UNITED STATES
SECURITIES AND EXCHANGE COMMISSION
Washington, D.C. 20549
FORM N-CSR
CERTIFIED SHAREHOLDER REPORT OF REGISTERED
MANAGEMENT INVESTMENT COMPANIES
Investment Company Act file number 811-02841
Fidelity Capital Trust
(Exact name of registrant as specified in charter)
245 Summer St., Boston, Massachusetts 02210
(Address of principal executive offices) (Zip code)
Cynthia Lo Bessette, Secretary
245 Summer St.
Boston, Massachusetts 02210
(Name and address of agent for service)
Registrant's telephone number, including area code:
617-563-7000
| |
Date of fiscal year end: | October 31 |
|
|
Date of reporting period: | October 31, 2019 |
Item 1.
Reports to Stockholders
Fidelity® Value Fund
Annual Report
October 31, 2019

See the inside front cover for important information about access to your fund’s shareholder reports.

Beginning on January 1, 2021, as permitted by regulations adopted by the Securities and Exchange Commission, paper copies of a fund’s shareholder reports will no longer be sent by mail, unless you specifically request paper copies of the reports from the fund or from your financial intermediary, such as a financial advisor, broker-dealer or bank. Instead, the reports will be made available on a website, and you will be notified by mail each time a report is posted and provided with a website link to access the report.
If you already elected to receive shareholder reports electronically, you will not be affected by this change and you need not take any action. You may elect to receive shareholder reports and other communications from a fund electronically, by contacting your financial intermediary. For Fidelity customers, visit Fidelity's web site or call Fidelity using the contact information listed below.
You may elect to receive all future reports in paper free of charge. If you wish to continue receiving paper copies of your shareholder reports, you may contact your financial intermediary or, if you are a Fidelity customer, visit Fidelity’s website, or call Fidelity at the applicable toll-free number listed below. Your election to receive reports in paper will apply to all funds held with the fund complex/your financial intermediary.
| Account Type | Website | Phone Number |
| Brokerage, Mutual Fund, or Annuity Contracts: | fidelity.com/mailpreferences | 1-800-343-3548 |
| Employer Provided Retirement Accounts: | netbenefits.fidelity.com/preferences (choose 'no' under Required Disclosures to continue to print) | 1-800-343-0860 |
| Advisor Sold Accounts Serviced Through Your Financial Intermediary: | Contact Your Financial Intermediary | Your Financial Intermediary's phone number |
| Advisor Sold Accounts Serviced by Fidelity: | institutional.fidelity.com | 1-877-208-0098 |
Contents
To view a fund's proxy voting guidelines and proxy voting record for the 12-month period ended June 30, visit http://www.fidelity.com/proxyvotingresults or visit the Securities and Exchange Commission's (SEC) web site at http://www.sec.gov.
You may also call 1-800-544-8544 if you’re an individual investing directly with Fidelity, call 1-800-835-5092 if you’re a plan sponsor or participant with Fidelity as your recordkeeper or call 1-877-208-0098 on institutional accounts or if you’re an advisor or invest through one to request a free copy of the proxy voting guidelines.
Standard & Poor's, S&P and S&P 500 are registered service marks of The McGraw-Hill Companies, Inc. and have been licensed for use by Fidelity Distributors Corporation.
Other third-party marks appearing herein are the property of their respective owners.
All other marks appearing herein are registered or unregistered trademarks or service marks of FMR LLC or an affiliated company. © 2019 FMR LLC. All rights reserved.
This report and the financial statements contained herein are submitted for the general information of the shareholders of the Fund. This report is not authorized for distribution to prospective investors in the Fund unless preceded or accompanied by an effective prospectus.
A fund files its complete schedule of portfolio holdings with the SEC for the first and third quarters of each fiscal year on Form N-PORT. Forms N-PORT are available on the SEC’s web site at http://www.sec.gov. A fund's Forms N-PORT may be reviewed and copied at the SEC’s Public Reference Room in Washington, DC. Information regarding the operation of the SEC's Public Reference Room may be obtained by calling 1-800-SEC-0330.
For a complete list of a fund's portfolio holdings, view the most recent holdings listing, semiannual report, or annual report on Fidelity's web site at http://www.fidelity.com, http://www.institutional.fidelity.com, or http://www.401k.com, as applicable.
NOT FDIC INSURED •MAY LOSE VALUE •NO BANK GUARANTEE
Neither the Fund nor Fidelity Distributors Corporation is a bank.
Performance: The Bottom Line
Average annual total return reflects the change in the value of an investment, assuming reinvestment of distributions from dividend income and capital gains (the profits earned upon the sale of securities that have grown in value, if any) and assuming a constant rate of performance each year. The hypothetical investment and the average annual total returns do not reflect the deduction of taxes that a shareholder would pay on fund distributions or the redemption of fund shares. During periods of reimbursement by Fidelity, a fund’s total return will be greater than it would be had the reimbursement not occurred. How a fund did yesterday is no guarantee of how it will do tomorrow.
Average Annual Total Returns
| For the periods ended October 31, 2019 | Past 1 year | Past 5 years | Past 10 years |
| Fidelity® Value Fund | 9.31% | 5.28% | 11.54% |
| Class K | 9.43% | 5.38% | 11.67% |
$10,000 Over 10 Years
Let's say hypothetically that $10,000 was invested in Fidelity® Value Fund, a class of the fund, on October 31, 2009.
The chart shows how the value of your investment would have changed, and also shows how the Russell Midcap® Value Index performed over the same period.
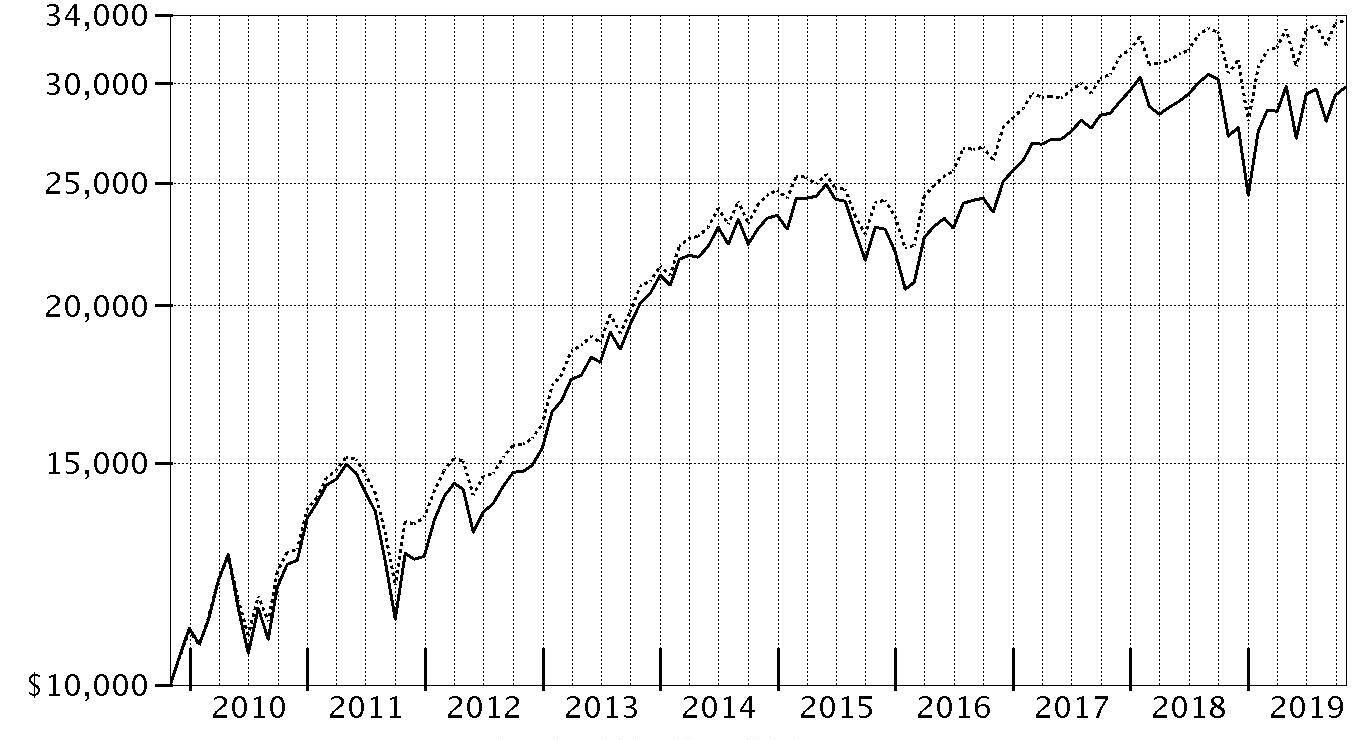
| Period Ending Values |
| $29,797 | Fidelity® Value Fund - Fidelity® Value Fund |
| $33,652 | Russell Midcap® Value Index |
Management's Discussion of Fund Performance
Market Recap: The S&P 500
® index gained 14.33% for the 12 months ending October 31, 2019, ending the period just shy of a record close after seesawing due to trade tension, interest rates, economic data and an inverted yield curve, among other factors. Upbeat company earnings and outlooks, along with signs the Federal Reserve may pause on rates, boosted stocks to an all-time high on April 30. In May, however, volatility spiked and the index sunk as trade negotiations between the U.S. and China broke down. The bull market roared back in June and recorded a series of highs in July, when the Fed, affirming a dovish shift in policy, cut interest rates for the first time since 2008. Volatility intensified in August, however, as the U.S. Treasury yield curve inverted for the first time since 2007, which some investors viewed as a sign the U.S. economy could be heading for recession. The market proved resilient, rising in the final two months and reaching a new high on October 30, when the Fed cut interest rates for the third time this year. For the full 12 months, the defensive real estate (+27%) and utilities (+24%) sectors led the way, followed by information technology (+23%). Communication services and consumer discretionary each gained about 16%, while industrials advanced 15%. In contrast, energy (-11%) was by far the weakest sector – slipping on lower oil prices. Other notable laggards included health care (+9%) and financials (+12%). Lastly, consumer staples and materials finished roughly in line with the index.
Comments from Lead Portfolio Manager Matthew Friedman: For the fiscal year, the fund’s share classes gained about 9%, trailing the 10.08% advance of the benchmark Russell Midcap
® Value Index. Versus the benchmark, sector positioning detracted the past 12 months, most notably an overweighting in energy and underweightings in real estate and utilities. Security selection in information technology also hurt. I'll note that security selection overall contributed to our relative result, led by our picks in energy and financials. The largest individual relative detractor was Encana, as our non-benchmark position in the natural gas exploration and production company returned -61% this period amid lower prices for natural gas. An overweighting in DXC Technology (-62%) also hurt. Shares of the IT services provider fell sharply in August after the company slashed its full-year revenue guidance. Conversely, the fund’s non-benchmark stake in Medicines gained roughly 118% and was the top contributor. The stock was boosted by positive late-stage trials of the company's therapy to treat low-density lipoprotein (LDL) cholesterol. A sizable non-benchmark investment in Equinix (+52%), a real estate firm that specializes in internet connection and data centers, was another noteworthy relative contributor this period.
The views expressed above reflect those of the portfolio manager(s) only through the end of the period as stated on the cover of this report and do not necessarily represent the views of Fidelity or any other person in the Fidelity organization. Any such views are subject to change at any time based upon market or other conditions and Fidelity disclaims any responsibility to update such views. These views may not be relied on as investment advice and, because investment decisions for a Fidelity fund are based on numerous factors, may not be relied on as an indication of trading intent on behalf of any Fidelity fund.
Investment Summary (Unaudited)
Top Ten Stocks as of October 31, 2019
| | % of fund's net assets |
| Sempra Energy | 2.1 |
| Vistra Energy Corp. | 1.8 |
| FirstEnergy Corp. | 1.3 |
| Entergy Corp. | 1.2 |
| CubeSmart | 1.1 |
| Olin Corp. | 1.0 |
| HD Supply Holdings, Inc. | 1.0 |
| Tyson Foods, Inc. Class A | 1.0 |
| Nielsen Holdings PLC | 1.0 |
| SunTrust Banks, Inc. | 1.0 |
| | 12.5 |
Top Five Market Sectors as of October 31, 2019
| | % of fund's net assets |
| Industrials | 18.1 |
| Financials | 14.1 |
| Consumer Discretionary | 11.4 |
| Materials | 9.2 |
| Real Estate | 8.9 |
Asset Allocation (% of fund's net assets)
| As of October 31, 2019* |
| | Stocks | 99.6% |
| | Short-Term Investments and Net Other Assets (Liabilities) | 0.4% |

* Foreign investments - 17.6%
Schedule of Investments October 31, 2019
Showing Percentage of Net Assets
| Common Stocks - 99.6% | | | |
| | | Shares | Value (000s) |
| COMMUNICATION SERVICES - 2.5% | | | |
| Diversified Telecommunication Services - 0.6% | | | |
| GCI Liberty, Inc. (a) | | 574,200 | $40,183 |
| Media - 1.9% | | | |
| DISH Network Corp. Class A (a) | | 976,700 | 33,579 |
| Liberty Global PLC Class C (a) | | 1,634,200 | 39,008 |
| Nexstar Broadcasting Group, Inc. Class A | | 585,000 | 56,915 |
| | | | 129,502 |
|
| TOTAL COMMUNICATION SERVICES | | | 169,685 |
|
| CONSUMER DISCRETIONARY - 11.4% | | | |
| Auto Components - 0.2% | | | |
| American Axle & Manufacturing Holdings, Inc. (a) | | 1,808,900 | 15,122 |
| Automobiles - 0.2% | | | |
| Bayerische Motoren Werke AG (BMW) | | 206,400 | 15,817 |
| Distributors - 0.7% | | | |
| LKQ Corp. (a) | | 1,489,700 | 50,635 |
| Diversified Consumer Services - 0.4% | | | |
| Laureate Education, Inc. Class A (a) | | 1,593,900 | 24,634 |
| Hotels, Restaurants & Leisure - 1.5% | | | |
| Eldorado Resorts, Inc. (a) | | 1,313,665 | 58,813 |
| Hilton Grand Vacations, Inc. (a) | | 460,219 | 15,983 |
| International Game Technology PLC | | 2,008,100 | 26,587 |
| | | | 101,383 |
| Household Durables - 1.9% | | | |
| D.R. Horton, Inc. | | 613,000 | 32,103 |
| Mohawk Industries, Inc. (a) | | 419,700 | 60,177 |
| Whirlpool Corp. | | 244,000 | 37,117 |
| | | | 129,397 |
| Internet & Direct Marketing Retail - 1.1% | | | |
| eBay, Inc. | | 1,267,564 | 44,682 |
| Liberty Interactive Corp. QVC Group Series A (a) | | 2,959,500 | 28,234 |
| | | | 72,916 |
| Leisure Products - 1.2% | | | |
| Brunswick Corp. | | 789,100 | 45,957 |
| Mattel, Inc. (a)(b) | | 2,223,400 | 26,547 |
| Vista Outdoor, Inc. (a) | | 1,075,300 | 7,205 |
| | | | 79,709 |
| Specialty Retail - 2.5% | | | |
| L Brands, Inc. | | 1,613,600 | 27,496 |
| Lithia Motors, Inc. Class A (sub. vtg.) | | 97,300 | 15,323 |
| Lowe's Companies, Inc. | | 351,500 | 39,231 |
| Michaels Companies, Inc. (a)(b) | | 2,839,600 | 24,790 |
| Sally Beauty Holdings, Inc. (a) | | 1,432,500 | 22,204 |
| Signet Jewelers Ltd. (b) | | 667,600 | 10,708 |
| Urban Outfitters, Inc. (a) | | 1,095,500 | 31,441 |
| | | | 171,193 |
| Textiles, Apparel & Luxury Goods - 1.7% | | | |
| Capri Holdings Ltd. (a) | | 1,117,800 | 34,730 |
| PVH Corp. | | 504,800 | 43,998 |
| Tapestry, Inc. | | 1,571,200 | 40,631 |
| | | | 119,359 |
|
| TOTAL CONSUMER DISCRETIONARY | | | 780,165 |
|
| CONSUMER STAPLES - 6.9% | | | |
| Food & Staples Retailing - 0.7% | | | |
| U.S. Foods Holding Corp. (a) | | 1,176,600 | 46,676 |
| Food Products - 4.2% | | | |
| B&G Foods, Inc. Class A (b) | | 897,000 | 13,948 |
| Bunge Ltd. | | 286,900 | 15,493 |
| Conagra Brands, Inc. | | 2,074,300 | 56,110 |
| Darling International, Inc. (a) | | 2,664,800 | 51,431 |
| Nomad Foods Ltd. (a) | | 1,278,917 | 24,952 |
| The Kraft Heinz Co. | | 897,700 | 29,023 |
| TreeHouse Foods, Inc. (a) | | 540,600 | 29,203 |
| Tyson Foods, Inc. Class A | | 829,600 | 68,683 |
| | | | 288,843 |
| Household Products - 0.8% | | | |
| Energizer Holdings, Inc. | | 200,300 | 8,511 |
| Spectrum Brands Holdings, Inc. | | 901,600 | 45,269 |
| | | | 53,780 |
| Personal Products - 0.5% | | | |
| Edgewell Personal Care Co. (a) | | 1,018,100 | 35,634 |
| Tobacco - 0.7% | | | |
| Altria Group, Inc. | | 1,011,700 | 45,314 |
|
| TOTAL CONSUMER STAPLES | | | 470,247 |
|
| ENERGY - 7.9% | | | |
| Energy Equipment & Services - 0.7% | | | |
| Baker Hughes, A GE Co. Class A | | 1,616,871 | 34,601 |
| Halliburton Co. | | 551,700 | 10,620 |
| | | | 45,221 |
| Oil, Gas & Consumable Fuels - 7.2% | | | |
| Cabot Oil & Gas Corp. | | 430,500 | 8,025 |
| Cenovus Energy, Inc. (Canada) | | 5,038,588�� | 42,922 |
| Cheniere Energy, Inc. (a) | | 915,900 | 56,374 |
| Concho Resources, Inc. | | 344,700 | 23,274 |
| Devon Energy Corp. | | 664,600 | 13,478 |
| Encana Corp. | | 1,351,746 | 5,312 |
| Encana Corp. (Toronto) | | 7,994,469 | 31,320 |
| Enterprise Products Partners LP | | 477,600 | 12,432 |
| Golar LNG Ltd. | | 1,552,348 | 21,376 |
| Hess Corp. | | 751,500 | 49,411 |
| Magnolia Oil & Gas Corp. Class A (a) | | 1,575,800 | 15,474 |
| Marathon Petroleum Corp. | | 871,399 | 55,726 |
| Noble Energy, Inc. | | 2,936,100 | 56,549 |
| Teekay LNG Partners LP | | 2,063,980 | 29,701 |
| Teekay Offshore Partners LP | | 11,287,527 | 17,383 |
| Valero Energy Corp. | | 469,800 | 45,561 |
| WPX Energy, Inc. (a) | | 1,112,600 | 11,104 |
| | | | 495,422 |
|
| TOTAL ENERGY | | | 540,643 |
|
| FINANCIALS - 14.1% | | | |
| Banks - 3.8% | | | |
| East West Bancorp, Inc. | | 681,800 | 29,263 |
| First Citizens Bancshares, Inc. | | 95,892 | 47,171 |
| PNC Financial Services Group, Inc. | | 284,900 | 41,795 |
| Signature Bank | | 297,100 | 35,153 |
| SunTrust Banks, Inc. | | 948,000 | 64,786 |
| U.S. Bancorp | | 719,715 | 41,038 |
| | | | 259,206 |
| Capital Markets - 5.0% | | | |
| Ameriprise Financial, Inc. | | 378,900 | 57,172 |
| Apollo Global Management LLC Class A | | 1,271,032 | 52,316 |
| Donnelley Financial Solutions, Inc. (a) | | 1,626,479 | 18,379 |
| E*TRADE Financial Corp. | | 617,900 | 25,822 |
| Lazard Ltd. Class A | | 1,261,300 | 47,084 |
| LPL Financial | | 433,300 | 35,028 |
| Northern Trust Corp. | | 437,131 | 43,573 |
| Raymond James Financial, Inc. | | 396,300 | 33,087 |
| Tullett Prebon PLC | | 6,040,886 | 26,832 |
| | | | 339,293 |
| Consumer Finance - 2.8% | | | |
| Capital One Financial Corp. | | 531,291 | 49,543 |
| OneMain Holdings, Inc. | | 1,121,000 | 44,840 |
| SLM Corp. | | 5,030,096 | 42,454 |
| Synchrony Financial | | 1,512,200 | 53,487 |
| | | | 190,324 |
| Diversified Financial Services - 0.2% | | | |
| ECN Capital Corp. | | 5,087,700 | 16,803 |
| Insurance - 2.3% | | | |
| AMBAC Financial Group, Inc. (a) | | 2,040,459 | 41,829 |
| American International Group, Inc. | | 575,000 | 30,452 |
| Chubb Ltd. | | 146,048 | 22,261 |
| FNF Group | | 384,400 | 17,621 |
| The Travelers Companies, Inc. | | 364,100 | 47,719 |
| | | | 159,882 |
|
| TOTAL FINANCIALS | | | 965,508 |
|
| HEALTH CARE - 6.6% | | | |
| Biotechnology - 0.6% | | | |
| Alexion Pharmaceuticals, Inc. (a) | | 382,800 | 40,347 |
| The Medicines Company (a) | | 84,500 | 4,435 |
| | | | 44,782 |
| Health Care Equipment & Supplies - 0.3% | | | |
| Dentsply Sirona, Inc. | | 82,000 | 4,492 |
| The Cooper Companies, Inc. | | 22,800 | 6,635 |
| Zimmer Biomet Holdings, Inc. | | 85,746 | 11,853 |
| | | | 22,980 |
| Health Care Providers & Services - 3.4% | | | |
| AmerisourceBergen Corp. | | 117,200 | 10,007 |
| Cardinal Health, Inc. | | 140,600 | 6,953 |
| Centene Corp. (a) | | 1,006,500 | 53,425 |
| Cigna Corp. | | 269,500 | 48,095 |
| Henry Schein, Inc. (a) | | 56,200 | 3,517 |
| Humana, Inc. | | 118,900 | 34,980 |
| Laboratory Corp. of America Holdings (a) | | 82,700 | 13,626 |
| MEDNAX, Inc. (a) | | 822,600 | 18,064 |
| Molina Healthcare, Inc. (a) | | 23,100 | 2,717 |
| Premier, Inc. (a) | | 1,101,900 | 35,900 |
| Universal Health Services, Inc. Class B | | 31,200 | 4,289 |
| | | | 231,573 |
| Health Care Technology - 0.5% | | | |
| Change Healthcare, Inc. (b) | | 2,357,400 | 31,165 |
| Life Sciences Tools & Services - 0.6% | | | |
| Agilent Technologies, Inc. | | 111,100 | 8,416 |
| Avantor, Inc. | | 533,300 | 7,578 |
| Bio-Rad Laboratories, Inc. Class A (a) | | 34,600 | 11,474 |
| IQVIA Holdings, Inc. (a) | | 67,100 | 9,691 |
| PerkinElmer, Inc. | | 44,700 | 3,842 |
| | | | 41,001 |
| Pharmaceuticals - 1.2% | | | |
| Bayer AG | | 486,100 | 37,710 |
| Jazz Pharmaceuticals PLC (a) | | 347,367 | 43,640 |
| Mylan NV (a) | | 135,600 | 2,597 |
| | | | 83,947 |
|
| TOTAL HEALTH CARE | | | 455,448 |
|
| INDUSTRIALS - 18.1% | | | |
| Aerospace & Defense - 1.2% | | | |
| Bombardier, Inc. Class B (sub. vtg.) (a) | | 9,552,800 | 12,040 |
| General Dynamics Corp. | | 185,100 | 32,726 |
| Huntington Ingalls Industries, Inc. | | 180,200 | 40,664 |
| | | | 85,430 |
| Air Freight & Logistics - 0.5% | | | |
| FedEx Corp. | | 235,100 | 35,890 |
| Airlines - 1.5% | | | |
| American Airlines Group, Inc. | | 2,026,317 | 60,911 |
| JetBlue Airways Corp. (a) | | 2,360,299 | 45,554 |
| | | | 106,465 |
| Building Products - 0.3% | | | |
| Jeld-Wen Holding, Inc. (a) | | 664,500 | 11,356 |
| Owens Corning | | 153,800 | 9,425 |
| | | | 20,781 |
| Commercial Services & Supplies - 0.7% | | | |
| The Brink's Co. | | 550,100 | 46,736 |
| Construction & Engineering - 2.6% | | | |
| AECOM (a) | | 1,452,879 | 58,130 |
| Arcadis NV | | 1,714,375 | 33,843 |
| Fluor Corp. | | 1,499,900 | 24,163 |
| Granite Construction, Inc. | | 746,500 | 17,573 |
| Tutor Perini Corp. (a) | | 99,300 | 1,536 |
| Williams Scotsman Corp. (a) | | 2,718,400 | 42,842 |
| | | | 178,087 |
| Electrical Equipment - 1.2% | | | |
| Atkore International Group, Inc. (a) | | 208,500 | 7,235 |
| Regal Beloit Corp. | | 322,400 | 23,874 |
| Sensata Technologies, Inc. PLC (a) | | 1,003,806 | 51,385 |
| | | | 82,494 |
| Industrial Conglomerates - 0.8% | | | |
| General Electric Co. | | 5,195,800 | 51,854 |
| Machinery - 1.1% | | | |
| Allison Transmission Holdings, Inc. | | 163,404 | 7,126 |
| Kennametal, Inc. | | 110,000 | 3,405 |
| SPX Corp. (a) | | 707,100 | 32,201 |
| Welbilt, Inc. (a) | | 1,847,195 | 35,023 |
| | | | 77,755 |
| Marine - 0.2% | | | |
| A.P. Moller - Maersk A/S Series B | | 9,737 | 12,421 |
| Professional Services - 2.0% | | | |
| Asgn, Inc. (a) | | 436,400 | 27,751 |
| Intertrust NV (c) | | 806,600 | 15,329 |
| Manpower, Inc. | | 289,800 | 26,349 |
| Nielsen Holdings PLC | | 3,226,300 | 65,042 |
| | | | 134,471 |
| Road & Rail - 2.0% | | | |
| Knight-Swift Transportation Holdings, Inc. Class A | | 1,724,400 | 62,872 |
| Norfolk Southern Corp. | | 84,587 | 15,395 |
| Ryder System, Inc. | | 1,188,700 | 57,806 |
| | | | 136,073 |
| Trading Companies & Distributors - 3.5% | | | |
| AerCap Holdings NV (a) | | 717,596 | 41,534 |
| Ashtead Group PLC | | 1,152,431 | 35,051 |
| Fortress Transportation & Infrastructure Investors LLC | | 2,226,938 | 35,297 |
| HD Supply Holdings, Inc. (a) | | 1,762,674 | 69,696 |
| MRC Global, Inc. (a) | | 867,824 | 9,858 |
| Univar, Inc. (a) | | 2,157,100 | 46,291 |
| | | | 237,727 |
| Transportation Infrastructure - 0.5% | | | |
| Macquarie Infrastructure Co. LLC | | 753,800 | 32,519 |
|
| TOTAL INDUSTRIALS | | | 1,238,703 |
|
| INFORMATION TECHNOLOGY - 6.7% | | | |
| Communications Equipment - 1.0% | | | |
| CommScope Holding Co., Inc. (a) | | 3,225,100 | 36,121 |
| F5 Networks, Inc. (a) | | 214,100 | 30,848 |
| | | | 66,969 |
| Electronic Equipment & Components - 0.7% | | | |
| Flextronics International Ltd. (a) | | 4,236,200 | 49,775 |
| IT Services - 2.2% | | | |
| Amdocs Ltd. | | 419,100 | 27,325 |
| Conduent, Inc. (a) | | 4,168,700 | 25,763 |
| DXC Technology Co. | | 1,994,536 | 55,189 |
| Econocom Group SA | | 5,920,326 | 15,438 |
| Unisys Corp. (a) | | 2,353,419 | 24,146 |
| | | | 147,861 |
| Semiconductors & Semiconductor Equipment - 1.2% | | | |
| Marvell Technology Group Ltd. | | 1,659,600 | 40,478 |
| NXP Semiconductors NV | | 377,100 | 42,869 |
| | | | 83,347 |
| Software - 1.6% | | | |
| Micro Focus International PLC | | 2,806,615 | 38,521 |
| SS&C Technologies Holdings, Inc. | | 855,900 | 44,515 |
| Totvs SA | | 1,943,600 | 30,183 |
| | | | 113,219 |
|
| TOTAL INFORMATION TECHNOLOGY | | | 461,171 |
|
| MATERIALS - 9.2% | | | |
| Chemicals - 6.0% | | | |
| Axalta Coating Systems Ltd. (a) | | 968,678 | 28,566 |
| Celanese Corp. Class A | | 143,339 | 17,366 |
| CF Industries Holdings, Inc. | | 505,800 | 22,938 |
| DowDuPont, Inc. | | 605,240 | 39,891 |
| Element Solutions, Inc. (a) | | 2,943,800 | 31,970 |
| FMC Corp. | | 189,825 | 17,369 |
| LyondellBasell Industries NV Class A | | 119,729 | 10,740 |
| Olin Corp. | | 3,842,180 | 70,466 |
| Orion Engineered Carbons SA | | 1,898,900 | 31,446 |
| The Chemours Co. LLC | | 2,017,100 | 33,101 |
| The Mosaic Co. | | 2,323,500 | 46,191 |
| Tronox Holdings PLC | | 2,823,274 | 23,970 |
| Westlake Chemical Corp. | | 585,800 | 37,017 |
| | | | 411,031 |
| Construction Materials - 0.5% | | | |
| Martin Marietta Materials, Inc. | | 46,683 | 12,227 |
| Summit Materials, Inc. (a) | | 1,116,200 | 25,594 |
| | | | 37,821 |
| Containers & Packaging - 1.8% | | | |
| Avery Dennison Corp. | | 99,190 | 12,682 |
| Ball Corp. | | 106,694 | 7,465 |
| Berry Global Group, Inc. (a) | | 669,100 | 27,774 |
| Crown Holdings, Inc. (a) | | 654,300 | 47,659 |
| Graphic Packaging Holding Co. | | 1,726,500 | 27,037 |
| | | | 122,617 |
| Metals & Mining - 0.9% | | | |
| Alcoa Corp. (a) | | 262,201 | 5,451 |
| Antofagasta PLC | | 444,100 | 4,989 |
| Barrick Gold Corp. | | 626,185 | 10,871 |
| Constellium NV (a) | | 2,322,300 | 30,956 |
| Steel Dynamics, Inc. | | 307,265 | 9,329 |
| | | | 61,596 |
|
| TOTAL MATERIALS | | | 633,065 |
|
| REAL ESTATE - 8.9% | | | |
| Equity Real Estate Investment Trusts (REITs) - 6.9% | | | |
| Alexandria Real Estate Equities, Inc. | | 304,800 | 48,387 |
| American Tower Corp. | | 181,904 | 39,670 |
| CubeSmart | | 2,420,237 | 76,722 |
| Douglas Emmett, Inc. | | 1,039,400 | 45,027 |
| Equinix, Inc. | | 101,600 | 57,585 |
| Equity Lifestyle Properties, Inc. | | 698,422 | 48,848 |
| Essex Property Trust, Inc. | | 114,700 | 37,522 |
| National Retail Properties, Inc. | | 697,088 | 41,065 |
| Taubman Centers, Inc. | | 829,800 | 29,690 |
| VICI Properties, Inc. | | 1,947,400 | 45,861 |
| | | | 470,377 |
| Real Estate Management & Development - 2.0% | | | |
| CBRE Group, Inc. (a) | | 914,092 | 48,950 |
| Cushman & Wakefield PLC (a) | | 2,544,500 | 47,455 |
| Howard Hughes Corp. (a) | | 358,100 | 40,043 |
| | | | 136,448 |
|
| TOTAL REAL ESTATE | | | 606,825 |
|
| UTILITIES - 7.3% | | | |
| Electric Utilities - 3.3% | | | |
| Edison International | | 193,150 | 12,149 |
| Entergy Corp. | | 704,800 | 85,619 |
| Exelon Corp. | | 885,100 | 40,263 |
| FirstEnergy Corp. | | 1,838,900 | 88,856 |
| | | | 226,887 |
| Independent Power and Renewable Electricity Producers - 1.9% | | | |
| NRG Energy, Inc. | | 238,333 | 9,562 |
| Vistra Energy Corp. | | 4,555,400 | 123,132 |
| | | | 132,694 |
| Multi-Utilities - 2.1% | | | |
| Sempra Energy | | 972,397 | 140,516 |
|
| TOTAL UTILITIES | | | 500,097 |
|
| TOTAL COMMON STOCKS | | | |
| (Cost $6,477,137) | | | 6,821,557 |
| | | Principal Amount (000s) | Value (000s) |
|
| U.S. Treasury Obligations - 0.0% | | | |
| U.S. Treasury Bills, yield at date of purchase 1.84% to 1.94% 11/29/19 to 12/26/19 (d) | | | |
| (Cost $2,814) | | 2,820 | 2,815 |
| | | Shares | Value (000s) |
|
| Money Market Funds - 1.0% | | | |
| Fidelity Cash Central Fund 1.83% (e) | | 32,536,712 | $32,543 |
| Fidelity Securities Lending Cash Central Fund 1.84% (e)(f) | | 39,341,034 | 39,345 |
| TOTAL MONEY MARKET FUNDS | | | |
| (Cost $71,886) | | | 71,888 |
| TOTAL INVESTMENT IN SECURITIES - 100.6% | | | |
| (Cost $6,551,837) | | | 6,896,260 |
| NET OTHER ASSETS (LIABILITIES) - (0.6)% | | | (44,062) |
| NET ASSETS - 100% | | | $6,852,198 |
Legend
(a) Non-income producing
(b) Security or a portion of the security is on loan at period end.
(c) Security exempt from registration under Rule 144A of the Securities Act of 1933. These securities may be resold in transactions exempt from registration, normally to qualified institutional buyers. At the end of the period, the value of these securities amounted to $15,329,000 or 0.2% of net assets.
(d) Security or a portion of the security was pledged to cover margin requirements for futures contracts. At period end, the value of securities pledged amounted to $165,000.
(e) Affiliated fund that is generally available only to investment companies and other accounts managed by Fidelity Investments. The rate quoted is the annualized seven-day yield of the fund at period end. A complete unaudited listing of the fund's holdings as of its most recent quarter end is available upon request. In addition, each Fidelity Central Fund's financial statements, which are not covered by the Fund's Report of Independent Registered Public Accounting Firm, are available on the SEC's website or upon request.
(f) Investment made with cash collateral received from securities on loan.
Affiliated Central Funds
Information regarding fiscal year to date income earned by the Fund from investments in Fidelity Central Funds is as follows:
| Fund | Income earned |
| | (Amounts in thousands) |
| Fidelity Cash Central Fund | $1,796 |
| Fidelity Securities Lending Cash Central Fund | 286 |
| Total | $2,082 |
Amounts in the income column in the above table include any capital gain distributions from underlying funds, which are presented in the corresponding line-item in the Statement of Operations, if applicable. Amount for Fidelity Securities Lending Cash Central Fund represents the income earned on investing cash collateral, less rebates paid to borrowers and any lending agent fees associated with the loan, plus any premium payments received for lending certain types of securities.
Investment Valuation
The following is a summary of the inputs used, as of October 31, 2019, involving the Fund's assets and liabilities carried at fair value. The inputs or methodology used for valuing securities may not be an indication of the risk associated with investing in those securities. For more information on valuation inputs, and their aggregation into the levels used below, please refer to the Investment Valuation section in the accompanying Notes to Financial Statements.
| | Valuation Inputs at Reporting Date: |
| Description | Total | Level 1 | Level 2 | Level 3 |
| (Amounts in thousands) | | | | |
| Investments in Securities: | | | | |
| Equities: | | | | |
| Communication Services | $169,685 | $169,685 | $-- | $-- |
| Consumer Discretionary | 780,165 | 780,165 | -- | -- |
| Consumer Staples | 470,247 | 470,247 | -- | -- |
| Energy | 540,643 | 540,643 | -- | -- |
| Financials | 965,508 | 965,508 | -- | -- |
| Health Care | 455,448 | 417,738 | 37,710 | -- |
| Industrials | 1,238,703 | 1,226,282 | 12,421 | -- |
| Information Technology | 461,171 | 422,650 | 38,521 | -- |
| Materials | 633,065 | 633,065 | -- | -- |
| Real Estate | 606,825 | 606,825 | -- | -- |
| Utilities | 500,097 | 500,097 | -- | -- |
| U.S. Government and Government Agency Obligations | 2,815 | -- | 2,815 | -- |
| Money Market Funds | 71,888 | 71,888 | -- | -- |
| Total Investments in Securities: | $6,896,260 | $6,804,793 | $91,467 | $-- |
Other Information
Distribution of investments by country or territory of incorporation, as a percentage of Total Net Assets, is as follows (Unaudited):
| United States of America | 82.4% |
| United Kingdom | 5.4% |
| Netherlands | 2.5% |
| Bermuda | 2.3% |
| Canada | 1.7% |
| Others (Individually Less Than 1%) | 5.7% |
| | 100.0% |
See accompanying notes which are an integral part of the financial statements.
Financial Statements
Statement of Assets and Liabilities
| Amounts in thousands (except per-share amounts) | | October 31, 2019 |
| Assets | | |
Investment in securities, at value (including securities loaned of $37,932) — See accompanying schedule:
Unaffiliated issuers (cost $6,479,951) | $6,824,372 | |
| Fidelity Central Funds (cost $71,886) | 71,888 | |
| Total Investment in Securities (cost $6,551,837) | | $6,896,260 |
| Cash | | 2,996 |
| Foreign currency held at value (cost $1,207) | | 1,207 |
| Receivable for investments sold | | 38,364 |
| Receivable for fund shares sold | | 1,123 |
| Dividends receivable | | 3,456 |
| Distributions receivable from Fidelity Central Funds | | 148 |
| Prepaid expenses | | 12 |
| Other receivables | | 703 |
| Total assets | | 6,944,269 |
| Liabilities | | |
| Payable for investments purchased | $45,857 | |
| Payable for fund shares redeemed | 2,845 | |
| Accrued management fee | 2,550 | |
| Other affiliated payables | 834 | |
| Other payables and accrued expenses | 648 | |
| Collateral on securities loaned | 39,337 | |
| Total liabilities | | 92,071 |
| Net Assets | | $6,852,198 |
| Net Assets consist of: | | |
| Paid in capital | | $6,356,000 |
| Total accumulated earnings (loss) | | 496,198 |
| Net Assets | | $6,852,198 |
| Net Asset Value and Maximum Offering Price | | |
| Value: | | |
| Net Asset Value, offering price and redemption price per share ($6,112,022 ÷ 577,355 shares) | | $10.59 |
| Class K: | | |
| Net Asset Value, offering price and redemption price per share ($740,176 ÷ 69,810 shares) | | $10.60 |
See accompanying notes which are an integral part of the financial statements.
Statement of Operations
| Amounts in thousands | | Year ended October 31, 2019 |
| Investment Income | | |
| Dividends | | $131,490 |
| Interest | | 67 |
| Income from Fidelity Central Funds (including $286 from security lending) | | 2,082 |
| Total income | | 133,639 |
| Expenses | | |
| Management fee | | |
| Basic fee | $36,677 | |
| Performance adjustment | (8,198) | |
| Transfer agent fees | 8,987 | |
| Accounting and security lending fees | 1,170 | |
| Custodian fees and expenses | 124 | |
| Independent trustees' fees and expenses | 39 | |
| Registration fees | 72 | |
| Audit | 82 | |
| Legal | 24 | |
| Interest | 5 | |
| Miscellaneous | 50 | |
| Total expenses before reductions | 39,032 | |
| Expense reductions | (391) | |
| Total expenses after reductions | | 38,641 |
| Net investment income (loss) | | 94,998 |
| Realized and Unrealized Gain (Loss) | | |
| Net realized gain (loss) on: | | |
| Investment securities: | | |
| Unaffiliated issuers | 137,023 | |
| Fidelity Central Funds | 1 | |
| Foreign currency transactions | (42) | |
| Futures contracts | (1,308) | |
| Total net realized gain (loss) | | 135,674 |
| Change in net unrealized appreciation (depreciation) on: | | |
| Investment securities: | | |
| Unaffiliated issuers | 375,981 | |
| Fidelity Central Funds | 1 | |
| Assets and liabilities in foreign currencies | 38 | |
| Total change in net unrealized appreciation (depreciation) | | 376,020 |
| Net gain (loss) | | 511,694 |
| Net increase (decrease) in net assets resulting from operations | | $606,692 |
See accompanying notes which are an integral part of the financial statements.
Statement of Changes in Net Assets
| Amounts in thousands | Year ended October 31, 2019 | Year ended October 31, 2018 |
| Increase (Decrease) in Net Assets | | |
| Operations | | |
| Net investment income (loss) | $94,998 | $103,610 |
| Net realized gain (loss) | 135,674 | 848,990 |
| Change in net unrealized appreciation (depreciation) | 376,020 | (1,212,733) |
| Net increase (decrease) in net assets resulting from operations | 606,692 | (260,133) |
| Distributions to shareholders | (879,656) | (401,193) |
| Share transactions - net increase (decrease) | 101,049 | (731,672) |
| Total increase (decrease) in net assets | (171,915) | (1,392,998) |
| Net Assets | | |
| Beginning of period | 7,024,113 | 8,417,111 |
| End of period | $6,852,198 | $7,024,113 |
See accompanying notes which are an integral part of the financial statements.
Financial Highlights
Fidelity Value Fund
| Years ended October 31, | 2019 | 2018 A | 2017 A | 2016 A | 2015 A |
| Selected Per–Share Data | | | | | |
| Net asset value, beginning of period | $11.15 | $12.19 | $10.30 | $11.07 | $11.30 |
| Income from Investment Operations | | | | | |
| Net investment income (loss)B | .14 | .15 | .18C | .17 | .12 |
| Net realized and unrealized gain (loss) | .71 | (.62) | 1.85 | .11 | (.10)D |
| Total from investment operations | .85 | (.47) | 2.03 | .28 | .02 |
| Distributions from net investment income | (.12) | (.17) | (.14) | (.12) | (.09) |
| Distributions from net realized gain | (1.29) | (.41) | –E | (.93) | (.16) |
| Total distributions | (1.41) | (.57)F | (.14) | (1.05) | (.25) |
| Net asset value, end of period | $10.59 | $11.15 | $12.19 | $10.30 | $11.07 |
| Total ReturnG | 9.31% | (4.14)% | 19.86% | 2.85% | .12%D |
| Ratios to Average Net AssetsH,I | | | | | |
| Expenses before reductions | .58% | .58% | .58% | .62% | .79% |
| Expenses net of fee waivers, if any | .58% | .58% | .58% | .62% | .79% |
| Expenses net of all reductions | .58% | .56% | .57% | .61% | .78% |
| Net investment income (loss) | 1.38% | 1.25% | 1.51%C | 1.71% | 1.02% |
| Supplemental Data | | | | | |
| Net assets, end of period (in millions) | $6,112 | $6,181 | $7,344 | $6,741 | $7,437 |
| Portfolio turnover rateJ | 75% | 100% | 73% | 72% | 80% |
A Per share amounts have been adjusted to reflect the impact of the 10 for 1 share split that occurred on May 11, 2018.
B Calculated based on average shares outstanding during the period.
C Net investment income per share reflects a large, non-recurring dividend which amounted to $.03 per share. Excluding this non-recurring dividend, the ratio of net investment income (loss) to average net assets would have been 1.23%.
D Net realized and unrealized gain (loss) per share reflects proceeds received from litigation which amounted to $.01 per share. Excluding these litigation proceeds, the total return would have been .01%
E Amount represents less than $.005 per share.
F Total distributions of $.57 per share is comprised of distributions from net investment income of $.165 and distributions from net realized gain of $.409 per share.
G Total returns would have been lower if certain expenses had not been reduced during the applicable periods shown.
H Fees and expenses of any underlying Fidelity Central Funds are not included in the Fund's expense ratio. The Fund indirectly bears its proportionate share of the expenses of any underlying Fidelity Central Funds.
I Expense ratios reflect operating expenses of the class. Expenses before reductions do not reflect amounts reimbursed by the investment adviser or reductions from brokerage service arrangements or reductions from other expense offset arrangements and do not represent the amount paid by the class during periods when reimbursements or reductions occur. Expenses net of fee waivers reflect expenses after reimbursement by the investment adviser but prior to reductions from brokerage service arrangements or other expense offset arrangements. Expenses net of all reductions represent the net expenses paid by the class.
J Amount does not include the portfolio activity of any underlying Fidelity Central Funds.
See accompanying notes which are an integral part of the financial statements.
Fidelity Value Fund Class K
| Years ended October 31, | 2019 | 2018 A | 2017 A | 2016 A | 2015 A |
| Selected Per–Share Data | | | | | |
| Net asset value, beginning of period | $11.16 | $12.21 | $10.32 | $11.09 | $11.32 |
| Income from Investment Operations | | | | | |
| Net investment income (loss)B | .15 | .16 | .19C | .18 | .13 |
| Net realized and unrealized gain (loss) | .72 | (.62) | 1.85 | .11 | (.10)D |
| Total from investment operations | .87 | (.46) | 2.04 | .29 | .03 |
| Distributions from net investment income | (.13) | (.18) | (.15) | (.13) | (.10) |
| Distributions from net realized gain | (1.29) | (.41) | –E | (.93) | (.16) |
| Total distributions | (1.43)F | (.59) | (.15) | (1.06) | (.26) |
| Net asset value, end of period | $10.60 | $11.16 | $12.21 | $10.32 | $11.09 |
| Total ReturnG | 9.43% | (4.11)% | 19.98% | 2.96% | .24%D |
| Ratios to Average Net AssetsH,I | | | | | |
| Expenses before reductions | .49% | .48% | .48% | .50% | .68% |
| Expenses net of fee waivers, if any | .49% | .48% | .48% | .50% | .68% |
| Expenses net of all reductions | .48% | .46% | .48% | .49% | .67% |
| Net investment income (loss) | 1.48% | 1.34% | 1.61%C | 1.82% | 1.13% |
| Supplemental Data | | | | | |
| Net assets, end of period (in millions) | $740 | $844 | $1,073 | $922 | $1,404 |
| Portfolio turnover rateJ | 75% | 100% | 73% | 72% | 80% |
A Per share amounts have been adjusted to reflect the impact of the 10 for 1 share split that occurred on May 11, 2018.
B Calculated based on average shares outstanding during the period.
C Net investment income per share reflects a large, non-recurring dividend which amounted to $.03 per share. Excluding this non-recurring dividend, the ratio of net investment income (loss) to average net assets would have been 1.33%.
D Net realized and unrealized gain (loss) per share reflects proceeds received from litigation which amounted to $.01 per share. Excluding these litigation proceeds, the total return would have been .13%
E Amount represents less than $.005 per share.
F Total distributions of $1.43 per share is comprised of distributions from net investment income of $.132 and distributions from net realized gain of $1.293 per share.
G Total returns would have been lower if certain expenses had not been reduced during the applicable periods shown.
H Fees and expenses of any underlying Fidelity Central Funds are not included in the Fund's expense ratio. The Fund indirectly bears its proportionate share of the expenses of any underlying Fidelity Central Funds.
I Expense ratios reflect operating expenses of the class. Expenses before reductions do not reflect amounts reimbursed by the investment adviser or reductions from brokerage service arrangements or reductions from other expense offset arrangements and do not represent the amount paid by the class during periods when reimbursements or reductions occur. Expenses net of fee waivers reflect expenses after reimbursement by the investment adviser but prior to reductions from brokerage service arrangements or other expense offset arrangements. Expenses net of all reductions represent the net expenses paid by the class.
J Amount does not include the portfolio activity of any underlying Fidelity Central Funds.
See accompanying notes which are an integral part of the financial statements.
Notes to Financial Statements
For the period ended October 31, 2019
(Amounts in thousands except percentages)
1. Organization.
Fidelity Value Fund (the Fund) is a fund of Fidelity Capital Trust (the Trust) and is authorized to issue an unlimited number of shares. The Trust is registered under the Investment Company Act of 1940, as amended (the 1940 Act), as an open-end management investment company organized as a Massachusetts business trust. The Fund offers Value and Class K shares, each of which has equal rights as to assets and voting privileges. Each class has exclusive voting rights with respect to matters that affect that class.
2. Investments in Fidelity Central Funds.
The Fund invests in Fidelity Central Funds, which are open-end investment companies generally available only to other investment companies and accounts managed by the investment adviser and its affiliates. The Fund's Schedule of Investments lists each of the Fidelity Central Funds held as of period end, if any, as an investment of the Fund, but does not include the underlying holdings of each Fidelity Central Fund. As an Investing Fund, the Fund indirectly bears its proportionate share of the expenses of the underlying Fidelity Central Funds.
The Money Market Central Funds seek preservation of capital and current income and are managed by Fidelity Investments Money Management, Inc. (FIMM), an affiliate of the investment adviser. Annualized expenses of the Money Market Central Funds as of their most recent shareholder report date ranged from less than .005% to .01%.
A complete unaudited list of holdings for each Fidelity Central Fund is available upon request or at the Securities and Exchange Commission (the SEC) website at www.sec.gov. In addition, the financial statements of the Fidelity Central Funds, which are not covered by the Fund's Report of Independent Registered Public Accounting Firm, are available on the SEC website or upon request.
3. Significant Accounting Policies.
The Fund is an investment company and applies the accounting and reporting guidance of the Financial Accounting Standards Board (FASB) Accounting Standards Codification Topic 946 Financial Services – Investments Companies. The financial statements have been prepared in conformity with accounting principles generally accepted in the United States of America (GAAP), which require management to make certain estimates and assumptions at the date of the financial statements. Actual results could differ from those estimates. Subsequent events, if any, through the date that the financial statements were issued have been evaluated in the preparation of the financial statements. The following summarizes the significant accounting policies of the Fund:
Investment Valuation. Investments are valued as of 4:00 p.m. Eastern time on the last calendar day of the period. The Board of Trustees (the Board) has delegated the day to day responsibility for the valuation of the Fund's investments to the Fair Value Committee (the Committee) established by the Fund's investment adviser. In accordance with valuation policies and procedures approved by the Board, the Fund attempts to obtain prices from one or more third party pricing vendors or brokers to value its investments. When current market prices, quotations or currency exchange rates are not readily available or reliable, investments will be fair valued in good faith by the Committee, in accordance with procedures adopted by the Board. Factors used in determining fair value vary by investment type and may include market or investment specific events, changes in interest rates and credit quality. The frequency with which these procedures are used cannot be predicted and they may be utilized to a significant extent. The Committee oversees the Fund's valuation policies and procedures and reports to the Board on the Committee's activities and fair value determinations. The Board monitors the appropriateness of the procedures used in valuing the Fund's investments and ratifies the fair value determinations of the Committee.
The Fund categorizes the inputs to valuation techniques used to value its investments into a disclosure hierarchy consisting of three levels as shown below:
- Level 1 – quoted prices in active markets for identical investments
- Level 2 – other significant observable inputs (including quoted prices for similar investments, interest rates, prepayment speeds, etc.)
- Level 3 – unobservable inputs (including the Fund's own assumptions based on the best information available)
Valuation techniques used to value the Fund's investments by major category are as follows:
Equity securities, including restricted securities, for which market quotations are readily available, are valued at the last reported sale price or official closing price as reported by a third party pricing vendor on the primary market or exchange on which they are traded and are categorized as Level 1 in the hierarchy. In the event there were no sales during the day or closing prices are not available, securities are valued at the last quoted bid price or may be valued using the last available price and are generally categorized as Level 2 in the hierarchy. For foreign equity securities, when market or security specific events arise, comparisons to the valuation of American Depositary Receipts (ADRs), futures contracts, Exchange-Traded Funds (ETFs) and certain indexes as well as quoted prices for similar securities may be used and would be categorized as Level 2 in the hierarchy. For equity securities, including restricted securities, where observable inputs are limited, assumptions about market activity and risk are used and these securities may be categorized as Level 3 in the hierarchy.
Debt securities, including restricted securities, are valued based on evaluated prices received from third party pricing vendors or from brokers who make markets in such securities. U.S. government and government agency obligations are valued by pricing vendors who utilize matrix pricing which considers yield or price of bonds of comparable quality, coupon, maturity and type or by broker-supplied prices. When independent prices are unavailable or unreliable, debt securities may be valued utilizing pricing methodologies which consider similar factors that would be used by third party pricing vendors. Debt securities are generally categorized as Level 2 in the hierarchy but may be Level 3 depending on the circumstances.
Investments in open-end mutual funds, including the Fidelity Central Funds, are valued at their closing net asset value (NAV) each business day and are categorized as Level 1 in the hierarchy.
Changes in valuation techniques may result in transfers in or out of an assigned level within the disclosure hierarchy. The aggregate value of investments by input level as of October 31, 2019 is included at the end of the Fund's Schedule of Investments.
Foreign Currency. The Fund may use foreign currency contracts to facilitate transactions in foreign-denominated securities. Gains and losses from these transactions may arise from changes in the value of the foreign currency or if the counterparties do not perform under the contracts' terms.
Foreign-denominated assets, including investment securities, and liabilities are translated into U.S. dollars at the exchange rates at period end. Purchases and sales of investment securities, income and dividends received and expenses denominated in foreign currencies are translated into U.S. dollars at the exchange rate in effect on the transaction date.
The effects of exchange rate fluctuations on investments are included with the net realized and unrealized gain (loss) on investment securities. Other foreign currency transactions resulting in realized and unrealized gain (loss) are disclosed separately.
Investment Transactions and Income. For financial reporting purposes, the Fund's investment holdings and NAV include trades executed through the end of the last business day of the period. The NAV per share for processing shareholder transactions is calculated as of the close of business of the New York Stock Exchange (NYSE), normally 4:00 p.m. Eastern time and includes trades executed through the end of the prior business day. Gains and losses on securities sold are determined on the basis of identified cost and include proceeds received from litigation. Dividend income is recorded on the ex-dividend date, except for certain dividends from foreign securities where the ex-dividend date may have passed, which are recorded as soon as the Fund is informed of the ex-dividend date. Non-cash dividends included in dividend income, if any, are recorded at the fair market value of the securities received. Income and capital gain distributions from Fidelity Central Funds, if any, are recorded on the ex-dividend date. Certain distributions received by the Fund represent a return of capital or capital gain. The Fund determines the components of these distributions subsequent to the ex-dividend date, based upon receipt of tax filings or other correspondence relating to the underlying investment. These distributions are recorded as a reduction of cost of investments and/or as a realized gain. Interest income is accrued as earned and includes coupon interest and amortization of premium and accretion of discount on debt securities as applicable. Investment income is recorded net of foreign taxes withheld where recovery of such taxes is uncertain.
Class Allocations and Expenses. Investment income, realized and unrealized capital gains and losses, common expenses of the Fund, and certain fund-level expense reductions, if any, are allocated daily on a pro-rata basis to each class based on the relative net assets of each class to the total net assets of the Fund. Each class differs with respect to transfer agent fees incurred. Certain expense reductions may also differ by class. For the reporting period, the allocated portion of income and expenses to each class as a percent of its average net assets may vary due to the timing of recording these transactions in relation to fluctuating net assets of the classes. Expenses directly attributable to a fund are charged to that fund. Expenses attributable to more than one fund are allocated among the respective funds on the basis of relative net assets or other appropriate methods. Expense estimates are accrued in the period to which they relate and adjustments are made when actual amounts are known.
Deferred Trustee Compensation. Under a Deferred Compensation Plan (the Plan) for the Fund, certain independent Trustees have elected to defer receipt of a portion of their annual compensation. Deferred amounts are invested in a cross-section of Fidelity funds, are marked-to-market and remain in the Fund until distributed in accordance with the Plan. The investment of deferred amounts and the offsetting payable to the Trustees of $536 are included in the accompanying Statement of Assets and Liabilities in other receivables and other payables and accrued expenses, respectively.
Income Tax Information and Distributions to Shareholders. Each year, the Fund intends to qualify as a regulated investment company under Subchapter M of the Internal Revenue Code, including distributing substantially all of its taxable income and realized gains. As a result, no provision for U.S. Federal income taxes is required. As of October 31, 2019, the Fund did not have any unrecognized tax benefits in the financial statements; nor is the Fund aware of any tax positions for which it is reasonably possible that the total amounts of unrecognized tax benefits will significantly change in the next twelve months. The Fund files a U.S. federal tax return, in addition to state and local tax returns as required. The Fund's federal income tax returns are subject to examination by the Internal Revenue Service (IRS) for a period of three fiscal years after they are filed. State and local tax returns may be subject to examination for an additional fiscal year depending on the jurisdiction. Foreign taxes are provided for based on the Fund's understanding of the tax rules and rates that exist in the foreign markets in which it invests.
Distributions are declared and recorded on the ex-dividend date. Income and capital gain distributions are declared separately for each class. Income and capital gain distributions are determined in accordance with income tax regulations, which may differ from GAAP. In addition, the Fund claimed a portion of the payment made to redeeming shareholders as a distribution for income tax purposes.
Capital accounts within the financial statements are adjusted for permanent book-tax differences. These adjustments have no impact on net assets or the results of operations. Capital accounts are not adjusted for temporary book-tax differences which will reverse in a subsequent period.
Book-tax differences are primarily due to foreign currency transactions, passive foreign investment companies (PFIC), market discount, deferred trustees compensation, partnerships and losses deferred due to wash sales.
As of period end, the cost and unrealized appreciation (depreciation) in securities, and derivatives if applicable, for federal income tax purposes were as follows:
| Gross unrealized appreciation | $990,104 |
| Gross unrealized depreciation | (704,628) |
| Net unrealized appreciation (depreciation) | $285,476 |
| Tax Cost | $6,610,784 |
The tax-based components of distributable earnings as of period end were as follows:
| Undistributed ordinary income | $62,156 |
| Undistributed long-term capital gain | $150,695 |
| Net unrealized appreciation (depreciation) on securities and other investments | $283,882 |
The tax character of distributions paid was as follows:
| | October 31, 2019 | October 31, 2018 |
| Ordinary Income | $215,858 | $ 302,079 |
| Long-term Capital Gains | 663,798 | 99,114 |
| Total | $879,656 | $ 401,193 |
Restricted Securities. The Fund may invest in securities that are subject to legal or contractual restrictions on resale. These securities generally may be resold in transactions exempt from registration or to the public if the securities are registered. Disposal of these securities may involve time-consuming negotiations and expense, and prompt sale at an acceptable price may be difficult. Information regarding restricted securities is included at the end of the Fund's Schedule of Investments.
4. Derivative Instruments.
Risk Exposures and the Use of Derivative Instruments. The Fund's investment objective allows the Fund to enter into various types of derivative contracts, including futures contracts. Derivatives are investments whose value is primarily derived from underlying assets, indices or reference rates and may be transacted on an exchange or over-the-counter (OTC). Derivatives may involve a future commitment to buy or sell a specified asset based on specified terms, to exchange future cash flows at periodic intervals based on a notional principal amount, or for one party to make one or more payments upon the occurrence of specified events in exchange for periodic payments from the other party.
The Fund used derivatives to increase returns and to manage exposure to certain risks as defined below. The success of any strategy involving derivatives depends on analysis of numerous economic factors, and if the strategies for investment do not work as intended, the Fund may not achieve its objectives.
The Fund's use of derivatives increased or decreased its exposure to the following risk:
| Equity Risk | Equity risk relates to the fluctuations in the value of financial instruments as a result of changes in market prices (other than those arising from interest rate risk or foreign exchange risk), whether caused by factors specific to an individual investment, its issuer, or all factors affecting all instruments traded in a market or market segment.
|
The Fund is also exposed to additional risks from investing in derivatives, such as liquidity risk and counterparty credit risk. Liquidity risk is the risk that the Fund will be unable to close out the derivative in the open market in a timely manner. Counterparty credit risk is the risk that the counterparty will not be able to fulfill its obligation to the Fund. Counterparty credit risk related to exchange-traded futures contracts may be mitigated by the protection provided by the exchange on which they trade.
Investing in derivatives may involve greater risks than investing in the underlying assets directly and, to varying degrees, may involve risk of loss in excess of any initial investment and collateral received and amounts recognized in the Statement of Assets and Liabilities. In addition, there may be the risk that the change in value of the derivative contract does not correspond to the change in value of the underlying instrument.
Futures Contracts. A futures contract is an agreement between two parties to buy or sell a specified underlying instrument for a fixed price at a specified future date. The Fund used futures contracts to manage its exposure to the stock market.
Upon entering into a futures contract, a fund is required to deposit either cash or securities (initial margin) with a clearing broker in an amount equal to a certain percentage of the face value of the contract. Futures contracts are marked-to-market daily and subsequent daily payments (variation margin) are made or received by a fund depending on the daily fluctuations in the value of the futures contracts and are recorded as unrealized appreciation or (depreciation). This receivable and/or payable, if any, is included in daily variation margin on futures contracts in the Statement of Assets and Liabilities. Realized gain or (loss) is recorded upon the expiration or closing of a futures contract. The net realized gain (loss) and change in net unrealized appreciation (depreciation) on futures contracts during the period is presented in the Statement of Operations.
Any open futures contracts at period end are presented in the Schedule of Investments under the caption "Futures Contracts". The notional amount at value reflects each contract's exposure to the underlying instrument or index at period end. Securities deposited to meet initial margin requirements are identified in the Schedule of Investments.
5. Purchases and Sales of Investments.
Purchases and sales of securities, other than short-term securities, aggregated $5,063,452 and $5,747,640, respectively.
6. Fees and Other Transactions with Affiliates.
Management Fee. Fidelity Management & Research Company (the investment adviser) and its affiliates provide the Fund with investment management related services for which the Fund pays a monthly management fee. The management fee is the sum of an individual fund fee rate that is based on an annual rate of .30% of the Fund's average net assets and an annualized group fee rate that averaged .24% during the period. The group fee rate is based upon the average net assets of all the mutual funds advised by the investment adviser, including any mutual funds previously advised by the investment adviser that are currently advised by Fidelity SelectCo, LLC, an affiliate of the investment adviser. The group fee rate decreases as assets under management increase and increases as assets under management decrease. In addition, the management fee is subject to a performance adjustment (up to a maximum of +/- .20% of the Fund's average net assets over a 36 month performance period). The upward or downward adjustment to the management fee is based on the relative investment performance of Value as compared to its benchmark index, the Russell Midcap Value Index, over the same 36 month performance period. For the reporting period, the total annual management fee rate, including the performance adjustment, was .42% of the Fund's average net assets. The performance adjustment included in the management fee rate may be higher or lower than the maximum performance adjustment rate due to the difference between the average net assets for the reporting and performance periods.
Transfer Agent Fees. Fidelity Investments Institutional Operations Company, Inc., (FIIOC), an affiliate of the investment adviser, is the transfer, dividend disbursing and shareholder servicing agent for each class of the Fund. FIIOC receives account fees and asset-based fees that vary according to the account size and type of account of the shareholders of Value, except for Class K. FIIOC receives an asset-based fee of Class K's average net assets. FIIOC pays for typesetting, printing and mailing of shareholder reports, except proxy statements.
For the period, transfer agent fees for each class were as follows:
| | Amount | % of Class-Level Average Net Assets |
| Value | $8,634 | .14 |
| Class K | 353 | .05 |
| | $8,987 | |
Accounting and Security Lending Fees. Fidelity Service Company, Inc. (FSC), an affiliate of the investment adviser, maintains the Fund's accounting records. The accounting fee is based on the level of average net assets for each month. Prior to April 1, 2019, FSC had a separate agreement with the Fund for administration of the security lending program, based on the number and duration of lending transactions. For the period, the total fees paid for accounting and administration of securities lending were equivalent to an annual rate of .02%.
Brokerage Commissions. The Fund placed a portion of its portfolio transactions with brokerage firms which are affiliates of the investment adviser. Brokerage commissions are included in net realized gain (loss) and change in net unrealized appreciation (depreciation) in the Statement of Operations. The commissions paid to these affiliated firms were $226 for the period.
Interfund Lending Program. Pursuant to an Exemptive Order issued by the SEC, the Fund, along with other registered investment companies having management contracts with Fidelity Management & Research Company (FMR) or other affiliated entities of FMR, may participate in an interfund lending program. This program provides an alternative credit facility allowing the funds to borrow from, or lend money to, other participating affiliated funds. At period end, there were no interfund loans outstanding. The Fund's activity in this program during the period for which loans were outstanding was as follows:
| Borrower or Lender | Average Loan Balance | Weighted Average Interest Rate | Interest Expense |
| Borrower | $23,230 | 2.49% | $5 |
Interfund Trades. The Fund may purchase from or sell securities to other Fidelity Funds under procedures adopted by the Board. The procedures have been designed to ensure these interfund trades are executed in accordance with Rule 17a-7 of the 1940 Act. Interfund trades are included within the respective purchases and sales amounts shown in the Purchases and Sales of Investments note.
7. Committed Line of Credit.
The Fund participates with other funds managed by the investment adviser or an affiliate in a $4.25 billion credit facility (the "line of credit") to be utilized for temporary or emergency purposes to fund shareholder redemptions or for other short-term liquidity purposes. The Fund has agreed to pay commitment fees on its pro-rata portion of the line of credit, which amounted to $18 and is reflected in Miscellaneous expenses on the Statement of Operations. During the period, the Fund did not borrow on this line of credit.
8. Security Lending.
The Fund lends portfolio securities from time to time in order to earn additional income. For equity securities, lending agents are used, including National Financial Services (NFS), an affiliate of the Fund. Pursuant to a securities lending agreement, NFS will receive a fee, which is capped at 9.9% of daily lending revenue, for its services as lending agent. The Fund may lend securities to certain qualified borrowers, including NFS. On the settlement date of the loan, the Fund receives collateral (in the form of U.S. Treasury obligations, letters of credit and/or cash) against the loaned securities and maintains collateral in an amount not less than 100% of the market value of the loaned securities during the period of the loan. The market value of the loaned securities is determined at the close of business of the Fund and any additional required collateral is delivered to the Fund on the next business day. The Fund or borrower may terminate the loan at any time, and if the borrower defaults on its obligation to return the securities loaned because of insolvency or other reasons, the Fund may apply collateral received from the borrower against the obligation. The Fund may experience delays and costs in recovering the securities loaned. Any cash collateral received is invested in the Fidelity Securities Lending Cash Central Fund. The value of loaned securities and cash collateral at period end are disclosed on the Fund's Statement of Assets and Liabilities. The value of securities loaned to NFS, as affiliated borrower, at period end was $7,429. Total fees paid by the Fund to NFS, as lending agent, amounted to $12. Security lending income represents the income earned on investing cash collateral, less rebates paid to borrowers and any lending agent fees associated with the loan, plus any premium payments received for lending certain types of securities. Security lending income is presented in the Statement of Operations as a component of income from Fidelity Central Funds., and includes $11 from securities loaned to NFS, as affiliated borrower.
9. Expense Reductions.
Commissions paid to certain brokers with whom the investment adviser, or its affiliates, places trades on behalf of the Fund include an amount in addition to trade execution, which may be rebated back to the Fund to offset certain expenses. This amount totaled $336 for the period. During the period, transfer agent credits reduced each class' expenses as noted in the table below.
| | Expense reduction |
| Value | $4 |
In addition, during the period the investment adviser reimbursed and/or waived a portion of fund-level operating expenses in the amount of $51.
10. Distributions to Shareholders.
Distributions to shareholders of each class were as follows:
| | Year ended
October 31, 2019 | Year ended
October 31, 2018 |
| Distributions to shareholders | | |
| Value | $774,997 | $341,788 |
| Class K | 104,659 | 59,405 |
| Total | $879,656 | $401,193 |
11. Share Transactions.
Share transactions for each class were as follows and may contain automatic conversions between classes or exchanges between affiliated funds:
| | Shares | Shares | Dollars | Dollars |
| | Year ended October 31, 2019 | Year ended October 31, 2018(a) | Year ended October 31, 2019 | Year ended October 31, 2018 |
| Value | | | | |
| Shares sold | 35,232 | 16,805 | $343,088 | $201,914 |
| Reinvestment of distributions | 77,071 | 26,848 | 722,157 | 319,599 |
| Shares redeemed | (89,380) | (91,551) | (898,938) | (1,103,877) |
| Net increase (decrease) | 22,923 | (47,898) | $166,307 | $(582,364) |
| Class K | | | | |
| Shares sold | 8,047 | 26,637 | $81,588 | $323,494 |
| Reinvestment of distributions | 11,170 | 4,987 | 104,659 | 59,405 |
| Shares redeemed | (24,966) | (43,915) | (251,505) | (532,207) |
| Net increase (decrease) | (5,749) | (12,291) | $(65,258) | $(149,308) |
(a) Share activity prior to May 11, 2018 has been adjusted to reflect the impact of the 10 for 1 share split that occurred on that date.
12. Other.
The Fund's organizational documents provide former and current trustees and officers with a limited indemnification against liabilities arising in connection with the performance of their duties to the Fund. In the normal course of business, the Fund may also enter into contracts that provide general indemnifications. The Fund's maximum exposure under these arrangements is unknown as this would be dependent on future claims that may be made against the Fund. The risk of material loss from such claims is considered remote.
Report of Independent Registered Public Accounting Firm
To the Board of Trustees of Fidelity Capital Trust and Shareholders of Fidelity Value Fund:
Opinion on the Financial Statements
We have audited the accompanying statement of assets and liabilities, including the schedule of investments, of Fidelity Value Fund (one of the funds constituting Fidelity Capital Trust, referred to hereafter as the “Fund”) as of October 31, 2019, the related statement of operations for the year ended October 31, 2019, the statement of changes in net assets for each of the two years in the period ended October 31, 2019, including the related notes, and the financial highlights for each of the five years in the period ended October 31, 2019 (collectively referred to as the “financial statements”). In our opinion, the financial statements present fairly, in all material respects, the financial position of the Fund as of October 31, 2019, the results of its operations for the year then ended, the changes in its net assets for each of the two years in the period ended October 31, 2019 and the financial highlights for each of the five years in the period ended October 31, 2019 in conformity with accounting principles generally accepted in the United States of America.
Basis for Opinion
These financial statements are the responsibility of the Fund’s management. Our responsibility is to express an opinion on the Fund’s financial statements based on our audits. We are a public accounting firm registered with the Public Company Accounting Oversight Board (United States) (PCAOB) and are required to be independent with respect to the Fund in accordance with the U.S. federal securities laws and the applicable rules and regulations of the Securities and Exchange Commission and the PCAOB.
We conducted our audits of these financial statements in accordance with the standards of the PCAOB. Those standards require that we plan and perform the audit to obtain reasonable assurance about whether the financial statements are free of material misstatement, whether due to error or fraud.
Our audits included performing procedures to assess the risks of material misstatement of the financial statements, whether due to error or fraud, and performing procedures that respond to those risks. Such procedures included examining, on a test basis, evidence regarding the amounts and disclosures in the financial statements. Our audits also included evaluating the accounting principles used and significant estimates made by management, as well as evaluating the overall presentation of the financial statements. Our procedures included confirmation of securities owned as of October 31, 2019 by correspondence with the custodian and brokers; when replies were not received from brokers, we performed other auditing procedures. We believe that our audits provide a reasonable basis for our opinion.
PricewaterhouseCoopers LLP
Boston, Massachusetts
December 11, 2019
We have served as the auditor of one or more investment companies in the Fidelity group of funds since 1932.
Trustees and Officers
The Trustees, Members of the Advisory Board (if any), and officers of the trust and fund, as applicable, are listed below. The Board of Trustees governs the fund and is responsible for protecting the interests of shareholders. The Trustees are experienced executives who meet periodically throughout the year to oversee the fund's activities, review contractual arrangements with companies that provide services to the fund, oversee management of the risks associated with such activities and contractual arrangements, and review the fund's performance. Except for Michael E. Wiley, each of the Trustees oversees 298 funds. Mr. Wiley oversees 197 funds.
The Trustees hold office without limit in time except that (a) any Trustee may resign; (b) any Trustee may be removed by written instrument, signed by at least two-thirds of the number of Trustees prior to such removal; (c) any Trustee who requests to be retired or who has become incapacitated by illness or injury may be retired by written instrument signed by a majority of the other Trustees; and (d) any Trustee may be removed at any special meeting of shareholders by a two-thirds vote of the outstanding voting securities of the trust. Each Trustee who is not an interested person (as defined in the 1940 Act) of the trust and the fund is referred to herein as an Independent Trustee. Each Independent Trustee shall retire not later than the last day of the calendar year in which his or her 75th birthday occurs. The Independent Trustees may waive this mandatory retirement age policy with respect to individual Trustees. Officers and Advisory Board Members hold office without limit in time, except that any officer or Advisory Board Member may resign or may be removed by a vote of a majority of the Trustees at any regular meeting or any special meeting of the Trustees. Except as indicated, each individual has held the office shown or other offices in the same company for the past five years.
The fund's Statement of Additional Information (SAI) includes more information about the Trustees. To request a free copy, call Fidelity at 1-800-544-8544 if you’re an individual investing directly with Fidelity, call 1-800-835-5092 if you’re a plan sponsor or participant with Fidelity as your recordkeeper or call 1-877-208-0098 on institutional accounts or if you’re an advisor or invest through one.
Experience, Skills, Attributes, and Qualifications of the Trustees. The Governance and Nominating Committee has adopted a statement of policy that describes the experience, qualifications, attributes, and skills that are necessary and desirable for potential Independent Trustee candidates (Statement of Policy). The Board believes that each Trustee satisfied at the time he or she was initially elected or appointed a Trustee, and continues to satisfy, the standards contemplated by the Statement of Policy. The Governance and Nominating Committee also engages professional search firms to help identify potential Independent Trustee candidates who have the experience, qualifications, attributes, and skills consistent with the Statement of Policy. From time to time, additional criteria based on the composition and skills of the current Independent Trustees, as well as experience or skills that may be appropriate in light of future changes to board composition, business conditions, and regulatory or other developments, have also been considered by the professional search firms and the Governance and Nominating Committee. In addition, the Board takes into account the Trustees' commitment and participation in Board and committee meetings, as well as their leadership of standing and ad hoc committees throughout their tenure.
In determining that a particular Trustee was and continues to be qualified to serve as a Trustee, the Board has considered a variety of criteria, none of which, in isolation, was controlling. The Board believes that, collectively, the Trustees have balanced and diverse experience, qualifications, attributes, and skills, which allow the Board to operate effectively in governing the fund and protecting the interests of shareholders. Information about the specific experience, skills, attributes, and qualifications of each Trustee, which in each case led to the Board's conclusion that the Trustee should serve (or continue to serve) as a trustee of the fund, is provided below.
Board Structure and Oversight Function. James C. Curvey is an interested person and currently serves as Chairman. The Trustees have determined that an interested Chairman is appropriate and benefits shareholders because an interested Chairman has a personal and professional stake in the quality and continuity of services provided to the fund. Independent Trustees exercise their informed business judgment to appoint an individual of their choosing to serve as Chairman, regardless of whether the Trustee happens to be independent or a member of management. The Independent Trustees have determined that they can act independently and effectively without having an Independent Trustee serve as Chairman and that a key structural component for assuring that they are in a position to do so is for the Independent Trustees to constitute a substantial majority for the Board. The Independent Trustees also regularly meet in executive session. Ned C. Lautenbach serves as Chairman of the Independent Trustees and as such (i) acts as a liaison between the Independent Trustees and management with respect to matters important to the Independent Trustees and (ii) with management prepares agendas for Board meetings.
Fidelity® funds are overseen by different Boards of Trustees. The fund's Board oversees Fidelity's high income and certain equity funds, and other Boards oversee Fidelity's investment-grade bond, money market, asset allocation, and other equity funds. The asset allocation funds may invest in Fidelity® funds overseen by the fund's Board. The use of separate Boards, each with its own committee structure, allows the Trustees of each group of Fidelity® funds to focus on the unique issues of the funds they oversee, including common research, investment, and operational issues. On occasion, the separate Boards establish joint committees to address issues of overlapping consequences for the Fidelity® funds overseen by each Board.
The Trustees operate using a system of committees to facilitate the timely and efficient consideration of all matters of importance to the Trustees, the fund, and fund shareholders and to facilitate compliance with legal and regulatory requirements and oversight of the fund's activities and associated risks. The Board, acting through its committees, has charged FMR and its affiliates with (i) identifying events or circumstances the occurrence of which could have demonstrably adverse effects on the fund's business and/or reputation; (ii) implementing processes and controls to lessen the possibility that such events or circumstances occur or to mitigate the effects of such events or circumstances if they do occur; and (iii) creating and maintaining a system designed to evaluate continuously business and market conditions in order to facilitate the identification and implementation processes described in (i) and (ii) above. Because the day-to-day operations and activities of the fund are carried out by or through FMR, its affiliates, and other service providers, the fund's exposure to risks is mitigated but not eliminated by the processes overseen by the Trustees. While each of the Board's committees has responsibility for overseeing different aspects of the fund's activities, oversight is exercised primarily through the Operations, Audit, and Compliance Committees. Appropriate personnel, including but not limited to the fund's Chief Compliance Officer (CCO), FMR's internal auditor, the independent accountants, the fund's Treasurer and portfolio management personnel, make periodic reports to the Board's committees, as appropriate, including an annual review of Fidelity's risk management program for the Fidelity® funds. The responsibilities of each standing committee, including their oversight responsibilities, are described further under "Standing Committees of the Trustees."
Interested Trustees*:
Correspondence intended for a Trustee who is an interested person may be sent to Fidelity Investments, 245 Summer Street, Boston, Massachusetts 02210.
Name, Year of Birth; Principal Occupations and Other Relevant Experience+
James C. Curvey (1935)
Year of Election or Appointment: 2007
Trustee
Chairman of the Board of Trustees
Mr. Curvey also serves as Trustee of other Fidelity® funds. Mr. Curvey is Vice Chairman (2007-present) and Director of FMR LLC (diversified financial services company). In addition, Mr. Curvey is an Overseer Emeritus for the Boston Symphony Orchestra, a Director of Artis-Naples, and a Trustee of Brewster Academy in Wolfeboro, New Hampshire. Previously, Mr. Curvey served as a Director of Fidelity Research & Analysis Co. (investment adviser firm, 2009-2018), Director of Fidelity Investments Money Management, Inc. (investment adviser firm, 2009-2014) and a Director of FMR and FMR Co., Inc. (investment adviser firms, 2007-2014).
* Determined to be an “Interested Trustee” by virtue of, among other things, his or her affiliation with the trust or various entities under common control with FMR.
+ The information includes the Trustee's principal occupation during the last five years and other information relating to the experience, attributes, and skills relevant to the Trustee's qualifications to serve as a Trustee, which led to the conclusion that the Trustee should serve as a Trustee for the fund.
Independent Trustees:
Correspondence intended for an Independent Trustee may be sent to Fidelity Investments, P.O. Box 55235, Boston, Massachusetts 02205-5235.
Name, Year of Birth; Principal Occupations and Other Relevant Experience+
Dennis J. Dirks (1948)
Year of Election or Appointment: 2005
Trustee
Mr. Dirks also serves as Trustee of other Fidelity® funds. Prior to his retirement in May 2003, Mr. Dirks was Chief Operating Officer and a member of the Board of The Depository Trust & Clearing Corporation (DTCC). He also served as President, Chief Operating Officer, and Board member of The Depository Trust Company (DTC) and President and Board member of the National Securities Clearing Corporation (NSCC). In addition, Mr. Dirks served as Chief Executive Officer and Board member of the Government Securities Clearing Corporation, Chief Executive Officer and Board member of the Mortgage-Backed Securities Clearing Corporation, as a Trustee and a member of the Finance Committee of Manhattan College (2005-2008), as a Trustee and a member of the Finance Committee of AHRC of Nassau County (2006-2008), as a member of the Independent Directors Council (IDC) Governing Council (2010-2015), and as a member of the Board of Directors for The Brookville Center for Children’s Services, Inc. (2009-2017). Mr. Dirks is a member of the Finance Committee (2016-present) and Board of Directors (2017-present) and is Treasurer (2018-present) of the Asolo Repertory Theatre.
Donald F. Donahue (1950)
Year of Election or Appointment: 2018
Trustee
Mr. Donahue also serves as a Trustee of other Fidelity® funds. Mr. Donahue is President and Chief Executive Officer of Miranda Partners, LLC (risk consulting for the financial services industry, 2012-present). Previously, Mr. Donahue served as a Member of the Advisory Board of certain Fidelity® funds (2015-2018) and Chief Executive Officer (2006-2012), Chief Operating Officer (2003-2006), and Managing Director, Customer Marketing and Development (1999-2003) of The Depository Trust & Clearing Corporation (financial markets infrastructure). Mr. Donahue serves as a Member (2007-present) and Co-Chairman (2016-present) of the Board of Directors of United Way of New York, Member of the Board of Directors of NYC Leadership Academy (2012-present) and Member of the Board of Advisors of Ripple Labs, Inc. (financial services, 2015-present). He also served as Chairman (2010-2012) and Member of the Board of Directors (2012-2013) of Omgeo, LLC (financial services), Treasurer of United Way of New York (2012-2016), and Member of the Board of Directors of XBRL US (financial services non-profit, 2009-2012) and the International Securities Services Association (2009-2012).
Alan J. Lacy (1953)
Year of Election or Appointment: 2008
Trustee
Mr. Lacy also serves as Trustee of other Fidelity® funds. Mr. Lacy serves as a Director of Bristol-Myers Squibb Company (global pharmaceuticals, 2008-present). He is a Trustee of the California Chapter of The Nature Conservancy (2015-present) and a Director of the Center for Advanced Study in the Behavioral Sciences at Stanford University (2015-present). In addition, Mr. Lacy served as Senior Adviser (2007-2014) of Oak Hill Capital Partners, L.P. (private equity) and also served as Chief Executive Officer (2005) and Vice Chairman (2005-2006) of Sears Holdings Corporation (retail) and Chief Executive Officer and Chairman of the Board of Sears, Roebuck and Co. (retail, 2000-2005). Previously, Mr. Lacy served as Chairman (2014-2017) and a member (2010-2017) of the Board of Directors of Dave & Buster’s Entertainment, Inc. (restaurant and entertainment complexes), as Chairman (2008-2011) and a member (2006-2015) of the Board of Trustees of the National Parks Conservation Association, and as a member of the Board of Directors for The Hillman Companies, Inc. (hardware wholesalers, 2010-2014), Earth Fare, Inc. (retail grocery, 2010-2014), and The Western Union Company (global money transfer, 2006-2011).
Ned C. Lautenbach (1944)
Year of Election or Appointment: 2000
Trustee
Chairman of the Independent Trustees
Mr. Lautenbach also serves as Trustee of other Fidelity® funds. Mr. Lautenbach currently serves as Chair (2018-present) and Member (2013-present) of the Board of Governors, State University System of Florida and is a member of the Council on Foreign Relations (1994-present). He is also a member and has most recently served as Chairman of the Board of Directors of Artis-Naples (2012-present). Previously, Mr. Lautenbach served as a member and then Lead Director of the Board of Directors of Eaton Corporation (diversified industrial, 1997-2016). He was also a Partner and Advisory Partner at Clayton, Dubilier & Rice, LLC (private equity investment, 1998-2010), as well as a Director of Sony Corporation (2006-2007). In addition, Mr. Lautenbach also had a 30-year career with IBM (technology company) during which time he served as Senior Vice President and a member of the Corporate Executive Committee (1968-1998).
Joseph Mauriello (1944)
Year of Election or Appointment: 2008
Trustee
Mr. Mauriello also serves as Trustee of other Fidelity® funds. Prior to his retirement in January 2006, Mr. Mauriello served in numerous senior management positions including Deputy Chairman and Chief Operating Officer (2004-2005), and Vice Chairman of Financial Services (2002-2004) of KPMG LLP US (professional services, 1965-2005). Mr. Mauriello currently serves as a member of the Independent Directors Council (IDC) Governing Council (2015-present). Previously, Mr. Mauriello served as a member of the Board of Directors of XL Group plc. (global insurance and re-insurance, 2006-2018).
Cornelia M. Small (1944)
Year of Election or Appointment: 2005
Trustee
Ms. Small also serves as Trustee of other Fidelity® funds. Ms. Small is a member of the Board of Directors (2009-present) and Chair of the Investment Committee (2010-present) of the Teagle Foundation. Ms. Small also serves on the Investment Committee of the Berkshire Taconic Community Foundation (2008-present). Previously, Ms. Small served as Chairperson (2002-2008) and a member of the Investment Committee and Chairperson (2008-2012) and a member of the Board of Trustees of Smith College. In addition, Ms. Small served as Chief Investment Officer, Director of Global Equity Investments, and a member of the Board of Directors of Scudder, Stevens & Clark and Scudder Kemper Investments.
Garnett A. Smith (1947)
Year of Election or Appointment: 2018
Trustee
Mr. Smith also serves as Trustee of other Fidelity® funds. Prior to Mr. Smith's retirement, he served as Chairman and Chief Executive Officer of Inbrand Corp. (manufacturer of personal absorbent products, 1990-1997). He also served as President (1986-1990) of Inbrand Corp. Prior to his employment with Inbrand Corp., he was employed by a retail fabric chain and North Carolina National Bank. In addition, Mr. Smith served as a Member of the Advisory Board of certain Fidelity® funds (2012-2013) and as a board member of the Jackson Hole Land Trust (2009-2012).
David M. Thomas (1949)
Year of Election or Appointment: 2008
Trustee
Mr. Thomas also serves as Trustee of other Fidelity® funds. Mr. Thomas serves as Non-Executive Chairman of the Board of Directors of Fortune Brands Home and Security (home and security products, 2011-present) and as a member of the Board of Directors (2004-present) and Presiding Director (2013-present) of Interpublic Group of Companies, Inc. (marketing communication). Previously, Mr. Thomas served as Executive Chairman (2005-2006) and Chairman and Chief Executive Officer (2000-2005) of IMS Health, Inc. (pharmaceutical and healthcare information solutions), a Director of Fortune Brands, Inc. (consumer products, 2000-2011), and a member of the Board of Trustees of the University of Florida (2013-2018).
Michael E. Wiley (1950)
Year of Election or Appointment: 2018
Trustee
Mr. Wiley also serves as Trustee or Member of the Advisory Board of other Fidelity® funds. Mr. Wiley serves as a Director of High Point Resources (exploration and production, 2005-present). Previously, Mr. Wiley served as a Director of Andeavor Corporation (independent oil refiner and marketer, 2005-2018), a Director of Andeavor Logistics LP (natural resources logistics, 2015-2018), a Director of Post Oak Bank (privately-held bank, 2004-2018), a Director of Asia Pacific Exploration Consolidated (international oil and gas exploration and production, 2008-2013), a member of the Board of Trustees of the University of Tulsa (2000-2006; 2007-2010), a Senior Energy Advisor of Katzenbach Partners, LLC (consulting, 2006-2007), an Advisory Director of Riverstone Holdings (private investment), a Director of Spinnaker Exploration Company (exploration and production, 2001-2005) and Chairman, President, and CEO of Baker Hughes, Inc. (oilfield services, 2000-2004).
+ The information includes the Trustee's principal occupation during the last five years and other information relating to the experience, attributes, and skills relevant to the Trustee's qualifications to serve as a Trustee, which led to the conclusion that the Trustee should serve as a Trustee for the fund.
Advisory Board Members and Officers:
Correspondence intended for a Member of the Advisory Board (if any) may be sent to Fidelity Investments, P.O. Box 55235, Boston, Massachusetts 02205-5235. Correspondence intended for an officer or Peter S. Lynch may be sent to Fidelity Investments, 245 Summer Street, Boston, Massachusetts 02210. Officers appear below in alphabetical order.
Name, Year of Birth; Principal Occupation
Vicki L. Fuller (1957)
Year of Election or Appointment: 2018
Member of the Advisory Board
Ms. Fuller also serves as Member of the Advisory Board of other Fidelity® funds. Ms. Fuller serves as a member of the Board of Directors, Audit Committee, and Nominating and Governance Committee of The Williams Companies, Inc. (natural gas infrastructure, 2018-present). Previously, Ms. Fuller served as the Chief Investment Officer of the New York State Common Retirement Fund (2012-2018) and held a variety of positions at AllianceBernstein L.P. (global asset management, 1985-2012), including Managing Director (2006-2012) and Senior Vice President and Senior Portfolio Manager (2001-2006).
Peter S. Lynch (1944)
Year of Election or Appointment: 2003
Member of the Advisory Board
Mr. Lynch also serves as Member of the Advisory Board of other Fidelity® funds. Mr. Lynch is Vice Chairman and a Director of FMR (investment adviser firm) and FMR Co., Inc. (investment adviser firm). In addition, Mr. Lynch serves as a Trustee of Boston College and as the Chairman of the Inner-City Scholarship Fund. Previously, Mr. Lynch served on the Special Olympics International Board of Directors (1997-2006).
Elizabeth Paige Baumann (1968)
Year of Election or Appointment: 2017
Anti-Money Laundering (AML) Officer
Ms. Baumann also serves as AML Officer of other funds. She is Chief AML Officer (2012-present) and Senior Vice President (2014-present) of FMR LLC (diversified financial services company) and is an employee of Fidelity Investments. Previously, Ms. Baumann served as AML Officer of the funds (2012-2016), and Vice President (2007-2014) and Deputy Anti-Money Laundering Officer (2007-2012) of FMR LLC.
Craig S. Brown (1977)
Year of Election or Appointment: 2019
Assistant Treasurer
Mr. Brown also serves as Assistant Treasurer of other funds. Mr. Brown is an employee of Fidelity Investments (2013-present).
John J. Burke III (1964)
Year of Election or Appointment: 2018
Chief Financial Officer
Mr. Burke also serves as Chief Financial Officer of other funds. Mr. Burke serves as Head of Investment Operations for Fidelity Fund and Investment Operations (2018-present) and is an employee of Fidelity Investments (1998-present). Previously Mr. Burke served as head of Asset Management Investment Operations (2012-2018).
William C. Coffey (1969)
Year of Election or Appointment: 2019
Assistant Secretary
Mr. Coffey also serves as Assistant Secretary of other funds. He is Senior Vice President and Deputy General Counsel of FMR LLC (diversified financial services company, 2010-present), and is an employee of Fidelity Investments. Previously, Mr. Coffey served as Secretary and CLO of certain funds (2018-2019); CLO, Secretary, and Senior Vice President of Fidelity Management & Research Company and FMR Co., Inc. (investment adviser firms, 2018-2019); Secretary of Fidelity SelectCo, LLC and Fidelity Investments Money Management, Inc. (investment adviser firms, 2018-2019); CLO of Fidelity Management & Research (Hong Kong) Limited, FMR Investment Management (UK) Limited, and Fidelity Management & Research (Japan) Limited (investment adviser firms, 2018-2019); and Assistant Secretary of certain funds (2009-2018).
Timothy M. Cohen (1969)
Year of Election or Appointment: 2018
Vice President
Mr. Cohen also serves as Vice President of other funds. Mr. Cohen serves as Executive Vice President of Fidelity SelectCo, LLC (2019-present), Co-Head of Equity (2018-present), a Director of Fidelity Management & Research (Japan) Limited (investment adviser firm, 2016-present), and is an employee of Fidelity Investments. Previously, Mr. Cohen served as Head of Global Equity Research (2016-2018), Chief Investment Officer - Equity and a Director of Fidelity Management & Research (U.K.) Inc. (investment adviser firm, 2013-2015) and as a Director of Fidelity Management & Research (Hong Kong) Limited (investment adviser firm, 2017).
Jonathan Davis (1968)
Year of Election or Appointment: 2010
Assistant Treasurer
Mr. Davis also serves as Assistant Treasurer of other funds. Mr. Davis serves as Assistant Treasurer of FMR Capital, Inc. (2017-present) and is an employee of Fidelity Investments. Previously, Mr. Davis served as Vice President and Associate General Counsel of FMR LLC (diversified financial services company, 2003-2010).
Adrien E. Deberghes (1967)
Year of Election or Appointment: 2016
Assistant Treasurer
Mr. Deberghes also serves as an officer of other funds. He serves as Assistant Treasurer of FMR Capital, Inc. (2017-present), Executive Vice President of Fidelity Investments Money Management, Inc. (FIMM) (investment adviser firm, 2016-present), and is an employee of Fidelity Investments (2008-present). Previously, Mr. Deberghes served as President and Treasurer of certain Fidelity® funds (2013-2018). Prior to joining Fidelity Investments, Mr. Deberghes was Senior Vice President of Mutual Fund Administration at State Street Corporation (2007-2008), Senior Director of Mutual Fund Administration at Investors Bank & Trust (2005-2007), and Director of Finance for Dunkin' Brands (2000-2005). Previously, Mr. Deberghes served in other fund officer roles.
Laura M. Del Prato (1964)
Year of Election or Appointment: 2018
Assistant Treasurer
Ms. Del Prato also serves as an officer of other funds. Ms. Del Prato is an employee of Fidelity Investments (2017-present). Prior to joining Fidelity Investments, Ms. Del Prato served as a Managing Director and Treasurer of the JPMorgan Mutual Funds (2014-2017). Prior to JPMorgan, Ms. Del Prato served as a partner at Cohen Fund Audit Services (accounting firm, 2012-2013) and KPMG LLP (accounting firm, 2004-2012).
Colm A. Hogan (1973)
Year of Election or Appointment: 2016
Deputy Treasurer
Mr. Hogan also serves as an officer of other funds. Mr. Hogan serves as Assistant Treasurer of FMR Capital, Inc. (2017-present) and is an employee of Fidelity Investments (2005-present). Previously, Mr. Hogan served as Assistant Treasurer of certain Fidelity® funds (2016-2018).
Pamela R. Holding (1964)
Year of Election or Appointment: 2018
Vice President
Ms. Holding also serves as Vice President of other funds. Ms. Holding serves as Executive Vice President of Fidelity SelectCo, LLC (2019-present), Co-Head of Equity (2018-present) and is an employee of Fidelity Investments (2013-present). Previously, Ms. Holding served as Chief Investment Officer of Fidelity Institutional Asset Management (2013-2018).
Cynthia Lo Bessette (1969)
Year of Election or Appointment: 2019
Secretary and Chief Legal Officer (CLO)
Ms. Lo Bessette also serves as Secretary and CLO of other funds. Ms. Lo Bessette serves as CLO, Secretary, and Senior Vice President of Fidelity Management & Research Company and FMR Co., Inc. (investment adviser firms, 2019-present); Secretary of Fidelity SelectCo, LLC and Fidelity Investments Money Management, Inc. (investment adviser firms, 2019-present); and CLO of Fidelity Management & Research (Hong Kong) Limited, FMR Investment Management (UK) Limited, and Fidelity Management & Research (Japan) Limited (investment adviser firms, 2019-present). She is a Senior Vice President and Deputy General Counsel of FMR LLC (diversified financial services company, 2019-present), and is an employee of Fidelity Investments. Previously, Ms. Lo Bessette served as Executive Vice President, General Counsel (2016-2019) and Senior Vice President, Deputy General Counsel (2015-2016) of OppenheimerFunds (investment management company) and Deputy Chief Legal Officer (2013-2015) of Jennison Associates LLC (investment adviser firm).
Chris Maher (1972)
Year of Election or Appointment: 2013
Assistant Treasurer
Mr. Maher serves as Assistant Treasurer of other funds. Mr. Maher is Vice President of Valuation Oversight, serves as Assistant Treasurer of FMR Capital, Inc. (2017-present), and is an employee of Fidelity Investments. Previously, Mr. Maher served as Vice President of Asset Management Compliance (2013), Vice President of the Program Management Group of FMR (investment adviser firm, 2010-2013), and Vice President of Valuation Oversight (2008-2010).
Kenneth B. Robins (1969)
Year of Election or Appointment: 2016
Chief Compliance Officer
Mr. Robins also serves as an officer of other funds. Mr. Robins serves as Compliance Officer of Fidelity Management & Research Company and FMR Co., Inc. (investment adviser firms, 2016-present) and is an employee of Fidelity Investments (2004-present). Previously, Mr. Robins served as Executive Vice President of Fidelity Investments Money Management, Inc. (investment adviser firm, 2013-2016) and served in other fund officer roles.
Stacie M. Smith (1974)
Year of Election or Appointment: 2016
President and Treasurer
Ms. Smith also serves as an officer of other funds. Ms. Smith serves as Assistant Treasurer of FMR Capital, Inc. (2017-present), is an employee of Fidelity Investments (2009-present), and has served in other fund officer roles. Prior to joining Fidelity Investments, Ms. Smith served as Senior Audit Manager of Ernst & Young LLP (accounting firm, 1996-2009). Previously, Ms. Smith served as Assistant Treasurer (2013-2018) and Deputy Treasurer (2013-2016) of certain Fidelity® funds.
Marc L. Spector (1972)
Year of Election or Appointment: 2016
Assistant Treasurer
Mr. Spector also serves as an officer of other funds. Mr. Spector serves as Assistant Treasurer of FMR Capital, Inc. (2017-present) and is an employee of Fidelity Investments (2016-present). Prior to joining Fidelity Investments, Mr. Spector served as Director at the Siegfried Group (accounting firm, 2013-2016), and prior to Siegfried Group as audit senior manager at Deloitte & Touche (accounting firm, 2005-2013).
Jim Wegmann (1979)
Year of Election or Appointment: 2019
Assistant Treasurer
Mr. Wegmann also serves as Assistant Treasurer of other funds. Mr. Wegmann is an employee of Fidelity Investments (2011-present).
Shareholder Expense Example
As a shareholder of the Fund, you incur two types of costs: (1) transaction costs and (2) ongoing costs, including management fees and other Fund expenses. This Example is intended to help you understand your ongoing costs (in dollars) of investing in the Fund and to compare these costs with the ongoing costs of investing in other mutual funds.
The Example is based on an investment of $1,000 invested at the beginning of the period and held for the entire period (May 1, 2019 to October 31, 2019).
Actual Expenses
The first line of the accompanying table for each class of the Fund provides information about actual account values and actual expenses. You may use the information in this line, together with the amount you invested, to estimate the expenses that you paid over the period. Simply divide your account value by $1,000.00 (for example, an $8,600 account value divided by $1,000.00 = 8.6), then multiply the result by the number in the first line for a class of the Fund under the heading entitled "Expenses Paid During Period" to estimate the expenses you paid on your account during this period. In addition, the Fund, as a shareholder in the underlying Fidelity Central Funds, will indirectly bear its pro-rata share of the fees and expenses incurred by the underlying Fidelity Central Funds. These fees and expenses are not included in the Fund's annualized expense ratio used to calculate the expense estimate in the table below.
Hypothetical Example for Comparison Purposes
The second line of the accompanying table for each class of the Fund provides information about hypothetical account values and hypothetical expenses based on a Class' actual expense ratio and an assumed rate of return of 5% per year before expenses, which is not the Class' actual return. The hypothetical account values and expenses may not be used to estimate the actual ending account balance or expenses you paid for the period. You may use this information to compare the ongoing costs of investing in the Fund and other funds. To do so, compare this 5% hypothetical example with the 5% hypothetical examples that appear in the shareholder reports of the other funds. In addition, the Fund, as a shareholder in the underlying Fidelity Central Funds, will indirectly bear its pro-rata share of the fees and expenses incurred by the underlying Fidelity Central Funds. These fees and expenses are not included in the Fund's annualized expense ratio used to calculate the expense estimate in the table below.
Please note that the expenses shown in the table are meant to highlight your ongoing costs only and do not reflect any transaction costs. Therefore, the second line of the table is useful in comparing ongoing costs only, and will not help you determine the relative total costs of owning different funds.
| | Annualized Expense Ratio-A | Beginning
Account Value
May 1, 2019 | Ending
Account Value
October 31, 2019 | Expenses Paid
During Period-B
May 1, 2019
to October 31, 2019 |
| Value | .61% | | | |
| Actual | | $1,000.00 | $999.10 | $3.07 |
| Hypothetical-C | | $1,000.00 | $1,022.13 | $3.11 |
| Class K | .51% | | | |
| Actual | | $1,000.00 | $999.10 | $2.57 |
| Hypothetical-C | | $1,000.00 | $1,022.63 | $2.60 |
A Annualized expense ratio reflects expenses net of applicable fee waivers.
B Expenses are equal to each Class' annualized expense ratio, multiplied by the average account value over the period, multiplied by 184/365 (to reflect the one-half year period).
C 5% return per year before expenses
Distributions (Unaudited)
The Board of Trustees of Fidelity Value Fund voted to pay to shareholders of record at the opening of business on record date, the following distributions per share derived from capital gains realized from sales of portfolio securities, and dividends derived from net investment income:
| | Pay Date | Record Date | Dividends | Capital Gains |
| Fidelity Value Fund | | | | |
| Value | 12/09/19 | 12/06/19 | $0.127 | $0.243 |
| Class K | 12/09/19 | 12/06/19 | $0.137 | $0.243 |
|
The fund hereby designates as a capital gain dividend with respect to the taxable year ended October 31, 2019, $155,343,366, or, if subsequently determined to be different, the net capital gain of such year.
The fund designates 36% and Class K designates 35% of the dividends distributed during the fiscal year as qualifying for the dividends–received deduction for corporate shareholders.
The fund designates 45% and Class K designates 44% of the dividends distributed during the fiscal year as amounts which may be taken into account as a dividend for purposes of the maximum rate under section 1(h)(11) of the Internal Revenue Code.
The fund will notify shareholders in January 2020 of amounts for use in preparing 2019 income tax returns.

VAL-ANN-1219
1.538531.122
Fidelity® Capital Appreciation Fund
Annual Report
October 31, 2019
See the inside front cover for important information about access to your fund’s shareholder reports.
Beginning on January 1, 2021, as permitted by regulations adopted by the Securities and Exchange Commission, paper copies of a fund’s shareholder reports will no longer be sent by mail, unless you specifically request paper copies of the reports from the fund or from your financial intermediary, such as a financial advisor, broker-dealer or bank. Instead, the reports will be made available on a website, and you will be notified by mail each time a report is posted and provided with a website link to access the report.
If you already elected to receive shareholder reports electronically, you will not be affected by this change and you need not take any action. You may elect to receive shareholder reports and other communications from a fund electronically, by contacting your financial intermediary. For Fidelity customers, visit Fidelity's web site or call Fidelity using the contact information listed below.
You may elect to receive all future reports in paper free of charge. If you wish to continue receiving paper copies of your shareholder reports, you may contact your financial intermediary or, if you are a Fidelity customer, visit Fidelity’s website, or call Fidelity at the applicable toll-free number listed below. Your election to receive reports in paper will apply to all funds held with the fund complex/your financial intermediary.
| Account Type | Website | Phone Number |
| Brokerage, Mutual Fund, or Annuity Contracts: | fidelity.com/mailpreferences | 1-800-343-3548 |
| Employer Provided Retirement Accounts: | netbenefits.fidelity.com/preferences (choose 'no' under Required Disclosures to continue to print) | 1-800-343-0860 |
| Advisor Sold Accounts Serviced Through Your Financial Intermediary: | Contact Your Financial Intermediary | Your Financial Intermediary's phone number |
| Advisor Sold Accounts Serviced by Fidelity: | institutional.fidelity.com | 1-877-208-0098 |
Contents
To view a fund's proxy voting guidelines and proxy voting record for the 12-month period ended June 30, visit http://www.fidelity.com/proxyvotingresults or visit the Securities and Exchange Commission's (SEC) web site at http://www.sec.gov.
You may also call 1-800-544-8544 if you’re an individual investing directly with Fidelity, call 1-800-835-5092 if you’re a plan sponsor or participant with Fidelity as your recordkeeper or call 1-877-208-0098 on institutional accounts or if you’re an advisor or invest through one to request a free copy of the proxy voting guidelines.
Standard & Poor's, S&P and S&P 500 are registered service marks of The McGraw-Hill Companies, Inc. and have been licensed for use by Fidelity Distributors Corporation.
Other third-party marks appearing herein are the property of their respective owners.
All other marks appearing herein are registered or unregistered trademarks or service marks of FMR LLC or an affiliated company. © 2019 FMR LLC. All rights reserved.
This report and the financial statements contained herein are submitted for the general information of the shareholders of the Fund. This report is not authorized for distribution to prospective investors in the Fund unless preceded or accompanied by an effective prospectus.
A fund files its complete schedule of portfolio holdings with the SEC for the first and third quarters of each fiscal year on Form N-PORT. Forms N-PORT are available on the SEC’s web site at http://www.sec.gov. A fund's Forms N-PORT may be reviewed and copied at the SEC’s Public Reference Room in Washington, DC. Information regarding the operation of the SEC's Public Reference Room may be obtained by calling 1-800-SEC-0330.
For a complete list of a fund's portfolio holdings, view the most recent holdings listing, semiannual report, or annual report on Fidelity's web site at http://www.fidelity.com, http://www.institutional.fidelity.com, or http://www.401k.com, as applicable.
NOT FDIC INSURED •MAY LOSE VALUE •NO BANK GUARANTEE
Neither the Fund nor Fidelity Distributors Corporation is a bank.
Performance: The Bottom Line
Average annual total return reflects the change in the value of an investment, assuming reinvestment of distributions from dividend income and capital gains (the profits earned upon the sale of securities that have grown in value, if any) and assuming a constant rate of performance each year. The hypothetical investment and the average annual total returns do not reflect the deduction of taxes that a shareholder would pay on fund distributions or the redemption of fund shares. During periods of reimbursement by Fidelity, a fund’s total return will be greater than it would be had the reimbursement not occurred. How a fund did yesterday is no guarantee of how it will do tomorrow.
Average Annual Total Returns
| For the periods ended October 31, 2019 | Past 1 year | Past 5 years | Past 10 years |
| Fidelity® Capital Appreciation Fund | 12.24% | 8.68% | 13.88% |
| Class K | 12.33% | 8.79% | 14.02% |
$10,000 Over 10 Years
Let's say hypothetically that $10,000 was invested in Fidelity® Capital Appreciation Fund, a class of the fund, on October 31, 2009.
The chart shows how the value of your investment would have changed, and also shows how the S&P 500® Index performed over the same period.
| Period Ending Values |
| $36,694 | Fidelity® Capital Appreciation Fund - Fidelity® Capital Appreciation Fund |
| $36,096 | S&P 500® Index |
Management's Discussion of Fund Performance
Market Recap: The S&P 500
® index gained 14.33% for the 12 months ending October 31, 2019, ending the period just shy of a record close after seesawing due to trade tension, interest rates, economic data and an inverted yield curve, among other factors. Upbeat company earnings and outlooks, along with signs the Federal Reserve may pause on rates, boosted stocks to an all-time high on April 30. In May, however, volatility spiked and the index sunk as trade negotiations between the U.S. and China broke down. The bull market roared back in June and recorded a series of highs in July, when the Fed, affirming a dovish shift in policy, cut interest rates for the first time since 2008. Volatility intensified in August, however, as the U.S. Treasury yield curve inverted for the first time since 2007, which some investors viewed as a sign the U.S. economy could be heading for recession. The market proved resilient, rising in the final two months and reaching a new high on October 30, when the Fed cut interest rates for the third time this year. For the full 12 months, the defensive real estate (+27%) and utilities (+24%) sectors led the way, followed by information technology (+23%). Communication services and consumer discretionary each gained about 16%, while industrials advanced 15%. In contrast, energy (-11%) was by far the weakest sector – slipping on lower oil prices. Other notable laggards included health care (+9%) and financials (+12%). Lastly, consumer staples and materials finished roughly in line with the index.
Comments from Co-Portfolio Manager Asher Anolic: For the fiscal year, the fund’s share classes returned about 12%, behind the 14.33% result of the S&P 500
® Index. Security selection overall versus the index detracted this period. Among individual stocks, the fund’s untimely positioning in consumer electronics giant Apple hurt most. Shares of Apple gained about 15%. The fund was overweighted in the company at the start of the period, which hurt because Apple shares slid after the company reported lower-than-expected shipments of its smartphone for the fourth straight quarter and warned that holiday sales for the device would not meet forecasts. Later, it hurt to be underweighted the stock as it moved higher, in part on new details about its Apple TV+ video-streaming subscription service, set to debut in November 2019. An overweighted position in bank and brokerage firm Charles Schwab (-19%) also hurt, largely on concerns about brokerage pricing competition and the impact of potentially lower interest rates later in the period. We sold our position in Schwab by period end. Conversely, the fund’s large overweighting in credit-card processing company Visa (+31%) was the fund’s biggest individual contributor. The stock continued to benefit from the long-term trend of more consumer payments being made via credit and debit cards. Software maker Microsoft (+36%), another overweighting, was the fund’s largest holding and the second-largest contributor this period.
The views expressed above reflect those of the portfolio manager(s) only through the end of the period as stated on the cover of this report and do not necessarily represent the views of Fidelity or any other person in the Fidelity organization. Any such views are subject to change at any time based upon market or other conditions and Fidelity disclaims any responsibility to update such views. These views may not be relied on as investment advice and, because investment decisions for a Fidelity fund are based on numerous factors, may not be relied on as an indication of trading intent on behalf of any Fidelity fund.
Note to Shareholders: On March 30, 2019, former Lead Portfolio Manager Fergus Shiel retired from the firm, leaving Asher Anolic and Jason Weiner as co-managers of the fund.
Investment Summary (Unaudited)
Top Ten Stocks as of October 31, 2019
| | % of fund's net assets |
| Microsoft Corp. | 7.1 |
| Visa, Inc. Class A | 5.0 |
| Amazon.com, Inc. | 3.3 |
| Apple, Inc. | 3.1 |
| Procter & Gamble Co. | 2.6 |
| American Tower Corp. | 2.5 |
| Adobe, Inc. | 2.3 |
| Qualcomm, Inc. | 2.1 |
| Alphabet, Inc. Class C | 2.1 |
| AbbVie, Inc. | 2.1 |
| | 32.2 |
Top Five Market Sectors as of October 31, 2019
| | % of fund's net assets |
| Information Technology | 31.0 |
| Consumer Discretionary | 14.5 |
| Health Care | 12.6 |
| Financials | 9.6 |
| Communication Services | 8.2 |
Asset Allocation (% of fund's net assets)
| As of October 31, 2019* |
| | Stocks | 99.3% |
| | Short-Term Investments and Net Other Assets (Liabilities) | 0.7% |

* Foreign investments - 15.9%
Schedule of Investments October 31, 2019
Showing Percentage of Net Assets
| Common Stocks - 97.8% | | | |
| | | Shares | Value (000s) |
| COMMUNICATION SERVICES - 8.2% | | | |
| Entertainment - 1.7% | | | |
| Activision Blizzard, Inc. | | 1,089,000 | $61,017 |
| Electronic Arts, Inc. (a) | | 339,300 | 32,709 |
| | | | 93,726 |
| Interactive Media & Services - 5.6% | | | |
| Alphabet, Inc.: | | | |
| Class A (a) | | 78,600 | 98,942 |
| Class C (a) | | 91,715 | 115,571 |
| Facebook, Inc. Class A (a) | | 361,100 | 69,205 |
| Tencent Holdings Ltd. | | 644,900 | 26,159 |
| | | | 309,877 |
| Wireless Telecommunication Services - 0.9% | | | |
| Sprint Corp. (a) | | 2,589,200 | 16,079 |
| T-Mobile U.S., Inc. (a) | | 387,700 | 32,047 |
| | | | 48,126 |
|
| TOTAL COMMUNICATION SERVICES | | | 451,729 |
|
| CONSUMER DISCRETIONARY - 14.5% | | | |
| Automobiles - 0.9% | | | |
| Ferrari NV | | 293,100 | 46,931 |
| Diversified Consumer Services - 0.9% | | | |
| Grand Canyon Education, Inc. (a) | | 197,874 | 18,196 |
| Laureate Education, Inc. Class A (a) | | 2,038,400 | 31,503 |
| | | | 49,699 |
| Hotels, Restaurants & Leisure - 0.5% | | | |
| Dalata Hotel Group PLC | | 4,407,729 | 26,054 |
| Household Durables - 2.2% | | | |
| D.R. Horton, Inc. | | 1,137,800 | 59,587 |
| NVR, Inc. (a) | | 17,720 | 64,440 |
| | | | 124,027 |
| Internet & Direct Marketing Retail - 6.5% | | | |
| Alibaba Group Holding Ltd. sponsored ADR (a) | | 371,000 | 65,545 |
| Amazon.com, Inc. (a) | | 102,600 | 182,285 |
| Fiverr International Ltd. (b) | | 42,700 | 965 |
| Pinduoduo, Inc. ADR (a) | | 143,800 | 5,879 |
| The Booking Holdings, Inc. (a) | | 52,100 | 106,741 |
| | | | 361,415 |
| Specialty Retail - 2.5% | | | |
| Five Below, Inc. (a) | | 101,100 | 12,649 |
| National Vision Holdings, Inc. (a) | | 460,700 | 10,965 |
| Ross Stores, Inc. | | 649,900 | 71,275 |
| Ulta Beauty, Inc. (a) | | 177,700 | 41,431 |
| | | | 136,320 |
| Textiles, Apparel & Luxury Goods - 1.0% | | | |
| Anta Sports Products Ltd. | | 1,199,000 | 11,729 |
| Canada Goose Holdings, Inc. (a) | | 175,700 | 7,350 |
| LVMH Moet Hennessy Louis Vuitton SE | | 55,300 | 23,616 |
| LVMH Moet Hennessy Louis Vuitton SE | | 34,300 | 14,693 |
| | | | 57,388 |
|
| TOTAL CONSUMER DISCRETIONARY | | | 801,834 |
|
| CONSUMER STAPLES - 6.6% | | | |
| Beverages - 2.4% | | | |
| Coca-Cola European Partners PLC | | 626,500 | 33,524 |
| Keurig Dr. Pepper, Inc. (b) | | 1,088,300 | 30,647 |
| Kweichow Moutai Co. Ltd. (A Shares) | | 55,300 | 9,256 |
| Monster Beverage Corp. (a) | | 193,900 | 10,884 |
| Pernod Ricard SA | | 269,900 | 49,819 |
| | | | 134,130 |
| Household Products - 3.4% | | | |
| Energizer Holdings, Inc. (b) | | 1,053,500 | 44,763 |
| Procter & Gamble Co. | | 1,140,100 | 141,954 |
| Reckitt Benckiser Group PLC | | 5 | 0 |
| | | | 186,717 |
| Personal Products - 0.8% | | | |
| Coty, Inc. Class A | | 1,160,500 | 13,566 |
| Estee Lauder Companies, Inc. Class A | | 165,300 | 30,790 |
| | | | 44,356 |
|
| TOTAL CONSUMER STAPLES | | | 365,203 |
|
| ENERGY - 1.8% | | | |
| Oil, Gas & Consumable Fuels - 1.8% | | | |
| Cheniere Energy, Inc. (a) | | 517,360 | 31,844 |
| Hess Corp. | | 1,068,000 | 70,221 |
| | | | 102,065 |
| FINANCIALS - 9.6% | | | |
| Banks - 3.4% | | | |
| Citigroup, Inc. | | 785,700 | 56,460 |
| M&T Bank Corp. | | 557,700 | 87,297 |
| Wells Fargo & Co. | | 865,900 | 44,706 |
| | | | 188,463 |
| Capital Markets - 2.8% | | | |
| CME Group, Inc. | | 388,256 | 79,884 |
| HUB24 Ltd. (b) | | 1,477,196 | 12,540 |
| Morningstar, Inc. | | 120,800 | 19,550 |
| Netwealth Group Ltd. | | 1,898,893 | 11,518 |
| The Blackstone Group LP | | 581,900 | 30,934 |
| | | | 154,426 |
| Consumer Finance - 1.1% | | | |
| American Express Co. | | 510,100 | 59,825 |
| Insurance - 2.3% | | | |
| American International Group, Inc. | | 1,420,100 | 75,208 |
| Aon PLC | | 268,500 | 51,863 |
| | | | 127,071 |
|
| TOTAL FINANCIALS | | | 529,785 |
|
| HEALTH CARE - 12.6% | | | |
| Biotechnology - 2.1% | | | |
| AbbVie, Inc. | | 1,425,200 | 113,375 |
| BioNTech SE ADR (a) | | 135,500 | 2,279 |
| | | | 115,654 |
| Health Care Equipment & Supplies - 3.1% | | | |
| Alcon, Inc. (Switzerland) (a) | | 229,880 | 13,576 |
| Boston Scientific Corp. (a) | | 1,849,400 | 77,120 |
| Danaher Corp. | | 79,600 | 10,970 |
| Haemonetics Corp. (a) | | 111,500 | 13,461 |
| Intuitive Surgical, Inc. (a) | | 82,600 | 45,674 |
| Penumbra, Inc. (a) | | 74,000 | 11,542 |
| | | | 172,343 |
| Health Care Providers & Services - 1.0% | | | |
| Guardant Health, Inc. | | 40,600 | 2,822 |
| HealthEquity, Inc. (a) | | 229,800 | 13,050 |
| UnitedHealth Group, Inc. | | 159,054 | 40,193 |
| | | | 56,065 |
| Health Care Technology - 0.3% | | | |
| Veeva Systems, Inc. Class A (a) | | 96,700 | 13,715 |
| Life Sciences Tools & Services - 2.4% | | | |
| 10X Genomics, Inc. (a) | | 35,400 | 2,053 |
| Bio-Techne Corp. | | 11,800 | 2,456 |
| Bruker Corp. | | 245,222 | 10,912 |
| Codexis, Inc. (a) | | 399,200 | 5,397 |
| Mettler-Toledo International, Inc. (a) | | 72,400 | 51,038 |
| Thermo Fisher Scientific, Inc. | | 204,200 | 61,664 |
| | | | 133,520 |
| Pharmaceuticals - 3.7% | | | |
| AstraZeneca PLC sponsored ADR | | 2,108,400 | 103,375 |
| Horizon Pharma PLC (a) | | 967,800 | 27,979 |
| Perrigo Co. PLC | | 633,800 | 33,604 |
| Zoetis, Inc. Class A | | 312,863 | 40,021 |
| | | | 204,979 |
|
| TOTAL HEALTH CARE | | | 696,276 |
|
| INDUSTRIALS - 5.8% | | | |
| Aerospace & Defense - 0.3% | | | |
| HEICO Corp. Class A | | 189,600 | 18,063 |
| Building Products - 0.6% | | | |
| Kingspan Group PLC (Ireland) | | 647,015 | 33,526 |
| Commercial Services & Supplies - 0.6% | | | |
| Copart, Inc. (a) | | 402,835 | 33,290 |
| Edenred SA | | 10,900 | 574 |
| | | | 33,864 |
| Machinery - 2.0% | | | |
| Fortive Corp. | | 12,000 | 828 |
| Gardner Denver Holdings, Inc. (a) | | 2,450,300 | 77,993 |
| IDEX Corp. | | 214,900 | 33,423 |
| | | | 112,244 |
| Professional Services - 1.6% | | | |
| Equifax, Inc. | | 376,800 | 51,512 |
| TransUnion Holding Co., Inc. | | 434,800 | 35,923 |
| | | | 87,435 |
| Road & Rail - 0.7% | | | |
| Knight-Swift Transportation Holdings, Inc. Class A | | 360,438 | 13,142 |
| Norfolk Southern Corp. | | 6,700 | 1,219 |
| Uber Technologies, Inc. (b) | | 652,600 | 20,557 |
| | | | 34,918 |
|
| TOTAL INDUSTRIALS | | | 320,050 |
|
| INFORMATION TECHNOLOGY - 31.0% | | | |
| Communications Equipment - 0.1% | | | |
| ViaSat, Inc. (a) | | 71,200 | 4,901 |
| Electronic Equipment & Components - 0.4% | | | |
| Zebra Technologies Corp. Class A (a) | | 81,000 | 19,267 |
| IT Services - 7.8% | | | |
| Black Knight, Inc. (a) | | 814,500 | 52,291 |
| Booz Allen Hamilton Holding Corp. Class A | | 491,100 | 34,559 |
| Fiserv, Inc. (a) | | 518,200 | 55,002 |
| MongoDB, Inc. Class A (a) | | 22,600 | 2,888 |
| Verra Mobility Corp. (a) | | 575,200 | 8,254 |
| Visa, Inc. Class A | | 1,557,102 | 278,503 |
| | | | 431,497 |
| Semiconductors & Semiconductor Equipment - 7.6% | | | |
| ASML Holding NV | | 158,300 | 41,470 |
| Cree, Inc. (a) | | 203,300 | 9,704 |
| Lam Research Corp. | | 136,400 | 36,970 |
| Marvell Technology Group Ltd. | | 135,500 | 3,305 |
| NVIDIA Corp. | | 513,984 | 103,321 |
| NXP Semiconductors NV | | 846,500 | 96,230 |
| Qualcomm, Inc. | | 1,437,600 | 115,641 |
| Semtech Corp. (a) | | 230,500 | 11,631 |
| | | | 418,272 |
| Software - 12.0% | | | |
| Adobe, Inc. (a) | | 452,507 | 125,765 |
| Cloudflare, Inc. (a) | | 27,400 | 461 |
| Datadog, Inc. Class A (a)(b) | | 13,800 | 464 |
| Intuit, Inc. | | 211,639 | 54,497 |
| Manhattan Associates, Inc. (a) | | 168,000 | 12,592 |
| Microsoft Corp. | | 2,727,440 | 391,034 |
| Salesforce.com, Inc. (a) | | 473,300 | 74,067 |
| SolarWinds, Inc. (a) | | 373,400 | 7,076 |
| | | | 665,956 |
| Technology Hardware, Storage & Peripherals - 3.1% | | | |
| Apple, Inc. | | 693,087 | 172,412 |
|
| TOTAL INFORMATION TECHNOLOGY | | | 1,712,305 |
|
| MATERIALS - 2.8% | | | |
| Chemicals - 1.4% | | | |
| Air Products & Chemicals, Inc. | | 132,400 | 28,236 |
| Sherwin-Williams Co. | | 84,300 | 48,247 |
| | | | 76,483 |
| Containers & Packaging - 0.6% | | | |
| Aptargroup, Inc. | | 285,300 | 33,708 |
| Metals & Mining - 0.8% | | | |
| Barrick Gold Corp. | | 2,640,000 | 45,830 |
|
| TOTAL MATERIALS | | | 156,021 |
|
| REAL ESTATE - 4.3% | | | |
| Equity Real Estate Investment Trusts (REITs) - 4.3% | | | |
| American Tower Corp. | | 631,100 | 137,630 |
| Crown Castle International Corp. | | 428,200 | 59,430 |
| Prologis, Inc. | | 496,400 | 43,564 |
| | | | 240,624 |
| UTILITIES - 0.6% | | | |
| Water Utilities - 0.6% | | | |
| American Water Works Co., Inc. | | 279,300 | 34,429 |
| TOTAL COMMON STOCKS | | | |
| (Cost $4,343,044) | | | 5,410,321 |
|
| Nonconvertible Preferred Stocks - 1.5% | | | |
| ENERGY - 1.5% | | | |
| Oil, Gas & Consumable Fuels - 1.5% | | | |
| Petroleo Brasileiro SA - Petrobras sponsored ADR | | | |
| (Cost $82,668) | | 5,138,500 | 83,449 |
|
| Money Market Funds - 2.6% | | | |
| Fidelity Cash Central Fund 1.83% (c) | | 44,135,024 | 44,144 |
| Fidelity Securities Lending Cash Central Fund 1.84% (c)(d) | | 101,552,432 | 101,563 |
| TOTAL MONEY MARKET FUNDS | | | |
| (Cost $145,707) | | | 145,707 |
| TOTAL INVESTMENT IN SECURITIES - 101.9% | | | |
| (Cost $4,571,419) | | | 5,639,477 |
| NET OTHER ASSETS (LIABILITIES) - (1.9)% | | | (107,253) |
| NET ASSETS - 100% | | | $5,532,224 |
Values shown as $0 in the Schedule of Investments may reflect amounts less than $500.
Legend
(a) Non-income producing
(b) Security or a portion of the security is on loan at period end.
(c) Affiliated fund that is generally available only to investment companies and other accounts managed by Fidelity Investments. The rate quoted is the annualized seven-day yield of the fund at period end. A complete unaudited listing of the fund's holdings as of its most recent quarter end is available upon request. In addition, each Fidelity Central Fund's financial statements, which are not covered by the Fund's Report of Independent Registered Public Accounting Firm, are available on the SEC's website or upon request.
(d) Investment made with cash collateral received from securities on loan.
Affiliated Central Funds
Information regarding fiscal year to date income earned by the Fund from investments in Fidelity Central Funds is as follows:
| Fund | Income earned |
| | (Amounts in thousands) |
| Fidelity Cash Central Fund | $936 |
| Fidelity Securities Lending Cash Central Fund | 447 |
| Total | $1,383 |
Amounts in the income column in the above table include any capital gain distributions from underlying funds, which are presented in the corresponding line-item in the Statement of Operations, if applicable. Amount for Fidelity Securities Lending Cash Central Fund represents the income earned on investing cash collateral, less rebates paid to borrowers and any lending agent fees associated with the loan, plus any premium payments received for lending certain types of securities.
Other Affiliated Issuers
An affiliated company is a company in which the Fund has ownership of at least 5% of the voting securities. Fiscal year to date transactions with companies which are or were affiliates are as follows:
| Affiliate (Amounts in thousands) | Value, beginning of period | Purchases | Sales Proceeds | Dividend Income | Realized Gain (loss) | Change in Unrealized appreciation (depreciation) | Value, end of period |
| Dalata Hotel Group PLC | $63,263 | $-- | $31,509 | $557 | $4,517 | $(10,217) | $-- |
| Total | $63,263 | $-- | $31,509 | $557 | $4,517 | $(10,217) | $-- |
Investment Valuation
The following is a summary of the inputs used, as of October 31, 2019, involving the Fund's assets and liabilities carried at fair value. The inputs or methodology used for valuing securities may not be an indication of the risk associated with investing in those securities. For more information on valuation inputs, and their aggregation into the levels used below, please refer to the Investment Valuation section in the accompanying Notes to Financial Statements.
| | Valuation Inputs at Reporting Date: |
| Description | Total | Level 1 | Level 2 | Level 3 |
| (Amounts in thousands) | | | | |
| Investments in Securities: | | | | |
| Equities: | | | | |
| Communication Services | $451,729 | $425,570 | $26,159 | $-- |
| Consumer Discretionary | 801,834 | 766,489 | 35,345 | -- |
| Consumer Staples | 365,203 | 355,947 | 9,256 | -- |
| Energy | 185,514 | 185,514 | -- | -- |
| Financials | 529,785 | 505,727 | 24,058 | -- |
| Health Care | 696,276 | 696,276 | -- | -- |
| Industrials | 320,050 | 320,050 | -- | -- |
| Information Technology | 1,712,305 | 1,712,305 | -- | -- |
| Materials | 156,021 | 156,021 | -- | -- |
| Real Estate | 240,624 | 240,624 | -- | -- |
| Utilities | 34,429 | 34,429 | -- | -- |
| Money Market Funds | 145,707 | 145,707 | -- | -- |
| Total Investments in Securities: | $5,639,477 | $5,544,659 | $94,818 | $-- |
Other Information
Distribution of investments by country or territory of incorporation, as a percentage of Total Net Assets, is as follows (Unaudited):
| United States of America | 84.1% |
| United Kingdom | 3.4% |
| Netherlands | 3.3% |
| Ireland | 2.2% |
| Cayman Islands | 2.0% |
| France | 1.6% |
| Brazil | 1.5% |
| Others (Individually Less Than 1%) | 1.9% |
| | 100.0% |
See accompanying notes which are an integral part of the financial statements.
Financial Statements
Statement of Assets and Liabilities
| Amounts in thousands (except per-share amounts) | | October 31, 2019 |
| Assets | | |
Investment in securities, at value (including securities loaned of $97,322) — See accompanying schedule:
Unaffiliated issuers (cost $4,425,712) | $5,493,770 | |
| Fidelity Central Funds (cost $145,707) | 145,707 | |
| Total Investment in Securities (cost $4,571,419) | | $5,639,477 |
| Receivable for investments sold | | 4,007 |
| Receivable for fund shares sold | | 1,912 |
| Dividends receivable | | 2,935 |
| Distributions receivable from Fidelity Central Funds | | 171 |
| Prepaid expenses | | 11 |
| Other receivables | | 191 |
| Total assets | | 5,648,704 |
| Liabilities | | |
| Payable for investments purchased | $9,578 | |
| Payable for fund shares redeemed | 2,183 | |
| Accrued management fee | 2,363 | |
| Other affiliated payables | 650 | |
| Other payables and accrued expenses | 142 | |
| Collateral on securities loaned | 101,564 | |
| Total liabilities | | 116,480 |
| Net Assets | | $5,532,224 |
| Net Assets consist of: | | |
| Paid in capital | | $3,780,512 |
| Total accumulated earnings (loss) | | 1,751,712 |
| Net Assets | | $5,532,224 |
| Net Asset Value and Maximum Offering Price | | |
| Capital Appreciation: | | |
| Net Asset Value, offering price and redemption price per share ($4,667,744 ÷ 129,093 shares) | | $36.16 |
| Class K: | | |
| Net Asset Value, offering price and redemption price per share ($864,480 ÷ 23,847 shares) | | $36.25 |
See accompanying notes which are an integral part of the financial statements.
Statement of Operations
| Amounts in thousands | | Year ended October 31, 2019 |
| Investment Income | | |
| Dividends (including $557 earned from other affiliated issuers) | | $76,216 |
| Income from Fidelity Central Funds (including $447 from security lending) | | 1,383 |
| Total income | | 77,599 |
| Expenses | | |
| Management fee | | |
| Basic fee | $32,072 | |
| Performance adjustment | (5,069) | |
| Transfer agent fees | 7,055 | |
| Accounting and security lending fees | 1,122 | |
| Custodian fees and expenses | 65 | |
| Independent trustees' fees and expenses | 35 | |
| Registration fees | 61 | |
| Audit | 62 | |
| Legal | 20 | |
| Interest | 47 | |
| Miscellaneous | 44 | |
| Total expenses before reductions | 35,514 | |
| Expense reductions | (420) | |
| Total expenses after reductions | | 35,094 |
| Net investment income (loss) | | 42,505 |
| Realized and Unrealized Gain (Loss) | | |
| Net realized gain (loss) on: | | |
| Investment securities: | | |
| Unaffiliated issuers | 848,324 | |
| Fidelity Central Funds | 1 | |
| Other affiliated issuers | 4,517 | |
| Foreign currency transactions | 95 | |
| Total net realized gain (loss) | | 852,937 |
| Change in net unrealized appreciation (depreciation) on: | | |
| Investment securities: | | |
| Unaffiliated issuers | (198,055) | |
| Affiliated issuers | (10,217) | |
| Assets and liabilities in foreign currencies | (2) | |
| Total change in net unrealized appreciation (depreciation) | | (208,274) |
| Net gain (loss) | | 644,663 |
| Net increase (decrease) in net assets resulting from operations | | $687,168 |
See accompanying notes which are an integral part of the financial statements.
Statement of Changes in Net Assets
| Amounts in thousands | Year ended October 31, 2019 | Year ended October 31, 2018 |
| Increase (Decrease) in Net Assets | | |
| Operations | | |
| Net investment income (loss) | $42,505 | $58,068 |
| Net realized gain (loss) | 852,937 | 732,327 |
| Change in net unrealized appreciation (depreciation) | (208,274) | (255,542) |
| Net increase (decrease) in net assets resulting from operations | 687,168 | 534,853 |
| Distributions to shareholders | (693,623) | (761,525) |
| Share transactions - net increase (decrease) | (955,360) | (609,944) |
| Total increase (decrease) in net assets | (961,815) | (836,616) |
| Net Assets | | |
| Beginning of period | 6,494,039 | 7,330,655 |
| End of period | $5,532,224 | $6,494,039 |
See accompanying notes which are an integral part of the financial statements.
Financial Highlights
Fidelity Capital Appreciation Fund
| Years ended October 31, | 2019 | 2018 | 2017 | 2016 | 2015 |
| Selected Per–Share Data | | | | | |
| Net asset value, beginning of period | $36.33 | $37.90 | $31.75 | $37.03 | $39.82 |
| Income from Investment Operations | | | | | |
| Net investment income (loss)A | .24 | .29 | .38 | .34 | .24 |
| Net realized and unrealized gain (loss) | 3.53 | 2.15 | 7.55 | (1.34) | 1.13 |
| Total from investment operations | 3.77 | 2.44 | 7.93 | (1.00) | 1.37 |
| Distributions from net investment income | (.27) | (.34) | (.39) | (.27) | (.10) |
| Distributions from net realized gain | (3.67) | (3.67) | (1.39) | (4.01) | (4.06) |
| Total distributions | (3.94) | (4.01) | (1.78) | (4.28) | (4.16) |
| Net asset value, end of period | $36.16 | $36.33 | $37.90 | $31.75 | $37.03 |
| Total ReturnB | 12.24% | 6.93% | 25.93% | (3.06)% | 3.50% |
| Ratios to Average Net AssetsC,D | | | | | |
| Expenses before reductions | .62% | .54% | .51% | .61% | .83% |
| Expenses net of fee waivers, if any | .62% | .54% | .51% | .61% | .83% |
| Expenses net of all reductions | .61% | .53% | .50% | .60% | .82% |
| Net investment income (loss) | .69% | .77% | 1.09% | 1.05% | .63% |
| Supplemental Data | | | | | |
| Net assets, end of period (in millions) | $4,668 | $4,792 | $5,157 | $4,809 | $5,906 |
| Portfolio turnover rateE | 122% | 101% | 129% | 120% | 126% |
A Calculated based on average shares outstanding during the period.
B Total returns would have been lower if certain expenses had not been reduced during the applicable periods shown.
C Fees and expenses of any underlying Fidelity Central Funds are not included in the Fund's expense ratio. The Fund indirectly bears its proportionate share of the expenses of any underlying Fidelity Central Funds.
D Expense ratios reflect operating expenses of the class. Expenses before reductions do not reflect amounts reimbursed by the investment adviser or reductions from brokerage service arrangements or reductions from other expense offset arrangements and do not represent the amount paid by the class during periods when reimbursements or reductions occur. Expenses net of fee waivers reflect expenses after reimbursement by the investment adviser but prior to reductions from brokerage service arrangements or other expense offset arrangements. Expenses net of all reductions represent the net expenses paid by the class.
E Amount does not include the portfolio activity of any underlying Fidelity Central Funds.
See accompanying notes which are an integral part of the financial statements.
Fidelity Capital Appreciation Fund Class K
| Years ended October 31, | 2019 | 2018 | 2017 | 2016 | 2015 |
| Selected Per–Share Data | | | | | |
| Net asset value, beginning of period | $36.42 | $37.99 | $31.83 | $37.11 | $39.90 |
| Income from Investment Operations | | | | | |
| Net investment income (loss)A | .27 | .33 | .41 | .37 | .28 |
| Net realized and unrealized gain (loss) | 3.54 | 2.15 | 7.57 | (1.33) | 1.14 |
| Total from investment operations | 3.81 | 2.48 | 7.98 | (.96) | 1.42 |
| Distributions from net investment income | (.31) | (.37) | (.43) | (.31) | (.15) |
| Distributions from net realized gain | (3.67) | (3.67) | (1.39) | (4.01) | (4.06) |
| Total distributions | (3.98) | (4.05)B | (1.82) | (4.32) | (4.21) |
| Net asset value, end of period | $36.25 | $36.42 | $37.99 | $31.83 | $37.11 |
| Total ReturnC | 12.33% | 7.03% | 26.04% | (2.93)% | 3.62% |
| Ratios to Average Net AssetsD,E | | | | | |
| Expenses before reductions | .52% | .45% | .41% | .50% | .72% |
| Expenses net of fee waivers, if any | .52% | .44% | .41% | .50% | .72% |
| Expenses net of all reductions | .52% | .43% | .40% | .48% | .72% |
| Net investment income (loss) | .79% | .86% | 1.20% | 1.17% | .74% |
| Supplemental Data | | | | | |
| Net assets, end of period (in millions) | $864 | $1,702 | $2,174 | $2,103 | $2,524 |
| Portfolio turnover rateF | 122% | 101% | 129% | 120% | 126% |
A Calculated based on average shares outstanding during the period.
B Total distributions of $4.05 per share is comprised of distributions from net investment income of $.374 and distributions from net realized gain of $3.671 per share.
C Total returns would have been lower if certain expenses had not been reduced during the applicable periods shown.
D Fees and expenses of any underlying Fidelity Central Funds are not included in the Fund's expense ratio. The Fund indirectly bears its proportionate share of the expenses of any underlying Fidelity Central Funds.
E Expense ratios reflect operating expenses of the class. Expenses before reductions do not reflect amounts reimbursed by the investment adviser or reductions from brokerage service arrangements or reductions from other expense offset arrangements and do not represent the amount paid by the class during periods when reimbursements or reductions occur. Expenses net of fee waivers reflect expenses after reimbursement by the investment adviser but prior to reductions from brokerage service arrangements or other expense offset arrangements. Expenses net of all reductions represent the net expenses paid by the class.
F Amount does not include the portfolio activity of any underlying Fidelity Central Funds.
See accompanying notes which are an integral part of the financial statements.
Notes to Financial Statements
For the period ended October 31, 2019
(Amounts in thousands except percentages)
1. Organization.
Fidelity Capital Appreciation Fund (the Fund) is a fund of Fidelity Capital Trust (the Trust) and is authorized to issue an unlimited number of shares. The Trust is registered under the Investment Company Act of 1940, as amended (the 1940 Act), as an open-end management investment company organized as a Massachusetts business trust. The Fund offers Capital Appreciation and Class K shares, each of which has equal rights as to assets and voting privileges. Each class has exclusive voting rights with respect to matters that affect that class.
2. Investments in Fidelity Central Funds.
The Fund invests in Fidelity Central Funds, which are open-end investment companies generally available only to other investment companies and accounts managed by the investment adviser and its affiliates. The Fund's Schedule of Investments lists each of the Fidelity Central Funds held as of period end, if any, as an investment of the Fund, but does not include the underlying holdings of each Fidelity Central Fund. As an Investing Fund, the Fund indirectly bears its proportionate share of the expenses of the underlying Fidelity Central Funds.
The Money Market Central Funds seek preservation of capital and current income and are managed by Fidelity Investments Money Management, Inc. (FIMM), an affiliate of the investment adviser. Annualized expenses of the Money Market Central Funds as of their most recent shareholder report date ranged from less than .005% to .01%.
A complete unaudited list of holdings for each Fidelity Central Fund is available upon request or at the Securities and Exchange Commission (the SEC) website at www.sec.gov. In addition, the financial statements of the Fidelity Central Funds, which are not covered by the Fund's Report of Independent Registered Public Accounting Firm, are available on the SEC website or upon request.
3. Significant Accounting Policies.
The Fund is an investment company and applies the accounting and reporting guidance of the Financial Accounting Standards Board (FASB) Accounting Standards Codification Topic 946 Financial Services – Investments Companies. The financial statements have been prepared in conformity with accounting principles generally accepted in the United States of America (GAAP), which require management to make certain estimates and assumptions at the date of the financial statements. Actual results could differ from those estimates. Subsequent events, if any, through the date that the financial statements were issued have been evaluated in the preparation of the financial statements. The following summarizes the significant accounting policies of the Fund:
Investment Valuation. Investments are valued as of 4:00 p.m. Eastern time on the last calendar day of the period. The Board of Trustees (the Board) has delegated the day to day responsibility for the valuation of the Fund's investments to the Fair Value Committee (the Committee) established by the Fund's investment adviser. In accordance with valuation policies and procedures approved by the Board, the Fund attempts to obtain prices from one or more third party pricing vendors or brokers to value its investments. When current market prices, quotations or currency exchange rates are not readily available or reliable, investments will be fair valued in good faith by the Committee, in accordance with procedures adopted by the Board. Factors used in determining fair value vary by investment type and may include market or investment specific events. The frequency with which these procedures are used cannot be predicted and they may be utilized to a significant extent. The Committee oversees the Fund's valuation policies and procedures and reports to the Board on the Committee's activities and fair value determinations. The Board monitors the appropriateness of the procedures used in valuing the Fund's investments and ratifies the fair value determinations of the Committee.
The Fund categorizes the inputs to valuation techniques used to value its investments into a disclosure hierarchy consisting of three levels as shown below:
- Level 1 – quoted prices in active markets for identical investments
- Level 2 – other significant observable inputs (including quoted prices for similar investments, interest rates, prepayment speeds, etc.)
- Level 3 – unobservable inputs (including the Fund's own assumptions based on the best information available)
Valuation techniques used to value the Fund's investments by major category are as follows:
Equity securities, including restricted securities, for which market quotations are readily available, are valued at the last reported sale price or official closing price as reported by a third party pricing vendor on the primary market or exchange on which they are traded and are categorized as Level 1 in the hierarchy. In the event there were no sales during the day or closing prices are not available, securities are valued at the last quoted bid price or may be valued using the last available price and are generally categorized as Level 2 in the hierarchy. For foreign equity securities, when market or security specific events arise, comparisons to the valuation of American Depositary Receipts (ADRs), futures contracts, Exchange-Traded Funds (ETFs) and certain indexes as well as quoted prices for similar securities may be used and would be categorized as Level 2 in the hierarchy. For equity securities, including restricted securities, where observable inputs are limited, assumptions about market activity and risk are used and these securities may be categorized as Level 3 in the hierarchy.
Investments in open-end mutual funds, including the Fidelity Central Funds, are valued at their closing net asset value (NAV) each business day and are categorized as Level 1 in the hierarchy.
Changes in valuation techniques may result in transfers in or out of an assigned level within the disclosure hierarchy. The aggregate value of investments by input level as of October 31, 2019 is included at the end of the Fund's Schedule of Investments.
Foreign Currency. The Fund may use foreign currency contracts to facilitate transactions in foreign-denominated securities. Gains and losses from these transactions may arise from changes in the value of the foreign currency or if the counterparties do not perform under the contracts' terms.
Foreign-denominated assets, including investment securities, and liabilities are translated into U.S. dollars at the exchange rates at period end. Purchases and sales of investment securities, income and dividends received and expenses denominated in foreign currencies are translated into U.S. dollars at the exchange rate in effect on the transaction date.
The effects of exchange rate fluctuations on investments are included with the net realized and unrealized gain (loss) on investment securities. Other foreign currency transactions resulting in realized and unrealized gain (loss) are disclosed separately.
Investment Transactions and Income. For financial reporting purposes, the Fund's investment holdings and NAV include trades executed through the end of the last business day of the period. The NAV per share for processing shareholder transactions is calculated as of the close of business of the New York Stock Exchange (NYSE), normally 4:00 p.m. Eastern time and includes trades executed through the end of the prior business day. Gains and losses on securities sold are determined on the basis of identified cost and include proceeds received from litigation. Dividend income is recorded on the ex-dividend date, except for certain dividends from foreign securities where the ex-dividend date may have passed, which are recorded as soon as the Fund is informed of the ex-dividend date. Non-cash dividends included in dividend income, if any, are recorded at the fair market value of the securities received. Income and capital gain distributions from Fidelity Central Funds, if any, are recorded on the ex-dividend date. Certain distributions received by the Fund represent a return of capital or capital gain. The Fund determines the components of these distributions subsequent to the ex-dividend date, based upon receipt of tax filings or other correspondence relating to the underlying investment. These distributions are recorded as a reduction of cost of investments and/or as a realized gain. Investment income is recorded net of foreign taxes withheld where recovery of such taxes is uncertain.
Class Allocations and Expenses. Investment income, realized and unrealized capital gains and losses, common expenses of the Fund, and certain fund-level expense reductions, if any, are allocated daily on a pro-rata basis to each class based on the relative net assets of each class to the total net assets of the Fund. Each class differs with respect to transfer agent fees incurred. Certain expense reductions may also differ by class. For the reporting period, the allocated portion of income and expenses to each class as a percent of its average net assets may vary due to the timing of recording these transactions in relation to fluctuating net assets of the classes. Expenses directly attributable to a fund are charged to that fund. Expenses attributable to more than one fund are allocated among the respective funds on the basis of relative net assets or other appropriate methods. Expense estimates are accrued in the period to which they relate and adjustments are made when actual amounts are known.
Deferred Trustee Compensation. Under a Deferred Compensation Plan (the Plan) for the Fund, certain independent Trustees have elected to defer receipt of a portion of their annual compensation. Deferred amounts are invested in a cross-section of Fidelity funds, are marked-to-market and remain in the Fund until distributed in accordance with the Plan. The investment of deferred amounts and the offsetting payable to the Trustees of $64 are included in the accompanying Statement of Assets and Liabilities in other receivables and other payables and accrued expenses, respectively.
Income Tax Information and Distributions to Shareholders. Each year, the Fund intends to qualify as a regulated investment company under Subchapter M of the Internal Revenue Code, including distributing substantially all of its taxable income and realized gains. As a result, no provision for U.S. Federal income taxes is required. As of October 31, 2019, the Fund did not have any unrecognized tax benefits in the financial statements; nor is the Fund aware of any tax positions for which it is reasonably possible that the total amounts of unrecognized tax benefits will significantly change in the next twelve months. The Fund files a U.S. federal tax return, in addition to state and local tax returns as required. The Fund's federal income tax returns are subject to examination by the Internal Revenue Service (IRS) for a period of three fiscal years after they are filed. State and local tax returns may be subject to examination for an additional fiscal year depending on the jurisdiction. Foreign taxes are provided for based on the Fund's understanding of the tax rules and rates that exist in the foreign markets in which it invests.
Distributions are declared and recorded on the ex-dividend date. Income and capital gain distributions are declared separately for each class. Income and capital gain distributions are determined in accordance with income tax regulations, which may differ from GAAP. In addition, the Fund claimed a portion of the payment made to redeeming shareholders as a distribution for income tax purposes.
Capital accounts within the financial statements are adjusted for permanent book-tax differences. These adjustments have no impact on net assets or the results of operations. Capital accounts are not adjusted for temporary book-tax differences which will reverse in a subsequent period.
Book-tax differences are primarily due to deferred trustees compensation, foreign currency transactions, partnerships and losses deferred due to wash sales.
As of period end, the cost and unrealized appreciation (depreciation) in securities, and derivatives if applicable, for federal income tax purposes were as follows:
| Gross unrealized appreciation | $1,134,071 |
| Gross unrealized depreciation | (66,931) |
| Net unrealized appreciation (depreciation) | $1,067,140 |
| Tax Cost | $4,572,337 |
The tax-based components of distributable earnings as of period end were as follows:
| Undistributed ordinary income | $29,688 |
| Undistributed long-term capital gain | $654,955 |
| Net unrealized appreciation (depreciation) on securities and other investments | $1,067,133 |
The tax character of distributions paid was as follows:
| | October 31, 2019 | October 31, 2018 |
| Ordinary Income | $96,189 | $ 117,225 |
| Long-term Capital Gains | 597,434 | 644,300 |
| Total | $693,623 | $ 761,525 |
4. Purchases and Sales of Investments.
Purchases and sales of securities, other than short-term securities, aggregated $7,253,747 and $8,523,940, respectively.
5. Fees and Other Transactions with Affiliates.
Management Fee. Fidelity Management & Research Company (the investment adviser) and its affiliates provide the Fund with investment management related services for which the Fund pays a monthly management fee. The management fee is the sum of an individual fund fee rate that is based on an annual rate of .30% of the Fund's average net assets and an annualized group fee rate that averaged .24% during the period. The group fee rate is based upon the average net assets of all the mutual funds advised by the investment adviser, including any mutual funds previously advised by the investment adviser that are currently advised by Fidelity SelectCo, LLC, an affiliate of the investment adviser. The group fee rate decreases as assets under management increase and increases as assets under management decrease. In addition, the management fee is subject to a performance adjustment (up to a maximum of +/- .20% of the Fund's average net assets over a 36 month performance period). The upward or downward adjustment to the management fee is based on the relative investment performance of Capital Appreciation as compared to its benchmark index, the S&P 500 Index, over the same 36 month performance period. For the reporting period, the total annual management fee rate, including the performance adjustment, was .45% of the Fund's average net assets. The performance adjustment included in the management fee rate may be higher or lower than the maximum performance adjustment rate due to the difference between the average net assets for the reporting and performance periods.
Transfer Agent Fees. Fidelity Investments Institutional Operations Company, Inc., (FIIOC), an affiliate of the investment adviser, is the transfer, dividend disbursing and shareholder servicing agent for each class of the Fund. FIIOC receives account fees and asset-based fees that vary according to the account size and type of account of the shareholders of Capital Appreciation, except for Class K. FIIOC receives an asset-based fee of Class K's average net assets. FIIOC pays for typesetting, printing and mailing of shareholder reports, except proxy statements.
For the period, transfer agent fees for each applicable class were as follows:
| | Amount | % of Class-Level Average Net Assets |
| Capital Appreciation | $6,442 | .14 |
| Class K | 613 | .05 |
| | $7,055 | |
Accounting and Security Lending Fees. Fidelity Service Company, Inc. (FSC), an affiliate of the investment adviser, maintains the Fund's accounting records. The accounting fee is based on the level of average net assets for each month. Prior to April 1, 2019, FSC had a separate agreement with the Fund for administration of the security lending program, based on the number and duration of lending transactions. For the period, the total fees paid for accounting and administration of securities lending were equivalent to an annual rate of .02%.
Brokerage Commissions. The Fund placed a portion of its portfolio transactions with brokerage firms which are affiliates of the investment adviser. Brokerage commissions are included in net realized gain (loss) and change in net unrealized appreciation (depreciation) in the Statement of Operations. The commissions paid to these affiliated firms were $195 for the period.
Interfund Lending Program. Pursuant to an Exemptive Order issued by the SEC, the Fund, along with other registered investment companies having management contracts with Fidelity Management & Research Company (FMR) or other affiliated entities of FMR, may participate in an interfund lending program. This program provides an alternative credit facility allowing the funds to borrow from, or lend money to, other participating affiliated funds. At period end, there were no interfund loans outstanding. The Fund's activity in this program during the period for which loans were outstanding was as follows:
| Borrower or Lender | Average Loan Balance | Weighted Average Interest Rate | Interest Expense |
| Borrower | $15,623 | 2.60% | $47 |
Interfund Trades. The Fund may purchase from or sell securities to other Fidelity Funds under procedures adopted by the Board. The procedures have been designed to ensure these interfund trades are executed in accordance with Rule 17a-7 of the 1940 Act. Interfund trades are included within the respective purchases and sales amounts shown in the Purchases and Sales of Investments note.
6. Committed Line of Credit.
The Fund participates with other funds managed by the investment adviser or an affiliate in a $4.25 billion credit facility (the "line of credit") to be utilized for temporary or emergency purposes to fund shareholder redemptions or for other short-term liquidity purposes. The Fund has agreed to pay commitment fees on its pro-rata portion of the line of credit, which amounted to $16 and is reflected in Miscellaneous expenses on the Statement of Operations. During the period, the Fund did not borrow on this line of credit.
7. Security Lending.
The Fund lends portfolio securities from time to time in order to earn additional income. For equity securities, lending agents are used, including National Financial Services (NFS), an affiliate of the Fund. Pursuant to a securities lending agreement, NFS will receive a fee, which is capped at 9.9% of daily lending revenue, for its services as lending agent. The Fund may lend securities to certain qualified borrowers, including NFS. On the settlement date of the loan, the Fund receives collateral (in the form of U.S. Treasury obligations, letters of credit and/or cash) against the loaned securities and maintains collateral in an amount not less than 100% of the market value of the loaned securities during the period of the loan. The market value of the loaned securities is determined at the close of business of the Fund and any additional required collateral is delivered to the Fund on the next business day. The Fund or borrower may terminate the loan at any time, and if the borrower defaults on its obligation to return the securities loaned because of insolvency or other reasons, the Fund may apply collateral received from the borrower against the obligation. The Fund may experience delays and costs in recovering the securities loaned. Any cash collateral received is invested in the Fidelity Securities Lending Cash Central Fund. The value of loaned securities and cash collateral at period end are disclosed on the Fund's Statement of Assets and Liabilities. At period end, there were no security loans outstanding with NFS, as affiliated borrower. Total fees paid by the Fund to NFS, as lending agent, amounted to $38. Security lending income represents the income earned on investing cash collateral, less rebates paid to borrowers and any lending agent fees associated with the loan, plus any premium payments received for lending certain types of securities. Security lending income is presented in the Statement of Operations as a component of income from Fidelity Central Funds, and includes $32 from securities loaned to NFS, as affiliated borrower.
8. Expense Reductions.
Commissions paid to certain brokers with whom the investment adviser, or its affiliates, places trades on behalf of the Fund include an amount in addition to trade execution, which may be rebated back to the Fund to offset certain expenses. This amount totaled $366 for the period. In addition, through arrangements with the Fund's custodian and each class' transfer agent, credits realized as a result of certain uninvested cash balances were used to reduce the Fund's expenses. During the period, custodian credits reduced the Fund's expenses by an amount less than five-hundred dollars. During the period, transfer agent credits reduced each class' expenses as noted in the table below.
| | Expense reduction |
| Capital Appreciation | $7 |
In addition, during the period the investment adviser reimbursed and/or waived a portion of fund-level operating expenses in the amount of $47.
9. Distributions to Shareholders.
Distributions to shareholders of each class were as follows:
| | Year ended
October 31, 2019 | Year ended
October 31, 2018 |
| Distributions to shareholders | | |
| Capital Appreciation | $512,927 | $536,981 |
| Class K | 180,696 | 224,544 |
| Total | $693,623 | $761,525 |
10. Share Transactions.
Share transactions for each class were as follows and may contain automatic conversions between classes or exchanges between affiliated funds:
| | Shares | Shares | Dollars | Dollars |
| | Year ended October 31, 2019 | Year ended October 31, 2018 | Year ended October 31, 2019 | Year ended October 31, 2018 |
| Capital Appreciation | | | | |
| Shares sold | 3,860 | 6,102 | $130,536 | $228,863 |
| Reinvestment of distributions | 15,711 | 14,676 | 485,315 | 509,097 |
| Shares redeemed | (22,392) | (24,927) | (754,833) | (936,400) |
| Net increase (decrease) | (2,821) | (4,149) | $(138,982) | $(198,440) |
| Class K | | | | |
| Shares sold | 3,353 | 6,551 | $111,851 | $245,319 |
| Reinvestment of distributions | 5,840 | 6,462 | 180,696 | 224,544 |
| Shares redeemed | (32,070) | (23,522) | (1,108,927) | (881,367) |
| Net increase (decrease) | (22,877) | (10,509) | $(816,380) | $(411,504) |
11. Other.
The Fund's organizational documents provide former and current trustees and officers with a limited indemnification against liabilities arising in connection with the performance of their duties to the Fund. In the normal course of business, the Fund may also enter into contracts that provide general indemnifications. The Fund's maximum exposure under these arrangements is unknown as this would be dependent on future claims that may be made against the Fund. The risk of material loss from such claims is considered remote.
Report of Independent Registered Public Accounting Firm
To the Board of Trustees of Fidelity Capital Trust and Shareholders of Fidelity Capital Appreciation Fund:
Opinion on the Financial Statements
We have audited the accompanying statement of assets and liabilities, including the schedule of investments, of Fidelity Capital Appreciation Fund (one of the funds constituting Fidelity Capital Trust, referred to hereafter as the “Fund”) as of October 31, 2019, the related statement of operations for the year ended October 31, 2019, the statement of changes in net assets for each of the two years in the period ended October 31, 2019, including the related notes, and the financial highlights for each of the five years in the period ended October 31, 2019 (collectively referred to as the “financial statements”). In our opinion, the financial statements present fairly, in all material respects, the financial position of the Fund as of October 31, 2019, the results of its operations for the year then ended, the changes in its net assets for each of the two years in the period ended October 31, 2019 and the financial highlights for each of the five years in the period ended October 31, 2019 in conformity with accounting principles generally accepted in the United States of America.
Basis for Opinion
These financial statements are the responsibility of the Fund’s management. Our responsibility is to express an opinion on the Fund’s financial statements based on our audits. We are a public accounting firm registered with the Public Company Accounting Oversight Board (United States) (PCAOB) and are required to be independent with respect to the Fund in accordance with the U.S. federal securities laws and the applicable rules and regulations of the Securities and Exchange Commission and the PCAOB.
We conducted our audits of these financial statements in accordance with the standards of the PCAOB. Those standards require that we plan and perform the audit to obtain reasonable assurance about whether the financial statements are free of material misstatement, whether due to error or fraud.
Our audits included performing procedures to assess the risks of material misstatement of the financial statements, whether due to error or fraud, and performing procedures that respond to those risks. Such procedures included examining, on a test basis, evidence regarding the amounts and disclosures in the financial statements. Our audits also included evaluating the accounting principles used and significant estimates made by management, as well as evaluating the overall presentation of the financial statements. Our procedures included confirmation of securities owned as of October 31, 2019 by correspondence with the custodian and brokers; when replies were not received from brokers, we performed other auditing procedures. We believe that our audits provide a reasonable basis for our opinion.
PricewaterhouseCoopers LLP
Boston, Massachusetts
December 11, 2019
We have served as the auditor of one or more investment companies in the Fidelity group of funds since 1932.
Trustees and Officers
The Trustees, Members of the Advisory Board (if any), and officers of the trust and fund, as applicable, are listed below. The Board of Trustees governs the fund and is responsible for protecting the interests of shareholders. The Trustees are experienced executives who meet periodically throughout the year to oversee the fund's activities, review contractual arrangements with companies that provide services to the fund, oversee management of the risks associated with such activities and contractual arrangements, and review the fund's performance. Except for Michael E. Wiley, each of the Trustees oversees 298 funds. Mr. Wiley oversees 197 funds.
The Trustees hold office without limit in time except that (a) any Trustee may resign; (b) any Trustee may be removed by written instrument, signed by at least two-thirds of the number of Trustees prior to such removal; (c) any Trustee who requests to be retired or who has become incapacitated by illness or injury may be retired by written instrument signed by a majority of the other Trustees; and (d) any Trustee may be removed at any special meeting of shareholders by a two-thirds vote of the outstanding voting securities of the trust. Each Trustee who is not an interested person (as defined in the 1940 Act) of the trust and the fund is referred to herein as an Independent Trustee. Each Independent Trustee shall retire not later than the last day of the calendar year in which his or her 75th birthday occurs. The Independent Trustees may waive this mandatory retirement age policy with respect to individual Trustees. Officers and Advisory Board Members hold office without limit in time, except that any officer or Advisory Board Member may resign or may be removed by a vote of a majority of the Trustees at any regular meeting or any special meeting of the Trustees. Except as indicated, each individual has held the office shown or other offices in the same company for the past five years.
The fund's Statement of Additional Information (SAI) includes more information about the Trustees. To request a free copy, call Fidelity at 1-800-544-8544 if you’re an individual investing directly with Fidelity, call 1-800-835-5092 if you’re a plan sponsor or participant with Fidelity as your recordkeeper or call 1-877-208-0098 on institutional accounts or if you’re an advisor or invest through one.
Experience, Skills, Attributes, and Qualifications of the Trustees. The Governance and Nominating Committee has adopted a statement of policy that describes the experience, qualifications, attributes, and skills that are necessary and desirable for potential Independent Trustee candidates (Statement of Policy). The Board believes that each Trustee satisfied at the time he or she was initially elected or appointed a Trustee, and continues to satisfy, the standards contemplated by the Statement of Policy. The Governance and Nominating Committee also engages professional search firms to help identify potential Independent Trustee candidates who have the experience, qualifications, attributes, and skills consistent with the Statement of Policy. From time to time, additional criteria based on the composition and skills of the current Independent Trustees, as well as experience or skills that may be appropriate in light of future changes to board composition, business conditions, and regulatory or other developments, have also been considered by the professional search firms and the Governance and Nominating Committee. In addition, the Board takes into account the Trustees' commitment and participation in Board and committee meetings, as well as their leadership of standing and ad hoc committees throughout their tenure.
In determining that a particular Trustee was and continues to be qualified to serve as a Trustee, the Board has considered a variety of criteria, none of which, in isolation, was controlling. The Board believes that, collectively, the Trustees have balanced and diverse experience, qualifications, attributes, and skills, which allow the Board to operate effectively in governing the fund and protecting the interests of shareholders. Information about the specific experience, skills, attributes, and qualifications of each Trustee, which in each case led to the Board's conclusion that the Trustee should serve (or continue to serve) as a trustee of the fund, is provided below.
Board Structure and Oversight Function. James C. Curvey is an interested person and currently serves as Chairman. The Trustees have determined that an interested Chairman is appropriate and benefits shareholders because an interested Chairman has a personal and professional stake in the quality and continuity of services provided to the fund. Independent Trustees exercise their informed business judgment to appoint an individual of their choosing to serve as Chairman, regardless of whether the Trustee happens to be independent or a member of management. The Independent Trustees have determined that they can act independently and effectively without having an Independent Trustee serve as Chairman and that a key structural component for assuring that they are in a position to do so is for the Independent Trustees to constitute a substantial majority for the Board. The Independent Trustees also regularly meet in executive session. Ned C. Lautenbach serves as Chairman of the Independent Trustees and as such (i) acts as a liaison between the Independent Trustees and management with respect to matters important to the Independent Trustees and (ii) with management prepares agendas for Board meetings.
Fidelity® funds are overseen by different Boards of Trustees. The fund's Board oversees Fidelity's high income and certain equity funds, and other Boards oversee Fidelity's investment-grade bond, money market, asset allocation, and other equity funds. The asset allocation funds may invest in Fidelity® funds overseen by the fund's Board. The use of separate Boards, each with its own committee structure, allows the Trustees of each group of Fidelity® funds to focus on the unique issues of the funds they oversee, including common research, investment, and operational issues. On occasion, the separate Boards establish joint committees to address issues of overlapping consequences for the Fidelity® funds overseen by each Board.
The Trustees operate using a system of committees to facilitate the timely and efficient consideration of all matters of importance to the Trustees, the fund, and fund shareholders and to facilitate compliance with legal and regulatory requirements and oversight of the fund's activities and associated risks. The Board, acting through its committees, has charged FMR and its affiliates with (i) identifying events or circumstances the occurrence of which could have demonstrably adverse effects on the fund's business and/or reputation; (ii) implementing processes and controls to lessen the possibility that such events or circumstances occur or to mitigate the effects of such events or circumstances if they do occur; and (iii) creating and maintaining a system designed to evaluate continuously business and market conditions in order to facilitate the identification and implementation processes described in (i) and (ii) above. Because the day-to-day operations and activities of the fund are carried out by or through FMR, its affiliates, and other service providers, the fund's exposure to risks is mitigated but not eliminated by the processes overseen by the Trustees. While each of the Board's committees has responsibility for overseeing different aspects of the fund's activities, oversight is exercised primarily through the Operations, Audit, and Compliance Committees. Appropriate personnel, including but not limited to the fund's Chief Compliance Officer (CCO), FMR's internal auditor, the independent accountants, the fund's Treasurer and portfolio management personnel, make periodic reports to the Board's committees, as appropriate, including an annual review of Fidelity's risk management program for the Fidelity® funds. The responsibilities of each standing committee, including their oversight responsibilities, are described further under "Standing Committees of the Trustees."
Interested Trustees*:
Correspondence intended for a Trustee who is an interested person may be sent to Fidelity Investments, 245 Summer Street, Boston, Massachusetts 02210.
Name, Year of Birth; Principal Occupations and Other Relevant Experience+
James C. Curvey (1935)
Year of Election or Appointment: 2007
Trustee
Chairman of the Board of Trustees
Mr. Curvey also serves as Trustee of other Fidelity® funds. Mr. Curvey is Vice Chairman (2007-present) and Director of FMR LLC (diversified financial services company). In addition, Mr. Curvey is an Overseer Emeritus for the Boston Symphony Orchestra, a Director of Artis-Naples, and a Trustee of Brewster Academy in Wolfeboro, New Hampshire. Previously, Mr. Curvey served as a Director of Fidelity Research & Analysis Co. (investment adviser firm, 2009-2018), Director of Fidelity Investments Money Management, Inc. (investment adviser firm, 2009-2014) and a Director of FMR and FMR Co., Inc. (investment adviser firms, 2007-2014).
* Determined to be an “Interested Trustee” by virtue of, among other things, his or her affiliation with the trust[s] or various entities under common control with FMR.
+ The information includes the Trustee's principal occupation during the last five years and other information relating to the experience, attributes, and skills relevant to the Trustee's qualifications to serve as a Trustee, which led to the conclusion that the Trustee should serve as a Trustee for the fund.
Independent Trustees:
Correspondence intended for an Independent Trustee may be sent to Fidelity Investments, P.O. Box 55235, Boston, Massachusetts 02205-5235.
Name, Year of Birth; Principal Occupations and Other Relevant Experience+
Dennis J. Dirks (1948)
Year of Election or Appointment: 2005
Trustee
Mr. Dirks also serves as Trustee of other Fidelity® funds. Prior to his retirement in May 2003, Mr. Dirks was Chief Operating Officer and a member of the Board of The Depository Trust & Clearing Corporation (DTCC). He also served as President, Chief Operating Officer, and Board member of The Depository Trust Company (DTC) and President and Board member of the National Securities Clearing Corporation (NSCC). In addition, Mr. Dirks served as Chief Executive Officer and Board member of the Government Securities Clearing Corporation, Chief Executive Officer and Board member of the Mortgage-Backed Securities Clearing Corporation, as a Trustee and a member of the Finance Committee of Manhattan College (2005-2008), as a Trustee and a member of the Finance Committee of AHRC of Nassau County (2006-2008), as a member of the Independent Directors Council (IDC) Governing Council (2010-2015), and as a member of the Board of Directors for The Brookville Center for Children’s Services, Inc. (2009-2017). Mr. Dirks is a member of the Finance Committee (2016-present) and Board of Directors (2017-present) and is Treasurer (2018-present) of the Asolo Repertory Theatre.
Donald F. Donahue (1950)
Year of Election or Appointment: 2018
Trustee
Mr. Donahue also serves as a Trustee of other Fidelity® funds. Mr. Donahue is President and Chief Executive Officer of Miranda Partners, LLC (risk consulting for the financial services industry, 2012-present). Previously, Mr. Donahue served as a Member of the Advisory Board of certain Fidelity® funds (2015-2018) and Chief Executive Officer (2006-2012), Chief Operating Officer (2003-2006), and Managing Director, Customer Marketing and Development (1999-2003) of The Depository Trust & Clearing Corporation (financial markets infrastructure). Mr. Donahue serves as a Member (2007-present) and Co-Chairman (2016-present) of the Board of Directors of United Way of New York, Member of the Board of Directors of NYC Leadership Academy (2012-present) and Member of the Board of Advisors of Ripple Labs, Inc. (financial services, 2015-present). He also served as Chairman (2010-2012) and Member of the Board of Directors (2012-2013) of Omgeo, LLC (financial services), Treasurer of United Way of New York (2012-2016), and Member of the Board of Directors of XBRL US (financial services non-profit, 2009-2012) and the International Securities Services Association (2009-2012).
Alan J. Lacy (1953)
Year of Election or Appointment: 2008
Trustee
Mr. Lacy also serves as Trustee of other Fidelity® funds. Mr. Lacy serves as a Director of Bristol-Myers Squibb Company (global pharmaceuticals, 2008-present). He is a Trustee of the California Chapter of The Nature Conservancy (2015-present) and a Director of the Center for Advanced Study in the Behavioral Sciences at Stanford University (2015-present). In addition, Mr. Lacy served as Senior Adviser (2007-2014) of Oak Hill Capital Partners, L.P. (private equity) and also served as Chief Executive Officer (2005) and Vice Chairman (2005-2006) of Sears Holdings Corporation (retail) and Chief Executive Officer and Chairman of the Board of Sears, Roebuck and Co. (retail, 2000-2005). Previously, Mr. Lacy served as Chairman (2014-2017) and a member (2010-2017) of the Board of Directors of Dave & Buster’s Entertainment, Inc. (restaurant and entertainment complexes), as Chairman (2008-2011) and a member (2006-2015) of the Board of Trustees of the National Parks Conservation Association, and as a member of the Board of Directors for The Hillman Companies, Inc. (hardware wholesalers, 2010-2014), Earth Fare, Inc. (retail grocery, 2010-2014), and The Western Union Company (global money transfer, 2006-2011).
Ned C. Lautenbach (1944)
Year of Election or Appointment: 2000
Trustee
Chairman of the Independent Trustees
Mr. Lautenbach also serves as Trustee of other Fidelity® funds. Mr. Lautenbach currently serves as Chair (2018-present) and Member (2013-present) of the Board of Governors, State University System of Florida and is a member of the Council on Foreign Relations (1994-present). He is also a member and has most recently served as Chairman of the Board of Directors of Artis-Naples (2012-present). Previously, Mr. Lautenbach served as a member and then Lead Director of the Board of Directors of Eaton Corporation (diversified industrial, 1997-2016). He was also a Partner and Advisory Partner at Clayton, Dubilier & Rice, LLC (private equity investment, 1998-2010), as well as a Director of Sony Corporation (2006-2007). In addition, Mr. Lautenbach also had a 30-year career with IBM (technology company) during which time he served as Senior Vice President and a member of the Corporate Executive Committee (1968-1998).
Joseph Mauriello (1944)
Year of Election or Appointment: 2008
Trustee
Mr. Mauriello also serves as Trustee of other Fidelity® funds. Prior to his retirement in January 2006, Mr. Mauriello served in numerous senior management positions including Deputy Chairman and Chief Operating Officer (2004-2005), and Vice Chairman of Financial Services (2002-2004) of KPMG LLP US (professional services, 1965-2005). Mr. Mauriello currently serves as a member of the Independent Directors Council (IDC) Governing Council (2015-present). Previously, Mr. Mauriello served as a member of the Board of Directors of XL Group plc. (global insurance and re-insurance, 2006-2018).
Cornelia M. Small (1944)
Year of Election or Appointment: 2005
Trustee
Ms. Small also serves as Trustee of other Fidelity® funds. Ms. Small is a member of the Board of Directors (2009-present) and Chair of the Investment Committee (2010-present) of the Teagle Foundation. Ms. Small also serves on the Investment Committee of the Berkshire Taconic Community Foundation (2008-present). Previously, Ms. Small served as Chairperson (2002-2008) and a member of the Investment Committee and Chairperson (2008-2012) and a member of the Board of Trustees of Smith College. In addition, Ms. Small served as Chief Investment Officer, Director of Global Equity Investments, and a member of the Board of Directors of Scudder, Stevens & Clark and Scudder Kemper Investments.
Garnett A. Smith (1947)
Year of Election or Appointment: 2018
Trustee
Mr. Smith also serves as Trustee of other Fidelity® funds. Prior to Mr. Smith's retirement, he served as Chairman and Chief Executive Officer of Inbrand Corp. (manufacturer of personal absorbent products, 1990-1997). He also served as President (1986-1990) of Inbrand Corp. Prior to his employment with Inbrand Corp., he was employed by a retail fabric chain and North Carolina National Bank. In addition, Mr. Smith served as a Member of the Advisory Board of certain Fidelity® funds (2012-2013) and as a board member of the Jackson Hole Land Trust (2009-2012).
David M. Thomas (1949)
Year of Election or Appointment: 2008
Trustee
Mr. Thomas also serves as Trustee of other Fidelity® funds. Mr. Thomas serves as Non-Executive Chairman of the Board of Directors of Fortune Brands Home and Security (home and security products, 2011-present) and as a member of the Board of Directors (2004-present) and Presiding Director (2013-present) of Interpublic Group of Companies, Inc. (marketing communication). Previously, Mr. Thomas served as Executive Chairman (2005-2006) and Chairman and Chief Executive Officer (2000-2005) of IMS Health, Inc. (pharmaceutical and healthcare information solutions), a Director of Fortune Brands, Inc. (consumer products, 2000-2011), and a member of the Board of Trustees of the University of Florida (2013-2018).
Michael E. Wiley (1950)
Year of Election or Appointment: 2018
Trustee
Mr. Wiley also serves as Trustee or Member of the Advisory Board of other Fidelity® funds. Mr. Wiley serves as a Director of High Point Resources (exploration and production, 2005-present). Previously, Mr. Wiley served as a Director of Andeavor Corporation (independent oil refiner and marketer, 2005-2018), a Director of Andeavor Logistics LP (natural resources logistics, 2015-2018), a Director of Post Oak Bank (privately-held bank, 2004-2018), a Director of Asia Pacific Exploration Consolidated (international oil and gas exploration and production, 2008-2013), a member of the Board of Trustees of the University of Tulsa (2000-2006; 2007-2010), a Senior Energy Advisor of Katzenbach Partners, LLC (consulting, 2006-2007), an Advisory Director of Riverstone Holdings (private investment), a Director of Spinnaker Exploration Company (exploration and production, 2001-2005) and Chairman, President, and CEO of Baker Hughes, Inc. (oilfield services, 2000-2004).
+ The information includes the Trustee's principal occupation during the last five years and other information relating to the experience, attributes, and skills relevant to the Trustee's qualifications to serve as a Trustee, which led to the conclusion that the Trustee should serve as a Trustee for the fund.
Advisory Board Members and Officers:
Correspondence intended for a Member of the Advisory Board (if any) may be sent to Fidelity Investments, P.O. Box 55235, Boston, Massachusetts 02205-5235. Correspondence intended for an officer or Peter S. Lynch may be sent to Fidelity Investments, 245 Summer Street, Boston, Massachusetts 02210. Officers appear below in alphabetical order.
Name, Year of Birth; Principal Occupation
Vicki L. Fuller (1957)
Year of Election or Appointment: 2018
Member of the Advisory Board
Ms. Fuller also serves as Member of the Advisory Board of other Fidelity® funds. Ms. Fuller serves as a member of the Board of Directors, Audit Committee, and Nominating and Governance Committee of The Williams Companies, Inc. (natural gas infrastructure, 2018-present). Previously, Ms. Fuller served as the Chief Investment Officer of the New York State Common Retirement Fund (2012-2018) and held a variety of positions at AllianceBernstein L.P. (global asset management, 1985-2012), including Managing Director (2006-2012) and Senior Vice President and Senior Portfolio Manager (2001-2006).
Peter S. Lynch (1944)
Year of Election or Appointment: 2003
Member of the Advisory Board
Mr. Lynch also serves as Member of the Advisory Board of other Fidelity® funds. Mr. Lynch is Vice Chairman and a Director of FMR (investment adviser firm) and FMR Co., Inc. (investment adviser firm). In addition, Mr. Lynch serves as a Trustee of Boston College and as the Chairman of the Inner-City Scholarship Fund. Previously, Mr. Lynch served on the Special Olympics International Board of Directors (1997-2006).
Elizabeth Paige Baumann (1968)
Year of Election or Appointment: 2017
Anti-Money Laundering (AML) Officer
Ms. Baumann also serves as AML Officer of other funds. She is Chief AML Officer (2012-present) and Senior Vice President (2014-present) of FMR LLC (diversified financial services company) and is an employee of Fidelity Investments. Previously, Ms. Baumann served as AML Officer of the funds (2012-2016), and Vice President (2007-2014) and Deputy Anti-Money Laundering Officer (2007-2012) of FMR LLC.
Craig S. Brown (1977)
Year of Election or Appointment: 2019
Assistant Treasurer
Mr. Brown also serves as Assistant Treasurer of other funds. Mr. Brown is an employee of Fidelity Investments (2013-present).
John J. Burke III (1964)
Year of Election or Appointment: 2018
Chief Financial Officer
Mr. Burke also serves as Chief Financial Officer of other funds. Mr. Burke serves as Head of Investment Operations for Fidelity Fund and Investment Operations (2018-present) and is an employee of Fidelity Investments (1998-present). Previously Mr. Burke served as head of Asset Management Investment Operations (2012-2018).
William C. Coffey (1969)
Year of Election or Appointment: 2019
Assistant Secretary
Mr. Coffey also serves as Assistant Secretary of other funds. He is Senior Vice President and Deputy General Counsel of FMR LLC (diversified financial services company, 2010-present), and is an employee of Fidelity Investments. Previously, Mr. Coffey served as Secretary and CLO of certain funds (2018-2019); CLO, Secretary, and Senior Vice President of Fidelity Management & Research Company and FMR Co., Inc. (investment adviser firms, 2018-2019); Secretary of Fidelity SelectCo, LLC and Fidelity Investments Money Management, Inc. (investment adviser firms, 2018-2019); CLO of Fidelity Management & Research (Hong Kong) Limited, FMR Investment Management (UK) Limited, and Fidelity Management & Research (Japan) Limited (investment adviser firms, 2018-2019); and Assistant Secretary of certain funds (2009-2018).
Timothy M. Cohen (1969)
Year of Election or Appointment: 2018
Vice President
Mr. Cohen also serves as Vice President of other funds. Mr. Cohen serves as Executive Vice President of Fidelity SelectCo, LLC (2019-present), Co-Head of Equity (2018-present), a Director of Fidelity Management & Research (Japan) Limited (investment adviser firm, 2016-present), and is an employee of Fidelity Investments. Previously, Mr. Cohen served as Head of Global Equity Research (2016-2018), Chief Investment Officer - Equity and a Director of Fidelity Management & Research (U.K.) Inc. (investment adviser firm, 2013-2015) and as a Director of Fidelity Management & Research (Hong Kong) Limited (investment adviser firm, 2017).
Jonathan Davis (1968)
Year of Election or Appointment: 2010
Assistant Treasurer
Mr. Davis also serves as Assistant Treasurer of other funds. Mr. Davis serves as Assistant Treasurer of FMR Capital, Inc. (2017-present) and is an employee of Fidelity Investments. Previously, Mr. Davis served as Vice President and Associate General Counsel of FMR LLC (diversified financial services company, 2003-2010).
Adrien E. Deberghes (1967)
Year of Election or Appointment: 2016
Assistant Treasurer
Mr. Deberghes also serves as an officer of other funds. He serves as Assistant Treasurer of FMR Capital, Inc. (2017-present), Executive Vice President of Fidelity Investments Money Management, Inc. (FIMM) (investment adviser firm, 2016-present), and is an employee of Fidelity Investments (2008-present). Previously, Mr. Deberghes served as President and Treasurer of certain Fidelity® funds (2013-2018). Prior to joining Fidelity Investments, Mr. Deberghes was Senior Vice President of Mutual Fund Administration at State Street Corporation (2007-2008), Senior Director of Mutual Fund Administration at Investors Bank & Trust (2005-2007), and Director of Finance for Dunkin' Brands (2000-2005). Previously, Mr. Deberghes served in other fund officer roles.
Laura M. Del Prato (1964)
Year of Election or Appointment: 2018
Assistant Treasurer
Ms. Del Prato also serves as an officer of other funds. Ms. Del Prato is an employee of Fidelity Investments (2017-present). Prior to joining Fidelity Investments, Ms. Del Prato served as a Managing Director and Treasurer of the JPMorgan Mutual Funds (2014-2017). Prior to JPMorgan, Ms. Del Prato served as a partner at Cohen Fund Audit Services (accounting firm, 2012-2013) and KPMG LLP (accounting firm, 2004-2012).
Colm A. Hogan (1973)
Year of Election or Appointment: 2016
Deputy Treasurer
Mr. Hogan also serves as an officer of other funds. Mr. Hogan serves as Assistant Treasurer of FMR Capital, Inc. (2017-present) and is an employee of Fidelity Investments (2005-present). Previously, Mr. Hogan served as Assistant Treasurer of certain Fidelity® funds (2016-2018).
Pamela R. Holding (1964)
Year of Election or Appointment: 2018
Vice President
Ms. Holding also serves as Vice President of other funds. Ms. Holding serves as Executive Vice President of Fidelity SelectCo, LLC (2019-present), Co-Head of Equity (2018-present) and is an employee of Fidelity Investments (2013-present). Previously, Ms. Holding served as Chief Investment Officer of Fidelity Institutional Asset Management (2013-2018).
Cynthia Lo Bessette (1969)
Year of Election or Appointment: 2019
Secretary and Chief Legal Officer (CLO)
Ms. Lo Bessette also serves as Secretary and CLO of other funds. Ms. Lo Bessette serves as CLO, Secretary, and Senior Vice President of Fidelity Management & Research Company and FMR Co., Inc. (investment adviser firms, 2019-present); Secretary of Fidelity SelectCo, LLC and Fidelity Investments Money Management, Inc. (investment adviser firms, 2019-present); and CLO of Fidelity Management & Research (Hong Kong) Limited, FMR Investment Management (UK) Limited, and Fidelity Management & Research (Japan) Limited (investment adviser firms, 2019-present). She is a Senior Vice President and Deputy General Counsel of FMR LLC (diversified financial services company, 2019-present), and is an employee of Fidelity Investments. Previously, Ms. Lo Bessette served as Executive Vice President, General Counsel (2016-2019) and Senior Vice President, Deputy General Counsel (2015-2016) of OppenheimerFunds (investment management company) and Deputy Chief Legal Officer (2013-2015) of Jennison Associates LLC (investment adviser firm).
Chris Maher (1972)
Year of Election or Appointment: 2013
Assistant Treasurer
Mr. Maher serves as Assistant Treasurer of other funds. Mr. Maher is Vice President of Valuation Oversight, serves as Assistant Treasurer of FMR Capital, Inc. (2017-present), and is an employee of Fidelity Investments. Previously, Mr. Maher served as Vice President of Asset Management Compliance (2013), Vice President of the Program Management Group of FMR (investment adviser firm, 2010-2013), and Vice President of Valuation Oversight (2008-2010).
Kenneth B. Robins (1969)
Year of Election or Appointment: 2016
Chief Compliance Officer
Mr. Robins also serves as an officer of other funds. Mr. Robins serves as Compliance Officer of Fidelity Management & Research Company and FMR Co., Inc. (investment adviser firms, 2016-present) and is an employee of Fidelity Investments (2004-present). Previously, Mr. Robins served as Executive Vice President of Fidelity Investments Money Management, Inc. (investment adviser firm, 2013-2016) and served in other fund officer roles.
Stacie M. Smith (1974)
Year of Election or Appointment: 2016
President and Treasurer
Ms. Smith also serves as an officer of other funds. Ms. Smith serves as Assistant Treasurer of FMR Capital, Inc. (2017-present), is an employee of Fidelity Investments (2009-present), and has served in other fund officer roles. Prior to joining Fidelity Investments, Ms. Smith served as Senior Audit Manager of Ernst & Young LLP (accounting firm, 1996-2009). Previously, Ms. Smith served as Assistant Treasurer (2013-2018) and Deputy Treasurer (2013-2016) of certain Fidelity® funds.
Marc L. Spector (1972)
Year of Election or Appointment: 2016
Assistant Treasurer
Mr. Spector also serves as an officer of other funds. Mr. Spector serves as Assistant Treasurer of FMR Capital, Inc. (2017-present) and is an employee of Fidelity Investments (2016-present). Prior to joining Fidelity Investments, Mr. Spector served as Director at the Siegfried Group (accounting firm, 2013-2016), and prior to Siegfried Group as audit senior manager at Deloitte & Touche (accounting firm, 2005-2013).
Jim Wegmann (1979)
Year of Election or Appointment: 2019
Assistant Treasurer
Mr. Wegmann also serves as Assistant Treasurer of other funds. Mr. Wegmann is an employee of Fidelity Investments (2011-present).
Shareholder Expense Example
As a shareholder of the Fund, you incur two types of costs: (1) transaction costs and (2) ongoing costs, including management fees and other Fund expenses. This Example is intended to help you understand your ongoing costs (in dollars) of investing in the Fund and to compare these costs with the ongoing costs of investing in other mutual funds.
The Example is based on an investment of $1,000 invested at the beginning of the period and held for the entire period (May 1, 2019 to October 31, 2019).
Actual Expenses
The first line of the accompanying table for each class of the Fund provides information about actual account values and actual expenses. You may use the information in this line, together with the amount you invested, to estimate the expenses that you paid over the period. Simply divide your account value by $1,000.00 (for example, an $8,600 account value divided by $1,000.00 = 8.6), then multiply the result by the number in the first line for a class of the Fund under the heading entitled "Expenses Paid During Period" to estimate the expenses you paid on your account during this period. In addition, the Fund, as a shareholder in the underlying Fidelity Central Funds, will indirectly bear its pro-rata share of the fees and expenses incurred by the underlying Fidelity Central Funds. These fees and expenses are not included in the Fund's annualized expense ratio used to calculate the expense estimate in the table below.
Hypothetical Example for Comparison Purposes
The second line of the accompanying table for each class of the Fund provides information about hypothetical account values and hypothetical expenses based on a Class' actual expense ratio and an assumed rate of return of 5% per year before expenses, which is not the Class' actual return. The hypothetical account values and expenses may not be used to estimate the actual ending account balance or expenses you paid for the period. You may use this information to compare the ongoing costs of investing in the Fund and other funds. To do so, compare this 5% hypothetical example with the 5% hypothetical examples that appear in the shareholder reports of the other funds. In addition, the Fund, as a shareholder in the underlying Fidelity Central Funds, will indirectly bear its pro-rata share of the fees and expenses incurred by the underlying Fidelity Central Funds. These fees and expenses are not included in the Fund's annualized expense ratio used to calculate the expense estimate in the table below.
Please note that the expenses shown in the table are meant to highlight your ongoing costs only and do not reflect any transaction costs. Therefore, the second line of the table is useful in comparing ongoing costs only, and will not help you determine the relative total costs of owning different funds.
| | Annualized Expense Ratio-A | Beginning
Account Value
May 1, 2019 | Ending
Account Value
October 31, 2019 | Expenses Paid
During Period-B
May 1, 2019
to October 31, 2019 |
| Capital Appreciation | .68% | | | |
| Actual | | $1,000.00 | $1,030.80 | $3.48 |
| Hypothetical-C | | $1,000.00 | $1,021.78 | $3.47 |
| Class K | .61% | | | |
| Actual | | $1,000.00 | $1,031.00 | $3.12 |
| Hypothetical-C | | $1,000.00 | $1,022.13 | $3.11 |
A Annualized expense ratio reflects expenses net of applicable fee waivers.
B Expenses are equal to each Class' annualized expense ratio, multiplied by the average account value over the period, multiplied by 184/365 (to reflect the one-half year period).
C 5% return per year before expenses
Distributions (Unaudited)
The Board of Trustees of Fidelity Capital Appreciation Fund voted to pay to shareholders of record at the opening of business on record date, the following distributions per share derived from capital gains realized from sales of portfolio securities, and dividends derived from net investment income:
| | Pay Date | Record Date | Dividends | Capital Gains |
| Fidelity Capital Appreciation Fund | | | | |
| Capital Appreciation | 12/09/19 | 12/06/19 | $0.235 | $4.337 |
| Class K | 12/09/19 | 12/06/19 | $0.262 | $4.337 |
The fund hereby designates as a capital gain dividend with respect to the taxable year ended October 31, 2019, $842,909,403, or, if subsequently determined to be different, the net capital gain of such year.
Capital Appreciation designates 74% and Class K designates 69% of the dividend distributed during the fiscal year as qualifying for the dividends–received deduction for corporate shareholders.
Capital Appreciation designates 86% and Class K designates 80% of the dividend distributed during the fiscal year as amounts which may be taken into account as a dividend for purposes of the maximum rate under section 1(h)(11) of the Internal Revenue Code.
The fund will notify shareholders in January 2020 of amounts for use in preparing 2019 income tax returns.
CAF-ANN-1219
1.538293.122
Fidelity® Disciplined Equity Fund
Annual Report
October 31, 2019
See the inside front cover for important information about access to your fund’s shareholder reports.
Beginning on January 1, 2021, as permitted by regulations adopted by the Securities and Exchange Commission, paper copies of a fund’s shareholder reports will no longer be sent by mail, unless you specifically request paper copies of the reports from the fund or from your financial intermediary, such as a financial advisor, broker-dealer or bank. Instead, the reports will be made available on a website, and you will be notified by mail each time a report is posted and provided with a website link to access the report.
If you already elected to receive shareholder reports electronically, you will not be affected by this change and you need not take any action. You may elect to receive shareholder reports and other communications from a fund electronically, by contacting your financial intermediary. For Fidelity customers, visit Fidelity's web site or call Fidelity using the contact information listed below.
You may elect to receive all future reports in paper free of charge. If you wish to continue receiving paper copies of your shareholder reports, you may contact your financial intermediary or, if you are a Fidelity customer, visit Fidelity’s website, or call Fidelity at the applicable toll-free number listed below. Your election to receive reports in paper will apply to all funds held with the fund complex/your financial intermediary.
| Account Type | Website | Phone Number |
| Brokerage, Mutual Fund, or Annuity Contracts: | fidelity.com/mailpreferences | 1-800-343-3548 |
| Employer Provided Retirement Accounts: | netbenefits.fidelity.com/preferences (choose 'no' under Required Disclosures to continue to print) | 1-800-343-0860 |
| Advisor Sold Accounts Serviced Through Your Financial Intermediary: | Contact Your Financial Intermediary | Your Financial Intermediary's phone number |
| Advisor Sold Accounts Serviced by Fidelity: | institutional.fidelity.com | 1-877-208-0098 |
Contents
To view a fund's proxy voting guidelines and proxy voting record for the 12-month period ended June 30, visit http://www.fidelity.com/proxyvotingresults or visit the Securities and Exchange Commission's (SEC) web site at http://www.sec.gov.
You may also call 1-800-544-8544 if you’re an individual investing directly with Fidelity, call 1-800-835-5092 if you’re a plan sponsor or participant with Fidelity as your recordkeeper or call 1-877-208-0098 on institutional accounts or if you’re an advisor or invest through one to request a free copy of the proxy voting guidelines.
Standard & Poor's, S&P and S&P 500 are registered service marks of The McGraw-Hill Companies, Inc. and have been licensed for use by Fidelity Distributors Corporation.
Other third-party marks appearing herein are the property of their respective owners.
All other marks appearing herein are registered or unregistered trademarks or service marks of FMR LLC or an affiliated company. © 2019 FMR LLC. All rights reserved.
This report and the financial statements contained herein are submitted for the general information of the shareholders of the Fund. This report is not authorized for distribution to prospective investors in the Fund unless preceded or accompanied by an effective prospectus.
A fund files its complete schedule of portfolio holdings with the SEC for the first and third quarters of each fiscal year on Form N-PORT. Forms N-PORT are available on the SEC’s web site at http://www.sec.gov. A fund's Forms N-PORT may be reviewed and copied at the SEC’s Public Reference Room in Washington, DC. Information regarding the operation of the SEC's Public Reference Room may be obtained by calling 1-800-SEC-0330.
For a complete list of a fund's portfolio holdings, view the most recent holdings listing, semiannual report, or annual report on Fidelity's web site at http://www.fidelity.com, http://www.institutional.fidelity.com, or http://www.401k.com, as applicable.
NOT FDIC INSURED •MAY LOSE VALUE •NO BANK GUARANTEE
Neither the Fund nor Fidelity Distributors Corporation is a bank.
Performance: The Bottom Line
Average annual total return reflects the change in the value of an investment, assuming reinvestment of distributions from dividend income and capital gains (the profits earned upon the sale of securities that have grown in value, if any) and assuming a constant rate of performance each year. The hypothetical investment and the average annual total returns do not reflect the deduction of taxes that a shareholder would pay on fund distributions or the redemption of fund shares. During periods of reimbursement by Fidelity, a fund’s total return will be greater than it would be had the reimbursement not occurred. How a fund did yesterday is no guarantee of how it will do tomorrow.
Average Annual Total Returns
| For the periods ended October 31, 2019 | Past 1 year | Past 5 years | Past 10 years |
| Fidelity® Disciplined Equity Fund | 12.01% | 8.05% | 11.10% |
| Class K | 12.12% | 8.16% | 11.24% |
$10,000 Over 10 Years
Let's say hypothetically that $10,000 was invested in Fidelity® Disciplined Equity Fund, a class of the fund, on October 31, 2009.
The chart shows how the value of your investment would have changed, and also shows how the S&P 500® Index performed over the same period.
| Period Ending Values |
| $28,650 | Fidelity® Disciplined Equity Fund - Fidelity® Disciplined Equity Fund |
| $36,096 | S&P 500® Index |
Management's Discussion of Fund Performance
Market Recap: The S&P 500
® index gained 14.33% for the 12 months ending October 31, 2019, ending the period just shy of a record close after seesawing due to trade tension, interest rates, economic data and an inverted yield curve, among other factors. Upbeat company earnings and outlooks, along with signs the Federal Reserve may pause on rates, boosted stocks to an all-time high on April 30. In May, however, volatility spiked and the index sunk as trade negotiations between the U.S. and China broke down. The bull market roared back in June and recorded a series of highs in July, when the Fed, affirming a dovish shift in policy, cut interest rates for the first time since 2008. Volatility intensified in August, however, as the U.S. Treasury yield curve inverted for the first time since 2007, which some investors viewed as a sign the U.S. economy could be heading for recession. The market proved resilient, rising in the final two months and reaching a new high on October 30, when the Fed cut interest rates for the third time this year. For the full 12 months, the defensive real estate (+27%) and utilities (+24%) sectors led the way, followed by information technology (+23%). Communication services and consumer discretionary each gained about 16%, while industrials advanced 15%. In contrast, energy (-11%) was by far the weakest sector – slipping on lower oil prices. Other notable laggards included health care (+9%) and financials (+12%). Lastly, consumer staples and materials finished roughly in line with the index.
Comments from Portfolio Manager Kwasi Dadzie-Yeboah: For the year, the fund’s share classes gained about 12%, trailing the benchmark S&P 500
® index. Versus the benchmark, security selection in the health care, communication services and utilities sectors detracted most from the fund’s performance. On a stock-specific basis, an overweighted position in utility provider PG&E (-86%) was by far the fund’s largest detractor the past 12 months. PG&E was forced to file for bankruptcy in January 2019 due to its involvement in the deadly California wildfires. We sold out of this position in January. Untimely ownership of streaming-entertainment provider Netflix (-34%), which I bought for the fund in February, also hurt. Conversely, strong picks among industrials and financials stocks aided the portfolio’s relative result, as did underweighting the poor-performing energy sector. Among individual holdings, an overweighted stake in chip-equipment maker Lam Research – which I added soon after taking the helm – was our top relative contributor. Lastly, Visa, the fund’s largest individual overweighting at period end, also helped due to the firm's considerable pricing power and significant market share.
The views expressed above reflect those of the portfolio manager(s) only through the end of the period as stated on the cover of this report and do not necessarily represent the views of Fidelity or any other person in the Fidelity organization. Any such views are subject to change at any time based upon market or other conditions and Fidelity disclaims any responsibility to update such views. These views may not be relied on as investment advice and, because investment decisions for a Fidelity fund are based on numerous factors, may not be relied on as an indication of trading intent on behalf of any Fidelity fund.
Note to shareholders: On February 22, 2019, Kwasi Dadzie-Yeboah assumed lead portfolio management responsibilities for the fund, joining Co-Manager Alex Devereaux until October 1, 2019, when Alex transitioned off of the fund and Kwasi became sole portfolio manager. Upon Kwasi’s arrival, the fund’s investment process changed from a value-oriented strategy to one emphasizing companies with the most rapidly improving fundamentals.
Investment Summary (Unaudited)
Top Ten Stocks as of October 31, 2019
| | % of fund's net assets |
| Microsoft Corp. | 5.7 |
| Amazon.com, Inc. | 3.8 |
| Alphabet, Inc. Class A | 3.0 |
| Apple, Inc. | 2.8 |
| Visa, Inc. Class A | 2.8 |
| Facebook, Inc. Class A | 2.3 |
| MasterCard, Inc. Class A | 2.3 |
| JPMorgan Chase & Co. | 2.2 |
| UnitedHealth Group, Inc. | 2.0 |
| Bank of America Corp. | 1.8 |
| | 28.7 |
Top Five Market Sectors as of October 31, 2019
| | % of fund's net assets |
| Information Technology | 32.9 |
| Health Care | 15.7 |
| Consumer Discretionary | 12.0 |
| Industrials | 10.5 |
| Communication Services | 10.3 |
Asset Allocation (% of fund's net assets)
| As of October 31, 2019 * |
| | Stocks | 99.8% |
| | Short-Term Investments and Net Other Assets (Liabilities) | 0.2% |

* Foreign investments - 3.6%
Schedule of Investments October 31, 2019
Showing Percentage of Net Assets
| Common Stocks - 99.8% | | | |
| | | Shares | Value (000s) |
| COMMUNICATION SERVICES - 10.3% | | | |
| Entertainment - 3.5% | | | |
| Activision Blizzard, Inc. | | 191,074 | $10,706 |
| Electronic Arts, Inc. (a) | | 75,755 | 7,303 |
| Netflix, Inc. (a) | | 37,900 | 10,893 |
| The Walt Disney Co. | | 121,269 | 15,755 |
| | | | 44,657 |
| Interactive Media & Services - 6.8% | | | |
| Alphabet, Inc.: | | | |
| Class A (a) | | 31,092 | 39,139 |
| Class C (a) | | 12,866 | 16,213 |
| Facebook, Inc. Class A (a) | | 152,097 | 29,149 |
| IAC/InterActiveCorp (a) | | 10,700 | 2,432 |
| | | | 86,933 |
|
| TOTAL COMMUNICATION SERVICES | | | 131,590 |
|
| CONSUMER DISCRETIONARY - 12.0% | | | |
| Distributors - 0.0% | | | |
| Pool Corp. | | 3,400 | 705 |
| Diversified Consumer Services - 0.3% | | | |
| Service Corp. International | | 98,800 | 4,493 |
| Hotels, Restaurants & Leisure - 2.0% | | | |
| Darden Restaurants, Inc. | | 47,647 | 5,349 |
| Domino's Pizza, Inc. | | 12,300 | 3,341 |
| Hilton Worldwide Holdings, Inc. | | 42,400 | 4,111 |
| Planet Fitness, Inc. (a) | | 21,900 | 1,394 |
| Starbucks Corp. | | 128,400 | 10,858 |
| | | | 25,053 |
| Household Durables - 0.2% | | | |
| NVR, Inc. (a) | | 700 | 2,546 |
| Internet & Direct Marketing Retail - 4.8% | | | |
| Amazon.com, Inc. (a) | | 27,264 | 48,439 |
| The Booking Holdings, Inc. (a) | | 6,343 | 12,995 |
| | | | 61,434 |
| Multiline Retail - 0.6% | | | |
| Dollar General Corp. | | 49,800 | 7,985 |
| Specialty Retail - 3.2% | | | |
| Best Buy Co., Inc. | | 65,084 | 4,675 |
| Ross Stores, Inc. | | 64,700 | 7,096 |
| The Home Depot, Inc. | | 90,211 | 21,162 |
| TJX Companies, Inc. | | 133,536 | 7,698 |
| | | | 40,631 |
| Textiles, Apparel & Luxury Goods - 0.9% | | | |
| NIKE, Inc. Class B | | 127,600 | 11,427 |
|
| TOTAL CONSUMER DISCRETIONARY | | | 154,274 |
|
| CONSUMER STAPLES - 3.5% | | | |
| Beverages - 0.5% | | | |
| Monster Beverage Corp. (a) | | 109,600 | 6,152 |
| Food & Staples Retailing - 0.6% | | | |
| Costco Wholesale Corp. | | 19,300 | 5,734 |
| Walmart, Inc. | | 16,900 | 1,982 |
| | | | 7,716 |
| Food Products - 0.9% | | | |
| Lamb Weston Holdings, Inc. | | 56,800 | 4,433 |
| Mondelez International, Inc. | | 142,400 | 7,469 |
| | | | 11,902 |
| Household Products - 0.7% | | | |
| Procter & Gamble Co. | | 67,600 | 8,417 |
| Personal Products - 0.8% | | | |
| Estee Lauder Companies, Inc. Class A | | 56,500 | 10,524 |
|
| TOTAL CONSUMER STAPLES | | | 44,711 |
|
| ENERGY - 0.7% | | | |
| Oil, Gas & Consumable Fuels - 0.7% | | | |
| ConocoPhillips Co. | | 80,625 | 4,451 |
| EOG Resources, Inc. | | 46,400 | 3,216 |
| Hess Corp. | | 31,500 | 2,071 |
| | | | 9,738 |
| FINANCIALS - 9.5% | | | |
| Banks - 4.0% | | | |
| Bank of America Corp. | | 712,735 | 22,287 |
| JPMorgan Chase & Co. | | 226,800 | 28,332 |
| | | | 50,619 |
| Capital Markets - 3.8% | | | |
| CME Group, Inc. | | 35,853 | 7,377 |
| Moody's Corp. | | 72,800 | 16,066 |
| MSCI, Inc. | | 62,800 | 14,730 |
| S&P Global, Inc. | | 40,300 | 10,397 |
| | | | 48,570 |
| Consumer Finance - 0.5% | | | |
| Synchrony Financial | | 189,100 | 6,688 |
| Insurance - 1.2% | | | |
| Aon PLC | | 36,600 | 7,070 |
| Chubb Ltd. | | 54,000 | 8,231 |
| | | | 15,301 |
|
| TOTAL FINANCIALS | | | 121,178 |
|
| HEALTH CARE - 15.7% | | | |
| Biotechnology - 1.1% | | | |
| Alexion Pharmaceuticals, Inc. (a) | | 41,200 | 4,342 |
| Vertex Pharmaceuticals, Inc. (a) | | 49,400 | 9,657 |
| | | | 13,999 |
| Health Care Equipment & Supplies - 7.9% | | | |
| Baxter International, Inc. | | 89,700 | 6,880 |
| Becton, Dickinson & Co. | | 33,741 | 8,638 |
| Boston Scientific Corp. (a) | | 194,939 | 8,129 |
| Danaher Corp. | | 136,900 | 18,868 |
| Edwards Lifesciences Corp. (a) | | 45,600 | 10,870 |
| IDEXX Laboratories, Inc. (a) | | 36,800 | 10,488 |
| Intuitive Surgical, Inc. (a) | | 21,000 | 11,612 |
| Masimo Corp. (a) | | 25,800 | 3,761 |
| Stryker Corp. | | 85,100 | 18,405 |
| Varian Medical Systems, Inc. (a) | | 26,000 | 3,141 |
| | | | 100,792 |
| Health Care Providers & Services - 2.6% | | | |
| Anthem, Inc. | | 27,062 | 7,282 |
| UnitedHealth Group, Inc. | | 103,696 | 26,204 |
| | | | 33,486 |
| Health Care Technology - 0.4% | | | |
| Veeva Systems, Inc. Class A (a) | | 35,600 | 5,049 |
| Life Sciences Tools & Services - 2.8% | | | |
| Agilent Technologies, Inc. | | 88,700 | 6,719 |
| Bio-Rad Laboratories, Inc. Class A (a) | | 16,900 | 5,604 |
| Bruker Corp. | | 111,600 | 4,966 |
| Mettler-Toledo International, Inc. (a) | | 7,700 | 5,428 |
| Thermo Fisher Scientific, Inc. | | 45,280 | 13,674 |
| | | | 36,391 |
| Pharmaceuticals - 0.9% | | | |
| Zoetis, Inc. Class A | | 85,516 | 10,939 |
|
| TOTAL HEALTH CARE | | | 200,656 |
|
| INDUSTRIALS - 10.5% | | | |
| Aerospace & Defense - 3.7% | | | |
| Harris Corp. | | 34,700 | 7,159 |
| HEICO Corp. Class A | | 74,300 | 7,079 |
| Huntington Ingalls Industries, Inc. | | 29,000 | 6,544 |
| Lockheed Martin Corp. | | 9,137 | 3,442 |
| Northrop Grumman Corp. | | 24,900 | 8,777 |
| Raytheon Co. | | 31,200 | 6,621 |
| Teledyne Technologies, Inc. (a) | | 22,300 | 7,350 |
| | | | 46,972 |
| Commercial Services & Supplies - 1.4% | | | |
| Cintas Corp. | | 30,100 | 8,087 |
| Copart, Inc. (a) | | 111,900 | 9,247 |
| | | | 17,334 |
| Electrical Equipment - 1.0% | | | |
| AMETEK, Inc. | | 81,654 | 7,484 |
| Eaton Corp. PLC | | 66,900 | 5,828 |
| | | | 13,312 |
| Industrial Conglomerates - 1.7% | | | |
| Honeywell International, Inc. | | 70,700 | 12,212 |
| Roper Technologies, Inc. | | 28,400 | 9,570 |
| | | | 21,782 |
| Machinery - 1.4% | | | |
| Allison Transmission Holdings, Inc. | | 70,000 | 3,053 |
| Dover Corp. | | 44,300 | 4,602 |
| IDEX Corp. | | 42,900 | 6,672 |
| Parker Hannifin Corp. | | 23,200 | 4,257 |
| | | | 18,584 |
| Professional Services - 0.9% | | | |
| CoStar Group, Inc. (a) | | 9,900 | 5,440 |
| IHS Markit Ltd. (a) | | 94,300 | 6,603 |
| | | | 12,043 |
| Road & Rail - 0.4% | | | |
| Norfolk Southern Corp. | | 17,003 | 3,095 |
| Old Dominion Freight Lines, Inc. | | 8,500 | 1,548 |
| | | | 4,643 |
|
| TOTAL INDUSTRIALS | | | 134,670 |
|
| INFORMATION TECHNOLOGY - 32.9% | | | |
| Communications Equipment - 1.7% | | | |
| Arista Networks, Inc. (a) | | 19,400 | 4,745 |
| Cisco Systems, Inc. | | 356,900 | 16,956 |
| | | | 21,701 |
| Electronic Equipment & Components - 1.7% | | | |
| Amphenol Corp. Class A | | 56,900 | 5,709 |
| CDW Corp. | | 42,100 | 5,385 |
| Keysight Technologies, Inc. (a) | | 48,900 | 4,934 |
| Zebra Technologies Corp. Class A (a) | | 24,500 | 5,828 |
| | | | 21,856 |
| IT Services - 11.1% | | | |
| Accenture PLC Class A | | 83,996 | 15,575 |
| Automatic Data Processing, Inc. | | 73,000 | 11,843 |
| Black Knight, Inc. (a) | | 20,300 | 1,303 |
| Broadridge Financial Solutions, Inc. | | 18,500 | 2,317 |
| EPAM Systems, Inc. (a) | | 9,400 | 1,654 |
| FleetCor Technologies, Inc. (a) | | 15,300 | 4,502 |
| Global Payments, Inc. | | 76,426 | 12,930 |
| Jack Henry & Associates, Inc. | | 38,800 | 5,493 |
| MasterCard, Inc. Class A | | 105,273 | 29,141 |
| PayPal Holdings, Inc. (a) | | 125,383 | 13,052 |
| VeriSign, Inc. (a) | | 40,300 | 7,658 |
| Visa, Inc. Class A | | 202,023 | 36,134 |
| | | | 141,602 |
| Semiconductors & Semiconductor Equipment - 2.1% | | | |
| Lam Research Corp. | | 42,803 | 11,601 |
| NVIDIA Corp. | | 65,300 | 13,127 |
| Xilinx, Inc. | | 26,000 | 2,359 |
| | | | 27,087 |
| Software - 13.5% | | | |
| Adobe, Inc. (a) | | 65,288 | 18,145 |
| Alteryx, Inc. Class A (a) | | 5,900 | 540 |
| ANSYS, Inc. (a) | | 32,600 | 7,177 |
| Atlassian Corp. PLC (a) | | 31,500 | 3,805 |
| Autodesk, Inc. (a) | | 37,200 | 5,482 |
| Cadence Design Systems, Inc. (a) | | 97,100 | 6,345 |
| Citrix Systems, Inc. | | 33,017 | 3,594 |
| Fair Isaac Corp. (a) | | 19,200 | 5,838 |
| Fortinet, Inc. (a) | | 53,600 | 4,372 |
| Guidewire Software, Inc. (a) | | 29,500 | 3,326 |
| Intuit, Inc. | | 77,727 | 20,015 |
| Microsoft Corp. | | 513,920 | 73,674 |
| Paycom Software, Inc. (a) | | 9,700 | 2,052 |
| Salesforce.com, Inc. (a) | | 74,961 | 11,731 |
| ServiceNow, Inc. (a) | | 6,200 | 1,533 |
| Synopsys, Inc. (a) | | 39,600 | 5,376 |
| | | | 173,005 |
| Technology Hardware, Storage & Peripherals - 2.8% | | | |
| Apple, Inc. | | 146,892 | 36,541 |
|
| TOTAL INFORMATION TECHNOLOGY | | | 421,792 |
|
| MATERIALS - 1.2% | | | |
| Chemicals - 1.2% | | | |
| Air Products & Chemicals, Inc. | | 28,900 | 6,163 |
| Sherwin-Williams Co. | | 15,200 | 8,699 |
| | | | 14,862 |
| REAL ESTATE - 2.5% | | | |
| Equity Real Estate Investment Trusts (REITs) - 2.2% | | | |
| American Tower Corp. | | 52,000 | 11,340 |
| Equity Lifestyle Properties, Inc. | | 65,000 | 4,546 |
| Equity Residential (SBI) | | 44,800 | 3,972 |
| SBA Communications Corp. Class A | | 32,200 | 7,749 |
| | | | 27,607 |
| Real Estate Management & Development - 0.3% | | | |
| CBRE Group, Inc. (a) | | 79,500 | 4,257 |
|
| TOTAL REAL ESTATE | | | 31,864 |
|
| UTILITIES - 1.0% | | | |
| Electric Utilities - 0.7% | | | |
| NextEra Energy, Inc. | | 36,800 | 8,771 |
| Independent Power and Renewable Electricity Producers - 0.3% | | | |
| NRG Energy, Inc. | | 57,281 | 2,298 |
| Vistra Energy Corp. | | 52,200 | 1,411 |
| | | | 3,709 |
|
| TOTAL UTILITIES | | | 12,480 |
|
| TOTAL COMMON STOCKS | | | |
| (Cost $1,061,282) | | | 1,277,815 |
|
| Money Market Funds - 0.3% | | | |
| Fidelity Cash Central Fund 1.83% (b) | | | |
| (Cost $4,008) | | 4,007,576 | 4,008 |
| TOTAL INVESTMENT IN SECURITIES - 100.1% | | | |
| (Cost $1,065,290) | | | 1,281,823 |
| NET OTHER ASSETS (LIABILITIES) - (0.1)% | | | (1,168) |
| NET ASSETS - 100% | | | $1,280,655 |
Legend
(a) Non-income producing
(b) Affiliated fund that is generally available only to investment companies and other accounts managed by Fidelity Investments. The rate quoted is the annualized seven-day yield of the fund at period end. A complete unaudited listing of the fund's holdings as of its most recent quarter end is available upon request. In addition, each Fidelity Central Fund's financial statements, which are not covered by the Fund's Report of Independent Registered Public Accounting Firm, are available on the SEC's website or upon request.
Affiliated Central Funds
Information regarding fiscal year to date income earned by the Fund from investments in Fidelity Central Funds is as follows:
| Fund | Income earned |
| | (Amounts in thousands) |
| Fidelity Cash Central Fund | $200 |
| Fidelity Securities Lending Cash Central Fund | 2 |
| Total | $202 |
Amounts in the income column in the above table include any capital gain distributions from underlying funds, which are presented in the corresponding line-item in the Statement of Operations, if applicable. Amount for Fidelity Securities Lending Cash Central Fund represents the income earned on investing cash collateral, less rebates paid to borrowers and any lending agent fees associated with the loan, plus any premium payments received for lending certain types of securities.
Investment Valuation
All investments are categorized as Level 1 under the Fair Value Hierarchy. The inputs or methodology used for valuing securities may not be an indication of the risk associated with investing in those securities. For more information on valuation inputs please refer to the Investment Valuation section in the accompanying Notes to Financial Statements.
See accompanying notes which are an integral part of the financial statements.
Financial Statements
Statement of Assets and Liabilities
| Amounts in thousands (except per-share amounts) | | October 31, 2019 |
| Assets | | |
Investment in securities, at value — See accompanying schedule:
Unaffiliated issuers (cost $1,061,282) | $1,277,815 | |
| Fidelity Central Funds (cost $4,008) | 4,008 | |
| Total Investment in Securities (cost $1,065,290) | | $1,281,823 |
| Receivable for fund shares sold | | 78 |
| Dividends receivable | | 409 |
| Distributions receivable from Fidelity Central Funds | | 21 |
| Prepaid expenses | | 2 |
| Other receivables | | 3 |
| Total assets | | 1,282,336 |
| Liabilities | | |
| Payable for investments purchased | $140 | |
| Payable for fund shares redeemed | 969 | |
| Accrued management fee | 342 | |
| Transfer agent fee payable | 138 | |
| Other affiliated payables | 34 | |
| Other payables and accrued expenses | 58 | |
| Total liabilities | | 1,681 |
| Net Assets | | $1,280,655 |
| Net Assets consist of: | | |
| Paid in capital | | $1,098,469 |
| Total accumulated earnings (loss) | | 182,186 |
| Net Assets | | $1,280,655 |
| Net Asset Value and Maximum Offering Price | | |
| Disciplined Equity: | | |
| Net Asset Value, offering price and redemption price per share ($1,189,912 ÷ 31,719 shares) | | $37.51 |
| Class K: | | |
| Net Asset Value, offering price and redemption price per share ($90,743 ÷ 2,422 shares) | | $37.47 |
See accompanying notes which are an integral part of the financial statements.
Statement of Operations
| Amounts in thousands | | Year ended October 31, 2019 |
| Investment Income | | |
| Dividends | | $17,406 |
| Income from Fidelity Central Funds (including $2 from security lending) | | 202 |
| Total income | | 17,608 |
| Expenses | | |
| Management fee | | |
| Basic fee | $6,699 | |
| Performance adjustment | (2,589) | |
| Transfer agent fees | 1,656 | |
| Accounting and security lending fees | 400 | |
| Custodian fees and expenses | 23 | |
| Independent trustees' fees and expenses | 7 | |
| Registration fees | 39 | |
| Audit | 60 | |
| Legal | 7 | |
| Interest | 2 | |
| Miscellaneous | 8 | |
| Total expenses before reductions | 6,312 | |
| Expense reductions | (18) | |
| Total expenses after reductions | | 6,294 |
| Net investment income (loss) | | 11,314 |
| Realized and Unrealized Gain (Loss) | | |
| Net realized gain (loss) on: | | |
| Investment securities: | | |
| Unaffiliated issuers | (36,901) | |
| Total net realized gain (loss) | | (36,901) |
| Change in net unrealized appreciation (depreciation) on investment securities | | 165,807 |
| Net gain (loss) | | 128,906 |
| Net increase (decrease) in net assets resulting from operations | | $140,220 |
See accompanying notes which are an integral part of the financial statements.
Statement of Changes in Net Assets
| Amounts in thousands | Year ended October 31, 2019 | Year ended October 31, 2018 |
| Increase (Decrease) in Net Assets | | |
| Operations | | |
| Net investment income (loss) | $11,314 | $18,200 |
| Net realized gain (loss) | (36,901) | 141,828 |
| Change in net unrealized appreciation (depreciation) | 165,807 | (123,601) |
| Net increase (decrease) in net assets resulting from operations | 140,220 | 36,427 |
| Distributions to shareholders | (154,355) | (55,255) |
| Share transactions - net increase (decrease) | 14,679 | (77,997) |
| Total increase (decrease) in net assets | 544 | (96,825) |
| Net Assets | | |
| Beginning of period | 1,280,111 | 1,376,936 |
| End of period | $1,280,655 | $1,280,111 |
See accompanying notes which are an integral part of the financial statements.
Financial Highlights
Fidelity Disciplined Equity Fund
| Years ended October 31, | 2019 | 2018 | 2017 | 2016 | 2015 |
| Selected Per–Share Data | | | | | |
| Net asset value, beginning of period | $38.32 | $38.96 | $32.26 | $34.19 | $35.18 |
| Income from Investment Operations | | | | | |
| Net investment income (loss)A | .32 | .52 | .47 | .42 | .35 |
| Net realized and unrealized gain (loss) | 3.53 | .41 | 6.72 | (.34)B | 1.26 |
| Total from investment operations | 3.85 | .93 | 7.19 | .08 | 1.61 |
| Distributions from net investment income | (.53) | (.45) | (.49) | (.36) | (.38) |
| Distributions from net realized gain | (4.13) | (1.12) | – | (1.65) | (2.22) |
| Total distributions | (4.66) | (1.57) | (.49) | (2.01) | (2.60) |
| Net asset value, end of period | $37.51 | $38.32 | $38.96 | $32.26 | $34.19 |
| Total ReturnC | 12.01% | 2.37% | 22.51% | .16%B | 4.66% |
| Ratios to Average Net AssetsD,E | | | | | |
| Expenses before reductions | .51% | .53% | .54% | .68% | .89% |
| Expenses net of fee waivers, if any | .51% | .53% | .54% | .68% | .89% |
| Expenses net of all reductions | .51% | .53% | .54% | .68% | .89% |
| Net investment income (loss) | .90% | 1.32% | 1.33% | 1.30% | 1.02% |
| Supplemental Data | | | | | |
| Net assets, end of period (in millions) | $1,190 | $1,182 | $1,266 | $1,150 | $1,385 |
| Portfolio turnover rateF | 108% | 181% | 184% | 179% | 187% |
A Calculated based on average shares outstanding during the period.
B Net realized and unrealized gain (loss) per share reflects proceeds received from litigation which amounted to $.05 per share. Excluding these litigation proceeds, the total return would have been (.01)%.
C Total returns would have been lower if certain expenses had not been reduced during the applicable periods shown.
D Fees and expenses of any underlying Fidelity Central Funds are not included in the Fund's expense ratio. The Fund indirectly bears its proportionate share of the expenses of any underlying Fidelity Central Funds.
E Expense ratios reflect operating expenses of the class. Expenses before reductions do not reflect amounts reimbursed by the investment adviser or reductions from brokerage service arrangements or reductions from other expense offset arrangements and do not represent the amount paid by the class during periods when reimbursements or reductions occur. Expenses net of fee waivers reflect expenses after reimbursement by the investment adviser but prior to reductions from brokerage service arrangements or other expense offset arrangements. Expenses net of all reductions represent the net expenses paid by the class.
F Amount does not include the portfolio activity of any underlying Fidelity Central Funds.
See accompanying notes which are an integral part of the financial statements.
Fidelity Disciplined Equity Fund Class K
| Years ended October 31, | 2019 | 2018 | 2017 | 2016 | 2015 |
| Selected Per–Share Data | | | | | |
| Net asset value, beginning of period | $38.29 | $38.93 | $32.23 | $34.16 | $35.15 |
| Income from Investment Operations | | | | | |
| Net investment income (loss)A | .35 | .56 | .51 | .45 | .38 |
| Net realized and unrealized gain (loss) | 3.53 | .41 | 6.71 | (.34)B | 1.27 |
| Total from investment operations | 3.88 | .97 | 7.22 | .11 | 1.65 |
| Distributions from net investment income | (.57) | (.49) | (.52) | (.39) | (.42) |
| Distributions from net realized gain | (4.13) | (1.12) | – | (1.65) | (2.22) |
| Total distributions | (4.70) | (1.61) | (.52) | (2.04) | (2.64) |
| Net asset value, end of period | $37.47 | $38.29 | $38.93 | $32.23 | $34.16 |
| Total ReturnC | 12.12% | 2.48% | 22.65% | .26%B | 4.78% |
| Ratios to Average Net AssetsD,E | | | | | |
| Expenses before reductions | .42% | .43% | .44% | .57% | .79% |
| Expenses net of fee waivers, if any | .42% | .43% | .44% | .57% | .79% |
| Expenses net of all reductions | .42% | .43% | .44% | .57% | .79% |
| Net investment income (loss) | .99% | 1.41% | 1.43% | 1.41% | 1.12% |
| Supplemental Data | | | | | |
| Net assets, end of period (in millions) | $91 | $99 | $111 | $104 | $129 |
| Portfolio turnover rateF | 108% | 181% | 184% | 179% | 187% |
A Calculated based on average shares outstanding during the period.
B Net realized and unrealized gain (loss) per share reflects proceeds received from litigation which amounted to $.05 per share. Excluding these litigation proceeds, the total return would have been .09%.
C Total returns would have been lower if certain expenses had not been reduced during the applicable periods shown.
D Fees and expenses of any underlying Fidelity Central Funds are not included in the Fund's expense ratio. The Fund indirectly bears its proportionate share of the expenses of any underlying Fidelity Central Funds.
E Expense ratios reflect operating expenses of the class. Expenses before reductions do not reflect amounts reimbursed by the investment adviser or reductions from brokerage service arrangements or reductions from other expense offset arrangements and do not represent the amount paid by the class during periods when reimbursements or reductions occur. Expenses net of fee waivers reflect expenses after reimbursement by the investment adviser but prior to reductions from brokerage service arrangements or other expense offset arrangements. Expenses net of all reductions represent the net expenses paid by the class.
F Amount does not include the portfolio activity of any underlying Fidelity Central Funds.
See accompanying notes which are an integral part of the financial statements.
Notes to Financial Statements
For the period ended October 31, 2019
(Amounts in thousands except percentages)
1. Organization.
Fidelity Disciplined Equity Fund (the Fund) is a fund of Fidelity Capital Trust (the Trust) and is authorized to issue an unlimited number of shares. The Trust is registered under the Investment Company Act of 1940, as amended (the 1940 Act), as an open-end management investment company organized as a Massachusetts business trust. The Fund offers Disciplined Equity and Class K shares, each of which has equal rights as to assets and voting privileges. Each class has exclusive voting rights with respect to matters that affect that class.
2. Investments in Fidelity Central Funds.
The Fund invests in Fidelity Central Funds, which are open-end investment companies generally available only to other investment companies and accounts managed by the investment adviser and its affiliates. The Fund's Schedule of Investments lists each of the Fidelity Central Funds held as of period end, if any, as an investment of the Fund, but does not include the underlying holdings of each Fidelity Central Fund. As an Investing Fund, the Fund indirectly bears its proportionate share of the expenses of the underlying Fidelity Central Funds.
The Money Market Central Funds seek preservation of capital and current income and are managed by Fidelity Investments Money Management, Inc. (FIMM), an affiliate of the investment adviser. Annualized expenses of the Money Market Central Funds as of their most recent shareholder report date ranged from less than .005% to .01%.
A complete unaudited list of holdings for each Fidelity Central Fund is available upon request or at the Securities and Exchange Commission (the SEC) website at www.sec.gov. In addition, the financial statements of the Fidelity Central Funds, which are not covered by the Fund's Report of Independent Registered Public Accounting Firm, are available on the SEC website or upon request.
3. Significant Accounting Policies.
The Fund is an investment company and applies the accounting and reporting guidance of the Financial Accounting Standards Board (FASB) Accounting Standards Codification Topic 946 Financial Services – Investments Companies. The financial statements have been prepared in conformity with accounting principles generally accepted in the United States of America (GAAP), which require management to make certain estimates and assumptions at the date of the financial statements. Actual results could differ from those estimates. Subsequent events, if any, through the date that the financial statements were issued have been evaluated in the preparation of the financial statements. The following summarizes the significant accounting policies of the Fund:
Investment Valuation. Investments are valued as of 4:00 p.m. Eastern time on the last calendar day of the period. The Board of Trustees (the Board) has delegated the day to day responsibility for the valuation of the Fund's investments to the Fair Value Committee (the Committee) established by the Fund's investment adviser. In accordance with valuation policies and procedures approved by the Board, the Fund attempts to obtain prices from one or more third party pricing vendors or brokers to value its investments. When current market prices, quotations or currency exchange rates are not readily available or reliable, investments will be fair valued in good faith by the Committee, in accordance with procedures adopted by the Board. Factors used in determining fair value vary by investment type and may include market or investment specific events. The frequency with which these procedures are used cannot be predicted and they may be utilized to a significant extent. The Committee oversees the Fund's valuation policies and procedures and reports to the Board on the Committee's activities and fair value determinations. The Board monitors the appropriateness of the procedures used in valuing the Fund's investments and ratifies the fair value determinations of the Committee.
The Fund categorizes the inputs to valuation techniques used to value its investments into a disclosure hierarchy consisting of three levels as shown below:
- Level 1 – quoted prices in active markets for identical investments
- Level 2 – other significant observable inputs (including quoted prices for similar investments, interest rates, prepayment speeds, etc.)
- Level 3 – unobservable inputs (including the Fund's own assumptions based on the best information available)
Valuation techniques used to value the Fund's investments by major category are as follows:
Equity securities, including restricted securities, for which market quotations are readily available, are valued at the last reported sale price or official closing price as reported by a third party pricing vendor on the primary market or exchange on which they are traded and are categorized as Level 1 in the hierarchy. In the event there were no sales during the day or closing prices are not available, securities are valued at the last quoted bid price or may be valued using the last available price and are generally categorized as Level 2 in the hierarchy. For foreign equity securities, when market or security specific events arise, comparisons to the valuation of American Depositary Receipts (ADRs), futures contracts, Exchange-Traded Funds (ETFs) and certain indexes as well as quoted prices for similar securities may be used and would be categorized as Level 2 in the hierarchy. For equity securities, including restricted securities, where observable inputs are limited, assumptions about market activity and risk are used and these securities may be categorized as Level 3 in the hierarchy.
Investments in open-end mutual funds, including the Fidelity Central Funds, are valued at their closing net asset value (NAV) each business day and are categorized as Level 1 in the hierarchy.
Changes in valuation techniques may result in transfers in or out of an assigned level within the disclosure hierarchy.
Investment Transactions and Income. For financial reporting purposes, the Fund's investment holdings and NAV include trades executed through the end of the last business day of the period. The NAV per share for processing shareholder transactions is calculated as of the close of business of the New York Stock Exchange (NYSE), normally 4:00 p.m. Eastern time and includes trades executed through the end of the prior business day. Gains and losses on securities sold are determined on the basis of identified cost and include proceeds received from litigation. Dividend income is recorded on the ex-dividend date, except for certain dividends from foreign securities where the ex-dividend date may have passed, which are recorded as soon as the Fund is informed of the ex-dividend date. Non-cash dividends included in dividend income, if any, are recorded at the fair market value of the securities received. Income and capital gain distributions from Fidelity Central Funds, if any, are recorded on the ex-dividend date. Certain distributions received by the Fund represent a return of capital or capital gain. The Fund determines the components of these distributions subsequent to the ex-dividend date, based upon receipt of tax filings or other correspondence relating to the underlying investment. These distributions are recorded as a reduction of cost of investments and/or as a realized gain.
Class Allocations and Expenses. Investment income, realized and unrealized capital gains and losses, common expenses of the Fund, and certain fund-level expense reductions, if any, are allocated daily on a pro-rata basis to each class based on the relative net assets of each class to the total net assets of the Fund. Each class differs with respect to transfer agent fees incurred. Certain expense reductions may also differ by class. For the reporting period, the allocated portion of income and expenses to each class as a percent of its average net assets may vary due to the timing of recording these transactions in relation to fluctuating net assets of the classes. Expenses directly attributable to a fund are charged to that fund. Expenses attributable to more than one fund are allocated among the respective funds on the basis of relative net assets or other appropriate methods. Expense estimates are accrued in the period to which they relate and adjustments are made when actual amounts are known.
Income Tax Information and Distributions to Shareholders. Each year, the Fund intends to qualify as a regulated investment company under Subchapter M of the Internal Revenue Code, including distributing substantially all of its taxable income and realized gains. As a result, no provision for U.S. Federal income taxes is required. As of October 31, 2019, the Fund did not have any unrecognized tax benefits in the financial statements; nor is the Fund aware of any tax positions for which it is reasonably possible that the total amounts of unrecognized tax benefits will significantly change in the next twelve months. The Fund files a U.S. federal tax return, in addition to state and local tax returns as required. The Fund's federal income tax returns are subject to examination by the Internal Revenue Service (IRS) for a period of three fiscal years after they are filed. State and local tax returns may be subject to examination for an additional fiscal year depending on the jurisdiction.
Distributions are declared and recorded on the ex-dividend date. Income and capital gain distributions are declared separately for each class. Income and capital gain distributions are determined in accordance with income tax regulations, which may differ from GAAP. In addition, the Fund claimed a portion of the payment made to redeeming shareholders as a distribution for income tax purposes.
Capital accounts within the financial statements are adjusted for permanent book-tax differences. These adjustments have no impact on net assets or the results of operations. Capital accounts are not adjusted for temporary book-tax differences which will reverse in a subsequent period.
Book-tax differences are primarily due to deferred trustees compensation, capital loss carryforwards and losses deferred due to wash sales.
As of period end, the cost and unrealized appreciation (depreciation) in securities, and derivatives if applicable, for federal income tax purposes were as follows:
| Gross unrealized appreciation | $228,508 |
| Gross unrealized depreciation | (13,408) |
| Net unrealized appreciation (depreciation) | $215,100 |
| Tax Cost | $1,066,723 |
The tax-based components of distributable earnings as of period end were as follows:
| Undistributed ordinary income | $6,081 |
| Capital loss carryforward | $(38,994) |
| Net unrealized appreciation (depreciation) on securities and other investments | $215,100 |
Capital loss carryforwards are only available to offset future capital gains of the Fund to the extent provided by regulations and may be limited. Under the Regulated Investment Company Modernization Act of 2010 (the Act), the Fund is permitted to carry forward capital losses incurred in taxable years beginning after December 22, 2010 for an unlimited period and such capital losses are required to be used prior to any losses that expire. The capital loss carryforward information presented below, including any applicable limitation, is estimated as of fiscal period end and is subject to adjustment.
| No expiration | |
| Short-term | $(38,994) |
The tax character of distributions paid was as follows:
| | October 31, 2019 | October 31, 2018 |
| Ordinary Income | $34,184 | $ 15,954 |
| Long-term Capital Gains | 120,171 | 39,301 |
| Total | $154,355 | $ 55,255 |
4. Purchases and Sales of Investments.
Purchases and sales of securities, other than short-term securities, aggregated $1,341,479 and $1,460,533, respectively.
5. Fees and Other Transactions with Affiliates.
Management Fee. Fidelity Management & Research Company (the investment adviser) and its affiliates provide the Fund with investment management related services for which the Fund pays a monthly management fee. The management fee is the sum of an individual fund fee rate that is based on an annual rate of .30% of the Fund's average net assets and an annualized group fee rate that averaged .24% during the period. The group fee rate is based upon the average net assets of all the mutual funds advised by the investment adviser, including any mutual funds previously advised by the investment adviser that are currently advised by Fidelity SelectCo, LLC, an affiliate of the investment adviser. The group fee rate decreases as assets under management increase and increases as assets under management decrease. In addition, the management fee is subject to a performance adjustment (up to a maximum of +/- .20% of the Fund's average net assets over a 36 month performance period). The upward or downward adjustment to the management fee is based on the relative investment performance of Disciplined Equity as compared to its benchmark index, the S&P 500 Index, over the same 36 month performance period. For the reporting period, the total annual management fee rate, including the performance adjustment, was .33% of the Fund's average net assets. The performance adjustment included in the management fee rate may be higher or lower than the maximum performance adjustment rate due to the difference between the average net assets for the reporting and performance periods.
Transfer Agent Fees. Fidelity Investments Institutional Operations Company, Inc., (FIIOC), an affiliate of the investment adviser, is the transfer, dividend disbursing and shareholder servicing agent for each class of the Fund. FIIOC receives account fees and asset-based fees that vary according to the account size and type of account of the shareholders of Disciplined Equity. FIIOC receives an asset-based fee of Class K's average net assets. FIIOC pays for typesetting, printing and mailing of shareholder reports, except proxy statements.
For the period, transfer agent fees for each class were as follows:
| | Amount | % of Class-Level Average Net Assets |
| Disciplined Equity | $1,614 | .14 |
| Class K | 42 | .05 |
| | $1,656 | |
Accounting and Security Lending Fees. Fidelity Service Company, Inc. (FSC), an affiliate of the investment adviser, maintains the Fund's accounting records. The accounting fee is based on the level of average net assets for each month. Prior to April 1, 2019, FSC had a separate agreement with the Fund for administration of the security lending program, based on the number and duration of lending transactions. For the period, the total fees paid for accounting and administration of securities lending were equivalent to an annual rate of .03%.
Brokerage Commissions. The Fund placed a portion of its portfolio transactions with brokerage firms which are affiliates of the investment adviser. Brokerage commissions are included in net realized gain (loss) and change in net unrealized appreciation (depreciation) in the Statement of Operations. The commissions paid to these affiliated firms were $33 for the period.
Interfund Lending Program. Pursuant to an Exemptive Order issued by the SEC, the Fund, along with other registered investment companies having management contracts with Fidelity Management & Research Company (FMR) or other affiliated entities of FMR, may participate in an interfund lending program. This program provides an alternative credit facility allowing the funds to borrow from, or lend money to, other participating affiliated funds. At period end, there were no interfund loans outstanding. The Fund's activity in this program during the period for which loans were outstanding was as follows:
| Borrower or Lender | Average Loan Balance | Weighted Average Interest Rate | Interest Expense |
| Borrower | $8,385 | 2.64% | $2 |
Interfund Trades. The Fund may purchase from or sell securities to other Fidelity Funds under procedures adopted by the Board. The procedures have been designed to ensure these interfund trades are executed in accordance with Rule 17a-7 of the 1940 Act. Interfund trades are included within the respective purchases and sales amounts shown in the Purchases and Sales of Investments note.
6. Committed Line of Credit.
The Fund participates with other funds managed by the investment adviser or an affiliate in a $4.25 billion credit facility (the "line of credit") to be utilized for temporary or emergency purposes to fund shareholder redemptions or for other short-term liquidity purposes. The Fund has agreed to pay commitment fees on its pro-rata portion of the line of credit, which amounted to $3 and is reflected in Miscellaneous expenses on the Statement of Operations. During the period, the Fund did not borrow on this line of credit.
7. Security Lending.
The Fund lends portfolio securities from time to time in order to earn additional income. For equity securities, lending agents are used, including National Financial Services (NFS), an affiliate of the Fund. Pursuant to a securities lending agreement, NFS will receive a fee, which is capped at 9.9% of daily lending revenue, for its services as lending agent. The Fund may lend securities to certain qualified borrowers, including NFS. On the settlement date of the loan, the Fund receives collateral (in the form of U.S. Treasury obligations, letters of credit and/or cash) against the loaned securities and maintains collateral in an amount not less than 100% of the market value of the loaned securities during the period of the loan. The market value of the loaned securities is determined at the close of business of the Fund and any additional required collateral is delivered to the Fund on the next business day. The Fund or borrower may terminate the loan at any time, and if the borrower defaults on its obligation to return the securities loaned because of insolvency or other reasons, the Fund may apply collateral received from the borrower against the obligation. The Fund may experience delays and costs in recovering the securities loaned. Any cash collateral received is invested in the Fidelity Securities Lending Cash Central Fund. At period end, there were no security loans outstanding. Total fees paid by the Fund to NFS, as lending agent, amounted to an amount of less than five hundred dollars. Security lending income represents the income earned on investing cash collateral, less rebates paid to borrowers and any lending agent fees associated with the loan, plus any premium payments received for lending certain types of securities. Security lending income is presented in the Statement of Operations as a component of income from Fidelity Central Funds, and includes an amount of less than five hundred dollars from securities loaned to NFS, as affiliated borrower.
8. Expense Reductions.
Commissions paid to certain brokers with whom the investment adviser, or its affiliates, places trades on behalf of the Fund include an amount in addition to trade execution, which may be rebated back to the Fund to offset certain expenses. This amount totaled $7 for the period. In addition, through arrangements with the Fund's custodian and each class' transfer agent, credits realized as a result of certain uninvested cash balances were used to reduce the Fund's expenses. During the period, custodian credits reduced the Fund's expenses by $1.
During the period, transfer agent credits reduced each class' expenses as noted in the table below.
| | Expense reduction |
| Disciplined Equity | $1 |
In addition, during the period the investment adviser reimbursed and/or waived a portion of fund-level operating expenses in the amount of $9.
9. Distributions to Shareholders.
Distributions to shareholders of each class were as follows:
| | Year ended
October 31, 2019 | Year ended
October 31, 2018 |
| Distributions to shareholders | | |
| Disciplined Equity | $142,401 | $50,719 |
| Class K | 11,954 | 4,536 |
| Total | $154,355 | $55,255 |
10. Share Transactions.
Share transactions for each class were as follows and may contain automatic conversions between classes or exchanges between affiliated funds:
| | Shares | Shares | Dollars | Dollars |
| | Year ended October 31, 2019 | Year ended October 31, 2018 | Year ended October 31, 2019 | Year ended October 31, 2018 |
| Disciplined Equity | | | | |
| Shares sold | 607 | 587 | $21,231 | $23,206 |
| Reinvestment of distributions | 4,102 | 1,230 | 132,529 | 47,371 |
| Shares redeemed | (3,822) | (3,491) | (133,005) | (137,996) |
| Net increase (decrease) | 887 | (1,674) | $20,755 | $(67,419) |
| Class K | | | | |
| Shares sold | 164 | 203 | $5,843 | $8,020 |
| Reinvestment of distributions | 371 | 118 | 11,954 | 4,536 |
| Shares redeemed | (687) | (587) | (23,873) | (23,134) |
| Net increase (decrease) | (152) | (266) | $(6,076) | $(10,578) |
11. Other.
The Fund's organizational documents provide former and current trustees and officers with a limited indemnification against liabilities arising in connection with the performance of their duties to the Fund. In the normal course of business, the Fund may also enter into contracts that provide general indemnifications. The Fund's maximum exposure under these arrangements is unknown as this would be dependent on future claims that may be made against the Fund. The risk of material loss from such claims is considered remote.
Report of Independent Registered Public Accounting Firm
To the Board of Trustees of Fidelity Capital Trust and Shareholders of Fidelity Disciplined Equity Fund:
Opinion on the Financial Statements
We have audited the accompanying statement of assets and liabilities, including the schedule of investments, of Fidelity Disciplined Equity Fund (one of the funds constituting Fidelity Capital Trust, referred to hereafter as the “Fund”) as of October 31, 2019, the related statement of operations for the year ended October 31, 2019, the statement of changes in net assets for each of the two years in the period ended October 31, 2019, including the related notes, and the financial highlights for each of the five years in the period ended October 31, 2019 (collectively referred to as the “financial statements”). In our opinion, the financial statements present fairly, in all material respects, the financial position of the Fund as of October 31, 2019, the results of its operations for the year then ended, the changes in its net assets for each of the two years in the period ended October 31, 2019 and the financial highlights for each of the five years in the period ended October 31, 2019 in conformity with accounting principles generally accepted in the United States of America.
Basis for Opinion
These financial statements are the responsibility of the Fund’s management. Our responsibility is to express an opinion on the Fund’s financial statements based on our audits. We are a public accounting firm registered with the Public Company Accounting Oversight Board (United States) (PCAOB) and are required to be independent with respect to the Fund in accordance with the U.S. federal securities laws and the applicable rules and regulations of the Securities and Exchange Commission and the PCAOB.
We conducted our audits of these financial statements in accordance with the standards of the PCAOB. Those standards require that we plan and perform the audit to obtain reasonable assurance about whether the financial statements are free of material misstatement, whether due to error or fraud.
Our audits included performing procedures to assess the risks of material misstatement of the financial statements, whether due to error or fraud, and performing procedures that respond to those risks. Such procedures included examining, on a test basis, evidence regarding the amounts and disclosures in the financial statements. Our audits also included evaluating the accounting principles used and significant estimates made by management, as well as evaluating the overall presentation of the financial statements. Our procedures included confirmation of securities owned as of October 31, 2019 by correspondence with the custodian and brokers; when replies were not received from brokers, we performed other auditing procedures. We believe that our audits provide a reasonable basis for our opinion.
PricewaterhouseCoopers LLP
Boston, Massachusetts
December 11, 2019
We have served as the auditor of one or more investment companies in the Fidelity group of funds since 1932.
Trustees and Officers
The Trustees, Members of the Advisory Board (if any), and officers of the trust and fund, as applicable, are listed below. The Board of Trustees governs the fund and is responsible for protecting the interests of shareholders. The Trustees are experienced executives who meet periodically throughout the year to oversee the fund's activities, review contractual arrangements with companies that provide services to the fund, oversee management of the risks associated with such activities and contractual arrangements, and review the fund's performance. Except for the Michael Wiley, each of the Trustees oversees 298 funds. Mr. Wiley oversees 197 funds.
The Trustees hold office without limit in time except that (a) any Trustee may resign; (b) any Trustee may be removed by written instrument, signed by at least two-thirds of the number of Trustees prior to such removal; (c) any Trustee who requests to be retired or who has become incapacitated by illness or injury may be retired by written instrument signed by a majority of the other Trustees; and (d) any Trustee may be removed at any special meeting of shareholders by a two-thirds vote of the outstanding voting securities of the trust. Each Trustee who is not an interested person (as defined in the 1940 Act) of the trust and the fund is referred to herein as an Independent Trustee. Each Independent Trustee shall retire not later than the last day of the calendar year in which his or her 75th birthday occurs. The Independent Trustees may waive this mandatory retirement age policy with respect to individual Trustees. Officers and Advisory Board Members hold office without limit in time, except that any officer or Advisory Board Member may resign or may be removed by a vote of a majority of the Trustees at any regular meeting or any special meeting of the Trustees. Except as indicated, each individual has held the office shown or other offices in the same company for the past five years.
The fund's Statement of Additional Information (SAI) includes more information about the Trustees. To request a free copy, call Fidelity at 1-800-544-8544 if you’re an individual investing directly with Fidelity, call 1-800-835-5092 if you’re a plan sponsor or participant with Fidelity as your recordkeeper or call 1-877-208-0098 on institutional accounts or if you’re an advisor or invest through one.
Experience, Skills, Attributes, and Qualifications of the Trustees. The Governance and Nominating Committee has adopted a statement of policy that describes the experience, qualifications, attributes, and skills that are necessary and desirable for potential Independent Trustee candidates (Statement of Policy). The Board believes that each Trustee satisfied at the time he or she was initially elected or appointed a Trustee, and continues to satisfy, the standards contemplated by the Statement of Policy. The Governance and Nominating Committee also engages professional search firms to help identify potential Independent Trustee candidates who have the experience, qualifications, attributes, and skills consistent with the Statement of Policy. From time to time, additional criteria based on the composition and skills of the current Independent Trustees, as well as experience or skills that may be appropriate in light of future changes to board composition, business conditions, and regulatory or other developments, have also been considered by the professional search firms and the Governance and Nominating Committee. In addition, the Board takes into account the Trustees' commitment and participation in Board and committee meetings, as well as their leadership of standing and ad hoc committees throughout their tenure.
In determining that a particular Trustee was and continues to be qualified to serve as a Trustee, the Board has considered a variety of criteria, none of which, in isolation, was controlling. The Board believes that, collectively, the Trustees have balanced and diverse experience, qualifications, attributes, and skills, which allow the Board to operate effectively in governing the fund and protecting the interests of shareholders. Information about the specific experience, skills, attributes, and qualifications of each Trustee, which in each case led to the Board's conclusion that the Trustee should serve (or continue to serve) as a trustee of the fund, is provided below.
Board Structure and Oversight Function. James C. Curvey is an interested person and currently serves as Chairman. The Trustees have determined that an interested Chairman is appropriate and benefits shareholders because an interested Chairman has a personal and professional stake in the quality and continuity of services provided to the fund. Independent Trustees exercise their informed business judgment to appoint an individual of their choosing to serve as Chairman, regardless of whether the Trustee happens to be independent or a member of management. The Independent Trustees have determined that they can act independently and effectively without having an Independent Trustee serve as Chairman and that a key structural component for assuring that they are in a position to do so is for the Independent Trustees to constitute a substantial majority for the Board. The Independent Trustees also regularly meet in executive session. Ned C. Lautenbach serves as Chairman of the Independent Trustees and as such (i) acts as a liaison between the Independent Trustees and management with respect to matters important to the Independent Trustees and (ii) with management prepares agendas for Board meetings.
Fidelity® funds are overseen by different Boards of Trustees. The fund's Board oversees Fidelity's high income and certain equity funds, and other Boards oversee Fidelity's investment-grade bond, money market, asset allocation, and other equity funds. The asset allocation funds may invest in Fidelity® funds overseen by the fund's Board. The use of separate Boards, each with its own committee structure, allows the Trustees of each group of Fidelity® funds to focus on the unique issues of the funds they oversee, including common research, investment, and operational issues. On occasion, the separate Boards establish joint committees to address issues of overlapping consequences for the Fidelity® funds overseen by each Board.
The Trustees operate using a system of committees to facilitate the timely and efficient consideration of all matters of importance to the Trustees, the fund, and fund shareholders and to facilitate compliance with legal and regulatory requirements and oversight of the fund's activities and associated risks. The Board, acting through its committees, has charged FMR and its affiliates with (i) identifying events or circumstances the occurrence of which could have demonstrably adverse effects on the fund's business and/or reputation; (ii) implementing processes and controls to lessen the possibility that such events or circumstances occur or to mitigate the effects of such events or circumstances if they do occur; and (iii) creating and maintaining a system designed to evaluate continuously business and market conditions in order to facilitate the identification and implementation processes described in (i) and (ii) above. Because the day-to-day operations and activities of the fund are carried out by or through FMR, its affiliates, and other service providers, the fund's exposure to risks is mitigated but not eliminated by the processes overseen by the Trustees. While each of the Board's committees has responsibility for overseeing different aspects of the fund's activities, oversight is exercised primarily through the Operations, Audit, and Compliance Committees. Appropriate personnel, including but not limited to the fund's Chief Compliance Officer (CCO), FMR's internal auditor, the independent accountants, the fund's Treasurer and portfolio management personnel, make periodic reports to the Board's committees, as appropriate, including an annual review of Fidelity's risk management program for the Fidelity® funds. The responsibilities of each standing committee, including their oversight responsibilities, are described further under "Standing Committees of the Trustees."
Interested Trustees*:
Correspondence intended for a Trustee who is an interested person may be sent to Fidelity Investments, 245 Summer Street, Boston, Massachusetts 02210.
Name, Year of Birth; Principal Occupations and Other Relevant Experience+
James C. Curvey (1935)
Year of Election or Appointment: 2007
Trustee
Chairman of the Board of Trustees
Mr. Curvey also serves as Trustee of other Fidelity® funds. Mr. Curvey is Vice Chairman (2007-present) and Director of FMR LLC (diversified financial services company). In addition, Mr. Curvey is an Overseer Emeritus for the Boston Symphony Orchestra, a Director of Artis-Naples, and a Trustee of Brewster Academy in Wolfeboro, New Hampshire. Previously, Mr. Curvey served as a Director of Fidelity Research & Analysis Co. (investment adviser firm, 2009-2018), Director of Fidelity Investments Money Management, Inc. (investment adviser firm, 2009-2014) and a Director of FMR and FMR Co., Inc. (investment adviser firms, 2007-2014).
* Determined to be an “Interested Trustee” by virtue of, among other things, his or her affiliation with the trust or various entities under common control with FMR.
+ The information includes the Trustee's principal occupation during the last five years and other information relating to the experience, attributes, and skills relevant to the Trustee's qualifications to serve as a Trustee, which led to the conclusion that the Trustee should serve as a Trustee for the fund.
Independent Trustees:
Correspondence intended for an Independent Trustee may be sent to Fidelity Investments, P.O. Box 55235, Boston, Massachusetts 02205-5235.
Name, Year of Birth; Principal Occupations and Other Relevant Experience+
Dennis J. Dirks (1948)
Year of Election or Appointment: 2005
Trustee
Mr. Dirks also serves as Trustee of other Fidelity® funds. Prior to his retirement in May 2003, Mr. Dirks was Chief Operating Officer and a member of the Board of The Depository Trust & Clearing Corporation (DTCC). He also served as President, Chief Operating Officer, and Board member of The Depository Trust Company (DTC) and President and Board member of the National Securities Clearing Corporation (NSCC). In addition, Mr. Dirks served as Chief Executive Officer and Board member of the Government Securities Clearing Corporation, Chief Executive Officer and Board member of the Mortgage-Backed Securities Clearing Corporation, as a Trustee and a member of the Finance Committee of Manhattan College (2005-2008), as a Trustee and a member of the Finance Committee of AHRC of Nassau County (2006-2008), as a member of the Independent Directors Council (IDC) Governing Council (2010-2015), and as a member of the Board of Directors for The Brookville Center for Children’s Services, Inc. (2009-2017). Mr. Dirks is a member of the Finance Committee (2016-present) and Board of Directors (2017-present) and is Treasurer (2018-present) of the Asolo Repertory Theatre.
Donald F. Donahue (1950)
Year of Election or Appointment: 2018
Trustee
Mr. Donahue also serves as a Trustee of other Fidelity® funds. Mr. Donahue is President and Chief Executive Officer of Miranda Partners, LLC (risk consulting for the financial services industry, 2012-present). Previously, Mr. Donahue served as a Member of the Advisory Board of certain Fidelity® funds (2015-2018) and Chief Executive Officer (2006-2012), Chief Operating Officer (2003-2006), and Managing Director, Customer Marketing and Development (1999-2003) of The Depository Trust & Clearing Corporation (financial markets infrastructure). Mr. Donahue serves as a Member (2007-present) and Co-Chairman (2016-present) of the Board of Directors of United Way of New York, Member of the Board of Directors of NYC Leadership Academy (2012-present) and Member of the Board of Advisors of Ripple Labs, Inc. (financial services, 2015-present). He also served as Chairman (2010-2012) and Member of the Board of Directors (2012-2013) of Omgeo, LLC (financial services), Treasurer of United Way of New York (2012-2016), and Member of the Board of Directors of XBRL US (financial services non-profit, 2009-2012) and the International Securities Services Association (2009-2012).
Alan J. Lacy (1953)
Year of Election or Appointment: 2008
Trustee
Mr. Lacy also serves as Trustee of other Fidelity® funds. Mr. Lacy serves as a Director of Bristol-Myers Squibb Company (global pharmaceuticals, 2008-present). He is a Trustee of the California Chapter of The Nature Conservancy (2015-present) and a Director of the Center for Advanced Study in the Behavioral Sciences at Stanford University (2015-present). In addition, Mr. Lacy served as Senior Adviser (2007-2014) of Oak Hill Capital Partners, L.P. (private equity) and also served as Chief Executive Officer (2005) and Vice Chairman (2005-2006) of Sears Holdings Corporation (retail) and Chief Executive Officer and Chairman of the Board of Sears, Roebuck and Co. (retail, 2000-2005). Previously, Mr. Lacy served as Chairman (2014-2017) and a member (2010-2017) of the Board of Directors of Dave & Buster’s Entertainment, Inc. (restaurant and entertainment complexes), as Chairman (2008-2011) and a member (2006-2015) of the Board of Trustees of the National Parks Conservation Association, and as a member of the Board of Directors for The Hillman Companies, Inc. (hardware wholesalers, 2010-2014), Earth Fare, Inc. (retail grocery, 2010-2014), and The Western Union Company (global money transfer, 2006-2011).
Ned C. Lautenbach (1944)
Year of Election or Appointment: 2000
Trustee
Chairman of the Independent Trustees
Mr. Lautenbach also serves as Trustee of other Fidelity® funds. Mr. Lautenbach currently serves as Chair (2018-present) and Member (2013-present) of the Board of Governors, State University System of Florida and is a member of the Council on Foreign Relations (1994-present). He is also a member and has most recently served as Chairman of the Board of Directors of Artis-Naples (2012-present). Previously, Mr. Lautenbach served as a member and then Lead Director of the Board of Directors of Eaton Corporation (diversified industrial, 1997-2016). He was also a Partner and Advisory Partner at Clayton, Dubilier & Rice, LLC (private equity investment, 1998-2010), as well as a Director of Sony Corporation (2006-2007). In addition, Mr. Lautenbach also had a 30-year career with IBM (technology company) during which time he served as Senior Vice President and a member of the Corporate Executive Committee (1968-1998).
Joseph Mauriello (1944)
Year of Election or Appointment: 2008
Trustee
Mr. Mauriello also serves as Trustee of other Fidelity® funds. Prior to his retirement in January 2006, Mr. Mauriello served in numerous senior management positions including Deputy Chairman and Chief Operating Officer (2004-2005), and Vice Chairman of Financial Services (2002-2004) of KPMG LLP US (professional services, 1965-2005). Mr. Mauriello currently serves as a member of the Independent Directors Council (IDC) Governing Council (2015-present). Previously, Mr. Mauriello served as a member of the Board of Directors of XL Group plc. (global insurance and re-insurance, 2006-2018).
Cornelia M. Small (1944)
Year of Election or Appointment: 2005
Trustee
Ms. Small also serves as Trustee of other Fidelity® funds. Ms. Small is a member of the Board of Directors (2009-present) and Chair of the Investment Committee (2010-present) of the Teagle Foundation. Ms. Small also serves on the Investment Committee of the Berkshire Taconic Community Foundation (2008-present). Previously, Ms. Small served as Chairperson (2002-2008) and a member of the Investment Committee and Chairperson (2008-2012) and a member of the Board of Trustees of Smith College. In addition, Ms. Small served as Chief Investment Officer, Director of Global Equity Investments, and a member of the Board of Directors of Scudder, Stevens & Clark and Scudder Kemper Investments.
Garnett A. Smith (1947)
Year of Election or Appointment: 2018
Trustee
Mr. Smith also serves as Trustee of other Fidelity® funds. Prior to Mr. Smith's retirement, he served as Chairman and Chief Executive Officer of Inbrand Corp. (manufacturer of personal absorbent products, 1990-1997). He also served as President (1986-1990) of Inbrand Corp. Prior to his employment with Inbrand Corp., he was employed by a retail fabric chain and North Carolina National Bank. In addition, Mr. Smith served as a Member of the Advisory Board of certain Fidelity® funds (2012-2013) and as a board member of the Jackson Hole Land Trust (2009-2012).
David M. Thomas (1949)
Year of Election or Appointment: 2008
Trustee
Mr. Thomas also serves as Trustee of other Fidelity® funds. Mr. Thomas serves as Non-Executive Chairman of the Board of Directors of Fortune Brands Home and Security (home and security products, 2011-present) and as a member of the Board of Directors (2004-present) and Presiding Director (2013-present) of Interpublic Group of Companies, Inc. (marketing communication). Previously, Mr. Thomas served as Executive Chairman (2005-2006) and Chairman and Chief Executive Officer (2000-2005) of IMS Health, Inc. (pharmaceutical and healthcare information solutions), a Director of Fortune Brands, Inc. (consumer products, 2000-2011), and a member of the Board of Trustees of the University of Florida (2013-2018).
Michael E. Wiley (1950)
Year of Election or Appointment: 2018
Trustee
Mr. Wiley also serves as Trustee or Member of the Advisory Board of other Fidelity® funds. Mr. Wiley serves as a Director of High Point Resources (exploration and production, 2005-present). Previously, Mr. Wiley served as a Director of Andeavor Corporation (independent oil refiner and marketer, 2005-2018), a Director of Andeavor Logistics LP (natural resources logistics, 2015-2018), a Director of Post Oak Bank (privately-held bank, 2004-2018), a Director of Asia Pacific Exploration Consolidated (international oil and gas exploration and production, 2008-2013), a member of the Board of Trustees of the University of Tulsa (2000-2006; 2007-2010), a Senior Energy Advisor of Katzenbach Partners, LLC (consulting, 2006-2007), an Advisory Director of Riverstone Holdings (private investment), a Director of Spinnaker Exploration Company (exploration and production, 2001-2005) and Chairman, President, and CEO of Baker Hughes, Inc. (oilfield services, 2000-2004).
+ The information includes the Trustee's principal occupation during the last five years and other information relating to the experience, attributes, and skills relevant to the Trustee's qualifications to serve as a Trustee, which led to the conclusion that the Trustee should serve as a Trustee for the fund.
Advisory Board Members and Officers:
Correspondence intended for a Member of the Advisory Board (if any) may be sent to Fidelity Investments, P.O. Box 55235, Boston, Massachusetts 02205-5235. Correspondence intended for an officer or Peter S. Lynch may be sent to Fidelity Investments, 245 Summer Street, Boston, Massachusetts 02210. Officers appear below in alphabetical order.
Name, Year of Birth; Principal Occupation
Vicki L. Fuller (1957)
Year of Election or Appointment: 2018
Member of the Advisory Board
Ms. Fuller also serves as Member of the Advisory Board of other Fidelity® funds. Ms. Fuller serves as a member of the Board of Directors, Audit Committee, and Nominating and Governance Committee of The Williams Companies, Inc. (natural gas infrastructure, 2018-present). Previously, Ms. Fuller served as the Chief Investment Officer of the New York State Common Retirement Fund (2012-2018) and held a variety of positions at AllianceBernstein L.P. (global asset management, 1985-2012), including Managing Director (2006-2012) and Senior Vice President and Senior Portfolio Manager (2001-2006).
Peter S. Lynch (1944)
Year of Election or Appointment: 2003
Member of the Advisory Board
Mr. Lynch also serves as Member of the Advisory Board of other Fidelity® funds. Mr. Lynch is Vice Chairman and a Director of FMR (investment adviser firm) and FMR Co., Inc. (investment adviser firm). In addition, Mr. Lynch serves as a Trustee of Boston College and as the Chairman of the Inner-City Scholarship Fund. Previously, Mr. Lynch served on the Special Olympics International Board of Directors (1997-2006).
Elizabeth Paige Baumann (1968)
Year of Election or Appointment: 2017
Anti-Money Laundering (AML) Officer
Ms. Baumann also serves as AML Officer of other funds. She is Chief AML Officer (2012-present) and Senior Vice President (2014-present) of FMR LLC (diversified financial services company) and is an employee of Fidelity Investments. Previously, Ms. Baumann served as AML Officer of the funds (2012-2016), and Vice President (2007-2014) and Deputy Anti-Money Laundering Officer (2007-2012) of FMR LLC.
Craig S. Brown (1977)
Year of Election or Appointment: 2019
Assistant Treasurer
Mr. Brown also serves as Assistant Treasurer of other funds. Mr. Brown is an employee of Fidelity Investments (2013-present).
John J. Burke III (1964)
Year of Election or Appointment: 2018
Chief Financial Officer
Mr. Burke also serves as Chief Financial Officer of other funds. Mr. Burke serves as Head of Investment Operations for Fidelity Fund and Investment Operations (2018-present) and is an employee of Fidelity Investments (1998-present). Previously Mr. Burke served as head of Asset Management Investment Operations (2012-2018).
William C. Coffey (1969)
Year of Election or Appointment: 2019
Assistant Secretary
Mr. Coffey also serves as Assistant Secretary of other funds. He is Senior Vice President and Deputy General Counsel of FMR LLC (diversified financial services company, 2010-present), and is an employee of Fidelity Investments. Previously, Mr. Coffey served as Secretary and CLO of certain funds (2018-2019); CLO, Secretary, and Senior Vice President of Fidelity Management & Research Company and FMR Co., Inc. (investment adviser firms, 2018-2019); Secretary of Fidelity SelectCo, LLC and Fidelity Investments Money Management, Inc. (investment adviser firms, 2018-2019); CLO of Fidelity Management & Research (Hong Kong) Limited, FMR Investment Management (UK) Limited, and Fidelity Management & Research (Japan) Limited (investment adviser firms, 2018-2019); and Assistant Secretary of certain funds (2009-2018).
Timothy M. Cohen (1969)
Year of Election or Appointment: 2018
Vice President
Mr. Cohen also serves as Vice President of other funds. Mr. Cohen serves as Executive Vice President of Fidelity SelectCo, LLC (2019-present), Co-Head of Equity (2018-present), a Director of Fidelity Management & Research (Japan) Limited (investment adviser firm, 2016-present), and is an employee of Fidelity Investments. Previously, Mr. Cohen served as Head of Global Equity Research (2016-2018), Chief Investment Officer - Equity and a Director of Fidelity Management & Research (U.K.) Inc. (investment adviser firm, 2013-2015) and as a Director of Fidelity Management & Research (Hong Kong) Limited (investment adviser firm, 2017).
Jonathan Davis (1968)
Year of Election or Appointment: 2010
Assistant Treasurer
Mr. Davis also serves as Assistant Treasurer of other funds. Mr. Davis serves as Assistant Treasurer of FMR Capital, Inc. (2017-present) and is an employee of Fidelity Investments. Previously, Mr. Davis served as Vice President and Associate General Counsel of FMR LLC (diversified financial services company, 2003-2010).
Adrien E. Deberghes (1967)
Year of Election or Appointment: 2016
Assistant Treasurer
Mr. Deberghes also serves as an officer of other funds. He serves as Assistant Treasurer of FMR Capital, Inc. (2017-present), Executive Vice President of Fidelity Investments Money Management, Inc. (FIMM) (investment adviser firm, 2016-present), and is an employee of Fidelity Investments (2008-present). Previously, Mr. Deberghes served as President and Treasurer of certain Fidelity® funds (2013-2018). Prior to joining Fidelity Investments, Mr. Deberghes was Senior Vice President of Mutual Fund Administration at State Street Corporation (2007-2008), Senior Director of Mutual Fund Administration at Investors Bank & Trust (2005-2007), and Director of Finance for Dunkin' Brands (2000-2005). Previously, Mr. Deberghes served in other fund officer roles.
Laura M. Del Prato (1964)
Year of Election or Appointment: 2018
Assistant Treasurer
Ms. Del Prato also serves as an officer of other funds. Ms. Del Prato is an employee of Fidelity Investments (2017-present). Prior to joining Fidelity Investments, Ms. Del Prato served as a Managing Director and Treasurer of the JPMorgan Mutual Funds (2014-2017). Prior to JPMorgan, Ms. Del Prato served as a partner at Cohen Fund Audit Services (accounting firm, 2012-2013) and KPMG LLP (accounting firm, 2004-2012).
Colm A. Hogan (1973)
Year of Election or Appointment: 2016
Deputy Treasurer
Mr. Hogan also serves as an officer of other funds. Mr. Hogan serves as Assistant Treasurer of FMR Capital, Inc. (2017-present) and is an employee of Fidelity Investments (2005-present). Previously, Mr. Hogan served as Assistant Treasurer of certain Fidelity® funds (2016-2018).
Pamela R. Holding (1964)
Year of Election or Appointment: 2018
Vice President
Ms. Holding also serves as Vice President of other funds. Ms. Holding serves as Executive Vice President of Fidelity SelectCo, LLC (2019-present), Co-Head of Equity (2018-present) and is an employee of Fidelity Investments (2013-present). Previously, Ms. Holding served as Chief Investment Officer of Fidelity Institutional Asset Management (2013-2018).
Cynthia Lo Bessette (1969)
Year of Election or Appointment: 2019
Secretary and Chief Legal Officer (CLO)
Ms. Lo Bessette also serves as Secretary and CLO of other funds. Ms. Lo Bessette serves as CLO, Secretary, and Senior Vice President of Fidelity Management & Research Company and FMR Co., Inc. (investment adviser firms, 2019-present); Secretary of Fidelity SelectCo, LLC and Fidelity Investments Money Management, Inc. (investment adviser firms, 2019-present); and CLO of Fidelity Management & Research (Hong Kong) Limited, FMR Investment Management (UK) Limited, and Fidelity Management & Research (Japan) Limited (investment adviser firms, 2019-present). She is a Senior Vice President and Deputy General Counsel of FMR LLC (diversified financial services company, 2019-present), and is an employee of Fidelity Investments. Previously, Ms. Lo Bessette served as Executive Vice President, General Counsel (2016-2019) and Senior Vice President, Deputy General Counsel (2015-2016) of OppenheimerFunds (investment management company) and Deputy Chief Legal Officer (2013-2015) of Jennison Associates LLC (investment adviser firm).
Chris Maher (1972)
Year of Election or Appointment: 2013
Assistant Treasurer
Mr. Maher serves as Assistant Treasurer of other funds. Mr. Maher is Vice President of Valuation Oversight, serves as Assistant Treasurer of FMR Capital, Inc. (2017-present), and is an employee of Fidelity Investments. Previously, Mr. Maher served as Vice President of Asset Management Compliance (2013), Vice President of the Program Management Group of FMR (investment adviser firm, 2010-2013), and Vice President of Valuation Oversight (2008-2010).
Kenneth B. Robins (1969)
Year of Election or Appointment: 2016
Chief Compliance Officer
Mr. Robins also serves as an officer of other funds. Mr. Robins serves as Compliance Officer of Fidelity Management & Research Company and FMR Co., Inc. (investment adviser firms, 2016-present) and is an employee of Fidelity Investments (2004-present). Previously, Mr. Robins served as Executive Vice President of Fidelity Investments Money Management, Inc. (investment adviser firm, 2013-2016) and served in other fund officer roles.
Stacie M. Smith (1974)
Year of Election or Appointment: 2016
President and Treasurer
Ms. Smith also serves as an officer of other funds. Ms. Smith serves as Assistant Treasurer of FMR Capital, Inc. (2017-present), is an employee of Fidelity Investments (2009-present), and has served in other fund officer roles. Prior to joining Fidelity Investments, Ms. Smith served as Senior Audit Manager of Ernst & Young LLP (accounting firm, 1996-2009). Previously, Ms. Smith served as Assistant Treasurer (2013-2018) and Deputy Treasurer (2013-2016) of certain Fidelity® funds.
Marc L. Spector (1972)
Year of Election or Appointment: 2016
Assistant Treasurer
Mr. Spector also serves as an officer of other funds. Mr. Spector serves as Assistant Treasurer of FMR Capital, Inc. (2017-present) and is an employee of Fidelity Investments (2016-present). Prior to joining Fidelity Investments, Mr. Spector served as Director at the Siegfried Group (accounting firm, 2013-2016), and prior to Siegfried Group as audit senior manager at Deloitte & Touche (accounting firm, 2005-2013).
Jim Wegmann (1979)
Year of Election or Appointment: 2019
Assistant Treasurer
Mr. Wegmann also serves as Assistant Treasurer of other funds. Mr. Wegmann is an employee of Fidelity Investments (2011-present).
Shareholder Expense Example
As a shareholder of the Fund, you incur two types of costs: (1) transaction costs, and (2) ongoing costs, including management fees and other Fund expenses. This Example is intended to help you understand your ongoing costs (in dollars) of investing in the Fund and to compare these costs with the ongoing costs of investing in other mutual funds.
The Example is based on an investment of $1,000 invested at the beginning of the period and held for the entire period (May 1, 2019 to October 31, 2019).
Actual Expenses
The first line of the accompanying table for each class of the Fund provides information about actual account values and actual expenses. You may use the information in this line, together with the amount you invested, to estimate the expenses that you paid over the period. Simply divide your account value by $1,000.00 (for example, an $8,600 account value divided by $1,000.00 = 8.6), then multiply the result by the number in the first line for a class of the Fund under the heading entitled "Expenses Paid During Period" to estimate the expenses you paid on your account during this period. In addition, the Fund, as a shareholder in the underlying Fidelity Central Funds, will indirectly bear its pro-rata share of the fees and expenses incurred by the underlying Fidelity Central Funds. These fees and expenses are not included in the Fund's annualized expense ratio used to calculate the expense estimate in the table below.
Hypothetical Example for Comparison Purposes
The second line of the accompanying table for each class of the Fund provides information about hypothetical account values and hypothetical expenses based on a Class' actual expense ratio and an assumed rate of return of 5% per year before expenses, which is not the Class' actual return. The hypothetical account values and expenses may not be used to estimate the actual ending account balance or expenses you paid for the period. You may use this information to compare the ongoing costs of investing in the Fund and other funds. To do so, compare this 5% hypothetical example with the 5% hypothetical examples that appear in the shareholder reports of the other funds. In addition, the Fund, as a shareholder in the underlying Fidelity Central Funds, will indirectly bear its pro-rata share of the fees and expenses incurred by the underlying Fidelity Central Funds. These fees and expenses are not included in the Fund's annualized expense ratio used to calculate the expense estimate in the table below.
Please note that the expenses shown in the table are meant to highlight your ongoing costs only and do not reflect any transaction costs. Therefore, the second line of the table is useful in comparing ongoing costs only, and will not help you determine the relative total costs of owning different funds.
| | Annualized Expense Ratio-A | Beginning
Account Value
May 1, 2019 | Ending
Account Value
October 31, 2019 | Expenses Paid
During Period-B
May 1, 2019
to October 31, 2019 |
| Disciplined Equity | .52% | | | |
| Actual | | $1,000.00 | $1,040.50 | $2.67 |
| Hypothetical-C | | $1,000.00 | $1,022.58 | $2.65 |
| Class K | .42% | | | |
| Actual | | $1,000.00 | $1,041.10 | $2.16 |
| Hypothetical-C | | $1,000.00 | $1,023.09 | $2.14 |
A Annualized expense ratio reflects expenses net of applicable fee waivers.
B Expenses are equal to each Class' annualized expense ratio, multiplied by the average account value over the period, multiplied by 184/365 (to reflect the one-half year period).
C 5% return per year before expenses
Distributions (Unaudited)
The fund designates 61% and Class K designates 59% of the dividends distributed during the fiscal year as qualifying for the dividends–received deduction for corporate shareholders.
The fund designates 65% and Class K designates 63% of the dividends distributed during the fiscal year as amounts which may be taken into account as a dividend for purposes of the maximum rate under section 1(h)(11) of the Internal Revenue Code.
The fund will notify shareholders in January 2020 of amounts for use in preparing 2019 income tax returns.
FDE-ANN-1219
1.538372.122
Fidelity® Focused Stock Fund
Annual Report
October 31, 2019
See the inside front cover for important information about access to your fund’s shareholder reports.
Beginning on January 1, 2021, as permitted by regulations adopted by the Securities and Exchange Commission, paper copies of a fund’s shareholder reports will no longer be sent by mail, unless you specifically request paper copies of the reports from the fund or from your financial intermediary, such as a financial advisor, broker-dealer or bank. Instead, the reports will be made available on a website, and you will be notified by mail each time a report is posted and provided with a website link to access the report.
If you already elected to receive shareholder reports electronically, you will not be affected by this change and you need not take any action. You may elect to receive shareholder reports and other communications from a fund electronically, by contacting your financial intermediary. For Fidelity customers, visit Fidelity's web site or call Fidelity using the contact information listed below.
You may elect to receive all future reports in paper free of charge. If you wish to continue receiving paper copies of your shareholder reports, you may contact your financial intermediary or, if you are a Fidelity customer, visit Fidelity’s website, or call Fidelity at the applicable toll-free number listed below. Your election to receive reports in paper will apply to all funds held with the fund complex/your financial intermediary.
| Account Type | Website | Phone Number |
| Brokerage, Mutual Fund, or Annuity Contracts: | fidelity.com/mailpreferences | 1-800-343-3548 |
| Employer Provided Retirement Accounts: | netbenefits.fidelity.com/preferences (choose 'no' under Required Disclosures to continue to print) | 1-800-343-0860 |
| Advisor Sold Accounts Serviced Through Your Financial Intermediary: | Contact Your Financial Intermediary | Your Financial Intermediary's phone number |
| Advisor Sold Accounts Serviced by Fidelity: | institutional.fidelity.com | 1-877-208-0098 |
Contents
To view a fund's proxy voting guidelines and proxy voting record for the 12-month period ended June 30, visit http://www.fidelity.com/proxyvotingresults or visit the Securities and Exchange Commission's (SEC) web site at http://www.sec.gov.
You may also call 1-800-544-8544 to request a free copy of the proxy voting guidelines.
Standard & Poor's, S&P and S&P 500 are registered service marks of The McGraw-Hill Companies, Inc. and have been licensed for use by Fidelity Distributors Corporation.
Other third-party marks appearing herein are the property of their respective owners.
All other marks appearing herein are registered or unregistered trademarks or service marks of FMR LLC or an affiliated company. © 2019 FMR LLC. All rights reserved.
This report and the financial statements contained herein are submitted for the general information of the shareholders of the Fund. This report is not authorized for distribution to prospective investors in the Fund unless preceded or accompanied by an effective prospectus.
A fund files its complete schedule of portfolio holdings with the SEC for the first and third quarters of each fiscal year on Form N-PORT. Forms N-PORT are available on the SEC’s web site at http://www.sec.gov. A fund's Forms N-PORT may be reviewed and copied at the SEC’s Public Reference Room in Washington, DC. Information regarding the operation of the SEC's Public Reference Room may be obtained by calling 1-800-SEC-0330.
For a complete list of a fund's portfolio holdings, view the most recent holdings listing, semiannual report, or annual report on Fidelity's web site at http://www.fidelity.com, http://www.institutional.fidelity.com, or http://www.401k.com, as applicable.
NOT FDIC INSURED •MAY LOSE VALUE •NO BANK GUARANTEE
Neither the Fund nor Fidelity Distributors Corporation is a bank.
Performance: The Bottom Line
Average annual total return reflects the change in the value of an investment, assuming reinvestment of distributions from dividend income and capital gains (the profits earned upon the sale of securities that have grown in value, if any) and assuming a constant rate of performance each year. The hypothetical investment and the average annual total returns do not reflect the deduction of taxes that a shareholder would pay on fund distributions or the redemption of fund shares. During periods of reimbursement by Fidelity, a fund’s total return will be greater than it would be had the reimbursement not occurred. How a fund did yesterday is no guarantee of how it will do tomorrow.
Average Annual Total Returns
| For the periods ended October 31, 2019 | Past 1 year | Past 5 years | Past 10 years |
| Fidelity® Focused Stock Fund | 15.05% | 11.88% | 14.93% |
$10,000 Over 10 Years
Let's say hypothetically that $10,000 was invested in Fidelity® Focused Stock Fund on October 31, 2009.
The chart shows how the value of your investment would have changed, and also shows how the S&P 500® Index performed over the same period.
| Period Ending Values |
| $40,216 | Fidelity® Focused Stock Fund |
| $36,096 | S&P 500® Index |
Management's Discussion of Fund Performance
Market Recap: The S&P 500
® index gained 14.33% for the 12 months ending October 31, 2019, ending the period just shy of a record close after seesawing due to trade tension, interest rates, economic data and an inverted yield curve, among other factors. Upbeat company earnings and outlooks, along with signs the Federal Reserve may pause on rates, boosted stocks to an all-time high on April 30. In May, however, volatility spiked and the index sunk as trade negotiations between the U.S. and China broke down. The bull market roared back in June and recorded a series of highs in July, when the Fed, affirming a dovish shift in policy, cut interest rates for the first time since 2008. Volatility intensified in August, however, as the U.S. Treasury yield curve inverted for the first time since 2007, which some investors viewed as a sign the U.S. economy could be heading for recession. The market proved resilient, rising in the final two months and reaching a new high on October 30, when the Fed cut interest rates for the third time this year. For the full 12 months, the defensive real estate (+27%) and utilities (+24%) sectors led the way, followed by information technology (+23%). Communication services and consumer discretionary each gained about 16%, while industrials advanced 15%. In contrast, energy (-11%) was by far the weakest sector – slipping on lower oil prices. Other notable laggards included health care (+9%) and financials (+12%). Lastly, consumer staples and materials finished roughly in line with the index.
Comments from Portfolio Manager Stephen DuFour: For the fiscal year, the fund gained 15.05%, which was slightly ahead of the S&P 500
® index. The fund’s concentration in roughly 40 to 60 stocks with above-average earnings growth worked quite well in the first half of the period when a relatively small number of stocks – many of which the fund owned – drove much of the broader market’s gain. The fund’s focused approach, however, hindered relative performance when the market’s leadership broadened later in the period. For the full year, opportunistic buying, especially in the financials sector, aided the fund’s result, with notable contributions from bond rating agency Moody’s (+53%) and index data provider MSCI (+46%). New additions during the fourth-quarter market downturn, both stocks rebounded in 2019 as financial markets stabilized. Security selection in real estate and consumer staples and an overweighting in information technology also had a positive impact on the fund’s relative performance. Conversely, stock picks in health care hurt. The fund’s biggest individual detractor was health insurer Humana (-22%), which declined due to external headwinds, including talk of universal health care in the U.S. Another disappointment was electronic payments processor Square (-21%), a non-benchmark position that fell as investors locked in profits following strong performance in 2018. The fund did not hold MSCI at period end.
The views expressed above reflect those of the portfolio manager(s) only through the end of the period as stated on the cover of this report and do not necessarily represent the views of Fidelity or any other person in the Fidelity organization. Any such views are subject to change at any time based upon market or other conditions and Fidelity disclaims any responsibility to update such views. These views may not be relied on as investment advice and, because investment decisions for a Fidelity fund are based on numerous factors, may not be relied on as an indication of trading intent on behalf of any Fidelity fund.
Investment Summary (Unaudited)
Top Ten Stocks as of October 31, 2019
| | % of fund's net assets |
| Microsoft Corp. | 5.7 |
| Apple, Inc. | 5.0 |
| Alphabet, Inc. Class A | 4.8 |
| Adobe, Inc. | 4.4 |
| Moody's Corp. | 4.3 |
| American Tower Corp. | 3.9 |
| MasterCard, Inc. Class A | 3.9 |
| Amazon.com, Inc. | 3.9 |
| Bank of America Corp. | 3.7 |
| Accenture PLC Class A | 3.6 |
| | 43.2 |
Top Five Market Sectors as of October 31, 2019
| | % of fund's net assets |
| Information Technology | 36.0 |
| Financials | 16.2 |
| Health Care | 10.3 |
| Communication Services | 9.2 |
| Consumer Discretionary | 7.8 |
Asset Allocation (% of fund's net assets)
| As of October 31, 2019* |
| | Stocks | 95.3% |
| | Short-Term Investments and Net Other Assets (Liabilities) | 4.7% |

* Foreign investments - 5.6%
Schedule of Investments October 31, 2019
Showing Percentage of Net Assets
| Common Stocks - 95.3% | | | |
| | | Shares | Value |
| COMMUNICATION SERVICES - 9.2% | | | |
| Interactive Media & Services - 7.3% | | | |
| Alphabet, Inc. Class A (a) | | 111,600 | $140,482,080 |
| Facebook, Inc. Class A (a) | | 386,000 | 73,976,900 |
| | | | 214,458,980 |
| Media - 1.9% | | | |
| Comcast Corp. Class A | | 1,292,000 | 57,907,440 |
|
| TOTAL COMMUNICATION SERVICES | | | 272,366,420 |
|
| CONSUMER DISCRETIONARY - 7.8% | | | |
| Internet & Direct Marketing Retail - 3.9% | | | |
| Amazon.com, Inc. (a) | | 65,000 | 115,482,900 |
| Specialty Retail - 3.9% | | | |
| The Home Depot, Inc. | | 345,000 | 80,930,100 |
| TJX Companies, Inc. | | 574,000 | 33,091,100 |
| | | | 114,021,200 |
|
| TOTAL CONSUMER DISCRETIONARY | | | 229,504,100 |
|
| CONSUMER STAPLES - 2.9% | | | |
| Food & Staples Retailing - 2.4% | | | |
| Walmart, Inc. | | 605,000 | 70,942,300 |
| Personal Products - 0.5% | | | |
| Estee Lauder Companies, Inc. Class A | | 70,000 | 13,038,900 |
|
| TOTAL CONSUMER STAPLES | | | 83,981,200 |
|
| FINANCIALS - 16.2% | | | |
| Banks - 6.6% | | | |
| Bank of America Corp. | | 3,561,000 | 111,352,470 |
| JPMorgan Chase & Co. | | 679,000 | 84,820,680 |
| | | | 196,173,150 |
| Capital Markets - 7.8% | | | |
| Moody's Corp. | | 579,000 | 127,779,510 |
| S&P Global, Inc. | | 399,294 | 103,013,859 |
| | | | 230,793,369 |
| Consumer Finance - 1.8% | | | |
| American Express Co. | | 448,000 | 52,541,440 |
|
| TOTAL FINANCIALS | | | 479,507,959 |
|
| HEALTH CARE - 10.3% | | | |
| Health Care Equipment & Supplies - 8.5% | | | |
| Abbott Laboratories | | 889,000 | 74,329,290 |
| Boston Scientific Corp. (a) | | 1,980,000 | 82,566,000 |
| Novocure Ltd. (a) | | 61,000 | 4,370,040 |
| Stryker Corp. | | 386,000 | 83,480,220 |
| TransMedics Group, Inc. | | 396,027 | 7,104,724 |
| | | | 251,850,274 |
| Health Care Providers & Services - 1.0% | | | |
| UnitedHealth Group, Inc. | | 116,000 | 29,313,200 |
| Life Sciences Tools & Services - 0.1% | | | |
| 10X Genomics, Inc. (a) | | 26,800 | 1,554,400 |
| Pharmaceuticals - 0.7% | | | |
| AstraZeneca PLC sponsored ADR | | 425,000 | 20,837,750 |
|
| TOTAL HEALTH CARE | | | 303,555,624 |
|
| INDUSTRIALS - 4.1% | | | |
| Aerospace & Defense - 2.1% | | | |
| Northrop Grumman Corp. | | 178,000 | 62,741,440 |
| Machinery - 0.8% | | | |
| Caterpillar, Inc. | | 104,000 | 14,331,200 |
| PACCAR, Inc. | | 122,000 | 9,279,320 |
| | | | 23,610,520 |
| Road & Rail - 1.2% | | | |
| Kansas City Southern | | 245,000 | 34,491,100 |
|
| TOTAL INDUSTRIALS | | | 120,843,060 |
|
| INFORMATION TECHNOLOGY - 36.0% | | | |
| Electronic Equipment & Components - 1.2% | | | |
| Amphenol Corp. Class A | | 361,000 | 36,219,130 |
| IT Services - 14.1% | | | |
| Accenture PLC Class A | | 571,000 | 105,874,820 |
| Fidelity National Information Services, Inc. | | 75,000 | 9,882,000 |
| MasterCard, Inc. Class A | | 418,700 | 115,900,347 |
| PayPal Holdings, Inc. (a) | | 537,000 | 55,901,700 |
| Shopify, Inc. Class A (a) | | 76,300 | 23,925,214 |
| Visa, Inc. Class A | | 591,000 | 105,706,260 |
| | | | 417,190,341 |
| Semiconductors & Semiconductor Equipment - 5.6% | | | |
| Advanced Micro Devices, Inc. (a) | | 868,000 | 29,451,240 |
| Micron Technology, Inc. (a) | | 809,000 | 38,467,950 |
| NVIDIA Corp. | | 446,000 | 89,654,920 |
| NXP Semiconductors NV | | 77,000 | 8,753,360 |
| | | | 166,327,470 |
| Software - 10.1% | | | |
| Adobe, Inc. (a) | | 469,112 | 130,380,298 |
| Microsoft Corp. | | 1,172,000 | 168,029,641 |
| | | | 298,409,939 |
| Technology Hardware, Storage & Peripherals - 5.0% | | | |
| Apple, Inc. | | 586,000 | 145,773,360 |
|
| TOTAL INFORMATION TECHNOLOGY | | | 1,063,920,240 |
|
| REAL ESTATE - 6.4% | | | |
| Equity Real Estate Investment Trusts (REITs) - 6.4% | | | |
| American Tower Corp. | | 534,000 | 116,454,720 |
| Prologis, Inc. | | 829,000 | 72,753,040 |
| | | | 189,207,760 |
| UTILITIES - 2.4% | | | |
| Electric Utilities - 2.4% | | | |
| NextEra Energy, Inc. | | 294,000 | 70,071,960 |
| TOTAL COMMON STOCKS | | | |
| (Cost $2,223,566,483) | | | 2,812,958,323 |
|
| Money Market Funds - 5.4% | | | |
| Fidelity Cash Central Fund 1.83% (b) | | | |
| (Cost $160,214,097) | | 160,182,746 | 160,214,783 |
| TOTAL INVESTMENT IN SECURITIES - 100.7% | | | |
| (Cost $2,383,780,580) | | | 2,973,173,106 |
| NET OTHER ASSETS (LIABILITIES) - (0.7)% | | | (20,065,079) |
| NET ASSETS - 100% | | | $2,953,108,027 |
Legend
(a) Non-income producing
(b) Affiliated fund that is generally available only to investment companies and other accounts managed by Fidelity Investments. The rate quoted is the annualized seven-day yield of the fund at period end. A complete unaudited listing of the fund's holdings as of its most recent quarter end is available upon request. In addition, each Fidelity Central Fund's financial statements, which are not covered by the Fund's Report of Independent Registered Public Accounting Firm, are available on the SEC's website or upon request.
Affiliated Central Funds
Information regarding fiscal year to date income earned by the Fund from investments in Fidelity Central Funds is as follows:
| Fund | Income earned |
| Fidelity Cash Central Fund | $1,690,589 |
| Fidelity Securities Lending Cash Central Fund | 62,944 |
| Total | $1,753,533 |
Amounts in the income column in the above table include any capital gain distributions from underlying funds, which are presented in the corresponding line-item in the Statement of Operations, if applicable. Amount for Fidelity Securities Lending Cash Central Fund represents the income earned on investing cash collateral, less rebates paid to borrowers and any lending agent fees associated with the loan, plus any premium payments received for lending certain types of securities.
Investment Valuation
All investments are categorized as Level 1 under the Fair Value Hierarchy. The inputs or methodology used for valuing securities may not be an indication of the risk associated with investing in those securities. For more information on valuation inputs please refer to the Investment Valuation section in the accompanying Notes to Financial Statements.
See accompanying notes which are an integral part of the financial statements.
Financial Statements
Statement of Assets and Liabilities
| | | October 31, 2019 |
| Assets | | |
Investment in securities, at value — See accompanying schedule:
Unaffiliated issuers (cost $2,223,566,483) | $2,812,958,323 | |
| Fidelity Central Funds (cost $160,214,097) | 160,214,783 | |
| Total Investment in Securities (cost $2,383,780,580) | | $2,973,173,106 |
| Receivable for investments sold | | 37,732,364 |
| Receivable for fund shares sold | | 1,273,327 |
| Dividends receivable | | 1,246,358 |
| Distributions receivable from Fidelity Central Funds | | 214,458 |
| Prepaid expenses | | 5,158 |
| Other receivables | | 41,615 |
| Total assets | | 3,013,686,386 |
| Liabilities | | |
| Payable for investments purchased | $56,267,230 | |
| Payable for fund shares redeemed | 2,111,687 | |
| Accrued management fee | 1,654,454 | |
| Other affiliated payables | 492,327 | |
| Other payables and accrued expenses | 52,661 | |
| Total liabilities | | 60,578,359 |
| Net Assets | | $2,953,108,027 |
| Net Assets consist of: | | |
| Paid in capital | | $2,225,246,488 |
| Total accumulated earnings (loss) | | 727,861,539 |
| Net Assets, for 116,175,023 shares outstanding | | $2,953,108,027 |
| Net Asset Value, offering price and redemption price per share ($2,953,108,027 ÷ 116,175,023 shares) | | $25.42 |
See accompanying notes which are an integral part of the financial statements.
Statement of Operations
| | | Year ended October 31, 2019 |
| Investment Income | | |
| Dividends | | $25,734,155 |
| Income from Fidelity Central Funds (including $62,944 from security lending) | | 1,753,533 |
| Total income | | 27,487,688 |
| Expenses | | |
| Management fee | | |
| Basic fee | $14,651,965 | |
| Performance adjustment | 3,872,818 | |
| Transfer agent fees | 4,750,683 | |
| Accounting and security lending fees | 807,315 | |
| Custodian fees and expenses | 43,293 | |
| Independent trustees' fees and expenses | 14,911 | |
| Registration fees | 128,342 | |
| Audit | 52,729 | |
| Legal | 15,723 | |
| Miscellaneous | 15,986 | |
| Total expenses before reductions | 24,353,765 | |
| Expense reductions | (104,464) | |
| Total expenses after reductions | | 24,249,301 |
| Net investment income (loss) | | 3,238,387 |
| Realized and Unrealized Gain (Loss) | | |
| Net realized gain (loss) on: | | |
| Investment securities: | | |
| Unaffiliated issuers | 155,728,982 | |
| Fidelity Central Funds | (712) | |
| Foreign currency transactions | 16,155 | |
| Total net realized gain (loss) | | 155,744,425 |
| Change in net unrealized appreciation (depreciation) on: | | |
| Investment securities: | | |
| Unaffiliated issuers | 211,704,269 | |
| Fidelity Central Funds | 686 | |
| Assets and liabilities in foreign currencies | (2,003) | |
| Total change in net unrealized appreciation (depreciation) | | 211,702,952 |
| Net gain (loss) | | 367,447,377 |
| Net increase (decrease) in net assets resulting from operations | | $370,685,764 |
See accompanying notes which are an integral part of the financial statements.
Statement of Changes in Net Assets
| | Year ended October 31, 2019 | Year ended October 31, 2018 |
| Increase (Decrease) in Net Assets | | |
| Operations | | |
| Net investment income (loss) | $3,238,387 | $1,431,762 |
| Net realized gain (loss) | 155,744,425 | 321,407,359 |
| Change in net unrealized appreciation (depreciation) | 211,702,952 | (85,711,564) |
| Net increase (decrease) in net assets resulting from operations | 370,685,764 | 237,127,557 |
| Distributions to shareholders | (294,260,663) | (104,368,754) |
| Share transactions | | |
| Proceeds from sales of shares | 998,501,069 | 620,156,191 |
| Reinvestment of distributions | 281,328,969 | 99,419,534 |
| Cost of shares redeemed | (665,247,094) | (308,013,762) |
| Net increase (decrease) in net assets resulting from share transactions | 614,582,944 | 411,561,963 |
| Total increase (decrease) in net assets | 691,008,045 | 544,320,766 |
| Net Assets | | |
| Beginning of period | 2,262,099,982 | 1,717,779,216 |
| End of period | $2,953,108,027 | $2,262,099,982 |
| Other Information | | |
| Shares | | |
| Sold | 41,369,223 | 24,445,946 |
| Issued in reinvestment of distributions | 12,994,409 | 4,408,849 |
| Redeemed | (27,830,055) | (12,373,746) |
| Net increase (decrease) | 26,533,577 | 16,481,049 |
See accompanying notes which are an integral part of the financial statements.
Financial Highlights
Fidelity Focused Stock Fund
| | | | | | |
| Years ended October 31, | 2019 | 2018 | 2017 | 2016 | 2015 |
| Selected Per–Share Data | | | | | |
| Net asset value, beginning of period | $25.23 | $23.48 | $18.63 | $19.08 | $20.74 |
| Income from Investment Operations | | | | | |
| Net investment income (loss)A | .03 | .02 | .13 | .09 | .04 |
| Net realized and unrealized gain (loss) | 3.23 | 3.17 | 4.92 | .52 | .24 |
| Total from investment operations | 3.26 | 3.19 | 5.05 | .61 | .28 |
| Distributions from net investment income | (.03) | (.09)B | (.10) | (.05) | (.02) |
| Distributions from net realized gain | (3.04) | (1.35)B | (.10) | (1.02) | (1.92) |
| Total distributions | (3.07) | (1.44) | (.20) | (1.06)C | (1.94) |
| Net asset value, end of period | $25.42 | $25.23 | $23.48 | $18.63 | $19.08 |
| Total ReturnD | 15.05% | 14.30% | 27.37% | 3.31% | 1.33% |
| Ratios to Average Net AssetsE,F | | | | | |
| Expenses before reductions | .89% | .82% | .57% | .62% | .73% |
| Expenses net of fee waivers, if any | .89% | .82% | .57% | .62% | .72% |
| Expenses net of all reductions | .89% | .81% | .57% | .62% | .72% |
| Net investment income (loss) | .12% | .07% | .63% | .50% | .18% |
| Supplemental Data | | | | | |
| Net assets, end of period (000 omitted) | $2,953,108 | $2,262,100 | $1,717,779 | $1,602,487 | $1,896,753 |
| Portfolio turnover rateG | 152% | 138% | 121% | 141% | 189%H |
A Calculated based on average shares outstanding during the period.
B The amounts shown reflect certain reclassifications related to book to tax differences that were made in the year shown.
C Total distributions of $1.06 per share is comprised of distributions from net investment income of $.045 and distributions from net realized gain of $1.017 per share.
D Total returns would have been lower if certain expenses had not been reduced during the applicable periods shown.
E Fees and expenses of any underlying Fidelity Central Funds are not included in the Fund's expense ratio. The Fund indirectly bears its proportionate share of the expenses of any underlying Fidelity Central Funds.
F Expense ratios reflect operating expenses of the Fund. Expenses before reductions do not reflect amounts reimbursed by the investment adviser or reductions from brokerage service arrangements or reductions from other expense offset arrangements and do not represent the amount paid by the Fund during periods when reimbursements or reductions occur. Expenses net of fee waivers reflect expenses after reimbursement by the investment adviser but prior to reductions from brokerage service arrangements or other expense offset arrangements. Expenses net of all reductions represent the net expenses paid by the Fund.
G Amount does not include the portfolio activity of any underlying Fidelity Central Funds.
H The portfolio turnover rate does not include the assets acquired in the merger.
See accompanying notes which are an integral part of the financial statements.
Notes to Financial Statements
For the period ended October 31, 2019
1. Organization.
Fidelity Focused Stock Fund (the Fund) is a fund of Fidelity Capital Trust (the Trust) and is authorized to issue an unlimited number of shares. Share transactions on the Statement of Changes in Net Assets may contain exchanges between affiliated funds. The Trust is registered under the Investment Company Act of 1940, as amended (the 1940 Act), as an open-end management investment company organized as a Massachusetts business trust.
2. Investments in Fidelity Central Funds.
The Fund invests in Fidelity Central Funds, which are open-end investment companies generally available only to other investment companies and accounts managed by the investment adviser and its affiliates. The Fund's Schedule of Investments lists each of the Fidelity Central Funds held as of period end, if any, as an investment of the Fund, but does not include the underlying holdings of each Fidelity Central Fund. As an Investing Fund, the Fund indirectly bears its proportionate share of the expenses of the underlying Fidelity Central Funds.
The Money Market Central Funds seek preservation of capital and current income and are managed by Fidelity Investments Money Management, Inc. (FIMM), an affiliate of the investment adviser. Annualized expenses of the Money Market Central Funds as of their most recent shareholder report date ranged from less than .005% to .01%.
A complete unaudited list of holdings for each Fidelity Central Fund is available upon request or at the Securities and Exchange Commission (the SEC) website at www.sec.gov. In addition, the financial statements of the Fidelity Central Funds, which are not covered by the Fund's Report of Independent Registered Public Accounting Firm, are available on the SEC website or upon request.
3. Significant Accounting Policies.
The Fund is an investment company and applies the accounting and reporting guidance of the Financial Accounting Standards Board (FASB) Accounting Standards Codification Topic 946 Financial Services – Investments Companies. The financial statements have been prepared in conformity with accounting principles generally accepted in the United States of America (GAAP), which require management to make certain estimates and assumptions at the date of the financial statements. Actual results could differ from those estimates. Subsequent events, if any, through the date that the financial statements were issued have been evaluated in the preparation of the financial statements. The following summarizes the significant accounting policies of the Fund:
Investment Valuation. Investments are valued as of 4:00 p.m. Eastern time on the last calendar day of the period. The Board of Trustees (the Board) has delegated the day to day responsibility for the valuation of the Fund's investments to the Fair Value Committee (the Committee) established by the Fund's investment adviser. In accordance with valuation policies and procedures approved by the Board, the Fund attempts to obtain prices from one or more third party pricing vendors or brokers to value its investments. When current market prices, quotations or currency exchange rates are not readily available or reliable, investments will be fair valued in good faith by the Committee, in accordance with procedures adopted by the Board. Factors used in determining fair value vary by investment type and may include market or investment specific events. The frequency with which these procedures are used cannot be predicted and they may be utilized to a significant extent. The Committee oversees the Fund's valuation policies and procedures and reports to the Board on the Committee's activities and fair value determinations. The Board monitors the appropriateness of the procedures used in valuing the Fund's investments and ratifies the fair value determinations of the Committee.
The Fund categorizes the inputs to valuation techniques used to value its investments into a disclosure hierarchy consisting of three levels as shown below:
- Level 1 – quoted prices in active markets for identical investments
- Level 2 – other significant observable inputs (including quoted prices for similar investments, interest rates, prepayment speeds, etc.)
- Level 3 – unobservable inputs (including the Fund's own assumptions based on the best information available)
Valuation techniques used to value the Fund's investments by major category are as follows:
Equity securities, including restricted securities, for which market quotations are readily available, are valued at the last reported sale price or official closing price as reported by a third party pricing vendor on the primary market or exchange on which they are traded and are categorized as Level 1 in the hierarchy. In the event there were no sales during the day or closing prices are not available, securities are valued at the last quoted bid price or may be valued using the last available price and are generally categorized as Level 2 in the hierarchy. For foreign equity securities, when market or security specific events arise, comparisons to the valuation of American Depositary Receipts (ADRs), futures contracts, Exchange-Traded Funds (ETFs) and certain indexes as well as quoted prices for similar securities may be used and would be categorized as Level 2 in the hierarchy. For equity securities, including restricted securities, where observable inputs are limited, assumptions about market activity and risk are used and these securities may be categorized as Level 3 in the hierarchy.
Investments in open-end mutual funds, including the Fidelity Central Funds, are valued at their closing net asset value (NAV) each business day and are categorized as Level 1 in the hierarchy.
Changes in valuation techniques may result in transfers in or out of an assigned level within the disclosure hierarchy.
Foreign Currency. The Fund may use foreign currency contracts to facilitate transactions in foreign-denominated securities. Gains and losses from these transactions may arise from changes in the value of the foreign currency or if the counterparties do not perform under the contracts' terms.
Foreign-denominated assets, including investment securities, and liabilities are translated into U.S. dollars at the exchange rates at period end. Purchases and sales of investment securities, income and dividends received and expenses denominated in foreign currencies are translated into U.S. dollars at the exchange rate in effect on the transaction date.
The effects of exchange rate fluctuations on investments are included with the net realized and unrealized gain (loss) on investment securities. Other foreign currency transactions resulting in realized and unrealized gain (loss) are disclosed separately.
Investment Transactions and Income. For financial reporting purposes, the Fund's investment holdings and NAV include trades executed through the end of the last business day of the period. The NAV per share for processing shareholder transactions is calculated as of the close of business of the New York Stock Exchange (NYSE), normally 4:00 p.m. Eastern time and includes trades executed through the end of the prior business day. Gains and losses on securities sold are determined on the basis of identified cost and include proceeds received from litigation. Dividend income is recorded on the ex-dividend date, except for certain dividends from foreign securities where the ex-dividend date may have passed, which are recorded as soon as the Fund is informed of the ex-dividend date. Non-cash dividends included in dividend income, if any, are recorded at the fair market value of the securities received. Income and capital gain distributions from Fidelity Central Funds, if any, are recorded on the ex-dividend date. Certain distributions received by the Fund represent a return of capital or capital gain. The Fund determines the components of these distributions subsequent to the ex-dividend date, based upon receipt of tax filings or other correspondence relating to the underlying investment. These distributions are recorded as a reduction of cost of investments and/or as a realized gain. Investment income is recorded net of foreign taxes withheld where recovery of such taxes is uncertain.
Expenses. Expenses directly attributable to a fund are charged to that fund. Expenses attributable to more than one fund are allocated among the respective funds on the basis of relative net assets or other appropriate methods. Expense estimates are accrued in the period to which they relate and adjustments are made when actual amounts are known.
Income Tax Information and Distributions to Shareholders. Each year, the Fund intends to qualify as a regulated investment company under Subchapter M of the Internal Revenue Code, including distributing substantially all of its taxable income and realized gains. As a result, no provision for U.S. Federal income taxes is required. As of October 31, 2019, the Fund did not have any unrecognized tax benefits in the financial statements; nor is the Fund aware of any tax positions for which it is reasonably possible that the total amounts of unrecognized tax benefits will significantly change in the next twelve months. The Fund files a U.S. federal tax return, in addition to state and local tax returns as required. The Fund's federal income tax returns are subject to examination by the Internal Revenue Service (IRS) for a period of three fiscal years after they are filed. State and local tax returns may be subject to examination for an additional fiscal year depending on the jurisdiction. Foreign taxes are provided for based on the Fund's understanding of the tax rules and rates that exist in the foreign markets in which it invests. The Fund is subject to a tax imposed on capital gains by certain countries in which it invests.
Distributions are declared and recorded on the ex-dividend date. Income and capital gain distributions are determined in accordance with income tax regulations, which may differ from GAAP. In addition, the Fund certain Funds claimed a portion of the payment made to redeeming shareholders as a distribution for income tax purposes.
Capital accounts within the financial statements are adjusted for permanent book-tax differences. These adjustments have no impact on net assets or the results of operations. Capital accounts are not adjusted for temporary book-tax differences which will reverse in a subsequent period.
Book-tax differences are primarily due to foreign currency transactions, certain foreign taxes and losses deferred due to wash sales.
As of period end, the cost and unrealized appreciation (depreciation) in securities, and derivatives if applicable, for federal income tax purposes were as follows:
| Gross unrealized appreciation | $601,528,717 |
| Gross unrealized depreciation | (16,833,777) |
| Net unrealized appreciation (depreciation) | $584,694,940 |
| Tax Cost | $2,388,478,166 |
The tax-based components of distributable earnings as of period end were as follows:
| Undistributed ordinary income | $11,189,596 |
| Undistributed long-term capital gain | $131,978,012 |
| Net unrealized appreciation (depreciation) on securities and other investments | $584,693,930 |
The tax character of distributions paid was as follows:
| | October 31, 2019 | October 31, 2018 |
| Ordinary Income | $2,682,064 | $ 30,743,722 |
| Long-term Capital Gains | 291,578,599 | 73,625,032 |
| Total | $294,260,663 | $ 104,368,754 |
4. Purchases and Sales of Investments.
Purchases and sales of securities, other than short-term securities, aggregated $4,279,524,298 and $4,021,536,980, respectively.
5. Fees and Other Transactions with Affiliates.
Management Fee. Fidelity Management & Research Company (the investment adviser) and its affiliates provide the Fund with investment management related services for which the Fund pays a monthly management fee. The management fee is the sum of an individual fund fee rate that is based on an annual rate of .30% of the Fund's average net assets and an annualized group fee rate that averaged .24% during the period. The group fee rate is based upon the average net assets of all the mutual funds advised by the investment adviser, including any mutual funds previously advised by the investment adviser that are currently advised by Fidelity SelectCo, LLC, an affiliate of the investment adviser. The group fee rate decreases as assets under management increase and increases as assets under management decrease. In addition, the management fee is subject to a performance adjustment (up to a maximum of +/- .20% of the Fund's average net assets over a 36 month performance period). The upward or downward adjustment to the management fee is based on the Fund's relative investment performance as compared to its benchmark index, the S&P 500 Index, over the same 36 month performance period. For the reporting period, the total annual management fee rate, including the performance adjustment, was .68% of the Fund's average net assets. The performance adjustment included in the management fee rate may be higher or lower than the maximum performance adjustment rate due to the difference between the average net assets for the reporting and performance periods.
Transfer Agent Fees. Fidelity Investments Institutional Operations Company, Inc. (FIIOC), an affiliate of the investment adviser, is the Fund's transfer, dividend disbursing and shareholder servicing agent. FIIOC receives account fees and asset-based fees that vary according to account size and type of account. FIIOC pays for typesetting, printing and mailing of shareholder reports, except proxy statements. For the period, the transfer agent fees were equivalent to an annual rate of .17% of average net assets.
Accounting and Security Lending Fees. Fidelity Service Company, Inc. (FSC), an affiliate of the investment adviser, maintains the Fund's accounting records. The accounting fee is based on the level of average net assets for each month. Prior to April 1, 2019, FSC had a separate agreement with the Fund for administration of the security lending program, based on the number and duration of lending transactions. For the period, the total fees paid for accounting and administration of securities lending were equivalent to an annual rate of .03%.
Brokerage Commissions. The Fund placed a portion of its portfolio transactions with brokerage firms which are affiliates of the investment adviser. Brokerage commissions are included in net realized gain (loss) and change in net unrealized appreciation (depreciation) in the Statement of Operations. The commissions paid to these affiliated firms were $69,880 for the period.
Interfund Trades. The Fund may purchase from or sell securities to other Fidelity Funds under procedures adopted by the Board. The procedures have been designed to ensure these interfund trades are executed in accordance with Rule 17a-7 of the 1940 Act. Interfund trades are included within the respective purchases and sales amounts shown in the Purchases and Sales of Investments note.
6. Committed Line of Credit.
The Fund participates with other funds managed by the investment adviser or an affiliate in a $4.25 billion credit facility (the "line of credit") to be utilized for temporary or emergency purposes to fund shareholder redemptions or for other short-term liquidity purposes. The Fund has agreed to pay commitment fees on its pro-rata portion of the line of credit, which amounted to $7,057 and is reflected in Miscellaneous expenses on the Statement of Operations. During the period, the Fund did not borrow on this line of credit.
7. Security Lending.
The Fund lends portfolio securities from time to time in order to earn additional income. For equity securities, lending agents are used, including National Financial Services (NFS), an affiliate of the Fund. Pursuant to a securities lending agreement, NFS will receive a fee, which is capped at 9.9% of daily lending revenue, for its services as lending agent. The Fund may lend securities to certain qualified borrowers, including NFS. On the settlement date of the loan, the Fund receives collateral (in the form of U.S. Treasury obligations, letters of credit and/or cash) against the loaned securities and maintains collateral in an amount not less than 100% of the market value of the loaned securities during the period of the loan. The market value of the loaned securities is determined at the close of business of the Fund and any additional required collateral is delivered to the Fund on the next business day. The Fund or borrower may terminate the loan at any time, and if the borrower defaults on its obligation to return the securities loaned because of insolvency or other reasons, the Fund may apply collateral received from the borrower against the obligation. The Fund may experience delays and costs in recovering the securities loaned. Any cash collateral received is invested in the Fidelity Securities Lending Cash Central Fund. At period end, there were no security loans outstanding. Total fees paid by the Fund to NFS, as lending agent, amounted to $2,477. Security lending income represents the income earned on investing cash collateral, less rebates paid to borrowers and any lending agent fees associated with the loan, plus any premium payments received for lending certain types of securities. Security lending income is presented in the Statement of Operations as a component of income from Fidelity Central Funds. During the period, there were no securities loaned to NFS.
8. Expense Reductions.
Commissions paid to certain brokers with whom the investment adviser, or its affiliates, places trades on behalf of the Fund include an amount in addition to trade execution, which may be rebated back to the Fund to offset certain expenses. This amount totaled $83,781 for the period. In addition, through arrangements with the Fund's custodian, credits realized as a result of certain uninvested cash balances were used to reduce the Fund's expenses by $2,288.
In addition, during the period the investment adviser reimbursed and/or waived a portion of operating expenses in the amount of $18,395.
9. Other.
The Fund's organizational documents provide former and current trustees and officers with a limited indemnification against liabilities arising in connection with the performance of their duties to the Fund. In the normal course of business, the Fund may also enter into contracts that provide general indemnifications. The Fund's maximum exposure under these arrangements is unknown as this would be dependent on future claims that may be made against the Fund. The risk of material loss from such claims is considered remote.
Report of Independent Registered Public Accounting Firm
To the Board of Trustees of Fidelity Capital Trust and Shareholders of Fidelity Focused Stock Fund:
Opinion on the Financial Statements
We have audited the accompanying statement of assets and liabilities, including the schedule of investments, of Fidelity Focused Stock Fund (one of the funds constituting Fidelity Capital Trust, referred to hereafter as the “Fund”) as of October 31, 2019, the related statement of operations for the year ended October 31, 2019, the statement of changes in net assets for each of the two years in the period ended October 31, 2019, including the related notes, and the financial highlights for each of the five years in the period ended October 31, 2019 (collectively referred to as the “financial statements”). In our opinion, the financial statements present fairly, in all material respects, the financial position of the Fund as of October 31, 2019, the results of its operations for the year then ended, the changes in its net assets for each of the two years in the period ended October 31, 2019 and the financial highlights for each of the five years in the period ended October 31, 2019 in conformity with accounting principles generally accepted in the United States of America.
Basis for Opinion
These financial statements are the responsibility of the Fund’s management. Our responsibility is to express an opinion on the Fund’s financial statements based on our audits. We are a public accounting firm registered with the Public Company Accounting Oversight Board (United States) (PCAOB) and are required to be independent with respect to the Fund in accordance with the U.S. federal securities laws and the applicable rules and regulations of the Securities and Exchange Commission and the PCAOB.
We conducted our audits of these financial statements in accordance with the standards of the PCAOB. Those standards require that we plan and perform the audit to obtain reasonable assurance about whether the financial statements are free of material misstatement, whether due to error or fraud.
Our audits included performing procedures to assess the risks of material misstatement of the financial statements, whether due to error or fraud, and performing procedures that respond to those risks. Such procedures included examining, on a test basis, evidence regarding the amounts and disclosures in the financial statements. Our audits also included evaluating the accounting principles used and significant estimates made by management, as well as evaluating the overall presentation of the financial statements. Our procedures included confirmation of securities owned as of October 31, 2019 by correspondence with the custodian and brokers; when replies were not received from brokers, we performed other auditing procedures. We believe that our audits provide a reasonable basis for our opinion.
PricewaterhouseCoopers LLP
Boston, Massachusetts
December 11, 2019
We have served as the auditor of one or more investment companies in the Fidelity group of funds since 1932.
Trustees and Officers
The Trustees, Members of the Advisory Board (if any), and officers of the trust and fund, as applicable, are listed below. The Board of Trustees governs the fund and is responsible for protecting the interests of shareholders. The Trustees are experienced executives who meet periodically throughout the year to oversee the fund's activities, review contractual arrangements with companies that provide services to the fund, oversee management of the risks associated with such activities and contractual arrangements, and review the fund's performance. Except for Michael E. Wiley, each of the Trustees oversees 298 funds. Mr. Wiley oversees 197 funds.
The Trustees hold office without limit in time except that (a) any Trustee may resign; (b) any Trustee may be removed by written instrument, signed by at least two-thirds of the number of Trustees prior to such removal; (c) any Trustee who requests to be retired or who has become incapacitated by illness or injury may be retired by written instrument signed by a majority of the other Trustees; and (d) any Trustee may be removed at any special meeting of shareholders by a two-thirds vote of the outstanding voting securities of the trust. Each Trustee who is not an interested person (as defined in the 1940 Act) of the trust and the fund is referred to herein as an Independent Trustee. Each Independent Trustee shall retire not later than the last day of the calendar year in which his or her 75th birthday occurs. The Independent Trustees may waive this mandatory retirement age policy with respect to individual Trustees. Officers and Advisory Board Members hold office without limit in time, except that any officer or Advisory Board Member may resign or may be removed by a vote of a majority of the Trustees at any regular meeting or any special meeting of the Trustees. Except as indicated, each individual has held the office shown or other offices in the same company for the past five years.
The fund’s Statement of Additional Information (SAI) includes more information about the Trustees. To request a free copy, call Fidelity at 1-800-544-8544.
Experience, Skills, Attributes, and Qualifications of the Trustees. The Governance and Nominating Committee has adopted a statement of policy that describes the experience, qualifications, attributes, and skills that are necessary and desirable for potential Independent Trustee candidates (Statement of Policy). The Board believes that each Trustee satisfied at the time he or she was initially elected or appointed a Trustee, and continues to satisfy, the standards contemplated by the Statement of Policy. The Governance and Nominating Committee also engages professional search firms to help identify potential Independent Trustee candidates who have the experience, qualifications, attributes, and skills consistent with the Statement of Policy. From time to time, additional criteria based on the composition and skills of the current Independent Trustees, as well as experience or skills that may be appropriate in light of future changes to board composition, business conditions, and regulatory or other developments, have also been considered by the professional search firms and the Governance and Nominating Committee. In addition, the Board takes into account the Trustees' commitment and participation in Board and committee meetings, as well as their leadership of standing and ad hoc committees throughout their tenure.
In determining that a particular Trustee was and continues to be qualified to serve as a Trustee, the Board has considered a variety of criteria, none of which, in isolation, was controlling. The Board believes that, collectively, the Trustees have balanced and diverse experience, qualifications, attributes, and skills, which allow the Board to operate effectively in governing the fund and protecting the interests of shareholders. Information about the specific experience, skills, attributes, and qualifications of each Trustee, which in each case led to the Board's conclusion that the Trustee should serve (or continue to serve) as a trustee of the fund, is provided below.
Board Structure and Oversight Function. James C. Curvey is an interested person and currently serves as Chairman. The Trustees have determined that an interested Chairman is appropriate and benefits shareholders because an interested Chairman has a personal and professional stake in the quality and continuity of services provided to the fund. Independent Trustees exercise their informed business judgment to appoint an individual of their choosing to serve as Chairman, regardless of whether the Trustee happens to be independent or a member of management. The Independent Trustees have determined that they can act independently and effectively without having an Independent Trustee serve as Chairman and that a key structural component for assuring that they are in a position to do so is for the Independent Trustees to constitute a substantial majority for the Board. The Independent Trustees also regularly meet in executive session. Ned C. Lautenbach serves as Chairman of the Independent Trustees and as such (i) acts as a liaison between the Independent Trustees and management with respect to matters important to the Independent Trustees and (ii) with management prepares agendas for Board meetings.
Fidelity® funds are overseen by different Boards of Trustees. The fund's Board oversees Fidelity's high income and certain equity funds, and other Boards oversee Fidelity's investment-grade bond, money market, asset allocation, and other equity funds. The asset allocation funds may invest in Fidelity® funds overseen by the fund's Board. The use of separate Boards, each with its own committee structure, allows the Trustees of each group of Fidelity® funds to focus on the unique issues of the funds they oversee, including common research, investment, and operational issues. On occasion, the separate Boards establish joint committees to address issues of overlapping consequences for the Fidelity® funds overseen by each Board.
The Trustees operate using a system of committees to facilitate the timely and efficient consideration of all matters of importance to the Trustees, the fund, and fund shareholders and to facilitate compliance with legal and regulatory requirements and oversight of the fund's activities and associated risks. The Board, acting through its committees, has charged FMR and its affiliates with (i) identifying events or circumstances the occurrence of which could have demonstrably adverse effects on the fund's business and/or reputation; (ii) implementing processes and controls to lessen the possibility that such events or circumstances occur or to mitigate the effects of such events or circumstances if they do occur; and (iii) creating and maintaining a system designed to evaluate continuously business and market conditions in order to facilitate the identification and implementation processes described in (i) and (ii) above. Because the day-to-day operations and activities of the fund are carried out by or through FMR, its affiliates, and other service providers, the fund's exposure to risks is mitigated but not eliminated by the processes overseen by the Trustees. While each of the Board's committees has responsibility for overseeing different aspects of the fund's activities, oversight is exercised primarily through the Operations, Audit, and Compliance Committees. Appropriate personnel, including but not limited to the fund's Chief Compliance Officer (CCO), FMR's internal auditor, the independent accountants, the fund's Treasurer and portfolio management personnel, make periodic reports to the Board's committees, as appropriate, including an annual review of Fidelity's risk management program for the Fidelity® funds. The responsibilities of each standing committee, including their oversight responsibilities, are described further under "Standing Committees of the Trustees."
Interested Trustees*:
Correspondence intended for a Trustee who is an interested person may be sent to Fidelity Investments, 245 Summer Street, Boston, Massachusetts 02210.
Name, Year of Birth; Principal Occupations and Other Relevant Experience+
James C. Curvey (1935)
Year of Election or Appointment: 2007
Trustee
Chairman of the Board of Trustees
Mr. Curvey also serves as Trustee of other Fidelity® funds. Mr. Curvey is Vice Chairman (2007-present) and Director of FMR LLC (diversified financial services company). In addition, Mr. Curvey is an Overseer Emeritus for the Boston Symphony Orchestra, a Director of Artis-Naples, and a Trustee of Brewster Academy in Wolfeboro, New Hampshire. Previously, Mr. Curvey served as a Director of Fidelity Research & Analysis Co. (investment adviser firm, 2009-2018), Director of Fidelity Investments Money Management, Inc. (investment adviser firm, 2009-2014) and a Director of FMR and FMR Co., Inc. (investment adviser firms, 2007-2014).
* Determined to be an “Interested Trustee” by virtue of, among other things, his or her affiliation with the trust or various entities under common control with FMR.
+ The information includes the Trustee's principal occupation during the last five years and other information relating to the experience, attributes, and skills relevant to the Trustee's qualifications to serve as a Trustee, which led to the conclusion that the Trustee should serve as a Trustee for the fund.
Independent Trustees:
Correspondence intended for an Independent Trustee may be sent to Fidelity Investments, P.O. Box 55235, Boston, Massachusetts 02205-5235.
Name, Year of Birth; Principal Occupations and Other Relevant Experience+
Dennis J. Dirks (1948)
Year of Election or Appointment: 2005
Trustee
Mr. Dirks also serves as Trustee of other Fidelity® funds. Prior to his retirement in May 2003, Mr. Dirks was Chief Operating Officer and a member of the Board of The Depository Trust & Clearing Corporation (DTCC). He also served as President, Chief Operating Officer, and Board member of The Depository Trust Company (DTC) and President and Board member of the National Securities Clearing Corporation (NSCC). In addition, Mr. Dirks served as Chief Executive Officer and Board member of the Government Securities Clearing Corporation, Chief Executive Officer and Board member of the Mortgage-Backed Securities Clearing Corporation, as a Trustee and a member of the Finance Committee of Manhattan College (2005-2008), as a Trustee and a member of the Finance Committee of AHRC of Nassau County (2006-2008), as a member of the Independent Directors Council (IDC) Governing Council (2010-2015), and as a member of the Board of Directors for The Brookville Center for Children’s Services, Inc. (2009-2017). Mr. Dirks is a member of the Finance Committee (2016-present) and Board of Directors (2017-present) and is Treasurer (2018-present) of the Asolo Repertory Theatre.
Donald F. Donahue (1950)
Year of Election or Appointment: 2018
Trustee
Mr. Donahue also serves as a Trustee of other Fidelity® funds. Mr. Donahue is President and Chief Executive Officer of Miranda Partners, LLC (risk consulting for the financial services industry, 2012-present). Previously, Mr. Donahue served as a Member of the Advisory Board of certain Fidelity® funds (2015-2018) and Chief Executive Officer (2006-2012), Chief Operating Officer (2003-2006), and Managing Director, Customer Marketing and Development (1999-2003) of The Depository Trust & Clearing Corporation (financial markets infrastructure). Mr. Donahue serves as a Member (2007-present) and Co-Chairman (2016-present) of the Board of Directors of United Way of New York, Member of the Board of Directors of NYC Leadership Academy (2012-present) and Member of the Board of Advisors of Ripple Labs, Inc. (financial services, 2015-present). He also served as Chairman (2010-2012) and Member of the Board of Directors (2012-2013) of Omgeo, LLC (financial services), Treasurer of United Way of New York (2012-2016), and Member of the Board of Directors of XBRL US (financial services non-profit, 2009-2012) and the International Securities Services Association (2009-2012).
Alan J. Lacy (1953)
Year of Election or Appointment: 2008
Trustee
Mr. Lacy also serves as Trustee of other Fidelity® funds. Mr. Lacy serves as a Director of Bristol-Myers Squibb Company (global pharmaceuticals, 2008-present). He is a Trustee of the California Chapter of The Nature Conservancy (2015-present) and a Director of the Center for Advanced Study in the Behavioral Sciences at Stanford University (2015-present). In addition, Mr. Lacy served as Senior Adviser (2007-2014) of Oak Hill Capital Partners, L.P. (private equity) and also served as Chief Executive Officer (2005) and Vice Chairman (2005-2006) of Sears Holdings Corporation (retail) and Chief Executive Officer and Chairman of the Board of Sears, Roebuck and Co. (retail, 2000-2005). Previously, Mr. Lacy served as Chairman (2014-2017) and a member (2010-2017) of the Board of Directors of Dave & Buster’s Entertainment, Inc. (restaurant and entertainment complexes), as Chairman (2008-2011) and a member (2006-2015) of the Board of Trustees of the National Parks Conservation Association, and as a member of the Board of Directors for The Hillman Companies, Inc. (hardware wholesalers, 2010-2014), Earth Fare, Inc. (retail grocery, 2010-2014), and The Western Union Company (global money transfer, 2006-2011).
Ned C. Lautenbach (1944)
Year of Election or Appointment: 2000
Trustee
Chairman of the Independent Trustees
Mr. Lautenbach also serves as Trustee of other Fidelity® funds. Mr. Lautenbach currently serves as Chair (2018-present) and Member (2013-present) of the Board of Governors, State University System of Florida and is a member of the Council on Foreign Relations (1994-present). He is also a member and has most recently served as Chairman of the Board of Directors of Artis-Naples (2012-present). Previously, Mr. Lautenbach served as a member and then Lead Director of the Board of Directors of Eaton Corporation (diversified industrial, 1997-2016). He was also a Partner and Advisory Partner at Clayton, Dubilier & Rice, LLC (private equity investment, 1998-2010), as well as a Director of Sony Corporation (2006-2007). In addition, Mr. Lautenbach also had a 30-year career with IBM (technology company) during which time he served as Senior Vice President and a member of the Corporate Executive Committee (1968-1998).
Joseph Mauriello (1944)
Year of Election or Appointment: 2008
Trustee
Mr. Mauriello also serves as Trustee of other Fidelity® funds. Prior to his retirement in January 2006, Mr. Mauriello served in numerous senior management positions including Deputy Chairman and Chief Operating Officer (2004-2005), and Vice Chairman of Financial Services (2002-2004) of KPMG LLP US (professional services, 1965-2005). Mr. Mauriello currently serves as a member of the Independent Directors Council (IDC) Governing Council (2015-present). Previously, Mr. Mauriello served as a member of the Board of Directors of XL Group plc. (global insurance and re-insurance, 2006-2018).
Cornelia M. Small (1944)
Year of Election or Appointment: 2005
Trustee
Ms. Small also serves as Trustee of other Fidelity® funds. Ms. Small is a member of the Board of Directors (2009-present) and Chair of the Investment Committee (2010-present) of the Teagle Foundation. Ms. Small also serves on the Investment Committee of the Berkshire Taconic Community Foundation (2008-present). Previously, Ms. Small served as Chairperson (2002-2008) and a member of the Investment Committee and Chairperson (2008-2012) and a member of the Board of Trustees of Smith College. In addition, Ms. Small served as Chief Investment Officer, Director of Global Equity Investments, and a member of the Board of Directors of Scudder, Stevens & Clark and Scudder Kemper Investments.
Garnett A. Smith (1947)
Year of Election or Appointment: 2018
Trustee
Mr. Smith also serves as Trustee of other Fidelity® funds. Prior to Mr. Smith's retirement, he served as Chairman and Chief Executive Officer of Inbrand Corp. (manufacturer of personal absorbent products, 1990-1997). He also served as President (1986-1990) of Inbrand Corp. Prior to his employment with Inbrand Corp., he was employed by a retail fabric chain and North Carolina National Bank. In addition, Mr. Smith served as a Member of the Advisory Board of certain Fidelity® funds (2012-2013) and as a board member of the Jackson Hole Land Trust (2009-2012).
David M. Thomas (1949)
Year of Election or Appointment: 2008
Trustee
Mr. Thomas also serves as Trustee of other Fidelity® funds. Mr. Thomas serves as Non-Executive Chairman of the Board of Directors of Fortune Brands Home and Security (home and security products, 2011-present) and as a member of the Board of Directors (2004-present) and Presiding Director (2013-present) of Interpublic Group of Companies, Inc. (marketing communication). Previously, Mr. Thomas served as Executive Chairman (2005-2006) and Chairman and Chief Executive Officer (2000-2005) of IMS Health, Inc. (pharmaceutical and healthcare information solutions), a Director of Fortune Brands, Inc. (consumer products, 2000-2011), and a member of the Board of Trustees of the University of Florida (2013-2018).
Michael E. Wiley (1950)
Year of Election or Appointment: 2018
Trustee
Mr. Wiley also serves as Trustee or Member of the Advisory Board of other Fidelity® funds. Mr. Wiley serves as a Director of High Point Resources (exploration and production, 2005-present). Previously, Mr. Wiley served as a Director of Andeavor Corporation (independent oil refiner and marketer, 2005-2018), a Director of Andeavor Logistics LP (natural resources logistics, 2015-2018), a Director of Post Oak Bank (privately-held bank, 2004-2018), a Director of Asia Pacific Exploration Consolidated (international oil and gas exploration and production, 2008-2013), a member of the Board of Trustees of the University of Tulsa (2000-2006; 2007-2010), a Senior Energy Advisor of Katzenbach Partners, LLC (consulting, 2006-2007), an Advisory Director of Riverstone Holdings (private investment), a Director of Spinnaker Exploration Company (exploration and production, 2001-2005) and Chairman, President, and CEO of Baker Hughes, Inc. (oilfield services, 2000-2004).
+ The information includes the Trustee's principal occupation during the last five years and other information relating to the experience, attributes, and skills relevant to the Trustee's qualifications to serve as a Trustee, which led to the conclusion that the Trustee should serve as a Trustee for the fund.
Advisory Board Members and Officers:
Correspondence intended for a Member of the Advisory Board (if any) may be sent to Fidelity Investments, P.O. Box 55235, Boston, Massachusetts 02205-5235. Correspondence intended for an officer or Peter S. Lynch may be sent to Fidelity Investments, 245 Summer Street, Boston, Massachusetts 02210. Officers appear below in alphabetical order.
Name, Year of Birth; Principal Occupation
Vicki L. Fuller (1957)
Year of Election or Appointment: 2018
Member of the Advisory Board
Ms. Fuller also serves as Member of the Advisory Board of other Fidelity® funds. Ms. Fuller serves as a member of the Board of Directors, Audit Committee, and Nominating and Governance Committee of The Williams Companies, Inc. (natural gas infrastructure, 2018-present). Previously, Ms. Fuller served as the Chief Investment Officer of the New York State Common Retirement Fund (2012-2018) and held a variety of positions at AllianceBernstein L.P. (global asset management, 1985-2012), including Managing Director (2006-2012) and Senior Vice President and Senior Portfolio Manager (2001-2006).
Peter S. Lynch (1944)
Year of Election or Appointment: 2003
Member of the Advisory Board
Mr. Lynch also serves as Member of the Advisory Board of other Fidelity® funds. Mr. Lynch is Vice Chairman and a Director of FMR (investment adviser firm) and FMR Co., Inc. (investment adviser firm). In addition, Mr. Lynch serves as a Trustee of Boston College and as the Chairman of the Inner-City Scholarship Fund. Previously, Mr. Lynch served on the Special Olympics International Board of Directors (1997-2006).
Elizabeth Paige Baumann (1968)
Year of Election or Appointment: 2017
Anti-Money Laundering (AML) Officer
Ms. Baumann also serves as AML Officer of other funds. She is Chief AML Officer (2012-present) and Senior Vice President (2014-present) of FMR LLC (diversified financial services company) and is an employee of Fidelity Investments. Previously, Ms. Baumann served as AML Officer of the funds (2012-2016), and Vice President (2007-2014) and Deputy Anti-Money Laundering Officer (2007-2012) of FMR LLC.
Craig S. Brown (1977)
Year of Election or Appointment: 2019
Assistant Treasurer
Mr. Brown also serves as Assistant Treasurer of other funds. Mr. Brown is an employee of Fidelity Investments (2013-present).
John J. Burke III (1964)
Year of Election or Appointment: 2018
Chief Financial Officer
Mr. Burke also serves as Chief Financial Officer of other funds. Mr. Burke serves as Head of Investment Operations for Fidelity Fund and Investment Operations (2018-present) and is an employee of Fidelity Investments (1998-present). Previously Mr. Burke served as head of Asset Management Investment Operations (2012-2018).
William C. Coffey (1969)
Year of Election or Appointment: 2019
Assistant Secretary
Mr. Coffey also serves as Assistant Secretary of other funds. He is Senior Vice President and Deputy General Counsel of FMR LLC (diversified financial services company, 2010-present), and is an employee of Fidelity Investments. Previously, Mr. Coffey served as Secretary and CLO of certain funds (2018-2019); CLO, Secretary, and Senior Vice President of Fidelity Management & Research Company and FMR Co., Inc. (investment adviser firms, 2018-2019); Secretary of Fidelity SelectCo, LLC and Fidelity Investments Money Management, Inc. (investment adviser firms, 2018-2019); CLO of Fidelity Management & Research (Hong Kong) Limited, FMR Investment Management (UK) Limited, and Fidelity Management & Research (Japan) Limited (investment adviser firms, 2018-2019); and Assistant Secretary of certain funds (2009-2018).
Timothy M. Cohen (1969)
Year of Election or Appointment: 2018
Vice President
Mr. Cohen also serves as Vice President of other funds. Mr. Cohen serves as Executive Vice President of Fidelity SelectCo, LLC (2019-present), Co-Head of Equity (2018-present), a Director of Fidelity Management & Research (Japan) Limited (investment adviser firm, 2016-present), and is an employee of Fidelity Investments. Previously, Mr. Cohen served as Head of Global Equity Research (2016-2018), Chief Investment Officer - Equity and a Director of Fidelity Management & Research (U.K.) Inc. (investment adviser firm, 2013-2015) and as a Director of Fidelity Management & Research (Hong Kong) Limited (investment adviser firm, 2017).
Jonathan Davis (1968)
Year of Election or Appointment: 2010
Assistant Treasurer
Mr. Davis also serves as Assistant Treasurer of other funds. Mr. Davis serves as Assistant Treasurer of FMR Capital, Inc. (2017-present) and is an employee of Fidelity Investments. Previously, Mr. Davis served as Vice President and Associate General Counsel of FMR LLC (diversified financial services company, 2003-2010).
Adrien E. Deberghes (1967)
Year of Election or Appointment: 2016
Assistant Treasurer
Mr. Deberghes also serves as an officer of other funds. He serves as Assistant Treasurer of FMR Capital, Inc. (2017-present), Executive Vice President of Fidelity Investments Money Management, Inc. (FIMM) (investment adviser firm, 2016-present), and is an employee of Fidelity Investments (2008-present). Previously, Mr. Deberghes served as President and Treasurer of certain Fidelity® funds (2013-2018). Prior to joining Fidelity Investments, Mr. Deberghes was Senior Vice President of Mutual Fund Administration at State Street Corporation (2007-2008), Senior Director of Mutual Fund Administration at Investors Bank & Trust (2005-2007), and Director of Finance for Dunkin' Brands (2000-2005). Previously, Mr. Deberghes served in other fund officer roles.
Laura M. Del Prato (1964)
Year of Election or Appointment: 2018
Assistant Treasurer
Ms. Del Prato also serves as an officer of other funds. Ms. Del Prato is an employee of Fidelity Investments (2017-present). Prior to joining Fidelity Investments, Ms. Del Prato served as a Managing Director and Treasurer of the JPMorgan Mutual Funds (2014-2017). Prior to JPMorgan, Ms. Del Prato served as a partner at Cohen Fund Audit Services (accounting firm, 2012-2013) and KPMG LLP (accounting firm, 2004-2012).
Colm A. Hogan (1973)
Year of Election or Appointment: 2016
Deputy Treasurer
Mr. Hogan also serves as an officer of other funds. Mr. Hogan serves as Assistant Treasurer of FMR Capital, Inc. (2017-present) and is an employee of Fidelity Investments (2005-present). Previously, Mr. Hogan served as Assistant Treasurer of certain Fidelity® funds (2016-2018).
Pamela R. Holding (1964)
Year of Election or Appointment: 2018
Vice President
Ms. Holding also serves as Vice President of other funds. Ms. Holding serves as Executive Vice President of Fidelity SelectCo, LLC (2019-present), Co-Head of Equity (2018-present) and is an employee of Fidelity Investments (2013-present). Previously, Ms. Holding served as Chief Investment Officer of Fidelity Institutional Asset Management (2013-2018).
Cynthia Lo Bessette (1969)
Year of Election or Appointment: 2019
Secretary and Chief Legal Officer (CLO)
Ms. Lo Bessette also serves as Secretary and CLO of other funds. Ms. Lo Bessette serves as CLO, Secretary, and Senior Vice President of Fidelity Management & Research Company and FMR Co., Inc. (investment adviser firms, 2019-present); Secretary of Fidelity SelectCo, LLC and Fidelity Investments Money Management, Inc. (investment adviser firms, 2019-present); and CLO of Fidelity Management & Research (Hong Kong) Limited, FMR Investment Management (UK) Limited, and Fidelity Management & Research (Japan) Limited (investment adviser firms, 2019-present). She is a Senior Vice President and Deputy General Counsel of FMR LLC (diversified financial services company, 2019-present), and is an employee of Fidelity Investments. Previously, Ms. Lo Bessette served as Executive Vice President, General Counsel (2016-2019) and Senior Vice President, Deputy General Counsel (2015-2016) of OppenheimerFunds (investment management company) and Deputy Chief Legal Officer (2013-2015) of Jennison Associates LLC (investment adviser firm).
Chris Maher (1972)
Year of Election or Appointment: 2013
Assistant Treasurer
Mr. Maher serves as Assistant Treasurer of other funds. Mr. Maher is Vice President of Valuation Oversight, serves as Assistant Treasurer of FMR Capital, Inc. (2017-present), and is an employee of Fidelity Investments. Previously, Mr. Maher served as Vice President of Asset Management Compliance (2013), Vice President of the Program Management Group of FMR (investment adviser firm, 2010-2013), and Vice President of Valuation Oversight (2008-2010).
Kenneth B. Robins (1969)
Year of Election or Appointment: 2016
Chief Compliance Officer
Mr. Robins also serves as an officer of other funds. Mr. Robins serves as Compliance Officer of Fidelity Management & Research Company and FMR Co., Inc. (investment adviser firms, 2016-present) and is an employee of Fidelity Investments (2004-present). Previously, Mr. Robins served as Executive Vice President of Fidelity Investments Money Management, Inc. (investment adviser firm, 2013-2016) and served in other fund officer roles.
Stacie M. Smith (1974)
Year of Election or Appointment: 2016
President and Treasurer
Ms. Smith also serves as an officer of other funds. Ms. Smith serves as Assistant Treasurer of FMR Capital, Inc. (2017-present), is an employee of Fidelity Investments (2009-present), and has served in other fund officer roles. Prior to joining Fidelity Investments, Ms. Smith served as Senior Audit Manager of Ernst & Young LLP (accounting firm, 1996-2009). Previously, Ms. Smith served as Assistant Treasurer (2013-2018) and Deputy Treasurer (2013-2016) of certain Fidelity® funds.
Marc L. Spector (1972)
Year of Election or Appointment: 2016
Assistant Treasurer
Mr. Spector also serves as an officer of other funds. Mr. Spector serves as Assistant Treasurer of FMR Capital, Inc. (2017-present) and is an employee of Fidelity Investments (2016-present). Prior to joining Fidelity Investments, Mr. Spector served as Director at the Siegfried Group (accounting firm, 2013-2016), and prior to Siegfried Group as audit senior manager at Deloitte & Touche (accounting firm, 2005-2013).
Jim Wegmann (1979)
Year of Election or Appointment: 2019
Assistant Treasurer
Mr. Wegmann also serves as Assistant Treasurer of other funds. Mr. Wegmann is an employee of Fidelity Investments (2011-present).
Shareholder Expense Example
As a shareholder of the Fund, you incur two types of costs: (1) transaction costs and (2) ongoing costs, including management fees and other Fund expenses. This Example is intended to help you understand your ongoing costs (in dollars) of investing in the Fund and to compare these costs with the ongoing costs of investing in other mutual funds.
The Example is based on an investment of $1,000 invested at the beginning of the period and held for the entire period (May 1, 2019 to October 31, 2019).
Actual Expenses
The first line of the accompanying table provides information about actual account values and actual expenses. You may use the information in this line, together with the amount you invested, to estimate the expenses that you paid over the period. Simply divide your account value by $1,000.00 (for example, an $8,600 account value divided by $1,000.00 = 8.6), then multiply the result by the number in the first line under the heading entitled "Expenses Paid During Period" to estimate the expenses you paid on your account during this period. In addition, the Fund, as a shareholder in the underlying Fidelity Central Funds, will indirectly bear its pro-rata share of the fees and expenses incurred by the underlying Fidelity Central Funds. These fees and expenses are not included in the Fund's annualized expense ratio used to calculate the expense estimate in the table below.
Hypothetical Example for Comparison Purposes
The second line of the accompanying table provides information about hypothetical account values and hypothetical expenses based on the Fund's actual expense ratio and an assumed rate of return of 5% per year before expenses, which is not the Fund's actual return. The hypothetical account values and expenses may not be used to estimate the actual ending account balance or expenses you paid for the period. You may use this information to compare the ongoing costs of investing in the Fund and other funds. To do so, compare this 5% hypothetical example with the 5% hypothetical examples that appear in the shareholder reports of the other funds. In addition, the Fund, as a shareholder in the underlying Fidelity Central Funds, will indirectly bear its pro-rata share of the fees and expenses incurred by the underlying Fidelity Central Funds. These fees and expenses are not included in the Fund's annualized expense ratio used to calculate the expense estimate in the table below.
Please note that the expenses shown in the table are meant to highlight your ongoing costs only and do not reflect any transaction costs. Therefore, the second line of the table is useful in comparing ongoing costs only, and will not help you determine the relative total costs of owning different funds.
| | Annualized Expense Ratio-A | Beginning
Account Value
May 1, 2019 | Ending
Account Value
October 31, 2019 | Expenses Paid
During Period-B
May 1, 2019
to October 31, 2019 |
| Actual | .88% | $1,000.00 | $1,005.10 | $4.45 |
| Hypothetical-C | | $1,000.00 | $1,020.77 | $4.48 |
A Annualized expense ratio reflects expenses net of applicable fee waivers.
B Expenses are equal to the Fund's annualized expense ratio, multiplied by the average account value over the period, multiplied by 184/365 (to reflect the one-half year period).
C 5% return per year before expenses
Distributions (Unaudited)
The Board of Trustees of Fidelity Focused Stock Fund voted to pay on December 9, 2019, to shareholders of record at the opening of business on December 6, 2019, a distribution of $1.301 per share derived from capital gains realized from sales of portfolio securities and a dividend of $0.022 per share from net investment income.
The fund hereby designates as a capital gain dividend with respect to the taxable year ended October 31, 2019, $132,087,376, or, if subsequently determined to be different, the net capital gain of such year.
The fund designates 100% of the dividend distributed during the fiscal year as qualifying for the dividends–received deduction for corporate shareholders.
The fund designates 100% of the dividend distributed in December during the fiscal year as amounts which may be taken into account as a dividend for the purposes of the maximum rate under section 1(h)(11) of the Internal Revenue Code.
The fund will notify shareholders in January 2020 of amounts for use in preparing 2019 income tax returns.
TQG-ANN-1219
1.538682.122
Fidelity® Stock Selector Small Cap Fund
Annual Report
October 31, 2019
Includes Fidelity and Fidelity Advisor share classes
See the inside front cover for important information about access to your fund’s shareholder reports.
Beginning on January 1, 2021, as permitted by regulations adopted by the Securities and Exchange Commission, paper copies of a fund’s shareholder reports will no longer be sent by mail, unless you specifically request paper copies of the reports from the fund or from your financial intermediary, such as a financial advisor, broker-dealer or bank. Instead, the reports will be made available on a website, and you will be notified by mail each time a report is posted and provided with a website link to access the report.
If you already elected to receive shareholder reports electronically, you will not be affected by this change and you need not take any action. You may elect to receive shareholder reports and other communications from a fund electronically, by contacting your financial intermediary. For Fidelity customers, visit Fidelity's web site or call Fidelity using the contact information listed below.
You may elect to receive all future reports in paper free of charge. If you wish to continue receiving paper copies of your shareholder reports, you may contact your financial intermediary or, if you are a Fidelity customer, visit Fidelity’s website, or call Fidelity at the applicable toll-free number listed below. Your election to receive reports in paper will apply to all funds held with the fund complex/your financial intermediary.
| Account Type | Website | Phone Number |
| Brokerage, Mutual Fund, or Annuity Contracts: | fidelity.com/mailpreferences | 1-800-343-3548 |
| Employer Provided Retirement Accounts: | netbenefits.fidelity.com/preferences (choose 'no' under Required Disclosures to continue to print) | 1-800-343-0860 |
| Advisor Sold Accounts Serviced Through Your Financial Intermediary: | Contact Your Financial Intermediary | Your Financial Intermediary's phone number |
| Advisor Sold Accounts Serviced by Fidelity: | institutional.fidelity.com | 1-877-208-0098 |
Contents
To view a fund's proxy voting guidelines and proxy voting record for the 12-month period ended June 30, visit http://www.fidelity.com/proxyvotingresults or visit the Securities and Exchange Commission's (SEC) web site at http://www.sec.gov.
You may also call 1-800-544-8544 if you’re an individual investing directly with Fidelity, call 1-800-835-5092 if you’re a plan sponsor or participant with Fidelity as your recordkeeper or call 1-877-208-0098 on institutional accounts or if you’re an advisor or invest through one to request a free copy of the proxy voting guidelines.
Standard & Poor's, S&P and S&P 500 are registered service marks of The McGraw-Hill Companies, Inc. and have been licensed for use by Fidelity Distributors Corporation.
Other third-party marks appearing herein are the property of their respective owners.
All other marks appearing herein are registered or unregistered trademarks or service marks of FMR LLC or an affiliated company. © 2019 FMR LLC. All rights reserved.
This report and the financial statements contained herein are submitted for the general information of the shareholders of the Fund. This report is not authorized for distribution to prospective investors in the Fund unless preceded or accompanied by an effective prospectus.
A fund files its complete schedule of portfolio holdings with the SEC for the first and third quarters of each fiscal year on Form N-PORT. Forms N-PORT are available on the SEC’s web site at http://www.sec.gov. A fund's Forms N-PORT may be reviewed and copied at the SEC’s Public Reference Room in Washington, DC. Information regarding the operation of the SEC's Public Reference Room may be obtained by calling 1-800-SEC-0330.
For a complete list of a fund's portfolio holdings, view the most recent holdings listing, semiannual report, or annual report on Fidelity's web site at http://www.fidelity.com, http://www.institutional.fidelity.com, or http://www.401k.com, as applicable.
NOT FDIC INSURED •MAY LOSE VALUE •NO BANK GUARANTEE
Neither the Fund nor Fidelity Distributors Corporation is a bank.
Performance: The Bottom Line
Average annual total return reflects the change in the value of an investment, assuming reinvestment of distributions from dividend income and capital gains (the profits earned upon the sale of securities that have grown in value, if any) and assuming a constant rate of performance each year. The hypothetical investment and the average annual total returns do not reflect the deduction of taxes that a shareholder would pay on fund distributions or the redemption of fund shares. During periods of reimbursement by Fidelity, a fund’s total return will be greater than it would be had the reimbursement not occurred. How a fund did yesterday is no guarantee of how it will do tomorrow.
Average Annual Total Returns
| For the periods ended October 31, 2019 | Past 1 year | Past 5 years | Past 10 years |
| Class A (incl. 5.75% sales charge) | 5.14% | 6.75% | 11.66% |
| Class M (incl. 3.50% sales charge) | 7.31% | 6.90% | 11.57% |
| Class C (incl. contingent deferred sales charge) | 9.74% | 7.14% | 11.43% |
| Fidelity® Stock Selector Small Cap Fund | 11.90% | 8.34% | 12.64% |
| Class I | 11.87% | 8.33% | 12.68% |
| Class Z | 12.05% | 8.42% | 12.73% |
Class C shares' contingent deferred sales charges included in the past one year, past five years and past ten years total return figures are 1%, 0% and 0%, respectively.
The initial offering of Class Z shares took place on February 1, 2017. Returns prior to February 1, 2017, are those of Class I.
$10,000 Over 10 Years
Let's say hypothetically that $10,000 was invested in Fidelity® Stock Selector Small Cap Fund, a class of the fund, on October 31, 2009.
The chart shows how the value of your investment would have changed, and also shows how the Russell 2000® Index performed over the same period.
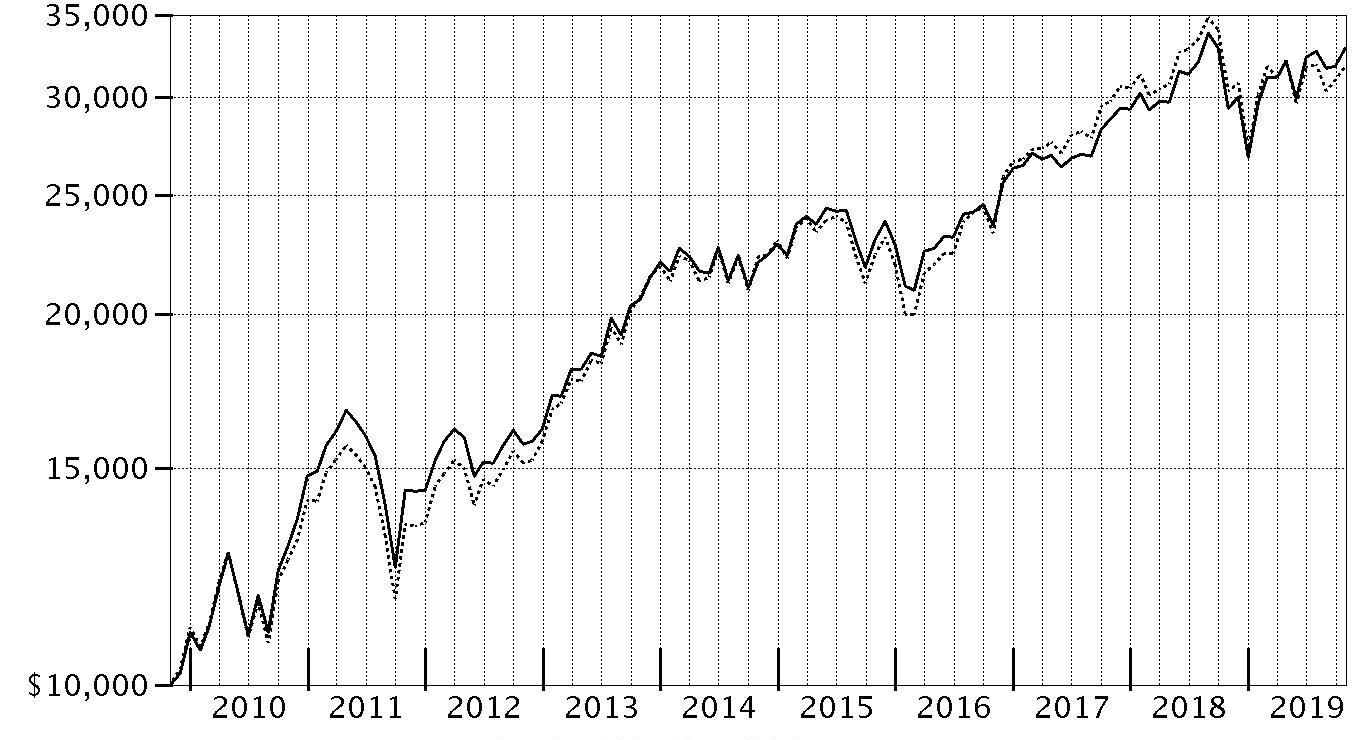
| Period Ending Values |
| $32,880 | Fidelity® Stock Selector Small Cap Fund - Fidelity® Stock Selector Small Cap Fund |
| $31,816 | Russell 2000® Index |
Management's Discussion of Fund Performance
Market Recap: The S&P 500
® index gained 14.33% for the 12 months ending October 31, 2019, ending the period just shy of a record close after seesawing due to trade tension, interest rates, economic data and an inverted yield curve, among other factors. Upbeat company earnings and outlooks, along with signs the Federal Reserve may pause on rates, boosted stocks to an all-time high on April 30. In May, however, volatility spiked and the index sunk as trade negotiations between the U.S. and China broke down. The bull market roared back in June and recorded a series of highs in July, when the Fed, affirming a dovish shift in policy, cut interest rates for the first time since 2008. Volatility intensified in August, however, as the U.S. Treasury yield curve inverted for the first time since 2007, which some investors viewed as a sign the U.S. economy could be heading for recession. The market proved resilient, rising in the final two months and reaching a new high on October 30, when the Fed cut interest rates for the third time this year. For the full 12 months, the defensive real estate (+27%) and utilities (+24%) sectors led the way, followed by information technology (+23%). Communication services and consumer discretionary each gained about 16%, while industrials advanced 15%. In contrast, energy (-11%) was by far the weakest sector – slipping on lower oil prices. Other notable laggards included health care (+9%) and financials (+12%). Lastly, consumer staples and materials finished roughly in line with the index.
Comments from Lead Portfolio Manager Morgen Peck: For the fiscal year, the fund's share classes gained roughly 11% to 12%, notably outpacing the 4.90% result of the benchmark, the Russell
® 2000 Index. The small-cap equity market experienced a volatile 12 months, as trade tariffs, interest rates and slower global growth concerned investors. Amid this environment, defensive sectors and higher-quality names with stable growth performed best. Versus the benchmark, stock selection drove the fund's outperformance, especially choices within the health care, consumer discretionary and industrials sectors. Positioning in energy also added value. Among individual stocks, the fund's stake in semiconductor equipment maker Entegris rose 83%, and contributed more than any other position. The company's end-markets stabilized for much of the 12 months, after absorbing excess supply in late 2018, and Entegris exceeded consensus earnings expectations for several quarters, lifting its stock price. Also adding value was the fund's stake in stand-by generator manufacturer Generac Holdings (+90%). Conversely, an underweighting in the strong-performing utilities sector and choices in information technology detracted. In the latter sector, an overweighting in this strong-performing group more than offset the negative impact of stock selection. A position in kids' clothing retailer The Children's Place (-43%) detracted more than any individual fund position.
The views expressed above reflect those of the portfolio manager(s) only through the end of the period as stated on the cover of this report and do not necessarily represent the views of Fidelity or any other person in the Fidelity organization. Any such views are subject to change at any time based upon market or other conditions and Fidelity disclaims any responsibility to update such views. These views may not be relied on as investment advice and, because investment decisions for a Fidelity fund are based on numerous factors, may not be relied on as an indication of trading intent on behalf of any Fidelity fund.
Investment Summary (Unaudited)
Top Ten Stocks as of October 31, 2019
| | % of fund's net assets |
| Generac Holdings, Inc. | 1.3 |
| Essent Group Ltd. | 1.2 |
| Deckers Outdoor Corp. | 1.1 |
| Murphy U.S.A., Inc. | 1.1 |
| Performance Food Group Co. | 1.1 |
| Entegris, Inc. | 1.0 |
| Innospec, Inc. | 1.0 |
| Primerica, Inc. | 1.0 |
| Terreno Realty Corp. | 1.0 |
| Churchill Downs, Inc. | 1.0 |
| | 10.8 |
Top Five Market Sectors as of October 31, 2019
| | % of fund's net assets |
| Financials | 19.1 |
| Information Technology | 16.7 |
| Industrials | 15.3 |
| Health Care | 14.3 |
| Consumer Discretionary | 14.2 |
Asset Allocation (% of fund's net assets)
| As of October 31, 2019* |
| | Stocks | 99.1% |
| | Short-Term Investments and Net Other Assets (Liabilities) | 0.9% |

* Foreign investments - 9.2%
Schedule of Investments October 31, 2019
Showing Percentage of Net Assets
| Common Stocks - 99.1% | | | |
| | | Shares | Value (000s) |
| COMMUNICATION SERVICES - 2.1% | | | |
| Diversified Telecommunication Services - 0.5% | | | |
| Bandwidth, Inc. (a) | | 36,000 | $2,021 |
| Iridium Communications, Inc. (a) | | 109,400 | 2,677 |
| | | | 4,698 |
| Entertainment - 0.3% | | | |
| Cinemark Holdings, Inc. | | 84,750 | 3,102 |
| Media - 1.3% | | | |
| Gray Television, Inc. (a) | | 173,600 | 2,849 |
| Nexstar Broadcasting Group, Inc. Class A | | 57,800 | 5,623 |
| Tegna, Inc. | | 203,900 | 3,065 |
| The New York Times Co. Class A | | 70,650 | 2,183 |
| | | | 13,720 |
|
| TOTAL COMMUNICATION SERVICES | | | 21,520 |
|
| CONSUMER DISCRETIONARY - 14.2% | | | |
| Auto Components - 1.1% | | | |
| Fox Factory Holding Corp. (a) | | 73,500 | 4,479 |
| Standard Motor Products, Inc. | | 96,102 | 5,032 |
| Stoneridge, Inc. (a) | | 70,500 | 2,177 |
| | | | 11,688 |
| Diversified Consumer Services - 0.8% | | | |
| Laureate Education, Inc. Class A (a) | | 521,500 | 8,060 |
| Hotels, Restaurants & Leisure - 1.9% | | | |
| Churchill Downs, Inc. | | 76,800 | 9,983 |
| Eldorado Resorts, Inc. (a)(b) | | 72,750 | 3,257 |
| Wendy's Co. | | 288,100 | 6,102 |
| | | | 19,342 |
| Household Durables - 2.8% | | | |
| Cavco Industries, Inc. (a) | | 14,866 | 2,849 |
| Helen of Troy Ltd. (a) | | 20,300 | 3,040 |
| M.D.C. Holdings, Inc. | | 211,726 | 8,196 |
| Skyline Champion Corp. (a) | | 186,800 | 5,273 |
| Taylor Morrison Home Corp. (a) | | 157,000 | 3,933 |
| TopBuild Corp. (a) | | 49,000 | 5,093 |
| | | | 28,384 |
| Leisure Products - 1.6% | | | |
| Acushnet Holdings Corp. | | 236,600 | 6,731 |
| Brunswick Corp. | | 40,200 | 2,341 |
| Clarus Corp. | | 311,000 | 3,965 |
| MCBC Holdings, Inc. (a) | | 104,400 | 1,644 |
| YETI Holdings, Inc. (b) | | 56,100 | 1,869 |
| | | | 16,550 |
| Multiline Retail - 0.3% | | | |
| Ollie's Bargain Outlet Holdings, Inc. (a)(b) | | 54,900 | 3,507 |
| Specialty Retail - 2.8% | | | |
| Monro, Inc. | | 88,700 | 6,219 |
| Murphy U.S.A., Inc. (a) | | 94,900 | 11,192 |
| The Children's Place Retail Stores, Inc. | | 58,500 | 4,792 |
| Williams-Sonoma, Inc. (b) | | 94,600 | 6,318 |
| | | | 28,521 |
| Textiles, Apparel & Luxury Goods - 2.9% | | | |
| Carter's, Inc. | | 46,500 | 4,661 |
| Deckers Outdoor Corp. (a) | | 73,400 | 11,223 |
| Oxford Industries, Inc. | | 24,500 | 1,687 |
| Steven Madden Ltd. | | 232,988 | 9,594 |
| Wolverine World Wide, Inc. | | 92,600 | 2,748 |
| | | | 29,913 |
|
| TOTAL CONSUMER DISCRETIONARY | | | 145,965 |
|
| CONSUMER STAPLES - 5.2% | | | |
| Food & Staples Retailing - 2.4% | | | |
| BJ's Wholesale Club Holdings, Inc. (a) | | 346,100 | 9,241 |
| Casey's General Stores, Inc. | | 26,500 | 4,526 |
| Performance Food Group Co. (a) | | 255,075 | 10,869 |
| | | | 24,636 |
| Food Products - 1.7% | | | |
| Darling International, Inc. (a) | | 216,400 | 4,177 |
| Nomad Foods Ltd. (a) | | 325,100 | 6,343 |
| Post Holdings, Inc. (a) | | 72,000 | 7,409 |
| | | | 17,929 |
| Household Products - 0.7% | | | |
| Central Garden & Pet Co. Class A (non-vtg.) (a) | | 257,600 | 7,285 |
| Personal Products - 0.4% | | | |
| BellRing Brands, Inc. Class A (a) | | 231,500 | 4,044 |
|
| TOTAL CONSUMER STAPLES | | | 53,894 |
|
| ENERGY - 1.0% | | | |
| Oil, Gas & Consumable Fuels - 1.0% | | | |
| Delek U.S. Holdings, Inc. | | 189,471 | 7,569 |
| Par Pacific Holdings, Inc. (a) | | 113,800 | 2,578 |
| | | | 10,147 |
| FINANCIALS - 19.1% | | | |
| Banks - 10.3% | | | |
| Associated Banc-Corp. | | 197,561 | 3,973 |
| BancFirst Corp. | | 119,856 | 6,938 |
| Banner Corp. | | 121,129 | 6,539 |
| City Holding Co. | | 100,400 | 7,966 |
| Cullen/Frost Bankers, Inc. | | 93,000 | 8,377 |
| First Bancorp, Puerto Rico | | 452,100 | 4,756 |
| First Citizens Bancshares, Inc. | | 10,800 | 5,313 |
| First Hawaiian, Inc. | | 311,746 | 8,520 |
| First Interstate Bancsystem, Inc. | | 161,917 | 6,794 |
| First Merchants Corp. | | 151,037 | 5,974 |
| Heartland Financial U.S.A., Inc. | | 70,111 | 3,280 |
| Hilltop Holdings, Inc. | | 195,800 | 4,574 |
| Independent Bank Corp., Massachusetts | | 69,842 | 5,733 |
| Signature Bank | | 18,100 | 2,142 |
| Trico Bancshares | | 210,017 | 7,903 |
| Trustmark Corp. | | 97,500 | 3,346 |
| WesBanco, Inc. | | 197,300 | 7,417 |
| Wintrust Financial Corp. | | 95,200 | 6,076 |
| | | | 105,621 |
| Capital Markets - 1.7% | | | |
| BrightSphere Investment Group, Inc. | | 199,155 | 1,956 |
| Hamilton Lane, Inc. Class A | | 87,800 | 5,235 |
| Houlihan Lokey | | 53,300 | 2,519 |
| Morningstar, Inc. | | 38,119 | 6,169 |
| Virtu Financial, Inc. Class A (b) | | 124,700 | 2,115 |
| | | | 17,994 |
| Consumer Finance - 1.1% | | | |
| First Cash Financial Services, Inc. | | 100,300 | 8,464 |
| Navient Corp. | | 202,600 | 2,790 |
| | | | 11,254 |
| Insurance - 3.3% | | | |
| Amerisafe, Inc. | | 61,900 | 3,933 |
| Employers Holdings, Inc. | | 55,043 | 2,331 |
| First American Financial Corp. | | 147,900 | 9,137 |
| Primerica, Inc. | | 82,600 | 10,422 |
| White Mountains Insurance Group Ltd. | | 7,900 | 8,461 |
| | | | 34,284 |
| Mortgage Real Estate Investment Trusts - 0.3% | | | |
| Redwood Trust, Inc. | | 185,000 | 3,023 |
| Thrifts & Mortgage Finance - 2.4% | | | |
| Essent Group Ltd. | | 228,600 | 11,908 |
| LendingTree, Inc. (a) | | 7,100 | 2,555 |
| NMI Holdings, Inc. (a) | | 84,500 | 2,472 |
| WSFS Financial Corp. | | 172,942 | 7,293 |
| | | | 24,228 |
|
| TOTAL FINANCIALS | | | 196,404 |
|
| HEALTH CARE - 14.3% | | | |
| Biotechnology - 6.9% | | | |
| ACADIA Pharmaceuticals, Inc. (a) | | 131,567 | 5,580 |
| Agios Pharmaceuticals, Inc. (a) | | 46,515 | 1,399 |
| Allakos, Inc. (a) | | 38,616 | 2,649 |
| AnaptysBio, Inc. (a) | | 36,700 | 1,384 |
| Aprea Therapeutics, Inc. | | 48,200 | 1,164 |
| Argenx SE ADR (a) | | 31,331 | 3,837 |
| Ascendis Pharma A/S sponsored ADR (a) | | 34,006 | 3,760 |
| Audentes Therapeutics, Inc. (a) | | 59,980 | 1,613 |
| BELLUS Health, Inc. (a) | | 11,300 | 75 |
| bluebird bio, Inc. (a) | | 32,784 | 2,656 |
| Blueprint Medicines Corp. (a) | | 43,154 | 2,971 |
| Crinetics Pharmaceuticals, Inc. (a)(b) | | 106,950 | 1,883 |
| FibroGen, Inc. (a) | | 136,400 | 5,340 |
| G1 Therapeutics, Inc. (a) | | 105,100 | 2,230 |
| Heron Therapeutics, Inc. (a) | | 148,500 | 3,156 |
| Insmed, Inc. (a) | | 164,947 | 3,066 |
| Intercept Pharmaceuticals, Inc. (a) | | 33,803 | 2,460 |
| Ionis Pharmaceuticals, Inc. (a) | | 25,028 | 1,395 |
| Kezar Life Sciences, Inc. (a) | | 69,264 | 225 |
| Kura Oncology, Inc. (a) | | 119,200 | 1,786 |
| La Jolla Pharmaceutical Co. (a) | | 124,900 | 876 |
| Mirati Therapeutics, Inc. (a)(b) | | 28,300 | 2,665 |
| Morphic Holding, Inc. | | 62,200 | 871 |
| Neurocrine Biosciences, Inc. (a) | | 45,932 | 4,570 |
| Principia Biopharma, Inc. (a) | | 83,400 | 2,945 |
| Protagonist Therapeutics, Inc. (a) | | 253,848 | 3,414 |
| Sage Therapeutics, Inc. (a) | | 17,700 | 2,401 |
| Sarepta Therapeutics, Inc. (a) | | 19,900 | 1,653 |
| Scholar Rock Holding Corp. (a) | | 4,800 | 44 |
| Turning Point Therapeutics, Inc. | | 33,800 | 1,297 |
| Viela Bio, Inc. | | 75,600 | 1,644 |
| Zymeworks, Inc. (a) | | 14,500 | 501 |
| | | | 71,510 |
| Health Care Equipment & Supplies - 2.8% | | | |
| CONMED Corp. | | 31,300 | 3,444 |
| Haemonetics Corp. (a) | | 66,100 | 7,980 |
| Hill-Rom Holdings, Inc. | | 63,200 | 6,616 |
| Masimo Corp. (a) | | 38,800 | 5,657 |
| STERIS PLC | | 35,100 | 4,969 |
| | | | 28,666 |
| Health Care Providers & Services - 1.3% | | | |
| Chemed Corp. | | 10,200 | 4,018 |
| LHC Group, Inc. (a) | | 50,400 | 5,593 |
| Molina Healthcare, Inc. (a) | | 32,900 | 3,870 |
| | | | 13,481 |
| Health Care Technology - 0.4% | | | |
| Inovalon Holdings, Inc. Class A (a) | | 265,600 | 4,151 |
| Life Sciences Tools & Services - 1.7% | | | |
| 10X Genomics, Inc. (a) | | 11,600 | 673 |
| Bio-Rad Laboratories, Inc. Class A (a) | | 16,300 | 5,405 |
| Bruker Corp. | | 105,600 | 4,699 |
| ICON PLC (a) | | 42,600 | 6,258 |
| | | | 17,035 |
| Pharmaceuticals - 1.2% | | | |
| MyoKardia, Inc. (a) | | 67,930 | 3,894 |
| Theravance Biopharma, Inc. (a) | | 112,478 | 1,813 |
| Xeris Pharmaceuticals, Inc. (a) | | 208,800 | 1,708 |
| Zogenix, Inc. (a) | | 113,400 | 5,063 |
| | | | 12,478 |
|
| TOTAL HEALTH CARE | | | 147,321 |
|
| INDUSTRIALS - 15.3% | | | |
| Aerospace & Defense - 1.4% | | | |
| Moog, Inc. Class A | | 108,462 | 9,079 |
| Teledyne Technologies, Inc. (a) | | 17,451 | 5,752 |
| | | | 14,831 |
| Air Freight & Logistics - 0.3% | | | |
| Air Transport Services Group, Inc. (a) | | 133,748 | 2,797 |
| Building Products - 2.1% | | | |
| Allegion PLC | | 21,805 | 2,530 |
| Armstrong World Industries, Inc. | | 42,000 | 3,928 |
| Continental Building Products, Inc. (a) | | 113,100 | 3,383 |
| Gibraltar Industries, Inc. (a) | | 85,000 | 4,525 |
| Simpson Manufacturing Co. Ltd. | | 86,120 | 7,117 |
| | | | 21,483 |
| Commercial Services & Supplies - 0.5% | | | |
| Tetra Tech, Inc. | | 57,600 | 5,038 |
| Construction & Engineering - 2.6% | | | |
| Comfort Systems U.S.A., Inc. | | 77,676 | 3,916 |
| EMCOR Group, Inc. | | 106,280 | 9,322 |
| Fluor Corp. | | 120,100 | 1,935 |
| MasTec, Inc. (a) | | 84,900 | 5,344 |
| Valmont Industries, Inc. | | 49,280 | 6,761 |
| | | | 27,278 |
| Electrical Equipment - 2.2% | | | |
| Atkore International Group, Inc. (a) | | 260,800 | 9,050 |
| Generac Holdings, Inc. (a) | | 139,000 | 13,422 |
| | | | 22,472 |
| Machinery - 4.0% | | | |
| Allison Transmission Holdings, Inc. | | 70,400 | 3,070 |
| ESCO Technologies, Inc. | | 106,600 | 9,007 |
| Gardner Denver Holdings, Inc. (a) | | 68,100 | 2,168 |
| ITT, Inc. | | 152,340 | 9,057 |
| Luxfer Holdings PLC sponsored | | 147,200 | 2,482 |
| Oshkosh Corp. | | 21,600 | 1,844 |
| Rexnord Corp. (a) | | 144,600 | 4,091 |
| SPX Flow, Inc. (a) | | 206,909 | 9,369 |
| | | | 41,088 |
| Professional Services - 1.1% | | | |
| CBIZ, Inc. (a) | | 268,900 | 7,360 |
| FTI Consulting, Inc. (a) | | 35,400 | 3,854 |
| | | | 11,214 |
| Trading Companies & Distributors - 1.1% | | | |
| Kaman Corp. | | 127,875 | 7,502 |
| MRC Global, Inc. (a) | | 148,190 | 1,683 |
| Rush Enterprises, Inc. Class A | | 50,592 | 2,210 |
| | | | 11,395 |
|
| TOTAL INDUSTRIALS | | | 157,596 |
|
| INFORMATION TECHNOLOGY - 16.7% | | | |
| Electronic Equipment & Components - 2.2% | | | |
| ePlus, Inc. (a) | | 70,352 | 5,497 |
| Fabrinet (a) | | 144,140 | 8,105 |
| Insight Enterprises, Inc. (a) | | 63,600 | 3,904 |
| TTM Technologies, Inc. (a) | | 448,784 | 5,255 |
| | | | 22,761 |
| IT Services - 6.9% | | | |
| Amdocs Ltd. | | 50,000 | 3,260 |
| Black Knight, Inc. (a) | | 47,600 | 3,056 |
| CACI International, Inc. Class A(a) | | 23,400 | 5,236 |
| Endava PLC ADR (a) | | 108,800 | 4,679 |
| EPAM Systems, Inc. (a) | | 34,498 | 6,070 |
| ExlService Holdings, Inc. (a) | | 115,933 | 8,072 |
| Maximus, Inc. | | 55,450 | 4,255 |
| Perficient, Inc. (a) | | 142,200 | 5,574 |
| Perspecta, Inc. | | 288,500 | 7,657 |
| Science Applications International Corp. | | 104,650 | 8,646 |
| Verra Mobility Corp. (a) | | 243,300 | 3,491 |
| Virtusa Corp. (a) | | 62,900 | 2,345 |
| WNS Holdings Ltd. sponsored ADR(a) | | 142,050 | 8,784 |
| | | | 71,125 |
| Semiconductors & Semiconductor Equipment - 3.7% | | | |
| Brooks Automation, Inc. | | 160,200 | 6,804 |
| Cabot Microelectronics Corp. | | 34,800 | 5,259 |
| Entegris, Inc. | | 221,600 | 10,637 |
| MKS Instruments, Inc. | | 18,900 | 2,045 |
| Onto Innovation, Inc. (a) | | 170,700 | 5,497 |
| Semtech Corp. (a) | | 156,000 | 7,872 |
| | | | 38,114 |
| Software - 3.9% | | | |
| Altair Engineering, Inc. Class A (a) | | 85,800 | 3,163 |
| Ebix, Inc. | | 39,100 | 1,667 |
| Everbridge, Inc. (a) | | 107,000 | 7,438 |
| Five9, Inc. (a) | | 156,500 | 8,687 |
| LivePerson, Inc. (a)(b) | | 214,500 | 8,805 |
| Q2 Holdings, Inc. (a) | | 35,800 | 2,559 |
| Varonis Systems, Inc. (a) | | 37,800 | 2,705 |
| Workiva, Inc. (a) | | 113,800 | 4,742 |
| | | | 39,766 |
|
| TOTAL INFORMATION TECHNOLOGY | | | 171,766 |
|
| MATERIALS - 3.0% | | | |
| Chemicals - 1.7% | | | |
| Axalta Coating Systems Ltd. (a) | | 137,000 | 4,040 |
| Innospec, Inc. | | 116,109 | 10,608 |
| Olin Corp. | | 157,000 | 2,879 |
| | | | 17,527 |
| Construction Materials - 0.3% | | | |
| Eagle Materials, Inc. | | 37,300 | 3,407 |
| Metals & Mining - 0.5% | | | |
| Commercial Metals Co. | | 148,600 | 2,872 |
| Steel Dynamics, Inc. | | 85,650 | 2,600 |
| | | | 5,472 |
| Paper & Forest Products - 0.5% | | | |
| Louisiana-Pacific Corp. | | 161,800 | 4,729 |
|
| TOTAL MATERIALS | | | 31,135 |
|
| REAL ESTATE - 6.9% | | | |
| Equity Real Estate Investment Trusts (REITs) - 6.6% | | | |
| American Assets Trust, Inc. | | 87,800 | 4,299 |
| Americold Realty Trust | | 234,950 | 9,419 |
| Corporate Office Properties Trust (SBI) | | 149,400 | 4,428 |
| CubeSmart | | 174,200 | 5,522 |
| Equity Commonwealth | | 152,100 | 4,895 |
| Equity Lifestyle Properties, Inc. | | 67,500 | 4,721 |
| Four Corners Property Trust, Inc. | | 95,106 | 2,725 |
| Front Yard Residential Corp. Class B | | 232,500 | 2,876 |
| Lexington Corporate Properties Trust | | 392,700 | 4,273 |
| PS Business Parks, Inc. | | 27,500 | 4,965 |
| Rexford Industrial Realty, Inc. | | 120,250 | 5,783 |
| Store Capital Corp. | | 82,507 | 3,342 |
| Terreno Realty Corp. | | 181,600 | 10,244 |
| | | | 67,492 |
| Real Estate Management & Development - 0.3% | | | |
| Cushman & Wakefield PLC (a) | | 193,400 | 3,607 |
|
| TOTAL REAL ESTATE | | | 71,099 |
|
| UTILITIES - 1.3% | | | |
| Electric Utilities - 0.5% | | | |
| Allete, Inc. | | 51,600 | 4,441 |
| Gas Utilities - 0.4% | | | |
| Southwest Gas Holdings, Inc. | | 50,350 | 4,396 |
| Independent Power and Renewable Electricity Producers - 0.4% | | | |
| Vistra Energy Corp. | | 158,250 | 4,277 |
|
| TOTAL UTILITIES | | | 13,114 |
|
| TOTAL COMMON STOCKS | | | |
| (Cost $839,461) | | | 1,019,961 |
| | | Principal Amount (000s) | Value (000s) |
|
| U.S. Treasury Obligations - 0.0% | | | |
| U.S. Treasury Bills, yield at date of purchase 1.94% 11/29/19 (c) | | | |
| (Cost $220) | | 220 | 220 |
| | | Shares | Value (000s) |
|
| Money Market Funds - 3.2% | | | |
| Fidelity Cash Central Fund 1.83% (d) | | 7,518,294 | $7,520 |
| Fidelity Securities Lending Cash Central Fund 1.84% (d)(e) | | 25,028,542 | 25,031 |
| TOTAL MONEY MARKET FUNDS | | | |
| (Cost $32,550) | | | 32,551 |
| TOTAL INVESTMENT IN SECURITIES - 102.3% | | | |
| (Cost $872,231) | | | 1,052,732 |
| NET OTHER ASSETS (LIABILITIES) - (2.3)% | | | (23,381) |
| NET ASSETS - 100% | | | $1,029,351 |
Legend
(a) Non-income producing
(b) Security or a portion of the security is on loan at period end.
(c) Security or a portion of the security was pledged to cover margin requirements for futures contracts. At period end, the value of securities pledged amounted to $10,000.
(d) Affiliated fund that is generally available only to investment companies and other accounts managed by Fidelity Investments. The rate quoted is the annualized seven-day yield of the fund at period end. A complete unaudited listing of the fund's holdings as of its most recent quarter end is available upon request. In addition, each Fidelity Central Fund's financial statements, which are not covered by the Fund's Report of Independent Registered Public Accounting Firm, are available on the SEC's website or upon request.
(e) Investment made with cash collateral received from securities on loan.
Affiliated Central Funds
Information regarding fiscal year to date income earned by the Fund from investments in Fidelity Central Funds is as follows:
| Fund | Income earned |
| | (Amounts in thousands) |
| Fidelity Cash Central Fund | $558 |
| Fidelity Securities Lending Cash Central Fund | 171 |
| Total | $729 |
Amounts in the income column in the above table include any capital gain distributions from underlying funds, which are presented in the corresponding line-item in the Statement of Operations, if applicable. Amount for Fidelity Securities Lending Cash Central Fund represents the income earned on investing cash collateral, less rebates paid to borrowers and any lending agent fees associated with the loan, plus any premium payments received for lending certain types of securities.
Investment Valuation
The following is a summary of the inputs used, as of October 31, 2019, involving the Fund's assets and liabilities carried at fair value. The inputs or methodology used for valuing securities may not be an indication of the risk associated with investing in those securities. For more information on valuation inputs, and their aggregation into the levels used below, please refer to the Investment Valuation section in the accompanying Notes to Financial Statements.
| | Valuation Inputs at Reporting Date: |
| Description | Total | Level 1 | Level 2 | Level 3 |
| (Amounts in thousands) | | | | |
| Investments in Securities: | | | | |
| Equities: | | | | |
| Communication Services | $21,520 | $21,520 | $-- | $-- |
| Consumer Discretionary | 145,965 | 145,965 | -- | -- |
| Consumer Staples | 53,894 | 53,894 | -- | -- |
| Energy | 10,147 | 10,147 | -- | -- |
| Financials | 196,404 | 196,404 | -- | -- |
| Health Care | 147,321 | 147,321 | -- | -- |
| Industrials | 157,596 | 157,596 | -- | -- |
| Information Technology | 171,766 | 171,766 | -- | -- |
| Materials | 31,135 | 31,135 | -- | -- |
| Real Estate | 71,099 | 71,099 | -- | -- |
| Utilities | 13,114 | 13,114 | -- | -- |
| U.S. Government and Government Agency Obligations | 220 | -- | 220 | -- |
| Money Market Funds | 32,551 | 32,551 | -- | -- |
| Total Investments in Securities: | $1,052,732 | $1,052,512 | $220 | $-- |
See accompanying notes which are an integral part of the financial statements.
Financial Statements
Statement of Assets and Liabilities
| Amounts in thousands (except per-share amounts) | | October 31, 2019 |
| Assets | | |
Investment in securities, at value (including securities loaned of $24,281) — See accompanying schedule:
Unaffiliated issuers (cost $839,681) | $1,020,181 | |
| Fidelity Central Funds (cost $32,550) | 32,551 | |
| Total Investment in Securities (cost $872,231) | | $1,052,732 |
| Cash | | 38 |
| Receivable for investments sold | | 2,148 |
| Receivable for fund shares sold | | 599 |
| Dividends receivable | | 125 |
| Distributions receivable from Fidelity Central Funds | | 34 |
| Prepaid expenses | | 2 |
| Other receivables | | 26 |
| Total assets | | 1,055,704 |
| Liabilities | | |
| Payable for investments purchased | $34 | |
| Payable for fund shares redeemed | 425 | |
| Accrued management fee | 583 | |
| Distribution and service plan fees payable | 17 | |
| Other affiliated payables | 209 | |
| Other payables and accrued expenses | 58 | |
| Collateral on securities loaned | 25,027 | |
| Total liabilities | | 26,353 |
| Net Assets | | $1,029,351 |
| Net Assets consist of: | | |
| Paid in capital | | $830,224 |
| Total accumulated earnings (loss) | | 199,127 |
| Net Assets | | $1,029,351 |
| Net Asset Value and Maximum Offering Price | | |
| Class A: | | |
| Net Asset Value and redemption price per share ($37,189 ÷ 1,561.0 shares)(a) | | $23.82 |
| Maximum offering price per share (100/94.25 of $23.82) | | $25.27 |
| Class M: | | |
| Net Asset Value and redemption price per share ($7,428 ÷ 322.9 shares)(a) | | $23.00 |
| Maximum offering price per share (100/96.50 of $23.00) | | $23.83 |
| Class C: | | |
| Net Asset Value and offering price per share ($7,542 ÷ 351.9 shares)(a) | | $21.43 |
| Stock Selector Small Cap: | | |
| Net Asset Value, offering price and redemption price per share ($937,952 ÷ 38,337.5 shares) | | $24.47 |
| Class I: | | |
| Net Asset Value, offering price and redemption price per share ($9,060 ÷ 369.2 shares) | | $24.54 |
| Class Z: | | |
| Net Asset Value, offering price and redemption price per share ($30,180 ÷ 1,229.5 shares) | | $24.55 |
(a) Redemption price per share is equal to net asset value less any applicable contingent deferred sales charge.
See accompanying notes which are an integral part of the financial statements.
Statement of Operations
| Amounts in thousands | | Year ended October 31, 2019 |
| Investment Income | | |
| Dividends | | $11,746 |
| Interest | | 9 |
| Income from Fidelity Central Funds (including $171 from security lending) | | 729 |
| Total income | | 12,484 |
| Expenses | | |
| Management fee | | |
| Basic fee | $6,637 | |
| Performance adjustment | (848) | |
| Transfer agent fees | 2,058 | |
| Distribution and service plan fees | 171 | |
| Accounting and security lending fees | 369 | |
| Custodian fees and expenses | 38 | |
| Independent trustees' fees and expenses | 6 | |
| Registration fees | 119 | |
| Audit | 67 | |
| Legal | 8 | |
| Miscellaneous | 11 | |
| Total expenses before reductions | 8,636 | |
| Expense reductions | (14) | |
| Total expenses after reductions | | 8,622 |
| Net investment income (loss) | | 3,862 |
| Realized and Unrealized Gain (Loss) | | |
| Net realized gain (loss) on: | | |
| Investment securities: | | |
| Unaffiliated issuers | 25,175 | |
| Redemptions in-kind with affiliated entities | 41,770 | |
| Foreign currency transactions | (4) | |
| Futures contracts | (898) | |
| Total net realized gain (loss) | | 66,043 |
| Change in net unrealized appreciation (depreciation) on: | | |
| Investment securities: | | |
| Unaffiliated issuers | 50,890 | |
| Fidelity Central Funds | 1 | |
| Futures contracts | 22 | |
| Total change in net unrealized appreciation (depreciation) | | 50,913 |
| Net gain (loss) | | 116,956 |
| Net increase (decrease) in net assets resulting from operations | | $120,818 |
See accompanying notes which are an integral part of the financial statements.
Statement of Changes in Net Assets
| Amounts in thousands | Year ended October 31, 2019 | Year ended October 31, 2018 |
| Increase (Decrease) in Net Assets | | |
| Operations | | |
| Net investment income (loss) | $3,862 | $5,870 |
| Net realized gain (loss) | 66,043 | 219,021 |
| Change in net unrealized appreciation (depreciation) | 50,913 | (182,932) |
| Net increase (decrease) in net assets resulting from operations | 120,818 | 41,959 |
| Distributions to shareholders | (186,724) | (151,381) |
| Share transactions - net increase (decrease) | (20,129) | (351,977) |
| Redemption fees | – | 10 |
| Total increase (decrease) in net assets | (86,035) | (461,389) |
| Net Assets | | |
| Beginning of period | 1,115,386 | 1,576,775 |
| End of period | $1,029,351 | $1,115,386 |
See accompanying notes which are an integral part of the financial statements.
Financial Highlights
Fidelity Stock Selector Small Cap Fund Class A
| Years ended October 31, | 2019 | 2018 | 2017 | 2016 | 2015 |
| Selected Per–Share Data | | | | | |
| Net asset value, beginning of period | $25.94 | $28.16 | $23.48 | $24.48 | $25.76 |
| Income from Investment Operations | | | | | |
| Net investment income (loss)A | .01 | .04B | –C | .05 | .06 |
| Net realized and unrealized gain (loss) | 2.30 | .43 | 5.05 | .52 | .96 |
| Total from investment operations | 2.31 | .47 | 5.05 | .57 | 1.02 |
| Distributions from net investment income | (.01) | (.03) | (.07) | (.05) | (.03) |
| Distributions from net realized gain | (4.42) | (2.65) | (.30) | (1.52) | (2.27) |
| Total distributions | (4.43) | (2.69)D | (.37) | (1.57) | (2.30) |
| Redemption fees added to paid in capitalA | – | –C | –C | –C | –C |
| Net asset value, end of period | $23.82 | $25.94 | $28.16 | $23.48 | $24.48 |
| Total ReturnE,F | 11.55% | 1.73% | 21.62% | 2.30% | 4.19% |
| Ratios to Average Net AssetsG,H | | | | | |
| Expenses before reductions | 1.04% | .97% | 1.05% | 1.16% | 1.01% |
| Expenses net of fee waivers, if any | 1.04% | .97% | 1.04% | 1.16% | 1.01% |
| Expenses net of all reductions | 1.04% | .95% | 1.04% | 1.15% | 1.00% |
| Net investment income (loss) | .06% | .14%B | .02% | .22% | .24% |
| Supplemental Data | | | | | |
| Net assets, end of period (in millions) | $37 | $23 | $14 | $12 | $11 |
| Portfolio turnover rateI | 56%J | 68% | 62% | 57% | 48% |
A Calculated based on average shares outstanding during the period.
B Net investment income per share reflects a large, non-recurring dividend which amounted to $.03 per share. Excluding this non-recurring dividend, the ratio of net investment income (loss) to average net assets would have been .04%.
C Amount represents less than $.005 per share.
D Total distributions of $2.69 per share is comprised of distributions from net investment income of $.034 and distributions from net realized gain of $2.651 per share.
E Total returns would have been lower if certain expenses had not been reduced during the applicable periods shown.
F Total returns do not include the effect of the sales charges.
G Fees and expenses of any underlying Fidelity Central Funds are not included in the Fund's expense ratio. The Fund indirectly bears its proportionate share of the expenses of any underlying Fidelity Central Funds.
H Expense ratios reflect operating expenses of the class. Expenses before reductions do not reflect amounts reimbursed by the investment adviser or reductions from brokerage service arrangements or reductions from other expense offset arrangements and do not represent the amount paid by the class during periods when reimbursements or reductions occur. Expenses net of fee waivers reflect expenses after reimbursement by the investment adviser but prior to reductions from brokerage service arrangements or other expense offset arrangements. Expenses net of all reductions represent the net expenses paid by the class.
I Amount does not include the portfolio activity of any underlying Fidelity Central Funds.
J Portfolio turnover rate excludes securities received or delivered in-kind.
See accompanying notes which are an integral part of the financial statements.
Fidelity Stock Selector Small Cap Fund Class M
| Years ended October 31, | 2019 | 2018 | 2017 | 2016 | 2015 |
| Selected Per–Share Data | | | | | |
| Net asset value, beginning of period | $25.21 | $27.49 | $22.95 | $24.00 | $25.30 |
| Income from Investment Operations | | | | | |
| Net investment income (loss)A | (.05) | (.06)B | (.08) | (.03) | (.03) |
| Net realized and unrealized gain (loss) | 2.21 | .43 | 4.92 | .50 | .97 |
| Total from investment operations | 2.16 | .37 | 4.84 | .47 | .94 |
| Distributions from net investment income | – | – | – | – | – |
| Distributions from net realized gain | (4.37) | (2.65) | (.30) | (1.52) | (2.24) |
| Total distributions | (4.37) | (2.65) | (.30) | (1.52) | (2.24) |
| Redemption fees added to paid in capitalA | – | –C | –C | –C | –C |
| Net asset value, end of period | $23.00 | $25.21 | $27.49 | $22.95 | $24.00 |
| Total ReturnD,E | 11.20% | 1.40% | 21.20% | 1.89% | 3.90% |
| Ratios to Average Net AssetsF,G | | | | | |
| Expenses before reductions | 1.35% | 1.33% | 1.39% | 1.51% | 1.35% |
| Expenses net of fee waivers, if any | 1.35% | 1.33% | 1.39% | 1.51% | 1.35% |
| Expenses net of all reductions | 1.35% | 1.32% | 1.39% | 1.50% | 1.34% |
| Net investment income (loss) | (.24)% | (.22)%B | (.33)% | (.13)% | (.10)% |
| Supplemental Data | | | | | |
| Net assets, end of period (in millions) | $7 | $5 | $3 | $3 | $3 |
| Portfolio turnover rateH | 56%I | 68% | 62% | 57% | 48% |
A Calculated based on average shares outstanding during the period.
B Net investment income per share reflects a large, non-recurring dividend which amounted to $.03 per share. Excluding this non-recurring dividend, the ratio of net investment income (loss) to average net assets would have been (.32) %.
C Amount represents less than $.005 per share.
D Total returns would have been lower if certain expenses had not been reduced during the applicable periods shown.
E Total returns do not include the effect of the sales charges.
F Fees and expenses of any underlying Fidelity Central Funds are not included in the Fund's expense ratio. The Fund indirectly bears its proportionate share of the expenses of any underlying Fidelity Central Funds.
G Expense ratios reflect operating expenses of the class. Expenses before reductions do not reflect amounts reimbursed by the investment adviser or reductions from brokerage service arrangements or reductions from other expense offset arrangements and do not represent the amount paid by the class during periods when reimbursements or reductions occur. Expenses net of fee waivers reflect expenses after reimbursement by the investment adviser but prior to reductions from brokerage service arrangements or other expense offset arrangements. Expenses net of all reductions represent the net expenses paid by the class.
H Amount does not include the portfolio activity of any underlying Fidelity Central Funds.
I Portfolio turnover rate excludes securities received or delivered in-kind.
See accompanying notes which are an integral part of the financial statements.
Fidelity Stock Selector Small Cap Fund Class C
| Years ended October 31, | 2019 | 2018 | 2017 | 2016 | 2015 |
| Selected Per–Share Data | | | | | |
| Net asset value, beginning of period | $23.79 | $26.20 | $21.99 | $23.16 | $24.49 |
| Income from Investment Operations | | | | | |
| Net investment income (loss)A | (.16) | (.17)B | (.20) | (.13) | (.14) |
| Net realized and unrealized gain (loss) | 2.06 | .41 | 4.71 | .48 | .93 |
| Total from investment operations | 1.90 | .24 | 4.51 | .35 | .79 |
| Distributions from net investment income | – | – | – | – | – |
| Distributions from net realized gain | (4.26) | (2.65) | (.30) | (1.52) | (2.12) |
| Total distributions | (4.26) | (2.65) | (.30) | (1.52) | (2.12) |
| Redemption fees added to paid in capitalA | – | –C | –C | –C | –C |
| Net asset value, end of period | $21.43 | $23.79 | $26.20 | $21.99 | $23.16 |
| Total ReturnD,E | 10.64% | .94% | 20.62% | 1.41% | 3.36% |
| Ratios to Average Net AssetsF,G | | | | | |
| Expenses before reductions | 1.86% | 1.79% | 1.87% | 1.98% | 1.84% |
| Expenses net of fee waivers, if any | 1.86% | 1.79% | 1.87% | 1.98% | 1.84% |
| Expenses net of all reductions | 1.86% | 1.78% | 1.86% | 1.97% | 1.83% |
| Net investment income (loss) | (.76)% | (.68)%B | (.81)% | (.60)% | (.59)% |
| Supplemental Data | | | | | |
| Net assets, end of period (in millions) | $8 | $6 | $5 | $3 | $4 |
| Portfolio turnover rateH | 56%I | 68% | 62% | 57% | 48% |
A Calculated based on average shares outstanding during the period.
B Net investment income per share reflects a large, non-recurring dividend which amounted to $.03 per share. Excluding this non-recurring dividend, the ratio of net investment income (loss) to average net assets would have been (.78) %.
C Amount represents less than $.005 per share.
D Total returns would have been lower if certain expenses had not been reduced during the applicable periods shown.
E Total returns do not include the effect of the contingent deferred sales charge.
F Fees and expenses of any underlying Fidelity Central Funds are not included in the Fund's expense ratio. The Fund indirectly bears its proportionate share of the expenses of any underlying Fidelity Central Funds.
G Expense ratios reflect operating expenses of the class. Expenses before reductions do not reflect amounts reimbursed by the investment adviser or reductions from brokerage service arrangements or reductions from other expense offset arrangements and do not represent the amount paid by the class during periods when reimbursements or reductions occur. Expenses net of fee waivers reflect expenses after reimbursement by the investment adviser but prior to reductions from brokerage service arrangements or other expense offset arrangements. Expenses net of all reductions represent the net expenses paid by the class.
H Amount does not include the portfolio activity of any underlying Fidelity Central Funds.
I Portfolio turnover rate excludes securities received or delivered in-kind.
See accompanying notes which are an integral part of the financial statements.
Fidelity Stock Selector Small Cap Fund
| Years ended October 31, | 2019 | 2018 | 2017 | 2016 | 2015 |
| Selected Per–Share Data | | | | | |
| Net asset value, beginning of period | $26.50 | $28.71 | $23.91 | $24.89 | $26.15 |
| Income from Investment Operations | | | | | |
| Net investment income (loss)A | .08 | .12B | .08 | .11 | .12 |
| Net realized and unrealized gain (loss) | 2.36 | .43 | 5.15 | .54 | .98 |
| Total from investment operations | 2.44 | .55 | 5.23 | .65 | 1.10 |
| Distributions from net investment income | (.06) | (.11) | (.12) | (.11) | (.09) |
| Distributions from net realized gain | (4.42) | (2.65) | (.30) | (1.52) | (2.27) |
| Total distributions | (4.47)C | (2.76) | (.43)D | (1.63) | (2.36) |
| Redemption fees added to paid in capitalA | – | –E | –E | –E | –E |
| Net asset value, end of period | $24.47 | $26.50 | $28.71 | $23.91 | $24.89 |
| Total ReturnF | 11.90% | 2.04% | 22.00% | 2.57% | 4.46% |
| Ratios to Average Net AssetsG,H | | | | | |
| Expenses before reductions | .75% | .68% | .75% | .89% | .77% |
| Expenses net of fee waivers, if any | .75% | .68% | .75% | .89% | .77% |
| Expenses net of all reductions | .75% | .67% | .74% | .88% | .76% |
| Net investment income (loss) | .36% | .43%B | .31% | .49% | .48% |
| Supplemental Data | | | | | |
| Net assets, end of period (in millions) | $938 | $1,035 | $1,511 | $1,359 | $1,372 |
| Portfolio turnover rateI | 56%J | 68% | 62% | 57% | 48% |
A Calculated based on average shares outstanding during the period.
B Net investment income per share reflects a large, non-recurring dividend which amounted to $.03 per share. Excluding this non-recurring dividend, the ratio of net investment income (loss) to average net assets would have been .33%.
C Total distributions of $4.47 per share is comprised of distributions from net investment income of $.055 and distributions from net realized gain of $4.418 per share.
D Total distributions of $.43 per share is comprised of distributions from net investment income of $.123 and distributions from net realized gain of $.303 per share.
E Amount represents less than $.005 per share.
F Total returns would have been lower if certain expenses had not been reduced during the applicable periods shown.
G Fees and expenses of any underlying Fidelity Central Funds are not included in the Fund's expense ratio. The Fund indirectly bears its proportionate share of the expenses of any underlying Fidelity Central Funds.
H Expense ratios reflect operating expenses of the class. Expenses before reductions do not reflect amounts reimbursed by the investment adviser or reductions from brokerage service arrangements or reductions from other expense offset arrangements and do not represent the amount paid by the class during periods when reimbursements or reductions occur. Expenses net of fee waivers reflect expenses after reimbursement by the investment adviser but prior to reductions from brokerage service arrangements or other expense offset arrangements. Expenses net of all reductions represent the net expenses paid by the class.
I Amount does not include the portfolio activity of any underlying Fidelity Central Funds.
J Portfolio turnover rate excludes securities received or delivered in-kind.
See accompanying notes which are an integral part of the financial statements.
Fidelity Stock Selector Small Cap Fund Class I
| Years ended October 31, | 2019 | 2018 | 2017 | 2016 | 2015 |
| Selected Per–Share Data | | | | | |
| Net asset value, beginning of period | $26.57 | $28.78 | $23.97 | $24.96 | $26.21 |
| Income from Investment Operations | | | | | |
| Net investment income (loss)A | .08 | .12B | .08 | .12 | .13 |
| Net realized and unrealized gain (loss) | 2.37 | .43 | 5.15 | .53 | .99 |
| Total from investment operations | 2.45 | .55 | 5.23 | .65 | 1.12 |
| Distributions from net investment income | (.06) | (.11) | (.12) | (.12) | (.10) |
| Distributions from net realized gain | (4.42) | (2.65) | (.30) | (1.52) | (2.27) |
| Total distributions | (4.48) | (2.76) | (.42) | (1.64) | (2.37) |
| Redemption fees added to paid in capitalA | – | –C | –C | –C | –C |
| Net asset value, end of period | $24.54 | $26.57 | $28.78 | $23.97 | $24.96 |
| Total ReturnD | 11.87% | 2.02% | 21.97% | 2.55% | 4.52% |
| Ratios to Average Net AssetsE,F | | | | | |
| Expenses before reductions | .76% | .69% | .75% | .87% | .74% |
| Expenses net of fee waivers, if any | .76% | .69% | .75% | .87% | .73% |
| Expenses net of all reductions | .75% | .68% | .75% | .87% | .73% |
| Net investment income (loss) | .35% | .42%B | .31% | .50% | .51% |
| Supplemental Data | | | | | |
| Net assets, end of period (in millions) | $9 | $40 | $43 | $43 | $46 |
| Portfolio turnover rateG | 56%H | 68% | 62% | 57% | 48% |
A Calculated based on average shares outstanding during the period.
B Net investment income per share reflects a large, non-recurring dividend which amounted to $.03 per share. Excluding this non-recurring dividend, the ratio of net investment income (loss) to average net assets would have been .31%.
C Amount represents less than $.005 per share.
D Total returns would have been lower if certain expenses had not been reduced during the applicable periods shown.
E Fees and expenses of any underlying Fidelity Central Funds are not included in the Fund's expense ratio. The Fund indirectly bears its proportionate share of the expenses of any underlying Fidelity Central Funds.
F Expense ratios reflect operating expenses of the class. Expenses before reductions do not reflect amounts reimbursed by the investment adviser or reductions from brokerage service arrangements or reductions from other expense offset arrangements and do not represent the amount paid by the class during periods when reimbursements or reductions occur. Expenses net of fee waivers reflect expenses after reimbursement by the investment adviser but prior to reductions from brokerage service arrangements or other expense offset arrangements. Expenses net of all reductions represent the net expenses paid by the class.
G Amount does not include the portfolio activity of any underlying Fidelity Central Funds.
H Portfolio turnover rate excludes securities received or delivered in-kind.
See accompanying notes which are an integral part of the financial statements.
Fidelity Stock Selector Small Cap Fund Class Z
| Years ended October 31, | 2019 | 2018 | 2017 A |
| Selected Per–Share Data | | | |
| Net asset value, beginning of period | $26.59 | $28.81 | $26.36 |
| Income from Investment Operations | | | |
| Net investment income (loss)B | .12 | .16C | .07 |
| Net realized and unrealized gain (loss) | 2.36 | .43 | 2.38 |
| Total from investment operations | 2.48 | .59 | 2.45 |
| Distributions from net investment income | (.10) | (.16) | – |
| Distributions from net realized gain | (4.42) | (2.65) | – |
| Total distributions | (4.52) | (2.81) | – |
| Redemption fees added to paid in capitalB | – | –D | –D |
| Net asset value, end of period | $24.55 | $26.59 | $28.81 |
| Total ReturnE,F | 12.05% | 2.17% | 9.29% |
| Ratios to Average Net AssetsG,H | | | |
| Expenses before reductions | .61% | .55% | .62%I |
| Expenses net of fee waivers, if any | .61% | .55% | .61%I |
| Expenses net of all reductions | .61% | .54% | .61%I |
| Net investment income (loss) | .49% | .56%C | .34%I |
| Supplemental Data | | | |
| Net assets, end of period (in millions) | $30 | $6 | $1 |
| Portfolio turnover rateJ | 56%K | 68% | 62%I |
A For the period February 1, 2017 (commencement of sale of shares) to October 31, 2017.
B Calculated based on average shares outstanding during the period.
C Net investment income per share reflects a large, non-recurring dividend which amounted to $.03 per share. Excluding this non-recurring dividend, the ratio of net investment income (loss) to average net assets would have been .46%.
D Amount represents less than $.005 per share.
E Total returns for periods of less than one year are not annualized.
F Total returns would have been lower if certain expenses had not been reduced during the applicable periods shown.
G Fees and expenses of any underlying Fidelity Central Funds are not included in the Fund's expense ratio. The Fund indirectly bears its proportionate share of the expenses of any underlying Fidelity Central Funds.
H Expense ratios reflect operating expenses of the class. Expenses before reductions do not reflect amounts reimbursed by the investment adviser or reductions from brokerage service arrangements or reductions from other expense offset arrangements and do not represent the amount paid by the class during periods when reimbursements or reductions occur. Expense ratios before reductions for start-up periods may not be representative of longer-term operating periods. Expenses net of fee waivers reflect expenses after reimbursement by the investment adviser but prior to reductions from brokerage service arrangements or other expense offset arrangements. Expenses net of all reductions represent the net expenses paid by the class.
I Annualized
J Amount does not include the portfolio activity of any underlying Fidelity Central Funds.
K Portfolio turnover rate excludes securities received or delivered in-kind.
See accompanying notes which are an integral part of the financial statements.
Notes to Financial Statements
For the period ended October 31, 2019
(Amounts in thousands except percentages)
1. Organization.
Fidelity Stock Selector Small Cap Fund (the Fund) is a fund of Fidelity Capital Trust (the Trust) and is authorized to issue an unlimited number of shares. The Trust is registered under the Investment Company Act of 1940, as amended (the 1940 Act), as an open-end management investment company organized as a Massachusetts business trust. The Fund offers Class A, Class M, Class C, Stock Selector Small Cap, Class I and Class Z shares, each of which has equal rights as to assets and voting privileges. Each class has exclusive voting rights with respect to matters that affect that class.
Effective March 1, 2019, Class C shares will automatically convert to Class A shares after a holding period of ten years from the initial date of purchase, with certain exceptions.
2. Investments in Fidelity Central Funds.
The Fund invests in Fidelity Central Funds, which are open-end investment companies generally available only to other investment companies and accounts managed by the investment adviser and its affiliates. The Fund's Schedule of Investments lists each of the Fidelity Central Funds held as of period end, if any, as an investment of the Fund, but does not include the underlying holdings of each Fidelity Central Fund. As an Investing Fund, the Fund indirectly bears its proportionate share of the expenses of the underlying Fidelity Central Funds.
The Money Market Central Funds seek preservation of capital and current income and are managed by Fidelity Investments Money Management, Inc. (FIMM), an affiliate of the investment adviser. Annualized expenses of the Money Market Central Funds as of their most recent shareholder report date ranged from less than .005% to .01%.
A complete unaudited list of holdings for each Fidelity Central Fund is available upon request or at the Securities and Exchange Commission (the SEC) website at www.sec.gov. In addition, the financial statements of the Fidelity Central Funds, which are not covered by the Fund's Report of Independent Registered Public Accounting Firm, are available on the SEC website or upon request.
3. Significant Accounting Policies.
The Fund is an investment company and applies the accounting and reporting guidance of the Financial Accounting Standards Board (FASB) Accounting Standards Codification Topic 946 Financial Services – Investments Companies. The financial statements have been prepared in conformity with accounting principles generally accepted in the United States of America (GAAP), which require management to make certain estimates and assumptions at the date of the financial statements. Actual results could differ from those estimates. Subsequent events, if any, through the date that the financial statements were issued have been evaluated in the preparation of the financial statements. The following summarizes the significant accounting policies of the Fund:
Investment Valuation. Investments are valued as of 4:00 p.m. Eastern time on the last calendar day of the period. The Board of Trustees (the Board) has delegated the day to day responsibility for the valuation of the Fund's investments to the Fair Value Committee (the Committee) established by the Fund's investment adviser. In accordance with valuation policies and procedures approved by the Board, the Fund attempts to obtain prices from one or more third party pricing vendors or brokers to value its investments. When current market prices, quotations or currency exchange rates are not readily available or reliable, investments will be fair valued in good faith by the Committee, in accordance with procedures adopted by the Board. Factors used in determining fair value vary by investment type and may include market or investment specific events, changes in interest rates and credit quality. The frequency with which these procedures are used cannot be predicted and they may be utilized to a significant extent. The Committee oversees the Fund's valuation policies and procedures and reports to the Board on the Committee's activities and fair value determinations. The Board monitors the appropriateness of the procedures used in valuing the Fund's investments and ratifies the fair value determinations of the Committee.
The Fund categorizes the inputs to valuation techniques used to value its investments into a disclosure hierarchy consisting of three levels as shown below:
- Level 1 – quoted prices in active markets for identical investments
- Level 2 – other significant observable inputs (including quoted prices for similar investments, interest rates, prepayment speeds, etc.)
- Level 3 – unobservable inputs (including the Fund's own assumptions based on the best information available)
Valuation techniques used to value the Fund's investments by major category are as follows:
Equity securities, including restricted securities, for which market quotations are readily available, are valued at the last reported sale price or official closing price as reported by a third party pricing vendor on the primary market or exchange on which they are traded and are categorized as Level 1 in the hierarchy. In the event there were no sales during the day or closing prices are not available, securities are valued at the last quoted bid price or may be valued using the last available price and are generally categorized as Level 2 in the hierarchy. For foreign equity securities, when market or security specific events arise, comparisons to the valuation of American Depositary Receipts (ADRs), futures contracts, Exchange-Traded Funds (ETFs) and certain indexes as well as quoted prices for similar securities may be used and would be categorized as Level 2 in the hierarchy. For equity securities, including restricted securities, where observable inputs are limited, assumptions about market activity and risk are used and these securities may be categorized as Level 3 in the hierarchy.
Debt securities, including restricted securities, are valued based on evaluated prices received from third party pricing vendors or from brokers who make markets in such securities. U.S. government and government agency obligations are valued by pricing vendors who utilize matrix pricing which considers yield or price of bonds of comparable quality, coupon, maturity and type or by broker-supplied prices. When independent prices are unavailable or unreliable, debt securities may be valued utilizing pricing methodologies which consider similar factors that would be used by third party pricing vendors. Debt securities are generally categorized as Level 2 in the hierarchy but may be Level 3 depending on the circumstances.
Investments in open-end mutual funds, including the Fidelity Central Funds, are valued at their closing net asset value (NAV) each business day and are categorized as Level 1 in the hierarchy.
Changes in valuation techniques may result in transfers in or out of an assigned level within the disclosure hierarchy. The aggregate value of investments by input level as of October 31, 2019 is included at the end of the Fund's Schedule of Investments.
Foreign Currency. The Fund may use foreign currency contracts to facilitate transactions in foreign-denominated securities. Gains and losses from these transactions may arise from changes in the value of the foreign currency or if the counterparties do not perform under the contracts' terms.
Foreign-denominated assets, including investment securities, and liabilities are translated into U.S. dollars at the exchange rates at period end. Purchases and sales of investment securities, income and dividends received and expenses denominated in foreign currencies are translated into U.S. dollars at the exchange rate in effect on the transaction date.
The effects of exchange rate fluctuations on investments are included with the net realized and unrealized gain (loss) on investment securities. Other foreign currency transactions resulting in realized and unrealized gain (loss) are disclosed separately.
Investment Transactions and Income. For financial reporting purposes, the Fund's investment holdings and NAV include trades executed through the end of the last business day of the period. The NAV per share for processing shareholder transactions is calculated as of the close of business of the New York Stock Exchange (NYSE), normally 4:00 p.m. Eastern time and includes trades executed through the end of the prior business day. Gains and losses on securities sold are determined on the basis of identified cost and include proceeds received from litigation. Dividend income is recorded on the ex-dividend date, except for certain dividends from foreign securities where the ex-dividend date may have passed, which are recorded as soon as the Fund is informed of the ex-dividend date. Non-cash dividends included in dividend income, if any, are recorded at the fair market value of the securities received. Income and capital gain distributions from Fidelity Central Funds, if any, are recorded on the ex-dividend date. Certain distributions received by the Fund represent a return of capital or capital gain. The Fund determines the components of these distributions subsequent to the ex-dividend date, based upon receipt of tax filings or other correspondence relating to the underlying investment. These distributions are recorded as a reduction of cost of investments and/or as a realized gain. Interest income is accrued as earned and includes coupon interest and amortization of premium and accretion of discount on debt securities as applicable. Investment income is recorded net of foreign taxes withheld where recovery of such taxes is uncertain.
Class Allocations and Expenses. Investment income, realized and unrealized capital gains and losses, common expenses of the Fund, and certain fund-level expense reductions, if any, are allocated daily on a pro-rata basis to each class based on the relative net assets of each class to the total net assets of the Fund. Each class differs with respect to transfer agent and distribution and service plan fees incurred. Certain expense reductions may also differ by class. For the reporting period, the allocated portion of income and expenses to each class as a percent of its average net assets may vary due to the timing of recording these transactions in relation to fluctuating net assets of the classes. Expenses directly attributable to a fund are charged to that fund. Expenses attributable to more than one fund are allocated among the respective funds on the basis of relative net assets or other appropriate methods. Expense estimates are accrued in the period to which they relate and adjustments are made when actual amounts are known.
Income Tax Information and Distributions to Shareholders. Each year, the Fund intends to qualify as a regulated investment company under Subchapter M of the Internal Revenue Code, including distributing substantially all of its taxable income and realized gains. As a result, no provision for U.S. Federal income taxes is required. As of October 31, 2019, the Fund did not have any unrecognized tax benefits in the financial statements; nor is the Fund aware of any tax positions for which it is reasonably possible that the total amounts of unrecognized tax benefits will significantly change in the next twelve months. The Fund files a U.S. federal tax return, in addition to state and local tax returns as required. The Fund's federal income tax returns are subject to examination by the Internal Revenue Service (IRS) for a period of three fiscal years after they are filed. State and local tax returns may be subject to examination for an additional fiscal year depending on the jurisdiction. Foreign taxes are provided for based on the Fund's understanding of the tax rules and rates that exist in the foreign markets in which it invests.
Distributions are declared and recorded on the ex-dividend date. Income and capital gain distributions are declared separately for each class. Income and capital gain distributions are determined in accordance with income tax regulations, which may differ from GAAP. In addition, the Fund claimed a portion of the payment made to redeeming shareholders as a distribution for income tax purposes.
Capital accounts within the financial statements are adjusted for permanent book-tax differences. These adjustments have no impact on net assets or the results of operations. Capital accounts are not adjusted for temporary book-tax differences which will reverse in a subsequent period.
Book-tax differences are primarily due to futures contracts, foreign currency transactions, passive foreign investment companies (PFIC), market discount, redemptions in kind and losses deferred due to wash sales.
As of period end, the cost and unrealized appreciation (depreciation) in securities, and derivatives if applicable, for federal income tax purposes were as follows:
| Gross unrealized appreciation | $215,872 |
| Gross unrealized depreciation | (38,568) |
| Net unrealized appreciation (depreciation) | $177,304 |
| Tax Cost | $875,428 |
The tax-based components of distributable earnings as of period end were as follows:
| Undistributed ordinary income | $2,329 |
| Undistributed long-term capital gain | $19,494 |
| Net unrealized appreciation (depreciation) on securities and other investments | $177,304 |
The tax character of distributions paid was as follows:
| | October 31, 2019 | October 31, 2018 |
| Ordinary Income | $14,391 | $ 6,116 |
| Long-term Capital Gains | 172,333 | 145,265 |
| Total | $186,724 | $ 151,381 |
4. Derivative Instruments.
Risk Exposures and the Use of Derivative Instruments. The Fund's investment objective allows the Fund to enter into various types of derivative contracts, including futures contracts. Derivatives are investments whose value is primarily derived from underlying assets, indices or reference rates and may be transacted on an exchange or over-the-counter (OTC). Derivatives may involve a future commitment to buy or sell a specified asset based on specified terms, to exchange future cash flows at periodic intervals based on a notional principal amount, or for one party to make one or more payments upon the occurrence of specified events in exchange for periodic payments from the other party.
The Fund used derivatives to increase returns and to manage exposure to certain risks as defined below. The success of any strategy involving derivatives depends on analysis of numerous economic factors, and if the strategies for investment do not work as intended, the Fund may not achieve its objectives.
The Fund's use of derivatives increased or decreased its exposure to the following risk:
| Equity Risk | Equity risk relates to the fluctuations in the value of financial instruments as a result of changes in market prices (other than those arising from interest rate risk or foreign exchange risk), whether caused by factors specific to an individual investment, its issuer, or all factors affecting all instruments traded in a market or market segment.
|
The Fund is also exposed to additional risks from investing in derivatives, such as liquidity risk and counterparty credit risk. Liquidity risk is the risk that the Fund will be unable to close out the derivative in the open market in a timely manner. Counterparty credit risk is the risk that the counterparty will not be able to fulfill its obligation to the Fund. Counterparty credit risk related to exchange-traded futures contracts may be mitigated by the protection provided by the exchange on which they trade.
Investing in derivatives may involve greater risks than investing in the underlying assets directly and, to varying degrees, may involve risk of loss in excess of any initial investment and collateral received and amounts recognized in the Statement of Assets and Liabilities. In addition, there may be the risk that the change in value of the derivative contract does not correspond to the change in value of the underlying instrument.
Futures Contracts. A futures contract is an agreement between two parties to buy or sell a specified underlying instrument for a fixed price at a specified future date. The Fund used futures contracts to manage its exposure to the stock market.
Upon entering into a futures contract, a fund is required to deposit either cash or securities (initial margin) with a clearing broker in an amount equal to a certain percentage of the face value of the contract. Futures contracts are marked-to-market daily and subsequent daily payments (variation margin) are made or received by a fund depending on the daily fluctuations in the value of the futures contracts and are recorded as unrealized appreciation or (depreciation). This receivable and/or payable, if any, is included in daily variation margin on futures contracts in the Statement of Assets and Liabilities. Realized gain or (loss) is recorded upon the expiration or closing of a futures contract. The net realized gain (loss) and change in net unrealized appreciation (depreciation) on futures contracts during the period is presented in the Statement of Operations.
Any open futures contracts at period end are presented in the Schedule of Investments under the caption "Futures Contracts". The notional amount at value reflects each contract's exposure to the underlying instrument or index at period end. Securities deposited to meet initial margin requirements are identified in the Schedule of Investments.
5. Purchases and Sales of Investments.
Purchases and sales of securities, other than short-term securities and in-kind transactions, aggregated $613,932 and $632,655, respectively.
6. Fees and Other Transactions with Affiliates.
Management Fee. Fidelity Management & Research Company (the investment adviser) and its affiliates provide the Fund with investment management related services for which the Fund pays a monthly management fee. The management fee is the sum of an individual fund fee rate that is based on an annual rate of .35% of the Fund's average net assets and an annualized group fee rate that averaged .24% during the period. The group fee rate is based upon the average net assets of all the mutual funds advised by the investment adviser, including any mutual funds previously advised by the investment adviser that are currently advised by Fidelity SelectCo, LLC, an affiliate of the investment adviser. The group fee rate decreases as assets under management increase and increases as assets under management decrease. In addition, the management fee is subject to a performance adjustment (up to a maximum of +/- .20% of the Fund's average net assets over a 36 month performance period). The upward or downward adjustment to the management fee is based on the relative investment performance of Stock Selector Small Cap as compared to its benchmark index, the Russell 2000 Index, over the same 36 month performance period. For the reporting period, the total annual management fee rate, including the performance adjustment, was .51% of the Fund's average net assets. The performance adjustment included in the management fee rate may be higher or lower than the maximum performance adjustment rate due to the difference between the average net assets for the reporting and performance periods.
Distribution and Service Plan Fees. In accordance with Rule 12b-1 of the 1940 Act, the Fund has adopted separate Distribution and Service Plans for each class of shares. Certain classes pay Fidelity Distributors Corporation (FDC), an affiliate of the investment adviser, separate Distribution and Service Fees, each of which is based on an annual percentage of each class' average net assets. In addition, FDC may pay financial intermediaries for selling shares of the Fund and providing shareholder support services. For the period, the Distribution and Service Fee rates, total fees and amounts retained by FDC were as follows:
| | Distribution Fee | Service Fee | Total Fees | Retained by FDC |
| Class A | -% | .25% | $73 | $6 |
| Class M | .25% | .25% | 32 | – |
| Class C | .75% | .25% | 66 | 17 |
| | | | $171 | $23 |
Sales Load. FDC may receive a front-end sales charge of up to 5.75% for selling Class A shares and 3.50% for selling Class M shares, some of which is paid to financial intermediaries for selling shares of the Fund. Depending on the holding period, FDC may receive contingent deferred sales charges levied on Class A, Class M and Class C redemptions. The deferred sales charges are 1.00% for Class C shares, 1.00% for certain purchases of Class A shares and .25% for certain purchases of Class M shares.
For the period, sales charge amounts retained by FDC were as follows:
| | Retained by FDC |
| Class A | $32 |
| Class M | 4 |
| Class C(a) | 1 |
| | $37 |
(a) When Class C shares are initially sold, FDC pays commissions from its own resources to financial intermediaries through which the sales are made.
Transfer Agent Fees. Fidelity Investments Institutional Operations Company, Inc., (FIIOC), an affiliate of the investment adviser, is the transfer, dividend disbursing and shareholder servicing agent for each class of the Fund. FIIOC receives account fees and asset-based fees that vary according to the account size and type of account of the shareholders of the respective classes of the Fund, except for Class Z. FIIOC receives an asset-based fee of Class Z's average net assets. FIIOC pays for typesetting, printing and mailing of shareholder reports, except proxy statements.
For the period, transfer agent fees for each class were as follows:
| | Amount | % of Class-Level Average Net Assets |
| Class A | $68 | .23 |
| Class M | 18 | .28 |
| Class C | 20 | .30 |
| Stock Selector Small Cap | 1,872 | .18 |
| Class I | 75 | .19 |
| Class Z | 5 | .05 |
| | $2,058 | |
Accounting and Security Lending Fees. Fidelity Service Company, Inc. (FSC), an affiliate of the investment adviser, maintains the Fund's accounting records. The accounting fee is based on the level of average net assets for each month. Prior to April 1, 2019, FSC had a separate agreement with the Fund for administration of the security lending program, based on the number and duration of lending transactions. For the period, the total fees paid for accounting and administration of securities lending were equivalent to an annual rate of .03%.
Brokerage Commissions. The Fund placed a portion of its portfolio transactions with brokerage firms which are affiliates of the investment adviser. Brokerage commissions are included in net realized gain (loss) and change in net unrealized appreciation (depreciation) in the Statement of Operations. The commissions paid to these affiliated firms were $27 for the period.
Interfund Trades. The Fund may purchase from or sell securities to other Fidelity Funds under procedures adopted by the Board. The procedures have been designed to ensure these interfund trades are executed in accordance with Rule 17a-7 of the 1940 Act. Interfund trades are included within the respective purchases and sales amounts shown in the Purchases and Sales of Investments note.
Affiliated Redemptions In-Kind. During the period, 7,510 shares of the Fund were redeemed in-kind for investments and cash with a value of $177,450. The net realized gain of $41,770 on investments delivered through in-kind redemptions is included in the accompanying Statement of Operations. The amount of the in-kind redemptions is included in share transactions in the accompanying Statement of Changes in Net Assets as well as the Notes to Financial Statements. The Fund recognized no gain or loss for federal income tax purposes.
7. Committed Line of Credit.
The Fund participates with other funds managed by the investment adviser or an affiliate in a $4.25 billion credit facility (the "line of credit") to be utilized for temporary or emergency purposes to fund shareholder redemptions or for other short-term liquidity purposes. The Fund has agreed to pay commitment fees on its pro-rata portion of the line of credit, which amounted to $3 and is reflected in Miscellaneous expenses on the Statement of Operations. During the period, the Fund did not borrow on this line of credit.
8. Security Lending.
The Fund lends portfolio securities from time to time in order to earn additional income. For equity securities, lending agents are used, including National Financial Services (NFS), an affiliate of the Fund. Pursuant to a securities lending agreement, NFS will receive a fee, which is capped at 9.9% of daily lending revenue, for its services as lending agent. The Fund may lend securities to certain qualified borrowers, including NFS. On the settlement date of the loan, the Fund receives collateral (in the form of U.S. Treasury obligations, letters of credit and/or cash) against the loaned securities and maintains collateral in an amount not less than 100% of the market value of the loaned securities during the period of the loan. The market value of the loaned securities is determined at the close of business of the Fund and any additional required collateral is delivered to the Fund on the next business day. The Fund or borrower may terminate the loan at any time, and if the borrower defaults on its obligation to return the securities loaned because of insolvency or other reasons, the Fund may apply collateral received from the borrower against the obligation. The Fund may experience delays and costs in recovering the securities loaned. Any cash collateral received is invested in the Fidelity Securities Lending Cash Central Fund. The value of loaned securities and cash collateral at period end are disclosed on the Fund's Statement of Assets and Liabilities. The value of securities loaned to NFS, as affiliated borrower, at period end was $190. Total fees paid by the Fund to NFS, as lending agent, amounted to $7. Security lending income represents the income earned on investing cash collateral, less rebates paid to borrowers and any lending agent fees associated with the loan, plus any premium payments received for lending certain types of securities. Security lending income is presented in the Statement of Operations as a component of income from Fidelity Central Funds, and includes $8 from securities loaned to NFS, as affiliated borrower.
9. Expense Reductions.
Commissions paid to certain brokers with whom the investment adviser, or its affiliates, places trades on behalf of the Fund include an amount in addition to trade execution, which may be rebated back to the Fund to offset certain expenses. This amount totaled $6 for the period.
In addition, during the period the investment adviser reimbursed and/or waived a portion of fund-level operating expenses in the amount of $8.
10. Distributions to Shareholders.
Distributions to shareholders of each class were as follows:
| | Year ended
October 31, 2019 | Year ended
October 31, 2018 |
| Distributions to shareholders | | |
| Class A | $3,980 | $1,345 |
| Class M | 863 | 291 |
| Class C | 1,165 | 453 |
| Stock Selector Small Cap | 172,948 | 145,099 |
| Class I | 6,723 | 4,133 |
| Class Z | 1,045 | 60 |
| Total | $186,724 | $151,381 |
11. Share Transactions.
Share transactions for each class were as follows and may contain automatic conversions between classes or exchanges between affiliated funds:
| | Shares | Shares | Dollars | Dollars |
| | Year ended October 31, 2019 | Year ended October 31, 2018 | Year ended October 31, 2019 | Year ended October 31, 2018 |
| Class A | | | | |
| Shares sold | 769 | 397 | $17,323 | $11,141 |
| Reinvestment of distributions | 192 | 52 | 3,957 | 1,339 |
| Shares redeemed | (281) | (67) | (6,317) | (1,821) |
| Net increase (decrease) | 680 | 382 | $14,963 | $10,659 |
| Class M | | | | |
| Shares sold | 162 | 91 | $3,483 | $2,508 |
| Reinvestment of distributions | 42 | 11 | 829 | 281 |
| Shares redeemed | (68) | (30) | (1,434) | (799) |
| Net increase (decrease) | 136 | 72 | $2,878 | $1,990 |
| Class C | | | | |
| Shares sold | 206 | 129 | $4,171 | $3,346 |
| Reinvestment of distributions | 62 | 19 | 1,157 | 447 |
| Shares redeemed | (188) | (51) | (3,775) | (1,291) |
| Net increase (decrease) | 80 | 97 | $1,553 | $2,502 |
| Stock Selector Small Cap | | | | |
| Shares sold | 7,634 | 22,058 | $177,127 | $600,957 |
| Reinvestment of distributions | 7,937 | 5,410 | 167,624 | 141,745 |
| Shares redeemed | (16,301)(a) | (41,044) | (379,548)(a) | (1,115,801) |
| Net increase (decrease) | (730) | (13,576) | $(34,797) | $(373,099) |
| Class I | | | | |
| Shares sold | 538 | 842 | $12,465 | $24,053 |
| Reinvestment of distributions | 316 | 157 | 6,703 | 4,120 |
| Shares redeemed | (1,990)(a) | (990) | (46,997)(a) | (28,242) |
| Net increase (decrease) | (1,136) | 9 | $(27,829) | $(69) |
| Class Z | | | | |
| Shares sold | 1,270 | 219 | $29,611 | $6,401 |
| Reinvestment of distributions | 17 | 2 | 352 | 51 |
| Shares redeemed | (287) | (14) | (6,860) | (412) |
| Net increase (decrease) | 1,000 | 207 | $23,103 | $6,040 |
(a) Amount includes in-kind redemptions (see the Affiliated Redemptions In-Kind note for additional details).
12. Other.
The Fund's organizational documents provide former and current trustees and officers with a limited indemnification against liabilities arising in connection with the performance of their duties to the Fund. In the normal course of business, the Fund may also enter into contracts that provide general indemnifications. The Fund's maximum exposure under these arrangements is unknown as this would be dependent on future claims that may be made against the Fund. The risk of material loss from such claims is considered remote.
Report of Independent Registered Public Accounting Firm
To the Trustees of Fidelity Capital Trust and Shareholders of Fidelity Stock Selector Small Cap Fund:
Opinion on the Financial Statements and Financial Highlights
We have audited the accompanying statement of assets and liabilities of Fidelity Stock Selector Small Cap Fund (the “Fund”), a fund of Fidelity Capital Trust, including the schedule of investments, as of October 31, 2019, and the related statement of operations for the year then ended, the statement of changes in net assets for each of the two years in the period then ended, the financial highlights for each of the five years in the period then ended, and the related notes. In our opinion, the financial statements and financial highlights present fairly, in all material respects, the financial position of the Fund as of October 31, 2019, and the results of its operations for the year then ended, the changes in its net assets for each of the two years in the period then ended, and the financial highlights for each of the five years in the period then ended, in conformity with accounting principles generally accepted in the United States of America.
Basis for Opinion
These financial statements and financial highlights are the responsibility of the Fund's management. Our responsibility is to express an opinion on the Fund's financial statements and financial highlights based on our audits. We are a public accounting firm registered with the Public Company Accounting Oversight Board (United States) (PCAOB) and are required to be independent with respect to the Fund in accordance with the U.S. federal securities laws and the applicable rules and regulations of the Securities and Exchange Commission and the PCAOB.
We conducted our audits in accordance with the standards of the PCAOB. Those standards require that we plan and perform the audit to obtain reasonable assurance about whether the financial statements and financial highlights are free of material misstatement, whether due to error or fraud. The Fund is not required to have, nor were we engaged to perform, an audit of its internal control over financial reporting. As part of our audits we are required to obtain an understanding of internal control over financial reporting but not for the purpose of expressing an opinion on the effectiveness of the Fund’s internal control over financial reporting. Accordingly, we express no such opinion.
Our audits included performing procedures to assess the risks of material misstatement of the financial statements and financial highlights, whether due to error or fraud, and performing procedures that respond to those risks. Such procedures included examining, on a test basis, evidence regarding the amounts and disclosures in the financial statements and financial highlights. Our audits also included evaluating the accounting principles used and significant estimates made by management, as well as evaluating the overall presentation of the financial statements and financial highlights. Our procedures included confirmation of securities owned as of October 31, 2019, by correspondence with the custodians and brokers; when replies were not received from brokers, we performed other auditing procedures. We believe that our audits provide a reasonable basis for our opinion.
/s/ Deloitte & Touche LLP
Boston, Massachusetts
December 10, 2019
We have served as the auditor of one or more of the Fidelity investment companies since 1999.
Trustees and Officers
The Trustees, Members of the Advisory Board (if any), and officers of the trust and fund, as applicable, are listed below. The Board of Trustees governs the fund and is responsible for protecting the interests of shareholders. The Trustees are experienced executives who meet periodically throughout the year to oversee the fund's activities, review contractual arrangements with companies that provide services to the fund, oversee management of the risks associated with such activities and contractual arrangements, and review the fund's performance. Except for Michael E. Wiley, each of the Trustees oversees 298 funds. Mr. Wiley oversees 197 funds.
The Trustees hold office without limit in time except that (a) any Trustee may resign; (b) any Trustee may be removed by written instrument, signed by at least two-thirds of the number of Trustees prior to such removal; (c) any Trustee who requests to be retired or who has become incapacitated by illness or injury may be retired by written instrument signed by a majority of the other Trustees; and (d) any Trustee may be removed at any special meeting of shareholders by a two-thirds vote of the outstanding voting securities of the trust. Each Trustee who is not an interested person (as defined in the 1940 Act) of the trust and the fund is referred to herein as an Independent Trustee. Each Independent Trustee shall retire not later than the last day of the calendar year in which his or her 75th birthday occurs. The Independent Trustees may waive this mandatory retirement age policy with respect to individual Trustees. Officers and Advisory Board Members hold office without limit in time, except that any officer or Advisory Board Member may resign or may be removed by a vote of a majority of the Trustees at any regular meeting or any special meeting of the Trustees. Except as indicated, each individual has held the office shown or other offices in the same company for the past five years.
The fund's Statement of Additional Information (SAI) includes more information about the Trustees. To request a free copy, call Fidelity at 1-800-544-8544 if you’re an individual investing directly with Fidelity, call 1-800-835-5092 if you’re a plan sponsor or participant with Fidelity as your recordkeeper or call 1-877-208-0098 on institutional accounts or if you’re an advisor or invest through one.
Experience, Skills, Attributes, and Qualifications of the Trustees. The Governance and Nominating Committee has adopted a statement of policy that describes the experience, qualifications, attributes, and skills that are necessary and desirable for potential Independent Trustee candidates (Statement of Policy). The Board believes that each Trustee satisfied at the time he or she was initially elected or appointed a Trustee, and continues to satisfy, the standards contemplated by the Statement of Policy. The Governance and Nominating Committee also engages professional search firms to help identify potential Independent Trustee candidates who have the experience, qualifications, attributes, and skills consistent with the Statement of Policy. From time to time, additional criteria based on the composition and skills of the current Independent Trustees, as well as experience or skills that may be appropriate in light of future changes to board composition, business conditions, and regulatory or other developments, have also been considered by the professional search firms and the Governance and Nominating Committee. In addition, the Board takes into account the Trustees' commitment and participation in Board and committee meetings, as well as their leadership of standing and ad hoc committees throughout their tenure.
In determining that a particular Trustee was and continues to be qualified to serve as a Trustee, the Board has considered a variety of criteria, none of which, in isolation, was controlling. The Board believes that, collectively, the Trustees have balanced and diverse experience, qualifications, attributes, and skills, which allow the Board to operate effectively in governing the fund and protecting the interests of shareholders. Information about the specific experience, skills, attributes, and qualifications of each Trustee, which in each case led to the Board's conclusion that the Trustee should serve (or continue to serve) as a trustee of the fund, is provided below.
Board Structure and Oversight Function. James C. Curvey is an interested person and currently serves as Chairman. The Trustees have determined that an interested Chairman is appropriate and benefits shareholders because an interested Chairman has a personal and professional stake in the quality and continuity of services provided to the fund. Independent Trustees exercise their informed business judgment to appoint an individual of their choosing to serve as Chairman, regardless of whether the Trustee happens to be independent or a member of management. The Independent Trustees have determined that they can act independently and effectively without having an Independent Trustee serve as Chairman and that a key structural component for assuring that they are in a position to do so is for the Independent Trustees to constitute a substantial majority for the Board. The Independent Trustees also regularly meet in executive session. Ned C. Lautenbach serves as Chairman of the Independent Trustees and as such (i) acts as a liaison between the Independent Trustees and management with respect to matters important to the Independent Trustees and (ii) with management prepares agendas for Board meetings.
Fidelity® funds are overseen by different Boards of Trustees. The fund's Board oversees Fidelity's high income and certain equity funds, and other Boards oversee Fidelity's investment-grade bond, money market, asset allocation, and other equity funds. The asset allocation funds may invest in Fidelity® funds overseen by the fund's Board. The use of separate Boards, each with its own committee structure, allows the Trustees of each group of Fidelity® funds to focus on the unique issues of the funds they oversee, including common research, investment, and operational issues. On occasion, the separate Boards establish joint committees to address issues of overlapping consequences for the Fidelity® funds overseen by each Board.
The Trustees operate using a system of committees to facilitate the timely and efficient consideration of all matters of importance to the Trustees, the fund, and fund shareholders and to facilitate compliance with legal and regulatory requirements and oversight of the fund's activities and associated risks. The Board, acting through its committees, has charged FMR and its affiliates with (i) identifying events or circumstances the occurrence of which could have demonstrably adverse effects on the fund's business and/or reputation; (ii) implementing processes and controls to lessen the possibility that such events or circumstances occur or to mitigate the effects of such events or circumstances if they do occur; and (iii) creating and maintaining a system designed to evaluate continuously business and market conditions in order to facilitate the identification and implementation processes described in (i) and (ii) above. Because the day-to-day operations and activities of the fund are carried out by or through FMR, its affiliates, and other service providers, the fund's exposure to risks is mitigated but not eliminated by the processes overseen by the Trustees. While each of the Board's committees has responsibility for overseeing different aspects of the fund's activities, oversight is exercised primarily through the Operations, Audit, and Compliance Committees. Appropriate personnel, including but not limited to the fund's Chief Compliance Officer (CCO), FMR's internal auditor, the independent accountants, the fund's Treasurer and portfolio management personnel, make periodic reports to the Board's committees, as appropriate, including an annual review of Fidelity's risk management program for the Fidelity® funds. The responsibilities of each standing committee, including their oversight responsibilities, are described further under "Standing Committees of the Trustees."
Interested Trustees*:
Correspondence intended for a Trustee who is an interested person may be sent to Fidelity Investments, 245 Summer Street, Boston, Massachusetts 02210.
Name, Year of Birth; Principal Occupations and Other Relevant Experience+
James C. Curvey (1935)
Year of Election or Appointment: 2007
Trustee
Chairman of the Board of Trustees
Mr. Curvey also serves as Trustee of other Fidelity® funds. Mr. Curvey is Vice Chairman (2007-present) and Director of FMR LLC (diversified financial services company). In addition, Mr. Curvey is an Overseer Emeritus for the Boston Symphony Orchestra, a Director of Artis-Naples, and a Trustee of Brewster Academy in Wolfeboro, New Hampshire. Previously, Mr. Curvey served as a Director of Fidelity Research & Analysis Co. (investment adviser firm, 2009-2018), Director of Fidelity Investments Money Management, Inc. (investment adviser firm, 2009-2014) and a Director of FMR and FMR Co., Inc. (investment adviser firms, 2007-2014).
* Determined to be an “Interested Trustee” by virtue of, among other things, his or her affiliation with the trust or various entities under common control with FMR.
+ The information includes the Trustee's principal occupation during the last five years and other information relating to the experience, attributes, and skills relevant to the Trustee's qualifications to serve as a Trustee, which led to the conclusion that the Trustee should serve as a Trustee for the fund.
Independent Trustees:
Correspondence intended for an Independent Trustee may be sent to Fidelity Investments, P.O. Box 55235, Boston, Massachusetts 02205-5235.
Name, Year of Birth; Principal Occupations and Other Relevant Experience+
Dennis J. Dirks (1948)
Year of Election or Appointment: 2005
Trustee
Mr. Dirks also serves as Trustee of other Fidelity® funds. Prior to his retirement in May 2003, Mr. Dirks was Chief Operating Officer and a member of the Board of The Depository Trust & Clearing Corporation (DTCC). He also served as President, Chief Operating Officer, and Board member of The Depository Trust Company (DTC) and President and Board member of the National Securities Clearing Corporation (NSCC). In addition, Mr. Dirks served as Chief Executive Officer and Board member of the Government Securities Clearing Corporation, Chief Executive Officer and Board member of the Mortgage-Backed Securities Clearing Corporation, as a Trustee and a member of the Finance Committee of Manhattan College (2005-2008), as a Trustee and a member of the Finance Committee of AHRC of Nassau County (2006-2008), as a member of the Independent Directors Council (IDC) Governing Council (2010-2015), and as a member of the Board of Directors for The Brookville Center for Children’s Services, Inc. (2009-2017). Mr. Dirks is a member of the Finance Committee (2016-present) and Board of Directors (2017-present) and is Treasurer (2018-present) of the Asolo Repertory Theatre.
Donald F. Donahue (1950)
Year of Election or Appointment: 2018
Trustee
Mr. Donahue also serves as a Trustee of other Fidelity® funds. Mr. Donahue is President and Chief Executive Officer of Miranda Partners, LLC (risk consulting for the financial services industry, 2012-present). Previously, Mr. Donahue served as a Member of the Advisory Board of certain Fidelity® funds (2015-2018) and Chief Executive Officer (2006-2012), Chief Operating Officer (2003-2006), and Managing Director, Customer Marketing and Development (1999-2003) of The Depository Trust & Clearing Corporation (financial markets infrastructure). Mr. Donahue serves as a Member (2007-present) and Co-Chairman (2016-present) of the Board of Directors of United Way of New York, Member of the Board of Directors of NYC Leadership Academy (2012-present) and Member of the Board of Advisors of Ripple Labs, Inc. (financial services, 2015-present). He also served as Chairman (2010-2012) and Member of the Board of Directors (2012-2013) of Omgeo, LLC (financial services), Treasurer of United Way of New York (2012-2016), and Member of the Board of Directors of XBRL US (financial services non-profit, 2009-2012) and the International Securities Services Association (2009-2012).
Alan J. Lacy (1953)
Year of Election or Appointment: 2008
Trustee
Mr. Lacy also serves as Trustee of other Fidelity® funds. Mr. Lacy serves as a Director of Bristol-Myers Squibb Company (global pharmaceuticals, 2008-present). He is a Trustee of the California Chapter of The Nature Conservancy (2015-present) and a Director of the Center for Advanced Study in the Behavioral Sciences at Stanford University (2015-present). In addition, Mr. Lacy served as Senior Adviser (2007-2014) of Oak Hill Capital Partners, L.P. (private equity) and also served as Chief Executive Officer (2005) and Vice Chairman (2005-2006) of Sears Holdings Corporation (retail) and Chief Executive Officer and Chairman of the Board of Sears, Roebuck and Co. (retail, 2000-2005). Previously, Mr. Lacy served as Chairman (2014-2017) and a member (2010-2017) of the Board of Directors of Dave & Buster’s Entertainment, Inc. (restaurant and entertainment complexes), as Chairman (2008-2011) and a member (2006-2015) of the Board of Trustees of the National Parks Conservation Association, and as a member of the Board of Directors for The Hillman Companies, Inc. (hardware wholesalers, 2010-2014), Earth Fare, Inc. (retail grocery, 2010-2014), and The Western Union Company (global money transfer, 2006-2011).
Ned C. Lautenbach (1944)
Year of Election or Appointment: 2000
Trustee
Chairman of the Independent Trustees
Mr. Lautenbach also serves as Trustee of other Fidelity® funds. Mr. Lautenbach currently serves as Chair (2018-present) and Member (2013-present) of the Board of Governors, State University System of Florida and is a member of the Council on Foreign Relations (1994-present). He is also a member and has most recently served as Chairman of the Board of Directors of Artis-Naples (2012-present). Previously, Mr. Lautenbach served as a member and then Lead Director of the Board of Directors of Eaton Corporation (diversified industrial, 1997-2016). He was also a Partner and Advisory Partner at Clayton, Dubilier & Rice, LLC (private equity investment, 1998-2010), as well as a Director of Sony Corporation (2006-2007). In addition, Mr. Lautenbach also had a 30-year career with IBM (technology company) during which time he served as Senior Vice President and a member of the Corporate Executive Committee (1968-1998).
Joseph Mauriello (1944)
Year of Election or Appointment: 2008
Trustee
Mr. Mauriello also serves as Trustee of other Fidelity® funds. Prior to his retirement in January 2006, Mr. Mauriello served in numerous senior management positions including Deputy Chairman and Chief Operating Officer (2004-2005), and Vice Chairman of Financial Services (2002-2004) of KPMG LLP US (professional services, 1965-2005). Mr. Mauriello currently serves as a member of the Independent Directors Council (IDC) Governing Council (2015-present). Previously, Mr. Mauriello served as a member of the Board of Directors of XL Group plc. (global insurance and re-insurance, 2006-2018).
Cornelia M. Small (1944)
Year of Election or Appointment: 2005
Trustee
Ms. Small also serves as Trustee of other Fidelity® funds. Ms. Small is a member of the Board of Directors (2009-present) and Chair of the Investment Committee (2010-present) of the Teagle Foundation. Ms. Small also serves on the Investment Committee of the Berkshire Taconic Community Foundation (2008-present). Previously, Ms. Small served as Chairperson (2002-2008) and a member of the Investment Committee and Chairperson (2008-2012) and a member of the Board of Trustees of Smith College. In addition, Ms. Small served as Chief Investment Officer, Director of Global Equity Investments, and a member of the Board of Directors of Scudder, Stevens & Clark and Scudder Kemper Investments.
Garnett A. Smith (1947)
Year of Election or Appointment: 2018
Trustee
Mr. Smith also serves as Trustee of other Fidelity® funds. Prior to Mr. Smith's retirement, he served as Chairman and Chief Executive Officer of Inbrand Corp. (manufacturer of personal absorbent products, 1990-1997). He also served as President (1986-1990) of Inbrand Corp. Prior to his employment with Inbrand Corp., he was employed by a retail fabric chain and North Carolina National Bank. In addition, Mr. Smith served as a Member of the Advisory Board of certain Fidelity® funds (2012-2013) and as a board member of the Jackson Hole Land Trust (2009-2012).
David M. Thomas (1949)
Year of Election or Appointment: 2008
Trustee
Mr. Thomas also serves as Trustee of other Fidelity® funds. Mr. Thomas serves as Non-Executive Chairman of the Board of Directors of Fortune Brands Home and Security (home and security products, 2011-present) and as a member of the Board of Directors (2004-present) and Presiding Director (2013-present) of Interpublic Group of Companies, Inc. (marketing communication). Previously, Mr. Thomas served as Executive Chairman (2005-2006) and Chairman and Chief Executive Officer (2000-2005) of IMS Health, Inc. (pharmaceutical and healthcare information solutions), a Director of Fortune Brands, Inc. (consumer products, 2000-2011), and a member of the Board of Trustees of the University of Florida (2013-2018).
Michael E. Wiley (1950)
Year of Election or Appointment: 2018
Trustee
Mr. Wiley also serves as Trustee or Member of the Advisory Board of other Fidelity® funds. Mr. Wiley serves as a Director of High Point Resources (exploration and production, 2005-present). Previously, Mr. Wiley served as a Director of Andeavor Corporation (independent oil refiner and marketer, 2005-2018), a Director of Andeavor Logistics LP (natural resources logistics, 2015-2018), a Director of Post Oak Bank (privately-held bank, 2004-2018), a Director of Asia Pacific Exploration Consolidated (international oil and gas exploration and production, 2008-2013), a member of the Board of Trustees of the University of Tulsa (2000-2006; 2007-2010), a Senior Energy Advisor of Katzenbach Partners, LLC (consulting, 2006-2007), an Advisory Director of Riverstone Holdings (private investment), a Director of Spinnaker Exploration Company (exploration and production, 2001-2005) and Chairman, President, and CEO of Baker Hughes, Inc. (oilfield services, 2000-2004).
+ The information includes the Trustee's principal occupation during the last five years and other information relating to the experience, attributes, and skills relevant to the Trustee's qualifications to serve as a Trustee, which led to the conclusion that the Trustee should serve as a Trustee for the fund.
Advisory Board Members and Officers:
Correspondence intended for a Member of the Advisory Board (if any) may be sent to Fidelity Investments, P.O. Box 55235, Boston, Massachusetts 02205-5235. Correspondence intended for an officer or Peter S. Lynch may be sent to Fidelity Investments, 245 Summer Street, Boston, Massachusetts 02210. Officers appear below in alphabetical order.
Name, Year of Birth; Principal Occupation
Vicki L. Fuller (1957)
Year of Election or Appointment: 2018
Member of the Advisory Board
Ms. Fuller also serves as Member of the Advisory Board of other Fidelity® funds. Ms. Fuller serves as a member of the Board of Directors, Audit Committee, and Nominating and Governance Committee of The Williams Companies, Inc. (natural gas infrastructure, 2018-present). Previously, Ms. Fuller served as the Chief Investment Officer of the New York State Common Retirement Fund (2012-2018) and held a variety of positions at AllianceBernstein L.P. (global asset management, 1985-2012), including Managing Director (2006-2012) and Senior Vice President and Senior Portfolio Manager (2001-2006).
Peter S. Lynch (1944)
Year of Election or Appointment: 2003
Member of the Advisory Board
Mr. Lynch also serves as Member of the Advisory Board of other Fidelity® funds. Mr. Lynch is Vice Chairman and a Director of FMR (investment adviser firm) and FMR Co., Inc. (investment adviser firm). In addition, Mr. Lynch serves as a Trustee of Boston College and as the Chairman of the Inner-City Scholarship Fund. Previously, Mr. Lynch served on the Special Olympics International Board of Directors (1997-2006).
Elizabeth Paige Baumann (1968)
Year of Election or Appointment: 2017
Anti-Money Laundering (AML) Officer
Ms. Baumann also serves as AML Officer of other funds. She is Chief AML Officer (2012-present) and Senior Vice President (2014-present) of FMR LLC (diversified financial services company) and is an employee of Fidelity Investments. Previously, Ms. Baumann served as AML Officer of the funds (2012-2016), and Vice President (2007-2014) and Deputy Anti-Money Laundering Officer (2007-2012) of FMR LLC.
Craig S. Brown (1977)
Year of Election or Appointment: 2019
Assistant Treasurer
Mr. Brown also serves as Assistant Treasurer of other funds. Mr. Brown is an employee of Fidelity Investments (2013-present).
John J. Burke III (1964)
Year of Election or Appointment: 2018
Chief Financial Officer
Mr. Burke also serves as Chief Financial Officer of other funds. Mr. Burke serves as Head of Investment Operations for Fidelity Fund and Investment Operations (2018-present) and is an employee of Fidelity Investments (1998-present). Previously Mr. Burke served as head of Asset Management Investment Operations (2012-2018).
William C. Coffey (1969)
Year of Election or Appointment: 2019
Assistant Secretary
Mr. Coffey also serves as Assistant Secretary of other funds. He is Senior Vice President and Deputy General Counsel of FMR LLC (diversified financial services company, 2010-present), and is an employee of Fidelity Investments. Previously, Mr. Coffey served as Secretary and CLO of certain funds (2018-2019); CLO, Secretary, and Senior Vice President of Fidelity Management & Research Company and FMR Co., Inc. (investment adviser firms, 2018-2019); Secretary of Fidelity SelectCo, LLC and Fidelity Investments Money Management, Inc. (investment adviser firms, 2018-2019); CLO of Fidelity Management & Research (Hong Kong) Limited, FMR Investment Management (UK) Limited, and Fidelity Management & Research (Japan) Limited (investment adviser firms, 2018-2019); and Assistant Secretary of certain funds (2009-2018).
Timothy M. Cohen (1969)
Year of Election or Appointment: 2018
Vice President
Mr. Cohen also serves as Vice President of other funds. Mr. Cohen serves as Executive Vice President of Fidelity SelectCo, LLC (2019-present), Co-Head of Equity (2018-present), a Director of Fidelity Management & Research (Japan) Limited (investment adviser firm, 2016-present), and is an employee of Fidelity Investments. Previously, Mr. Cohen served as Head of Global Equity Research (2016-2018), Chief Investment Officer - Equity and a Director of Fidelity Management & Research (U.K.) Inc. (investment adviser firm, 2013-2015) and as a Director of Fidelity Management & Research (Hong Kong) Limited (investment adviser firm, 2017).
Jonathan Davis (1968)
Year of Election or Appointment: 2010
Assistant Treasurer
Mr. Davis also serves as Assistant Treasurer of other funds. Mr. Davis serves as Assistant Treasurer of FMR Capital, Inc. (2017-present) and is an employee of Fidelity Investments. Previously, Mr. Davis served as Vice President and Associate General Counsel of FMR LLC (diversified financial services company, 2003-2010).
Adrien E. Deberghes (1967)
Year of Election or Appointment: 2016
Assistant Treasurer
Mr. Deberghes also serves as an officer of other funds. He serves as Assistant Treasurer of FMR Capital, Inc. (2017-present), Executive Vice President of Fidelity Investments Money Management, Inc. (FIMM) (investment adviser firm, 2016-present), and is an employee of Fidelity Investments (2008-present). Previously, Mr. Deberghes served as President and Treasurer of certain Fidelity® funds (2013-2018). Prior to joining Fidelity Investments, Mr. Deberghes was Senior Vice President of Mutual Fund Administration at State Street Corporation (2007-2008), Senior Director of Mutual Fund Administration at Investors Bank & Trust (2005-2007), and Director of Finance for Dunkin' Brands (2000-2005). Previously, Mr. Deberghes served in other fund officer roles.
Laura M. Del Prato (1964)
Year of Election or Appointment: 2018
Assistant Treasurer
Ms. Del Prato also serves as an officer of other funds. Ms. Del Prato is an employee of Fidelity Investments (2017-present). Prior to joining Fidelity Investments, Ms. Del Prato served as a Managing Director and Treasurer of the JPMorgan Mutual Funds (2014-2017). Prior to JPMorgan, Ms. Del Prato served as a partner at Cohen Fund Audit Services (accounting firm, 2012-2013) and KPMG LLP (accounting firm, 2004-2012).
Colm A. Hogan (1973)
Year of Election or Appointment: 2016
Deputy Treasurer
Mr. Hogan also serves as an officer of other funds. Mr. Hogan serves as Assistant Treasurer of FMR Capital, Inc. (2017-present) and is an employee of Fidelity Investments (2005-present). Previously, Mr. Hogan served as Assistant Treasurer of certain Fidelity® funds (2016-2018).
Pamela R. Holding (1964)
Year of Election or Appointment: 2018
Vice President
Ms. Holding also serves as Vice President of other funds. Ms. Holding serves as Executive Vice President of Fidelity SelectCo, LLC (2019-present), Co-Head of Equity (2018-present) and is an employee of Fidelity Investments (2013-present). Previously, Ms. Holding served as Chief Investment Officer of Fidelity Institutional Asset Management (2013-2018).
Cynthia Lo Bessette (1969)
Year of Election or Appointment: 2019
Secretary and Chief Legal Officer (CLO)
Ms. Lo Bessette also serves as Secretary and CLO of other funds. Ms. Lo Bessette serves as CLO, Secretary, and Senior Vice President of Fidelity Management & Research Company and FMR Co., Inc. (investment adviser firms, 2019-present); Secretary of Fidelity SelectCo, LLC and Fidelity Investments Money Management, Inc. (investment adviser firms, 2019-present); and CLO of Fidelity Management & Research (Hong Kong) Limited, FMR Investment Management (UK) Limited, and Fidelity Management & Research (Japan) Limited (investment adviser firms, 2019-present). She is a Senior Vice President and Deputy General Counsel of FMR LLC (diversified financial services company, 2019-present), and is an employee of Fidelity Investments. Previously, Ms. Lo Bessette served as Executive Vice President, General Counsel (2016-2019) and Senior Vice President, Deputy General Counsel (2015-2016) of OppenheimerFunds (investment management company) and Deputy Chief Legal Officer (2013-2015) of Jennison Associates LLC (investment adviser firm).
Chris Maher (1972)
Year of Election or Appointment: 2013
Assistant Treasurer
Mr. Maher serves as Assistant Treasurer of other funds. Mr. Maher is Vice President of Valuation Oversight, serves as Assistant Treasurer of FMR Capital, Inc. (2017-present), and is an employee of Fidelity Investments. Previously, Mr. Maher served as Vice President of Asset Management Compliance (2013), Vice President of the Program Management Group of FMR (investment adviser firm, 2010-2013), and Vice President of Valuation Oversight (2008-2010).
Kenneth B. Robins (1969)
Year of Election or Appointment: 2016
Chief Compliance Officer
Mr. Robins also serves as an officer of other funds. Mr. Robins serves as Compliance Officer of Fidelity Management & Research Company and FMR Co., Inc. (investment adviser firms, 2016-present) and is an employee of Fidelity Investments (2004-present). Previously, Mr. Robins served as Executive Vice President of Fidelity Investments Money Management, Inc. (investment adviser firm, 2013-2016) and served in other fund officer roles.
Stacie M. Smith (1974)
Year of Election or Appointment: 2016
President and Treasurer
Ms. Smith also serves as an officer of other funds. Ms. Smith serves as Assistant Treasurer of FMR Capital, Inc. (2017-present), is an employee of Fidelity Investments (2009-present), and has served in other fund officer roles. Prior to joining Fidelity Investments, Ms. Smith served as Senior Audit Manager of Ernst & Young LLP (accounting firm, 1996-2009). Previously, Ms. Smith served as Assistant Treasurer (2013-2018) and Deputy Treasurer (2013-2016) of certain Fidelity® funds.
Marc L. Spector (1972)
Year of Election or Appointment: 2016
Assistant Treasurer
Mr. Spector also serves as an officer of other funds. Mr. Spector serves as Assistant Treasurer of FMR Capital, Inc. (2017-present) and is an employee of Fidelity Investments (2016-present). Prior to joining Fidelity Investments, Mr. Spector served as Director at the Siegfried Group (accounting firm, 2013-2016), and prior to Siegfried Group as audit senior manager at Deloitte & Touche (accounting firm, 2005-2013).
Jim Wegmann (1979)
Year of Election or Appointment: 2019
Assistant Treasurer
Mr. Wegmann also serves as Assistant Treasurer of other funds. Mr. Wegmann is an employee of Fidelity Investments (2011-present).
Shareholder Expense Example
As a shareholder of the Fund, you incur two types of costs: (1) transaction costs, including sales charges (loads) on purchase payments or redemption proceeds, and (2) ongoing costs, including management fees, distribution and/or service (12b-1) fees and other Fund expenses. This Example is intended to help you understand your ongoing costs (in dollars) of investing in the Fund and to compare these costs with the ongoing costs of investing in other mutual funds.
The Example is based on an investment of $1,000 invested at the beginning of the period and held for the entire period (May 1, 2019 to October 31, 2019).
Actual Expenses
The first line of the accompanying table for each class of the Fund provides information about actual account values and actual expenses. You may use the information in this line, together with the amount you invested, to estimate the expenses that you paid over the period. Simply divide your account value by $1,000.00 (for example, an $8,600 account value divided by $1,000.00 = 8.6), then multiply the result by the number in the first line for a class of the Fund under the heading entitled "Expenses Paid During Period" to estimate the expenses you paid on your account during this period. In addition, the Fund, as a shareholder in the underlying Fidelity Central Funds, will indirectly bear its pro-rata share of the fees and expenses incurred by the underlying Fidelity Central Funds. These fees and expenses are not included in the Fund's annualized expense ratio used to calculate the expense estimate in the table below.
Hypothetical Example for Comparison Purposes
The second line of the accompanying table for each class of the Fund provides information about hypothetical account values and hypothetical expenses based on a Class' actual expense ratio and an assumed rate of return of 5% per year before expenses, which is not the Class' actual return. The hypothetical account values and expenses may not be used to estimate the actual ending account balance or expenses you paid for the period. You may use this information to compare the ongoing costs of investing in the Fund and other funds. To do so, compare this 5% hypothetical example with the 5% hypothetical examples that appear in the shareholder reports of the other funds. In addition, the Fund, as a shareholder in the underlying Fidelity Central Funds, will indirectly bear its pro-rata share of the fees and expenses incurred by the underlying Fidelity Central Funds. These fees and expenses are not included in the Fund's annualized expense ratio used to calculate the expense estimate in the table below.
Please note that the expenses shown in the table are meant to highlight your ongoing costs only and do not reflect any transaction costs. Therefore, the second line of the table is useful in comparing ongoing costs only, and will not help you determine the relative total costs of owning different funds. In addition, if these transactional costs were included, your costs would have been higher.
| | Annualized Expense Ratio-A | Beginning
Account Value
May 1, 2019 | Ending
Account Value
October 31, 2019 | Expenses Paid
During Period-B
May 1, 2019
to October 31, 2019 |
| Class A | 1.13% | | | |
| Actual | | $1,000.00 | $1,022.80 | $5.76 |
| Hypothetical-C | | $1,000.00 | $1,019.51 | $5.75 |
| Class M | 1.42% | | | |
| Actual | | $1,000.00 | $1,021.30 | $7.23 |
| Hypothetical-C | | $1,000.00 | $1,018.05 | $7.22 |
| Class C | 1.95% | | | |
| Actual | | $1,000.00 | $1,018.50 | $9.92 |
| Hypothetical-C | | $1,000.00 | $1,015.38 | $9.91 |
| Stock Selector Small Cap | .85% | | | |
| Actual | | $1,000.00 | $1,024.30 | $4.34 |
| Hypothetical-C | | $1,000.00 | $1,020.92 | $4.33 |
| Class I | .87% | | | |
| Actual | | $1,000.00 | $1,023.80 | $4.44 |
| Hypothetical-C | | $1,000.00 | $1,020.82 | $4.43 |
| Class Z | .66% | | | |
| Actual | | $1,000.00 | $1,025.10 | $3.37 |
| Hypothetical-C | | $1,000.00 | $1,021.88 | $3.36 |
A Annualized expense ratio reflects expenses net of applicable fee waivers.
B Expenses are equal to each Class' annualized expense ratio, multiplied by the average account value over the period, multiplied by 184/365 (to reflect the one-half year period).
C 5% return per year before expenses
Distributions (Unaudited)
The Board of Trustees of Fidelity Stock Selector Small Cap Fund voted to pay to shareholders of record at the opening of business on record date, the following distributions per share derived from capital gains realized from sales of portfolio securities, and dividends derived from net investment income:
| | Pay Date | Record Date | Dividends | Capital Gains |
| Fidelity Stock Selector Small Cap Fund | | | | |
| Class A | 12/09/19 | 12/06/19 | $0.029 | $0.459 |
| Class M | 12/09/19 | 12/06/19 | $0.000 | $0.459 |
| Class C | 12/09/19 | 12/06/19 | $0.000 | $0.459 |
| Stock Selector Small Cap | 12/09/19 | 12/06/19 | $0.084 | $0.459 |
| Class I | 12/09/19 | 12/06/19 | $0.012 | $0.459 |
| Class Z | 12/09/19 | 12/06/19 | $0.126 | $0.459 |
The fund hereby designates as a capital gain dividend with respect to the taxable year ended October 31, 2019, $25,665,290, or, if subsequently determined to be different, the net capital gain of such year.
Class A designates 64%, Class M designates 79%, Class C designates 100%, Stock Selector Small Cap designates 56%, Class I designates 55% and Class Z designates 49% of the dividends distributed during the fiscal year as qualifying for the dividends–received deduction for corporate shareholders.
Class A designates 72%, Class M designates 90%, Class C designates 100%, Stock Selector Small Cap designates 63%, Class I designates 63% and Class Z designates 56% of dividends distributed during the fiscal year as amounts which may be taken into account as a dividend for purposes of the maximum rate under section 1(h)(11) of the Internal Revenue Code.
The fund will notify shareholders in January 2020 of amounts for use in preparing 2019 income tax returns.
SCS-ANN-1219
1.703160.122
Fidelity Flex℠ Funds
Fidelity Flex℠ Small Cap Fund
Annual Report
October 31, 2019
See the inside front cover for important information about access to your fund’s shareholder reports.
Beginning on January 1, 2021, as permitted by regulations adopted by the Securities and Exchange Commission, paper copies of a fund’s shareholder reports will no longer be sent by mail, unless you specifically request paper copies of the reports from the fund or from your financial intermediary, such as a financial advisor, broker-dealer or bank. Instead, the reports will be made available on a website, and you will be notified by mail each time a report is posted and provided with a website link to access the report.
If you already elected to receive shareholder reports electronically, you will not be affected by this change and you need not take any action. You may elect to receive shareholder reports and other communications from a fund electronically, by contacting your financial intermediary. For Fidelity customers, visit Fidelity's web site or call Fidelity using the contact information listed below.
You may elect to receive all future reports in paper free of charge. If you wish to continue receiving paper copies of your shareholder reports, you may contact your financial intermediary or, if you are a Fidelity customer, visit Fidelity’s website, or call Fidelity at the applicable toll-free number listed below. Your election to receive reports in paper will apply to all funds held with the fund complex/your financial intermediary.
| Account Type | Website | Phone Number |
| Brokerage, Mutual Fund, or Annuity Contracts: | fidelity.com/mailpreferences | 1-800-343-3548 |
| Employer Provided Retirement Accounts: | netbenefits.fidelity.com/preferences (choose 'no' under Required Disclosures to continue to print) | 1-800-343-0860 |
| Advisor Sold Accounts Serviced Through Your Financial Intermediary: | Contact Your Financial Intermediary | Your Financial Intermediary's phone number |
| Advisor Sold Accounts Serviced by Fidelity: | institutional.fidelity.com | 1-877-208-0098 |
Contents
To view a fund's proxy voting guidelines and proxy voting record for the 12-month period ended June 30, visit http://www.fidelity.com/proxyvotingresults or visit the Securities and Exchange Commission's (SEC) web site at http://www.sec.gov.
You may also call 1-800-544-3455 (for managed account clients) or 1-800-835-5092 (for retirement plan participants) to request a free copy of the proxy voting guidelines.
Standard & Poor's, S&P and S&P 500 are registered service marks of The McGraw-Hill Companies, Inc. and have been licensed for use by Fidelity Distributors Corporation.
Other third-party marks appearing herein are the property of their respective owners.
All other marks appearing herein are registered or unregistered trademarks or service marks of FMR LLC or an affiliated company. © 2019 FMR LLC. All rights reserved.
This report and the financial statements contained herein are submitted for the general information of the shareholders of the Fund. This report is not authorized for distribution to prospective investors in the Fund unless preceded or accompanied by an effective prospectus.
A fund files its complete schedule of portfolio holdings with the SEC for the first and third quarters of each fiscal year on Form N-PORT. Forms N-PORT are available on the SEC’s web site at http://www.sec.gov. A fund's Forms N-PORT may be reviewed and copied at the SEC’s Public Reference Room in Washington, DC. Information regarding the operation of the SEC's Public Reference Room may be obtained by calling 1-800-SEC-0330.
For a complete list of a fund's portfolio holdings, view the most recent holdings listing, semiannual report, or annual report on Fidelity's web site at http://www.fidelity.com, http://www.institutional.fidelity.com, or http://www.401k.com, as applicable.
NOT FDIC INSURED •MAY LOSE VALUE •NO BANK GUARANTEE
Neither the Fund nor Fidelity Distributors Corporation is a bank.
Performance: The Bottom Line
Average annual total return reflects the change in the value of an investment, assuming reinvestment of distributions from dividend income and capital gains (the profits earned upon the sale of securities that have grown in value, if any) and assuming a constant rate of performance each year. The hypothetical investment and the average annual total returns do not reflect the deduction of taxes that a shareholder would pay on fund distributions or the redemption of fund shares. During periods of reimbursement by Fidelity, a fund’s total return will be greater than it would be had the reimbursement not occurred. How a fund did yesterday is no guarantee of how it will do tomorrow.
Average Annual Total Returns
| For the periods ended October 31, 2019 | Past 1 year | Life of fundA |
| Fidelity Flex℠ Small Cap Fund | 11.83% | 8.90% |
A From March 7, 2017
$10,000 Over Life of Fund
Let's say hypothetically that $10,000 was invested in Fidelity Flex℠ Small Cap Fund on March 7, 2017, when the fund started.
The chart shows how the value of your investment would have changed, and also shows how the Russell 2000® Index performed over the same period.
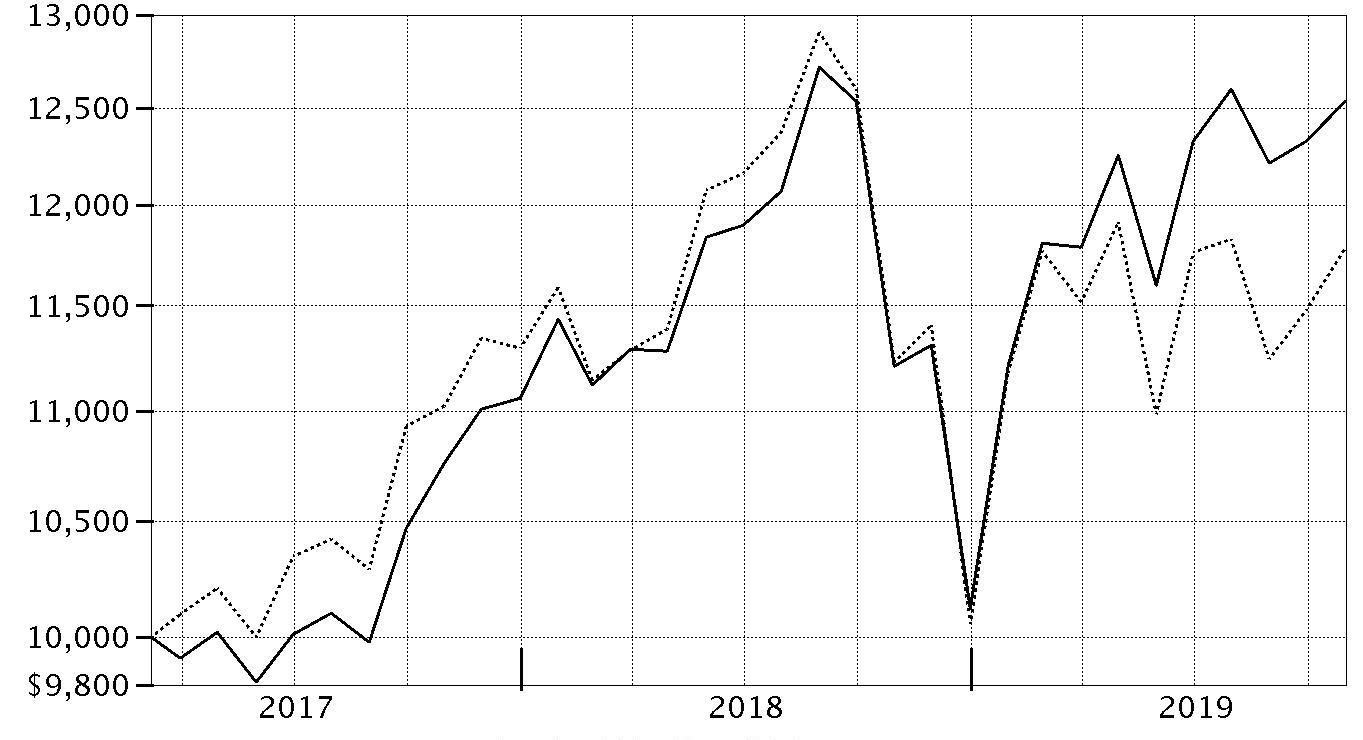
| Period Ending Values |
| $12,536 | Fidelity Flex℠ Small Cap Fund |
| $11,780 | Russell 2000® Index |
Management's Discussion of Fund Performance
Market Recap: The S&P 500
® index gained 14.33% for the 12 months ending October 31, 2019, ending the period just shy of a record close after seesawing due to trade tension, interest rates, economic data and an inverted yield curve, among other factors. Upbeat company earnings and outlooks, along with signs the Federal Reserve may pause on rates, boosted stocks to an all-time high on April 30. In May, however, volatility spiked and the index sunk as trade negotiations between the U.S. and China broke down. The bull market roared back in June and recorded a series of highs in July, when the Fed, affirming a dovish shift in policy, cut interest rates for the first time since 2008. Volatility intensified in August, however, as the U.S. Treasury yield curve inverted for the first time since 2007, which some investors viewed as a sign the U.S. economy could be heading for recession. The market proved resilient, rising in the final two months and reaching a new high on October 30, when the Fed cut interest rates for the third time this year. For the full 12 months, the defensive real estate (+27%) and utilities (+24%) sectors led the way, followed by information technology (+23%). Communication services and consumer discretionary each gained about 16%, while industrials advanced 15%. In contrast, energy (-11%) was by far the weakest sector – slipping on lower oil prices. Other notable laggards included health care (+9%) and financials (+12%). Lastly, consumer staples and materials finished roughly in line with the index.
Comments from Lead Portfolio Manager Clint Lawrence: For the fiscal year, the fund gained 11.83%, significantly outpacing the 4.90% advance of the benchmark Russell 2000
® Index. Strong security selection drove the fund's relative outperformance, especially in the health care, industrials, information technology, consumer staples and real estate sectors. Stock picking and an underweighting in the strong-performing utilities category partly offset this positive impact. The fund's non-benchmark stake in Computer Services (+85%), which provides back-office transactions for bank customers, added more value than any other individual position. A non-benchmark stake in biopharmaceutical company Ascendis Pharma (+72%) also helped on a relative basis, rising sharply in March, after the company reported promising drug-trial results. Other notable contributors included IT services company Verra Mobility and data advertising firm Cardlytics, which returned 52% and 99% for the fund, respectively. Conversely, a non-benchmark position in Orion Engineered Carbons (-33%) detracted notably. This maker of a carbon product used in various industries saw its shares fall sharply in March, after the company announced lower production volumes and issued a weak financial outlook. Other notable detractors included 2U (-75%) an educational technology company and a non-benchmark stock I sold from the fund in September, and online auto research and shopping site CarGurus (-24%).
The views expressed above reflect those of the portfolio manager(s) only through the end of the period as stated on the cover of this report and do not necessarily represent the views of Fidelity or any other person in the Fidelity organization. Any such views are subject to change at any time based upon market or other conditions and Fidelity disclaims any responsibility to update such views. These views may not be relied on as investment advice and, because investment decisions for a Fidelity fund are based on numerous factors, may not be relied on as an indication of trading intent on behalf of any Fidelity fund.
Investment Summary (Unaudited)
Top Ten Stocks as of October 31, 2019
| | % of fund's net assets |
| SYNNEX Corp. | 1.5 |
| Moog, Inc. Class A | 1.3 |
| Portland General Electric Co. | 1.3 |
| BJ's Wholesale Club Holdings, Inc. | 1.3 |
| Enstar Group Ltd. | 1.3 |
| First Citizens Bancshares, Inc. | 1.2 |
| Aaron's, Inc. Class A | 1.2 |
| Potlatch Corp. | 1.2 |
| Taylor Morrison Home Corp. | 1.1 |
| LPL Financial | 1.1 |
| | 12.5 |
Top Five Market Sectors as of October 31, 2019
| | % of fund's net assets |
| Financials | 20.5 |
| Industrials | 16.0 |
| Health Care | 13.9 |
| Information Technology | 13.3 |
| Consumer Discretionary | 12.1 |
Asset Allocation (% of fund's net assets)
| As of October 31, 2019 * |
| | Stocks | 98.2% |
| | Convertible Securities | 0.6% |
| | Short-Term Investments and Net Other Assets (Liabilities) | 1.2% |

* Foreign investments - 14.1%
Schedule of Investments October 31, 2019
Showing Percentage of Net Assets
| Common Stocks - 97.7% | | | |
| | | Shares | Value |
| COMMUNICATION SERVICES - 4.3% | | | |
| Diversified Telecommunication Services - 0.9% | | | |
| Iridium Communications, Inc. (a) | | 4,165 | $101,918 |
| Entertainment - 0.3% | | | |
| Gaia, Inc. Class A (a) | | 1,805 | 12,509 |
| World Wrestling Entertainment, Inc. Class A | | 419 | 23,481 |
| | | | 35,990 |
| Interactive Media & Services - 1.0% | | | |
| CarGurus, Inc. Class A (a) | | 2,635 | 88,510 |
| Eventbrite, Inc. (a) | | 1,084 | 19,490 |
| | | | 108,000 |
| Media - 2.1% | | | |
| Cardlytics, Inc. (a) | | 2,592 | 108,631 |
| Gray Television, Inc. (a) | | 5,565 | 91,322 |
| Tegna, Inc. | | 2,763 | 41,528 |
| | | | 241,481 |
|
| TOTAL COMMUNICATION SERVICES | | | 487,389 |
|
| CONSUMER DISCRETIONARY - 12.1% | | | |
| Auto Components - 1.0% | | | |
| Fox Factory Holding Corp. (a) | | 446 | 27,179 |
| Standard Motor Products, Inc. | | 1,581 | 82,781 |
| | | | 109,960 |
| Diversified Consumer Services - 2.4% | | | |
| Afya Ltd. | | 1,184 | 31,968 |
| Arco Platform Ltd. Class A (a) | | 1,337 | 55,486 |
| Bright Horizons Family Solutions, Inc. (a) | | 218 | 32,377 |
| Grand Canyon Education, Inc. (a) | | 720 | 66,211 |
| Laureate Education, Inc. Class A (a) | | 2,973 | 45,948 |
| OneSpaWorld Holdings Ltd. (a) | | 1,436 | 22,330 |
| Strategic Education, Inc. | | 164 | 20,177 |
| | | | 274,497 |
| Hotels, Restaurants & Leisure - 1.8% | | | |
| Churchill Downs, Inc. | | 462 | 60,055 |
| Planet Fitness, Inc. (a) | | 542 | 34,504 |
| SeaWorld Entertainment, Inc. (a) | | 562 | 14,848 |
| Wyndham Destinations, Inc. | | 2,090 | 96,997 |
| | | | 206,404 |
| Household Durables - 2.5% | | | |
| Helen of Troy Ltd. (a) | | 486 | 72,783 |
| KB Home | | 1,622 | 57,889 |
| Skyline Champion Corp. (a) | | 1,152 | 32,521 |
| Taylor Morrison Home Corp. (a) | | 4,832 | 121,042 |
| | | | 284,235 |
| Internet & Direct Marketing Retail - 0.2% | | | |
| Revolve Group, Inc. | | 1,131 | 23,480 |
| The RealReal, Inc. | | 13 | 300 |
| | | | 23,780 |
| Leisure Products - 0.6% | | | |
| Brunswick Corp. | | 1,083 | 63,074 |
| Multiline Retail - 0.3% | | | |
| Ollie's Bargain Outlet Holdings, Inc. (a) | | 484 | 30,918 |
| Specialty Retail - 2.2% | | | |
| Aaron's, Inc. Class A | | 1,838 | 137,721 |
| Five Below, Inc. (a) | | 199 | 24,897 |
| The Children's Place Retail Stores, Inc. | | 473 | 38,743 |
| Urban Outfitters, Inc. (a) | | 1,533 | 43,997 |
| | | | 245,358 |
| Textiles, Apparel & Luxury Goods - 1.1% | | | |
| Deckers Outdoor Corp. (a) | | 246 | 37,613 |
| G-III Apparel Group Ltd. (a) | | 2,240 | 56,246 |
| Steven Madden Ltd. | | 620 | 25,532 |
| | | | 119,391 |
|
| TOTAL CONSUMER DISCRETIONARY | | | 1,357,617 |
|
| CONSUMER STAPLES - 3.7% | | | |
| Beverages - 0.1% | | | |
| Boston Beer Co., Inc. Class A (a) | | 28 | 10,485 |
| Food & Staples Retailing - 2.0% | | | |
| BJ's Wholesale Club Holdings, Inc. (a) | | 5,523 | 147,464 |
| Grocery Outlet Holding Corp. | | 629 | 20,065 |
| Performance Food Group Co. (a) | | 1,290 | 54,967 |
| | | | 222,496 |
| Food Products - 1.1% | | | |
| Freshpet, Inc. (a) | | 365 | 19,075 |
| Nomad Foods Ltd. (a) | | 3,469 | 67,680 |
| Post Holdings, Inc. (a) | | 364 | 37,456 |
| | | | 124,211 |
| Personal Products - 0.3% | | | |
| BellRing Brands, Inc. Class A (a) | | 1,716 | 29,979 |
| Tobacco - 0.2% | | | |
| Universal Corp. | | 478 | 26,194 |
|
| TOTAL CONSUMER STAPLES | | | 413,365 |
|
| ENERGY - 2.3% | | | |
| Energy Equipment & Services - 0.8% | | | |
| Oil States International, Inc. (a) | | 2,981 | 42,539 |
| Patterson-UTI Energy, Inc. | | 2,182 | 18,154 |
| ShawCor Ltd. Class A | | 2,601 | 26,186 |
| | | | 86,879 |
| Oil, Gas & Consumable Fuels - 1.5% | | | |
| Berry Petroleum Corp. | | 4,701 | 44,142 |
| Encana Corp. (Toronto) | | 2,506 | 9,818 |
| Kosmos Energy Ltd. | | 1,412 | 8,754 |
| PDC Energy, Inc. (a) | | 780 | 15,561 |
| Viper Energy Partners LP | | 3,805 | 91,586 |
| | | | 169,861 |
|
| TOTAL ENERGY | | | 256,740 |
|
| FINANCIALS - 20.5% | | | |
| Banks - 8.7% | | | |
| Associated Banc-Corp. | | 4,327 | 87,016 |
| BOK Financial Corp. | | 608 | 46,907 |
| Camden National Corp. | | 396 | 17,547 |
| Cullen/Frost Bankers, Inc. | | 171 | 15,404 |
| First Citizens Bancshares, Inc. | | 280 | 137,738 |
| Heartland Financial U.S.A., Inc. | | 839 | 39,248 |
| Hilltop Holdings, Inc. | | 4,299 | 100,425 |
| PacWest Bancorp | | 1,617 | 59,813 |
| Popular, Inc. | | 2,060 | 112,188 |
| Trico Bancshares | | 3,108 | 116,954 |
| Umpqua Holdings Corp. | | 4,637 | 73,357 |
| United Community Bank, Inc. | | 3,627 | 109,572 |
| Wintrust Financial Corp. | | 1,018 | 64,969 |
| | | | 981,138 |
| Capital Markets - 4.1% | | | |
| Apollo Global Management LLC Class A | | 553 | 22,761 |
| BrightSphere Investment Group, Inc. | | 6,988 | 68,622 |
| Donnelley Financial Solutions, Inc. (a) | | 3,633 | 41,053 |
| Hamilton Lane, Inc. Class A | | 328 | 19,555 |
| Lazard Ltd. Class A | | 2,422 | 90,413 |
| LPL Financial | | 1,492 | 120,613 |
| Morningstar, Inc. | | 621 | 100,503 |
| | | | 463,520 |
| Consumer Finance - 1.0% | | | |
| Encore Capital Group, Inc. (a) | | 1,846 | 61,269 |
| First Cash Financial Services, Inc. | | 541 | 45,655 |
| | | | 106,924 |
| Diversified Financial Services - 0.7% | | | |
| Cannae Holdings, Inc. (a) | | 1,085 | 31,682 |
| ECN Capital Corp. | | 13,084 | 43,213 |
| | | | 74,895 |
| Insurance - 4.4% | | | |
| Axis Capital Holdings Ltd. | | 515 | 30,606 |
| BRP Group, Inc. (a) | | 1,494 | 24,203 |
| eHealth, Inc. (a) | | 243 | 16,777 |
| Enstar Group Ltd. (a) | | 731 | 146,858 |
| First American Financial Corp. | | 1,505 | 92,979 |
| Old Republic International Corp. | | 3,629 | 81,072 |
| Primerica, Inc. | | 808 | 101,953 |
| | | | 494,448 |
| Thrifts & Mortgage Finance - 1.6% | | | |
| Essent Group Ltd. | | 892 | 46,464 |
| LendingTree, Inc. (a) | | 47 | 16,913 |
| WSFS Financial Corp. | | 2,755 | 116,178 |
| | | | 179,555 |
|
| TOTAL FINANCIALS | | | 2,300,480 |
|
| HEALTH CARE - 13.9% | | | |
| Biotechnology - 4.4% | | | |
| Acceleron Pharma, Inc. (a) | | 679 | 30,467 |
| Allakos, Inc. (a) | | 369 | 25,313 |
| AnaptysBio, Inc. (a) | | 235 | 8,864 |
| Arena Pharmaceuticals, Inc. (a) | | 390 | 18,999 |
| Argenx SE ADR (a) | | 360 | 44,086 |
| Ascendis Pharma A/S sponsored ADR (a) | | 440 | 48,655 |
| Audentes Therapeutics, Inc. (a) | | 475 | 12,778 |
| Blueprint Medicines Corp. (a) | | 617 | 42,474 |
| Deciphera Pharmaceuticals, Inc. (a) | | 302 | 13,391 |
| FibroGen, Inc. (a) | | 850 | 33,278 |
| G1 Therapeutics, Inc. (a) | | 380 | 8,064 |
| Global Blood Therapeutics, Inc. (a) | | 723 | 34,668 |
| Gritstone Oncology, Inc. (a) | | 667 | 5,409 |
| Heron Therapeutics, Inc. (a) | | 872 | 18,530 |
| Iovance Biotherapeutics, Inc. (a) | | 868 | 18,341 |
| Kura Oncology, Inc. (a) | | 694 | 10,396 |
| Mirati Therapeutics, Inc. (a) | | 71 | 6,687 |
| Morphic Holding, Inc. | | 479 | 6,706 |
| Morphosys AG (a) | | 170 | 18,515 |
| Neurocrine Biosciences, Inc. (a) | | 272 | 27,061 |
| Sarepta Therapeutics, Inc. (a) | | 325 | 26,995 |
| The Medicines Company (a) | | 392 | 20,576 |
| Turning Point Therapeutics, Inc. | | 502 | 19,257 |
| | | | 499,510 |
| Health Care Equipment & Supplies - 3.9% | | | |
| Axonics Modulation Technologies, Inc. (a) | | 379 | 9,369 |
| Cerus Corp. (a) | | 831 | 3,615 |
| CONMED Corp. | | 368 | 40,487 |
| Haemonetics Corp. (a) | | 298 | 35,978 |
| Hill-Rom Holdings, Inc. | | 467 | 48,890 |
| Insulet Corp. (a) | | 769 | 111,751 |
| Integer Holdings Corp. (a) | | 407 | 31,518 |
| Masimo Corp. (a) | | 394 | 57,441 |
| Novocure Ltd. (a) | | 690 | 49,432 |
| Tandem Diabetes Care, Inc. (a) | | 375 | 23,093 |
| TransMedics Group, Inc. | | 1,336 | 23,968 |
| | | | 435,542 |
| Health Care Providers & Services - 1.3% | | | |
| Chemed Corp. | | 88 | 34,664 |
| LHC Group, Inc. (a) | | 405 | 44,943 |
| Molina Healthcare, Inc. (a) | | 356 | 41,880 |
| Progyny, Inc. (a) | | 1,849 | 30,379 |
| | | | 151,866 |
| Health Care Technology - 2.0% | | | |
| Cegedim SA (a) | | 2,059 | 63,725 |
| Health Catalyst, Inc. | | 503 | 16,176 |
| HMS Holdings Corp. (a) | | 1,362 | 44,524 |
| Inovalon Holdings, Inc. Class A (a) | | 2,348 | 36,699 |
| Phreesia, Inc. | | 1,387 | 41,097 |
| Teladoc Health, Inc. (a) | | 231 | 17,695 |
| | | | 219,916 |
| Life Sciences Tools & Services - 0.9% | | | |
| 10X Genomics, Inc. (a) | | 257 | 14,906 |
| Bruker Corp. | | 512 | 22,784 |
| ICON PLC (a) | | 391 | 57,438 |
| Quanterix Corp. (a) | | 527 | 10,988 |
| | | | 106,116 |
| Pharmaceuticals - 1.4% | | | |
| Horizon Pharma PLC (a) | | 1,405 | 40,619 |
| Perrigo Co. PLC | | 1,512 | 80,166 |
| Theravance Biopharma, Inc. (a) | | 598 | 9,640 |
| Xeris Pharmaceuticals, Inc. (a) | | 599 | 4,900 |
| Zogenix, Inc. (a) | | 387 | 17,280 |
| | | | 152,605 |
|
| TOTAL HEALTH CARE | | | 1,565,555 |
|
| INDUSTRIALS - 15.9% | | | |
| Aerospace & Defense - 2.1% | | | |
| HEICO Corp. Class A | | 244 | 23,246 |
| Moog, Inc. Class A | | 1,792 | 150,008 |
| Teledyne Technologies, Inc. (a) | | 196 | 64,602 |
| | | | 237,856 |
| Airlines - 0.4% | | | |
| SkyWest, Inc. | | 780 | 46,449 |
| Building Products - 0.3% | | | |
| Armstrong World Industries, Inc. | | 383 | 35,822 |
| Commercial Services & Supplies - 0.9% | | | |
| Copart, Inc. (a) | | 317 | 26,197 |
| Knoll, Inc. | | 2,598 | 69,471 |
| | | | 95,668 |
| Construction & Engineering - 2.8% | | | |
| AECOM (a) | | 1,841 | 73,658 |
| Argan, Inc. | | 1,476 | 55,867 |
| Dycom Industries, Inc. (a) | | 684 | 31,184 |
| Jacobs Engineering Group, Inc. | | 368 | 34,437 |
| MasTec, Inc. (a) | | 1,848 | 116,313 |
| | | | 311,459 |
| Electrical Equipment - 2.2% | | | |
| Atkore International Group, Inc. (a) | | 908 | 31,508 |
| Generac Holdings, Inc. (a) | | 1,193 | 115,220 |
| Regal Beloit Corp. | | 1,403 | 103,892 |
| | | | 250,620 |
| Machinery - 3.6% | | | |
| AGCO Corp. | | 665 | 50,999 |
| Allison Transmission Holdings, Inc. | | 865 | 37,723 |
| ITT, Inc. | | 750 | 44,588 |
| Luxfer Holdings PLC sponsored | | 4,932 | 83,154 |
| Rational AG | | 40 | 30,448 |
| SPX Flow, Inc. (a) | | 1,328 | 60,132 |
| Toro Co. | | 324 | 24,990 |
| Woodward, Inc. | | 639 | 68,156 |
| | | | 400,190 |
| Marine - 0.2% | | | |
| SITC International Holdings Co. Ltd. | | 16,179 | 17,815 |
| Professional Services - 1.7% | | | |
| Asgn, Inc. (a) | | 354 | 22,511 |
| CBIZ, Inc. (a) | | 1,759 | 48,144 |
| Exponent, Inc. | | 520 | 33,036 |
| FTI Consulting, Inc. (a) | | 660 | 71,854 |
| Insperity, Inc. | | 168 | 17,746 |
| | | | 193,291 |
| Road & Rail - 0.9% | | | |
| Genesee & Wyoming, Inc. Class A (a) | | 205 | 22,761 |
| Schneider National, Inc. Class B | | 3,269 | 74,762 |
| | | | 97,523 |
| Trading Companies & Distributors - 0.8% | | | |
| GMS, Inc. (a) | | 1,060 | 31,758 |
| Titan Machinery, Inc. (a) | | 3,836 | 63,678 |
| | | | 95,436 |
|
| TOTAL INDUSTRIALS | | | 1,782,129 |
|
| INFORMATION TECHNOLOGY - 12.8% | | | |
| Communications Equipment - 0.1% | | | |
| ViaSat, Inc. (a) | | 180 | 12,391 |
| Electronic Equipment & Components - 2.5% | | | |
| Itron, Inc. (a) | | 495 | 37,749 |
| SYNNEX Corp. | | 1,403 | 165,182 |
| TTM Technologies, Inc. (a) | | 6,370 | 74,593 |
| | | | 277,524 |
| IT Services - 5.5% | | | |
| Black Knight, Inc. (a) | | 629 | 40,382 |
| Booz Allen Hamilton Holding Corp. Class A | | 517 | 36,381 |
| CACI International, Inc. Class A (a) | | 196 | 43,855 |
| Computer Services, Inc. | | 2,620 | 117,900 |
| EPAM Systems, Inc. (a) | | 157 | 27,626 |
| Euronet Worldwide, Inc. (a) | | 132 | 18,489 |
| Genpact Ltd. | | 1,032 | 40,423 |
| International Money Express, Inc. (a) | | 700 | 10,724 |
| InterXion Holding NV (a) | | 287 | 25,319 |
| KBR, Inc. | | 1,411 | 39,734 |
| Maximus, Inc. | | 523 | 40,135 |
| MongoDB, Inc. Class A (a) | | 243 | 31,048 |
| Unisys Corp. (a) | | 4,891 | 50,182 |
| Verra Mobility Corp. (a) | | 7,067 | 101,411 |
| | | | 623,609 |
| Semiconductors & Semiconductor Equipment - 1.3% | | | |
| Advanced Energy Industries, Inc. (a) | | 597 | 35,283 |
| Cabot Microelectronics Corp. | | 198 | 29,922 |
| Cirrus Logic, Inc. (a) | | 841 | 57,154 |
| Entegris, Inc. | | 489 | 23,472 |
| | | | 145,831 |
| Software - 3.4% | | | |
| Alteryx, Inc. Class A (a) | | 234 | 21,411 |
| Ceridian HCM Holding, Inc. (a) | | 756 | 36,477 |
| DocuSign, Inc. (a) | | 517 | 34,220 |
| Elastic NV | | 416 | 29,956 |
| Everbridge, Inc. (a) | | 545 | 37,883 |
| HubSpot, Inc. (a) | | 219 | 33,967 |
| j2 Global, Inc. | | 265 | 25,164 |
| Lightspeed POS, Inc. (a) | | 700 | 18,261 |
| LivePerson, Inc. (a) | | 1,080 | 44,334 |
| Pluralsight, Inc. (a) | | 939 | 16,977 |
| PROS Holdings, Inc. (a) | | 491 | 25,159 |
| ShotSpotter, Inc. (a) | | 263 | 5,313 |
| SurveyMonkey (a) | | 1,399 | 25,742 |
| Workiva, Inc. (a) | | 669 | 27,877 |
| | | | 382,741 |
|
| TOTAL INFORMATION TECHNOLOGY | | | 1,442,096 |
|
| MATERIALS - 2.5% | | | |
| Chemicals - 1.2% | | | |
| Intrepid Potash, Inc. (a) | | 10,604 | 32,766 |
| Olin Corp. | | 3,852 | 70,646 |
| Orion Engineered Carbons SA | | 1,890 | 31,298 |
| | | | 134,710 |
| Containers & Packaging - 1.3% | | | |
| Aptargroup, Inc. | | 316 | 37,335 |
| Ardagh Group SA | | 3,704 | 69,154 |
| Avery Dennison Corp. | | 133 | 17,005 |
| Crown Holdings, Inc. (a) | | 331 | 24,110 |
| | | | 147,604 |
|
| TOTAL MATERIALS | | | 282,314 |
|
| REAL ESTATE - 6.3% | | | |
| Equity Real Estate Investment Trusts (REITs) - 5.0% | | | |
| Americold Realty Trust | | 1,418 | 56,848 |
| Clipper Realty, Inc. | | 3,575 | 34,463 |
| Corporate Office Properties Trust (SBI) | | 4,000 | 118,560 |
| Essential Properties Realty Trust, Inc. | | 1,250 | 32,075 |
| Lexington Corporate Properties Trust | | 3,802 | 41,366 |
| Outfront Media, Inc. | | 1,867 | 49,121 |
| Potlatch Corp. | | 3,104 | 131,827 |
| Store Capital Corp. | | 1,268 | 51,354 |
| Terreno Realty Corp. | | 754 | 42,533 |
| | | | 558,147 |
| Real Estate Management & Development - 1.3% | | | |
| Cushman & Wakefield PLC (a) | | 4,327 | 80,699 |
| DIC Asset AG | | 4,900 | 68,312 |
| | | | 149,011 |
|
| TOTAL REAL ESTATE | | | 707,158 |
|
| UTILITIES - 3.4% | | | |
| Electric Utilities - 2.1% | | | |
| IDACORP, Inc. | | 864 | 92,984 |
| Portland General Electric Co. | | 2,616 | 148,798 |
| | | | 241,782 |
| Gas Utilities - 1.3% | | | |
| ONE Gas, Inc. | | 704 | 65,359 |
| Spire, Inc. | | 919 | 77,251 |
| | | | 142,610 |
|
| TOTAL UTILITIES | | | 384,392 |
|
| TOTAL COMMON STOCKS | | | |
| (Cost $10,128,720) | | | 10,979,235 |
|
| Convertible Preferred Stocks - 0.6% | | | |
| HEALTH CARE - 0.0% | | | |
| Biotechnology - 0.0% | | | |
| REVOLUTION Medicines, Inc. Series C (b)(c) | | 2,823 | 5,815 |
| INDUSTRIALS - 0.1% | | | |
| Road & Rail - 0.1% | | | |
| Convoy, Inc. Series D (b)(c) | | 1,249 | 16,911 |
| INFORMATION TECHNOLOGY - 0.5% | | | |
| Software - 0.5% | | | |
| Compass, Inc.: | | | |
| Series E (a)(b)(c) | | 26 | 4,108 |
| Series F (b)(c) | | 310 | 47,823 |
| | | | 51,931 |
| TOTAL CONVERTIBLE PREFERRED STOCKS | | | |
| (Cost $61,237) | | | 74,657 |
|
| Investment Companies - 0.5% | | | |
| iShares Russell 2000 Growth Index ETF | | | |
| (Cost $54,723) | | 281 | 55,781 |
| | | Principal Amount | Value |
|
| U.S. Treasury Obligations - 0.1% | | | |
| U.S. Treasury Bills, yield at date of purchase 1.7% 1/2/20 | | | |
| (Cost $9,971) | | 10,000 | 9,973 |
| | | Shares | Value |
|
| Money Market Funds - 3.1% | | | |
| Fidelity Cash Central Fund 1.83% (d) | | | |
| (Cost $346,763) | | 346,693 | 346,763 |
| TOTAL INVESTMENT IN SECURITIES - 102.0% | | | |
| (Cost $10,601,414) | | | 11,466,409 |
| NET OTHER ASSETS (LIABILITIES) - (2.0)% | | | (230,272) |
| NET ASSETS - 100% | | | $11,236,137 |
Security Type Abbreviations
ETF – Exchange-Traded Fund
Legend
(a) Non-income producing
(b) Restricted securities - Investment in securities not registered under the Securities Act of 1933 (excluding 144A issues). At the end of the period, the value of restricted securities (excluding 144A issues) amounted to $74,657 or 0.7% of net assets.
(c) Level 3 security
(d) Affiliated fund that is generally available only to investment companies and other accounts managed by Fidelity Investments. The rate quoted is the annualized seven-day yield of the fund at period end. A complete unaudited listing of the fund's holdings as of its most recent quarter end is available upon request. In addition, each Fidelity Central Fund's financial statements, which are not covered by the Fund's Report of Independent Registered Public Accounting Firm, are available on the SEC's website or upon request.
Additional information on each restricted holding is as follows:
| Security | Acquisition Date | Acquisition Cost |
| Compass, Inc. Series E | 11/3/17 | $1,754 |
| Compass, Inc. Series F | 10/22/18 | $36,757 |
| Convoy, Inc. Series D | 10/30/19 | $16,911 |
| REVOLUTION Medicines, Inc. Series C | 6/3/19 | $5,815 |
Affiliated Central Funds
Information regarding fiscal year to date income earned by the Fund from investments in Fidelity Central Funds is as follows:
| Fund | Income earned |
| Fidelity Cash Central Fund | $5,130 |
| Total | $5,130 |
Amounts in the income column in the above table include any capital gain distributions from underlying funds, which are presented in the corresponding line-item in the Statement of Operations, if applicable.
Investment Valuation
The following is a summary of the inputs used, as of October 31, 2019, involving the Fund's assets and liabilities carried at fair value. The inputs or methodology used for valuing securities may not be an indication of the risk associated with investing in those securities. For more information on valuation inputs, and their aggregation into the levels used below, please refer to the Investment Valuation section in the accompanying Notes to Financial Statements.
| | Valuation Inputs at Reporting Date: |
| Description | Total | Level 1 | Level 2 | Level 3 |
| Investments in Securities: | | | | |
| Equities: | | | | |
| Communication Services | $487,389 | $487,389 | $-- | $-- |
| Consumer Discretionary | 1,357,617 | 1,357,617 | -- | -- |
| Consumer Staples | 413,365 | 413,365 | -- | -- |
| Energy | 256,740 | 256,740 | -- | -- |
| Financials | 2,300,480 | 2,300,480 | -- | -- |
| Health Care | 1,571,370 | 1,565,555 | -- | 5,815 |
| Industrials | 1,799,040 | 1,764,314 | 17,815 | 16,911 |
| Information Technology | 1,494,027 | 1,442,096 | -- | 51,931 |
| Materials | 282,314 | 282,314 | -- | -- |
| Real Estate | 707,158 | 707,158 | -- | -- |
| Utilities | 384,392 | 384,392 | -- | -- |
| Investment Companies | 55,781 | 55,781 | -- | -- |
| U.S. Government and Government Agency Obligations | 9,973 | -- | 9,973 | -- |
| Money Market Funds | 346,763 | 346,763 | -- | -- |
| Total Investments in Securities: | $11,466,409 | $11,363,964 | $27,788 | $74,657 |
Other Information
Distribution of investments by country or territory of incorporation, as a percentage of Total Net Assets, is as follows (Unaudited):
| United States of America | 85.9% |
| Bermuda | 3.8% |
| Ireland | 1.6% |
| United Kingdom | 1.5% |
| Germany | 1.1% |
| Puerto Rico | 1.0% |
| Others (Individually Less Than 1%) | 5.1% |
| | 100.0% |
See accompanying notes which are an integral part of the financial statements.
Financial Statements
Statement of Assets and Liabilities
| | | October 31, 2019 |
| Assets | | |
Investment in securities, at value — See accompanying schedule:
Unaffiliated issuers (cost $10,254,651) | $11,119,646 | |
| Fidelity Central Funds (cost $346,763) | 346,763 | |
| Total Investment in Securities (cost $10,601,414) | | $11,466,409 |
| Cash | | 6,982 |
| Receivable for investments sold | | 82,518 |
| Receivable for fund shares sold | | 3,690 |
| Dividends receivable | | 1,175 |
| Distributions receivable from Fidelity Central Funds | | 462 |
| Total assets | | 11,561,236 |
| Liabilities | | |
| Payable for investments purchased | $309,353 | |
| Payable for fund shares redeemed | 15,746 | |
| Total liabilities | | 325,099 |
| Net Assets | | $11,236,137 |
| Net Assets consist of: | | |
| Paid in capital | | $10,552,791 |
| Total accumulated earnings (loss) | | 683,346 |
| Net Assets, for 933,316 shares outstanding | | $11,236,137 |
| Net Asset Value, offering price and redemption price per share ($11,236,137 ÷ 933,316 shares) | | $12.04 |
See accompanying notes which are an integral part of the financial statements.
Statement of Operations
| | | Year ended October 31, 2019 |
| Investment Income | | |
| Dividends | | $90,007 |
| Interest | | 191 |
| Income from Fidelity Central Funds | | 5,130 |
| Total income | | 95,328 |
| Expenses | | |
| Independent trustees' fees and expenses | $48 | |
| Commitment fees | 22 | |
| Total expenses | | 70 |
| Net investment income (loss) | | 95,258 |
| Realized and Unrealized Gain (Loss) | | |
| Net realized gain (loss) on: | | |
| Investment securities: | | |
| Unaffiliated issuers | (211,019) | |
| Foreign currency transactions | (2) | |
| Futures contracts | 3,003 | |
| Total net realized gain (loss) | | (208,018) |
| Change in net unrealized appreciation (depreciation) on: | | |
| Investment securities: | | |
| Unaffiliated issuers | 954,457 | |
| Assets and liabilities in foreign currencies | 10 | |
| Total change in net unrealized appreciation (depreciation) | | 954,467 |
| Net gain (loss) | | 746,449 |
| Net increase (decrease) in net assets resulting from operations | | $841,707 |
See accompanying notes which are an integral part of the financial statements.
Statement of Changes in Net Assets
| | Year ended October 31, 2019 | Year ended October 31, 2018 |
| Increase (Decrease) in Net Assets | | |
| Operations | | |
| Net investment income (loss) | $95,258 | $70,077 |
| Net realized gain (loss) | (208,018) | 132,779 |
| Change in net unrealized appreciation (depreciation) | 954,467 | (130,145) |
| Net increase (decrease) in net assets resulting from operations | 841,707 | 72,711 |
| Distributions to shareholders | (177,637) | (5,350) |
| Share transactions | | |
| Proceeds from sales of shares | 10,666,475 | 13,229,826 |
| Reinvestment of distributions | 177,637 | 5,350 |
| Cost of shares redeemed | (7,805,995) | (6,306,678) |
| Net increase (decrease) in net assets resulting from share transactions | 3,038,117 | 6,928,498 |
| Total increase (decrease) in net assets | 3,702,187 | 6,995,859 |
| Net Assets | | |
| Beginning of period | 7,533,950 | 538,091 |
| End of period | $11,236,137 | $7,533,950 |
| Other Information | | |
| Shares | | |
| Sold | 922,418 | 1,158,230 |
| Issued in reinvestment of distributions | 17,146 | 496 |
| Redeemed | (684,824) | (530,150) |
| Net increase (decrease) | 254,740 | 628,576 |
See accompanying notes which are an integral part of the financial statements.
Financial Highlights
Fidelity Flex Small Cap Fund
| | | | |
| Years ended October 31, | 2019 | 2018 | 2017 A |
| Selected Per–Share Data | | | |
| Net asset value, beginning of period | $11.10 | $10.76 | $10.00 |
| Income from Investment Operations | | | |
| Net investment income (loss)B | .12 | .13 | .07 |
| Net realized and unrealized gain (loss) | 1.14 | .32 | .69 |
| Total from investment operations | 1.26 | .45 | .76 |
| Distributions from net investment income | (.12) | (.11) | – |
| Distributions from net realized gain | (.20) | – | – |
| Total distributions | (.32) | (.11) | – |
| Net asset value, end of period | $12.04 | $11.10 | $10.76 |
| Total ReturnC | 11.83% | 4.18% | 7.60% |
| Ratios to Average Net AssetsD,E | | | |
| Expenses before reductionsF | -% | -% | - %G |
| Expenses net of fee waivers, if anyF | -% | -% | - %G |
| Expenses net of all reductionsF | -% | -% | - %G |
| Net investment income (loss) | 1.07% | 1.14% | 1.10%G |
| Supplemental Data | | | |
| Net assets, end of period (000 omitted) | $11,236 | $7,534 | $538 |
| Portfolio turnover rateH | 145% | 163% | 249%G |
A For the period March 7, 2017 (commencement of operations) to October 31, 2017.
B Calculated based on average shares outstanding during the period.
C Total returns for periods of less than one year are not annualized.
D Fees and expenses of any underlying Fidelity Central Funds are not included in the Fund's expense ratio. The Fund indirectly bears its proportionate share of the expenses of any underlying Fidelity Central Funds.
E Expense ratios reflect operating expenses of the Fund. Expenses before reductions do not reflect amounts reimbursed by the investment adviser or reductions from expense offset arrangements and do not represent the amount paid by the Fund during periods when reimbursements or reductions occur. Expense ratios before reductions for start-up periods may not be representative of longer term operating periods. Expenses net of fee waivers reflect expenses after reimbursement by the investment adviser but prior to reductions from expense offset arrangements. Expenses net of all reductions represent the net expenses paid by the Fund.
F Amount represents less than .005%.
G Annualized
H Amount does not include the portfolio activity of any underlying Fidelity Central Funds.
See accompanying notes which are an integral part of the financial statements.
Notes to Financial Statements
For the period ended October 31, 2019
1. Organization.
Fidelity Flex Small Cap Fund (the Fund) is a fund of Fidelity Capital Trust (the Trust) and is authorized to issue an unlimited number of shares. Share transactions on the Statement of Changes in Net Assets may contain exchanges between affiliated funds. The Trust is registered under the Investment Company Act of 1940, as amended (the 1940 Act), as an open-end management investment company organized as a Massachusetts business trust. The Fund is available only to certain fee-based accounts offered by Fidelity.
2. Investments in Fidelity Central Funds.
The Fund invests in Fidelity Central Funds, which are open-end investment companies generally available only to other investment companies and accounts managed by the investment adviser and its affiliates. The Fund's Schedule of Investments lists each of the Fidelity Central Funds held as of period end, if any, as an investment of the Fund, but does not include the underlying holdings of each Fidelity Central Fund. As an Investing Fund, the Fund indirectly bears its proportionate share of the expenses of the underlying Fidelity Central Funds.
The Money Market Central Funds seek preservation of capital and current income and are managed by Fidelity Investments Money Management, Inc. (FIMM), an affiliate of the investment adviser. Annualized expenses of the Money Market Central Funds as of their most recent shareholder report date ranged from less than .005% to .01%.
A complete unaudited list of holdings for each Fidelity Central Fund is available upon request or at the Securities and Exchange Commission (the SEC) website at www.sec.gov. In addition, the financial statements of the Fidelity Central Funds, which are not covered by the Fund's Report of Independent Registered Public Accounting Firm, are available on the SEC website or upon request.
3. Significant Accounting Policies.
The Fund is an investment company and applies the accounting and reporting guidance of the Financial Accounting Standards Board (FASB) Accounting Standards Codification Topic 946 Financial Services – Investments Companies. The financial statements have been prepared in conformity with accounting principles generally accepted in the United States of America (GAAP), which require management to make certain estimates and assumptions at the date of the financial statements. Actual results could differ from those estimates. Subsequent events, if any, through the date that the financial statements were issued have been evaluated in the preparation of the financial statements. The following summarizes the significant accounting policies of the Fund:
Investment Valuation. Investments are valued as of 4:00 p.m. Eastern time on the last calendar day of the period. The Board of Trustees (the Board) has delegated the day to day responsibility for the valuation of the Fund's investments to the Fair Value Committee (the Committee) established by the Fund's investment adviser. In accordance with valuation policies and procedures approved by the Board, the Fund attempts to obtain prices from one or more third party pricing vendors or brokers to value its investments. When current market prices, quotations or currency exchange rates are not readily available or reliable, investments will be fair valued in good faith by the Committee, in accordance with procedures adopted by the Board. Factors used in determining fair value vary by investment type and may include market or investment specific events, changes in interest rates and credit quality. The frequency with which these procedures are used cannot be predicted and they may be utilized to a significant extent. The Committee oversees the Fund's valuation policies and procedures and reports to the Board on the Committee's activities and fair value determinations. The Board monitors the appropriateness of the procedures used in valuing the Fund's investments and ratifies the fair value determinations of the Committee.
The Fund categorizes the inputs to valuation techniques used to value its investments into a disclosure hierarchy consisting of three levels as shown below:
- Level 1 – quoted prices in active markets for identical investments
- Level 2 – other significant observable inputs (including quoted prices for similar investments, interest rates, prepayment speeds, etc.)
- Level 3 – unobservable inputs (including the Fund's own assumptions based on the best information available)
Valuation techniques used to value the Fund's investments by major category are as follows:
Equity securities, including restricted securities, for which market quotations are readily available, are valued at the last reported sale price or official closing price as reported by a third party pricing vendor on the primary market or exchange on which they are traded and are categorized as Level 1 in the hierarchy. In the event there were no sales during the day or closing prices are not available, securities are valued at the last quoted bid price or may be valued using the last available price and are generally categorized as Level 2 in the hierarchy. For foreign equity securities, when market or security specific events arise, comparisons to the valuation of American Depositary Receipts (ADRs), futures contracts, Exchange-Traded Funds (ETFs) and certain indexes as well as quoted prices for similar securities may be used and would be categorized as Level 2 in the hierarchy. For equity securities, including restricted securities, where observable inputs are limited, assumptions about market activity and risk are used and these securities may be categorized as Level 3 in the hierarchy.
Debt securities, including restricted securities, are valued based on evaluated prices received from third party pricing vendors or from brokers who make markets in such securities. U.S. government and government agency obligations are valued by pricing vendors who utilize matrix pricing which considers prepayment speed assumptions, attributes of the collateral, yield or price of bonds of comparable quality, coupon, maturity and type or by broker-supplied prices. When independent prices are unavailable or unreliable, debt securities may be valued utilizing pricing methodologies which consider similar factors that would be used by third party pricing vendors. Debt securities are generally categorized as Level 2 in the hierarchy but may be Level 3 depending on the circumstances.
ETFs are valued at their last sale price or official closing price as reported by a third party pricing vendor on the primary market or exchange on which they are traded and are categorized as Level 1 in the hierarchy. In the event there were no sales during the day but the exchange reports a closing bid level, ETFs are valued at the closing bid and would be categorized as Level 1 in the hierarchy. In the event there was no closing bid, ETFs may be valued by another method that the Board believes reflects fair value in accordance with the Board's fair value pricing policies and may be categorized as Level 2 in the hierarchy.
Investments in open-end mutual funds, including the Fidelity Central Funds, are valued at their closing net asset value (NAV) each business day and are categorized as Level 1 in the hierarchy.
Changes in valuation techniques may result in transfers in or out of an assigned level within the disclosure hierarchy. The aggregate value of investments by input level as of October 31, 2019 is included at the end of the Fund's Schedule of Investments.
Foreign Currency. The Fund may use foreign currency contracts to facilitate transactions in foreign-denominated securities. Gains and losses from these transactions may arise from changes in the value of the foreign currency or if the counterparties do not perform under the contracts' terms.
Foreign-denominated assets, including investment securities, and liabilities are translated into U.S. dollars at the exchange rates at period end. Purchases and sales of investment securities, income and dividends received and expenses denominated in foreign currencies are translated into U.S. dollars at the exchange rate in effect on the transaction date.
The effects of exchange rate fluctuations on investments are included with the net realized and unrealized gain (loss) on investment securities. Other foreign currency transactions resulting in realized and unrealized gain (loss) are disclosed separately.
Investment Transactions and Income. For financial reporting purposes, the Fund's investment holdings and NAV include trades executed through the end of the last business day of the period. The NAV per share for processing shareholder transactions is calculated as of the close of business of the New York Stock Exchange (NYSE), normally 4:00 p.m. Eastern time and includes trades executed through the end of the prior business day. Gains and losses on securities sold are determined on the basis of identified cost. Dividend income is recorded on the ex-dividend date, except for certain dividends from foreign securities where the ex-dividend date may have passed, which are recorded as soon as the Fund is informed of the ex-dividend date. Non-cash dividends included in dividend income, if any, are recorded at the fair market value of the securities received. Income and capital gain distributions from Fidelity Central Funds, if any, are recorded on the ex-dividend date. Certain distributions received by the Fund represent a return of capital or capital gain. The Fund determines the components of these distributions subsequent to the ex-dividend date, based upon receipt of tax filings or other correspondence relating to the underlying investment. These distributions are recorded as a reduction of cost of investments and/or as a realized gain. Interest income is accrued as earned and includes coupon interest and amortization of premium and accretion of discount on debt securities as applicable. Investment income is recorded net of foreign taxes withheld where recovery of such taxes is uncertain.
Expenses. Expenses directly attributable to a fund are charged to that fund. Expenses attributable to more than one fund are allocated among the respective funds on the basis of relative net assets or other appropriate methods. Expense estimates are accrued in the period to which they relate and adjustments are made when actual amounts are known.
Income Tax Information and Distributions to Shareholders. Each year, the Fund intends to qualify as a regulated investment company under Subchapter M of the Internal Revenue Code, including distributing substantially all of its taxable income and realized gains. As a result, no provision for U.S. Federal income taxes is required. As of October 31, 2019, the Fund did not have any unrecognized tax benefits in the financial statements; nor is the Fund aware of any tax positions for which it is reasonably possible that the total amounts of unrecognized tax benefits will significantly change in the next twelve months. The Fund files a U.S. federal tax return, in addition to state and local tax returns as required. The Fund's federal income tax returns are subject to examination by the Internal Revenue Service (IRS) for a period of three fiscal years after they are filed. State and local tax returns may be subject to examination for an additional fiscal year depending on the jurisdiction. Foreign taxes are provided for based on the Fund's understanding of the tax rules and rates that exist in the foreign markets in which it invests.
Distributions are declared and recorded on the ex-dividend date. Income and capital gain distributions are determined in accordance with income tax regulations, which may differ from GAAP. In addition, the Fund claimed a portion of the payment made to redeeming shareholders as a distribution for income tax purposes.
Capital accounts within the financial statements are adjusted for permanent book-tax differences. These adjustments have no impact on net assets or the results of operations. Capital accounts are not adjusted for temporary book-tax differences which will reverse in a subsequent period.
Book-tax differences are primarily due to futures contracts, foreign currency transactions, market discount, partnerships, capital loss carryforwards and losses deferred due to wash sales.
As of period end, the cost and unrealized appreciation (depreciation) in securities, and derivatives if applicable, for federal income tax purposes were as follows:
| Gross unrealized appreciation | $1,331,003 |
| Gross unrealized depreciation | (567,880) |
| Net unrealized appreciation (depreciation) | $763,123 |
| Tax Cost | $10,703,286 |
The tax-based components of distributable earnings as of period end were as follows:
| Undistributed ordinary income | $61,285 |
| Capital loss carryforward | $(141,071) |
| Net unrealized appreciation (depreciation) on securities and other investments | $763,133 |
Capital loss carryforwards are only available to offset future capital gains of the Fund to the extent provided by regulations and may be limited. Under the Regulated Investment Company Modernization Act of 2010 (the Act), the Fund is permitted to carry forward capital losses incurred in taxable years beginning after December 22, 2010 for an unlimited period and such capital losses are required to be used prior to any losses that expire. The capital loss carryforward information presented below, including any applicable limitation, is estimated as of fiscal period end and is subject to adjustment.
| No expiration | |
| Short-term | $(141,071) |
The tax character of distributions paid was as follows:
| | October 31, 2019 | October 31, 2018 |
| Ordinary Income | $159,375 | $ 5,350 |
| Long-term Capital Gains | 18,262 | – |
| Total | $177,637 | $ 5,350 |
Restricted Securities. The Fund may invest in securities that are subject to legal or contractual restrictions on resale. These securities generally may be resold in transactions exempt from registration or to the public if the securities are registered. Disposal of these securities may involve time-consuming negotiations and expense, and prompt sale at an acceptable price may be difficult. Information regarding restricted securities is included at the end of the Fund's Schedule of Investments.
4. Derivative Instruments.
Risk Exposures and the Use of Derivative Instruments. The Fund's investment objective allows the Fund to enter into various types of derivative contracts, including futures contracts. Derivatives are investments whose value is primarily derived from underlying assets, indices or reference rates and may be transacted on an exchange or over-the-counter (OTC). Derivatives may involve a future commitment to buy or sell a specified asset based on specified terms, to exchange future cash flows at periodic intervals based on a notional principal amount, or for one party to make one or more payments upon the occurrence of specified events in exchange for periodic payments from the other party.
The Fund used derivatives to increase returns and to manage exposure to certain risks as defined below. The success of any strategy involving derivatives depends on analysis of numerous economic factors, and if the strategies for investment do not work as intended, the Fund may not achieve its objectives.
The Fund's use of derivatives increased or decreased its exposure to the following risk:
| Equity Risk | Equity risk relates to the fluctuations in the value of financial instruments as a result of changes in market prices (other than those arising from interest rate risk or foreign exchange risk), whether caused by factors specific to an individual investment, its issuer, or all factors affecting all instruments traded in a market or market segment.
|
The Fund is also exposed to additional risks from investing in derivatives, such as liquidity risk and counterparty credit risk. Liquidity risk is the risk that the Fund will be unable to close out the derivative in the open market in a timely manner. Counterparty credit risk is the risk that the counterparty will not be able to fulfill its obligation to the Fund. Counterparty credit risk related to exchange-traded futures contracts may be mitigated by the protection provided by the exchange on which they trade.
Investing in derivatives may involve greater risks than investing in the underlying assets directly and, to varying degrees, may involve risk of loss in excess of any initial investment and collateral received and amounts recognized in the Statement of Assets and Liabilities. In addition, there may be the risk that the change in value of the derivative contract does not correspond to the change in value of the underlying instrument.
Futures Contracts. A futures contract is an agreement between two parties to buy or sell a specified underlying instrument for a fixed price at a specified future date. The Fund used futures contracts to manage its exposure to the stock market.
Upon entering into a futures contract, a fund is required to deposit either cash or securities (initial margin) with a clearing broker in an amount equal to a certain percentage of the face value of the contract. Futures contracts are marked-to-market daily and subsequent daily payments are made or received by a fund depending on the daily fluctuations in the value of the futures contracts and are recorded as unrealized appreciation or (depreciation). This receivable and/or payable, if any, is included in daily variation margin on futures contracts in the Statement of Assets and Liabilities. Realized gain or (loss) is recorded upon the expiration or closing of a futures contract. The net realized gain (loss) and change in net unrealized appreciation (depreciation) on futures contracts during the period is presented in the Statement of Operations.
Any open futures contracts at period end are presented in the Schedule of Investments under the caption "Futures Contracts". The notional amount at value reflects each contract's exposure to the underlying instrument or index at period end.
5. Purchases and Sales of Investments.
Purchases and sales of securities, other than short-term securities, aggregated $15,554,654 and $12,535,640, respectively.
6. Fees and Other Transactions with Affiliates.
Management Fee. Fidelity Management & Research Company (the investment adviser) and its affiliates provide the Fund with investment management related services and the Fund does not pay any fees for these services. Under the management contract, the investment adviser or an affiliate pays all other expenses of the Fund, excluding fees and expenses of the independent Trustees, and certain miscellaneous expenses such as proxy and shareholder meeting expenses.
Brokerage Commissions. The Fund placed a portion of its portfolio transactions with brokerage firms which are affiliates of the investment adviser. Brokerage commissions are included in net realized gain (loss) and change in net unrealized appreciation (depreciation) in the Statement of Operations. The commissions paid to these affiliated firms were $768 for the period.
Interfund Trades. The Fund may purchase from or sell securities to other Fidelity Funds under procedures adopted by the Board. The procedures have been designed to ensure these interfund trades are executed in accordance with Rule 17a-7 of the 1940 Act. Interfund trades are included within the respective purchases and sales amounts shown in the Purchases and Sales of Investments note.
7. Committed Line of Credit.
The Fund participates with other funds managed by the investment adviser or an affiliate in a $4.25 billion credit facility (the "line of credit") to be utilized for temporary or emergency purposes to fund shareholder redemptions or for other short-term liquidity purposes. The Fund has agreed to pay commitment fees on its pro-rata portion of the line of credit, which amounted to $22 and is reflected in Commitment fees on the Statement of Operations. During the period, the Fund did not borrow on this line of credit.
8. Other.
The Fund's organizational documents provide former and current trustees and officers with a limited indemnification against liabilities arising in connection with the performance of their duties to the Fund. In the normal course of business, the Fund may also enter into contracts that provide general indemnifications. The Fund's maximum exposure under these arrangements is unknown as this would be dependent on future claims that may be made against the Fund. The risk of material loss from such claims is considered remote.
Report of Independent Registered Public Accounting Firm
To the Trustees of Fidelity Capital Trust and Shareholders of Fidelity Flex Small Cap Fund:
Opinion on the Financial Statements and Financial Highlights
We have audited the accompanying statement of assets and liabilities of Fidelity Flex Small Cap Fund (the "Fund"), a fund of Fidelity Capital Trust, including the schedule of investments, as of October 31, 2019, the related statement of operations for the year then ended, the statement of changes in net assets for each of the two years in the period then ended, the financial highlights for each of the two years in the period then ended and for the period from March 7, 2017 (commencement of operations) to October 31, 2017, and the related notes. In our opinion, the financial statements and financial highlights present fairly, in all material respects, the financial position of the Fund as of October 31, 2019, and the results of its operations for the year then ended, the changes in its net assets for each of the two years in the period then ended, and the financial highlights for each of the two years in the period then ended and for the period from March 7, 2017 (commencement of operations) to October 31, 2017 in conformity with accounting principles generally accepted in the United States of America.
Basis for Opinion
These financial statements and financial highlights are the responsibility of the Fund's management. Our responsibility is to express an opinion on the Fund's financial statements and financial highlights based on our audits. We are a public accounting firm registered with the Public Company Accounting Oversight Board (United States) (PCAOB) and are required to be independent with respect to the Fund in accordance with the U.S. federal securities laws and the applicable rules and regulations of the Securities and Exchange Commission and the PCAOB.
We conducted our audits in accordance with the standards of the PCAOB. Those standards require that we plan and perform the audit to obtain reasonable assurance about whether the financial statements and financial highlights are free of material misstatement, whether due to error or fraud. The Fund is not required to have, nor were we engaged to perform, an audit of its internal control over financial reporting. As part of our audits we are required to obtain an understanding of internal control over financial reporting but not for the purpose of expressing an opinion on the effectiveness of the Fund’s internal control over financial reporting. Accordingly, we express no such opinion.
Our audits included performing procedures to assess the risks of material misstatement of the financial statements and financial highlights, whether due to error or fraud, and performing procedures that respond to those risks. Such procedures included examining, on a test basis, evidence regarding the amounts and disclosures in the financial statements and financial highlights. Our audits also included evaluating the accounting principles used and significant estimates made by management, as well as evaluating the overall presentation of the financial statements and financial highlights. Our procedures included confirmation of securities owned as of October 31, 2019, by correspondence with the custodians and brokers; when replies were not received from brokers, we performed other auditing procedures. We believe that our audits provide a reasonable basis for our opinion.
/s/ Deloitte & Touche LLP
Boston, Massachusetts
December 13, 2019
We have served as the auditor of one or more of the Fidelity investment companies since 1999.
Trustees and Officers
The Trustees, Members of the Advisory Board (if any), and officers of the trust and fund, as applicable, are listed below. The Board of Trustees governs the fund and is responsible for protecting the interests of shareholders. The Trustees are experienced executives who meet periodically throughout the year to oversee the fund's activities, review contractual arrangements with companies that provide services to the fund, oversee management of the risks associated with such activities and contractual arrangements, and review the fund's performance. Except for Michael E. Wiley, each of the Trustees oversees 298 funds. Mr. Wiley oversees 197 funds.
The Trustees hold office without limit in time except that (a) any Trustee may resign; (b) any Trustee may be removed by written instrument, signed by at least two-thirds of the number of Trustees prior to such removal; (c) any Trustee who requests to be retired or who has become incapacitated by illness or injury may be retired by written instrument signed by a majority of the other Trustees; and (d) any Trustee may be removed at any special meeting of shareholders by a two-thirds vote of the outstanding voting securities of the trust. Each Trustee who is not an interested person (as defined in the 1940 Act) of the trust and the fund is referred to herein as an Independent Trustee. Each Independent Trustee shall retire not later than the last day of the calendar year in which his or her 75th birthday occurs. The Independent Trustees may waive this mandatory retirement age policy with respect to individual Trustees. Officers and Advisory Board Members hold office without limit in time, except that any officer or Advisory Board Member may resign or may be removed by a vote of a majority of the Trustees at any regular meeting or any special meeting of the Trustees. Except as indicated, each individual has held the office shown or other offices in the same company for the past five years.
The fund’s Statement of Additional Information (SAI) includes more information about the Trustees. To request a free copy, call Fidelity at 1-800-544-3455 (for managed account clients) or 1-800-835-5092 (for retirement plan participants).
Experience, Skills, Attributes, and Qualifications of the Trustees. The Governance and Nominating Committee has adopted a statement of policy that describes the experience, qualifications, attributes, and skills that are necessary and desirable for potential Independent Trustee candidates (Statement of Policy). The Board believes that each Trustee satisfied at the time he or she was initially elected or appointed a Trustee, and continues to satisfy, the standards contemplated by the Statement of Policy. The Governance and Nominating Committee also engages professional search firms to help identify potential Independent Trustee candidates who have the experience, qualifications, attributes, and skills consistent with the Statement of Policy. From time to time, additional criteria based on the composition and skills of the current Independent Trustees, as well as experience or skills that may be appropriate in light of future changes to board composition, business conditions, and regulatory or other developments, have also been considered by the professional search firms and the Governance and Nominating Committee. In addition, the Board takes into account the Trustees' commitment and participation in Board and committee meetings, as well as their leadership of standing and ad hoc committees throughout their tenure.
In determining that a particular Trustee was and continues to be qualified to serve as a Trustee, the Board has considered a variety of criteria, none of which, in isolation, was controlling. The Board believes that, collectively, the Trustees have balanced and diverse experience, qualifications, attributes, and skills, which allow the Board to operate effectively in governing the fund and protecting the interests of shareholders. Information about the specific experience, skills, attributes, and qualifications of each Trustee, which in each case led to the Board's conclusion that the Trustee should serve (or continue to serve) as a trustee of the fund, is provided below.
Board Structure and Oversight Function. James C. Curvey is an interested person and currently serves as Chairman. The Trustees have determined that an interested Chairman is appropriate and benefits shareholders because an interested Chairman has a personal and professional stake in the quality and continuity of services provided to the fund. Independent Trustees exercise their informed business judgment to appoint an individual of their choosing to serve as Chairman, regardless of whether the Trustee happens to be independent or a member of management. The Independent Trustees have determined that they can act independently and effectively without having an Independent Trustee serve as Chairman and that a key structural component for assuring that they are in a position to do so is for the Independent Trustees to constitute a substantial majority for the Board. The Independent Trustees also regularly meet in executive session. Ned C. Lautenbach serves as Chairman of the Independent Trustees and as such (i) acts as a liaison between the Independent Trustees and management with respect to matters important to the Independent Trustees and (ii) with management prepares agendas for Board meetings.
Fidelity® funds are overseen by different Boards of Trustees. The fund's Board oversees Fidelity's high income and certain equity funds, and other Boards oversee Fidelity's investment-grade bond, money market, asset allocation, and other equity funds. The asset allocation funds may invest in Fidelity® funds overseen by the fund's Board. The use of separate Boards, each with its own committee structure, allows the Trustees of each group of Fidelity® funds to focus on the unique issues of the funds they oversee, including common research, investment, and operational issues. On occasion, the separate Boards establish joint committees to address issues of overlapping consequences for the Fidelity® funds overseen by each Board.
The Trustees operate using a system of committees to facilitate the timely and efficient consideration of all matters of importance to the Trustees, the fund, and fund shareholders and to facilitate compliance with legal and regulatory requirements and oversight of the fund's activities and associated risks. The Board, acting through its committees, has charged FMR and its affiliates with (i) identifying events or circumstances the occurrence of which could have demonstrably adverse effects on the fund's business and/or reputation; (ii) implementing processes and controls to lessen the possibility that such events or circumstances occur or to mitigate the effects of such events or circumstances if they do occur; and (iii) creating and maintaining a system designed to evaluate continuously business and market conditions in order to facilitate the identification and implementation processes described in (i) and (ii) above. Because the day-to-day operations and activities of the fund are carried out by or through FMR, its affiliates, and other service providers, the fund's exposure to risks is mitigated but not eliminated by the processes overseen by the Trustees. While each of the Board's committees has responsibility for overseeing different aspects of the fund's activities, oversight is exercised primarily through the Operations, Audit, and Compliance Committees. Appropriate personnel, including but not limited to the fund's Chief Compliance Officer (CCO), FMR's internal auditor, the independent accountants, the fund's Treasurer and portfolio management personnel, make periodic reports to the Board's committees, as appropriate, including an annual review of Fidelity's risk management program for the Fidelity® funds. The responsibilities of each standing committee, including their oversight responsibilities, are described further under "Standing Committees of the Trustees."
Interested Trustees*:
Correspondence intended for a Trustee who is an interested person may be sent to Fidelity Investments, 245 Summer Street, Boston, Massachusetts 02210.
Name, Year of Birth; Principal Occupations and Other Relevant Experience+
James C. Curvey (1935)
Year of Election or Appointment: 2007
Trustee
Chairman of the Board of Trustees
Mr. Curvey also serves as Trustee of other Fidelity® funds. Mr. Curvey is Vice Chairman (2007-present) and Director of FMR LLC (diversified financial services company). In addition, Mr. Curvey is an Overseer Emeritus for the Boston Symphony Orchestra, a Director of Artis-Naples, and a Trustee of Brewster Academy in Wolfeboro, New Hampshire. Previously, Mr. Curvey served as a Director of Fidelity Research & Analysis Co. (investment adviser firm, 2009-2018), Director of Fidelity Investments Money Management, Inc. (investment adviser firm, 2009-2014) and a Director of FMR and FMR Co., Inc. (investment adviser firms, 2007-2014).
* Determined to be an “Interested Trustee” by virtue of, among other things, his or her affiliation with the trust or various entities under common control with FMR.
+ The information includes the Trustee's principal occupation during the last five years and other information relating to the experience, attributes, and skills relevant to the Trustee's qualifications to serve as a Trustee, which led to the conclusion that the Trustee should serve as a Trustee for the fund.
Independent Trustees:
Correspondence intended for an Independent Trustee may be sent to Fidelity Investments, P.O. Box 55235, Boston, Massachusetts 02205-5235.
Name, Year of Birth; Principal Occupations and Other Relevant Experience+
Dennis J. Dirks (1948)
Year of Election or Appointment: 2005
Trustee
Mr. Dirks also serves as Trustee of other Fidelity® funds. Prior to his retirement in May 2003, Mr. Dirks was Chief Operating Officer and a member of the Board of The Depository Trust & Clearing Corporation (DTCC). He also served as President, Chief Operating Officer, and Board member of The Depository Trust Company (DTC) and President and Board member of the National Securities Clearing Corporation (NSCC). In addition, Mr. Dirks served as Chief Executive Officer and Board member of the Government Securities Clearing Corporation, Chief Executive Officer and Board member of the Mortgage-Backed Securities Clearing Corporation, as a Trustee and a member of the Finance Committee of Manhattan College (2005-2008), as a Trustee and a member of the Finance Committee of AHRC of Nassau County (2006-2008), as a member of the Independent Directors Council (IDC) Governing Council (2010-2015), and as a member of the Board of Directors for The Brookville Center for Children’s Services, Inc. (2009-2017). Mr. Dirks is a member of the Finance Committee (2016-present) and Board of Directors (2017-present) and is Treasurer (2018-present) of the Asolo Repertory Theatre.
Donald F. Donahue (1950)
Year of Election or Appointment: 2018
Trustee
Mr. Donahue also serves as a Trustee of other Fidelity® funds. Mr. Donahue is President and Chief Executive Officer of Miranda Partners, LLC (risk consulting for the financial services industry, 2012-present). Previously, Mr. Donahue served as a Member of the Advisory Board of certain Fidelity® funds (2015-2018) and Chief Executive Officer (2006-2012), Chief Operating Officer (2003-2006), and Managing Director, Customer Marketing and Development (1999-2003) of The Depository Trust & Clearing Corporation (financial markets infrastructure). Mr. Donahue serves as a Member (2007-present) and Co-Chairman (2016-present) of the Board of Directors of United Way of New York, Member of the Board of Directors of NYC Leadership Academy (2012-present) and Member of the Board of Advisors of Ripple Labs, Inc. (financial services, 2015-present). He also served as Chairman (2010-2012) and Member of the Board of Directors (2012-2013) of Omgeo, LLC (financial services), Treasurer of United Way of New York (2012-2016), and Member of the Board of Directors of XBRL US (financial services non-profit, 2009-2012) and the International Securities Services Association (2009-2012).
Alan J. Lacy (1953)
Year of Election or Appointment: 2008
Trustee
Mr. Lacy also serves as Trustee of other Fidelity® funds. Mr. Lacy serves as a Director of Bristol-Myers Squibb Company (global pharmaceuticals, 2008-present). He is a Trustee of the California Chapter of The Nature Conservancy (2015-present) and a Director of the Center for Advanced Study in the Behavioral Sciences at Stanford University (2015-present). In addition, Mr. Lacy served as Senior Adviser (2007-2014) of Oak Hill Capital Partners, L.P. (private equity) and also served as Chief Executive Officer (2005) and Vice Chairman (2005-2006) of Sears Holdings Corporation (retail) and Chief Executive Officer and Chairman of the Board of Sears, Roebuck and Co. (retail, 2000-2005). Previously, Mr. Lacy served as Chairman (2014-2017) and a member (2010-2017) of the Board of Directors of Dave & Buster’s Entertainment, Inc. (restaurant and entertainment complexes), as Chairman (2008-2011) and a member (2006-2015) of the Board of Trustees of the National Parks Conservation Association, and as a member of the Board of Directors for The Hillman Companies, Inc. (hardware wholesalers, 2010-2014), Earth Fare, Inc. (retail grocery, 2010-2014), and The Western Union Company (global money transfer, 2006-2011).
Ned C. Lautenbach (1944)
Year of Election or Appointment: 2000
Trustee
Chairman of the Independent Trustees
Mr. Lautenbach also serves as Trustee of other Fidelity® funds. Mr. Lautenbach currently serves as Chair (2018-present) and Member (2013-present) of the Board of Governors, State University System of Florida and is a member of the Council on Foreign Relations (1994-present). He is also a member and has most recently served as Chairman of the Board of Directors of Artis-Naples (2012-present). Previously, Mr. Lautenbach served as a member and then Lead Director of the Board of Directors of Eaton Corporation (diversified industrial, 1997-2016). He was also a Partner and Advisory Partner at Clayton, Dubilier & Rice, LLC (private equity investment, 1998-2010), as well as a Director of Sony Corporation (2006-2007). In addition, Mr. Lautenbach also had a 30-year career with IBM (technology company) during which time he served as Senior Vice President and a member of the Corporate Executive Committee (1968-1998).
Joseph Mauriello (1944)
Year of Election or Appointment: 2008
Trustee
Mr. Mauriello also serves as Trustee of other Fidelity® funds. Prior to his retirement in January 2006, Mr. Mauriello served in numerous senior management positions including Deputy Chairman and Chief Operating Officer (2004-2005), and Vice Chairman of Financial Services (2002-2004) of KPMG LLP US (professional services, 1965-2005). Mr. Mauriello currently serves as a member of the Independent Directors Council (IDC) Governing Council (2015-present). Previously, Mr. Mauriello served as a member of the Board of Directors of XL Group plc. (global insurance and re-insurance, 2006-2018).
Cornelia M. Small (1944)
Year of Election or Appointment: 2005
Trustee
Ms. Small also serves as Trustee of other Fidelity® funds. Ms. Small is a member of the Board of Directors (2009-present) and Chair of the Investment Committee (2010-present) of the Teagle Foundation. Ms. Small also serves on the Investment Committee of the Berkshire Taconic Community Foundation (2008-present). Previously, Ms. Small served as Chairperson (2002-2008) and a member of the Investment Committee and Chairperson (2008-2012) and a member of the Board of Trustees of Smith College. In addition, Ms. Small served as Chief Investment Officer, Director of Global Equity Investments, and a member of the Board of Directors of Scudder, Stevens & Clark and Scudder Kemper Investments.
Garnett A. Smith (1947)
Year of Election or Appointment: 2018
Trustee
Mr. Smith also serves as Trustee of other Fidelity® funds. Prior to Mr. Smith's retirement, he served as Chairman and Chief Executive Officer of Inbrand Corp. (manufacturer of personal absorbent products, 1990-1997). He also served as President (1986-1990) of Inbrand Corp. Prior to his employment with Inbrand Corp., he was employed by a retail fabric chain and North Carolina National Bank. In addition, Mr. Smith served as a Member of the Advisory Board of certain Fidelity® funds (2012-2013) and as a board member of the Jackson Hole Land Trust (2009-2012).
David M. Thomas (1949)
Year of Election or Appointment: 2008
Trustee
Mr. Thomas also serves as Trustee of other Fidelity® funds. Mr. Thomas serves as Non-Executive Chairman of the Board of Directors of Fortune Brands Home and Security (home and security products, 2011-present) and as a member of the Board of Directors (2004-present) and Presiding Director (2013-present) of Interpublic Group of Companies, Inc. (marketing communication). Previously, Mr. Thomas served as Executive Chairman (2005-2006) and Chairman and Chief Executive Officer (2000-2005) of IMS Health, Inc. (pharmaceutical and healthcare information solutions), a Director of Fortune Brands, Inc. (consumer products, 2000-2011), and a member of the Board of Trustees of the University of Florida (2013-2018).
Michael E. Wiley (1950)
Year of Election or Appointment: 2018
Trustee
Mr. Wiley also serves as Trustee or Member of the Advisory Board of other Fidelity® funds. Mr. Wiley serves as a Director of High Point Resources (exploration and production, 2005-present). Previously, Mr. Wiley served as a Director of Andeavor Corporation (independent oil refiner and marketer, 2005-2018), a Director of Andeavor Logistics LP (natural resources logistics, 2015-2018), a Director of Post Oak Bank (privately-held bank, 2004-2018), a Director of Asia Pacific Exploration Consolidated (international oil and gas exploration and production, 2008-2013), a member of the Board of Trustees of the University of Tulsa (2000-2006; 2007-2010), a Senior Energy Advisor of Katzenbach Partners, LLC (consulting, 2006-2007), an Advisory Director of Riverstone Holdings (private investment), a Director of Spinnaker Exploration Company (exploration and production, 2001-2005) and Chairman, President, and CEO of Baker Hughes, Inc. (oilfield services, 2000-2004).
+ The information includes the Trustee's principal occupation during the last five years and other information relating to the experience, attributes, and skills relevant to the Trustee's qualifications to serve as a Trustee, which led to the conclusion that the Trustee should serve as a Trustee for the fund.
Advisory Board Members and Officers:
Correspondence intended for a Member of the Advisory Board (if any) may be sent to Fidelity Investments, P.O. Box 55235, Boston, Massachusetts 02205-5235. Correspondence intended for an officer or Peter S. Lynch may be sent to Fidelity Investments, 245 Summer Street, Boston, Massachusetts 02210. Officers appear below in alphabetical order.
Name, Year of Birth; Principal Occupation
Vicki L. Fuller (1957)
Year of Election or Appointment: 2018
Member of the Advisory Board
Ms. Fuller also serves as Member of the Advisory Board of other Fidelity® funds. Ms. Fuller serves as a member of the Board of Directors, Audit Committee, and Nominating and Governance Committee of The Williams Companies, Inc. (natural gas infrastructure, 2018-present). Previously, Ms. Fuller served as the Chief Investment Officer of the New York State Common Retirement Fund (2012-2018) and held a variety of positions at AllianceBernstein L.P. (global asset management, 1985-2012), including Managing Director (2006-2012) and Senior Vice President and Senior Portfolio Manager (2001-2006).
Peter S. Lynch (1944)
Year of Election or Appointment: 2003
Member of the Advisory Board
Mr. Lynch also serves as Member of the Advisory Board of other Fidelity® funds. Mr. Lynch is Vice Chairman and a Director of FMR (investment adviser firm) and FMR Co., Inc. (investment adviser firm). In addition, Mr. Lynch serves as a Trustee of Boston College and as the Chairman of the Inner-City Scholarship Fund. Previously, Mr. Lynch served on the Special Olympics International Board of Directors (1997-2006).
Elizabeth Paige Baumann (1968)
Year of Election or Appointment: 2017
Anti-Money Laundering (AML) Officer
Ms. Baumann also serves as AML Officer of other funds. She is Chief AML Officer (2012-present) and Senior Vice President (2014-present) of FMR LLC (diversified financial services company) and is an employee of Fidelity Investments. Previously, Ms. Baumann served as AML Officer of the funds (2012-2016), and Vice President (2007-2014) and Deputy Anti-Money Laundering Officer (2007-2012) of FMR LLC.
Craig S. Brown (1977)
Year of Election or Appointment: 2019
Assistant Treasurer
Mr. Brown also serves as Assistant Treasurer of other funds. Mr. Brown is an employee of Fidelity Investments (2013-present).
John J. Burke III (1964)
Year of Election or Appointment: 2018
Chief Financial Officer
Mr. Burke also serves as Chief Financial Officer of other funds. Mr. Burke serves as Head of Investment Operations for Fidelity Fund and Investment Operations (2018-present) and is an employee of Fidelity Investments (1998-present). Previously Mr. Burke served as head of Asset Management Investment Operations (2012-2018).
William C. Coffey (1969)
Year of Election or Appointment: 2019
Assistant Secretary
Mr. Coffey also serves as Assistant Secretary of other funds. He is Senior Vice President and Deputy General Counsel of FMR LLC (diversified financial services company, 2010-present), and is an employee of Fidelity Investments. Previously, Mr. Coffey served as Secretary and CLO of certain funds (2018-2019); CLO, Secretary, and Senior Vice President of Fidelity Management & Research Company and FMR Co., Inc. (investment adviser firms, 2018-2019); Secretary of Fidelity SelectCo, LLC and Fidelity Investments Money Management, Inc. (investment adviser firms, 2018-2019); CLO of Fidelity Management & Research (Hong Kong) Limited, FMR Investment Management (UK) Limited, and Fidelity Management & Research (Japan) Limited (investment adviser firms, 2018-2019); and Assistant Secretary of certain funds (2009-2018).
Timothy M. Cohen (1969)
Year of Election or Appointment: 2018
Vice President
Mr. Cohen also serves as Vice President of other funds. Mr. Cohen serves as Executive Vice President of Fidelity SelectCo, LLC (2019-present), Co-Head of Equity (2018-present), a Director of Fidelity Management & Research (Japan) Limited (investment adviser firm, 2016-present), and is an employee of Fidelity Investments. Previously, Mr. Cohen served as Head of Global Equity Research (2016-2018), Chief Investment Officer - Equity and a Director of Fidelity Management & Research (U.K.) Inc. (investment adviser firm, 2013-2015) and as a Director of Fidelity Management & Research (Hong Kong) Limited (investment adviser firm, 2017).
Jonathan Davis (1968)
Year of Election or Appointment: 2010
Assistant Treasurer
Mr. Davis also serves as Assistant Treasurer of other funds. Mr. Davis serves as Assistant Treasurer of FMR Capital, Inc. (2017-present) and is an employee of Fidelity Investments. Previously, Mr. Davis served as Vice President and Associate General Counsel of FMR LLC (diversified financial services company, 2003-2010).
Adrien E. Deberghes (1967)
Year of Election or Appointment: 2016
Assistant Treasurer
Mr. Deberghes also serves as an officer of other funds. He serves as Assistant Treasurer of FMR Capital, Inc. (2017-present), Executive Vice President of Fidelity Investments Money Management, Inc. (FIMM) (investment adviser firm, 2016-present), and is an employee of Fidelity Investments (2008-present). Previously, Mr. Deberghes served as President and Treasurer of certain Fidelity® funds (2013-2018). Prior to joining Fidelity Investments, Mr. Deberghes was Senior Vice President of Mutual Fund Administration at State Street Corporation (2007-2008), Senior Director of Mutual Fund Administration at Investors Bank & Trust (2005-2007), and Director of Finance for Dunkin' Brands (2000-2005). Previously, Mr. Deberghes served in other fund officer roles.
Laura M. Del Prato (1964)
Year of Election or Appointment: 2018
Assistant Treasurer
Ms. Del Prato also serves as an officer of other funds. Ms. Del Prato is an employee of Fidelity Investments (2017-present). Prior to joining Fidelity Investments, Ms. Del Prato served as a Managing Director and Treasurer of the JPMorgan Mutual Funds (2014-2017). Prior to JPMorgan, Ms. Del Prato served as a partner at Cohen Fund Audit Services (accounting firm, 2012-2013) and KPMG LLP (accounting firm, 2004-2012).
Colm A. Hogan (1973)
Year of Election or Appointment: 2016
Deputy Treasurer
Mr. Hogan also serves as an officer of other funds. Mr. Hogan serves as Assistant Treasurer of FMR Capital, Inc. (2017-present) and is an employee of Fidelity Investments (2005-present). Previously, Mr. Hogan served as Assistant Treasurer of certain Fidelity® funds (2016-2018).
Pamela R. Holding (1964)
Year of Election or Appointment: 2018
Vice President
Ms. Holding also serves as Vice President of other funds. Ms. Holding serves as Executive Vice President of Fidelity SelectCo, LLC (2019-present), Co-Head of Equity (2018-present) and is an employee of Fidelity Investments (2013-present). Previously, Ms. Holding served as Chief Investment Officer of Fidelity Institutional Asset Management (2013-2018).
Cynthia Lo Bessette (1969)
Year of Election or Appointment: 2019
Secretary and Chief Legal Officer (CLO)
Ms. Lo Bessette also serves as Secretary and CLO of other funds. Ms. Lo Bessette serves as CLO, Secretary, and Senior Vice President of Fidelity Management & Research Company and FMR Co., Inc. (investment adviser firms, 2019-present); Secretary of Fidelity SelectCo, LLC and Fidelity Investments Money Management, Inc. (investment adviser firms, 2019-present); and CLO of Fidelity Management & Research (Hong Kong) Limited, FMR Investment Management (UK) Limited, and Fidelity Management & Research (Japan) Limited (investment adviser firms, 2019-present). She is a Senior Vice President and Deputy General Counsel of FMR LLC (diversified financial services company, 2019-present), and is an employee of Fidelity Investments. Previously, Ms. Lo Bessette served as Executive Vice President, General Counsel (2016-2019) and Senior Vice President, Deputy General Counsel (2015-2016) of OppenheimerFunds (investment management company) and Deputy Chief Legal Officer (2013-2015) of Jennison Associates LLC (investment adviser firm).
Chris Maher (1972)
Year of Election or Appointment: 2013
Assistant Treasurer
Mr. Maher serves as Assistant Treasurer of other funds. Mr. Maher is Vice President of Valuation Oversight, serves as Assistant Treasurer of FMR Capital, Inc. (2017-present), and is an employee of Fidelity Investments. Previously, Mr. Maher served as Vice President of Asset Management Compliance (2013), Vice President of the Program Management Group of FMR (investment adviser firm, 2010-2013), and Vice President of Valuation Oversight (2008-2010).
Kenneth B. Robins (1969)
Year of Election or Appointment: 2016
Chief Compliance Officer
Mr. Robins also serves as an officer of other funds. Mr. Robins serves as Compliance Officer of Fidelity Management & Research Company and FMR Co., Inc. (investment adviser firms, 2016-present) and is an employee of Fidelity Investments (2004-present). Previously, Mr. Robins served as Executive Vice President of Fidelity Investments Money Management, Inc. (investment adviser firm, 2013-2016) and served in other fund officer roles.
Stacie M. Smith (1974)
Year of Election or Appointment: 2016
President and Treasurer
Ms. Smith also serves as an officer of other funds. Ms. Smith serves as Assistant Treasurer of FMR Capital, Inc. (2017-present), is an employee of Fidelity Investments (2009-present), and has served in other fund officer roles. Prior to joining Fidelity Investments, Ms. Smith served as Senior Audit Manager of Ernst & Young LLP (accounting firm, 1996-2009). Previously, Ms. Smith served as Assistant Treasurer (2013-2018) and Deputy Treasurer (2013-2016) of certain Fidelity® funds.
Marc L. Spector (1972)
Year of Election or Appointment: 2016
Assistant Treasurer
Mr. Spector also serves as an officer of other funds. Mr. Spector serves as Assistant Treasurer of FMR Capital, Inc. (2017-present) and is an employee of Fidelity Investments (2016-present). Prior to joining Fidelity Investments, Mr. Spector served as Director at the Siegfried Group (accounting firm, 2013-2016), and prior to Siegfried Group as audit senior manager at Deloitte & Touche (accounting firm, 2005-2013).
Jim Wegmann (1979)
Year of Election or Appointment: 2019
Assistant Treasurer
Mr. Wegmann also serves as Assistant Treasurer of other funds. Mr. Wegmann is an employee of Fidelity Investments (2011-present).
Shareholder Expense Example
As a shareholder of the Fund, you incur two types of costs: (1) transaction costs and (2) ongoing costs, including other Fund expenses. This Example is intended to help you understand your ongoing costs (in dollars) of investing in the Fund and to compare these costs with the ongoing costs of investing in other mutual funds.
The Example is based on an investment of $1,000 invested at the beginning of the period and held for the entire period (May 1, 2019 to October 31, 2019).
Actual Expenses
The first line of the accompanying table provides information about actual account values and actual expenses. You may use the information in this line, together with the amount you invested, to estimate the expenses that you paid over the period. Simply divide your account value by $1,000.00 (for example, an $8,600 account value divided by $1,000.00 = 8.6), then multiply the result by the number in the first line under the heading entitled "Expenses Paid During Period" to estimate the expenses you paid on your account during this period. In addition, the Fund, as a shareholder in the underlying Fidelity Central Funds, will indirectly bear its pro-rata share of the fees and expenses incurred by the underlying Fidelity Central Funds. These fees and expenses are not included in the Fund's annualized expense ratio used to calculate the expense estimate in the table below.
Hypothetical Example for Comparison Purposes
The second line of the accompanying table provides information about hypothetical account values and hypothetical expenses based on the Fund's actual expense ratio and an assumed rate of return of 5% per year before expenses, which is not the Fund's actual return. The hypothetical account values and expenses may not be used to estimate the actual ending account balance or expenses you paid for the period. You may use this information to compare the ongoing costs of investing in the Fund and other funds. To do so, compare this 5% hypothetical example with the 5% hypothetical examples that appear in the shareholder reports of the other funds. In addition, the Fund, as a shareholder in the underlying Fidelity Central Funds, will indirectly bear its pro-rata share of the fees and expenses incurred by the underlying Fidelity Central Funds. These fees and expenses are not included in the Fund's annualized expense ratio used to calculate the expense estimate in the table below.
Please note that the expenses shown in the table are meant to highlight your ongoing costs only and do not reflect any transaction costs. Therefore, the second line of the table is useful in comparing ongoing costs only, and will not help you determine the relative total costs of owning different funds.
| | Annualized Expense Ratio-A | Beginning
Account Value
May 1, 2019 | Ending
Account Value
October 31, 2019 | Expenses Paid
During Period-B
May 1, 2019
to October 31, 2019 |
| Actual | - %-C | $1,000.00 | $1,022.90 | $--D |
| Hypothetical-E | | $1,000.00 | $1,025.21 | $--D |
A Annualized expense ratio reflects expenses net of applicable fee waivers.
B Expenses are equal to the Fund's annualized expense ratio, multiplied by the average account value over the period, multiplied by 184/365 (to reflect the one-half year period).
C Amount represents less than .005%.
D Amount represents less than $.005.
E 5% return per year before expenses
Distributions (Unaudited)
The fund designates 61% of the dividend distributed during the fiscal year as qualifying for the dividends–received deduction for corporate shareholders.
The fund designates 68% of the dividend distributed during the fiscal year as amounts which may be taken into account as a dividend for the purposes of the maximum rate under section 1(h)(11) of the Internal Revenue Code.
The fund will notify shareholders in January 2020 of amounts for use in preparing 2019 income tax returns.
ZSC-ANN-1219
1.9881583.102
Item 2.
Code of Ethics
As of the end of the period, October 31, 2019, Fidelity Capital Trust (the trust) has adopted a code of ethics, as defined in Item 2 of Form N-CSR, that applies to its President and Treasurer and its Chief Financial Officer. A copy of the code of ethics is filed as an exhibit to this Form N-CSR.
Item 3.
Audit Committee Financial Expert
The Board of Trustees of the trust has determined that Joseph Mauriello is an audit committee financial expert, as defined in Item 3 of Form N-CSR. Mr. Mauriello is independent for purposes of Item 3 of Form N-CSR.
Item 4.
Principal Accountant Fees and Services
Fees and Services
The following table presents fees billed by Deloitte & Touche LLP, the member firms of Deloitte Touche Tohmatsu, and their respective affiliates (collectively, “Deloitte Entities”) in each of the last two fiscal years for services rendered to Fidelity Flex Small Cap Fund and Fidelity Stock Selector Small Cap Fund (the “Fund(s)”):
Services Billed by Deloitte Entities
October 31, 2019 FeesA
| | | | |
| Audit Fees | Audit-Related Fees | Tax Fees | All Other Fees |
Fidelity Flex Small Cap Fund | $38,000 | $100 | $5,300 | $1,000 |
Fidelity Stock Selector Small Cap Fund | $45,000 | $100 | $5,000 | $1,200 |
| | | | |
| Audit Fees | Audit-Related Fees | Tax Fees | All Other Fees |
Fidelity Flex Small Cap Fund | $39,000 | $100 | $5,200 | $1,100 |
Fidelity Stock Selector Small Cap Fund | $47,000 | $100 | $5,000 | $1,300 |
AAmounts may reflect rounding.
The following table presents fees billed by PricewaterhouseCoopers LLP (“PwC”) in each of the last two fiscal years for services rendered to Fidelity Capital Appreciation Fund, Fidelity Disciplined Equity Fund, Fidelity Focused Stock Fund and Fidelity Value Fund (the “Fund(s)”):
Services Billed by PwC
October 31, 2019 FeesA
| | | | |
| Audit Fees | Audit-Related Fees | Tax Fees | All Other Fees |
Fidelity Capital Appreciation Fund | $51,000 | $4,100 | $4,200 | $1,900 |
Fidelity Disciplined Equity Fund | $48,000 | $4,000 | $4,200 | $1,800 |
Fidelity Focused Stock Fund | $34,000 | $2,800 | $3,300 | $1,300 |
Fidelity Value Fund | $59,000 | $4,900 | $7,000 | $2,200 |
| | | | |
| Audit Fees | Audit-Related Fees | Tax Fees | All Other Fees |
Fidelity Capital Appreciation Fund | $53,000 | $4,600 | $3,300 | $2,200 |
Fidelity Disciplined Equity Fund | $53,000 | $4,600 | $3,300 | $2,300 |
Fidelity Focused Stock Fund | $35,000 | $3,100 | $3,300 | $1,500 |
Fidelity Value Fund | $61,000 | $5,300 | $4,400 | $2,600 |
AAmounts may reflect rounding.
The following table(s) present(s) fees billed by Deloitte Entities and PwC that were required to be approved by the Audit Committee for services that relate directly to the operations and financial reporting of the Fund(s) and that are rendered on behalf of Fidelity Management & Research Company ("FMR") and entities controlling, controlled by, or under common control with FMR (not including any sub-adviser whose role is primarily portfolio management and is subcontracted with or overseen by another investment adviser) that provide ongoing services to the Fund(s) (“Fund Service Providers”):
Services Billed by Deloitte Entities
| | |
| October 31, 2019A | October 31, 2018A |
Audit-Related Fees | $290,000 | $5,000 |
Tax Fees | $5,000 | $5,000 |
All Other Fees | $- | $- |
A Amounts may reflect rounding.
Services Billed by PwC
| | |
| October 31, 2019A | October 31, 2018A |
Audit-Related Fees | $7,890,000 | $7,745,000 |
Tax Fees | $10,000 | $20,000 |
All Other Fees | $- | $- |
A Amounts may reflect rounding.
“Audit-Related Fees” represent fees billed for assurance and related services that are reasonably related to the performance of the fund audit or the review of the fund's financial statements and that are not reported under Audit Fees.
“Tax Fees” represent fees billed for tax compliance, tax advice or tax planning that relate directly to the operations and financial reporting of the fund.
“All Other Fees” represent fees billed for services provided to the fund or Fund Service Provider, a significant portion of which are assurance related, that relate directly to the operations and financial reporting of the fund, excluding those services that are reported under Audit Fees, Audit-Related Fees or Tax Fees.
Assurance services must be performed by an independent public accountant.
* * *
The aggregate non-audit fees billed by Deloitte Entities and PwC for services rendered to the Fund(s), FMR (not including any sub-adviser whose role is primarily portfolio management and is subcontracted with or overseen by another investment adviser), and any Fund Service Provider for each of the last two fiscal years of the Fund(s) are as follows:
| | |
Billed By | October 31, 2019A | October 31, 2018A |
Deloitte Entities | $590,000 | $495,000 |
PwC | $12,580,000 | $10,980,000 |
A Amounts may reflect rounding.
The trust's Audit Committee has considered non-audit services that were not pre-approved that were provided by Deloitte Entities and PwC to Fund Service Providers to be compatible with maintaining the independence of Deloitte Entities and PwC in its(their) audit of the Fund(s), taking into account representations from Deloitte Entities and PwC, in accordance with Public Company Accounting Oversight Board rules, regarding its independence from the Fund(s) and its(their) related entities and FMR’s review of the appropriateness and permissibility under applicable law of such non-audit services prior to their provision to the Fund(s) Service Providers.
Audit Committee Pre-Approval Policies and Procedures
The trust’s Audit Committee must pre-approve all audit and non-audit services provided by a fund’s independent registered public accounting firm relating to the operations or financial reporting of the fund. Prior to the commencement of any audit or non-audit services to a fund, the Audit Committee reviews the services to determine whether they are appropriate and permissible under applicable law.
The Audit Committee has adopted policies and procedures to, among other purposes, provide a framework for the Committee’s consideration of non-audit services by the audit firms that audit the Fidelity funds. The policies and procedures require that any non-audit service provided by a fund audit firm to a Fidelity fund and any non-audit service provided by a fund auditor to a Fund Service Provider that relates directly to the operations and financial reporting of a Fidelity fund (“Covered Service”) are subject to approval by the Audit Committee before such service is provided.
All Covered Services must be approved in advance of provision of the service either: (i) by formal resolution of the Audit Committee, or (ii) by oral or written approval of the service by the Chair of the Audit Committee (or if the Chair is unavailable, such other member of the Audit Committee as may be designated by the Chair to act in the Chair’s absence). The approval contemplated by (ii) above is permitted where the Treasurer determines that action on such an engagement is necessary before the next meeting of the Audit Committee.
Non-audit services provided by a fund audit firm to a Fund Service Provider that do not relate directly to the operations and financial reporting of a Fidelity fund are reported to the Audit Committee periodically.
Non-Audit Services Approved Pursuant to Rule 2-01(c)(7)(i)(C) and (ii) of Regulation S-X (“De Minimis Exception”)
There were no non-audit services approved or required to be approved by the Audit Committee pursuant to the De Minimis Exception during the Fund’s(s’) last two fiscal years relating to services provided to (i) the Fund(s) or (ii) any Fund Service Provider that relate directly to the operations and financial reporting of the Fund(s).
Item 5.
Audit Committee of Listed Registrants
Not applicable.
Item 6.
Investments
(a)
Not applicable.
(b)
Not applicable.
Item 7.
Disclosure of Proxy Voting Policies and Procedures for Closed-End Management Investment Companies
Not applicable.
Item 8.
Portfolio Managers of Closed-End Management Investment Companies
Not applicable.
Item 9.
Purchase of Equity Securities by Closed-End Management Investment Company and Affiliated Purchasers
Not applicable.
Item 10.
Submission of Matters to a Vote of Security Holders
There were no material changes to the procedures by which shareholders may recommend nominees to the trust’s Board of Trustees.
Item 11.
Controls and Procedures
(a)(i) The President and Treasurer and the Chief Financial Officer have concluded that the trust’s disclosure controls and procedures (as defined in Rule 30a-3(c) under the Investment Company Act) provide reasonable assurances that material information relating to the trust is made known to them by the appropriate persons, based on their evaluation of these controls and procedures as of a date within 90 days of the filing date of this report.
(a)(ii) There was no change in the trust’s internal control over financial reporting (as defined in Rule 30a-3(d) under the Investment Company Act) that occurred during the period covered by this report that has materially affected, or is reasonably likely to materially affect, the trust’s internal control over financial reporting.
Item 12.
Disclosure of Securities Lending Activities for Closed-End Management
Investment Companies
Not applicable.
Item 13.
Exhibits
| | |
(a) | (1) | Code of Ethics pursuant to Item 2 of Form N-CSR is filed and attached hereto as EX-99.CODE ETH. |
(a) | (2) | Certification pursuant to Rule 30a-2(a) under the Investment Company Act of 1940 (17 CFR 270.30a-2(a)) is filed and attached hereto as Exhibit 99.CERT. |
(a) | (3) | Not applicable. |
(b) |
| Certification pursuant to Rule 30a-2(b) under the Investment Company Act of 1940 (17 CFR 270.30a-2(b)) is furnished and attached hereto as Exhibit 99.906CERT. |
SIGNATURES
Pursuant to the requirements of the Securities Exchange Act of 1934 and the Investment Company Act of 1940, the registrant has duly caused this report to be signed on its behalf by the undersigned, thereunto duly authorized.
Fidelity Capital Trust
| |
By: | /s/Stacie M. Smith |
| Stacie M. Smith |
| President and Treasurer |
|
|
Date: | December 26, 2019 |
Pursuant to the requirements of the Securities Exchange Act of 1934 and the Investment Company Act of 1940, this report has been signed below by the following persons on behalf of the registrant and in the capacities and on the dates indicated.
| |
By: | /s/Stacie M. Smith |
| Stacie M. Smith |
| President and Treasurer |
|
|
Date: | December 26, 2019 |
| |
By: | /s/John J. Burke III |
| John J. Burke III |
| Chief Financial Officer |
|
|
Date: | December 26, 2019 |