UNITED STATES
SECURITIES AND EXCHANGE COMMISSION
WASHINGTON, D.C. 20549
FORM N-CSR
CERTIFIED SHAREHOLDER REPORT OF REGISTERED MANAGEMENT
INVESTMENT COMPANIES
Investment Company Act file number 811-2183
Babson Capital Corporate Investors
(Exact name of registrant as specified in charter)
1500 Main Street, P.O. Box 15189, Springfield, MA 01115-5189
(Address of principal executive offices) (Zip code)
Christopher A. DeFrancis, Vice President, Secretary and Chief Legal Officer
1500 Main Street, Suite 2800, P.O. Box 15189, Springfield, MA 01115-5189
(Name and address of agent for service)
Registrant's telephone number, including area code: 413-226-1000
Date of fiscal year end: 12/31
Date of reporting period: 12/31/13
Form N-CSR is to be used by management investment companies to file reports with the Commission not later than 10 days after the transmission to stockholders of any report that is required to be transmitted to stockholders under Rule 30e-1 under the Investment Company Act of 1940 (17 CFR 270.30e-1). The Commission may use the information provided on Form N-CSR in its regulatory, disclosure review, inspection and policymaking roles.
A registrant is required to disclose the information specified by Form N-CSR, and the Commission will make this information public. A registrant is not required to respond to the collection of information contained in Form N-CSR unless the Form displays a currently valid Office of Management and Budget ("OMB") control number. Please direct comments concerning the accuracy of the information collection burden estimate and any suggestions for reducing the burden to Secretary, Securities and Exchange Commission, 100 F Street NE, Washington, DC 20549. The OMB has reviewed this collection of information under the clearance requirements of 44 U.S.C. ss. 3507.
ITEM 1. REPORT TO STOCKHOLDERS.
Attached hereto is the annual shareholder report transmitted to shareholders pursuant to Rule 30e-1 of the Investment Company Act of 1940, as amended.
2013 | ||
Babson Capital CORPORATE INVESTORS 2013 Annual Report | ||
BABSON CAPITAL CORPORATE INVESTORS c/o Babson Capital Management LLC 1500 Main Street P.O. Box 15189 Springfield, Massachusetts 01115-5189 (413) 226-1516 http://www.BabsonCapital.com/mci ADVISER Babson Capital Management LLC 1500 Main Street, P.O. Box 15189 Springfield, Massachusetts 01115-5189 INDEPENDENT REGISTERED PUBLIC ACCOUNTING FIRM KPMG LLP Boston, Massachusetts 02111 COUNSEL TO THE TRUST Ropes & Gray LLP Boston, Massachusetts 02111 CUSTODIAN State Street Bank and Trust Company Boston, MA 02110 TRANSFER AGENT & REGISTRAR DST Systems, Inc. P.O. Box 219086 Kansas City, MO 64121-9086 1-800-647-7374 PROXY VOTING POLICIES & PROCEDURES; PROXY VOTING RECORD The Trustees of Babson Capital Corporate Investors (the “Trust”) have delegated proxy voting responsibilities relating to the voting of securities held by the Trust to Babson Capital Management LLC (“Babson Capital”). A description of Babson Capital’s proxy voting policies and procedures is available (1) without charge, upon request, by calling, toll-free 1-866-399-1516; (2) on the Trust’s website at http://www.BabsonCapital.com/mci; and (3) on the U.S. Securities and Exchange Commission’s (“SEC”) website at http://www.sec.gov. Information regarding how the Trust voted proxies relating to portfolio securities during the most recent 12-month period ended June 30, 2013 is available (1) on the Trust’s website at http://www.BabsonCapital.com/mci; and (2) on the SEC’s website at http://www.sec.gov. FORM N-Q The Trust files its complete schedule of portfolio holdings with the SEC for the first and third quarters of each fiscal year on Form N-Q. This information is available (i) on the SEC’s website at http://www.sec.gov; and (ii) at the SEC’s Public Reference Room in Washington, DC (which information on their operation may be obtained by calling 1-800-SEC-0330). A complete schedule of portfolio holdings as of each quarter-end is available on the Trust’s website at http://www.BabsonCapital.com/mci or upon request by calling, toll-free, 1-866-399-1516. | OFFICERS OF THE TRUST | |||
Clifford M. Noreen Chairman | ||||
Michael L. Klofas President | ||||
Michael P. Hermsen Vice President | ||||
Richard E. Spencer, II Vice President | ||||
Sean Feeley Vice President | ||||
James M. Roy Vice President & Chief Financial Officer | ||||
Christopher A. DeFrancis Vice President, Secretary & Chief Legal Officer | ||||
BABSON CAPITAL CORPORATE INVESTORS
Babson Capital Corporate Investors is a closed-end investment company, first offered to the public in 1971, whose shares are traded on the New York Stock Exchange.
INVESTMENT OBJECTIVE & POLICY
Babson Capital Corporate Investors (the “Trust”) is a closed-end managament investment company, first offered to the public in 1971, whose shares are traded on the New York Stock Exchange under the trading symbol “MCI”. The Trust’s share price can be found in the financial section of newspapers under either the New York Stock Exchange listings or Closed-End Fund Listings.
The Trust’s investment objective is to maintain a portfolio of securities providing a fixed yield and at the same time offering an opportunity for capital gains. The Trust’s principal investments are privately placed, below-investment grade, long-term debt obligations. Such direct placement securities may, in some cases, be accompanied by equity features such as warrants, conversion rights, or other equity features and, occasionally, preferred stocks. The Trust typically purchases these investments, which are not publicly tradable, directly from their issuers in private placement transactions. These investments are typically mezzanine debt instruments with accompanying private equity securities made to small or middle market companies. In addition, the Trust may temporarily invest, subject to certain limitations, in marketable investment grade debt securities, other marketable debt securities (including high yield securities) and marketable common stocks. Below-investment grade or high yield securities have predominantly speculative characteristics with respect to the capacity of the issuer to pay interest and repay principal.
Babson Capital Management LLC (“Babson Capital”) manages the Trust on a total return basis. The Trust distributes substantially all of its net income to shareholders each year. Accordingly, the Trust pays dividends to shareholders four times a year in January, May, August, and November. The Trust pays dividends to its shareholders in cash, unless the shareholder elects to participate in the Dividend Reinvestment and Share Purchase Plan.
In this report you will find a complete listing of the Trust’s holdings. We encourage you to read this section carefully for a better understanding of the Trust. We cordially invite all shareholders to attend the Trust’s Annual Meeting of Shareholders, which will be held on April 16, 2014 at 1:00 P.M. in Springfield, Massachusetts.
1
Babson Capital Corporate Investors
* | Data for Babson Capital Corporate Investors (the “Trust”) represents portfolio returns based on change in the Trust’s net asset value assuming the reinvestment of all dividends and distributions. These returns differ from the total investment return based on market value of the Trust’s shares due to the difference between the Trust’s net asset value and the market value of its shares outstanding (see page 11 for total investment return based on market value). Past performance is no guarantee of future results. |
2
2013 Annual Report
TO OUR SHAREHOLDERS
I am pleased to share with you the Trust’s Annual Report for the year ended December 31, 2013.
PORTFOLIO PERFORMANCE
The Trust’s net total portfolio rate of return for 2013 was 12.8%, as measured by the change in net asset value and assuming the reinvestment of all dividends and distributions. The Trust’s total net assets were $268,687,514 or $13.85 per share, as of December 31, 2013. This compares to $257,378,392 or $13.38 per share, as of December 31, 2012. The Trust paid a quarterly dividend of $0.30 per share for each of the four quarters of 2013, for a total annual dividend $1.20 per share. In 2012, the Trust also paid four quarterly dividends of $0.30 per share, and declared a special yearend dividend of $0.10 per share, for a total annual dividend of $1.30 per share. Net investment income for 2013 was $1.18 per share, including approximately $0.04 per share of non-recurring income, down $0.10 per share from 2012 net investment income of $1.28 per share, which included approximately $0.06 per share of non-recurring income.
The Trust’s stock price declined 2.3% during 2013, from $15.28 as of December 31, 2012 to $14.93 as of December 31, 2013. Most of the decline occurred in the fourth quarter of the year. Since year-end, the stock price has recovered somewhat, to $15.99 as of February 25, 2014. The Trust’s stock price of $14.93 as of December 31, 2013 equates to a 7.8% premium over the December 31, 2013 net asset value per share of $13.85. The Trust’s average quarter-end premium for the 3, 5, 10 and 25-year periods was 20.6%, 13.5%, 12.6%, and 4.1%, respectively.
The table below lists the average annual net returns of the Trust’s portfolio, based on the change in net assets and assuming the reinvestment of all dividends and distributions. Average annual returns of the Barclays Capital U.S. Corporate High Yield Index and the Russell 2000 Index for the 1, 3, 5,10 and 25 years ended December 31, 2013 are provided for comparison purposes only.
Barclays Capital U.S. | Russell | ||
The Trust | Corporate High Yield Index | 2000 Index | |
1 Year | 12.76% | 7.44% | 38.82% |
3 Years | 13.92% | 9.32% | 15.67% |
5 Years | 14.82% | 18.93% | 20.08% |
10 Years | 12.96% | 8.62% | 9.07% |
25 Years | 13.44% | 8.69% | 10.20% |
Past performance is no guarantee of future results.
PORTFOLIO ACTIVITY
Middle market merger and acquisition activity was slow during 2013, declining for the second straight year and remaining well below historical levels. As a result, new investment activity for the Trust was down from the prior year. For the full year 2013, the Trust closed 11 new private placement investments and seven add-on investments in existing portfolio companies. Total private placement investments purchased in 2013 were $36,209,813. This amount represents a 39.2% decrease from the $59,591,043 of new private placement investments completed by the Trust in 2012. Competition for new investment opportunities was intense in 2013, as there continued to be an overabundance of private debt and equity capital looking to be invested. Attractive companies are being aggressively pursued by both buyers and lenders, resulting in purchase price and leverage multiples rising to levels not seen since 2007. Pricing and return expectations also continued to be squeezed given the existing market supply/demand dynamics. All in all, 2013 was a difficult year for new investment activity in the private mezzanine market.
3
Babson Capital Corporate Investors
New private placement investments completed during 2013 were ARI Holding Corporation; CG Holdings Manufacturing Company; CTM Holding, Inc.; EPM Holding Company; gloProfessional Holdings, Inc.; Hi-Rel Group LLC; Janus Group Holding LLC; Signature Systems Holdings Company; SMB Machinery Holdings, Inc.; Strahman Holdings, Inc.; and Tranzonic Holdings LLC. In addition, the Trust added to existing private placement investments in Advanced Manufacturing Enterprises, LLC; A S C Group, Inc.; CG Holdings Manufacturing Company; FGI Equity LLC; K & N Parent, Inc.; Safety Infrastructure Solutions; and Synteract Holdings Corporation. A brief description of these investments can be found in the Consolidated Schedule of Investments.
While new investment activity was off from last year’s pace, the condition of the Trust’s existing portfolio strengthened once again in 2013. Sales and earnings for the Trust’s portfolio companies as a whole continued their upward momentum. Credit upgrades in the portfolio this year outnumbered credit downgrades by a three to one margin. The number of companies on our watch list and in default is at or near the lowest level we have seen over the last five years.
We had 13 companies exit from the Trust’s portfolio during 2013, some of which were sold off in pieces over the last several years. This is a relatively normal level of exit activity for the portfolio. In ten of these exits, the Trust realized a positive return on its investment. These investments were AE Company, Inc.; EXC Acquisition Corporation; Flutes, Inc.; HGGC Citadel Plastics Holdings; Marshall Physicians Services LLC; Paradigm Packaging, Inc.; Qualis Automotive LLC; RM Holding Company; The Tranzonic Companies and Visioneering, Inc. Three long-standing troubled investments, International Offshore Services LLC, Monessen Holding Corporation, and Workplace Media Holding Company were also realized in 2013 at recovery levels consistent with their carrying values.
We had an unprecedented level of refinancing activity in the portfolio in 2013, on top of an unusually high level in 2012. These transactions, in which the debt instruments held by the Trust were fully or partially prepaid, are being driven by companies seeking to take advantage of low interest rates and the abundant availability of capital. During 2013, we had 32 portfolio companies fully or partially prepay their debt obligations to the Trust, including ten such transactions in the month of December alone. This high level of prepayment activity near year end is the principal reason that the cash balance at year end was unusually high. Including the 13 exits, 45 of the 120 companies, or 38%, in which the Trust held private restricted securities at the end of 2012 either fully or partially prepaid their debt obligations or left the portfolio entirely. In addition to the high cash balance at year end, the other effect of such activity is the reduction in net investment income that we experienced in 2013.
OUTLOOK FOR 2014
We have started the year off with a healthy level of deal flow, which should help the Trust begin to rebuild its private mezzanine debt portfolio. Surveys of middle market financiers indicate that most expect 2014 to be a more robust year in terms of deal flow than 2013. However, they also indicate an expectation of continued upward pressure on leverage levels and downward pressure on pricing and returns. In the face of these expected market conditions, we will continue to employ on behalf of the Trust the same investment philosophy that has served it well since its inception: investing in companies which we believe have a strong business proposition, solid cash flow and experienced, ethical management. We believe this philosophy, along with Babson Capital’s seasoned investment management team, positions the Trust well to meet its long-term investment objectives.
While the Trust was able to maintain its $0.30 per share quarterly dividend in 2013, this level may not be sustainable throughout 2014. The Trust is currently not earning $0.30 per share per quarter due principally to the high level of prepayment and exit activity that has occurred over the past two years. We anticipate a continuance of a higher than normal level of exit and prepayment activity in 2014. We have yet not been able to fully offset this with new investments due to the slow merger and acquisition market of the last few years. In short, the number of private mezzanine debt securities in the portfolio has shrunk considerably over the past two years, and it is unlikely we can build the portfolio back up to its former size in the near term. As we move through 2014, we and the Board of Trustees will continue to evaluate the earnings capacity of the Trust and seek to formulate a dividend strategy in light of that earnings level.
4
2013 Annual Report
As always, I would like to thank you for your continued interest in and support of Babson Capital Corporate Investors. I look forward to seeing you at the Trust’s annual shareholder meeting in Springfield on April 16, 2014.
Lastly, on behalf of the Trust’s shareholders, the members of the Board of Trustees, and the officers of the Trust, I would once again like to thank Donald E. Benson and Donald Glickman for their many years of dedicated service to the Trust as Trustees. Both of them provided the Trust with invaluable insight and guidance, and served our shareholders extremely well throughout their respective long tenures as Trustees. I would also like to welcome Barbara M. Ginader as a Trustee. Barbara was elected at the October 2013 Board of Trustees meeting for a term of office to expire at the 2014 annual meeting of shareholders. On a sad note, I would also like to acknowledge the passing of Martin T. Hart. Martin was a Trustee from 1991 until his retirement in 2012. He passed away on January 3, 2014, and he will be missed.
Sincerely,
Michael L. Klofas
President
Cautionary Notice: Certain statements contained in this report may be “forward looking” statements. Investors are cautioned not to place undue reliance on forward-looking statements, which speak only as of the date in which they are made and which reflect management’s current estimates, projections, expectations or beliefs, and which are subject to risks and uncertainties that may cause actual results to differ materially. These statements are subject to change at any time based upon economic, market or other conditions and may not be relied upon as investment advice or an indication of the Trust’s trading intent. References to specific securities are not recommendations of such securities, and may not be representative of the Trust’s current or future investments. We undertake no obligation to publicly update forward looking statements, whether as a result of new information, future events, or otherwise.
2013 | Record | Net Investment | Short-Term | Tax | Long-Term | ||||||||||||
Dividends | Date | Income | Gains | Effect | Gains | ||||||||||||
Regular | 4/29/2013 | 0.3000 | - | - | |||||||||||||
8/30/2013 | 0.3000 | - | - | ||||||||||||||
10/28/2013 | 0.3000 | - | - | ||||||||||||||
12/31/2013 | 0.3000 | - | - | ||||||||||||||
$ | 1.2000 | $ | - | $ | 1.2000 | 0.0000 |
The Trust did not have distributable net long-term capital gains in 2013.
Qualified for Dividend | Interest Earned on | |||||||||||||||||||||||||
Annual Dividend | Received Deduction*** | Qualified Dividends**** | U.S. Gov’t. Obligations | |||||||||||||||||||||||
Amount | Amount | Amount | Amount | |||||||||||||||||||||||
Per Share | Percent | Per Share | Percent | Per Share | Percent | Per Share | ||||||||||||||||||||
$ | 1.20 | 2.7497% | 0.0329 | 2.3510% | 0.0281 | 0% | 0.0000 |
*** Not available to individual shareholders
**** Qualified dividends are reported in Box 1b on IRS Form 1099-Div for 2013
5
BABSON CAPITAL CORPORATE INVESTORS | |||
Financial Report | |||
Consolidated Statement of Assets and Liabilities | 7 | ||
Consolidated Statement of Operations | 8 | ||
Consolidated Statement of Cash Flows | 9 | ||
Consolidated Statements of Changes in Net Assets | 10 | ||
Consolidated Selected Financial Highlights | 11 | ||
Consolidated Schedule of Investments | 12-40 | ||
Notes to Consolidated Financial Statements | 41-46 | ||
Report of Independent Registered Public Accounting Firm | 47 | ||
Interested Trustees | 48-49 | ||
Independent Trustees | 50-51 | ||
Officers of the Trust | 52-53 | ||
2013 Annual Report
CONSOLIDATED STATEMENT OF ASSETS AND LIABILITIES
December 31, 2013
Assets: | ||||
Investments | ||||
(See Consolidated Schedule of Investments) | ||||
Corporate restricted securities at fair value | ||||
(Cost - $197,574,891) | $ | 195,718,763 | ||
Corporate restricted securities at market value | ||||
(Cost - $38,141,957) | 39,751,750 | |||
Corporate public securities at market value | ||||
(Cost - $40,712,864) | 42,395,164 | |||
Short-term securities at amortized cost | 4,249,802 | |||
Total investments (Cost - $280,679,514) | 282,115,479 | |||
Cash | 23,789,433 | |||
Interest receivable | 2,435,269 | |||
Other assets | 39,121 | |||
Total assets | 308,379,302 | |||
Liabilities: | ||||
Note payable | 30,000,000 | |||
Dividend payable | 5,818,097 | |||
Deferred tax liability | 1,328,228 | |||
Investment advisory fee payable | 839,648 | |||
Tax Payable | 725,481 | |||
Payable for investments purchased | 520,108 | |||
Interest payable | 202,400 | |||
Accrued expenses | 257,826 | |||
Total liabilities | 39,691,788 | |||
Total net assets | $ | 268,687,514 | ||
Net Assets: | ||||
Common shares, par value $1.00 per share | $ | 19,393,655 | ||
Additional paid-in capital | 113,627,828 | |||
Retained net realized gain on investments, prior years | 133,207,098 | |||
Undistributed net investment income | 2,361,260 | |||
Accumulated net realized loss on investments | (10,064 | ) | ||
Net unrealized depreciation of investments | 107,737 | |||
Total net assets | $ | 268,687,514 | ||
Common shares issued and outstanding (28,054,782 authorized) | 19,393,655 | |||
Net asset value per share | $ | 13.85 |
See Notes to Consolidated Financial Statements
7
Babson Capital Corporate Investors
CONSOLIDATED STATEMENT OF OPERATIONS
For the year ended December 31, 2013
Investment Income: | ||||
Interest | $ | 28,003,629 | ||
Dividends | 638,099 | |||
Other | 238,089 | |||
Total investment income | 28,879,817 | |||
Expenses: | ||||
Investment advisory fees | 3,366,793 | |||
Interest | 1,584,000 | |||
Trustees' fees and expenses | 480,000 | |||
Professional fees | 274,103 | |||
Reports to shareholders | 90,000 | |||
Custodian fees | 33,600 | |||
Other | 181,022 | |||
Total expenses | 6,009,518 | |||
Investment income - net | 22,870,299 | |||
Net realized and unrealized gain on investments: | ||||
Net realized loss on investments before taxes | (440,452 | ) | ||
Income tax expense | (502,116 | ) | ||
Net realized loss on investments after taxes | (942,568 | ) | ||
Net change in unrealized appreciation of investments before taxes | 10,674,370 | |||
Net change in deferred income tax expense | (426,188 | ) | ||
Net change in unrealized appreciation of investments after taxes | 10,248,182 | |||
Net gain on investments | 9,305,614 | |||
Net increase in net assets resulting from operations | $ | 32,175,913 |
See Notes to Consolidated Financial Statements
8
2013 Annual Report
CONSOLIDATED STATEMENT OF CASH FLOWS
For the year ended December 31, 2013
Net increase in cash: | ||||
Cash flows from operating activities: | ||||
Purchases/Proceeds/Maturities from short-term portfolio securities, net | $ | 3,769,821 | ||
Purchases of portfolio securities | (94,145,191 | ) | ||
Proceeds from disposition of portfolio securities | 114,107,342 | |||
Interest, dividends and other income received | 25,869,305 | |||
Interest expense paid | (1,584,000 | ) | ||
Operating expenses paid | (4,314,828 | ) | ||
Income taxes paid | (2,013,435 | ) | ||
Net cash provided by operating activities | 41,689,014 | |||
Cash flows from financing activities: | ||||
Cash dividends paid from net investment income and realized short-term gains | (25,084,023 | ) | ||
Receipts for shares issued on reinvestment of dividends | 2,339,460 | |||
Net cash used for financing activities | (22,744,563 | ) | ||
Net increase in cash | 18,944,451 | |||
Cash - beginning of year | 4,844,982 | |||
Cash - end of year | $ | 23,789,433 | ||
Reconciliation of net increase in net assets to net cash provided by operating activities: | ||||
Net increase in net assets resulting from operations | $ | 32,175,913 | ||
Decrease in investments | 10,176,582 | |||
Increase in interest receivable | (293,041 | ) | ||
Decrease in receivable for investments sold | 117,353 | |||
Increase in other assets | (33,460 | ) | ||
Increase in deferred tax payable | 426,188 | |||
Increase in investment advisory fee payable | 35,341 | |||
Decrease in tax payable | (1,511,319 | ) | ||
Increase in payable for investments purchased | 520,108 | |||
Increase in accrued expenses | 75,349 | |||
Total adjustments to net assets from operations | 9,513,101 | |||
Net cash provided by operating activities | $ | 41,689,014 |
See Notes to Consolidated Financial Statements
9
Babson Capital Corporate Investors
CONSOLIDATED STATEMENTS OF CHANGES IN NET ASSETS
For the years ended December 31, 2013 and 2012
2013 | 2012 | |||||||
Increase in net assets: | ||||||||
Operations: | ||||||||
Investment income - net | $ | 22,870,299 | $ | 24,510,117 | ||||
Net realized gain on investments after taxes | (942,568 | ) | 5,288,921 | |||||
Net change in unrealized depreciation of investments after taxes | 10,248,182 | 7,904,425 | ||||||
Net increase in net assets resulting from operations | 32,175,913 | 37,703,463 | ||||||
Increase from common shares issued on reinvestment of dividends | ||||||||
Common shares issued (2013 - 153,982; 2012 - 169,463) | 2,339,460 | 2,676,531 | ||||||
Dividends to shareholders from: | ||||||||
Net investment income (2013 - $1.20 per share; 2012 - $1.25 per share) | (23,206,251 | ) | (24,075,541 | ) | ||||
Net realized gains (2013 - $0.00 per share; 2012 - $0.05 per share) | - | (869,595 | ) | |||||
Total increase in net assets | 11,309,122 | 15,434,858 | ||||||
Net assets, beginning of year | 257,378,392 | 241,943,534 | ||||||
Net assets, end of year (including undistributed net investment income of $2,361,260 and $3,358,678 respectively) | $ | 268,687,514 | $ | 257,378,392 |
See Notes to Consolidated Financial Statements
10
2013 Annual Report
CONSOLIDATED SELECTED FINANCIAL HIGHLIGHTS
Selected data for each share of beneficial interest outstanding:
For the years ended December 31, | ||||||||||||||||||||
2013 | 2012 | 2011 (a) | 2010 (a) | 2009 (a) | ||||||||||||||||
Net asset value: | ||||||||||||||||||||
Beginning of year | $ | 13.38 | $ | 12.69 | $ | 12.56 | $ | 11.45 | $ | 11.17 | ||||||||||
Net investment income (b) | 1.18 | 1.28 | 1.29 | 1.13 | 1.03 | |||||||||||||||
Net realized and unrealized gain (loss) on investments | 0.48 | 0.69 | 0.17 | 1.06 | 0.33 | |||||||||||||||
Total from investment operations | 1.66 | 1.97 | 1.46 | 2.19 | 1.36 | |||||||||||||||
Dividends from net investment income to common shareholders | (1.20 | ) | (1.25 | ) | (1.34 | ) | (1.08 | ) | (1.08 | ) | ||||||||||
Dividends from net realized gain on investments to common shareholders | - | (0.05 | ) | (0.01 | ) | - | - | |||||||||||||
Increase from dividends reinvested | 0.01 | 0.02 | 0.02 | 0.00 | (c) | 0.00 | (c) | |||||||||||||
Total dividends | (1.19 | ) | (1.28 | ) | (1.33 | ) | (1.08 | ) | (1.08 | ) | ||||||||||
Net asset value: End of year | $ | 13.85 | $ | 13.38 | $ | 12.69 | $ | 12.56 | $ | 11.45 | ||||||||||
Per share market value: | ||||||||||||||||||||
End of year | $ | 14.93 | $ | 15.28 | $ | 17.99 | $ | 15.28 | $ | 12.55 | ||||||||||
Total investment return | ||||||||||||||||||||
Net asset value (d) | 12.76 | % | 17.07 | % | 12.00 | % | 19.81 | % | 12.64 | % | ||||||||||
Market value (d) | 5.93 | % | (7.11 | %) | 27.92 | % | 31.73 | % | 39.89 | % | ||||||||||
Net assets (in millions): | ||||||||||||||||||||
End of year | $ | 268.69 | $ | 257.38 | $ | 241.94 | $ | 237.58 | $ | 214.44 | ||||||||||
Ratio of total expenses to average net assets | 2.42 | % | 3.17 | % | 2.42 | % | 2.57 | % | 2.33 | % | ||||||||||
Ratio of operating expenses to average net assets | 1.64 | % | 1.66 | % | 1.62 | % | 1.60 | % | 1.58 | % | ||||||||||
Ratio of interest expense to average net assets | 0.59 | % | 0.63 | % | 0.64 | % | 0.70 | % | 0.75 | % | ||||||||||
Ratio of income tax expense to average net assets (e) | 0.19 | % | 0.88 | % | 0.16 | % | 0.27 | % | 0.00 | % | ||||||||||
Ratio of net investment income to average net assets | 8.50 | % | 9.78 | % | 9.91 | % | 9.46 | % | 9.06 | % | ||||||||||
Portfolio turnover | 34 | % | 34 | % | 21 | % | 39 | % | 23 | % |
(a) | Per share amounts were adjusted to reflect a 2:1 stock split effective February 18, 2011. |
(b) | Calculated using average shares. |
(c) | Rounds to less than $0.01 per share. |
(d) | Net asset value return represents portfolio returns based on change in the Trust’s net asset value assuming the reinvestment of all dividends and distributions which differs from the total investment return based on the Trust’s market value due to the difference between the Trust’s net asset value and the market value of its shares outstanding; past performance is no guarantee of future results. |
(e) | As additional information, this ratio is included to reflect the taxes paid on retained long-term gains. These taxes paid are netted against realized capital gains in the Statement of Operations. The taxes paid are treated as deemed distributions and a credit for the taxes paid is passed on to the shareholders. |
Senior borrowings: | ||||||||||||||||||||
Total principal amount (in millions) | $ | 30 | $ | 30 | $ | 30 | $ | 30 | $ | 30 | ||||||||||
Asset coverage per $1,000 of indebtedness | $ | 9,956 | $ | 9,579 | $ | 9,065 | $ | 8,919 | $ | 8,148 |
See Notes to Consolidated Financial Statements
11
Babson Capital Corporate Investors
CONSOLIDATED SCHEDULE OF INVESTMENTS
December 31, 2013
Principal Amount, Shares, Units orOwnership Percentage | Acquisition Date | Cost | Fair Value | |||||||||||||
Corporate Restricted Securities - 87.64%: (A) | ||||||||||||||||
Private Placement Investments - 72.84% | ||||||||||||||||
1492 Acquisition LLC | ||||||||||||||||
A leading producer of premium Italian cured meats and deli meats in the U.S. | ||||||||||||||||
14% Senior Subordinated Note due 2019 | $ | 2,793,512 | 10/17/12 | $ | 2,744,969 | $ | 2,803,406 | |||||||||
Limited Liability Company Unit Class A Common (B) | 27,273 uts. | 10/17/12 | 27,273 | 110,667 | ||||||||||||
Limited Liability Company Unit Class A Preferred (B) | 245 uts. | 10/17/12 | 245,450 | 265,108 | ||||||||||||
3,017,692 | $ | 3,179,181 | ||||||||||||||
A H C Holding Company, Inc. | ||||||||||||||||
A designer and manufacturer of boilers and water heaters for the commercial sector. | ||||||||||||||||
Limited Partnership Interest (B) | 23.16% int. | 11/21/07 | 181,387 | 448,442 | ||||||||||||
A S C Group, Inc. | ||||||||||||||||
A designer and manufacturer of high reliability encryption equipment, communications products, computing systems and electronic components primarily for the military and aerospace sectors. | ||||||||||||||||
14% Senior Subordinated Note due 2020 | $ | 1,933,016 | 12/20/13 | 1,894,488 | 1,921,983 | |||||||||||
Limited Liability Company Unit Class A (B) | 5,843 uts. | * | 290,317 | 460,721 | ||||||||||||
Limited Liability Company Unit Class B (B) | 2,793 uts. | 10/09/09 | 100,114 | 220,228 | ||||||||||||
* 10/09/09 and 10/27/10. | 2,284,919 | 2,602,932 | ||||||||||||||
A W X Holdings Corporation | ||||||||||||||||
A provider of aerial equipment rental, sales and repair services to non-residential construction and maintenance contractors operating in the State of Indiana. | ||||||||||||||||
10.5% Senior Secured Term Note due 2014 (D) | $ | 735,000 | 05/15/08 | 724,402 | 367,500 | |||||||||||
13% Senior Subordinated Note due 2015 (D) | $ | 735,000 | 05/15/08 | 673,096 | - | |||||||||||
Common Stock (B) | 105,000 shs. | 05/15/08 | 105,000 | - | ||||||||||||
Warrant, exercisable until 2015, to purchase common stock at $.01 per share (B) | 36,923 shs. | 05/15/08 | 62,395 | - | ||||||||||||
1,564,893 | 367,500 | |||||||||||||||
ABC Industries, Inc. | ||||||||||||||||
A manufacturer of mine and tunneling ventilation products in the U.S. | ||||||||||||||||
13% Senior Subordinated Note due 2019 | $ | 1,200,000 | 08/01/12 | 1,090,111 | 1,190,623 | |||||||||||
Preferred Stock Series A (B) | 300,000 shs. | 08/01/12 | 300,000 | 300,000 | ||||||||||||
Warrant, exercisable until 2022, to purchase common stock at $.02 per share (B) | 53,794 shs. | 08/01/12 | 101,870 | 53,794 | ||||||||||||
1,491,981 | 1,544,417 | |||||||||||||||
ACP Cascade Holdings LLC | ||||||||||||||||
A manufacturer and distributor of vinyl windows and patio doors throughout the northwestern United States. | ||||||||||||||||
Limited Liability Company Unit Class B (B) | 64 uts. | 11/09/12 | - | - |
See Notes to Consolidated Financial Statements
12
2013 Annual Report
CONSOLIDATED SCHEDULE OF INVESTMENTS (CONTINUED)
December 31, 2013
Corporate Restricted Securities: (A) (Continued) | Principal Amount, Shares, Units or | Acquisition Date | Cost | Fair Value | ||||||||||||
Advanced Manufacturing Enterprises LLC | ||||||||||||||||
A designer and manufacturer of large, custom gearing products for a number of critical customer applications. | ||||||||||||||||
14% Senior Subordinated Note due 2018 | $ | 2,723,077 | 12/07/12 | $ | 2,687,212 | $ | 2,554,643 | |||||||||
Limited Liability Company Unit (B) | 3,434 uts. | * | 343,385 | 215,129 | ||||||||||||
* 12/07/12 and 07/11/13. | 3,030,597 | 2,769,772 | ||||||||||||||
Advanced Technologies Holdings | ||||||||||||||||
A provider of factory maintenance services to industrial companies. | ||||||||||||||||
Preferred Stock Series A (B) | 796 shs. | 12/27/07 | 393,754 | 1,634,097 | ||||||||||||
Convertible Preferred Stock Series B (B) | 52 shs. | 01/04/11 | 40,800 | 107,797 | ||||||||||||
434,554 | 1,741,894 | |||||||||||||||
All Current Holding Company | ||||||||||||||||
A specialty re-seller of essential electrical parts and components primarily serving wholesale distributors. | ||||||||||||||||
Common Stock (B) | 1,347 shs. | 09/26/08 | 134,683 | 283,965 | ||||||||||||
Warrant, exercisable until 2018, to purchase common stock at $.01 per share (B) | 958 shs. | 09/26/08 | 87,993 | 201,959 | ||||||||||||
222,676 | 485,924 | |||||||||||||||
American Hospice Management Holding LLC | ||||||||||||||||
A for-profit hospice care provider in the United States. | ||||||||||||||||
12% Senior Subordinated Note due 2014 | $ | 2,337,496 | * | 2,335,259 | 2,337,496 | |||||||||||
Preferred Class A Unit (B) | 3,223 uts. | ** | 322,300 | 362,750 | ||||||||||||
Preferred Class B Unit (B) | 1,526 uts. | 06/09/08 | 152,626 | 365,082 | ||||||||||||
Common Class B Unit (B) | 30,420 uts. | 01/22/04 | 1 | - | ||||||||||||
Common Class D Unit (B) | 6,980 uts. | 09/12/06 | 1 | - | ||||||||||||
* 01/22/04 and 06/09/08. | 2,810,187 | 3,065,328 | ||||||||||||||
** 01/22/04 and 09/12/06. | ||||||||||||||||
AMS Holding LLC | ||||||||||||||||
A leading multi-channel direct marketer of high-value collectible coins and proprietary-branded jewelry and watches. | ||||||||||||||||
Limited Liability Company Unit Class A Preferred (B) | 273 uts. | 10/04/12 | 272,727 | 379,065 | ||||||||||||
Apex Analytix Holding Corporation | ||||||||||||||||
A provider of audit recovery and fraud detection services and software to commercial and retail businesses in the U.S. and Europe. | ||||||||||||||||
Preferred Stock Series B (B) | 3,065 shs. | 04/28/09 | 306,507 | 449,629 | ||||||||||||
Common Stock (B) | 1,366 shs. | 04/28/09 | 1,366 | 248,678 | ||||||||||||
307,873 | 698,307 | |||||||||||||||
Arch Global Precision LLC | ||||||||||||||||
A leading manufacturer of high tolerance precision components and consumable tools. | ||||||||||||||||
14.75% Senior Subordinated Note due 2018 | $ | 2,378,392 | 12/21/11 | 2,330,958 | 2,395,085 | |||||||||||
Limited Liability Company Unit Class B (B) | 85 uts. | 12/21/11 | 85,250 | 112,892 | ||||||||||||
Limited Liability Company Unit Class C (B) | 665 uts. | 12/21/11 | 664,750 | 880,291 | ||||||||||||
3,080,958 | 3,388,268 |
See Notes to Consolidated Financial Statements
13
Babson Capital Corporate Investors
CONSOLIDATED SCHEDULE OF INVESTMENTS (CONTINUED)
December 31, 2013
Corporate Restricted Securities: (A) (Continued) | Principal Amount, Shares, Units or | Acquisition Date | Cost | Fair Value | ||||||||||||
ARI Holding Corporation | ||||||||||||||||
A leading national supplier of products used primarily by specialty contractors. | ||||||||||||||||
13.5% Senior Subordinated Note due 2020 | $ | 2,630,288 | 05/21/13 | $ | 2,581,004 | $ | 2,682,894 | |||||||||
Preferred Stock (B) | 58 shs. | 05/21/13 | 579,208 | 596,295 | ||||||||||||
Common Stock (B) | 58 shs. | 05/21/13 | 64,356 | 283,656 | ||||||||||||
3,224,568 | 3,562,845 | |||||||||||||||
Arrow Tru-Line Holdings, Inc. | ||||||||||||||||
A manufacturer of hardware for residential and commercial overhead garage doors in North America. | ||||||||||||||||
12% Senior Subordinated Note due 2016 | $ | 388,481 | 05/18/05 | 341,573 | 388,481 | |||||||||||
Preferred Stock (B) | 63 shs. | 10/16/09 | 62,756 | 182,836 | ||||||||||||
Common Stock (B) | 497 shs. | 05/18/05 | 497,340 | 21,107 | ||||||||||||
Warrant, exercisable until 2016, to purchase common stock at $.01 per share (B) | 130 shs. | 05/18/05 | 112,128 | 5,533 | ||||||||||||
1,013,797 | 597,957 | |||||||||||||||
Baby Jogger Holdings LLC | ||||||||||||||||
A designer and marketer of premium baby strollers and stroller accessories. | ||||||||||||||||
14% Senior Subordinated Note due 2019 | $ | 2,826,634 | 04/20/12 | 2,780,302 | 2,883,167 | |||||||||||
Common Stock (B) | 2,261 shs. | 04/20/12 | 226,132 | 399,245 | ||||||||||||
3,006,434 | 3,282,412 | |||||||||||||||
Blue Wave Products, Inc. | ||||||||||||||||
A distributor of pool supplies. | ||||||||||||||||
10% Senior Secured Term Note due 2018 | $ | 714,893 | 10/12/12 | 702,861 | 707,167 | |||||||||||
13% Senior Subordinated Note due 2019 | $ | 723,674 | 10/12/12 | 676,666 | 712,351 | |||||||||||
Common Stock (B) | 114,894 shs. | 10/12/12 | 114,894 | 147,841 | ||||||||||||
Warrant, exercisable until 2022, to purchase common stock at $.01 per share (B) | 45,486 shs. | 10/12/12 | 45,486 | 58,530 | ||||||||||||
1,539,907 | 1,625,889 | |||||||||||||||
BP SCI LLC | ||||||||||||||||
A leading value-added distributor of branded pipes, valves, and fittings (PVF) to diversified end markets. | ||||||||||||||||
14% Senior Subordinated Note due 2018 | $ | 2,561,145 | 10/17/12 | 2,518,102 | 2,482,281 | |||||||||||
Limited Liability Company Unit Class A (B) | 1,000 uts. | 10/17/12 | 100,000 | 82,014 | ||||||||||||
Limited Liability Company Unit Class B (B) | 400 uts. | 10/17/12 | 400,000 | 448,453 | ||||||||||||
3,018,102 | 3,012,748 |
See Notes to Consolidated Financial Statements
14
2013 Annual Report
CONSOLIDATED SCHEDULE OF INVESTMENTS (CONTINUED)
December 31, 2013
Corporate Restricted Securities: (A) (Continued) | Principal Amount, Shares, Units or | Acquisition Date | Cost | Fair Value | ||||||||||||
Bravo Sports Holding Corporation | ||||||||||||||||
A designer and marketer of niche branded consumer products including canopies, trampolines, in-line skates, skateboards, and urethane wheels. | ||||||||||||||||
12.5% Senior Subordinated Note due 2014 | $ | 2,281,593 | 06/30/06 | $ | 2,268,097 | $ | 2,053,434 | |||||||||
Preferred Stock Class A (B) | 879 shs. | 06/30/06 | 268,121 | 45,736 | ||||||||||||
Common Stock (B) | 1 sh. | 06/30/06 | 286 | - | ||||||||||||
Warrant, exercisable until 2014, to purchase common stock at $.01 per share (B) | 309 shs. | 06/30/06 | 92,102 | 16,074 | ||||||||||||
2,628,606 | 2,115,244 | |||||||||||||||
C D N T, Inc. | ||||||||||||||||
A value-added converter and distributor of specialty pressure sensitive adhesives, foams, films, and foils. | ||||||||||||||||
10.5% Senior Secured Term Note due 2014 | $ | 93,859 | 08/07/08 | 93,624 | 93,859 | |||||||||||
12.5% Senior Subordinated Note due 2015 | $ | 750,872 | 08/07/08 | 727,573 | 750,872 | |||||||||||
Common Stock (B) | 73,256 shs. | 08/07/08 | 73,256 | 148,286 | ||||||||||||
Warrant, exercisable until 2018, to purchase common stock at $.01 per share (B) | 57,600 shs. | 08/07/08 | 57,689 | 116,595 | ||||||||||||
952,142 | 1,109,612 | |||||||||||||||
Capital Specialty Plastics, Inc. | ||||||||||||||||
A producer of desiccant strips used for packaging pharmaceutical products. | ||||||||||||||||
Common Stock (B) | 109 shs. | * | 503 | 1,076,843 | ||||||||||||
*12/30/97 and 05/29/99. | ||||||||||||||||
CG Holdings Manufacturing Company | ||||||||||||||||
A coating provider serving the automotive, agricultural, heavy truck and other end markets. | ||||||||||||||||
13% Senior Subordinated Note due 2019 | $ | 3,390,252 | 05/09/13 | 3,202,413 | 3,416,446 | |||||||||||
Preferred Stock (B) | 3,241 shs. | 05/09/13 | 324,054 | 326,341 | ||||||||||||
Preferred Stock (B) | 1,174 shs. | 05/09/13 | 116,929 | 118,236 | ||||||||||||
Common Stock (B) | 337 shs. | 05/09/13 | 35,673 | 37,177 | ||||||||||||
Warrant, exercisable until 2023, to purchase common stock at $.01 per share (B) | 137 shs. | 05/09/13 | 13,033 | 15,126 | ||||||||||||
3,692,102 | 3,913,326 | |||||||||||||||
CHG Alternative Education Holding Company | ||||||||||||||||
A leading provider of publicly-funded, for profit pre-K-12 education services targeting special needs children at therapeutic day schools and "at risk" youth through alternative education programs. | ||||||||||||||||
13.5% Senior Subordinated Note due 2018 | $ | 2,235,417 | 01/19/11 | 2,145,766 | 2,280,125 | |||||||||||
14% Senior Subordinated Note due 2019 | $ | 578,786 | 08/03/12 | 569,016 | 581,680 | |||||||||||
Common Stock (B) | 1,125 shs. | 01/19/11 | 112,500 | 134,108 | ||||||||||||
Warrant, exercisable until 2021, to purchase common stock at $.01 per share (B) | 884 shs. | 01/19/11 | 87,750 | 105,417 | ||||||||||||
2,915,032 | 3,101,330 |
See Notes to Consolidated Financial Statements
15
Babson Capital Corporate Investors
CONSOLIDATED SCHEDULE OF INVESTMENTS (CONTINUED)
December 31, 2013
Corporate Restricted Securities: (A) (Continued) | Principal Amount, Shares, Units or Ownership Percentage | Acquisition Date | Cost | Fair Value | ||||||||||||
Church Services Holding Company | ||||||||||||||||
A provider of diversified residential services to homeowners in the Houston, Dallas, and Austin markets. | ||||||||||||||||
14.5% Senior Subordinated Note due 2018 | $ | 1,242,910 | 03/26/12 | $ | 1,210,444 | $ | 1,237,486 | |||||||||
Common Stock (B) | 3,981 shs. | * | 398,100 | 345,593 | ||||||||||||
Warrant, exercisable until 2022, to purchase common stock at $.01 per share (B) | 172 shs. | 03/26/12 | 17,220 | 14,931 | ||||||||||||
*03/26/12, 05/25/12 and 06/19/12. | 1,625,764 | 1,598,010 | ||||||||||||||
Clough, Harbour and Associates | ||||||||||||||||
An engineering service firm that is located in Albany, NY. | ||||||||||||||||
Preferred Stock (B) | 277 shs. | 12/02/08 | 276,900 | 408,119 | ||||||||||||
Connecticut Electric, Inc. | ||||||||||||||||
A supplier and distributor of electrical products sold into the retail and wholesale markets. | ||||||||||||||||
Limited Liability Company Unit Class A (B) | 156,046 uts. | 01/12/07 | 156,046 | 113,797 | ||||||||||||
Limited Liability Company Unit Class C (B) | 112,873 uts. | 01/12/07 | 112,873 | 88,210 | ||||||||||||
Limited Liability Company Unit Class D (B) | 1,268,437 uts. | 05/03/10 | - | 1,379,071 | ||||||||||||
Limited Liability Company Unit Class E (B) | 2,081 uts. | 05/03/10 | - | - | ||||||||||||
268,919 | 1,581,078 | |||||||||||||||
Connor Sport Court International, Inc. | ||||||||||||||||
A designer and manufacturer of outdoor and indoor synthetic sports flooring and other temporary flooring products. | ||||||||||||||||
Preferred Stock Series B-2 (B) | 17,152 shs. | 07/05/07 | 700,392 | 647,533 | ||||||||||||
Preferred Stock Series C (B) | 7,080 shs. | 07/05/07 | 236,503 | 267,273 | ||||||||||||
Common Stock (B) | 718 shs. | 07/05/07 | 7 | - | ||||||||||||
Limited Partnership Interest (B) | 12.64% int. | * | 189,586 | - | ||||||||||||
*08/12/04 and 01/14/05. | 1,126,488 | 914,806 | ||||||||||||||
CorePharma LLC | ||||||||||||||||
A manufacturer of oral dose generic pharmaceuticals targeted at niche applications. | ||||||||||||||||
Warrant, exercisable until 2015, to purchase common stock at $.001 per share (B) | 20 shs. | 08/04/05 | 137,166 | 325,862 | ||||||||||||
Crane Rental Corporation | ||||||||||||||||
A crane rental company since 1960, headquartered in Florida. | ||||||||||||||||
13% Senior Subordinated Note due 2015 | $ | 1,950,750 | 08/21/08 | 1,882,004 | 1,950,750 | |||||||||||
Common Stock (B) | 255,000 shs. | 08/21/08 | 255,000 | 332,610 | ||||||||||||
Warrant, exercisable until 2016, to purchase common stock at $.01 per share (B) | 136,070 shs. | �� | 08/21/08 | 194,826 | 177,483 | |||||||||||
2,331,830 | 2,460,843 |
See Notes to Consolidated Financial Statements
16
2013 Annual Report
CONSOLIDATED SCHEDULE OF INVESTMENTS (CONTINUED)
December 31, 2013
Corporate Restricted Securities: (A) (Continued) | Principal Amount, Shares, Units or Ownership Percentage | Acquisition Date | Cost | Fair Value | ||||||||||||
CTM Holding, Inc. | ||||||||||||||||
A leading owner and operator of coin-operated children's rides, penny presses and candy kiosks in the U.S. | ||||||||||||||||
15% Senior Subordinated Note due 2019 | $ | 2,371,318 | 11/22/13 | $ | 2,324,583 | $ | 2,374,990 | |||||||||
Common Stock (B) | 62,088 shs. | 11/22/13 | 886,364 | 842,045 | ||||||||||||
3,210,947 | 3,217,035 | |||||||||||||||
Custom Engineered Wheels, Inc. | ||||||||||||||||
A manufacturer of custom engineered, non-pneumatic plastic wheels and plastic tread cap tires used primarily for lawn and garden products and wheelchairs. | ||||||||||||||||
Preferred Stock PIK (B) | 296 shs. | 10/27/09 | 295,550 | 401,468 | ||||||||||||
Preferred Stock Series A (B) | 216 shs. | 10/27/09 | 197,152 | 293,327 | ||||||||||||
Common Stock (B) | 72 shs. | 10/27/09 | 72,238 | 103,469 | ||||||||||||
Warrant, exercisable until 2016, to purchase common stock at $.01 per share (B) | 53 shs. | 10/27/09 | 48,608 | 75,597 | ||||||||||||
613,548 | 873,861 | |||||||||||||||
DPL Holding Corporation | ||||||||||||||||
A distributor and manufacturer of aftermarket undercarriage parts for medium and heavy duty trucks and trailers. | ||||||||||||||||
14% Senior Subordinated Note due 2019 | $ | 3,173,754 | 05/04/12 | 3,121,782 | 2,966,900 | |||||||||||
Preferred Stock (B) | 61 shs. | 05/04/12 | 605,841 | 651,162 | ||||||||||||
Common Stock (B) | 61 shs. | 05/04/12 | 67,316 | 68,892 | ||||||||||||
3,794,939 | 3,686,954 | |||||||||||||||
Duncan Systems, Inc. | ||||||||||||||||
A distributor of windshields and side glass for the recreational vehicle market. | ||||||||||||||||
10% Senior Secured Term Note due 2015 | $ | 45,000 | 11/01/06 | 45,000 | 43,575 | |||||||||||
13% Senior Subordinated Note due 2015 | $ | 855,000 | 11/01/06 | 837,366 | 842,166 | |||||||||||
Common Stock (B) | 180,000 shs. | 11/01/06 | 180,000 | 56,474 | ||||||||||||
Warrant, exercisable until 2014, to purchase common stock at $.01 per share (B) | 56,514 shs. | 11/01/06 | 78,160 | 17,731 | ||||||||||||
1,140,526 | 959,946 | |||||||||||||||
E S P Holdco, Inc. | ||||||||||||||||
A manufacturer of power protection technology for commercial office equipment, primarily supplying the office equipment dealer network. | ||||||||||||||||
Common Stock (B) | 660 shs. | 01/08/08 | 329,990 | 462,112 | ||||||||||||
Eatem Holding Company | ||||||||||||||||
A developer and manufacturer of savory flavor systems for soups, sauces, gravies, and other products produced by food manufacturers for retail and foodservice end products. | ||||||||||||||||
12.5% Senior Subordinated Note due 2018 | $ | 2,850,000 | 02/01/10 | 2,601,772 | 2,897,290 | |||||||||||
Common Stock (B) | 150 shs. | 02/01/10 | 150,000 | 194,538 | ||||||||||||
Warrant, exercisable until 2018, to purchase common stock at $.01 per share (B) | 358 shs. | 02/01/10 | 321,300 | 463,844 | ||||||||||||
3,073,072 | 3,555,672 |
See Notes to Consolidated Financial Statements
17
Babson Capital Corporate Investors
CONSOLIDATED SCHEDULE OF INVESTMENTS (CONTINUED)
December 31, 2013
Corporate Restricted Securities: (A) (Continued) | Principal Amount, Shares, Units or Ownership Percentage | Acquisition Date | Cost | Fair Value | ||||||||||||
ELT Holding Company | ||||||||||||||||
A provider of web-based ethics and compliance training solutions for companies in the United States. | ||||||||||||||||
14% Senior Subordinated Note due 2019 | $ | 2,830,419 | 03/01/12 | $ | 2,785,661 | $ | 2,722,023 | |||||||||
Common Stock (B) | 122 shs. | 03/01/12 | 272,727 | 170,238 | ||||||||||||
3,058,388 | 2,892,261 | |||||||||||||||
EPM Holding Company | ||||||||||||||||
A provider of non-discretionary regulatory driven engineering services that support mission critical safety and operational aspects of nuclear power plants. | ||||||||||||||||
14.5% Senior Subordinated Note due 2019 | $ | 1,163,475 | 07/26/13 | 1,141,527 | 1,145,203 | |||||||||||
Common Stock | 3,069 shs. | 07/26/13 | 306,947 | 131,367 | ||||||||||||
1,448,474 | 1,276,570 | |||||||||||||||
F F C Holding Corporation | ||||||||||||||||
A leading U.S. manufacturer of private label frozen novelty and ice cream products. | ||||||||||||||||
Limited Liability Company Unit Preferred (B) | 512 uts. | 09/27/10 | 175,035 | 587,066 | ||||||||||||
Limited Liability Company Unit (B) | 512 uts. | 09/27/10 | 51,220 | 209,209 | ||||||||||||
226,255 | 796,275 | |||||||||||||||
F G I Equity LLC | ||||||||||||||||
A manufacturer of a broad range of filters and related products that are used in commercial, light industrial, healthcare, gas turbine, nuclear, laboratory, clean room, hotel, educational system, and food processing settings. | ||||||||||||||||
Limited Liability Company Unit Class B-1 (B) | 394,737 uts. | 12/15/10 | 394,737 | 857,625 | ||||||||||||
Limited Liability Company Unit Class B-2 (B) | 49,488 uts. | 12/15/10 | 49,488 | 107,520 | ||||||||||||
Limited Liability Company Unit Class B-3 (B) | 39,130 uts. | 08/30/12 | 90,000 | 94,684 | ||||||||||||
Limited Liability Company Unit Class C (B) | 9,449 uts. | 12/20/10 | 96,056 | 136,769 | ||||||||||||
630,281 | 1,196,598 | |||||||||||||||
G C Holdings | ||||||||||||||||
A leading manufacturer of gaming tickets, industrial recording charts, security-enabled point-of sale receipts, and medical charts and supplies. | ||||||||||||||||
Warrant, exercisable until 2018, to purchase common stock at $.01 per share (B) | 594 shs. | 10/19/10 | 140,875 | 1,707,776 | ||||||||||||
GD Dental Services LLC | ||||||||||||||||
A provider of convenient "onestop" general, specialty, and cosmetic dental services with 21 offices located throughout South and Central Florida. | ||||||||||||||||
Limited Liability Company Unit Common (B) | 1,840 uts. | 10/05/12 | 1,840 | 57,242 | ||||||||||||
Limited Liability Company Unit Preferred (B) | 182 uts. | 10/05/12 | 182,209 | 197,018 | ||||||||||||
184,049 | 254,260 | |||||||||||||||
glo Professional Holdings, Inc. | ||||||||||||||||
A marketer and distributor of premium mineral-based cosmetics, cosmeceuticals and professional hair care products to the professional spa and physician's office channels. | ||||||||||||||||
14% Senior Subordinated Note due 2019 | $ | 2,757,944 | 03/27/13 | 2,708,252 | 2,702,979 | |||||||||||
Common Stock (B) | 2,835 shs. | 03/27/13 | 283,465 | 248,938 | ||||||||||||
2,991,717 | 2,951,917 |
See Notes to Consolidated Financial Statements
18
2013 Annual Report
CONSOLIDATED SCHEDULE OF INVESTMENTS (CONTINUED)
December 31, 2013
Corporate Restricted Securities: (A) (Continued) | Principal Amount, Shares, Units or Ownership Percentage | Acquisition Date | Cost | Fair Value | ||||||||||||
Golden County Foods Holding, Inc. | ||||||||||||||||
A manufacturer of frozen appetizers and snacks. | ||||||||||||||||
14% Senior Subordinated Note due 2019 (D) | $ | 73,550 | 11/13/13 | $ | 436,682 | $ | - | |||||||||
Preferred Stock (B) | 287,658 shs. | 11/13/13 | 146,658 | - | ||||||||||||
Preferred Stock Series F (B) | 294,200 shs. | 11/13/13 | 1,746,726 | - | ||||||||||||
2,330,066 | - | |||||||||||||||
H M Holding Company | ||||||||||||||||
A designer, manufacturer, and importer of promotional and wood furniture. | ||||||||||||||||
7.5% Senior Subordinated Note due 2016 (D) | $ | 685,100 | 10/15/09 | 512,231 | - | |||||||||||
Preferred Stock (B) | 40 shs. | * | 40,476 | - | ||||||||||||
Preferred Stock Series B (B) | 2,055 shs. | 10/15/09 | 1,536,694 | - | ||||||||||||
Common Stock (B) | 340 shs. | 02/10/06 | 340,000 | - | ||||||||||||
Common Stock Class C (B) | 560 shs. | 10/15/09 | - | - | ||||||||||||
Warrant, exercisable until 2016, to purchase common stock at $.02 per share (B) | 126 shs. | 02/10/06 | 116,875 | - | ||||||||||||
* 09/18/07 and 06/27/08. | 2,546,276 | - | ||||||||||||||
Handi Quilter Holding Company | ||||||||||||||||
A designer and manufacturer of long-arm quilting machines and related components for the consumer quilting market. | ||||||||||||||||
Common Stock (B) | 115 shs. | 11/14/11 | 115,385 | 312,330 | ||||||||||||
Warrant, exercisable until 2021, to purchase common stock at $.01 per share (B) | 83 shs. | 11/14/11 | 76,788 | 223,603 | ||||||||||||
192,173 | 535,933 | |||||||||||||||
Healthcare Direct Holding Company | ||||||||||||||||
A direct-to-consumer marketer of discount dental plans. | ||||||||||||||||
14% Senior Subordinated Note due 2019 (D) | $ | 2,151,183 | 03/09/12 | 2,114,542 | 2,043,624 | |||||||||||
Common Stock (B) | 1,552 shs. | 03/09/12 | 155,172 | 61,528 | ||||||||||||
2,269,714 | 2,105,152 | |||||||||||||||
Hi-Rel Group LLC | ||||||||||||||||
A manufacturer and distributor of precision metal piece parts for the microelectronic packaging industry, serving the aerospace/ defense, telecommunications, and medical end markets. | ||||||||||||||||
12% Senior Subordinated Note due 2018 | $ | 1,687,500 | 04/15/13 | 1,587,817 | 1,666,947 | |||||||||||
Limited Liability Company Unit (B) | 563 uts. | 04/15/13 | 562,500 | 578,315 | ||||||||||||
Warrant, exercisable until 2020, to purchase common stock at $.01 per share (B) | 89,224 shs. | 04/15/13 | 77,625 | 8,523 | ||||||||||||
2,227,942 | 2,253,785 |
See Notes to Consolidated Financial Statements
19
Babson Capital Corporate Investors
CONSOLIDATED SCHEDULE OF INVESTMENTS (CONTINUED)
December 31, 2013
Corporate Restricted Securities: (A) (Continued) | Principal Amount, Shares, Units or Ownership Percentage | Acquisition Date | Cost | Fair Value | ||||||||||||
Home Décor Holding Company | ||||||||||||||||
A designer, manufacturer and marketer of framed art and wall décor products. | ||||||||||||||||
Common Stock (B) | 63 shs. | * | $ | 62,742 | $ | 166,495 | ||||||||||
Warrant, exercisable until 2016, to purchase common stock at $.02 per share (B) | 200 shs. | * | 199,501 | 529,420 | ||||||||||||
* 06/30/04 and 08/19/04. | 262,243 | 695,915 | ||||||||||||||
HOP Entertainment LLC | ||||||||||||||||
A provider of post production equipment and services to producers of television shows and motion pictures. | ||||||||||||||||
Limited Liability Company Unit Class F (B) | 89 uts. | 10/14/11 | - | - | ||||||||||||
Limited Liability Company Unit Class G (B) | 215 uts. | 10/14/11 | - | - | ||||||||||||
Limited Liability Company Unit Class H (B) | 89 uts. | 10/14/11 | - | - | ||||||||||||
Limited Liability Company Unit Class I (B) | 89 uts. | 10/14/11 | - | - | ||||||||||||
- | - | |||||||||||||||
Hospitality Mints Holding Company | ||||||||||||||||
A manufacturer of individually-wrapped imprinted promotional mints. | ||||||||||||||||
12% Senior Subordinated Note due 2016 | $ | 2,075,581 | 08/19/08 | 2,003,536 | 2,031,231 | |||||||||||
Common Stock (B) | 474 shs. | 08/19/08 | 474,419 | 127,463 | ||||||||||||
Warrant, exercisable until 2016, to purchase common stock at $.01 per share (B) | 123 shs. | 08/19/08 | 113,773 | 32,944 | ||||||||||||
2,591,728 | 2,191,638 | |||||||||||||||
HVAC Holdings, Inc. | ||||||||||||||||
A provider of integrated energy efficiency services and maintenance programs for HVAC systems. | ||||||||||||||||
14% Senior Subordinated Note due 2019 | $ | 2,796,758 | 09/27/12 | 2,748,529 | 2,769,651 | |||||||||||
Preferred Stock Series A (B) | 2,705 shs. | 09/27/12 | 270,542 | 305,248 | ||||||||||||
Common Stock (B) | 2,185 shs. | 09/27/12 | 2,185 | 7,506 | ||||||||||||
3,021,256 | 3,082,405 | |||||||||||||||
Ideal Tridon Holdings, Inc. | ||||||||||||||||
A designer and manufacturer of clamps and couplings used in automotive and industrial end markets. | ||||||||||||||||
Common Stock (B) | 279 shs. | 10/27/11 | 278,561 | 510,024 | ||||||||||||
Insurance Claims Management, Inc. | ||||||||||||||||
A third party administrator providing auto and property claim administration services for insurance companies. | ||||||||||||||||
Common Stock (B) | 89 shs. | 02/27/07 | 2,689 | 623,885 |
See Notes to Consolidated Financial Statements
20
2013 Annual Report
CONSOLIDATED SCHEDULE OF INVESTMENTS (CONTINUED)
December 31, 2013
Corporate Restricted Securities: (A) (Continued) | Principal Amount, Shares, Units or Ownership Percentage | Acquisition Date | Cost | Fair Value | ||||||||||||
J A C Holding Enterprises, Inc. | ||||||||||||||||
A supplier of luggage racks and accessories to the original equipment manufacturers. | ||||||||||||||||
Preferred Stock A (B) | 495 shs. | 12/20/10 | $ | 495,000 | $ | 690,757 | ||||||||||
Preferred Stock B (B) | 0.17 shs. | 12/20/10 | - | 233 | ||||||||||||
Common Stock (B) | 100 shs. | 12/20/10 | 5,000 | 462,820 | ||||||||||||
Warrant, exercisable until 2020, to purchase common stock at $.01 per share (B) | 36 shs. | 12/20/10 | 316,930 | 167,818 | ||||||||||||
816,930 | 1,321,628 | |||||||||||||||
Janus Group Holdings LLC | ||||||||||||||||
A manufacturer of roll-up doors and hallway systems that are primarily used in self-storage facilities. | ||||||||||||||||
13.5% Senior Subordinated Note due 2019 | $ | 2,684,783 | 12/11/13 | 2,631,470 | 2,683,760 | |||||||||||
Limited Liability Company Unit Class A (B) | 565 shs. | 12/11/13 | 565,217 | 536,959 | ||||||||||||
3,196,687 | 3,220,719 | |||||||||||||||
Jason Partners Holdings LLC | ||||||||||||||||
A diversified manufacturing company serving various industrial markets. | ||||||||||||||||
Limited Liability Company Unit (B) | 90 uts. | 09/21/10 | 848,275 | 48,185 | ||||||||||||
JMH Investors LLC | ||||||||||||||||
A developer and manufacturer of custom formulations for a wide variety of foods. | ||||||||||||||||
14.25% Senior Subordinated Note due 2019 | $ | 2,538,613 | 12/05/12 | 2,493,785 | 2,477,291 | |||||||||||
Limited Liability Company Unit (B) | 521,739 uts. | 12/05/12 | 521,739 | 367,498 | ||||||||||||
3,015,524 | 2,844,789 | |||||||||||||||
K & N Parent, Inc. | ||||||||||||||||
A manufacturer and supplier of automotive aftermarket performance air filters and intake systems. | ||||||||||||||||
14% Senior Subordinated Note due 2019 | $ | 3,445,377 | 12/23/11 | 3,371,593 | 3,488,813 | |||||||||||
Preferred Stock Series A (B) | 305 shs. | 12/23/11 | 119,662 | 361,462 | ||||||||||||
Preferred Stock Series B (B) | 86 shs. | 12/23/11 | - | 102,306 | ||||||||||||
Common Stock (B) | 391 shs. | 12/23/11 | 19,565 | 152,748 | ||||||||||||
3,510,820 | 4,105,329 | |||||||||||||||
K N B Holdings Corporation | ||||||||||||||||
A designer, manufacturer and marketer of products for the custom framing market. | ||||||||||||||||
Common Stock (B) | 134,210 shs. | 05/25/06 | 134,210 | 69,892 | ||||||||||||
Warrant, exercisable until 2016, to purchase common stock at $.01 per share (B) | 82,357 shs. | 05/25/06 | 71,534 | 42,889 | ||||||||||||
205,744 | 112,781 | |||||||||||||||
K P H I Holdings, Inc. | ||||||||||||||||
A manufacturer of highly engineered plastic and metal components for a diverse range of end-markets, including medical, consumer and industrial, automotive and defense. | ||||||||||||||||
Common Stock (B) | 698,478 shs. | 12/10/10 | 698,478 | 847,419 |
See Notes to Consolidated Financial Statements
21
Babson Capital Corporate Investors
CONSOLIDATED SCHEDULE OF INVESTMENTS (CONTINUED)
December 31, 2013
Corporate Restricted Securities: (A) (Continued) | Principal Amount, Shares, Units or Ownership Percentage | Acquisition Date | Cost | Fair Value | ||||||||||||
K P I Holdings, Inc. | ||||||||||||||||
The largest player in the U.S. non-automotive, non-ferrous die casting segment. | ||||||||||||||||
Convertible Preferred Stock Series C (B) | 55 shs. | 06/30/09 | $ | 55,435 | $ | 156,487 | ||||||||||
Convertible Preferred Stock Series D (B) | 24 shs. | 09/17/09 | 24,476 | 73,410 | ||||||||||||
Common Stock (B) | 443 shs. | 07/15/08 | 443,478 | 112,771 | ||||||||||||
Warrant, exercisable until 2018, to purchase common stock at $.01 per share (B) | 96 shs. | 07/16/08 | 96,024 | 24,417 | ||||||||||||
Warrant, exercisable until 2018, to purchase common stock at $.01 per share (B) | 128 shs. | 09/17/09 | - | 32,447 | ||||||||||||
619,413 | 399,532 | |||||||||||||||
LPC Holding Company | ||||||||||||||||
A designer and manufacturer of precision-molded silicone rubber components that are utilized in the medical and automotive end markets. | ||||||||||||||||
Common Stock (B) | 315 shs. | 08/15/11 | 315,057 | 464,860 | ||||||||||||
M V I Holding, Inc. | ||||||||||||||||
A manufacturer of large precision machined metal components used in equipment which services a variety of industries, including the oil and gas, mining, and defense markets. | ||||||||||||||||
Common Stock (B) | 61 shs. | 09/12/08 | 60,714 | - | ||||||||||||
Warrant, exercisable until 2018, to purchase common stock at $.01 per share (B) | 66 shs. | 09/12/08 | 65,571 | - | ||||||||||||
126,285 | - | |||||||||||||||
Mail Communications Group, Inc. | ||||||||||||||||
A provider of mail processing and handling services, lettershop services, and commercial printing services. | ||||||||||||||||
Limited Liability Company Unit (B) | 24,109 uts. | * | 314,464 | 509,077 | ||||||||||||
Warrant, exercisable until 2014, to purchase common stock at $.01 per share (B) | 3,375 shs. | 05/04/07 | 43,031 | 71,266 | ||||||||||||
* 05/04/07 and 01/02/08. | 357,495 | 580,343 | ||||||||||||||
Manhattan Beachwear Holding Company | ||||||||||||||||
A designer and distributor of women's swimwear. | ||||||||||||||||
12.5% Senior Subordinated Note due 2018 | $ | 1,259,914 | 01/15/10 | 1,155,685 | 1,259,914 | |||||||||||
15% Senior Subordinated Note due 2018 | $ | 333,072 | 10/05/10 | 328,744 | 320,055 | |||||||||||
Common Stock (B) | 106 shs. | 10/05/10 | 106,200 | 253,495 | ||||||||||||
Common Stock Class B (B) | 353 shs. | 01/15/10 | 352,941 | 842,454 | ||||||||||||
Warrant, exercisable until 2019, to purchase common stock at $.01 per share (B) | 312 shs. | 01/15/10 | 283,738 | 745,567 | ||||||||||||
2,227,308 | 3,421,485 |
See Notes to Consolidated Financial Statements
22
2013 Annual Report
CONSOLIDATED SCHEDULE OF INVESTMENTS (CONTINUED)
December 31, 2013
Corporate Restricted Securities: (A) (Continued) | Principal Amount, Shares, Units or Ownership Percentage | Acquisition Date | Cost | Fair Value | ||||||||||||
MBWS Ultimate Holdco, Inc. | ||||||||||||||||
A provider of services throughout North Dakota that address the fluid management and related transportation needs of an oil well. | ||||||||||||||||
12% Senior Subordinated Note due 2016 | $ | 3,352,486 | * | $ | 3,170,490 | $ | 3,352,486 | |||||||||
Preferred Stock Series A (B) | 4,164 shs. | 09/07/10 | 416,392 | 1,190,348 | ||||||||||||
Common Stock (B) | 487 shs. | 03/01/11 | 48,677 | 139,217 | ||||||||||||
Common Stock (B) | 458 shs. | 09/07/10 | 45,845 | 130,927 | ||||||||||||
Warrant, exercisable until 2020, to purchase common stock at $.01 per share (B) | 310 shs. | 03/01/11 | 30,975 | 88,619 | ||||||||||||
Warrant, exercisable until 2016, to purchase common stock at $.01 per share (B) | 1,158 shs. | 09/07/10 | 115,870 | 331,033 | ||||||||||||
* 09/07/10 and 03/01/11. | 3,828,249 | 5,232,630 | ||||||||||||||
MedSystems Holdings LLC | ||||||||||||||||
A manufacturer of enteral feeding products, such as feeding tubes and other products related to assisted feeding. | ||||||||||||||||
Preferred Unit (B) | 126 uts. | 08/29/08 | 125,519 | 168,037 | ||||||||||||
Common Unit Class A (B) | 1,268 uts. | 08/29/08 | 1,268 | 78,909 | ||||||||||||
Common Unit Class B (B) | 472 uts. | 08/29/08 | 120,064 | 29,361 | ||||||||||||
246,851 | 276,307 | |||||||||||||||
MEGTEC Holdings, Inc. | ||||||||||||||||
A supplier of industrial and environmental products and services to a broad array of industries. | ||||||||||||||||
Preferred Stock (B) | 107 shs. | 09/24/08 | 103,255 | 170,476 | ||||||||||||
Limited Partnership Interest (B) | 1.40% int. | 09/16/08 | 388,983 | 889,124 | ||||||||||||
Warrant, exercisable until 2018, to purchase common stock at $.01 per share (B) | 35 shs. | 09/24/08 | 33,268 | 161,082 | ||||||||||||
525,506 | 1,220,682 | |||||||||||||||
Merex Holding Corporation | ||||||||||||||||
A provider of after-market spare parts and components, as well as Maintenance, Repair and Overhaul services for "out of production" or "legacy" aerospace and defense systems that are no longer effectively supported by the original equipment manufacturers. | ||||||||||||||||
14% Senior Subordinated Note due 2018 | $ | 1,273,585 | 09/22/11 | 1,254,281 | 1,286,913 | |||||||||||
Limited Liability Company Unit Series B (B) | 467,833 uts. | 09/22/11 | 467,833 | 356,653 | ||||||||||||
1,722,114 | 1,643,566 | |||||||||||||||
MicroGroup, Inc. | ||||||||||||||||
A manufacturer of precision parts and assemblies, and a value-added supplier of metal tubing and bars. | ||||||||||||||||
7% Senior Subordinated Note due 2014 (D) | $ | 1,705,152 | * | 1,635,166 | 426,288 | |||||||||||
Preferred Stock Series A (B) | 980 shs. | 10/10/12 | 942,054 | - | ||||||||||||
Common Stock (B) | 450 shs. | * | 450,000 | - | ||||||||||||
Common Stock Series B (B) | 1,128 shs. | 10/10/12 | 11 | - | ||||||||||||
Warrant, exercisable until 2014, to purchase common stock at $.02 per share (B) | 164 shs. | * | 162,974 | - | ||||||||||||
* 08/12/05 and 09/11/06. | 3,190,205 | 426,288 |
See Notes to Consolidated Financial Statements
23
Babson Capital Corporate Investors
CONSOLIDATED SCHEDULE OF INVESTMENTS (CONTINUED)
December 31, 2013
Corporate Restricted Securities: (A) (Continued) | Principal Amount, Shares, Units or Ownership Percentage | Acquisition Date | Cost | Fair Value | ||||||||||||
MNX Holding Company | ||||||||||||||||
An international third party logistics company providing customized logistics services to customers across the globe. | ||||||||||||||||
14% Senior Subordinated Note due 2019 | $ | 2,960,823 | 11/02/12 | $ | 2,909,109 | $ | 2,912,296 | |||||||||
Common Stock (B) | 107 shs. | 11/02/12 | 107,143 | 79,646 | ||||||||||||
3,016,252 | 2,991,942 | |||||||||||||||
Motion Controls Holdings | ||||||||||||||||
A manufacturer of high performance mechanical motion control and linkage products. | ||||||||||||||||
14.25% Senior Subordinated Note due 2017 | $ | 2,871,649 | 11/30/10 | 2,836,884 | 2,869,921 | |||||||||||
Limited Liability Company Unit Class B-1 (B) | 281,250 uts. | 11/30/10 | - | 236,759 | ||||||||||||
Limited Liability Company Unit Class B-2 (B) | 25,504 uts. | 11/30/10 | - | 21,469 | ||||||||||||
2,836,884 | 3,128,149 | |||||||||||||||
NABCO, Inc. | ||||||||||||||||
A producer of explosive containment vessels in the United States. | ||||||||||||||||
Common Stock (B) | 809 shs. | 12/20/12 | 578,174 | - |
NetShape Technologies, Inc.
A manufacturer of powder metal and metal injection molded precision components used in industrial, consumer, and other applications.
14% Senior Subordinated Note due 2014 | $ | 2,004,985 | 02/02/07 | 1,989,743 | 1,904,736 | |||||||||||
Limited Partnership Interest of | ||||||||||||||||
Saw Mill PCG Partners LLC (B) | 2.73% int. | 02/01/07 | 1,110,810 | - | ||||||||||||
Limited Liability Company Unit Class D of | ||||||||||||||||
Saw Mill PCG Partners LLC (B) | 17 uts. | * | 16,759 | - | ||||||||||||
Limited Liability Company Unit Class D-1 of | ||||||||||||||||
Saw Mill PCG Partners LLC (B) | 229 uts. | 09/30/09 | 228,858 | 424,480 | ||||||||||||
Limited Liability Company Unit Class D-2 of | ||||||||||||||||
Saw Mill PCG Partners LLC (B) | 128 uts. | 04/29/11 | 65,256 | - | ||||||||||||
* 12/18/08 and 09/30/09. | 3,411,426 | 2,329,216 | ||||||||||||||
Newark Group, Inc. | ||||||||||||||||
A major producer of paper products from recycled materials. | ||||||||||||||||
Common Stock (B) | 134,520 shs. | 09/02/10 | 796,862 | 346,322 |
Nicoat Acquisitions LLC
A manufacturer of water-based and ultraviolet coatings for high-performance graphic arts, packaging and other specialty coating applications.
14% Senior Subordinated Note due 2018 | $ | 1,475,084 | 11/05/10 | 1,388,078 | 1,475,084 | |||||||||||
Limited Liability Company Unit Series B (B) | 51,724 uts. | 11/05/10 | 51,724 | 65,312 | ||||||||||||
Limited Liability Company Unit Series B (B) | 104,792 uts. | 11/05/10 | 104,792 | 132,320 | ||||||||||||
Limited Liability Company Unit Series F (B) | 104,792 uts. | 11/05/10 | - | 1,094,940 | ||||||||||||
1,544,594 | 2,767,656 |
See Notes to Consolidated Financial Statements
24
2013 Annual Report
CONSOLIDATED SCHEDULE OF INVESTMENTS (CONTINUED)
December 31, 2013
Corporate Restricted Securities: (A) (Continued) | Principal Amount, Shares, Units or Ownership Percentage | Acquisition Date | Cost | Fair Value | ||||||||||||
Northwest Mailing Services, Inc. | ||||||||||||||||
A producer of promotional materials for companies that use direct mail as part of their customer retention and loyalty programs. | ||||||||||||||||
12% Senior Subordinated Note due 2016 | $ | 2,818,421 | * | $ | 2,538,876 | $ | 2,796,882 | |||||||||
Limited Partnership Interest (B) | 3,287 uts. | * | 328,679 | 222,491 | ||||||||||||
Warrant, exercisable until 2019, to purchase | ||||||||||||||||
common stock at $.01 per share (B) | 4,920 shs. | * | 492,016 | 333,058 | ||||||||||||
* 07/09/09 and 08/09/10. | 3,359,571 | 3,352,431 | ||||||||||||||
NT Holding Company | ||||||||||||||||
A leading developer, manufacturer and provider of medical products used primarily in interventional pain management. | ||||||||||||||||
12% Senior Subordinated Note due 2019 | $ | 2,649,351 | 02/02/11 | 2,491,121 | 2,675,845 | |||||||||||
Common Stock (B) | 377 shs. | * | 377,399 | 515,050 | ||||||||||||
Warrant, exercisable until 2021, to purchase | ||||||||||||||||
common stock at $.01 per share (B) | 176 shs. | 02/02/11 | 158,961 | 240,548 | ||||||||||||
*02/02/11 and 06/30/11. | 3,027,481 | 3,431,443 | ||||||||||||||
O E C Holding Corporation | ||||||||||||||||
A provider of elevator maintenance, repair and modernization services. | ||||||||||||||||
13% Senior Subordinated Note due 2017 | $ | 1,333,333 | 06/04/10 | 1,259,140 | 1,333,333 | |||||||||||
Preferred Stock Series A (B) | 1,661 shs. | 06/04/10 | 166,062 | 81,988 | ||||||||||||
Preferred Stock Series B (B) | 934 shs. | 06/04/10 | 93,376 | 46,102 | ||||||||||||
Common Stock (B) | 1,032 shs. | 06/04/10 | 1,032 | - | ||||||||||||
1,519,610 | 1,461,423 | |||||||||||||||
Ontario Drive & Gear Ltd. | ||||||||||||||||
A manufacturer of all-wheel drive, off-road amphibious vehicles and related accessories. | ||||||||||||||||
Limited Liability Company Unit (B) | 3,667 uts. | 01/17/06 | 572,115 | 1,767,201 | ||||||||||||
Warrant, exercisable until 2014, to purchase | ||||||||||||||||
common stock at $.01 per share (B) | 619 shs. | 01/17/06 | 170,801 | 298,366 | ||||||||||||
742,916 | 2,065,567 | |||||||||||||||
P K C Holding Corporation | ||||||||||||||||
A manufacturer of plastic film and badges for the general industrial, medical, and food industries. | ||||||||||||||||
Preferred Stock Class A (B) | 54 shs. | 12/21/10 | 340,718 | 635,394 | ||||||||||||
Common Stock (B) | 54 shs. | 12/21/10 | 25,500 | 105,401 | ||||||||||||
366,218 | 740,795 | |||||||||||||||
P P T Holdings LLC |
A high-end packaging solutions provider that targets customers who have multiple packaging needs, require a high number of low volume SKUs, short lead times, technical expertise, and overall supply chain management.
15% Senior Subordinated Note due 2017 | $ | 2,936,146 | 12/20/10 | 2,899,407 | 2,936,146 | |||||||
Limited Liability Company Unit Class A (B) | 99 uts. | 12/20/10 | 318,215 | 333,387 | ||||||||
Limited Liability Company Unit Class B (B) | 99 uts. | 12/20/10 | 3,214 | 333,387 | ||||||||
3,220,836 | 3,602,920 |
See Notes to Consolidated Financial Statements
25
CONSOLIDATED SCHEDULE OF INVESTMENTS (CONTINUED)
December 31, 2013
Corporate Restricted Securities: (A) (Continued) | Principal Amount, Shares, Units or Ownership Percentage | Acquisition Date | Cost | Fair Value | ||||||||||||
Pacific Consolidated Holdings LLC | ||||||||||||||||
A manufacturer of rugged, mobile liquid and gaseous oxygen and nitrogen generating systems used in the global defense, oil and gas, and medical sectors. | ||||||||||||||||
0% Senior Subordinated Note due 2014 (B) | $ | 79,688 | 12/18/12 | $ | - | $ | 79,688 | |||||||||
Pearlman Enterprises, Inc. | ||||||||||||||||
A developer and distributor of tools, equipment, and supplies to the natural and engineered stone industry. | ||||||||||||||||
Preferred Stock Series A (B) | 2,334 shs. | 05/22/09 | 111,508 | - | ||||||||||||
Preferred Stock Series B (B) | 13,334 shs. | 05/22/09 | 547,872 | - | ||||||||||||
Common Stock (B) | 40,540 shs. | 05/22/09 | 1,877,208 | - | ||||||||||||
2,536,588 | - | |||||||||||||||
Petroplex Inv Holdings LLC | ||||||||||||||||
A leading provider of acidizing services to E&P customers in the Permian Basin. | ||||||||||||||||
16% Senior Subordinated Note due 2018 | $ | 2,743,110 | 11/29/12 | 2,686,289 | 2,669,068 | |||||||||||
Limited Liability Company Unit (B) | 375,000 uts. | 11/29/12 | 375,000 | 372,163 | ||||||||||||
3,061,289 | 3,041,231 | |||||||||||||||
Postle Aluminum Company LLC | ||||||||||||||||
A manufacturer and distributor of aluminum extruded products. | ||||||||||||||||
15% Senior Subordinated Note due 2014 | $ | 1,702,685 | 06/03/10 | 1,694,837 | 1,702,685 | |||||||||||
Limited Liability Company Unit Class A (B) | 1,384 uts. | 10/02/06 | 510,000 | 276,684 | ||||||||||||
Limited Liability Company Unit (B) | 143 uts. | 05/22/09 | 642 | 28,586 | ||||||||||||
Warrant, exercisable until 2016, to purchase | ||||||||||||||||
common stock at $.01 per share (B) | 8,595 shs. | 10/02/06 | 124,644 | 1,718,219 | ||||||||||||
2,330,123 | 3,726,174 | |||||||||||||||
Precision Wire Holding Company | ||||||||||||||||
A manufacturer of specialty medical wires that are used in non-elective minimally invasive surgical procedures. | ||||||||||||||||
Warrant, exercisable until 2019, to purchase | ||||||||||||||||
common stock at $.01 per share (B) | 206 shs. | 11/12/09 | 203,944 | 348,513 | ||||||||||||
R A J Manufacturing Holdings LLC | ||||||||||||||||
A designer and manufacturer of women’s swimwear sold under a variety of licensed brand names. | ||||||||||||||||
14.5% Senior Subordinated Note due 2014 (D) | $ | 1,570,531 | 12/15/06 | 1,532,479 | 785,266 | |||||||||||
Limited Liability Company Unit (B) | 2,828 uts. | 12/15/06 | 282,810 | - | ||||||||||||
Warrant, exercisable until 2014, to purchase | ||||||||||||||||
common stock at $.01 per share (B) | 3 shs. | 12/15/06 | 131,483 | - | ||||||||||||
1,946,772 | 785,266 |
See Notes to Consolidated Financial Statements
26
CONSOLIDATED SCHEDULE OF INVESTMENTS (CONTINUED)
December 31, 2013
Corporate Restricted Securities: (A) (Continued) | Principal Amount, Shares, Units or | Acquisition Date | Cost | Fair Value | ||||||||||||
REVSpring, Inc. | ||||||||||||||||
A provider of accounts receivable management and revenue cycle management services to customers in the healthcare, financial and utility industries. | ||||||||||||||||
14% Senior Subordinated Note due 2018 | $ | 3,482,203 | * | $ | 3,432,969 | $ | 3,469,417 | |||||||||
Limited Liability Company Unit Class A (B) | 40,643 uts. | * | 406,432 | 494,356 | ||||||||||||
* 10/21/11 and 08/03/12. | 3,839,401 | 3,963,773 | ||||||||||||||
Rose City Holding Company | ||||||||||||||||
A designer and printer of folding cartons and packaging for food and beverage manufacturers on the West Coast. | ||||||||||||||||
Preferred Stock (B) | 93,749 shs. | 12/11/12 | 93,749 | 101,601 | ||||||||||||
Common Stock (B) | 94 shs. | 12/11/12 | 9 | 39,963 | ||||||||||||
93,758 | 141,564 | |||||||||||||||
Safety Infrastructure Solutions |
A provider of trench safety equipment to a diverse customer base across multiple end markets in Texas and the Southwestern United States.
15% Senior Subordinated Note due 2018 | $ | 2,531,250 | * | 2,500,156 | 2,562,898 | |||||||||||
Preferred Stock (B) | 6,294 shs. | 03/30/12 | 251,758 | 289,428 | ||||||||||||
Common Stock (B) | 2,949 shs. | 03/30/12 | 29,492 | 72,680 | ||||||||||||
* 03/30/12 and 05/16/13. | 2,781,406 | 2,925,006 |
Sencore Holding Company
A designer, manufacturer, and marketer of decoders, receivers and modulators sold to broadcasters, satellite, cable and telecom operators for encoding/decoding analog and digital transmission video signals.
12.5% Senior Subordinated Note due 2014 (D) | $ | 2,185,882 | 01/15/09 | 1,560,231 | - | |||||||||||
Signature Systems Holdings Company | ||||||||||||||||
A seller and installer of a variety of modular surfaces, industrial matting and related products used for ground protection. | ||||||||||||||||
12.5% Senior Subordinated Note due 2021 | $ | 1,812,211 | 03/15/13 | 1,714,128 | 1,808,804 | |||||||||||
Common Stock (B) | 181 shs. | 03/15/13 | 181,221 | 207,544 | ||||||||||||
Warrant, exercisable until 2023, to purchase | ||||||||||||||||
common stock at $.01 per share (B) | 74 shs. | 03/15/13 | 67,958 | 84,784 | ||||||||||||
1,963,307 | 2,101,132 | |||||||||||||||
Smart Source Holdings LLC | ||||||||||||||||
A short-term computer rental company. | ||||||||||||||||
Limited Liability Company Unit (B) | 619 uts. | * | 493,496 | 795,357 | ||||||||||||
Warrant, exercisable until 2015, to purchase | ||||||||||||||||
common stock at $.01 per share (B) | 157 shs. | * | 127,437 | 201,491 | ||||||||||||
* 08/31/07 and 03/06/08. | 620,933 | 996,848 |
See Notes to Consolidated Financial Statements
27
Babson Capital Corporate Investors
CONSOLIDATED SCHEDULE OF INVESTMENTS (CONTINUED)
December 31, 2013
Corporate Restricted Securities: (A) (Continued) | Principal Amount, Shares, Units or Ownership Percentage | Acquisition Date | Cost | Fair Value | ||||||||||||
SMB Machinery Holdings, Inc. | ||||||||||||||||
A reseller of used, rebuilt and refurbished packaging and processing equipment, primarily serving the bottling and food manufacturing industries. | ||||||||||||||||
14% Senior Subordinated Note due 2019 | $ | 1,462,725 | 10/18/13 | $ | 1,434,229 | $ | 1,454,141 | |||||||||
Common Stock (B) | 1,681 shs. | 10/18/13 | 168,100 | 159,695 | ||||||||||||
1,602,329 | 1,613,836 | |||||||||||||||
Snacks Parent Corporation | ||||||||||||||||
The world’s largest provider of trail mixes and a leading provider of snack nuts, dried fruits, and other healthy snack products. | ||||||||||||||||
13% Senior Subordinated Note due 2020 | $ | 2,689,341 | 11/12/10 | 2,578,790 | 2,689,341 | |||||||||||
Preferred Stock A (B) | 3,395 shs. | 11/12/10 | 301,503 | 233,159 | ||||||||||||
Preferred Stock B (B) | 1,575 shs. | 11/12/10 | - | 108,195 | ||||||||||||
Common Stock (B) | 19,737 shs. | 11/12/10 | 19,737 | - | ||||||||||||
Warrant, exercisable until 2020, to purchase | ||||||||||||||||
common stock at $.01 per share (B) | 5,418 shs. | 11/12/10 | 5,418 | - | ||||||||||||
2,905,448 | 3,030,695 | |||||||||||||||
SouthernCare Holdings, Inc. | ||||||||||||||||
A hospice company providing palliative care services to terminally ill patients. | ||||||||||||||||
Common Stock (B) | 2,727 shs. | 12/01/11 | 272,727 | 309,558 | ||||||||||||
Spartan Foods Holding Company | ||||||||||||||||
A manufacturer of branded pizza crusts and pancakes. | ||||||||||||||||
14.25% Senior Subordinated Note due 2017 | $ | 2,267,934 | 12/15/09 | 2,056,817 | 2,175,551 | |||||||||||
Warrant, exercisable until 2018, to purchase | ||||||||||||||||
common stock at $.01 per share (B) | 257 shs. | 12/15/09 | 227,109 | 29,084 | ||||||||||||
2,283,926 | 2,204,635 | |||||||||||||||
Specialty Commodities, Inc. | ||||||||||||||||
A distributor of specialty food ingredients. | ||||||||||||||||
Common Stock (B) | 30 shs. | 10/23/08 | 300,000 | 569,329 | ||||||||||||
Warrant, exercisable until 2018, to purchase | ||||||||||||||||
common stock at $.01 per share (B) | 11 shs. | 10/23/08 | 100,650 | 216,345 | ||||||||||||
400,650 | 785,674 | |||||||||||||||
Stag Parkway Holding Company | ||||||||||||||||
A distributor of RV parts and accessories in the United States. | ||||||||||||||||
13% Senior Subordinated Note due 2018 | $ | 2,744,413 | 12/19/12 | 2,631,187 | 2,745,333 | |||||||||||
Common Stock (B) | 284 shs. | 12/19/12 | 283,688 | 334,009 | ||||||||||||
Warrant, exercisable until 2018, to purchase | ||||||||||||||||
common stock at $.01 per share (B) | 83 shs. | 12/19/12 | 76,435 | 98,087 | ||||||||||||
2,991,310 | 3,177,429 |
See Notes to Consolidated Financial Statements
28
CONSOLIDATED SCHEDULE OF INVESTMENTS (CONTINUED)
December 31, 2013
Corporate Restricted Securities: (A) (Continued) | Principal Amount, Shares, Units or | Acquisition Date | Cost | Fair Value | ||||||||||||
Strahman Holdings Inc. | ||||||||||||||||
A manufacturer of industrial valves and wash down equipment for a variety of industries, including chemical, petrochemical, polymer, pharmaceutical, food processing, beverage and mining. | ||||||||||||||||
14% Senior Subordinated Note due 2020 | $ | 2,119,565 | 12/13/13 | $ | 2,077,361 | $ | 2,116,770 | |||||||||
Preferred Stock A (B) | 317,935 shs. | 12/13/13 | 317,935 | 302,038 | ||||||||||||
2,395,296 | 2,418,808 | |||||||||||||||
Strata/WLA Holding Corporation |
A leading independent anatomic pathology laboratory that conducts over 320,000 tests annually to customers in 40 U.S. states and in Canada and Venezuela.
14.5% Senior Subordinated Note due 2018 (D) | $ | 2,877,446 | 07/01/11 | 2,831,111 | - | |||||||||||
Preferred Stock Series A (B) | 228 shs. | 07/01/11 | 228,137 | - | ||||||||||||
3,059,248 | - | |||||||||||||||
Sundance Investco LLC | ||||||||||||||||
A provider of post-production services to producers of movies and television shows. | ||||||||||||||||
Limited Liability Company Unit Class A (B) | 6,429 shs. | 03/31/10 | - | - |
Sunrise Windows Holding Company
A manufacturer and marketer of premium vinyl windows exclusively selling to the residential remodeling and replacement market.
14% Senior Subordinated Note due 2017 | $ | 3,069,059 | 12/14/10 | 2,951,662 | 3,008,163 | |||||||||||
14% Senior Subordinated PIK Note due 2017 | $ | 271,913 | 08/17/12 | 263,352 | 266,518 | |||||||||||
Common Stock (B) | 115 shs. | 12/14/10 | 114,504 | 62,515 | ||||||||||||
Warrant, exercisable until 2020, to purchase | ||||||||||||||||
common stock at $.01 per share (B) | 112 shs. | 12/14/10 | 111,747 | 61,014 | ||||||||||||
3,441,265 | 3,398,210 | |||||||||||||||
Synteract Holdings Corporation | ||||||||||||||||
A provider of outsourced clinical trial management services to pharmaceutical and biotechnology companies. | ||||||||||||||||
14% Senior Subordinated Note due 2019 | $ | 3,323,616 | 09/02/08 | 3,204,909 | 3,227,721 | |||||||||||
Preferred Stock Series D (B) | 485 shs. | 02/27/13 | 48,503 | - | ||||||||||||
Redeemable Preferred Stock Series A (B) | 1,280 shs. | 09/02/08 | 12,523 | - | ||||||||||||
Warrant, exercisable until 2018, to purchase | ||||||||||||||||
common stock at $.01 per share (B) | 12,803 shs. | 09/02/08 | 112,693 | - | ||||||||||||
3,378,628 | 3,227,721 |
See Notes to Consolidated Financial Statements
29
Babson Capital Corporate Investors
CONSOLIDATED SCHEDULE OF INVESTMENTS (CONTINUED)
December 31, 2013
Corporate Restricted Securities: (A) (Continued) | Principal Amount, Shares, Units or | Acquisition Date | Cost | Fair Value | ||||||||||||
Terra Renewal LLC | ||||||||||||||||
A provider of wastewater residual management and required environmental reporting, permitting, nutrient management planning and record keeping to companies involved in poultry and food processing. | ||||||||||||||||
12% Senior Subordinated Note due 2016 (D) | $ | 750,682 | * | $ | 129,688 | $ | - | |||||||||
Common Stock Class B | 55 shs. | * | 7,783 | - | ||||||||||||
Limited Partnership Interest of | ||||||||||||||||
Saw Mill Capital Fund V, LLC (B) | 3.97% int. | ** | 191,802 | - | ||||||||||||
Warrant, exercisable until 2016, to purchase | ||||||||||||||||
common stock at $.01 per share (B) | 72 shs. | 04/28/06 | 59,041 | - | ||||||||||||
* 04/28/06 and 09/13/06. | 388,314 | - | ||||||||||||||
** 03/01/05 and 10/10/08. |
Torrent Group Holdings, Inc.
A contractor specializing in the sales and installation of engineered drywells for the retention and filtration of stormwater and nuisance water flow.
3% Senior Subordinated Note due 2018 (D) | $ | 2,006,491 | 12/05/13 | - | - | |||||||||||
15% Senior Subordinated Note due 2020 (D) | $ | 88,396 | 12/05/13 | 414,051 | - | |||||||||||
Warrant, exercisable until 2023, to purchase | 53,038 | |||||||||||||||
common stock at $.01 per share (B) | 12/05/13 | - | - | |||||||||||||
414,051 | - | |||||||||||||||
Transpac Holding Company | ||||||||||||||||
A designer, importer and wholesaler of home décor and seasonal gift products. | ||||||||||||||||
12% Senior Subordinated Note due 2015 (D) | $ | 1,773,006 | 10/31/07 | 1,713,028 | 1,063,804 | |||||||||||
Common Stock (B) | 209 shs. | 10/31/07 | 208,589 | - | ||||||||||||
Warrant, exercisable until 2015, to purchase | ||||||||||||||||
common stock at $.01 per share (B) | 94 shs. | 10/31/07 | 87,607 | - | ||||||||||||
2,009,224 | 1,063,804 | |||||||||||||||
Tranzonic Holdings LLC |
A producer of commercial and industrial supplies, such as safety products, janitorial supplies, work apparel, washroom and restroom supplies and sanitary care products.
14% Senior Subordinated Note due 2019 | $ | 2,983,340 | 07/05/13 | 2,927,420 | 2,975,427 | |||||||||||
Limited Liability Company Unit Class A (B) | 295,455 shs. | 07/05/13 | 295,455 | 304,585 | ||||||||||||
3,222,875 | 3,280,012 |
See Notes to Consolidated Financial Statements
30
2013 Annual Report
CONSOLIDATED SCHEDULE OF INVESTMENTS (CONTINUED)
December 31, 2013
Corporate Restricted Securities: (A) (Continued) | Principal Amount, Shares, Units or | Acquisition Date | Cost | Fair Value | ||||||||||||
Truck Bodies & Equipment International | ||||||||||||||||
A designer and manufacturer of accessories for heavy and medium duty trucks, primarily dump bodies, hoists, various forms of flat-bed bodies, landscape bodies and other accessories. | ||||||||||||||||
12% Senior Subordinated Note due 2016 | $ | 2,309,541 | * | $ | 2,258,972 | $ | 2,309,541 | |||||||||
Preferred Stock Series B (B) | 241 shs. | 10/20/08 | 241,172 | 952,186 | ||||||||||||
Common Stock (B) | 742 shs. | * | 800,860 | - | ||||||||||||
Warrant, exercisable until 2017, to purchase | ||||||||||||||||
common stock at $.02 per share (B) | 153 shs. | * | 159,894 | - | ||||||||||||
Warrant, exercisable until 2018, to purchase | ||||||||||||||||
common stock at $.01 per share (B) | 1,054 shs. | 10/20/08 | - | - | ||||||||||||
* 07/19/05 and 12/22/05. | 3,460,898 | 3,261,727 | ||||||||||||||
TruStile Doors, Inc. | ||||||||||||||||
A manufacturer and distributor of interior doors. | ||||||||||||||||
Limited Liability Company Unit (B) | 11,775 uts. | 02/28/11 | 187,500 | 472,554 | ||||||||||||
Warrant, exercisable until 2016, to purchase | ||||||||||||||||
common stock at $.01 per share (B) | 5,781 shs. | 04/11/03 | 68,059 | 95,763 | ||||||||||||
255,559 | 568,317 | |||||||||||||||
U-Line Corporation | ||||||||||||||||
A manufacturer of high-end, built-in, undercounter ice making, wine storage and refrigeration appliances. | ||||||||||||||||
Common Stock (B) | 182 shs. | 04/30/04 | 182,200 | 294,419 | ||||||||||||
Warrant, exercisable until 2016, to purchase | ||||||||||||||||
common stock at $.01 per share (B) | 230 shs. | 04/30/04 | 211,736 | 372,338 | ||||||||||||
393,936 | 666,757 | |||||||||||||||
U M A Enterprises, Inc. | ||||||||||||||||
An importer and wholesaler of home décor products. | ||||||||||||||||
Convertible Preferred Stock (B) | 887 shs. | 02/08/08 | 886,956 | 2,253,476 | ||||||||||||
Vitex Packaging Group, Inc. | ||||||||||||||||
A manufacturer of specialty packaging, primarily envelopes and tags used on tea bags. | ||||||||||||||||
Class B Unit (B) | 767,881 uts. | 10/29/09 | 348,058 | - | ||||||||||||
Class C Unit (B) | 850,000 uts. | 10/29/09 | 780,572 | 440,331 | ||||||||||||
Limited Liability Company Unit Class A (B) | 723,465 uts. | * | 433,222 | - | ||||||||||||
Limited Liability Company Unit Class B (B) | 182,935 uts. | 07/19/04 | 182,935 | - | ||||||||||||
* 07/19/04 and 10/29/09. | 1,744,787 | 440,331 |
See Notes to Consolidated Financial Statements
31
Babson Capital Corporate Investors
CONSOLIDATED SCHEDULE OF INVESTMENTS (CONTINUED)
December 31, 2013
Corporate Restricted Securities: (A) (Continued) | Principal Amount, Shares, Units or | Acquisition Date | Cost | Fair Value | ||||||||||||
Wellborn Forest Holding Company | ||||||||||||||||
A manufacturer of semi-custom kitchen and bath cabinetry. | ||||||||||||||||
12.13% Senior Subordinated Note due 2016 (D) | $ | 1,721,250 | 11/30/06 | $ | 1,638,669 | $ | - | |||||||||
Common Stock (B) | 191 shs. | 11/30/06 | 191,250 | - | ||||||||||||
Warrant, exercisable until 2016, to purchase | ||||||||||||||||
common stock at $.01 per share (B) | 95 shs. | 11/30/06 | 86,493 | - | ||||||||||||
1,916,412 | - | |||||||||||||||
Wheaton Holding Corporation | ||||||||||||||||
A distributor and manufacturer of laboratory supply products and packaging. | ||||||||||||||||
Preferred Stock Series B (B) | 2,109 shs. | 06/08/10 | 210,924 | 293,968 | ||||||||||||
Common Stock (B) | 1,058 shs. | 06/08/10 | 1,058 | 26,921 | ||||||||||||
211,982 | 320,889 | |||||||||||||||
Whitcraft Holdings, Inc. | ||||||||||||||||
A leading independent manufacturer of precision formed, machined, and fabricated flight-critical aerospace components. | ||||||||||||||||
12% Senior Subordinated Note due 2018 | $ | 2,383,562 | 12/16/10 | 2,240,030 | 2,311,776 | |||||||||||
Common Stock (B) | 616 shs. | 12/16/10 | 616,438 | 247,110 | ||||||||||||
Warrant, exercisable until 2018, to purchase | ||||||||||||||||
common stock at $.02 per share (B) | 166 shs. | 12/16/10 | 148,003 | 66,400 | ||||||||||||
3,004,471 | 2,625,286 | |||||||||||||||
WP Supply Holding Corporation | ||||||||||||||||
A distributor of fresh fruits and vegetables to grocery wholesalers and foodservice distributors in the upper Midwest. | ||||||||||||||||
14.5% Senior Subordinated Note due 2018 | $ | 2,691,120 | 11/03/11 | 2,650,669 | 2,744,942 | |||||||||||
Common Stock (B) | 4,500 shs. | 11/03/11 | 450,000 | 645,146 | ||||||||||||
3,100,669 | 3,390,088 | |||||||||||||||
Total Private Placement Investments (E) | $ | 197,574,891 | $ | 195,718,763 |
See Notes to Consolidated Financial Statements
32
2013 Annual Report
CONSOLIDATED SCHEDULE OF INVESTMENTS (CONTINUED)
December 31, 2013
Corporate Restricted Securities: (A) (Continued) | Interest Rate | Maturity Date | Principal Amount | Cost | Market Value | ||||||||||||
Rule 144A Securities -14.80%: | |||||||||||||||||
Bonds - 14.75% | |||||||||||||||||
AAR Corporation | 7.250 | % | 01/15/22 | $ | 2,000,000 | $ | 2,116,740 | $ | 2,140,000 | ||||||||
Alliant Techsystems Inc. | 5.250 | 10/01/21 | 1,000,000 | 1,000,000 | 1,002,500 | ||||||||||||
Antero Resources Corporation | 5.375 | 11/01/21 | 800,000 | 800,000 | 808,000 | ||||||||||||
Ashtead Group plc | 6.500 | 07/15/22 | 385,000 | 408,012 | 410,507 | ||||||||||||
Beverage Packaging Holdings | 6.000 | 06/15/17 | 730,000 | 730,000 | 739,125 | ||||||||||||
Calpine Corporation | 7.500 | 02/15/21 | 600,000 | 614,324 | 654,750 | ||||||||||||
Calumet Specialty Products Partners, L.P. | 7.625 | 01/15/22 | 740,000 | 728,956 | 747,400 | ||||||||||||
Commscope Holdings Inc. | 6.625 | 06/01/20 | 500,000 | 501,207 | 520,000 | ||||||||||||
Cooper-Standard Automotive | 7.375 | 04/01/18 | 1,000,000 | 1,006,651 | 1,005,000 | ||||||||||||
Cornerstone Chemical Company | 9.375 | 03/15/18 | 750,000 | 767,994 | 789,375 | ||||||||||||
CTP Transportation Products, LLC | 8.250 | 12/15/19 | 635,000 | 635,000 | 661,988 | ||||||||||||
Energy Future Holdings | 10.000 | 12/01/20 | 400,000 | 403,536 | 424,000 | ||||||||||||
Exopack LLC | 7.875 | 11/01/19 | 1,000,000 | 1,000,000 | 1,020,000 | ||||||||||||
Ferrellgas Partners, L.P | 6.750 | 01/15/22 | 465,000 | 465,000 | 471,975 | ||||||||||||
First Data Corporation | 11.750 | 08/15/21 | 1,000,000 | 1,000,000 | 1,055,000 | ||||||||||||
FMG Resources | 6.875 | 04/01/22 | 1,000,000 | 963,903 | 1,090,000 | ||||||||||||
FMG Resources | 7.000 | 11/01/15 | 386,000 | 393,256 | 400,475 | ||||||||||||
Forest Laboratories, Inc. | 5.000 | 12/15/21 | 775,000 | 775,000 | 777,906 | ||||||||||||
Forum Energy Technologies | 6.250 | 10/01/21 | 325,000 | 325,000 | 341,250 | ||||||||||||
Hercules Offshore, Inc. | 7.500 | 10/01/21 | 1,000,000 | 1,000,000 | 1,060,000 | ||||||||||||
Hilcorp Energy Company | 7.625 | 04/15/21 | 725,000 | 697,918 | 786,625 | ||||||||||||
Hilton Worldwide Holdings, Inc. | 5.625 | 10/15/21 | 1,000,000 | 1,000,000 | 1,037,500 | ||||||||||||
Hovnanian Enterprises, Inc. | 7.250 | 10/15/20 | 1,000,000 | 1,000,000 | 1,073,750 | ||||||||||||
Hub International Ltd. | 7.875 | 10/01/21 | 1,000,000 | 1,000,000 | 1,027,500 | ||||||||||||
International Automotive Component | 9.125 | 06/01/18 | 1,000,000 | 956,615 | 1,042,500 | ||||||||||||
J.B. Poindexter Co., Inc. | 9.000 | 04/01/22 | 1,000,000 | 1,051,250 | 1,067,500 | ||||||||||||
LBC Tank Terminals Holding Netherlands B.V. | 6.875 | 05/15/23 | 1,315,000 | 1,356,578 | 1,359,381 | ||||||||||||
Lear Corporation | 4.750 | 01/15/23 | 750,000 | 735,885 | 703,125 | ||||||||||||
MEG Energy Corporation | 7.000 | 03/31/24 | 1,000,000 | 1,000,000 | 1,012,500 | ||||||||||||
Meritor, Inc. | 7.875 | 03/01/26 | 669,000 | 663,403 | 947,471 | ||||||||||||
Milacron Financial | 7.750 | 02/15/21 | 500,000 | 500,000 | 525,000 | ||||||||||||
Mustang Merger Corporation | 8.500 | 08/15/21 | 1,000,000 | 997,555 | 1,080,000 | ||||||||||||
NXP BV/NXP Funding LLC | 3.750 | 06/01/18 | 1,500,000 | 1,500,000 | 1,511,250 | ||||||||||||
Oasis Petroleum Inc. | 6.875 | 03/15/22 | 1,000,000 | 1,000,000 | 1,060,000 | ||||||||||||
Pinnacle Operating Corporation | 9.000 | 11/15/20 | 1,000,000 | 1,046,749 | 1,061,250 |
See Notes to Consolidated Financial Statements
33
Babson Capital Corporate Investors
CONSOLIDATED SCHEDULE OF INVESTMENTS (CONTINUED)
December 31, 2013
Corporate Restricted Securities: (A) (Continued) | Interes Rate | Maturity Date | Shares or Principal | Cost | Market Value | ||||||||||||||
Prestige Brands Holdings, Inc. | 5.375 | % | 12/15/21 | $ | 1,350,000 | $ | 1,350,000 | $ | 1,363,500 | ||||||||||
RKI Inc. | 8.500 | 08/01/21 | 1,000,000 | 1,004,838 | 1,052,500 | ||||||||||||||
Safway Group Holding LLC/Finance Corporation | 7.000 | 05/15/18 | 500,000 | 500,000 | 527,500 | ||||||||||||||
Sirius XM Radio Inc. | 5.875 | 10/01/20 | 750,000 | 750,000 | 765,000 | ||||||||||||||
Sprint Corporation | 7.125 | 06/15/24 | 315,000 | 315,000 | 319,725 | ||||||||||||||
Tesoro Logistics LP | 5.875 | 10/01/20 | 1,000,000 | 1,022,385 | 1,022,500 | ||||||||||||||
Topaz Marine S.A. | 8.625 | 11/01/18 | 1,000,000 | 1,000,000 | 1,007,500 | ||||||||||||||
Univision Communications, Inc. | 5.125 | 05/15/23 | 325,000 | 325,000 | 324,594 | ||||||||||||||
Valeant Pharmaceuticals International | 6.750 | 10/01/17 | 70,000 | 69,773 | 74,550 | ||||||||||||||
Valeant Pharmaceuticals International | 7.000 | 10/01/20 | 880,000 | 881,527 | 948,200 | ||||||||||||||
Welltec A/S | 8.000 | 02/01/19 | 750,000 | 737,893 | 795,000 | ||||||||||||||
Total Bonds | 38,096,948 | 39,615,172 | |||||||||||||||||
Convertible Preferred Stock - 0.00% | |||||||||||||||||||
ETEX Corporation (B) | 777 | - | - | ||||||||||||||||
Total Convertible Preferred Stock | - | - | |||||||||||||||||
Preferred Stock - 0.05% | |||||||||||||||||||
Ally Financial | 143 | $ | 45,009 | $ | 136,578 | ||||||||||||||
TherOX, Inc. (B) | 103 | - | - | ||||||||||||||||
Total Preferred Stock | 45,009 | 136,578 | |||||||||||||||||
Common Stock - 0.00% | |||||||||||||||||||
Touchstone Health Partnership (B) | 1,168 | - | - | ||||||||||||||||
Total Common Stock | - | - | |||||||||||||||||
Total Rule 144A Securities | 38,141,957 | 39,751,750 | |||||||||||||||||
Total Corporate Restricted Securities | $ | 235,716,848 | $ | 235,470,513 |
See Notes to Consolidated Financial Statements
34
2013 Annual Report
CONSOLIDATED SCHEDULE OF INVESTMENTS (CONTINUED)
December 31, 2013
Interest | Maturity | Principal | Market | ||||||||||||||
Corporate Public Securities - 15.78%: (A) | Rate | Date | Amount | Cost | Value | ||||||||||||
Bank Loans - 1.92% | |||||||||||||||||
Aquilex Holdings LLC | 5.250 | % | 12/31/20 | $ | 297,921 | $ | 297,176 | $ | 298,666 | ||||||||
Triple Point Technology, Inc. | 9.250 | 07/09/21 | 259,223 | 222,932 | 217,748 | ||||||||||||
Total Bank Loans | 520,108 | 516,414 | |||||||||||||||
Bonds - 13.57% | |||||||||||||||||
Accuride Corp | 9.500 | % | 08/01/18 | $ | 1,500,000 | $ | 1,534,383 | $ | 1,466,250 | ||||||||
Ally Financial, Inc. | 5.500 | 02/15/17 | 1,500,000 | 1,523,619 | 1,623,750 | ||||||||||||
Alta Mesa Financial Services | 9.625 | 10/15/18 | 1,500,000 | 1,501,266 | 1,605,000 | ||||||||||||
American Axle & Manufacturing, Inc. | 5.125 | 02/15/19 | 240,000 | 240,000 | 246,600 | ||||||||||||
Arch Coal, Inc. | 7.000 | 06/15/19 | 150,000 | 150,000 | 119,250 | ||||||||||||
Avis Budget Car Rental | 9.750 | 03/15/20 | 750,000 | 750,000 | 879,375 | ||||||||||||
B E Aerospace, Inc. | 6.875 | 10/01/20 | 850,000 | 867,276 | 932,875 | ||||||||||||
Calumet Specialty Products Partners L.P. | 9.375 | 05/01/19 | 1,500,000 | 1,508,643 | 1,665,000 | ||||||||||||
CCO Holdings Capital Corporation | 7.250 | 10/30/17 | 750,000 | 763,726 | 794,062 | ||||||||||||
CHC Helicopter SA | 9.375 | 06/01/21 | 1,500,000 | 1,500,000 | 1,537,500 | ||||||||||||
Chemtura Corporation | 7.875 | 09/01/18 | 500,000 | 522,627 | 538,750 | ||||||||||||
Clearwater Paper Corporation | 4.500 | 02/01/23 | 750,000 | 742,955 | 675,000 | ||||||||||||
Coeur d’Alene Mines Corporation | 7.875 | 02/01/21 | 1,000,000 | 1,003,620 | 1,015,000 | ||||||||||||
Commercial Metals Company | 4.875 | 05/15/23 | 1,500,000 | 1,502,996 | 1,395,000 | ||||||||||||
Cooper-Standard Automotive | 8.500 | 05/01/18 | 750,000 | 787,126 | 795,000 | ||||||||||||
Crosstex Energy L.P. | 8.875 | 02/15/18 | 225,000 | 222,127 | 236,531 | ||||||||||||
CVR Refining LLC | 6.500 | 11/01/22 | 650,000 | 627,848 | 638,625 | ||||||||||||
Energy Transfer Equity LP | 7.500 | 10/15/20 | 100,000 | 100,000 | 112,250 | ||||||||||||
Fidelity National Information | 7.875 | 07/15/20 | 125,000 | 125,000 | 136,370 | ||||||||||||
Halcón Resources Corporation | 9.750 | 07/15/20 | 1,000,000 | 1,050,899 | 1,042,500 | ||||||||||||
Headwaters, Inc. | 7.625 | 04/01/19 | 850,000 | 850,178 | 915,875 | ||||||||||||
Health Management Association | 6.125 | 04/15/16 | 750,000 | 763,627 | 830,625 | ||||||||||||
Huntington Ingalls Industries | 7.125 | 03/15/21 | 750,000 | 775,692 | 823,125 | ||||||||||||
Lennar Corporation | 4.750 | 11/15/22 | 750,000 | 739,092 | 695,625 | ||||||||||||
Linn Energy, LLC | 8.625 | 04/15/20 | 1,000,000 | 1,009,592 | 1,080,000 | ||||||||||||
Magnum Hunter Resources, Corp. | 9.750 | 05/15/20 | 1,500,000 | 1,570,054 | 1,620,000 | ||||||||||||
Meritor, Inc. | 6.750 | 06/15/21 | 1,000,000 | 1,000,000 | 1,020,000 | ||||||||||||
Michael Foods, Inc. | 9.750 | 07/15/18 | 75,000 | 75,000 | 81,562 | ||||||||||||
Midstates Petroleum Company, Inc. | 9.250 | 06/01/21 | 1,000,000 | 1,000,000 | 1,045,000 | ||||||||||||
Neustar, Inc. | 4.500 | 01/15/23 | 750,000 | 727,082 | 676,875 | ||||||||||||
Nexeo Solutions LLC | 8.375 | 03/01/18 | 40,000 | 40,000 | 39,700 | ||||||||||||
Nielsen Finance LLC | 4.500 | 10/01/20 | 1,000,000 | 1,000,000 | 972,500 | ||||||||||||
NRG Energy, Inc. | 8.500 | 06/15/19 | 750,000 | 769,578 | 800,625 | ||||||||||||
Nuveen Investments | 5.500 | 09/15/15 | 1,500,000 | 1,425,955 | 1,507,500 | ||||||||||||
Omnova Solutions, Inc. | 7.875 | 11/01/18 | 1,500,000 | 1,524,078 | 1,612,500 | ||||||||||||
Perry Ellis International, Inc. | 7.875 | 04/01/19 | 750,000 | 743,836 | 798,750 |
See Notes to Consolidated Financial Statements
35
Babson Capital Corporate Investors
CONSOLIDATED SCHEDULE OF INVESTMENTS (CONTINUED)
December 31, 2013
Corporate Public Securities: (A) (Continued) | Interest Rate | Maturity Date | Shares or Principal Amount | Cost | Market Value | ||||||||||||
Precision Drilling Corporation | 6.625 | % | 11/15/20 | $ | 750,000 | $ | 770,138 | $ | 800,625 | ||||||||
Quebecor Media, Inc. | 7.750 | 03/15/16 | 570,000 | 555,670 | 577,125 | ||||||||||||
Rosetta Resources Inc. | 5.875 | 06/01/22 | 1,000,000 | 1,000,000 | 992,500 | ||||||||||||
Stone Energy Corporation | 7.500 | 11/15/22 | 1,000,000 | 1,029,764 | 1,045,000 | ||||||||||||
Suburban Propane Partners, L.P. | 7.500 | 10/01/18 | 168,000 | 176,414 | 180,180 | ||||||||||||
Thermadyne Holdings Corporation | 9.000 | 12/15/17 | 681,000 | 713,872 | 728,670 | ||||||||||||
T-Mobile USA Inc. | 6.464 | 04/28/19 | 700,000 | 713,029 | 743,750 | ||||||||||||
T-Mobile USA Inc. | 6.731 | 04/28/22 | 450,000 | 445,337 | 469,125 | ||||||||||||
T-Mobile USA Inc. | 6.836 | 04/28/23 | 135,000 | 132,273 | 140,063 | ||||||||||||
Tomkins, Inc. | 9.250 | 10/01/18 | 79,000 | 79,000 | 86,505 | ||||||||||||
Tronox Finance LLC | 6.375 | 08/15/20 | 750,000 | 732,769 | 765,000 | ||||||||||||
Unit Corporation | 6.625 | 05/15/21 | 1,000,000 | 989,054 | 1,055,000 | ||||||||||||
Venoco, Inc. | 8.875 | 02/15/19 | 500,000 | 507,543 | 492,500 | ||||||||||||
Visteon Corporation | 6.750 | 04/15/19 | 160,000 | 160,000 | 170,000 | ||||||||||||
Xerium Technologies, Inc. | 8.875 | 06/15/18 | 831,000 | 871,018 | 872,550 | ||||||||||||
Total Bonds | 39,913,756 | 41,093,543 | |||||||||||||||
Common Stock - 0.29% | |||||||||||||||||
Bally Total Fitness Holding Corporation (B) (F) | 15 | $ | - | $ | - | ||||||||||||
Chase Packaging Corporation | 9,541 | - | 477 | ||||||||||||||
Intrepid Potash, Inc. (B) | 365 | 11,680 | 5,782 | ||||||||||||||
Nortek, Inc. | 175 | 1 | 13,055 | ||||||||||||||
Supreme Industries, Inc. (B) | 131,371 | 267,319 | 765,893 | ||||||||||||||
Total Common Stock | 279,000 | 785,207 | |||||||||||||||
Total Corporate Public Securities | $ | 40,712,864 | $ | 42,395,164 |
Short-Term Securities: | Interest Rate/Yield^ | Maturity Date | Principal Amount | Cost | Fair Value | ||||||||||||
Commercial Paper - 1.58% | |||||||||||||||||
Ryder System Inc. | 0.210 | % | 01/09/14 | $ | 4,250,000 | $ | 4,249,802 | $ | 4,249,802 | ||||||||
Total Short-Term Securities | $ | 4,249,802 | $ | 4,249,802 | |||||||||||||
Total Investments | 105.00 | % | $ | 280,679,514 | $ | 282,115,479 | |||||||||||
Other Assets | 9.77 | 26,263,823 | |||||||||||||||
Liabilities | (14.77 | ) | (39,691,788 | ) | |||||||||||||
Total Net Assets | 100.00 | % | $ | 268,687,514 |
(A) | In each of the convertible note, warrant, convertible preferred and common stock investments, the issuer has agreed to provide certain registration rights. |
(B) | Non-income producing security. |
(C) | Variable rate security; rate indicated is as of December 31, 2013. |
(D) | Defaulted security; interest not accrued. |
(E) | Illiquid securities. As of December 31, 2013, the value of these securities amounted to $195,718,763 or 72.84% of net assets. |
(F) | Security valued at fair value using methods determined in good faith by or under the direction of the Board of Trustees. |
^ | Effective yield at purchase |
PIK - Payment-in-kind
See Notes to Consolidated Financial Statements
36
2013 Annual Report
CONSOLIDATED SCHEDULE OF INVESTMENTS (CONTINUED)
December 31, 2013
Fair Value/ | Fair Value/ | ||||||||
Industry Classification: | Market Value | Market Value | |||||||
AEROSPACE - 3.11% | BUILDINGS & REAL ESTATE - 2.33% | ||||||||
AAR Corporation | $ | 2,140,000 | Hovnanian Enterprises, Inc. | $ | 1,073,750 | ||||
Alliant Techsystems Inc. | 1,002,500 | Lennar Corporation | 695,625 | ||||||
B E Aerospace, Inc. | 932,875 | Safway Group Holding LLC/Finance Corporation | 527,500 | ||||||
Merex Holding Corporation | 1,643,566 | Sunrise Windows Holding Company | 3,398,210 | ||||||
Whitcraft Holdings, Inc. | 2,625,286 | TruStile Doors, Inc. | 568,317 | ||||||
8,344,227 | 6,263,402 | ||||||||
AUTOMOBILE - 8.94% | |||||||||
Accuride Corp | 1,466,250 | CHEMICAL, PLASTICS & RUBBER - 2.61% | |||||||
American Axle & Manufacturing, Inc. | 246,600 | Capital Specialty Plastics, Inc. | 1,076,843 | ||||||
Avis Budget Car Rental | 879,375 | Cornerstone Chemical Company | 789,375 | ||||||
CG Holdings Manufacturing Company | 3,913,326 | Nicoat Acquisitions LLC | 2,767,656 | ||||||
Cooper-Standard Automotive | 1,800,000 | Omnova Solutions, Inc. | 1,612,500 | ||||||
DPL Holding Corporation | 3,686,954 | Tronox Finance LLC | 765,000 | ||||||
Ideal Tridon Holdings, Inc. | 510,024 | 7,011,374 | |||||||
International Automotive Component | 1,042,500 | CONSUMER PRODUCTS - 8.54% | |||||||
J A C Holding Enterprises, Inc. | 1,321,628 | AMS Holding LLC | 379,065 | ||||||
Jason Partners Holdings LLC | 48,185 | Baby Jogger Holdings LLC | 3,282,412 | ||||||
K & N Parent, Inc. | 4,105,329 | Bravo Sports Holding Corporation | 2,115,244 | ||||||
Lear Corporation | 703,125 | Clearwater Paper Corporation | 675,000 | ||||||
Meritor, Inc. | 1,967,471 | Custom Engineered Wheels, Inc. | 873,861 | ||||||
Ontario Drive & Gear Ltd. | 2,065,567 | gloProfessional Holdings, Inc. | 2,951,917 | ||||||
Tomkins, Inc. | 86,505 | Handi Quilter Holding Company | 535,933 | ||||||
Visteon Corporation | 170,000 | K N B Holdings Corporation | 112,781 | ||||||
24,012,839 | Manhattan Beachwear Holding Company | 3,421,485 | |||||||
BEVERAGE, DRUG & FOOD - 7.34% | NXP BV/NXP Funding LLC | 1,511,250 | |||||||
1492 Acquisition LLC | 3,179,181 | Perry Ellis International, Inc. | 798,750 | ||||||
Eatem Holding Company | 3,555,672 | Prestige Brands Holdings, Inc. | 1,363,500 | ||||||
F F C Holding Corporation | 796,275 | R A J Manufacturing Holdings LLC | 785,266 | ||||||
Hospitality Mints Holding Company | 2,191,638 | Tranzonic Holdings LLC | 3,280,012 | ||||||
JMH Investors LLC | 2,844,789 | Xerium Technologies, Inc. | 872,550 | ||||||
Michael Foods, Inc. | 81,562 | 22,959,026 | |||||||
Pinnacle Operating Corporation | 1,061,250 | ||||||||
Snacks Parent Corporation | 3,030,695 | ||||||||
Spartan Foods Holding Company | 2,204,635 | ||||||||
Specialty Commodities, Inc. | 785,674 | ||||||||
19,731,371 |
See Notes to Consolidated Financial Statements
37
Babson Capital Corporate Investors
CONSOLIDATED SCHEDULE OF INVESTMENTS (CONTINUED)
December 31, 2013
Fair Value/ | Fair Value/ | ||||||||
Industry Classification: (Continued) | Market Value | Market Value | |||||||
CONTAINERS, PACKAGING & GLASS - 2.71% | DIVERSIFIED/CONGLOMERATE, | ||||||||
Beverage Packaging Holdings | $ | 739,125 | SERVICE - 10.23% | ||||||
Chase Packaging Corporation | 477 | A S C Group, Inc. | $ | 2,602,932 | |||||
P K C Holding Corporation | 740,795 | A W X Holdings Corporation | 367,500 | ||||||
P P T Holdings LLC | 3,602,920 | Advanced Technologies Holdings | 1,741,894 | ||||||
Rose City Holding Company | 141,564 | Apex Analytix Holding Corporation | 698,307 | ||||||
SMB Machinery Holdings, Inc. | 1,613,836 | Church Services Holding Company | 1,598,010 | ||||||
Vitex Packaging Group, Inc. | 440,331 | Clough, Harbour and Associates | 408,119 | ||||||
7,279,048 | Crane Rental Corporation | 2,460,843 | |||||||
DISTRIBUTION - 6.64% | ELT Holding Company | 2,892,261 | |||||||
ARI Holding Corporation | 3,562,845 | EPM Holding Company | 1,276,570 | ||||||
Blue Wave Products, Inc. | 1,625,889 | Hilton Worldwide Holdings, Inc. | 1,037,500 | ||||||
BP SCI LLC | 3,012,748 | Hub International Ltd. | 1,027,500 | ||||||
Duncan Systems, Inc. | 959,946 | HVAC Holdings, Inc. | 3,082,405 | ||||||
Signature Systems Holdings Company | 2,101,132 | Insurance Claims Management, Inc. | 623,885 | ||||||
Stag Parkway Holding Company | 3,177,429 | Mail Communications Group, Inc. | 580,343 | ||||||
WP Supply Holding Corporation | 3,390,088 | Nexeo Solutions LLC | 39,700 | ||||||
17,830,077 | Northwest Mailing Services, Inc. | 3,352,431 | |||||||
DIVERSIFIED/CONGLOMERATE, | Safety Infrastructure Solutions | 2,925,006 | |||||||
MANUFACTURING - 11.13% | Sirius XM Radio Inc. | 765,000 | |||||||
A H C Holding Company, Inc. | 448,422 | 27,480,206 | |||||||
Advanced Manufacturing Enterprises LLC | 2,769,772 | ELECTRONICS - 0.59% | |||||||
Arrow Tru-Line Holdings, Inc. | 597,957 | Connecticut Electric, Inc. | 1,581,078 | ||||||
C D N T, Inc. | 1,109,612 | 1,581,078 | |||||||
CTP Transportation Products, LLC | 661,988 | FINANCIAL SERVICES - 4.31% | |||||||
F G I Equity LLC | 1,196,598 | Ally Financial, Inc. | 1,760,328 | ||||||
G C Holdings | 1,707,776 | Alta Mesa Financial Services | 1,605,000 | ||||||
Hi-Rel Group LLC | 2,253,785 | Ashtead Group plc | 410,507 | ||||||
Janus Group Holdings LLC | 3,220,719 | LBC Tank Terminals Holding Netherlands B.V. | 1,359,381 | ||||||
J.B. Poindexter Co., Inc. | 1,067,500 | Nielsen Finance LLC | 972,500 | ||||||
K P H I Holdings, Inc. | 847,419 | Nuveen Investments | 1,507,500 | ||||||
K P I Holdings, Inc. | 399,532 | REVSpring, Inc. | 3,963,773 | ||||||
LPC Holding Company | 464,860 | 11,578,989 | |||||||
MEGTEC Holdings, Inc. | 1,220,682 | ||||||||
Mustang Merger Corporation | 1,080,000 | ||||||||
Nortek, Inc. | 13,055 | ||||||||
O E C Holding Corporation | 1,461,423 | ||||||||
Postle Aluminum Company LLC | 3,726,174 | ||||||||
Strahman Holdings Inc | 2,418,808 | ||||||||
Truck Bodies & Equipment International | 3,261,727 | ||||||||
29,927,809 |
See Notes to Consolidated Financial Statements
38
2013 Annual Report
CONSOLIDATED SCHEDULE OF INVESTMENTS (CONTINUED)
December 31, 2013
Fair Value/ | Fair Value/ | ||||||||
Industry Classification: (Continued) | Market Value | Market Value | |||||||
HEALTHCARE, EDUCATION & CHILDCARE - 4.61% | MEDICAL DEVICES/BIOTECH - 2.57% | ||||||||
American Hospice Management Holding LLC $ | 3,065,328 | Chemtura Corporation | $ | 538,750 | |||||
CHG Alternative Education Holding Company | 3,101,330 | Halcón Resources Corporation | 1,042,500 | ||||||
GD Dental Services LLC | 254,260 | Health Management Association | 830,625 | ||||||
Healthcare Direct Holding Company | 2,105,152 | MedSystems Holdings LLC | 276,307 | ||||||
SouthernCare Holdings, Inc. | 309,558 | MicroGroup, Inc. | 426,288 | ||||||
Synteract Holdings Corporation | 3,227,721 | NT Holding Company | 3,431,443 | ||||||
Wheaton Holding Corporation | 320,889 | Precision Wire Holding Company | 348,513 | ||||||
12,384,238 | 6,894,426 | ||||||||
HOME & OFFICE FURNISHINGS, HOUSEWARES & DURABLE CONSUMER PRODUCTS - 2.08% | MINING, STEEL, IRON & NON-PRECIOUS METALS - 1.45% | ||||||||
Connor Sport Court International, Inc. | 914,806 | Coeur d’Alene Mines Corporation | 1,015,000 | ||||||
Home Décor Holding Company | 695,915 | Commercial Metals Company | 1,395,000 | ||||||
Transpac Holding Company | 1,063,804 | FMG Resources | 1,490,475 | ||||||
U M A Enterprises, Inc. | 2,253,476 | 3,900,475 | |||||||
U-Line Corporation | 666,757 | NATURAL RESOURCES - 0.39% | |||||||
5,594,758 | Arch Coal, Inc. | 119,250 | |||||||
Headwaters, Inc. | 915,875 | ||||||||
LEISURE, AMUSEMENT & ENTERTAINMENT - 1.20% | Intrepid Potash, Inc. | 5,782 | |||||||
CTM Holding, Inc. | 3,217,035 | 1,040,907 |
OIL & GAS - 10.01% | |||||||||
MACHINERY - 5.12% | Antero Resources Corporation | 808,000 | |||||||
ABC Industries, Inc. | 1,544,417 | Calumet Specialty Products Partners L.P. | 1,665,000 | ||||||
Arch Global Precision LLC | 3,388,268 | Calumet Specialty Products Partners, L.P. | 747,400 | ||||||
E S P Holdco, Inc. | 462,112 | CVR Refining LLC | 638,625 | ||||||
Milacron Financial | 525,000 | Energy Transfer Equity LP | 112,250 | ||||||
Motion Controls Holdings | 3,128,149 | Exopack LLC | 1,020,000 | ||||||
NetShape Technologies, Inc. | 2,329,216 | Forum Energy Technologies | 341,250 | ||||||
Pacific Consolidated Holdings LLC | 79,688 | Hercules Offshore, Inc. | 1,060,000 | ||||||
Supreme Industries, Inc. | 765,893 | Hilcorp Energy Company | 786,625 | ||||||
Thermadyne Holdings Corporation | 728,670 | Linn Energy, LLC | 1,080,000 | ||||||
Welltec A/S | 795,000 | Magnum Hunter Resources, Corp. | 1,620,000 | ||||||
13,746,413 | MBWS Ultimate Holdco, Inc. | 5,232,630 | |||||||
MEG Energy Corporation | 1,012,500 | ||||||||
Midstates Petroleum Company, Inc. | 1,045,000 | ||||||||
Oasis Petroleum Inc. | 1,060,000 | ||||||||
Petroplex Inv Holdings LLC | 3,041,231 | ||||||||
Precision Drilling Corporation | 800,625 |
See Notes to Consolidated Financial Statements
39
Babson Capital Corporate Investors
CONSOLIDATED SCHEDULE OF INVESTMENTS (CONTINUED)
December 31, 2013
Fair Value/ | Fair Value/ | ||||||||
Industry Classification: (Continued) | Market Value | Market Value | |||||||
RKI Inc. | $ | 1,052,500 | Huntington Ingalls Industries | $ | 823,125 | ||||
Rosetta Resources Inc. | 992,500 | Ryder System, Inc. | 4,249,802 | ||||||
Stone Energy Corporation | 1,045,000 | Tesoro Logistics LP | 1,022,500 | ||||||
Suburban Propane Partners, L.P. | 180,180 | Topaz Marine S.A. | 1,007,500 | ||||||
Unit Corporation | 1,055,000 | 11,632,369 | |||||||
Venoco, Inc. | 492,500 | UTILITIES - 0.79% | |||||||
26,888,816 | Calpine Corporation | 654,750 | |||||||
PHARMACEUTICALS - 0.79% | Crosstex Energy L.P. | 236,531 | |||||||
CorePharma LLC | 325,862 | Energy Future Holdings | 424,000 | ||||||
Forest Laboratories, Inc. | 777,906 | NRG Energy, Inc. | 800,625 | ||||||
Valeant Pharmaceuticals International | 1,022,750 | 2,115,906 | |||||||
2,126,518 |
PUBLISHING/PRINTING - 0.34% | WASTE MANAGEMENT/POLLUTION - 0.11% | ||||||||
Newark Group, Inc. | 346,322 | ||||||||
Quebecor Media, Inc. | 577,125 | Aquilex Holdings LLC | 298,666 | ||||||
923,447 | |||||||||
�� | Total Investments - 105.00% | $ | 282,115,479 | ||||||
RETAIL STORES - 0.17% | |||||||||
Ferrellgas Partners, L.P | 471,975 | ||||||||
TECHNOLOGY - 1.02% | |||||||||
Fidelity National Information | 136,370 | ||||||||
First Data Corporation | 1,055,000 | ||||||||
Smart Source Holdings LLC | 996,848 | ||||||||
Triple Point Technology, Inc. | 217,748 | ||||||||
Univision Communications, Inc. | 324,594 | ||||||||
2,730,560 | |||||||||
TELECOMMUNICATIONS - 1.54% | |||||||||
All Current Holding Company | 485,924 | ||||||||
CCO Holdings Capital Corporation | 794,062 | ||||||||
Commscope Holdings Inc. | 520,000 | ||||||||
Neustar, Inc. | 676,875 | ||||||||
Sprint Corporation | 319,725 | ||||||||
T-Mobile USA Inc. | 1,352,938 | ||||||||
4,149,524 | |||||||||
TRANSPORTATION - 4.33% | |||||||||
CHC Helicopter SA | 1,537,500 | ||||||||
MNX Holding Company | 2,991,942 |
See Notes to Consolidated Financial Statements
40
2013 Annual Report
NOTES TO CONSOLIDATED FINANCIAL STATEMENTS
1. History Babson Capital Corporate Investors (the “Trust”) commenced operations in 1971 as a Delaware corporation. Pursuant to an Agreement and Plan of Reorganization dated November 14, 1985, approved by shareholders, the Trust was reorganized as a Massachusetts business trust under the laws of the Commonwealth of Massachusetts, effective November 28, 1985. The Trust is a diversified closed-end management investment company. Babson Capital Management LLC (“Babson Capital”), a wholly-owned indirect subsidiary of Massachusetts Mutual Life Insurance Company (“MassMutual”), acts as its investment adviser. The Trust’s investment objective is to maintain a portfolio of securities providing a fixed yield and at the same time offering an opportunity for capital gains. The Trust’s principal investments are privately placed, below-investment grade, long-term debt obligations. Such direct placement securities may, in some cases, be accompanied by equity features such as common stock, warrants, conversion rights, or other equity features and, occasionally, preferred stocks. The Trust typically purchases these investments, which are not publicly tradable, directly from their issuers in private placement transactions. These investments are typically mezzanine debt instruments with accompanying private equity securities made to small or middle market companies. In addition, the Trust may invest, subject to certain limitations, in marketable investment grade debt securities, other marketable debt securities (including high yield securities) and marketable common stocks. Below-investment grade or high yield securities have predominantly speculative characteristics with respect to the capacity of the issuer to pay interest and repay capital. On January 27, 1998, the Board of Trustees authorized the formation of a wholly-owned subsidiary of the Trust (“CI Subsidiary Trust”) for the purpose of holding certain investments. The results of CI Subsidiary Trust are consolidated in the accompanying financial statements. Footnote 2.D below discusses the Federal tax consequences of the CI Subsidiary Trust. 2. Significant Accounting Policies The following is a summary of significant accounting policies followed consistently by the Trust in the preparation of its consolidated financial statements in conformity with accounting principles generally accepted in the United States of America (“U.S. GAAP”). A. Valuation of Investments: Under U.S. GAAP, fair value represents the price that should be received to sell an asset (exit price) in an orderly transaction between willing market participants at the measurement date. Determination of Fair Value The determination of the fair value of the Trust’s investments is the responsibility of the Trust’s Board of Trustees (the “Trustees”). The Trustees have adopted procedures for the valuation of the Trust’s securities and has delegated responsibility | for applying those procedures to Babson Capital. Babson Capital has established a Pricing Committee which is responsible for setting the guidelines used in following the procedures adopted by the Trustees and ensuring that those guidelines are being followed. Babson Capital considers all relevant factors that are reasonably available, through either public information or information directly available to Babson Capital, when determining the fair value of a security. The Trustees meet at least once each quarter to approve the value of the Trust’s portfolio securities as of the close of business on the last business day of the preceding quarter. This valuation requires the approval of a majority of the Trustees of the Trust, including a majority of the Trustees who are not interested persons of the Trust or of Babson Capital. In approving valuations, the Trustees will consider reports by Babson Capital analyzing each portfolio security in accordance with the procedures and guidelines referred to above, which include the relevant factors referred to below. Babson Capital has agreed to provide such reports to the Trust at least quarterly. The consolidated financial statements include private placement restricted securities valued at $195,718,763 (72.84% of net assets) as of December 31, 2013 whose values have been estimated by the Trustees based on the process described above in the absence of readily ascertainable market values. Due to the inherent uncertainty of valuation, those estimated values may differ significantly from the values that would have been used had a ready market for the securities existed, and the differences could be material. Following is a description of valuation methodologies used for assets recorded at fair value. Corporate Public Securities – Bank Loans, Corporate Bonds, Preferred Stocks and Common Stocks The Trust uses external independent third-party pricing services to determine the fair values of its Corporate Public Securities. At December 31, 2013, 100% of the carrying value of these investments was from external pricing services. In the event that the primary pricing service does not provide a price, the Trust utilizes the pricing provided by a secondary pricing service. Public debt securities generally trade in the over-the-counter market rather than on a securities exchange. The Trust’s pricing services use multiple valuation techniques to determine fair value. In instances where significant market activity exists, the pricing services may utilize a market based approach through which quotes from market makers are used to determine fair value. In instances where significant market activity may not exist or is limited, the pricing services also utilize proprietary valuation models which may consider market characteristics such as benchmark yield curves, option adjusted spreads, credit spreads, estimated default rates, coupon rates, anticipated timing of principal underlying prepayments, collateral, and other unique security features in order to estimate the relevant cash flows, which are then discounted to calculate the fair value. |
41
Babson Capital Corporate Investors
NOTES TO CONSOLIDATED FINANCIAL STATEMENTS (CONTINUED)
The Trust’s investments in bank loans are normally valued at the bid quotation obtained from dealers in loans by an independent pricing service in accordance with the Trust’s valuation policies and procedures approved by the Trustees. Public equity securities listed on an exchange or on the NASDAQ National Market System are valued at the last quoted sales price of that day. Annually, Babson Capital conducts reviews of the primary pricing vendors to validate that the inputs used in that vendors’ pricing process are deemed to be market observable as defined in the standard. While Babson Capital is not provided access to proprietary models of the vendors, the reviews have included on-site walk-throughs of the pricing process, methodologies and control procedures for each asset class and level for which prices are provided. The review also includes an examination of the underlying inputs and assumptions for a sample of individual securities across asset classes, credit rating levels and various durations, a process Babson Capital continues to perform annually. In addition, the pricing vendors have an established challenge process in place for all security valuations, which facilitates identification and resolution of prices that fall outside expected ranges. Babson Capital believes that the prices received from the pricing vendors are representative of prices that would be received to sell the assets at the measurement date (exit prices) and are classified appropriately in the hierarchy Corporate Restricted Securities – Corporate Bonds The fair value of certain notes is determined using an internal model that discounts the anticipated cash flows of those notes using a specific discount rate. Changes to that discount rate are driven by changes in general interest rates, probabilities of default and credit adjustments. The discount rate used within the models to discount the future anticipated cash flows is considered a significant unobservable input. Significant increases/(decreases) in the discount rate would result in a significant (decrease)/increase to the notes’ fair value. The fair value of certain distressed notes is based on an enterprise waterfall methodology which is discussed in the equity security valuation section below. Corporate Restricted Securities – Common Stock, Preferred Stock and Partnerships & LLC’s The fair value of equity securities is determined using an enterprise waterfall methodology. Under this methodology, the enterprise value of the company is first estimated and that value is then allocated to the company’s outstanding debt and equity securities based on the documented priority of each class of securities in the capital structure. Generally, the waterfall proceeds from senior debt tranches of the capital structure to senior then junior subordinated debt, followed by each class of preferred stock and finally the common stock | To estimate a company’s enterprise value, the company’s trailing twelve months earnings before interest, taxes, depreciation and amortization (“EBITDA”) is multiplied by a valuation multiple. A discount for lack of marketability is applied to the end result. Both the company’s EBITDA and valuation multiple are considered significant unobservable inputs. Short-Term Securities Short-term securities, of sufficient credit quality, with more than sixty days to maturity are valued at fair value, using external independent third-party services. Short-term securities having a maturity of sixty days or less are valued at amortized cost, which approximates fair value. Quantitative Information about Level 3 Fair Value Measurements The following table represents quantitative information about Level 3 fair value measurements as of December 31, 2013. | |||||||||
Valuation | Unobservable | Weighted | ||||||||
Technique | Inputs | Range | Average | |||||||
Corporate | Discounted | Discount | 7.4% to | 13.40% | ||||||
Bonds | Cash Flows | Rate | 16.90% | |||||||
Equity | Market | Valuation | 3.5x to | 7.2x | ||||||
Securities | Approach | Multiple | 11.0x | |||||||
Discount for | 0% to | 5.30% | ||||||||
lack of | 24% | |||||||||
marketability | ||||||||||
EBITDA | $0.1 million to | 22.4 million | ||||||||
$143.2 million | ||||||||||
Fair Value Hierarchy | ||||||||||
The Trust categorizes its investments measured at fair value in three levels, based on the inputs and assumptions used to determine fair value. These levels are as follows: | ||||||||||
Level 1 – quoted prices in active markets for identical securities | ||||||||||
Level 2 – other significant observable inputs (including quoted prices for similar securities, interest rates, prepayment speeds, credit risk, etc.) | ||||||||||
Level 3 – significant unobservable inputs (including the Trust’s own assumptions in determining the fair value of investments) |
42
2013 Annual Report
NOTES TO CONSOLIDATED FINANCIAL STATEMENTS (CONTINUED)
The following is a summary of the inputs used to value the Trust’s net assets as of December 31, 2013:
Assets: | Total | Level 1 | Level 2 | Level 3 | ||||||||||||
Restricted Securities | ||||||||||||||||
Corporate Bonds | $ | 175,980,096 | $ | - | $ | 39,615,172 | $ | 136,364,924 | ||||||||
Common Stock - U.S. | 23,299,991 | - | - | 23,299,991 | ||||||||||||
Preferred Stock | 14,914,692 | - | 136,578 | 14,778,114 | ||||||||||||
Partnerships and LLCs | 21,275,734 | - | - | 21,275,734 | ||||||||||||
Public Securities | ||||||||||||||||
Bank Loans | 516,414 | - | 516,414 | - | ||||||||||||
Corporate Bonds | 41,093,543 | - | 41,093,543 | - | ||||||||||||
Common Stock - U.S. | 785,207 | 785,207 | - | - | ||||||||||||
Short-term Securities | 4,249,802 | - | 4,249,802 | - | ||||||||||||
Total | $ | 282,115,479 | $ | 785,207 | $ | 85,611,509 | $ | 195,718,763 |
See information disaggregated by security type and industry classification in the Consolidated Schedule of Investments.
There were no transfers into or out of Level 1 or Level 2 assets.
Following is a reconciliation of Level 3 assets for which significant unobservable inputs were used to determine fair value:
Assets: | Beginning balance at 12/31/2012 | Included in earnings | Purchases | Sales | Prepayments | Transfers into Level 3 | Transfers out of Level 3 | Ending balance at 12/31/2013 | |||||||||||||||||
Restricted Securities | |||||||||||||||||||||||||
Corporate Bonds | $ | 191,789,043 | $ | (3,240,319 | ) | $ | 36,669,962 | $ | (16,869,708 | ) | $ | (71,984,054 | ) | $ | - | $ | - | $ | 136,364,924 | ||||||
Common Stock - U.S. | 18,594,948 | 6,394,194 | 2,194,071 | (3,883,222 | ) | - | - | - | 23,299,991 | ||||||||||||||||
Preferred Stock | 12,415,845 | (138,395 | ) | 2,638,117 | (137,453 | - | - | - | 14,778,114 | ||||||||||||||||
Partnerships and LLCs | 15,933,742 | 4,699,994 | 1,367,750 | (725,752 | ) | - | - | - | 21,275,734 | ||||||||||||||||
$ | 238,733,578 | $ | 7,715,474 | 42,869,900 | $ | (21,616,135 | ) | (71,984,054 | ) | $ | - | $ | - | $ | 195,718,763 |
Income, Gains and Losses included in Net Increase in Net Assets resulting from Operations for the period are presented in the following accounts on the Statement of Operations for Level 3 assets:
Net Increase in Net Assets Resulting from | Change in Unrealized Gains in Net Assets from assets | |||||||
Operations | still held | |||||||
Interest (Amortization) | 1,208,721 | - | ||||||
Net realized loss on investments before taxes | (3,029,974) | - | ||||||
Net change in unrealized depreciation of investments before taxes. | 9,536,727 | 9,936,639 |
43
Babson Capital Corporate Investors
NOTES TO CONSOLIDATED FINANCIAL STATEMENTS (CONTINUED)
B. Accounting for Investments: Investment transactions are accounted for on the trade date. Dividend income is recorded on the ex-dividend date. Interest income is recorded on the accrual basis, including the amortization of premiums and accretion of discounts on bonds held using the yield- to-maturity method. The Trust does not accrue income when payment is delinquent and when management believes payment is questionable. Realized gains and losses on investment transactions and unrealized appreciation and depreciation of investments are reported for financial statement and Federal income tax purposes on the identified cost method. | net realized gains by $4,890,947, increased retained net realized gain on investments, prior years by $4,719,676 and increased additional paid in capital by $832,737 to more accurately display the Trust’s capital financial position on a tax-basis in accordance with U.S. GAAP. These re-classifications had no impact on net asset value. The CI Subsidiary Trust is not taxed as a regulated investment company. Accordingly, prior to the Trust receiving any distributions from the CI Subsidiary Trust, all of the CI Subsidiary Trust’s taxable income and realized gains, including non-qualified income and realized gains, is subject to taxation at prevailing corporate tax rates. The components of income taxes included in the consolidated Statement of Operations for the year ended December 31, 2013 were as follows: |
Income tax expense (benefit) | ||||||
C. Use of Estimates: The preparation of financial statements in conformity with U.S. GAAP requires management to make estimates and assumptions that affect the reported amounts of assets and liabilities, disclosure of contingent assets and liabilities and the reported amounts of revenues and expenses during the reporting period. Actual results could differ from those estimates. | Current: | |||||
Federal | $ | 336,512 | ||||
State | 80,267 | |||||
Total current | 416,779 | |||||
Deferred: | ||||||
Federal | 365,422 | |||||
State | 60,766 | |||||
Total deferred | 426,188 | |||||
Total income tax expense from continuing operations | ||||||
$ | 842,967 | |||||
D. Federal Income Taxes: The Trust has elected to be taxed as a “regulated investment company” under the Internal Revenue Code, and intends to maintain this qualification and to distribute substantially all of its net taxable income to its shareholders. In any year when net long-term capital gains are realized by the Trust, management, after evaluating the prevailing economic conditions, will recommend that the Trustees either designate the net realized long-term gains as undistributed and pay the Federal capital gains taxes thereon or distribute all or a portion of such net gains. For the year ended December 31, 2013, the Trust did not have any realized taxable long-term capital gains. | Deferred tax assets and liabilities are recognized for the future tax consequences attributable to differences between the financial statement carrying amounts of the existing assets and liabilities and their respective tax basis. The tax effects of temporary differences that give rise to significant portions of the deferred tax assets and liabilities as of December 31, 2013 were as follows: |
The Trust is taxed as a regulated investment company and is therefore limited as to the amount of non- qualified income that it may receive as the result of operating a trade or business, e.g. the Trust’s pro rata share of income allocable to the Trust by a partnership operating company. The Trust’s violation of this limitation could result in the loss of its status as a regulated investment company, thereby subjecting all of its net income and capital gains to corporate taxes prior to distribution to its shareholders. The Trust, from time-to-time, identifies investment opportunities in the securities of entities that could cause such trade or business income to be allocable to the Trust. The CI Subsidiary Trust (described in Footnote 1 above) was formed in order to allow investment in such securities without adversely affecting the Trust’s status as a regulated investment company. Net investment income and net realized gains or losses of the Trust as presented under U.S. GAAP may differ from distributable taxable earnings due to earnings from the CI Subsidiary Trust as well as certain permanent and temporary differences in the recognition of income and realized gains or losses on certain investments. Permanent differences will result in reclassifications to the capital accounts. In 2013, the Trust decreased undistributed net investment income by $661,466, decreased accumulated | Deferred tax liabilities: | |||||
Unrealized gain on investments | 1,328,228 | |||||
Total deferred tax liabilities | 1,328,228 | |||||
Net deferred tax liability | $ | (1,328,228 | ) | |||
The Trust recognizes a tax benefit from an uncertain position only if it is more likely than not that the position is sustainable, based solely on its technical merits and consideration of the relevant taxing authority’s widely understood administrative practices and precedents. If this threshold is met, the Trust measures the tax benefit as the largest amount of benefit that is greater than fifty percent likely of being realized upon ultimate settlement. The Trust has evaluated and determined that the tax positions did not have a material effect on the Trust’s financial position and results of operations for the year ended December 31, 2013. A reconciliation of the differences between the CI Subsidiary Trust’s income tax expense and the amount computed by applying the prevailing U.S. federal tax rate to pretax income for the year ended December 31, 2013 is as follows: |
44
2013 Annual Report
NOTES TO CONSOLIDATED FINANCIAL STATEMENTS (CONTINUED)
Amount | Percentage | While management is still assessing the impact of this update on disclosures, the impact of this update is not expected to be material to the financial statements. 3. Investment Services Contract A. Services: Under an Investment Services Contract (the “Contract”) with the Trust, Babson Capital agrees to use its best efforts to present to the Trust a continuing and suitable investment program consistent with the investment objectives and policies of the Trust. Babson Capital represents the Trust in any negotiations with issuers, investment banking firms, securities brokers or dealers and other institutions or investors relating to the Trust’s investments. Under the Contract, Babson Capital also provides administration of the day-to-day operations of the Trust and provides the Trust with office space and office equipment, accounting and bookkeeping services, and necessary executive, clerical and secretarial personnel for the performance of the foregoing services. B. Fee: For its services under the Contract, Babson Capital is paid a quarterly investment advisory fee of 0.3125% of the net asset value of the Trust as of the last business day of each fiscal quarter, which is approximately equal to 1.25% annually. A majority of the Trustees, including a majority of the Trustees who are not interested persons of the Trust or of Babson Capital, approve the valuation of the Trust’s net assets as of such day. | ||||||||
Provision for income taxes at | ||||||||||
the U.S. federal rate | $ | 786,686 | 35.00 | % | ||||||
State tax, net of federal effect | 80,354 | 3.58 | % | |||||||
Change in valuation allowance | 0 | 0 | % | |||||||
Other | (24,073 | ) | (1.07 | %) | ||||||
Income tax expense | $ | 842,967 | 37.51 | % | ||||||
Each of the Trust’s Federal tax returns for the prior three fiscal years remain subject to examination by the Internal Revenue Service. E. Distributions to Shareholders: The Trust records distributions to shareholders from net investment income and net realized gains, if any, on the ex-dividend date. The Trust’s net investment income dividend is declared four times per year, in April, July, October, and December. The Trust’s net realized capital gain distribution, if any, is declared in December. The components of capital shown in the following table represent the Trust’s undistributed net investment income, undistributed net capital gain, losses the Trust may be able to offset against gains in future taxable years, as well as unrealized appreciation (depreciation) on securities and other fund investments, if any, at December 31, 2013, each of which determined on a U.S. federal tax basis: |
Net Unrealized | |||||||||||||||
Appreciation | 4. Senior Secured Indebtedness MassMutual holds the Trust’s $30,000,000 Senior Fixed Rate Convertible Note (the “Note”) issued by the Trust on November 15, 2007. The Note is due November 15, 2017 and accrues interest at 5.28% per annum. MassMutual, at its option, can convert the principal amount of the Note into common shares. The dollar amount of principal would be converted into an equivalent dollar amount of common shares based upon the average price of the common shares for ten business days prior to the notice of conversion. For the year ended December 31, 2013, the Trust incurred total interest expense on the Note of $1,584,000. The Trust may redeem the Note, in whole or in part, at the principal amount proposed to be redeemed together with the accrued and unpaid interest thereon through the redemption date plus a Make Whole Premium. The Make Whole Premium equals the excess of (i) the present value of the scheduled payments of principal and interest which the Trust would have paid but for the proposed redemption, discounted at the rate of interest of U.S. Treasury obligations whose maturity approximates that of the Note plus 0.50% over (ii) the principal of the Note proposed to be redeemed. Management estimates that the fair value of the Note was $32,804,100 as of December 31, 2013. | ||||||||||||||
Undistributed | (Depreciation) | ||||||||||||||
(Overdistributed) | Undistributed | Accumulated | on Securities | ||||||||||||
Net Investment | Net Capital | Loss | and Other | ||||||||||||
Income | Gain | Carryforward | Investments | ||||||||||||
$ | 2,126,833 | $ | 0 | $ | (1,074,497 | ) | $ | 1,406,597 | |||||||
The tax character of distributions declared during the years ended December 31, 2013 and 2012 was as follows: | |||||||||||||||
Distributions paid from: | 2013 | 2012 | |||||||||||||
Ordinary Income | $ | 23,206,25 | $ | 24,945,136 | |||||||||||
Long-term Capital Gains | $ | - | $ | - | |||||||||||
F. New Accounting Pronouncements: In June 2013, the Financial Accounting Standards Board (“FASB”) issued Accounting Standards Update No. 2013-08, Financial Services - Investment Companies (Topic 946): Amendments to the Scope, Measurement and Disclosure Requirements (“ASU 2013-08”), which updates the criteria used in defining an investment company under U.S. GAAP and also sets forth certain measurement and disclosure requirements. The amendments in ASU 2013-08 are effective for fiscal periods (including interim periods) beginning after December 15, 2013. | |||||||||||||||
45
Babson Capital Corporate Investors
NOTES TO CONSOLIDATED FINANCIAL STATEMENTS (CONTINUED)
5. Purchases and Sales of Investments | 7. Aggregate Remuneration Paid to Officers, Trustees and Their Affiliated Persons For the year ended December 31, 2013, the Trust paid its Trustees aggregate remuneration of $394,200. During the year, the Trust did not pay any compensation to any of its Trustees who are “interested persons” (as defined by the 1940 Act) of the Trust. The Trust classifies Messrs. Noreen and Joyal as “interested persons” of the Trust. All of the Trust’s officers are employees of Babson Capital. Pursuant to the Contract, the Trust does not compensate its officers who are employees of Babson Capital (except for the Chief Compliance Officer of the Trust unless assumed by Babson Capital). For the year ended December 31, 2013, Babson Capital paid the compensation of the Chief Compliance Officer of the Trust. Mr. Noreen, one of the Trust’s Trustees, is an “affiliated person” (as defined by the 1940 Act) of MassMutual and Babson Capital. The Trust did not make any payments to Babson Capital for the year ended December 31, 2013, other than amounts payable to Babson Capital pursuant to the Contract. 8. Certifications As required under New York Stock Exchange (“NYSE”) Corporate Governance Rules, the Trust’s principal executive officer has certified to the NYSE that he was not aware, as of the certification date, of any violation by the Trust of the NYSE’s Corporate Governance listing standards. In addition, as required by Section 302 of the Sarbanes-Oxley Act of 2002 and related SEC rules, the Trust’s principal executive and principal financial officers have made quarterly certifications, included in filings with the Securities and Exchange Commission on Forms N-CSR and N-Q, relating to, among other things, the Trust’s disclosure controls and procedures and internal control over financial reporting, as applicable. 9. Subsequent Events The Trust has evaluated the possibility of subsequent events existing in this report through February 26, 2014. The Trust has determined that there are no material events that would require recognition or disclosure in this report through this date. | ||||||||
For the year ended | |||||||||
12/31/2013 | |||||||||
Cost of Investments Acquired | Proceeds from Sales or Maturities | ||||||||
Corporate restricted securities | $ | 85,696,335 | $ | 85,890,380 | |||||
Corporate public securities | 8,968,964 | 28,216,962 | |||||||
The aggregate cost of investments is substantially the same for financial reporting and Federal income tax purposes as of December 31, 2013. The net unrealized appreciation of investments for financial reporting and Federal tax purposes as of December 31, 2013 is $1,435,965 and consists of $34,277,278 appreciation and $32,841,313 depreciation. | |||||||||
Net unrealized appreciation of investments on the Statement of Assets and Liabilities reflects the balance net of a deferred tax accrual of $1,328,228 on net unrealized gains on the CI Subsidiary Trust. | |||||||||
6. Quarterly Results of Investment Operations (Unaudited) | |||||||||
March 31, 2013 | |||||||||
Amount | Per Share | ||||||||
Investment income | $ | 7,412,097 | |||||||
Net investment income | 5,954,292 | $ | 0.31 | ||||||
Net realized and unrealized | |||||||||
gain on investments (net of taxes) | 4,692,928 | 0.24 | |||||||
June 30, 2013 | |||||||||
Amount | Per Share | ||||||||
Investment income | $ | 7,355,816 | |||||||
Net investment income | 5,900,864 | $ | 0.31 | ||||||
Net realized and unrealized | |||||||||
gain on investments (net of taxes) | (1,903,314 | ) | (0.1 | ) | |||||
September 30, 2013 | |||||||||
Amount | Per Share | ||||||||
Investment income | $ | 6,826,999 | |||||||
Net investment income | 5,344,847 | $ | 0.28 | ||||||
Net realized and unrealized | |||||||||
gain on investments (net of taxes) | 4,826,087 | 0.25 | |||||||
December 31, 2013 | |||||||||
Amount | Per Share | ||||||||
Investment income | $ | 7,284,905 | |||||||
Net investment income | 5,670,296 | $ | 0.29 | ||||||
Net realized and unrealized | |||||||||
gain on investments (net of taxes) | 1,689,913 | 0.09 |
46
2013 Annual Report
REPORT OF INDEPENDENT REGISTERED PUBLIC ACCOUNTING FIRM
KPMG LLP Two Financial Center 60 South Street Boston, MA 02111 | |||
The Shareholders and Board of Trustees of Babson Capital Corporate Investors We have audited the accompanying consolidated statement of assets and liabilities of Babson Capital Corporate Investors (the “Trust”), including the consolidated schedule of investments, as of December 31, 2013, and the related consolidated statements of operations and cash flows for the year then ended, the consolidated statements of changes in net assets for each of the years in the two-year period then ended, and the consolidated selected financial highlights for each of the years in the five-year period then ended. These consolidated financial statements and consolidated selected financial highlights are the responsibility of the Trust’s management. Our responsibility is to express an opinion on these consolidated financial statements and consolidated selected financial highlights based on our audits. We conducted our audits in accordance with the standards of the Public Company Accounting Oversight Board (United States). Those standards require that we plan and perform the audit to obtain reasonable assurance about whether the consolidated financial statements and consolidated selected financial highlights are free of material misstatement. An audit includes examining, on a test basis, evidence supporting the amounts and disclosures in the financial statements. Our procedures included confirmation of securities owned as of December 31, 2013, by correspondence with the custodian and counterparties. An audit also includes assessing the accounting principles used and significant estimates made by management, as well as evaluating the overall financial statement presentation. We believe that our audits provide a reasonable basis for our opinion. In our opinion, the consolidated financial statements and consolidated selected financial highlights referred to above present fairly, in all material respects, the financial position of Babson Capital Corporate Investors as of December 31, 2013, the consolidated results of their operations and cash flows for the year then ended, the consolidated changes in their net assets for each of the years in the two-year period then ended, and the consolidated selected financial highlights for each of the years in the five-year period then ended, in conformity with U.S. generally accepted accounting principles. Boston, Massachusetts February 26, 2014 | |||
47
Babson Capital Corporate Investors
INTERESTED TRUSTEES
Name (Age), Address | Position With The Trust | Office Term / Length of Time Served | Principal Occupations During Past 5 Years | Portfolios Overseen in Fund Complex | Other Directorships Held by Director |
Clifford M. Noreen* (56) Babson Capital Corporate Investors 1500 Main Street P.O. Box 15189 Springfield, MA 01115-5189 | Trustee / Chairman | Term expires 2015; Trustee since 2009 | President of Babson Capital (since 2008), Vice Chairman (2007-2008), Member of the Board of Managers (since 2006), Managing Director (since 2000), Babson Capital; President (2005-2009), Vice President (1993-2005) of the Trust. | 2 | Chairman and Trustee (since 2009), President (2005-2009), Vice President (1993-2009), Babson Capital Participation Investors; President (since 2009), Senior Vice President (1996-2009), HYP Management LLC (LLC Manager); Director (2005-2013), MassMutual Corporate Value Limited (investment company); Director (2005-2013), MassMutual Corporate Value Partners Limited (investment company); Director (since 2008), Jefferies Finance LLC (a finance company); Chairman and Chief Executive Officer (since 2009), Manager (since 2007), MMC Equipment Finance LLC; Director (since 2011), Wood Creek Capital Management, LLC (investment advisory firm); Chairman (since 2009), Trustee (since 2005), President (2005-2009), CI Subsidiary Trust and PI Subsidiary Trust; and Member of Investment Committee (since 1999), Diocese of Springfield. |
* | Mr. Noreen is classified as an “interested person” of the Trust and Babson Capital (as defined by the Investment Company Act of 1940, as amended) because of his position as an Officer of the Trust and President of Babson Capital. |
48
INTERESTED TRUSTEES
Name (Age), Address | Position With The Trust | Office Term / Length of Time Served | Principal Occupations During Past 5 Years | Portfolios Overseen in Fund Complex | Other Directorships Held by Director |
Robert E. Joyal* (69) Babson Capital Corporate Investors 1500 Main Street P.O. Box 15189 Springfield, MA 01115-5189 | Trustee | Term expires 2016; Trustee since 2003 | Retired (since 2003); President (2001-2003), Babson Capital; and President (1993 - 2003) of the Trust. | 97 | Trustee (since 2003), President (1993-2003), Babson Capital Participation Investors; Director (since 2006), Jefferies Group, Inc. (financial services); Director (2003-2010), Alabama Aircraft Industries, Inc. (aircraft maintenance and overhaul); Director (2007-2011), Scottish Re Group Ltd. (global life reinsurance specialist); Trustee (since 2003), MassMutual Select Funds (an open-end investment company advised by MassMutual); Trustee (since 2003), MML Series Investment Fund (an open-end investment company advised by MassMutual); Trustee (since 2012), MassMutual Series Investment Fund II (an open-ended investment company advised by MassMutual); Trustee (since 2012), MassMutual Premier Funds (an open-ended investment company advised by MassMutual); Director (since 2012), Ormat Technologies, Inc. (a geothermal energy company); Director (since 2013), Leucadia National Corporation (holding company owning businesses ranging from insurance to telecommunications); and Director (since 2013), Baring Asset Management Korea Limited (company that engages in asset management, business administration and investment management). |
* | Mr. Joyal retired as President of Babson Capital in June 2003. In addition and as noted above, Mr. Joyal is a director of Jefferies Group, Inc., which has a wholly-owned broker-dealer subsidiary that may execute portfolio transactions and/or engage in principal transactions with the Trust, other investment companies advised by Babson Capital or any other advisory accounts over which Babson Capital has brokerage placement discretion. Accordingly, the Trust has determined to classify Mr. Joyal as an “interested person” of the Trust and Babson Capital (as defined by the Investment Company Act of 1940, as amended). |
49
INDEPENDENT TRUSTEES
Name (Age), Address | Position With The Trust | Office Term / Length of Time Served | Principal Occupations During Past 5 Years | Portfolios Overseen in Fund Complex | Other Directorships Held by Director |
William J. Barrett (74) Babson Capital Corporate Investors 1500 Main Street P.O. Box 15189 Springfield, MA 01115-5189 | Trustee | Term expires 2015; Trustee since 2006 | President (since 2010), WJ Barrett Associates, Inc.; President (2002 - 2010), Barrett-Gardner Associates, Inc. (private merchant bank). | 2 | Trustee (since 2006), Babson Capital Participation Investors; Director (since 1979), TGC Industries, Inc. (geophysical services); Director and Secretary (since 2001 and from 1996-1997), Chase Packaging Corporation (agricultural services); Chairman and Director (2000-2012), Rumson-Fair Haven Bank and Trust Company (commercial bank and trust company); and Director (since 1983), Executive Vice President, Secretary and Assistant Treasurer (since 2004), Supreme Industries, Inc. (specialized truck and body manufacturer). |
Michael H. Brown (56) Babson Capital Corporate Investors 1500 Main Street P.O. Box 15189 Springfield, MA 01115-5189 | Trustee / Nominee | Term expires 2014; Trustee since 2005 | Private Investor; and Managing Director (1994-2005), Morgan Stanley. | 2 | Trustee (since 2005), Babson Capital Participation Investors; Independent Director (since 2006), Invicta Holdings LLC and its subsidiaries (a derivative trading company owned indirectly by MassMutual). |
Barbara M. Ginader (57) Babson Capital Corporate Investors 1500 Main Street P.O. Box 15189 Springfield, MA 01115-5189 | Trustee / Nominee | Term expires 2014; Trustee since October 2013 | Retired (since 2006); Managing Director (1993-2006), BV Investment Partners (private equity firm). | 2 | Trustee (since 2013), Babson Capital Participation Investors; Managing Director (since 1993), Boston Ventures VI L.P. (private equity fund); Managing Director (since 1993), Boston Ventures V L.P. (private equity fund); Member of the Board of Overseers (since 2013), MSPCA-Angell; Member of the Grants Committee (since 2013), IECA Foundation. |
50
INDEPENDENT TRUSTEES
Name (Age), Address | Position With The Trust | Office Term / Length of Time Served | Principal Occupations During Past 5 Years | Portfolios Overseen in Fund Complex | Other Directorships Held by Director |
Edward P. Grace III (63) Babson Capital Corporate Investors 1500 Main Street P.O. Box 15189 Springfield, MA 01115-5189 | Trustee | Term expires 2016; Trustee since 2012 | President (since 1997), Phelps Grace International, Inc. (investment management); Managing Director (since 1998), Grace Ventures Partners LP (venture capital fund); Senior Advisor (since 2011), Angelo Gordon & Co. (investment adviser). | 2 | Trustee (since 2012), Babson Capital Participation Investors; Director (since 2010), Larkburger, Inc. (restaurant chain); Director (since 2012), Benihana, Inc. (restaurant chain); Director (since 2011), Firebirds Wood Fired Holding Corporation (restaurant chain); Director (since 1998), Shawmut Design and Construction (construction management and general contracting firm); Director (2004-2012), Not Your Average Joe’s, Inc. (restaurant chain); Director (2008-2010), Logan’s Roadhouse, Inc. (restaurant); Director (2007-2009), Claim Jumper Restaurants (restaurant chain); Director (1996-2008), RARE Hospitality International, Inc. (restaurant chain); Director (2006-2008), Quintess/Dream Catchers Retreats; Director (2004-2009), The Gemesis Corporation (cultivator of cultured diamonds); Trustee (1999-2008), Bryant University; Trustee (1994-2010), Johnson & Wales University. |
Susan B. Sweeney (61) Babson Capital Corporate Investors 1500 Main Street P.O. Box 15189 Springfield, MA 01115-5189 | Trustee | Term expires 2016; Trustee since 2012 | Senior Vice President and Chief Investment Officer (since 2010), Selective Insurance Company of America; Senior Managing Director (2008-2010), Ironwood Capital. | 93 | Trustee (since 2012), Babson Capital Participation Investors; Trustee (since 2009), MassMutual Select Funds (an open-ended investment company advised by MassMutual); Trustee (since 2009), MML Series Investment Fund (an open-ended investment company advised by MassMutual); Trustee (since 2012), MassMutual Premier Funds (an open-ended investment company advised by MassMutual); Trustee (since 2012), MML Series Investment Fund II (an open-ended investment company advised by MassMutual). |
Maleyne M. Syracuse (57) Babson Capital Corporate Investors 1500 Main Street P.O. Box 15189 Springfield, MA 01115-5189 | Trustee / Nominee | Term expires 2014; Trustee since 2007 | Private Investor; Managing Director (2000- 2007), JP Morgan Securities, Inc. (investments and banking); Managing Director (1981-2000), Deutsche Bank Securities. | 2 | Trustee (since 2007), Babson Capital Participation Investors. |
51
Babson Capital Corporate Investors
OFFICERS OF THE TRUST
Name (Age), Address | Position With The Trust | Office Term / Length of Time Served | Principal Occupations During Past 5 Years |
Michael L. Klofas (53) Babson Capital Corporate Investors 1500 Main Street P.O. Box 15189 Springfield, MA 01115-5189 | President | Since 2009 | Vice President (1998-2009) of the Trust; President (since 2009), Vice President (1998-2009), Babson Capital Participation Investors; Managing Director (since 2000), Babson Capital; and President (since 2009), Vice President (2005-2009), CI Subsidiary Trust and PI Subsidiary Trust. |
Christopher A. DeFrancis (47) Babson Capital Corporate Investors 1500 Main Street P.O. Box 15189 Springfield, MA 01115-5189 | Vice President, Secretary and Chief Legal Officer | Since 2010 | Associate Secretary (2008-2010) of the Trust; Vice President, Secretary and Chief Legal Officer (since 2010), Associate Secretary (2008-2010), Babson Capital Participation Investors; Chief Compliance Officer (since 2011), Co-General Counsel, Secretary, and Managing Director (since 2010), Senior Counsel, Assistant Secretary and Managing Director (2010), Assistant Secretary and Counsel (2008-2009), Babson Capital; Counsel (2001-2009), Massachusetts Mutual Life Insurance Company; Vice President and Secretary (since 2010), Assistant Secretary (2009-2010), CI Subsidiary Trust and PI Subsidiary Trust. |
James M. Roy (51) Babson Capital Corporate Investors 1500 Main Street P.O. Box 15189 Springfield, MA 01115-5189 | Vice President and Chief Financial Officer | Since 2005 | Treasurer (2003-2005), Associate Treasurer (1999-2003) of the Trust; Vice President and Chief Financial Officer (since 2005), Treasurer (2003-2005), Associate Treasurer (1999-2003), Babson Capital Participation Investors; Managing Director (since 2005), Director (2000-2005), Babson Capital; and Trustee (since 2005), Treasurer (since 2005), Controller (2003-2005), CI Subsidiary Trust and PI Subsidiary Trust. |
Melissa M. LaGrant (40) Babson Capital Corporate Investors 1500 Main Street P.O. Box 15189 Springfield, MA 01115-5189 | Chief Compliance Officer | Since 2006 | Chief Compliance Officer (since 2006), Babson Capital Participation Investors; Chief Compliance Officer (since 2013), Babson Capital Finance LLC; Chief Compliance Officer (since 2013), Babson Capital Funds Trust; Chief Compliance Officer (since 2012), Babson Capital Global Short Duration High Yield Fund; Managing Director (since 2005), Babson Capital; Vice President and Senior Compliance Trading Manager (2003-2005), Loomis, Sayles & Company, L.P.; and Assistant Vice President-Business Risk Management Group (2002-2003), Assistant Vice President-Investment Compliance (2001-2002), Zurich Scudder Investments/Deutsche Asset Management. |
Daniel J. Florence (41) Babson Capital Corporate Investors 1500 Main Street P.O. Box 15189 Springfield, MA 01115-5189 | Treasurer | Since 2008 | Associate Treasurer (2006-2008) of the Trust; Treasurer (since 2008), Associate Treasurer (2006-2008), Babson Capital Participation Investors; and Director (since 2013), Associate Director (2008-2013), Analyst (2000-2008), Babson Capital. |
* | Officers hold their position with the Trust until a successor has been duly elected and qualified. Officers are generally elected annually by the Board of Trustees of the Trust. The officers were last elected on July 24, 2013. |
52
2013 Annual Report
OFFICERS OF THE TRUST
Name (Age), Address | Position With The Trust | Office Term / Length of Time Served | Principal Occupations During Past 5 Years |
Sean Feeley (46) Babson Capital Corporate Investors 1500 Main Street P.O. Box 15189 Springfield, MA 01115-5189 | Vice President | Since 2011 | Vice President (since 2011), Babson Capital Participation Investors; Vice President (since 2012), Babson Capital Global Short Duration High Yield Fund; Managing Director (since 2003), Babson Capital; and Vice President (since 2011), CI Subsidiary Trust and PI Subsidiary Trust. |
Michael P. Hermsen (53) Babson Capital Corporate Investors 1500 Main Street P.O. Box 15189 Springfield, MA 01115-5189 | Vice President | Since 1998 | Vice President (since 1998), Babson Capital Participation Investors; Managing Director (since 2000), Babson Capital; Vice President (since 2005), CI Subsidiary Trust and PI Subsidiary Trust; Chief Executive Officer (since 2013), Babson Capital Finance LLC; Director (since 2009), Babson Capital Asia Limited; and Director (since 2009), Babson Capital Australia Holding Company Pty. Ltd. and Babson Capital Australia Pty. Ltd. |
Richard E. Spencer, II (51) Babson Capital Corporate Investors 1500 Main Street P.O. Box 15189 Springfield, MA 01115-5189 | Vice President | Since 2002 | Vice President (since 2002), Babson Capital Participation Investors; Managing Director (since 2000), Babson Capital; and Vice President (since 2005), CI Subsidiary Trust and PI Subsidiary Trust. |
* | Officers hold their position with the Trusts until a successor has been duly elected and qualified. Officers are generally elected annually by the Board of Trustees of each Trust. The officers were last elected on July 24, 2013. |
53
This page left intentionally blank.
54
2013 Annual Report
This page left intentionally blank.
56
Members of the Board of Trustrees | DIVIDEND REINVESTMENT AND SHARE PURCHASE PLAN |
William J. Barrett President, W J Barrett Associates, Inc. | Babson Capital Corporate Investors (the “Trust”) offers a Dividend Reinvestment and Share Purchase Plan (the “Plan”). The Plan provides a simple way for shareholders to add to their holdings in the Trust through the receipt of dividend shares issued by the Trust or through the investment of cash dividends in Trust shares purchased in the open market. A shareholder may join the Plan by filling out and mailing an authorization card to DST Systems, Inc., the Transfer Agent. Participating shareholders will continue to participate until they notify the Transfer Agent, in writing, of their desire to terminate participation. Unless a shareholder elects to participate in the Plan, he or she will, in effect, have elected to receive dividends and distributions in cash. Participating shareholders may also make additional contributions to the Plan from their own funds. Such contributions may be made by personal check or other means in an amount not less than $10 nor more than $5,000 per quarter. Cash contributions must be received by the Transfer Agent at least five days (but no more then 30 days) before the payment date of a dividend or distribution. Whenever the Trust declares a dividend payable in cash or shares, the Transfer Agent, acting on behalf of each participating shareholder, will take the dividend in shares only if the net asset value is lower than the market price plus an estimated brokerage commission as of the close of business on the valuation day. The valuation day is the last day preceding the day of dividend payment. When the dividend is to be taken in shares, the number of shares to be received is determined by dividing the cash dividend by the net asset value as of the close of business on the valuation date or, if greater than net asset value, 95% of the closing share price. If the net asset value of the shares is higher than the market value plus an estimated commission, the Transfer Agent, consistent with obtaining the best price and execution, will buy shares on the open market at current prices promptly after the dividend payment date. The reinvestment of dividends does not, in any way, relieve participating shareholders of any federal, state or local tax. For federal income tax purposes, the amount reportable in respect of a dividend received in newly-issued shares of the Trust will be the fair market value of the shares received, which will be reportable as ordinary income and/or capital gains. As compensation for its services, the Transfer Agent receives a fee of 5% of any dividend and cash contribution (in no event in excess of $2.50 per distribution per shareholder.) Any questions regarding the Plan should be addressed to DST Systems, Inc., Agent for Babson Capital Corporate Investors’ Dividend Reinvestment and Share Purchase Plan, P.O. Box 219086, Kansas City, MO 64121-9086. | |||
Michael H. Brown* Private Investor | ||||
Barbara M. Ginader Private Investor | ||||
Edward P. Grace President Phelps Grace International, Inc. | ||||
Robert E. Joyal Retired President, Babson Capital Management LLC | ||||
Clifford M. Noreen President, Babson Capital Management LLC |
Susan B. Sweeney* Senior Vice President and Chief Investment Officer Selective Insurance Company of America | Officers | ||||||
Clifford M. Noreen | Michael L. Klofas | James M. Roy | |||||
Chairman | President | Vice President & | |||||
Chief Financial Officer | |||||||
Christopher A. DeFrancis | Sean Feeley | Michael P. Hermsen | |||||
Vice President, Secretary | Vice President | Vice President | |||||
& Chief Legal Officer | |||||||
Maleyne M. Syracuse* | |||||||
Private Investor | Richard E. Spencer, II | Daniel J. Florence | Melissa M. LaGrant | ||||
Vice President | Treasurer | Chief Compliance Officer | |||||
*Member of the Audit Committe
B a b s o n C a p i t a l CORPORATE INVESTORS 2013 Annual Report | |||
CI6369 | |||
ITEM 2. CODE OF ETHICS.
The Registrant adopted a Code of Ethics for Senior Financial Officers (the "Code") on October 17, 2003, which is available on the Registrant's website at www.babsoncapital.com/mci. During the period covered by this Form N-CSR, there were no amendments to, or waivers from, the Code.
ITEM 3. AUDIT COMMITTEE FINANCIAL EXPERT.
The Registrant's Board of Trustees has determined that Mr. Michael H. Brown, a Trustee of the Registrant and a member of its Audit Committee, is an audit committee financial expert. Mr. Brown is "independent" for purposes of this Item 3 as required by applicable regulation.
ITEM 4. PRINCIPAL ACCOUNTANT FEES AND SERVICES.
Fees Billed to the Registrant
KPMG LLP | KPMG LLP | |||||||
Year Ended | Year Ended | |||||||
December 31, | December 31, | |||||||
2013 | 2012 | |||||||
Audit Fees | $ | 64,500 | $ | 61,500 | ||||
Audit-Related Fees | 0 | 0 | ||||||
Tax Fees | 46,200 | 44,100 | ||||||
All Other Fees | 0 | 0 | ||||||
Total Fees | $ | 110,700 | $ | 105,600 |
Non-Audit Fees Billed to Babson Capital and MassMutual
KPMG LLP | KPMG LLP | |||||||
Year Ended | Year Ended | |||||||
December 31, | December 31, | |||||||
2013 | 2012 | |||||||
Audit-Related Fees | $ | 971,856 | $ | 685,475 | ||||
Tax Fees | 75,000 | 93,100 | ||||||
All Other Fees | 0 | 0 | ||||||
Total Fees | $ | 1,046,856 | $ | 778,575 |
The category "Audit-Related Fees" reflects fees billed by KPMG for various non-audit and non-tax services rendered to the Registrant, Babson Capital Management LLC ("Babson Capital"), and Massachusetts Mutual Life Insurance Company ("MassMutual"), such as SOC-1 review, consulting and agreed upon procedures reports. Preparation of Federal, state and local income tax returns and tax compliance work are representative of the fees reported in the "Tax Fees" category. The category "All Other Fees" represents fees billed by KPMG for consulting rendered to Babson Capital and MassMutual. The Sarbanes-Oxley Act of 2002 and its implementing regulations allows the Registrant's Audit Committee to establish a pre-approval policy for certain services rendered by the Registrant's independent accountants. During 2013, the Registrant's Audit Committee approved all of the services rendered to the Registrant by KPMG and did not rely on such a pre-approval policy for any such services.
The Audit Committee has also reviewed the aggregate fees billed for professional services rendered by KPMG for 2012 and 2013 for the Registrant and for the non-audit services provided to Babson Capital, and Babson Capital's parent, MassMutual. As part of this review, the Audit Committee considered whether the provision of such non-audit services was compatible with maintaining the principal accountant's independence.
The 2012 fees billed represent final 2012 amounts, which may differ from the preliminary figures available as of the filing date of the Registrant's 2012 Annual Form N-CSR and includes, among other things, fees for services that may not have been billed as of the filing date of the Registrant's 2012 Annual Form N-CSR, but are now properly included in the 2012 fees billed to the Registrant, Babson Capital and MassMutual.
ITEM 5. AUDIT COMMITTEE OF LISTED REGISTRANTS.
The Registrant maintains an Audit Committee composed exclusively of Trustees of the Registrant who qualify as "independent" Trustees under the current listing standards of the New York Stock Exchange and the rules of the U.S. Securities and Exchange Commission. The Audit Committee operates pursuant to a written Audit Committee Charter, which is available (1) on the Registrant's website, www.babsoncapital.com/mci; and (2) without charge, upon request, by calling, toll-free 866-399-1516. The current members of the Audit Committee are Michael H. Brown, Susan B. Sweeney and Maleyne M. Syracuse.
ITEM 6. SCHEDULE OF INVESTMENTS
A schedule of investments for the Registrant is included as part of this report to shareholders under Item 1 of this Form N-CSR.
ITEM 7. | DISCLOSURE OF PROXY VOTING POLICIES AND PROCEDURES FOR CLOSED-END MANAGEMENT INVESTMENT COMPANIES. |
Summary of Babson Capital’s Proxy Voting Policy:
Babson Capital views the voting of proxies as an integral part of its investment management responsibility and believes, as a general principle, that proxies should be acted upon (voted or abstained) solely in the best interest of its clients (i.e. in a manner it believes is most likely to enhance the economic value of the underlying securities held in client accounts). To implement this general principle, Babson Capital engages a proxy service provider (the “Service Provider”) that is responsible for processing and maintaining records of proxy votes. In addition, the Service Provider will retain the services of an independent third party research provider (the “Research Provider”) to provide research and recommendations on proxies. Babson Capital’s Proxy Voting Policy is generally to vote proxies in accordance with the recommendations of the Research Provider. In circumstances where the Research Provider has not provided recommendations with respect to a proxy, Babson Capital will vote in accordance with the Research Provider’s proxy voting guidelines (the “Guidelines”). In circumstances where the Research Provider has not provided a recommendation or has not contemplated an issue within its Guidelines, the proxy will be analyzed on a case-by-case basis.
Babson Capital recognizes that there may be times when it is in the best interest of clients to vote proxies (i) against the Research Provider’s recommendations or (ii) in instances where the Research Provider has not provided a recommendation vote against the Guidelines. Babson Capital can vote, in whole or in part, against the Research Provider’s recommendations or Guidelines, as it deems appropriate. The procedures set forth in the Proxy Voting Policy are designed to ensure that votes against the Research Provider’s recommendations or Guidelines are made in the best interests of clients and are not the result of any material conflict of interest (a “Material Conflict”). For purposes of the Proxy Voting Policy, a Material Conflict is defined as any position, relationship or interest, financial or otherwise, of Babson Capital or a Babson Capital associate that could reasonably be expected to affect the independence or judgment concerning proxy voting.
Summary of Babson Capital’s Proxy Voting Procedures:
Babson Capital will vote all client proxies for which it has proxy voting discretion, where no Material Conflict exists, in accordance with the Research Provider’s recommendations or Guidelines, unless (i) Babson Capital is unable or determines not to vote a proxy in accordance with the Proxy Voting Policy or (ii) an authorized investment person or designee (a “Proxy Analyst”) determines that it is in the client’s best interests to vote against the Research Provider’s recommendations or Guidelines. In such cases where a Proxy Analyst believes a proxy should be voted against the Research Provider’s recommendations or Guidelines, the Proxy Administrator will vote the proxy in accordance with the Proxy Analyst’s recommendation as long as (i) no other Proxy Analyst disagrees with such recommendation and (ii) no known Material Conflict is identified by the Proxy Analyst(s) or the Proxy Administrator. If a Material Conflict is identified by a Proxy Analysis or the Proxy Administrator, the proxy will be submitted to the Trading Practices Committee to determine how the proxy is to be voted in order to achieve that client’s best interests.
No associate, officer, director or board of managers/directors of Babson Capital or its affiliates (other than those assigned such responsibilities under the Proxy Voting Policy) can influence how Babson Capital votes client proxies, unless such person has been requested to provide assistance by a Proxy Analyst or Trading Practices Committee member and has disclosed any known Material Conflict. Pre-vote communications are prohibited. In the event that pre-vote communications occur, it should be reported to the Trading Practices Committee or Babson Capital’s Chief Compliance Officer or General Counsel prior to voting. Any questions or concerns regarding proxy-solicitor arrangements should be addressed to Babson Capital’s Chief Compliance Officer and/or General Counsel.
Investment management agreements generally delegate the authority to vote proxies to Babson Capital in accordance with Babson Capital’s Proxy Voting Policy. In the event an investment management agreement is silent on proxy voting, Babson Capital should obtain written instructions from the client as to their voting preference. However, when the client does not provide written instructions as to their voting preferences, Babson Capital will assume proxy voting responsibilities. In the event that a client makes a written request regarding voting, Babson Capital will vote as instructed.
Obtaining a Copy of the Proxy Voting Policy:
Clients may obtain a copy of Babson Capital’s Proxy Voting Policy and information about how Babson Capital voted proxies related to their securities, free of charge, by contacting the Chief Compliance Officer, Babson Capital Management LLC, 1500 Main Street, Suite 2800, P.O. Box 15189, Springfield, MA 01115-5189, or calling toll-free, 1-877-766-0014.
ITEM 8. | PORTFOLIO MANAGERS OF CLOSED-END MANAGEMENT INVESTMENT COMPANIES. |
The following disclosure item is made as of the date of this Form N-CSR unless otherwise indicated.
PORTFOLIO MANAGER. Michael L. Klofas serves as the President of the Registrant (since 2009) and as one of its Portfolio Managers. Mr. Klofas began his service to the Registrant in 1998 as a Vice President. With over 25 years of industry experience, Mr. Klofas is a Managing Director of the Mezzanine and Private Equity Group of Babson Capital Management LLC ("Babson Capital"). Mr. Klofas joined MassMutual in 1988. Prior to joining MassMutual, he spent two years at a small venture capital firm and two years at a national public accounting firm. At MassMutual and then Babson Capital, Mr. Klofas has analyzed and invested in traditional private placements and high yield public bonds. He also spent four years leading Babson Capital's workout and restructuring activities. Since 1993, he has focused on originating, analyzing, structuring and documenting mezzanine and private equity investments. Mr. Klofas holds a B.A. from Brandeis University and an M.B.A. from Babson College. He is also a Certified Public Accountant and a Chartered Financial Analyst. Mr. Klofas also presently serves as President of Babson Capital Participation Investors, another closed-end management investment company advised by Babson Capital.
PORTFOLIO MANAGEMENT TEAM. Mr. Klofas has primary responsibility for overseeing the investment of the Registrant's portfolio, with the day-to-day investment management responsibility of the Registrant's portfolio being shared with the following Babson Capital investment professionals (together with the Portfolio Manager, the "Portfolio Team").
Michael P. Hermsen is a Vice President of the Registrant and a Managing Director of Babson Capital who oversees the Babson Capital Finance Group, which assists in finding, analyzing, negotiating and servicing mezzanine private placement securities for the Registrant.
Mr. Hermsen joined MassMutual in 1990 and has been an officer of the Registrant since 1998. Previously, he worked at Teachers Insurance and Annuity Association where he was a generalist private placement analyst. At MassMutual and then Babson Capital, Mr. Hermsen has analyzed and invested in traditional private placements, high yield public and private bonds, and leveraged bank loans. He has also been responsible for managing a small portfolio of distressed investments. Since 1993, he has focused on originating, analyzing, structuring and documenting mezzanine and private equity investments. He holds a B.A. from Bowdoin College and an M.B.A. from Columbia University. Mr. Hermsen is a Chartered Financial Analyst.
Mr. Spencer is a Vice President of the Registrant and a Managing Director of Babson Capital who also manages Babson Capital's Fund Investment and Advisory Group. Mr. Spencer joined MassMutual in 1989 after three years as a corporate loan analyst at a major New England bank. He has been an officer of the Registrant since 2002. At MassMutual and then Babson Capital, Mr. Spencer has analyzed and invested in traditional private placements, high yield public and private bonds, leveraged bank loans, mezzanine debt and private equity. From 1993 to 1999, he was the lead restructuring professional at Babson Capital. Since 1999, Mr. Spencer has been focused on the origination, analysis, structuring and documentation of mezzanine and private equity investments. He holds a B.A. from Bucknell University and an M.B.A. from the State University of New York at Buffalo. Mr. Spencer is a Chartered Financial Analyst.
Sean Feeley is responsible for the day-to-day management of the Registrant’s public high yield and investment grade fixed income portfolio. Mr. Feeley has been a Vice President of the Registrant since 2011. Mr. Feeley is a Managing Director of Babson Capital and head of the High Yield Research Team with over 22 years of industry experience in high yield bonds and loans in various investment strategies. Prior to joining Babson Capital in 2003, he was a Vice President at Cigna Investment Management in project finance and a Vice President at Credit Suisse in leveraged loan finance. Mr. Feeley holds a B.S. from Canisius College and an M.B.A. from Cornell University. Mr. Feeley is a Certified Public Accountant and a Chartered Financial Analyst.
OTHER ACCOUNTS MANAGED BY THE PORTFOLIO TEAM. The members of the Registrant's Portfolio Team also have primary responsibility for the day-to-day management of other Babson Capital advisory accounts, including, among others, closed-end and open-end investment companies, private investment funds, MassMutual-affiliated accounts, as well as separate accounts for institutional clients. These advisory accounts are identified below.
NUMBER OF | ||||||||||
ACCOUNTS | APPROXIMATE | |||||||||
TOTAL | WITH | ASSET SIZE OF | ||||||||
NUMBER | APPROXIMATE | PERFORMANCE- | PERFORMANCE- | |||||||
PORTFOLIO | ACCOUNT | OF | TOTAL ASSET | BASED | BASED ADVISORY | |||||
TEAM | CATEGORY | ACCOUNTS | SIZE (A) | ADVISORY FEE | FEE ACCOUNTS (A) | |||||
Registered | 1 | $131.4 million | 0 | N/A | ||||||
Clifford M. | Investment | |||||||||
Noreen (B) | Companies | |||||||||
Other Pooled | 9 | $1.03 billion | 9 | $1.03 billion | ||||||
Investment | ||||||||||
Vehicles | ||||||||||
Other | 0 | N/A | 0 | N/A | ||||||
Accounts (C) | ||||||||||
Registered | 5 | $1.23 billion | 0 | N/A | ||||||
Sean | Investment | |||||||||
Feeley | Companies | |||||||||
Other Pooled | 3 | $176.2 million | 3 | $176.2 million | ||||||
Investment | ||||||||||
Vehicles | ||||||||||
Other | 6 | $2.88 billion | 6 | $2.88 billion | ||||||
Accounts (C) | ||||||||||
Registered | 1 | $131.4 million | 0 | N/A | ||||||
Michael P. | Investment | |||||||||
Hermsen (D) | Companies | |||||||||
Other Pooled | 7 | $1.36 billion | 7 | $1.36 billion | ||||||
Investment | ||||||||||
Vehicles | ||||||||||
Other | 0 | N/A | 0 | N/A | ||||||
Accounts (E) | ||||||||||
Registered | 1 | $131.4 million | 0 | N/A | ||||||
Michael L. | Investment | |||||||||
Klofas | Companies | |||||||||
Other Pooled | 6 | $1.34 billion | 6 | $1.34 billion | ||||||
Investment | ||||||||||
Vehicles | ||||||||||
Other | 0 | N/A | 0 | N/A | ||||||
Accounts (E) | ||||||||||
Registered | 1 | $131.4 million | 0 | N/A | ||||||
Richard E. | Investment | |||||||||
Spencer, II | Companies | |||||||||
Other Pooled | 0 | N/A | 0 | N/A | ||||||
Investment | ||||||||||
Vehicles | ||||||||||
Other | 0 | N/A | 0 | N/A | ||||||
Accounts (E) |
(A) | Account asset size has been calculated as of December 31, 2013. |
(B) | Mr. Noreen, as head of Babson Capital’s Private Investments and Equity Group, has overall responsibility for all fixed income portfolios comprised mainly of investment grade assets managed by Babson Capital. Except for the accounts noted in the table above, Mr. Noreen is not primarily responsible for the day-to-day management of the other accounts managed by Babson Capital’s Private Investments and Equity Group. |
(C) | Messrs. Noreen and Feeley have investment discretion over certain sectors of the general investment account of Massachusetts Mutual Life Insurance Company and C.M. Life Insurance Company (the “GIA”). However, since neither Messrs. Noreen nor Feeley are considered primary portfolio managers of the GIA, these assets are not represented in the table above. |
(D) | Mr. Hermsen, as head of the Babson Capital Finance Group, has overall responsible for public and private bonds, mezzanine and private equity investments. |
(E) | Messrs. Hermsen, Klofas and Spencer manage private placement mezzanine debt securities for the GIA. However, since neither Messrs. Hermsen, Klofas nor Spencer are considered primary portfolio managers of the GIA, these assets are not represented in the table above. |
MATERIAL CONFLICTS OF INTEREST. The potential for material conflicts of interest may exist as the members of the Portfolio Management Team, have responsibilities for the day-to-day management of multiple advisory accounts. These conflicts may be heightened to the extent the individual, Babson Capital and/or an affiliate has an investment in one or more of such accounts. Babson Capital has identified (and summarized below) areas where material conflicts of interest are most likely to arise, and has adopted policies and procedures that it believes are reasonable designed to address such conflicts.
Transactions with Affiliates: Babson Capital or its affiliates, including MassMutual and its affiliates, may from time to time, acting as principal, buy securities or other investments for itself from or sell securities or other investments it owns to its advisory clients. Likewise, Babson Capital may either directly or on behalf of MassMutual, purchase and/or hold securities or other investments that are subsequently sold or transferred to advisory clients. Babson Capital has a conflict of interest in connection with a transaction where it or an affiliate is acting as principal since it may have an incentive to favor itself or its affiliates over its advisory clients in connection with the transaction. To address these conflicts of interest, Babson Capital has adopted a Transactions with Affiliates Policy, which ensures any such transaction is consistent with Babson Capital’s fiduciary obligations to act in the best interests of its clients, including its ability to obtain best execution in connection with the transaction, and is in compliance with applicable legal and regulatory requirements.
Cross Trades: Babson Capital may effect cross-trades on behalf of its advisory clients whereby one advisory client buys securities or other investments from or sells securities or other investments to another advisory client. Babson Capital may also effect cross-trades involving advisory accounts or funds in which it or its affiliates, including MassMutual, and their respective employees, have an ownership interest or for which Babson Capital is entitled to earn a performance or incentive fee. As a result, Babson Capital has a conflict of interest in connection with the cross-trade since it may have an incentive to favor the advisory client or fund in which it or its affiliate has an ownership interest and/or is entitled to a performance or incentive fee. To address these conflicts of interest, Babson Capital has adopted a Transactions with Affiliates Policy, which ensures any such cross-trade is consistent with Babson Capital’s fiduciary obligations to act in the best interests of each of its advisory clients, including its ability to obtain best execution for each advisory client in connection with the cross-trade transaction, and is in compliance with applicable legal and regulatory requirements. Babson Capital will not receive a commission or any other remuneration (other than its advisory fee) for effecting cross-trades between advisory clients.
Loan Origination Transactions: While Babson Capital or its affiliates generally do not act as an underwriter or member of a syndicate in connection with a securities offering, Babson Capital or its affiliates (or an unaffiliated entity in which Babson Capital or its affiliates has an ownership interest) may act as an underwriter, originator, agent, or member of a syndicate in connection with the origination of senior secured loans or other lending arrangements with borrowers, where such loans may be purchased by Babson Capital advisory clients during or after the original syndication. Babson Capital advisory clients may purchase such loans directly from Babson Capital or its affiliates (or an unaffiliated entity in which Babson Capital or its affiliates has an ownership interest) or from other members of the lending syndicate. Babson Capital or its affiliates may directly or indirectly receive underwriting, origination, or agent fees in connection with such loan originations. As a result, Babson Capital has a conflict of interest in connection with such loan origination transactions since it has an incentive to base its investment recommendation to its advisory clients on the amount of compensation, underwriting, origination or agent fees it would receive rather than on its advisory clients’ best interests. To address this conflict of interest, Babson Capital has adopted a Transactions with Affiliates Policy, which ensures any such transaction is consistent with Babson Capital’s fiduciary obligations to act in the best interests of its clients, including its ability to obtain best execution in connection with the transaction, and is in compliance with applicable legal and regulatory requirements.
MML Investors Services, LLC (“MMLISI”), an indirect wholly-owned subsidiary of MassMutual, is an SEC-registered broker-dealer that may act as an introducing broker for the purpose of effecting securities transactions for brokerage customers. While a Babson Capital advisory client could request that MMLISI effect securities transactions for it that would result in commissions to MMLISI, currently no Babson Capital advisory client directs Babson Capital to effect securities transactions for its account through MMLISI.
Investments by Advisory Clients: Babson Capital may invest client assets in securities or other investments that are also held by (i) Babson Capital or its affiliates, including MassMutual, (ii) other Babson Capital advisory accounts, (iii) funds or accounts in which Babson Capital or its affiliates or their respective employees have an ownership or economic interest or (iv) employees of Babson Capital or its affiliates. Babson Capital may also, on behalf of its advisory clients, invest in the same or different securities or instruments of issuers in which (i) Babson Capital or its affiliates, including MassMutual, (ii) other Babson Capital advisory accounts, (iii) funds or accounts in which Babson Capital, its affiliates, or their respective employees have an ownership or economic interest or (iv) employees of Babson Capital or its affiliates, have an ownership interest as a holder of the debt, equity or other instruments of the issuer. Babson Capital has a conflict of interest in connection with any such transaction since investments by its advisory clients may directly or indirectly benefit Babson Capital and/or its affiliates and employees by potentially increasing the value of the securities or instruments it holds in the issuer. Any investment by Babson Capital on behalf of its advisory clients will be consistent with its fiduciary obligations to act in the best interests of its advisory clients, and otherwise be consistent with such clients’ investment objectives and restrictions.
Babson Capital or its affiliates may also recommend that clients invest in registered or unregistered investment companies, including private investment funds such as hedge funds, private equity funds or structured funds (i) advised by Babson Capital or an affiliate, (ii) in which Babson Capital, an affiliate or their respective employees has an ownership or economic interest or (iii) with respect to which Babson Capital or an affiliate has an interest in the entity entitled to receive the fees paid by such funds. Babson Capital has a conflict of interest in connection with any such recommendation since it may have an incentive to base its recommendation to invest in such investment companies or private funds on the fees that Babson Capital or its affiliates would earn as a result of the investment by its advisory clients in the investment companies or private funds. Any recommendation to invest in a Babson Capital advised fund or other investment company will be consistent with Babson Capital’s fiduciary obligations to act in the best interests of its advisory clients, consistent with such clients’ investment objectives and restrictions. Babson Capital may, in certain limited circumstances, offer to clients that invest in private investment funds that it advises an equity interest in entities that receive advisory fees and carried profits interest from such funds.
Employee Co-Investment: Babson Capital may permit certain of its portfolio managers and other eligible employees to invest in certain private investment funds advised by Babson Capital or its affiliates and/or share in the performance or incentive fees received by Babson Capital from such funds. If the portfolio manager or eligible employee was responsible for both the portfolio management of the private fund and other Babson Capital advisory accounts, such person would have a conflict of interest in connection with investment decisions since the person may have an incentive to direct the best investment ideas, or to allocate trades, in favor of the fund in which he or she is invested or otherwise entitled to share in the performance or incentive fees received from such fund. To address these conflicts of interest, Babson Capital has adopted a Side by Side Management of Private Investment Funds and Other Advisory Accounts Policy which requires, among others things, that Babson Capital treat each of its advisory clients in a manner consistent with its fiduciary obligations and prohibits Babson Capital from favoring any particular advisory account as a result of the ownership or economic interests of Babson Capital, its affiliates or employees, in such advisory account. Any investment by a Babson Capital employee in one of its private funds is also governed by Babson Capital’s Employee Co-Investment Policy, which ensures that any co-investment by a Babson Capital employee is consistent with Babson Capital’s Code of Ethics.
Management of Multiple Accounts: As noted above, Babson Capital’s portfolio managers are often responsible for the day-to-day management of multiple accounts, including, among others, separate accounts for institutional clients, closed-end and open-end registered investment companies, and/or private investment funds (such as hedge funds, private equity funds and structured funds), as well as for proprietary accounts of Babson Capital and its affiliates, including MassMutual and its affiliates. The potential for material conflicts of interest exist whenever a portfolio manager has responsibility for the day-to-day management of multiple advisory accounts. These conflicts may be heightened to the extent a portfolio manager is responsible for managing a proprietary account for Babson Capital or its affiliates or where the portfolio manager, Babson Capital and/or an affiliate has an investment in one or more of such accounts or an interest in the performance of one or more of such accounts (e.g., through the receipt of a performance or incentive fee).
Investment Allocation: Such potential conflicts include those relating to allocation of investment opportunities. For example, it is possible that an investment opportunity may be suitable for more than one account managed by Babson Capital, but may not be available in sufficient quantities for all accounts to participate fully. Similarly, there may be limited opportunity to sell an investment held by multiple accounts. A conflict arises where the portfolio manager has an incentive to treat an account preferentially because the account pays Babson Capital or its affiliates a performance-based fee or the portfolio manager, Babson Capital or an affiliate has an ownership or other economic interest in the account. As noted above, Babson Capital also acts as an investment manager for certain of its affiliates, including MassMutual. These affiliate accounts co-invest jointly and concurrently with Babson Capital’s other advisory clients and therefore share in the allocation of such investment opportunities. To address these conflicts of interest associated with the allocation of trading and investment opportunities, Babson Capital has adopted an Investment Allocation Policy and trade allocation procedures that govern the allocation of portfolio transactions and investment opportunities across multiple advisory accounts, including affiliated accounts. In addition, as noted above, to address these conflicts of interest, Babson Capital has adopted a Side by Side Management of Private Investment Funds and Other Advisory Accounts Policy which requires, among others things, that Babson Capital treat each of its advisory clients in a manner consistent with its fiduciary obligations and prohibits Babson Capital from favoring any particular advisory account as a result of the ownership or economic interests of Babson Capital, its affiliates or employees, in such advisory accounts. Any investment by a Babson Capital employee in one of its private funds is also governed by Babson Capital’s Employee Co-Investment Policy, which ensures that any co-investment by a Babson Capital employee is consistent with Babson Capital’s Code of Ethics.
Personal Securities Transactions; Short Sales: Potential material conflicts of interest may also arise related to the knowledge and timing of an account’s trades, investment opportunities and broker selection. Babson Capital and its portfolio managers have information about the size, timing and possible market impact of the trades of each account they manage. It is possible that portfolio managers could use this information for their personal advantage and/or the advantage or disadvantage of various accounts which they manage. For example, a portfolio manager could, or cause a favored account to, “front run” an account’s trade or sell short a security for an account immediately prior to another accounts sale of that security. To address these conflicts, Babson Capital has adopted policies and procedures, including a Short Sales Policy, which ensures that the use of short sales by Babson Capital is consistent with Babson Capital’s fiduciary obligations to its clients, a Side by Side Management of Private Investment Funds and Other Advisory Accounts Policy, which requires, among other things, that Babson Capital treat each of its advisory clients in a manner consistent with its fiduciary obligations and prohibits Babson Capital from favoring any particular account as a result of the ownership or economic interest of Babson Capital, its affiliates or employees and a Code of Ethics.
Trade Errors: Potential material conflicts of interest may also arise if a trade error occurs in a client account. A trade error is deemed to occur if there is a deviation by Babson Capital from the applicable standard of care in connection with the placement, execution or settlement of a trade for an advisory account that results in (1) Babson Capital purchasing securities not permitted or authorized by a client’s investment advisory agreement or otherwise failing to follow a client’s specific investment directives; (2) Babson Capital purchasing or selling the wrong security or the wrong amount of securities on behalf of a client’s account; or (3) Babson Capital purchasing or selling securities for, or allocating securities to, the wrong client account. When correcting these errors, conflicts of interest between Babson Capital and its advisory accounts may arise as decisions are made on whether to cancel, reverse or reallocate the erroneous trades. In order to address these conflicts, Babson Capital has adopted an Errors Policy governing the resolution of trading errors, and will follow the Errors Policy in order to ensure that trade errors are handled promptly and appropriately and that any action taken to remedy an error places the interest of a client ahead of Babson Capital’s interest.
Best Execution; Directed Brokerage: With respect to securities transactions for most of the accounts it manages, Babson Capital determines which broker to use to execute each order, consistent with its fiduciary duty to seek best execution of the transaction. Babson Capital manages certain accounts, however, for clients who limit its discretion with respect to the selection of brokers or direct it to execute such client’s transaction through a particular broker. In these cases, trades for such an account in a particular security may be placed separately from, rather than aggregated with, those in the same security for other accounts. Placing separate transaction orders for a security may temporarily affect the market price of the security or otherwise affect the execution of the transaction to the possible detriment of one or more of the other account(s) involved. In order to address these conflicts, Babson Capital has adopted a Best Execution Policy, which establishes the necessary controls to satisfy its obligations regarding best execution and ensures it places advisory client trades in such a manner that the advisory client’s total costs or proceeds are the most favorable under the circumstances, and a Directed Brokerage Policy, which ensures all directed brokerage instructions are executed in accordance with written client instructions and applicable legal requirements.
Babson Capital and its portfolio managers or employees may have other actual or potential conflicts of interest in managing an advisory account, and the list above is not a complete description of every conflict of interest that could be deemed to exist.
COMPENSATION. The current Babson Capital compensation and incentive program for investment professionals is designed to attract, motivate and retain high-performing individuals.
To help Babson Capital make informed decisions, Babson Capital participates in annual compensation surveys of investment management firms using McLagan | Aon Hewitt, in addition to other industry specific resources. The firms selected for periodic peer-group comparisons typically have similar asset size or business mix. Annually, a review is conducted of total compensation versus market, to ensure that individual pay is competitive with the defined overall market.
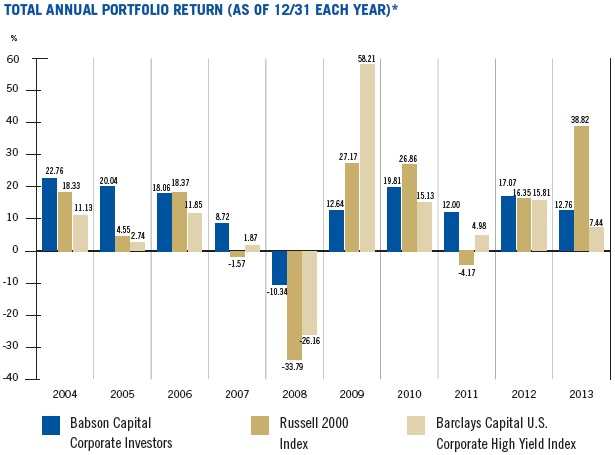
The compensation package for the members of the Portfolio Team is comprised of a market-driven base salary, a performance-driven annual bonus, and discretionary long-term incentives. The performance-driven annual bonus is based on the overall performance of Babson Capital as well as the performance of the accounts managed by the members of the Portfolio Team relative to appropriate benchmarks, including with respect to the Registrant, to the Russell 2000 Index and Barclays Capital U.S. Corporate High Yield Index. Performance of the Registrant, like other accounts Portfolio Team members manage, are evaluated on a pre-tax basis, and are reviewed over one and three-year periods, with greater emphasis given to the latter. There are other factors that affect bonus awards to a lesser extent, such as client satisfaction, teamwork, employee individual performance in relation to pre-determined goals, and the assets under management. Such factors are considered as a part of the overall annual bonus evaluation process by the management of Babson Capital.
Long-Term incentives are designed to share with participants the longer-term value created in Babson Capital. Long-term incentives may take the form of deferred cash awards (including deferred cash awards that provide a portfolio manager with the economic equivalent of a "shareholder" interest in Babson Capital by linking the value of the award to a formula which is meant to represent the value of the business), and/or, in the case of a portfolio manager who manages a private investment fund with a performance fee, a deferred cash award or a direct profit sharing interest that results in the portfolio manager receiving amounts based on the amount of the performance fee paid by such fund. These long-term incentives vest over time and are granted annually, based upon the same criteria used to determine the performance-driven annual bonus detailed above. Because the Portfolio Team members are generally responsible for multiple accounts (including the Registrant), they are compensated on the overall performance of the accounts that they manage, rather than a specific account, except for the portion of compensation relating to any performance fee award.
BENEFICIAL OWNERSHIP. As of December 31, 2013, members of the Portfolio Team beneficially owned the following dollar range of equity securities in the Registrant:
Portfolio Team: | Dollar Range of Beneficially Owned* Equity Securities of the Registrant: |
Clifford M. Noreen | Over $1,000,000 |
Sean Feeley | None |
Michael P. Hermsen | $100,001-$500,000 |
Michael L. Klofas | $100,001-$500,000 |
Richard E. Spencer II | $10,001-$50,000 |
* | Beneficial ownership has been determined in accordance with Rule 16a-1(a)(2) under the Securities Exchange Act of 1934, as amended. (Shares "beneficially owned" include the number of shares of the Registrant represented by the value of a Registrant-related investment option under Babson Capital's non-qualified deferred compensation plan for certain officers of Babson Capital (the "Plan"). The Plan has an investment option that derives its value from the market value of the Registrant's shares. However, neither the Plan nor the participation in the Plan has an actual ownership interest in the Registrant's shares.) |
ITEM 9. | PURCHASES OF EQUITY SECURITIES BY CLOSED-END MANAGEMENT INVESTMENT COMPANY AND AFFILIATED PURCHASERS. |
Not applicable for this filing.
ITEM 10. SUBMISSION OF MATTERS TO A VOTE OF SECURITY HOLDERS.
Not applicable for this filing.
ITEM 11. CONTROLS AND PROCEDURES.
(a) | The principal executive officer and principal financial officer of the Registrant evaluated the effectiveness of the Registrant's disclosure controls and procedures (as defined in Rule 30a-3(c) under the Investment Company Act of 1940 (the "Act")) as of a date within 90 days of the filing date of this report and based on that evaluation have concluded that such disclosure controls and procedures are effective to provide reasonable assurance that material information required to be disclosed by the Registrant on Form N-CSR is recorded, processed, summarized and reported within the time periods specified in the Securities and Exchange Commission's rules and forms. |
(b) | There were no changes in the Registrant's internal control over financial reporting (as defined in Rule 30a-3(d) under the Act) during the Registrant's second fiscal half year that have materially affected, or are reasonably likely to materially affect, the Registrant's internal control over financial reporting. |
ITEM 12. EXHIBITS.
(a)(1) | ANY CODE OF ETHICS, OR AMENDMENTS THERETO, THAT IS THE SUBJECT OF DISCLOSURE REQUIRED BY ITEM 2, TO THE EXTENT THAT THE REGISTRANT INTENDS TO SATISFY THE ITEM 2 REQUIREMENTS THROUGH THE FILING OF AN EXHIBIT. |
None.
(a)(2) | A SEPARATE CERTIFICATION FOR EACH PRINCIPAL EXECUTIVE OFFICER AND PRINCIPAL FINANCIAL OFFICER OF THE REGISTRANT AS REQUIRED BY RULE 30a-2 UNDER THE ACT. |
Attached hereto as EX-99.31.1
Attached hereto as EX-99.31.2
(a)(3) | ANY WRITTEN SOLICITATION TO PURCHASE SECURITIES UNDER RULE 23c-1 UNDER THE ACT (17 CFR 270.23c-1) SENT OR GIVEN DURING THE PERIOD COVERED BY THE REPORT BY OR ON BEHALF OF THE REGISTRANT TO 10 OR MORE PERSONS. |
Not applicable for this filing.
(b) | CERTIFICATIONS PURSUANT TO RULE 30a-2(b) UNDER THE ACT. |
Attached hereto as EX-99.32
SIGNATURES
Pursuant to the requirements of the Securities Exchange Act of 1934 and the Investment Company Act of 1940, the Registrant has duly caused this report to be signed on its behalf by the undersigned, thereunto duly authorized.
(Registrant): | Babson Capital Corporate Investors | |
By: | /s/ Michael L. Klofas | |
Michael L. Klofas, President | ||
Date: | March 7, 2014 | |
Pursuant to the requirements of the Securities Exchange Act of 1934 and the Investment Company Act of 1940, this report has been signed below by the following persons on behalf of the Registrant and in the capacities and on the dates indicated.
By: | /s/ Michael L. Klofas | |
Michael L. Klofas, President | ||
Date: | March 7, 2014 | |
By: | /s/ James M. Roy | |
James M. Roy, Vice President and Chief Financial Officer | ||
Date: | March 7, 2014 |