Adviser
Barings LLC
1500 Main Street, P.O. Box 15189
Springfield, Massachusetts 01115-5189
Independent Registered Public Accounting Firm
KPMG LLP
Boston, Massachusetts 02110
Counsel to the Trust
Ropes & Gray LLP
Boston, Massachusetts 02110
Custodian
State Street Bank and Trust Company
Boston, Massachusetts 02116
Transfer Agent & Registrar
DST Systems, Inc.
P.O. Box 219086
Kansas City, Missouri 64121-9086
1-800-647-7374
Internet Website
www.barings.com/mci
| Barings Corporate Investors c/o Barings LLC 1500 Main Street, Suite 2200 Springfield, Massachusetts 01115 (413) 226-1516 |
Investment Objective and Policy
Barings Corporate Investors (the "Trust") is a closed-end management investment company, first offered to the public in 1971, whose shares are traded on the New York Stock Exchange under the trading symbol "MCI". The Trust's share price can be found in the financial section of most newspapers under either the New York Stock Exchange listings or Closed-End Fund Listings.
The Trust's investment objective is to maintain a portfolio of securities providing a current yield and at the same time offering an opportunity for capital gains. The Trust's principal investments are privately placed, below-investment grade, long-term debt obligations. Such direct placement securities may, in some cases, be accompanied by equity features such as common stock, warrants, conversion rights, or other equity features and, occasionally, preferred stocks. The Trust typically purchases these investments, which are not publicly tradable, directly from their issuers in private placement transactions. These investments are typically mezzanine debt instruments with accompanying private equity securities made to small or middle market companies. In addition, the Trust may invest, subject to certain limitations, in marketable investment grade debt securities, other marketable debt securities (including high yield securities) and marketable common stocks. Below-investment grade or high yield securities have predominantly speculative characteristics with respect to the capacity of the issuer to pay interest and repay principal.
Barings LLC ("Barings") manages the Trust on a total return basis. The Trust distributes substantially all of its net income to shareholders each year. Accordingly, the Trust pays dividends to shareholders in January, May, August, and November. The Trust pays dividends to its shareholders in cash, unless the shareholder elects to participate in the Dividend Reinvestment and Share Purchase Plan.
Form N-Q
The Trust files its complete schedule of portfolio holdings with the U.S. Securities and Exchange Commission ("SEC") for the first and third quarters of each fiscal year on Form N-Q. This information is available (i) on the SEC's website at http://www.sec.gov; and (ii) at the SEC's Public Reference Room in Washington, DC (which information on their operation may be obtained by calling 1-800-SEC-0330). A complete schedule of portfolio holdings as of each quarter-end is available upon request by calling, toll-free, 866-399-1516.
Proxy Voting Policies & Procedures; Proxy Voting Record
The Trustees of the Trust have delegated proxy voting responsibilities relating to the voting of securities held by the Trust to Barings. A description of Barings' proxy voting policies and procedures is available (i) without charge, upon request, by calling, toll-free 866-399-1516; (ii) on the Trust's website: www.barings.com/mci; and (iii) on the SEC's website at http://www.sec.gov. Information regarding how the Trust voted proxies relating to portfolio securities during the most recent 12-month period ended June 30 is available (i) on the Trust's website: www.barings.com/mci; and (ii) on the SEC's website at http://www.sec.gov.
Legal Matters
The Trust has entered into contractual arrangements with an investment adviser, transfer agent and custodian (collectively, "service providers") who each provide services to the Trust. Shareholders are not parties to, or intended beneficiaries of, these contractual arrangements, and these contractual arrangements are not intended to create any shareholder right to enforce them against the service providers or to seek any remedy under them against the service providers, either directly or on behalf of the Trust.
Under the Trust's Bylaws, any claims asserted against or on behalf of the Trust, including claims against Trustees and officers must be brought in courts located within the Commonwealth of Massachusetts.
The Trust's registration statement and this shareholder report are not contracts between the Trust and its shareholders and do not give rise to any contractual rights or obligations or any shareholder rights other than any rights conferred explicitly by federal or state securities laws that may not be waived.
Barings Corporate Investors
TO OUR SHAREHOLDERS
July 31, 2017
We are pleased to present the June 30, 2017 Quarterly Report of Barings Corporate Investors (the "Trust").
The Board of Trustees declared a quarterly dividend of $0.30 per share, payable on August 11, 2017 to shareholders of record on August 1, 2017. The Trust paid a $0.30 per share dividend for the preceding quarter. The Trust earned $0.34 per share of net investment income, including $0.04 per share of non-recurring income for the second quarter of 2017, compared to $0.33 per share, including $0.04 per share of non-recurring income, in the previous quarter.
During the second quarter, the net assets of the Trust increased to $302,454,098 or $15.22 per share compared to $292,381,934 or $14.74 per share on March 31, 2017. This translates into a 5.4% total return for the quarter, based on the change in the Trust's net assets assuming the reinvestment of all dividends. Longer term, the Trust returned 14.1%, 10.1%, 12.7%, 10.5%, and 13.7% for the 1, 3, 5, 10, and 25-year periods, respectively, based on the change in the Trust's net assets assuming the reinvestment of all dividends.
The Trust's share price decreased 1.2% during the quarter, from $15.27 per share as of March 31, 2017 to $15.09 per share as of June 30, 2017. The Trust's market price of $15.09 per share equates to a 0.9% discount to the June 30, 2017 net asset value per share of $15.22. The Trust's average quarter-end premium for the 3, 5 and 10-year periods was 9.8%, 13.6% and 12.5%, respectively. U.S. equity markets, as approximated by the Russell 2000 Index, increased 2.5% for the quarter. U.S. fixed income markets, as approximated by the Barclays Capital U.S. Corporate High Yield Index, increased 2.2% for the quarter.
The Trust closed three new private placement investments during the second quarter. The three new investments were in BEI Precision Systems & Space Company, Inc., English Color & Supply LLC and Whitebridge Pet Brands Holdings, LLC. A brief description of these investments can be found in the Consolidated Schedule of Investments. The total amount invested by the Trust in these transactions was $10,305,000.
Middle market transaction activity continued to be below expectations in the second quarter. While overall middle market loan volume increased 2% compared to the first quarter of 2017 and 7% compared to the comparable quarter in 2016, the increase was primarily driven by refinancing activity as new money volume (an indicator of M&A activity) was down 5% from the first quarter. More importantly, it was the larger end of the middle market that posted the quarter-over-quarter and year-over-year growth. Lending activity in the "traditional middle market", the primary market segment in which the Trust invests, was down 13% compared to the first quarter of 2017 and 20% lower than the comparable quarter of 2016 (source: Thomson Reuters LPC Middle Market Weekly – July 14, 2017). Exacerbating the low M&A activity is the continuation of hyper-competitive market conditions driven by the increasing abundance of debt capital available to borrowers. While deal flow remains stable and we continue to actively pursue new investment opportunities on behalf of the Trust, we do so cautiously in order to generate attractive investment returns without taking inappropriate levels of risk, a strategy that has served us well over the years.
The Trust's remaining portfolio remains in good condition with the number of companies on our watch list and/or in default remaining stable and at acceptable levels. Furthermore, the majority of the underlying companies in the portfolio generally demonstrated stable to improving financial performance during the quarter. Five private companies in which the Trust had outstanding investments were sold during the quarter resulting in favorable outcomes. In addition, three companies prepaid a portion or all of their subordinated debt held by the Trust. At quarter-end there were eleven companies in which the Trust had outstanding investments which were in an active sale process. We would expect these companies to be sold over the next few quarters.
The Trust was able to maintain its $0.30 per share quarterly dividend in the second quarter. For the first time since 2013, the Trust's recurring investment income was sufficient to maintain the quarterly dividend and required no supplementation from non-recurring income to do so. As discussed in prior reports, since 2013 recurring investment income alone had not been sufficient to fully fund the current dividend rate principally due to the considerable reduction in the number of private debt securities in the portfolio resulting from the high level of exits and prepayment activity that occurred from 2013 through 2015, combined with generally lower investment returns available due to market and competitive dynamics over the past several years. Over the past several quarters many of the investments exited by the Trust in privately held companies were in non-interest bearing securities, while the majority of the Trust's new investments in privately held companies have been in interest bearing debt securities. Thus, recurring investment
(Continued)
1
income was sufficient to fund the current quarterly dividend. The level of expected recurring investment income generated by the Trust in 2017, combined with the availability of earnings carry forwards and other non-recurring income, is expected to be sufficient to maintain the current dividend rate over the next several quarters. However, until recurring investment income consistently reaches a level equal to the current dividend rate, there is the risk that the dividend may need to be reduced in the future.
Thank you for your continued interest in and support of Barings Corporate Investors.
Sincerely,
Robert M. Shettle
President
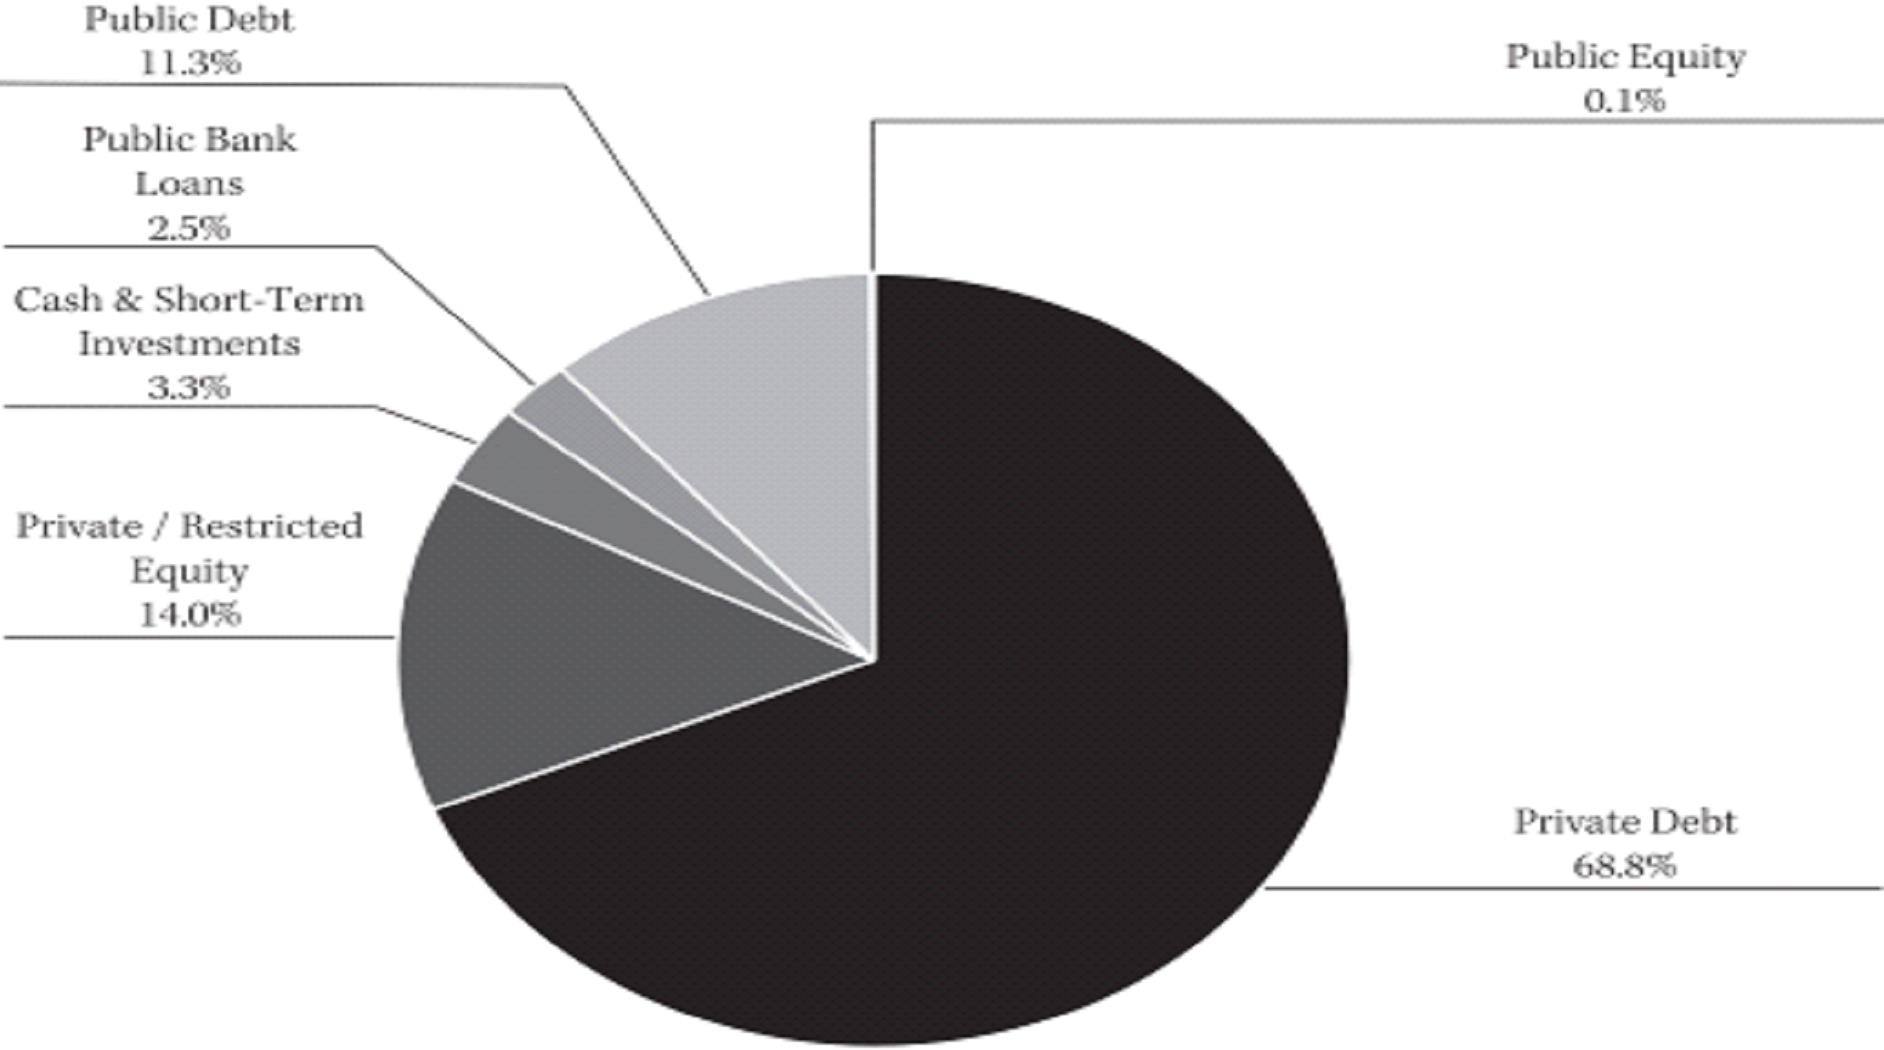
Portfolio Composition as of 6/30/2017*
* Based on market value of total investments (including cash)
Cautionary Notice: Certain statements contained in this report may be "forward looking" statements. Investors are cautioned not to place undue reliance on forward-looking statements, which speak only as of the date on which they are made and which reflect management's current estimates, projections, expectations or beliefs, and which are subject to risks and uncertainties that may cause actual results to differ materially. These statements are subject to change at any time based upon economic, market or other conditions and may not be relied upon as investment advice or an indication of the Trust's trading intent. References to specific securities are not recommendations of such securities, and may not be representative of the Trust's current or future investments. We undertake no obligation to publicly update forward looking statements, whether as a result of new information, future events, or otherwise.
2
Barings Corporate Investors
CONSOLIDATED STATEMENT OF ASSETS AND LIABILITIES
June 30, 2017
(Unaudited)
| | | | |
| Assets: | | | |
| Investments | | | |
| (See Consolidated Schedule of Investments) | | | |
Corporate restricted securities at fair value
(Cost - $212,435,568) | | $ | 216,971,616 | |
Corporate restricted securities at market value
(Cost - $57,849,677) | | | 58,808,444 | |
Corporate public securities at market value
(Cost - $44,363,143) | | | 46,215,387 | |
| Short-term securities at amortized cost | | | 1,998,678 | |
| | | | | |
| Total investments (Cost - $316,647,066) | | | 323,994,125 | |
| Cash | | | 9,170,096 | |
| Interest receivable | | | 3,603,283 | |
| Other assets | | | 6,747 | |
| | | | | |
| Total assets | | | 336,774,251 | |
| | | | | |
| | | | | |
| Liabilities: | | | | |
| Note payable | | | 30,000,000 | |
| Payable for investments purchased | | | 1,462,849 | |
| Deferred tax liability | | | 1,371,595 | |
| Investment advisory fee payable | | | 945,169 | |
| Interest payable | | | 202,400 | |
| Tax payable | | | 147,693 | |
| Accrued expenses | | | 190,447 | |
| | | | | |
| Total liabilities | | | 34,320,153 | |
| | | | | |
| Total net assets | | $ | 302,454,098 | |
| | | | | |
| | | | | |
| Net Assets: | | | | |
| Common shares, par value $1.00 per share | | $ | 19,868,194 | |
| Additional paid-in capital | | | 112,114,511 | |
| Retained net realized gain on investments, prior years | | | 145,980,019 | |
| Undistributed net investment gain | | | 8,785,835 | |
| Accumulated net realized gain on investments | | | 9,730,075 | |
| Net unrealized depreciation of investments | | | 5,975,464 | |
| | | | | |
| Total net assets | | $ | 302,454,098 | |
| | | | | |
| Common shares issued and outstanding (28,054,782 authorized) | | | 19,868,194 | |
| | | | | |
| Net asset value per share | | $ | 15.22 | |
| | | | | |
See Notes to Consolidated Financial Statements
3
CONSOLIDATED STATEMENT OF OPERATIONS
For the six months ended June 30, 2017
(Unaudited)
| | | | |
| Investment Income: | | | |
| Interest | | $ | 13,526,935 | |
| Dividends | | | 2,426,510 | |
| Other | | | 257,275 | |
| | | | | |
| Total investment income | | | 16,210,720 | |
| | | | | |
| | | | | |
| Expenses: | | | | |
| Investment advisory fees | | | 1,858,863 | |
| Interest | | | 792,000 | |
| Trustees' fees and expenses | | | 168,000 | |
| Professional fees | | | 104,087 | |
| Reports to shareholders | | | 57,000 | |
| Custodian fees | | | 16,795 | |
| Other | | | 58,253 | |
| | | | | |
| Total expenses | | | 3,054,998 | |
| | | | | |
| Investment income - net | | | 13,155,722 | |
| | | | | |
| | | | | |
| Net realized and unrealized gain on investments: | | | | |
| Net realized gain on investments before taxes | | | 3,230,440 | |
| Income tax expense | | | (323,912 | ) |
| | | | | |
| | | | | |
| Net realized gain on investments after taxes | | | 2,906,528 | |
| | | | | |
| Net increase (decrease) in unrealized appreciation (depreciation) of investments before taxes | | | 9,978,472 | |
| | | | | |
| Net (increase) decrease in deferred income tax expense | | | (358,394 | ) |
| | | | | |
| Net increase (decrease) in unrealized appreciation (depreciation) of investments after taxes | | | 9,620,078 | |
| | | | | |
| Net gain on investments | | | 12,526,606 | |
| | | | | |
| Net increase in net assets resulting from operations | | $ | 25,682,328 | |
| | | | | |
See Notes to Consolidated Financial Statements
4
Barings Corporate Investors
CONSOLIDATED STATEMENT OF CASH FLOWS
For the six months ended June 30, 2017
(Unaudited)
| | | | |
| Net decrease in cash: | | | |
| Cash flows from operating activities: | | | |
| Purchases/Proceeds/Maturities from short-term portfolio securities, net | | $ | 8,933,108 | |
| Purchases of portfolio securities | | | (37,946,279 | ) |
| Proceeds from disposition of portfolio securities | | | 25,023,238 | |
| Interest, dividends and other income received | | | 14,920,901 | |
| Interest expense paid | | | (792,000 | ) |
| Operating expenses paid | | | (2,201,481 | ) |
| Income taxes paid | | | (2,320,378 | ) |
| | | | | |
| Net cash provided by operating activities | | | 5,617,109 | |
| | | | | |
| Cash flows from financing activities: | | | | |
| Cash dividends paid from net investment income | | | (11,886,148 | ) |
| Receipts for shares issued on reinvestment of dividends | | | 1,149,905 | |
| | | | | |
| Net cash used for financing activities | | | (10,736,243 | ) |
| | | | | |
| Net decrease in cash | | | (5,119,134 | ) |
| Cash - beginning of year | | | 14,289,230 | |
| | | | | |
| Cash - end of period | | $ | 9,170,096 | |
| | | | | |
| | | | | |
Reconciliation of net increase in net assets to net cash provided by operating activities: | | | | |
| | | | | |
| Net increase in net assets resulting from operations | | $ | 25,682,328 | |
| | | | | |
| Increase in investments | | | (20,081,942 | ) |
| Decrease in interest receivable | | | 110,393 | |
| Decrease in other assets | | | 20,036 | |
| Increase in payable for investments purchased | | | 1,462,849 | |
| Increase in deferred tax liability | | | 358,394 | |
| Increase in investment advisory fee payable | | | 65,260 | |
| Decrease in tax payable | | | (1,996,466 | ) |
| Decrease in accrued expenses | | | (3,743 | ) |
| | | | | |
| Total adjustments to net assets from operations | | | (20,065,219 | ) |
| | | | | |
| Net cash provided by operating activities | | $ | 5,617,109 | |
| | | | | |
See Notes to Consolidated Financial Statements
5
CONSOLIDATED STATEMENTS OF CHANGES IN NET ASSETS
| | | | | | | |
| | | For the six
months ended
06/30/2017
(Unaudited) | | | For the
year ended
12/31/2016 | |
| Increase in net assets: | | | | | | |
| Operations: | | | | | | |
| Investment income - net | | $ | 13,155,722 | | | $ | 22,171,839 | |
| Net realized gain on investments after taxes | | | 2,906,528 | | | | 3,711,135 | |
| Net change in unrealized appreciation of investments after taxes | | | 9,620,078 | | | | 1,357,082 | |
| | | | | | | | | |
| Net increase in net assets resulting from operations | | | 25,682,328 | | | | 27,240,056 | |
| | | | | | | | | |
| Increase from common shares issued on reinvestment of dividends | | | | | | | | |
| Common shares issued (2017 - 77,787; 2016 - 125,703) | | | 1,149,905 | | | | 2,103,555 | |
| | | | | | | | | |
| Dividends to shareholders from: | | | | | | | | |
| Net investment income (2017 - $0.30 per share; 2016 - $1.20 per share) | | | (5,949,026 | ) | | | (23,688,009 | ) |
| | | | | | | | | |
| Total increase in net assets | | | 20,883,207 | | | | 5,655,602 | |
| | | | | | | | | |
| Net assets, beginning of period/year | | | 281,570,891 | | | | 275,915,289 | |
| | | | | | | | | |
Net assets, end of period/year (including undistributed net investment income of $8,785,835 and $1,579,139, respectively) | | $ | 302,454,098 | | | $ | 281,570,891 | |
| | | | | | | | | |
See Notes to Consolidated Financial Statements
6
Barings Corporate Investors
CONSOLIDATED SELECTED FINANCIAL HIGHLIGHTS
Selected data for each share of beneficial interest outstanding:
| | | For the six
months ended
06/30/2017
(Unaudited) | | | For the years ended December 31, | |
| | | 2016 | | | 2015 | | | 2014 | | | 2013 | |
| Net asset value: | | | | | | | | | | | | | | | |
| Beginning of period/year | | $ | 14.23 | | | $ | 14.03 | | | $ | 14.34 | | | $ | 13.85 | | | $ | 13.38 | |
| | | | | | | | | | | | | | | | | | | | | |
| Net investment income (a) | | | 0.66 | | | | 1.12 | | | | 1.04 | | | | 1.23 | | | | 1.18 | |
| Net realized and unrealized gain (loss) on investments | | | 0.63 | | | | 0.26 | | | | (0.16 | ) | | | 0.45 | | | | 0.48 | |
| | | | | | | | | | | | | | | | | | | | | |
| Total from investment operations | | | 1.29 | | | | 1.38 | | | | 0.88 | | | | 1.68 | | | | 1.66 | |
| | | | | | | | | | | | | | | | | | | | | |
| Dividends from net investment income to common shareholders | | | (0.30 | ) | | | (1.20 | ) | | | (1.20 | ) | | | (1.20 | ) | | | (1.20 | ) |
Dividends from net realized gain on investments to
common shareholders | | | — | | | | — | | | | — | | | | — | | | | — | |
| (Decrease)/Increase from dividends reinvested | | | 0.00 | | | | 0.02 | | | | 0.01 | | | | 0.01 | | | | 0.01 | |
| | | | | | | | | | | | | | | | | | | | | |
| Total dividends | | | (0.30 | ) | | | (1.18 | ) | | | (1.19 | ) | | | (1.19 | ) | | | (1.19 | ) |
| | | | | | | | | | | | | | | | | | | | | |
| Net asset value: End of period/year | | $ | 15.22 | | | $ | 14.23 | | | $ | 14.03 | | | $ | 14.34 | | | $ | 13.85 | |
| | | | | | | | | | | | | | | | | | | | | |
| Per share market value: | | | | | | | | | | | | | | | | | | | | |
| End of period/year | | $ | 15.09 | | | $ | 15.48 | | | $ | 17.25 | | | $ | 15.89 | | | $ | 14.93 | |
| | | | | | | | | | | | | | | | | | | | | |
| Total investment return | | | | | | | | | | | | | | | | | | | | |
| Net asset value (b) | | | 9.15% | | | | 10.13% | | | | 6.20% | | | | 13.78% | | | | 12.76% | |
| Market value (b) | | | (0.51% | ) | | | (3.49% | ) | | | 17.01% | | | | 16.53% | | | | 5.93% | |
| Net assets (in millions): | | | | | | | | | | | | | | | | | | | | |
| End of period/year | | $ | 302.45 | | | $ | 281.57 | | | $ | 275.92 | | | $ | 280.13 | | | $ | 268.69 | |
| Ratio of total expenses to average net assets | | | 2.34% | | | | 2.92% | | | | 2.56% | | | | 3.66% | | | | 2.42% | |
| Ratio of operating expenses to average net assets | | | 1.57% | | | | 1.56% | | | | 1.67% | | | | 1.65% | | | | 1.64% | |
| Ratio of interest expense to average net assets | | | 0.55% | | | | 0.56% | | | | 0.55% | | | | 0.57% | | | | 0.59% | |
| Ratio of income tax expense to average net assets (c) | | | 0.22% | | | | 0.80% | | | | 0.34% | | | | 1.44% | | | | 0.19% | |
| Ratio of net investment income to average net assets | | | 9.11% | | | | 7.80% | | | | 7.12% | | | | 8.57% | | | | 8.50% | |
| Portfolio turnover | | | 8% | | | | 29% | | | | 29% | | | | 38% | | | | 34% | |
| (a) | Calculated using average shares. |
| (b) | Net asset value return represents portfolio returns based on change in the Trust's net asset value assuming the reinvestment of all dividends and distributions which differs from the total investment return based on the Trust's market value due to the difference between the Trust's net asset value and the market value of its shares outstanding; past performance is no guarantee of future results. |
| (c) | As additional information, this ratio is included to reflect the taxes paid on retained long-term gains. These taxes paid are netted against realized capital gains in the Statement of Operations. The taxes paid are treated as deemed distributions and a credit for the taxes paid is passed on to the shareholders. |
| | | | | | | | | | | | | | | | |
| Senior borrowings: | | | | | | | | | | | | | | | |
| Total principal amount (in millions) | | $ | 30 | | | $ | 30 | | | $ | 30 | | | $ | 30 | | | $ | 30 | |
| Asset coverage per $1,000 of indebtedness | | $ | 11,082 | | | $ | 10,386 | | | $ | 10,197 | | | $ | 10,338 | | | $ | 9,956 | |
See Notes to Consolidated Financial Statements
7
CONSOLIDATED SCHEDULE OF INVESTMENTS
June 30, 2017
(Unaudited)
| Corporate Restricted Securities - 91.18%: (A) | | Principal Amount,
Shares, Units or
Ownership Percentage | | | Acquisition
Date | | | Cost | | | Fair Value | |
| | | | | | | | | | | | | |
| Private Placement Investments - 71.74%: (C) | | | | | | | | | | | | |
| | | | | | | | | | | | | |
| 1492 Acquisition LLC | | | | | | | | | | | | |
| A leading producer of premium Italian cured meats and deli meats in the U.S. | |
| Limited Liability Company Unit Class A Preferred (B) | | 245 uts. | | | 10/17/12 | | | $ | 245,450 | | | $ | 348,891 | |
| Limited Liability Company Unit Class A Common (B) | | 27,273 uts. | | | 10/17/12 | | | | 27,273 | | | | 496,405 | |
| | | | | | | | | | | | | | | |
| | | | | | | | | | 272,723 | | | | 845,296 | |
| | | | | | | | | | | | | | | |
| ABC Industries, Inc. | | | | | | | | | | | | | | |
| A manufacturer of mine and tunneling ventilation products in the U.S. | |
| 13% Senior Subordinated Note due 07/31/2019 | | $ | 262,403 | | | 08/01/12 | | | | 251,022 | | | | 260,572 | |
| Preferred Stock Series A (B) | | 300,000 shs. | | | 08/01/12 | | | | 300,000 | | | | 567,827 | |
Warrant, exercisable until 2022, to purchase common stock at $.02 per share (B) | | 53,794 shs. | | | 08/01/12 | | | | 101,870 | | | | 95,818 | |
| | | | | | | | | | | | | | | | |
| | | | | | | | | | | 652,892 | | | | 924,217 | |
| | | | | | | | | | | | | | | | |
| Advanced Manufacturing Enterprises LLC | | | | | | | | | | | | | | | |
| A designer and manufacturer of large, custom gearing products for a number of critical customer applications. | |
| Limited Liability Company Unit (B) | | 4,669 uts. | | | | * | | | | 498,983 | | | | — | |
| | | | | | | | | | | | | | | | | |
| * 12/07/12, 07/11/13 and 06/30/15. | | | | | | | | | | | | | | | | |
| | | | | | | | | | | | | | | | | |
| | | | | | | | | | | | | | | | | |
| AFC - Dell Holding Corporation | | | | | | | | | | | | | | | | |
| A distributor and provider of inventory management services for "C-Parts" used by OEMs in their manufacturing and production facilities. | |
12.5% (1% PIK) Senior Subordinated Note due 09/27/2020 | | $ | 2,453,761 | | | 03/27/15 | | | | 2,421,586 | | | | 2,478,299 | |
| Preferred Stock (B) | | 2,276 shs. | | | 03/27/15 | | | | 227,558 | | | | 203,548 | |
| Common Stock (B) | | 703 shs. | | | 03/27/15 | | | | 703 | | | | — | |
| | | | | | | | | | | | | | | | | |
| | | | | | | | | | | | 2,649,847 | | | | 2,681,847 | |
| | | | | | | | | | | | | | | | | |
| Airxcel Holdings | | | | | | | | | | | | | | | | |
| A leading manufacturer of a broad range of climate control solutions, including air-conditioners, heat pumps, cooking appliances, furnaces, powered vents, and water heaters. | |
| Limited Liability Company Unit | | 583 uts. | | | 11/18/14 | | | | 583,000 | | | | 998,604 | |
| | | | | | | | | | | | | | | | | |
| | | | | | | | | | | | | | | | | |
| AM Conservation Holding Corp | | | | | | | | | | | | | | | | |
| A supplier of energy efficiency ("EE") products, including lighting, shower heads and aerators, and weatherization products such as door seals and weather stripping. | |
11.75% (1.5% PIK) Senior Subordinated Note
due 04/30/2023 | | $ | 3,181,818 | | | 10/31/16 | | | | 3,122,698 | | | | 3,192,476 | |
| Common Stock (B) | | 318,182 shs. | | | 10/31/16 | | | | 318,182 | | | | 486,244 | |
| | | | | | | | | | | | | | | | | |
| | | | | | | | | | | | 3,440,880 | | | | 3,678,720 | |
| | | | | | | | | | | | | | | | | |
Barings Corporate Investors
CONSOLIDATED SCHEDULE OF INVESTMENTS (CONTINUED)
June 30, 2017
(Unaudited)
Corporate Restricted Securities: (A) (Continued) | | Principal Amount,
Shares, Units or
Ownership
Percentage | | | Acquisition
Date | | | Cost | | | Fair Value | |
| | | | | | | | | | | | | |
| AMS Holding LLC | | | | | | | | | | | | |
| A leading multi-channel direct marketer of high-value collectible coins and proprietary-branded jewelry and watches. | |
| Limited Liability Company Unit Class A Preferred (B) (F) | | 273 uts. | | | 10/04/12 | | | $ | 272,727 | | | $ | 600,919 | |
| | | | | | | | | | | | | | | |
| | | | | | | | | | | | | | | |
| API Technologies Corp. | | | | | | | | | | | | | | |
| A designer, developer and manufacturer of electronic systems, subsystems, modules and secure communications for technically demanding defense, aerospace and commercial applications in the U.S. and internationally. | |
12% (1% PIK) Senior Subordinated Note
due 04/22/2023 | | $ | 2,833,434 | | | 04/22/16 | | | | 2,804,365 | | | | 2,877,268 | |
| Limited Liability Company Unit (B) | | 0.90% int. | | | 04/20/16 | | | | 700,000 | | | | 700,000 | |
| | | | | | | | | | | | | | | | |
| | | | | | | | | | | 3,504,365 | | | | 3,577,268 | |
| | | | | | | | | | | | | | | | |
| ARI Holding Corporation | | | | | | | | | | | | | | | |
| A leading national supplier of products used primarily by specialty contractors. | |
11.5% (0.5% PIK) Senior Subordinated Note
due 02/01/2020 | | $ | 3,434,795 | | | | * | | | | 3,405,290 | | | | 3,434,795 | |
| Limited Partnership Interest | | 1,048 uts. | | | 08/01/14 | | | | 1,047,900 | | | | 1,179,218 | |
| | | | | | | | | | | | | | | | | |
| * 05/21/13 and 08/01/14. | | | | | | | | | | | 4,453,190 | | | | 4,614,013 | |
| | | | | | | | | | | | | | | | | |
| | | | | | | | | | | | | | | | | |
| ASC Holdings, Inc. | | | | | | | | | | | | | | | | |
| A manufacturer of capital equipment used by corrugated box manufacturers. | |
13% (1% PIK) Senior Subordinated Note
due 05/18/2021 | | $ | 1,526,814 | | | 11/19/15 | | | | 1,503,475 | | | | 1,466,178 | |
| Limited Liability Company Unit (B) | | 225,300 uts. | | | 11/18/15 | | | | 225,300 | | | | 67,815 | |
| | | | | | | | | | | | | | | | | |
| | | | | | | | | | | | 1,728,775 | | | | 1,533,993 | |
| | | | | | | | | | | | | | | | | |
| Aurora Parts & Accessories LLC | | | | | | | | | | | | | | | | |
| A distributor of aftermarket over-the-road semi-trailer parts and accessories sold to customers across North America. | |
| 11% Senior Subordinated Note due 02/17/2022 | | $ | 3,074,700 | | | 08/17/15 | | | | 3,027,272 | | | | 3,148,747 | |
| Preferred Stock (B) | | 425 shs. | | | 08/17/15 | | | | 424,875 | | | | 400,568 | |
| Common Stock (B) | | 425 shs. | | | 08/17/15 | | | | 425 | | | | — | |
| | | | | | | | | | | | | | | | | |
| | | | | | | | | | | | 3,452,572 | | | | 3,549,315 | |
| | | | | | | | | | | | | | | | | |
| Avantech Testing Services LLC | | | | | | | | | | | | | | | | |
| A manufacturer of custom Non-Destructive Testing ("NDT") systems and provider of NDT and inspections services primarily to the oil country tubular goods market. | |
15% (3.75% PIK) Senior Subordinated Note
due 01/31/2021 (D) | | $ | 1,015,684 | | | 07/31/14 | | | | 996,694 | | | | — | |
| Limited Liability Company Unit (B) (F) | | 92,327 uts. | | | | * | | | | — | | | | — | |
| | | | | | | | | | | | | | | | | |
| * 07/31/14 and 10/14/15. | | | | | | | | | | | 996,694 | | | | — | |
| | | | | | | | | | | | | | | | | |
| | | | | | | | | | | | | | | | | |
CONSOLIDATED SCHEDULE OF INVESTMENTS (CONTINUED)
June 30, 2017
(Unaudited)
Corporate Restricted Securities: (A) (Continued) | | Principal Amount,
Shares, Units or
Ownership Percentage | | | Acquisition
Date | | | Cost | | | Fair Value | |
| | | | | | | | | | | | | |
| BEI Precision Systems & Space Company, Inc. | | | | | | | | | | | | |
| A provider of advanced design, manufacturing, and testing for custom optical encoder-based positioning systems, precision accelerometers, and micro scanners. | |
12% (1% PIK) Senior Subordinated Note
due 04/28/2024 | | $ | 2,940,000 | | | 04/28/17 | | | $ | 2,882,145 | | | $ | 2,968,686 | |
| Limited Liability Company Unit (B) (F) | | 5,600 uts. | | | 04/28/17 | | | | 560,000 | | | | 560,000 | |
| | | | | | | | | | | | | | | | |
| | | | | 3,442,145 | | | | 3,528,686 | |
| | | | | | | | | | | | | | | | |
| | | | | | | | | | | | | | | | |
| Blue Wave Products, Inc. | | | | | | | | | | | | | | | |
| A distributor of pool supplies. | | | | | | | | | | | | | | | |
| 10% Senior Secured Term Note due 09/30/2018 | | $ | 223,404 | | | 10/12/12 | | | | 222,243 | | | | 223,404 | |
13% (1% PIK) Senior Subordinated Note
due 09/30/2019 | | $ | 749,418 | | | 10/12/12 | | | | 726,385 | | | | 749,418 | |
| Common Stock (B) | | 114,894 shs. | | | 10/12/12 | | | | 114,894 | | | | 701,637 | |
Warrant, exercisable until 2022, to purchase common stock at $.01 per share (B) | | 45,486 shs. | | | 10/12/12 | | | | 45,486 | | | | 277,775 | |
| | | | | | | | | | | | | | | | |
| | | | | | | | | | | 1,109,008 | | | | 1,952,234 | |
| | | | | | | | | | | | | | | | |
| BlueSpire Holding, Inc. | | | | | | | | | | | | | | | |
| A marketing services firm that integrates strategy, technology, and content to deliver customized marketing solutions for clients in the senior living, financial services and healthcare end markets. | |
12.5% (1.5% PIK) Senior Subordinated Note
due 06/30/2021 (D) | | $ | 3,217,730 | | | 06/30/15 | | | | 3,167,754 | | | | — | |
| Common Stock (B) | | 2,876 shs. | | | 06/30/15 | | | | 318,200 | | | | — | |
| | | | | | | | | | | | | | | | |
| | | | | | | | | | | 3,485,954 | | | | — | |
| | | | | | | | | | | | | | | | |
| BP SCI LLC | | | | | | | | | | | | | | | |
| A leading value-added distributor of branded pipes, valves, and fittings (PVF) to diversified end markets. | |
| Limited Liability Company Unit Class A (B) (F) | | 1,000 uts. | | | 10/17/12 | | | | 100,000 | | | | 171,002 | |
| Limited Liability Company Unit Class B (B) (F) | | 400 uts. | | | 10/17/12 | | | | 400,000 | | | | 682,287 | |
| | | | | | | | | | | | | | | | |
| | | | | | | | | | | 500,000 | | | | 853,289 | |
| | | | | | | | | | | | | | | | |
| CG Holdings Manufacturing Company | | | | | | | | | | | | | | | |
| A coating provider serving the automotive, agricultural, heavy truck and other end markets. | |
| 13% Senior Subordinated Note 11/01/2019 | | $ | 3,390,252 | | | | * | | | | 3,295,336 | | | | 3,390,252 | |
| Preferred Stock (B) | | 3,241 shs. | | | | * | | | | 324,054 | | | | 422,426 | |
| Preferred Stock (B) | | 1,174 shs. | | | | * | | | | 116,929 | | | | 153,049 | |
| Common Stock (B) | | 337 shs. | | | | * | | | | 35,673 | | | | 664,850 | |
Warrant, exercisable until 2023, to purchase common stock at $.01 per share (B) | | 137 shs. | | | | * | | | | 13,033 | | | | 270,499 | |
| | | | | | | | | | | | | | | | | |
| * 05/09/13 and 11/01/13. | | | | | | | | | | | 3,785,025 | | | | 4,901,076 | |
| | | | | | | | | | | | | | | | | |
| | | | | | | | | | | | | | | | | |
Barings Corporate Investors
CONSOLIDATED SCHEDULE OF INVESTMENTS (CONTINUED)
June 30, 2017
(Unaudited)
Corporate Restricted Securities: (A) (Continued) | | Principal Amount,
Shares, Units or
Ownership Percentage | | | Acquisition
Date | | | Cost | | | Fair Value | |
| | | | | |
| CHG Alternative Education Holding Company | | | | |
| A leading provider of publicly-funded, for profit pre-K-12 education services targeting special needs children at therapeutic day schools and "at risk" youth through alternative education programs. | |
13.5% (1.5% PIK) Senior Subordinated Note
due 06/19/2020 | | $ | 2,357,344 | | | 01/19/11 | | | $ | 2,335,995 | | | $ | 2,357,344 | |
14% (2% PIK) Senior Subordinated Note
due 06/19/2020 | | $ | 621,228 | | | 08/03/12 | | | | 616,456 | | | | 621,228 | |
| Common Stock (B) | | 1,125 shs. | | | 01/19/11 | | | | 112,500 | | | | 138,436 | |
Warrant, exercisable until 2021, to purchase common stock at $.01 per share (B) | | 884 shs. | | | 01/19/11 | | | | 87,750 | | | | 108,819 | |
| | | | | | | | | | | | | | | | |
| | | | | | | | | | | 3,152,701 | | | | 3,225,827 | |
| | | | | | | | | | | | | | | | |
| Church Services Holding Company | | | | | | | | | | | | | | | |
| A provider of diversified residential services to homeowners in the Houston, Dallas, and Austin markets. | |
| Limited Liability Company Unit (B) (F) | | 3 uts. | | | 03/26/12 | | | | 569,935 | | | | — | |
| | | | | | | | | | | | | | | | |
| | | | | | | | | | | | | | | | |
| Clarion Brands Holding Corp. | | | | | | | | | | | | | | | |
| A portfolio of six over-the-counter (OTC) pharmaceutical brands whose products are used to treat tinnitus or ringing of the ear, excessive sweating, urinary tract infections, muscle pain, and skin conditions. | |
12.5% (1.5% PIK) Senior Subordinated Note
due 04/01/2021 | | $ | 4,136,379.15 | | | | * | | | | 4,077,713 | | | | 4,121,730 | |
| Limited Liability Company Unit (B) | | 3,759 uts. | | | 07/18/16 | | | | 384,020 | | | | 304,568 | |
| | | | | | | | | | | | | | | | | |
| * 10/01/14 and 07/18/16. | | | | | | | | | | | 4,461,733 | | | | 4,426,298 | |
| | | | | | | | | | | | | | | | | |
| | | | | | | | | | | | | | | | | |
| Clough, Harbour and Associates | | | | | | | | | | | | | | | | |
| An engineering service firm that is located in Albany, NY. | |
| Preferred Stock (B) | | 277 shs. | | | 12/02/08 | | | | 276,900 | | | | 1,223,848 | |
| | | | | | | | | | | | | | | | | |
| | | | | | | | | | | | | | | | | |
| Compass Chemical International LLC | | | | | | | | | | | | | | | | |
| A manufacturer and supplier of standard and specialty formulated chemicals, primarily phosphoric acid derivatives called phosphonates. | |
| Limited Liability Company Unit (B) (F) | | 467 uts. | | | 03/04/15 | | | | 298,900 | | | | 294,192 | |
| | | | | | | | | | | | | | | | | |
| | | | | | | | | | | | | | | | | |
| Connecticut Electric, Inc. | | | | | | | | | | | | | | | | |
| A supplier and distributor of electrical products sold into the retail and wholesale markets. | |
| Limited Liability Company Unit Class A (B) | | 156,046 uts. | | | 01/12/07 | | | | 156,046 | | | | 244,218 | |
| Limited Liability Company Unit Class C (B) | | 112,873 uts. | | | 01/12/07 | | | | 112,873 | | | | 196,562 | |
| Limited Liability Company Unit Class D (B) | | 1,268,437 uts. | | | 05/03/10 | | | | — | | | | 2,123,091 | |
| Limited Liability Company Unit Class E (B) | | 2,081 uts. | | | 05/03/10 | | | | — | | | | 495,896 | |
| | | | | | | | | | | | | | | | | |
| | | | | | | | | | | | 268,919 | | | | 3,059,767 | |
| | | | | | | | | | | �� | | | | | | |
CONSOLIDATED SCHEDULE OF INVESTMENTS (CONTINUED)
June 30, 2017
(Unaudited)
Corporate Restricted Securities: (A) (Continued) | | Principal Amount,
Shares, Units or
Ownership Percentage | | | Acquisition
Date | | | Cost | | | Fair Value | |
| | | | | | | | | | | | | |
| CORA Health Services, Inc. | | | | | | | | | | | | |
| A provider of outpatient rehabilitation therapy services. | |
12.75% (1.75% PIK) Senior Subordinated Note
due 06/30/2023 | | $ | 1,565,637 | | | 06/30/16 | | | $ | 1,537,806 | | | $ | 1,599,894 | |
| Preferred Stock Series A (B) | | 1,538 shs. | | | 06/30/16 | | | | 146,154 | | | | 165,692 | |
| Common Stock Class A (B) | | 7,692 shs. | | | 06/30/16 | | | | 7,692 | | | | 19,623 | |
| | | | | | | | | | | | | | | | |
| | | | | | | | | | | 1,691,652 | | | | 1,785,209 | |
| | | | | | | | | | | | | | | | |
| CTM Holding, Inc. | | | | | | | | | | | | | | | |
| A leading owner and operator of coin-operated children's rides, penny presses and candy kiosks in the U.S. | |
15% (3% PIK) Senior Subordinated Note
due 11/22/2019 | | $ | 2,632,816 | | | 11/22/13 | | | | 2,608,755 | | | | 2,632,816 | |
| Common Stock (B) | | 180 shs. | | | | * | | | | 1,028,568 | | | | 812,973 | |
| | | | | | | | | | | | | | | | | |
| * 11/22/13 and 09/16/16. | | | | | | | | | | | 3,637,323 | | | | 3,445,789 | |
| | | | | | | | | | | | | | | | | |
| | | | | | | | | | | | | | | | | |
| Del Real LLC | | | | | | | | | | | | | | | | |
| A manufacturer and distributor of fully-prepared fresh refrigerated Hispanic entrees as well as side dishes that are typically sold on a heat-and-serve basis at retail grocers. | |
| 11% Senior Subordinated Note due 04/06/2023 | | $ | 2,882,353 | | | 10/07/16 | | | | 2,829,322 | | | | 2,876,264 | |
| Limited Liability Company Unit (B) (F) | | 617,647 uts. | | | 10/07/16 | | | | 617,647 | | | | 642,353 | |
| | | | | | | | | | | | | | | | | |
| | | | | | | | | | | | 3,446,969 | | | | 3,518,617 | |
| | | | | | | | | | | | | | | | | |
| DPL Holding Corporation | | | | | | | | | | | | | | | | |
| A distributor and manufacturer of aftermarket undercarriage parts for medium and heavy duty trucks and trailers. | |
14% (2% PIK) Senior Subordinated Note
due 11/04/2020 | | $ | 3,403,284 | | | 05/04/12 | | | | 3,378,046 | | | | 3,334,215 | |
| Preferred Stock (B) | | 61 shs. | | | 05/04/12 | | | | 605,841 | | | | 578,533 | |
| Common Stock (B) | | 61 shs. | | | 05/04/12 | | | | 67,316 | | | | — | |
| | | | | | | | | | | | | | | | | |
| | | | | | | | | | | | 4,051,203 | | | | 3,912,748 | |
| | | | | | | | | | | | | | | | | |
| Dunn Paper | | | | | | | | | | | | | | | | |
| A provider of specialty paper for niche product applications. | |
| 9.75% Second Lien Term Loan due 08/31/2023 | | $ | 3,500,000 | | | 09/28/16 | | | | 3,437,260 | | | | 3,430,000 | |
| | | | | | | | | | | | | | | | | |
| | | | | | | | | | | | | | | | | |
| Eagle Family Foods, Inc. | | | | | | | | | | | | | | | | |
| A producer of low-cost branded and private label canned milk. | | | | | | | | | | | | | |
| 10.05% Last Out Term Loan due 12/31/2021 | | $ | 3,500,000 | | | 12/22/15 | | | | 3,460,625 | | | | 3,500,000 | |
| | | | | | | | | | | | | | | | | |
| | | | | | | | | | | | | | | | | |
Barings Corporate Investors
CONSOLIDATED SCHEDULE OF INVESTMENTS (CONTINUED)
June 30, 2017
(Unaudited)
Corporate Restricted Securities: (A) (Continued) | | Principal Amount,
Shares, Units or
Ownership Percentage | | | | Acquisition
Date | | | Cost | | | Fair Value | |
| | | | | | | | | | | | | | |
| ECG Consulting Group | | | | | | | | | | | | | |
| A healthcare management consulting company who provides strategic, financial, operational, and technology related consulting services to healthcare providers. | |
11.75% (0.75% PIK) Senior Subordinated Note
due 11/21/2020 | | $ | 2,676,809 | | | | 11/21/14 | | | $ | 2,637,870 | | | $ | 2,703,577 | |
| Limited Liability Company Unit (B) (F) | | 467 uts. | | | | 11/19/14 | | | | 145,833 | | | | 193,915 | |
| | | | | | | | | | | | | | | | | |
| | | | | | | | | | | | 2,783,703 | | | | 2,897,492 | |
| | | | | | | | | | | | | | | | | |
| Elite Sportswear Holding, LLC | | | | | | | | | | | | | | | | |
| A designer and manufacturer of gymnastics, competitive cheerleading and swimwear apparel in the U.S. and internationally. | |
11.5% (1% PIK) Senior Subordinated Note
due 10/13/2021 | | $ | 3,198,918 | | | | 10/14/16 | | | | 3,149,449 | | | | 3,199,990 | |
| Limited Liability Company Unit (B) (F) | | 204 uts. | | | | 10/14/16 | | | | 324,074 | | | | 316,198 | |
| | | | | | | | | | | | | | | | | |
| | | | | | | | | | | | 3,473,523 | | | | 3,516,188 | |
| | | | | | | | | | | | | | | | | |
| English Color & Supply LLC | | | | | | | | | | | | | | | | |
| A distributor of aftermarket automotive paint and related products to collision repair shops, auto dealerships and fleet customers through a network of stores in the Southern U.S. | |
11.5% (0.5% PIK) Senior Subordinated Note
due 12/31/2023 | | $ | 2,693,084 | | | | 06/30/17 | | | | 2,639,245 | | | | 2,693,084 | |
| Limited Liability Company Unit (B) (F) | | 806,916 uts. | | | | 06/30/17 | | | | 806,916 | | | | 806,916 | |
| | | | | | | | | | | | | | | | | |
| | | | | | | | | | | | 3,446,161 | | | | 3,500,000 | |
| | | | | | | | | | | | | | | | | |
| ERG Holding Company LLC | | | | | | | | | | | | | | | | |
| A provider of inpatient and outpatient clinical trial services to pharmaceutical companies and contract research organizations. | |
13.5% (1.5% PIK) Senior Subordinated Note
due 10/04/2019 | | $ | 1,981,566 | | | | 04/04/14 | | | | 1,962,558 | | | | 1,981,566 | |
14% (2% PIK) Senior Subordinated Note
due 10/04/2019 | | $ | 521,572 | | | | 07/01/16 | | | | 513,993 | | | | 532,004 | |
| Common Stock (B) | | 0.64% int. | | | | 04/04/14 | | | | 157,314 | | | | 175,135 | |
| | | | | | | | | | | | | | | | | |
| | | | | | | | | | | | 2,633,865 | | | | 2,688,705 | |
| | | | | | | | | | | | | | | | | |
| F F C Holding Corporation | | | | | | | | | | | | | | | | |
| A leading U.S. manufacturer of private label frozen novelty and ice cream products. | |
| Limited Liability Company Unit Preferred (B) | | 512 uts. | | | | 09/27/10 | | | | 175,035 | | | | 252,077 | |
| Limited Liability Company Unit Common (B) | | 512 uts. | | | | 09/27/10 | | | | 51,220 | | | | 1,409,897 | |
| | | | | | | | | | | | | | | | | |
| | | | | | | | | | | | 226,255 | | | | 1,661,974 | |
| | | | | | | | | | | | | | | | | |
CONSOLIDATED SCHEDULE OF INVESTMENTS (CONTINUED)
June 30, 2017
(Unaudited)
Corporate Restricted Securities: (A) (Continued) | | Principal Amount,
Shares, Units or
Ownership Percentage | | | | Acquisition
Date | | | Cost | | | Fair Value | |
| | | | | | | | | | | | | | |
| F G I Equity LLC | | | | | | | | | | | | | |
| A manufacturer of a broad range of filters and related products that are used in commercial, light industrial, healthcare, gas turbine, nuclear, laboratory, clean room, hotel, educational system, and food processing settings. | |
| Limited Liability Company Unit Preferred (B) | | 483,355 uts. | | | | 04/15/14 | | | $ | — | | | $ | 483,355 | |
| Limited Liability Company Unit Class B-1 (B) | | 394,737 uts. | | | | 12/15/10 | | | | 394,737 | | | | 1,781,338 | |
| Limited Liability Company Unit Class B-2 (B) | | 49,488 uts. | | | | 12/15/10 | | | | 49,488 | | | | 223,326 | |
| Limited Liability Company Unit Class B-3 (B) | | 39,130 uts. | | | | 08/30/12 | | | | 90,000 | | | | 186,759 | |
| Limited Liability Company Unit Class C (B) | | 9,449 uts. | | | | 12/20/10 | | | | 96,056 | | | | 304,062 | |
| | | | | | | | | | | | | | | | |
| | | | | | | | | | | 630,281 | | | | 2,978,840 | |
| | | | | | | | | | | | | | | | |
| FMH Holdings Corporation | | | | | | | | | | | | | | | |
| A designer and manufacturer of highly engineered components for the aerospace, defense and space industries. | |
| Common Stock (B) | | 300 shs. | | | | 05/01/15 | | | | 300,485 | | | | 556,019 | |
| | | | | | | | | | | | | | | | |
| | | | | | | | | | | | | | | | |
| GD Dental Services LLC | | | | | | | | | | | | | | | |
| A provider of convenient "onestop" general, specialty, and cosmetic dental services with 21 offices located throughout South and Central Florida. | |
| Limited Liability Company Unit Preferred (B) | | 182 uts. | | | | 10/05/12 | | | | 182,209 | | | | 255,499 | |
| Limited Liability Company Unit Common (B) | | 1,840 uts. | | | | 10/05/12 | | | | 1,840 | | | | — | |
| | | | | | | | | | | | | | | | |
| | | | | | | | | | | 184,049 | | | | 255,499 | |
| | | | | | | | | | | | | | | | |
| GenNx Novel Holding, Inc. | | | | | | | | | | | | | | | |
| A manufacturer and distributor of nutraceutical ingredients. | |
15% (1% PIK) Senior Subordinated Note
due 03/27/2020 | | $ | 3,282,855 | | | | 03/27/14 | | | | 3,245,877 | | | | 3,118,712 | |
| Common Stock (B) | | 31,500 shs. | | | | 03/27/14 | | | | 315,000 | | | | 211,008 | |
| | | | | | | | | | | | | | | | | |
| | | | | | | | | | | | 3,560,877 | | | | 3,329,720 | |
| | | | | | | | | | | | | | | | | |
| gloProfessional Holdings, Inc. | | | | | | | | | | | | | | | | |
| A marketer and distributor of premium mineral-based cosmetics, cosmeceuticals and professional hair care products to the professional spa and physician's office channels. | |
14% (2% PIK) Senior Subordinated Note
due 03/27/2019 | | $ | 2,957,402 | | | | 03/27/13 | | | | 2,936,675 | | | | 2,957,402 | |
| Common Stock (B) | | 2,835 shs. | | | | 03/27/13 | | | | 283,465 | | | | 301,534 | |
| | | | | | | | | | | | | | | | | |
| | | | | | | | | | | | 3,220,140 | | | | 3,258,936 | |
| | | | | | | | | | | | | | | | | |
| Glynlyon Holding Companies, Inc. | | | | | | | | | | | | | | | | |
| A technology-enabled curriculum provider of K-12 and support services predominantly to small and medium public school districts. | |
12% (1% PIK) Senior Subordinated Note
due 01/15/2022 | | $ | 3,247,908 | | | | 01/15/16 | | | | 3,195,442 | | | | 3,312,867 | |
| Common Stock (B) | | 299 shs. | | | | 01/15/16 | | | | 299,145 | | | | 484,855 | |
| | | | | | | | | | | | | | | | | |
| | | | | | | | | | | | 3,494,587 | | | | 3,797,722 | |
| | | | | | | | | | | | | | | | | |
Barings Corporate Investors
CONSOLIDATED SCHEDULE OF INVESTMENTS (CONTINUED)
June 30, 2017
(Unaudited)
Corporate Restricted Securities: (A) (Continued) | | Principal Amount,
Shares, Units or
Ownership Percentage | | | Acquisition
Date | | | Cost | | | Fair Value | |
| | | | | | | | | | | | | |
| GlynnDevins Acquisition Corporation | | | | | | | | | | | | |
| A marketing communications agency that services senior living facilities. | |
| Preferred Stock Series A (B) | | 695 shs. | | | 06/19/15 | | | $ | 143,414 | | | $ | 164,563 | |
| Common Stock (B) | | 695 shs. | | | 06/19/15 | | | | 5,976 | | | | 75,567 | |
| | | | | | | | | | | | | | | |
| | | | | | | | | | 149,390 | | | | 240,130 | |
| | | | | | | | | | | | | | | |
| Grakon Parent | | | | | | | | | | | | | | |
| The leading designer and manufacturer of highly-engineered and customized LED and incandescent lighting systems for transportation-based markets. | |
| Common Stock (B) | | 355 shs. | | | 10/31/14 | | | | 354,730 | | | | 342,712 | |
| | | | | | | | | | | | | | | |
| | | | | | | | | | | | | | | |
| GTI Holding Company | | | | | | | | | | | | | | |
| A designer, developer, and marketer of precision specialty hand tools and handheld test instruments. | |
| 12% Senior Subordinated Note due 02/05/2020 | | $ | 1,455,729 | | | 02/05/14 | | | | 1,400,927 | | | | 1,439,148 | |
| Common Stock (B) | | 1,693 shs. | | | 02/05/14 | | | | 169,271 | | | | 119,421 | |
Warrant, exercisable until 2024, to purchase common stock at $.01 per share (B) | | 795 shs. | | | 02/05/14 | | | | 73,633 | | | | 56,078 | |
| | | | | | | | | | | | | | | | |
| | | | | | | | | | | 1,643,831 | | | | 1,614,647 | |
| | | | | | | | | | | | | | | | |
| Handi Quilter Holding Company (Premier Needle Arts) | |
| A designer and manufacturer of long-arm quilting machines and related components for the consumer quilting market. | |
12% (1% PIK) Senior Subordinated Note
due 06/19/2021 | | $ | 3,500,000 | | | | * | | | | 3,448,150 | | | | 3,528,549 | |
| Limited Liability Company Unit Preferred (B) | | 754 uts. | | | | ** | | | | 754,061 | | | | 861,020 | |
| Limited Liability Company Unit Common Class A (B) | | 7,292 uts. | | | 12/19/14 | | | | — | | | | — | |
| | | | | | | | | | | | | | | | | |
| * 12/19/14 and 02/21/17. | | | | | | | | | | | 4,202,211 | | | | 4,389,569 | |
| ** 12/19/14 and 04/29/16. | | | | | | | | | | | | | | | | |
| | | | | | | | | | | | | | | | | |
| Happy Floors Acquisition, Inc. | | | | | | | | | | | | | | | | |
| A wholesale importer and value-added distributor of premium European flooring tile to residential and commercial end markets. | |
12.5% (1% PIK) Senior Subordinated Note
due 07/01/2022 | | $ | 3,228,754 | | | 07/01/16 | | | | 3,172,473 | | | | 3,287,946 | |
| Common Stock (B) | | 303 shs. | | | 07/01/16 | | | | 303,333 | | | | 325,632 | |
| | | | | | | | | | | | | | | | | |
| | | | | | | | | | | | 3,475,806 | | | | 3,613,578 | |
| | | | | | | | | | | | | | | | | |
| Hartland Controls Holding Corporation | | | | | | | | | | | | | | | | |
| A manufacturer and distributor of electronic and electromechanical components. | |
14% (2% PIK) Senior Subordinated Note
due 08/14/2020 | | $ | 2,267,331 | | | 02/14/14 | | | | 2,245,020 | | | | 2,267,331 | |
| 12% Senior Subordinated Note due 08/14/2020 | | $ | 875,000 | | | 06/22/15 | | | | 869,785 | | | | 883,750 | |
| Common Stock (B) | | 1,666 shs. | | | 02/14/14 | | | | 1,667 | | | | 591,795 | |
| | | | | | | | | | | | | | | | | |
| | | | | | | | | | | | 3,116,472 | | | | 3,742,876 | |
| | | | | | | | | | | | | | | | | |
CONSOLIDATED SCHEDULE OF INVESTMENTS (CONTINUED)
June 30, 2017
(Unaudited)
Corporate Restricted Securities: (A) (Continued) | | Principal Amount,
Shares, Units or
Ownership Percentage | | | Acquisition
Date | | | Cost | | | Fair Value | |
| | | | | | | | | | | | | |
| HHI Group, LLC | | | | | | | | | | | | |
| A developer, marketer, and distributor of hobby-grade radio control products. | |
14% (2% PIK) Senior Subordinated Note
due 11/26/2020 | | $ | 3,463,129 | | | 01/17/14 | | | $ | 3,430,619 | | | $ | 3,289,972 | |
| Limited Liability Company Unit (B) (F) | | 203 uts. | | | 01/17/14 | | | | 203,125 | | | | — | |
| | | | | | | | | | | | | | | | |
| | | | | | | | | | | 3,633,744 | | | | 3,289,972 | |
| | | | | | | | | | | | | | | | |
| Hollandia Produce LLC | | | | | | | | | | | | | | | |
| A hydroponic greenhouse producer of branded root vegetables. | |
14.25% (2.75% PIK) Senior Subordinated Note
due 12/11/2020 | | $ | 2,795,414 | | | | * | | | | 2,754,239 | | | | 2,701,270 | |
| | | | | | | | | | | | | | | | | |
| * 12/30/15 and 12/23/16 | | | | | | | | | | | | | | | | |
| | | | | | | | | | | | | | | | | |
| | | | | | | | | | | | | | | | | |
| HOP Entertainment LLC | | | | | | | | | | | | | | | | |
| A provider of post production equipment and services to producers of television shows and motion pictures. | |
| Limited Liability Company Unit Class F (B) (F) | | 89 uts. | | | 10/14/11 | | | | — | | | | — | |
| Limited Liability Company Unit Class G (B) (F) | | 215 uts. | | | 10/14/11 | | | | — | | | | — | |
| Limited Liability Company Unit Class H (B) (F) | | 89 uts. | | | 10/14/11 | | | | — | | | | — | |
| Limited Liability Company Unit Class I (B) (F) | | 89 uts. | | | 10/14/11 | | | | — | | | | — | |
| | | | | | | | | | | | | | | | | |
| | | | | | | | | | | | — | | | | — | |
| | | | | | | | | | | | | | | | | |
| Hospitality Mints Holding Company | | | | | | | | | | | | | | | | |
| A manufacturer of individually-wrapped imprinted promotional mints. | |
| 12% Senior Subordinated Note due 10/01/2018 | | $ | 2,075,581 | | | 08/19/08 | | | | 2,070,050 | | | | 1,985,202 | |
| Common Stock (B) | | 474 shs. | | | 08/19/08 | | | | 474,419 | | | | 38,509 | |
Warrant, exercisable until 2018, to purchase common stock at $.01 per share (B) | | 123 shs. | | | 08/19/08 | | | | 113,773 | | | | 9,953 | |
| | | | | | | | | | | | | | | | | |
| | | | | | | | | | | | 2,658,242 | | | | 2,033,664 | |
| | | | | | | | | | | | | | | | | |
| HVAC Holdings, Inc. | | | | | | | | | | | | | | | | |
| A provider of integrated energy efficiency services and maintenance programs for HVAC systems. | |
12% (1% PIK) Senior Subordinated Note
due 07/19/2022 | | $ | 2,301,887 | | | | * | | | | 2,277,391 | | | | 2,301,887 | |
| Limited Liability Company Unit Class A Preferred (B) | | 2,705 uts. | | | 09/27/12 | | | | 270,542 | | | | 416,988 | |
| Limited Liability Company Unit Class A Common (B) | | 2,185 uts. | | | 09/27/12 | | | | 2,185 | | | | 530,862 | |
| | | | | | | | | | | | | | | | | |
| * 07/19/16 and 09/06/16 | | | | | | | | | | | 2,550,118 | | | | 3,249,737 | |
| | | | | | | | | | | | | | | | | |
| | | | | | | | | | | | | | | | | |
| Ideal Tridon Holdings, Inc. | | | | | | | | | | | | | | | | |
| A designer and manufacturer of clamps and couplings used in automotive and industrial end markets. | |
| Common Stock | | 279 shs. | | | 10/27/11 | | | | 232,385 | | | | 581,096 | |
| | | | | | | | | | | | | | | | | |
| | | | | | | | | | | | | | | | | |
Barings Corporate Investors
CONSOLIDATED SCHEDULE OF INVESTMENTS (CONTINUED)
June 30, 2017
(Unaudited)
Corporate Restricted Securities: (A) (Continued) | | Principal Amount,
Shares, Units or
Ownership Percentage | | | | Acquisition
Date | | | Cost | | | Fair Value | |
| | | | | | | | | | | | | | |
| Impact Confections | | | | | | | | | | | | | |
An independent manufacturer and marketer of confectionery products including Warheads® brand sour candies, Melster® brand classic candies, and co-manufactured/private label classic candies. | |
13% (1% PIK) Senior Subordinated Note
due 11/10/2020 | | $ | 2,216,037 | | | | 11/10/14 | | | $ | 2,187,780 | | | $ | 2,194,721 | |
| Common Stock (B) | | 4,667 shs. | | | | 11/10/14 | | | | 466,667 | | | | 354,628 | |
| | | | | | | | | | | | | | | | | |
| | | | | | | | | | | | 2,654,447 | | | | 2,549,349 | |
| | | | | | | | | | | | | | | | | |
| Insurance Claims Management, Inc. | | | | | | | | | | | | | | | | |
| A third party administrator providing auto and property claim administration services for insurance companies. | |
| Common Stock (B) | | 89 shs. | | | | 02/27/07 | | | | 2,689 | | | | 237,255 | |
| | | | | | | | | | | | | | | | | |
| | | | | | | | | | | | | | | | | |
| Janus Group Holdings LLC | | | | | | | | | | | | | | | | |
| A manufacturer of roll-up doors and hallway systems that are primarily used in self-storage facilities. | |
| Limited Liability Company Unit Class A (B) (F) | | 565 uts. | | | | 12/11/13 | | | | — | | | | 2,773,525 | |
| | | | | | | | | | | | | | | | | |
| | | | | | | | | | | | | | | | | |
| JMH Investors LLC | | | | | | | | | | | | | | | | |
| A developer and manufacturer of custom formulations for a wide variety of foods. | |
| Limited Liability Company Unit (B) (F) | | 2,493,253 uts. | | | | 12/05/12 | | | | 557,301 | | | | — | |
| Limited Liability Company Unit Class A-1 (B) (F) | | 391,304 uts. | | | | 10/31/16 | | | | 391,304 | | | | 466,630 | |
| Limited Liability Company Unit Class A-2 (B) (F) | | 2,478,261 uts. | | | | 10/31/16 | | | | — | | | | 93,108 | |
| | | | | | | | | | | | | | | | | |
| | | | | | | | | | | | 948,605 | | | | 559,738 | |
| | | | | | | | | | | | | | | | | |
| K P I Holdings, Inc. | | | | | | | | | | | | | | | | |
| The largest player in the U.S. non-automotive, non-ferrous die casting segment. | |
| Limited Liability Company Unit Class C Preferred (B) | | 75 uts. | | | | 06/30/15 | | | | — | | | | 151,846 | |
| Common Stock (B) | | 667 shs. | | | | 07/15/08 | | | | 539,502 | | | | 226,220 | |
| | | | | | | | | | | | | | | | | |
| | | | | | | | | | | | 539,502 | | | | 378,066 | |
| | | | | | | | | | | | | | | | | |
| Kyjen Company | | | | | | | | | | | | | | | | |
| A designer and distributor of branded and private label dog toys and accessories primarily in the U.S. | |
13% (1% PIK) Senior Subordinated Note
due 10/14/2021 | | $ | 2,670,247 | | | | 10/14/15 | | | | 2,628,784 | | | | 2,723,652 | |
| | | | | | | | | | | | | | | | | |
| | | | | | | | | | | | | | | | | |
| Mail Communications Group, Inc. | | | | | | | | | | | | | | | | |
| A provider of mail processing and handling services, lettershop services, and commercial printing services. | |
| Limited Liability Company Unit | | 24,109 uts. | | | | * | | | | 314,464 | | | | 421,617 | |
Warrant, exercisable until 2018, to purchase common stock at $.01 per share (B) (F) | | 3,375 shs. | | | | 05/04/07 | | | | 43,031 | | | | 59,022 | |
| | | | | | | | | | | | | | | | | |
| * 05/04/07 and 01/02/08. | | | | | | | | | | | 357,495 | | | | 480,639 | |
| | | | | | | | | | | | | | | | | |
| | | | | | | | | | | | | | | | | |
CONSOLIDATED SCHEDULE OF INVESTMENTS (CONTINUED)
June 30, 2017
(Unaudited)
Corporate Restricted Securities: (A) (Continued) | | Principal Amount,
Shares, Units or
Ownership
Percentage | | | Acquisition
Date | | | Cost | | | Fair Value | |
| | | | | | | | | | | | | |
| Manhattan Beachwear Holding Company | | | | | | | | | | | | |
| A designer and distributor of women's swimwear. | |
| 12.5% Senior Subordinated Note due 01/15/2018 (D) | | $ | 1,259,914 | | | 01/15/10 | | | $ | 1,212,363 | | | $ | 629,957 | |
15% (2.5% PIK) Senior Subordinated Note
due 01/15/2018 (D) | | $ | 345,759 | | | 10/05/10 | | | | 343,820 | | | | 172,879 | |
| Common Stock (B) | | 106 shs. | | | 10/05/10 | | | | 106,200 | | | | — | |
| Common Stock Class B (B) | | 353 shs. | | | 01/15/10 | | | | 352,941 | | | | — | |
Warrant, exercisable until 2019, to purchase common stock at $.01 per share (B) | | 312 shs. | | | 10/05/10 | | | | 283,738 | | | | — | |
| | | | | | | | | | | | | | | | |
| | | | | | | | | | | 2,299,062 | | | | 802,836 | |
| | | | | | | | | | | | | | | | |
| Master Cutlery LLC | | | | | | | | | | | | | | | |
| A designer and marketer of a wide assortment of knives and swords. | |
| 13% Senior Subordinated Note due 04/17/2020 | | $ | 1,736,205 | | | 04/17/15 | | | | 1,723,036 | | | | 1,565,770 | |
| Limited Liability Company Unit | | 9 uts. | | | 04/17/15 | | | | 1,356,658 | | | | — | |
| | | | | | | | | | | | | | | | |
| | | | | | | | | | | 3,079,694 | | | | 1,565,770 | |
| | | | | | | | | | | | | | | | |
| MC Sign Holdings LLC | | | | | | | | | | | | | | | |
| A provider of sign and lighting services nationwide. | |
11.75% (0.75% PIK) Senior Subordinated Note
due 08/09/2022 | | $ | 2,003,561 | | | | * | | | | 1,971,016 | | | | 2,023,910 | |
| Limited Liability Company Unit Class B (B) | | 205,900 uts. | | | 09/22/15 | | | | 205,900 | | | | 295,878 | |
| | | | | | | | | | | | | | | | | |
| * 09/22/15 and 02/09/17 | | | | | | | | | | | 2,176,916 | | | | 2,319,788 | |
| | | | | | | | | | | | | | | | | |
| | | | | | | | | | | | | | | | | |
| Merex Holding Corporation | | | | | | | | | | | | | | | | |
| A provider of after-market spare parts and components, as well as maintenance, repair and overhaul services for "out of production" or "legacy" aerospace and defense systems that are no longer effectively supported by the original equipment manufacturers. | |
16% Senior Subordinated Note due 10/30/2019 (D) | | $ | 1,362,886 | | | 09/22/11 | | | | 1,347,188 | | | | 1,294,742 | |
15% PIK Senior Subordinated Note due 04/30/2022 (D) | | $ | 71,517 | | | 08/18/15 | | | | 71,517 | | | | — | |
14% PIK Senior Subordinated Note due 06/30/2019 (B) | | $ | 109,734 | | | 10/21/16 | | | | 109,734 | | | | 109,621 | |
| Common Stock Class A (B) | | 225,775 shs. | | | | * | | | | 512,114 | | | | — | |
| | | | | | | | | | | | | | | | | |
| * 08/18/15, 10/20/16 and 01/27/17. | | | | | | | | | | | 2,040,553 | | | | 1,404,363 | |
| | | | | | | | | | | | | | | | | |
| | | | | | | | | | | | | | | | | |
| MES Partners, Inc. | | | | | | | | | | | | | | | | |
| An industrial service business offering an array of cleaning and environmental services to the Gulf Coast region of the U.S. | |
12% (1% PIK) Senior Subordinated Note
due 09/30/2021 | | $ | 2,256,590 | | | 09/30/14 | | | | 2,225,669 | | | | 2,227,849 | |
| Common Stock Class B (B) | | 445,455 shs. | | | 09/30/14 | | | | 445,455 | | | | 190,816 | |
| | | | | | | | | | | | | | | | | |
| | | | | | | | | | | | 2,671,124 | | | | 2,418,665 | |
| | | | | | | | | | | | | | | | | |
Barings Corporate Investors
CONSOLIDATED SCHEDULE OF INVESTMENTS (CONTINUED)
June 30, 2017
(Unaudited)
Corporate Restricted Securities: (A) (Continued) | | Principal Amount,
Shares, Units or
Ownership Percentage | | | Acquisition
Date | | | Cost | | | Fair Value | |
| | | | | | | | | | | | | |
| Midwest Industrial Rubber, Inc. | | | | | | | | | | | | |
| A supplier of industrial maintenance, repair, and operations ("MRO") products, specializing in the fabrication and distribution of lightweight conveyor belting and related conveyor components and accessories. | |
12% (1% PIK) Senior Subordinated Note
due 12/02/2022 | | $ | 3,170,651 | | | 12/02/16 | | | $ | 3,111,849 | | | $ | 3,223,708 | |
| Preferred Stock | | 3,472 shs. | | | 12/02/16 | | | | 347,191 | | | | 308,410 | |
| Common Stock | | 491 shs. | | | 12/02/16 | | | | 491 | | | | — | |
| | | | | | | | | | | | | | | | |
| | | | | | | | | | | 3,459,531 | | | | 3,532,118 | |
| | | | | | | | | | | | | | | | |
| MNX Holding Company | | | | | | | | | | | | | | | |
| An international third party logistics company providing customized logistics services to customers across the globe. | |
14% (2% PIK) Senior Subordinated Note
due 11/02/2019 | | $ | 3,174,953 | | | 11/02/12 | | | | 3,149,072 | | | | 3,174,953 | |
| Common Stock (B) | | 107 shs. | | | 11/02/12 | | | | 107,143 | | | | 87,164 | |
| | | | | | | | | | | | | | | | |
| | | | | | | | | | | 3,256,215 | | | | 3,262,117 | |
| | | | | | | | | | | | | | | | |
| Money Mailer Equity LLC | | | | | | | | | | | | | | | |
| A leading provider of hyperlocal shared direct mail advertising as well as interactive and online advertising solutions through its nationwide production and distribution network. | |
12% (1% PIK) Senior Subordinated Note
due 10/29/2021 | | $ | 3,538,231 | | | 04/29/16 | | | | 3,479,321 | | | | 3,398,754 | |
| | | | | | | | | | | | | | | | |
| | | | | | | | | | | | | | | | |
| Motion Controls Holdings | | | | | | | | | | | | | | | |
| A manufacturer of high performance mechanical motion control and linkage products. | |
14.25% (1.75% PIK) Senior Subordinated Note
due 08/15/2020 | | $ | 844,980 | | | 11/30/10 | | | | 839,069 | | | | 844,980 | |
| Limited Liability Company Unit Class B-1 (B) (F) | | 225,000 uts. | | | 11/30/10 | | | | — | | | | 160,783 | |
| Limited Liability Company Unit Class B-2 (B) (F) | | 20,403 uts. | | | 11/30/10 | | | | — | | | | 14,580 | |
| | | | | | | | | | | | | | | | |
| | | | | | | | | | | 839,069 | | | | 1,020,343 | |
| | | | | | | | | | | | | | | | |
| NetShape Technologies, Inc. | | | | | | | | | | | | | | | |
| A manufacturer of powder metal and metal injection molded precision components used in industrial, consumer, and other applications. | |
| 12% Senior Subordinated Note due 06/10/2020 (D) | | $ | 1,530,000 | | | 02/02/07 | | | | 1,528,882 | | | | — | |
Limited Partnership Interest of Saw Mill PCG Partners LLC (B) | | 2.76% int. | | | 02/01/07 | | | | 1,110,810 | | | | — | |
Limited Liability Company Unit Class D of Saw Mill PCG Partners LLC (B) | | 17 uts. | | | | * | | | | 16,759 | | | | — | |
Limited Liability Company Unit Class D-1 of Saw Mill PCG Partners LLC (B) | | 229 uts. | | | 09/30/09 | | | | 228,858 | | | | — | |
Limited Liability Company Unit Class D-2 of Saw Mill PCG Partners LLC (B) | | 128 uts. | | | 04/29/11 | | | | 65,256 | | | | — | |
| Limited Liability Company Unit Class D-3 of Saw Mill PCG Partners LLC (B) | | 196 uts. | | | 12/10/14 | | | | 196,263 | | | | — | |
| | | | | | | | | | | | | | | | | |
| * 12/18/08 and 09/30/09. | | | | | | | | | | | 3,146,828 | | | | — | |
| | | | | | | | | | | | | | | | | |
| | | | | | | | | | | | | | | | | |
CONSOLIDATED SCHEDULE OF INVESTMENTS (CONTINUED)
June 30, 2017
(Unaudited)
Corporate Restricted Securities: (A) (Continued) | | Principal Amount,
Shares, Units or
Ownership Percentage | | | Acquisition
Date | | | Cost | | | Fair Value | |
| | | | | | | | | | | | | |
| NSi Industries Holdings, Inc. | | | | | | | | | | | | |
| A manufacturer and distributer of electrical components and accessories to small to mid-sized electrical wholesalers. | |
12.75% (1.75% PIK) Senior Subordinated Note
due 05/17/2023 | | $ | 3,099,913 | | | 06/30/16 | | | $ | 3,045,336 | | | $ | 3,151,209 | |
| Common Stock (B) | | 420 shs. | | | 05/17/16 | | | | 420,000 | | | | 502,081 | |
| | | | | | | | | | | | | | | | |
| | | | | | | | | | | 3,465,336 | | | | 3,653,290 | |
| | | | | | | | | | | | | | | | |
| PANOS Brands LLC | | | | | | | | | | | | | | | |
| A marketer and distributor of branded consumer foods in the specialty, natural, better-for-you,"free from" healthy and gluten-free categories. | |
12% (1% PIK) Senior Subordinated Note
due 07/29/2021 | | $ | 2,940,000 | | | 01/29/16 | | | | 2,892,829 | | | | 2,998,800 | |
12% (1% PIK) Senior Subordinated Note
due 08/17/2022 | | $ | 662,879 | | | 02/17/17 | | | | 650,254 | | | | 669,960 | |
| Common Stock Class B (B) | | 772,121 shs. | | | | * | | | | 772,121 | | | | 772,121 | |
| | | | | | | | | | | | | | | | | |
| * 01/29/16 and 02/17/17. | | | | | | | | | | | 4,315,204 | | | | 4,440,881 | |
| | | | | | | | | | | | | | | | | |
| | | | | | | | | | | | | | | | | |
| Petroplex Inv Holdings LLC | | | | | | | | | | | | | | | | |
| A leading provider of acidizing services to E&P customers in the Permian Basin. | |
| Limited Liability Company Unit | | 0.90% int. | | | | * | | | | 420,814 | | | | 16,111 | |
| | | | | | | | | | | | | | | | | |
| * 11/29/12 and 12/20/16. | | | | | | | | | | | | | | | | |
| | | | | | | | | | | | | | | | | |
| Polytex Holdings LLC | | | | | | | | | | | | | | | | |
| A manufacturer of water based inks and related products serving primarily the wall covering market. | |
13% (1% PIK) Senior Subordinated Note
due 01/31/2020 | | $ | 2,165,569 | | | 07/31/14 | | | | 2,142,029 | | | | 2,044,828 | |
| Limited Liability Company Unit | | 300,485 uts. | | | 07/31/14 | | | | 300,485 | | | | 103,637 | |
| | | | | | | | | | | | | | | | | |
| | | | | | | | | | | | 2,442,514 | | | | 2,148,465 | |
| | | | | | | | | | | | | | | | | |
| Power Stop Holdings LLC | | | | | | | | | | | | | | | | |
| A supplier of performance upgrade aftermarket brake products. | | | | | |
| 11% Senior Subordinated Note due 05/29/2022 | | $ | 3,266,800 | | | 05/29/15 | | | | 3,217,409 | | | | 3,299,468 | |
| Limited Liability Company Unit Preferred (B) (F) | | 2,332 uts. | | | 05/29/15 | | | | 233,200 | | | | 279,775 | |
| Limited Liability Company Unit Common (B) (F) | | 2,332 uts. | | | 05/29/15 | | | | — | | | | 221,417 | |
| | | | | | | | | | | | | | | | | |
| | | | | | | | | | | | 3,450,609 | | | | 3,800,660 | |
| | | | | | | | | | | | | | | | | |
Barings Corporate Investors
CONSOLIDATED SCHEDULE OF INVESTMENTS (CONTINUED)
June 30, 2017
(Unaudited)
Corporate Restricted Securities: (A) (Continued) | | Principal Amount,
Shares, Units or
Ownership Percentage | | | Acquisition
Date | | | Cost | | | Fair Value | |
| | | | | | | | | | | | | |
| PPC Event Services | | | | | | | | | | | | |
| A special event equipment rental business. | |
14% (2% PIK) Senior Subordinated Note
due 05/20/2020 | | $ | 2,391,344 | | | 11/20/14 | | | $ | 2,363,388 | | | $ | 2,391,344 | |
| Limited Liability Company Unit (B) | | 7,000 uts. | | | 11/20/14 | | | | 350,000 | | | | 1,011,423 | |
| Limited Liability Company Unit Series A-1 (B) | | 689 uts. | | | 03/16/16 | | | | 86,067 | | | | 115,750 | |
| | | | | | | | | | | | | | | | |
| | | | | | | | | | | 2,799,455 | | | | 3,518,517 | |
| | | | | | | | | | | | | | | | |
| Randy's Worldwide Automotive | | | | | | | | | | | | | | | |
| A designer and distributor of automotive aftermarket parts. | |
| 11.5% Senior Subordinated Note due 05/12/2021 | | $ | 2,304,719 | | | 05/12/15 | | | | 2,272,827 | | | | 2,327,766 | |
| Common Stock (B) | | 240 shs. | | | 05/12/15 | | | | 240,388 | | | | 432,057 | |
| | | | | | | | | | | | | | | | |
| | | | | | | | | | | 2,513,215 | | | | 2,759,823 | |
| | | | | | | | | | | | | | | | |
| Signature Systems Holdings Company | | | | | | | | | | | | | | | |
| A seller and installer of a variety of modular surfaces, industrial matting and related products used for ground protection. | |
| Common Stock (B) | | 181 shs. | | | 03/15/13 | | | | 181,221 | | | | 128,304 | |
Warrant, exercisable until 2023, to purchase common stock at $.01 per share (B) | | 74 shs. | | | 03/15/13 | | | | 67,958 | | | | 52,413 | |
| | | | | | | | | | | | | | | | |
| | | | | | | | | | | 249,179 | | | | 180,717 | |
| | | | | | | | | | | | | | | | |
| Smart Source Holdings LLC | | | | | | | | | | | | | | | |
| A short-term computer rental company. | |
| Limited Liability Company Unit (B) | | 619 uts. | | | | * | | | | 493,496 | | | | 790,082 | |
Warrant, exercisable until 2020, to purchase common stock at $.01 per share (B) | | 157 shs. | | | | * | | | | 127,437 | | | | 200,154 | |
| | | | | | | | | | | | | | | | | |
| * 08/31/07 and 03/06/08. | | | | | | | | | | | 620,933 | | | | 990,236 | |
| | | | | | | | | | | | | | | | | |
| | | | | | | | | | | | | | | | | |
| SMB Machinery Holdings, Inc. | | | | | | | | | | | | | | | | |
| A reseller of used, rebuilt and refurbished packaging and processing equipment, primarily serving the bottling and food manufacturing industries. | |
14% (2% PIK) Senior Subordinated Note
due 10/18/2019 (D) | | $ | 1,477,388 | | | 10/18/13 | | | | 1,452,295 | | | | — | |
| Common Stock (B) | | 1,681 shs. | | | 10/18/13 | | | | 168,100 | | | | — | |
| | | | | | | | | | | | | | | | | |
| | | | | | | | | | | | 1,620,395 | | | | — | |
| | | | | | | | | | | | | | | | | |
| Software Paradigms International Group, LLC | | | | | | | | | | | | | | | | |
| An outsourced IT services provider focused on the retail industry. | |
12.5% (1.5% PIK) Senior Subordinated Note
due 11/23/2021 | | $ | 3,500,000 | | | 05/23/16 | | | | 3,440,446 | | | | 3,535,000 | |
| | | | | | | | | | | | | | | | | |
| | | | | | | | | | | | | | | | | |
CONSOLIDATED SCHEDULE OF INVESTMENTS (CONTINUED)
June 30, 2017
(Unaudited)
Corporate Restricted Securities: (A) (Continued) | | Principal Amount,
Shares, Units or
Ownership Percentage | | | Acquisition
Date | | | Cost | | | Fair Value | |
| | | | | | | | | | | | | |
| SR Smith LLC | | | | | | | | | | | | |
| A manufacturer of mine and tunneling ventilation products in the United States. | |
| 11% Senior Subordinated Note due 03/27/2022 | | $ | 1,760,454 | | | 03/27/17 | | | $ | 1,739,325 | | | $ | 1,760,454 | |
| Limited Liability Company Unit Class A (B) (F) | | 29 uts. | | | 03/27/17 | | | | 1,717,802 | | | | 1,475,918 | |
| | | | | | | | | | | | | | | | |
| | | | | | | | | | | 3,457,127 | | | | 3,236,372 | |
| | | | | | | | | | | | | | | | |
| Strahman Holdings Inc | | | | | | | | | | | | | | | |
| A manufacturer of industrial valves and wash down equipment for a variety of industries, including chemical, petrochemical, polymer, pharmaceutical, food processing, beverage and mining. | |
14% (2% PIK) Senior Subordinated Note
due 06/13/2019 | | $ | 2,119,565 | | | 12/13/13 | | | | 2,093,476 | | | | 2,111,744 | |
| Preferred Stock Series A (B) | | 317,935 shs. | | | 12/13/13 | | | | 317,935 | | | | 375,163 | |
| Preferred Stock Series A-2 (B) | | 53,086 shs. | | | 09/10/15 | | | | 59,987 | | | | 62,641 | |
| | | | | | | | | | | | | | | | |
| | | | | | | | | | | 2,471,398 | | | | 2,549,4548 | |
| | | | | | | | | | | | | | | | |
| Sunrise Windows Holding Company | | | | | | | | | | | | | | | |
| A manufacturer and marketer of premium vinyl windows exclusively selling to the residential remodeling and replacement market. | |
| 16% Senior Subordinated Note due 01/31/2019 (D) | | $ | 4,285,410 | | | | * | | | | 4,075,756 | | | | 2,999,787 | |
| Common Stock (B) | | 115 shs. | | | 12/14/10 | | | | 114,504 | | | | — | |
Warrant, exercisable until 2020, to purchase common stock at $.01 per share (B) | | 112 shs. | | | 12/14/10 | | | | 111,747 | | | | — | |
| | | | | | | | | | | | | | | | | |
| * 12/14/10, 08/17/12 and 03/31/16. | | | | | | | | | | | 4,302,007 | | | | 2,999,787 | |
| | | | | | | | | | | | | | | | | |
| | | | | | | | | | | | | | | | | |
| Sunvair Aerospace Group Inc. | | | | | | | | | | | | | | | | |
| An aerospace maintenance, repair, and overhaul provider servicing landing gears on narrow body aircraft. | |
12% (1% PIK) Senior Subordinated Note
due 07/31/2021 | | $ | 2,478,788 | | | 07/31/15 | | | | 2,429,459 | | | | 2,453,647 | |
| Common Stock (B) | | 139 shs. | | | 07/31/15 | | | | 158,560 | | | | 105,675 | |
| | | | | | | | | | | | | | | | | |
| | | | | | | | | | | | 2,588,019 | | | | 2,559,322 | |
| | | | | | | | | | | | | | | | | |
| | | | | | | | | | | | | | | | | |
| Team Drive-Away Holdings LLC | | | | | | | | | | | | | | | | |
| An asset-light provider of over the road driveaway services for class 8 trucks and specialized equipment. | |
| Limited Liability Company Unit (B) | | 194,400 uts. | | | 10/15/15 | | | | 194,400 | | | | 244,750 | |
| | | | | | | | | | | | | | | | | |
| | | | | | | | | | | | | | | | | |
| Torrent Group Holdings, Inc. | | | | | | | | | | | | | | | | |
| A contractor specializing in the sales and installation of engineered drywells for the retention and filtration of stormwater and nuisance water flow. | |
15% (7.5% PIK) Senior Subordinated Note
due 12/05/2020 | | $ | 134,039 | | | 12/05/13 | | | | 415,666 | | | | 134,039 | |
Warrant, exercisable until 2023, to purchase common stock at $.01 per share (B) | | 53,038 shs. | | | 12/05/13 | | | | — | | | | 21,215 | |
| | | | | | | | | | | | | | | | | |
| | | | | | | | | | | | 415,666 | | | | 155,254 | |
| | | | | | | | | | | | | | | | | |
Barings Corporate Investors
CONSOLIDATED SCHEDULE OF INVESTMENTS (CONTINUED)
June 30, 2017
(Unaudited)
Corporate Restricted Securities: (A) (Continued) | | Principal Amount,
Shares, Units or
Ownership Percentage | | | Acquisition
Date | | | Cost | | | Fair Value | |
| | | | | | | | | | | | | |
| Tranzonic Holdings LLC | | | | | | | | | | | | |
| A producer of commercial and industrial supplies, such as safety products, janitorial supplies, work apparel, washroom and restroom supplies and sanitary care products. | |
| Limited Liability Company Unit Preferred Class A (B) | | 305,393 uts. | | | | * | | | $ | 332,498 | | | $ | 1,182,907 | |
| | | | | | | | | | | | | | | | |
| * 07/05/13 and 02/13/17. | | | | | | | | | | | | | | | |
| | | | | | | | | | | | | | | | |
| Tristar Global Energy Solutions, Inc. | | | | | | | | | | | | | | | |
| A hydrocarbon and decontamination services provider serving refineries worldwide. | |
12.5% (1.5% PIK) Senior Subordinated Note
due 07/31/2020 | | $ | 2,337,355 | | | 01/23/15 | | | | 2,307,736 | | | | 2,325,560 | |
| | | | | | | | | | | | | | | | | |
| | | | | | | | | | | | | | | | | |
| Veritext Corporation | | | | | | | | | | | | | | | | |
| A provider of stenographic staffing and other services used during the legal deposition process. | |
| 10.75% Second Lien Term Loan due 01/29/2023 | | $ | 4,083,333 | | | | * | | | | 4,016,564 | | | | 4,015,949 | |
| | | | | | | | | | | | | | | | | |
| * 01/21/16 and 02/23/17. | | | | | | | | | | | | | | | | |
| | | | | | | | | | | | | | | | | |
| VP Holding Company | | | | | | | | | | | | | | | | |
| A provider of school transportation services for special-needs and homeless children in Massachusetts. | |
| Common Stock (B) | | 7,368 shs. | | | 03/31/14 | | | | 736,842 | | | | 1,001,535 | |
| | | | | | | | | | | | | | | | | |
| | | | | | | | | | | | | | | | | |
| Wellborn Forest Holding Company | | | | | | | | | | | | | | | | |
| A manufacturer of semi-custom kitchen and bath cabinetry. | |
| 8% Senior Subordinated Note due 09/30/2019 (D) | | $ | 3,359,243 | | | 11/30/06 | | | | 1,481,602 | | | | 3,359,243 | |
| Common Stock (B) | | 191 shs. | | | 11/30/06 | | | | 191,250 | | | | — | |
Warrant, exercisable until 2019, to purchase common stock at $.01 per share (B) | | 95 shs. | | | 11/30/06 | | | | 86,493 | | | | — | |
| | | | | | | | | | | | | | | | | |
| | | | | | | | | | | | 1,759,345 | | | | 3,359,243 | |
| | | | | | | | | | | | | | | | | |
| | | | | | | | | | | | | | | | | |
| Westminster Acquisition LLC | | | | | | | | | | | | | | | | |
| A manufacturer of premium, all-natural oyster cracker products sold under the Westminster and Olde Cape Cod brands. | |
12% (1% PIK) Senior Subordinated Note
due 02/03/2021 | | $ | 765,668 | | | 08/03/15 | | | | 755,010 | | | | 780,981 | |
| Limited Liability Company Unit (B) (F) | | 751,212 uts. | | | 08/03/15 | | | | 751,212 | | | | 1,159,221 | |
| | | | | | | | | | | | | | | | | |
| | | | | | | | | | | | 1,506,222 | | | | 1,940,202 | |
| | | | | | | | | | | | | | | | | |
| | | | | | | | | | | | | | | | | |
CONSOLIDATED SCHEDULE OF INVESTMENTS (CONTINUED)
June 30, 2017
(Unaudited)
Corporate Restricted Securities: (A) (Continued) | | Principal Amount,
Shares, Units or
Ownership Percentage | | | | Acquisition
Date | | | Cost | | | Fair Value | |
| | | | | | | | | | | | | | |
| Whitebridge Pet Brands Holdings, LLC | | | | | | | | | | | | | |
| A portfolio of natural treats and foods for dogs and cats. | |
11.5% (0.5% PIK) Senior Subordinated Note
due 08/18/2021 | | $ 3,007,896 shs. | | | | 04/18/17 | | | $ | 2,964,317 | | | $ | 3,016,714 | |
| Limited Liability Company Unit Class A (B) (F) | | 250 uts. | | | | 04/18/17 | | | | 300,485 | | | | 300,480 | |
| Limited Liability Company Unit Class B (B) (F) | | 250 uts. | | | | 04/18/17 | | | | — | | | | — | |
| | | | | | | | | | | | | | | | |
| | | | | | | | | | | 3,264,802 | | | | 3,317,194 | |
| | | | | | | | | | | | | | | | |
| Wolf-Gordon, Inc. | | | | | | | | | | | | | | | |
| A designer and specialty distributor of wallcoverings and related building products, including textiles, paint, and writeable surfaces. | |
12.5% (1.5% PIK) Senior Subordinated Note
due 07/22/2021 | | $ | 3,251,247 | | | | 01/22/16 | | | | 3,200,236 | | | | 3,316,272 | |
| Common Stock (B) | | 318 shs. | | | | 01/22/16 | | | | 318,182 | | | | 322,069 | |
| | | | | | | | | | | | | | | | | |
| | | | | | | | | | | | 3,518,418 | | | | 3,638,341 | |
| | | | | | | | | | | | | | | | | |
| Worldwide Express Operations, LLC | | | | | | | | | | | | | | | | |
| A third party logistics company providing parcel, less than truck load and truck load services focused on the small and medium business market through both company owned and franchise locations. | |
| 9.78% Second Lien Term Loan due 01/19/2025 | | $ | 3,500,000 | | | | 02/13/17 | | | | 3,449,988 | | | | 3,464,535 | |
| | | | | | | | | | | | | | | | | |
| | | | | | | | | | | | | | | | | |
| WP Supply Holding Corporation | | | | | | | | | | | | | | | | |
| A distributor of fresh fruits and vegetables to grocery wholesalers and foodservice distributors in the upper Midwest. | |
14.5% (2.5% PIK) Senior Subordinated Note
due 06/12/2020 | | $ | 2,936,402 | | | | 11/03/11 | | | | 2,922,208 | | | | 2,936,402 | |
| Common Stock (B) | | 4,500 shs. | | | | 11/03/11 | | | | 450,000 | | | | 312,819 | |
| | | | | | | | | | | | | | | | | |
| | | | | | | | | | | | 3,372,208 | | | | 3,249,221 | |
| | | | | | | | | | | | | | | | | |
| York Wall Holding Company | | | | | | | | | | | | | | | | |
| A designer, manufacturer and marketer of wall covering products for both residential and commercial wall coverings. | |
12.5% (1.5% PIK) Senior Subordinated Note
due 03/04/2021 (D) | | $ | 3,190,238 | | | | 03/04/15 | | | | 3,144,099 | | | | 2,819,314 | |
| Common Stock (B) | | 3,723 shs. | | | | 03/04/15 | | | | 372,300 | | | | 139,786 | |
| | | | | | | | | | | | | | | | | |
| | | | | | | | | | | | 3,516,399 | | | | 2,959,100 | |
| | | | | | | | | | | | | | | | | |
| | | | | | | | | | | | | | | | | |
| | | | | | | | | | | | | | | | | |
| Total Private Placement Investments (E) | | | | | | | | | | $ | 212,435,568 | | | $ | 216,971,616 | |
| | | | | | | | | | | | | | | | | |
Barings Corporate Investors
CONSOLIDATED SCHEDULE OF INVESTMENTS (CONTINUED)
June 30, 2017
(Unaudited)
Corporate Restricted Securities: (A) (Continued) | | Interest
Rate | | Maturity
Date | | Principal
Amount | | | Cost | | | Market
Value | |
| | | | | | | | | | | | | | |
| Rule 144A Securities - 19.44%: | | | | | | | | | | | | | |
| | | | | | | | | | | | | | |
| Bonds - 19.44% | | | | | | | | | | | | | |
| Altice Financing S.A. | | | 7.500 | % | 05/15/26 | | $ | 1,000,000 | | | $ | 1,060,025 | | | $ | 1,110,000 | |
| Altice S.A. | | | 7.750 | | 05/15/22 | | | 1,000,000 | | | | 1,000,000 | | | | 1,061,250 | |
| American Airlines Group Inc. | | | 5.500 | | 10/01/19 | | | 870,000 | | | | 889,810 | | | | 916,197 | |
| Amsted Industries | | | 5.375 | | 09/15/24 | | | 520,000 | | | | 520,000 | | | | 538,200 | |
| Belden Inc. | | | 5.250 | | 07/15/24 | | | 410,000 | | | | 410,000 | | | | 424,350 | |
| Boise Cascade Company | | | 5.625 | | 09/01/24 | | | 259,000 | | | | 259,000 | | | | 266,770 | |
| CITGO Holding, Inc. | | | 10.750 | | 02/15/20 | | | 1,000,000 | | | | 1,015,908 | | | | 1,086,250 | |
| CITGO Petroleum Corporation | | | 6.250 | | 08/15/22 | | | 925,000 | | | | 925,000 | | | | 938,875 | |
| Consolidated Energy Finance S.A. | | | 6.750 | | 10/15/19 | | | 394,000 | | | | 390,405 | | | | 401,880 | |
| Constellium N.V. | | | 7.875 | | 04/01/21 | | | 743,000 | | | | 743,000 | | | | 795,010 | |
| Cornerstone Chemical Company | | | 9.375 | | 03/15/18 | | | 1,000,000 | | | | 1,004,410 | | | | 1,000,000 | |
| Coveris Holdings S.A. | | | 7.875 | | 11/01/19 | | | 1,000,000 | | | | 1,000,000 | | | | 985,000 | |
| CTP Transportation Products, LLC | | | 8.250 | | 12/15/19 | | | 635,000 | | | | 635,000 | | | | 591,344 | |
| CVR Partners, LP. | | | 9.250 | | 06/15/23 | | | 1,000,000 | | | | 977,789 | | | | 1,046,250 | |
| Dean Foods | | | 6.500 | | 03/15/23 | | | 663,000 | | | | 663,000 | | | | 699,465 | |
Diamond 1 Finance Corp / Diamond 2 Finance Corp (Dell) | | | 5.875 | | 06/15/21 | | | 228,000 | | | | 228,000 | | | | 238,830 | |
| Digicel Group Limited | | | 6.000 | | 04/15/21 | | | 1,000,000 | | | | 926,502 | | | | 958,750 | |
| Eagle Holding Co II LLC | | | 7.625 | | 05/15/22 | | | 208,000 | | | | 208,000 | | | | 213,980 | |
| Endo Finance LLC | | | 5.375 | | 01/31/23 | | | 1,000,000 | | | | 982,429 | | | | 835,000 | |
| EnPro Industries Inc. | | | 5.875 | | 09/15/22 | | | 250,000 | | | | 252,392 | | | | 260,625 | |
| EP Energy Corporation | | | 8.000 | | 11/29/24 | | | 500,000 | | | | 500,000 | | | | 498,750 | |
| First Quantum Minerals Ltd. | | | 7.500 | | 04/01/25 | | | 1,000,000 | | | | 971,620 | | | | 977,500 | |
| Gates Global LLC | | | 6.000 | | 07/15/22 | | | 1,000,000 | | | | 803,238 | | | | 1,002,500 | |
| Hertz Corporation | | | 7.625 | | 06/01/22 | | | 1,000,000 | | | | 1,000,000 | | | | 997,600 | |
| Hilcorp Energy Company | | | 5.000 | | 12/01/24 | | | 500,000 | | | | 500,000 | | | | 460,000 | |
| Hill-Rom Holdings, Inc. | | | 5.750 | | 09/01/23 | | | 385,000 | | | | 385,000 | | | | 405,213 | |
| Hub International Ltd. | | | 7.875 | | 10/01/21 | | | 1,000,000 | | | | 1,000,000 | | | | 1,042,500 | |
| IAMGOLD Corporation | | | 7.000 | | 04/15/25 | | | 1,000,000 | | | | 1,000,000 | | | | 1,030,000 | |
| Infor (US), Inc. | | | 5.750 | | 08/15/20 | | | 226,000 | | | | 224,498 | | | | 233,345 | |
| International Automotive Component | | | 9.125 | | 06/01/18 | | | 1,000,000 | | | | 989,168 | | | | 977,500 | |
| J.B. Poindexter Co., Inc. | | | 9.000 | | 04/01/22 | | | 1,000,000 | | | | 1,033,486 | | | | 1,048,750 | |
| JBS USA Holdings, Inc. | | | 7.750 | | 10/28/20 | | | 750,000 | | | | 772,450 | | | | 710,475 | |
| JDA Escrow LLC | | | 7.375 | | 10/15/24 | | | 179,000 | | | | 179,000 | | | | 186,160 | |
| Jupiter Resources Inc. | | | 8.500 | | 10/01/22 | | | 1,000,000 | | | | 944,230 | | | | 750,000 | |
| KeHE Distributors, LLC | | | 7.625 | | 08/15/21 | | | 1,000,000 | | | | 1,041,522 | | | | 1,002,500 | |
| LBC Tank Terminals Holding Netherlands B.V. | | | 6.875 | | 05/15/23 | | | 1,315,000 | | | | 1,343,787 | | | | 1,364,313 | |
| Mallinckrodt PLC | | | 5.750 | | 08/01/22 | | | 1,000,000 | | | | 1,000,000 | | | | 940,000 | |
| Micron Technology, Inc. | | | 5.250 | | 08/01/23 | | | 669,000 | | | | 669,000 | | | | 694,757 | |
CONSOLIDATED SCHEDULE OF INVESTMENTS (CONTINUED)
June 30, 2017
(Unaudited)
| Corporate Restricted Securities: (A) (Continued) | | Interest
Rate | | Maturity
Date | | Principal
Amount | | | Cost | | | Market
Value | |
| Moog Inc. | | | 5.250 | % | 12/01/22 | | $ | 1,000,000 | | | $ | 1,005,851 | | | $ | 1,040,000 | |
| New Gold Inc. | | | 6.250 | | 11/15/22 | | | 1,000,000 | | | | 1,004,788 | | | | 1,027,500 | |
| New Gold Inc. | | | 6.375 | | 05/15/25 | | | 231,000 | | | | 231,000 | | | | 237,930 | |
| Numericable Group SA | | | 6.000 | | 05/15/22 | | | 1,000,000 | | | | 980,010 | | | | 1,046,250 | |
| Onex Corporation | | | 8.500 | | 10/01/22 | | | 1,352,000 | | | | 1,289,319 | | | | 1,301,300 | |
| OPE KAG Finance Sub | | | 7.875 | | 07/31/23 | | | 1,750,000 | | | | 1,810,954 | | | | 1,837,500 | |
| Orchestra Borrower LLC/Orchestra Co-Issuer, Inc. | | | 6.750 | | 06/15/22 | | | 174,000 | | | | 174,000 | | | | 179,290 | |
| Park-Ohio Industries Inc. | | | 6.625 | | 04/15/27 | | | 343,000 | | | | 343,000 | | | | 360,150 | |
| Peabody Energy Corporation | | | 6.615 | | 03/31/25 | | | 1,000,000 | | | | 985,354 | | | | 985,000 | |
| Pinnacle Operating Corporation | | | 9.000 | | 05/15/23 | | | 756,588 | | | | 941,414 | | | | 718,759 | |
| Prime Security Services Borrower | | | 9.250 | | 05/15/23 | | | 1,000,000 | | | | 1,000,000 | | | | 1,086,660 | |
| PSPC Escrow Corp | | | 6.500 | | 02/01/22 | | | 299,000 | | | | 259,448 | | | | 308,718 | |
| Sabre GLBL Inc. | | | 5.250 | | 11/15/23 | | | 251,000 | | | | 251,000 | | | | 260,413 | |
| Signode Industrial Group | | | 6.375 | | 05/01/22 | | | 1,265,000 | | | | 1,239,160 | | | | 1,321,925 | |
| Sinclair Television Group, Inc. | | | 5.125 | | 02/15/27 | | | 1,000,000 | | | | 1,000,000 | | | | 967,500 | |
| Sirius XM Radio Inc. | | | 5.375 | | 04/15/25 | | | 250,000 | | | | 250,000 | | | | 258,438 | |
| Sirius XM Radio Inc. | | | 5.375 | | 07/15/26 | | | 1,000,000 | | | | 993,970 | | | | 1,035,000 | |
| Sonic Automotive, Inc. | | | 6.125 | | 03/15/27 | | | 352,000 | | | | 352,000 | | | | 350,240 | |
| Suncoke Energy | | | 7.500 | | 06/15/25 | | | 1,000,000 | | | | 984,670 | | | | 987,500 | |
| Tallgrass Operations LLC | | | 5.500 | | 09/15/24 | | | 605,000 | | | | 605,000 | | | | 612,562 | |
| Teine Energy Ltd. | | | 6.875 | | 09/30/22 | | | 1,300,000 | | | | 1,308,753 | | | | 1,317,875 | |
| Tempo Acquisition LLC | | | 6.750 | | 06/01/25 | | | 216,000 | | | | 216,000 | | | | 220,860 | |
| Topaz Marine S.A. | | | 8.625 | | 11/01/18 | | | 1,000,000 | | | | 1,000,000 | | | | 993,140 | |
| Tullow Oil Plc | | | 6.250 | | 04/15/22 | | | 725,000 | | | | 553,243 | | | | 660,655 | |
| United States Steel Corp. | | | 8.375 | | 07/01/21 | | | 195,000 | | | | 195,000 | | | | 214,500 | |
| Unitymedia KabelBW GmbH | | | 6.125 | | 01/15/25 | | | 1,000,000 | | | | 1,000,000 | | | | 1,072,500 | |
| Univision Communications, Inc. | | | 5.125 | | 05/15/23 | | | 325,000 | | | | 325,000 | | | | 328,145 | |
| Univision Communications, Inc. | | | 5.125 | | 02/15/25 | | | 860,000 | | | | 869,488 | | | | 852,475 | |
| UPCB Finance IV Limited | | | 5.375 | | 01/15/25 | | | 425,000 | | | | 425,000 | | | | 444,656 | |
| USIS Merger Sub Inc. | | | 6.875 | | 05/01/25 | | | 1,000,000 | | | | 1,000,000 | | | | 1,017,500 | |
| Virgin Media Secured Finance PLC | | | 5.250 | | 01/15/26 | | | 1,000,000 | | | | 1,005,420 | | | | 1,040,810 | |
| VRX Escrow Corp. | | | 5.875 | | 05/15/23 | | | 1,500,000 | | | | 1,138,983 | | | | 1,286,250 | |
| Watco Companies, L.L.C. | | | 6.375 | | 04/01/23 | | | 1,000,000 | | | | 1,000,000 | | | | 1,042,500 | |
| Welltec A/S | | | 8.000 | | 02/01/19 | | | 750,000 | | | | 745,504 | | | | 727,500 | |
| West Corporation | | | 5.375 | | 07/15/22 | | | 1,000,000 | | | | 986,319 | | | | 1,010,000 | |
| WMG Acquisition Corp. | | | 6.750 | | 04/15/22 | | | 1,000,000 | | | | 1,036,360 | | | | 1,051,250 | |
| Wolverine World Wide, Inc. | | | 5.000 | | 09/01/26 | | | 666,000 | | | | 666,000 | | | | 656,842 | |
| Zekelman Industries, Inc | | | 9.875 | | 06/15/23 | | | 230,000 | | | | 230,000 | | | | 258,462 | |
| | | | | | | | | | | | | | | | | | |
| Total Bonds | | | | | | | | | | | | 57,849,677 | | | | 58,808,444 | |
| | | | | | | | | | | | | | | | | | |
Barings Corporate Investors
CONSOLIDATED SCHEDULE OF INVESTMENTS (CONTINUED)
June 30, 2017
(Unaudited)
| | | | | | | | | | |
Corporate Restricted Securities: (A) (Continued) | | Shares | | | Cost | | | Market
Value | |
| | | | | | | | | | |
| Common Stock - 0.00% | | | | | | | | | |
| TherOX, Inc. (B) | | | 6 | | | $ | — | | | $ | — | |
| Touchstone Health Partnership (B) | | | 1,168 | | | | — | | | | — | |
| | | | | | | | | | | | | |
| Total Common Stock | | | | | | | — | | | | — | |
| | | | | | | | | | | | | |
| | | | | | | | | | | | | |
| Total Rule 144A Securities | | | | | | | 57,849,677 | | | | 58,808,444 | |
| | | | | | | | | | | | | |
| | | | | | | | | | | | | |
| Total Corporate Restricted Securities | | | | | | $ | 270,285,245 | | | $ | 275,780,060 | |
| | | | | | | | | | | | | |
CONSOLIDATED SCHEDULE OF INVESTMENTS (CONTINUED)
June 30, 2017
(Unaudited)
| Corporate Public Securities - 15.28%: (A) | | Interest
Rate | | Maturity
Date | | Principal
Amount | | | Cost | | | Market
Value | |
| | | | | | | | | | | | | | |
| Bank Loans - 2.72% | | | | | | | | | | | | | |
| Almonde, Inc. | | | 8.459 | % | 06/13/25 | | $ | 940,734 | | | $ | 958,960 | | | $ | 956,858 | |
| Aquilex Holdings LLC | | | 6.500 | | 12/31/20 | | | 273,105 | | | | 272,760 | | | | 267,643 | |
| Caelus Energy Alaska, LLC | | | 8.750 | | 04/15/20 | | | 1,000,000 | | | | 995,136 | | | | 858,330 | |
| Fieldwood Energy LLC | | | 8.000 | | 08/31/20 | | | 344,430 | | | | 314,130 | | | | 321,181 | |
| Fieldwood Energy LLC | | | 8.375 | | 09/30/20 | | | 1,044,008 | | | | 562,026 | | | | 576,815 | |
| Fieldwood Energy LLC | | | 8.375 | | 09/30/20 | | | 1,455,992 | | | | 873,994 | | | | 1,146,593 | |
| Gulf Finance LLC | | | 6.300 | | 08/25/23 | | | 523,337 | | | | 518,796 | | | | 486,049 | |
| K&N Engineering, Inc. | | | 9.750 | | 12/31/99 | | | 1,000,000 | | | | 981,645 | | | | 987,500 | |
| Kronos Incorporated | | | 9.284 | | 12/31/99 | | | 409,457 | | | | 405,675 | | | | 424,640 | |
| RadNet Management Inc. | | | 8.150 | | 12/31/99 | | | 1,000,000 | | | | 997,854 | | | | 1,002,500 | |
| Power Products LLC | | | 5.530 | | 01/24/23 | | | 267,591 | | | | 266,343 | | | | 267,926 | |
| Seadrill Partners Finco, LLC | | | 4.000 | | 02/21/21 | | | 984,694 | | | | 535,501 | | | | 626,265 | |
| Summit Midstream Holdings, LLC | | | 7.022 | | 03/06/22 | | | 306,680 | | | | 303,775 | | | | 309,747 | |
| | | | | | | | | | | | | | | | | | |
| Total Bank Loans | | | | | | | | | | | | 7,986,595 | | | | 8,232,047 | |
| | | | | | | | | | | | | | | | | | |
| | | | | | | | | | | | | | | | | | |
| Bonds - 12.41% | | | | | | | | | | | | | | | | | |
| A. Schulman Inc. | | | 6.875 | | 06/01/23 | | | 1,000,000 | | | | 1,011,386 | | | | 1,057,500 | |
| Alere Inc. | | | 7.250 | | 07/01/18 | | | 940,000 | | | | 954,329 | | | | 941,175 | |
| Anixter, Inc. | | | 5.500 | | 03/01/23 | | | 1,000,000 | | | | 1,000,000 | | | | 1,068,750 | |
| Antero Resources Corporation | | | 5.375 | | 11/01/21 | | | 800,000 | | | | 800,000 | | | | 808,000 | |
| Beazer Homes USA Inc. | | | 6.750 | | 03/15/25 | | | 598,000 | | | | 598,000 | | | | 623,415 | |
| Beazer Homes USA Inc. | | | 8.750 | | 03/15/22 | | | 320,000 | | | | 320,000 | | | | 356,800 | |
| Boyd Gaming Corporation | | | 6.375 | | 04/01/26 | | | 197,000 | | | | 197,000 | | | | 213,006 | |
| Calpine Corporation | | | 5.750 | | 01/15/25 | | | 700,000 | | | | 700,000 | | | | 656,250 | |
| CHS/Community Health Systems, Inc. | | | 5.125 | | 08/01/21 | | | 480,000 | | | | 472,541 | | | | 486,000 | |
| CHS/Community Health Systems, Inc. | | | 6.250 | | 03/31/23 | | | 298,000 | | | | 298,000 | | | | 307,640 | |
| Clearwater Paper Corporation | | | 4.500 | | 02/01/23 | | | 750,000 | | | | 745,321 | | | | 738,750 | |
| Commercial Metals Company | | | 4.875 | | 05/15/23 | | | 1,500,000 | | | | 1,502,035 | | | | 1,516,875 | |
| CVR Refining LLC | | | 6.500 | | 11/01/22 | | | 650,000 | | | | 635,013 | | | | 654,875 | |
| EP Energy Corporation | | | 9.375 | | 05/01/20 | | | 819,000 | | | | 437,827 | | | | 645,986 | |
| Ferrellgas Partners, L.P | | | 6.750 | | 01/15/22 | | | 1,000,000 | | | | 1,005,526 | | | | 940,000 | |
| Ferrellgas Partners, L.P | | | 8.625 | | 06/15/20 | | | 1,048,000 | | | | 1,048,778 | | | | 990,360 | |
| Forum Energy Technologies | | | 6.250 | | 10/01/21 | | | 325,000 | | | | 325,000 | | | | 316,875 | |
| GEO Group, Inc. (The) | | | 5.875 | | 01/15/22 | | | 1,000,000 | | | | 954,330 | | | | 1,040,000 | |
| HCA Holdings, Inc. | | | 5.375 | | 02/01/25 | | | 150,000 | | | | 152,240 | | | | 158,220 | |
| HealthSouth Corporation | | | 5.750 | | 11/01/24 | | | 579,000 | | | | 582,331 | | | | 594,199 | |
| Hughes Satellite Systems Corporation | | | 6.625 | | 08/01/26 | | | 1,250,000 | | | | 1,233,962 | | | | 1,343,750 | |
| Icahn Enterprises L.P. | | | 6.000 | | 08/01/20 | | | 1,150,000 | | | | 1,161,826 | | | | 1,183,781 | |
| Kindred Healthcare, Inc. | | | 8.750 | | 01/15/23 | | | 1,000,000 | | | | 1,000,000 | | | | 1,051,250 | |
| Lamar Media Corp. | | | 5.375 | | 01/15/24 | | | 320,000 | | | | 320,000 | | | | 334,400 | |
Barings Corporate Investors
CONSOLIDATED SCHEDULE OF INVESTMENTS (CONTINUED)
June 30, 2017
(Unaudited)
Corporate Public Securities: (A) (Continued) | | Interest
Rate | | Maturity
Date | | Shares or
Principal
Amount | | | Cost | | | Market
Value | |
| Laredo Petroleum, Inc. | | | 5.625 | % | 01/15/22 | | $ | 1,000,000 | | | $ | 951,273 | | | $ | 970,000 | |
| Level 3 Communications Inc. | | | 5.250 | | 03/15/26 | | | 858,000 | | | | 878,096 | | | | 890,269 | |
| Meritor, Inc. | | | 6.750 | | 06/15/21 | | | 1,000,000 | | | | 1,000,000 | | | | 1,035,000 | |
| Meritor, Inc. | | | 7.875 | | 03/01/26 | | | 669,000 | | | | 663,403 | | | | 1,138,136 | |
| Micron Technology, Inc. | | | 7.500 | | 09/15/23 | | | 403,000 | | | | 403,000 | | | | 450,554 | |
| NRG Energy, Inc. | | | 7.250 | | 05/15/26 | | | 500,000 | | | | 503,057 | | | | 517,500 | |
| NRG Energy, Inc. | | | 6.625 | | 01/15/27 | | | 1,000,000 | | | | 954,728 | | | | 1,001,250 | |
| Oasis Petroleum Inc. | | | 6.875 | | 03/15/22 | | | 1,000,000 | | | | 1,000,000 | | | | 970,000 | |
| PBF Holding Company LLC | | | 7.000 | | 11/15/23 | | | 65,000 | | | | 65,000 | | | | 64,025 | |
| Perry Ellis International, Inc. | | | 7.875 | | 04/01/19 | | | 250,000 | | | | 249,170 | | | | 250,000 | |
| P.H. Glatfelter Company | | | 5.375 | | 10/15/20 | | | 1,000,000 | | | | 1,006,865 | | | | 1,022,500 | |
| Ply Gem Industries, Inc. | | | 6.500 | | 02/01/22 | | | 1,000,000 | | | | 949,567 | | | | 1,042,920 | |
| Precision Drilling Corporation | | | 6.625 | | 11/15/20 | | | 448,432 | | | | 454,936 | | | | 438,343 | |
| Select Medical Corporation | | | 6.375 | | 06/01/21 | | | 650,000 | | | | 655,772 | | | | 667,875 | |
| SM Energy Company | | | 6.750 | | 09/15/26 | | | 1,500,000 | | | | 1,487,595 | | | | 1,432,020 | |
| Sprint Corporation | | | 7.125 | | 06/15/24 | | | 315,000 | | | | 315,000 | | | | 350,438 | |
| Suburban Propane Partners, L.P. | | | 5.750 | | 03/01/25 | | | 1,000,000 | | | | 1,000,000 | | | | 990,000 | |
| Summit Midstream Holdings, LLC | | | 5.500 | | 08/15/22 | | | 170,000 | | | | 127,625 | | | | 169,788 | |
| Sunoco LP | | | 6.250 | | 04/15/21 | | | 840,000 | | | | 835,924 | | | | 877,800 | |
| Tenet Healthcare Corporation | | | 6.750 | | 06/15/23 | | | 725,000 | | | | 722,053 | | | | 725,000 | |
| TransDigm Group, Inc. | | | 6.375 | | 06/15/26 | | | 1,000,000 | | | | 977,970 | | | | 1,015,000 | |
| Triumph Group, Inc. | | | 4.875 | | 04/01/21 | | | 1,000,000 | | | | 961,215 | | | | 993,750 | |
| Western Digital Corporation | | | 10.500 | | 04/01/24 | | | 494,000 | | | | 494,000 | | | | 582,762 | |
| William Lyon Homes | | | 7.000 | | 08/15/22 | | | 1,000,000 | | | | 1,000,000 | | | | 1,035,000 | |
| WPX Energy, Inc. | | | 5.250 | | 09/15/24 | | | 925,000 | | | | 925,000 | | | | 878,750 | |
| | | | | | | | | | | | | | | | | | |
| Total Bonds | | | | | | | | | | | | 36,036,694 | | | | 37,536,537 | |
| | | | | | | | | | | | | | | | | | |
| | | | | | | | | | | | | | | | | | |
| Common Stock - 0.00% | | | | | | | | | | | | | | | | | |
| Chase Packaging Corporation | | | | | | | | 9,541 | | | | — | | | | 207 | |
| | | | | | | | | | | | | | | | | | |
| Total Common Stock | | | | | | | | | | | | — | | | | 207 | |
| | | | | | | | | | | | | | | | | | |
| Preferred Stock - 0.15% | | | | | | | | | | | | | | | | | |
| Pinnacle Operating Corporation | | | | | | | | 519,298 | | | | 339,854 | | | | 446,596 | |
| | | | | | | | | | | | | | | | | | |
| Total Preferred Stock | | | | | | | | | | | | 339,854 | | | | 446,596 | |
| | | | | | | | | | | | | | | | | | |
| | | | | | | | | | | | | | | | | | |
| Total Corporate Public Securities | | | | | | | | | | | $ | 44,363,143 | | | $ | 46,215,387 | |
| | | | | | | | | | | | | | | | | | |
CONSOLIDATED SCHEDULE OF INVESTMENTS (CONTINUED)
June 30, 2017
(Unaudited)
| Short-Term Securities: | | Interest
Rate/Yield^ | | Maturity
Date | | Principal
Amount | | | Cost | | | Market
Value | |
| | | | | | | | | | | | | | |
| Commercial Paper - 0.66% | | | | | | | | | | | | | |
| Ryder System Inc | | | 1.400 | % | 07/18/17 | | $ | 2,000,000 | | | $ | 1,998,678 | | | $ | 1,998,678 | |
| | | | | | | | | | | | | | | | | | |
| Total Short-Term Securities | | | | | | | | | | | $ | 1,998,678 | | | $ | 1,998,678 | |
| | | | | | | | | | | | | | | | | | |
| | | | | | | | | | | | | | | | | | |
| Total Investments | | | 107.12 | % | | | | | | | $ | 316,647,066 | | | $ | 323,994,125 | |
| | | | | | | | | | | | | | | | | | |
| | | | | | | | | | | | | | | | | | |
| Other Assets | | | 4.23 | | | | | | | | | | | | | 12,780,126 | |
| | | | | | | | | | | | | | | | | | |
| Liabilities | | | (11.35 | ) | | | | | | | | | | | | (34,320,153 | ) |
| | | | | | | | | | | | | | | | | | |
| | | | | | | | | | | | | | | | | | |
| Total Net Assets | | | 100.00 | % | | | | | | | | | | | $ | 302,454,098 | |
| | | | | | | | | | | | | | | | | | |
| (A) | In each of the convertible note, warrant, convertible preferred and common stock investments, the issuer has agreed to provide certain registration rights. |
| (B) | Non-income producing security. |
| (C) | Security valued at fair value using methods determined in good faith by or under the direction of the Board of Trustees. |
| (D) | Defaulted security; interest not accrued. |
| (E) | Illiquid securities. As of June 30, 2017, the value of these securities amounted to $216,971,616 or 71.74% of net assets. |
| (F) | Held in CI Subsidiary Trust. |
| ^ | Effective yield at purchase |
Barings Corporate Investors
CONSOLIDATED SCHEDULE OF INVESTMENTS (CONTINUED)
June 30, 2017
(Unaudited)
Industry Classification: | | Fair Value/
Market Value | |
| AEROSPACE & DEFENSE - 4.51% | | | |
| API Technologies Corp. | | $ | 3,577,268 | |
| BEI Precision Systems & Space Company, Inc. | | | 3,528,686 | |
| FMH Holdings Corporation | | | 556,019 | |
| Merex Holding Corporation | | | 1,404,363 | |
| Sunvair Aerospace Group Inc. | | | 2,559,322 | |
| TransDigm Group, Inc. | | | 1,015,000 | |
| Triumph Group, Inc. | | | 993,750 | |
| | | | 13,634,408 | |
| | | | | |
| AIRLINES - 0.30% | | | | |
| American Airlines Group Inc. | | | 916,197 | |
| | | | | |
| AUTOMOTIVE - 9.92% | | | | |
| Aurora Parts & Accessories LLC | | | 3,549,315 | |
| CG Holdings Manufacturing Company | | | 4,901,076 | |
| DPL Holding Corporation | | | 3,912,748 | |
| English Color & Supply LLC | | | 3,500,000 | |
| Gates Global LLC | | | 1,002,500 | |
| Grakon Parent | | | 342,712 | |
| International Automotive Component | | | 977,500 | |
| J.B. Poindexter Co., Inc. | | | 1,048,750 | |
| K&N Engineering, Inc. | | | 987,500 | |
| Meritor, Inc. | | | 2,173,136 | |
| Moog Inc. | | | 1,040,000 | |
| Power Stop Holdings LLC | | | 3,800,660 | |
| Randy's Worldwide Automotive | | | 2,759,823 | |
| | | | 29,995,720 | |
| | | | | |
| BROKERAGE, ASSET MANAGERS & EXCHANGES - 0.45% | | | | |
| Icahn Enterprises L.P. | | | 1,183,781 | |
| Orchestra Borrower LLC/Orchestra Co-Issuer, Inc. | | | 179,290 | |
| | | | 1,363,071 | |
| | | | | |
| BUILDING MATERIALS - 8.69% | | | | |
| ARI Holding Corporation | | | 4,614,013 | |
| Boise Cascade Company | | | 266,770 | |
| Happy Floors Acquisition, Inc. | | | 3,613,578 | |
| Janus Group Holdings LLC | | | 2,773,525 | |
| NSi Industries Holdings, Inc. | | | 3,653,290 | |
| Ply Gem Industries, Inc. | | | 1,042,920 | |
| Signature Systems Holdings Company | | | 180,717 | |
| | | Fair Value/
Market Value | |
| | | | | |
| Sunrise Windows Holding Company | | $ | 2,999,787 | |
| Torrent Group Holdings, Inc. | | | 155,254 | |
| Wellborn Forest Holding Company | | | 3,359,243 | |
| Wolf-Gordon, Inc. | | | 3,638,341 | |
| | | | 26,297,438 | |
| | | | | |
| CABLE & SATELLITE - 2.01% | | | | |
| Altice Financing S.A. | | | 1,110,000 | |
| Altice S.A. | | | 1,061,250 | |
| Hughes Satellite Systems Corporation | | | 1,343,750 | |
| Unitymedia KabelBW GmbH | | | 1,072,500 | |
| UPCB Finance IV Limited | | | 444,656 | |
| Virgin Media Secured Finance PLC | | | 1,040,810 | |
| | | | 6,072,966 | |
| | | | | |
| CHEMICALS - 2.80% | | | | |
| A. Schulman Inc. | | | 1,057,500 | |
| Compass Chemical International LLC | | | 294,192 | |
| Consolidated Energy Finance S.A. | | | 401,880 | |
| Cornerstone Chemical Company | | | 1,000,000 | |
| CVR Partners, LP. | | | 1,046,250 | |
| LBC Tank Terminals Holding Netherlands B.V. | | | 1,364,313 | |
| Pinnacle Operating Corporation | | | 1,165,355 | |
| Polytex Holdings LLC | | | 2,148,465 | |
| | | | 8,477,955 | |
| | | | | |
| CONSUMER CYCLICAL SERVICES - 3.27% | | | | |
| CHG Alternative Education Holding Company | | | 3,225,827 | |
| Church Services Holding Company | | | — | |
| GEO Group, Inc. (The) | | | 1,040,000 | |
| PPC Event Services | | | 3,518,517 | |
| Prime Security Services Borrower | | | 1,086,660 | |
| West Corporation | | | 1,010,000 | |
| | | | 9,881,004 | |
| | | | | |
| CONSUMER PRODUCTS - 10.00% | | | | |
| AMS Holding LLC | | | 600,919 | |
| Blue Wave Products, Inc. | | | 1,952,234 | |
| Elite Sportswear Holding, LLC | | | 3,516,188 | |
| gloProfessional Holdings, Inc. | | | 3,258,936 | |
| GTI Holding Company | | | 1,614,647 | |
| Handi Quilter Holding Company | | | 4,389,569 | |
| HHI Group, LLC | | | 3,289,972 | |
See Notes to Consolidated Financial Statements
CONSOLIDATED SCHEDULE OF INVESTMENTS (CONTINUED)
June 30, 2017
(Unaudited)
Industry Classification: (Continued) | | Fair Value/
Market Value | |
| | | | | |
| Kyjen Company | | $ | 2,723,652 | |
| Manhattan Beachwear Holding Company | | | 802,836 | |
| Master Cutlery LLC | | | 1,565,770 | |
| Perry Ellis International, Inc. | | | 250,000 | |
| Whitebridge Pet Brands Holdings, LLC | | | 3,317,194 | |
| York Wall Holding Company | | | 2,959,100 | |
| | | | 30,241,017 | |
| | | | | |
| DIVERSIFIED MANUFACTURING - 5.35% | | | | |
| ABC Industries, Inc. | | | 924,217 | |
| Advanced Manufacturing Enterprises LLC | | | — | |
| Airxcel Holdings | | | 998,604 | |
| Amsted Industries | | | 538,200 | |
| Belden Inc. | | | 424,350 | |
| BP SCI LLC | | | 853,289 | |
| CTP Transportation Products, LLC | | | 591,344 | |
| EnPro Industries Inc. | | | 260,625 | |
| F G I Equity LLC | | | 2,978,840 | |
| Forum Energy Technologies | | | 316,875 | |
| Ideal Tridon Holdings, Inc. | | | 581,096 | |
| K P I Holdings, Inc. | | | 378,066 | |
| Motion Controls Holdings | | | 1,020,343 | |
| NetShape Technologies, Inc. | | | — | |
| Power Products LLC | | | 267,926 | |
| SR Smith LLC | | | 3,236,372 | |
| Strahman Holdings Inc | | | 2,549,548 | |
| Zekelman Industries, Inc | | | 258,462 | |
| | | | 16,178,157 | |
| | | | | |
| ELECTRIC - 1.94% | | | | |
| AM Conservation Holding Corp | | | 3,678,720 | |
| Calpine Corporation | | | 656,250 | |
| NRG Energy, Inc. | | | 1,518,750 | |
| | | | 5,853,720 | |
| | | | | |
| ENERGY - 0.28% | | | | |
| Caelus Energy Alaska, LLC | | | 858,330 | |
| | | | | |
| FINANCIAL OTHER - 1.36% | | | | |
| Hub International Ltd. | | | 1,042,500 | |
| Insurance Claims Management, Inc. | | | 237,255 | |
| Onex Corporation | | | 1,301,300 | |
| PSPC Escrow Corp | | | 308,718 | |
| | | Fair Value/
Market Value | |
| | | | | |
| Tempo Acquisition LLC | | | 220,860 | |
| USIS Merger Sub Inc. | | $ | 1,017,500 | |
| | | | 4,128,133 | |
| | | | | |
| FOOD & BEVERAGE - 10.83% | | | | |
| 1492 Acquisition LLC | | | 845,296 | |
| Dean Foods | | | 699,465 | |
| Del Real LLC | | | 3,518,617 | |
| Eagle Family Foods, Inc. | | | 3,500,000 | |
| F F C Holding Corporation | | | 1,661,974 | |
| GenNx Novel Holding, Inc. | | | 3,329,720 | |
| Hollandia Produce LLC | | | 2,701,270 | |
| Hospitality Mints Holding Company | | | 2,033,664 | |
| Impact Confections | | | 2,549,349 | |
| JBS USA Holdings, Inc. | | | 710,475 | |
| JMH Investors LLC | | | 559,738 | |
| KeHE Distributors, LLC | | | 1,002,500 | |
| PANOS Brands LLC | | | 4,440,881 | |
| Westminster Acquisition LLC | | | 1,940,202 | |
| WP Supply Holding Corporation | | | 3,249,221 | |
| | | | 32,742,372 | |
| | | | | |
| GAMING - 1.21% | | | | |
| Boyd Gaming Corporation | | | 213,006 | |
| CTM Holding, Inc. | | | 3,445,789 | |
| | | | 3,658,795 | |
| | | | | |
| HEALTHCARE - 3.80% | | | | |
| Alere Inc. | | | 941,175 | |
| CHS/Community Health Systems, Inc. | | | 793,640 | |
| CORA Health Services, Inc. | | | 1,785,209 | |
| Eagle Holding Co II LLC | | | 213,980 | |
| ECG Consulting Group | | | 2,897,492 | |
| GD Dental Services LLC | | | 255,499 | |
| HCA Holdings, Inc. | | | 158,220 | |
| HealthSouth Corporation | | | 594,199 | |
| Hill-Rom Holdings, Inc. | | | 405,213 | |
| Kindred Healthcare, Inc. | | | 1,051,250 | |
| RadNet Management Inc. | | | 1,002,500 | |
| Select Medical Corporation | | | 667,875 | |
| Tenet Healthcare Corporation | | | 725,000 | |
| TherOX, Inc. | | | — | |
| Touchstone Health Partnership | | | — | |
| | | | 11,491,252 | |
| | | | | |
See Notes to Consolidated Financial Statements
Barings Corporate Investors
CONSOLIDATED SCHEDULE OF INVESTMENTS (CONTINUED)
June 30, 2017
(Unaudited)
Industry Classification: (Continued) | | Fair Value/
Market Value | |
| HOME CONSTRUCTION - 0.67% | | | |
| Beazer Homes USA Inc. | | $ | 980,215 | |
| William Lyon Homes | | | 1,035,000 | |
| | | | 2,015,215 | |
| | | | | |
| INDEPENDENT - 2.73% | | | | |
| Antero Resources Corporation | | | 808,000 | |
| EP Energy Corporation | | | 1,144,736 | |
| Fieldwood Energy LLC | | | 2,044,589 | |
| Jupiter Resources Inc. | | | 750,000 | |
| Laredo Petroleum, Inc. | | | 970,000 | |
| Precision Drilling Corporation | | | 438,343 | |
| SM Energy Company | | | 1,432,020 | |
| Tullow Oil Plc | | | 660,655 | |
| | | | 8,248,343 | |
| | | | | |
| INDUSTRIAL OTHER - 7.63% | | | | |
| AFC - Dell Holding Corporation | | | 2,681,847 | |
| Aquilex Holdings LLC | | | 267,643 | |
| Clough, Harbour and Associates | | | 1,223,848 | |
| Connecticut Electric, Inc. | | | 3,059,767 | |
| Hartland Controls Holding Corporation | | | 3,742,876 | |
| HVAC Holdings, Inc. | | | 3,249,737 | |
| Mail Communications Group, Inc. | | | 480,639 | |
| MC Sign Holdings LLC | | | 2,319,788 | |
| Midwest Industrial Rubber, Inc. | | | 3,532,118 | |
| Park-Ohio Industries Inc. | | | 360,150 | |
| Smart Source Holdings LLC | | | 990,236 | |
| SMB Machinery Holdings, Inc. | | | — | |
| Tranzonic Holdings LLC | | | 1,182,907 | |
| | | | 23,091,556 | |
| | | | | |
| MEDIA & ENTERTAINMENT - 2.80% | | | | |
| BlueSpire Holding, Inc. | | | — | |
| GlynnDevins Acquisition Corporation | | | 240,130 | |
| HOP Entertainment LLC | | | — | |
| Lamar Media Corp. | | | 334,400 | |
| Money Mailer Equity LLC | | | 3,398,754 | |
| Sinclair Television Group, Inc. | | | 967,500 | |
| Sirius XM Radio Inc. | | | 1,293,438 | |
| Univision Communications, Inc. | | | 1,180,620 | |
| WMG Acquisition Corp. | | | 1,051,250 | |
| | | | 8,466,092 | |
| | | | | |
| | | Fair Value/
Market Value | |
| METALS & MINING - 2.57% | | | |
| Commercial Metals Company | | $ | 1,516,875 | |
| Constellium N.V. | | | 795,010 | |
| First Quantum Minerals Ltd. | | | 977,500 | |
| IAMGOLD Corporation | | | 1,030,000 | |
| New Gold Inc. | | | 1,265,430 | |
| Peabody Energy Corporation | | | 985,000 | |
| Suncoke Energy | | | 987,500 | |
| United States Steel Corp. | | | 214,500 | |
| | | | 7,771,815 | |
| | | | | |
| MIDSTREAM - 1.83% | | | | |
| CVR Refining LLC | | | 654,875 | |
| Ferrellgas Partners, L.P | | | 1,930,360 | |
| Suburban Propane Partners, L.P. | | | 990,000 | |
| Summit Midstream Holdings, LLC | | | 479,535 | |
| Sunoco LP | | | 877,800 | |
| Tallgrass Operations LLC | | | 612,562 | |
| | | | 5,545,132 | |
| | | | | |
| OIL FIELD SERVICES - 2.14% | | | | |
| Avantech Testing Services LLC | | | — | |
| Gulf Finance LLC | | | 486,049 | |
| Hilcorp Energy Company | | | 460,000 | |
| Oasis Petroleum Inc. | | | 970,000 | |
| Petroplex Inv Holdings LLC | | | 16,111 | |
| Seadrill Partners Finco, LLC | | | 626,265 | |
| Teine Energy Ltd. | | | 1,317,875 | |
| Topaz Marine S.A. | | | 993,140 | |
| Welltec A/S | | | 727,500 | |
| WPX Energy, Inc. | | | 878,750 | |
| | | | 6,475,690 | |
| | | | | |
| PACKAGING - 1.27% | | | | |
| ASC Holdings, Inc. | | | 1,533,993 | |
| Chase Packaging Corporation | | | 207 | |
| Coveris Holdings S.A. | | | 985,000 | |
| Signode Industrial Group | | | 1,321,925 | |
| | | | 3,841,125 | |
| | | | | |
| PAPER - 1.72% | | | | |
| Clearwater Paper Corporation | | | 738,750 | |
| Dunn Paper | | | 3,430,000 | |
See Notes to Consolidated Financial Statements
CONSOLIDATED SCHEDULE OF INVESTMENTS (CONTINUED)
June 30, 2017
(Unaudited)
Industry Classification: (Continued) | | Fair Value/
Market Value | |
| | | | | |
| P.H. Glatfelter Company | | $ | 1,022,500 | |
| | | | 5,191,250 | |
| | | | | |
| PHARMACEUTICALS - 3.36% | | | | |
| Clarion Brands Holding Corp. | | | 4,426,298 | |
| Endo Finance LLC | | | 835,000 | |
| ERG Holding Company LLC | | | 2,688,705 | |
| Mallinckrodt PLC | | | 940,000 | |
| VRX Escrow Corp. | | | 1,286,250 | |
| | | | 10,176,253 | |
| | | | | |
| REFINING - 2.26% | | | | |
| CITGO Holding, Inc. | | | 1,086,250 | |
| CITGO Petroleum Corporation | | | 938,875 | |
| MES Partners, Inc. | | | 2,418,665 | |
| PBF Holding Company LLC | | | 64,025 | |
| Tristar Global Energy Solutions, Inc. | | | 2,325,560 | |
| | | | 6,833,375 | |
| | | | | |
| RETAILERS - 0.33% | | | | |
| Sonic Automotive, Inc. | | | 350,240 | |
| Wolverine World Wide, Inc. | | | 656,842 | |
| | | | 1,007,082 | |
| | | | | |
| TECHNOLOGY - 5.44% | | | | |
| Almonde, Inc. | | | 956,858 | |
| Anixter, Inc. | | | 1,068,750 | |
| Diamond 1 Finance Corp / Diamond 2 Finance Corp (Dell) | | | 238,830 | |
| Glynlyon Holding Companies, Inc. | | | 3,797,722 | |
| Infor (US), Inc. | | | 233,345 | |
| | | Fair Value/
Market Value | |
| | | | | |
| JDA Escrow LLC | | $ | 186,160 | |
| Kronos Incorporated | | | 424,640 | |
| Micron Technology, Inc. | | | 1,145,311 | |
| Sabre GLBL Inc. | | | 260,413 | |
| Software Paradigms International Group, LLC | | | 3,535,000 | |
| Veritext Corporation | | | 4,015,949 | |
| Western Digital Corporation | | | 582,762 | |
| | | | 16,445,740 | |
| | | | | |
| TRANSPORTATION SERVICES - 4.58% | | | | |
| Hertz Corporation | | | 997,600 | |
| MNX Holding Company | | | 3,262,117 | |
| OPE KAG Finance Sub | | | 1,837,500 | |
| Ryder System Inc | | | 1,998,678 | |
| Team Drive-Away Holdings LLC | | | 244,750 | |
| VP Holding Company | | | 1,001,535 | |
| Watco Companies, L.L.C. | | | 1,042,500 | |
| Worldwide Express Operations, LLC | | | 3,464,535 | |
| | | | 13,849,215 | |
| | | | | |
| WIRELESS - 1.07% | | | | |
| Digicel Group Limited | | | 958,750 | |
| Level 3 Communications Inc. | | | 890,269 | |
| Numericable Group SA | | | 1,046,250 | |
| Sprint Corporation | | | 350,438 | |
| | | | 3,245,707 | |
| | | | | |
| Total Investments - 107.12% | | | | |
| (Cost - $316,647,066) | | $ | 323,994,125 | |
| | | | | |
See Notes to Consolidated Financial Statements
Barings Corporate Investors
NOTES TO CONSOLIDATED FINANCIAL STATEMENTS
(Unaudited)
Barings Corporate Investors (formerly known as Babson Capital Corporate Investors) (the "Trust") commenced operations in 1971 as a Delaware corporation. Pursuant to an Agreement and Plan of Reorganization dated November 14, 1985, approved by shareholders, the Trust was reorganized as a Massachusetts business trust under the laws of the Commonwealth of Massachusetts, effective November 28, 1985. In order to clarify the Trust's relationship to Barings LLC (formerly known as Babson Capital Management LLC), as of September 12, 2016, the Trust's name was changed to replace "Babson Capital Corporate Investors" with "Barings Corporate Investors".
The Trust is a diversified closed-end management investment company. Barings LLC ("Barings"), a wholly-owned indirect subsidiary of Massachusetts Mutual Life Insurance Company ("MassMutual"), acts as its investment adviser. The Trust's investment objective is to maintain a portfolio of securities providing a current yield and at the same time offering an opportunity for capital gains. The Trust's principal investments are privately placed, below-investment grade, long-term debt obligations. Such direct placement securities may, in some cases, be accompanied by equity features such as common stock, warrants, conversion rights, or other equity features and, occasionally, preferred stocks. The Trust typically purchases these investments, which are not publicly tradable, directly from their issuers in private placement transactions. These investments are typically mezzanine debt instruments with accompanying private equity securities made to small or middle market companies. In addition, the Trust may invest, subject to certain limitations, in marketable investment grade debt securities, other marketable debt (including high yield securities) and marketable common stocks. Below-investment grade or high yield securities have predominantly speculative characteristics with respect to the capacity of the issuer to pay interest and repay capital.
On January 27, 1998, the Board of Trustees authorized the formation of a wholly-owned subsidiary of the Trust ("CI Subsidiary Trust") for the purpose of holding certain investments. The results of CI Subsidiary Trust are consolidated in the accompanying financial statements. Footnote 2.D below discusses the Federal tax consequences of the CI Subsidiary Trust.
| 2. | Significant Accounting Policies |
The following is a summary of significant accounting policies followed consistently by the Trust in the preparation of its consolidated financial statements in conformity with accounting principles generally accepted in the United States of America ("U.S. GAAP").
The Trustees have determined that the Trust is an investment company in accordance with Accounting Standards Codification ("ASC") 946, Financial Services – Investment Companies, for the purpose of financial reporting.
A. Fair Value Measurements:
Under U.S. GAAP, fair value represents the price that should be received to sell an asset (exit price) in an orderly transaction between willing market participants at the measurement date.
Determination of Fair Value
The determination of the fair value of the Trust's investments is the responsibility of the Trust's Board of Trustees (the "Trustees"). The Trustees have adopted procedures for the valuation of the Trust's securities and has delegated responsibility for applying those procedures to Barings. Barings has established a Pricing Committee which is responsible for setting the guidelines used in following the procedures adopted by the Trustees and ensuring that those guidelines are being followed. Barings considers all relevant factors that are reasonably available, through either public information or information directly available to Barings, when determining the fair value of a security. The Trustees meet at least once each quarter to approve the value of the Trust's portfolio securities as of the close of business on the last business day of the preceding quarter. This valuation requires the approval of a majority of the Trustees of the Trust, including a majority of the Trustees who are not interested persons of the Trust or of Barings. In approving valuations, the Trustees will consider reports by Barings analyzing each portfolio security in accordance with the procedures and guidelines referred to above, which include the relevant factors referred to below. Barings has agreed to provide such reports to the Trust at least quarterly. The consolidated financial statements include private placement restricted securities valued at $216,971,616 (71.74% of net assets) as of June 30, 2017 whose values have been estimated by the Trustees based on the process described above in the absence of readily ascertainable market values. Due to the inherent uncertainty of valuation, those estimated values may differ significantly from the values that would have been used had a ready market for the securities existed, and the differences could be material.
Following is a description of valuation methodologies used for assets recorded at fair value:
Corporate Public Securities – Bank Loans, Corporate Bonds, Preferred Stocks and Common Stocks
The Trust uses external independent third-party pricing services to determine the fair values of its Corporate Public Securities. At June 30, 2017, 100% of the carrying value of these investments was from external pricing services. In the event that the primary pricing service does not provide a price, the Trust utilizes the pricing provided by a secondary pricing service.
Public debt securities generally trade in the over-the-counter market rather than on a securities exchange. The Trust's pricing services use multiple valuation techniques to determine fair value. In instances where significant market activity exists, the pricing services may utilize a market based
NOTES TO CONSOLIDATED FINANCIAL STATEMENTS (CONTINUED)
(Unaudited)
approach through which quotes from market makers are used to determine fair value. In instances where significant market activity may not exist or is limited, the pricing services also utilize proprietary valuation models which may consider market characteristics such as benchmark yield curves, option adjusted spreads, credit spreads, estimated default rates, coupon rates, anticipated timing of principal underlying prepayments, collateral, and other unique security features in order to estimate the relevant cash flows, which are then discounted to calculate the fair value.
The Trust's investments in bank loans are normally valued at the bid quotation obtained from dealers in loans by an independent pricing service in accordance with the Trust's valuation policies and procedures approved by the Trustees.
Public equity securities listed on an exchange or on the NASDAQ National Market System are valued at the last quoted sales price of that day.
Annually, Barings conducts reviews of the primary pricing vendors to validate that the inputs used in that vendors' pricing process are deemed to be market observable as defined in the standard. While Barings is not provided access to proprietary models of the vendors, the reviews have included on-site walk-throughs of the pricing process, methodologies and control procedures for each asset class and level for which prices are provided. The review also includes an examination of the underlying inputs and assumptions for a sample of individual securities across asset classes, credit rating levels and various durations, a process Barings continues to perform annually. In addition, the pricing vendors have an established challenge process in place for all security valuations, which facilitates identification and resolution of prices that fall outside expected ranges. Barings believes that the prices received from the pricing vendors are representative of prices that would be received to sell the assets at the measurement date (exit prices) and are classified appropriately in the hierarchy.
Corporate Restricted Securities – Corporate Bonds
The fair value of certain notes is determined using an internal model that discounts the anticipated cash flows of those notes using a specific discount rate. Changes to that discount rate are driven by changes in general interest
rates, probabilities of default and credit adjustments. The discount rate used within the models to discount the future anticipated cash flows is considered a significant unobservable input. Significant increases/(decreases) in the discount rate would result in a significant (decrease)/increase to the notes' fair value.
The fair value of certain distressed notes is based on an enterprise waterfall methodology which is discussed in the equity security valuation section below.
Corporate Restricted Securities – Common Stock, Preferred Stock and Partnerships & LLC's
The fair value of equity securities is determined using an enterprise waterfall methodology. Under this methodology, the enterprise value of the company is first estimated and that value is then allocated to the company's outstanding debt and equity securities based on the documented priority of each class of securities in the capital structure. Generally, the waterfall proceeds from senior debt tranches of the capital structure to senior then junior subordinated debt, followed by each class of preferred stock and, finally, the common stock.
To estimate a company's enterprise value, the company's trailing twelve months earnings before interest, taxes, depreciation and amortization ("EBITDA") is multiplied by a valuation multiple.
Both the company's EBITDA and valuation multiple are considered significant unobservable inputs. Significant increases/(decreases) to the company's EBITDA and/or valuation multiple would result in significant increases/ (decreases) to the equity value. An increase/(decrease) to the discount would result in a (decrease)/increase to the equity value.
Short-Term Securities
Short-term securities, of sufficient credit quality, with more than sixty days to maturity are valued at fair value, using external independent third-party services. Short-term securities having a maturity of sixty days or less are valued at amortized cost, which approximates fair value.
Barings Corporate Investors
NOTES TO CONSOLIDATED FINANCIAL STATEMENTS (CONTINUED)
(Unaudited)
Quantitative Information about Level 3 Fair Value Measurements
The following table represents quantitative information about Level 3 fair value measurements as of June 30, 2017.
| | | | | | |
| | Fair Value | Valuation Technique | Unobservable Inputs | Range | Weighted
Average |
| Bank Loans | $6,265,316 | Broker Quote | Single Broker | 98% to 101% | 98.7% |
| | | | | | |
| | $10,980,484 | Discounted Cash Flows | Discount Rate | 8.9% to 9.6% | 9.2% |
| | | | | | |
| Corporate Bonds | $144,721,412 | Discounted Cash Flows | Discount Rate | 7.7% to 17.5% | 12.2% |
| | | | | | |
| | $8,521,376 | Market Approach | Valuation Multiple | 3.8x to 8.0x | 6.5x |
| | | | | | |
| | | | EBITDA | $0 million to
$10.7 million | $6.8 million |
| | | | | | |
| Equity Securities | $44,957,864 | Market Approach | Valuation Multiple | 3.8x to 13.5x | 8.4x |
| | | | | | |
| | | | EBITDA | $0 million to
$213.8 million | $35.1 million |
| | | | | | |
| | $446,596 | Broker Quote | Single Quote | $0.86/share | $0.86 share |
Certain of the Trust's Level 3 investments have been valued using unadjusted inputs that have not been internally developed by the Trust, including recently purchased securities held at cost. As a result, fair value of assets of $4,360,480 have been excluded from the preceding table.
Fair Value Hierarchy
The Trust categorizes its investments measured at fair value in three levels, based on the inputs and assumptions used to determine fair value. These levels are as follows:
Level 1 – quoted prices in active markets for identical securities
Level 2 – other significant observable inputs (including quoted prices for similar securities, interest rates, prepayment speeds, credit risk, etc.)
Level 3 – significant unobservable inputs (including the Trust's own assumptions in determining the fair value of investments)
The following is a summary of the inputs used to value the Trust's net assets as of June 30, 2017:
| | | | | | | | | | | | | |
| Assets: | | Total | | | Level 1 | | | Level 2 | | | Level 3 | |
| Restricted Securities | | | | | | | | | | | | |
| Corporate Bonds | | $ | 214,744,315 | | | $ | — | | | $ | 58,808,444 | | | $ | 155,935,871 | |
| Bank Loans | | | 14,410,484 | | | | — | | | | — | | | | 14,410,484 | |
| Common Stock - U.S. | | | 12,591,320 | | | | — | | | | — | | | | 12,591,320 | |
| Preferred Stock | | | 4,626,269 | | | | — | | | | — | | | | 4,626,269 | |
| Partnerships and LLCs | | | 29,407,672 | | | | — | | | | — | | | | 29,407,672 | |
| Public Securities | | | | | | | | | | | | | | | | |
| Bank Loans | | | 8,232,047 | | | | — | | | | 5,396,731 | | | | 2,835,316 | |
| Corporate Bonds | | | 37,536,537 | | | | — | | | | 37,536,537 | | | | — | |
| Common Stock - U.S. | | | 207 | | | | 207 | | | | — | | | | — | |
| Preferred Stock | | | 446,596 | | | | — | | | | — | | | | 446,596 | |
| Short-term Securities | | | 1,998,678 | | | | — | | | | 1,998,678 | | | | — | |
| Total | | $ | 323,994,125 | | | $ | 207 | | | $ | 103,740,390 | | | $ | 220,253,528 | |
NOTES TO CONSOLIDATED FINANCIAL STATEMENTS (CONTINUED)
(Unaudited)
Following is a reconciliation of Level 3 assets for which significant unobservable inputs were used to determine fair value:
| Assets: | | Beginning
Balance at
12/31/2016 | | | Included in
Earnings | | | Purchases | | | Sales | | | Prepayments | | | Transfers
into
Level 3 | | | Transfers
out of
Level 3 | | | Ending
Balance at
6/30/2017 | |
| Restricted Securities | | | | | | | | | | | | | | | | | | | | | | | | |
| Corporate Bonds | | $ | 146,939,686 | | | $ | 5,581,710 | | | $ | 11,934,129 | | | $ | — | | | $ | (8,519,654 | ) | | $ | — | | | $ | — | | | $ | 155,935,871 | |
| Bank Loans | | | 10,414,560 | | | | (23,242 | ) | | | 4,019,166 | | | | — | | | | — | | | | — | | | | — | | | | 14,410,484 | |
| Common Stock - U.S. | | | 13,321,840 | | | | 2,361,613 | | | | 212,121 | | | | (3,304,254 | ) | | | — | | | | — | | | | — | | | | 12,591,320 | |
| Preferred Stock | | | 8,047,466 | | | | 557,276 | | | | — | | | | (3,978,473 | ) | | | — | | | | — | | | | — | | | | 4,626,269 | |
| Partnerships and LLCs | | | 22,484,369 | | | | 3,800,613 | | | | 4,017,074 | | | | (894,384 | ) | | | — | | | | — | | | | — | | | | 29,407,672 | |
| Public Securities | | | | | | | | | | | | | | | | | | | | | | | | | | | | | | | | |
| Bank Loans | | | 982,500 | | | | (2,046 | ) | | | — | | | | (670 | ) | | | — | | | | 2,838,032 | | | | (982,500 | ) | | | 2,835,316 | |
| Preferred Stock | | | — | | | | 106,743 | | | | 339,853 | | | | — | | | | — | | | | — | | | | — | | | | 446,596 | |
| Total | | $ | 202,190,421 | | | $ | 12,382,667 | | | $ | 20,522,343 | | | $ | (8,177,781 | ) | | $ | (8,519,654 | ) | | $ | 2,838,032 | | | $ | (982,500 | ) | | $ | 220,253,528 | |
Income, Gains and Losses included in Net Increase in Net Assets resulting from Operations for the period are presented in the following accounts on the Statement of Operations:
| | | Net Increase in
Net Assets
Resulting from
Operations | | | Change in
Unrealized
Gains &
(Losses) in
Net Assets
from Assets
Still Held | |
| Interest (Amortization) | | $ | 446,930 | | | | — | |
| Net realized gain on investments before taxes | | $ | 2,600,291 | | | | — | |
| Net change in unrealized depreciation of investments before taxes | | $ | 9,337,492 | | | $ | 10,010,831 | |
B. Accounting for Investments:
Investment transactions are accounted for on the trade date. Dividend income is recorded on the ex-dividend date. Interest income is recorded on the accrual basis, including the amortization of premiums and accretion of discounts on bonds held using the yield-to-maturity method. The Trust does not accrue income when payment is delinquent and when management believes payment is questionable.
Realized gains and losses on investment transactions and unrealized appreciation and depreciation of investments are reported for financial statement and Federal income tax purposes on the identified cost method.
C. Use of Estimates:
The preparation of financial statements in conformity with U.S. GAAP requires management to make estimates and assumptions that affect the reported amounts of assets and liabilities and disclosure of contingent assets and liabilities at the date of the financial statements and the reported amounts of revenues and expenses during the reporting period. Actual results could differ from those estimates.
D. Federal Income Taxes:
The Trust has elected to be taxed as a "regulated investment company" under the Internal Revenue Code, and intends to maintain this qualification and to distribute substantially all of its net taxable income to its shareholders. In any year when net long-term capital gains are realized by the Trust, management, after evaluating the prevailing economic conditions, will recommend that the Trustees either designate the net realized long-term gains as undistributed and pay the Federal capital gains taxes thereon or distribute all or a portion of such net gains. For the six months ended June 30, 2017, the Trust did not have any realized taxable long-term capital gains.
The Trust is taxed as a regulated investment company and is therefore limited as to the amount of non-qualified income that it may receive as the result of operating a trade or business, e.g. the Trust's pro rata share of income allocable to the Trust by a partnership operating company. The Trust's violation of this limitation could result in the loss of its status as a regulated investment company, thereby subjecting all of its net income and capital gains to corporate taxes prior to distribution to its shareholders. The Trust, from time-to-time,
Barings Corporate Investors
NOTES TO CONSOLIDATED FINANCIAL STATEMENTS (CONTINUED)
(Unaudited)
identifies investment opportunities in the securities of entities that could cause such trade or business income to be allocable to the Trust. The CI Subsidiary Trust (described in Footnote 1 above) was formed in order to allow investment in such securities without adversely affecting the Trust's status as a regulated investment company.
The CI Subsidiary Trust is not taxed as a regulated investment company. Accordingly, prior to the Trust receiving any distributions from the CI Subsidiary Trust, all of the CI Subsidiary Trust's taxable income and realized gains, including non-qualified income and realized gains, are subject to taxation at prevailing corporate tax rates. As of June 30, 2017, the CI Subsidiary Trust has incurred income tax expense of $323,912.
Deferred tax assets and liabilities are recognized for the future tax consequences attributable to differences between the financial statement carrying amounts of the existing assets and liabilities and their respective tax basis. As of June 30, 2017, the CI Subsidiary Trust has a deferred tax liability of $ 1,371,595.
E. Distributions to Shareholders:
The Trust records distributions to shareholders from net investment income and net realized gains, if any, on the ex-dividend date. The Trust's net investment income dividend is declared four times per year, in April, July, October, and December. The Trust's net realized capital gain distribution, if any, is declared in December.
| 3. | Investment Services Contract |
A. Services:
Under an Investment Services Contract (the "Contract") with the Trust, Barings agrees to use its best efforts to present to the Trust a continuing and suitable investment program consistent with the investment objectives and policies of the Trust. Barings represents the Trust in any negotiations with issuers, investment banking firms, securities brokers or dealers and other institutions or investors relating to the Trust's investments. Under the Contract, Barings also provides administration of the day-to-day operations of the Trust and provides the Trust with office space and office equipment, accounting and bookkeeping services, and necessary executive, clerical and secretarial personnel for the performance of the foregoing services.
B. Fee:
For its services under the Contract, Barings is paid a quarterly investment advisory fee of 0.3125% of the net asset value of the Trust as of the last business day of each fiscal quarter, which is approximately equal to 1.25% annually. A majority of the Trustees, including a majority of the Trustees who are not interested persons of the Trust or of Barings, approve the valuation of the Trust's net assets as of such day.
C. Basis for Board Renewal of Contract
At a meeting of the Trustees held on April 21, 2017, the Trustees (including a majority of the Trustees who are not "interested persons" of the Trust or Barings) unanimously approved a one year continuance of the Contract.
Prior to the meeting, the Trustees requested and received from Ropes & Gray LLP, counsel to the Trust, a memorandum describing the Trustees' legal responsibilities in connection with their review and re-approval of the Contract. The Trustees also requested and received from Barings extensive written and oral information regarding, among other matters: the principal terms of the Contract; the reasons why Barings was proposing the continuance of the Contract; Barings and its personnel; the Trust's investment performance, including comparative performance information; the nature and quality of the services provided by Barings to the Trust; financial strength of Barings; the fee arrangements between Barings and the Trust; fee and expense information, including comparative fee and expense information; profitability of the advisory arrangement to Barings; and "fallout" benefits to Barings resulting from the Contract.
Among other things, the Trustees discussed and considered with management (i) the aforementioned guidance provided by Ropes & Gray LLP and the information provided by Barings prior to the meeting and (ii) the reasons Barings put forth in support of its recommendation that the Trustees approve the continuance of the Contract. These considerations are summarized below.
NATURE, EXTENT AND QUALITY OF SERVICES TO BE PROVIDED BY BARINGS TO THE TRUST
In evaluating the scope and quality of the services provided by Barings to the Trust, the Trustees considered, among other factors: (i) the scope of services required to be provided by Barings under the Contract; (ii) Barings' ability to find and negotiate private placement securities having equity features that are consistent with the stated investment objectives of the Trust; (iii) the experience and quality of Barings' staff; (iv) the strength of Barings' financial condition; (v) the nature of the private placement market compared to public markets (including the fact that finding, analyzing, negotiating and servicing private placement securities is more labor-intensive than buying and selling public securities and the administration of private placement securities is more extensive, expensive, and requires greater time and expertise than a portfolio of only public securities); (vi) the potential advantages afforded to the Trust by its ability to co-invest in negotiated private placements with MassMutual and its affiliates; and (vii) the expansion of the scope of services provided by Barings as a result of recent regulatory and legislative initiatives that have required increased legal, compliance and business attention and diligence. Based on such considerations, the Trustees concluded that, overall, they are satisfied with the nature, extent and quality of services provided by Barings, and expected to be provided in the future, under the Contract.
NOTES TO CONSOLIDATED FINANCIAL STATEMENTS (CONTINUED)
(Unaudited)
INVESTMENT PERFORMANCE
The Trustees also examined the Trust's short-term, intermediate-term, and long-term performance as compared against various benchmark indices presented at the meeting, which showed that the Trust had outperformed such indices for the 1-, 3-, 5- and 10-year periods. In addition, the Trustees considered comparisons of the Trust's performance with the performance of (i) selected closed-end investment companies and funds that may invest in private placement securities and/or bank loans; (ii) selected business development companies with comparable types of investments; and (iii) investment companies included in the Broadridge closed-end bond universe. It was acknowledged that, while such comparisons are helpful in judging performance, they are not directly comparable in terms of types of investments due to the fact that business development companies often report returns based on market value, which is affected by factors other than the performance of the underlying portfolio investments. Based on these considerations and the detailed performance information provided to the Trustees at the regular Board meetings each quarter, the Trustees concluded that the Trust's absolute and relative performance over time have been sufficient to warrant renewal of the Contract.
ADVISORY FEE/COSTS OF SERVICES PROVIDED AND PROFITABILITY/ MANAGER'S "FALLOUT" BENEFITS
In connection with the Trustees' consideration of the advisory fee paid by the Trust to Barings under the Contract, Barings noted that it was unaware of any registered closed-end investment companies that are directly comparable to the Trust in terms of the types of investments and percentages invested in private placement securities (which require more extensive advisory and administrative services than a portfolio of publicly traded securities, as previously discussed) other than Barings Participation Investors, which also is advised by Barings. Under the terms of its Investment Advisory and Administrative Services Contract, Barings Participation Investors is charged a quarterly investment advisory fee of 0.225% of net asset value as of the end of each quarter, which is approximately equal to 0.90% annually. In considering the fee rate provided in the Contract, the Trustees noted the advisory fee charged by Barings to Tower Square Capital Partners, L.P., and Tower Square Capital Partners II, III and IV, L.P., each a private mezzanine fund also managed by Barings, and that the fee Barings Participation Investors charged compares favorably.
At the request of the Trustees, Barings provided information concerning the profitability of Barings' advisory relationship with the Trust. The Trustees also considered the non-economic benefits Barings and its affiliates derived from its relationship with the Trust, including the reputational benefits derived from having the Trust listed on the New York Stock Exchange, and the de minimis amount of commissions resulting from the Trust's portfolio transactions used by Barings for third-party soft dollar arrangements. The Trustees recognized that Barings should be entitled to earn
a reasonable level of profit for services provided to the Trust and, based on their review, concluded that they were satisfied that Barings' historical level of profitability from its relationship with the Trust was not excessive and that the advisory fee under the Contract is reasonable.
ECONOMIES OF SCALE
The Trustees considered the concept of economies of scale and possible advisory fee reductions if the Trust were to grow in assets. Given that the Trust is not continuously offering shares, such growth comes principally from retained net realized gain on investments and dividend reinvestment. The Trustees also examined the breakpoint features of selected competitive funds and noted that the minimum starting point for fee reductions in those funds was at least $200 million, close to the value of the Trust's current net assets. The Trustees concluded that the absence of breakpoints in the fee schedule under the Contract was currently acceptable given the Trust's current size and closed-end fund structure.
| 4. | Senior Secured Indebtedness |
MassMutual holds the Trust's $30,000,000 Senior Fixed Rate Convertible Note (the "Note") issued by the Trust on November 15, 2007. The Note is due November 15, 2017 and accrues interest at 5.28% per annum. MassMutual, at its option, can convert the principal amount of the Note into common shares. The dollar amount of principal would be converted into an equivalent dollar amount of common shares based upon the average price of the common shares for ten business days prior to the notice of conversion. For the six months ended June 30, 2017, the Trust incurred total interest expense on the Note of $792,000.
The Trust may redeem the Note, in whole or in part, at the principal amount proposed to be redeemed together with the accrued and unpaid interest thereon through the redemption date plus a Make Whole Premium. The Make Whole Premium equals the excess of (i) the present value of the scheduled payments of principal and interest which the Trust would have paid but for the proposed redemption, discounted at the rate of interest of U.S. Treasury obligations whose maturity approximates that of the Note plus 0.50% over (ii) the principal of the Note proposed to be redeemed.
| 5. | Purchases and Sales of Investments |
| | | | | | | |
| | | For the six
months ended
06/30/2017 | |
| | | Cost of
Investments
Acquired | | | Proceeds
from
Sales or
Maturities | |
| Corporate restricted securities | | $ | 32,057,858 | | | $ | 21,626,397 | |
| Corporate public securities | | | 7,351,270 | | | | 3,396,841 | |
Barings Corporate Investors
NOTES TO CONSOLIDATED FINANCIAL STATEMENTS (CONTINUED)
(Unaudited)
The aggregate cost of investments is substantially the same for financial reporting and Federal income tax purposes as of June 30, 2017. The net unrealized depreciation of investments for financial reporting and Federal tax purposes as of June 30, 2017 is $7,347,059 and consists of $29,806,355 appreciation and $22,459,296 depreciation.
Net unrealized depreciation of investments on the Statement of Assets and Liabilities reflects the balance net of a deferred tax accrual of $1,371,595 on net unrealized losses on the CI Subsidiary Trust.
| 6. | Quarterly Results of Investment Operations (Unaudited) |
| | | | | | | |
| | | | |
| | | March 31, 2017 | |
| | | | | | | |
| | | Amount | | | Per Share | |
| Investment income | | $ | 7,990,298 | | | | |
| Net investment income | | | 6,473,615 | | | $ | 0.33 | |
| Net realized and unrealized gain on investments (net of taxes) | | | 3,745,781 | | | | 0.19 | |
| | | | | | | | | |
| | | | | | | | | |
| | | June 30, 2017 | |
| | | | | | | | | |
| | | Amount | | | Per Share | |
| Investment income | | $ | 16,210,720 | | | | | |
| Net investment income | | | 13,155,722 | | | $ | 0.66 | |
| Net realized and unrealized gain on investments (net of taxes) | | | 12,526,606 | | | | 0.63 | |
In the normal course of its business, the Trust trades various financial instruments and enters into certain investment activities with investment risks. These risks include: (i) market risk, (ii) volatility risk and (iii) credit, counterparty and liquidity risk. It is the Trust's policy to identify, measure and monitor risk through various mechanisms including risk management strategies and credit policies. These include monitoring risk guidelines and
diversifying exposures across a variety of instruments, markets and counterparties. There can be no assurance that the Trust will be able to implement its credit guidelines or that its risk monitoring strategies will be successful.
| 8. | Commitments and Contingencies |
During the normal course of business, the Trust may enter into contracts and agreements that contain a variety of representations and warranties. The exposure, if any, to the Trust under these arrangements is unknown as this would involve future claims that may or may not be made against the Trust and which have not yet occurred. The Trust has no history of prior claims related to such contracts and agreements. At June 30, 2017, the Trust had the following unfunded commitments:
| | | | |
Investment | | Unfunded Amount | |
| CORA Health Services, Inc. | | $ | 1,807,693 | |
| HVAC Holdings, Inc. | | $ | 1,218,493 | |
| 9. | Results of Shareholder Meeting |
The Annual Meeting of Shareholders was held on Friday, April 21, 2017. The shareholders were asked to vote to re-elect as Trustees Michael H. Brown, Barbara M. Ginader and Maleyne M. Syracuse for three year terms. The shareholders approved the proposal. The Trust's other Trustees, Edward P. Grace III, Robert E. Joyal, Clifford M. Noreen and Susan B. Sweeney continued to serve their respective terms following the April 21, 2017 Annual Shareholder Meeting. The results of the voting are set forth below.
| | | | | | | | |
| Shares for | | Withheld | | Total | | % of
Shares
Voted for |
Michael H. Brown 14,979,818 | | 402,554 | | 15,382,372 | | 97.38% |
Barbara M. Ginader 15,060,652 | | 321,720 | | 15,382,372 | | 97.91% |
Maleyne M. Syracuse 15,047,578 | | 334,794 | | 15,382,372 | | 97.82% |
THIS PRIVACY NOTICE IS BEING PROVIDED ON BEHALF OF BARINGS LLC AND ITS AFFILIATES: BARINGS SECURITIES LLC; BARINGS AUSTRALIA PTY LTD; BARINGS ADVISERS (JAPAN) KK; BARINGS INVESTMENT ADVISERS (HONG KONG) LIMITED; BARINGS FUNDS TRUST; BARINGS GLOBAL SHORT DURATION HIGH YIELD FUND; BARINGS CORPORATE INVESTORS AND BARINGS PARTICIPATION INVESTORS (TOGETHER, FOR PURPOSES OF THIS PRIVACY NOTICE, "BARINGS").
When you use Barings you entrust us not only with your hard-earned assets but also with your personal and financial data. We consider your data to be private and confidential, and protecting its confidentiality is important to us. Our policies and procedures regarding your personal information are summarized below.
We may collect non-public personal information about you from:
| ● | Applications or other forms, interviews, or by other means; |
| ● | Consumer or other reporting agencies, government agencies, employers or others; |
| ● | Your transactions with us, our affiliates, or others; and |
We may share the financial information we collect with our financial service affiliates, such as insurance companies, investment companies and securities broker-dealers. Additionally, so that we may continue to offer you products and services that best meet your investment needs and to effect transactions that you request or authorize, we may disclose the information we collect, as described above, to companies that perform administrative or marketing services on our behalf, such as transfer agents, custodian banks, service providers or printers and mailers that assist us in the distribution of investor materials or that provide operational support to Barings. These companies are required to protect this information and will use this information only for the services for which we hire them, and are not permitted to use or share this information for any other purpose. Some of these companies may perform such services in jurisdictions other than the United States. We may share some or all of the information we collect with other financial institutions with whom we jointly market products. This may be done only if it is permitted by the state in which you live. Some disclosures may be limited to your name, contact and transaction information with us or our affiliates.
Any disclosures will be only to the extent permitted by federal and state law. Certain disclosures may require us to get an "opt-in" or "opt-out" from you. If this is required, we will do so before information is shared. Otherwise, we do not share any personal information about our customers or former customers unless authorized by the customer or as permitted by law.
We restrict access to personal information about you to those employees who need to know that information to provide products and services to you. We maintain physical, electronic and procedural safeguards that comply with legal standards to guard your personal information. As an added measure, we do not include personal or account information in non-secure e-mails that we send you via the Internet without your prior consent. We advise you not to send such information to us in non-secure e-mails.
This joint notice describes the privacy policies of Barings, the Funds and Barings Securities LLC. It applies to all Barings and the Funds accounts you presently have, or may open in the future, using your social security number or federal taxpayer identification number – whether or not you remain a shareholder of our Funds or as an advisory client of Barings. As mandated by rules issued by the Securities and Exchange Commission, we will be sending you this notice annually, as long as you own shares in the Funds or have an account with Barings.
Barings Securities LLC is a member of the Financial Industry Regulatory Authority (FINRA) and the Securities Investor Protection Corporation (SIPC). Investors may obtain information about SIPC including the SIPC brochure by contacting SIPC online at www.sipc.org or calling (202)-371-8300. Investors may obtain information about FINRA including the FINRA Investor Brochure by contacting FINRA online at www.finra.org or by calling (800) 289-9999.
January 2017
Barings Corporate Investors
This page left intentionally blank.
This page left intentionally blank.
Members of the Board of Trustees Michael H. Brown* Barbara M. Ginader Edward P. Grace III Robert E. Joyal Clifford M. Noreen Susan B. Sweeney* Maleyne M. Syracuse* *Member of the Audit Committee Officers Clifford M. Noreen Chairman Robert M. Shettle President James M. Roy Vice President & Chief Financial Officer Janice M. Bishop Vice President, Secretary & Chief Legal Officer Sean Feeley Vice President Daniel J. Florence Treasurer Melissa M. LaGrant Chief Compliance Officer | | DIVIDEND REINVESTMENT AND SHARE PURCHASE PLAN Barings Corporate Investors (the "Trust") offers a Dividend Reinvestment and Share Purchase Plan (the "Plan"). The Plan provides a simple way for shareholders to add to their holdings in the Trust through the receipt of dividend shares issued by the Trust or through the investment of cash dividends in Trust shares purchased in the open market. A shareholder may join the Plan by filling out and mailing an authorization card to DST Systems, Inc., the Transfer Agent. Participating shareholders will continue to participate until they notify the Transfer Agent, in writing, of their desire to terminate participation. Unless a shareholder elects to participate in the Plan, he or she will, in effect, have elected to receive dividends and distributions in cash. Participating shareholders may also make additional contributions to the Plan from their own funds. Such contributions may be made by personal check or other means in an amount not less than $10 nor more than $5,000 per quarter. Cash contributions must be received by the Transfer Agent at least five days (but no more then 30 days) before the payment date of a dividend or distribution. Whenever the Trust declares a dividend payable in cash or shares, the Transfer Agent, acting on behalf of each participating shareholder, will take the dividend in shares only if the net asset value is lower than the market price plus an estimated brokerage commission as of the close of business on the valuation day. The valuation day is the last day preceding the day of dividend payment. When the dividend is to be taken in shares, the number of shares to be received is determined by dividing the cash dividend by the net asset value as of the close of business on the valuation date or, if greater than net asset value, 95% of the closing share price. If the net asset value of the shares is higher than the market value plus an estimated commission, the Transfer Agent, consistent with obtaining the best price and execution, will buy shares on the open market at current prices promptly after the dividend payment date. The reinvestment of dividends does not, in any way, relieve participating shareholders of any federal, state or local tax. For federal income tax purposes, the amount reportable in respect of a dividend received in newly-issued shares of the Trust will be the fair market value of the shares received, which will be reportable as ordinary income and/or capital gains. As compensation for its services, the Transfer Agent receives a fee of 5% of any dividend and cash contribution (in no event in excess of $2.50 per distribution per shareholder.) Any questions regarding the Plan should be addressed to DST Systems, Inc., Transfer Agent for Barings Corporate Investors' Dividend Reinvestment and Share Purchase Plan, P.O. Box 219086, Kansas City, MO 64121-9086. |

ITEM 2. CODE OF ETHICS.
Not applicable for this filing.
ITEM 3. AUDIT COMMITTEE FINANCIAL EXPERT.
Not applicable for this filing.
ITEM 4. PRINCIPAL ACCOUNTANT FEES AND SERVICES.
Not applicable for this filing.
ITEM 5. AUDIT COMMITTEE OF LISTED REGISTRANTS.
Not applicable for this filing.
ITEM 6. SCHEDULE OF INVESTMENTS.
| (a) | A schedule of investments for the Registrant is included as part of this report to shareholders under Item 1 of this Form N-CSR. |
| (b) | Not applicable for this filing. |
ITEM 7. DISCLOSURE OF PROXY VOTING POLICIES AND PROCEDURES FOR CLOSED-END MANAGEMENT INVESTMENT COMPANIES.
Not applicable for this filing.
ITEM 8. PORTFOLIO MANAGERS OF CLOSED-END MANAGEMENT INVESTMENT COMPANIES.
Not applicable for this filing.
ITEM 9. PURCHASES OF EQUITY SECURITIES BY CLOSED-END MANAGEMENT INVESTMENT COMPANY AND AFFILIATED PURCHASERS.
Not applicable for this filing.
ITEM 10. SUBMISSION OF MATTERS TO A VOTE OF SECURITY HOLDERS.
Not applicable for this filing.
ITEM 11. CONTROLS AND PROCEDURES.
| (a) | The principal executive officer and principal financial officer of the Registrant evaluated the effectiveness of the Registrant's disclosure controls and procedures (as defined in Rule 30a-3(c) under the Investment Company Act of 1940 (the "Act")) as of a date within 90 days of the filing date of this report and based on that evaluation have concluded that such disclosure controls and procedures are effective to provide reasonable assurance that material information required to be disclosed by the Registrant on Form N-CSR is recorded, processed, summarized and reported within the time periods specified in the Securities and Exchange Commission's rules and forms. |
| (b) | There were no changes in the Registrant's internal control over financial reporting (as defined in Rule 30a-3(d) under the Act) during the Registrant's second fiscal half year that have materially affected, or are reasonably likely to materially affect, the Registrant's internal control over financial reporting. |
ITEM 12. SECURITIES LENDING ACTIVITIES FOR CLOSED-END MANAGEMENT INVESTMENT COMPANIES.
ITEM 13. EXHIBITS.
| (a)(1) | ANY CODE OF ETHICS, OR AMENDMENTS THERETO, THAT IS THE SUBJECT OF DISCLOSURE REQUIRED BY ITEM 2, TO THE EXTENT THAT THE REGISTRANT INTENDS TO SATISFY THE ITEM 2 REQUIREMENTS THROUGH THE FILING OF AN EXHIBIT. |
Not applicable for this filing.
| (a)(2) | A SEPARATE CERTIFICATION FOR EACH PRINCIPAL EXECUTIVE OFFICER AND PRINCIPAL FINANCIAL OFFICER OF THE REGISTRANT AS REQUIRED BY RULE 30a-2 UNDER THE ACT. |
Attached hereto as EX-99.31.1
Attached hereto as EX-99.31.2
| (a)(3) | ANY WRITTEN SOLICITATION TO PURCHASE SECURITIES UNDER RULE 23c-1 UNDER THE ACT (17 CFR 270.23c-1) SENT OR GIVEN DURING THE PERIOD COVERED BY THE REPORT BY OR ON BEHALF OF THE REGISTRANT TO 10 OR MORE PERSONS. |
Not applicable for this filing.
(b) CERTIFICATIONS PURSUANT TO RULE 30a-2(b) UNDER THE ACT.
Attached hereto as EX-99.32
SIGNATURES
Pursuant to the requirements of the Securities Exchange Act of 1934 and the Investment Company Act of 1940, the Registrant has duly caused this report to be signed on its behalf by the undersigned, thereunto duly authorized.
(Registrant): | Barings Corporate Investors | |
| | |
| | |
By: | /s/ Robert M. Shettle | |
| Robert M. Shettle, President | |
| | |
Date: | September 8, 2017 | |
| | |
Pursuant to the requirements of the Securities Exchange Act of 1934 and the Investment Company Act of 1940, this report has been signed below by the following persons on behalf of the Registrant and in the capacities and on the dates indicated.
By: | /s/ Robert M. Shettle | |
| Robert M. Shettle, President | |
| | |
Date: | September 8, 2017 | |
| | |
| | |
By: | /s/ James M. Roy | |
| James M. Roy, Vice President and Chief Financial Officer | |
| | |
Date: | September 8, 2017 | |