UNITED STATES SECURITIES AND EXCHANGE COMMISSION
Washington, D.C. 20549
FORM N-CSR
CERTIFIED SHAREHOLDER REPORT OF REGISTERED MANAGEMENT
INVESTMENT COMPANIES
Investment Company Act file number: 811-00750
Exact name of registrant as specified in charter: Delaware Group Equity Funds II
Address of principal executive offices:
2005 Market Street
Philadelphia, PA 19103
Name and address of agent for service:
David F. Connor, Esq.
2005 Market Street
Philadelphia, PA 19103
Registrant’s telephone number, including area code: (800) 523-1918
Date of fiscal year end: November 30
Date of reporting period: November 30, 2009
Item 1. Reports to Stockholders

Annual report Delaware Large Cap Value Fund November 30, 2009 Value equity mutual fund |
This annual report is for the information of Delaware Large Cap Value Fund shareholders, but it may be used with prospective investors when preceded or accompanied by a current prospectus for Delaware Large Cap Value Fund. The figures in the annual report for Delaware Large Cap Value Fund represent past results, which are not a guarantee of future results. The return and principal value of an investment in the Fund will fluctuate so that shares, when redeemed, may be worth more or less than their original cost. Current performance may be higher or lower than the performance data quoted. You should consider the investment objectives, risks, charges, and expenses of the Fund carefully before investing. The Delaware Large Cap Value Fund prospectus contains this and other important information about the Fund. Prospectuses for all open-end funds in the Delaware Investments® Family of Funds are available from your financial advisor, online at www.delawareinvestments.com, or by phone at 800 523-1918. Please read the prospectus carefully before you invest or send money. |
You can obtain shareholder reports and prospectuses online instead of in the mail.
Visit www.delawareinvestments.com/edelivery. |
Experience Delaware Investments
Delaware Investments is committed to the pursuit of consistently superior asset management and unparalleled client service. We believe in our investment processes, which seek to deliver consistent results, and in convenient services that help add value for our clients.
If you are interested in learning more about creating an investment plan, contact your financial advisor.
You can learn more about Delaware Investments or obtain a prospectus for Delaware Large Cap Value Fund at www.delawareinvestments.com.
| Manage your investments online |
- 24-hour access to your account information
- Obtain share prices
- Check your account balance and recent transactions
- Request statements or literature
- Make purchases and redemptions
|
On January 4, 2010, Delaware Management Holdings, Inc., and its subsidiaries (collectively known by the marketing name of Delaware Investments) were sold by a subsidiary of Lincoln National Corporation to Macquarie Group Limited, a global provider of banking, financial, advisory, investment and funds management services. Please see your Fund’s prospectus and any supplements thereto for more complete information.
Investments in Delaware Large Cap Value Fund are not and will not be deposits with or liabilities of Macquarie Bank Limited ABN 46 008 583 542 and its holding companies, including subsidiaries or related companies, and are subject to investment risk, including possible delays in repayment and loss of income and capital invested. No Macquarie Group company guarantees or will guarantee the performance of the Fund, the repayment of capital from the Fund, or any particular rate of return.
| Table of contents | |
| Portfolio management review | 1 |
| Performance summary | 4 |
| Disclosure of Fund expenses | 8 |
| Sector allocation and top 10 holdings | 10 |
| Statement of net assets | 11 |
| Statement of operations | 15 |
| Statements of changes in net assets | 16 |
| Financial highlights | 18 |
| Notes to financial statements | 28 |
| Report of independent registered public accounting firm | 39 |
| Other Fund information | 40 |
| Board of trustees/directors and officers addendum | 48 |
| About the organization | 54 |
Views expressed herein are current as of Nov. 30, 2009, and are subject to change.
Funds are not FDIC insured and are not guaranteed. It is possible to lose the principal amount invested.
Mutual fund advisory services provided by Delaware Management Company, a series of Delaware Management Business Trust, which is a registered investment advisor. Delaware Investments is the marketing name of Delaware Management Holdings, Inc. and its subsidiaries. Macquarie Group refers to Macquarie Group Limited and its subsidiaries and affiliates worldwide.
© 2010 Delaware Management Holdings, Inc.
All third-party trademarks cited are the property of their respective owners.
| Portfolio management review | |
| Delaware Large Cap Value Fund | Dec. 8, 2009 |
| Performance preview (for the period ended Nov. 30, 2009) | | | | |
| Delaware Large Cap Value Fund (Class A shares) | | 1-year return | | +21.51% |
| Russell 1000® Value Index (benchmark) | | 1-year return | | +19.24% |
Past performance does not guarantee future results.
For complete, annualized performance for Delaware Large Cap Value Fund please see the table on page 4.
The performance of Class A shares excludes the applicable sales charge and reflects the reinvestment of all distributions.
Index performance returns do not reflect any management fees, transaction costs, or expenses. Indices are unmanaged and one cannot invest directly in an index. |
A period of volatility ends with stability
The past 12 months was a time of tremendous volatility for stock investors. Between the start of the period in December 2008 and the market’s low in early March 2009, equities remained severely depressed as the recession deepened. Beginning in the third quarter of 2008, U.S. gross domestic product — which measures the combined value of the goods and services produced by a nation — fell for the fourth consecutive quarter. The economy’s 5.4% drop in the fourth quarter of 2008 and 6.4% decline in the first quarter of 2009 constituted the worst consecutive quarterly drop in GDP in more than 50 years. (Source: Bloomberg.)
Starting in the second week of March 2009, however, conditions gradually began to improve. Credit markets began to function more normally and investor confidence gradually increased; evidence of economic growth also mounted. Investors seemed to conclude that the market climate was less dire than they had feared.
We believe this change in outlook among investors was primarily driven by the government’s actions, particularly those meant to encourage consumer spending. Two notable programs that helped the market rally continue through the summer were the cash-for-clunkers program, which took effect in August 2009, and the implementation of a housing tax credit, both of which proved popular with consumers.
- Throughout the period, we positioned the Fund somewhat defensively, emphasizing what we believed were attractively valued stocks with limited economic sensitivity.
- Most of the Fund’s relative outperformance came during the period’s first four months, and then again in October 2009, when the Fund held up well during declining markets.
- This trend is consistent with our management approach; through our value-oriented, defensive style, we seek to do well in relative terms in down markets by minimizing losses.
1
Portfolio management review
Delaware Large Cap Value Fund
Within the Fund
For its fiscal year ended Nov. 30, 2009, Delaware Large Cap Value Fund (Class A shares) returned +21.51% at net asset value, and +14.50% at maximum offer price (both returns assume reinvestment of all distributions). In comparison, the Fund’s benchmark, the Russell 1000 Value Index, gained +19.24% during the same period.
After a difficult 2008, the Fund generated strong results compared to its benchmark during this fiscal period. Most of our relative outperformance came during the period’s first four months, and then again in October 2009, when the Fund held up relatively well during declining markets. This trend is consistent with our management approach; through our value-oriented, defensive style, we seek to do well in relative terms in down markets by minimizing losses.
The most significant positive for the Fund was an overweight position in information technology stocks relative to the benchmark. Despite the recent slowdown in technology spending, we continue to like this sector. Debt levels generally tend to be lower than in most other sectors, and many of the companies are global in nature and offer exposure to emerging markets. Additionally, we think spending on productivity-enhancing technologies could be a strong driver of performance over the long term. One of the top-performing stocks within this group was Motorola, whose shares rose along with investors’ hopes that the mobile telephone maker might be in the early stages of a turnaround.
Other contributors to overall relative performance came from the energy and healthcare sectors. In energy, we maintained an underweight allocation versus the benchmark, which proved beneficial given the underperformance of the sector more broadly. However, Marathon Oil, the fourth-largest integrated oil company in the United States, was our top performer, making an unusual rise of more than 28% during the period. The Fund also benefited from its overweight position in healthcare, a traditionally defensive area that held up better than average during the market’s decline. Within healthcare, the Fund’s top contributor to relative performance was drug manufacturer Wyeth, which was acquired for, in our view, a premium price by rival Pfizer, another holding within the Fund.
Elsewhere, the Fund gained strength from clothing retailer Gap, whose shares held up relatively well in the downturn and which gained significant ground as the market bounced back. We sold our position in Gap relatively late in the period, believing that its stock price had exceeded what was warranted by the company’s underlying fundamentals.
The biggest detractor to relative performance during the fiscal year came from the Fund’s investments in the financial sector. Performance was negatively affected by our significant underweight and less credit-sensitive exposure, which caused the Fund to lag the share price gains that occurred among financials more broadly. Our stance on financials remains somewhat cautious despite the market’s embrace of this sector. In our view, asset quality and loss reserve adequacy are still questionable, lending activity remains weak, and regulatory pressures are likely to increase.
At the individual stock level, the biggest detractor was R.R. Donnelley & Sons, whose commercial printing business has suffered along with consumer spending trends. Our investment in apparel company Limited Brands, another economically sensitive business, also hampered performance.
2
We sold both stocks prior to the market recovery (in March 2009) because we believed they could continue to face significant challenges for some time.
Toward the end of the period, we added two holdings that made the Fund somewhat more economically sensitive (economically sensitive sectors have historically recovered more rapidly than other sectors during an economic recovery). First, we increased our energy weighting by purchasing National Oilwell Varco, an oil and gas equipment and services company that we felt was attractively valued and which we believe has the potential to benefit from rising global energy demand. We also added Lowe’s, one of the country’s leading home-improvement retailers. We believe that Lowe’s, currently trading at what we view as a low valuation, could be helped by a recovering housing market.
Long-term view gives way to opportunities
With the U.S. economy beginning to emerge from recession, we find ourselves giving more consideration to the potential long-term effects of the government’s unprecedented stimulus initiatives. It stands to reason that government borrowing and spending have contributed to the rise in economic activity, though how much is hard to quantify. Mounting deficits, at both the federal and state level, along with an expanding array of government outlays, lead us to believe that higher taxes could be on the way. Another concern is the potential for ongoing weakness in the dollar due to large deficits and an expanding money supply, which could presage an increase in commodity prices and, possibly, higher inflation down the road.
We continue to see economic risks ahead and believe that an overall defensive posture remains warranted. The recent surge in equity prices pushed market valuation levels above their long-run averages. Overall, the market appears to be a bit overvalued, in our view, especially given the potential for weaker-than-expected consumer spending and economic growth. In this environment, we find ourselves putting even more emphasis on bottom-up, company-level fundamentals. We continue to seek stocks selling at large discounts to our estimates of long-term intrinsic value, targeting companies whose shares have lagged during the recent bull phase. Currently, we believe there is potential opportunity in some of the more cyclical sectors, and are considering ways to mitigate the effects of a potential rise in longer-term inflation on the Fund. At the sector level, the Fund ended the period with large overweights in consumer staples, healthcare, telecommunications, and utilities, and large underweights in financials and industrials, versus the S&P 500 Index (our sector benchmark).
3
| Performance summary | |
| Delaware Large Cap Value Fund | Nov. 30, 2009 |
The performance data quoted represent past performance; past performance does not guarantee future results. Investment return and principal value will fluctuate so your shares, when redeemed, may be worth more or less than their original cost. Please obtain the performance data current for the most recent month end by calling 800 523-1918 or visiting our Web site at www.delawareinvestments.com/performance. Current performance may be lower or higher than the performance data quoted.
You should consider the investment objectives, risks, charges, and expenses of the Fund carefully before investing. The Delaware Large Cap Value Fund prospectus contains this and other important information about the Fund. Please request a prospectus through your financial advisor or by calling 800 523-1918 or visiting our Web site at www.delawareinvestments.com. Read the prospectus carefully before you invest or send money.
| Fund performance | | | Average annual total returns through Nov. 30, 2009 |
| | 1 year | | 5 years | | 10 years | | Lifetime |
| Class A (Est. March 18, 1957) | | | | | | | | | | | | | | | | | | | |
| Excluding sales charge | | | +21.51 | % | | | | -0.57 | % | | | | +1.14 | % | | | n/a |
| Including sales charge | | | +14.50 | % | | | | -1.74 | % | | | | +0.55 | % | | | n/a |
| Class B (Est. Sept. 6, 1994) | | | | | | | | | | | | | | | | | |
| Excluding sales charge | | | +20.66 | % | | | | -1.29 | % | | | | +0.54 | % | | | n/a |
| Including sales charge | | | +16.66 | % | | | | -1.63 | % | | | | +0.54 | % | | | n/a |
| Class C (Est. Nov. 29, 1995) | | | | | | | | | | | | | | | | | | | |
| Excluding sales charge | | | +20.69 | % | | | | -1.29 | % | | | | +0.40 | % | | | n/a |
| Including sales charge | | | +19.69 | % | | | | -1.29 | % | | | | +0.40 | % | | | n/a |
| Class R (Est. June 2, 2003) | | | | | | | | | | | | | | | | | |
| Excluding sales charge | | | +21.23 | % | | | | -0.81 | % | | | n/a | | +2.27% |
| Including sales charge | | | +21.23 | % | | | | -0.81 | % | | | n/a | | +2.27% |
| Institutional Class (Est. Jan. 13, 1994) | | | | | | | | | | | | | | | | | | | |
| Excluding sales charge | | | +21.83 | % | | | | -0.31 | % | | | | +1.41 | % | | | n/a |
| Including sales charge | | | +21.83 | % | | | | -0.31 | % | | | | +1.41 | % | | | n/a |
Returns reflect the reinvestment of all distributions and any applicable sales charges as noted in the following paragraphs.
Performance for Class B and C shares, excluding sales charges, assumes either that contingent deferred sales charges did not apply or that the investment was not redeemed.
Expense limitations were in effect for certain classes during the periods shown in the “Fund performance” chart and in the “Performance of a $10,000 investment” chart. The current expenses for each class are listed on the “Fund expense ratios” chart. (Note that all charts and graphs referred to in the “Performance summary” section of this report are found on pages 4 through 7.) Performance would have been lower had the expense limitations not been in effect.
The Fund offers Class A, B, C, R, and Institutional Class shares.
4
Class A shares are sold with a maximum front-end sales charge of up to 5.75%, and have an annual distribution and service fee of up to 0.30% of average daily net assets. The Board adopted a formula for calculating 12b-1 plan expenses for the Fund’s Class A shares that went into effect on May 2, 1994. The total 12b-1 fees to be paid by Class A shareholders of the Fund will be the sum of 0.10% of the average daily net assets representing the shares that were acquired prior to May 2, 1992, and 0.30% of the average daily net assets representing the shares that were acquired on or after May 2, 1992. All Class A shareholders will bear the 12b-1 fees at the same rate, the blended rate based upon the allocation of the 0.10% and 0.30% rates described above.
Class B shares may only be purchased through dividend reinvestment and certain permitted exchanges as described in the prospectus. Please see the prospectus for additional information on Class B purchase and sales charges. Class B shares have a contingent deferred sales charge that declines from 4.00% to zero depending on the period of time the shares are held.
Class B shares will automatically convert to Class A shares on a quarterly basis approximately eight years after purchase. They are also subject to an annual distribution and service fee of up to 1.00% of average daily net assets.
Ten-year and lifetime performance figures for Class B shares reflect conversion to Class A shares after approximately eight years.
Class C shares are sold with a contingent deferred sales charge of 1.00% if redeemed during the first 12 months. They are also subject to an annual distribution and service fee of up to 1.00% of average daily net assets.
Class R shares were first made available June 2, 2003, and are available only for certain retirement plan products. They are sold without a sales charge and have an annual distribution and service fee of up to 0.60% of average daily net assets, which has been limited contractually to 0.50% from April 1, 2009, through March 31, 2010.
Institutional Class shares were first made available Jan. 13, 1994, and are available without sales or asset-based distribution charges only to certain eligible institutional accounts.
The “Fund performance” table and the “Performance of a $10,000 investment” graph do not reflect the deduction of taxes the shareholder would pay on Fund distributions or redemptions of Fund shares.
The Fund will be affected primarily by changes in stock prices.
Instances of high double-digit returns are unusual, cannot be sustained, and were primarily achieved during favorable market conditions.
5
Performance summary
Delaware Large Cap Value Fund
The Fund’s expense ratios, as described in the most recent prospectus, are disclosed in the following “Fund expense ratios” table.
| Fund expense ratios | Class A | | Class B | | Class C | | Class R | | Institutional Class |
| Total annual operating expenses | 1.20% | | 1.92% | | 1.92% | | 1.52% | | 0.92% |
| (without fee waivers) | | | | | | | | | |
| Net expenses | 1.20% | | 1.92% | | 1.92% | | 1.42% | | 0.92% |
| (including fee waivers, if any) | | | | | | | | | |
| Type of waiver | N/A | | N/A | | N/A | | Contractual | | N/A |
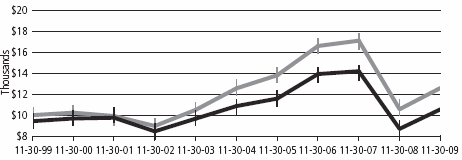
Performance of a $10,000 investment
Average annual total returns from Nov. 30, 1999, through Nov. 30, 2009
| For period beginning Nov. 30, 1999, through Nov. 30, 2009 | Starting value | Ending value |
| | Russell 1000 Value Index | $10,000 | $12,603 |
| | Delaware Large Cap Value Fund — Class A Shares | $9,425 | $10,561 |
6
The chart assumes $10,000 invested in the Fund on Nov. 30, 1999, and includes the effect of a 5.75% front-end sales charge and the reinvestment of all distributions. Please note additional details on these fees in the “Performance summary” section of this report, which includes pages 4 through 7.
The chart also assumes $10,000 invested in the Russell 1000 Value Index as of Nov. 30, 1999.
The Russell 1000 Value Index measures the performance of the large-cap value segment of the U.S. equity universe. It includes those Russell 1000 companies with lower price-to-book ratios and lower forecasted growth values.
The S&P 500 Index measures the performance of 500 mostly large-cap stocks weighted by market value, and is often used to represent performance of the U.S. stock market.
An index is unmanaged and does not reflect the costs of operating a mutual fund, such as the costs of buying, selling, and holding securities. You cannot invest directly in an index. Past performance is not a guarantee of future results.
Performance of other Fund classes will vary due to different charges and expenses.
The “Fund performance” chart and the “Performance of a $10,000 investment” graph do not reflect the deduction of taxes the shareholders would pay on Fund distributions or redemptions of Fund shares.
| Stock symbols and CUSIP numbers |
| | Nasdaq symbols | | CUSIPs | |
| Class A | | | DELDX | | | 245907100 | |
| Class B | | | DEIBX | | | 245907605 | |
| Class C | | | DECCX | | | 245907704 | |
| Class R | | | DECRX | | | 245907886 | |
| Institutional Class | | | DEDIX | | | 245907407 | |
7
Disclosure of Fund expenses
For the period June 1, 2009 to November 30, 2009
As a shareholder of the Fund, you incur two types of costs: (1) transaction costs, including sales charges (loads) on purchase payments, reinvested dividends, or other distributions; redemption fees; and exchange fees; and (2) ongoing costs, including management fees; distribution and/or service (12b-1) fees; and other Fund expenses. This example is intended to help you understand your ongoing costs (in dollars) of investing in the Fund and to compare these costs with the ongoing costs of investing in other mutual funds.
The example is based on an investment of $1,000 invested at the beginning of the period and held for the entire period June 1, 2009 to November 30, 2009.
Actual expenses
The first section of the table shown, “Actual Fund return,” provides information about actual account values and actual expenses. You may use the information in this section of the table, together with the amount you invested, to estimate the expenses that you paid over the period. Simply divide your account value by $1,000 (for example, an $8,600 account value divided by $1,000 = 8.6), then multiply the result by the number in the first section under the heading entitled “Expenses Paid During Period” to estimate the expenses you paid on your account during this period.
Hypothetical example for comparison purposes
The second section of the table shown, “Hypothetical 5% return,” provides information about hypothetical account values and hypothetical expenses based on the Fund’s actual expense ratio and an assumed rate of return of 5% per year before expenses, which is not the Fund’s actual return. The hypothetical account values and expenses may not be used to estimate the actual ending account balance or expenses you paid for the period. You may use this information to compare the ongoing costs of investing in the Fund and other funds. To do so, compare this 5% hypothetical example with the 5% hypothetical examples that appear in the shareholder reports of the other funds.
Please note that the expenses shown in the table are meant to highlight your ongoing costs only and do not reflect any transactional costs, such as sales charges (loads), redemption fees, or exchange fees. Therefore, the second section of the table is useful in comparing ongoing costs only, and will not help you determine the relative total costs of owning different funds. In addition, if these transactional costs were included, your costs would have been higher. The Fund’s expenses shown in the table reflect fee waivers in effect. The expenses shown in the table assume reinvestment of all dividends and distributions.
8
Delaware Large Cap Value Fund
Expense analysis of an investment of $1,000
| | Beginning | | Ending | | | | Expenses |
| | Account Value | | Account Value | | Annualized | | Paid During Period |
| | 6/1/09 | | 11/30/09 | | Expense Ratio | | 6/1/09 to 11/30/09* |
| Actual Fund return | | | | | | | | | | | |
| Class A | | $1,000.00 | | | $1,174.70 | | | 1.19% | | $ 6.49 | |
| Class B | | 1,000.00 | | | 1,170.40 | | | 1.91% | | 10.39 | |
| Class C | | 1,000.00 | | | 1,171.00 | | | 1.91% | | 10.39 | |
| Class R | | 1,000.00 | | | 1,173.90 | | | 1.41% | | 7.68 | |
| Institutional Class | | 1,000.00 | | | 1,176.50 | | | 0.91% | | 4.97 | |
| Hypothetical 5% return (5% return before expenses) | | | | | | |
| Class A | | $1,000.00 | | | $1,019.10 | | | 1.19% | | $ 6.02 | |
| Class B | | 1,000.00 | | | 1,015.49 | | | 1.91% | | 9.65 | |
| Class C | | 1,000.00 | | | 1,015.49 | | | 1.91% | | 9.65 | |
| Class R | | 1,000.00 | | | 1,018.00 | | | 1.41% | | 7.13 | |
| Institutional Class | | 1,000.00 | | | 1,020.51 | | | 0.91% | | 4.61 | |
Delaware Management Company (DMC) has voluntarily agreed to waive that portion, if any, of its management fee and reimburse the Fund to the extent necessary to ensure that total annual operating expenses from April 1, 2009 to September 10, 2009 do not exceed 0.88% of average daily net assets of the Fund (excluding any 12b-1 plan expenses, taxes, interest, inverse floater program expenses, brokerage fees, short sale and dividend interest expenses, certain insurance costs, and nonroutine expenses or costs, including, but not limited to, those relating to reorganizations, litigation, conducting shareholder meetings, and liquidations (collectively, nonroutine expenses)). Effective September 11, 2009, DMC has discontinued this voluntary waiver.
The Fund’s expense analysis would be as follows if the voluntary waiver was not in effect for the entire period:
| | Beginning | | Ending | | | | Expenses |
| | Account Value | | Account Value | | Annualized | | Paid During Period |
| | 6/1/09 | | 11/30/09 | | Expense Ratio | | 6/1/09 to 11/30/09* |
| Actual Fund return | | | | | | | | | | | |
| Class A | | $1,000.00 | | | $1,174.70 | | | 1.26% | | $ 6.87 | |
| Class B | | 1,000.00 | | | 1,170.40 | | | 1.98% | | 10.77 | |
| Class C | | 1,000.00 | | | 1,171.00 | | | 1.98% | | 10.78 | |
| Class R | | 1,000.00 | | | 1,173.90 | | | 1.48% | | 8.07 | |
| Institutional Class | | 1,000.00 | | | 1,176.50 | | | 0.98% | | 5.35 | |
| Hypothetical 5% return (5% return before expenses) | | | | | | |
| Class A | | $1,000.00 | | | $1,018.75 | | | 1.26% | | $ 6.38 | |
| Class B | | 1,000.00 | | | 1,015.14 | | | 1.98% | | 10.00 | |
| Class C | | 1,000.00 | | | 1,015.14 | | | 1.98% | | 10.00 | |
| Class R | | 1,000.00 | | | 1,017.65 | | | 1.48% | | 7.49 | |
| Institutional Class | | 1,000.00 | | | 1,020.16 | | | 0.98% | | 4.96 | |
*“Expenses Paid During Period” are equal to the Fund’s annualized expense ratio, multiplied by the average account value over the period, multiplied by 183/365 (to reflect the one-half year period).
9
| Sector allocation and top 10 holdings | |
| Delaware Large Cap Value Fund | As of November 30, 2009 |
Sector designations may be different than the sector designations presented in other Fund materials. The sector designations may represent the investment manager’s internal sector classifications, which may result in the sector designations for one fund being different than another fund’s sector designations.
| Sector | Percentage of net assets |
| Common Stock | 98.48 | % |
| Consumer Discretionary | 6.22 | % |
| Consumer Staples | 18.77 | % |
| Energy | 12.19 | % |
| Financials | 8.45 | % |
| Health Care | 20.06 | % |
| Industrials | 6.26 | % |
| Information Technology | 11.59 | % |
| Materials | 3.25 | % |
| Telecommunications | 5.85 | % |
| Utilities | 5.84 | % |
| Discount Note | 1.22 | % |
| Securities Lending Collateral | 1.66 | % |
| Total Value of Securities | 101.36 | % |
| Obligation to Return Securities Lending Collateral | (1.68 | %) |
| Receivables and Other Assets Net of Liabilities | 0.32 | % |
| Total Net Assets | 100.00 | % |
Holdings are for informational purposes only and are subject to change at any time. They are not a recommendation to buy, sell, or hold any security.
| Top 10 Holdings | Percentage of net assets |
| Pfizer | 3.97 | % |
| Kimberly-Clark | 3.44 | % |
| Cardinal Health | 3.39 | % |
| Chevron | 3.36 | % |
| Merck | 3.33 | % |
| duPont (E.I.) deNemours | 3.25 | % |
| Travelers | 3.25 | % |
| Waste Management | 3.25 | % |
| Bristol-Myers Squibb | 3.24 | % |
| International Business Machines | 3.20 | % |
10
| Statement of net assets | |
| Delaware Large Cap Value Fund | November 30, 2009 |
| | | Number of shares | | Value |
| Common Stock – 98.48% | | | | | | |
| Consumer Discretionary – 6.22% | | | | | | |
| Lowe’s | | 984,000 | | | $ | 21,461,040 |
| Mattel | | 1,093,400 | | | | 21,277,564 |
| | | | | | | 42,738,604 |
| Consumer Staples – 18.77% | | | | | | |
| Archer-Daniels-Midland | | 696,000 | | | | 21,443,760 |
| CVS Caremark | | 683,800 | | | | 21,204,638 |
| * | Heinz (H.J.) | | 505,200 | | | | 21,445,740 |
| | Kimberly-Clark | | 357,600 | | | | 23,590,872 |
| Kraft Foods Class A | | 758,500 | | | | 20,160,930 |
| Safeway | | 934,700 | | | | 21,030,750 |
| | | | | | | 128,876,690 |
| Energy – 12.19% | | | | | | |
| Chevron | | 295,600 | | | | 23,068,624 |
| ConocoPhillips | | 392,500 | | | | 20,319,725 |
| Marathon Oil | | 620,700 | | | | 20,247,234 |
| National Oilwell Varco | | 466,200 | | | | 20,055,924 |
| | | | | | | 83,691,507 |
| Financials – 8.45% | | | | | | |
| Allstate | | 629,700 | | | | 17,889,777 |
| Bank of New York Mellon | | 668,600 | | | | 17,811,504 |
| Travelers | | 425,800 | | | | 22,307,662 |
| | | | | | | 58,008,943 |
| Health Care – 20.06% | | | | | | |
| Bristol-Myers Squibb | | 878,400 | | | | 22,232,304 |
| Cardinal Health | | 722,100 | | | | 23,273,283 |
| Johnson & Johnson | | 334,200 | | | | 21,001,128 |
| Merck | | 631,000 | | | | 22,848,510 |
| Pfizer | | 1,499,788 | | | | 27,251,148 |
| Quest Diagnostics | | 365,100 | | | | 21,153,894 |
| | | | | | | 137,760,267 |
| Industrials – 6.26% | | | | | | |
| Northrop Grumman | | 377,100 | | | | 20,665,080 |
| * | Waste Management | | 678,700 | | | | 22,288,508 |
| | | | | | | 42,953,588 |
11
Statement of net assets
Delaware Large Cap Value Fund
| | | Number of shares | | | Value |
| Common Stock (continued) | | | | | | | |
| Information Technology – 11.59% | | | | | | | |
| Intel | | | 1,077,600 | | | $ | 20,689,920 |
| International Business Machines | | | 174,000 | | | | 21,984,900 |
| † | Motorola | | | 2,392,000 | | | | 19,159,920 |
| Xerox | | | 2,308,200 | | | | 17,773,140 |
| | | | | | | | 79,607,880 |
| Materials – 3.25% | | | | | | | |
| duPont (E.I.) deNemours | | | 645,600 | | | | 22,324,848 |
| | | | | | | | 22,324,848 |
| Telecommunications – 5.85% | | | | | | | |
| AT&T | | | 738,900 | | | | 19,905,966 |
| Verizon Communications | | | 643,100 | | | | 20,231,926 |
| | | | | | | | 40,137,892 |
| Utilities – 5.84% | | | | | | | |
| Edison International | | | 592,000 | | | | 20,157,600 |
| Progress Energy | | | 511,100 | | | | 19,978,899 |
| | | | | | | | 40,136,499 |
| Total Common Stock (cost $697,533,139) | | | | | | | 676,236,718 |
| |
| | Principal amount | | | |
| ¹Discount Note – 1.22% | | | | | | | |
| Federal Home Loan Bank 0.02% 12/1/09 | | $ | 8,358,011 | | | | 8,358,011 |
| Total Discount Note (cost $8,358,011) | | | | | | | 8,358,011 |
| |
| Total Value of Securities Before Securities | | | | | | | |
| Lending Collateral – 99.70% (cost $705,891,150) | | | | | | | 684,594,729 |
| |
| | Number of shares | | | |
| Securities Lending Collateral** – 1.66% | | | | | | | |
| Investment Companies | | | | | | | |
| Mellon GSL DBT II Collateral Fund | | | 8,679,509 | | | | 8,679,509 |
| BNY Mellon SL DBT II Liquidating Fund | | | 2,776,379 | | | | 2,746,116 |
| | †@Mellon GSL Reinvestment Trust II | | | 75,750 | | | | 3,219 |
| Total Securities Lending Collateral (cost $11,531,638) | | | | | | | 11,428,844 |
12
| | | | |
| Total Value of Securities – 101.36% | | | |
| (cost $717,422,788) | $ | 696,023,573 | © |
| Obligation to Return Securities | | | |
| Lending Collateral** – (1.68%) | | (11,531,638 | ) |
| Receivables and Other Assets | | | |
| Net of Liabilities – 0.32% | | 2,171,991 | |
| Net Assets Applicable to 52,522,188 | | | |
| Shares Outstanding – 100.00% | $ | 686,663,926 | |
| |
| Net Asset Value – Delaware Large Cap Value Fund | | | |
| Class A ($623,792,359 / 47,702,794 Shares) | | | $13.08 | |
| Net Asset Value – Delaware Large Cap Value Fund | | | |
| Class B ($16,199,198 / 1,249,147 Shares) | | | $12.97 | |
| Net Asset Value – Delaware Large Cap Value Fund | | | |
| Class C ($16,731,027 / 1,279,961 Shares) | | | $13.07 | |
| Net Asset Value – Delaware Large Cap Value Fund | | | |
| Class R ($1,509,213 / 115,569 Shares) | | | $13.06 | |
| Net Asset Value – Delaware Large Cap Value Fund | | | |
| Institutional Class ($28,432,129 / 2,174,717 Shares) | | | $13.07 | |
| |
| Components of Net Assets at November 30, 2009: | | | |
| Shares of beneficial interest (unlimited authorization – no par) | $ | 922,666,848 | |
| Undistributed net investment income | | 5,927,041 | |
| Accumulated net realized loss on investments | | (220,530,748 | ) |
| Net unrealized depreciation of investments | | (21,399,215 | ) |
| Total net assets | $ | 686,663,926 | |
| ¹ | The rate shown is the effective yield at the time of purchase. |
| † | Non income producing security. |
| * | Fully or partially on loan. |
| ** | See Note 8 in “Notes to financial statements.” |
| @ | Illiquid security. At November 30, 2009, the aggregate amount of illiquid securities was $3,219, which represented 0.00% of the Fund’s net assets. See Note 9 in “Notes to financial statements.” |
| © | Includes $11,210,030 of securities loaned. |
13
Statement of net assets
Delaware Large Cap Value Fund
| | | |
| Net Asset Value and Offering Price Per Share – | | |
| Delaware Large Cap Value Fund | | |
| Net asset value Class A (A) | $ | 13.08 |
| Sales charge (5.75% of offering price) (B) | | 0.80 |
| Offering price | $ | 13.88 |
| (A) | Net asset value per share, as illustrated, is the amount which would be paid upon redemption or repurchase of shares. |
| (B) | See the current prospectus for purchases of $50,000 or more. |
See accompanying notes
14
| Statement of operations | |
| Delaware Large Cap Value Fund | Year Ended November 30, 2009 |
| Investment Income: | | | | | | |
| | Dividends | $ | 23,742,967 | | | | |
| Interest | | 50,450 | | | | |
| Securities lending income | | 78,878 | | $ | 23,872,295 | |
| |
| Expenses: | | | | | | |
| Management fees | | 4,052,247 | | | | |
| Distribution expenses – Class A | | 1,617,499 | | | | |
| Distribution expenses – Class B | | 178,464 | | | | |
| Distribution expenses – Class C | | 153,239 | | | | |
| Distribution expenses – Class R | | 7,894 | | | | |
| Dividend disbursing and transfer agent fees and expenses | | 1,666,361 | | | | |
| Accounting and administration expenses | | 253,487 | | | | |
| Reports and statements to shareholders | | 125,247 | | | | |
| Legal fees | | 97,986 | | | | |
| Registration fees | | 70,605 | | | | |
| Audit and tax | | 40,990 | | | | |
| | Trustees’ fees | | 39,338 | | | | |
| Insurance fees | | 19,069 | | | | |
| Custodian fees | | 10,356 | | | | |
| Consulting fees | | 9,351 | | | | |
| Dues and services | | 5,668 | | | | |
| Trustees’ expenses | | 3,211 | | | | |
| Pricing fees | | 2,563 | | | 8,353,575 | |
| Less fees waived | | | | | (680,445 | ) |
| Less waived distribution expenses – Class R | | | | | (1,316 | ) |
| Total operating expenses | | | | | 7,671,814 | |
| Net Investment Income | | | | | 16,200,481 | |
| |
| Net Realized and Unrealized Gain (Loss) on Investments: | | | | |
| Net realized loss on investments | | | | | (46,403,394 | ) |
| Net change in unrealized appreciation/depreciation of investments | | | 155,924,206 | |
| Net Realized and Unrealized Gain on Investments | | | | | 109,520,812 | |
| |
| Net Increase in Net Assets Resulting from Operations | | | | $ | 125,721,293 | |
See accompanying notes
15
Statements of changes in net assets
Delaware Large Cap Value Fund
| | | Year Ended |
| | 11/30/09 | | 11/30/08 |
| Increase (Decrease) in Net Assets from Operations: | | | | | | | |
| Net investment income | $ | 16,200,481 | | | $ | 19,097,323 | |
| Net realized loss on investments | | (46,403,394 | ) | | | (164,995,675 | ) |
| Net change in unrealized | | | | | | | |
| appreciation/depreciation of investments | | 155,924,206 | | | | (304,041,912 | ) |
| Net increase (decrease) in net assets resulting | | | | | | | |
| from operations | | 125,721,293 | | | | (449,940,264 | ) |
| |
| Dividends and Distributions to Shareholders from: | | | | | | | |
| Net investment income: | | | | | | | |
| | Class A | | (17,440,301 | ) | | | (19,850,670 | ) |
| Class B | | (475,529 | ) | | | (586,368 | ) |
| Class C | | (375,250 | ) | | | (340,914 | ) |
| Class R | | (36,737 | ) | | | (37,234 | ) |
| Institutional Class | | (813,219 | ) | | | (941,239 | ) |
| |
| Net realized gain on investments: | | | | | | | |
| Class A | | — | | | | (102,495,698 | ) |
| Class B | | — | | | | (5,182,330 | ) |
| Class C | | — | | | | (2,928,752 | ) |
| Class R | | — | | | | (228,775 | ) |
| Institutional Class | | — | | | | (4,175,858 | ) |
| | | (19,141,036 | ) | | | (136,767,838 | ) |
| |
| Capital Share Transactions: | | | | | | | |
| Proceeds from shares sold: | | | | | | | |
| Class A | | 19,271,954 | | | | 27,200,303 | |
| Class B | | 266,760 | | | | 297,573 | |
| Class C | | 2,253,941 | | | | 2,473,201 | |
| Class R | | 472,281 | | | | 549,235 | |
| Institutional Class | | 3,769,779 | | | | 4,895,326 | |
16
| | Year Ended |
| | | 11/30/09 | | 11/30/08 |
| Capital Share Transactions (continued): | | | | | | | |
| Net asset value of shares issued upon reinvestment | | | | | | | |
| of dividends and distributions: | | | | | | | |
| Class A | $ | 15,542,064 | | | $ | 112,274,450 | |
| Class B | | 448,159 | | | | 5,407,704 | |
| Class C | | 356,654 | | | | 3,127,230 | |
| Class R | | 36,737 | | | | 266,007 | |
| Institutional Class | | 813,219 | | | | 5,117,094 | |
| | | 43,231,548 | | | | 161,608,123 | |
| |
| Cost of shares repurchased: | | | | | | | |
| | Class A | | (95,028,180 | ) | | | (166,804,235 | ) |
| Class B | | (9,243,153 | ) | | | (21,848,956 | ) |
| Class C | | (3,926,417 | ) | | | (8,179,906 | ) |
| Class R | | (491,682 | ) | | | (952,958 | ) |
| Institutional Class | | (5,327,537 | ) | | | (9,748,769 | ) |
| | | (114,016,969 | ) | | | (207,534,824 | ) |
| Decrease in net assets derived from capital | | | | | | | |
| share transactions | | (70,785,421 | ) | | | (45,926,701 | ) |
| Net Increase (Decrease) in Net Assets | | 35,794,836 | | | | (632,634,803 | ) |
| |
| Net Assets: | | | | | | | |
| Beginning of year | | 650,869,090 | | | | 1,283,503,893 | |
| End of year (including undistributed net investment | | | | | | | |
| income of $5,927,041 and $8,867,596, respectively) | $ | 686,663,926 | | | $ | 650,869,090 | |
See accompanying notes
17
Financial highlights
Delaware Large Cap Value Fund Class A
Selected data for each share of the Fund outstanding throughout each period were as follows:
| Net asset value, beginning of period |
| |
| Income (loss) from investment operations: |
| Net investment income1 |
| Net realized and unrealized gain (loss) on investments and foreign currencies |
| Total from investment operations |
| |
| Less dividends and distributions from: |
| Net investment income |
| Net realized gain on investments |
| Total dividends and distributions |
| |
| Net asset value, end of period |
| |
| Total return2 |
| |
| Ratios and supplemental data: |
| Net assets, end of period (000 omitted) |
| Ratio of expenses to average net assets |
| Ratio of expenses to average net assets |
| prior to fees waived and expense paid indirectly |
| Ratio of net investment income to average net assets |
| Ratio of net investment income to average net assets |
| prior to fees waived and expense paid indirectly |
| Portfolio turnover |
1 | The average shares outstanding method has been applied for per share information. |
2 | Total investment return is based on the change in net asset value of a share during the period and assumes reinvestment of dividends and distributions at net asset value and does not reflect the impact of a sales charge. Total investment return during some of the periods shown reflects a waiver by the manager. Performance would have been lower had the waiver not been in effect. |
See accompanying notes
18
| Year Ended | |
| 11/30/09 | | | 11/30/08 | | | 11/30/07 | | | 11/30/06 | | | 11/30/05 | | |
| | $11.080 | | | $20.390 | | | $21.080 | | | $19.010 | | | $18.030 | | |
| | |
| | |
| 0.293 | | | 0.305 | | | 0.336 | | | 0.305 | | | 0.271 | | |
| 2.046 | | | (7.418 | ) | | 0.090 | | | 3.279 | | | 0.917 | | |
| 2.339 | | | (7.113 | ) | | 0.426 | | | 3.584 | | | 1.188 | | |
| | |
| | |
| (0.339 | ) | | (0.353 | ) | | (0.363 | ) | | (0.324 | ) | | (0.192 | ) | |
| — | | | (1.844 | ) | | (0.753 | ) | | (1.190 | ) | | (0.016 | ) | |
| (0.339 | ) | | (2.197 | ) | | (1.116 | ) | | (1.514 | ) | | (0.208 | ) | |
| | |
| | $13.080 | | | $11.080 | | | $20.390 | | | $21.080 | | | $19.010 | | |
| | |
| 21.51% | | | (38.91% | ) | | 1.96% | | | 20.28% | | | 6.62% | | |
| | |
| | |
| | $623,793 | | | $587,215 | | | $1,140,659 | | | $1,246,544 | | | $1,177,317 | | |
| 1.18% | | | 1.18% | | | 1.13% | | | 1.17% | | | 1.15% | | |
| | |
| 1.29% | | | 1.20% | | | 1.13% | | | 1.17% | | | 1.15% | | |
| 2.58% | | | 1.97% | | | 1.59% | | | 1.60% | | | 1.47% | | |
| | |
| 2.47% | | | 1.95% | | | 1.59% | | | 1.60% | | | 1.47% | | |
| 15% | | | 27% | | | 19% | | | 16% | | | 114% | | |
19
Financial highlights
Delaware Large Cap Value Fund Class B
Selected data for each share of the Fund outstanding throughout each period were as follows:
| Net asset value, beginning of period |
| |
| Income (loss) from investment operations: |
| Net investment income1 |
| Net realized and unrealized gain (loss) on investments and foreign currencies |
| Total from investment operations |
| |
| Less dividends and distributions from: |
| Net investment income |
| Net realized gain on investments |
| Total dividends and distributions |
| |
| Net asset value, end of period |
| |
| Total return2 |
| |
| Ratios and supplemental data: |
| Net assets, end of period (000 omitted) |
| Ratio of expenses to average net assets |
| Ratio of expenses to average net assets |
| prior to fees waived and expense paid indirectly |
| Ratio of net investment income to average net assets |
| Ratio of net investment income to average net assets |
| prior to fees waived and expense paid indirectly |
| Portfolio turnover |
| The average shares outstanding method has been applied for per share information. |
| Total investment return is based on the change in net asset value of a share during the period and assumes reinvestment of dividends and distributions at net asset value and does not reflect the impact of a sales charge. Total investment return during some of the periods shown reflects a waiver by the manager. Performance would have been lower had the waiver not been in effect. |
See accompanying notes
20
| Year Ended | |
| 11/30/09 | | 11/30/08 | | 11/30/07 | | 11/30/06 | | 11/30/05 | |
| $11.000 | | | $20.240 | | | $20.930 | | | $18.880 | | | $17.910 | |
| | |
| | |
| 0.213 | | | 0.193 | | | 0.185 | | | 0.168 | | | 0.137 | |
| 2.029 | | | (7.373 | ) | | 0.091 | | | 3.252 | | | 0.912 | |
| 2.242 | | | (7.180 | ) | | 0.276 | | | 3.420 | | | 1.049 | |
| | |
| | |
| (0.272 | ) | | (0.216 | ) | | (0.213 | ) | | (0.180 | ) | | (0.063 | ) |
| — | | | (1.844 | ) | | (0.753 | ) | | (1.190 | ) | | (0.016 | ) |
| (0.272 | ) | | (2.060 | ) | | (0.966 | ) | | (1.370 | ) | | (0.079 | ) |
| | |
| $12.970 | | | $11.000 | | | $20.240 | | | $20.930 | | | $18.880 | |
| | |
| 20.66% | | | (39.37% | ) | | 1.25% | | | 19.39% | | | 5.87% | |
| | |
| | |
| $16,199 | | | $22,137 | | | $61,603 | | | $102,322 | | | $136,050 | |
| 1.90% | | | 1.90% | | | 1.86% | | | 1.90% | | | 1.88% | |
| | |
| 2.01% | | | 1.92% | | | 1.86% | | | 1.90% | | | 1.88% | |
| 1.86% | | | 1.25% | | | 0.86% | | | 0.87% | | | 0.74% | |
| | |
| 1.75% | | | 1.23% | | | 0.86% | | | 0.87% | | | 0.74% | |
| 15% | | | 27% | | | 19% | | | 16% | | | 114% | |
21
Financial highlights
Delaware Large Cap Value Fund Class C
Selected data for each share of the Fund outstanding throughout each period were as follows:
| Net asset value, beginning of period |
| |
| Income (loss) from investment operations: |
| Net investment income1 |
| Net realized and unrealized gain (loss) on investments and foreign currencies |
| Total from investment operations |
| |
| Less dividends and distributions from: |
| Net investment income |
| Net realized gain on investments |
| Total dividends and distributions |
| |
| Net asset value, end of period |
| |
| Total return2 |
| |
| Ratios and supplemental data: |
| Net assets, end of period (000 omitted) |
| Ratio of expenses to average net assets |
| Ratio of expenses to average net assets |
| prior to fees waived and expense paid indirectly |
| Ratio of net investment income to average net assets |
| Ratio of net investment income to average net assets |
| prior to fees waived and expense paid indirectly |
| Portfolio turnover |
1 The average shares outstanding method has been applied for per share information. |
2 Total investment return is based on the change in net asset value of a share during the period and assumes reinvestment of dividends and distributions at net asset value and does not reflect the impact of a sales charge. Total investment return during some of the periods shown reflects a waiver by the manager. Performance would have been lower had the waiver not been in effect. |
See accompanying notes
22
| Year Ended | |
| 11/30/09 | | 11/30/08 | | 11/30/07 | | 11/30/06 | | 11/30/05 | |
| $11.090 | | | $20.380 | | | $21.070 | | | $19.000 | | | $18.020 | |
| | |
| | |
| 0.212 | | | 0.193 | | | 0.183 | | | 0.166 | | | 0.136 | |
| 2.040 | | | (7.423 | ) | | 0.093 | | | 3.274 | | | 0.923 | |
| 2.252 | | | (7.230 | ) | | 0.276 | | | 3.440 | | | 1.059 | |
| | |
| | |
| (0.272 | ) | | (0.216 | ) | | (0.213 | ) | | (0.180 | ) | | (0.063 | ) |
| — | | | (1.844 | ) | | (0.753 | ) | | (1.190 | ) | | (0.016 | ) |
| (0.272 | ) | | (2.060 | ) | | (0.966 | ) | | (1.370 | ) | | (0.079 | ) |
| | |
| $13.070 | | | $11.090 | | | $20.380 | | | $21.070 | | | $19.000 | |
| | |
| 20.69% | | | (39.39% | ) | | 1.24% | | | 19.38% | | | 5.89% | |
| | |
| | |
| $16,731 | | | $15,507 | | | $32,453 | | | $36,709 | | | $36,148 | |
| 1.90% | | | 1.90% | | | 1.86% | | | 1.90% | | | 1.88% | |
| | |
| 2.01% | | | 1.92% | | | 1.86% | | | 1.90% | | | 1.88% | |
| 1.86% | | | 1.25% | | | 0.86% | | | 0.87% | | | 0.74% | |
| | |
| 1.75% | | | 1.23% | | | 0.86% | | | 0.87% | | | 0.74% | |
| 15% | | | 27% | | | 19% | | | 16% | | | 114% | |
23
Financial highlights
Delaware Large Cap Value Fund Class R
Selected data for each share of the Fund outstanding throughout each period were as follows:
| Net asset value, beginning of period |
| |
| Income (loss) from investment operations: |
| Net investment income1 |
| Net realized and unrealized gain (loss) on investments and foreign currencies |
| Total from investment operations |
| |
| Less dividends and distributions from: |
| Net investment income |
| Net realized gain on investments |
| Total dividends and distributions |
| |
| Net asset value, end of period |
| |
| Total return2 |
| |
| Ratios and supplemental data: |
| Net assets, end of period (000 omitted) |
| Ratio of expenses to average net assets |
| Ratio of expenses to average net assets |
| prior to fees waived and expense paid indirectly |
| Ratio of net investment income to average net assets |
| Ratio of net investment income to average net assets |
| prior to fees waived and expense paid indirectly |
| Portfolio turnover |
1 The average shares outstanding method has been applied for per share information. |
2 Total investment return is based on the change in net asset value of a share during the period and assumes reinvestment of dividends and distributions at net asset value. Total investment return during some of the periods shown reflects waivers by the manager and distributor. Performance would have been lower had the waivers not been in effect. |
See accompanying notes
24
| Year Ended | |
| 11/30/09 | | 11/30/08 | | 11/30/07 | | 11/30/06 | | 11/30/05 | |
| $11.070 | | | $20.360 | | | $21.060 | | | $19.000 | | | $18.010 | |
| | |
| | |
| 0.268 | | | 0.271 | | | 0.289 | | | 0.262 | | | 0.216 | |
| 2.042 | | | (7.407 | ) | | 0.083 | | | 3.275 | | | 0.915 | |
| 2.310 | | | (7.136 | ) | | 0.372 | | | 3.537 | | | 1.131 | |
| | |
| | |
| (0.320 | ) | | (0.310 | ) | | (0.319 | ) | | (0.287 | ) | | (0.125 | ) |
| — | | | (1.844 | ) | | (0.753 | ) | | (1.190 | ) | | (0.016 | ) |
| (0.320 | ) | | (2.154 | ) | | (1.072 | ) | | (1.477 | ) | | (0.141 | ) |
| | |
| $13.060 | | | $11.070 | | | $20.360 | | | $21.060 | | | $19.000 | |
| | |
| 21.23% | | | (39.03% | ) | | 1.70% | | | 20.00% | | | 6.30% | |
| | |
| | |
| $1,509 | | | $1,253 | | | $2,514 | | | $1,166 | | | $1,078 | |
| 1.40% | | | 1.40% | | | 1.36% | | | 1.40% | | | 1.45% | |
| | |
| 1.61% | | | 1.52% | | | 1.46% | | | 1.50% | | | 1.48% | |
| 2.36% | | | 1.75% | | | 1.36% | | | 1.37% | | | 1.17% | |
| | |
| 2.15% | | | 1.63% | | | 1.26% | | | 1.27% | | | 1.14% | |
| 15% | | | 27% | | | 19% | | | 16% | | | 114% | |
25
Financial highlights
Delaware Large Cap Value Fund Institutional Class
Selected data for each share of the Fund outstanding throughout each period were as follows:
| Net asset value, beginning of period |
| |
| Income (loss) from investment operations: |
| Net investment income1 |
| Net realized and unrealized gain (loss) on investments and foreign currencies |
| Total from investment operations |
| |
| Less dividends and distributions from: |
| Net investment income |
| Net realized gain on investments |
| Total dividends and distributions |
| |
| Net asset value, end of period |
| |
| Total return2 |
| |
| Ratios and supplemental data: |
| Net assets, end of period (000 omitted) |
| Ratio of expenses to average net assets |
| Ratio of expenses to average net assets |
| prior to fees waived and expense paid indirectly |
| Ratio of net investment income to average net assets |
| Ratio of net investment income to average net assets |
| prior to fees waived and expense paid indirectly |
| Portfolio turnover |
1 The average shares outstanding method has been applied for per share information. |
2 Total investment return is based on the change in net asset value of a share during the period and assumes reinvestment of dividends and distributions at net asset value. Total investment return during some of the periods shown reflects a waiver by the manager. Performance would have been lower had the waiver not been in effect. |
See accompanying notes
26
| Year Ended | |
| 11/30/09 | | 11/30/08 | | 11/30/07 | | 11/30/06 | | 11/30/05 | |
| $11.080 | | | $20.390 | | | $21.080 | | | $19.010 | | | $18.030 | |
| | |
| | |
| 0.325 | | | 0.349 | | | 0.395 | | | 0.357 | | | 0.321 | |
| 2.031 | | | (7.409 | ) | | 0.091 | | | 3.279 | | | 0.912 | |
| 2.356 | | | (7.060 | ) | | 0.486 | | | 3.636 | | | 1.233 | |
| | |
| | |
| (0.366 | ) | | (0.406 | ) | | (0.423 | ) | | (0.376 | ) | | (0.237 | ) |
| — | | | (1.844 | ) | | (0.753 | ) | | (1.190 | ) | | (0.016 | ) |
| (0.366 | ) | | (2.250 | ) | | (1.176 | ) | | (1.566 | ) | | (0.253 | ) |
| | |
| $13.070 | | | $11.080 | | | $20.390 | | | $21.080 | | | $19.010 | |
| | |
| 21.83% | | | (38.76% | ) | | 2.24% | | | 20.61% | | | 6.88% | |
| | |
| | |
| $28,432 | | | $24,757 | | | $46,275 | | | $45,841 | | | $44,837 | |
| 0.90% | | | 0.90% | | | 0.86% | | | 0.90% | | | 0.88% | |
| | |
| 1.01% | | | 0.92% | | | 0.86% | | | 0.90% | | | 0.88% | |
| 2.86% | | | 2.25% | | | 1.86% | | | 1.87% | | | 1.74% | |
| | |
| 2.75% | | | 2.23% | | | 1.86% | | | 1.87% | | | 1.74% | |
| 15% | | | 27% | | | 19% | | | 16% | | | 114% | |
27
| Notes to financial statements |
| Delaware Large Cap Value Fund | November 30, 2009 |
Delaware Group® Equity Funds II (Trust) is organized as a Delaware statutory trust and offers two series: Delaware Large Cap Value Fund and Delaware Value Fund. These financial statements and the related notes pertain to Delaware Large Cap Value Fund (Fund). The Trust is an open-end investment company. The Fund is considered diversified under the Investment Company Act of 1940, as amended, and offers Class A, Class B, Class C, Class R and Institutional Class shares. Class A shares are sold with a maximum front-end sales charge of up to 5.75%. Class A share purchases of $1,000,000 or more will incur a contingent deferred sales charge (CDSC) of 1% if redeemed during the first year and 0.50% during the second year, provided that Delaware Distributors, L.P. (DDLP) paid a financial advisor a commission on the purchase of those shares. Class B shares may only be purchased through dividend reinvestment and certain permitted exchanges. Prior to June 1, 2007, Class B shares were sold with a CDSC that declined from 4% to zero depending upon the period of time the shares were held. Class B shares will automatically convert to Class A shares on a quarterly basis approximately eight years after purchase. Class C shares are sold with a CDSC of 1%, if redeemed during the first twelve months. Class R and Institutional Class shares are not subject to a sales charge and are offered for sale exclusively to certain eligible investors.
The investment objective of the Fund is to seek long-term capital appreciation.
1. Significant Accounting Policies
The following accounting policies are in accordance with U.S. generally accepted accounting principles (GAAP) and are consistently followed by the Fund.
Security Valuation — Equity securities, except those traded on the Nasdaq Stock Market, Inc. (Nasdaq), are valued at the last quoted sales price as of the time of the regular close of the New York Stock Exchange (NYSE) on the valuation date. Securities traded on the Nasdaq are valued in accordance with the Nasdaq Official Closing Price, which may not be the last sales price. If on a particular day an equity security does not trade, then the mean between the bid and ask prices will be used. Investment companies are valued at net asset value per share. Short-term debt securities are valued at market value. Generally, other securities and assets for which market quotations are not readily available are valued at fair value as determined in good faith under the direction of the Fund’s Board of Trustees (Board). In determining whether market quotations are readily available or fair valuation will be used, various factors will be taken into consideration, such as market closures, or suspension of trading in a security. The Fund may use fair value pricing more frequently for securities traded primarily in non-U.S. markets because, among other things, most foreign markets close well before the Fund values its securities at 4:00 p.m. Eastern time. The earlier close of these foreign markets gives rise to the possibility that significant events, including broad market moves, government actions or pronouncements, aftermarket trading, or news events may have occurred in the interim. To account for this, the Fund may frequently value foreign securities using fair value prices based on third-party vendor modeling tools (international fair value pricing).
28
Federal Income Taxes — No provision for federal income taxes has been made as the Fund intends to continue to qualify for federal income tax purposes as a regulated investment company under Subchapter M of the Internal Revenue Code of 1986, as amended, and make the requisite distributions to shareholders. The Fund evaluates tax positions taken or expected to be taken in the course of preparing the Fund’s tax returns to determine whether the tax positions are “more-likely-than-not” of being sustained by the applicable tax authority. Tax positions not deemed to meet the more-likely-than-not threshold are recorded as a tax benefit or expense in the current year. Management has analyzed the Fund’s tax positions taken on federal income tax returns for all open tax years (tax years ended November 30, 2006 – November 30, 2009), and has concluded that no provision for federal income tax is required in the Fund’s financial statements.
Class Accounting — Investment income, common expenses and realized and unrealized gain (loss) on investments are allocated to the various classes of the Fund on the basis of daily net assets of each class. Distribution expenses relating to a specific class are charged directly to that class.
Repurchase Agreements — The Fund may invest in a pooled cash account along with other members of the Delaware Investments® Family of Funds pursuant to an exemptive order issued by the Securities and Exchange Commission. The aggregate daily balance of the pooled cash account is invested in repurchase agreements secured by obligations of the U.S government. The respective collateral is held by the Fund’s custodian bank until the maturity of the respective repurchase agreements. Each repurchase agreement is at least 102% collateralized. However, in the event of default or bankruptcy by the counterparty to the agreement, realization of the collateral may be subject to legal proceedings. At November 30, 2009, the Fund held no investments in repurchase agreements.
Use of Estimates — The preparation of financial statements in conformity with U.S. GAAP requires management to make estimates and assumptions that affect the reported amounts of assets and liabilities at the date of the financial statements and the reported amounts of revenues and expenses during the reporting period. Actual results could differ from those estimates.
Other — Expenses directly attributable to the Fund are charged directly to the Fund. Other expenses common to various funds within the Delaware Investments® Family of Funds are generally allocated amongst such funds on the basis of average net assets. Management fees and some other expenses are paid monthly. Security transactions are recorded on the date the securities are purchased or sold (trade date) for financial reporting purposes. Costs used in calculating realized gains and losses on the sale of investment securities are those of the specific securities sold. Dividend income is recorded on the ex-dividend date and interest income is recorded on the accrual basis. The Fund declares and pays dividends from net investment income quarterly and distributions from net realized gain from investments, if any, annually.
Subject to seeking best execution, the Fund may direct certain security trades to brokers who have agreed to rebate a portion of the related brokerage commission to the Fund in cash. In general, best execution refers to many factors, including the price paid or received for a security,
29
Notes to financial statements
Delaware Large Cap Value Fund
1. Significant Accounting Policies (continued)
the commission charged, the promptness and reliability of execution, the confidentiality and placement accorded the order, and other factors affecting the overall benefit obtained by the Fund on the transaction. There were no commission rebates for the year ended November 30, 2009.
The Fund may receive earnings credits from its custodian when positive cash balances are maintained, which are used to offset custody fees. There were no earnings credits for the year ended November 30, 2009.
On July 1, 2009, the Financial Accounting Standards Board (FASB) issued the FASB Accounting Standards Codification (Codification). The Codification became the single source of authoritative nongovernmental U.S. GAAP, superseding existing literature of the FASB, American Institute of Certified Public Accountants, Emerging Issues Task Force and other sources. The Codification is effective for interim and annual periods ending after September 15, 2009. The Fund adopted the Codification for the year ended November 30, 2009. There was no impact to financial statements as the Codification requirements are disclosure-only in nature.
Management has evaluated whether any events or transactions occurred subsequent to November 30, 2009 through January 21, 2010, the date of issuance of the Fund’s financial statements, and determined that there were no material events or transactions that would require recognition or disclosure in the Fund’s financial statements.
2. Investment Management, Administration Agreements and Other Transactions with Affiliates
In accordance with the terms of its investment management agreement, the Fund pays Delaware Management Company (DMC), a series of Delaware Management Business Trust and the investment manager, an annual fee which is calculated daily at the rate of 0.65% on the first $500 million of average daily net assets of the Fund, 0.60% on the next $500 million, 0.55% on the next $1.5 billion, and 0.50% on average daily net assets in excess of $2.5 billion.
DMC had voluntarily agreed to waive that portion, if any, of its management fee and reimburse the Fund to the extent necessary to ensure that total annual operating expenses from April 1, 2009 to September 10, 2009 did not exceed 0.88% of average daily net assets of the fund (excluding any 12b-1 plan expenses, taxes, interest, inverse floater program expenses, brokerage fees, certain insurance costs, and nonroutine expenses or costs, including, but not limited to, those relating to reorganizations, litigation, conducting shareholder meetings, and liquidations). For purposes of these waivers and reimbursements, nonroutine expenses may also include such additional costs and expenses, as may be agreed upon from time to time by the Fund’s Board and DMC. These expense waivers and reimbursements applied only to expenses paid directly by the Fund. Effective September 11, 2009, DMC has discontinued the voluntary waiver.
30
Delaware Service Company, Inc. (DSC), an affiliate of DMC, provides fund accounting and financial administration oversight services to the Fund. For these services, the Fund pays DSC fees based on aggregate daily net assets of the Delaware Investments® Family of Funds at the following annual rate: 0.0050% of the first $30 billion; 0.0045% of the next $10 billion; 0.0040% of the next $10 billion; and 0.0025% of aggregate average daily net assets in excess of $50 billion. The fees payable to DSC under the service agreement described above are allocated among all Funds in the Delaware Investments® Family of Funds on a relative net asset value basis. For the year ended November 30, 2009, the Fund was charged $31,686 for these services.
DSC also provides dividend disbursing and transfer agency services. The Fund pays DSC a monthly fee based on the number of shareholder accounts for dividend disbursing and transfer agent services.
Pursuant to a distribution agreement and distribution plan, the Fund pays DDLP, the distributor and an affiliate of DMC, an annual distribution and service fee not to exceed 0.30% of the average daily net assets of the Class A shares, 1.00% of the average daily net assets of the Class B and C shares and 0.60% of the average daily net assets of Class R shares. Institutional Class shares pay no distribution and service expenses. The Board has adopted a formula for calculating 12b-1 plan fees for the Fund’s Class A shares that went into effect on May 2, 1994. The total 12b-1 fees to be paid by Class A shareholders of the Fund will be the sum of 0.10% of the average daily net assets representing shares that were acquired prior to June 1, 1992 and 0.30% of the average daily net assets representing shares that were acquired on or after June 1, 1992. All Class A shareholders will bear 12b-1 fees at the same rate, the blended rate based upon the allocation of the rates described above. DDLP has contracted to limit distribution and service fees through March 31, 2010 in order to prevent distribution and service fees of Class R shares from exceeding 0.50% of average daily net assets.
At November 30, 2009, the Fund had liabilities payable to affiliates as follows:
| Investment management fee payable to DMC | $358,964 |
| Dividend disbursing, transfer agent and fund accounting | |
| oversight fees and other expenses payable to DSC | 103,069 |
| Distribution fees payable to DDLP | 172,310 |
| Other expenses payable to DMC and affiliates* | 13,106 |
*DMC, as part of its administrative services, pays operating expenses on behalf of the Fund and is reimbursed on a periodic basis. Such expenses include items such as printing of shareholder reports, fees for audit, legal and tax services, registration fees and trustees’ fees.
As provided in the investment management agreement, the Fund bears the cost of certain legal and tax services, including internal legal and tax services provided to the Fund by DMC and/or its affiliates’ employees. For the year ended November 30, 2009, the Fund was charged $53,790 for internal legal and tax services provided by DMC and/or its affiliates’ employees.
31
Notes to financial statements
Delaware Large Cap Value Fund
2. Investment Management, Administration Agreements and Other Transactions with Affiliates (continued)
For the year ended November 30, 2009, DDLP earned $31,756 for commissions on sales of the Fund’s Class A shares. For the year ended November 30, 2009, DDLP received gross CDSC commissions of $-, $17,136 and $1,266 on redemption of the Fund’s Class A, Class B and Class C shares, respectively, and these commissions were entirely used to offset up-front commissions previously paid by DDLP to broker-dealers on sales of those shares.
Trustees’ fees include expenses accrued by the Fund for each Trustee’s retainer and meeting fees. Certain officers of DMC, DSC and DDLP are officers and/or Trustees of the Trust. These officers and Trustees are paid no compensation by the Fund.
3. Investments
For the year ended November 30, 2009, the Fund made purchases of $92,850,965 and sales of $169,388,534 of investment securities other than short-term investments.
At November 30, 2009, the cost of investments for federal income tax purposes was $717,756,128. At November 30, 2009, the net unrealized depreciation was $21,732,555, of which $61,442,644 related to unrealized appreciation of investments and $83,175,199 related to unrealized depreciation of investments.
The Fund applies the provisions, as amended to date, of Accounting Standards Codification 820 (ASC 820), Fair Value Measurements and Disclosures. ASC 820 defines fair value as the price that the Fund would receive to sell an asset or pay to transfer a liability in an orderly transaction between market participants at the measurement date under current market conditions. ASC 820 also establishes a framework for measuring fair value, and a three level hierarchy for fair value measurements based upon the transparency of inputs to the valuation of an asset or liability. Inputs may be observable or unobservable and refer broadly to the assumptions that market participants would use in pricing the asset or liability. Observable inputs reflect the assumptions market participants would use in pricing the asset or liability based on market data obtained from sources independent of the reporting entity. Unobservable inputs reflect the reporting entity’s own assumptions about the assumptions that market participants would use in pricing the asset or liability developed based on the best information available under the circumstances. The Fund’s investment in its entirety is assigned a level based upon the observability of the inputs which are significant to the overall valuation. The three-tier hierarchy of inputs is summarized below.
Level 1 – inputs are quoted prices in active markets
Level 2 – inputs are observable, directly or indirectly
Level 3 – inputs are unobservable and reflect assumptions on the part of the reporting entity
32
The following table summarizes the valuation of the Fund’s investments by the ASC 820 fair value hierarchy levels as of November 30, 2009:
| Level 1 | | Level 2 | | Level 3 | | Total |
| Common Stock | $ | 676,236,718 | | $ | — | | $ | — | | $ | 676,236,718 |
| Short-Term | | — | | | 8,358,011 | | | — | | | 8,358,011 |
| Securities Lending Collateral | | 8,679,509 | | | 2,746,116 | | | 3,219 | | | 11,428,844 |
| Total | $ | 684,916,227 | | $ | 11,104,127 | | $ | 3,219 | | $ | 696,023,573 |
The following is a reconciliation of investments in which significant unobservable inputs (Level 3) were used in determining fair value:
| Securities |
| Lending |
| Collateral |
| Balance as of 11/30/08 | $ | 6,211 | |
| Net change in unrealized appreciation/depreciation | | (2,992 | ) |
| Balance as of 11/30/09 | $ | 3,219 | |
| |
| Net change in unrealized appreciation/depreciation from | | | |
| investments still held as of 11/30/09 | $ | (2,992 | ) |
4. Dividend and Distribution Information
Income and long-term capital gain distributions are determined in accordance with federal income tax regulations, which may differ from U.S. GAAP. Additionally, distributions from net short-term gains on sales of investment securities are treated as ordinary income for federal income tax purposes. The tax character of dividends and distributions paid during the years ended November 30, 2009 and 2008 was as follows:
| Year Ended |
| 11/30/09 | | 11/30/08 |
| Ordinary income | $ | 19,141,036 | | $ | 23,611,519 |
| Long-term capital gain | | — | | | 113,156,319 |
| Total | $ | 19,141,036 | | $ | 136,767,838 |
33
Notes to financial statements
Delaware Large Cap Value Fund
5. Components of Net Assets on a Tax Basis
As of November 30, 2009, the components of net assets on a tax basis were as follows:
| Shares of beneficial interest | $ | 922,666,848 | |
| Undistributed ordinary income | | 5,927,041 | |
| Capital loss carryforwards* | | (220,197,408 | ) |
| Unrealized depreciation of investments | | (21,732,555 | ) |
| Net assets | $ | 686,663,926 | |
*The amount of this loss which can be utilized in subsequent years is subject to an annual limitation in accordance with the Internal Revenue Code due to the fund merger with Delaware Core Equity Fund, Delaware Devon Fund and Delaware Growth and Income Fund in 2004.
The difference between book basis and tax basis components of net assets are primarily attributable to tax deferral of losses on wash sales.
For financial reporting purposes, capital accounts are adjusted to reflect the tax character of permanent book/tax differences. Reclassifications are primarily due to tax treatment of expiration of capital loss carryforwards. Results of operations and net assets were not affected by these reclassifications. For the year ended November 30, 2009, the Fund recorded the following reclassifications.
| Accumulated net realized gain | $ | 4,231,045 | |
| Paid-in capital | | (4,231,045 | ) |
For federal income tax purposes, capital loss carryforwards may be carried forward and applied against future capital gains. $4,231,045 expired in 2009. Capital loss carryforwards remaining at November 30, 2009 will expire as follows: $6,991,292 expires in 2010, $166,349,321 expires in 2016 and $46,856,795 expires in 2017.
34
6. Capital Shares
Transactions in capital shares were as follows:
| Year Ended |
| 11/30/09 | | 11/30/08 |
| Shares sold: | | | | | |
| Class A | 1,718,166 | | | 1,723,151 | |
| Class B | 25,066 | | | 20,782 | |
| Class C | 203,977 | | | 163,122 | |
| Class R | 43,683 | | | 35,369 | |
| Institutional Class | 342,845 | | | 318,709 | |
| |
| Shares issued upon reinvestment of dividends and distributions: | | | | | |
| Class A | 1,417,700 | | | 6,244,176 | |
| Class B | 41,298 | | | 300,079 | |
| Class C | 32,553 | | | 172,290 | |
| Class R | 3,353 | | | 14,759 | |
| Institutional Class | 74,185 | | | 285,859 | |
| 3,902,826 | | | 9,278,296 | |
| |
| Shares repurchased: | | | | | |
| Class A | (8,422,148 | ) | | (10,927,366 | ) |
| Class B | (828,779 | ) | | (1,353,679 | ) |
| Class C | (354,822 | ) | | (529,894 | ) |
| Class R | (44,589 | ) | | (60,465 | ) |
| Institutional Class | (477,652 | ) | | (639,208 | ) |
| | (10,127,990 | ) | | (13,510,612 | ) |
| Net decrease | (6,225,164 | ) | | (4,232,316 | ) |
For the years ended November 30, 2009 and 2008, 433,186 Class B shares were converted to 429,632 Class A shares valued at $4,837,126 and 602,584 Class B shares were converted to 597,772 Class A shares valued at $10,124,727, respectively. The respective amounts are included in Class B redemptions and Class A subscriptions in the table above and the statements of changes in net assets.
35
Notes to financial statements
Delaware Large Cap Value Fund
7. Line of Credit
The Fund, along with certain other funds in the Delaware Investments® Family of Funds (Participants), participates in a $35,000,000 revolving line of credit with The Bank of New York Mellon (BNY Mellon) to be used for temporary or emergency purposes as an additional source of liquidity to fund redemptions of investor shares. Under the agreement, the Participants are charged an annual commitment fee, which is allocated across the Participants on the basis of each Participant’s allocation of the entire facility. The Participants may borrow up to a maximum of one third of their net assets under the agreement. The agreement expires on November 16, 2010. The Fund had no amounts outstanding as of November 30, 2009, or at any time during the year then ended.
8. Securities Lending
The Fund, along with other funds in the Delaware Investments® Family of Funds, may lend its securities pursuant to a security lending agreement (Lending Agreement) with BNY Mellon. With respect to each loan, if the aggregate market value of securities collateral held plus cash collateral received on any business day is less than the aggregate market value of the securities which are the subject of such loan, the borrower will be notified to provide additional collateral not less than the applicable collateral requirements. Cash collateral received is generally invested in the Mellon GSL DBT II Collateral Fund (Collective Trust) established by BNY Mellon for the purpose of investment on behalf of clients participating in its securities lending programs. The Collective Trust may invest in fixed income securities, with a weighted average maturity not to exceed 90 days, rated in one of the top three tiers by Standard & Poor’s Ratings Group or Moody’s Investors Service, Inc. or repurchase agreements collateralized by such securities. The Collective Trust seeks to maintain a net asset value per unit of $1.00, but there can be no assurance that it will always be able to do so. At November 30, 2009, the Collective Trust held only cash and assets with a maturity of one business day or less (Cash/Overnight Assets). The Fund may incur investment losses as a result of investing securities lending collateral in the Collective Trust. This could occur if an investment in the Collective Trust defaulted or if it were necessary to liquidate assets in the Collective Trust to meet returns on outstanding security loans at a time when the Collective Trust’s net asset value per unit was less than $1.00. Under those circumstances, the Fund may not receive an amount from the Collective Trust that is equal in amount to the collateral the Fund would be required to return to the borrower of the securities and the Fund would be required to make up for this shortfall. Effective April 20, 2009, BNY Mellon transferred the assets of the Collective Trust other than the Cash/Overnight Assets to the BNY Mellon SL DBT II Liquidating Fund (Liquidating Fund), effectively bifurcating the collateral investment pool. The Fund’s exposure to the Liquidating Fund is expected to decrease as the Liquidating Fund’s assets mature or are sold. In October 2008, BNY Mellon transferred certain distressed securities from the Collective Trust into the Mellon GSL Reinvestment Trust II. The Fund can also accept U.S. government securities and letters of credit (non-cash collateral) in connection with securities loans. In the event of default or bankruptcy by the lending agent, realization and/or retention of the collateral may be subject to legal proceedings. In the event the borrower fails to return loaned securities and the collateral received is insufficient
36
to cover the value of the loaned securities and provided such collateral shortfall is not the result of investment losses, the lending agent has agreed to pay the amount of the shortfall to the Fund, or at the discretion of the lending agent, replace the loaned securities. The Fund continues to record dividends or interest, as applicable, on the securities loaned and is subject to change in value of the securities loaned that may occur during the term of the loan. The Fund has the right under the Lending Agreement to recover the securities from the borrower on demand. With respect to security loans collateralized by non-cash collateral, the Fund receives loan premiums paid by the borrower. With respect to security loans collateralized by cash collateral, the earnings from the collateral investments are shared among the Fund, the security lending agent, and the borrower. The Fund records security lending income net of allocations to the security lending agent and the borrower.
At November 30, 2009, the value of securities on loan was $11,210,030, for which cash collateral was received and invested in accordance with the Lending Agreement. At November 30, 2009, the value of invested collateral was $11,428,844. Such investments are presented on the statement of net assets under the caption “Securities Lending Collateral.”
9. Credit and Market Risk
The Fund may invest up to 15% of its net assets in illiquid securities, which may include securities with contractual restrictions on resale, securities exempt from registration under Rule 144A of the Securities Act of 1933, as amended, and other securities which may not be readily marketable. The relative illiquidity of these securities may impair the Fund from disposing of them in a timely manner and at a fair price when it is necessary or desirable to do so. While maintaining oversight, the Fund’s Board has delegated to DMC the day-to-day functions of determining whether individual securities are liquid for purposes of the Fund’s limitation on investments in illiquid assets. Securities eligible for resale pursuant to Rule 144A, which are determined to be liquid, are not subject to the Fund’s 15% limit on investments in illiquid securities. As of November 30, 2009, there were no Rule 144A securities. Illiquid securities have been identified on the statement of net assets.
10. Contractual Obligations
The Fund enters into contracts in the normal course of business that contain a variety of indemnifications. The Fund’s maximum exposure under these arrangements is unknown. However, the Fund has not had prior claims or losses pursuant to these contracts. Management has reviewed the Fund’s existing contracts and expects the risk of loss to be remote.
11. Sale of Delaware Investments to Macquarie Group
On August 18, 2009, Lincoln National Corporation (parent company of Delaware Investments) and Macquarie Group (Macquarie) entered into an agreement pursuant to which Delaware Investments, including DMC, DDLP and DSC, would be acquired by Macquarie, an Australia-based global provider of banking, financial, advisory, investment and funds management services (Transaction). The Transaction was completed on January 4, 2010. DMC, DDLP and DSC are now wholly owned subsidiaries of Macquarie.
37
Notes to financial statements
Delaware Large Cap Value Fund
11. Sale of Delaware Investments to Macquarie Group (continued)
The Transaction resulted in a change of control of DMC which, in turn, caused the termination of the investment advisory agreement between DMC and the Fund. On January 4, 2010, the new investment advisory agreement between DMC and the Fund that was approved by the shareholders became effective.
12. Tax Information (Unaudited)
The information set forth below is for the Fund’s fiscal year as required by federal laws. Shareholders, however, must report distributions on a calendar year basis for income tax purposes, which may include distributions for portions of two fiscal years of a fund. Accordingly, the information needed by shareholders for income tax purposes will be sent to them in January of each year. Please consult your tax advisor for proper treatment of the information.
For the fiscal year ended November 30, 2009, the Fund designates distributions paid during the year as follows:
| (A) | | Long-Term Capital Gains Distributions (Tax Basis) | — | % |
| (B) | | Ordinary Income Distributions* (Tax Basis) | 100.00 | % |
| | | Total Distributions (Tax Basis) | 100.00 | % |
| (C) | | Qualifying Dividends1 | 97.44 | % |
(A) and (B) are based on a percentage of the Fund’s total distributions.
(C) is based on a percentage of the Fund’s ordinary income distributions.
1Qualifying dividends represent dividends which qualify for the corporate dividends received deduction.
*For the fiscal year ended November 30, 2009, certain dividends paid by the Fund may be subject to a maximum tax rate of 15%, as provided for by the Jobs and Growth Tax Relief Reconciliation Act of 2003. The Fund intends to designate up to a maximum amount of $19,141,036 to be taxed at maximum rate of 15%. Complete information will be computed and reported in conjunction with your 2009 Form 1099-DIV.
For the fiscal year ended November 30, 2009, certain interest income and short-term gains paid by the Fund, determined to be Qualified Interest Income, may be subject to relief from U.S. withholding for foreign shareholders, as provided by the American Jobs Creation Act of 2004. For the fiscal year ended November 30, 2009, the Fund has designated maximum distributions of Qualified Interest Income of $25,907.
38
Report of independent
registered public accounting firm
To the Shareholders and Board of Trustees
Delaware Group Equity Funds II — Delaware Large Cap Value Fund
We have audited the accompanying statement of net assets of Delaware Large Cap Value Fund (one of the series constituting Delaware Group Equity Funds II) (the “Fund”) as of November 30, 2009, and the related statement of operations for the year then ended, the statements of changes in net assets for each of the two years in the period then ended, and the financial highlights for each of the five years in the period then ended. These financial statements and financial highlights are the responsibility of the Fund’s management. Our responsibility is to express an opinion on these financial statements and financial highlights based on our audits.
We conducted our audits in accordance with the standards of the Public Company Accounting Oversight Board (United States). Those standards require that we plan and perform the audit to obtain reasonable assurance about whether the financial statements and financial highlights are free of material misstatement. We were not engaged to perform an audit of the Fund’s internal control over financial reporting. Our audits included consideration of internal control over financial reporting as a basis for designing audit procedures that are appropriate in the circumstances, but not for the purpose of expressing an opinion on the effectiveness of the Fund’s internal control over financial reporting. Accordingly, we express no such opinion. An audit also includes examining, on a test basis, evidence supporting the amounts and disclosures in the financial statements and financial highlights, assessing the accounting principles used and significant estimates made by management, and evaluating the overall financial statement presentation. Our procedures included confirmation of securities owned as of November 30, 2009 by correspondence with the custodian and brokers. We believe that our audits provide a reasonable basis for our opinion.
In our opinion, the financial statements and financial highlights referred to above present fairly, in all material respects, the financial position of the Delaware Large Cap Value Fund of Delaware Group Equity Funds II at November 30, 2009, the results of its operations for the year then ended, the changes in its net assets for each of the two years in the period then ended, and its financial highlights for each of the five years in the period then ended, in conformity with U.S. generally accepted accounting principles.
Philadelphia, Pennsylvania
January 21, 2010
39
Other Fund information
(Unaudited)
Delaware Large Cap Value Fund
Board Consideration of New Investment Advisory Agreement
At a meeting held on September 3, 2009 (the “Meeting”), the Board of Trustees of the Delaware Investments Family of Funds (the “Board”), including a majority of independent Trustees, approved a new investment advisory agreement between each registrant on behalf of each series (each, a “Fund” and together, the “Funds”) and Delaware Management Company (“DMC”) in connection with the sale of Delaware Investments’ advisory business to Macquarie Bank Limited (the “Macquarie Group”) (the “Transaction”). In making its decision, the Board considered information furnished specifically in connection with the approval of the new investment advisory agreements with DMC (the “New Investment Advisory Agreements”) which included extensive materials about the Transaction and matters related to the proposed approvals. To assist the Board in considering the New Investment Advisory Agreements, Macquarie Group provided materials and information about Macquarie Group, including detailed written responses to the questions posed by the independent Trustees. DMC also provided materials and information about the Transaction, including detailed written responses to the questions posed by the independent Trustees.
At the Meeting, the Trustees discussed the Transaction with DMC management and with key Macquarie Group representatives. The Meeting included discussions of the strategic rationale for the Transaction and Macquarie Group’s general plans and intentions regarding the Funds and DMC. The Board members also inquired about the plans for, and anticipated roles and responsibilities of, key employees and officers of Delaware Management Holdings Inc. and DMC in connection with the Transaction.
In connection with the Trustees’ review of the New Investment Advisory Agreements for the Funds, DMC and/or Macquarie Group emphasized that:
- They expected that there would be no adverse changes as a result of the Transaction, in the nature, quality, or extent of services currently provided to the Funds and their shareholders, including investment management, distribution, or other shareholder services.
- No material changes in personnel or operations were contemplated in the operation of DMC under Macquarie Group as a result of the Transaction and no material changes were currently contemplated in connection with third party service providers to the Funds.
- Macquarie Group had no intention to cause DMC to alter the voluntary expense waivers and reimbursements currently in effect for the Funds.
- Under the agreement between Macquarie Group and Lincoln National Corporation (“LNC”) (the “Transaction Agreement”), Macquarie Group has agreed to conduct, and to cause its affiliates to conduct, their respective businesses in compliance with the conditions of Section 15(f) of the Investment Company Act of 1940 (the “1940 Act”) with respect to the Funds, to the extent within its control, including maintaining Board composition of at least 75% of the Board members qualifying as independent Trustees and not imposing any “unfair burden” on the Funds for at least two years from the closing of the Transaction (the “Closing”).
40
In addition to the information provided by DMC and Macquarie Group as described above, the Trustees also considered all other factors they believed to be relevant to evaluating the New Investment Advisory Agreements, including the specific matters discussed below. In their deliberations, the Trustees did not identify any particular information that was controlling, and different Trustees may have attributed different weights to the various factors. However, for each Fund, the Trustees determined that the overall arrangements between the Fund and DMC, as provided in the respective New Investment Advisory Agreement, including the proposed advisory fee and the related administration arrangements between the Fund and DMC, were fair and reasonable in light of the services to be performed, expenses incurred, and such other matters as the Trustees considered relevant. Factors evaluated included:
- The potential for expanding distribution of Fund shares through access to Macquarie Group’s existing distribution channels;
- Delaware Investments’ acquisition of an exclusive wholesaling sales force from a subsidiary of LNC;
- The reputation, financial strength, and resources of Macquarie Group as well as its historic and ongoing commitment to the asset management business in Australia as well as other parts of the world;
- The terms and conditions of the New Investment Advisory Agreements, including that each Fund’s total contractual fee rate under the New Investment Advisory Agreement will remain the same;
- The Board’s full annual review (or initial approval) of the current investment advisory agreements at their in-person meeting in May 2009 as required by the 1940 Act and its determination that (i) DMC had the capabilities, resources, and personnel necessary to provide the satisfactory advisory and administrative services currently provided to each Fund and (ii) the advisory and/or management fees paid by each Fund, taking into account any applicable fee waivers and breakpoints, represented reasonable compensation to DMC in light of the services provided, the costs to DMC of providing those services, economies of scale, and the fees and other expenses paid by similar funds and such other matters that the Board considered relevant in the exercise of its reasonable judgment;
- The portfolio management teams for the Funds are not currently expected to change as a result of the Transaction;
- LNC and Macquarie Group were expected to execute a reimbursement agreement pursuant to which LNC and Macquarie Group would agree to pay (or reimburse) all reasonable out-of-pocket costs and expenses of the Funds in connection with the Board’s consideration of the Transaction, the New Investment Advisory Agreements and related agreements, and all costs related to the proxy solicitation (the “Expense Agreement”);
41
Other Fund information
(Unaudited)
Delaware Large Cap Value Fund
Board Consideration of New Investment Advisory Agreement (continued)
- The likelihood that Macquarie Group would invest additional amounts in Delaware Investments, including DMC, which could result in increased assets under management, which in turn would allow some Funds the potential opportunity to achieve economies of scale and lower fees payable by Fund shareholders; and
- The compliance and regulatory history of Macquarie Group and its affiliates.
In making their decision relating to the approval of each Fund’s New Investment Advisory Agreement, the independent Trustees gave attention to all information furnished. The following discussion, however, identifies the primary factors taken into account by the Trustees and the conclusions reached in approving the New Investment Advisory Agreements.
Nature, Extent, and Quality of Service. The Trustees considered the services historically provided by DMC to the Funds and their shareholders. In reviewing the nature, extent, and quality of services, the Board considered that the New Investment Advisory Agreements would be substantially similar to the current investment advisory agreements between the Funds and DMC (the “Current Investment Advisory Agreements”), and therefore, considered the many reports furnished to them throughout 2008 and 2009 at regular Board meetings covering matters such as the relative performance of the Funds; compliance of portfolio managers with the investment policies, strategies, and restrictions for the Funds; the compliance of management personnel with the code of ethics adopted throughout the Delaware Investments Family of Funds complex; and the adherence to fair value pricing procedures as established by the Board. The Trustees were pleased with the current staffing of DMC and the emphasis placed on research and risk management in the investment process. Favorable consideration was given to DMC’s efforts to maintain expenditures and, in some instances, increase financial and human resources committed to Fund matters.
The Board also considered the transfer agent and shareholder services that would continue to be provided to Fund shareholders by DMC’s affiliate, Delaware Service Company, Inc. (“DSC”). The Trustees noted, in particular, DSC’s commitment to maintain a high level of service as well as DMC’s expenditures to improve the delivery of shareholder services. The Board was assured that shareholders would continue to receive the benefits provided to Fund shareholders by being part of the Delaware Investments Family of Funds, including each shareholder’s ability to exchange an investment in one Delaware Investments Fund for the same class of shares in another Delaware Investments Fund without a sales charge, to reinvest Fund dividends into additional shares of any of the Funds, and the privilege to combine holdings in other Funds to obtain a reduced sales charge.
Based on the information provided by DMC and Macquarie Group, including that Macquarie Group and DMC currently expected no material changes as a result of the Transaction in (i) personnel or operations of DMC or (ii) third party service providers to the Funds, the Board concluded that the satisfactory nature, extent, and quality of services currently provided to the Funds and their shareholders were very likely to continue under the New Investment Advisory
42
Agreements. Moreover, the Board concluded that the Funds would probably benefit from the expanded distribution resources that would become available to Delaware Investments following the Transaction. The Board also concluded that it was very unlikely that any “unfair burden” would be imposed on any of the Funds for the first two years following the Closing as a result of the Transaction. Consequently, the Board concluded that it did not expect the Transaction to result in any adverse changes in the nature, quality, or extent of services (including investment management, distribution or other shareholder services) currently provided to the Funds and their shareholders.
Investment Performance. The Board considered the overall investment performance of DMC and the Funds. The Trustees placed significant emphasis on the investment performance of the Funds in view of its importance to shareholders. Although the Trustees gave appropriate consideration to performance reports and discussions with portfolio managers at Board meetings throughout the year, the Trustees gave particular weight to their review of investment performance in connection with the approval of the Current Investment Advisory Agreements at the Board meeting held in May 2009. At that meeting, the Trustees reviewed reports prepared by Lipper, Inc., an independent statistical compilation organization (“Lipper”), which showed each Fund’s investment performance as of December 31, 2008 in comparison to a group of funds selected by Lipper as being similar to the Fund (the “Performance Universe”). During the May 2009 agreement review process, the Trustees observed the significant improvements to relative investment performance of the Funds compared to the Funds’ performance as of December 31, 2007.
At their meeting on September 3, 2009, the Trustees, including the independent Trustees in consultation with their independent counsel, reviewed the investment performance of each Fund. The Trustees compared the performance of each Fund relative to that of its respective Performance Universe for the 1-, 3-, 5-, and 10-year periods ended June 30, 2009 and compared its relative investment performance against the corresponding relative investment performance of each Fund for such time periods ended December 31, 2008, to the extent applicable. As of June 30, 2009, 30 of the Funds had investment performance relative to that of the respective Performance Universe that was better than the corresponding relative investment performance at December 31, 2008 for all applicable time periods. At June 30, 2009, an additional 6 Funds had investment performance relative to that of their respective Performance Universe that was better than the corresponding relative investment performance at December 31, 2008 for a majority of the applicable time periods. At June 30, 2009, 15 additional Funds had investment performance relative to that of their respective Performance Universe that was better than the corresponding relative performance at December 31, 2008 and only 29 Funds had poorer relative investment performance at June 30, 2009 compared to that at December 31, 2008.
The Board therefore concluded that the investment performance of the Funds, on an aggregate basis, had continued to improve relative to their respective Performance Universe since the data reviewed at the May 2009 meeting. Based on information provided by DMC and Macquarie Group, the Board concluded that neither the Transaction nor the New Investment Advisory Agreement would likely have an adverse effect on the investment performance of any Fund because (i) DMC and Macquarie Group did not currently expect the Transaction to cause any
43
Other Fund information
(Unaudited)
Delaware Large Cap Value Fund
Board Consideration of New Investment Advisory Agreement (continued)
material change to the Funds’ portfolio management teams responsible for investment performance, which the Board found to be satisfactory and improving; and (ii) as discussed in more detail below, the Funds’ expenses were not expected to increase as a result of the Transaction.
Comparative Expenses. The Trustees also considered expense comparison data for the Funds previously provided in May 2009. At that meeting, DMC had provided the Board with information on pricing levels and fee structures for the Funds and comparative funds. The Trustees focused on the comparative analysis of the effective management fees and total expense ratios of each Fund versus the effective management fees and expense ratios of a group of funds selected by Lipper as being similar to each Fund (the “Expense Group”). In reviewing comparative costs, each Fund’s contractual management fee and the actual management fee incurred by the Fund were compared with the contractual management fees (assuming all funds in the Expense Group were similar in size to the Fund) and actual management fees (as reported by each fund) of other funds within the Expense Group, taking into account any applicable breakpoints and fee limitations. Each Fund’s total expenses were also compared with those of its Expense Group. The Trustees also considered fees paid to Delaware Investments for nonmanagement services. At the September 3, 2009 meeting, DMC advised the Board that the more recent comparative expenses for the Funds remained consistent with the previous review in May 2009 and, consequently, the Trustees concluded that expenses of the Funds were satisfactory.
The Board also considered the Expense Agreement under negotiation in evaluating Fund expenses. The Trustees expected that the Expense Agreement would provide that LNC and Macquarie Group would pay or reimburse the Trusts for all reasonable out-of-pocket costs and expenses in connection with the Transaction and the consideration of the New Investment Advisory Agreements (subject to certain limited exceptions).
Based on information provided by DMC and Macquarie Group, the Board concluded that neither the Transaction nor the New Investment Advisory Agreements likely would have an adverse effect on the Funds’ expenses because (i) each Fund’s contractual fee rates under the New Investment Advisory Agreement would remain the same; (ii) under the Expense Agreement, the Funds would be reimbursed for all reasonable out-of-pocket costs and expenses in connection with the Transaction and the related proxy solicitation (subject to certain limited exceptions); and (iii) the expense ratios of certain Funds might decline as a result of the possible increased investment in Delaware Investments by Macquarie Group, as discussed below under “Economies of Scale.”
Management Profitability. At their meeting on September 3, 2009, the Board evaluated DMC’s profitability in connection with the operation of the Funds. The Board had previously considered DMC’s profitability in connection with the operation of the Funds at its May 2009 meeting. At that meeting, the Board reviewed an analysis that addressed the overall profitability of Delaware Investments’ business in providing management and other services to each of the Funds and the Delaware Investments Family of Funds as a whole. Specific attention was given to the methodology followed in allocating costs for the purpose of determining profitability.
44
At the May 2009 meeting, representatives of DMC had stated that the level of profits of DMC, to a certain extent, reflect operational cost savings and efficiencies initiated by Delaware Investments (including DMC and its affiliates that provide services to the Funds). The Board considered Delaware Investments’ efforts to improve services provided to Fund shareholders and to meet additional regulatory and compliance requirements resulting from recent industry-wide U.S. Securities and Exchange Commission initiatives. At that meeting, the Board found that the management fees were reasonable in light of the services rendered and the level of profitability of DMC. At the September 3, 2009 meeting, DMC advised the Board that DMC did not expect the Transaction to affect materially the profitability of Delaware Investments compared to the level of profitability considered during the May 2009 review. Moreover, the Trustees reviewed pro forma balance sheets of certain key companies in Delaware Investments as of June 30, 2009 (which were provided by Macquarie Group and DMC in response to the Trustees’ requests) and evaluated the projections of Delaware Investments’ capitalization following the Transaction for purposes of evaluating the financial ability of Delaware Investments to continue to provide the nature, extent, and quality of services as it had under the Current Investment Advisory Agreement.
Based on information provided by DMC and Macquarie Group, the Board concluded that DMC and Delaware Investments would be sufficiently capitalized following the Transaction to continue the same level and quality of services to the Funds under the New Investment Advisory Agreements as was the case under the Current Investment Advisory Agreements. The Board also concluded that Macquarie Group had sufficient financial strength and resources, as well as an ongoing commitment to a global asset management business, to continue investing in Delaware Investments, including DMC, to the extent that Macquarie Group determined it was appropriate. Finally, because services and costs were expected to be substantially the same (and DMC had represented that, correspondingly, profitability would be about the same), under the New Investment Advisory Agreements as under the Current Investment Advisory Agreements, the Trustees concluded that the profitability of Delaware Investments would not result in an inequitable charge on the Funds or their shareholders. Accordingly, the Board concluded that the fees charged under the New Investment Advisory Agreements would be reasonable in light of the services to be provided and the expected profitability of DMC.
Economies of Scale. The Trustees considered whether economies of scale would be realized by Delaware Investments as each Fund’s assets increase and the extent to which any economies of scale would be reflected in the management fees charged. The Trustees took into account DMC’s practice of maintaining the competitive nature of management fees based on its analysis of fees charged by comparable funds. DMC management believed, and the Board agreed, that the Funds were priced with breakpoints and relatively low management fees to reflect potential economies of scale to Fund shareholders.
The Board also acknowledged Macquarie Group’s statement that the Transaction would not by itself immediately provide additional economies of scale given Macquarie Group’s limited presence in the U.S. mutual fund market. Nonetheless, the Trustees concluded that additional economies of scale could potentially be achieved in the future if DMC were owned by Macquarie Group as a result of
45
Other Fund information
(Unaudited)
Delaware Large Cap Value Fund
Board Consideration of New Investment Advisory Agreement (continued)
Macquarie Group’s willingness to invest further in Delaware Investments if appropriate opportunities arise. The Board further concluded that potential economies of scale could be achieved as a result of Delaware Investments’ expanded distribution capabilities arising from the Transaction, as well as opportunities that might arise from Macquarie Group’s global asset management business.
Fall-Out Benefits. The Board acknowledged that DMC would continue to benefit from soft dollar arrangements using portfolio brokerage of each Fund that invests in equity securities and that DMC’s profitability would likely be somewhat lower without the benefit of practices with respect to allocating Fund portfolio brokerage for brokerage and research services. The Board also considered that Macquarie Group and Delaware Investments may derive reputational, strategic, and other benefits from their association with the Delaware Investments Family of Funds, including service relationships with DMC, DSC, and Delaware Distributors, L.P., and evaluated the extent to which Delaware Investments might derive ancillary benefits from Fund operations, including the potential for procuring additional business as a result of the prestige and visibility associated with its role as service provider to the Delaware Investments Family of Funds and the benefits from allocation of Fund brokerage to improve trading efficiencies. However, the Board concluded that (i) any such benefits under the New Investment Advisory Agreements would not be dissimilar from those existing under the Current Investment Advisory Agreements; (ii) such benefits did not impose a cost or burden on the Funds or their shareholders; and (iii) such benefits would probably have an indirectly beneficial effect on the Funds and their shareholders because of the added importance that DMC and Macquarie Group might attach to the Funds as a result of the fall-out benefits that the Funds conveyed.
Board Review of Macquarie Group. The Trustees reviewed detailed information supplied by Macquarie Group about its operations as well as other information regarding Macquarie Group provided by independent legal counsel to the independent Trustees. Based on this review, the Trustees concluded that Delaware Investments would continue to have the financial ability to maintain the high quality of services required by the Funds. The Trustees noted that there would be a limited transition period during which some services previously provided by LNC to Delaware Investments would continue to be provided by LNC after the Closing, and concluded that this arrangement would help minimize disruption in Delaware Investments’ provision of services to the Funds following the Transaction.
The Board considered Macquarie Group’s support for Delaware Investments’ plans for Fund distribution by transferring wholesalers from Lincoln Financial Distributors, Inc., LNC’s retail distributor, to Delaware Investments, and Macquarie Group’s current intention to leave the Funds’ other service providers in place. The Board also considered Macquarie Group’s current strategic plans to increase its asset management activities, one of its core businesses, particularly in North America, and its statement that its acquisition of DMC is an important component of this strategic
46
growth and the establishment of a significant presence in the United States. Based in part on the information provided by DMC and Macquarie Group, the Board concluded that Macquarie Group’s acquisition of Delaware Investments could potentially enhance the nature, quality, and extent of services provided to the Funds and their shareholders.
Conclusion. The Board concluded that the advisory fee rate under each New Investment Advisory Agreement was reasonable in relation to the services provided and that execution of the New Investment Advisory Agreement would be in the best interests of the shareholders. For each Fund, the Trustees noted that they had concluded in their most recent advisory agreement continuance considerations in May 2009 that the management fees and total expense ratios were at acceptable levels in light of the quality of services provided to the Funds and in comparison to those of the Funds’ respective peer groups; that the advisory fee schedule would not be increased and would stay the same for all of the Funds; that the total expense ratio had not changed materially since that determination; and that DMC had represented that the overall expenses for each Fund were not expected to be adversely affected by the Transaction. The Trustees also noted, with respect to the Funds that currently had the benefit of voluntary fee limitations, that Macquarie Group had no present intention to cause DMC to alter any voluntary expense limitations or reimbursements currently in effect. On that basis, the Trustees concluded that the total expense ratios and proposed advisory fees for the Funds anticipated to result from the Transaction were acceptable. In approving each New Investment Advisory Agreement, the Board stated that it anticipated reviewing the continuance of the New Investment Advisory Agreement in advance of the expiration of the initial two-year period.
47
Board of trustees/directors and officers addendum
Delaware Investments® Family of Funds
A mutual fund is governed by a Board of Trustees/Directors (“Trustees”), which has oversight responsibility for the management of a fund’s business affairs. Trustees establish procedures and oversee and review the performance of the investment manager, the distributor, and others who perform services for the fund. The independent fund trustees, in particular, are advocates
| Name, Address, | | Position(s) | | Length of |
| and Birth Date | | Held with Fund(s) | | Time Served |
| Interested Trustees | | | | |
| |
| Patrick P. Coyne1 | | Chairman, President, | | Chairman and Trustee |
| 2005 Market Street | | Chief Executive Officer, | | since August 16, 2006 |
| Philadelphia, PA 19103 | | and Trustee | | |
| April 1963 | | | | President and |
| | | | Chief Executive Officer |
| | | | since August 1, 2006 |
| | | | | |
| Independent Trustees | | | | |
| |
| Thomas L. Bennett | | Trustee | | Since March 2005 |
| 2005 Market Street | | | | |
| Philadelphia, PA 19103 | | | | |
| October 1947 | | | | |
| |
| John A. Fry | | Trustee | | Since January 2001 |
| 2005 Market Street | | | | |
| Philadelphia, PA 19103 | | | | |
| May 1960 | | | | |
| |
| Anthony D. Knerr | | Trustee | | Since April 1990 |
| 2005 Market Street | | | | |
| Philadelphia, PA 19103 | | | | |
| December 1938 | | | | |
| | | | |
| |
| Lucinda S. Landreth | | Trustee | | Since March 2005 |
| 2005 Market Street | | | | |
| Philadelphia, PA 19103 | | | | |
| June 1947 | | | | |
| | | | | |
1 Patrick P. Coyne is considered to be an “Interested Trustee” because he is an executive officer of the Fund’s(s’) investment advisor.
48
for shareholder interests. Each trustee has served in that capacity since he or she was elected to or appointed to the Board of Trustees, and will continue to serve until his or her retirement or the election of a new trustee in his or her place. The following is a list of the Trustees and Officers with certain background and related information.
| | Number of Portfolios in | | |
| Principal Occupation(s) | | Fund Complex Overseen | | Other Directorships |
| During Past 5 Years | | by Trustee or Officer | | Held by Trustee or Officer |
| |
| |
| Patrick P. Coyne has served in | | 80 | | Director |
| various executive capacities | | | | Kaydon Corp. |
| at different times at | | | | |
| Delaware Investments.2 | | | | |
| | | | | |
| |
| |
| |
| |
| Private Investor | | 80 | | Director |
| (March 2004–Present) | | | | Bryn Mawr Bank Corp. (BMTC) |
| | | | (April 2007–Present) |
| Investment Manager | | | | |
| Morgan Stanley & Co. | | | | |
| (January 1984–March 2004) | | | | |
| |
| President | | 80 | | Director |
| Franklin & Marshall College | | | | Community Health Systems |
| (June 2002–Present) | | | | |
| | | | | |
| Executive Vice President | | | | |
| University of Pennsylvania | | | | |
| (April 1995–June 2002) | | | | |
| |
| Founder and | | 80 | | None |
| Managing Director | | | | |
| Anthony Knerr & Associates | | | | |
| (Strategic Consulting) | | | | |
| (1990–Present) | | | | |
| |
| Chief Investment Officer | | 80 | | None |
| Assurant, Inc. (Insurance) | | | | |
| (2002–2004) | | | | |
| | | | | |
2 Delaware Investments is the marketing name for Delaware Management Holdings, Inc. and its subsidiaries, including the Fund’s(s’) investment advisor, principal underwriter, and its transfer agent.
49
Board of trustees/directors and officers addendum
Delaware Investments® Family of Funds
| Name, Address, | | Position(s) | | Length of |
| and Birth Date | | Held with Fund(s) | | Time Served |
| Independent Trustees (continued) | | | | |
| |
| Ann R. Leven | | Trustee | | Since October 1989 |
| 2005 Market Street | | | | |
| Philadelphia, PA 19103 | | | | |
| November 1940 | | | | |
| |
| Thomas F. Madison | | Trustee | | Since May 19973 |
| 2005 Market Street | | | | |
| Philadelphia, PA 19103 | | | | |
| February 1936 | | | | |
| | | | | |
| | | | | |
| | | | | |
| | | | | |
| | | | | |
| | | | | |
| | | | | |
| | | | | |
| | | | | |
| | | | | |
| | | | | |
| | | | | |
| | | | | |
| | | | | |
| | | | | |
| | | | | |
| | | | | |
| | | | | |
| | | | | |
| | | | | |
| | | | | |
| | | | | |
| | | | | |
3 In 1997, several funds managed by Voyageur Fund Managers, Inc. (the “Voyageur Funds”) were incorporated into the Delaware Investments Family of Funds. Mr. Madison served as a director of the Voyageur Funds from 1993 until 1997.
50
| | Number of Portfolios in | | |
| Principal Occupation(s) | | Fund Complex Overseen | | Other Directorships |
| During Past 5 Years | | by Trustee or Officer | | Held by Trustee or Officer |
| |
| |
| Consultant | | 80 | | None |
| ARL Associates | | | | |
| (Financial Planning) | | | | |
| (1983–Present) | | | | |
| |
| President and | | 80 | | Director and Chair of |
| Chief Executive Officer | | | | Compensation Committee, |
| MLM Partners, Inc. | | | | Governance Committee |
| (Small Business Investing | | | | Member |
| and Consulting) | | | | CenterPoint Energy |
| (January 1993–Present) | | | | |
| | | | Lead Director and Chair of |
| | | | Audit and Governance |
| | | | Committees, Member of |
| | | | Compensation Committee |
| | | | Digital River, Inc. |
| |
| | | | Director and Chair of |
| | | | Governance Committee, |
| | | | Audit Committee |
| | | | Member |
| | | | Rimage Corporation |
| |
| | | | Director and Chair of |
| | | | Compensation Committee |
| | | | Spanlink Communications |
| |
| | | | Lead Director and Member of |
| | | | Compensation and |
| | | | Governance Committees |
| | | | Valmont Industries, Inc. |
| | | | |
51
Board of trustees/directors and officers addendum
Delaware Investments® Family of Funds
| Name, Address, | | Position(s) | | Length of |
| and Birth Date | | Held with Fund(s) | | Time Served |
| Independent Trustees (continued) |
| |
| Janet L. Yeomans | | Trustee | | Since April 1999 |
| 2005 Market Street | | | | |
| Philadelphia, PA 19103 | | | | |
| July 1948 | | | | |
| |
| |
| |
| |
| J. Richard Zecher | | Trustee | | Since March 2005 |
| 2005 Market Street | | | | |
| Philadelphia, PA 19103 | | | | |
| July 1940 | | | | |
| |
| |
| |
| |
| |
| |
| Officers |
| |
| David F. Connor | | Vice President, | | Vice President since |
| 2005 Market Street | | Deputy General | | September 2000 |
| Philadelphia, PA 19103 | | Counsel, and Secretary | | and Secretary since |
| December 1963 | | | | October 2005 |
| |
| |
| Daniel V. Geatens | | Vice President | | Treasurer |
| 2005 Market Street | | and Treasurer | | since October 25, 2007 |
| Philadelphia, PA 19103 | | | | |
| October 1972 | | | | |
| |
| David P. O’Connor | | Senior Vice President, | | Senior Vice President, |
| 2005 Market Street | | General Counsel, | | General Counsel, and |
| Philadelphia, PA 19103 | | and Chief Legal Officer | | Chief Legal Officer |
| February 1966 | | | | since October 2005 |
| |
| Richard Salus | | Senior Vice President | | Chief Financial Officer |
| 2005 Market Street | | and Chief Financial Officer | | since November 2006 |
| Philadelphia, PA 19103 | | | | |
| October 1963 | | | | |
| | | | | |
4 David F. Connor, Daniel V. Geatens, David P. O’Connor, and Richard Salus serve in similar capacities for the six portfolios of the Optimum Fund Trust, which have the same investment advisor, principal underwriter, and transfer agent as the registrant.
52
| | Number of Portfolios in | | |
| Principal Occupation(s) | | Fund Complex Overseen | | Other Directorships |
| During Past 5 Years | | by Trustee or Officer | | Held by Trustee or Officer |
| |
| |
| Vice President and Treasurer | | 80 | | None |
| (January 2006–Present) | | | | |
| Vice President — Mergers & Acquisitions | | | | |
| (January 2003–January 2006), and | | | | |
| Vice President | | | | |
| (July 1995–January 2003) | | | | |
| 3M Corporation | | | | |
| |
| Founder | | 80 | | Director and Audit |
| Investor Analytics | | | | Committee Member |
| (Risk Management) | | | | Investor Analytics |
| (May 1999–Present) | | | | |
| |
| Founder | | | | |
| Sutton Asset Management | | | | |
| (Hedge Fund) | | | | |
| (September 1996–Present) | | | | |
| | | | |
| |
| |
| David F. Connor has served as | | 80 | | None4 |
| Vice President and Deputy | | | | |
| General Counsel of | | | | |
| Delaware Investments | | | | |
| since 2000. | | | | |
| |
| Daniel V. Geatens has served | | 80 | | None4 |
| in various capacities at | | | | |
| different times at | | | | |
| Delaware Investments. | | | | |
| |
| David P. O’Connor has served in | | 80 | | None4 |
| various executive and legal | | | | |
| capacities at different times | | | | |
| at Delaware Investments. | | | | |
| |
| Richard Salus has served in | | 80 | | None4 |
| various executive capacities | | | | |
| at different times at | | | | |
| Delaware Investments. | | | | |
| | | | |
The Statement of Additional Information for the Fund(s) includes additional information about the Trustees and Officers and is available, without charge, upon request by calling 800 523-1918.
53
About the organization
| Board of trustees | | | |
| | | | |
Patrick P. Coyne
Chairman, President, and
Chief Executive Officer
Delaware Investments®
Family of Funds
Philadelphia, PA Thomas L. Bennett
Private Investor
Rosemont, PA John A. Fry
President
Franklin & Marshall
College
Lancaster, PA | Anthony D. Knerr
Founder and Managing
Director
Anthony Knerr &
Associates
New York, NY Lucinda S. Landreth
Former Chief Investment
Officer
Assurant, Inc.
Philadelphia, PA | Ann R. Leven
Consultant
ARL Associates
New York, NY Thomas F. Madison
President and
Chief Executive Officer
MLM Partners, Inc.
Minneapolis, MN | Janet L. Yeomans
Vice President and
Treasurer
3M Corporation
St. Paul, MN J. Richard Zecher
Founder
Investor Analytics
Scottsdale, AZ |
| | | | |
| Affiliated officers | | | |
| | | | |
David F. Connor
Vice President, Deputy
General Counsel, and
Secretary
Delaware Investments
Family of Funds
Philadelphia, PA | Daniel V. Geatens
Vice President and
Treasurer
Delaware Investments
Family of Funds
Philadelphia, PA | David P. O’Connor
Senior Vice President,
General Counsel,
and Chief Legal Officer
Delaware Investments
Family of Funds
Philadelphia, PA | Richard Salus
Senior Vice President and
Chief Financial Officer
Delaware Investments
Family of Funds
Philadelphia, PA |
This annual report is for the information of Delaware Large Cap Value Fund shareholders, but it may be used with prospective investors when preceded or accompanied by a current prospectus for Delaware Large Cap Value Fund and the Delaware Investments Fund profile for the most recently completed calendar quarter. These documents are available at www.delawareinvestments.com. The prospectus sets forth details about charges, expenses, investment objectives, and operating policies of the investment company. You should read the prospectus carefully before you invest. The figures in this report represent past results that are not a guarantee of future results. The return and principal value of an investment in the investment company will fluctuate so that shares, when redeemed, may be worth more or less than their original cost. |
Delaware Investments is the marketing name of Delaware Management Holdings, Inc. and its subsidiaries. The Fund files its complete schedule of portfolio holdings with the Securities and Exchange Commission for the first and third quarters of each fiscal year on Form N-Q. The Fund’s Forms N-Q, as well as a description of the policies and procedures that the Fund uses to determine how to vote proxies (if any) relating to portfolio securities are available without charge (i) upon request, by calling 800 523-1918; and (ii) on the Commission’s Web site at www.sec.gov. In addition, a description of the policies and procedures that the Fund uses to determine how to vote proxies (if any) relating to portfolio securities and the Fund’s Schedule of Investments are available without charge on the Fund’s Web site at www.delawareinvestments.com. The Fund’s Forms N-Q may be reviewed and copied at the Commission’s Public Reference Room in Washington, D.C.; information on the operation of the Public Reference Room may be obtained by calling 800 SEC-0330. Information (if any) regarding how the Fund voted proxies relating to portfolio securities during the most recently disclosed 12-month period ended June 30 is available without charge (i) through the Fund’s Web site at www.delawareinvestments.com; and (ii) on the Commission’s Web site at www.sec.gov. |
54
Annual report Delaware Value® Fund November 30, 2009 Value equity mutual fund |
This annual report is for the information of Delaware Value Fund shareholders, but it may be used with prospective investors when preceded or accompanied by a current prospectus for Delaware Value Fund. The figures in the annual report for Delaware Value Fund represent past results, which are not a guarantee of future results. The return and principal value of an investment in the Fund will fluctuate so that shares, when redeemed, may be worth more or less than their original cost. Current performance may be higher or lower than the performance data quoted. You should consider the investment objectives, risks, charges, and expenses of the Fund carefully before investing. The Delaware Value Fund prospectus contains this and other important information about the Fund. Prospectuses for all open-end funds in the Delaware Investments® Family of Funds are available from your financial advisor, online at www.delawareinvestments.com, or by phone at 800 523-1918. Please read the prospectus carefully before you invest or send money. |
You can obtain shareholder reports and prospectuses online instead of in the mail.
Visit www.delawareinvestments.com/edelivery. |
Experience Delaware Investments
Delaware Investments is committed to the pursuit of consistently superior asset management and unparalleled client service. We believe in our investment processes, which seek to deliver consistent results, and in convenient services that help add value for our clients.
If you are interested in learning more about creating an investment plan, contact your financial advisor.
You can learn more about Delaware Investments or obtain a prospectus for Delaware Value® Fund at www.delawareinvestments.com.
| Manage your investments online |
- 24-hour access to your account information
- Obtain share prices
- Check your account balance and recent transactions
- Request statements or literature
- Make purchases and redemptions
|
On January 4, 2010, Delaware Management Holdings, Inc., and its subsidiaries (collectively known by the marketing name of Delaware Investments) were sold by a subsidiary of Lincoln National Corporation to Macquarie Group Limited, a global provider of banking, financial, advisory, investment and funds management services. Please see your Fund’s prospectus and any supplements thereto for more complete information.
Investments in Delaware Value Fund are not and will not be deposits with or liabilities of Macquarie Bank Limited ABN 46 008 583 542 and its holding companies, including subsidiaries or related companies, and are subject to investment risk, including possible delays in repayment and loss of income and capital invested. No Macquarie Group company guarantees or will guarantee the performance of the Fund, the repayment of capital from the Fund, or any particular rate of return.
| Table of contents | |
| Portfolio management review | 1 |
| Performance summary | 4 |
| Disclosure of Fund expenses | 8 |
| Sector allocation and top 10 holdings | 10 |
| Statement of net assets | 11 |
| Statement of operations | 15 |
| Statements of changes in net assets | 16 |
| Financial highlights | 18 |
| Notes to financial statements | 28 |
| Report of independent registered | |
| public accounting firm | 38 |
| Other Fund information | 39 |
| Board of trustees/directors and | |
| officers addendum | 48 |
| About the organization | 54 |
Views expressed herein are current as of Nov. 30, 2009, and are subject to change.
Funds are not FDIC insured and are not guaranteed. It is possible to lose the principal amount invested.
Mutual fund advisory services provided by Delaware Management Company, a series of Delaware Management Business Trust, which is a registered investment advisor. Delaware Investments is the marketing name of Delaware Management Holdings, Inc. and its subsidiaries. Macquarie Group refers to Macquarie Group Limited and its subsidiaries and affiliates worldwide.
© 2010 Delaware Management Holdings, Inc.
All third-party trademarks cited are the property of their respective owners.
| Portfolio management review | |
| Delaware Value® Fund | Dec. 8, 2009 |
| Performance preview (for the period ended Nov. 30, 2009) | | | | |
| Delaware Value Fund (Class A shares) | | 1-year return | | +21.21% |
| Russell 1000® Value Index (benchmark) | | 1-year return | | +19.24% |
Past performance does not guarantee future results.
For complete, annualized performance for Delaware Value Fund please see the table on page 4.
The performance of Class A shares excludes the applicable sales charge and reflects the reinvestment of all distributions.
Index performance returns do not reflect any management fees, transaction costs, or expenses. Indices are unmanaged and one cannot invest directly in an index. |
A period of volatility ends with stability
The past 12 months was a time of tremendous volatility for stock investors. Between the start of the period in December 2008 and the market’s low in early March 2009, equities remained severely depressed as the recession deepened. Beginning in the third quarter of 2008, U.S. gross domestic product — which measures the combined value of the goods and services produced by a nation — fell for the fourth consecutive quarter. The economy’s 5.4% drop in the fourth quarter of 2008 and 6.4% decline in the first quarter of 2009 constituted the worst consecutive quarterly drop in GDP in more than 50 years. (Source: Bloomberg.)
Starting in the second week of March 2009, however, conditions gradually began to improve. Credit markets began to function more normally and investor confidence gradually increased; evidence of economic growth also mounted. Investors seemed to conclude that the market climate was less dire than they had feared.
We believe this change in outlook among investors was primarily driven by the government’s actions, particularly those meant to encourage consumer spending. Two notable programs that helped the market rally continue through the summer were the cash-for-clunkers program, which took effect in August 2009, and the implementation of a housing tax credit, both of which proved popular with consumers.
- Throughout the period, we positioned the Fund somewhat defensively, emphasizing what we believed were attractively valued stocks with limited economic sensitivity.
- Most of the Fund’s relative outperformance came during the period’s first four months, and then again in October 2009, when the Fund held up well during declining markets.
- This trend is consistent with our management approach; through our value-oriented, defensive style, we seek to do well in relative terms in down markets by minimizing losses.
1
Portfolio management review
Delaware Value® Fund
Within the Fund
For its fiscal year ended Nov. 30, 2009, Delaware Value Fund (Class A shares) returned +21.21% at net asset value, and +14.29% at maximum offer price (both returns assume reinvestment of all distributions). In comparison, the Fund’s benchmark, the Russell 1000 Value Index, gained +19.24% during the same period.
After a difficult 2008, the Fund generated strong results compared to its benchmark during this fiscal period. Most of our relative outperformance came during the period’s first four months, and then again in October 2009, when the Fund held up relatively well during declining markets. This trend is consistent with our management approach; through our value-oriented, defensive style, we seek to do well in relative terms in down markets by minimizing losses.
The most significant positive for the Fund was an overweight position in information technology stocks relative to the benchmark. Despite the recent slowdown in technology spending, we continue to like this sector. Debt levels generally tend to be lower than in most other sectors, and many of the companies are global in nature and offer exposure to emerging markets. Additionally, we think spending on productivity-enhancing technologies could be a strong driver of performance over the long term. One of the top-performing stocks within this group was Motorola, whose shares rose along with investors’ hopes that the mobile telephone maker might be in the early stages of a turnaround.
Other contributors to overall relative performance came from the energy and healthcare sectors. In energy, we maintained an underweight allocation versus the benchmark, which proved beneficial given the underperformance of the sector more broadly. However, Marathon Oil, the fourth-largest integrated oil company in the United States, was our top performer, making an unusual rise of more than 28% during the period. The Fund also benefited from its overweight position in healthcare, a traditionally defensive area that held up better than average during the market’s decline. Within healthcare, the Fund’s top contributor to relative performance was drug manufacturer Wyeth, which was acquired for, in our view, a premium price by rival Pfizer, another holding within the Fund.
Elsewhere, the Fund gained strength from clothing retailer Gap, whose shares held up relatively well in the downturn and which gained significant ground as the market bounced back. We sold our position in Gap relatively late in the period, believing that its stock price had exceeded what was warranted by the company’s underlying fundamentals.
The biggest detractor to relative performance during the fiscal year came from the Fund’s investments in the financial sector. Performance was negatively affected by our significant underweight and less credit-sensitive exposure, which caused the Fund to lag the share price gains that occurred among financials more broadly. Our stance on financials remains somewhat cautious despite the market’s embrace of this sector. In our view, asset quality and loss reserve adequacy are still questionable, lending activity remains weak, and regulatory pressures are likely to increase.
At the individual stock level, the biggest detractor was R.R. Donnelley & Sons, whose commercial printing business has suffered along with consumer spending trends. Our investment in apparel company Limited Brands, another economically sensitive business, also hampered performance.
2
We sold both stocks prior to the market recovery (in March 2009) because we believed they could continue to face significant challenges for some time.
Toward the end of the period, we added two holdings that made the Fund somewhat more economically sensitive (economically sensitive sectors have historically recovered more rapidly than other sectors during an economic recovery). First, we increased our energy weighting by purchasing National Oilwell Varco, an oil and gas equipment and services company that we felt was attractively valued and which we believe has the potential to benefit from rising global energy demand. We also added Lowe’s, one of the country’s leading home-improvement retailers. We believe that Lowe’s, currently trading at what we view as a low valuation, could be helped by a recovering housing market.
Long-term view gives way to opportunities
With the U.S. economy beginning to emerge from recession, we find ourselves giving more consideration to the potential long-term effects of the government’s unprecedented stimulus initiatives. It stands to reason that government borrowing and spending have contributed to the rise in economic activity, though how much is hard to quantify. Mounting deficits, at both the federal and state level, along with an expanding array of government outlays, lead us to believe that higher taxes could be on the way. Another concern is the potential for ongoing weakness in the dollar due to large deficits and an expanding money supply, which could presage an increase in commodity prices and, possibly, higher inflation down the road.
We continue to see economic risks ahead and believe that an overall defensive posture remains warranted. The recent surge in equity prices pushed market valuation levels above their long-run averages. Overall, the market appears to be a bit overvalued, in our view, especially given the potential for weaker-than-expected consumer spending and economic growth. In this environment, we find ourselves putting even more emphasis on bottom-up, company-level fundamentals. We continue to seek stocks selling at large discounts to our estimates of long-term intrinsic value, targeting companies whose shares have lagged during the recent bull phase. Currently, we believe there is potential opportunity in some of the more cyclical sectors and are considering ways to mitigate the effects of a potential rise in longer-term inflation on the Fund. At the sector level, the Fund ended the period with large overweights in consumer staples, healthcare, telecommunications, and utilities, and large underweights in financials and industrials, versus the S&P 500 Index (our sector benchmark).
3
| Performance summary | |
| Delaware Value® Fund | Nov. 30, 2009 |
The performance data quoted represent past performance; past performance does not guarantee future results. Investment return and principal value will fluctuate so your shares, when redeemed, may be worth more or less than their original cost. Please obtain the performance data current for the most recent month end by calling 800 523-1918 or visiting our Web site at www.delawareinvestments.com/performance. Current performance may be lower or higher than the performance data quoted.
You should consider the investment objectives, risks, charges, and expenses of the Fund carefully before investing. The Delaware Value Fund prospectus contains this and other important information about the Fund. Please request a prospectus through your financial advisor or by calling 800 523-1918 or visiting our Web site at www.delawareinvestments.com. Read the prospectus carefully before you invest or send money.
| Fund performance | | Average annual total returns through Nov. 30, 2009 |
| | 1 year | | 5 years | | 10 years | | Lifetime |
| Class A (Est. Sept. 15, 1998) | | | | | | | | | | | | | | | | | |
| Excluding sales charge | | | +21.21 | % | | | | +0.47 | % | | | | +1.79 | % | | | | +3.78 | % | |
| Including sales charge | | | +14.29 | % | | | | -0.72 | % | | | | +1.19 | % | | | | +3.23 | % | |
| Class B (Est. May 1, 2002) | | | | | | | | | | | | | | | | | |
| Excluding sales charge | | | +20.44 | % | | | | -0.26 | % | | | | n/a | | | | | +1.27 | % | |
| Including sales charge | | | +16.44 | % | | | | -0.65 | % | | | | n/a | | | | | +1.27 | % | |
| Class C (Est. May 1, 2002) | | | | | | | | | | | | | | | | | |
| Excluding sales charge | | | +20.28 | % | | | | -0.29 | % | | | | n/a | | | | | +1.23 | % | |
| Including sales charge | | | +19.28 | % | | | | -0.29 | % | | | | n/a | | | | | +1.23 | % | |
| Class R (Est. Sept. 1, 2005) | | | | | | | | | | | | | | | | | |
| Excluding sales charge | | | +20.98 | % | | | | n/a | | | | | n/a | | | | | -1.68 | % | |
| Including sales charge | | | +20.98 | % | | | | n/a | | | | | n/a | | | | | -1.68 | % | |
| Institutional Class (Est. Sept. 15, 1998) | | | | | | | | | | | | | | | | | |
| Excluding sales charge | | | +21.43 | % | | | | +0.72 | % | | | | +1.98 | % | | | | +3.95 | % | |
| Including sales charge | | | +21.43 | % | | | | +0.72 | % | | | | +1.98 | % | | | | +3.95 | % | |
Returns reflect the reinvestment of all distributions and any applicable sales charges as noted in the following paragraphs.
Performance for Class B and C shares, excluding sales charges, assumes either that contingent deferred sales charges did not apply or that the investment was not redeemed.
Expense limitations were in effect for certain classes during the periods shown in the “Fund performance” chart and in the “Performance of a $10,000 investment” chart. The current expenses for each class are listed on the “Fund expense ratios” chart. (Note that all charts and graphs referred to in the “Performance summary” section of this report are found on pages 4 through 7.) Performance would have been lower had the expense limitations not been in effect.
4
The Fund offers Class A, B, C, R, and Institutional Class shares.
Class A shares are sold with a maximum front-end sales charge of up to 5.75%, and have an annual distribution and service fee of up to 0.30% of average daily net assets. This fee has been contractually limited to 0.25% of average daily net assets from April 1, 2009, through March 31, 2010.
Class B shares may only be purchased through dividend reinvestment and certain permitted exchanges as described in the prospectus. Please see the prospectus for additional information on Class B purchase and sales charges. Class B shares have a contingent deferred sales charge that declines from 4.00% to zero depending on the period of time the shares are held.
Class B shares will automatically convert to Class A shares on a quarterly basis approximately eight years after purchase. They are also subject to an annual distribution and service fee of up to 1.00% of average daily net assets.
Lifetime performance figures for Class B shares reflect conversion to Class A shares after approximately eight years.
Class C shares are sold with a contingent deferred sales charge of 1.00% if redeemed during the first 12 months. They are also subject to an annual distribution and service fee of up to 1.00% of average daily net assets.
Class R shares were first made available Sept. 1, 2005, and are available only for certain retirement plan products. They are sold without a sales charge and have an annual distribution and service fee of up to 0.60% of average daily net assets, which has been limited contractually to 0.50% from April 1, 2009, through March 31, 2010.
Institutional Class shares were first made available Sept. 15, 1998, and are available without sales or asset-based distribution charges only to certain eligible institutional accounts.
The “Fund performance” table and the “Performance of a $10,000 investment” graph do not reflect the deduction of taxes the shareholder would pay on Fund distributions or redemptions of Fund shares.
The Fund will be affected primarily by changes in stock prices.
Instances of high double-digit return are unusual, cannot be sustained, and were primarily achieved during favorable market conditions.
5
Performance summary
Delaware Value® Fund
The Fund’s expense ratios, as described in the most recent prospectus, are disclosed in the following “Fund expense ratios” table. Delaware Investments has agreed to reimburse certain expenses and/or waive certain fees from April 1, 2009, until such time as the voluntary expense cap is discontinued. Please see the most recent prospectus for additional information on these fee waivers and/or reimbursements.
| Fund expense ratios | Class A | | Class B | | Class C | | Class R | | Institutional Class |
| Total annual operating expenses | 1.26% | | 1.96% | | 1.96% | | 1.56% | | 0.96% |
| (without fee waivers) | | | | | | | | | |
| Net expenses | 1.21% | | 1.96% | | 1.96% | | 1.46% | | 0.96% |
| (including fee waivers, if any) | | | | | | | | | |
| Type of waiver | Voluntary | | Voluntary | | Voluntary | | Voluntary | | Voluntary |
| and contractual | | | | | | and contractual | | |
Performance of a $10,000 investment
Average annual total returns from Nov. 30, 1999, through Nov. 30, 2009
| For period beginning Nov. 30, 1999, through Nov. 30, 2009 | Starting value | Ending value |
| | Russell 1000 Value Index | $10,000 | $12,603 |
| | Delaware Value Fund — Class A Shares | $9,425 | $11,257 |
6
The chart assumes $10,000 invested in the Fund on Nov. 30, 1999, and includes the effect of a 5.75% front-end sales charge and the reinvestment of all distributions. Please note additional details on these fees in the “Performance summary” section of this report, which includes pages 4 through 7.
The chart also assumes $10,000 invested in the Russell 1000 Value Index as of Nov. 30, 1999.
The Russell 1000 Value Index measures the performance of the large-cap value segment of the U.S. equity universe. It includes those Russell 1000 companies with lower price-to-book ratios and lower forecasted growth values.
The S&P 500 Index measures the performance of 500 mostly large-cap stocks weighted by market value, and is often used to represent performance of the U.S. stock market.
An index is unmanaged and does not reflect the costs of operating a mutual fund, such as the costs of buying, selling, and holding securities. You cannot invest directly in an index. Past performance is not a guarantee of future results.
Performance of other Fund classes will vary due to different charges and expenses.
The “Fund performance” chart and the “Performance of a $10,000 investment” graph do not reflect the deduction of taxes the shareholders would pay on Fund distributions or redemptions of Fund shares.
| Stock symbols and CUSIP numbers |
| | Nasdaq symbols | | CUSIPs | |
| Class A | | | DDVAX | | | 24610C881 | |
| Class B | | | DDVBX | | | 24610C873 | |
| Class C | | | DDVCX | | | 24610C865 | |
| Class R | | | DDVRX | | | 245907860 | |
| Institutional Class | | | DDVIX | | | 24610C857 | |
7
Disclosure of Fund expenses
For the period June 1, 2009 to November 30, 2009
As a shareholder of the Fund, you incur two types of costs: (1) transaction costs, including sales charges (loads) on purchase payments, reinvested dividends, or other distributions; redemption fees; and exchange fees; and (2) ongoing costs, including management fees; distribution and/or service (12b-1) fees; and other Fund expenses. This example is intended to help you understand your ongoing costs (in dollars) of investing in the Fund and to compare these costs with the ongoing costs of investing in other mutual funds.
The example is based on an investment of $1,000 invested at the beginning of the period and held for the entire period June 1, 2009 to November 30, 2009.
Actual expenses
The first section of the table shown, “Actual Fund return,” provides information about actual account values and actual expenses. You may use the information in this section of the table, together with the amount you invested, to estimate the expenses that you paid over the period. Simply divide your account value by $1,000 (for example, an $8,600 account value divided by $1,000 = 8.6), then multiply the result by the number in the first section under the heading entitled “Expenses Paid During Period” to estimate the expenses you paid on your account during this period.
Hypothetical example for comparison purposes
The second section of the table shown, “Hypothetical 5% return,” provides information about hypothetical account values and hypothetical expenses based on the Fund’s actual expense ratio and an assumed rate of return of 5% per year before expenses, which is not the Fund’s actual return. The hypothetical account values and expenses may not be used to estimate the actual ending account balance or expenses you paid for the period. You may use this information to compare the ongoing costs of investing in the Fund and other funds. To do so, compare this 5% hypothetical example with the 5% hypothetical examples that appear in the shareholder reports of the other funds.
Please note that the expenses shown in the table are meant to highlight your ongoing costs only and do not reflect any transactional costs, such as sales charges (loads), redemption fees, or exchange fees. Therefore, the second section of the table is useful in comparing ongoing costs only, and will not help you determine the relative total costs of owning different funds. In addition, if these transactional costs were included, your costs would have been higher. The Fund’s expenses shown in the table reflect fee waivers in effect. The expenses shown in the table assume reinvestment of all dividends and distributions.
8
Delaware Value® Fund
Expense analysis of an investment of $1,000
| | Beginning | | Ending | | | | Expenses |
| | Account Value | | Account Value | | Annualized | | Paid During Period |
| | 6/1/09 | | 11/30/09 | | Expense Ratio | | 6/1/09 to 11/30/09* |
| Actual Fund return | | | | | | | | | | | |
| Class A | | $1,000.00 | | | $1,171.20 | | | 1.10% | | $5.99 | |
| Class B | | 1,000.00 | | | 1,167.70 | | | 1.85% | | 10.05 | |
| Class C | | 1,000.00 | | | 1,167.70 | | | 1.85% | | 10.05 | |
| Class R | | 1,000.00 | | | 1,171.40 | | | 1.35% | | 7.35 | |
| Institutional Class | | 1,000.00 | | | 1,172.50 | | | 0.85% | | 4.63 | |
| Hypothetical 5% return (5% return before expenses) | | | | | | |
| Class A | | $1,000.00 | | | $1,019.55 | | | 1.10% | | $5.57 | |
| Class B | | 1,000.00 | | | 1,015.79 | | | 1.85% | | 9.35 | |
| Class C | | 1,000.00 | | | 1,015.79 | | | 1.85% | | 9.35 | |
| Class R | | 1,000.00 | | | 1,018.30 | | | 1.35% | | 6.83 | |
| Institutional Class | | 1,000.00 | | | 1,020.81 | | | 0.85% | | 4.31 | |
*“Expenses Paid During Period” are equal to the Fund’s annualized expense ratio, multiplied by the average account value over the period, multiplied by 183/365 (to reflect the one-half year period).
9
| Sector allocation and top 10 holdings | |
| Delaware Value® Fund | As of November 30, 2009 |
Sector designations may be different than the sector designations presented in other Fund materials. The sector designations may represent the investment manager internal sector classifications which may result in the sector designations for one fund being different than another fund’s designations.
| Sector | Percentage of net assets |
| Common Stock | 96.06 | % |
| Consumer Discretionary | 5.93 | % |
| Consumer Staples | 18.29 | % |
| Energy | 11.91 | % |
| Financials | 8.71 | % |
| Health Care | 19.56 | % |
| Industrials | 5.99 | % |
| Information Technology | 11.29 | % |
| Materials | 2.96 | % |
| Telecommunications | 5.73 | % |
| Utilities | 5.69 | % |
| Discount Note | 3.56 | % |
| Securities Lending Collateral | 1.34 | % |
| Total Value of Securities | 100.96 | % |
| Obligation to Return Securities Lending Collateral | (1.37 | %) |
| Receivables and Other Assets Net of Liabilities | 0.41 | % |
| Total Net Assets | 100.00 | % |
Holdings are for informational purposes only and are subject to change at any time. They are not a recommendation to buy, sell, or hold any security.
| Top 10 Holdings | Percentage of net assets |
| Pfizer | 4.04 | % |
| Cardinal Health | 3.34 | % |
| Kimberly-Clark | 3.20 | % |
| ConocoPhillips | 3.18 | % |
| Merck | 3.17 | % |
| Safeway | 3.16 | % |
| Bristol-Myers Squibb | 3.08 | % |
| Chevron | 3.08 | % |
| Quest Diagnostics | 3.06 | % |
| Waste Management | 3.05 | % |
10
| Statement of net assets | |
| Delaware Value® Fund | November 30, 2009 |
| | | Number of shares | | | Value |
| Common Stock – 96.06% | | | | |
| Consumer Discretionary – 5.93% | | | | |
| Lowe’s | 562,400 | | $ | 12,265,944 |
| * | Mattel | 624,300 | | | 12,148,878 |
| | | | | 24,414,822 |
| | |
| Consumer Staples – 18.29% | | | | |
| Archer-Daniels-Midland | 407,000 | | | 12,539,670 |
| CVS Caremark | 404,300 | | | 12,537,343 |
| * | Heinz (H.J.) | 290,400 | | | 12,327,480 |
| Kimberly-Clark | 199,700 | | | 13,174,209 |
| Kraft Foods Class A | 441,700 | | | 11,740,386 |
| Safeway | 579,200 | | | 13,032,000 |
| | | | | 75,351,088 |
| |
| Energy – 11.91% | | | | |
| Chevron | 162,600 | | | 12,689,304 |
| ConocoPhillips | 253,300 | | | 13,113,341 |
| * | Marathon Oil | 363,000 | | | 11,841,060 |
| National Oilwell Varco | 266,200 | | | 11,451,924 |
| | | | | 49,095,629 |
| |
| Financials – 8.71% | | | | |
| Allstate | 409,975 | | | 11,647,390 |
| Bank of New York Mellon | 449,300 | | | 11,969,352 |
| Travelers | 234,400 | | | 12,280,216 |
| | | | | 35,896,958 |
| |
| Health Care – 19.56% | | | | |
| Bristol-Myers Squibb | 501,500 | | | 12,692,965 |
| Cardinal Health | 426,500 | | | 13,746,095 |
| Johnson & Johnson | 188,300 | | | 11,832,772 |
| Merck | 360,200 | | | 13,042,842 |
| Pfizer | 916,463 | | | 16,652,132 |
| Quest Diagnostics | 217,900 | | | 12,625,126 |
| | | | | 80,591,932 |
11
Statement of net assets
Delaware Value® Fund
| | | Number of shares | | Value |
| Common Stock (continued) | | | | | | | |
| Industrials – 5.99% | | | | | | | |
| Northrop Grumman | | | 221,400 | | | $ | 12,132,720 |
| * | Waste Management | | | 382,500 | | | | 12,561,300 |
| | | | | | | | 24,694,020 |
| |
| Information Technology – 11.29% | | | | | | | |
| * | Intel | | | 613,000 | | | | 11,769,600 |
| International Business Machines | | | 94,900 | | | | 11,990,615 |
| *† | Motorola | | | 1,451,200 | | | | 11,624,112 |
| Xerox | | | 1,448,300 | | | | 11,151,910 |
| | | | | | | | 46,536,237 |
| |
| Materials – 2.96% | | | | | | | |
| duPont (E.I.) deNemours | | | 352,800 | | | | 12,199,824 |
| | | | | | | | 12,199,824 |
| |
| Telecommunications – 5.73% | | | | | | | |
| AT&T | | | 432,100 | | | | 11,640,774 |
| Verizon Communications | | | 380,400 | | | | 11,967,384 |
| | | | | | | | 23,608,158 |
| |
| Utilities – 5.69% | | | | | | | |
| * | Edison International | | | 348,600 | | | | 11,869,830 |
| * | Progress Energy | | | 295,700 | | | | 11,558,913 |
| | | | | | | | 23,428,743 |
| Total Common Stock (cost $395,640,585) | | | | | | | 395,817,411 |
| |
| | Principal amount | | | |
| ¹Discount Note – 3.56% | | | | | | | |
| Federal Home Loan Bank 0.02% 12/1/09 | | $ | 14,646,019 | | | | 14,646,019 |
| Total Discount Note (cost $14,646,019) | | | | | | | 14,646,019 |
| |
| Total Value of Securities Before Securities | | | | | | | |
| Lending Collateral – 99.62% (cost $410,286,604) | | | | | | | 410,463,430 |
12
| | | Number of shares | | Value | |
| Securities Lending Collateral** – 1.34% | | | | | |
| | Investment Companies | | | | | |
| Mellon GSL DBT II Collateral Fund | 3,468,235 | | $ | 3,468,235 | |
| BNY Mellon SL DBT II Liquidating Fund | 2,091,979 | | | 2,069,177 | |
| @†Mellon GSL Reinvestment Trust II | 93,831 | | | 3,988 | |
| Total Securities Lending Collateral (cost $5,654,045) | | | | 5,541,400 | |
| |
| Total Value of Securities – 100.96% | | | | | |
| (cost $415,940,649) | | | | 416,004,830 | © |
| Obligation to Return Securities | | | | | |
| Lending Collateral** – (1.37%) | | | | (5,654,045 | ) |
| Receivables and Other Assets | | | | | |
| Net of Liabilities – 0.41% | | | | 1,683,167 | |
| Net Assets Applicable to 45,272,659 | | | | | |
| Shares Outstanding – 100.00% | | | $ | 412,033,952 | |
| |
| Net Asset Value – Delaware Value Fund | | | | | |
| Class A ($302,849,048 / 33,270,364 Shares) | | | | $9.10 | |
| Net Asset Value – Delaware Value Fund | | | | | |
| Class B ($2,929,764 / 323,893 Shares) | | | | $9.05 | |
| Net Asset Value – Delaware Value Fund | | | | | |
| Class C ($23,924,718 / 2,643,694 Shares) | | | | $9.05 | |
| Net Asset Value – Delaware Value Fund | | | | | |
| Class R ($1,957,050 / 215,360 Shares) | | | | $9.09 | |
| Net Asset Value – Delaware Value Fund | | | | | |
| Institutional Class ($80,373,372 / 8,819,348 Shares) | | | | $9.11 | |
| |
| Components of Net Assets at November 30, 2009: | | | | | |
| Shares of beneficial interest (unlimited authorization – no par) | | $ | 524,453,273 | |
| Undistributed net investment income | | | | 7,903,058 | |
| Accumulated net realized loss on investments | | | | (120,386,560 | ) |
| Net unrealized appreciation of investments | | | | 64,181 | |
| Total net assets | | | $ | 412,033,952 | |
13
Statement of net assets
Delaware Value® Fund
| | |
| @ | Illiquid security. At November 30, 2009, the aggregate amount of illiquid securities was $3,988, which represented 0.00% of the Fund’s net assets. See Note 9 in “Notes to financial statements.” |
| * | Fully or partially on loan. |
| ** | See Note 8 in “Notes to financial statements.” |
| © | Includes $5,496,149 of securities loaned. |
| † | Non income producing security. |
| ¹ | The rate shown is the effective yield at the time of purchase. |
| Net Asset Value and Offering Price Per Share – | | |
| Delaware Value Fund | | |
| Net asset value Class A (A) | | $9.10 |
| Sales charge (5.75% of offering price) (B) | | 0.56 |
| Offering Price | | $9.66 |
| (A) | Net asset value per share, as illustrated, is the amount which would be paid upon redemption or repurchase of shares. |
| (B) | See the current prospectus for purchases of $50,000 or more. |
See accompanying notes
14
| Statement of operations | |
| Delaware Value® Fund | Year Ended November 30, 2009 |
| Investment Income: | | | | | | |
| Dividends | $ | 12,774,980 | | | | |
| Interest | | 17,456 | | | | |
| Security lending income | | 34,892 | | $ | 12,827,328 | |
| |
| Expenses: | | | | | | |
| Management fees | | 2,273,705 | | | | |
| Distribution expenses – Class A | | 790,999 | | | | |
| Distribution expenses – Class B | | 30,492 | | | | |
| Distribution expenses – Class C | | 227,473 | | | | |
| Distribution expenses – Class R | | 10,119 | | | | |
| Dividend disbursing and transfer agent fees and expenses | | 1,021,965 | | | | |
| Accounting and administration expenses | | 139,920 | | | | |
| Reports and statements to shareholders | | 80,958 | | | | |
| Registration fees | | 78,013 | | | | |
| Legal fees | | 53,372 | | | | |
| Audit and tax | | 30,467 | | | | |
| Trustees’ fees | | 23,317 | | | | |
| Insurance fees | | 10,324 | | | | |
| Custodian fees | | 8,155 | | | | |
| Consulting fees | | 5,011 | | | | |
| �� Dues and services | | 3,442 | | | | |
| Pricing fees | | 2,519 | | | | |
| Trustees’ expenses | | 1,722 | | | 4,791,973 | |
| Less fees waived | | | | | (868,502 | ) |
| Less waiver of distribution expenses – Class A | | | | | (131,833 | ) |
| Less waiver of distribution expenses – Class R | | | | | (1,686 | ) |
| Total operating expenses | | | | | 3,789,952 | |
| Net Investment Income | | | | | 9,037,376 | |
| |
| Net Realized and Unrealized Gain (Loss) on Investments: | | | | | | |
| Net realized loss on investments | | | | | (25,798,260 | ) |
| Net change in unrealized appreciation/depreciation of investments | | | | | 87,455,628 | |
| Net Realized and Unrealized Gain on Investments | | | | | 61,657,368 | |
| |
| Net Increase in Net Assets Resulting from Operations | | | | $ | 70,694,744 | |
See accompanying notes
15
Statements of changes in net assets
Delaware Value® Fund
| Year Ended |
| 11/30/09 | | 11/30/08 |
| Increase (Decrease) in Net Assets from Operations: | | | | | | | |
| Net investment income | $ | 9,037,376 | | | $ | 10,437,273 | |
| Net realized loss on investments | | (25,798,260 | ) | | | (108,430,511 | ) |
| Net change in unrealized | | | | | | | |
| appreciation/depreciation of investments | | 87,455,628 | | | | (129,276,348 | ) |
| Net increase (decrease) in net assets | | | | | | | |
| resulting from operations | | 70,694,744 | | | | (227,269,586 | ) |
| |
| Dividends and Distributions to Shareholders from: | | | | | | | |
| Net investment income: | | | | | | | |
| Class A | | (8,722,039 | ) | | | (7,558,874 | ) |
| Class B | | (74,017 | ) | | | (92,451 | ) |
| Class C | | (542,744 | ) | | | (668,097 | ) |
| Class R | | (49,682 | ) | | | (34,521 | ) |
| Institutional Class | | (1,539,972 | ) | | | (2,541,014 | ) |
| |
| Net realized gain on investments: | | | | | | | |
| Class A | | — | | | | (20,557,607 | ) |
| Class B | | — | | | | (438,638 | ) |
| Class C | | — | | | | (3,169,800 | ) |
| Class R | | — | | | | (109,994 | ) |
| Institutional Class | | — | | | | (6,027,953 | ) |
| | (10,928,454 | ) | | | (41,198,949 | ) |
| |
| Capital Share Transactions: | | | | | | | |
| Proceeds from shares sold: | | | | | | | |
| Class A | | 100,483,549 | | | | 160,096,328 | |
| Class B | | 328,113 | | | | 169,061 | |
| Class C | | 3,448,921 | | | | 5,269,185 | |
| Class R | | 466,254 | | | | 974,242 | |
| Institutional Class | | 39,358,079 | | | | 67,283,345 | |
16
| Year Ended |
| 11/30/09 | | 11/30/08 |
| Capital Share Transactions (continued): | | | | | | | |
| Net asset value of shares issued upon reinvestment | | | | | | | |
| of dividends and distributions: | | | | | | | |
| Class A | $ | 8,275,384 | | | $ | 26,439,603 | |
| Class B | | 65,978 | | | | 496,294 | |
| Class C | | 494,585 | | | | 3,589,985 | |
| Class R | | 49,682 | | | | 144,515 | |
| Institutional Class | | 1,516,149 | | | | 8,490,084 | |
| | 154,486,694 | | | | 272,952,642 | |
| Cost of shares repurchased: | | | | | | | |
| Class A | | (116,500,682 | ) | | | (143,219,399 | ) |
| Class B | | (1,233,962 | ) | | | (3,901,049 | ) |
| Class C | | (7,423,103 | ) | | | (28,546,818 | ) |
| Class R | | (508,819 | ) | | | (634,250 | ) |
| Institutional Class | | (15,533,519 | ) | | | (112,994,851 | ) |
| | (141,200,085 | ) | | | (289,296,367 | ) |
| Increase (decrease) in net assets derived from capital | | | | | | | |
| share transactions | | 13,286,609 | | | | (16,343,725 | ) |
| Net Increase (Decrease) in Net Assets | | 73,052,899 | | | | (284,812,260 | ) |
| |
| Net Assets: | | | | | | | |
| Beginning of year | | 338,981,053 | | | | 623,793,313 | |
| End of year (including undistributed net investment | | | | | | | |
| income of $7,903,058 and $9,794,136 respectively) | $ | 412,033,952 | | | $ | 338,981,053 | |
See accompanying notes
17
Financial highlights
Delaware Value® Fund Class A
Selected data for each share of the Fund outstanding throughout each period were as follows:
| |
| Net asset value, beginning of period |
| |
| Income (loss) from investment operations: |
| Net investment income1 |
| Net realized and unrealized gain (loss) on investments |
| Total from investment operations |
| |
| Less dividends and distributions from: |
| Net investment income |
| Net realized gain on investments |
| Total dividends and distributions |
| |
| Net asset value, end of period |
| |
| Total return2 |
| |
| Ratios and supplemental data: |
| Net assets, end of period (000 omitted) |
| Ratio of expense to average net assets |
| Ratio of expense to average net assets |
| prior to fees waived and expense paid indirectly |
| Ratio of net investment income to average net assets |
| Ratio of net investment income to average net assets |
| prior to fees waived and expense paid indirectly |
| Portfolio turnover |
1 The average shares outstanding method has been applied for per share information. |
2 Total investment return is based on the change in net asset value of a share during the period and assumes reinvestment of dividends and distributions at net asset value and does not reflect the impact of a sales charge. Total investment return during all of the periods shown reflects waivers by the manager and distributor. Performance would have been lower had the waivers not been in effect. |
See accompanying notes
18
| Year Ended | |
| | 11/30/09 | | | 11/30/08 | | | 11/30/07 | | | 11/30/06 | | | 11/30/05 | | |
| | $7.760 | | | $13.360 | | | $13.470 | | | $11.370 | | | $10.760 | | |
| | |
| | |
| | 0.205 | | | 0.224 | | | 0.241 | | | 0.225 | | | 0.220 | | |
| | 1.389 | | | (4.935 | ) | | 0.064 | | | 2.068 | | | 0.842 | | |
| | 1.594 | | | (4.711 | ) | | 0.305 | | | 2.293 | | | 1.062 | | |
| | |
| | |
| | (0.254 | ) | | (0.239 | ) | | (0.191 | ) | | (0.122 | ) | | (0.089 | ) | |
| | — | | | (0.650 | ) | | (0.224 | ) | | (0.071 | ) | | (0.363 | ) | |
| | (0.254 | ) | | (0.889 | ) | | (0.415 | ) | | (0.193 | ) | | (0.452 | ) | |
| | |
| | $9.100 | | | $7.760 | | | $13.360 | | | $13.470 | | | $11.370 | | |
| | |
| | 21.21% | | | (37.78% | ) | | 2.25% | | | 20.48% | | | 10.11% | | |
| | |
| | |
| | $302,849 | | | $266,386 | | | $420,120 | | | $271,378 | | | $104,140 | | |
| | 1.07% | | | 1.00% | | | 1.00% | | | 1.01% | | | 1.01% | | |
| | |
| | 1.37% | | | 1.26% | | | 1.15% | | | 1.17% | | | 1.11% | | |
| | 2.60% | | | 2.11% | | | 1.75% | | | 1.84% | | | 1.98% | | |
| | |
| | 2.30% | | | 1.85% | | | 1.60% | | | 1.68% | | | 1.88% | | |
| | 27% | | | 43% | | | 24% | | | 24% | | | 26% | | |
19
Financial highlights
Delaware Value® Fund Class B
Selected data for each share of the Fund outstanding throughout each period were as follows:
| |
| Net asset value, beginning of period |
| |
| Income (loss) from investment operations: |
| Net investment income1 |
| Net realized and unrealized gain (loss) on investments |
| Total from investment operations |
| |
| Less dividends and distributions from: |
| Net investment income |
| Net realized gain on investments |
| Total dividends and distributions |
| |
| Net asset value, end of period |
| |
| Total return2 |
| |
| Ratios and supplemental data: |
| Net assets, end of period (000 omitted) |
| Ratio of expense to average net assets |
| Ratio of expense to average net assets |
| prior to fees waived and expense paid indirectly |
| Ratio of net investment income to average net assets |
| Ratio of net investment income to average net assets |
| prior to fees waived and expense paid indirectly |
| Portfolio turnover |
1 The average shares outstanding method has been applied for per share information. |
2 Total investment return is based on the change in net asset value of a share during the period and assumes reinvestment of dividends and distributions at net asset value and does not reflect the impact of a sales charge. Total investment return during all of the periods shown reflects a waiver by the manager. Performance would have been lower had the waiver not been in effect. |
See accompanying notes
20
| Year Ended | |
| 11/30/09 | | 11/30/08 | | 11/30/07 | | 11/30/06 | | 11/30/05 |
| $7.690 | | | $13.240 | | | $13.370 | | | $11.290 | | | $10.680 | | |
| | |
| | |
| 0.146 | | | 0.142 | | | 0.138 | | | 0.134 | | | 0.137 | | |
| 1.391 | | | (4.905 | ) | | 0.055 | | | 2.058 | | | 0.843 | | |
| 1.537 | | | (4.763 | ) | | 0.193 | | | 2.192 | | | 0.980 | | |
| | |
| | |
| (0.177 | ) | | (0.137 | ) | | (0.099 | ) | | (0.041 | ) | | (0.007 | ) | |
| — | | | (0.650 | ) | | (0.224 | ) | | (0.071 | ) | | (0.363 | ) | |
| (0.177 | ) | | (0.787 | ) | | (0.323 | ) | | (0.112 | ) | | (0.370 | ) | |
| | |
| $9.050 | | | $7.690 | | | $13.240 | | | $13.370 | | | $11.290 | | |
| | |
| 20.44% | | | (38.25% | ) | | 1.41% | | | 19.59% | | | 9.35% | | |
| | |
| | |
| $2,930 | | | $3,279 | | | $9,514 | | | $9,914 | | | $6,516 | | |
| 1.82% | | | 1.75% | | | 1.75% | | | 1.76% | | | 1.76% | | |
| | |
| 2.07% | | | 1.96% | | | 1.85% | | | 1.87% | | | 1.81% | | |
| 1.85% | | | 1.36% | | | 1.00% | | | 1.09% | | | 1.23% | | |
| | |
| 1.60% | | | 1.15% | | | 0.90% | | | 0.98% | | | 1.18% | | |
| 27% | | | 43% | | | 24% | | | 24% | | | 26% | | |
21
Financial highlights
Delaware Value® Fund Class C
Selected data for each share of the Fund outstanding throughout each period were as follows:
| |
| Net asset value, beginning of period |
| |
| Income (loss) from investment operations: |
| Net investment income1 |
| Net realized and unrealized gain (loss) on investments |
| Total from investment operations |
| |
| Less dividends and distributions from: |
| Net investment income |
| Net realized gain on investments |
| Total dividends and distributions |
| |
| Net asset value, end of period |
| |
| Total return2 |
| |
| Ratios and supplemental data: |
| Net assets, end of period (000 omitted) |
| Ratio of expense to average net assets |
| Ratio of expense to average net assets |
| prior to fees waived and expense paid indirectly |
| Ratio of net investment income to average net assets |
| Ratio of net investment income to average net assets |
| prior to fees waived and expense paid indirectly |
| Portfolio turnover |
1 The average shares outstanding method has been applied for per share information. |
2 Total investment return is based on the change in net asset value of a share during the period and assumes reinvestment of dividends and distributions at net asset value and does not reflect the impact of a sales charge. Total investment return during all of the periods shown reflects a waiver by the manager. Performance would have been lower had the waiver not been in effect. |
See accompanying notes
22
| Year Ended |
| 11/30/09 | | 11/30/08 | | 11/30/07 | | 11/30/06 | | 11/30/05 |
| $7.690 | | | $13.250 | | | $13.370 | | | $11.290 | | | $10.690 | |
| | |
| | |
| 0.146 | | | 0.142 | | | 0.137 | | | 0.134 | | | 0.138 | |
| 1.391 | | | (4.915 | ) | | 0.066 | | | 2.058 | | | 0.832 | |
| 1.537 | | | (4.773 | ) | | 0.203 | | | 2.192 | | | 0.970 | |
| | |
| | |
| (0.177 | ) | | (0.137 | ) | | (0.099 | ) | | (0.041 | ) | | (0.007 | ) |
| — | | | (0.650 | ) | | (0.224 | ) | | (0.071 | ) | | (0.363 | ) |
| (0.177 | ) | | (0.787 | ) | | (0.323 | ) | | (0.112 | ) | | (0.370 | ) |
| | |
| $9.050 | | | $7.690 | | | $13.250 | | | $13.370 | | | $11.290 | |
| | |
| 20.28% | | | (38.21% | ) | | 1.49% | | | 19.59% | | | 9.25% | |
| | |
| | |
| $23,925 | | | $23,733 | | | $65,890 | | | $41,013 | | | $19,597 | |
| 1.82% | | | 1.75% | | | 1.75% | | | 1.76% | | | 1.76% | |
| | |
| 2.07% | | | 1.96% | | | 1.85% | | | 1.87% | | | 1.81% | |
| 1.85% | | | 1.36% | | | 1.00% | | | 1.09% | | | 1.23% | |
| | |
| 1.60% | | | 1.15% | | | 0.90% | | | 0.98% | | | 1.18% | |
| 27% | | | 43% | | | 24% | | | 24% | | | 26% | |
23
Financial highlights
Delaware Value® Fund Class R
Selected data for each share of the Fund outstanding throughout the period was as follows:
| |
| Net asset value, beginning of period |
| |
| Income (loss) from investment operations: |
| Net investment income2 |
| Net realized and unrealized gain (loss) on investments |
| Total from investment operations |
| |
| Less dividends and distributions from: |
| Net investment income |
| Net realized gain on investments |
| Total dividends and distributions |
| |
| Net asset value, end of period |
| |
| Total return3 |
| |
| Ratios and supplemental data: |
| Net assets, end of period (000 omitted) |
| Ratio of expense to average net assets |
| Ratio of expense to average net assets |
| prior to fees waived and expense paid indirectly |
| Ratio of net investment income to average net assets |
| Ratio of net investment income to average net assets |
| prior to fees waived and expense paid indirectly |
| Portfolio turnover |
1 As of November 30, 2005, Delaware Value Fund Class R had one share outstanding, representing the initial seed purchase. Shareholder data for this class prior to December 1, 2005 is not disclosed because management does not believe it to be meaningful. |
2 The average shares outstanding method has been applied for per share information. |
3 Total investment return is based on the change in net asset value of a share during the period and assumes reinvestment of dividends and distributions at net asset value. Total investment return during all of the periods shown reflects waivers by the manager and distributor. Performance would have been lower had the waivers not been in effect. |
See accompanying notes
24
| Year Ended |
| 11/30/09 | | 11/30/08 | | 11/30/07 | | 11/30/061 |
| $7.740 | | | $13.320 | | | $13.420 | | | $11.350 | |
| | |
| | |
| 0.185 | | | 0.197 | | | 0.207 | | | 0.218 | |
| 1.393 | | | (4.923 | ) | | 0.057 | | | 2.058 | |
| 1.578 | | | (4.726 | ) | | 0.264 | | | 2.276 | |
| | |
| | |
| (0.228 | ) | | (0.204 | ) | | (0.140 | ) | | (0.135 | ) |
| — | | | (0.650 | ) | | (0.224 | ) | | (0.071 | ) |
| (0.228 | ) | | (0.854 | ) | | (0.364 | ) | | (0.206 | ) |
| | |
| $9.090 | | | $7.740 | | | $13.320 | | | $13.420 | |
| | |
| 20.98% | | | (37.90% | ) | | 1.95% | | | 20.39% | |
| | |
| | |
| | $1,957 | | | $1,669 | | | $2,246 | | | $6 | |
| 1.32% | | | 1.25% | | | 1.25% | | | 1.26% | |
| | |
| 1.67% | | | 1.56% | | | 1.45% | | | 1.47% | |
| 2.35% | | | 1.86% | | | 1.50% | | | 1.59% | |
| | |
| 2.00% | | | 1.55% | | | 1.30% | | | 1.38% | |
| 27% | | | 43% | | | 24% | | | 24% | |
25
Financial highlights
Delaware Value® Fund Institutional Class
Selected data for each share of the Fund outstanding throughout each period were as follows:
| |
| Net asset value, beginning of period |
| |
| Income (loss) from investment operations: |
| Net investment income1 |
| Net realized and unrealized gain (loss) on investments |
| Total from investment operations |
| |
| Less dividends and distributions from: |
| Net investment income |
| Net realized gain on investments |
| Total dividends and distributions |
| |
| Net asset value, end of period |
| |
| Total return2 |
| |
| Ratios and supplemental data: |
| Net assets, end of period (000 omitted) |
| Ratio of expense to average net assets |
| Ratio of expense to average net assets |
| prior to fees waived and expense paid indirectly |
| Ratio of net investment income to average net assets |
| Ratio of net investment income to average net assets |
| prior to fees waived and expense paid indirectly |
| Portfolio turnover |
1 The average shares outstanding method has been applied for per share information. |
2 Total investment return is based on the change in net asset value of a share during the period and assumes reinvestment of dividends and distributions at net asset value. Total investment return during all of the periods shown reflect a waiver by the manager. Performance would have been lower had the waiver not been in effect. |
See accompanying notes
26
| Year Ended |
| 11/30/09 | | 11/30/08 | | 11/30/07 | | 11/30/06 | | 11/30/05 |
| $7.770 | | | $13.380 | | | $13.500 | | | $11.390 | | | $10.780 | |
| |
| |
| 0.225 | | | 0.250 | | | 0.276 | | | 0.256 | | | 0.243 | |
| 1.394 | | | (4.936 | ) | | 0.051 | | | 2.077 | | | 0.846 | |
| 1.619 | | | (4.686 | ) | | 0.327 | | | 2.333 | | | 1.089 | |
| |
| |
| (0.279 | ) | | (0.274 | ) | | (0.223 | ) | | (0.152 | ) | | (0.116 | ) |
| — | | | (0.650 | ) | | (0.224 | ) | | (0.071 | ) | | (0.363 | ) |
| (0.279 | ) | | (0.924 | ) | | (0.447 | ) | | (0.223 | ) | | (0.479 | ) |
| |
| $9.110 | | | $7.770 | | | $13.380 | | | $13.500 | | | $11.390 | |
| |
| 21.43% | | | (37.54% | ) | | 2.41% | | | 20.85% | | | 10.37% | |
| |
| |
| $80,373 | | | $43,914 | | | $126,023 | | | $189,557 | | | $146,761 | |
| 0.82% | | | 0.75% | | | 0.75% | | | 0.76% | | | 0.76% | |
| |
| 1.07% | | | 0.96% | | | 0.85% | | | 0.87% | | | 0.81% | |
| 2.85% | | | 2.36% | | | 2.00% | | | 2.09% | | | 2.23% | |
| |
| 2.60% | | | 2.15% | | | 1.90% | | | 1.98% | | | 2.18% | |
| 27% | | | 43% | | | 24% | | | 24% | | | 26% | |
27
| Notes to financial statements | |
| Delaware Value® Fund | November 30, 2009 |
Delaware Group® Equity Funds II (Trust) is organized as a Delaware statutory trust and offers two series: Delaware Large Cap Value Fund and Delaware Value Fund. These financial statements and the related notes pertain to Delaware Value Fund (Fund). The Trust is an open-end investment company. The Fund is considered diversified under the Investment Company Act of 1940, as amended, and offers Class A, Class B, Class C, Class R and Institutional Class shares. Class A shares are sold with a maximum front-end sales charge of up to 5.75%. Class A share purchases of $1,000,000 or more will incur a contingent deferred sales charge (CDSC) of up to 1% if redeemed during the first year and 0.50% during the second year, provided that Delaware Distributors, L.P. (DDLP) paid a financial advisor a commission on the purchase of those shares. Class B shares may only be purchased through dividend reinvestment and certain permitted exchanges. Prior to June 1, 2007, Class B shares were sold with a CDSC that declined from 4% to zero depending upon the period of time the shares are held. Class B shares will automatically convert to Class A shares on a quarterly basis approximately eight years after purchase. Class C shares are sold with a CDSC of 1%, if redeemed during the first 12 months. Class R and Institutional Class shares are not subject to a sales charge and are offered for sale exclusively to certain eligible investors.
The investment objective of the Fund is to seek long-term capital appreciation.
1. Significant Accounting Policies
The following accounting policies are in accordance with U.S. generally accepted accounting principles (GAAP) and are consistently followed by the Fund.
Security Valuation — Equity securities, except those traded on the Nasdaq Stock Market, Inc. (Nasdaq), are valued at the last quoted sales price as of the time of the regular close of the New York Stock Exchange (NYSE) on the valuation date. Securities traded on the Nasdaq are valued in accordance with the Nasdaq Official Closing Price, which may not be the last sales price. If on a particular day an equity security does not trade, then the mean between the bid and ask prices will be used. Investment companies are valued at net asset value per share. Short-term debt securities are valued at market value. Generally, other securities and assets for which market quotations are not readily available are valued at fair value as determined in good faith under the direction of the Fund’s Board of Trustees (Board). In determining whether market quotations are readily available or fair valuation will be used, various factors will be taken into consideration, such as market closures or suspension of trading in a security. The Fund may use fair value pricing more frequently for securities traded primarily in non-U.S. markets because, among other things, most foreign markets close well before the Fund values its securities at 4:00 p.m. Eastern time. The earlier close of these foreign markets gives rise to the possibility that significant events, including broad market moves, government actions or pronouncements, aftermarket trading, or news events may have occurred in the interim. To account for this, the Fund may frequently value foreign securities using fair value prices based on third-party vendor modeling tools (international fair value pricing).
Federal Income Taxes — No provision for federal income taxes has been made as the Fund intends to continue to qualify for federal income tax purposes as a regulated investment company under Subchapter M of the Internal Revenue Code of 1986, as amended, and
28
make the requisite distributions to shareholders. The Fund evaluates tax positions taken or expected to be taken in the course of preparing the Fund’s tax returns to determine whether the tax positions are “more-likely-than-not” of being sustained by the applicable tax authority. Tax positions not deemed to meet the more-likely-than-not threshold are recorded as a tax benefit or expense in the current year. Management has analyzed the Fund’s tax positions taken on federal income tax returns for all open tax years (tax years ended November 30, 2006 – November 30, 2009), and has concluded that no provision for federal income tax is required for the Fund’s financial statements.
Class Accounting — Investment income, common expenses and realized and unrealized gain (loss) on investments are allocated to the various classes of the Fund on the basis of daily net assets of each class. Distribution expenses relating to a specific class are charged directly to that class.
Repurchase Agreements — The Fund may invest in a pooled cash account along with other members of the Delaware Investments® Family of Funds pursuant to an exemptive order issued by the Securities and Exchange Commission. The aggregate daily balance of the pooled cash account is invested in repurchase agreements secured by obligations of the U.S. government. The respective collateral is held by the Fund’s custodian bank until the maturity of the respective repurchase agreements. Each repurchase agreement is at least 102% collateralized. However, in the event of default or bankruptcy by the counterparty to the agreement, realization of the collateral may be subject to legal proceedings. At November 30, 2009, the Fund held no investments in repurchase agreements.
Use of Estimates — The preparation of financial statements in conformity with U.S. GAAP requires management to make estimates and assumptions that affect the reported amounts of assets and liabilities at the date of the financial statements and the reported amounts of revenues and expenses during the reporting period. Actual results could differ from those estimates.
Other — Expenses directly attributable to the Fund are charged directly to the Fund. Other expenses common to various funds within the Delaware Investments® Family of Funds are generally allocated amongst such funds on the basis of average net assets. Management fees and some other expenses are paid monthly. Security transactions are recorded on the date the securities are purchased or sold (trade date) for financial reporting purposes. Costs used in calculating realized gains and losses on the sale of investment securities are those of the specific securities sold. Dividend income is recorded on the ex-dividend date and interest income is recorded on the accrual basis. The Fund declares and pays dividends from net investment income and distributions from net realized gain from investments, if any, annually.
Subject to seeking best execution, the Fund may direct certain security trades to brokers who have agreed to rebate a portion of the related brokerage commission to the Fund in cash. Such commission rebates are included in realized gain on investments in the accompanying financial statements and totaled $247 for the year ended November 30, 2009. In general, best execution refers to many factors, including the price paid or received for a security, the commission charged, the promptness and reliability of execution, the confidentiality and placement accorded the order, and other factors affecting the overall benefit obtained by the Fund on the transaction.
29
| Notes to financial statements | |
| Delaware Value® Fund | |
1. Significant Accounting Policies (continued)
The Fund may receive earnings credits from its custodian when positive cash balances are maintained, which are used to offset custody fees. There were no earnings credits for the year ended November 30, 2009.
On July 1, 2009, the Financial Accounting Standards Board (FASB) issued the FASB Accounting Standards Codification (Codification). The Codification became the single source of authoritative nongovernmental U.S. GAAP, superseding existing literature of the FASB, American Institute of Certified Public Accountants, Emerging Issues Task Force and other sources. The Codification is effective for interim and annual periods ending after September 15, 2009. The Fund adopted the codification for the year ended November 30, 2009. There was no impact to financial statements as the Codification requirements are disclosure-only in nature.
Management has evaluated whether any events or transactions occurred subsequent to November 30, 2009 through January 21, 2010, the date of issuance of the Fund’s financial statements, and determined that there were no material events or transactions that would require recognition or disclosure in the Fund’s financial statements.
2. Investment Management, Administration Agreements and Other Transactions with Affiliates
In accordance with the terms of it’s investment management agreement, the Fund pays Delaware Management Company (DMC), a series of Delaware Management Business Trust and the investment manager, an annual fee which is calculated daily at the rate of 0.65% on the first $500 million of average daily net assets of the Fund, 0.60% on the next $500 million, 0.55% on the next $1.5 billion and 0.50% on average daily net assets in excess of $2.5 billion.
Effective April 1, 2009, DMC has voluntarily agreed to waive that portion, if any, of its management fee and reimburse the Fund to the extent necessary to ensure that annual operating expenses (excluding any 12b-1 plan expenses, taxes, interest, inverse floater program expenses, brokerage fees, certain insurance costs, and nonroutine expenses or costs including, but not limited to, those relating to reorganizations, litigation, conducting shareholder meetings, and liquidations (collectively, nonroutine expenses)), do not exceed 0.85% of average daily net assets of the Fund until such time as the waiver is discontinued. Prior to April 1, 2009, DMC had voluntarily agreed to waive that portion, if any, of its management fee and reimburse the Fund to the extent necessary to ensure that annual operating expenses, (excluding any 12b-1 plan expenses, taxes, interest, inverse floater program expenses, brokerage fees, certain insurance costs, and nonroutine expenses), did not exceed 0.75% of average daily net assets of the Fund. For purposes of these waivers and reimbursements, nonroutine expenses may also include such additional costs and expenses, as may be agreed upon from time to time by the Board and DMC. The current expense waiver may be discontinued at any time because it is voluntary, and applies only to expenses paid directly by the Fund.
30
Delaware Service Company, Inc. (DSC), an affiliate of DMC, provides fund accounting and financial administration oversight services to the Fund. For these services, the Fund pays DSC fees based on the aggregate daily net assets of the Delaware Investments® Family of Funds at the following annual rate: 0.0050% of the first $30 billion; 0.0045% of the next $10 billion; 0.0040% of the next $10 billion; and 0.0025% of aggregate average daily net assets in excess of $50 billion. The fees payable to DSC under the service agreement described above are allocated among all Funds in the Delaware Investments Family of Funds on a relative net asset value basis. For the year ended November 30, 2009, the Fund was charged $17,490 for these services.
DSC also provides dividend disbursing and transfer agency services. The Fund pays DSC a monthly fee based on the number of shareholder accounts for dividend disbursing and transfer agent services.
Pursuant to a distribution agreement and distribution plan, the Fund pays DDLP, the distributor and an affiliate of DMC, an annual distribution and service fee not to exceed 0.30% of the average daily net assets of the Class A shares, 1.00% of the average daily net assets of the Class B and C shares and 0.60% of the average daily net assets of the Class R shares. Institutional Class shares pay no distribution and services expenses. DDLP has contracted to waive distribution and service fees through March 31, 2010 in order to prevent distribution and service fees of Class A and Class R shares from exceeding 0.25% and 0.50%, respectively, of average daily net assets.
At November 30, 2009, the Fund had liabilities payable to affiliates as follows:
| Investment management fee payable to DMC | | $ | 195,379 |
| Dividend disbursing, transfer agent and fund accounting | | | |
| oversight fees and other expenses payable to DSC | | | 52,913 |
| Distribution fees payable to DDLP | | | 84,069 |
| Other expenses payable to DMC and affiliates* | | | 7,868 |
*DMC, as part of its administrative services, pays operating expenses on behalf of the Fund and is reimbursed on a periodic basis. Such expenses include items such as printing of shareholder reports, fees for audit, legal and tax services, registration fees and trustees’ fees.
As provided in the investment management agreement, the Fund bears the cost of certain legal and tax services, including internal legal and tax services provided to the Fund by DMC and/or its affiliates’ employees. For the year ended November 30, 2009, the Fund was charged $29,620 for internal legal and tax services provided by DMC and/or its affiliates’ employees.
For the year ended November 30, 2009, DDLP earned $9,820 for commissions on sales of the Fund’s Class A shares. For the year ended November 30, 2009, DDLP received gross CDSC commissions of $—, $5,686 and $1,185 on redemption of the Fund’s Class A, Class B and Class C shares, respectively, and these commissions were entirely used to offset up-front commissions previously paid by DDLP to broker-dealers on sales of those shares.
Trustees’ fees include expenses accrued by the Fund for each Trustee’s retainer and meeting fees. Certain officers of DMC, DSC and DDLP are officers and/or Trustees of the Trust. These officers and Trustees are paid no compensation by the Fund.
31
Notes to financial statements
Delaware Value® Fund
3. Investments
For the year ended November 30, 2009, the Fund made purchases of $91,313,284 and sales of $91,377,223 of investment securities other than short-term investments.
At November 30, 2009, the cost of investments for federal income purposes was $417,402,412. At November 30, 2009, net unrealized depreciation was $1,397,582, of which $33,500,826 related to unrealized appreciation of investments and $34,898,408 related to unrealized depreciation of investments.
The Fund applies the provisions, as amended to date, of Accounting Standards Codification 820 (ASC 820), Fair Value Measurements and Disclosures. ASC 820 defines fair value as the price that the Fund would receive to sell an asset or pay to transfer a liability in an orderly transaction between market participants at the measurement date under current market conditions. ASC 820 also establishes a framework for measuring fair value, and a three level hierarchy for fair value measurements based upon the transparency of inputs to the valuation of an asset or liability. Inputs may be observable or unobservable and refer broadly to the assumptions that market participants would use in pricing the asset or liability. Observable inputs reflect the assumptions market participants would use in pricing the asset or liability based on market data obtained from sources independent of the reporting entity. Unobservable inputs reflect the reporting entity’s own assumptions about the assumptions that market participants would use in pricing the asset or liability developed based on the best information available under the circumstances. The Fund’s investment in its entirety is assigned a level based upon the observability of the inputs which are significant to the overall valuation. The three-tier hierarchy of inputs is summarized below.
Level 1 – inputs are quoted prices in active markets
Level 2 – inputs are observable, directly or indirectly
Level 3 – inputs are unobservable and reflect assumptions on the part of the reporting entity
The following table summarizes the valuation of the Fund’s investments by the ASC 820 fair value hierarchy levels as of November 30, 2009:
| | Level 1 | | Level 2 | | Level 3 | | Total |
| Common Stock | $ | 395,817,411 | | $ | — | | $ | — | | $ | 395,817,411 |
| Short-Term | | — | | | 14,646,019 | | | — | | | 14,646,019 |
| Securities Lending Collateral | | 3,468,235 | | | 2,069,177 | | | 3,988 | | | 5,541,400 |
| Total | $ | 399,285,646 | | $ | 16,715,196 | | $ | 3,988 | | $ | 416,004,830 |
32
The following is a reconciliation of investments in which significant unobservable inputs (Level 3) were used in determining fair value:
| | Securities |
| | Lending |
| | Collateral |
| Balance as of 11/30/08 | $ | 7,694 | |
| Net change in unrealized appreciation/depreciation | | (3,706 | ) |
| Balance as of 11/30/09 | $ | 3,988 | |
| |
| Net change in unrealized appreciation/depreciation from | | | |
| investments still held as of 11/30/09 | $ | (3,706 | ) |
4. Dividend and Distribution Information
Income and long-term capital gain distributions are determined in accordance with federal income tax regulations, which may differ from U.S. GAAP. Additionally, distributions from net short-term gains on sales of investment securities are treated as ordinary income for federal income tax purposes. The tax character of dividends and distributions paid during the years ended November 30, 2009 and 2008 was as follows:
| | 11/30/09 | | 11/30/08 |
| Ordinary income | $ | 10,928,454 | | $ | 19,416,612 |
| Long-term capital gain | | — | | | 21,782,337 |
| Total | $ | 10,928,454 | | $ | 41,198,949 |
5. Components of Net Assets on a Tax Basis
As of November 30, 2009, the components of net assets on a tax basis were as follows:
| Shares of beneficial interest | $ | 524,453,273 | |
| Undistributed ordinary income | | 7,903,058 | |
| Capital loss carryforwards | | (118,924,797 | ) |
| Unrealized depreciation of investments | | (1,397,582 | ) |
| Net assets | $ | 412,033,952 | |
The differences between book basis and tax basis components of net assets are primarily attributable to tax deferral of losses on wash sales.
For federal income tax purposes, capital loss carryforwards may be carried forward and applied against future capital gains. Capital loss carryforwards remaining at November 30, 2009 will expire as follows: $93,035,807 expires in 2016 and $25,888,990 expires in 2017.
33
Notes to financial statements
Delaware Value® Fund
6. Capital Shares
Transactions in capital shares were as follows:
| | Year Ended |
| | 11/30/09 | | 11/30/08 |
| Shares sold: | | | | | |
| Class A | 12,801,028 | | | 15,162,138 | |
| Class B | 45,194 | | | 19,163 | |
| Class C | 448,443 | | | 492,256 | |
| Class R | 60,019 | | | 93,157 | |
| Institutional Class | 5,018,644 | | | 6,173,541 | |
| |
| Shares issued upon reinvestment of dividends and distributions: | | | | | |
| Class A | 1,096,074 | | | 2,135,670 | |
| Class B | 8,727 | | | 40,153 | |
| Class C | 65,421 | | | 290,217 | |
| Class R | 6,572 | | | 11,673 | |
| Institutional Class | 201,081 | | | 685,790 | |
| | 19,751,203 | | | 25,103,758 | |
| |
| Shares repurchased: | | | | | |
| Class A | (14,967,432 | ) | | (14,408,788 | ) |
| Class B | (156,392 | ) | | (351,558 | ) |
| Class C | (954,814 | ) | | (2,671,861 | ) |
| Class R | (66,870 | ) | | (57,769 | ) |
| Institutional Class | (2,050,520 | ) | | (10,625,612 | ) |
| | (18,196,028 | ) | | (28,115,588 | ) |
| Net increase (decrease) | 1,555,175 | | | (3,011,830 | ) |
For the years ended November 30, 2009 and 2008, 18,769 Class B shares were converted to 18,687 Class A shares valued at $141,883 and 23,585 Class B shares were converted to 23,466 Class A shares valued at $258,067, respectively. The respective amounts are included in Class B redemptions and Class A subscriptions in the table above and the statements of changes in the net assets.
7. Line of Credit
The Fund, along with certain other funds in the Delaware Investments® Family of Funds (Participants), participates in a $35,000,000 revolving line of credit with The Bank of New York Mellon (BNY Mellon) to be used for temporary or emergency purposes as an additional source of liquidity to fund redemptions of investor shares. Under the agreement, the Participants are charged an annual commitment fee, which is allocated across the Participants on the basis of each Participant’s allocation of the entire facility. The Participants may borrow up to a maximum of one third of their net assets under the agreement. The agreement expires on November 16, 2010. The Fund had no amounts outstanding as of November 30, 2009 or at any time during the year then ended.
34
8. Securities Lending
The Fund, along with other funds in the Delaware Investments® Family of Funds, may lend its securities pursuant to a security lending agreement (Lending Agreement) with BNY Mellon. With respect to each loan, if the aggregate market value of securities collateral held plus cash collateral received on any business day is less than the aggregate market value of the securities which are the subject of such loan, the borrower will be notified to provide additional collateral not less than the applicable collateral requirements. Cash collateral received is generally invested in the Mellon GSL DBT II Collateral Fund (Collective Trust) established by BNY Mellon for the purpose of investment on behalf of clients participating in its securities lending programs. The Collective Trust may invest in fixed income securities, with a weighted average maturity not to exceed 90 days, rated in one of the top three tiers by Standard & Poor’s Ratings Group or Moody’s Investors Service, Inc. or repurchase agreements collateralized by such securities. The Collective Trust seeks to maintain a net asset value per unit of $1.00, but there can be no assurance that it will always be able to do so. At November, 30, 2009, the Collective Trust held only cash and assets with a maturity of one business day or less (Cash/Overnight Assets). The Fund may incur investment losses as a result of investing securities lending collateral in the Collective Trust. This could occur if an investment in the Collective Trust defaulted or if it were necessary to liquidate assets in the Collective Trust to meet returns on outstanding security loans at a time when the Collective Trust’s net asset value per unit was less than $1.00. Under those circumstances, the Fund may not receive an amount from the Collective Trust that is equal in amount to the collateral the Fund would be required to return to the borrower of the securities and the Fund would be required to make up for this shortfall. Effective April 20, 2009, BNY Mellon transferred the assets of the Collective Trust other than the Cash/Overnight Assets to the BNY Mellon SL DBT II Liquidating Fund (the Liquidating Fund), effectively bifurcating the collateral investment pool. The Fund’s exposure to the Liquidating Fund is expected to decrease as the Liquidating Fund’s assets mature or are sold. In October 2008, BNY Mellon transferred certain distressed securities from the Collective Trust into the Mellon GSL Reinvestment Trust II. The Fund may also accept U.S. government securities and letters of credit (non-cash collateral) in connection with securities loans. In the event of default or bankruptcy by the lending agent, realization and/or retention of the collateral may be subject to legal proceedings. In the event the borrower fails to return loaned securities and the collateral received is insufficient to cover the value of the loaned securities and provided such collateral shortfall is not the result of investment losses, the lending agent has agreed to pay the amount of the shortfall to the Fund, or at the discretion of the lending agent, replace the loaned securities. The Fund continues to record dividends or interest, as applicable, on the securities loaned and is subject to any change in value of the securities loaned that may occur during the term of the loan. The Fund has the right under the Lending Agreement to recover the securities from the borrower on demand. With respect to security loans collateralized by securities collateral, the Fund receives loan premiums paid by the borrower. With respect to security loans collateralized by cash collateral, the earnings from the collateral investments are shared among the Fund, the security lending agent, and the borrower. The Fund records security lending income net of allocations to the security lending agent and the borrower.
35
Notes to financial statements
Delaware Value® Fund
8. Securities Lending (continued)
At November 30, 2009, the value of the securities on loan was $5,496,149, for which cash collateral was received and invested in accordance with the Lending Agreement. At November 30, 2009, the value of invested collateral was $5,541,400. Such investments are presented on the statement of net assets under the caption “Securities Lending Collateral.”
9. Credit and Market Risk
The Fund may invest up to 15% of its total net assets in illiquid securities, which may include securities with contractual restrictions on resale, securities exempt from registration under Rule 144A of the Securities Act of 1933, as amended, and other securities which may not be readily marketable. The relative illiquidity of these securities may impair the Fund from disposing of them in a timely manner and at a fair price when it is necessary or desirable to do so. While maintaining oversight, the Fund’s Board has delegated to DMC the day-to-day functions of determining whether individual securities are liquid for purposes of the Fund’s limitation on investments in illiquid assets. Securities eligible for resale pursuant to Rule 144A, which are determined to be liquid, are not subject to the Fund’s 15% limit on investments in illiquid securities. For the year ended November 30, 2009, there were no Rule 144A securities. Illiquid securities have been identified on the statement of net assets.
10. Contractual Obligations
The Fund enters into contracts in the normal course of business that contain a variety of indemnifications. The Fund’s maximum exposure under these arrangements is unknown. However, the Fund has not had prior claims or losses pursuant to these contracts. Management has reviewed the Fund’s existing contracts and expects the risk of loss to be remote.
11. Sale of Delaware Investments to Macquarie Group
On August 18, 2009, Lincoln National Corporation (parent company of Delaware Investments) and Macquarie Group (Macquarie) entered into an agreement pursuant to which Delaware Investments, including DMC, DDLP and DSC, would be acquired by Macquarie, an Australia-based global provider of banking, financial, advisory, investment and funds management services (Transaction). The Transaction was completed on January 4, 2010. DMC, DDLP and DSC are now wholly owned subsidiaries of Macquarie.
The Transaction resulted in a change of control of DMC which, in turn, caused the termination of the investment advisory agreement between DMC and the Fund. On January 4, 2010, the new investment advisory agreement between DMC and the Fund that was approved by the shareholders became effective.
36
12. Tax Information (Unaudited)
The information set forth below is for the Fund’s fiscal year as required by federal laws. Shareholders, however, must report distributions on a calendar year basis for income tax purposes, which may include distributions for portions of two fiscal years of a fund. Accordingly, the information needed by shareholders for income tax purposes will be sent to them in January of each year. Please consult your tax advisor for proper treatment of this information.
For the fiscal year ended November 30, 2009, the Fund designates distributions paid during the year as follows:
| (A) | | Long-Term Capital Gains Distributions (Tax Basis) | — |
| (B) | | Ordinary Income Distributions* (Tax Basis) | 100.00% |
| | | Total Distributions (Tax Basis) | 100.00% |
| (C) | | Qualifying Dividends1 | 100.00% |
(A) and (B) are based on a percentage of the Fund’s total distributions.
(C) is based on a percentage of the Fund’s ordinary income distributions.
1Qualifying dividends represent dividends which qualify for the corporate dividends received deduction.
| * | For the fiscal year ended November 30, 2009, certain dividends paid by the Fund may be subject to a maximum tax rate of 15%, as provided for by the Jobs and Growth Tax Relief Reconciliation Act of 2003. The Fund intends to designate up to a maximum amount of $10,928,454 to be taxed at maximum rate of 15%. Complete information will be computed and reported in conjunction with your 2009 Form 1099-DIV. |
37
Report of independent
registered public accounting firm
To the Shareholders and Board of Trustees
Delaware Group® Equity Funds II — Delaware Value® Fund
We have audited the accompanying statement of net assets of Delaware Value Fund (one of the series constituting Delaware Group Equity Funds II) (the “Fund”) as of November 30, 2009, and the related statement of operations for the year then ended, the statements of changes in net assets for each of the two years in the period then ended, and the financial highlights for each of the periods indicated therein. These financial statements and financial highlights are the responsibility of the Fund’s management. Our responsibility is to express an opinion on these financial statements and financial highlights based on our audits.
We conducted our audits in accordance with the standards of the Public Company Accounting Oversight Board (United States). Those standards require that we plan and perform the audit to obtain reasonable assurance about whether the financial statements and financial highlights are free of material misstatement. We were not engaged to perform an audit of the Fund’s internal control over financial reporting. Our audits included consideration of internal control over financial reporting as a basis for designing audit procedures that are appropriate in the circumstances, but not for the purpose of expressing an opinion on the effectiveness of the Fund’s internal control over financial reporting. Accordingly, we express no such opinion. An audit also includes examining, on a test basis, evidence supporting the amounts and disclosures in the financial statements and financial highlights, assessing the accounting principles used and significant estimates made by management, and evaluating the overall financial statement presentation. Our procedures included confirmation of securities owned as of November 30, 2009 by correspondence with the custodian and brokers or by other appropriate auditing procedures where replies from brokers were not received. We believe that our audits provide a reasonable basis for our opinion.
In our opinion, the financial statements and financial highlights referred to above present fairly, in all material respects, the financial position of the Delaware Value Fund of Delaware Group Equity Funds II at November 30, 2009, the results of its operations for the year then ended, the changes in its net assets for each of the two years in the period then ended, and its financial highlights for each of the periods indicated therein, in conformity with U.S. generally accepted accounting principles.
Philadelphia, Pennsylvania
January 21, 2010
38
Other Fund information
(Unaudited)
Delaware Value® Fund
Board Consideration of New Investment Advisory Agreement
At a meeting held on September 3, 2009 (the “Meeting”), the Board of Trustees of the Delaware Investments® Family of Funds (the “Board”), including a majority of independent Trustees, approved a new investment advisory agreement between each registrant on behalf of each series (each, a “Fund” and together, the “Funds”) and Delaware Management Company (“DMC”) in connection with the sale of Delaware Investments’ advisory business to Macquarie Bank Limited (the “Macquarie Group”) (the “Transaction”). In making its decision, the Board considered information furnished specifically in connection with the approval of the new investment advisory agreements with DMC (the “New Investment Advisory Agreements”) which included extensive materials about the Transaction and matters related to the proposed approvals. To assist the Board in considering the New Investment Advisory Agreements, Macquarie Group provided materials and information about Macquarie Group, including detailed written responses to the questions posed by the independent Trustees. DMC also provided materials and information about the Transaction, including detailed written responses to the questions posed by the independent Trustees.
At the Meeting, the Trustees discussed the Transaction with DMC management and with key Macquarie Group representatives. The Meeting included discussions of the strategic rationale for the Transaction and Macquarie Group’s general plans and intentions regarding the Funds and DMC. The Board members also inquired about the plans for, and anticipated roles and responsibilities of, key employees and officers of Delaware Management Holdings Inc. and DMC in connection with the Transaction.
In connection with the Trustees’ review of the New Investment Advisory Agreements for the Funds, DMC and/or Macquarie Group emphasized that:
- They expected that there would be no adverse changes as a result of the Transaction, in the nature, quality, or extent of services currently provided to the Funds and their shareholders, including investment management, distribution, or other shareholder services.
- No material changes in personnel or operations were contemplated in the operation of DMC under Macquarie Group as a result of the Transaction and no material changes were currently contemplated in connection with third party service providers to the Funds.
- Macquarie Group had no intention to cause DMC to alter the voluntary expense waivers and reimbursements currently in effect for the Funds.
- Under the agreement between Macquarie Group and Lincoln National Corporation (“LNC”) (the “Transaction Agreement”), Macquarie Group has agreed to conduct, and to cause its affiliates to conduct, their respective businesses in compliance with the conditions of Section 15(f) of the Investment Company Act of 1940 (the “1940 Act”) with respect to the Funds, to the extent within its control, including maintaining Board composition of at least 75% of the Board members qualifying as independent Trustees and not imposing any “unfair burden” on the Funds for at least two years from the closing of the Transaction (the “Closing”).
39
Other Fund information
(Unaudited)
Delaware Value® Fund
Board Consideration of New Investment Advisory Agreement (continued)
In addition to the information provided by DMC and Macquarie Group as described above, the Trustees also considered all other factors they believed to be relevant to evaluating the New Investment Advisory Agreements, including the specific matters discussed below. In their deliberations, the Trustees did not identify any particular information that was controlling, and different Trustees may have attributed different weights to the various factors. However, for each Fund, the Trustees determined that the overall arrangements between the Fund and DMC, as provided in the respective New Investment Advisory Agreement, including the proposed advisory fee and the related administration arrangements between the Fund and DMC, were fair and reasonable in light of the services to be performed, expenses incurred, and such other matters as the Trustees considered relevant. Factors evaluated included:
- The potential for expanding distribution of Fund shares through access to Macquarie Group’s existing distribution channels;
- Delaware Investments’ acquisition of an exclusive wholesaling sales force from a subsidiary of LNC;
- The reputation, financial strength, and resources of Macquarie Group as well as its historic and ongoing commitment to the asset management business in Australia as well as other parts of the world;
- The terms and conditions of the New Investment Advisory Agreements, including that each Fund’s total contractual fee rate under the New Investment Advisory Agreement will remain the same;
- The Board’s full annual review (or initial approval) of the current investment advisory agreements at their in-person meeting in May 2009 as required by the 1940 Act and its determination that (i) DMC had the capabilities, resources, and personnel necessary to provide the satisfactory advisory and administrative services currently provided to each Fund and (ii) the advisory and/or management fees paid by each Fund, taking into account any applicable fee waivers and breakpoints, represented reasonable compensation to DMC in light of the services provided, the costs to DMC of providing those services, economies of scale, and the fees and other expenses paid by similar funds and such other matters that the Board considered relevant in the exercise of its reasonable judgment;
- The portfolio management teams for the Funds are not currently expected to change as a result of the Transaction;
- LNC and Macquarie Group were expected to execute a reimbursement agreement pursuant to which LNC and Macquarie Group would agree to pay (or reimburse) all reasonable out-of-pocket costs and expenses of the Funds in connection with the Board’s consideration of the Transaction, the New Investment Advisory Agreements and related agreements, and all costs related to the proxy solicitation (the “Expense Agreement”);
40
- The likelihood that Macquarie Group would invest additional amounts in Delaware Investments, including DMC, which could result in increased assets under management, which in turn would allow some Funds the potential opportunity to achieve economies of scale and lower fees payable by Fund shareholders; and
- The compliance and regulatory history of Macquarie Group and its affiliates.
In making their decision relating to the approval of each Fund’s New Investment Advisory Agreement, the independent Trustees gave attention to all information furnished. The following discussion, however, identifies the primary factors taken into account by the Trustees and the conclusions reached in approving the New Investment Advisory Agreements.
Nature, Extent, and Quality of Service. The Trustees considered the services historically provided by DMC to the Funds and their shareholders. In reviewing the nature, extent, and quality of services, the Board considered that the New Investment Advisory Agreements would be substantially similar to the current investment advisory agreements between the Funds and DMC (the “Current Investment Advisory Agreements”), and therefore, considered the many reports furnished to them throughout 2008 and 2009 at regular Board meetings covering matters such as the relative performance of the Funds; compliance of portfolio managers with the investment policies, strategies, and restrictions for the Funds; the compliance of management personnel with the code of ethics adopted throughout the Delaware Investments Family of Funds complex; and the adherence to fair value pricing procedures as established by the Board. The Trustees were pleased with the current staffing of DMC and the emphasis placed on research and risk management in the investment process. Favorable consideration was given to DMC’s efforts to maintain expenditures and, in some instances, increase financial and human resources committed to Fund matters.
The Board also considered the transfer agent and shareholder services that would continue to be provided to Fund shareholders by DMC’s affiliate, Delaware Service Company, Inc. (“DSC”). The Trustees noted, in particular, DSC’s commitment to maintain a high level of service as well as DMC’s expenditures to improve the delivery of shareholder services. The Board was assured that shareholders would continue to receive the benefits provided to Fund shareholders by being part of the Delaware Investments Family of Funds, including each shareholder’s ability to exchange an investment in one Delaware Investments Fund for the same class of shares in another Delaware Investments Fund without a sales charge, to reinvest Fund dividends into additional shares of any of the Funds, and the privilege to combine holdings in other Funds to obtain a reduced sales charge.
Based on the information provided by DMC and Macquarie Group, including that Macquarie Group and DMC currently expected no material changes as a result of the Transaction in (i) personnel or operations of DMC or (ii) third party service providers to the Funds, the Board concluded that the satisfactory nature, extent, and quality of services currently provided to the Funds and their shareholders were very likely to continue under the New Investment Advisory Agreements. Moreover, the Board concluded that the Funds would probably benefit from the
41
Other Fund information
(Unaudited)
Delaware Value® Fund
Board Consideration of New Investment Advisory Agreement (continued)
expanded distribution resources that would become available to Delaware Investments following the Transaction. The Board also concluded that it was very unlikely that any “unfair burden” would be imposed on any of the Funds for the first two years following the Closing as a result of the Transaction. Consequently, the Board concluded that it did not expect the Transaction to result in any adverse changes in the nature, quality, or extent of services (including investment management, distribution or other shareholder services) currently provided to the Funds and their shareholders.
Investment Performance. The Board considered the overall investment performance of DMC and the Funds. The Trustees placed significant emphasis on the investment performance of the Funds in view of its importance to shareholders. Although the Trustees gave appropriate consideration to performance reports and discussions with portfolio managers at Board meetings throughout the year, the Trustees gave particular weight to their review of investment performance in connection with the approval of the Current Investment Advisory Agreements at the Board meeting held in May 2009. At that meeting, the Trustees reviewed reports prepared by Lipper, Inc., an independent statistical compilation organization (“Lipper”), which showed each Fund’s investment performance as of December 31, 2008 in comparison to a group of funds selected by Lipper as being similar to the Fund (the “Performance Universe”). During the May 2009 agreement review process, the Trustees observed the significant improvements to relative investment performance of the Funds compared to the Funds’ performance as of December 31, 2007.
At their meeting on September 3, 2009, the Trustees, including the independent Trustees in consultation with their independent counsel, reviewed the investment performance of each Fund. The Trustees compared the performance of each Fund relative to that of its respective Performance Universe for the 1-, 3-, 5-, and 10-year periods ended June 30, 2009 and compared its relative investment performance against the corresponding relative investment performance of each Fund for such time periods ended December 31, 2008, to the extent applicable. As of June 30, 2009, 30 of the Funds had investment performance relative to that of the respective Performance Universe that was better than the corresponding relative investment performance at December 31, 2008 for all applicable time periods. At June 30, 2009, an additional 6 Funds had investment performance relative to that of their respective Performance Universe that was better than the corresponding relative investment performance at December 31, 2008 for a majority of the applicable time periods. At June 30, 2009, 15 additional Funds had investment performance relative to that of their respective Performance Universe that was better than the corresponding relative performance at December 31, 2008 and only 29 Funds had poorer relative investment performance at June 30, 2009 compared to that at December 31, 2008.
The Board therefore concluded that the investment performance of the Funds, on an aggregate basis, had continued to improve relative to their respective Performance Universe since the data reviewed at the May 2009 meeting. Based on information provided by DMC and Macquarie Group, the Board concluded that neither the Transaction nor the New Investment Advisory Agreement would likely have an adverse effect on the investment performance of any Fund because (i) DMC and Macquarie Group did not currently expect the Transaction to cause any material change to
42
the Funds’ portfolio management teams responsible for investment performance, which the Board found to be satisfactory and improving; and (ii) as discussed in more detail below, the Funds’ expenses were not expected to increase as a result of the Transaction.
Comparative Expenses. The Trustees also considered expense comparison data for the Funds previously provided in May 2009. At that meeting, DMC had provided the Board with information on pricing levels and fee structures for the Funds and comparative funds. The Trustees focused on the comparative analysis of the effective management fees and total expense ratios of each Fund versus the effective management fees and expense ratios of a group of funds selected by Lipper as being similar to each Fund (the “Expense Group”). In reviewing comparative costs, each Fund’s contractual management fee and the actual management fee incurred by the Fund were compared with the contractual management fees (assuming all funds in the Expense Group were similar in size to the Fund) and actual management fees (as reported by each fund) of other funds within the Expense Group, taking into account any applicable breakpoints and fee limitations. Each Fund’s total expenses were also compared with those of its Expense Group. The Trustees also considered fees paid to Delaware Investments for nonmanagement services. At the September 3, 2009 meeting, DMC advised the Board that the more recent comparative expenses for the Funds remained consistent with the previous review in May 2009 and, consequently, the Trustees concluded that expenses of the Funds were satisfactory.
The Board also considered the Expense Agreement under negotiation in evaluating Fund expenses. The Trustees expected that the Expense Agreement would provide that LNC and Macquarie Group would pay or reimburse the Trusts for all reasonable out-of-pocket costs and expenses in connection with the Transaction and the consideration of the New Investment Advisory Agreements (subject to certain limited exceptions).
Based on information provided by DMC and Macquarie Group, the Board concluded that neither the Transaction nor the New Investment Advisory Agreements likely would have an adverse effect on the Funds’ expenses because (i) each Fund’s contractual fee rates under the New Investment Advisory Agreement would remain the same; (ii) under the Expense Agreement, the Funds would be reimbursed for all reasonable out-of-pocket costs and expenses in connection with the Transaction and the related proxy solicitation (subject to certain limited exceptions); and (iii) the expense ratios of certain Funds might decline as a result of the possible increased investment in Delaware Investments by Macquarie Group, as discussed below under “Economies of Scale.”
Management Profitability. At their meeting on September 3, 2009, the Board evaluated DMC’s profitability in connection with the operation of the Funds. The Board had previously considered DMC’s profitability in connection with the operation of the Funds at its May 2009 meeting. At that meeting, the Board reviewed an analysis that addressed the overall profitability of Delaware Investments’ business in providing management and other services to each of the Funds and the Delaware Investments Family of Funds as a whole. Specific attention was given to the methodology followed in allocating costs for the purpose of determining profitability.
43
Other Fund information
(Unaudited)
Delaware Value® Fund
Board Consideration of New Investment Advisory Agreement (continued)
At the May 2009 meeting, representatives of DMC had stated that the level of profits of DMC, to a certain extent, reflect operational cost savings and efficiencies initiated by Delaware Investments (including DMC and its affiliates that provide services to the Funds). The Board considered Delaware Investments’ efforts to improve services provided to Fund shareholders and to meet additional regulatory and compliance requirements resulting from recent industry-wide U.S. Securities and Exchange Commission initiatives. At that meeting, the Board found that the management fees were reasonable in light of the services rendered and the level of profitability of DMC. At the September 3, 2009 meeting, DMC advised the Board that DMC did not expect the Transaction to affect materially the profitability of Delaware Investments compared to the level of profitability considered during the May 2009 review. Moreover, the Trustees reviewed pro forma balance sheets of certain key companies in Delaware Investments as of June 30, 2009 (which were provided by Macquarie Group and DMC in response to the Trustees’ requests) and evaluated the projections of Delaware Investments’ capitalization following the Transaction for purposes of evaluating the financial ability of Delaware Investments to continue to provide the nature, extent, and quality of services as it had under the Current Investment Advisory Agreement.
Based on information provided by DMC and Macquarie Group, the Board concluded that DMC and Delaware Investments would be sufficiently capitalized following the Transaction to continue the same level and quality of services to the Funds under the New Investment Advisory Agreements as was the case under the Current Investment Advisory Agreements. The Board also concluded that Macquarie Group had sufficient financial strength and resources, as well as an ongoing commitment to a global asset management business, to continue investing in Delaware Investments, including DMC, to the extent that Macquarie Group determined it was appropriate. Finally, because services and costs were expected to be substantially the same (and DMC had represented that, correspondingly, profitability would be about the same), under the New Investment Advisory Agreements as under the Current Investment Advisory Agreements, the Trustees concluded that the profitability of Delaware Investments would not result in an inequitable charge on the Funds or their shareholders. Accordingly, the Board concluded that the fees charged under the New Investment Advisory Agreements would be reasonable in light of the services to be provided and the expected profitability of DMC.
Economies of Scale. The Trustees considered whether economies of scale would be realized by Delaware Investments as each Fund’s assets increase and the extent to which any economies of scale would be reflected in the management fees charged. The Trustees took into account DMC’s practice of maintaining the competitive nature of management fees based on its analysis of fees charged by comparable funds. DMC management believed, and the Board agreed, that the Funds were priced with breakpoints and relatively low management fees to reflect potential economies of scale to Fund shareholders.
44
The Board also acknowledged Macquarie Group’s statement that the Transaction would not by itself immediately provide additional economies of scale given Macquarie Group’s limited presence in the U.S. mutual fund market. Nonetheless, the Trustees concluded that additional economies of scale could potentially be achieved in the future if DMC were owned by Macquarie Group as a result of Macquarie Group’s willingness to invest further in Delaware Investments if appropriate opportunities arise. The Board further concluded that potential economies of scale could be achieved as a result of Delaware Investments’ expanded distribution capabilities arising from the Transaction, as well as opportunities that might arise from Macquarie Group’s global asset management business.
Fall-Out Benefits. The Board acknowledged that DMC would continue to benefit from soft dollar arrangements using portfolio brokerage of each Fund that invests in equity securities and that DMC’s profitability would likely be somewhat lower without the benefit of practices with respect to allocating Fund portfolio brokerage for brokerage and research services. The Board also considered that Macquarie Group and Delaware Investments may derive reputational, strategic, and other benefits from their association with the Delaware Investments Family of Funds, including service relationships with DMC, DSC, and Delaware Distributors, L.P., and evaluated the extent to which Delaware Investments might derive ancillary benefits from Fund operations, including the potential for procuring additional business as a result of the prestige and visibility associated with its role as service provider to the Delaware Investments Family of Funds and the benefits from allocation of Fund brokerage to improve trading efficiencies. However, the Board concluded that (i) any such benefits under the New Investment Advisory Agreements would not be dissimilar from those existing under the Current Investment Advisory Agreements; (ii) such benefits did not impose a cost or burden on the Funds or their shareholders; and (iii) such benefits would probably have an indirectly beneficial effect on the Funds and their shareholders because of the added importance that DMC and Macquarie Group might attach to the Funds as a result of the fall-out benefits that the Funds conveyed.
Board Review of Macquarie Group. The Trustees reviewed detailed information supplied by Macquarie Group about its operations as well as other information regarding Macquarie Group provided by independent legal counsel to the independent Trustees. Based on this review, the Trustees concluded that Delaware Investments would continue to have the financial ability to maintain the high quality of services required by the Funds. The Trustees noted that there would be a limited transition period during which some services previously provided by LNC to Delaware Investments would continue to be provided by LNC after the Closing, and concluded that this arrangement would help minimize disruption in Delaware Investments’ provision of services to the Funds following the Transaction.
45
Other Fund information
(Unaudited)
Delaware Value® Fund
Board Consideration of New Investment Advisory Agreement (continued)
The Board considered Macquarie Group’s support for Delaware Investments’ plans for Fund distribution by transferring wholesalers from Lincoln Financial Distributors, Inc., LNC’s retail distributor, to Delaware Investments, and Macquarie Group’s current intention to leave the Funds’ other service providers in place. The Board also considered Macquarie Group’s current strategic plans to increase its asset management activities, one of its core businesses, particularly in North America, and its statement that its acquisition of DMC is an important component of this strategic growth and the establishment of a significant presence in the United States. Based in part on the information provided by DMC and Macquarie Group, the Board concluded that Macquarie Group’s acquisition of Delaware Investments could potentially enhance the nature, quality, and extent of services provided to the Funds and their shareholders.
Conclusion. The Board concluded that the advisory fee rate under each New Investment Advisory Agreement was reasonable in relation to the services provided and that execution of the New Investment Advisory Agreement would be in the best interests of the shareholders. For each Fund, the Trustees noted that they had concluded in their most recent advisory agreement continuance considerations in May 2009 that the management fees and total expense ratios were at acceptable levels in light of the quality of services provided to the Funds and in comparison to those of the Funds’ respective peer groups; that the advisory fee schedule would not be increased and would stay the same for all of the Funds; that the total expense ratio had not changed materially since that determination; and that DMC had represented that the overall expenses for each Fund were not expected to be adversely affected by the Transaction. The Trustees also noted, with respect to the Funds that currently had the benefit of voluntary fee limitations, that Macquarie Group had no present intention to cause DMC to alter any voluntary expense limitations or reimbursements currently in effect. On that basis, the Trustees concluded that the total expense ratios and proposed advisory fees for the Funds anticipated to result from the Transaction were acceptable. In approving each New Investment Advisory Agreement, the Board stated that it anticipated reviewing the continuance of the New Investment Advisory Agreement in advance of the expiration of the initial two-year period.
46
Board of trustees/directors and officers addendum
Delaware Investments® Family of Funds
A mutual fund is governed by a Board of Trustees/Directors (“Trustees”), which has oversight responsibility for the management of a fund’s business affairs. Trustees establish procedures and oversee and review the performance of the investment manager, the distributor, and others who perform services for the fund. The independent fund trustees, in particular, are advocates
| Name, Address, | | Position(s) | | Length of |
| and Birth Date | | Held with Fund(s) | | Time Served |
| Interested Trustees | | | | |
| |
| Patrick P. Coyne1 | | Chairman, President, | | Chairman and Trustee |
| 2005 Market Street | | Chief Executive Officer, | | since August 16, 2006 |
| Philadelphia, PA 19103 | | and Trustee | | |
| April 1963 | | | | President and |
| | | | Chief Executive Officer |
| | | | since August 1, 2006 |
| | | | |
| Independent Trustees | | | | |
| |
| Thomas L. Bennett | | Trustee | | Since March 2005 |
| 2005 Market Street | | | | |
| Philadelphia, PA 19103 | | | | |
| October 1947 | | | | |
| |
| |
|
| John A. Fry | | Trustee | | Since January 2001 |
| 2005 Market Street | | | | |
| Philadelphia, PA 19103 | | | | |
| May 1960 | | | | |
| |
| |
| |
| |
| Anthony D. Knerr | | Trustee | | Since April 1990 |
| 2005 Market Street | | | | |
| Philadelphia, PA 19103 | | | | |
| December 1938 | | | | |
| |
| |
| Lucinda S. Landreth | | Trustee | | Since March 2005 |
| 2005 Market Street | | | | |
| Philadelphia, PA 19103 | | | | |
| June 1947 | | | | |
| | | | |
1 Patrick P. Coyne is considered to be an “Interested Trustee” because he is an executive officer of the Fund’s(s’) investment advisor.
48
for shareholder interests. Each trustee has served in that capacity since he or she was elected to or appointed to the Board of Trustees, and will continue to serve until his or her retirement or the election of a new trustee in his or her place. The following is a list of the Trustees and Officers with certain background and related information.
| | Number of Portfolios in | | |
| Principal Occupation(s) | | Fund Complex Overseen | | Other Directorships |
| During Past 5 Years | | by Trustee or Officer | | Held by Trustee or Officer |
| |
| |
| Patrick P. Coyne has served in | | 80 | | Director |
| various executive capacities | | | | Kaydon Corp. |
| at different times at | | | | |
| Delaware Investments.2 | | | | |
| |
| |
| |
| |
| | | | | |
| Private Investor | | 80 | | Director |
| (March 2004–Present) | | | | Bryn Mawr Bank Corp. (BMTC) |
| | | | | (April 2007–Present) |
| Investment Manager | | | | |
| Morgan Stanley & Co. | | | | |
| (January 1984–March 2004) | | | | |
| |
| President | | 80 | | Director |
| Franklin & Marshall College | | | | Community Health Systems |
| (June 2002–Present) | | | | |
| |
| Executive Vice President | | | | |
| University of Pennsylvania | | | | |
| (April 1995–June 2002) | | | | |
| |
| Founder and | | 80 | | None |
| Managing Director | | | | |
| Anthony Knerr & Associates | | | | |
| (Strategic Consulting) | | | | |
| (1990–Present) | | | | |
| |
| Chief Investment Officer | | 80 | | None |
| Assurant, Inc. (Insurance) | | | | |
| (2002–2004) | | | | |
| | | | | |
2 Delaware Investments is the marketing name for Delaware Management Holdings, Inc. and its subsidiaries, including the Fund’s(s’) investment advisor, principal underwriter, and its transfer agent.
49
Board of trustees/directors and officers addendum
Delaware Investments® Family of Funds
| Name, Address, | Position(s) | Length of |
| and Birth Date | Held with Fund(s) | Time Served |
| Independent Trustees (continued) | | |
| |
| Ann R. Leven | Trustee | Since October 1989 |
| 2005 Market Street | | |
| Philadelphia, PA 19103 | | |
| November 1940 | | |
| |
| Thomas F. Madison | Trustee | Since May 19973 |
| 2005 Market Street | | |
| Philadelphia, PA 19103 | | |
| February 1936 | | |
| | |
3 In 1997, several funds managed by Voyageur Fund Managers, Inc. (the “Voyageur Funds”) were incorporated into the Delaware Investments Family of Funds. Mr. Madison served as a director of the Voyageur Funds from 1993 until 1997.
50
| | Number of Portfolios in | | |
| Principal Occupation(s) | | Fund Complex Overseen | | Other Directorships |
| During Past 5 Years | | by Trustee or Officer | | Held by Trustee or Officer |
| |
| |
| Consultant | | 80 | | None |
| ARL Associates | | | | |
| (Financial Planning) | | | | |
| (1983–Present) | | | | |
| |
| President and | | 80 | | Director and Chair of |
| Chief Executive Officer | | | | Compensation Committee, |
| MLM Partners, Inc. | | | | Governance Committee |
| (Small Business Investing | | | | Member |
| and Consulting) | | | | CenterPoint Energy |
| (January 1993–Present) | | | | |
| | | | Lead Director and Chair of |
| | | | Audit and Governance |
| | | | Committees, Member of |
| | | | Compensation Committee |
| | | | Digital River, Inc. |
| |
| | | | Director and Chair of |
| | | | Governance Committee, |
| | | | Audit Committee |
| | | | Member |
| | | | Rimage Corporation |
| |
| | | | Director and Chair of |
| | | | Compensation Committee |
| | | | Spanlink Communications |
| |
| | | | Lead Director and Member of |
| | | | Compensation and |
| | | | Governance Committees |
| | | | Valmont Industries, Inc. |
| | | | |
51
Board of trustees/directors and officers addendum
Delaware Investments® Family of Funds
| Name, Address, | Position(s) | Length of |
| and Birth Date | Held with Fund(s) | Time Served |
| Independent Trustees (continued) | | |
| |
| Janet L. Yeomans | Trustee | Since April 1999 |
| 2005 Market Street | | |
| Philadelphia, PA 19103 | | |
| July 1948 | | |
| |
| |
| |
| |
| J. Richard Zecher | Trustee | Since March 2005 |
| 2005 Market Street | | |
| Philadelphia, PA 19103 | | |
| July 1940 | | |
| | | |
| |
| |
| |
| |
| Officers | | |
| |
| David F. Connor | Vice President, | Vice President since |
| 2005 Market Street | Deputy General | September 2000 |
| Philadelphia, PA 19103 | Counsel, and Secretary | and Secretary since |
| December 1963 | | October 2005 |
| |
| |
| Daniel V. Geatens | Vice President | Treasurer |
| 2005 Market Street | and Treasurer | since October 25, 2007 |
| Philadelphia, PA 19103 | | |
| October 1972 | | |
| |
| David P. O’Connor | Senior Vice President, | Senior Vice President, |
| 2005 Market Street | General Counsel, | General Counsel, and |
| Philadelphia, PA 19103 | and Chief Legal Officer | Chief Legal Officer |
| February 1966 | | since October 2005 |
| |
| Richard Salus | Senior Vice President | Chief Financial Officer |
| 2005 Market Street | and Chief Financial Officer | since November 2006 |
| Philadelphia, PA 19103 | | |
| October 1963 | | |
| | | |
4 David F. Connor, Daniel V. Geatens, David P. O’Connor, and Richard Salus serve in similar capacities for the six portfolios of the Optimum Fund Trust, which have the same investment advisor, principal underwriter, and transfer agent as the registrant.
52
| | Number of Portfolios in | | |
| Principal Occupation(s) | | Fund Complex Overseen | | Other Directorships |
| During Past 5 Years | | by Trustee or Officer | | Held by Trustee or Officer |
| |
| |
| Vice President and Treasurer | | 80 | | None |
| (January 2006–Present) | | | | |
| Vice President — Mergers & Acquisitions | | | | |
| (January 2003–January 2006), and | | | | |
| Vice President | | | | |
| (July 1995–January 2003) | | | | |
| 3M Corporation | | | | |
| |
| Founder | | 80 | | Director and Audit |
| Investor Analytics | | | | Committee Member |
| (Risk Management) | | | | Investor Analytics |
| (May 1999–Present) | | | | |
| |
| Founder | | | | |
| Sutton Asset Management | | | | |
| (Hedge Fund) | | | | |
| (September 1996–Present) | | | | |
| | | | | |
| |
| |
| David F. Connor has served as | | 80 | | None4 |
| Vice President and Deputy | | | | |
| General Counsel of | | | | |
| Delaware Investments | | | | |
| since 2000. | | | | |
| |
| Daniel V. Geatens has served | | 80 | | None4 |
| in various capacities at | | | | |
| different times at | | | | |
| Delaware Investments. | | | | |
| |
| David P. O’Connor has served in | | 80 | | None4 |
| various executive and legal | | | | |
| capacities at different times | | | | |
| at Delaware Investments. | | | | |
| |
| Richard Salus has served in | | 80 | | None4 |
| various executive capacities | | | | |
| at different times at | | | | |
| Delaware Investments. | | | | |
| | | | | |
The Statement of Additional Information for the Fund(s) includes additional information about the Trustees and Officers and is available, without charge, upon request by calling 800 523-1918.
53
About the organization
| Board of trustees | | | | | | |
| | | | | | | |
Patrick P. Coyne
Chairman, President, and
Chief Executive Officer
Delaware Investments®
Family of Funds
Philadelphia, PA
Thomas L. Bennett
Private Investor
Rosemont, PA John A. Fry
President
Franklin & Marshall
College
Lancaster, PA | | Anthony D. Knerr
Founder and Managing
Director
Anthony Knerr &
Associates
New York, NY Lucinda S. Landreth
Former Chief Investment
Officer
Assurant, Inc.
Philadelphia, PA | | Ann R. Leven
Consultant
ARL Associates
New York, NY Thomas F. Madison
President and
Chief Executive Officer
MLM Partners, Inc.
Minneapolis, MN | | Janet L. Yeomans
Vice President and
Treasurer
3M Corporation
St. Paul, MN J. Richard Zecher
Founder
Investor Analytics
Scottsdale, AZ |
| | | | | | | |
| Affiliated officers | | | | | | |
| | | | | | | |
David F. Connor
Vice President, Deputy
General Counsel, and
Secretary
Delaware Investments
Family of Funds
Philadelphia, PA | | Daniel V. Geatens
Vice President and
Treasurer
Delaware Investments
Family of Funds
Philadelphia, PA | | David P. O’Connor
Senior Vice President,
General Counsel,
and Chief Legal Officer
Delaware Investments
Family of Funds
Philadelphia, PA | | Richard Salus
Senior Vice President and
Chief Financial Officer
Delaware Investments
Family of Funds
Philadelphia, PA |
| | | | | | | |
This annual report is for the information of Delaware Value® Fund shareholders, but it may be used with prospective investors when preceded or accompanied by a current prospectus for Delaware Value Fund and the Delaware Investments Fund profile for the most recently completed calendar quarter. These documents are available at www.delawareinvestments.com. The prospectus sets forth details about charges, expenses, investment objectives, and operating policies of the investment company. You should read the prospectus carefully before you invest. The figures in this report represent past results that are not a guarantee of future results. The return and principal value of an investment in the investment company will fluctuate so that shares, when redeemed, may be worth more or less than their original cost. |
Delaware Investments is the marketing name of Delaware Management Holdings, Inc. and its subsidiaries. The Fund files its complete schedule of portfolio holdings with the Securities and Exchange Commission for the first and third quarters of each fiscal year on Form N-Q. The Fund’s Forms N-Q, as well as a description of the policies and procedures that the Fund uses to determine how to vote proxies (if any) relating to portfolio securities are available without charge (i) upon request, by calling 800 523-1918; and (ii) on the Commission’s Web site at www.sec.gov. In addition, a description of the policies and procedures that the Fund uses to determine how to vote proxies (if any) relating to portfolio securities and the Fund’s Schedule of Investments are available without charge on the Fund’s Web site at www.delawareinvestments.com. The Fund’s Forms N-Q may be reviewed and copied at the Commission’s Public Reference Room in Washington, D.C.; information on the operation of the Public Reference Room may be obtained by calling 800 SEC-0330. Information (if any) regarding how the Fund voted proxies relating to portfolio securities during the most recently disclosed 12-month period ended June 30 is available without charge (i) through the Fund’s Web site at www.delawareinvestments.com; and (ii) on the Commission’s Web site at www.sec.gov. |
54
Item 2. Code of Ethics
The registrant has adopted a code of ethics that applies to the registrant’s principal executive officer, principal financial officer, principal accounting officer or controller, or persons performing similar functions, regardless of whether these individuals are employed by the registrant or a third party. A copy of the registrant’s Code of Business Ethics has been posted on the Delaware Investments Internet Web site at www.delawareinvestments.com. Any amendments to the Code of Business Ethics, and information on any waiver from its provisions granted by the registrant, will also be posted on this Web site within five business days of such amendment or waiver and will remain on the Web site for at least 12 months.
Item 3. Audit Committee Financial Expert
The registrant’s Board of Trustees/Directors has determined that each member of the registrant’s Audit Committee is an audit committee financial expert, as defined below. For purposes of this item, an “audit committee financial expert” is a person who has the following attributes:
a. An understanding of generally accepted accounting principles and financial statements;
b. The ability to assess the general application of such principles in connection with the accounting for estimates, accruals, and reserves;
c. Experience preparing, auditing, analyzing, or evaluating financial statements that present a breadth and level of complexity of accounting issues that are generally comparable to the breadth and complexity of issues that can reasonably be expected to be raised by the registrant’s financial statements, or experience actively supervising one or more persons engaged in such activities;
d. An understanding of internal controls and procedures for financial reporting; and
e. An understanding of audit committee functions.
An “audit committee financial expert” shall have acquired such attributes through:
a. Education and experience as a principal financial officer, principal accounting officer, controller, public accountant, or auditor or experience in one or more positions that involve the performance of similar functions;
b. Experience actively supervising a principal financial officer, principal accounting officer, controller, public accountant, auditor, or person performing similar functions;
c. Experience overseeing or assessing the performance of companies or public accountants with respect to the preparation, auditing, or evaluation of financial statements; or
d. Other relevant experience.
The registrant’s Board of Trustees/Directors has also determined that each member of the registrant’s Audit Committee is independent. In order to be “independent” for purposes of this item, the Audit Committee member may not: (i) other than in his or her capacity as a member of the Board of Trustees/Directors or any committee thereof, accept directly or indirectly any consulting, advisory or other compensatory fee from the issuer; or (ii) be an “interested person” of the registrant as defined in Section 2(a)(19) of the Investment Company Act of 1940.
The names of the audit committee financial experts on the registrant’s Audit Committee are set forth below:
Thomas L. Bennett 1
John A. Fry
Thomas F. Madison
J. Richard Zecher
Item 4. Principal Accountant Fees and Services
(a) Audit fees.
The aggregate fees billed for services provided to the registrant by its independent auditors for the audit of the registrant’s annual financial statements and for services normally provided by the independent auditors in connection with statutory and regulatory filings or engagements were $61,976 for the fiscal year ended November 30, 2009.
____________________
1 The instructions to Form N-CSR require disclosure on the relevant experience of persons who qualify as audit committee financial experts based on “other relevant experience.” The Board of Trustees/Directors has determined that Mr. Bennett qualifies as an audit committee financial expert by virtue of his education, Chartered Financial Analyst designation, and his experience as a credit analyst, portfolio manager and the manager of other credit analysts and portfolio managers.
The aggregate fees billed for services provided to the registrant by its independent auditors for the audit of the registrant’s annual financial statements and for services normally provided by the independent auditors in connection with statutory and regulatory filings or engagements were $91,800 for the fiscal year ended November 30, 2009.
(b) Audit-related fees.
The aggregate fees billed by the registrant’s independent auditors for services relating to the performance of the audit of the registrant’s financial statements and not reported under paragraph (a) of this Item were $0 for the fiscal year ended November 30, 2009.
The aggregate fees billed by the registrant’s independent auditors for services relating to the performance of the audit of the financial statements of the registrant’s investment adviser and other service providers under common control with the adviser and that relate directly to the operations or financial reporting of the registrant were $19,074 for the registrant’s fiscal year ended November 30, 2009. The percentage of these fees relating to services approved by the registrant’s Audit Committee pursuant to the de minimis exception from the pre-approval requirement in Rule 2-01(c)(7)(i)(C) of Regulation S-X was 0%. These audit-related services were as follows: issuance of report concerning transfer agent's system of internal accounting control pursuant to Rule 17Ad-13 of the Securities Exchange Act.
The aggregate fees billed by the registrant’s independent auditors for services relating to the performance of the audit of the registrant’s financial statements and not reported under paragraph (a) of this Item were $0 for the fiscal year ended November 30, 2008.
The aggregate fees billed by the registrant’s independent auditors for services relating to the performance of the audit of the financial statements of the registrant’s investment adviser and other service providers under common control with the adviser and that relate directly to the operations or financial reporting of the registrant were $19,074 for the registrant’s fiscal year ended November 30, 2008. The percentage of these fees relating to services approved by the registrant’s Audit Committee pursuant to the de minimis exception from the pre-approval requirement in Rule 2-01(c)(7)(i)(C) of Regulation S-X was 0%. These audit-related services were as follows: issuance of report concerning transfer agent's system of internal accounting control pursuant to Rule 17Ad-13 of the Securities Exchange Act.
(c) Tax fees.
The aggregate fees billed by the registrant’s independent auditors for tax-related services provided to the registrant were $23,500 for the fiscal year ended November 30, 2009. The percentage of these fees relating to services approved by the registrant’s Audit Committee pursuant to the de minimis exception from the pre-approval requirement in Rule 2-01(c)(7)(i)(C) of Regulation S-X was 0%. These tax-related services were as follows: Review of income tax returns/review of annual excise distribution calculations.
The aggregate fees billed by the registrant’s independent auditors for tax-related services provided to the registrant’s investment adviser and other service providers under common control with the adviser and that relate directly to the operations or financial reporting of the registrant were $0 for the registrant’s fiscal year ended November 30, 2009.
The aggregate fees billed by the registrant’s independent auditors for tax-related services provided to the registrant were $34,300 for the fiscal year ended November 30, 2008. The percentage of these fees relating to services approved by the registrant’s Audit Committee pursuant to the de minimis exception from the pre-approval requirement in Rule 2-01(c)(7)(i)(C) of Regulation S-X was 0%. These tax-related services were as follows: Review of income tax returns/review of annual excise distribution calculations.
The aggregate fees billed by the registrant’s independent auditors for tax-related services provided to the registrant’s adviser and other service providers under common control with the adviser and that relate directly to the operations or financial reporting of the registrant were $0 for the registrant’s fiscal year ended November 30, 2008.
(d) All other fees.
The aggregate fees billed for all services provided by the independent auditors to the registrant other than those set forth in paragraphs (a), (b) and (c) of this Item were $0 for the fiscal year ended November 30, 2009.
The aggregate fees billed for all services other than those set forth in paragraphs (b) and (c) of this Item provided by the registrant’s independent auditors to the registrant’s adviser and other service providers under common control with the adviser and that relate directly to the operations or financial reporting of the registrant were $0 for the registrant’s fiscal year ended November 30, 2009.
The aggregate fees billed for all services provided by the independent auditors to the registrant other than those set forth in paragraphs (a), (b) and (c) of this Item were $0 for the fiscal year ended November 30, 2008.
The aggregate fees billed for all services other than those set forth in paragraphs (b) and (c) of this Item provided by the registrant’s independent auditors to the registrant’s adviser and other service providers under common control with the adviser and that relate directly to the operations or financial reporting of the registrant were $0 for the registrant’s fiscal year ended November 30, 2008.
(e) The registrant’s Audit Committee has established pre-approval policies and procedures as permitted by Rule 2-01(c)(7)(i)(B) of Regulation S-X (the “Pre-Approval Policy”) with respect to services provided by the registrant’s independent auditors. Pursuant to the Pre-Approval Policy, the Audit Committee has pre-approved the services set forth in the table below with respect to the registrant up to the specified fee limits. Certain fee limits are based on aggregate fees to the registrant and other registrants within the Delaware Investments Family of Funds.
| Service | Range of Fees |
| Audit Services | |
| Statutory audits or financial audits for new Funds | up to $25,000 per Fund |
| Services associated with SEC registration statements (e.g., Form N-1A, Form N-14, etc.), periodic reports and other documents filed with the SEC or other documents issued in connection with securities offerings (e.g., comfort letters for closed-end Fund offerings, consents), and assistance in responding to SEC comment letters | up to $10,000 per Fund |
| Consultations by Fund management as to the accounting or disclosure treatment of transactions or events and/or the actual or potential impact of final or proposed rules, standards or interpretations by the SEC, FASB, or other regulatory or standard-setting bodies (Note: Under SEC rules, some consultations may be considered “audit-related services” rather than “audit services”) | up to $25,000 in the aggregate |
| Audit-Related Services | |
| Consultations by Fund management as to the accounting or disclosure treatment of transactions or events and/or the actual or potential impact of final or proposed rules, standards or interpretations by the SEC, FASB, or other regulatory or standard-setting bodies (Note: Under SEC rules, some consultations may be considered “audit services” rather than “audit-related services”) | up to $25,000 in the aggregate |
| Tax Services | |
| U.S. federal, state and local and international tax planning and advice (e.g., consulting on statutory, regulatory or administrative developments, evaluation of Funds’ tax compliance function, etc.) | up to $25,000 in the aggregate |
| U.S. federal, state and local tax compliance (e.g., excise distribution reviews, etc.) | up to $5,000 per Fund |
| Review of federal, state, local and international income, franchise and other tax returns | up to $5,000 per Fund |
Under the Pre-Approval Policy, the Audit Committee has also pre-approved the services set forth in the table below with respect to the registrant’s investment adviser and other entities controlling, controlled by or under common control with the investment adviser that provide ongoing services to the registrant (the “Control Affiliates”) up to the specified fee limit. This fee limit is based on aggregate fees to the investment adviser and its Control Affiliates.
| Service | Range of Fees |
| Non-Audit Services | |
| Services associated with periodic reports and other documents filed with the SEC and assistance in responding to SEC comment letters | up to $10,000 in the aggregate |
The Pre-Approval Policy requires the registrant’s independent auditors to report to the Audit Committee at each of its regular meetings regarding all services initiated since the last such report was rendered, including those services authorized by the Pre-Approval Policy.
(f) Not applicable.
(g) The aggregate non-audit fees billed by the registrant’s independent auditors for services rendered to the registrant and to its investment adviser and other service providers under common control with the adviser were $223,214 and $288,302 for the registrant’s fiscal years ended November 30, 2009 and November 30, 2008, respectively.
(h) In connection with its selection of the independent auditors, the registrant’s Audit Committee has considered the independent auditors’ provision of non-audit services to the registrant’s investment adviser and other service providers under common control with the adviser that were not required to be pre-approved pursuant to Rule 2-01(c)(7)(ii) of Regulation S-X. The Audit Committee has determined that the independent auditors’ provision of these services is compatible with maintaining the auditors’ independence.
Item 5. Audit Committee of Listed Registrants
Not applicable.
Item 6. Investments
(a) Included as part of report to shareholders filed under Item 1 of this Form N-CSR.
(b) Divestment of securities in accordance with Section 13(c) of the Investment Company Act of 1940.
Not applicable.
Item 7. Disclosure of Proxy Voting Policies and Procedures for Closed-End Management Investment Companies
Not applicable.
Item 8. Portfolio Managers of Closed-End Management Investment Companies
Not applicable.
Item 9. Purchases of Equity Securities by Closed-End Management Investment Company and Affiliated Purchasers
Not applicable.
Item 10. Submission of Matters to a Vote of Security Holders
Not applicable.
Item 11. Controls and Procedures
The registrant’s principal executive officer and principal financial officer have evaluated the registrant’s disclosure controls and procedures within 90 days of the filing of this report and have concluded that they are effective in providing reasonable assurance that the information required to be disclosed by the registrant in its reports or statements filed under the Securities Exchange Act of 1934 is recorded, processed, summarized and reported within the time periods specified in the rules and forms of the Securities and Exchange Commission.
There were no significant changes in the registrant’s internal control over financial reporting that occurred during the second fiscal quarter of the period covered by the report to stockholders included herein (i.e., the registrant’s fourth fiscal quarter) that have materially affected, or are reasonably likely to materially affect, the registrant’s internal control over financial reporting.
Item 12. Exhibits
| (a) | | (1) | Code of Ethics |
| | | |
| | | Not applicable. |
| | | |
| | (2) | Certifications of Principal Executive Officer and Principal Financial Officer pursuant to Rule 30a-2 under the Investment Company Act of 1940 are attached hereto as Exhibit 99.CERT. |
| | | |
| | (3) | Written solicitations to purchase securities pursuant to Rule 23c-1 under the Securities Exchange Act of 1934. |
| | | |
| | | Not applicable. |
| | | |
| (b) | | | Certifications pursuant to Section 906 of the Sarbanes-Oxley Act of 2002 are furnished herewith as Exhibit 99.906CERT. |
SIGNATURES
Pursuant to the requirements of the Securities Exchange Act of 1934 and the Investment Company Act of 1940, the registrant has duly caused this report to be signed on its behalf, by the undersigned, thereunto duly authorized.
| Name of Registrant: |
| |
| PATRICK P. COYNE |
| By: | Patrick P. Coyne |
| Title: | Chief Executive Officer |
| Date: | February 5, 2010 |
Pursuant to the requirements of the Securities Exchange Act of 1934 and the Investment Company Act of 1940, this report has been signed below by the following persons on behalf of the registrant and in the capacities and on the dates indicated.
| PATRICK P. COYNE |
| By: | Patrick P. Coyne |
| Title: | Chief Executive Officer |
| Date: | February 5, 2010 |
| |
| |
| RICHARD SALUS |
| By: | Richard Salus |
| Title: | Chief Financial Officer |
| Date: | February 5, 2010 |