UNITED STATES SECURITIES AND EXCHANGE COMMISSION
Washington, D.C. 20549
FORM N-CSR
CERTIFIED SHAREHOLDER REPORT OF REGISTERED MANAGEMENT
INVESTMENT COMPANIES
Investment Company Act file number: 811-00750
Exact name of registrant as specified in charter: Delaware Group Equity Funds II
Address of principal executive offices:
2005 Market Street
Philadelphia, PA 19103
Name and address of agent for service:
David F. Connor, Esq.
2005 Market Street
Philadelphia, PA 19103
Registrant’s telephone number, including area code: (800) 523-1918
Date of fiscal year end: November 30
Date of reporting period: November 30, 2010
Item 1. Reports to Stockholders

Annual report Delaware Value® Fund
November 30, 2010 Value equity mutual fund |
This annual report is for the information of Delaware Value Fund shareholders, but it may be used with prospective investors when preceded or accompanied by a current prospectus for Delaware Value Fund. The figures in the annual report for Delaware Value Fund represent past results, which are not a guarantee of future results. The return and principal value of an investment in the Fund will fluctuate so that shares, when redeemed, may be worth more or less than their original cost. Current performance may be higher or lower than the performance data quoted.
You should consider the investment objectives, risks, charges, and expenses of the Fund carefully before investing. The Delaware Value Fund prospectus contains this and other important information about the Fund. Prospectuses for all open-end funds in the Delaware Investments® Family of Funds are available from your financial advisor, online at www.delawareinvestments.com, or by phone at 800 523-1918. Please read the prospectus carefully before you invest or send money.
|
You can obtain shareholder reports and prospectuses online instead of in the mail.
Visit www.delawareinvestments.com/edelivery. |
Experience Delaware Investments
Delaware Investments is committed to the pursuit of consistently superior asset management and unparalleled client service. We believe in our investment processes, which seek to deliver consistent results, and in convenient services that help add value for our clients.
If you are interested in learning more about creating an investment plan, contact your financial advisor.
You can learn more about Delaware Investments or obtain a prospectus for Delaware Value® Fund at www.delawareinvestments.com.
Manage your investments online
- 24-hour access to your account information
- Obtain share prices
- Check your account balance and recent transactions
- Request statements or literature
- Make purchases and redemptions
Delaware Management Holdings, Inc., and its subsidiaries (collectively known by the marketing name of Delaware Investments) are wholly owned subsidiaries of Macquarie Group Limited, a global provider of banking, financial, advisory, investment and funds management services.
Investments in Delaware Value Fund are not and will not be deposits with or liabilities of Macquarie Bank Limited ABN 46 008 583 542 and its holding companies, including their subsidiaries or related companies (Macquarie Group), and are subject to investment risk, including possible delays in repayment and loss of income and capital invested. No Macquarie Group company guarantees or will guarantee the performance of the Fund, the repayment of capital from the Fund, or any particular rate of return.
Table of contents
| Portfolio management review | 1 |
| Performance summary | 4 |
| Disclosure of Fund expenses | 8 |
| Sector allocation and top 10 holdings | 10 |
| Statement of net assets | 11 |
| Statement of operations | 15 |
| Statements of changes in net assets | 16 |
| Financial highlights | 18 |
| Notes to financial statements | 28 |
| Report of independent registered | |
| public accounting firm | 38 |
| Other Fund information | 39 |
| Board of trustees/directors and | |
| officers addendum | 40 |
| About the organization | 50 |
Unless otherwise noted, views expressed herein are current as of Nov. 30, 2010, and are subject to change.
Funds are not FDIC insured and are not guaranteed. It is possible to lose the principal amount invested.
Mutual fund advisory services provided by Delaware Management Company, a series of Delaware Management Business Trust, which is a registered investment advisor. Delaware Investments, a member of Macquarie Group, refers to Delaware Management Holdings, Inc. and its subsidiaries, including the Fund’s distributor, Delaware Distributors, L.P. Macquarie Group refers to Macquarie Group Limited and its subsidiaries and affiliates worldwide.
© 2011 Delaware Management Holdings, Inc.
All third-party trademarks cited are the property of their respective owners.
| Portfolio management review | |
| Delaware Value® Fund | December 7, 2010 |
| Performance preview (for the year ended November 30, 2010) |
| Delaware Value Fund (Class A shares) | | 1-year return | | +10.16% |
| Russell 1000® Value Index (benchmark) | | 1-year return | | +8.95% |
Past performance does not guarantee future results.
For complete, annualized performance for Delaware Value Fund, please see the table on page 4.
The performance of Class A shares excludes the applicable sales charge and reflects the reinvestment of all distributions.
Index performance returns do not reflect any management fees, transaction costs, or expenses. Indices are unmanaged and one cannot invest directly in an index.
For its fiscal year ended Nov. 30, 2010, Delaware Value Fund (Class A shares) returned +10.16% at net asset value, and +3.77% at maximum offer price (both returns assume reinvestment of all distributions). In comparison, the Fund’s benchmark, the Russell 1000 Value Index, returned +8.95% during the same time period. Complete annualized performance for Delaware Value Fund is shown in the table on page 4.
Although U.S. stock prices finished the fiscal year on an upswing and achieved solid gains overall, these results masked the stock market’s fluctuating performance during that time span.
As the Fund’s fiscal year began, many equity investors remained optimistic about the U.S. economic recovery. Stock prices, which began a long rally back in March 2009, continued to climb through late April 2010 when investor sentiment abruptly reversed course due to several factors, including:
- Worries about the financial health of certain European governments, especially Greece
- The uncertain economic effects of the Gulf of Mexico oil spill
- New economic data showing a more vulnerable U.S. economy
We continued to adhere to our bottom-up stock selection process during the Fund’s fiscal year, meaning we chose to invest in stocks one at a time, based on our assessment of their individual characteristics. We continued favoring stocks that, in our view, had consistent earnings and relatively healthy balance sheets — the types of stocks that, since the market’s April 2010 peak, have generally enjoyed better performance than their lower-quality counterparts.
1
Portfolio management review
Delaware Value® Fund
Against this backdrop, stocks turned in sluggish results through the rest of the spring and summer of 2010. However, a strong rebound in early fall propelled equity values upward during the last three months of the fiscal year.
In this environment, the Fund enjoyed good results in absolute terms, as well as relative to its benchmark, the Russell 1000 Value Index. From a sector perspective, the most notable source of outperformance came from strategic allocations within the energy and financials sectors. Among energy stocks, the Fund was helped by having less exposure than the benchmark early in the fiscal year, while a few well-chosen energy stocks actually boosted returns. In financials, the main source of the Fund’s outperformance compared with the benchmark index was the Fund’s significant underweighting in this group. The sector generated a positive return of less than 1% within the benchmark index and was one of that index’s weakest-performing sectors during the fiscal year.
One of the top individual contributors to the Fund’s performance was Xerox, a manufacturer of printers and copiers, and a provider of document-oriented and other technology services. We believe the company’s integration with recently acquired Affiliated Computer Services seems to be meeting the market’s expectations, and Xerox recently indicated that demand for its products and services is starting to look better.
Another noteworthy contributor to the Fund’s performance was National Oilwell Varco, a provider of equipment and services for oil and natural gas rigs. The company’s share price rebounded from the large selloff in energy stocks associated with the BP oil spill. It also appears to be benefiting from ongoing global activity in oil and gas exploration.
In contrast, the Fund’s unfavorable positioning in the consumer staples and consumer discretionary sectors was a source of underperformance. In addition to some disappointing stock selection in both groups, the Fund was underweighted in the outperforming consumer discretionary sector.
Two of the Fund’s weakest performers during the Fund’s fiscal year came from the healthcare sector: Quest Diagnostics and Pfizer.
Among Quest’s laboratory testing services is pre-employment testing — a business that slowed down for the company in concert with the decelerating job market. Against this backdrop, Quest forecasted slower-than-anticipated revenues for its 2010 fiscal year. We still have a positive outlook for Quest and therefore continue to hold the stock in the Fund. In our view, the company has strong cash flow and should benefit, over time, if higher testing volumes occur, for example, due to an aging population in the United States.
Pfizer, the large pharmaceutical manufacturer, has been working through its integration with Wyeth, which it acquired last year. Overall, sales results for the company have been mixed and, broadly speaking, investors remain concerned about Pfizer’s upcoming patent expirations and overall growth prospects. We continue to hold the stock in the Fund. The company remains attractive, in our view, because of what we consider its low valuation (inclusive of patent expirations), highly rated balance sheet, and above-average dividend yield.
We continued to adhere to our bottom-up stock selection process during the Fund’s fiscal year, meaning we chose to invest in stocks one at a time, based on our assessment of their individual characteristics.
2
We continued favoring stocks that, in our view, had consistent earnings and relatively healthy balance sheets — the types of stocks that, since the market’s April 2010 peak, have generally enjoyed better performance than their lower-quality counterparts.
While changes to the Fund were relatively modest during the reporting period, we did sell a handful of stocks when we felt they had reached or come close to our target price, and we replaced them with securities that we felt offered significantly better value potential. For example, within the consumer discretionary sector, we sold the Fund’s position in toy manufacturer Mattel because the company had achieved our investment objectives during the course of the past several years. We felt that it now offered more downside risk than upside potential, and we used the proceeds of our sale to add a position in cable television provider Comcast, whose shares we felt were quite inexpensive relative to their long-term performance prospects.
Similarly, we sold the Fund’s stake in food-products business H.J. Heinz, which we originally purchased when the company was seeking to turn around its declining business. As Heinz gradually improved its profit margins and earnings, the stock performed well, leading us to exchange the position for a company we felt offered better long-term value potential: Williams Companies, a natural gas exploration and production firm that we felt was well priced and stood to benefit if long-term trends favoring demand for gas continue.
We also identified what, in our view, was a favorable opportunity within the financial sector. In September 2010, we added a position in Marsh & McLennan Companies, a major insurance brokerage and consulting firm.
Marsh & McLennan had undergone significant turmoil and transformation during the past six years, including three leadership changes. Investor sentiment toward the company has seemed poor due to uncertainty about its business strategy, write-downs incurred from a recent divestiture, and weakness in property and casualty insurance pricing. However, the company seems to have “right-sized” its business, enabling it to better focus on core operations. The Fund’s investment team viewed Marsh & McLennan as an attractive long-term investment for a variety of reasons including its lower level of credit sensitivity relative to other financial companies. The company also had a global platform to help meet the needs of multinational customers, and a diversified revenue base.
We still foresee a prolonged recovery phase as the U.S. economy continues working through the excesses of the credit and housing bubbles. Similarly, our outlook for the stock market is unchanged. At the end of the Fund’s fiscal year, we continued to focus on what we believed were financially secure, attractively valued companies, which we viewed as being well positioned to withstand the potential risks in the shifting economic environment. Accordingly, the Fund’s largest allocations were in healthcare, consumer staples, and energy — sectors where we’ve been able to find attractively valued, financially strong global businesses. In addition, we feel these businesses can fare well under current market conditions. On the other hand, we continue to underweight the consumer discretionary and financial sectors due to our belief that consumer spending will likely remain soft and that credit-sensitive financials may be in f or a sustained period of lower earnings power. We’re also maintaining a below-benchmark weighting in industrials, waiting until we can find what we believe are good businesses trading at lower valuations in this sector.
3
Performance summary
| Delaware Value® Fund | November 30, 2010 |
The performance data quoted represent past performance; past performance does not guarantee future results. Investment return and principal value will fluctuate so your shares, when redeemed, may be worth more or less than their original cost. Please obtain the performance data current for the most recent month end by calling 800 523-1918 or visiting our Web site at www.delawareinvestments.com/performance. Current performance may be lower or higher than the performance data quoted.
Carefully consider the Fund’s investment objectives, risk factors, charges, and expenses before investing. This and other information can be found in the Fund’s prospectus and, if available, its summary prospectus, which may be obtained by visiting www.delawareinvestments.com or calling 800 523-1918. Investors should read the prospectus and, if available, the summary prospectus carefully before investing.
| Fund performance | | Average annual total returns through Nov. 30, 2010 |
| | | 1 year | | 5 years | | 10 years | | Lifetime |
| Class A (Est. Sept. 15, 1998) | | | | | | | | | | | | |
| Excluding sales charge | | | +10.16% | | | | +0.48% | | | +2.55% | | n/a |
| Including sales charge | | | +3.77% | | | | -0.70% | | | +1.94% | | n/a |
| Class B (Est. May 1, 2002) | | | | | | | | | | | | |
| Excluding sales charge | | | +9.16% | | | | -0.30% | | | n/a | | +2.22% |
| Including sales charge | | | +5.16% | | | | -0.69% | | | n/a | | +2.22% |
| Class C (Est. May 1, 2002) | | | | | | | | | | | | |
| Excluding sales charge | | | +9.28% | | | | -0.28% | | | n/a | | +2.14% |
| Including sales charge | | | +8.28% | | | | -0.28% | | | n/a | | +2.14% |
| Class R (Est. Sept. 1, 2005) | | | | | | | | | | | | |
| Excluding sales charge | | | +9.81% | | | | +0.26% | | | n/a | | +0.41% |
| Including sales charge | | | +9.81% | | | | +0.26% | | | n/a | | +0.41% |
| Institutional Class (Est. Sept. 15, 1998) | | | | | | | | | | | | |
| Excluding sales charge | | | +10.39% | | | | +0.72% | | | +2.76% | | n/a |
| Including sales charge | | | +10.39% | | | | +0.72% | | | +2.76% | | n/a |
Returns reflect the reinvestment of all distributions and any applicable sales charges as noted in the following paragraphs.
Performance for Class B and C shares, excluding sales charges, assumes either that contingent deferred sales charges did not apply or that the investment was not redeemed.
Expense limitations were in effect for certain classes during the periods shown in the “Fund performance” chart and in the “Performance of a $10,000 investment” chart. The current expenses for each class are listed on the “Fund expense ratios” chart. (Note that all charts and graphs referred to in the “Performance summary” section of this report are found on pages 4 through 6.) Performance would have been lower had the expense limitations not been in effect.
4
The Fund offers Class A, B, C, R, and Institutional Class shares.
Class A shares are sold with a maximum front-end sales charge of up to 5.75%, and have an annual distribution and service fee of up to 0.30% of average daily net assets. This fee has been contractually limited to 0.25% of average daily net assets from March 30, 2010, through March 30, 2011.
Class B shares may be purchased only through dividend reinvestment and certain permitted exchanges as described in the prospectus. Please see the prospectus for additional information on Class B purchase and sales charges. Class B shares have a contingent deferred sales charge that declines from 4.00% to zero depending on the period of time the shares are held.
Class B shares will automatically convert to Class A shares on a quarterly basis approximately eight years after purchase. They are also subject to an annual distribution and service fee of up to 1.00% of average daily net assets.
Ten-year performance figures for Class B shares reflect conversion to Class A shares after approximately eight years.
Class C shares are sold with a contingent deferred sales charge of 1.00% if redeemed during the first 12 months. They are also subject to an annual distribution and service fee of up to 1.00% of average daily net assets.
Class R shares are available only for certain retirement plan products. They are sold without a sales charge and have an annual distribution and service fee of up to 0.60% of average daily net assets, which has been limited contractually to 0.50% from March 30, 2010, through March 30, 2011.
Institutional Class shares are available without sales or asset-based distribution charges only to certain eligible institutional accounts.
The “Fund performance” table and the “Performance of a $10,000 investment” graph do not reflect the deduction of taxes the shareholder would pay on Fund distributions or redemptions of Fund shares.
The Fund’s expense ratios, as described in the most recent prospectus, are disclosed in the following “Fund expense ratios” chart. Delaware Investments has agreed to reimburse certain expenses and/or waive certain fees in order to prevent total fund operating expenses (excluding any 12b-1 fees and certain other expenses) from exceeding 0.85% of the Fund’s average daily net assets from March 30, 2010, through March 30, 2011. Please see the most recent prospectus and any applicable supplement(s) for additional information on these fee waivers and/or reimbursements.
| Fund expense ratios | Class A | | Class B | | Class C | | Class R | | Institutional Class |
| Total annual operating expenses | 1.37% | | 2.07% | | 2.07% | | 1.67% | | 1.07% |
| (without fee waivers) | | | | | | | | | |
| Net expenses | 1.10% | | 1.85% | | 1.85% | | 1.35% | | 0.85% |
| (including fee waivers, if any) | | | | | | | | | |
| Type of waiver | Contractual | | Contractual | | Contractual | | Contractual | | Contractual |
5
Performance summary
Delaware Value® Fund
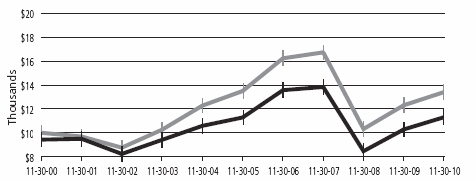
Performance of a $10,000 investment
Average annual total returns from Nov. 30, 2000, through Nov. 30, 2010
| For period beginning Nov. 30, 2000, through Nov. 30, 2010 | Starting value | Ending value |
| | Russell 1000 Value Index | $10,000 | $13,410 |
| | Delaware Value Fund — Class A Shares | $9,425 | $12,120 |
The chart assumes $10,000 invested in the Fund on Nov. 30, 2000, and includes the effect of a 5.75% front-end sales charge and the reinvestment of all distributions. Please note additional details on these fees in the “Performance summary” section of this report, which includes pages 4 through 6.
The chart also assumes $10,000 invested in the Russell 1000 Value Index as of Nov. 30, 2000.
The Russell 1000 Value Index measures the performance of the large-cap value segment of the U.S. equity universe. It includes those Russell 1000 companies with lower price-to-book ratios and lower forecasted growth values.
Index performance returns do not reflect any management fees, transaction costs or expenses. Indices are unmanaged and one cannot invest directly in an index. Past performance is not a guarantee of future results.
Performance of other Fund classes will vary due to different charges and expenses. The “Fund performance” chart and the “Performance of a $10,000 investment” graph do not reflect the deduction of taxes shareholders would pay on Fund distributions or redemptions of Fund shares.
| | | Nasdaq symbols | | CUSIPs | |
| Class A | | | DDVAX | | | 24610C881 | |
| Class B | | | DDVBX | | | 24610C873 | |
| Class C | | | DDVCX | | | 24610C865 | |
| Class R | | | DDVRX | | | 245907860 | |
| Institutional Class | | | DDVIX | | | 24610C857 | |
6
Disclosure of Fund expenses
For the six-month period from June 1, 2010 to November 30, 2010
As a shareholder of the Fund, you incur two types of costs: (1) transaction costs, including sales charges (loads) on purchase payments, reinvested dividends, or other distributions; redemption fees; and exchange fees; and (2) ongoing costs, including management fees; distribution and/or service (12b-1) fees; and other Fund expenses. This example is intended to help you understand your ongoing costs (in dollars) of investing in the Fund and to compare these costs with the ongoing costs of investing in other mutual funds.
The example is based on an investment of $1,000 invested at the beginning of the period and held for the entire six-month period from June 1, 2010 to November 30, 2010.
Actual expenses
The first section of the table shown, “Actual Fund return,” provides information about actual account values and actual expenses. You may use the information in this section of the table, together with the amount you invested, to estimate the expenses that you paid over the period. Simply divide your account value by $1,000 (for example, an $8,600 account value divided by $1,000 = 8.6), then multiply the result by the number in the first section under the heading entitled “Expenses Paid During Period” to estimate the expenses you paid on your account during this period.
Hypothetical example for comparison purposes
The second section of the table shown, “Hypothetical 5% return,” provides information about hypothetical account values and hypothetical expenses based on the Fund’s actual expense ratio and an assumed rate of return of 5% per year before expenses, which is not the Fund’s actual return. The hypothetical account values and expenses may not be used to estimate the actual ending account balance or expenses you paid for the period. You may use this information to compare the ongoing costs of investing in the Fund and other funds. To do so, compare this 5% hypothetical example with the 5% hypothetical examples that appear in the shareholder reports of the other funds.
Please note that the expenses shown in the table are meant to highlight your ongoing costs only and do not reflect any transactional costs, such as sales charges (loads), redemption fees, or exchange fees. Therefore, the second section of the table is useful in comparing ongoing costs only, and will not help you determine the relative total costs of owning different funds. In addition, if these transactional costs were included, your costs would have been higher. The Fund’s expenses shown in the table reflect fee waivers in effect. The expenses shown in the table assume reinvestment of all dividends and distributions.
8
Delaware Value® Fund
Expense analysis of an investment of $1,000
| | | Beginning | | Ending | | | | | Expenses |
| | | Account Value | | Account Value | | Annualized | | Paid During Period |
| | | 6/1/10 | | 11/30/10 | | Expense Ratio | | 6/1/10 to 11/30/10* |
| Actual Fund return | | | | | | | | | | | | | | | |
| Class A | | $ | 1,000.00 | | | $ | 1,108.40 | | | 1.10 | % | | $ | 5.81 | |
| Class B | | | 1,000.00 | | | | 1,103.10 | | | 1.85 | % | | | 9.75 | |
| Class C | | | 1,000.00 | | | | 1,102.90 | | | 1.85 | % | | | 9.75 | |
| Class R | | | 1,000.00 | | | | 1,106.10 | | | 1.35 | % | | | 7.13 | |
| Institutional Class | | | 1,000.00 | | | | 1,108.20 | | | 0.85 | % | | | 4.49 | |
| Hypothetical 5% return (5% return before expenses) | | | | | | | | |
| Class A | | $ | 1,000.00 | | | $ | 1,019.55 | | | 1.10 | % | | $ | 5.57 | |
| Class B | | | 1,000.00 | | | | 1,015.79 | | | 1.85 | % | | | 9.35 | |
| Class C | | | 1,000.00 | | | | 1,015.79 | | | 1.85 | % | | | 9.35 | |
| Class R | | | 1,000.00 | | | | 1,018.30 | | | 1.35 | % | | | 6.83 | |
| Institutional Class | | | 1,000.00 | | | | 1,020.81 | | | 0.85 | % | | | 4.31 | |
| * | “Expenses Paid During Period” are equal to the Fund’s annualized expense ratio, multiplied by the average account value over the period, multiplied by 183/365 (to reflect the one-half year period). |
9
| Sector allocation and top 10 holdings |
| Delaware Value® Fund | As of November 30, 2010 |
Sector designations may be different than the sector designations presented in other Fund materials. The sector designations may represent the investment manager’s internal sector classifications, which may result in the sector designations for one fund being different than another fund’s sector designations.
| Sector | Percentage of net assets |
| Common Stock | 99.07 | % |
| Consumer Discretionary | 6.25 | % |
| Consumer Staples | 15.02 | % |
| Energy | 15.25 | % |
| Financials | 12.09 | % |
| Healthcare | 17.79 | % |
| Industrials | 5.87 | % |
| Information Technology | 11.96 | % |
| Materials | 2.98 | % |
| Telecommunications | 5.85 | % |
| Utilities | 6.01 | % |
| Discount Note | 0.02 | % |
| Securities Lending Collateral | 16.01 | % |
| Total Value of Securities | 115.10 | % |
| Obligation to Return Securities Lending Collateral | (16.03 | %) |
| Receivables and Other Assets Net of Liabilities | 0.93 | % |
| Total Net Assets | 100.00 | % |
Holdings are for informational purposes only and are subject to change at any time. They are not a recommendation to buy, sell, or hold any security.
| Top 10 Holdings | Percentage of net assets |
| Lowe’s | 3.18 | % |
| CVS Caremark | 3.13 | % |
| Safeway | 3.13 | % |
| National Oilwell Varco | 3.10 | % |
| Williams | 3.10 | % |
| Marsh & McLennan | 3.10 | % |
| Bank of New York Mellon | 3.10 | % |
| Cardinal Health | 3.09 | % |
| ConocoPhillips | 3.08 | % |
| Intel | 3.08 | % |
10
| Statement of net assets |
| Delaware Value® Fund | | | November 30, 2010 |
| | | Number of shares | | Value |
| Common Stock – 99.07% | | | | |
| Consumer Discretionary – 6.25% | | | | |
| * | Comcast Class A | 657,600 | | $ | 13,152,000 |
| | Lowe’s | 599,400 | | | 13,606,380 |
| | | | | | 26,758,380 |
| Consumer Staples – 15.02% | | | | |
| * | Archer-Daniels-Midland | 421,000 | | | 12,204,790 |
| | CVS Caremark | 432,300 | | | 13,401,300 |
| | Kimberly-Clark | 205,700 | | | 12,730,773 |
| * | Kraft Foods Class A | 414,200 | | | 12,529,550 |
| * | Safeway | 581,800 | | | 13,375,582 |
| | | | | | 64,241,995 |
| Energy – 15.25% | | | | |
| | Chevron | 157,700 | | | 12,768,969 |
| | ConocoPhillips | 219,300 | | | 13,195,281 |
| * | Marathon Oil | 379,900 | | | 12,715,253 |
| | National Oilwell Varco | 216,700 | | | 13,281,543 |
| * | Williams | 582,100 | | | 13,277,701 |
| | | | | | 65,238,747 |
| Financials – 12.09% | | | | |
| | Allstate | 427,275 | | | 12,437,975 |
| | Bank of New York Mellon | 491,200 | | | 13,257,488 |
| * | Marsh & McLennan | 529,200 | | | 13,272,336 |
| | Travelers | 236,100 | | | 12,747,039 |
| | | | | | 51,714,838 |
| Healthcare – 17.79% | | | | |
| | Baxter International | 259,600 | | | 12,603,580 |
| | Cardinal Health | 371,500 | | | 13,217,971 |
| | Johnson & Johnson | 201,000 | | | 12,371,550 |
| | Merck | 366,700 | | | 12,640,149 |
| | Pfizer | 747,963 | | | 12,184,317 |
| * | Quest Diagnostics | 265,100 | | | 13,074,732 |
| | | | | | 76,092,299 |
| Industrials – 5.87% | | | | |
| * | Northrop Grumman | 204,600 | | | 12,619,728 |
| * | Waste Management | 364,700 | | | 12,490,975 |
| | | | | | 25,110,703 |
11
Statement of net assets
Delaware Value® Fund
| | | Number of shares | | Value |
| Common Stock (continued) | | | | | |
| Information Technology – 11.96% | | | | | |
| | Intel | | 624,700 | | $ | 13,193,664 |
| | International Business Machines | | 89,700 | | | 12,688,962 |
| † | Motorola | | 1,590,400 | | | 12,182,464 |
| | Xerox | | 1,144,600 | | | 13,117,116 |
| | | | | | | 51,182,206 |
| Materials – 2.98% | | | | | |
| | duPont (E.I.) deNemours | | 271,300 | | | 12,748,387 |
| | | | | | | 12,748,387 |
| Telecommunications – 5.85% | | | | | |
| | AT&T | | 446,900 | | | 12,419,351 |
| * | Verizon Communications | | 394,400 | | | 12,624,744 |
| | | | | | | 25,044,095 |
| Utilities – 6.01% | | | | | |
| * | Edison International | | 355,400 | | | 13,128,476 |
| * | Progress Energy | | 287,600 | | | 12,565,244 |
| | | | | | | 25,693,720 |
| Total Common Stock (cost $388,790,385) | | | | | 423,825,370 |
| | | | | | | |
| | | Principal amount | | | |
| ≠Discount Note – 0.02% | | | | | |
| | Federal Home Loan Bank 0.07% 12/1/10 | | $109,000 | | | 109,000 |
| Total Discount Note (cost $109,000) | | | | | 109,000 |
| | | | | | |
| Total Value of Securities Before Securities | | | | | |
| | Lending Collateral – 99.09% (cost $388,899,385) | | | | | 423,934,370 |
| | | | | | |
| | | Number of shares | | | |
| Securities Lending Collateral** – 16.01% | | | | | |
| | Investment Companies | | | | | |
| | BNY Mellon SL DBT II Liquidating Fund | | 144,449 | | | 140,375 |
| | Delaware Investments Collateral Fund No. 1 | | 68,351,364 | | | 68,351,364 |
| | @†Mellon GSL Reinvestment Trust II | | 89,083 | | | 0 |
| Total Securities Lending Collateral (cost $68,584,896) | | | | | 68,491,739 |
12
| | |
| Total Value of Securities – 115.10% | | | |
| (cost $457,484,281) | $ | 492,426,109 | © |
| Obligation to Return Securities | | | |
| Lending Collateral** – (16.03%) | | (68,584,896 | ) |
| Receivables and Other Assets | | | |
| Net of Liabilities – 0.93% | | 3,975,314 | |
| Net Assets Applicable to 43,583,611 | | | |
| Shares Outstanding – 100.00% | $ | 427,816,527 | |
| | | | |
| Net Asset Value – Delaware Value Fund | | | |
| Class A ($298,109,440 / 30,370,493 Shares) | | | $9.82 | |
| Net Asset Value – Delaware Value Fund | | | |
| Class B ($2,513,217 / 257,941 Shares) | | | $9.74 | |
| Net Asset Value – Delaware Value Fund | | | |
| Class C ($19,377,355 / 1,987,801 Shares) | | | $9.75 | |
| Net Asset Value – Delaware Value Fund | | | |
| Class R ($1,815,464 / 185,316 Shares) | | | $9.80 | |
| Net Asset Value – Delaware Value Fund | | | |
| Institutional Class ($106,001,051 / 10,782,060 Shares) | | | $9.83 | |
| | | | |
| Components of Net Assets at November 30, 2010: | | | |
| Shares of beneficial interest (unlimited authorization – no par) | $ | 505,043,353 | |
| Undistributed net investment income | | 7,415,091 | |
| Accumulated net realized loss on investments | | (119,583,745 | ) |
| Net unrealized appreciation of investments | | 34,941,828 | |
| Total net assets | $ | 427,816,527 | |
| @ | Illiquid security. At November 30, 2010, the aggregate amount of illiquid securities was $0, which represented 0.00% of the Fund’s net assets. See Note 9 in “Notes to financial statements.” |
| * | Fully or partially on loan. |
| ** | See Note 8 in “Notes to financial statements.” |
| © | Includes $66,983,032 of securities loaned. |
| † | Non income producing security. |
| ≠ | The rate shown is the effective yield at the time of purchase. |
13
Statement of net assets
Delaware Value® Fund
| |
| Net Asset Value and Offering Price Per Share – | | |
| Delaware Value Fund | | |
| Net asset value Class A (A) | $ | 9.82 |
| Sales charge (5.75% of offering price) (B) | | 0.60 |
| Offering price | $ | 10.42 |
| (A) | | Net asset value per share, as illustrated, is the amount which would be paid upon redemption or repurchase of shares. |
| (B) | | See the current prospectus for purchases of $50,000 or more. |
See accompanying Notes, which are an integral part of the financial statements.
14
| Statement of operations | |
| Delaware Value® Fund | | Year Ended November 30, 2010 |
| Investment Income: | | | | | | |
| Dividends | $ | 12,862,495 | | | | |
| Interest | | 11,883 | | | | |
| Security lending income | | 9,080 | | $ | 12,883,458 | |
| | | | | | | |
| Expenses: | | | | | | |
| Management fees | | 2,836,855 | | | | |
| Distribution expenses – Class A | | 969,096 | | | | |
| Distribution expenses – Class B | | 26,797 | | | | |
| Distribution expenses – Class C | | 213,151 | | | | |
| Distribution expenses – Class R | | 11,215 | | | | |
| Dividend disbursing and transfer agent fees and expenses | | 1,102,834 | | | | |
| Accounting and administration expenses | | 173,068 | | | | |
| Registration fees | | 88,048 | | | | |
| Reports and statements to shareholders | | 71,835 | | | | |
| Legal fees | | 50,066 | | | | |
| Audit and tax | | 32,166 | | | | |
| Dues and services | | 25,375 | | | | |
| Trustees’ fees | | 24,504 | | | | |
| Insurance fees | | 17,097 | | | | |
| Custodian fees | | 11,524 | | | | |
| Consulting fees | | 6,060 | | | | |
| Pricing fees | | 2,622 | | | | |
| Trustees’ expenses | | 1,714 | | | 5,664,027 | |
| Less fees waived | | | | | (725,288 | ) |
| Less waiver of distribution expenses – Class A | | | | | (161,463 | ) |
| Less waiver of distribution expenses – Class R | | | | | (1,869 | ) |
| Less expense paid indirectly | | | | | (1,472 | ) |
| Total operating expenses | | | | | 4,773,935 | |
| Net Investment Income | | | | | 8,109,523 | |
| | | | | | | |
| Net Realized and Unrealized Gain on Investments: | | | | | | |
| Net realized gain on investments | | | | | 802,815 | |
| Net change in unrealized appreciation/depreciation of investments | | | 34,877,647 | |
| Net Realized and Unrealized Gain on Investments | | | | | 35,680,462 | |
| | | | | | | |
| Net Increase in Net Assets Resulting from Operations | | | | $ | 43,789,985 | |
See accompanying Notes, which are an integral part of the financial statements.
15
Statements of changes in net assets
Delaware Value® Fund
| | Year Ended |
| | 11/30/10 | | 11/30/09 |
| Increase (Decrease) in Net Assets from Operations: | | | | | | | |
| Net investment income | $ | 8,109,523 | | | $ | 9,037,376 | |
| Net realized gain (loss) on investments | | 802,815 | | | | (25,798,260 | ) |
| Net change in unrealized | | | | | | | |
| appreciation/depreciation of investments | | 34,877,647 | | | | 87,455,628 | |
| Net increase in net assets resulting from operations | | 43,789,985 | | | | 70,694,744 | |
| | | | | | | | |
| Dividends and Distributions to Shareholders from: | | | | | | | |
| Net investment income: | | | | | | | |
| Class A | | (6,336,133 | ) | | | (8,722,039 | ) |
| Class B | | (40,558 | ) | | | (74,017 | ) |
| Class C | | (337,169 | ) | | | (542,744 | ) |
| Class R | | (36,356 | ) | | | (49,682 | ) |
| Institutional Class | | (1,847,274 | ) | | | (1,539,972 | ) |
| | | (8,597,490 | ) | | | (10,928,454 | ) |
| | | | | | | | |
| Capital Share Transactions: | | | | | | | |
| Proceeds from shares sold: | | | | | | | |
| Class A | | 105,703,060 | | | | 100,483,549 | |
| Class B | | 33,967 | | | | 328,113 | |
| Class C | | 1,853,744 | | | | 3,448,921 | |
| Class R | | 374,782 | | | | 466,254 | |
| Institutional Class | | 53,267,499 | | | | 39,358,079 | |
| | | | | | | | |
| Net asset value of shares issued upon reinvestment | | | | | | | |
| of dividends and distributions: | | | | | | | |
| Class A | | 6,002,782 | | | | 8,275,384 | |
| Class B | | 35,459 | | | | 65,978 | |
| Class C | | 309,111 | | | | 494,585 | |
| Class R | | 36,355 | | | | 49,682 | |
| Institutional Class | | 1,463,194 | | | | 1,516,149 | |
| | | 169,079,953 | | | | 154,486,694 | |
16
| | | Year Ended | |
| | 11/30/10 | | 11/30/09 |
| Capital Share Transactions (continued): | | | | | | | |
| Cost of shares repurchased: | | | | | | | |
| Class A | $ | (142,906,681 | ) | | $ | (116,500,682 | ) |
| Class B | | (678,000 | ) | | | (1,233,962 | ) |
| Class C | | (8,167,392 | ) | | | (7,423,103 | ) |
| Class R | | (689,487 | ) | | | (508,819 | ) |
| Institutional Class | | (36,048,313 | ) | | | (15,533,519 | ) |
| | | (188,489,873 | ) | | | (141,200,085 | ) |
| Increase (decrease) in net assets derived | | | | | | | |
| from capital share transactions | | (19,409,920 | ) | | | 13,286,609 | |
| Net Increase in Net Assets | | 15,782,575 | | | | 73,052,899 | |
| | | | | | | | |
| Net Assets: | | | | | | | |
| Beginning of year | | 412,033,952 | | | | 338,981,053 | |
| End of year (including undistributed net investment | | | | | | | |
| income of $7,415,091 and $7,903,058, respectively) | $ | 427,816,527 | | | $ | 412,033,952 | |
See accompanying Notes, which are an integral part of the financial statements.
17
Financial highlights
Delaware Value® Fund Class A
Selected data for each share of the Fund outstanding throughout each period were as follows:
| Net asset value, beginning of period |
| |
| Income (loss) from investment operations: |
| Net investment income1 |
| Net realized and unrealized gain (loss) on investments |
| Total from investment operations |
| |
| Less dividends and distributions from: |
| Net investment income |
| Net realized gain on investments |
| Total dividends and distributions |
| |
| Net asset value, end of period |
| |
| Total return2 |
| |
| Ratios and supplemental data: |
| Net assets, end of period (000 omitted) |
| Ratio of expenses to average net assets |
| Ratio of expenses to average net assets |
| prior to fees waived and expense paid indirectly |
| Ratio of net investment income to average net assets |
| Ratio of net investment income to average net assets |
| prior to fees waived and expense paid indirectly |
| Portfolio turnover |
1 The average shares outstanding method has been applied for per share information. |
2 Total investment return is based on the change in net asset value of a share during the period and assumes reinvestment of dividends and distributions at net asset value and does not reflect the impact of a sales charge. Total investment return during all of the periods shown reflects waivers by the manager and distributor. Performance would have been lower had the waivers not been in effect. |
See accompanying Notes, which are an integral part of the financial statements.
18
| | Year Ended |
| | | 11/30/10 | | 11/30/09 | | 11/30/08 | | 11/30/07 | | 11/30/06 | |
| | | $9.100 | | | $7.760 | | | $13.360 | | | $13.470 | | | $11.370 | | |
| | | | | | | | | | | | | | | | | |
| | | | | | | | | | | | | | | | | |
| | | 0.171 | | | 0.205 | | | 0.224 | | | 0.241 | | | 0.225 | | |
| | | 0.738 | | | 1.389 | | | (4.935 | ) | | 0.064 | | | 2.068 | | |
| | | 0.909 | | | 1.594 | | | (4.711 | ) | | 0.305 | | | 2.293 | | |
| | | | | | | | | | | | | | | | | |
| | | | | | | | | | | | | | | | | |
| | | (0.189 | ) | | (0.254 | ) | | (0.239 | ) | | (0.191 | ) | | (0.122 | ) | |
| | | — | | | — | | | (0.650 | ) | | (0.224 | ) | | (0.071 | ) | |
| | | (0.189 | ) | | (0.254 | ) | | (0.889 | ) | | (0.415 | ) | | (0.193 | ) | |
| | | | | | | | | | | | | | | | | |
| | | $9.820 | | | $9.100 | | | $7.760 | | | $13.360 | | | $13.470 | | |
| | | | | | | | | | | | | | | | | |
| | | 10.16% | | | 21.21% | | | (37.78% | ) | | 2.25% | | | 20.48% | | |
| | | | | | | | | | | | | | | | | |
| | | | | | | | | | | | | | | | | |
| | | $298,110 | | | $302,849 | | | $266,386 | | | $420,120 | | | $271,378 | | |
| | | 1.10% | | | 1.07% | | | 1.00% | | | 1.00% | | | 1.01% | | |
| | | | | | | | | | | | | | | | | |
| | | 1.32% | | | 1.37% | | | 1.26% | | | 1.15% | | | 1.17% | | |
| | | 1.85% | | | 2.60% | | | 2.11% | | | 1.75% | | | 1.84% | | |
| | | | | | | | | | | | | | | | | |
| | | 1.63% | | | 2.30% | | | 1.85% | | | 1.60% | | | 1.68% | | |
| | | 29% | | | 27% | | | 43% | | | 24% | | | 24% | | |
19
Financial highlights
Delaware Value® Fund Class B
Selected data for each share of the Fund outstanding throughout each period were as follows:
| Net asset value, beginning of period |
| |
| Income (loss) from investment operations: |
| Net investment income1 |
| Net realized and unrealized gain (loss) on investments |
| Total from investment operations |
| |
| Less dividends and distributions from: |
| Net investment income |
| Net realized gain on investments |
| Total dividends and distributions |
| |
| Net asset value, end of period |
| |
| Total return2 |
| |
| Ratios and supplemental data: |
| Net assets, end of period (000 omitted) |
| Ratio of expenses to average net assets |
| Ratio of expenses to average net assets |
| prior to fees waived and expense paid indirectly |
| Ratio of net investment income to average net assets |
| Ratio of net investment income to average net assets |
| prior to fees waived and expense paid indirectly |
| Portfolio turnover |
1 The average shares outstanding method has been applied for per share information.
2 Total investment return is based on the change in net asset value of a share during the period and assumes reinvestment of dividends and distributions at net asset value and does not reflect the impact of a sales charge. Total investment return during all of the periods shown reflects a waiver by the manager. Performance would have been lower had the waiver not been in effect.
See accompanying Notes, which are an integral part of the financial statements.
20
| | | Year Ended | |
| | | 11/30/10 | | 11/30/09 | | 11/30/08 | | 11/30/07 | | 11/30/06 | |
| | | $9.050 | | | $7.690 | | | $13.240 | | | $13.370 | | | $11.290 | | |
| | | | | | | | | | | | | | | | | |
| | | | | | | | | | | | | | | | | |
| | | 0.101 | | | 0.146 | | | 0.142 | | | 0.138 | | | 0.134 | | |
| | | 0.719 | | | 1.391 | | | (4.905 | ) | | 0.055 | | | 2.058 | | |
| | | 0.820 | | | 1.537 | | | (4.763 | ) | | 0.193 | | | 2.192 | | |
| | | | | | | | | | | | | | | | | |
| | | | | | | | | | | | | | | | | |
| | | (0.130 | ) | | (0.177 | ) | | (0.137 | ) | | (0.099 | ) | | (0.041 | ) | |
| | | — | | | — | | | (0.650 | ) | | (0.224 | ) | | (0.071 | ) | |
| | | (0.130 | ) | | (0.177 | ) | | (0.787 | ) | | (0.323 | ) | | (0.112 | ) | |
| | | | | | | | | | | | | | | | | |
| | | $9.740 | | | $9.050 | | | $7.690 | | | $13.240 | | | $13.370 | | |
| | | | | | | | | | | | | | | | | |
| | | 9.16% | | | 20.44% | | | (38.25% | ) | | 1.41% | | | 19.59% | | |
| | | | | | | | | | | | | | | | | |
| | | | | | | | | | | | | | | | | |
| | | $2,513 | | | $2,930 | | | $3,279 | | | $9,514 | | | $9,914 | | |
| | | 1.85% | | | 1.82% | | | 1.75% | | | 1.75% | | | 1.76% | | |
| | | | | | | | | | | | | | | | | |
| | | 2.02% | | | 2.07% | | | 1.96% | | | 1.85% | | | 1.87% | | |
| | | 1.10% | | | 1.85% | | | 1.36% | | | 1.00% | | | 1.09% | | |
| | | | | | | | | | | | | | | | | |
| | | 0.93% | | | 1.60% | | | 1.15% | | | 0.90% | | | 0.98% | | |
| | | 29% | | | 27% | | | 43% | | | 24% | | | 24% | | |
21
Financial highlights
Delaware Value® Fund Class C
Selected data for each share of the Fund outstanding throughout each period were as follows:
| Net asset value, beginning of period |
| |
| Income (loss) from investment operations: |
| Net investment income1 |
| Net realized and unrealized gain (loss) on investments |
| Total from investment operations |
| |
| Less dividends and distributions from: |
| Net investment income |
| Net realized gain on investments |
| Total dividends and distributions |
| |
| Net asset value, end of period |
| |
| Total return2 |
| |
| Ratios and supplemental data: |
| Net assets, end of period (000 omitted) |
| Ratio of expenses to average net assets |
| Ratio of expenses to average net assets |
| prior to fees waived and expense paid indirectly |
| Ratio of net investment income to average net assets |
| Ratio of net investment income to average net assets |
| prior to fees waived and expense paid indirectly |
| Portfolio turnover |
1 The average shares outstanding method has been applied for per share information.
2 Total investment return is based on the change in net asset value of a share during the period and assumes reinvestment of dividends and distributions at net asset value and does not reflect the impact of a sales charge. Total investment return during all of the periods shown reflects a waiver by the manager. Performance would have been lower had the waiver not been in effect.
See accompanying Notes, which are an integral part of the financial statements.
22
| | | Year Ended | |
| | | 11/30/10 | | 11/30/09 | | 11/30/08 | | 11/30/07 | | 11/30/06 | |
| | | $9.050 | | | $7.690 | | | $13.250 | | | $13.370 | | | $11.290 | | |
| | | | | | | | | | | | | | | | | |
| | | | | | | | | | | | | | | | | |
| | | 0.101 | | | 0.146 | | | 0.142 | | | 0.137 | | | 0.134 | | |
| | | 0.729 | | | 1.391 | | | (4.915 | ) | | 0.066 | | | 2.058 | | |
| | | 0.830 | | | 1.537 | | | (4.773 | ) | | 0.203 | | | 2.192 | | |
| | | | | | | | | | | | | | | | | |
| | | | | | | | | | | | | | | | | |
| | | (0.130 | ) | | (0.177 | ) | | (0.137 | ) | | (0.099 | ) | | (0.041 | ) | |
| | | — | | | — | | | (0.650 | ) | | (0.224 | ) | | (0.071 | ) | |
| | | (0.130 | ) | | (0.177 | ) | | (0.787 | ) | | (0.323 | ) | | (0.112 | ) | |
| | | | | | | | | | | | | | | | | |
| | | $9.750 | | | $9.050 | | | $7.690 | | | $13.250 | | | $13.370 | | |
| | | | | | | | | | | | | | | | | |
| | | 9.28% | | | 20.28% | | | (38.21% | ) | | 1.49% | | | 19.59% | | |
| | | | | | | | | | | | | | | | | |
| | | | | | | | | | | | | | | | | |
| | | $19,377 | | | $23,925 | | | $23,733 | | | $65,890 | | | $41,013 | | |
| | | 1.85% | | | 1.82% | | | 1.75% | | | 1.75% | | | 1.76% | | |
| | | | | | | | | | | | | | | | | |
| | | 2.02% | | | 2.07% | | | 1.96% | | | 1.85% | | | 1.87% | | |
| | | 1.10% | | | 1.85% | | | 1.36% | | | 1.00% | | | 1.09% | | |
| | | | | | | | | | | | | | | | | |
| | | 0.93% | | | 1.60% | | | 1.15% | | | 0.90% | | | 0.98% | | |
| | | 29% | | | 27% | | | 43% | | | 24% | | | 24% | | |
23
Financial highlights
Delaware Value® Fund Class R
Selected data for each share of the Fund outstanding throughout each period were as follows:
| Net asset value, beginning of period |
| |
| Income (loss) from investment operations: |
| Net investment income1 |
| Net realized and unrealized gain (loss) on investments |
| Total from investment operations |
| |
| Less dividends and distributions from: |
| Net investment income |
| Net realized gain on investments |
| Total dividends and distributions |
| |
| Net asset value, end of period |
| |
| Total return2 |
| |
| Ratios and supplemental data: |
| Net assets, end of period (000 omitted) |
| Ratio of expenses to average net assets |
| Ratio of expenses to average net assets |
| prior to fees waived and expense paid indirectly |
| Ratio of net investment income to average net assets |
| Ratio of net investment income to average net assets |
| prior to fees waived and expense paid indirectly |
| Portfolio turnover |
1 The average shares outstanding method has been applied for per share information.
2 Total investment return is based on the change in net asset value of a share during the period and assumes reinvestment of dividends and distributions at net asset value. Total investment return during all of the periods shown reflects waivers by the manager and distributor. Performance would have been lower had the waivers not been in effect.
See accompanying Notes, which are an integral part of the financial statements.
24
| | | Year Ended | |
| | | 11/30/10 | | 11/30/09 | | 11/30/08 | | 11/30/07 | | 11/30/06 | |
| | | $9.090 | | | $7.740 | | | $13.320 | | | $13.420 | | | $11.350 | | |
| | | | | | | | | | | | | | | | | |
| | | | | | | | | | | | | | | | | |
| | | 0.148 | | | 0.185 | | | 0.197 | | | 0.207 | | | 0.218 | | |
| | | 0.731 | | | 1.393 | | | (4.923 | ) | | 0.057 | | | 2.058 | | |
| | | 0.879 | | | 1.578 | | | (4.726 | ) | | 0.264 | | | 2.276 | | |
| | | | | | | | | | | | | | | | | |
| | | | | | | | | | | | | | | | | |
| | | (0.169 | ) | | (0.228 | ) | | (0.204 | ) | | (0.140 | ) | | (0.135 | ) | |
| | | — | | | — | | | (0.650 | ) | | (0.224 | ) | | (0.071 | ) | |
| | | (0.169 | ) | | (0.228 | ) | | (0.854 | ) | | (0.364 | ) | | (0.206 | ) | |
| | | | | | | | | | | | | | | | | |
| | | $9.800 | | | $9.090 | | | $7.740 | | | $13.320 | | | $13.420 | | |
| | | | | | | | | | | | | | | | | |
| | | 9.81% | | | 20.98% | | | (37.90% | ) | | 1.95% | | | 20.39% | | |
| | | | | | | | | | | | | | | | | |
| | | | | | | | | | | | | | | | | |
| | | $1,816 | | | $1,957 | | | $1,669 | | | $2,246 | | | $6 | | |
| | | 1.35% | | | 1.32% | | | 1.25% | | | 1.25% | | | 1.26% | | |
| | | | | | | | | | | | | | | | | |
| | | 1.62% | | | 1.67% | | | 1.56% | | | 1.45% | | | 1.47% | | |
| | | 1.60% | | | 2.35% | | | 1.86% | | | 1.50% | | | 1.59% | | |
| | | | | | | | | | | | | | | | | |
| | | 1.33% | | | 2.00% | | | 1.55% | | | 1.30% | | | 1.38% | | |
| | | 29% | | | 27% | | | 43% | | | 24% | | | 24% | | |
25
Financial highlights
Delaware Value® Fund Institutional Class
Selected data for each share of the Fund outstanding throughout each period were as follows:
| Net asset value, beginning of period |
| |
| Income (loss) from investment operations: |
| Net investment income1 |
| Net realized and unrealized gain (loss) on investments |
| Total from investment operations |
| |
| Less dividends and distributions from: |
| Net investment income |
| Net realized gain on investments |
| Total dividends and distributions |
| |
| Net asset value, end of period |
| |
| Total return2 |
| |
| Ratios and supplemental data: |
| Net assets, end of period (000 omitted) |
| Ratio of expenses to average net assets |
| Ratio of expenses to average net assets |
| prior to fees waived and expense paid indirectly |
| Ratio of net investment income to average net assets |
| Ratio of net investment income to average net assets |
| prior to fees waived and expense paid indirectly |
| Portfolio turnover |
1 The average shares outstanding method has been applied for per share information.
2 Total investment return is based on the change in net asset value of a share during the period and assumes reinvestment of dividends and distributions at net asset value. Total investment return during all of the periods shown reflect a waiver by the manager. Performance would have been lower had the waiver not been in effect.
See accompanying Notes, which are an integral part of the financial statements.
26
| | | Year Ended | |
| | | 11/30/10 | | 11/30/09 | | 11/30/08 | | 11/30/07 | | 11/30/06 | |
| | | $9.110 | | | $7.770 | | | $13.380 | | | $13.500 | | | $11.390 | | |
| | | | | | | | | | | | | | | | | |
| | | | | | | | | | | | | | | | | |
| | | 0.194 | | | 0.225 | | | 0.250 | | | 0.276 | | | 0.256 | | |
| | | 0.735 | | | 1.394 | | | (4.936 | ) | | 0.051 | | | 2.077 | | |
| | | 0.929 | | | 1.619 | | | (4.686 | ) | | 0.327 | | | 2.333 | | |
| | | | | | | | | | | | | | | | | |
| | | | | | | | | | | | | | | | | |
| | | (0.209 | ) | | (0.279 | ) | | (0.274 | ) | | (0.223 | ) | | (0.152 | ) | |
| | | — | | | — | | | (0.650 | ) | | (0.224 | ) | | (0.071 | ) | |
| | | (0.209 | ) | | (0.279 | ) | | (0.924 | ) | | (0.447 | ) | | (0.223 | ) | |
| | | | | | | | | | | | | | | | | |
| | | $9.830 | | | $9.110 | | | $7.770 | | | $13.380 | | | $13.500 | | |
| | | | | | | | | | | | | | | | | |
| | | 10.39% | | | 21.43% | | | (37.54% | ) | | 2.41% | | | 20.85% | | |
| | | | | | | | | | | | | | | | | |
| | | | | | | | | | | | | | | | | |
| | | $106,001 | | | $80,373 | | | $43,914 | | | $126,023 | | | $189,557 | | |
| | | 0.85% | | | 0.82% | | | 0.75% | | | 0.75% | | | 0.76% | | |
| | | | | | | | | | | | | | | | | |
| | | 1.02% | | | 1.07% | | | 0.96% | | | 0.85% | | | 0.87% | | |
| | | 2.10% | | | 2.85% | | | 2.36% | | | 2.00% | | | 2.09% | | |
| | | | | | | | | | | | | | | | | |
| | | 1.93% | | | 2.60% | | | 2.15% | | | 1.90% | | | 1.98% | | |
| | | 29% | | | 27% | | | 43% | | | 24% | | | 24% | | |
27
| Notes to financial statements |
| Delaware Value® Fund | November 30, 2010 |
Delaware Group® Equity Funds II (Trust) is organized as a Delaware statutory trust and offers two series: Delaware Large Cap Value Fund and Delaware Value Fund. These financial statements and the related notes pertain to Delaware Value Fund (Fund). The Trust is an open-end investment company. The Fund is considered diversified under the Investment Company Act of 1940, as amended, and offers Class A, Class B, Class C, Class R and Institutional Class shares. Class A shares are sold with a maximum front-end sales charge of up to 5.75%. Class A share purchases of $1,000,000 or more will incur a contingent deferred sales charge (CDSC) of up to 1% if redeemed during the first year and 0.50% during the second year, provided that Delaware Distributors, L.P. (DDLP) paid a financial advisor a commission on the purchase of those shares. Class B shares may only be purchased through div idend reinvestment and certain permitted exchanges. Prior to June 1, 2007, Class B shares were sold with a CDSC that declined from 4% to zero depending upon the period of time the shares are held. Class B shares will automatically convert to Class A shares on a quarterly basis approximately eight years after purchase. Class C shares are sold with a CDSC of 1%, if redeemed during the first 12 months. Class R and Institutional Class shares are not subject to a sales charge and are offered for sale exclusively to certain eligible investors.
The investment objective of the Fund is to seek long-term capital appreciation.
1. Significant Accounting Policies
The following accounting policies are in accordance with U.S. generally accepted accounting principles (U.S. GAAP) and are consistently followed by the Fund.
Security Valuation — Equity securities, except those traded on the Nasdaq Stock Market, Inc. (Nasdaq), are valued at the last quoted sales price as of the time of the regular close of the New York Stock Exchange (NYSE) on the valuation date. Securities traded on the Nasdaq are valued in accordance with the Nasdaq Official Closing Price, which may not be the last sales price. If on a particular day an equity security does not trade, then the mean between the bid and ask prices will be used. Short-term debt securities are valued at market value. Investment company securities are valued at net asset value per share. Generally, other securities and assets for which market quotations are not readily available are valued at fair value as determined in good faith under the direction of the Fund’s Board of Trustees (Board) . In determining whether market quotations are readily available or fair valuation will be used, various factors will be taken into consideration, such as market closures or suspension of trading in a security. The Fund may use fair value pricing more frequently for securities traded primarily in non-U.S. markets because, among other things, most foreign markets close well before the Fund values its securities generally as of 4:00 p.m. Eastern time. The earlier close of these foreign markets gives rise to the possibility that significant events, including broad market moves, government actions or pronouncements, aftermarket trading, or news events may have occurred in the interim. To account for this, the Fund may frequently value foreign securities using fair value prices based on third-party vendor modeling tools (international fair value pricing).
Federal Income Taxes — No provision for federal income taxes has been made as the Fund intends to continue to qualify for federal income tax purposes as a regulated investment company under Subchapter M of the Internal Revenue Code of 1986, as amended, and make the requisite
28
distributions to shareholders. The Fund evaluates tax positions taken or expected to be taken in the course of preparing the Fund’s tax return to determine whether the tax positions are “more-likely-than-not” of being sustained by the applicable tax authority. Tax positions not deemed to meet the more-likely-than-not threshold are recorded as a tax benefit or expense in the current year. Management has analyzed the Fund’s tax positions taken on federal income tax returns for all open tax years (November 30, 2007 – November 30, 2010), and has concluded that no position for federal income tax is required in the Fund’s financial statements.
Class Accounting — Investment income, common expenses and realized and unrealized gain (loss) on investments are allocated to the various classes of the Fund on the basis of daily net assets of each class. Distribution expenses relating to a specific class are charged directly to that class.
Use of Estimates — The preparation of financial statements in conformity with U.S. GAAP requires management to make estimates and assumptions that affect the reported amounts of assets and liabilities and disclosure of contingent assets and liabilities at the date of the financial statements and the reported amounts of revenues and expenses during the reporting period. Actual results could differ from those estimates and the differences could be material.
Other — Expenses directly attributable to the Fund are charged directly to the Fund. Other expenses common to various funds within the Delaware Investments® Family of Funds are generally allocated amongst such funds on the basis of average net assets. Management fees and some other expenses are paid monthly. Security transactions are recorded on the date the securities are purchased or sold (trade date) for financial reporting purposes. Costs used in calculating realized gains and losses on the sale of investment securities are those of the specific securities sold. Dividend income is recorded on the ex-dividend date and interest income is recorded on the accrual basis. The Fund declares and pays dividends from net investment income and distributions from net realized gain on investments, if any, annually. Dividends and distributions, if any, are recorded on the ex-dividend date.
Subject to seeking best execution, the Fund may direct certain security trades to brokers who have agreed to rebate a portion of the related brokerage commission to the Fund in cash. Such commission rebates are included in realized gain on investments in the accompanying financial statements and totaled $ 11,599 for the year ended November 30, 2010. In general, best execution refers to many factors, including the price paid or received for a security, the commission charged, the promptness and reliability of execution, the confidentiality and placement accorded the order, and other factors affecting the overall benefit obtained by the Fund on the transaction.
The Fund may receive earnings credits from its custodian when positive cash balances are maintained, which are used to offset custody fees. There were no earnings credits for the year ended November 30, 2010.
The Fund may receive earnings credits from its transfer agent when positive cash balances are maintained, which may be used to offset transfer agent fees. The expense paid under this arrangement is included in dividend disbursing and transfer agent fees and expenses on the statement of operations with the corresponding expense offset shown as “expense paid indirectly.” For the year ended November 30, 2010, the Fund earned $1,472 under this agreement.
29
Notes to financial statements
Delaware Value® Fund
2. Investment Management, Administration Agreements and Other Transactions with Affiliates
In accordance with the terms of its investment management agreement, the Fund pays Delaware Management Company (DMC), a series of Delaware Management Business Trust and the investment manager, an annual fee which is calculated daily at the rate of 0.65% on the first $500 million of average daily net assets of the Fund, 0.60% on the next $500 million, 0.55% on the next $1.5 billion and 0.50% on average daily net assets in excess of $2.5 billion.
Effective March 30, 2010, DMC has contractually agreed to waive that portion, if any, of its management fee and reimburse the Fund to the extent necessary to ensure that annual operating expenses, (excluding any 12b-1 plan and certain other expenses), do not exceed 0.85% of average daily net assets of the Fund through March 30, 2011. Prior to March 30, 2010, the expense limitation was voluntary. This expense waiver and reimbursement applies only to expenses paid directly by the Fund.
Delaware Service Company, Inc. (DSC), an affiliate of DMC, provides fund accounting and financial administration oversight services to the Fund. For these services, the Fund pays DSC fees based on the aggregate daily net assets of the Delaware Investments® Family of Funds at the following annual rate: 0.0050% of the first $30 billion; 0.0045% of the next $10 billion; 0.0040% of the next $10 billion; and 0.0025% of aggregate average daily net assets in excess of $50 billion. The fees payable to DSC under the service agreement described above are allocated among all Funds in the Delaware Investments Family of Funds on a relative net asset value basis. For the year ended November 30, 2010, the Fund was charged $21,791 for these services.
DSC also provides dividend disbursing and transfer agency services. The Fund pays DSC a monthly fee based on the number of shareholder accounts for dividend disbursing and transfer agent services.
Pursuant to a distribution agreement and distribution plan, the Fund pays DDLP, the distributor and an affiliate of DMC, an annual distribution and service fee not to exceed 0.30% of the average daily net assets of the Class A shares, 1.00% of the average daily net assets of the Class B and C shares and 0.60% of the average daily net assets of the Class R shares. Institutional Class shares pay no distribution and services expenses. DDLP has contracted to waive distribution and service fees through March 30, 2011 in order to prevent distribution and service fees of Class A and Class R shares from exceeding 0.25% and 0.50%, respectively, of average daily net assets.
30
At November 30, 2010, the Fund had liabilities payable to affiliates as follows:
| Investment management fee payable to DMC | | $ | 193,671 |
| Dividend disbursing, transfer agent and fund accounting | | | |
| oversight fees and other expenses payable to DSC | | | 41,506 |
| Distribution fees payable to DDLP | | | 82,332 |
| Other expenses payable to DMC and affiliates* | | | 31,235 |
*DMC, as part of its administrative services, pays operating expenses on behalf of the Fund and is reimbursed on a periodic basis. These expenses include items such as printing of shareholder reports, fees for audit, legal and tax services, registration fees and trustees’ fees.
As provided in the investment management agreement, the Fund bears the cost of certain legal and tax services, including internal legal and tax services provided to the Fund by DMC and/or its affiliates’ employees. For the year ended November 30, 2010, the Fund was charged $18,749 for internal legal and tax services provided by DMC and/or its affiliates’ employees.
For the year ended November 30, 2010, DDLP earned $5,442 for commissions on sales of the Fund’s Class A shares. For the year ended November 30, 2010, DDLP received gross CDSC commissions of $0, $1,715 and $614 on redemption of the Fund’s Class A, Class B and Class C shares, respectively, and these commissions were entirely used to offset up-front commissions previously paid by DDLP to broker-dealers on sales of those shares.
Trustees’ fees include expenses accrued by the Fund for each Trustee’s retainer and meeting fees. Certain officers of DMC, DSC and DDLP are officers and/or Trustees of the Trust. These officers and Trustees are paid no compensation by the Fund.
3. Investments
For the year ended November 30, 2010, the Fund made purchases of $121,813,389 and sales of $129,429,183 of investment securities other than short-term investments.
At November 30, 2010, the cost of investments for federal income purposes was $461,456,121. At November 30, 2010, net unrealized appreciation was $30,969,988, of which $50,796,620 related to unrealized appreciation of investments and $19,826,632 related to unrealized depreciation of investments.
U.S. GAAP defines fair value as the price that the Fund would receive to sell an asset or pay to transfer a liability in an orderly transaction between market participants at the measurement date under current market conditions. A three level hierarchy for fair value measurements has been established based upon the transparency of inputs to the valuation of an asset or liability. Inputs may be observable or unobservable and refer broadly to the assumptions that market participants would use in pricing the asset or liability. Observable inputs reflect the assumptions market participants would use in pricing the asset or liability based on market data obtained from sources independent of the reporting entity. Unobservable inputs reflect the reporting entity’s own assumptions about the assumptions that market participants would use in pricing the asset or liability developed based on the best information available under the circumstance s.
31
Notes to financial statements
Delaware Value® Fund
3. Investments (continued)
The Fund’s investment in its entirety is assigned a level based upon the observability of the inputs which are significant to the overall valuation. The three level hierarchy of inputs is summarized below.
| Level 1 | – | inputs are quoted prices in active markets for identical investments (e.g. equity securities, open-end investment companies, futures contracts, options contracts) |
| | | |
| Level 2 | – | other observable inputs (including, but not limited to: quoted prices for similar assets or liabilities in markets that are active, quoted prices for identical or similar assets or liabilities in markets that are not active, inputs other than quoted prices that are observable for the assets or liabilities (such as interest rates, yield curves, volatilities, prepayment speeds, loss severities, credit risks and default rates) or other market-corroborated inputs) ( e.g. debt securities, government securities, swap contracts, foreign currency exchange contracts, foreign securities utilizing international fair value pricing) |
| | | |
| Level 3 | – | inputs are significant unobservable inputs (including the Fund’s own assumptions used to determine the fair value of investments) (e.g. broker-quoted securities, fair valued securities) |
The following table summarizes the valuation of the Fund’s investments by fair value hierarchy levels as of November 30, 2010:
| | | Level 1 | | Level 2 | | Level 3 | | Total |
| Common Stock | | $ | 423,825,370 | | $ | — | | $ | — | | $ | 423,825,370 |
| Short-Term | | | — | | | 109,000 | | | — | | | 109,000 |
| Securities Lending Collateral | | | — | | | 68,491,739 | | | — | | | 68,491,739 |
| Total | | $ | 423,825,370 | | $ | 68,600,739 | | $ | — | | $ | 492,426,109 |
The following is a reconciliation of investments in which significant unobservable inputs (Level 3) were used in determining fair value:
| | | Securities |
| | | Lending |
| | | Collateral |
| Balance as of 11/30/09 | | $ | 3,988 | |
| Sales | | | (4,748 | ) |
| Net change in unrealized appreciation/depreciation | | | 760 | |
| Balance as of 11/30/10 | | $ | — | |
| | | | | |
| Net change in unrealized appreciation/depreciation from | | | | |
| investments still held as of 11/30/10 | | $ | (3,786 | ) |
32
In January 2010, the Financial Accounting Standards Board issued an Accounting Standards Update, Improving Disclosures about Fair Value Measurements, which introduced new disclosure requirements and clarified certain existing disclosure requirements around fair value measurements currently presented above. The new disclosures and clarifications of existing disclosures are generally effective for the Fund’s fiscal year end November 30, 2011 and interim periods therein. During the fiscal year ended November 30, 2010, there were no transfers between Level 1 investments, Level 2 investments or Level 3 investments that had a material impact to the Fund.
4. Dividend and Distribution Information
Income and long-term capital gain distributions are determined in accordance with federal income tax regulations, which may differ from U.S. GAAP. Additionally, distributions from net short-term gains on sales of investment securities are treated as ordinary income for federal income tax purposes. The tax character of dividends and distributions paid during the years ended November 30, 2010 and 2009 was as follows:
| | | 11/30/10 | | 11/30/09 |
| Ordinary income | | $ | 8,597,490 | | $ | 10,928,454 |
5. Components of Net Assets on a Tax Basis
As of November 30, 2010, the components of net assets on a tax basis were as follows:
| Shares of beneficial interest | | $ | 505,043,353 | |
| Undistributed ordinary income | | | 7,415,091 | |
| Capital loss carryforwards | | | (115,611,905 | ) |
| Unrealized appreciation of investments | | | 30,969,988 | |
| Net assets | | $ | 427,816,527 | |
The differences between book basis and tax basis components of net assets are primarily attributable to tax deferral of losses on wash sales.
For federal income tax purposes, capital loss carryforwards may be carried forward and applied against future capital gains. $3,312,892 was utilized in 2010. Capital loss carryforwards remaining at November 30, 2010 will expire as follows: $89,722,915 expires in 2016 and $25,888,990 expires in 2017.
33
Notes to financial statements
Delaware Value® Fund
6. Capital Shares
Transactions in capital shares were as follows:
| | | Year Ended |
| | | 11/30/10 | | 11/30/09 |
| Shares sold: | | | | | | |
| Class A | | 11,549,124 | | | 12,801,028 | |
| Class B | | 3,643 | | | 45,194 | |
| Class C | | 200,919 | | | 448,443 | |
| Class R | | 40,545 | | | 60,019 | |
| Institutional Class | | 5,712,985 | | | 5,018,644 | |
| | | | | | | |
| Shares issued upon reinvestment of dividends and distributions: | | | | | | |
| Class A | | 661,099 | | | 1,096,074 | |
| Class B | | 3,905 | | | 8,727 | |
| Class C | | 34,043 | | | 65,421 | |
| Class R | | 3,999 | | | 6,572 | |
| Institutional Class | | 161,322 | | | 201,081 | |
| | | 18,371,584 | | | 19,751,203 | |
| | | | | | | |
| Shares repurchased: | | | | | | |
| Class A | | (15,110,094 | ) | | (14,967,432 | ) |
| Class B | | (73,500 | ) | | (156,392 | ) |
| Class C | | (890,855 | ) | | (954,814 | ) |
| Class R | | (74,588 | ) | | (66,870 | ) |
| Institutional Class | | (3,911,595 | ) | | (2,050,520 | ) |
| | | (20,060,632 | ) | | (18,196,028 | ) |
| Net increase (decrease) | | (1,689,048 | ) | | 1,555,175 | |
For the years ended November 30, 2010 and 2009, 21,573 Class B shares were converted to 21,461 Class A shares valued at $198,909 and 18,769 Class B shares were converted to 18,687 Class A shares valued at $141,883, respectively. The respective amounts are included in Class B redemptions and Class A subscriptions in the table above and the statements of changes in the net assets.
7. Line of Credit
The Fund, along with certain other funds in the Delaware Investments® Family of Funds (Participants), was a participant in a $35,000,000 revolving line of credit with The Bank of New York Mellon (BNY Mellon) to be used for temporary or emergency purposes as an additional source of liquidity to fund redemptions of investor shares. Under the agreement, the Participants were charged an annual commitment fee, which was allocated across the Participants on the basis of each Participant’s allocation of the entire facility. The Participants were permitted to borrow up to a maximum of one third of their net assets under the agreement. The line of credit expired on November 16, 2010.
34
Effective as of November 16, 2010, the Fund along with the other Participants entered into an amendment to the agreement with BNY Mellon for a $50,000,000 revolving line of credit. The agreement as amended is to be used and operated in substantially the same manner as the original agreement. The new line of credit under the agreement as amended expires on November 15, 2011. The Fund had no amounts outstanding as of November 30, 2010, or at any time during the period then ended.
8. Securities Lending
The Fund, along with other funds in the Delaware Investments® Family of Funds, may lend its securities pursuant to a security lending agreement (Lending Agreement) with BNY Mellon. With respect to each loan, if on any business day the aggregate market value of securities collateral plus cash collateral held is less than the aggregate market value of the securities which are the subject of such loan, the borrower will be notified to provide additional collateral by the end of the following business day which, together with the collateral already held, will be not less than the applicable collateral requirements for such security loan. If the aggregate market value of securities collateral and cash collateral held with respect to a security loan exceeds the applicable collateral requirement, upon the request of the borrower BNY Mellon must return enough collateral to the borr ower by the end of the following business day to reduce the value of the remaining collateral to the applicable collateral requirement for such security loan. As a result of the foregoing, the value of the collateral held with respect to a loaned security may be temporarily more or less than the value of the security on loan.
Cash collateral received is generally invested in the Delaware Investments Collateral Fund No. 1 (Collective Trust) established by BNY Mellon for the purpose of investment on behalf of funds managed by DMC that participate in BNY Mellon’s securities lending program. The Collective Trust may invest in U.S. government securities and high quality corporate debt, asset-backed and other money market securities and in repurchase agreements collateralized by such securities, provided that the Collective Trust will generally have a dollar-weighted average portfolio maturity of 60 days or less. The Collective Trust seeks to maintain a net asset value per unit of $1.00, but there can be no assurance that it will always be able to do so. The Fund may incur investment losses as a result of investing securities lending collateral in the Collective Trust or another collateral investment pool. This could occur if an investment in a collateral inves tment pool defaulted or if it were necessary to liquidate assets in the collateral investment pool to meet returns on outstanding security loans at a time when the collateral investment pool’s net asset value per unit was less than $1.00. Under those circumstances, the Fund may not receive an amount from the collateral investment pool that is equal in amount to the collateral the Fund would be required to return to the borrower of the securities and the Fund would be required to make up this shortfall. Effective April 20, 2009, BNY Mellon transferred the assets of the Fund’s previous collateral investment pool other than cash and assets with a maturity of one business day or less to the BNY Mellon SL DBT II Liquidating Fund (Liquidating Fund), effectively bifurcating the previous collateral investment pool. The Fund’s exposure to the Liquidating Fund is expected to decrease as the Liquidating Fund’s assets mature or are sold. In October 2008, BNY Mellon transferred certain distressed securities from the previous collateral investment pool into the
35
Notes to financial statements
Delaware Value® Fund
8. Securities Lending (continued)
Mellon GSL Reinvestment Trust II. The Fund can also accept U.S. government securities and letters of credit (non-cash collateral) in connection with securities loans. In the event of default or bankruptcy by the lending agent, realization and/or retention of the collateral may be subject to legal proceedings. In the event the borrower fails to return loaned securities and the collateral received is insufficient to cover the value of the loaned securities and provided such collateral shortfall is not the result of investment losses, the lending agent has agreed to pay the amount of the shortfall to the Fund, or at the discretion of the lending agent, replace the loaned securities. The Fund continues to record dividends or interest, as applicable, on the securities loaned and is subject to change in value of the securities loaned that may occur during the term of the loan. The Fund has the right under the Lending Agreement to recover the sec urities from the borrower on demand. With respect to security loans collateralized by non-cash collateral, the Fund receives loan premiums paid by the borrower. With respect to security loans collateralized by cash collateral, the earnings from the collateral investments are shared among the Fund, the security lending agent and the borrower. The Fund records security lending income net of allocations to the security lending agent and the borrower.
At November 30, 2010, the value of securities on loan was $66,983,032, for which cash collateral was received and invested in accordance with the lending agreement. At November 30, 2010, the value of invested collateral was $68,491,739. Such investments are presented on the statement of net assets under the caption “Securities Lending Collateral.”
9. Credit and Market Risk
The Fund may invest up to 15% of its total net assets in illiquid securities, which may include securities with contractual restrictions on resale, securities exempt from registration under Rule 144A of the Securities Act of 1933, as amended, and other securities which may not be readily marketable. The relative illiquidity of these securities may impair the Fund from disposing of them in a timely manner and at a fair price when it is necessary or desirable to do so. While maintaining oversight, the Fund’s Board has delegated to DMC the day-to-day functions of determining whether individual securities are liquid for purposes of the Fund’s limitation on investments in illiquid assets. Securities eligible for resale pursuant to Rule 144A, which are determined to be liquid, are not subject to the Fund’s 15% limit on investments in illiquid securities. For the year ended November 30, 2010, there were no Rule 144A securities. Illiquid securities have been identified on the statement of net assets.
10. Contractual Obligations
The Fund enters into contracts in the normal course of business that contain a variety of indemnifications. The Fund’s maximum exposure under these arrangements is unknown. However, the Fund has not had prior claims or losses pursuant to these contracts. Management has reviewed the Fund’s existing contracts and expects the risk of loss to be remote.
36
11. Subsequent Events
Management has determined no material events or transactions occurred subsequent to November 30, 2010 that would require recognition or disclosure in the Fund’s financial statements.
12. Tax Information (Unaudited)
The information set forth below is for the Fund’s fiscal year as required by federal laws. Shareholders, however, must report distributions on a calendar year basis for income tax purposes, which may include distributions for portions of two fiscal years of a fund. Accordingly, the information needed by shareholders for income tax purposes will be sent to them in January of each year. Please consult your tax advisor for proper treatment of this information.
For the fiscal year ended November 30, 2010, the Fund designates distributions paid during the year as follows:
| (A) | Ordinary Income Distributions* (Tax Basis) | | 100 | % |
| (B) | Qualifying Dividends1 | | 100 | % |
(A) is based on a percentage of the Fund’s total distributions.
(B) is based on a percentage of the Fund’s ordinary income distributions.
1 Qualifying dividends represent dividends which qualify for the corporate dividends received deduction.
*For the fiscal year ended November 30, 2010, certain dividends paid by the Fund may be subject to a maximum tax rate of 15%, as provided for by the Jobs and Growth Tax Relief Reconciliation Act of 2003. The Fund intends to designate up to a maximum amount of $8,597,490 to be taxed at maximum rate of 15%. Complete information will be computed and reported in conjunction with your 2009 or 2010 Form 1099-DIV.
37
Report of independent
registered public accounting firm
To the Board of Trustees of Delaware Group® Equity
Funds II and the Shareholders of Delaware Value Fund:
In our opinion, the accompanying statement of net assets and the related statements of operations and of changes in net assets and the financial highlights present fairly, in all material respects, the financial position of Delaware Value Fund (one of the series constituting Delaware Group Equity Funds II, hereafter referred to as the “Fund”) at November 30, 2010, and the results of its operations, the changes in its net assets and the financial highlights for the year then ended, in conformity with accounting principles generally accepted in the United States of America. These financial statements and financial highlights (hereafter referred to as “financial statements”) are the responsibility of the Fund’s management; our responsibility is to express an opinion on these financial statements based on our audit. We conducted our audit of these financial statements in accordance with the standards of the Public Company Accounting Oversight Board (United States). Those standards require that we plan and perform the audit to obtain reasonable assurance about whether the financial statements are free of material misstatement. An audit includes examining, on a test basis, evidence supporting the amounts and disclosures in the financial statements, assessing the accounting principles used and significant estimates made by management, and evaluating the overall financial statement presentation. We believe that our audit, which included confirmation of securities at November 30, 2010 by correspondence with the custodian, provides a reasonable basis for our opinion. The statement of changes in net assets for the year ended November 30, 2009 and the financial highlights for each of the four years in the period ended November 30, 2009 were audited by other independent accountants whose report dated January 21, 2010 expressed an unqualified opinion on those statements.
PricewaterhouseCoopers LLP
Philadelphia, Pennsylvania
January 19, 2011
38
Other Fund information
(Unaudited)
Delaware Value® Fund
Change in Independent Registered Public Accounting Firm
Due to independence matters under the Securities and Exchange Commission’s auditor independence rules relating to the January 4, 2010 acquisition of Delaware Investments (including DMC, DDLP and DSC) by Macquarie Group, Ernst & Young LLP (“E&Y”) has resigned as the independent registered public accounting firm for Delaware Group® Equity Funds II (the “Trust”) effective May 20, 2010. At a meeting held on May 20, 2010, the Board of Trustees of the Fund, upon recommendation of the Audit Committee, selected PricewaterhouseCoopers LLP (“PwC”) to serve as the independent registered public accounting firm for the Trust for the fiscal year ending November 30, 2010. During the fiscal years ended November 30, 2009 and 2008, E&Y’s audit reports on the financial statements of the Trust did not contain any adverse opinion or disclaimer of opinion, nor were they qualified or modified as to uncertainty, audit scope, or accounting principles. In addition, there were no disagreements between the Trust and E&Y on accounting principles, financial statements disclosures or audit scope, which, if not resolved to the satisfaction of E&Y, would have caused them to make reference to the disagreement in their reports. Neither the Trust nor anyone on its behalf has consulted with PwC at any time prior to their selection with respect to the application of accounting principles to a specified transaction, either completed or proposed or the type of audit opinion that might be rendered on the Trust’s financial statements.
39
Board of trustees/directors and officers addendum
Delaware Investments® Family of Funds
A mutual fund is governed by a Board of Trustees/Directors (“Trustees”), which has oversight responsibility for the management of a fund’s business affairs. Trustees establish procedures and oversee and review the performance of the investment manager, the distributor, and others who perform services for the fund. The independent fund trustees, in particular, are advocates
| Name, Address, | Position(s) | Length of |
| and Birth Date | Held with Fund(s) | Time Served |
| Interested Trustees | | |
| | | |
| Patrick P. Coyne1 | Chairman, President, | Chairman and Trustee |
| 2005 Market Street | Chief Executive Officer, | since August 16, 2006 |
| Philadelphia, PA 19103 | and Trustee | |
| April 1963 | | President and |
| | | Chief Executive Officer |
| | | since August 1, 2006
|
1 Patrick P. Coyne is considered to be an “Interested Trustee” because he is an executive officer of the Fund’s(s’) investment advisor.
40
for shareholder interests. Each trustee has served in that capacity since he or she was elected to or appointed to the Board of Trustees, and will continue to serve until his or her retirement or the election of a new trustee in his or her place. The following is a list of the Trustees and Officers with certain background and related information.
| | Number of Portfolios in | |
| Principal Occupation(s) | Fund Complex Overseen | Other Directorships |
| During Past 5 Years | by Trustee or Officer | Held by Trustee or Officer |
| | | |
| | | |
| Patrick P. Coyne has served in | 78 | Director |
| various executive capacities | | Kaydon Corp. |
| at different times at | | |
| Delaware Investments.2 | | Board of Governors Member |
| | | Investment Company |
| | | Institute (ICI) |
| | | |
| | | Finance Committee Member |
| | | St. John Vianney Roman |
| | | Catholic Church |
| | | |
| | | Board of Trustees |
| | | Agnes Irwin School |
| | | |
| | | Member of Investment |
| | | Committee |
| | | Cradle of Liberty Council, |
| | | BSA |
| | | (2007 – 2010) |
| | |
|
2 Delaware Investments is the marketing name for Delaware Management Holdings, Inc. and its subsidiaries, including the Fund’s(s’) investment advisor, principal underwriter, and its transfer agent.
41
Board of trustees/directors and officers addendum
Delaware Investments® Family of Funds
| Name, Address, | Position(s) | Length of |
| and Birth Date | Held with Fund(s) | Time Served |
| Independent Trustees | | |
| | | |
| Thomas L. Bennett | Trustee | Since March 2005 |
| 2005 Market Street | | |
| Philadelphia, PA 19103 | | |
| October 1947 | | |
| | |
| John A. Fry | Trustee | Since January 2001 |
| 2005 Market Street | | |
| Philadelphia, PA 19103 | | |
| May 1960 | | |
| | |
| Anthony D. Knerr | Trustee | Since April 1990 |
| 2005 Market Street | | |
| Philadelphia, PA 19103 | | |
| December 1938 | | |
| | |
| Lucinda S. Landreth | Trustee | Since March 2005 |
| 2005 Market Street | | |
| Philadelphia, PA 19103 | | |
June 1947
| | |
42
| | Number of Portfolios in | |
| Principal Occupation(s) | Fund Complex Overseen | Other Directorships |
| During Past 5 Years | by Trustee or Officer | Held by Trustee or Officer |
| | | |
| | | |
| Private Investor | 78 | Director |
| (March 2004–Present) | | Bryn Mawr Bank Corp. (BMTC) |
| | | |
| Investment Manager | | Chairman of Investment |
| Morgan Stanley & Co. | | Committee |
| (January 1984–March 2004) | | Pennsylvania Academy of |
| | | Fine Arts |
| | | |
| | | Investment Committee and |
| | | Governance Committee |
| | | Member |
| | | Pennsylvania Horticultural |
| | | Society
|
| President | 78 | Director |
| Drexel University | | Community Health Systems |
| (August 2010–Present) | | |
| | | Director — Ecore |
| President | | International |
| Franklin & Marshall College | | (2009 – 2010) |
| (July 2002–July 2010) | | |
| | | Director — Allied |
| Executive Vice President | | Barton Securities Holdings |
| University of Pennsylvania | | (2005 – 2008) |
(April 1995–June 2002)
| | |
| Founder and | 78 | None |
| Managing Director | | |
| Anthony Knerr & Associates | | |
| (Strategic Consulting) | | |
(1990–Present)
| | |
| Chief Investment Officer | 78 | None |
| Assurant, Inc. (Insurance) | | |
| (2002–2004) | | |
| | |
43
Board of trustees/directors and officers addendum
Delaware Investments® Family of Funds
| Name, Address, | Position(s) | Length of |
| and Birth Date | Held with Fund(s) | Time Served |
| Independent Trustees (continued) | | |
| | | |
| Ann R. Leven | Trustee | Since October 1989 |
| 2005 Market Street | | |
| Philadelphia, PA 19103 | | |
| November 1940 | | |
| | |
| Thomas F. Madison | Trustee | Since May 19973 |
| 2005 Market Street | | |
| Philadelphia, PA 19103 | | |
| February 1936 | | |
| | |
3 In 1997, several funds managed by Voyageur Fund Managers, Inc. (the “Voyageur Funds”) were incorporated into the Delaware Investments Family of Funds. Mr. Madison served as a director of the Voyageur Funds from 1993 until 1997.
44
| | Number of Portfolios in | |
| Principal Occupation(s) | Fund Complex Overseen | Other Directorships |
| During Past 5 Years | by Trustee or Officer | Held by Trustee or Officer |
| | | |
| | | |
| Consultant | 78 | Director and Audit |
| ARL Associates | | Committee Chair – |
| (Financial Planning) | | Systemax Inc. |
| (1983–Present) | | (2001 – 2009) |
| | | |
| | | Director and Audit |
| | | Committee Chairperson – |
| | | Andy Warhol Foundation |
| | | (1999 – 2007)
|
| President and | 78 | Director and Chair of |
| Chief Executive Officer | | Compensation Committee, |
| MLM Partners, Inc. | | Governance Committee |
| (Small Business Investing | | Member |
| and Consulting) | | CenterPoint Energy |
| (January 1993–Present) | | |
| | | Lead Director and Chair of |
| | | Audit and Governance |
| | | Committees, Member of |
| | | Compensation Committee |
| | | Digital River, Inc. |
| | | |
| | | Director and Chair of |
| | | Governance Committee, |
| | | Audit Committee |
| | | Member |
| | | Rimage Corporation |
| | | |
| | | Director and Chair of |
| | | Compensation Committee |
| | | Spanlink Communications |
| | | |
| | | Lead Director and Member of |
| | | Compensation and |
| | | Governance Committees |
| | | Valmont Industries, Inc. |
| | | (1987 – 2010)
|
45
Board of trustees/directors and officers addendum
Delaware Investments® Family of Funds
| Name, Address, | Position(s) | Length of |
| and Birth Date | Held with Fund(s) | Time Served |
| Independent Trustees (continued) | | |
| | | |
| Thomas F. Madison | | |
| 2005 Market Street | | |
| Philadelphia, PA 19103 | | |
February 1936
| | |
| Janet L. Yeomans | Trustee | Since April 1999 |
| 2005 Market Street | | |
| Philadelphia, PA 19103 | | |
| July 1948 | | |
| | |
| J. Richard Zecher | Trustee | Since March 2005 |
| 2005 Market Street | | |
| Philadelphia, PA 19103 | | |
| July 1940 | | |
| | |
46
| | Number of Portfolios in | |
| Principal Occupation(s) | Fund Complex Overseen | Other Directorships |
| During Past 5 Years | by Trustee or Officer | Held by Trustee or Officer |
| | | |
| | | |
| | | Director |
| | | Banner Health |
| | | (1996 – 2007) |
| | |
|
| Vice President and Treasurer | 78 | Director |
| (January 2006–Present) | | Okabena Company |
| Vice President — Mergers & Acquisitions | | |
| (January 2003–January 2006), and | | |
| Vice President | | |
| (July 1995–January 2003) | | |
3M Corporation
| | |
| Founder | 78 | Director and Audit |
| Investor Analytics | | Committee Member |
| (Risk Management) | | Investor Analytics |
| (May 1999–Present) | | |
| | | |
| Founder | | Director |
| Sutton Asset Management | | Oxigene, Inc. |
| (Hedge Fund) | | (2003 – 2008) |
| (September 1996–Present) | | |
| | |
47
Board of trustees/directors and officers addendum
Delaware Investments® Family of Funds
| Name, Address, | Position(s) | Length of |
| and Birth Date | Held with Fund(s) | Time Served |
| Officers | | |
| | | |
| David F. Connor | Vice President, | Vice President since |
| 2005 Market Street | Deputy General | September 2000 |
| Philadelphia, PA 19103 | Counsel, and Secretary | and Secretary since |
| December 1963 | | October 2005 |
| | |
| Daniel V. Geatens | Vice President | Treasurer |
| 2005 Market Street | and Treasurer | since October 2007 |
| Philadelphia, PA 19103 | | |
October 1972
| | |
| David P. O’Connor | Senior Vice President, | Senior Vice President, |
| 2005 Market Street | General Counsel, | General Counsel, and |
| Philadelphia, PA 19103 | and Chief Legal Officer | Chief Legal Officer |
February 1966
| | since October 2005 |
| Richard Salus | Senior Vice President | Chief Financial Officer |
| 2005 Market Street | and Chief Financial Officer | since November 2006 |
| Philadelphia, PA 19103 | | |
October 1963
| | |
The Statement of Additional Information for the Fund(s) includes additional information about the Trustees and Officers and is available, without charge, upon request by calling 800 523-1918.
48
| | Number of Portfolios in | |
| Principal Occupation(s) | Fund Complex Overseen | Other Directorships |
| During Past 5 Years | by Trustee or Officer | Held by Trustee or Officer |
| | | |
| | | |
| David F. Connor has served as | 78 | None4 |
| Vice President and Deputy | | |
| General Counsel of | | |
| Delaware Investments | | |
since 2000.
| | |
| Daniel V. Geatens has served | 78 | None4 |
| in various capacities at | | |
| different times at | | |
Delaware Investments.
| | |
| David P. O’Connor has served in | 78 | None4 |
| various executive and legal | | |
| capacities at different times | | |
at Delaware Investments.
| | |
| Richard Salus has served in | 78 | None4 |
| various executive capacities | | |
| at different times at | | |
Delaware Investments.
| | |
4 David F. Connor, Daniel V. Geatens, David P. O’Connor, and Richard Salus serve in similar capacities for the six portfolios of the Optimum Fund Trust, which have the same investment advisor, principal underwriter, and transfer agent as the registrant.
49
About the organization
| Board of trustees | | | |
Patrick P. Coyne
Chairman, President, and
Chief Executive Officer
Delaware Investments®
Family of Funds
Philadelphia, PA
Thomas L. Bennett
Private Investor
Rosemont, PA
John A. Fry
President
Drexel University
Philadelphia, PA | Anthony D. Knerr
Founder and Managing
Director
Anthony Knerr &
Associates
New York, NY
Lucinda S. Landreth
Former Chief Investment
Officer
Assurant, Inc.
Philadelphia, PA
| Ann R. Leven
Consultant
ARL Associates
New York, NY
Thomas F. Madison
President and
Chief Executive Officer
MLM Partners, Inc.
Minneapolis, MN
| Janet L. Yeomans
Vice President and
Treasurer
3M Corporation
St. Paul, MN
J. Richard Zecher
Founder
Investor Analytics
Scottsdale, AZ
|
| | | | |
| Affiliated officers | | | |
David F. Connor
Vice President, Deputy
General Counsel, and
Secretary
Delaware Investments
Family of Funds
Philadelphia, PA | Daniel V. Geatens
Vice President and
Treasurer
Delaware Investments
Family of Funds
Philadelphia, PA | David P. O’Connor
Senior Vice President,
General Counsel,
and Chief Legal Officer
Delaware Investments
Family of Funds
Philadelphia, PA | Richard Salus
Senior Vice President and
Chief Financial Officer
Delaware Investments
Family of Funds
Philadelphia, PA |
This annual report is for the information of Delaware Value® Fund shareholders, but it may be used with prospective investors when preceded or accompanied by a current prospectus for Delaware Value Fund and the Delaware Investments Fund fact sheet for the most recently completed calendar quarter. These documents are available at www.delawareinvestments.com. The prospectus sets forth details about charges, expenses, investment objectives, and operating policies of the investment company. You should read the prospectus carefully before you invest. The figures in this report represent past results that are not a guarantee of future results. The return and principal value of an investment in the investment company will fluctuate so that shares, when redeemed, may be worth more or less than their original cost. |
Delaware Investments is the marketing name of Delaware Management Holdings, Inc. and its subsidiaries. The Fund files its complete schedule of portfolio holdings with the Securities and Exchange Commission (SEC) for the first and third quarters of each fiscal year on Form N-Q. The Fund’s Forms N-Q, as well as a description of the policies and procedures that the Fund uses to determine how to vote proxies (if any) relating to portfolio securities are available without charge (i) upon request, by calling 800 523-1918; and (ii) on the SEC’s Web site at www.sec.gov. In addition, a description of the policies and procedures that the Fund uses to determine how to vote proxies (if any) relating to portfolio securities and the Fund’s Schedule of Investments are available without charge on the Fund’s Web site at www.delawareinvestments.com. The Fund’s Forms N-Q may be reviewed and copied at the SEC’s Public Refe rence Room in Washington, D.C.; information on the operation of the Public Reference Room may be obtained by calling 800 SEC-0330. Information (if any) regarding how the Fund voted proxies relating to portfolio securities during the most recently disclosed 12-month period ended June 30 is available without charge (i) through the Fund’s Web site at www.delawareinvestments.com; and (ii) on the SEC’s Web site at www.sec.gov. |
50
Annual report Delaware Large Cap Value Fund November 30, 2010 Value equity mutual fund |
This annual report is for the information of Delaware Large Cap Value Fund shareholders, but it may be used with prospective investors when preceded or accompanied by a current prospectus for Delaware Large Cap Value Fund. The figures in the annual report for Delaware Large Cap Value Fund represent past results, which are not a guarantee of future results. The return and principal value of an investment in the Fund will fluctuate so that shares, when redeemed, may be worth more or less than their original cost. Current performance may be higher or lower than the performance data quoted.
You should consider the investment objectives, risks, charges, and expenses of the Fund carefully before investing. Delaware Large Cap Value Fund prospectus contains this and other important information about the Fund. Prospectuses for all open-end funds in the Delaware Investments® Family of Funds are available from your financial advisor, online at www.delawareinvestments.com, or by phone at 800 523-1918. Please read the prospectus carefully before you invest or send money.
|
You can obtain shareholder reports and prospectuses online instead of in the mail.
Visit www.delawareinvestments.com/edelivery. |
Experience Delaware Investments
Delaware Investments is committed to the pursuit of consistently superior asset management and unparalleled client service. We believe in our investment processes, which seek to deliver consistent results, and in convenient services that help add value for our clients.
If you are interested in learning more about creating an investment plan, contact your financial advisor.
You can learn more about Delaware Investments or obtain a prospectus for Delaware Large Cap Value Fund at www.delawareinvestments.com.
Manage your investments online
- 24-hour access to your account information
- Obtain share prices
- Check your account balance and recent transactions
- Request statements or literature
- Make purchases and redemptions
Delaware Management Holdings, Inc., and its subsidiaries (collectively known by the marketing name of Delaware Investments) are wholly owned subsidiaries of Macquarie Group Limited, a global provider of banking, financial, advisory, investment and funds management services.
Investments in Delaware Large Cap Value Fund are not and will not be deposits with or liabilities of Macquarie Bank Limited ABN 46 008 583 542 and its holding companies, including their subsidiaries or related companies (Macquarie Group), and are subject to investment risk, including possible delays in repayment and loss of income and capital invested. No Macquarie Group company guarantees or will guarantee the performance of the Fund, the repayment of capital from the Fund, or any particular rate of return.
| Table of contents | | |
| Portfolio management review | | 1 |
| Performance summary | | 4 |
| Disclosure of Fund expenses | | 8 |
| Sector allocation and top 10 holdings | | 10 |
| Statement of net assets | | 11 |
| Statement of operations | | 15 |
| Statements of changes in net assets | | 16 |
| Financial highlights | | 18 |
| Notes to financial statements | | 28 |
| Report of independent registered | | |
| public accounting firm | | 38 |
| Other Fund information | | 39 |
| Board of trustees/directors and | | |
| officers addendum | | 40 |
| About the organization | | 50 |
Unless otherwise noted, views expressed herein are current as of Nov. 30, 2010, and are subject to change.
Funds are not FDIC insured and are not guaranteed. It is possible to lose the principal amount invested.
Mutual fund advisory services provided by Delaware Management Company, a series of Delaware Management Business Trust, which is a registered investment advisor. Delaware Investments, a member of Macquarie Group, refers to Delaware Management Holdings, Inc. and its subsidiaries, including the Fund’s distributor, Delaware Distributors, L.P. Macquarie Group refers to Macquarie Group Limited and its subsidiaries and affiliates worldwide.
© 2011 Delaware Management Holdings, Inc.
All third-party trademarks cited are the property of their respective owners.
| Portfolio management review |
| Delaware Large Cap Value Fund | | December 7, 2010 |
| Performance preview (for the year ended November 30, 2010) | | | | |
| Delaware Large Cap Value Fund (Class A shares) | | 1-year return | | +9.98% |
| Russell 1000® Value Index (benchmark) | | 1-year return | | +8.95% |
Past performance does not guarantee future results.
For complete, annualized performance for Delaware Large Cap Value Fund, please see the table on page 4.
The performance of Class A shares excludes the applicable sales charge and reflects the reinvestment of all distributions.
Index performance returns do not reflect any management fees, transaction costs, or expenses. Indices are unmanaged and one cannot invest directly in an index. |
For its fiscal year ended Nov. 30, 2010, Delaware Large Cap Value Fund (Class A shares) returned +9.98% at net asset value, and +3.64% at maximum offer price (both returns assume reinvestment of all distributions). In comparison, the Fund’s benchmark, the Russell 1000 Value Index, returned +8.95% during the same time period. Complete annualized performance for Delaware Large Cap Value Fund is shown in the table on page 4.
Although U.S. stock prices finished the fiscal year on an upswing and achieved solid gains overall, these results masked the stock market’s fluctuating performance during that time span.
As the Fund’s fiscal year began, many equity investors remained optimistic about the U.S. economic recovery. Stock prices, which began a long rally back in March 2009, continued to climb through late April 2010 when investor sentiment abruptly reversed course due to several factors, including:
- Worries about the financial health of certain European governments, especially Greece
- The uncertain economic effects of the Gulf of Mexico oil spill
- New economic data showing a more vulnerable U.S. economy
We continued to adhere to our bottom-up stock selection process during the Fund’s fiscal year, meaning we chose to invest in stocks one at a time, based on our assessment of their individual characteristics. We continued favoring stocks that, in our view, had consistent earnings and relatively healthy balance sheets — the types of stocks that, since the market’s April 2010 peak, have generally enjoyed better performance than their lower-quality counterparts.
1
Portfolio management review
Delaware Large Cap Value Fund
Against this backdrop, stocks turned in sluggish results through the rest of the spring and summer of 2010. However, a strong rebound in early fall propelled equity values upward during the last three months of the fiscal year.
In this environment, the Fund enjoyed good results in absolute terms, as well as relative to its benchmark, the Russell 1000 Value Index. From a sector perspective, the most notable source of outperformance came from strategic allocations within the energy and financials sectors. Among energy stocks, the Fund was helped by having less exposure than the benchmark early in the fiscal year, while a few well-chosen energy stocks actually boosted returns. In financials, the main source of the Fund’s outperformance compared with the benchmark index was the Fund’s significant underweighting in this group. The sector generated a positive return of less than 1% within the benchmark index and was one of that index’s weakest-performing sectors during the fiscal year.
One of the top individual contributors to the Fund’s performance was Xerox, a manufacturer of printers and copiers, and a provider of document-oriented and other technology services. We believe the company’s integration with recently acquired Affiliated Computer Services seems to be meeting the market’s expectations, and Xerox recently indicated that demand for its products and services is starting to look better.
Another noteworthy contributor to the Fund’s performance was National Oilwell Varco, a provider of equipment and services for oil and natural gas rigs. The company’s share price rebounded from the large selloff in energy stocks associated with the BP oil spill. It also appears to be benefiting from ongoing global activity in oil and gas exploration.
In contrast, the Fund’s unfavorable positioning in the consumer staples and consumer discretionary sectors was a source of underperformance. In addition to some disappointing stock selection in both groups, the Fund was underweighted in the outperforming consumer discretionary sector.
Two of the Fund’s weakest performers during the Fund’s fiscal year came from the healthcare sector: Quest Diagnostics and Pfizer.
Among Quest’s laboratory testing services is pre-employment testing — a business that slowed down for the company in concert with the decelerating job market. Against this backdrop, Quest forecasted slower-than-anticipated revenues for its 2010 fiscal year. We still have a positive outlook for Quest and therefore continue to hold the stock in the Fund. In our view, the company has strong cash flow and should benefit, over time, if higher testing volumes occur, for example, due to an aging population in the United States.
Pfizer, the large pharmaceutical manufacturer, has been working through its integration with Wyeth, which it acquired last year. Overall, sales results for the company have been mixed and, broadly speaking, investors remain concerned about Pfizer’s upcoming patent expirations and overall growth prospects. We continue to hold the stock in the Fund. The company remains attractive, in our view, because of what we consider its low valuation (inclusive of patent expirations), highly rated balance sheet, and above-average dividend yield.
We continued to adhere to our bottom-up stock selection process during the Fund’s fiscal year, meaning we chose to invest in stocks one at a time, based on our assessment of their individual characteristics. We continued favoring stocks that, in our view, had consistent earnings and relatively healthy balance sheets
2
— the types of stocks that, since the market’s April 2010 peak, have generally enjoyed better performance than their lower-quality counterparts.
While changes to the Fund were relatively modest during the reporting period, we did sell a handful of stocks when we felt they had reached or come close to our target price, and we replaced them with securities that we felt offered significantly better value potential. For example, within the consumer discretionary sector, we sold the Fund’s position in toy manufacturer Mattel because the company had achieved our investment objectives during the course of the past several years. We felt that it now offered more downside risk than upside potential, and we used the proceeds of our sale to add a position in cable television provider Comcast, whose shares we felt were quite inexpensive relative to their long-term performance prospects.
Similarly, we sold the Fund’s stake in food-products business H.J. Heinz, which we originally purchased when the company was seeking to turn around its declining business. As Heinz gradually improved its profit margins and earnings, the stock performed well, leading us to exchange the position for a company we felt offered better long-term value potential: Williams Companies, a natural gas exploration and production firm that we felt was well priced and stood to benefit if long-term trends favoring demand for gas continue.
We also identified what, in our view, was a favorable opportunity within the financial sector. In September 2010, we added a position in Marsh & McLennan Companies, a major insurance brokerage and consulting firm. Marsh & McLennan had undergone significant turmoil and transformation during the past six years, including three leadership changes. Investor sentiment toward the company has seemed poor due to uncertainty about its business strategy, write-downs incurred from a recent divestiture, and weakness in property and casualty insurance pricing. However, the company seems to have “right-sized” its business, enabling it to better focus on core operations. The Fund’s investment team vi ewed Marsh & McLennan as an attractive long-term investment for a variety of reasons including its lower level of credit sensitivity relative to other financial companies. The company also had a global platform to help meet the needs of multinational customers, and a diversified revenue base.
We still foresee a prolonged recovery phase as the U.S. economy continues working through the excesses of the credit and housing bubbles. Similarly, our outlook for the stock market is unchanged. At the end of the Fund’s fiscal year, we continued to focus on what we believed were financially secure, attractively valued companies, which we viewed as being well positioned to withstand the potential risks in the shifting economic environment. Accordingly, the Fund’s largest allocations were in healthcare, consumer staples, and energy — sectors where we’ve been able to find attractively valued, financially strong global businesses. In addition, we feel these businesses can fare well under current market conditions. On the other hand, we continue to underweight the consumer discretionary and financial sectors due to our belief that consumer spending will likely remain soft and that credit-sensitive financials may be in f or a sustained period of lower earnings power. We’re also maintaining a below-benchmark weighting in industrials, waiting until we can find what we believe are good businesses trading at lower valuations in this sector.
3
| Performance summary |
| Delaware Large Cap Value Fund | November 30, 2010 |
The performance data quoted represent past performance; past performance does not guarantee future results. Investment return and principal value will fluctuate so your shares, when redeemed, may be worth more or less than their original cost. Please obtain the performance data current for the most recent month end by calling 800 523-1918 or visiting our Web site at www.delawareinvestments.com/performance. Current performance may be lower or higher than the performance data quoted.
Carefully consider the Fund’s investment objectives, risk factors, charges, and expenses before investing. This and other information can be found in the Fund’s prospectus and, if available, its summary prospectus, which may be obtained by visiting www.delawareinvestments.com or calling 800 523-1918. Investors should read the prospectus and, if available, the summary prospectus carefully before investing.
| Fund performance | | Average annual total returns through Nov. 30, 2010 |
| | | 1 year | | 5 years | | 10 years | | Lifetime |
| Class A (Est. March 18, 1957) | | | | | | | | | | | | |
| Excluding sales charge | | | +9.98% | | | | +0.04% | | | +1.84% | | n/a |
| Including sales charge | | | +3.64% | | | | -1.13% | | | +1.24% | | n/a |
| Class B (Est. Sept. 6, 1994) | | | | | | | | | | | | |
| Excluding sales charge | | | +9.24% | | | | -0.67% | | | +1.23% | | n/a |
| Including sales charge | | | +5.24% | | | | -1.01% | | | +1.23% | | n/a |
| Class C (Est. Nov. 29, 1995) | | | | | | | | | | | | |
| Excluding sales charge | | | +9.24% | | | | -0.67% | | | +1.10% | | n/a |
| Including sales charge | | | +8.24% | | | | -0.67% | | | +1.10% | | n/a |
| Class R (Est. June 2, 2003) | | | | | | | | | | | | |
| Excluding sales charge | | | +9.81% | | | | -0.17% | | | n/a | | +3.24% |
| Including sales charge | | | +9.81% | | | | -0.17% | | | n/a | | +3.24% |
| Institutional Class (Est. Jan. 13, 1994) | | | | | | | | | | | | |
| Excluding sales charge | | | +10.37% | | | | +0.33% | | | +2.11% | | n/a |
| Including sales charge | | | +10.37% | | | | +0.33% | | | +2.11% | | n/a |
Returns reflect the reinvestment of all distributions and any applicable sales charges as noted in the following paragraphs.
Performance for Class B and C shares, excluding sales charges, assumes either that contingent deferred sales charges did not apply or that the investment was not redeemed.
Expense limitations were in effect for certain classes during the periods shown in the “Fund performance” chart and in the “Performance of a $10,000 investment” chart. The current expenses for each class are listed on the “Fund expense ratios” chart. (Note that all charts and graphs referred to in the “Performance summary” section of this report are found on pages 4 through 6.) Performance would have been lower had the expense limitations not been in effect.
4
The Fund offers Class A, B, C, R, and Institutional Class shares.
Class A shares are sold with a maximum front-end sales charge of up to 5.75%, and have an annual distribution and service fee of up to 0.28% of average daily net assets.
The Board of Trustees has adopted a formula for calculating 12b-1 fees for the Fund’s Class A shares that went into effect on May 2, 1994. The total 12b-1 fees to be paid by Class A shareholders of the Fund will be the sum of 0.10% of the average daily net assets representing shares that were acquired prior to June 1, 1992, and 0.30% of the average daily net assets representing shares that were acquired on or after June 1, 1992. All Class A shareholders will bear 12b-1 fees at the same rate, the blended rate based upon the allocation of the 0.10% and 0.30% rates described above.
Class B shares may be purchased only through dividend reinvestment and certain permitted exchanges as described in the prospectus. Please see the prospectus for additional information on Class B purchase and sales charges. Class B shares have a contingent deferred sales charge that declines from 4.00% to zero depending on the period of time the shares are held.
Class B shares will automatically convert to Class A shares on a quarterly basis approximately eight years after purchase. They are also subject to an annual distribution and service fee of up to 1.00% of average daily net assets.
Ten-year performance figures for Class B shares reflect conversion to Class A shares after approximately eight years.
Class C shares are sold with a contingent deferred sales charge of 1.00% if redeemed during the first 12 months. They are also subject to an annual distribution and service fee of up to 1.00% of average daily net assets.
Class R shares are available only for certain retirement plan products. They are sold without a sales charge and have an annual distribution and service fee of up to 0.60% of average daily net assets, which has been limited contractually to 0.50% from March 30, 2010, through March 30, 2011.
Institutional Class shares are available without sales or asset-based distribution charges only to certain eligible institutional accounts.
The “Fund performance” table and the “Performance of a $10,000 investment” graph do not reflect the deduction of taxes the shareholder would pay on Fund distributions or redemptions of Fund shares.
The Fund’s expense ratios, as described in the most recent prospectus, are disclosed in the following “Fund expense ratios” chart. Delaware Investments has agreed to reimburse certain expenses and/or waive certain fees from March 30, 2010, through March 30, 2011. Please see the most recent prospectus and any applicable supplement(s) for additional information on these fee waivers and/or reimbursements.
| Fund expense ratios | Class A | | Class B | | Class C | | Class R | | Institutional Class |
| Total annual operating expenses | 1.29% | | 2.01% | | 2.01% | | 1.61% | | 1.01% |
| (without fee waivers) | | | | | | | | | |
| Net expenses | 1.29% | | 2.01% | | 2.01% | | 1.51% | | 1.01% |
| (including fee waivers, if any) | | | | | | | | | |
| Type of waiver | n/a | | n/a | | n/a | | Contractual | | n/a |
5
Performance summary
Delaware Large Cap Value Fund
Performance of a $10,000 investment
Average annual total returns from Nov. 30, 2000, through Nov. 30, 2010
| For period beginning Nov. 30, 2000, through Nov. 30, 2010 | Starting value | Ending value |
| | Russell 1000 Value Index | $10,000 | $13,410 |
| | Delaware Large Cap Value Fund — Class A Shares | $9,425 | $11,307 |
The chart assumes $10,000 invested in the Fund on Nov. 30, 2000, and includes the effect of a 5.75% front-end sales charge and the reinvestment of all distributions. Please note additional details on these fees in the “Performance summary” section of this report, which includes pages 4 through 6.
The chart also assumes $10,000 invested in the Russell 1000 Value Index as of Nov. 30, 2000.
The Russell 1000 Value Index measures the performance of the large-cap value segment of the U.S. equity universe. It includes those Russell 1000 companies with lower price-to-book ratios and lower forecasted growth values.
Index performance returns do not reflect any management fees, transaction costs or expenses. Indices are unmanaged and one cannot invest directly in an index. Past performance is not a guarantee of future results.
Performance of other Fund classes will vary due to different charges and expenses.
The “Fund performance” chart and the “Performance of a $10,000 investment” graph do not reflect the deduction of taxes shareholders would pay on Fund distributions or redemptions of Fund shares.
| | | Nasdaq symbols | | CUSIPs | |
| Class A | | | DELDX | | | 245907100 | |
| Class B | | | DEIBX | | | 245907605 | |
| Class C | | | DECCX | | | 245907704 | |
| Class R | | | DECRX | | | 245907886 | |
| Institutional Class | | | DEDIX | | | 245907407 | |
6
Disclosure of Fund expenses
For the six-month period from June 1, 2010 to November 30, 2010
As a shareholder of the Fund, you incur two types of costs: (1) transaction costs, including sales charges (loads) on purchase payments, reinvested dividends, or other distributions; redemption fees; and exchange fees; and (2) ongoing costs, including management fees; distribution and/or service (12b-1) fees; and other Fund expenses. This example is intended to help you understand your ongoing costs (in dollars) of investing in the Fund and to compare these costs with the ongoing costs of investing in other mutual funds.
The example is based on an investment of $1,000 invested at the beginning of the period and held for the entire six-month period from June 1, 2010 to November 30, 2010.
Actual expenses
The first section of the table shown, “Actual Fund return,” provides information about actual account values and actual expenses. You may use the information in this section of the table, together with the amount you invested, to estimate the expenses that you paid over the period. Simply divide your account value by $1,000 (for example, an $8,600 account value divided by $1,000 = 8.6), then multiply the result by the number in the first section under the heading entitled “Expenses Paid During Period” to estimate the expenses you paid on your account during this period.
Hypothetical example for comparison purposes
The second section of the table shown, “Hypothetical 5% return,” provides information about hypothetical account values and hypothetical expenses based on the Fund’s actual expense ratio and an assumed rate of return of 5% per year before expenses, which is not the Fund’s actual return. The hypothetical account values and expenses may not be used to estimate the actual ending account balance or expenses you paid for the period. You may use this information to compare the ongoing costs of investing in the Fund and other funds. To do so, compare this 5% hypothetical example with the 5% hypothetical examples that appear in the shareholder reports of the other funds.
Please note that the expenses shown in the table are meant to highlight your ongoing costs only and do not reflect any transactional costs, such as sales charges (loads), redemption fees, or exchange fees. Therefore, the second section of the table is useful in comparing ongoing costs only, and will not help you determine the relative total costs of owning different funds. In addition, if these transactional costs were included, your costs would have been higher. The Fund’s expenses shown in the table reflect fee waivers in effect. The expenses shown in the table assume reinvestment of all dividends and distributions.
8
Delaware Large Cap Value Fund
Expense analysis of an investment of $1,000
| | | Beginning | | Ending | | | | | Expenses |
| | | Account Value | | Account Value | | Annualized | | Paid During Period |
| | | 6/1/10 | | 11/30/10 | | Expense Ratio | | 6/1/10 to 11/30/10* |
| Actual Fund return | | | | | | | | | | | | | | | |
| Class A | | $ | 1,000.00 | | | $ | 1,107.50 | | | 1.23 | % | | $ | 6.50 | |
| Class B | | | 1,000.00 | | | | 1,103.70 | | | 1.95 | % | | | 10.28 | |
| Class C | | | 1,000.00 | | | | 1,103.70 | | | 1.95 | % | | | 10.28 | |
| Class R | | | 1,000.00 | | | | 1,106.90 | | | 1.45 | % | | | 7.66 | |
| Institutional Class | | | 1,000.00 | | | | 1,109.20 | | | 0.95 | % | | | 5.02 | |
| Hypothetical 5% return (5% return before expenses) | | | | | | | | |
| Class A | | $ | 1,000.00 | | | $ | 1,018.80 | | | 1.23 | % | | $ | 6.33 | |
| Class B | | | 1,000.00 | | | | 1,015.29 | | | 1.95 | % | | | 9.85 | |
| Class C | | | 1,000.00 | | | | 1,015.29 | | | 1.95 | % | | | 9.85 | |
| Class R | | | 1,000.00 | | | | 1,017.80 | | | 1.45 | % | | | 7.33 | |
| Institutional Class | | | 1,000.00 | | | | 1,020.31 | | | 0.95 | % | | | 4.81 | |
| * | “Expenses Paid During Period” are equal to the Fund’s annualized expense ratio, multiplied by the average account value over the period, multiplied by 183/365 (to reflect the one-half year period). |
9
| Sector allocation and top 10 holdings |
| Delaware Large Cap Value Fund | | | | As of November 30, 2010 |
Sector designations may be different than the sector designations presented in other Fund materials. The sector designations may represent the investment manager’s internal sector classifications, which may result in the sector designations for one fund being different than another fund’s designations.
| Sector | Percentage of net assets |
| Common Stock | 99.54 | % |
| Consumer Discretionary | 6.18 | % |
| Consumer Staples | 14.76 | % |
| Energy | 15.35 | % |
| Financials | 12.02 | % |
| Healthcare | 17.62 | % |
| Industrials | 5.97 | % |
| Information Technology | 12.24 | % |
| Materials | 3.05 | % |
| Telecommunications | 6.21 | % |
| Utilities | 6.14 | % |
| Discount Note | 0.43 | % |
| Securities Lending Collateral | 12.53 | % |
| Total Value of Securities | 112.50 | % |
| Obligation to Return Securities Lending Collateral | (12.55 | %) |
| Receivables and Other Assets Net of Liabilities | 0.05 | % |
| Total Net Assets | 100.00 | % |
Holdings are for informational purposes only and are subject to change at any time. They are not a recommendation to buy, sell, or hold any security.
| Top 10 holdings | Percentage of net assets |
| National Oilwell Varco | 3.15 | % |
| Verizon Communications | 3.12 | % |
| Xerox | 3.11 | % |
| Lowe’s | 3.10 | % |
| Edison International | 3.10 | % |
| International Business Machines | 3.10 | % |
| Travelers | 3.09 | % |
| Bank of New York Mellon | 3.09 | % |
| AT&T | 3.08 | % |
| ConocoPhillips | 3.08 | % |
10
| Statement of net assets |
| Delaware Large Cap Value Fund | | November 30, 2010 |
| | | Number of shares | | Value |
| Common Stock – 99.54% | | | | |
| Consumer Discretionary – 6.18% | | | | |
| | Comcast Class A | 981,400 | | $ | 19,628,000 |
| | Lowe’s | 872,100 | | | 19,796,670 |
| | | | | | 39,424,670 |
| Consumer Staples – 14.76% | | | | |
| | Archer-Daniels-Midland | 628,000 | | | 18,205,720 |
| | CVS Caremark | 617,700 | | | 19,148,700 |
| | Kimberly-Clark | 301,200 | | | 18,641,268 |
| * | Kraft Foods Class A | 631,800 | | | 19,111,950 |
| * | Safeway | 832,200 | | | 19,132,278 |
| | | | | | 94,239,916 |
| Energy – 15.35% | | | | |
| | Chevron | 240,400 | | | 19,465,188 |
| | ConocoPhillips | 327,200 | | | 19,687,624 |
| * | Marathon Oil | 569,100 | | | 19,047,777 |
| | National Oilwell Varco | 328,200 | | | 20,115,378 |
| * | Williams | 861,800 | | | 19,657,658 |
| | | | | | 97,973,625 |
| Financials – 12.02% | | | | |
| | Allstate | 613,000 | | | 17,844,430 |
| | Bank of New York Mellon | 729,900 | | | 19,700,001 |
| * | Marsh & McLennan | 777,600 | | | 19,502,208 |
| | Travelers | 365,400 | | | 19,727,946 |
| | | | | | 76,774,585 |
| Healthcare – 17.62% | | | | |
| | Baxter International | 394,300 | | | 19,143,265 |
| | Cardinal Health | 529,300 | | | 18,832,494 |
| | Johnson & Johnson | 310,100 | | | 19,086,655 |
| | Merck | 517,800 | | | 17,848,566 |
| | Pfizer | 1,162,388 | | | 18,935,301 |
| * | Quest Diagnostics | 378,700 | | | 18,677,484 |
| | | | | | 112,523,765 |
| Industrials – 5.97% | | | | |
| * | Northrop Grumman | 303,600 | | | 18,726,048 |
| * | Waste Management | 566,900 | | | 19,416,325 |
| | | | | | 38,142,373 |
11
Statement of net assets
Delaware Large Cap Value Fund
| | | Number of shares | | Value |
| Common Stock (continued) | | | | |
| Information Technology – 12.24% | | | | |
| | Intel | 927,300 | | $ | 19,584,576 |
| | International Business Machines | 139,700 | | | 19,761,962 |
| † | Motorola | 2,480,800 | | | 19,002,928 |
| | Xerox | 1,730,200 | | | 19,828,092 |
| | | | | | 78,177,558 |
| Materials – 3.05% | | | | |
| | duPont (E.I.) deNemours | 414,300 | | | 19,467,957 |
| | | | | | 19,467,957 |
| Telecommunications – 6.21% | | | | |
| | AT&T | 708,700 | | | 19,694,773 |
| * | Verizon Communications | 622,700 | | | 19,932,627 |
| | | | | | 39,627,400 |
| Utilities – 6.14% | | | | |
| * | Edison International | 535,300 | | | 19,773,982 |
| * | Progress Energy | 444,200 | | | 19,407,098 |
| | | | | | 39,181,080 |
| Total Common Stock (cost $614,152,552) | | | | 635,532,929 |
| | | | | | |
| | | Principal amount | | | |
| ≠Discount Note – 0.43% | | | | |
| | Federal Home Loan Bank 0.07% 12/1/10 | $2,770,007 | | | 2,770,007 |
| Total Discount Note (cost $2,770,007) | | | | 2,770,007 |
| | | | | |
| Total Value of Securities Before Securities | | | | |
| | Lending Collateral – 99.97% (cost $616,922,559) | | | | 638,302,936 |
| | | | | | |
| | | Number of shares | | | |
| Securities Lending Collateral** – 12.53% | | | | |
| | Investment Companies | | | | |
| | BNY Mellon SL DBT II Liquidating Fund | 191,706 | | | 186,300 |
| | Delaware Investments Collateral Fund No.1 | 79,849,161 | | | 79,849,161 |
| | @†Mellon GSL Reinvestment Trust II | 71,917 | | | 0 |
| Total Securities Lending Collateral (cost $80,112,784) | | | | 80,035,461 |
12
| | | | |
| Total Value of Securities – 112.50% | | | |
| (cost $697,035,343) | $ | 718,338,397 | © |
| Obligation to Return Securities | | | |
| Lending Collateral** – (12.55%) | | (80,112,784 | ) |
| Receivables and Other Assets | | | |
| Net of Liabilities – 0.05% | | 276,145 | |
| Net Assets Applicable to 45,344,164 | | | |
| Shares Outstanding – 100.00% | $ | 638,501,758 | |
| | | | |
| Net Asset Value – Delaware Large Cap Value Fund | | | |
| Class A ($602,743,378 / 42,798,635 Shares) | | | $14.08 | |
| Net Asset Value – Delaware Large Cap Value Fund | | | |
| Class B ($10,636,621 / 761,418 Shares) | | | $13.97 | |
| Net Asset Value – Delaware Large Cap Value Fund | | | |
| Class C ($16,156,278 / 1,147,340 Shares) | | | $14.08 | |
| Net Asset Value – Delaware Large Cap Value Fund | | | |
| Class R ($968,599 / 68,851 Shares) | | | $14.07 | |
| Net Asset Value – Delaware Large Cap Value Fund | | | |
| Institutional Class ($7,996,882 / 567,920 Shares) | | | $14.08 | |
| | | | |
| Components of Net Assets at November 30, 2010: | | | |
| Shares of beneficial interest (unlimited authorization – no par) | $ | 825,973,619 | |
| Undistributed net investment income | | 2,991,551 | |
| Accumulated net realized loss on investments | | (211,766,466 | ) |
| Net unrealized appreciation of investments | | 21,303,054 | |
| Total net assets | $ | 638,501,758 | |
| ≠ | The rate shown is the effective yield at the time of purchase. |
| † | Non income producing security. |
| * | Fully or partially on loan. |
| ** | See Note 8 in “Notes to financial statements.“ |
| @ | Illiquid security. At November 30, 2010, the aggregate amount of illiquid securities was $0, which represented 0.00% of the Fund’s net assets. See Note 9 in “Notes to financial statements.“ |
| © | Includes $78,494,403 of securities loaned. |
13
Statement of net assets
Delaware Large Cap Value Fund
| | | |
| Net Asset Value and Offering Price Per Share – | | |
| Delaware Large Cap Value Fund | | |
| Net asset value Class A (A) | $ | 14.08 |
| Sales charge (5.75% of offering price) (B) | | 0.86 |
| Offering price | $ | 14.94 |
| (A) | | Net asset value per share, as illustrated, is the amount which would be paid upon redemption or repurchase of shares. |
| (B) | | See the current prospectus for purchases of $50,000 or more. |
See accompanying notes, which are an integral part of the financial statements.
14
| Statement of operations |
| Delaware Large Cap Value Fund | Year Ended November 30, 2010 |
| Investment Income: | | | | | | | |
| Dividends | | $ | 19,413,751 | | | | |
| Interest | | | 42,354 | | | | |
| Securities lending income | | | 15,643 | | $ | 19,471,748 | |
| | | | | | | | |
| Expenses: | | | | | | | |
| Management fees | | | 4,158,601 | | | | |
| Distribution expenses – Class A | | | 1,708,393 | | | | |
| Distribution expenses – Class B | | | 127,716 | | | | |
| Distribution expenses – Class C | | | 161,158 | | | | |
| Distribution expenses – Class R | | | 6,458 | | | | |
| Dividend disbursing and transfer agent fees and expenses | | | 1,438,004 | | | | |
| Accounting and administration expenses | | | 258,370 | | | | |
| Reports and statements to shareholders | | | 97,848 | | | | |
| Registration fees | | | 89,224 | | | | |
| Legal fees | | | 68,668 | | | | |
| Audit and tax | | | 41,998 | | | | |
| Trustees’ fees | | | 39,240 | | | | |
| Insurance fees | | | 29,158 | | | | |
| Dues and services | | | 26,851 | | | | |
| Custodian fees | | | 13,977 | | | | |
| Consulting fees | | | 9,266 | | | | |
| Trustees’ expenses | | | 2,964 | | | | |
| Pricing fees | | | 2,645 | | | 8,280,539 | |
| Less waived distribution expenses – Class R | | | | | | (1,075 | ) |
| Less expense paid indirectly | | | | | | (2,439 | ) |
| Total operating expenses | | | | | | 8,277,025 | |
| Net Investment Income | | | | | | 11,194,723 | |
| | | | | | | | |
| Net Realized and Unrealized Gain on Investments: | | | | | | | |
| Net realized gain on investments | | | | | | 8,764,282 | |
| Net change in unrealized appreciation/depreciation of investments | | | 42,702,269 | |
| Net Realized and Unrealized Gain on Investments | | | | | | 51,466,551 | |
| | | | | | | | |
| Net Increase in Net Assets Resulting from Operations | | | | | $ | 62,661,274 | |
See accompanying notes, which are an integral part of the financial statements.
15
Statements of changes in net assets
Delaware Large Cap Value Fund
| | | Year Ended |
| | | 11/30/10 | | 11/30/09 |
| Increase (Decrease) in Net Assets from Operations: | | | | | | | | |
| Net investment income | | $ | 11,194,723 | | | $ | 16,200,481 | |
| Net realized gain (loss) on investments | | | 8,764,282 | | | | (46,403,394 | ) |
| Net change in unrealized | | | | | | | | |
| appreciation/depreciation of investments | | | 42,702,269 | | | | 155,924,206 | |
| Net increase in net assets | | | | | | | | |
| resulting from operations | | | 62,661,274 | | | | 125,721,293 | |
| | | | | | | | | |
| Dividends and Distributions to Shareholders from: | | | | | | | | |
| Net investment income: | | | | | | | | |
| Class A | | | (13,169,205 | ) | | | (17,440,301 | ) |
| Class B | | | (194,905 | ) | | | (475,529 | ) |
| Class C | | | (231,976 | ) | | | (375,250 | ) |
| Class R | | | (509,991 | ) | | | (36,737 | ) |
| Institutional Class | | | (24,136 | ) | | | (813,219 | ) |
| | | | (14,130,213 | ) | | | (19,141,036 | ) |
| | | | | | | | | |
| Capital Share Transactions: | | | | | | | | |
| Proceeds from shares sold: | | | | | | | | |
| Class A | | | 17,359,699 | | | | 19,271,954 | |
| Class B | | | 112,478 | | | | 266,760 | |
| Class C | | | 1,515,501 | | | | 2,253,941 | |
| Class R | | | 199,182 | | | | 472,281 | |
| Institutional Class | | | 2,673,146 | | | | 3,769,779 | |
| | | | | | | | | |
| Net asset value of shares issued upon reinvestment | | | | | | | | |
| of dividends and distributions: | | | | | | | | |
| Class A | | | 11,732,951 | | | | 15,542,064 | |
| Class B | | | 188,987 | | | | 448,159 | |
| Class C | | | 220,325 | | | | 356,654 | |
| Class R | | | 24,136 | | | | 36,737 | |
| Institutional Class | | | 509,505 | | | | 813,219 | |
| | | | 34,535,910 | | | | 43,231,548 | |
16
| | | Year Ended |
| | | 11/30/10 | | 11/30/09 |
| Capital Share Transactions (continued): | | | | | | | | |
| Cost of shares repurchased: | | | | | | | | |
| Class A | | $ | (94,687,858 | ) | | $ | (95,028,180 | ) |
| Class B | | | (6,773,812 | ) | | | (9,243,153 | ) |
| Class C | | | (3,466,240 | ) | | | (3,926,417 | ) |
| Class R | | | (842,853 | ) | | | (491,682 | ) |
| Institutional Class | | | (25,458,376 | ) | | | (5,327,537 | ) |
| | | | (131,229,139 | ) | | | (114,016,969 | ) |
| Decrease in net assets derived from capital share transactions | | | (96,693,229 | ) | | | (70,785,421 | ) |
| Net Increase (Decrease) in Net Assets | | | (48,162,168 | ) | | | 35,794,836 | |
| | | | | | | | | |
| Net Assets: | | | | | | | | |
| Beginning of year | | | 686,663,926 | | | | 650,869,090 | |
| End of year (including undistributed net investment | | | | | | | | |
| income of $2,991,551 and $5,927,041, respectively) | | $ | 638,501,758 | | | $ | 686,663,926 | |
See accompanying Notes, which are an integral part of the financial statements.
17
Financial highlights
Delaware Large Cap Value Fund Class A
Selected data for each share of the Fund outstanding throughout each period were as follows:
| Net asset value, beginning of period |
| |
| Income (loss) from investment operations: |
| Net investment income1 |
| Net realized and unrealized gain (loss) on investments and foreign currencies |
| Total from investment operations |
| |
| Less dividends and distributions from: |
| Net investment income |
| Net realized gain on investments |
| Total dividends and distributions |
| |
| Net asset value, end of period |
| |
| Total return2 |
| |
| Ratios and supplemental data: |
| Net assets, end of period (000 omitted) |
| Ratio of expenses to average net assets |
| Ratio of expenses to average net assets |
| prior to fees waived and expense paid indirectly |
| Ratio of net investment income to average net assets |
| Ratio of net investment income to average net assets |
| prior to fees waived and expense paid indirectly |
| Portfolio turnover |
1 The average shares outstanding method has been applied for per share information.
2 Total investment return is based on the change in net asset value of a share during the period and assumes reinvestment of dividends and distributions at net asset value and does not reflect the impact of a sales charge. Total investment return during some of the periods shown reflects a waiver by the manager. Performance would have been lower had the waiver not been in effect.
See accompanying notes, which are an integral part of the financial statements.
18
| | Year Ended |
| | | 11/30/10 | | 11/30/09 | | 11/30/08 | | 11/30/07 | | 11/30/06 | |
| | | $13.080 | | | $11.080 | | | $20.390 | | | $21.080 | | | $19.010 | | |
| | | | | | | | | | | | | | | | | |
| | | | | | | | | | | | | | | | | |
| | | 0.232 | | | 0.293 | | | 0.305 | | | 0.336 | | | 0.305 | | |
| | | 1.053 | | | 2.046 | | | (7.418 | ) | | 0.090 | | | 3.279 | | |
| | | 1.285 | | | 2.339 | | | (7.113 | ) | | 0.426 | | | 3.584 | | |
| | | | | | | | | | | | | | | | | |
| | | | | | | | | | | | | | | | | |
| | | (0.285 | ) | | (0.339 | ) | | (0.353 | ) | | (0.363 | ) | | (0.324 | ) | |
| | | — | | | — | | | (1.844 | ) | | (0.753 | ) | | (1.190 | ) | |
| | | (0.285 | ) | | (0.339 | ) | | (2.197 | ) | | (1.116 | ) | | (1.514 | ) | |
| | | | | | | | | | | | | | | | | |
| | | $14.080 | | | $13.080 | | | $11.080 | | | $20.390 | | | $21.080 | | |
| | | | | | | | | | | | | | | | | |
| | | 9.98% | | | 21.51% | | | (38.91% | ) | | 1.96% | | | 20.28% | | |
| | | | | | | | | | | | | | | | | |
| | | | | | | | | | | | | | | | | |
| | | $602,743 | | | $623,793 | | | $587,215 | | | $1,140,659 | | | $1,246,544 | | |
| | | 1.24% | | | 1.18% | | | 1.18% | | | 1.13% | | | 1.17% | | |
| | | | | | | | | | | | | | | | | |
| | | 1.24% | | | 1.29% | | | 1.20% | | | 1.13% | | | 1.17% | | |
| | | 1.75% | | | 2.58% | | | 1.97% | | | 1.59% | | | 1.60% | | |
| | | | | | | | | | | | | | | | | |
| | | 1.75% | | | 2.47% | | | 1.95% | | | 1.59% | | | 1.60% | | |
| | | 16% | | | 15% | | | 27% | | | 19% | | | 16% | | |
19
Financial highlights
Delaware Large Cap Value Fund Class B
Selected data for each share of the Fund outstanding throughout each period were as follows:
| Net asset value, beginning of period |
| |
| Income (loss) from investment operations: |
| Net investment income1 |
| Net realized and unrealized gain (loss) on investments and foreign currencies |
| Total from investment operations |
| |
| Less dividends and distributions from: |
| Net investment income |
| Net realized gain on investments |
| Total dividends and distributions |
| |
| Net asset value, end of period |
| |
| Total return2 |
| |
| Ratios and supplemental data: |
| Net assets, end of period (000 omitted) |
| Ratio of expenses to average net assets |
| Ratio of expenses to average net assets |
| prior to fees waived and expense paid indirectly |
| Ratio of net investment income to average net assets |
| Ratio of net investment income to average net assets |
| prior to fees waived and expense paid indirectly |
| Portfolio turnover |
1 The average shares outstanding method has been applied for per share information. |
2 Total investment return is based on the change in net asset value of a share during the period and assumes reinvestment of dividends and distributions at net asset value and does not reflect the impact of a sales charge. Total investment return during some of the periods shown reflects a waiver by the manager. Performance would have been lower had the waiver not been in effect. |
See accompanying notes, which are an integral part of the financial statements.
20
| | | Year Ended | |
| | | 11/30/10 | | 11/30/09 | | 11/30/08 | | 11/30/07 | | 11/30/06 | |
| | | $12.970 | | | $11.000 | | | $20.240 | | | $20.930 | | | $18.880 | | |
| | | | | | | | | | | | | | | | | |
| | | | | | | | | | | | | | | | | |
| | | 0.136 | | | 0.213 | | | 0.193 | | | 0.185 | | | 0.168 | | |
| | | 1.050 | | | 2.029 | | | (7.373 | ) | | 0.091 | | | 3.252 | | |
| | | 1.186 | | | 2.242 | | | (7.180 | ) | | 0.276 | | | 3.420 | | |
| | | | | | | | | | | | | | | | | |
| | | | | | | | | | | | | | | | | |
| | | (0.186 | ) | | (0.272 | ) | | (0.216 | ) | | (0.213 | ) | | (0.180 | ) | |
| | | — | | | — | | | (1.844 | ) | | (0.753 | ) | | (1.190 | ) | |
| | | (0.186 | ) | | (0.272 | ) | | (2.060 | ) | | (0.966 | ) | | (1.370 | ) | |
| | | | | | | | | | | | | | | | | |
| | | $13.970 | | | $12.970 | | | $11.000 | | | $20.240 | | | $20.930 | | |
| | | | | | | | | | | | | | | | | |
| | | 9.24% | | | 20.66% | | | (39.37% | ) | | 1.25% | | | 19.39% | | |
| | | | | | | | | | | | | | | | | |
| | | | | | | | | | | | | | | | | |
| | | $10,637 | | | $16,199 | | | $22,137 | | | $61,603 | | | $102,322 | | |
| | | 1.96% | | | 1.90% | | | 1.90% | | | 1.86% | | | 1.90% | | |
| | | | | | | | | | | | | | | | | |
| | | 1.96% | | | 2.01% | | | 1.92% | | | 1.86% | | | 1.90% | | |
| | | 1.03% | | | 1.86% | | | 1.25% | | | 0.86% | | | 0.87% | | |
| | | | | | | | | | | | | | | | | |
| | | 1.03% | | | 1.75% | | | 1.23% | | | 0.86% | | | 0.87% | | |
| | | 16% | | | 15% | | | 27% | | | 19% | | | 16% | | |
21
Financial highlights
Delaware Large Cap Value Fund Class C
Selected data for each share of the Fund outstanding throughout each period were as follows:
| Net asset value, beginning of period |
| |
| Income (loss) from investment operations: |
| Net investment income1 |
| Net realized and unrealized gain (loss) on investments and foreign currencies |
| Total from investment operations |
| |
| Less dividends and distributions from: |
| Net investment income |
| Net realized gain on investments |
| Total dividends and distributions |
| |
| Net asset value, end of period |
| |
| Total return2 |
| |
| Ratios and supplemental data: |
| Net assets, end of period (000 omitted) |
| Ratio of expenses to average net assets |
| Ratio of expenses to average net assets |
| prior to fees waived and expense paid indirectly |
| Ratio of net investment income to average net assets |
| Ratio of net investment income to average net assets |
| prior to fees waived and expense paid indirectly |
| Portfolio turnover |
1 The average shares outstanding method has been applied for per share information. |
2 Total investment return is based on the change in net asset value of a share during the period and assumes reinvestment of dividends and distributions at net asset value and does not reflect the impact of a sales charge. Total investment return during some of the periods shown reflects a waiver by the manager. Performance would have been lower had the waiver not been in effect. |
See accompanying notes, which are an integral part of the financial statements.
22
| | | Year Ended | |
| | | 11/30/10 | | 11/30/09 | | 11/30/08 | | 11/30/07 | | 11/30/06 | |
| | | $13.070 | | | $11.090 | | | $20.380 | | | $21.070 | | | $19.000 | | |
| | | | | | | | | | | | | | | | | |
| | | | | | | | | | | | | | | | | |
| | | 0.137 | | | 0.212 | | | 0.193 | | | 0.183 | | | 0.166 | | |
| | | 1.059 | | | 2.040 | | | (7.423 | ) | | 0.093 | | | 3.274 | | |
| | | 1.196 | | | 2.252 | | | (7.230 | ) | | 0.276 | | | 3.440 | | |
| | | | | | | | | | | | | | | | | |
| | | | | | | | | | | | | | | | | |
| | | (0.186 | ) | | (0.272 | ) | | (0.216 | ) | | (0.213 | ) | | (0.180 | ) | |
| | | — | | | — | | | (1.844 | ) | | (0.753 | ) | | (1.190 | ) | |
| | | (0.186 | ) | | (0.272 | ) | | (2.060 | ) | | (0.966 | ) | | (1.370 | ) | |
| | | | | | | | | | | | | | | | | |
| | | $14.080 | | | $13.070 | | | $11.090 | | | $20.380 | | | $21.070 | | |
| | | | | | | | | | | | | | | | | |
| | | 9.24% | | | 20.69% | | | (39.39% | ) | | 1.24% | | | 19.38% | | |
| | | | | | | | | | | | | | | | | |
| | | | | | | | | | | | | | | | | |
| | | $16,156 | | | $16,731 | | | $15,507 | | | $32,453 | | | $36,709 | | |
| | | 1.96% | | | 1.90% | | | 1.90% | | | 1.86% | | | 1.90% | | |
| | | | | | | | | | | | | | | | | |
| | | 1.96% | | | 2.01% | | | 1.92% | | | 1.86% | | | 1.90% | | |
| | | 1.03% | | | 1.86% | | | 1.25% | | | 0.86% | | | 0.87% | | |
| | | | | | | | | | | | | | | | | |
| | | 1.03% | | | 1.75% | | | 1.23% | | | 0.86% | | | 0.87% | | |
| | | 16% | | | 15% | | | 27% | | | 19% | | | 16% | | |
23
Financial highlights
Delaware Large Cap Value Fund Class R
Selected data for each share of the Fund outstanding throughout each period were as follows:
| Net asset value, beginning of period |
| |
| Income (loss) from investment operations: |
| Net investment income1 |
| Net realized and unrealized gain (loss) on investments and foreign currencies |
| Total from investment operations |
| |
| Less dividends and distributions from: |
| Net investment income |
| Net realized gain on investments |
| Total dividends and distributions |
| |
| Net asset value, end of period |
| |
| Total return2 |
| |
| Ratios and supplemental data: |
| Net assets, end of period (000 omitted) |
| Ratio of expenses to average net assets |
| Ratio of expenses to average net assets |
| prior to fees waived and expense paid indirectly |
| Ratio of net investment income to average net assets |
| Ratio of net investment income to average net assets |
| prior to fees waived and expense paid indirectly |
| Portfolio turnover |
1 The average shares outstanding method has been applied for per share information. |
2 Total investment return is based on the change in net asset value of a share during the period and assumes reinvestment of dividends and distributions at net asset value. Total investment return during some of the periods shown reflects waivers by the manager and distributor. Performance would have been lower had the waivers not been in effect. |
See accompanying notes, which are an integral part of the financial statements.
24
| | | Year Ended | |
| | | 11/30/10 | | 11/30/09 | | 11/30/08 | | 11/30/07 | | 11/30/06 | |
| | | $13.060 | | | $11.070 | | | $20.360 | | | $21.060 | | | $19.000 | | |
| | | | | | | | | | | | | | | | | |
| | | | | | | | | | | | | | | | | |
| | | 0.203 | | | 0.268 | | | 0.271 | | | 0.289 | | | 0.262 | | |
| | | 1.060 | | | 2.042 | | | (7.407 | ) | | 0.083 | | | 3.275 | | |
| | | 1.263 | | | 2.310 | | | (7.136 | ) | | 0.372 | | | 3.537 | | |
| | | | | | | | | | | | | | | | | |
| | | | | | | | | | | | | | | | | |
| | | (0.253 | ) | | (0.320 | ) | | (0.310 | ) | | (0.319 | ) | | (0.287 | ) | |
| | | — | | | — | | | (1.844 | ) | | (0.753 | ) | | (1.190 | ) | |
| | | (0.253 | ) | | (0.320 | ) | | (2.154 | ) | | (1.072 | ) | | (1.477 | ) | |
| | | | | | | | | | | | | | | | | |
| | | $14.070 | | | $13.060 | | | $11.070 | | | $20.360 | | | $21.060 | | |
| | | | | | | | | | | | | | | | | |
| | | 9.81% | | | 21.23% | | | (39.03% | ) | | 1.70% | | | 20.00% | | |
| | | | | | | | | | | | | | | | | |
| | | | | | | | | | | | | | | | | |
| | | $969 | | | $1,509 | | | $1,253 | | | $2,514 | | | $1,166 | | |
| | | 1.46% | | | 1.40% | | | 1.40% | | | 1.36% | | | 1.40% | | |
| | | | | | | | | | | | | | | | | |
| | | 1.56% | | | 1.61% | | | 1.52% | | | 1.46% | | | 1.50% | | |
| | | 1.53% | | | 2.36% | | | 1.75% | | | 1.36% | | | 1.37% | | |
| | | | | | | | | | | | | | | | | |
| | | 1.43% | | | 2.15% | | | 1.63% | | | 1.26% | | | 1.27% | | |
| | | 16% | | | 15% | | | 27% | | | 19% | | | 16% | | |
25
Financial highlights
Delaware Large Cap Value Fund Institutional Class
Selected data for each share of the Fund outstanding throughout each period were as follows:
| Net asset value, beginning of period |
| |
| Income (loss) from investment operations: |
| Net investment income1 |
| Net realized and unrealized gain (loss) on investments and foreign currencies |
| Total from investment operations |
| |
| Less dividends and distributions from: |
| Net investment income |
| Net realized gain on investments |
| Total dividends and distributions |
| |
| Net asset value, end of period |
| |
| Total return2 |
| |
| Ratios and supplemental data: |
| Net assets, end of period (000 omitted) |
| Ratio of expenses to average net assets |
| Ratio of expenses to average net assets |
| prior to fees waived and expense paid indirectly |
| Ratio of net investment income to average net assets |
| Ratio of net investment income to average net assets |
| prior to fees waived and expense paid indirectly |
| Portfolio turnover |
1 The average shares outstanding method has been applied for per share information. |
2 Total investment return is based on the change in net asset value of a share during the period and assumes reinvestment of dividends and distributions at net asset value. Total investment return during some of the periods shown reflects a waiver by the manager. Performance would have been lower had the waiver not been in effect. |
See accompanying notes, which are an integral part of the financial statements.
26
| | | Year Ended | |
| | | 11/30/10 | | 11/30/09 | | 11/30/08 | | 11/30/07 | | 11/30/06 | |
| | | $13.070 | | | $11.080 | | | $20.390 | | | $21.080 | | | $19.010 | | |
| | | | | | | | | | | | | | | | | |
| | | | | | | | | | | | | | | | | |
| | | 0.270 | | | 0.325 | | | 0.349 | | | 0.395 | | | 0.357 | | |
| | | 1.062 | | | 2.031 | | | (7.409 | ) | | 0.091 | | | 3.279 | | |
| | | 1.332 | | | 2.356 | | | (7.060 | ) | | 0.486 | | | 3.636 | | |
| | | | | | | | | | | | | | | | | |
| | | | | | | | | | | | | | | | | |
| | | (0.322 | ) | | (0.366 | ) | | (0.406 | ) | | (0.423 | ) | | (0.376 | ) | |
| | | — | | | — | | | (1.844 | ) | | (0.753 | ) | | (1.190 | ) | |
| | | (0.322 | ) | | (0.366 | ) | | (2.250 | ) | | (1.176 | ) | | (1.566 | ) | |
| | | | | | | | | | | | | | | | | |
| | | $14.080 | | | $13.070 | | | $11.080 | | | $20.390 | | | $21.080 | | |
| | | | | | | | | | | | | | | | | |
| | | 10.37% | | | 21.83% | | | (38.76% | ) | | 2.24% | | | 20.61% | | |
| | | | | | | | | | | | | | | | | |
| | | | | | | | | | | | | | | | | |
| | | $7,997 | | | $28,432 | | | $24,757 | | | $46,275 | | | $45,841 | | |
| | | 0.96% | | | 0.90% | | | 0.90% | | | 0.86% | | | 0.90% | | |
| | | | | | | | | | | | | | | | | |
| | | 0.96% | | | 1.01% | | | 0.92% | | | 0.86% | | | 0.90% | | |
| | | 2.03% | | | 2.86% | | | 2.25% | | | 1.86% | | | 1.87% | | |
| | | | | | | | | | | | | | | | | |
| | | 2.03% | | | 2.75% | | | 2.23% | | | 1.86% | | | 1.87% | | |
| | | 16% | | | 15% | | | 27% | | | 19% | | | 16% | | |
27
Notes to financial statements
Delaware Large Cap Value Fund | November 30, 2010 |
Delaware Group® Equity Funds II (Trust) is organized as a Delaware statutory trust and offers two series: Delaware Large Cap Value Fund and Delaware Value Fund. These financial statements and the related notes pertain to Delaware Large Cap Value Fund (Fund). The Trust is an open-end investment company. The Fund is considered diversified under the Investment Company Act of 1940, as amended, and offers Class A, Class B, Class C, Class R and Institutional Class shares. Class A shares are sold with a maximum front-end sales charge of up to 5.75%. Class A share purchases of $1,000,000 or more will incur a contingent deferred sales charge (CDSC) of 1% if redeemed during the first year and 0.50% during the second year, provided that Delaware Distributors, L.P. (DDLP) paid a financial advisor a commission on the purchase of those shares. Class B shares may only be purchased through dividend reinvestment and certain permitted exchanges. Prior to June 1, 2007, Class B shares were sold with a CDSC that declined from 4% to zero depending upon the period of time the shares were held. Class B shares will automatically convert to Class A shares on a quarterly basis approximately eight years after purchase. Class C shares are sold with a CDSC of 1%, if redeemed during the first twelve months. Class R and Institutional Class shares are not subject to a sales charge and are offered for sale exclusively to certain eligible investors.
The investment objective of the Fund is to seek long-term capital appreciation.
1. Significant Accounting Policies
The following accounting policies are in accordance with U.S. generally accepted accounting principles (U.S. GAAP) and are consistently followed by the Fund.
Security Valuation — Equity securities, except those traded on the Nasdaq Stock Market, Inc. (Nasdaq), are valued at the last quoted sales price as of the time of the regular close of the New York Stock Exchange (NYSE) on the valuation date. Securities traded on the Nasdaq are valued in accordance with the Nasdaq Official Closing Price, which may not be the last sales price. If on a particular day an equity security does not trade, then the mean between the bid and ask prices will be used. Investment company securities are valued at their published net asset value. Short-term debt securities are valued at market value. Generally, other securities and assets for which market quotations are not readily available are valued at fair value as determined in good faith under the direction of the Fund’s Board of Trustees ( Board). In determining whether market quotations are readily available or fair valuation will be used, various factors will be taken into consideration, such as market closures, or suspension of trading in a security. The Fund may use fair value pricing more frequently for securities traded primarily in non-U.S. markets because, among other things, most foreign markets close well before the Fund values its securities generally as of 4:00 p.m. Eastern time. The earlier close of these foreign markets gives rise to the possibility that significant events, including broad market moves, government actions or pronouncements, aftermarket trading, or news events may have occurred in the interim. To account for this, the Fund may frequently value foreign securities using fair value prices based on third-party vendor modeling tools (international fair value pricing).
28
Federal Income Taxes — No provision for federal income taxes has been made as the Fund intends to continue to qualify for federal income tax purposes as a regulated investment company under Subchapter M of the Internal Revenue Code of 1986, as amended, and make the requisite distributions to shareholders. The Fund evaluates tax positions taken or expected to be taken in the course of preparing the Fund’s tax returns to determine whether the tax positions are “more-likely-than-not” of being sustained by the applicable tax authority. Tax positions not deemed to meet the more-likely-than-not threshold are recorded as a tax benefit or expense in the current year. Management has analyzed the Fund’s tax positions taken on federal income tax returns for all open tax years (November 30, 2007 – Novem ber 30, 2010), and has concluded that no provision for federal income tax is required in the Fund’s financial statements.
Class Accounting — Investment income, common expenses and realized and unrealized gain (loss) on investments are allocated to the various classes of the Fund on the basis of daily net assets of each class. Distribution expenses relating to a specific class are charged directly to that class.
Use of Estimates — The preparation of financial statements in conformity with U.S. GAAP requires management to make estimates and assumptions that affect the reported amounts of assets and liabilities and disclosure of contingent assets and liabilities at the date of the financial statements and the reported amounts of revenues and expenses during the reporting period. Actual results could differ from those estimates and the differences could be material.
Other — Expenses directly attributable to the Fund are charged directly to the Fund. Other expenses common to various funds within the Delaware Investments® Family of Funds are generally allocated amongst such funds on the basis of average net assets. Management fees and some other expenses are paid monthly. Security transactions are recorded on the date the securities are purchased or sold (trade date) for financial reporting purposes. Costs used in calculating realized gains and losses on the sale of investment securities are those of the specific securities sold. Dividend income is recorded on the ex-dividend date and interest income is recorded on the accrual basis. The Fund declares a nd pays dividends from net investment income quarterly and distributions from net realized gain from investments, if any, annually. Dividends and distributions, if any, are recorded on the ex-dividend date.
Subject to seeking best execution, the Fund may direct certain security trades to brokers who have agreed to rebate a portion of the related brokerage commission to the Fund in cash. Such commission rebates are included in realized gain on investments in the accompanying financial statements and totaled $20,316 for the year ended November 30, 2010. In general, best execution refers to many factors, including the price paid or received for a security, the commission charged, the promptness and reliability of execution, the confidentiality and placement accorded the order, and other factors affecting the overall benefit obtained by the Fund on the transaction.
The Fund may receive earnings credits from its custodian when positive cash balances are maintained, which are used to offset custody fees. There were no earnings credits for the year ended November 30, 2010.
29
Notes to financial statements
Delaware Large Cap Value Fund
1. Significant Accounting Policies (continued)
The Fund may receive earnings credits from its transfer agent when positive cash balances are maintained, which may be used to offset transfer agent fees. The expense paid under this arrangement is included in dividend disbursing and transfer agent fees and expenses on the Statement of operations within the corresponding expense offset shown as “expense paid indirectly”. For the year ended November 31, 2010, the Fund earned $2,439 under this agreement.
2. Investment Management, Administration Agreements and Other Transactions with Affiliates
In accordance with the terms of its investment management agreement, the Fund pays Delaware Management Company (DMC), a series of Delaware Management Business Trust and the investment manager, an annual fee which is calculated daily at the rate of 0.65% on the first $500 million of average daily net assets of the Fund, 0.60% on the next $500 million, 0.55% on the next $1.5 billion, and 0.50% on average daily net assets in excess of $2.5 billion.
Delaware Service Company, Inc. (DSC), an affiliate of DMC, provides fund accounting and financial administration oversight services to the Fund. For these services, the Fund pays DSC fees based on aggregate daily net assets of the Delaware Investments® Family of Funds at the following annual rate: 0.0050% of the first $30 billion; 0.0045% of the next $10 billion; 0.0040% of the next $10 billion; and 0.0025% of aggregate average daily net assets in excess of $50 billion. The fees payable to DSC under the service agreement described above are allocated among all Funds in the Delaware Investments® Family of Funds on a relative net asset value basis. For the year ended November 30, 2010, the Fund was charged $32,527 for these services.
DSC also provides dividend disbursing and transfer agency services. The Fund pays DSC a monthly fee based on the number of shareholder accounts for dividend disbursing and transfer agent services.
Pursuant to a distribution agreement and distribution plan, the Fund pays DDLP, the distributor and an affiliate of DMC, an annual distribution and service fee not to exceed 0.30% of the average daily net assets of the Class A shares, 1.00% of the average daily net assets of the Class B and C shares and 0.60% of the average daily net assets of Class R shares. Institutional Class shares pay no distribution and service expenses. The Board has adopted a formula for calculating 12 b-1 plan fees for the Fund’s Class A shares that went into effect on May 2, 1994. The total 12b-1 fees to be paid by Class A shareholders of the Fund will be the sum of 0.10% of the average daily net assets representing shares that were acquired prior to June 1, 1992 and 0.30% of the average daily net assets representing shares that were acquired on or after June 1, 1992. All Class A shareholders will bear 12b-1 fees at the same rate, the blended rate based upon the allocation of the rates described above. DDLP has contracted to limit distribution and service fees through March 31, 2011 in order to prevent distribution and service fees of Class R shares from exceeding 0.50% of average daily net assets.
30
At November 30, 2010, the Fund had liabilities payable to affiliates as follows:
| Investment management fee payable to DMC | $ | 342,462 |
| Dividend disbursing, transfer agent and fund accounting | | |
| oversight fees and other expenses payable to DSC | | 52,461 |
| Distribution fees payable to DDLP | | 166,471 |
| Other expenses payable to DMC and affiliates* | | 39,451 |
*DMC, as part of its administrative services, pays operating expenses on behalf of the Fund and is reimbursed on a periodic basis. Expenses include items such as printing of shareholder reports, fees for audit, legal and tax services, registration fees and trustees’ fees.
As provided in the investment management agreement, the Fund bears the cost of certain legal and tax services, including internal legal and tax services provided to the Fund by DMC and/or its affiliates’ employees. For the year ended November 30, 2010, the Fund was charged $23,000 for internal legal and tax services provided by DMC and/or its affiliates’ employees.
For the year ended November 30, 2010, DDLP earned $25,631 for commissions on sales of the Fund’s Class A shares. For the year ended November 30, 2010, DDLP received gross CDSC commissions of $0, $8,679 and $4,071 on redemption of the Fund’s Class A, Class B and Class C shares, respectively, and these commissions were entirely used to offset up-front commissions previously paid by DDLP to broker/dealers on sales of those shares.
Trustees’ fees include expenses accrued by the Fund for each Trustee’s retainer and meeting fees. Certain officers of DMC, DSC and DDLP are officers and/or Trustees of the Trust. These officers and Trustees are paid no compensation by the Fund
3. Investments
For the year ended November 30, 2010, the Fund made purchases of $104,328,084 and sales of $196,011,852 of investment securities other than short-term investments.
At November 30, 2010, the cost of investments for federal income tax purposes was $698,459,525. At November 30, 2010, the net unrealized appreciation was $19,878,872 of which $78,670,267 related to unrealized appreciation of investments and $58,791,395 related to unrealized depreciation of investments.
U.S. GAAP defines fair value as the price that the Fund would receive to sell an asset or pay to transfer a liability in an orderly transaction between market participants at the measurement date under current market conditions. A three level hierarchy for fair value measurements has been established based upon the transparency of inputs to the valuation of an asset or liability. Inputs may be observable or unobservable and refer broadly to the assumptions that market participants would use in pricing the asset or liability. Observable inputs reflect the assumptions market participants would use in pricing the asset or liability based on market data obtained from sources independent of the reporting entity. Unobservable inputs reflect the reporting entity’s own assumptions about
31
Notes to financial statements
Delaware Large Cap Value Fund
3. Investments (continued)
the assumptions that market participants would use in pricing the asset or liability developed based on the best information available under the circumstances. The Fund’s investment in its entirety is assigned a level based upon the observability of the inputs which are significant to the overall valuation. The three level hierarchy of inputs is summarized below.
| Level 1 | | – | | inputs are quoted prices in active markets for identical investments (e.g., equity securities, open-end investment companies, futures contracts, options contracts) |
| | | | | |
| Level 2 | | – | | other observable inputs (including, but not limited to: quoted prices for similar assets or liabilities in markets that are active, quoted prices for identical or similar assets or liabilities in markets that are not active, inputs other than quoted prices that are observable for the assets or liabilities (such as interest rates, yield curves, volatilities, prepayment speeds, loss severities, credit risks and default rates) or other market-corroborated inputs) (e.g., debt securities, government securities, swap contracts, foreign currency exchange contracts, foreign securities utilizing international fair value pricing) |
| | | | | |
| Level 3 | | – | | inputs are significant unobservable inputs (including the Fund’s own assumptions used to determine the fair value of investments) (e.g., broker-quoted securities, fair valued securities) |
The following table summarizes the valuation of the Fund’s investments by fair value hierarchy levels as of November 30, 2010:
| | Level 1 | | Level 2 | | Level 3 | | Total |
| Common Stock | $ | 635,532,929 | | $ | — | | $ | — | | $ | 635,532,929 |
| Short-Term | | — | | | 2,770,007 | | | — | | | 2,770,007 |
| Securities Lending Collateral | | — | | | 80,035,461 | | | — | | | 80,035,461 |
| Total | $ | 635,532,929 | | $ | 82,805,468 | | $ | — | | $ | 718,338,397 |
The following is a reconciliation of investments in which significant unobservable inputs (Level 3) were used in determining fair value:
| | Securities |
| | Lending |
| | Collateral |
| Balance as of 11/30/09 | $ | 3,219 | |
| Sales | | (3,833 | ) |
| Net change in unrealized appreciation/depreciation | | 614 | |
| Balance as of 11/30/10 | $ | — | |
| |
| Net change in unrealized appreciation/depreciation from | | | |
| investments still held as of 11/30/10 | $ | (3,056 | ) |
32
In January 2010, the Financial Accounting Standards Board issued an Accounting Standards Update, Improving Disclosures about Fair Value Measurements, which introduced new disclosure requirements and clarified certain existing disclosure requirements around fair value measurements currently presented above. The new disclosures and clarifications of existing disclosures are generally effective for the Fund’s fiscal year ending November 30, 2011 and interim periods therein. During the fiscal year ended November 30, 2010, there were no transfers between Level 1 investments, Level 2 investments or Level 3 investments that had a material impact to the Fund.
4. Dividend and Distribution Information
Income and long-term capital gain distributions are determined in accordance with federal income tax regulations, which may differ from U.S. GAAP. Additionally, distributions from net short-term gains on sales of investment securities are treated as ordinary income for federal income tax purposes. The tax character of dividends and distributions paid during the years ended November 30, 2010 and 2009 was as follows:
| | | Year Ended |
| | | 11/30/10 | | 11/30/09 |
| Ordinary income | | $14,130,213 | | $19,141,036 |
5. Components of Net Assets on a Tax Basis
As of November 30, 2010, the components of net assets on a tax basis were as follows:
| Shares of beneficial interest | $ | 825,973,619 | |
| Undistributed ordinary income | | 2,991,551 | |
| Capital loss carryforwards | | (210,342,284 | ) |
| Unrealized appreciation of investments | | 19,878,872 | |
| Net assets | $ | 638,501,758 | |
The difference between book basis and tax basis components of net assets are primarily attributable to tax deferral of losses on wash sales.
For federal income tax purposes, capital loss carryforwards may be carried forward and applied against future capital gains. $9,855,124 was utilized in 2010. Capital loss carryforwards remaining at November 30, 2010 will expire as follows: $163,485,489 expires in 2016 and $46,856,795 expires in 2017.
33
Notes to financial statements
Delaware Large Cap Value Fund
6. Capital Shares
Transactions in capital shares were as follows:
| | Year Ended |
| | 11/30/10 | | 11/30/09 |
| Shares sold: | | | | | |
| Class A | 1,293,080 | | | 1,718,166 | |
| Class B | 8,457 | | | 25,066 | |
| Class C | 111,669 | | | 203,977 | |
| Class R | 15,015 | | | 43,683 | |
| Institutional Class | 198,773 | | | 342,845 | |
| |
| Shares issued upon reinvestment of dividends and distributions: | | | | | |
| Class A | 884,878 | | | 1,417,700 | |
| Class B | 14,365 | | | 41,298 | |
| Class C | 16,606 | | | 32,553 | |
| Class R | 1,823 | | | 3,353 | |
| Institutional Class | 38,393 | | | 74,185 | |
| | 2,583,059 | | | 3,902,826 | |
| |
| Shares repurchased: | | | | | |
| Class A | (7,082,117 | ) | | (8,422,148 | ) |
| Class B | (510,551 | ) | | (828,779 | ) |
| Class C | (260,896 | ) | | (354,822 | ) |
| Class R | (63,556 | ) | | (44,589 | ) |
| Institutional Class | (1,843,963 | ) | | (477,652 | ) |
| | (9,761,083 | ) | | (10,127,990 | ) |
| Net decrease | (7,178,024 | ) | | (6,225,164 | ) |
For the years ended November 30, 2010 and 2009, 312,487 Class B shares were converted to 309,753 Class A shares valued at $4,149,618 and 433,186 Class B shares were converted to 429,632 Class A shares valued at $4,837,126, respectively. The respective amounts are included in Class B redemptions and Clas s A subscriptions in the table above and the statements of changes in net assets.
7. Line of Credit
The Fund, along with certain other funds in the Delaware Investments® Family of Funds (Participants), was a participant in a $35,000,000 revolving line of credit with The Bank of New York Mellon (BNY Mellon) to be used for temporary or emergency purposes as an additional source of liquidity to fund redemptions of investor shares. Under the agreement, the Participants were charged an annual commitment fee, which was allocated across the Participants on the basis of each Participant’s allocation of the entire facility. The Participants were permitted to borrow up to a maximum of one third of their net assets under the agreement. The line of credit expired on November 16, 2010.
34
Effective as of November 16, 2010, the Fund along with the other Participants entered into an amendment to the agreement with BNY Mellon for a $50,000,000 revolving line of credit. The agreement as amended is to be used as described above and operates in substantially the same manner as the original agreement. The new line of credit under the agreement as amended expires on November 15, 2011. The Fund had no amounts outstanding as of November 30, 2010, or at any time during the year then ended.
8. Securities Lending
The Fund, along with other funds in the Delaware Investments® Family of Funds, may lend its securities pursuant to a security lending agreement (Lending Agreement) with BNY Mellon. With respect to each loan, if on any business day the aggregate market value of securities collateral plus cash collateral held is less than the aggregate market value of the securities which are the subject of such loan, the borrower will be notified to provide additional collateral by the end of the following business day which, together with the collateral already held, will be not less than the applicable collateral requirements for such security loan. If the aggregate market value of securities collateral and cash collateral held with respect to a security loan exceeds the applicable collateral requirement, upon the request of the borrower BNY Mellon must return enough collateral to the borr ower by the end of the following business day to reduce the value of the remaining collateral to the applicable collateral requirement for such security loan. As a result of the foregoing, the value of the collateral held with respect to a loaned security may be temporarily more or less than the value of the security on loan.
Cash collateral received is generally invested in the Delaware Investments Collateral Fund No. 1 (the “Collective Trust”) established by BNY Mellon for the purpose of investment on behalf of funds managed by DMC that participate in BNY Mellon’s securities lending program. The Collective Trust may invest in U.S. government securities and high quality corporate debt, asset-backed and other money market securities and in repurchase agreements collateralized by such securities, provided that the Collective Trust will generally have a dollar-weighted average portfolio maturity of 60 days or less. The Collective Trust seeks to maintain a net asset value per unit of $1.00, but there can be no assurance that it will always be able to do so. The Fund may incur investment losses as a result of investing securities lending collateral in the Collective Trust or another collateral investment pool. This could occur if an investment in a collateral investment pool defaulted or if it were necessary to liquidate assets in the collateral investment pool to meet returns on outstanding security loans at a time when the collateral investment pool’s net asset value per unit was less than $1.00. Under those circumstances, the Fund may not receive an amount from the collateral investment pool that is equal in amount to the collateral the Fund would be required to return to the borrower of the securities and the Fund would be required to make up this shortfall. Effective April 20, 2009, BNY Mellon transferred the assets of the Fund’s previous collateral investment pool other than cash and assets with a maturity of one business day or less to the BNY Mellon SL DBT II Liquidating Fund (the “Liquidating Fund”), effectively bifurcating the previous collateral investment pool. The Fund’s exposure to the Liquidating Fund is expected to decrease as the Liquidating Fund’s assets mature or are sold. In October 2008, BNY Me llon transferred certain distressed securities from the previous collateral investment pool into the Mellon GSL Reinvestment Trust II. The Fund can also accept
35
Notes to financial statements
Delaware Large Cap Value Fund
8. Securities Lending (continued)
U.S. government securities and letters of credit (non-cash collateral) in connection with securities loans. In the event of default or bankruptcy by the lending agent, realization and/or retention of the collateral may be subject to legal proceedings. In the event the borrower fails to return loaned securities and the collateral received is insufficient to cover the value of the loaned securities and provided such collateral shortfall is not the result of investment losses, the lending agent has agreed to pay the amount of the shortfall to the Fund, or at the discretion of the lending agent, replace the loaned securities. The Fund continues to record dividends or interest, as applicable, on the securities loaned and is subject to change in value of the securities loaned that may occur during the term of the loan. The Fund has the right under the Lending Agreement to recover the securities from the borrower on demand. With respect to securi ty loans collateralized by non-cash collateral, the Fund receives loan premiums paid by the borrower. With respect to security loans collateralized by cash collateral, the earnings from the collateral investments are shared among the Fund, the security lending agent and the borrower. The Fund records security lending income net of allocations to the security lending agent and the borrower.
At November 30, 2010, the value of the securities on loan was $78,494,403, for which cash collateral was received and invested in accordance with the Lending Agreement. At November 30, 2010, the value of invested collateral was $80,035,461. Such investments are presented on the statement of net assets under the caption “Securities Lending Collateral.”
9. Credit and Market Risk
The Fund may invest up to 15% of its net assets in illiquid securities, which may include securities with contractual restrictions on resale, securities exempt from registration under Rule 144A of the Securities Act of 1933, as amended, and other securities which may not be readily marketable. The relative illiquidity of these securities may impair the Fund from disposing of them in a timely manner and at a fair price when it is necessary or desirable to do so. While maintaining oversight, the Fund’s Board has delegated to DMC the day-to-day functions of determining whether individual securities are liquid for purposes of the Fund’s limitation on investments in illiquid assets. Securities eligible for resale pursuant to Rule 144A, which are determined to be liquid, are not subject to the Fund’s 15% limit on investments in illiquid securities. As of November 30, 2010, there were no Rule 144A securities. Illiquid securities have been identified on the statement of net assets.
10. Contractual Obligations
The Fund enters into contracts in the normal course of business that contain a variety of indemnifications. The Fund’s maximum exposure under these arrangements is unknown. However, the Fund has not had prior claims or losses pursuant to these contracts. Management has reviewed the Fund’s existing contracts and expects the risk of loss to be remote.
11. Subsequent Events
Management has determined no material events or transactions occurred subsequent to November 30, 2010 that would require recognition or disclosure in the Fund’s financial statements.
36
12. Tax Information (Unaudited)
The information set forth below is for the Fund’s fiscal year as required by federal laws. Shareholders, however, must report distributions on a calendar year basis for income tax purposes, which may include distributions for portions of two fiscal years of a fund. Accordingly, the information needed by shareholders for income tax purposes will be sent to them in January of each year. Please consult your tax advisor for proper treatment of the information.
For the fiscal year ended November 30, 2010, the Fund designates distributions paid during the year as follows:
| (A) | | Long-Term Capital Gains Distributions (Tax Basis) | —% |
| (B) | | Ordinary Income Distributions* (Tax Basis) | 100.00% |
| | | Total Distributions (Tax Basis) | 100.00% |
| (C) | | Qualifying Dividends1 | 100.00% |
| (A) and (B) are based on a percentage of the Fund’s total distributions. |
| (C) is based on a percentage of the Fund’s ordinary income distributions. |
1 Qualifying dividends represent dividends which qualify for the corporate dividends received deduction. |
| *For the fiscal year ended November 30, 2010, certain dividends paid by the Fund may be subject to a maximum tax rate of 15%, as provided for by the Jobs and Growth Tax Relief Reconciliation Act of 2003. The Fund intends to designate up to a maximum amount of $14,130,213 to be taxed at maximum rate of 15%. Complete information will be computed and reported in conjunction with your 2009 or 2010 Form 1099-DIV. |
For the fiscal year ended November 30, 2010, certain interest income and short-term gains paid by the Fund, determined to be Qualified Interest Income and Short-Term Capital Gains, may be subject to relief from U.S. withholding for foreign shareholders, as provided by the American Jobs Creation Act of 2004. For the fiscal year ended November 30, 2010, the Fund has designated maximum distributions of Qualified Interest Income of $22,652.
37
Report of independent
registered public accounting firm
To the Board of Trustees of Delaware Group Equity Funds II
and the Shareholders of Delaware Large Cap Value Fund:
In our opinion, the accompanying statement of net assets and the related statements of operations and of changes in net assets and the financial highlights present fairly, in all material respects, the financial position of Delaware Large Cap Value Fund (one of the series constituting Delaware Group Equity Funds II, hereafter referred to as the “Fund”) at November 30, 2010, and the results of its operations, the changes in its net assets and the financial highlights for the year then ended, in conformity with accounting principles generally accepted in the United States of America. These financial statements and financial highlights (hereafter referred to as “financial statements”) are the responsibility of the Fund’s management; our responsibility is to express an opinion on these financial statements based on our audit. We conducted our audit of these financial statements in accordance with the standards of the Public Company Accounting Oversight Board (United States). Those standards require that we plan and perform the audit to obtain reasonable assurance about whether the financial statements are free of material misstatement. An audit includes examining, on a test basis, evidence supporting the amounts and disclosures in the financial statements, assessing the accounting principles used and significant estimates made by management, and evaluating the overall financial statement presentation. We believe that our audit, which included confirmation of securities at November 30, 2010 by correspondence with the custodian, provides a reasonable basis for our opinion. The statement of changes in net assets for the year ended November 30, 2009 and the financial highlights for each of the four years in the period ended November 30, 2009 were audited by other independent accountants whose report dated January 21, 2010 expressed an unqualified opinion on those statements.
PricewaterhouseCoopers LLP
Philadelphia, Pennsylvania
January 19, 2011
38
Other Fund information
(Unaudited)
Delaware Large Cap Value Fund
Change in Independent Registered Public Accounting Firm
Due to independence matters under the Securities and Exchange Commission’s auditor independence rules relating to the January 4, 2010 acquisition of Delaware Investments (including DMC, DDLP and DSC) by Macquarie Group, Ernst & Young LLP (“E&Y”) has resigned as the independent registered public accounting firm for Delaware Group® Equity Funds II ( the “Trust”) effective May 20, 2010. At a meeting held on May 20, 2010, the Board of Trustees of the Trust, upon recommendation of the Audit Committee, selected PricewaterhouseCoopers LLP (“PwC”) to serve as the independent registered public accounting firm for the Trust for the fiscal year ending November 30, 2010. During the fiscal years ended November 30, 2009 and 2008, E&Y’s audit reports on the financial statements of the Trust did not contain any adverse opinion or disclaimer of opinion, nor were they qualified or modified as to uncertainty, audit scope, or accounting principles. In addition, there were no disagreements between the Trust and E&Y on accounting principles, financial statements disclosures or audit scope, which, if not resolved to the satisfaction of E&Y, would have caused them to make reference to the disagreement in their reports. Neither the Trust nor anyone on its behalf has consulted with PwC at any time prior to their selection with respect to the application of accounting principles to a specified transaction, either completed or proposed or the type of audit opinion that might be rendered on the Trust’s financial statements.
39
Board of trustees/directors and officers addendum
Delaware Investments® Family of Funds
A mutual fund is governed by a Board of Trustees/Directors (“Trustees”), which has oversight responsibility for the management of a fund’s business affairs. Trustees establish procedures and oversee and review the performance of the investment manager, the distributor, and others who perform services for the fund. The independent fund trustees, in particular, are advocates
| Name, Address, | | Position(s) | | Length of |
| and Birth Date | | Held with Fund(s) | | Time Served |
| Interested Trustees | | | | |
| | | | | |
| Patrick P. Coyne1 | | Chairman, President, | | Chairman and Trustee |
| 2005 Market Street | | Chief Executive Officer, | | since August 16, 2006 |
| Philadelphia, PA 19103 | | and Trustee | | |
| April 1963 | | | | President and |
| | | | | Chief Executive Officer |
| | | | | since August 1, 2006 |
| | | | | |
| | | | | |
| | | | | |
| | | | | |
| | | | | |
| | | | | |
| | | | | |
| | | | | |
| | | | | |
| | | | | |
| | | | | |
| | | | | |
| | | | | |
| | | | | |
| | | | | |
| | | | | |
| | | | | |
1 Patrick P. Coyne is considered to be an “Interested Trustee” because he is an executive officer of the Fund’s(s’) investment advisor.
40
for shareholder interests. Each trustee has served in that capacity since he or she was elected to or appointed to the Board of Trustees, and will continue to serve until his or her retirement or the election of a new trustee in his or her place. The following is a list of the Trustees and Officers with certain background and related information.
| | | Number of Portfolios in | | |
| Principal Occupation(s) | | Fund Complex Overseen | | Other Directorships |
| During Past 5 Years | | by Trustee or Officer | | Held by Trustee or Officer |
| |
| |
| Patrick P. Coyne has served in | | 78 | | Director |
| various executive capacities | | | | Kaydon Corp. |
| at different times at | | | | |
| Delaware Investments.2 | | | | Board of Governors Member |
| | | | | Investment Company |
| | | | | Institute (ICI) |
| | | | | |
| | | | | Finance Committee Member |
| | | | | St. John Vianney Roman |
| | | | | Catholic Church |
| |
| | | | | Board of Trustees |
| | | | | Agnes Irwin School |
| |
| | | | | Member of Investment |
| | | | | Committee |
| | | | | Cradle of Liberty Council, |
| | | | | BSA |
| | | | | (2007 – 2010) |
| | | | | |
| |
| | | | | |
| | | | | |
2 Delaware Investments is the marketing name for Delaware Management Holdings, Inc. and its subsidiaries, including the Fund’s(s’) investment advisor, principal underwriter, and its transfer agent.
41
Board of trustees/directors and officers addendum
Delaware Investments® Family of Funds
| Name, Address, | | Position(s) | | Length of |
| and Birth Date | | Held with Fund(s) | | Time Served |
| Independent Trustees | | | | |
| | | | | |
| Thomas L. Bennett | | Trustee | | Since March 2005 |
| 2005 Market Street | | | | |
| Philadelphia, PA 19103 | | | | |
| October 1947 | | | | |
| | | | | |
| | | | | |
| | | | | |
| | | | | |
| | | | | |
| | | | | |
| | | | | |
| | | | | |
| | | | | |
| | | | | |
| John A. Fry | | Trustee | | Since January 2001 |
| 2005 Market Street | | | | |
| Philadelphia, PA 19103 | | | | |
| May 1960 | | | | |
| | | | | |
| | | | | |
| | | | | |
| | | | | |
| | | | | |
| | | | | |
| | | | | |
| | | | | |
| Anthony D. Knerr | | Trustee | | Since April 1990 |
| 2005 Market Street | | | | |
| Philadelphia, PA 19103 | | | | |
| December 1938 | | | | |
| | | | | |
| | | | | |
| Lucinda S. Landreth | | Trustee | | Since March 2005 |
| 2005 Market Street | | | | |
| Philadelphia, PA 19103 | | | | |
| June 1947 | | | | |
| | | | | |
42
| | | Number of Portfolios in | | |
| Principal Occupation(s) | | Fund Complex Overseen | | Other Directorships |
| During Past 5 Years | | by Trustee or Officer | | Held by Trustee or Officer |
| | | | | |
| | | | | |
| Private Investor | | 78 | | Director |
| (March 2004–Present) | | | | Bryn Mawr Bank Corp. (BMTC) |
| | | | | |
| Investment Manager | | | | Chairman of Investment |
| Morgan Stanley & Co. | | | | Committee |
| (January 1984–March 2004) | | | | Pennsylvania Academy of |
| | | | | Fine Arts |
| | | | | |
| | | | | Investment Committee and |
| | | | | Governance Committee |
| | | | | Member |
| | | | | Pennsylvania Horticultural |
| | | | | Society |
| | | | | |
| President | | 78 | | Director |
| Drexel University | | | | Community Health Systems |
| (August 2010–Present) | | | | |
| | | | | Director — Ecore |
| President | | | | International |
| Franklin & Marshall College | | | | (2009 – 2010) |
| (July 2002–July 2010) | | | | |
| | | | | Director — Allied |
| Executive Vice President | | | | Barton Securities Holdings |
| University of Pennsylvania | | | | (2005 – 2008) |
| (April 1995–June 2002) | | | | |
| | | | | |
| Founder and | | 78 | | None |
| Managing Director | | | | |
| Anthony Knerr & Associates | | | | |
| (Strategic Consulting) | | | | |
| (1990–Present) | | | | |
| | | | | |
| Chief Investment Officer | | 78 | | None |
| Assurant, Inc. (Insurance) | | | | |
| (2002–2004) | | | | |
| | | | | |
| | | | | |
43
Board of trustees/directors and officers addendum
Delaware Investments® Family of Funds
| Name, Address, | | Position(s) | | Length of |
| and Birth Date | | Held with Fund(s) | | Time Served |
| Independent Trustees (continued) | | | | |
| | | | | |
| Ann R. Leven | | Trustee | | Since October 1989 |
| 2005 Market Street | | | | |
| Philadelphia, PA 19103 | | | | |
| November 1940 | | | | |
| | | | |
| Thomas F. Madison | | Trustee | | Since May 19973 |
| 2005 Market Street | | | | |
| Philadelphia, PA 19103 | | | | |
| February 1936 | | | | |
| | | | |
3 In 1997, several funds managed by Voyageur Fund Managers, Inc. (the “Voyageur Funds”) were incorporated into the Delaware Investments Family of Funds. Mr. Madison served as a director of the Voyageur Funds from 1993 until 1997.
44
| | | Number of Portfolios in | | |
| Principal Occupation(s) | | Fund Complex Overseen | | Other Directorships |
| During Past 5 Years | | by Trustee or Officer | | Held by Trustee or Officer |
| | | | | |
| | | | | |
| Consultant | | 78 | | Director and Audit |
| ARL Associates | | | | Committee Chair – |
| (Financial Planning) | | | | Systemax Inc. |
| (1983–Present) | | | | (2001 – 2009) |
| | | | | |
| | | | | Director and Audit |
| | | | | Committee Chairperson – |
| | | | | Andy Warhol Foundation |
| | | | | (1999 – 2007) |
| | | | | |
| President and | | 78 | | Director and Chair of |
| Chief Executive Officer | | | | Compensation Committee, |
| MLM Partners, Inc. | | | | Governance Committee |
| (Small Business Investing | | | | Member |
| and Consulting) | | | | CenterPoint Energy |
| (January 1993–Present) | | | | |
| | | | | Lead Director and Chair of |
| | | | | Audit and Governance |
| | | | | Committees, Member of |
| | | | | Compensation Committee |
| | | | | Digital River, Inc. |
| | | | | |
| | | | | Director and Chair of |
| | | | | Governance Committee, |
| | | | | Audit Committee |
| | | | | Member |
| | | | | Rimage Corporation |
| | | | | |
| | | | | Director and Chair of |
| | | | | Compensation Committee |
| | | | | Spanlink Communications |
| | | | | |
| | | | | Lead Director and Member of |
| | | | | Compensation and |
| | | | | Governance Committees |
| | | | | Valmont Industries, Inc. |
| | | | | (1987 – 2010) |
| | | | | |
45
Board of trustees/directors and officers addendum
Delaware Investments® Family of Funds
| Name, Address, | | Position(s) | | Length of |
| and Birth Date | | Held with Fund(s) | | Time Served |
| Independent Trustees (continued) | | | | |
| |
| Thomas F. Madison | | | | |
| 2005 Market Street | | | | |
| Philadelphia, PA 19103 | | | | |
| February 1936 | | | | |
| |
| Janet L. Yeomans | | Trustee | | Since April 1999 |
| 2005 Market Street | | | | |
| Philadelphia, PA 19103 | | | | |
| July 1948 | | | | |
| |
| |
| |
| |
| J. Richard Zecher | | Trustee | | Since March 2005 |
| 2005 Market Street | | | | |
| Philadelphia, PA 19103 | | | | |
| July 1940 | | | | |
| |
| |
| | | | | |
| | | | | |
| | | | | |
| | | | | |
| | | | | |
| | | | | |
| | | | | |
| | | | | |
| | | | | |
| | | | | |
| | | | | |
| | | | | |
| | | | | |
| | | | | |
| |
46
| | | Number of Portfolios in | | |
| Principal Occupation(s) | | Fund Complex Overseen | | Other Directorships |
| During Past 5 Years | | by Trustee or Officer | | Held by Trustee or Officer |
| | | | | |
| |
| | | | | Director |
| | | | | Banner Health |
| | | | | (1996 – 2007) |
| | | | | |
| |
| Vice President and Treasurer | | 78 | | Director |
| (January 2006–Present) | | | | Okabena Company |
| Vice President — Mergers & Acquisitions | | | | |
| (January 2003–January 2006), and | | | | |
| Vice President | | | | |
| (July 1995–January 2003) | | | | |
| 3M Corporation | | | | |
| |
| Founder | | 78 | | Director and Audit |
| Investor Analytics | | | | Committee Member |
| (Risk Management) | | | | Investor Analytics |
| (May 1999–Present) | | | | |
| | | | | |
| Founder | | | | Director |
| Sutton Asset Management | | | | Oxigene, Inc. |
| (Hedge Fund) | | | | (2003 – 2008) |
| (September 1996–Present) | | | | |
| | | | | |
| | | | | |
| | | | | |
| | | | | |
| | | | | |
| | | | | |
| | | | | |
| | | | | |
| | | | | |
| | | | | |
| | | | | |
| |
47
Board of trustees/directors and officers addendum
Delaware Investments® Family of Funds
| Name, Address, | | Position(s) | | Length of |
| and Birth Date | | Held with Fund(s) | | Time Served |
| Officers | | | | |
| | | | | |
| David F. Connor | | Vice President, | | Vice President since |
| 2005 Market Street | | Deputy General | | September 2000 |
| Philadelphia, PA 19103 | | Counsel, and Secretary | | and Secretary since |
| December 1963 | | | | October 2005 |
| | | | | |
| | | | | |
| Daniel V. Geatens | | Vice President | | Treasurer |
| 2005 Market Street | | and Treasurer | | since October 2007 |
| Philadelphia, PA 19103 | | | | |
| October 1972 | | | | |
| | | | | |
| David P. O’Connor | | Senior Vice President, | | Senior Vice President, |
| 2005 Market Street | | General Counsel, | | General Counsel, and |
| Philadelphia, PA 19103 | | and Chief Legal Officer | | Chief Legal Officer |
| February 1966 | | | | since October 2005 |
| | | | | |
| Richard Salus | | Senior Vice President | | Chief Financial Officer |
| 2005 Market Street | | and Chief Financial Officer | | since November 2006 |
| Philadelphia, PA 19103 | | | | |
| October 1963 | | | | |
| | | | | |
The Statement of Additional Information for the Fund(s) includes additional information about the Trustees and Officers and is available, without charge, upon request by calling 800 523-1918.
48
| | | Number of Portfolios in | | |
| Principal Occupation(s) | | Fund Complex Overseen | | Other Directorships |
| During Past 5 Years | | by Trustee or Officer | | Held by Trustee or Officer |
| | | | | |
| | | | | |
| David F. Connor has served as | | 78 | | None4 |
| Vice President and Deputy | | | | |
| General Counsel of | | | | |
| Delaware Investments | | | | |
| since 2000. | | | | |
| | | | | |
| Daniel V. Geatens has served | | 78 | | None4 |
| in various capacities at | | | | |
| different times at | | | | |
| Delaware Investments. | | | | |
| | | | | |
| David P. O’Connor has served in | | 78 | | None4 |
| various executive and legal | | | | |
| capacities at different times | | | | |
| at Delaware Investments. | | | | |
| | | | | |
| Richard Salus has served in | | 78 | | None4 |
| various executive capacities | | | | |
| at different times at | | | | |
| Delaware Investments. | | | | |
| | | | | |
4 David F. Connor, Daniel V. Geatens, David P. O’Connor, and Richard Salus serve in similar capacities for the six portfolios of the Optimum Fund Trust, which have the same investment advisor, principal underwriter, and transfer agent as the registrant.
49
About the organization
| Board of trustees |
Patrick P. Coyne
Chairman, President, and
Chief Executive Officer
Delaware Investments®
Family of Funds
Philadelphia, PA Thomas L. Bennett
Private Investor
Rosemont, PA John A. Fry
President
Drexel University
Philadelphia, PA | Anthony D. Knerr
Founder and Managing
Director
Anthony Knerr &
Associates
New York, NY Lucinda S. Landreth
Former Chief Investment
Officer
Assurant, Inc.
Philadelphia, PA | Ann R. Leven
Consultant
ARL Associates
New York, NY Thomas F. Madison
President and
Chief Executive Officer
MLM Partners, Inc.
Minneapolis, MN | Janet L. Yeomans
Vice President and
Treasurer
3M Corporation
St. Paul, MN J. Richard Zecher
Founder
Investor Analytics
Scottsdale, AZ |
| | | | |
| Affiliated officers |
David F. Connor
Vice President, Deputy
General Counsel, and
Secretary
Delaware Investments
Family of Funds
Philadelphia, PA | Daniel V. Geatens
Vice President and
Treasurer
Delaware Investments
Family of Funds
Philadelphia, PA | David P. O’Connor
Senior Vice President,
General Counsel,
and Chief Legal Officer
Delaware Investments
Family of Funds
Philadelphia, PA | Richard Salus
Senior Vice President and
Chief Financial Officer
Delaware Investments
Family of Funds
Philadelphia, PA |
This annual report is for the information of Delaware Large Cap Value Fund shareholders, but it may be used with prospective investors when preceded or accompanied by a current prospectus for Delaware Large Cap Value Fund and the Delaware Investments Fund fact sheet for the most recently completed calendar quarter. These documents are available at www.delawareinvestments.com. The prospectus sets forth details about charges, expenses, investment objectives, and operating policies of the investment company. You should read the prospectus carefully before you invest. The figures in this report represent past results that are not a guarantee of future results. The return and principal value of an investment in the investment company will fluctuate so that shares, when redeemed, may be worth more or less than their original cost. |
Delaware Investments is the marketing name of Delaware Management Holdings, Inc. and its subsidiaries. The Fund files its complete schedule of portfolio holdings with the Securities and Exchange Commission (SEC) for the first and third quarters of each fiscal year on Form N-Q. The Fund’s Forms N-Q, as well as a description of the policies and procedures that the Fund uses to determine how to vote proxies (if any) relating to portfolio securities are available without charge (i) upon request, by calling 800 523-1918; and (ii) on the SEC’s Web site at www.sec.gov. In addition, a description of the policies and procedures that the Fund uses to determine how to vote proxies (if any) relating to portfolio securities and the Fund’s Schedule of Investments are available without charge on the Fund’s Web site at www.delawareinvestments.com. The Fund’s Forms N-Q may be reviewed and copied at the SEC’s Public Reference Room in Washington, D.C.; information on the operation of the Public Reference Room may be obtaine d by calling 800 SEC-0330. Information (if any) regarding how the Fund voted proxies relating to portfolio securities during the most recently disclosed 12-month period ended June 30 is available without charge (i) through the Fund’s Web site at www.delawareinvestments.com; and (ii) on the SEC’s Web site at www.sec.gov. |
50
Item 2. Code of Ethics
The registrant has adopted a code of ethics that applies to the registrant’s principal executive officer, principal financial officer, principal accounting officer or controller, or persons performing similar functions, regardless of whether these individuals are employed by the registrant or a third party. A copy of the registrant’s Code of Business Ethics has been posted on the Delaware Investments Internet Web site at www.delawareinvestments.com. Any amendments to the Code of Business Ethics, and information on any waiver from its provisions granted by the registrant, will also be posted on this Web site within five business days of such amendment or waiver and will remain on the Web site for at least 12 months.
Item 3. Audit Committee Financial Expert
The registrant’s Board of Trustees/Directors has determined that each member of the registrant’s Audit Committee is an audit committee financial expert, as defined below. For purposes of this item, an “audit committee financial expert” is a person who has the following attributes:
a. An understanding of generally accepted accounting principles and financial statements;
b. The ability to assess the general application of such principles in connection with the accounting for estimates, accruals, and reserves;
c. Experience preparing, auditing, analyzing, or evaluating financial statements that present a breadth and level of complexity of accounting issues that are generally comparable to the breadth and complexity of issues that can reasonably be expected to be raised by the registrant’s financial statements, or experience actively supervising one or more persons engaged in such activities;
d. An understanding of internal controls and procedures for financial reporting; and
e. An understanding of audit committee functions.
An “audit committee financial expert” shall have acquired such attributes through:
a. Education and experience as a principal financial officer, principal accounting officer, controller, public accountant, or auditor or experience in one or more positions that involve the performance of similar functions;
b. Experience actively supervising a principal financial officer, principal accounting officer, controller, public accountant, auditor, or person performing similar functions;
c. Experience overseeing or assessing the performance of companies or public accountants with respect to the preparation, auditing, or evaluation of financial statements; or
d. Other relevant experience.
The registrant’s Board of Trustees/Directors has also determined that each member of the registrant’s Audit Committee is independent. In order to be “independent” for purposes of this item, the Audit Committee member may not: (i) other than in his or her capacity as a member of the Board of Trustees/Directors or any committee thereof, accept directly or indirectly any consulting, advisory or other compensatory fee from the issuer; or (ii) be an “interested person” of the registrant as defined in Section 2(a)(19) of the Investment Company Act of 1940.
The names of the audit committee financial experts on the registrant’s Audit Committee are set forth below:
John A. Fry
Thomas F. Madison
Janet L. Yeomans
Item 4. Principal Accountant Fees and Services
(a) Audit fees.
The aggregate fees billed for services provided to the registrant by its independent auditors for the audit of the registrant’s annual financial statements and for services normally provided by the independent auditors in connection with statutory and regulatory filings or engagements were $60,900 for the fiscal year ended November 30, 2010.
The aggregate fees billed for services provided to the registrant by its independent auditors for the audit of the registrant’s annual financial statements and for services normally provided by the independent auditors in connection with statutory and regulatory filings or engagements were $61,976 for the fiscal year ended November 30, 2009.
(b) Audit-related fees.
The aggregate fees billed by the registrant’s independent auditors for services relating to the performance of the audit of the registrant’s financial statements and not reported under paragraph (a) of this Item were $0 for the fiscal year ended November 30, 2010.
The aggregate fees billed by the registrant’s independent auditors for services relating to the performance of the audit of the financial statements of the registrant’s investment adviser and other service providers under common control with the adviser and that relate directly to the operations or financial reporting of the registrant were $84,000 for the registrant’s fiscal year ended November 30, 2010. The percentage of these fees relating to services approved by the registrant’s Audit Committee pursuant to the de minimis exception from the pre-approval requirement in Rule 2-01(c)(7)(i)(C) of Regulation S-X was 0%. These audit-related services were as follows: audit procedures performed on Delaware Investments for its consolidation into Macquarie's financial statements as of March 31, 2010.
The aggregate fees billed by the registrant’s independent auditors for services relating to the performance of the audit of the registrant’s financial statements and not reported under paragraph (a) of this Item were $0 for the fiscal year ended November 30, 2009.
The aggregate fees billed by the registrant’s independent auditors for services relating to the performance of the audit of the financial statements of the registrant’s investment adviser and other service providers under common control with the adviser and that relate directly to the operations or financial reporting of the registrant were $19,074 for the registrant’s fiscal year ended November 30, 2009. The percentage of these fees relating to services approved by the registrant’s Audit Committee pursuant to the de minimis exception from the pre-approval requirement in Rule 2-01(c)(7)(i)(C) of Regulation S-X was 0%. These audit-related services were as follows: issuance of report concerning transfer agent's system of internal accounting control pursuant to Rule 17Ad-13 of the Securities Exchange Act.
(c) Tax fees.
The aggregate fees billed by the registrant’s independent auditors for tax-related services provided to the registrant were $11,200 for the fiscal year ended November 30, 2010. The percentage of these fees relating to services approved by the registrant’s Audit Committee pursuant to the de minimis exception from the pre-approval requirement in Rule 2-01(c)(7)(i)(C) of Regulation S-X was 0%. These tax-related services were as follows: Review of income tax returns and review of annual exc ise distribution calculations.
The aggregate fees billed by the registrant’s independent auditors for tax-related services provided to the registrant’s investment adviser and other service providers under common control with the adviser and that relate directly to the operations or financial reporting of the registrant were $10,000 for the registrant’s fiscal year ended November 30, 2010.
The aggregate fees billed by the registrant’s independent auditors for tax-related services provided to the registrant were $23,500 for the fiscal year ended November 30, 2009. The percentage of these fees relating to services approved by the registrant’s Audit Committee pursuant to the de minimis exception from the pre-approval requirement in Rule 2-01(c)(7)(i)(C) of Regulation S-X was 0%. These tax-related services were as follows: Review of income tax returns/review of annual excise distribution calculations.
The aggregate fees billed by the registrant’s independent auditors for tax-related services provided to the registrant’s investment adviser and other service providers under common control with the adviser and that relate directly to the operations or financial reporting of the registrant were $0 for the registrant’s fiscal year ended November 30, 2009.
(d) All other fees.
The aggregate fees billed for all services provided by the independent auditors to the registrant other than those set forth in paragraphs (a), (b) and (c) of this Item were $0 for the fiscal year ended November 30, 2010.
The aggregate fees billed for all services other than those set forth in paragraphs (b) and (c) of this Item provided by the registrant’s independent auditors to the registrant’s adviser and other service providers under common control with the adviser and that relate directly to the operations or financial reporting of the registrant were $0 for the registrant’s fiscal year ended November 30, 2010.
The aggregate fees billed for all services provided by the independent auditors to the registrant other than those set forth in paragraphs (a), (b) and (c) of this Item were $0 for the fiscal year ended November 30, 2009.
The aggregate fees billed for all services other than those set forth in paragraphs (b) and (c) of this Item provided by the registrant’s independent auditors to the registrant’s adviser and other service providers under common control with the adviser and that relate directly to the operations or financial reporting of the registrant were $0 for the registrant’s fiscal year ended November 30, 2009.
(e) The registrant’s Audit Committee has established pre-approval policies and procedures as permitted by Rule 2-01(c)(7)(i)(B) of Regulation S-X (the “Pre-Approval Policy”) with respect to services provided by the registrant’s independent auditors. Pursuant to the Pre-Approval Policy, the Audit Committee has pre-approved the services set forth in the table below with respect to the registrant up to the specified fee limits. Certain fee limits are based on aggregate fees to the registrant and other registrants within the Delaware Investments Family of Funds.
| Service | Range of Fees |
| Audit Services | |
| Statutory audits or financial audits for new Funds | up to $25,000 per Fund |
| Services associated with SEC registration statements (e.g., Form N-1A, Form N-14, etc.), periodic reports and other documents filed with the SEC or other documents issued in connection with securities offerings (e.g., comfort letters for closed-end Fund offerings, consents), and assistance in responding to SEC comment letters | up to $10,000 per Fund |
| Consultations by Fund management as to the accounting or disclosure treatment of transactions or events and/or the actual or potential impact of final or proposed rules, standards or interpretations by the SEC, FASB, or other regulatory or standard-setting bodies (Note: Under SEC rules, some consultations may be considered “audit-related services” rather than “audit services”) | up to $25,000 in the aggregate |
| Audit-Related Services | |
| Consultations by Fund management as to the accounting or disclosure treatment of transactions or events and /or the actual or potential impact of final or proposed rules, standards or interpretations by the SEC, FASB, or other regulatory or standard-setting bodies (Note: Under SEC rules, some consultations may be considered “audit services” rather than “audit-related services”) | up to $25,000 in the aggregate |
| Tax Services | |
| U.S. federal, state and local and international tax planning and advice (e.g., consulting on statutory, regulatory or administrative developments, evaluation of Funds’ tax compliance function, etc.) | up to $25,000 in the aggregate |
| U.S. federal, state and local tax compliance (e.g., excise distribution reviews, etc.) | up to $5,000 per Fund |
| Review of federal, state, local and international income, franchise and other tax returns | up to $5,000 per Fund |
Under the Pre-Approval Policy, the Audit Committee has also pre-approved the services set forth in the table below with respect to the registrant’s investment adviser and other entities controlling, controlled by or under common control with the investment adviser that provide ongoing services to the registrant (the “Control Affiliates”) up to the specified fee limit. This fee limit is based on aggregate fees to the investment adviser and its Control Affiliates.
| Service | Range of Fees |
| Non-Audit Services | |
| Services associated with periodic reports and other documents filed with the SEC and assistance in responding to SEC comment letters | up to $10,000 in the aggregate |
The Pre-Approval Policy requires the registrant’s independent auditors to report to the Audit Committee at each of its regular meetings regarding all services initiated since the last such report was rendered, including those services authorized by the Pre-Approval Policy.
(f) Not applicable.
(g) The aggregate non-audit fees billed by the registrant’s independent auditors for services rendered to the registrant and to its investment adviser and other service providers under common control with the adviser were $0 and $223,214 for the registrant’s fiscal years ended November 30, 2010 and November 30, 2009, respectively.
(h) In connection with its selection of the independent auditors, the registrant’s Audit Committee has considered the independent auditors’ provision of non-audit services to the registrant’s investment adviser and other service providers under common control with the adviser that were not required to be pre-approved pursuant to Rule 2-01(c)(7)(ii) of Regulation S-X. The Audit Committee has determined that the independent auditors’ provision of these services is compatible with maintaining the auditors’ independence.
Item 5. Audit Committee of Listed Registrants
Not applicable.
Item 6. Investments
(a) Included as part of report to shareholders filed under Item 1 of this Form N-CSR.
(b) Divestment of securities in accordance with Section 13(c) of the Investment Company Act of 1940.
Not applicable.
Item 7. Disclosure of Proxy Voting Policies and Procedures for Closed-End Management Investment Companies
Not applicable.
Item 8. Portfolio Managers of Closed-End Management Investment Companies
Not applicable.
Item 9. Purchases of Equity Securities by Closed-End Management Investment Company and Affiliated Purchasers
Not applicable.
Item 10. Submission of Matters to a Vote of Security Holders
Not applicable.
Item 11. Controls and Procedures
The registrant’s principal executive officer and principal financial officer have evaluated the registrant’s disclosure controls and procedures within 90 days of the filing of this report and have concluded that they are effective in providing reasonable assurance that the information required to be disclosed by the registrant in its reports or statements filed under the Securities Exchange Act of 1934 is recorded, processed, summarized and reported within the time periods specified in the rules and forms of the Securities and Exchange Commission.
There were no significant changes in the registrant’s internal control over financial reporting that occurred during the second fiscal quarter of the period covered by the report to stockholders included herein (i.e., the registrant’s fourth fiscal quarter) that have materially affected, or are reasonably likely to materially affect, the registrant’s internal control over financial reporting.
Item 12. Exhibits
(a) (1) Code of Ethics
Not applicable.
(2) Certifications of Principal Executive Officer and Principal Financial Officer pursuant to Rule 30a-2 under the Investment Company Act of 1940 are attached hereto as Exhibit 99.CERT.
(3) Written solicitations to purchase securities pursuant to Rule 23c-1 under the Securities Exchange Act of 1934.
Not applicable.
(b) Certifications pursuant to Section 906 of the Sarbanes-Oxley Act of 2002 are furnished herewith as Exhibit 99.906CERT.
SIGNATURES
Pursuant to the requirements of the Securities Exchange Act of 1934 and the Investment Company Act of 1940, the registrant has duly caused this report to be signed on its behalf, by the undersigned, thereunto duly authorized.
Name of Registrant: Delaware Group Equity Funds II
| /s/ PATRICK P. COYNE |
| By: | Patrick P. Coyne |
| Title: | Chief Executive Officer |
| Date: | February 4, 2011 |
Pursuant to the requirements of the Securities Exchange Act of 1934 and the Investment Company Act of 1940, this report has been signed below by the following persons on behalf of the registrant and in the capacities and on the dates indicated.
| /s/ PATRICK P. COYNE |
| By: | Patrick P. Coyne |
| Title: | Chief Executive Officer |
| Date: | February 4, 2011 |
| |
| /s/ RICHARD SALUS |
| By: | Richard Salus |
| Title: | Chief Financial Officer |
| Date: | February 4, 2011 |