UNITED STATES
SECURITIES AND EXCHANGE COMMISSION
WASHINGTON, D.C. 20549
FORM N-CSR
CERTIFIED SHAREHOLDER REPORT OF REGISTERED
MANAGEMENT INVESTMENT COMPANIES
Investment Company Act file number 811-2668
Oppenheimer Rochester AMT-Free Municipal Fund
(Exact name of registrant as specified in charter)
6803 South Tucson Way, Centennial, Colorado 80112-3924
(Address of principal executive offices) (Zip code)
Arthur S. Gabinet
OFI Global Asset Management, Inc.
Two World Financial Center, New York, New York 10281-1008
(Name and address of agent for service)
Registrant’s telephone number, including area code: (303) 768-3200
Date of fiscal year end: July 31
Date of reporting period: 7/31/2014
| Item 1. | Reports to Stockholders. |
Class A Shares
AVERAGE ANNUAL TOTAL RETURNS AT 7/31/14
| | | | | | | | |
| | | Class A Shares of the Fund | | | | |
| | | Without Sales Charge | | With Sales Charge | | Barclays Municipal Bond Index | | |
1-Year | | 9.18% | | 4.00% | | 7.27% | | |
| | |
5-Year | | 11.21 | | 10.13 | | 5.50 | | |
| | |
10-Year | | 2.93 | | 2.43 | | 4.85 | | |
| | |
Performance data quoted represents past performance, which does not guarantee future results. The investment return and principal value of an investment in the Fund will fluctuate so that an investor’s shares, when redeemed, may be worth more or less than their original cost. Fund returns include changes in share price, reinvested distributions, and a 4.75% maximum applicable sales charge except where “without sales charge” is indicated. Current performance may be lower or higher than the performance quoted. Returns do not consider capital gains or income taxes on an individual’s investment. For performance data current to the most recent month-end, visit oppenheimerfunds.com or call 1.800.CALL OPP (225.5677).
OppenheimerFunds/Rochester is using social media to provide timely information related to muni market developments at www.twitter.com/RochesterFunds.
2 OPPENHEIMER ROCHESTER AMT-FREE MUNICIPAL FUND
Fund Performance Discussion
Oppenheimer Rochester AMT-Free Municipal Fund once again provided competitive, yield-driven total returns this reporting period. The Class A shares produced an annual total return of 9.18% (without sales charge), about two-thirds of which was attributable to the tax-free income generated by the Fund’s holdings. The Fund outperformed its benchmark for the 12-month period ended July 31, 2014 and, at 5.98% (without sales charge), the distribution yield of the Class A shares was the second highest in Lipper’s General & Insured Municipal Debt Funds category, trailing only this Fund’s Y shares.
MARKET OVERVIEW
Amid sluggish economic growth at the beginning of this reporting period, the muni market rallied. The Barclays Municipal Bond Index, an unmanaged index of a broad range of investment-grade municipal bonds that measures the performance of the general municipal bond market, rose 7.27% in the 12 months ended July 31, 2014.
In November 2013, as he approached the end of his 8-year tenure, Fed Chairman Ben S. Bernanke spoke frankly about his regular press conferences, saying that “transparency in
|
The average distribution yield in Lipper’s General & Insured Municipal Debt Funds category was 3.21% at the end of this reporting period. At 5.98%, the distribution yield for this Fund’s Class A shares was 277 basis points higher than the category average. |
monetary policy enhances public understanding and confidence.” Mr. Bernanke’s announcement in June 2013 — that the Fed was “prepared to increase or reduce the pace of its purchases — had caused a sharp market sell-off at the end of
| | | | | | | | |
| | | | | | | | | |
| | | |
YIELDS & DISTRIBUTIONS FOR CLASS A SHARES | | | | | | | | |
| | | |
Dividend Yield w/o sales charge | | | 5.98% | | | | | |
| | | |
Dividend Yield with sales charge | | | 5.70 | | | | | |
| | | |
Standardized Yield | | | 5.70 | | | | | |
| | | |
Taxable Equivalent Yield | | | 10.07 | | | | | |
| | | |
Last distribution (7/22/14) | | $ | 0.034 | | | | | |
| | | |
Total distributions (8/1/13 to 7/31/14) | | $ | 0.398 | | | | | |
| | | |
Endnotes for this discussion begin on page 14 of this report | | | | | | | | |
3 OPPENHEIMER ROCHESTER AMT-FREE MUNICIPAL FUND
the last reporting period, and many bond funds saw considerable outflows during the remainder of calendar year 2013. As a result, yields rose, effectively turning the investor’s fears into a reality. Investors who were able to ride out the price volatility and focus on the long term were able to buy bonds with higher yields.
Another sell-off occurred in mid-March 2014 after Janet Yellen, who was confirmed as chairman of the Federal Reserve on January 6, 2014, held her first press conference. There, she announced that the Fed’s decisions about the Fed Funds rate would begin to “take into account a wide range of information, including measures of labor market conditions, indicators of inflation pressures and inflation expectations, and readings on financial developments.” The Fed Funds rate has been set between zero and 0.25% since December 2008, and the Fed’s policy – that the Fed Funds rate would not change until the unemployment rate had crossed the 6.5% threshold – has been in place since mid-December 2012.
The Fed’s decision to spend billions monthly on mortgage-backed securities and long-term Treasuries has long remained a source of speculation. After more than a year of $85-billion-a-month purchases, the Fed lowered its spending to $75 billion in January 2014 and then to $65 billion the following month. Near the end of April, the Fed announced that spending in May would be $45 billion with another drop scheduled for the summer. The Fed announced at the end of July that it would
reduce its monthly bond purchases to $25 billion, yet gave no hint that recent signs of stronger growth had altered its resolve to hold short-term interests rates near zero into 2015.
Ms. Yellen has affirmed the Fed’s plan to end its stimulus purchases in the fall of 2014. The Fed also said it would reinvest the proceeds from its maturing securities in an effort to maintain current holdings levels. Although an end to the stimulus campaign looms, there is increasing backing among Fed officials to preserve the portfolio’s size, which it believes would help to keep borrowing costs low.
Given the current Fed Funds rate, the only plausible change would be an increase. The Fed has indicated that it has “no mechanical formula or timetable” for a decision about raising the Fed Funds rate. We remind investors that a change in the Fed Funds rate does not automatically translate into a change in longer-term interest rates, which are determined by the marketplace. Additionally, the Fund’s investment team believes that its focus on finding value in the marketplace and producing competitive levels of tax-free income is well suited for the market conditions that existed at the end of this reporting period.
AAA-rated municipal securities with maturities of 15 years or longer remained “cheap to Treasuries” this reporting period, a condition that exists when the after-tax yields on muni bonds exceed the yields on Treasury bonds with comparable maturities. This condition allows investors to benefit further from the
4 OPPENHEIMER ROCHESTER AMT-FREE MUNICIPAL FUND
federal, state and, where applicable, local tax exemptions on municipal investment income.
On July 31, 2014, the average yield on 30-year, AAA-rated muni bonds was 3.44%, down 84 basis points from July 31, 2013. The average yield on 10-year, AAA-rated muni bonds on July 31, 2014, was 2.22%, down 66 basis points from the July 2013 date, and the average yield on 1-year, AAA-rated muni bonds was 0.15%, down 14 basis points from the July 2013 date.
During this reporting period, media coverage about municipal debt issued in Puerto Rico and Detroit’s bankruptcy, which occurred during the previous reporting period, contributed to market volatility. Details about the Fund’s Puerto Rico holdings can be found in the Fund Performance section, which follows.
This Fund’s investments in Detroit include insured bonds issued by the Detroit City School District and tax increment financing securities (TIFs), which are secured by the incremental tax revenue that is created and collected once a real-estate developer makes incremental improvements to a property. This Fund also holds Detroit water and sewer bonds, which are secured by a dedicated revenue stream.
Near the end of this reporting period, pensioners voted to accept Detroit’s plan to exit bankruptcy, but other creditors saw the plan as “inferior” and potentially flawed. Negotiations with creditors – including holders
of Detroit’s $5.3 billion in water and sewer bonds – were ongoing as of July 31, 2014. Any long-term implications of Detroit’s filing will depend on how the bankruptcy judge ultimately rules. The Rochester team has been monitoring the fiscal conditions in the Motor City for years and will continue to do so.
Successful investors, we have found, maintain a long-term perspective regardless of the specific developments associated with any given reporting period. To maximize the benefits that municipal bond funds seek to provide, many investors reinvest their dividends and allow the income generated from their investments to compound over time.
FUND PERFORMANCE
Oppenheimer Rochester AMT-Free Municipal Fund held more than 830 securities as of July 31, 2014. The Fund was invested in a broad range of sectors, providing shareholders with a diversity of holdings that we believe would be difficult and costly to replicate in an individual portfolio.
The Fund’s Class A distribution yield at NAV was among the top 2% in Lipper’s General & Insured Municipal Debt Funds category as of July 31, 2014. At 5.98% on that date, it was 277 basis points higher than the category average, which was 3.21%. Additionally, for a taxable investment to have provided a greater benefit than an investment in this Fund, it would have had to yield more than 10.07%, based on the Fund’s standardized yield as of
5 OPPENHEIMER ROCHESTER AMT-FREE MUNICIPAL FUND

July 31, 2014, and the current top federal income tax rate. As long-time investors know, yields on fixed-income funds rise when share prices fall, and yields have historically contributed the lion’s share of the long-term total returns generated by bonds.
The dividend trend for this Fund shows the positive impact a yield-driven approach can have amid challenging market conditions. The Fund’s dividend, which was 3.2 cents per Class A share at the outset of the reporting period, increased twice during this reporting period: It rose to 3.3 cents beginning with the September 2013 payout and to 3.4 cents with the May 2014 payout. In all, the Fund distributed 39.8 cents per Class A share this reporting period.
Municipal bonds backed by proceeds from the tobacco Master Settlement Agreement (MSA), the national litigation settlement with U.S. tobacco manufacturers, represented 16.5% of the Fund’s total assets at the end of this reporting period and contributed positively to Fund performance.
We believe the securities we hold in this sector are fundamentally sound credits, and we like that “tobacco bonds” can provide tax-exempt income for investors as well as benefits to the issuing states and territories. Our long-term view of the sector remains bullish and, given attractive valuations, we believe that it is likely we will continue to hold a greater percentage of tobacco bonds in our portfolios than our peers. As in prior reporting periods, the
6 OPPENHEIMER ROCHESTER AMT-FREE MUNICIPAL FUND

tobacco bonds this Fund held during this reporting period made all scheduled payments of interest and principal on time and in full.
The Fund remained invested this reporting period in land development (or “dirt”) bonds, which are Special Assessment and Special Tax bonds that help finance the infrastructure needs of new real estate development. At the end of this reporting period, the Special Assessment and Special Tax sectors represented 12.1% and 4.1% of the Fund’s total assets, respectively.
Overall, we believe that the bonds in these sectors have several appealing characteristics: the debt service payments securing these bonds are on parity with real estate taxes and senior to mortgage payments, and
assessments or taxes must be paid by whoever owns the land when the tax bill comes due. During this reporting period, the bonds in these sectors contributed favorably to the Fund’s performance, supporting our long-standing belief that carefully researched dirt bonds belong in our portfolios. We continue to believe that improvements in the housing market and the general economy could further strengthen the credit profiles of these sectors.
As of July 31, 2014, the Fund was invested in the hospital/healthcare sector, which totaled 11.2% of its total assets. Our holdings in this sector consist of securities across the credit spectrum. Bonds in this sector were positive contributors to the Fund’s total return this reporting period.
7 OPPENHEIMER ROCHESTER AMT-FREE MUNICIPAL FUND
Securities issued in the Commonwealth of Puerto Rico, which are exempt from federal, state and local income taxes, represented 11.5% of the Fund’s net assets at the end of this reporting period. (Puerto Rico’s “tobacco bonds” are excluded from this figure, as they are backed by MSA proceeds and included in this Fund’s tobacco holdings, as discussed earlier in this report.) The Fund’s holdings, some of which are insured, include General Obligation (G.O.) debt and securities from many different sectors as well. Most of the Fund’s investments in securities issued in Puerto Rico are supported by taxes and other revenues and are designed to help finance electric utilities, highways and education, among other things. Nonetheless, the Fund’s holdings of bonds issued in Puerto Rico detracted from performance this reporting period amid concerns about the Commonwealth’s ongoing challenges.
Expanding on the fiscal discipline that was the hallmark of Luis Fortuño, his predecessor, first-term Governor Alejandro García Padilla has strengthened the island’s balance sheet, cut the government payrolls, enacted comprehensive pension reforms, and raised revenues via tax rate changes and improved enforcement.
About 90% of the sales tax revenue bonds held by the Fund this reporting period were issued in Puerto Rico. In all, this sector represented 6.0% of the Fund’s total assets as of July 31, 2014, and included bonds issued by various U.S. entities. Debt-service payments on securities in this sector are paid using the
issuing municipality’s sales tax revenues. As was the case overall for the Fund’s Puerto Rico holdings, investments in this sector detracted from the Fund’s overall performance this reporting period.
More than half of the G.O. securities held by this Fund were issued in Puerto Rico. G.O.s, which are backed by the full faith and taxing authority of state and local governments, represented 4.2% of the Fund’s total assets at the end of this reporting period. The Fund’s G.O. holdings also include bonds issued by many municipalities throughout the U.S. Even though G.O.s issued by Puerto Rico experienced “credit spread widening” – which occurs when the difference between yields on low-rated municipal bonds and higher-rated bonds increases – the Fund’s G.O. securities were a positive contributor to Fund performance this reporting period.
Late in this reporting period, news about the Commonwealth’s first balanced general fund budget in more than 20 years was overtaken by Gov. Padilla’s decision to sign legislation allowing Puerto Rico’s public corporations – PREPA (the electric utility authority), PRASA (the aqueduct and sewer authority) and PRHTA (the highway authority) – to restructure their debt. Were issuers to make use of this law – the Puerto Rico Public Corporation Debt Enforcement and Recovery Act (the “Recovery Act”) – they could potentially seek to lessen debt-service payments to their creditors.
8 OPPENHEIMER ROCHESTER AMT-FREE MUNICIPAL FUND
We recently filed a lawsuit in federal court in Puerto Rico, challenging the constitutional validity of the Recovery Act, which we will pursue vigorously. We are determined to protect our shareholders’ best interests and enforce the bond covenants that have been negotiated.
Our investment team will continue to monitor credit rating changes and other developments closely and will post information on our website (oppenheimerfunds.com) and on our Twitter feed (twitter.com/rochesterfunds). We also encourage investors to contact their financial advisors for the latest facts, as the situation remains quite fluid.
Puerto Rico debt continued to be the subject of a variety of critical reports. Early in this reporting period, the coverage focused on the Commonwealth’s lingering economic difficulties, which were exacerbated by the Great Recession. Media coverage in the latter half of calendar year 2013 led to increased pricing pressure on bonds issued in Puerto Rico, though many began to rally in January 2014. Prices of Puerto Rico’s muni bonds fell again late in this reporting period amid discussions of debt restructuring.
Given the degree to which Oppenheimer Rochester funds have been cited in news coverage about the economic and fiscal challenges facing Puerto Rico, we feel compelled to remind investors that all fund investments are actively managed. Our team is responsive to the dynamics of the market and may choose to adjust trading strategies in
the interest of maximizing the potential benefits to our shareholders – and minimizing their potential losses.
Further, while we remain committed to keeping investors informed about our basic investing strategies, we do not provide comment about near-term trading strategies as we believe doing so might allow other market participants to impair our team’s ability to deliver shareholder value.
The Fund’s holdings in municipal bonds issued by utilities represented 8.4% of total assets at the end of this reporting period. As of July 31, 2014, this set of holdings included sewer utilities with 3.7% of total assets, electric utilities with 3.0%, and water utilities with 1.7%. Our holdings in this sector consist of securities in the mid-range of the credit spectrum. While sewer and water utilities contributed positively during the reporting period, our investments in the electric utilities sector included bonds issued by PREPA, causing this sector to detract slightly from performance.
The Fund continued to be invested in the higher education sector this reporting period, which constituted 6.9% of total assets as of July 31, 2014. The investment-grade bonds we hold in this sector have regularly provided high levels of tax-free income with what we believe to be far less credit risk than their external ratings would suggest. Higher education was a positive contributor to the Fund this reporting period.
9 OPPENHEIMER ROCHESTER AMT-FREE MUNICIPAL FUND
Tax increment financing (TIF) bonds constituted 6.0% of the Fund’s total assets on July 31, 2014. Traditionally, this type of financing has been used for urban and suburban renewal projects. When tax collections increase, driven either by an improving economy or inflation, the credit quality of these types of securities generally improves, which can lead to enhanced performance. Bonds in this sector were positive contributors to the Fund’s total return this reporting period.
As of July 31, 2014, 4.6% of the Fund’s total assets were invested in the education sector, which contributed positively to Fund performance. Bonds in this sector primarily finance the infrastructure needs of a variety of the country’s charter schools around the states.
During this reporting period, the Fund maintained an investment in municipal inverse-floating rate securities, which are tax-exempt securities with interest payments that move inversely to changes in short-term interest rates. “Inverse floaters” continued to provide high levels of income to funds across the industry during this reporting period, which was characterized by rising prices among high-grade municipal securities. We continue to believe that “inverse floaters” are an essential element of this Fund’s portfolio because they can produce attractive yields under certain market conditions. The Fund’s inverse floaters, in aggregate, contributed positively to Fund performance this reporting period. As is its penchant, the Rochester-
based investment team will continue to monitor and make adjustments to its portfolios that it believes can provide the greatest benefit to Fund shareholders.
Several sectors in which the Fund maintained relatively smaller investments as of July 31, 2014, also contributed positively to performance. Investors benefited this reporting period from the Fund’s holdings in many sectors including: diversified financial services, marine/aviation facilities, multifamily housing, municipal leases, adult living facilities, highways/commuter facilities and student housing.
In other sectors, however, widening credit spreads and higher yields took a toll on performance. For example, the casino sector detracted from the Fund’s performance this reporting period, as did the securities that the Fund held in the government appropriation, real estate and transportation infrastructure sectors.
Our approach to municipal bond investing is flexible and responsive to market conditions. Further, market conditions during this reporting period did not affect the Fund’s overall investment goals. In closing, we believe that our time-tested strategies and the Fund’s structure and sector composition will continue to benefit fixed-income investors through interest rate and economic cycles.
INVESTMENT STRATEGY
The Rochester investment team focuses exclusively on municipal bonds and has consistently used a time-tested, value-oriented
10 OPPENHEIMER ROCHESTER AMT-FREE MUNICIPAL FUND
and security-specific approach to fund management. We know that market conditions can and do fluctuate, but we do not waver in our belief in the power of tax-free yield to help investors achieve their long-term objectives.
This Fund invests primarily in investment-grade municipal securities. It may invest up to 25% of its total assets in below-investment grade securities, or “junk” bonds; the percentage of assets is measured at the time of purchase as is the credit quality of the securities. Additionally, the credit quality is based on Nationally Recognized Statistical Rating Organization (“NRSRO”) ratings or, if no NRSRO rating, on internal ratings. As of July 31, 2014, market movements or rating changes of municipal bonds, notably the Fund’s investments in Puerto Rico paper, caused the Fund’s below-investment-grade holdings to exceed this threshold. As a result, no further purchases of below-investment-grade bonds will be made until the Fund’s holdings of these types of bonds is once again below 25% of total assets.
Our team continually searches for undervalued bonds that we believe will provide a meaningful level of tax-free income until maturity. Rather than making allocation shifts based on expected market conditions, we search the marketplace for what we believe to be the best values for generating income. It remains important to note that we do not manage our funds based on predictions of interest rate changes.
Instead, our investment approach involves scouring the market for municipal securities that meet our stringent credit criteria and buying bonds that we believe will deliver above-average yields relative to peer funds. We focus on identifying inefficiencies in market pricing that can lead to investment advantages. We seek to maintain a thoughtful mix of industry sectors, maturities and credit ratings in this Fund’s portfolio.
The Rochester Way, we believe, distinguishes our approach to municipal investing from those of our competitors.
Daniel G. Loughran,
Senior Vice President, Senior Portfolio Manager and Team Leader, on behalf of the rest of the Rochester portfolio management team: Scott S. Cottier, Troy E. Willis, Mark R. DeMitry, Michael L. Camarella, Charles S. Pulire and Elizabeth S. Mossow.
11 OPPENHEIMER ROCHESTER AMT-FREE MUNICIPAL FUND
Top Holdings and Allocations
TOP TEN CATEGORIES
| | | | |
Tobacco - Master Settlement Agreement | | | 16.5% | |
Special Assessment | | | 12.1 | |
Hospital/Healthcare | | | 11.2 | |
Higher Education | | | 6.9 | |
Tax Increment Financing (TIF) | | | 6.0 | |
Sales Tax Revenue | | | 6.0 | |
Education | | | 4.6 | |
General Obligation | | | 4.2 | |
Special Tax | | | 4.1 | |
Sewer Utilities | | | 3.7 | |
Portfolio holdings and allocations are subject to change. Percentages are as of July 31, 2014, and are based on total assets.
CREDIT ALLOCATION
| | | | | | | | | | | | |
| | | NRSRO-
Rated | | | Sub- Adviser- Rated | | | Total | |
AAA | | | 1.1 | % | | | 0.3 | % | | | 1.4% | |
AA | | | 13.4 | | | | 0.5 | | | | 13.9 | |
A | | | 11.2 | | | | 0.5 | | | | 11.7 | |
BBB | | | 21.6 | | | | 14.8 | | | | 36.4 | |
BB or lower | | | 22.9 | | | | 13.7 | | | | 36.6 | |
Total | | | 70.2 | % | | | 29.8 | % | | | 100.0% | |
The percentages above are based on the market value of the securities as of July 31, 2014, and are subject to change. OppenheimerFunds, Inc. determines the credit allocation of the Fund’s assets using ratings by nationally recognized statistical rating organizations (NRSROs), such as Standard & Poor’s. For any security rated by an NRSRO other than S&P, the sub-adviser, OppenheimerFunds, Inc., converts that security’s rating to the equivalent S&P rating. If two or more NRSROs have assigned a rating to a security, the highest rating is used. For securities not rated by an NRSRO, the sub-adviser uses its own credit analysis to assign ratings in categories similar to those of S&P. The use of similar categories is not an indication that the sub-adviser’s credit analysis process is consistent or comparable with any NRSRO’s process were that NRSRO to rate the same security.
For the purposes of this Credit Allocation table, securities rated within the NRSROs’ four highest categories—AAA, AA, A and BBB—are investment-grade securities. For further details, please consult the Fund’s prospectus or Statement of Additional Information.
12 OPPENHEIMER ROCHESTER AMT-FREE MUNICIPAL FUND
Performance
DISTRIBUTION YIELDS
As of 7/31/14
| | | | | | | | | | | | | | | | | | | | |
| | | Without Sales Charge | | | | With��Sales Charge | | |
Class A | | 5.98% | | | | 5.70% | | |
Class B | | 5.33 | | | | N/A | | |
Class C | | 5.33 | | | | N/A | | |
Class Y | | 6.22 | | | | N/A | | |
STANDARDIZED YIELDS
For the 30 Days Ended 7/31/14
| | | | | | | | |
Class A | | | 5.70 | % | | | | |
Class B | | | 5.23 | | | | | |
Class C | | | 5.23 | | | | | |
Class Y | | | 6.23 | | | | | |
TAXABLE EQUIVALENT YIELDS
As of 7/31/14
| | | | | | |
Class A | | | 10.07 | % | | |
Class B | | | 9.24 | | | |
Class C | | | 9.24 | | | |
Class Y | | | 11.01 | | | |
AVERAGE ANNUAL TOTAL RETURNS WITHOUT SALES CHARGE AS OF 7/31/14
| | | | | | | | | | | | | | | | | | | | |
| | | Inception Date | | | 1-Year | | | 5-Year | | | 10-Year | | | Since Inception | |
Class A (OPTAX) | | | 10/27/76 | | | | 9.18% | | | | 11.21% | | | | 2.93% | | | | 5.74% | |
Class B (OTFBX) | | | 3/16/93 | | | | 8.39 | | | | 10.32 | | | | 2.45 | | | | 3.91 | |
Class C (OMFCX) | | | 8/29/95 | | | | 8.58 | | | | 10.38 | | | | 2.14 | | | | 3.32 | |
Class Y (OMFYX) | | | 11/29/10 | | | | 9.47 | | | | N/A | | | | N/A | | | | 9.32 | |
AVERAGE ANNUAL TOTAL RETURNS WITH SALES CHARGE AS OF 7/31/14
| | | | | | | | | | | | | | | | | | | | |
| | | Inception Date | | | 1-Year | | | 5-Year | | | 10-Year | | | Since Inception | |
Class A (OPTAX) | | | 10/27/76 | | | | 4.00% | | | | 10.13% | | | | 2.43% | | | | 5.61% | |
Class B (OTFBX) | | | 3/16/93 | | | | 3.39 | | | | 10.04 | | | | 2.45 | | | | 3.91 | |
Class C (OMFCX) | | | 8/29/95 | | | | 7.58 | | | | 10.38 | | | | 2.14 | | | | 3.32 | |
Class Y (OMFYX) | | | 11/29/10 | | | | 9.47 | | | | N/A | | | | N/A | | | | 9.32 | |
13 OPPENHEIMER ROCHESTER AMT-FREE MUNICIPAL FUND
COMPARISON OF CHANGE IN VALUE OF $10,000 HYPOTHETICAL INVESTMENTS IN:
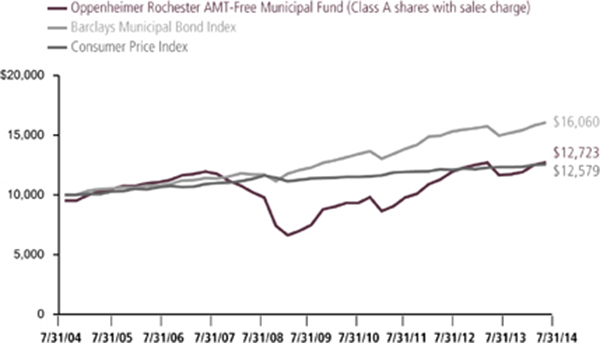
Performance data quoted represents past performance, which does not guarantee future results. The investment return and principal value of an investment in the Fund will fluctuate so that an investor’s shares, when redeemed, may be worth more or less than their original cost. Current performance may be lower or higher than the performance quoted. Returns do not consider capital gains or income taxes on an individual’s investments. For performance data current to the most recent month-end, visit oppenheimerfunds.com or call 1.800.CALL OPP (225.5677). Fund returns include changes in share price, reinvested distributions, and the applicable sales charge: for Class A shares, the current maximum initial sales charge of 4.75%; for Class B shares, the contingent deferred sales charge of 5% (1-year) and 2% (5-year); and for Class C, the contingent deferred sales charge of 1% for the 1-year period. There is no sales charge for Class Y shares. Because Class B shares convert to Class A shares 72 months after purchase, the 10-year return for Class B shares uses Class A performance for the period after conversion.
The Fund’s performance is compared to the performance of the Barclays Municipal Bond Index, an unmanaged index of a broad range of investment-grade municipal bonds that is a measure of the general municipal bond market. The Fund’s performance is also compared to the Consumer Price Index, a non-securities index that measures changes in the inflation rate. Indices are unmanaged and cannot be purchased by investors. While index comparisons may be useful to provide a benchmark for the Fund’s performance, it must be noted that the Fund’s investments are not limited to the investments comprising the index. Index performance includes reinvestment of income, but does not reflect transaction costs, fees, expenses or taxes. Index performance is shown for illustrative purposes only as a benchmark for the Fund’s performance, and does not predict or depict performance of the Fund. The Fund’s performance reflects the effects of the Fund’s business and operating expenses.
Distribution yields for Class A shares are based on dividends of $0.034 for the 28-day accrual period ended July 22, 2014. The yield without sales charge for Class A shares is calculated by dividing annualized dividends by the Class A net asset value on July 22, 2014; for the yield
14 OPPENHEIMER ROCHESTER AMT-FREE MUNICIPAL FUND
with sales charge, the denominator is the Class A maximum offering price on that date. Distribution yields for Class B, C and Y are annualized based on dividends of $0.0301, $0.0301 and $0.0352, respectively, for the 28-day accrual period ended July 22, 2014, and on the corresponding net asset values on that date.
Standardized yield is based on the Fund’s net investment income for the 30-day period ended July 31, 2014, and either that date’s maximum offering price (for Class A shares) or net asset value (for the other classes). Each result is compounded semiannually and annualized. Falling share prices artificially increase yields.
The average distribution yield in this Fund’s Lipper category was calculated based on the distributions and the final net asset values (NAVs) of the reporting period for the funds in each category. The average yield at NAV in Lipper’s General & Insured Municipal Debt funds category is based on 275 NAVs, one for each class of each fund in the category; a fund can have up to 4 classes. Lipper yields do not include sales charges – which, if included, would reduce results.
Taxable equivalent yield is based on the standardized yield and the 2014 top federal tax rate of 43.4%. Calculations factor in the 3.8% tax on unearned income under the Patient Protection and Affordable Care Act, as applicable. A portion of the Fund’s distributions may be subject to tax; capital gains distributions are taxable as capital gains. Tax treatments of the Fund’s distributions and capital gains may vary by state; investors should consult a tax advisor to determine if the Fund is appropriate for them. Each result is compounded semiannually and annualized. Falling share prices artificially increase yields. This Report must be preceded or accompanied by a Fund prospectus.
The average yields for AAA-rated municipal securities are provided by Municipal Market Advisors and are based on its benchmark of general obligation bonds structured with a 5% coupon. The MMA 5% benchmark is constructed using yields from the leading underwriters, who represent a significant percentage of the primary activity of the top 10 underwriters and therefore the total issuance.
Investments in “tobacco bonds,” which are backed by the proceeds a state or territory receives from the 1998 national litigation settlement with tobacco manufacturers, may be vulnerable to economic and/or legislative events that affect issuers in a particular municipal market sector. Annual payments by MSA-participating manufacturers, for example, hinge on many factors, including annual domestic cigarette shipments, inflation and the relative market share of non-participating manufacturers. To date, we believe consumption figures remain within an acceptable range of the assumptions used to structure MSA bonds. Future MSA payments could be reduced if consumption were to fall more rapidly than originally forecast.
The Fund’s investment strategy and focus can change over time. The mention of specific fund holdings does not constitute a recommendation by OppenheimerFunds, Inc. or its affiliates.
Before investing in any of the Oppenheimer funds, investors should carefully consider a fund’s investment objectives, risks, charges and expenses. Fund prospectuses and summary prospectuses contain this and other information about the funds, and may be obtained by asking your financial advisor, visiting oppenheimerfunds.com, or calling 1.800.CALL OPP (225.5677). Read prospectuses and summary prospectuses carefully before investing.
15 OPPENHEIMER ROCHESTER AMT-FREE MUNICIPAL FUND
Shares of Oppenheimer funds are not deposits or obligations of any bank, are not guaranteed by any bank, are not insured by the FDIC or any other agency, and involve investment risks, including the possible loss of the principal amount invested.
16 OPPENHEIMER ROCHESTER AMT-FREE MUNICIPAL FUND
Fund Expenses
Fund Expenses. As a shareholder of the Fund, you incur two types of costs: (1) transaction costs, which may include sales charges (loads) on purchase payments, contingent deferred sales charges on redemptions; and (2) ongoing costs, including management fees; distribution and service fees; and other Fund expenses. These examples are intended to help you understand your ongoing costs (in dollars) of investing in the Fund and to compare these costs with the ongoing costs of investing in other mutual funds.
The examples are based on an investment of $1,000.00 invested at the beginning of the period and held for the entire 6-month period ended July 31, 2014.
Actual Expenses. The first section of the table provides information about actual account values and actual expenses. You may use the information in this section for the class of shares you hold, together with the amount you invested, to estimate the expense that you paid over the period. Simply divide your account value by $1,000.00 (for example, an $8,600.00 account value divided by $1,000.00 = 8.60), then multiply the result by the number in the first section under the heading entitled “Expenses Paid During Period” to estimate the expenses you paid on your account during this period.
Hypothetical Example for Comparison Purposes. The second section of the table provides information about hypothetical account values and hypothetical expenses based on the Fund’s actual expense ratio for each class of shares, and an assumed rate of return of 5% per year for each class before expenses, which is not the actual return. The hypothetical account values and expenses may not be used to estimate the actual ending account balance or expenses you paid for the period. You may use this information to compare the ongoing costs of investing in the Fund and other funds. To do so, compare this 5% hypothetical example for the class of shares you hold with the 5% hypothetical examples that appear in the shareholder reports of the other funds.
Please note that the expenses shown in the table are meant to highlight your ongoing costs only and do not reflect any transactional costs, such as front-end or contingent deferred sales charges (loads). Therefore, the “hypothetical” section of the table is useful in comparing ongoing costs only, and will not help you determine the relative total costs of owning different funds. In addition, if these transactional costs were included, your costs would have been higher.
17 OPPENHEIMER ROCHESTER AMT-FREE MUNICIPAL FUND
| | | | | | |
| Actual | | Beginning Account Value February 1, 2014 | | Ending Account Value July 31, 2014 | | Expenses Paid During 6 Months Ended July 31, 2014 |
Class A | | $ 1,000.00 | | $ 1,067.70 | | $ 5.76 |
Class B | | 1,000.00 | | 1,064.20 | | 9.67 |
Class C | | 1,000.00 | | 1,064.20 | | 9.61 |
Class Y | | 1,000.00 | | 1,067.50 | | 4.47 |
| | | |
Hypothetical (5% return before expenses) | | | | | | |
Class A | | 1,000.00 | | 1,019.24 | | 5.62 |
Class B | | 1,000.00 | | 1,015.47 | | 9.44 |
Class C | | 1,000.00 | | 1,015.52 | | 9.39 |
Class Y | | 1,000.00 | | 1,020.48 | | 4.37 |
Expenses are equal to the Fund’s annualized expense ratio for that class, multiplied by the average account value over the period, multiplied by 181/365 (to reflect the one-half year period). Those annualized expense ratios, excluding indirect expenses from affiliated funds, based on the 6-month period ended July 31, 2014 are as follows:
| | | | | | |
| Class | | Expense Ratios | | | |
Class A | | | 1.12 | % | | |
Class B | | | 1.88 | | | |
Class C | | | 1.87 | | | |
Class Y | | | 0.87 | | | |
The expense ratios reflect voluntary and/or contractual waivers and/or reimbursements of expenses by the Fund’s Transfer Agent. Some of these undertakings may be modified or terminated at any time, as indicated in the Fund’s prospectus. The “Financial Highlights” tables in the Fund’s financial statements, included in this report, also show the gross expense ratios, without such waivers or reimbursements and reduction to custodian expenses, if applicable.
18 OPPENHEIMER ROCHESTER AMT-FREE MUNICIPAL FUND
| | |
| |
| STATEMENT OF INVESTMENTS July 31, 2014 | | |
| | | | | | | | | | | | | | | | |
Principal Amount | | | | | Coupon | | | Maturity | | | Value | |
| | |
| Municipal Bonds and Notes—110.5% | |
| Alabama—3.7% | |
| | $ 995,000 | | | AL Space Science Exhibit Finance Authority | | | 6.000 % | | | | 10/01/2025 | | | $ | 1,029,835 | |
| | |
| | 20,000,000 | | | Birmingham, AL Commercial Devel. Authority (Civic Center Improvements)1 | | | 5.500 | | | | 04/01/2041 | | | | 21,961,800 | |
| | |
| | 385,000 | | | Birmingham, AL Private Educational Building Authority (Birmingham-Southern College) | | | 6.125 | | | | 12/01/2025 | | | | 368,160 | |
| | |
| | 220,000 | | | Cooperative District, AL Fort Deposit | | | 6.000 | | | | 02/01/2036 | | | | 176,592 | |
| | |
| | 3,500,000 | | | Cullman County, AL Health Care Authority (Cullman Regional Medical Center) | | | 6.750 | | | | 02/01/2029 | | | | 3,783,640 | |
| | |
| | 200,000 | | | Greater Montgomery, AL Educational Building Authority (Huntingdon College) | | | 5.100 | | | | 05/01/2016 | | | | 204,312 | |
| | |
| | 10,000,000 | | | Jefferson County, AL Sewer | | | 0.000 9 | | | | 10/01/2050 | | | | 5,889,600 | |
| | |
| | 20,185,000 | | | Jefferson County, AL Sewer | | | 0.000 9 | | | | 10/01/2046 | | | | 12,001,193 | |
| | |
| | 8,750,000 | | | Jefferson County, AL Sewer | | | 0.000 9 | | | | 10/01/2050 | | | | 5,406,275 | |
| | |
| | 8,000,000 | | | Jefferson County, AL Sewer | | | 6.000 | | | | 10/01/2042 | | | | 8,727,840 | |
| | |
| | 7,500,000 | | | Jefferson County, AL Sewer | | | 6.500 | | | | 10/01/2053 | | | | 8,490,900 | |
| | |
| | 4,000,000 | | | Jefferson County, AL Sewer | | | 7.000 | | | | 10/01/2051 | | | | 4,692,960 | |
| | | | | | | | | | | | | | | | |
| | | | | | | | | | | | | | | 72,733,107 | |
| | |
| Alaska—0.0% | |
| | 750,000 | | | AK Industrial Devel. & Export Authority (Anchorage Sportsplex/Grace Community Church Obligated Group)2 | | | 6.120 | | | | 08/01/2031 | | | | 255,300 | |
| | |
| | 600,000 | | | AK Industrial Devel. & Export Authority Community Provider (Boys & Girls Home)3 | | | 5.875 | | | | 12/01/2027 | | | | 269,958 | |
| | |
| | 90,000 | | | AK Northern Tobacco Securitization Corp. (TASC) | | | 5.000 | | | | 06/01/2032 | | | | 69,530 | |
| | | | | | | | | | | | | | | | |
| | | | | | | | | | | | | | | 594,788 | |
| | |
| Arizona—3.5% | |
| | 200,000 | | | Centerra, AZ Community Facilities District | | | 5.150 | | | | 07/15/2031 | | | | 189,984 | |
| | |
| | 1,015,000 | | | Estrella Mountain Ranch, AZ Community Facilities District | | | 5.900 | | | | 07/15/2022 | | | | 1,086,182 | |
| | |
| | 330,000 | | | Estrella Mountain Ranch, AZ Community Facilities District | | | 6.125 | | | | 07/15/2027 | | | | 348,094 | |
| | |
| | 500,000 | | | Estrella Mountain Ranch, AZ Community Facilities District | | | 6.200 | | | | 07/15/2032 | | | | 524,590 | |
| | |
| | 305,000 | | | Estrella Mountain Ranch, AZ Community Facilities District | | | 5.450 | | | | 07/15/2021 | | | | 310,536 | |
| | |
| | 200,000 | | | Estrella Mountain Ranch, AZ Community Facilities District | | | 5.625 | | | | 07/15/2025 | | | | 202,716 | |
| | |
| | 450,000 | | | Estrella Mountain Ranch, AZ Community Facilities District | | | 5.800 | | | | 07/15/2030 | | | | 454,531 | |
| | |
| | 447,000 | | | Festival Ranch, AZ Community Facilities District | | | 5.750 | | | | 07/01/2032 | | | | 447,510 | |
| | |
| | 595,000 | | | Festival Ranch, AZ Community Facilities District | | | 5.800 | | | | 07/15/2032 | | | | 615,087 | |
| | |
| | 250,000 | | | Gladden Farms, AZ Community Facilities District | | | 5.500 | | | | 07/15/2031 | | | | 252,687 | |
| | |
| | 585,000 | | | Maricopa County, AZ IDA (Christian Care Apartments) | | | 6.500 | | | | 01/01/2036 | | | | 585,556 | |
| | |
| | 495,000 | | | Maricopa County, AZ IDA (Immanuel Campus Care)3 | | | 8.500 | | | | 04/20/2041 | | | | 197,970 | |
| | |
| | 785,000 | | | Maricopa County, AZ IDA (Sun King Apartments) | | | 6.750 | | | | 05/01/2031 | | | | 714,656 | |
19 OPPENHEIMER ROCHESTER AMT-FREE MUNICIPAL FUND
| | |
| |
| STATEMENT OF INVESTMENTS Continued | | |
| | | | | | | | | | | | | | | | |
Principal Amount | | | | | Coupon | | | Maturity | | | Value | |
| | |
| Arizona (Continued) | |
| | |
| | $ 940,000 | | | Maricopa County, AZ IDA (Sun King Apartments) | | | 6.750 % | | | | 11/01/2018 | | | $ | 937,133 | |
| | |
| | 420,000 | | | Maricopa County, AZ School District No. 24 (Gila Bend) | | | 5.500 | | | | 07/01/2022 | | | | 441,542 | |
| | |
| | 200,000 | | | Marley Park, AZ Community Facilities District | | | 5.300 | | | | 07/15/2031 | | | | 195,374 | |
| | |
| | 321,000 | | | Merrill Ranch, AZ Community Facilities District No. 1 Special Assessment Lien | | | 5.300 | | | | 07/01/2030 | | | | 306,218 | |
| | |
| | 980,000 | | | Palm Valley, AZ Community Facility District No. 3 | | | 5.800 | | | | 07/15/2032 | | | | 986,399 | |
| | |
| | 375,000 | | | Palm Valley, AZ Community Facility District No. 3 | | | 5.300 | | | | 07/15/2031 | | | | 374,513 | |
| | |
| | 750,000 | | | Phoenix, AZ IDA (Career Success Schools) | | | 7.000 | | | | 01/01/2029 | | | | 727,485 | |
| | |
| | 870,000 | | | Phoenix, AZ IDA (Eagle College Prep) | | | 5.000 | | | | 07/01/2033 | | | | 811,458 | |
| | |
| | 500,000 | | | Phoenix, AZ IDA (Espiritu Community Devel. Corp.) | | | 6.250 | | | | 07/01/2036 | | | | 500,755 | |
| | |
| | 1,000,000 | | | Phoenix, AZ IDA (Great Hearts Academies) | | | 6.300 | | | | 07/01/2042 | | | | 1,037,660 | |
| | |
| | 8,500,000 | | | Phoenix, AZ IDA (Rowan University) | | | 5.250 | | | | 06/01/2034 | | | | 9,052,075 | |
| | |
| | 1,630,000 | | | Pima County, AZ IDA (Arizona Charter School) | | | 5.000 | | | | 07/01/2026 | | | | 1,635,542 | |
| | |
| | 2,980,000 | | | Pima County, AZ IDA (Arizona Charter School) | | | 5.375 | | | | 07/01/2031 | | | | 3,037,186 | |
| | |
| | 3,950,000 | | | Pima County, AZ IDA (Center for Academic Success) | | | 5.500 | | | | 07/01/2037 | | | | 3,963,509 | |
| | |
| | 1,235,000 | | | Pima County, AZ IDA (Christian Senior Living) | | | 5.050 | | | | 01/01/2037 | | | | 1,247,893 | |
| | |
| | 500,000 | | | Pima County, AZ IDA (Facility Choice Education & Devel. Corp.) | | | 6.250 | | | | 06/01/2026 | | | | 500,030 | |
| | |
| | 12,400,000 | | | Pima County, AZ IDA (Metro Police Facility)1 | | | 5.375 | | | | 07/01/2039 | | | | 13,077,288 | |
| | |
| | 1,430,000 | | | Pima County, AZ IDA (New Plan Learning/OG Ohio/250 Shoup Mill Obligated Group) | | | 8.125 | | | | 07/01/2041 | | | | 1,541,140 | |
| | |
| | 500,000 | | | Pima County, AZ IDA (P.L.C. Charter Schools) | | | 6.750 | | | | 04/01/2036 | | | | 503,370 | |
| | |
| | 250,000 | | | Pima County, AZ IDA (Paradise Education Center) | | | 6.000 | | | | 06/01/2036 | | | | 251,545 | |
| | |
| | 355,000 | | | Pima County, AZ IDA (Paradise Education Center) | | | 5.875 | | | | 06/01/2033 | | | | 355,000 | |
| | |
| | 2,845,000 | | | Pima County, AZ IDA (Phoenix Advantage Charter School) | | | 5.600 | | | | 07/01/2023 | | | | 2,523,856 | |
| | |
| | 650,000 | | | Pima County, AZ IDA (Sonoran Science Academy) | | | 5.750 | | | | 12/01/2037 | | | | 600,574 | |
| | |
| | 500,000 | | | Pima County, AZ IDA (Sonoran Science Academy) | | | 5.670 | | | | 12/01/2027 | | | | 477,020 | |
| | |
| | 760,000 | | | Pima County, AZ IDA (Tucson Country Day School) | | | 5.000 | | | | 06/01/2037 | | | | 688,872 | |
| | |
| | 250,000 | | | Pima County, AZ IDA (Valley Academy) | | | 6.500 | | | | 07/01/2038 | | | | 261,280 | |
| | |
| | 500,000 | | | Quail Creek, AZ Community Facilities District | | | 5.550 | | | | 07/15/2030 | | | | 500,015 | |
| | |
| | 1,000,000 | | | Rio Rico, AZ Fire District | | | 7.000 | | | | 07/01/2030 | | | | 1,101,870 | |
| | |
| | 10,000,000 | | | Salt Verde, AZ Financial Corp. | | | 5.000 | | | | 12/01/2037 | | | | 10,946,200 | |
| | |
| | 100,000 | | | Salt Verde, AZ Financial Corp. | | | 5.500 | | | | 12/01/2029 | | | | 115,566 | |
| | |
| | 18,000 | | | Show Low Bluff, AZ Community Facilities District Special Assessment | | | 5.200 | | | | 07/01/2017 | | | | 18,788 | |
| | |
| | 1,655,000 | | | Tartesso West, AZ Community Facilities District | | | 5.900 | | | | 07/15/2032 | | | | 1,720,770 | |
| | |
| | 1,625,000 | | | Vistancia, AZ Community Facilities District | | | 6.750 | | | | 07/15/2022 | | | | 1,629,631 | |
20 OPPENHEIMER ROCHESTER AMT-FREE MUNICIPAL FUND
| | | | | | | | | | | | | | | | |
Principal Amount | | | | | Coupon | | | Maturity | | | Value | |
| | |
| Arizona (Continued) | |
| | |
| | $ 500,000 | | | Westpark, AZ Community Facilities District | | | 5.250 % | | | | 07/15/2031 | | | $ | 499,350 | |
| | | | | | | | | | | | | | | | |
| | | | | | | | | | | | | | | 68,497,006 | |
| | |
| Arkansas—0.1% | | | | | |
| | 300,000 | | | Arkadelphia, AR Public Education Facilities Board (Ouachita Baptist University) | | | 5.375 | | | | 03/01/2038 | | | | 303,168 | |
| | |
| | 2,310,000 | | | Cave Springs, AR Municipal Property (Creeks Special Sewer District)3 | | | 6.250 | | | | 02/01/2038 | | | | 1,270,546 | |
| | | | | | | | | | | | | | | | |
| | | | | | | | | | | | | | | 1,573,714 | |
| | |
| California—16.8% | | | | | |
| | 675,000 | | | Adelanto, CA Public Utility Authority | | | 6.750 | | | | 07/01/2039 | | | | 755,325 | |
| | |
| | 1,615,000 | | | Anaheim, CA Community Facilities District Special Tax (Platinum Triangle) | | | 6.250 | | | | 09/01/2040 | | | | 1,665,485 | |
| | |
| | 830,000 | | | Anaheim, CA Community Facilities District Special Tax (Platinum Triangle) | | | 6.000 | | | | 09/01/2029 | | | | 856,145 | |
| | |
| | 1,000,000 | | | Bonita Canyon, CA Public Facilities Financing Authority | | | 5.000 | | | | 09/01/2026 | | | | 1,030,870 | |
| | |
| | 2,340,000 | | | Bonita Canyon, CA Public Facilities Financing Authority | | | 5.000 | | | | 09/01/2025 | | | | 2,412,400 | |
| | |
| | 8,000,000 | | | CA County Tobacco Securitization Agency | | | 7.750 4 | | | | 06/01/2046 | | | | 478,560 | |
| | |
| | 129,820,000 | | | CA County Tobacco Securitization Agency | | | 6.700 4 | | | | 06/01/2050 | | | | 2,496,439 | |
| | |
| | 38,650,000 | | | CA County Tobacco Securitization Agency | | | 7.550 4 | | | | 06/01/2055 | | | | 274,028 | |
| | |
| | 6,060,000 | | | CA County Tobacco Securitization Agency | | | 7.234 4 | | | | 06/01/2033 | | | | 1,407,193 | |
| | |
| | 6,000,000 | | | CA County Tobacco Securitization Agency | | | 6.650 4 | | | | 06/01/2046 | | | | 174,600 | |
| | |
| | 7,000,000 | | | CA County Tobacco Securitization Agency | | | 5.312 4 | | | | 06/01/2046 | | | | 229,460 | |
| | |
| | 93,000,000 | | | CA County Tobacco Securitization Agency (TASC) | | | 6.651 4 | | | | 06/01/2046 | | | | 2,934,150 | |
| | |
| | 160,000 | | | CA County Tobacco Securitization Agency (TASC) | | | 5.700 | | | | 06/01/2046 | | | | 126,059 | |
| | |
| | 50,000 | | | CA County Tobacco Securitization Agency (TASC) | | | 5.875 | | | | 06/01/2035 | | | | 49,053 | |
| | |
| | 5,000,000 | | | CA County Tobacco Securitization Agency (TASC) | | | 5.875 | | | | 06/01/2043 | | | | 4,924,400 | |
| | |
| | 21,000,000 | | | CA County Tobacco Securitization Agency (TASC) | | | 6.000 | | | | 06/01/2042 | | | | 20,621,790 | |
| | |
| | 10,200,000 | | | CA County Tobacco Securitization Agency (TASC) | | | 0.748 | | | | 06/01/2036 | | | | 8,464,674 | |
| | |
| | 2,315,000 | | | CA County Tobacco Securitization Agency (TASC) | | | 5.125 | | | | 06/01/2038 | | | | 1,810,538 | |
| | |
| | 3,375,000 | | | CA Enterprise Devel. Authority (Sunpower Corp.) | | | 8.500 | | | | 04/01/2031 | | | | 3,750,401 | |
| | |
| | 4,335,000 | | | CA Golden State Tobacco Securitization Corp. | | | 5.000 | | | | 06/01/2036 | | | | 3,468,217 | |
| | |
| | 59,700,000 | | | CA Golden State Tobacco Securitization Corp. (TASC) | | | 5.300 | | | | 06/01/2037 | | | | 47,465,679 | |
| | |
| | 110,000,000 | | | CA Golden State Tobacco Securitization Corp. (TASC) | | | 5.046 4 | | | | 06/01/2047 | | | | 2,208,800 | |
| | |
| | 20,000,000 | | | CA Health Facilities Financing Authority (SJHS/SJHCN/SJHE/SJHO Obligated Group)1 | | | 5.750 | | | | 07/01/2039 | | | | 23,175,200 | |
| | |
| | 25,000 | | | CA HFA (Home Mtg.) | | | 5.450 | | | | 08/01/2033 | | | | 25,522 | |
21 OPPENHEIMER ROCHESTER AMT-FREE MUNICIPAL FUND
| | |
| |
| STATEMENT OF INVESTMENTS Continued | | |
| | | | | | | | | | | | | | | | |
Principal Amount | | | | | Coupon | | | Maturity | | | Value | |
| | |
| California (Continued) | |
| | |
| | $ 590,000 | | | CA Independent Cities Lease Finance Authority (Morgan Hill-Hacienda Valley) | | | 5.950 % | | | | 11/15/2039 | | | $ | 591,280 | |
| | |
| | 10,000,000 | | | CA M-S-R Energy Authority | | | 7.000 | | | | 11/01/2034 | | | | 13,592,000 | |
| | |
| | 350,000 | | | CA M-S-R Energy Authority | | | 6.500 | | | | 11/01/2039 | | | | 456,862 | |
| | |
| | 250,000 | | | CA Municipal Finance Authority (Harbor Regional Center) | | | 8.500 | | | | 11/01/2039 | | | | 299,370 | |
| | |
| | 1,600,000 | | | CA Public Works | | | 5.000 | | | | 04/01/2037 | | | | 1,739,328 | |
| | |
| | 2,180,000 | | | CA Public Works | | | 6.625 | | | | 11/01/2034 | | | | 2,190,617 | |
| | |
| | 15,000,000 | | | CA Public Works (Regents University)1 | | | 5.000 | | | | 12/01/2031 | | | | 18,398,700 | |
| | |
| | 450,000 | | | CA Public Works (Various Community Colleges) | | | 5.750 | | | | 10/01/2030 | | | | 527,481 | |
| | |
| | 1,000,000 | | | CA School Finance Authority Charter School (Coastal Academy) | | | 5.000 | | | | 10/01/2033 | | | | 1,037,640 | |
| | |
| | 14,000,000 | | | CA Silicon Valley Tobacco Securitization Authority | | | 8.840 4 | | | | 06/01/2047 | | | | 943,740 | |
| | |
| | 7,000,000 | | | CA Silicon Valley Tobacco Securitization Authority | | | 9.800 4 | | | | 06/01/2036 | | | | 1,413,930 | |
| | |
| | 1,995,000 | | | CA Statewide CDA (Aspire Public Schools) | | | 6.000 | | | | 07/01/2040 | | | | 2,043,259 | |
| | |
| | 625,000 | | | Chino, CA Public Financing Authority | | | 5.000 | | | | 09/01/2038 | | | | 653,137 | |
| | |
| | 2,000,000 | | | Chino, CA Public Financing Authority | | | 5.000 | | | | 09/01/2030 | | | | 2,119,420 | |
| | |
| | 2,000,000 | | | Corona-Norco, CA Unified School District Public Financing Authority Special Tax | | | 5.000 | | | | 09/01/2036 | | | | 2,037,060 | |
| | |
| | 560,000 | | | Coyote Canyon, CA Public Facilities Community Facilities District No. 2004-1 | | | 6.625 | | | | 09/01/2039 | | | | 641,805 | |
| | |
| | 1,000,000 | | | Davis, CA Special Tax Community Facilities District No. 2007-2 | | | 5.200 | | | | 09/01/2027 | | | | 1,013,680 | |
| | |
| | 2,000,000 | | | Davis, CA Special Tax Community Facilities District No. 2007-2 | | | 5.250 | | | | 09/01/2037 | | | | 2,001,600 | |
| | |
| | 20,000,000 | | | East Bay, CA Municipal Utility District (Water System)1 | | | 5.000 | | | | 06/01/2036 | | | | 22,733,800 | |
| | |
| | 950,000 | | | Elk Grove, CA Special Tax Community Facilities District No. 2005-1X | | | 5.250 | | | | 09/01/2037 | | | | 961,039 | |
| | |
| | 250,000 | | | Hemet, CA Unified School District | | | 5.125 | | | | 09/01/2036 | | | | 250,137 | |
| | |
| | 420,000 | | | Hemet, CA Unified School District | | | 5.050 | | | | 09/01/2026 | | | | 420,420 | |
| | |
| | 500,000 | | | Hemet, CA Unified School District Community Facilities District No. 2005-3 | | | 5.750 | | | | 09/01/2039 | | | | 500,310 | |
| | |
| | 345,750,000 | | | Inland, CA Empire Tobacco Securitization Authority (TASC) | | | 8.001 4 | | | | 06/01/2057 | | | | 3,225,847 | |
| | |
| | 360,655,000 | | | Inland, CA Empire Tobacco Securitization Authority (TASC) | | | 7.000 4 | | | | 06/01/2057 | | | | 3,408,190 | |
| | |
| | 120,000,000 | | | Inland, CA Empire Tobacco Securitization Authority (TASC) | | | 6.750 4 | | | | 06/01/2047 | | | | 5,277,600 | |
| | |
| | 155,000 | | | Jurupa, CA Public Financing Authority | | | 6.000 | | | | 09/01/2029 | | | | 159,842 | |
| | |
| | 175,000 | | | Jurupa, CA Public Financing Authority | | | 6.000 | | | | 09/01/2028 | | | | 180,476 | |
| | |
| | 205,000 | | | Jurupa, CA Public Financing Authority | | | 6.000 | | | | 09/01/2032 | | | | 211,375 | |
| | |
| | 135,000 | | | Jurupa, CA Public Financing Authority | | | 6.000 | | | | 09/01/2030 | | | | 139,211 | |
| | |
| | 150,000 | | | Jurupa, CA Public Financing Authority | | | 6.000 | | | | 09/01/2031 | | | | 154,671 | |
| | |
| | 1,270,000 | | | Lake Elsinore, CA Special Tax | | | 5.150 | | | | 09/01/2025 | | | | 1,316,736 | |
| | |
| | 200,000 | | | Lake Elsinore, CA Special Tax | | | 5.350 | | | | 09/01/2036 | | | | 200,270 | |
| | |
| | 1,245,000 | | | Lake Elsinore, CA Special Tax | | | 5.250 | | | | 09/01/2030 | | | | 1,286,048 | |
22 OPPENHEIMER ROCHESTER AMT-FREE MUNICIPAL FUND
| | | | | | | | | | | | | | | | |
Principal Amount | | | | | Coupon | | | Maturity | | | Value | |
| | |
| California (Continued) | |
| | |
| | $ 2,750,000 | | | Lammersville, CA Joint Unified School District Special Tax Community Facilities District (Mountain House-Shea) | | | 6.000 % | | | | 09/01/2043 | | | $ | 3,056,845 | |
| | |
| | 1,000,000 | | | Lammersville, CA School District Community Facilities District (Mountain House) | | | 0.000 9 | | | | 09/01/2028 | | | | 928,260 | |
| | |
| | 500,000 | | | Lammersville, CA School District Community Facilities District (Mountain House) | | | 0.000 9 | | | | 09/01/2029 | | | | 466,825 | |
| | |
| | 500,000 | | | Lammersville, CA School District Community Facilities District (Mountain House) | | | 0.000 9 | | | | 09/01/2030 | | | | 465,270 | |
| | |
| | 375,000 | | | Lammersville, CA School District Community Facilities District (Mountain House) | | | 0.000 9 | | | | 09/01/2026 | | | | 351,015 | |
| | |
| | 415,000 | | | Lammersville, CA School District Community Facilities District (Mountain House) | | | 0.000 9 | | | | 09/01/2025 | | | | 390,079 | |
| | |
| | 885,000 | | | Lammersville, CA School District Community Facilities District (Mountain House) | | | 0.000 9 | | | | 09/01/2027 | | | | 823,820 | |
| | |
| | 1,000,000 | | | Lammersville, CA School District Community Facilities District (Mountain House) | | | 0.000 9 | | | | 09/01/2032 | | | | 924,030 | |
| | |
| | 1,000,000 | | | Lancaster, CA Financing Authority (School District) | | | 5.000 | | | | 02/01/2026 | | | | 803,570 | |
| | |
| | 3,950,000 | | | Loma Linda, CA Redevel. Agency Tax Allocation | | | 5.250 | | | | 07/01/2030 | | | | 4,011,541 | |
| | |
| | 1,250,000 | | | Los Alamitos, CA Unified School District COP | | | 0.000 9 | | | | 08/01/2042 | | | | 821,375 | |
| | |
| | 180,000 | | | Los Angeles, CA Community Facilities District Special Tax (Legends at Cascades) | | | 5.750 | | | | 09/01/2040 | | | | 185,537 | |
| | |
| | 2,150,000 | | | Los Angeles, CA Regional Airports Improvement Corp. (American Airlines) | | | 7.125 | | | | 12/01/2024 | | | | 2,191,710 | |
| | |
| | 1,250,000 | | | Lynwood, CA Redevel. Agency Tax Allocation | | | 7.000 | | | | 09/01/2031 | | | | 1,518,387 | |
| | |
| | 2,930,000 | | | Marysville, CA (Fremont-Rideout Health) | | | 5.000 | | | | 01/01/2029 | | | | 3,109,609 | |
| | |
| | 4,010,000 | | | Moreno Valley, CA Unified School District Community Facilities District No. 2005-5 | | | 5.500 | | | | 09/01/2041 | | | | 4,132,505 | |
| | |
| | 630,000 | | | Moreno Valley, CA Unified School District Community Facilities District Special Tax | | | 5.000 | | | | 09/01/2037 | | | | 638,952 | |
| | |
| | 1,250,000 | | | Moreno Valley, CA Unified School District Community Facilities District Special Tax No. 2004-3 | | | 5.000 | | | | 09/01/2037 | | | | 1,267,762 | |
| | |
| | 20,000,000 | | | Northern CA Tobacco Securitization Authority (TASC) | | | 5.500 | | | | 06/01/2045 | | | | 15,687,200 | |
| | |
| | 955,000 | | | Orange, CA Community Facilities District Special Tax (Del Rio Public Improvements) | | | 5.750 | | | | 10/01/2030 | | | | 985,875 | |
| | |
| | 735,000 | | | Palm Desert, CA Financing Authority | | | 5.000 | | | | 04/01/2027 | | | | 736,257 | |
| | |
| | 1,510,000 | | | Perris, CA Community Facilities District Special Tax No. 2001 | | | 5.000 | | | | 09/01/2037 | | | | 1,510,876 | |
| | |
| | 550,000 | | | Perris, CA Community Facilities District Special Tax No. 2001 | | | 5.000 | | | | 09/01/2026 | | | | 550,622 | |
| | |
| | 620,000 | | | Perris, CA Community Facilities District Special Tax No. 2005-1 | | | 5.000 | | | | 09/01/2037 | | | | 619,963 | |
| | |
| | 1,260,000 | | | Rialto, CA Special Tax Community Facilities District No. 2006-1 | | | 5.350 | | | | 09/01/2036 | | | | 1,281,987 | |
| | |
| | 1,000,000 | | | Romoland, CA School District Special Tax Community Facilities District | | | 5.400 | | | | 09/01/2036 | | | | 1,010,830 | |
23 OPPENHEIMER ROCHESTER AMT-FREE MUNICIPAL FUND
| | |
| |
| STATEMENT OF INVESTMENTS Continued | | |
| | | | | | | | | | | | | | | | |
Principal Amount | | | | | Coupon | | | Maturity | | | Value | |
| | |
| California (Continued) | |
| | |
| | $ 1,000,000 | | | Roseville, CA Natural Gas Finance Authority | | | 5.000 % | | | | 02/15/2025 | | | $ | 1,130,300 | |
| | |
| | 345,000 | | | San Bernardino, CA Special Tax Community Facilities District No. 2006-1 (Lytle Creek) | | | 5.625 | | | | 09/01/2035 | | | | 355,623 | |
| | |
| | 10,000,000 | | | San Francisco, CA City & County COP1 | | | 5.000 | | | | 10/01/2033 | | | | 11,049,791 | |
| | |
| | 720,000 | | | San Francisco, CA City & County COP | | | 5.000 | | | | 10/01/2033 | | | | 795,586 | |
| | |
| | 250,000 | | | San Francisco, CA City & County Redevel. Financing Authority (Mission Bay North Redevel.) | | | 6.750 | | | | 08/01/2041 | | | | 298,073 | |
| | |
| | 350,000 | | | San Francisco, CA City & County Redevel. Financing Authority (Mission Bay North Redevel.) | | | 7.000 | | | | 08/01/2041 | | | | 398,209 | |
| | |
| | 1,620,000 | | | San Gorgonio, CA Memorial Health Care District | | | 7.000 | | | | 08/01/2027 | | | | 1,932,611 | |
| | |
| | 350,000 | | | San Jose, CA Finance Authority (Convention Center) | | | 5.500 | | | | 05/01/2031 | | | | 396,120 | |
| | |
| | 2,210,000 | | | Santa Clara, CA Redevel. Agency Tax Allocation (Bayshore North) | | | 5.750 | | | | 06/01/2026 | | | | 2,516,394 | |
| | |
| | 52,555,000 | | | Silicon Valley CA Tobacco Securitization Authority | | | 9.140 4 | | | | 06/01/2047 | | | | 3,542,733 | |
| | |
| | 22,445,000 | | | Southern CA Tobacco Securitization Authority | | | 5.125 | | | | 06/01/2046 | | | | 16,944,179 | |
| | |
| | 13,675,000 | | | Southern CA Tobacco Securitization Authority | | | 6.400 4 | | | | 06/01/2046 | | | | 287,312 | |
| | |
| | 47,250,000 | | | Southern CA Tobacco Securitization Authority | | | 7.100 4 | | | | 06/01/2046 | | | | 920,903 | |
| | |
| | 11,930,000 | | | Southern CA Tobacco Securitization Authority (TASC) | | | 5.000 | | | | 06/01/2037 | | | | 9,495,326 | |
| | |
| | 235,000 | | | Temecula Valley, CA Unified School District Community Facilities District No. 2004 | | | 5.000 | | | | 09/01/2037 | | | | 239,150 | |
| | |
| | 575,000 | | | Upland, CA Community Facilities District Special Tax | | | 5.000 | | | | 09/01/2034 | | | | 609,673 | |
| | |
| | 3,000,000 | | | Val Verde, CA Unified School District | | | 5.500 | | | | 08/01/2030 | | | | 3,399,150 | |
| | |
| | 900,000 | | | Vernon, CA Electric System | | | 5.125 | | | | 08/01/2033 | | | | 964,602 | |
| | |
| | 100,000 | | | Victor Valley, CA Union High School District | | | 5.050 | | | | 09/01/2025 | | | | 100,463 | |
| | |
| | 1,160,000 | | | Victor Valley, CA Union High School District | | | 5.100 | | | | 09/01/2035 | | | | 1,102,452 | |
| | | | | | | | | | | | | | | | |
| | | | | | | | | | | | | | | 327,881,221 | |
| | |
| Colorado—1.9% | | | | | |
| | 1,000,000 | | | CO Andonea Metropolitan District No. 32 | | | 6.250 | | | | 12/01/2035 | | | | 551,590 | |
| | |
| | 4,015,000 | | | CO Broomfield Village Metropolitan District No. 2 | | | 6.250 | | | | 12/01/2032 | | | | 3,713,995 | |
| | |
| | 400,000 | | | CO Central Marksheffel Metropolitan District | | | 7.250 | | | | 12/01/2029 | | | | 400,756 | |
| | |
| | 500,000 | | | CO Copperleaf Metropolitan District No. 2 | | | 5.850 | | | | 12/01/2026 | | | | 500,060 | |
| | |
| | 294,000 | | | CO Crystal Crossing Metropolitan District2 | | | 6.000 | | | | 12/01/2036 | | | | 175,330 | |
| | |
| | 125,000 | | | CO E-470 Public Highway Authority | | | 6.814 4 | | | | 09/01/2025 | | | | 82,329 | |
| | |
| | 1,500,000 | | | CO Educational and Cultural Facilities Authority (Free Horizon Charter School) | | | 6.125 | | | | 06/15/2040 | | | | 1,636,575 | |
| | |
| | 4,375,000 | | | CO Educational and Cultural Facilities Authority (Rocky Mountain Academy of Evergreen) | | | 6.450 | | | | 11/01/2040 | | | | 4,829,912 | |
| | |
| | 500,000 | | | CO Elbert and Highway 86 Metropolitan District | | | 5.750 | | | | 12/01/2036 | | | | 351,255 | |
| | |
| | 1,000,000 | | | CO Elkhorn Ranch Metropolitan District | | | 6.375 | | | | 12/01/2035 | | | | 720,040 | |
| | |
| | 745,000 | | | CO Fossil Ridge Metropolitan District No. 1 | | | 7.250 | | | | 12/01/2040 | | | | 778,287 | |
| | |
| | 500,000 | | | CO High Plains Metropolitan District2 | | | 6.250 | | | | 12/01/2035 | | | | 275,915 | |
| | |
| | 228,000 | | | CO Horse Creek Metropolitan District | | | 5.750 | | | | 12/01/2036 | | | | 187,596 | |
24 OPPENHEIMER ROCHESTER AMT-FREE MUNICIPAL FUND
| | | | | | | | | | | | | | | | |
Principal Amount | | | | | Coupon | | | Maturity | | | Value | |
| | |
| Colorado (Continued) | |
| | |
| | $ 415,000 | | | CO Huntington Trails Metropolitan District | | | 6.250 % | | | | 12/01/2036 | | | $ | 414,954 | |
| | |
| | 368,000 | | | CO International Center Metropolitan District No. 3 | | | 6.500 | | | | 12/01/2035 | | | | 311,891 | |
| | |
| | 500,000 | | | CO Liberty Ranch Metropolitan District | | | 6.250 | | | | 12/01/2036 | | | | 432,700 | |
| | |
| | 625,000 | | | CO Madre Metropolitan District No. 2 | | | 5.500 | | | | 12/01/2036 | | | | 465,931 | |
| | |
| | 2,850,000 | | | CO Murphy Creek Metropolitan District No. 32 | | | 6.125 | | | | 12/01/2035 | | | | 1,391,028 | |
| | |
| | 2,770,000 | | | CO Murphy Creek Metropolitan District No. 32 | | | 6.000 | | | | 12/01/2026 | | | | 1,366,109 | |
| | |
| | 1,945,000 | | | CO North Range Metropolitan District No. 1 | | | 5.000 | | | | 12/15/2024 | | | | 1,958,751 | |
| | |
| | 500,000 | | | CO North Range Metropolitan District No. 2 | | | 5.500 | | | | 12/15/2037 | | | | 503,510 | |
| | |
| | 1,250,000 | | | CO North Range Metropolitan District No. 2 | | | 5.500 | | | | 12/15/2018 | | | | 1,282,938 | |
| | |
| | 1,875,000 | | | CO Northwest Metropolitan District No. 3 | | | 6.250 | | | | 12/01/2035 | | | | 1,765,556 | |
| | |
| | 1,000,000 | | | CO Northwest Metropolitan District No. 3 | | | 6.125 | | | | 12/01/2025 | | | | 967,500 | |
| | |
| | 750,000 | | | CO Potomac Farms Metropolitan District | | | 7.250 | | | | 12/01/2037 | | | | 623,985 | |
| | |
| | 120,000 | | | CO Potomac Farms Metropolitan District | | | 7.625 | | | | 12/01/2023 | | | | 113,468 | |
| | |
| | 440,000 | | | CO Prairie Center Metropolitan District No. 3 | | | 5.250 | | | | 12/15/2021 | | | | 458,084 | |
| | |
| | 780,000 | | | CO Prairie Center Metropolitan District No. 3 | | | 5.400 | | | | 12/15/2031 | | | | 805,701 | |
| | |
| | 730,000 | | | CO Regency Metropolitan District2 | | | 5.750 | | | | 12/01/2036 | | | | 609,667 | |
| | |
| | 1,000,000 | | | CO Serenity Ridge Metropolitan District No. 22 | | | 7.500 | | | | 12/01/2034 | | | | 440,000 | |
| | |
| | 358,000 | | | CO Silver Peaks Metropolitan District | | | 5.750 | | | | 12/01/2036 | | | | 236,853 | |
| | |
| | 1,000,000 | | | CO Sorrell Ranch Metropolitan District3 | | | 6.750 | | | | 12/15/2036 | | | | 507,990 | |
| | |
| | 966,000 | | | CO Wheatlands Metropolitan District | | | 6.000 | | | | 12/01/2025 | | | | 968,599 | |
| | |
| | 175,000 | | | Fairplay, CO Sanitation District | | | 5.250 | | | | 12/15/2031 | | | | 167,491 | |
| | |
| | 180,000 | | | Jefferson County, CO (Section 14 Metropolitan District) | | | 5.000 | | | | 12/01/2018 | | | | 190,643 | |
| | |
| | 1,720,000 | | | Loveland, CO Special Assessment | | | 5.625 | | | | 07/01/2029 | | | | 1,483,087 | |
| | |
| | 1,495,000 | | | Public Authority for CO (Natural Gas Energy) | | | 6.250 | | | | 11/15/2028 | | | | 1,863,876 | |
| | |
| | 500,000 | | | Tabernash Meadows, CO Water & Sanitation District | | | 7.125 | | | | 12/01/2034 | | | | 550,050 | |
| | |
| | 250,000 | | | Tallyns Reach CO Metropolitan District No. 3 | | | 5.125 | | | | 11/01/2038 | | | | 251,958 | |
| | |
| | 110,000 | | | Tallyns Reach CO Metropolitan District No. 3 | | | 5.000 | | | | 12/01/2033 | | | | 110,744 | |
| | |
| | 3,824,161 | | | Woodmen Heights, CO Metropolitan District No. 1 | | | 0.000 9 | | | | 12/15/2041 | | | | 1,918,199 | |
| | |
| | 1,047,237 | | | Woodmen Heights, CO Metropolitan District No. 1 | | | 6.000 | | | | 12/01/2041 | | | | 973,040 | |
| | | | | | | | | | | | | | | | |
| | | | | | | | | | | | | | | 37,337,943 | |
| | |
| Connecticut—0.2% | | | | | |
| | 500,000 | | | Georgetown, CT Special Taxing District2 | | | 5.125 | | | | 10/01/2036 | | | | 195,660 | |
| | |
| | 8,473,532 | | | Mashantucket Western Pequot Tribe CT | | | 4.000 | | | | 07/01/2031 | | | | 4,232,021 | |
| | | | | | | | | | | | | | | | |
| | | | | | | | | | | | | | | 4,427,681 | |
| | |
| Delaware—0.4% | | | | | |
| | 3,575,000 | | | Bridgeville, DE Special Obligation (Heritage Shores) | | | 5.450 | | | | 07/01/2035 | | | | 3,524,414 | |
| | |
| | 630,000 | | | Kent County, DE Student Hsg. (Delaware State University Student Hsg. Foundation) | | | 5.000 | | | | 07/01/2030 | | | | 553,587 | |
| | |
| | 1,000,000 | | | Kent County, DE Student Hsg. (Delaware State University Student Hsg. Foundation) | | | 5.000 | | | | 07/01/2025 | | | | 924,470 | |
25 OPPENHEIMER ROCHESTER AMT-FREE MUNICIPAL FUND
| | |
| |
| STATEMENT OF INVESTMENTS Continued | | |
| | | | | | | | | | | | | | | | |
Principal Amount | | | | | Coupon | | | Maturity | | | Value | |
| | |
| Delaware (Continued) | |
| | |
| | $ 2,274,000 | | | Millsboro, DE Special Obligation (Plantation Lakes) | | | 5.450 % | | | | 07/01/2036 | | | $ | 1,889,535 | |
| | | | | | | | | | | | | | | | |
| | | | | | | | | | | | | | | 6,892,006 | |
| | |
| District of Columbia—0.8% | | | | | |
| | 25,000 | | | District of Columbia (James F. Oyster Elementary School) | | | 6.450 | | | | 11/01/2034 | | | | 24,969 | |
| | |
| | 2,100,000 | | | District of Columbia Center for Strategic & International Studies | | | 6.625 | | | | 03/01/2041 | | | | 2,262,477 | |
| | |
| | 2,000,000 | | | District of Columbia Center for Strategic & International Studies | | | 6.375 | | | | 03/01/2031 | | | | 2,161,860 | |
| | |
| | 1,000,000 | | | District of Columbia Student Dorm (Provident Group-Howard Properties) | | | 5.000 | | | | 10/01/2030 | | | | 1,020,460 | |
| | |
| | 4,385,000 | | | District of Columbia Tobacco Settlement Financing Corp. | | | 6.750 | | | | 05/15/2040 | | | | 4,384,956 | |
| | |
| | 2,570,000 | | | District of Columbia Tobacco Settlement Financing Corp. | | | 6.500 | | | | 05/15/2033 | | | | 2,859,073 | |
| | |
| | 72,125,000 | | | District of Columbia Tobacco Settlement Financing Corp. (TASC) | | | 6.375 4 | | | | 06/15/2046 | | | | 2,298,624 | |
| | |
| | 400,000 | | | District of Columbia University (Gallaudet University) | | | 5.500 | | | | 04/01/2034 | | | | 439,876 | |
| | | | | | | | | | | | | | | | |
| | | | | | | | | | | | | | | 15,452,295 | |
| | |
| Florida—13.0% | | | | | |
| | 100,000 | | | Alachua County, FL Health Facilities Authority (Shands Teaching Hospital & Clinics/Shands at Lake Shore Obligated Group) | | | 6.750 | | | | 12/01/2030 | | | | 110,625 | |
| | |
| | 1,860,000 | | | Amelia Concourse, FL Community Devel. District3 | | | 5.750 | | | | 05/01/2038 | | | | 723,447 | |
| | |
| | 1,120,000 | | | Arlington Ridge, FL Community Devel. District3 | | | 5.500 | | | | 05/01/2036 | | | | 439,141 | |
| | |
| | 435,000 | | | Avignon Villages, FL Community Devel. District3 | | | 5.300 | | | | 05/01/2014 | | | | 56,680 | |
| | |
| | 250,000 | | | Avignon Villages, FL Community Devel. District3 | | | 5.400 | | | | 05/01/2037 | | | | 32,575 | |
| | |
| | 1,370,000 | | | Baywinds, FL Community Devel. District | | | 5.250 | | | | 05/01/2037 | | | | 1,172,501 | |
| | |
| | 1,835,000 | | | Boynton Village, FL Community Devel. District Special Assessment | | | 6.000 | | | | 05/01/2038 | | | | 1,765,252 | |
| | |
| | 1,195,000 | | | Cascades, FL Groveland Community Devel. District | | | 5.300 | | | | 05/01/2036 | | | | 1,195,705 | |
| | |
| | 2,370,000 | | | Chapel Creek, FL Community Devel. District Special Assessment3 | | | 5.500 | | | | 05/01/2038 | | | | 1,410,387 | |
| | |
| | 1,675,000 | | | Clearwater Cay, FL Community Devel. District3 | | | 5.500 | | | | 05/01/2037 | | | | 631,542 | |
| | |
| | 2,280,000 | | | Creekside, FL Community Devel. District3 | | | 5.200 | | | | 05/01/2038 | | | | 1,028,052 | |
| | |
| | 875,000 | | | Crosscreek, FL Community Devel. District3 | | | 5.500 | | | | 05/01/2017 | | | | 372,829 | |
| | |
| | 415,000 | | | Crosscreek, FL Community Devel. District3 | | | 5.600 | | | | 05/01/2039 | | | | 177,002 | |
| | |
| | 5,400,000 | | | Cypress Creek of Hillsborough County, FL Community Devel. District | | | 5.350 | | | | 05/01/2037 | | | | 4,632,768 | |
| | |
| | 700,000 | | | Dade County, FL IDA (Miami Cerebral Palsy Residence) | | | 8.000 | | | | 06/01/2022 | | | | 699,923 | |
| | |
| | 1,625,000 | | | Dupree Lakes, FL Community Devel. District | | | 5.375 | | | | 05/01/2037 | | | | 1,488,386 | |
| | |
| | 655,000 | | | Durbin Crossing, FL Community Devel. District Special Assessment3 | | | 5.250 | | | | 11/01/2015 | | | | 620,763 | |
26 OPPENHEIMER ROCHESTER AMT-FREE MUNICIPAL FUND
| | | | | | | | | | | | | | | | |
Principal Amount | | | | | Coupon | | | Maturity | | | Value | |
| | |
| Florida (Continued) | |
| | |
| | $ 2,165,000 | | | East Homestead, FL Community Devel. District | | | 5.375 % | | | | 05/01/2036 | | | $ | 2,183,511 | |
| | |
| | 1,225,000 | | | East Homestead, FL Community Devel. District | | | 5.450 | | | | 05/01/2036 | | | | 1,248,520 | |
| | |
| | 350,000 | | | East Homestead, FL Community Devel. District | | | 5.000 | | | | 11/01/2033 | | | | 351,323 | |
| | |
| | 195,000 | | | East Homestead, FL Community Devel. District5 | | | 7.250 | | | | 05/01/2021 | | | | 207,782 | |
| | |
| | 495,000 | | | Escambia County, FL Health Facilities Authority | | | 5.950 | | | | 07/01/2020 | | | | 528,036 | |
| | |
| | 2,550,000 | | | FL Capital Trust Agency (American Opportunity)2 | | | 5.875 | | | | 06/01/2038 | | | | 1,452,735 | |
| | |
| | 5,437,000 | | | FL Capital Trust Agency (Atlantic Hsg. Foundation)2 | | | 7.000 | | | | 07/15/2032 | | | | 2,446,487 | |
| | |
| | 1,775,000 | | | FL Capital Trust Agency (Atlantic Hsg. Foundation)2 | | | 8.260 | | | | 07/15/2038 | | | | 798,697 | |
| | |
| | 750,000 | | | FL Capital Trust Agency (Miami Community Charter School) | | | 7.000 | | | | 10/15/2040 | | | | 786,712 | |
| | |
| | 1,810,000 | | | FL Capital Trust Agency (Windsor Cove Apartments) | | | 5.000 | | | | 11/01/2047 | | | | 1,835,774 | |
| | |
| | 10,440,000 | | | FL COP (Dept. of Management Services)1 | | | 5.250 | | | | 08/01/2028 | | | | 11,873,830 | |
| | |
| | 10,000 | | | FL Correctional Private Commission (350 Bed Youthful) COP5 | | | 5.000 | | | | 08/01/2017 | | | | 10,237 | |
| | |
| | 1,250,000 | | | FL HEFFA (Bethune-Cookman University) | | | 5.375 | | | | 07/01/2032 | | | | 1,347,562 | |
| | |
| | 1,100,000 | | | FL Lake Ashton II Community Devel. District | | | 5.375 | | | | 05/01/2036 | | | | 832,117 | |
| | |
| | 935,000 | | | FL Principal One Community Devel. District | | | 5.650 | | | | 05/01/2035 | | | | 940,311 | |
| | |
| | 3,865,000 | | | Flora Ridge, FL Educational Facilities Benefit District | | | 5.300 | | | | 05/01/2037 | | | | 3,881,465 | |
| | |
| | 145,000 | | | Forest Creek, FL Community Devel. District | | | 5.450 | | | | 05/01/2036 | | | | 145,251 | |
| | |
| | 236,868 | | | Forest Creek, FL Community Devel. District5 | | | 5.450 | | | | 05/01/2036 | | | | 207,624 | |
| | |
| | 925,000 | | | Greater Lakes/Sawgrass Bay, FL Community Devel. District | | | 5.500 | | | | 05/01/2038 | | | | 875,420 | |
| | |
| | 16,000,000 | | | Greater Orlando, FL Aviation Authority1 | | | 5.000 | | | | 10/01/2032 | | | | 17,214,400 | |
| | |
| | 195,000 | | | Heritage Isles, FL Community Devel. District3 | | | 7.100 | | | | 10/01/2023 | | | | 36,163 | |
| | |
| | 1,215,000 | | | Heritage Plantation, FL Community Devel. District2 | | | 5.400 | | | | 05/01/2037 | | | | 475,065 | |
| | |
| | 120,000 | | | Hialeah, FL Hsg. Authority | | | 5.800 | | | | 06/20/2033 | | | | 121,936 | |
| | |
| | 310,000 | | | Highland Meadows, FL Community Devel. District Special Assessment, Series A3 | | | 5.500 | | | | 05/01/2036 | | | | 123,098 | |
| | |
| | 3,820,000 | | | Highlands, FL Community Devel. District | | | 5.550 | | | | 05/01/2036 | | | | 2,775,650 | |
| | |
| | 745,000 | | | Hillsborough County, FL IDA (Senior Care Group)3 | | | 6.750 | | | | 07/01/2029 | | | | 372,448 | |
| | |
| | 855,000 | | | Indigo, FL Community Devel. District3 | | | 5.750 | | | | 05/01/2036 | | | | 514,599 | |
| | |
| | 35,000 | | | Jacksonville, FL Health Facilities Authority (Daughters of Charity Health Services of Austin) | | | 5.250 | | | | 08/15/2027 | | | | 36,262 | |
| | |
| | 1,000,000 | | | Lakeland, FL Educational Facilities (Florida Southern College) | | | 5.000 | | | | 09/01/2037 | | | | 1,031,820 | |
| | |
| | 1,255,000 | | | Lakeland, FL Educational Facilities (Florida Southern College) | | | 5.000 | | | | 09/01/2029 | | | | 1,330,676 | |
| | |
| | 250,000 | | | Lakeside Landings, FL Devel. District3 | | | 5.500 | | | | 05/01/2038 | | | | 109,075 | |
| | |
| | 4,485,000 | | | Lakewood Ranch, FL Stewardship District | | | 5.500 | | | | 05/01/2036 | | | | 3,511,217 | |
| | |
| | 3,460,000 | | | Lakewood Ranch, FL Stewardship District (Country Club East Investors) | | | 5.400 | | | | 05/01/2037 | | | | 2,975,565 | |
| | |
| | 500,000 | | | Legends Bay, FL Community Devel. District | | | 5.875 | | | | 05/01/2038 | | | | 361,255 | |
27 OPPENHEIMER ROCHESTER AMT-FREE MUNICIPAL FUND
| | |
| |
| STATEMENT OF INVESTMENTS Continued | | |
| | | | | | | | | | | | | | | | |
Principal Amount | | | | | Coupon | | | Maturity | | | Value | |
| | |
| Florida (Continued) | |
| | |
| | $ 1,835,000 | | | Lucaya, FL Community Devel. District | | | 5.375 % | | | | 05/01/2035 | | | $ | 1,653,482 | |
| | |
| | 530,000 | | | Madison County, FL Mtg. (Twin Oaks) | | | 6.000 | | | | 07/01/2025 | | | | 323,745 | |
| | |
| | 1,775,000 | | | Magnolia Creek, FL Community Devel. District3 | | | 5.900 | | | | 05/01/2039 | | | | 613,156 | |
| | |
| | 1,425,000 | | | Magnolia West, FL Community Devel. District Special Assessment3 | | | 5.350 | | | | 05/01/2037 | | | | 780,202 | |
| | |
| | 6,330,000 | | | Miromar Lakes, FL Community Devel. District | | | 6.875 | | | | 05/01/2035 | | | | 6,402,795 | |
| | |
| | 790,000 | | | Miromar Lakes, FL Community Devel. District | | | 5.375 | | | | 05/01/2032 | | | | 843,633 | |
| | |
| | 3,500,000 | | | Monterey/Congress, FL Community Devel. District Special Assessment | | | 5.375 | | | | 05/01/2036 | | | | 3,122,875 | |
| | |
| | 8,585,000 | | | Moody River, FL Estates Community Devel. District | | | 5.350 | | | | 05/01/2036 | | | | 5,954,814 | |
| | |
| | 9,405,000 | | | Myrtle Creek, FL Improvement District Special Assessment | | | 5.200 | | | | 05/01/2037 | | | | 9,547,015 | |
| | |
| | 485,000 | | | Naturewalk, FL Community Devel. District3 | | | 5.500 | | | | 05/01/2038 | | | | 241,292 | |
| | |
| | 580,000 | | | Naturewalk, FL Community Devel. District2 | | | 5.300 | | | | 05/01/2016 | | | | 288,196 | |
| | |
| | 250,000 | | | Orange County, FL Health Facilities Authority (Orlando Lutheran Tower) | | | 5.500 | | | | 07/01/2032 | | | | 251,590 | |
| | |
| | 10,000,000 | | | Orange County, FL School Board COP1 | | | 5.500 | | | | 08/01/2034 | | | | 11,081,800 | |
| | |
| | 1,000,000 | | | Palace Coral Gables, FL Community Devel. District Special Assessment | | | 5.625 | | | | 05/01/2042 | | | | 1,108,360 | |
| | |
| | 450,000 | | | Palace Coral Gables, FL Community Devel. District Special Assessment | | | 5.000 | | | | 05/01/2032 | | | | 489,555 | |
| | |
| | 1,250,000 | | | Palm Bay, FL Educational Facilities (Patriot Charter School)3 | | | 7.000 | | | | 07/01/2036 | | | | 375,025 | |
| | |
| | 25,000 | | | Palm Beach County, FL Health Facilities Authority (Boca Raton Community Hospital) | | | 5.625 | | | | 12/01/2031 | | | | 25,033 | |
| | |
| | 110,000 | | | Palm Beach County, FL Health Facilities Authority (Boca Raton Community Hospital) | | | 5.500 | | | | 12/01/2021 | | | | 110,257 | |
| | |
| | 1,895,000 | | | Palm Coast Park, FL Community Devel. District Special Assessment | | | 5.700 | | | | 05/01/2037 | | | | 1,297,734 | |
| | |
| | 2,200,000 | | | Palm Glades, FL Community Devel. District | | | 5.300 | | | | 05/01/2036 | | | | 2,219,888 | |
| | |
| | 315,000 | | | Palm Glades, FL Community Devel. District Special Assessment | | | 7.250 | | | | 08/01/2016 | | | | 327,058 | |
| | |
| | 510,000 | | | Palm River, FL Community Devel. District3 | | | 5.375 | | | | 05/01/2036 | | | | 201,154 | |
| | |
| | 460,000 | | | Palm River, FL Community Devel. District3 | | | 5.150 | | | | 05/01/2013 | | | | 181,153 | |
| | |
| | 2,195,000 | | | Parkway Center, FL Community Devel. District, Series A | | | 6.300 | | | | 05/01/2034 | | | | 2,042,667 | |
| | |
| | 2,000,000 | | | Parkway Center, FL Community Devel. District, Series A | | | 6.125 | | | | 05/01/2024 | | | | 1,924,420 | |
| | |
| | 1,310,000 | | | Pine Ridge Plantation, FL Community Devel. District | | | 5.400 | | | | 05/01/2037 | | | | 1,073,008 | |
| | |
| | 1,385,000 | | | Pinellas County, FL Health Facility Authority (St. Mark Village) | | | 5.650 | | | | 05/01/2037 | | | | 1,325,113 | |
| | |
| | 425,000 | | | Poinciana West, FL Community Devel. District Special Assessment | | | 6.000 | | | | 05/01/2037 | | | | 424,953 | |
| | |
| | 340,000 | | | Portico, FL Community Devel. District | | | 5.450 | | | | 05/01/2037 | | | | 230,442 | |
| | |
| | 490,000 | | | Portofino Cove, FL Community Devel. District Special Assessment3 | | | 5.500 | | | | 05/01/2038 | | | | 192,335 | |
| | |
| | 2,670,000 | | | Portofino Cove, FL Community Devel. District Special Assessment3 | | | 5.250 | | | | 05/01/2012 | | | | 1,335,534 | |
28 OPPENHEIMER ROCHESTER AMT-FREE MUNICIPAL FUND
| | | | | | | | | | | | | | | | |
Principal Amount | | | | | Coupon | | | Maturity | | | Value | |
| | |
| Florida (Continued) | |
| | |
| | $ 980,000 | | | Portofino Landings, FL Community Devel. District Special Assessment3 | | | 5.400 % | | | | 05/01/2038 | | | $ | 384,650 | |
| | |
| | 285,000 | | | Portofino Landings, FL Community Devel. District Special Assessment3 | | | 5.200 | | | | 05/01/2017 | | | | 111,771 | |
| | |
| | 14,330,000 | | | Quarry, FL Community Devel. District | | | 5.500 | | | | 05/01/2036 | | | | 13,939,078 | |
| | |
| | 10,020,000 | | | Renaissance Commons, FL Community Devel. District, Series A | | | 5.600 | | | | 05/01/2036 | | | | 8,483,233 | |
| | |
| | 4,175,000 | | | Reunion East, FL Community Devel. District | | | 7.375 | | | | 05/01/2033 | | | | 4,240,255 | |
| | |
| | 1,850,000 | | | Reunion East, FL Community Devel. District2 | | | 7.375 | | | | 05/01/2033 | | | | 1,287,970 | |
| | |
| | 1,710,000 | | | Reunion East, FL Community Devel. District2 | | | 5.800 | | | | 05/01/2036 | | | | 1,190,502 | |
| | |
| | 1,110,000 | | | Ridgewood Trails, FL Community Devel. District | | | 5.650 | | | | 05/01/2038 | | | | 541,946 | |
| | |
| | 2,500,000 | | | River Glen, FL Community Devel. District Special Assessment3 | | | 5.450 | | | | 05/01/2038 | | | | 996,525 | |
| | |
| | 145,000 | | | Rolling Hills, FL Community Devel. District3 | | | 5.450 | | | | 05/01/2037 | | | | 56,649 | |
| | |
| | 400,000 | | | Santa Rosa Bay, FL Bridge Authority | | | 6.250 | | | | 07/01/2028 | | | | 241,000 | |
| | |
| | 3,445,000 | | | Sarasota County, FL Educational Facilities (School of Arts & Sciences) | | | 6.750 | | | | 07/01/2030 | | | | 3,799,387 | |
| | |
| | 4,535,000 | | | Sarasota County, FL Educational Facilities (School of Arts & Sciences) | | | 6.500 | | | | 07/01/2040 | | | | 4,869,864 | |
| | |
| | 1,985,000 | | | South Bay, FL Community Devel. District3 | | | 5.125 | | | | 11/01/2009 | | | | 764,443 | |
| | |
| | 3,750,000 | | | South Bay, FL Community Devel. District3 | | | 5.375 | | | | 05/01/2013 | | | | 1,312,875 | |
| | |
| | 5,400,000 | | | South Bay, FL Community Devel. District3 | | | 5.950 | | | | 05/01/2036 | | | | 2,081,106 | |
| | |
| | 1,500,000 | | | St. Johns County, FL IDA (Presbyterian Retirement) | | | 6.000 | | | | 08/01/2045 | | | | 1,611,465 | |
| | |
| | 400,000 | | | St. Johns County, FL IDA (St. John’s County Welfare Federation) | | | 5.250 | | | | 10/01/2041 | | | | 364,980 | |
| | |
| | 1,495,000 | | | St. John’s Forest, FL Community Devel. District, Series A | | | 6.125 | | | | 05/01/2034 | | | | 1,495,688 | |
| | |
| | 6,020,000 | | | Tern Bay, FL Community Devel. District3 | | | 5.000 | | | | 05/01/2015 | | | | 1,466,412 | |
| | |
| | 500,000 | | | Tern Bay, FL Community Devel. District3 | | | 5.375 | | | | 05/01/2037 | | | | 121,875 | |
| | |
| | 4,310,000 | | | Town Center, FL at Palm Coast Community Devel. District | | | 6.000 | | | | 05/01/2036 | | | | 3,980,457 | |
| | |
| | 220,000 | | | Turnbull Creek, FL Community Devel. District Special Assessment | | | 5.250 | | | | 05/01/2037 | | | | 196,887 | |
| | |
| | 8,390,000 | | | Turnbull Creek, FL Community Devel. District Special Assessment | | | 5.800 | | | | 05/01/2035 | | | | 8,181,760 | |
| | |
| | 5,230,000 | | | Verandah East, FL Community Devel. District | | | 5.400 �� | | | | 05/01/2037 | | | | 4,060,363 | |
| | |
| | 4,010,000 | | | Verandah, FL Community Devel District | | | 5.250 | | | | 05/01/2036 | | | | 3,523,266 | |
| | |
| | 8,400,000 | | | Verona Walk, FL Community Devel. District | | | 5.375 | | | | 05/01/2037 | | | | 7,931,028 | |
| | |
| | 420,000 | | | Villa Vizcaya, FL Community Devel. District Special Assessment3 | | | 5.550 | | | | 05/01/2039 | | | | 186,942 | |
| | |
| | 2,565,000 | | | Villa Vizcaya, FL Community Devel. District Special Assessment3 | | | 5.350 | | | | 05/01/2017 | | | | 1,141,681 | |
| | |
| | 1,575,000 | | | Villages of Westport, FL Community Devel. District3,6 | | | 5.700 | | | | 05/01/2035 | | | | 789,233 | |
| | |
| | 4,575,000 | | | Vista, FL Community Devel. District Special Assessment | | | 5.375 | | | | 05/01/2037 | | | | 4,169,381 | |
| | |
| | 2,470,000 | | | Waterford Estates, FL Community Devel. District Special Assessment3 | | | 5.500 | | | | 05/01/2037 | | | | 726,304 | |
29 OPPENHEIMER ROCHESTER AMT-FREE MUNICIPAL FUND
| | |
| |
| STATEMENT OF INVESTMENTS Continued | | |
| | | | | | | | | | | | | | | | |
Principal Amount | | | | | Coupon | | | Maturity | | | Value | |
| | |
| Florida (Continued) | |
| | |
| | $ 1,500,000 | | | Waterford Estates, FL Community Devel. District Special Assessment3 | | | 5.125 % | | | | 05/01/2013 | | | $ | 440,565 | |
| | |
| | 5,395,000 | | | Watergrass, FL Community Devel. District Special Assessment | | | 5.500 | | | | 05/01/2036 | | | | 5,183,030 | |
| | |
| | 390,000 | | | Watergrass, FL Community Devel. District Special Assessment5 | | | 5.125 | | | | 11/01/2014 | | | | 375,933 | |
| | |
| | 531,156 | | | Watergrass, FL Community Devel. District Special Assessment5 | | | 6.960 | | | | 11/01/2017 | | | | 501,735 | |
| | |
| | 665,000 | | | Watergrass, FL Community Devel. District Special Assessment | | | 5.375 | | | | 05/01/2039 | | | | 500,605 | |
| | |
| | 950,000 | | | Waterlefe, FL Community Devel. District Golf Course3 | | | 8.125 | | | | 10/01/2025 | | | | 65,968 | |
| | |
| | 5,925,000 | | | Waters Edge, FL Community Devel. District | | | 5.300 | | | | 05/01/2036 | | | | 5,901,774 | |
| | |
| | 900,000 | | | Waters Edge, FL Community Devel. District | | | 0.000 9 | | | | 05/01/2039 | | | | 556,866 | |
| | |
| | 16,000 | | | Waters Edge, FL Community Devel. District | | | 5.350 | | | | 05/01/2039 | | | | 16,028 | |
| | |
| | 1,785,000 | | | Waterstone, FL Community Devel. District3 | | | 5.500 | | | | 05/01/2018 | | | | 707,806 | |
| | |
| | 540,000 | | | West Villages, FL Improvement District3 | | | 5.350 | | | | 05/01/2015 | | | | 414,731 | |
| | |
| | 7,350,000 | | | West Villages, FL Improvement District3 | | | 5.800 | | | | 05/01/2036 | | | | 4,373,985 | |
| | |
| | 3,125,000 | | | West Villages, FL Improvement District3 | | | 5.500 | | | | 05/01/2038 | | | | 2,597,875 | |
| | |
| | 4,925,000 | | | Westridge, FL Community Devel. District3 | | | 5.800 | | | | 05/01/2037 | | | | 1,854,509 | |
| | |
| | 5,840,000 | | | Westside, FL Community Devel. District2 | | | 5.650 | | | | 05/01/2037 | | | | 2,921,168 | |
| | |
| | 4,795,000 | | | World Commerce, FL Community Devel. District Special Assessment | | | 6.125 | | | | 05/01/2035 | | | | 4,681,742 | |
| | |
| | 2,250,000 | | | Wyld Palms, FL Community Devel. District3 | | | 5.400 | | | | 05/01/2015 | | | | 687,398 | |
| | |
| | 1,445,000 | | | Wyld Palms, FL Community Devel. District3 | | | 5.500 | | | | 05/01/2038 | | | | 441,867 | |
| | |
| | 990,000 | | | Zephyr Ridge, FL Community Devel. District3 | | | 5.625 | | | | 05/01/2037 | | | | 482,967 | |
| | |
| | 450,000 | | | Zephyr Ridge, FL Community Devel. District3 | | | 5.250 | | | | 05/01/2013 | | | | 219,279 | |
| | | | | | | | | | | | | | | | |
| | | | | | | | | | | | | | | 252,663,292 | |
| | |
| Georgia—0.9% | | | | | |
| | 5,000 | | | Atlanta, GA HDC (Bedford Tower) | | | 6.250 | | | | 01/01/2015 | | | | 5,022 | |
| | |
| | 230,000 | | | Atlanta, GA Tax Allocation (Beltline) | | | 7.500 | | | | 01/01/2031 | | | | 270,685 | |
| | |
| | 565,000 | | | Atlanta, GA Urban Residential Finance Authority (Trestletree Village Apartments) | | | 5.000 | | | | 11/01/2048 | | | | 573,300 | |
| | |
| | 115,000 | | | Atlanta, GA Water & Wastewater Authority | | | 5.000 | | | | 11/01/2039 | | | | 115,122 | |
| | |
| | 7,425,000 | | | DeKalb County, GA Devel. Authority Public Purpose | | | 5.500 | | | | 12/10/2023 | | | | 7,554,418 | |
| | |
| | 4,435,000 | | | East Point, GA (Camp Creek), Series B | | | 8.000 | | | | 02/01/2026 | | | | 4,445,156 | |
| | |
| | 3,005,000 | | | East Point, GA (Camp Creek), Series B | | | 8.000 | | | | 02/01/2026 | | | | 3,011,881 | |
| | |
| | 15,000 | | | GA Municipal Electric Authority | | | 6.600 | | | | 01/01/2018 | | | | 16,267 | |
| | |
| | 520,000 | | | Randolph County, GA GO | | | 5.000 | | | | 04/01/2030 | | | | 548,569 | |
| | | | | | | | | | | | | | | | |
| | | | | | | | | | | | | | | 16,540,420 | |
| | |
| Idaho—0.1% | | | | | |
| | 60,000 | | | ID Health Facilities Authority (Trinity Health Corp.) | | | 6.250 | | | | 12/01/2033 | | | | 70,058 | |
30 OPPENHEIMER ROCHESTER AMT-FREE MUNICIPAL FUND
| | | | | | | | | | | | | | | | |
Principal Amount | | | | | Coupon | | | Maturity | | | Value | |
| | |
| Idaho (Continued) | |
| | |
| | $ 1,000,000 | | | ID Hsg. & Finance Assoc. (Compass Public Charter School) | | | 6.250 % | | | | 07/01/2045 | | | $ | 1,054,400 | |
| | | | | | | | | | | | | | | | |
| | | | | | | | | | | | | | | 1,124,458 | |
| | |
| Illinois—12.4% | | | | | |
| | 400,000 | | | Annawan, IL Tax Increment (Patriot Renewable Fuels) | | | 5.625 | | | | 01/01/2018 | | | | 369,920 | |
| | |
| | 1,575,000 | | | Bedford Park, IL Tax | | | 5.125 | | | | 12/30/2018 | | | | 1,613,115 | |
| | |
| | 25,000 | | | Chicago, IL GO | | | 5.000 | | | | 01/01/2042 | | | | 24,999 | |
| | |
| | 5,000,000 | | | Chicago, IL O’Hare International Airport (Passenger Facility Charge) | | | 5.000 | | | | 01/01/2032 | | | | 5,443,450 | |
| | |
| | 6,000,000 | | | Chicago, IL Park District (Harbor Facilities)1 | | | 5.250 | | | | 01/01/2037 | | | | 6,429,300 | |
| | |
| | 10,000,000 | | | Chicago, IL Park District (Harbor Facilities)1 | | | 5.250 | | | | 01/01/2040 | | | | 10,651,400 | |
| | |
| | 2,400,000 | | | Cook County, IL Community School District GO | | | 7.125 | | | | 06/01/2024 | | | | 2,666,040 | |
| | |
| | 949,000 | | | Cortland, IL Special Tax (Sheaffer System)2 | | | 5.500 | | | | 03/01/2017 | | | | 285,649 | |
| | |
| | 500,000 | | | Country Club Hills, IL GO | | | 5.000 | | | | 12/01/2031 | | | | 509,875 | |
| | |
| | 40,000 | | | Country Club Hills, IL GO | | | 5.000 | | | | 12/01/2032 | | | | 40,728 | |
| | |
| | 435,000 | | | Country Club Hills, IL GO | | | 5.000 | | | | 12/01/2028 | | | | 444,270 | |
| | |
| | 395,000 | | | Country Club Hills, IL GO | | | 5.000 | | | | 12/01/2026 | | | | 403,540 | |
| | |
| | 410,000 | | | Country Club Hills, IL GO | | | 5.000 | | | | 12/01/2027 | | | | 418,991 | |
| | |
| | 455,000 | | | Country Club Hills, IL GO | | | 5.000 | | | | 12/01/2029 | | | | 464,414 | |
| | |
| | 475,000 | | | Country Club Hills, IL GO | | | 5.000 | | | | 12/01/2030 | | | | 484,528 | |
| | |
| | 320,000 | | | Du Page County, IL Special Service Area No. 31 Special Tax (Monarch Landing) | | | 5.625 | | | | 03/01/2036 | | | | 322,416 | |
| | |
| | 100,000 | | | Du Page County, IL Special Service Area No. 31 Special Tax (Monarch Landing) | | | 5.400 | | | | 03/01/2016 | | | | 102,324 | |
| | |
| | 1,250,000 | | | Gilberts, IL Special Service Area No. 19 Special Tax (Conservancy)3 | | | 5.375 | | | | 03/01/2016 | | | | 687,750 | |
| | |
| | 1,000,000 | | | Harvey, IL GO | | | 5.625 | | | | 12/01/2032 | | | | 752,060 | |
| | |
| | 2,225,000 | | | Harvey, IL GO | | | 5.500 | | | | 12/01/2027 | | | | 1,777,641 | |
| | |
| | 4,950,000 | | | Harvey, IL Hotel Motel Tax & Sales (Hotel & Conference Center)5 | | | 6.875 | | | | 08/01/2028 | | | | 4,019,152 | |
| | |
| | 1,920,000 | | | IL Finance Authority (Bethel Terrace Apartments) | | | 5.125 | | | | 09/01/2025 | | | | 1,915,104 | |
| | |
| | 2,215,000 | | | IL Finance Authority (Illinois Institute of Technology) | | | 7.125 | | | | 02/01/2034 | | | | 2,394,659 | |
| | |
| | 1,000,000 | | | IL Finance Authority (Illinois Institute of Technology) | | | 5.000 | | | | 04/01/2036 | | | | 961,550 | |
| | |
| | 1,010,000 | | | IL Finance Authority (Illinois Institute of Technology) | | | 5.000 | | | | 04/01/2026 | | | | 1,013,293 | |
| | |
| | 9,660,000 | | | IL Finance Authority (Illinois Institute of Technology) | | | 5.000 | | | | 04/01/2031 | | | | 9,563,497 | |
| | |
| | 155,000 | | | IL Finance Authority (Illinois Institute of Technology) | | | 6.500 | | | | 02/01/2023 | | | | 166,616 | |
| | |
| | 500,000 | | | IL Finance Authority (Lake Forest College) | | | 5.750 | | | | 10/01/2032 | | | | 530,545 | |
| | |
| | 450,000 | | | IL Finance Authority (Lake Forest College) | | | 6.000 | | | | 10/01/2048 | | | | 480,006 | |
| | |
| | 1,000,000 | | | IL Finance Authority (Lutheran Social Services of Illinois/Vesper Management Corp. Obligated Group) | | | 5.125 | | | | 08/15/2028 | | | | 1,001,880 | |
31 OPPENHEIMER ROCHESTER AMT-FREE MUNICIPAL FUND
| | |
| |
| STATEMENT OF INVESTMENTS Continued | | |
| | | | | | | | | | | | | | | | |
Principal Amount | | | | | Coupon | | | Maturity | | | Value | |
| | |
| Illinois (Continued) | |
| | |
| | $ 185,000 | | | IL Finance Authority (Northwestern Memorial Hospital) | | | 6.000 % | | | | 08/15/2039 | | | $ | 185,420 | |
| | |
| | 20,000,000 | | | IL Finance Authority (Northwestern Memorial Hospital)1 | | | 6.000 | | | | 08/15/2039 | | | | 23,115,200 | |
| | |
| | 50,000 | | | IL Finance Authority (OSF Healthcare System) | | | 7.125 | | | | 11/15/2037 | | | | 59,861 | |
| | |
| | 75,000 | | | IL Finance Authority (OSF Healthcare System) | | | 7.125 | | | | 11/15/2035 | | | | 76,532 | |
| | |
| | 10,190,000 | | | IL Finance Authority (Provena Health) | | | 7.750 | | | | 08/15/2034 | | | | 12,601,667 | |
| | |
| | 8,335,000 | | | IL Finance Authority (Resurrection Health Care) | | | 5.250 | | | | 05/15/2029 | | | | 8,814,513 | |
| | |
| | 6,665,000 | | | IL Finance Authority (Resurrection Health Care)1 | | | 5.250 | | | | 05/15/2029 | | | | 7,048,433 | |
| | |
| | 5,000,000 | | | IL Finance Authority (Resurrection Health) | | | 6.125 | | | | 05/15/2025 | | | | 5,554,650 | |
| | |
| | 2,680,000 | | | IL Finance Authority (Roosevelt University) | | | 6.250 | | | | 04/01/2029 | | | | 2,884,270 | |
| | |
| | 6,270,000 | | | IL Finance Authority (Roosevelt University) | | | 5.500 | | | | 04/01/2037 | | | | 6,407,313 | |
| | |
| | 3,250,000 | | | IL Finance Authority (Roosevelt University) | | | 5.500 | | | | 04/01/2032 | | | | 3,332,647 | |
| | |
| | 22,915,000 | | | IL Finance Authority (Roosevelt University) | | | 6.500 | | | | 04/01/2039 | | | | 24,520,196 | |
| | |
| | 5,855,000 | | | IL Finance Authority (Roosevelt University) | | | 6.500 | | | | 04/01/2044 | | | | 6,245,938 | |
| | |
| | 5,600,000 | | | IL Finance Authority (Roosevelt University) | | | 5.750 | | | | 04/01/2024 | | | | 6,100,752 | |
| | |
| | 4,765,000 | | | IL Finance Authority (Swedish Covenant Hospital) | | | 5.750 | | | | 08/15/2029 | | | | 5,168,167 | |
| | |
| | 10,000,000 | | | IL Finance Authority (Trinity Health Corp.)1 | | | 5.000 | | | | 12/01/2030 | | | | 11,033,683 | |
| | |
| | 1,500,000 | | | IL GO | | | 5.000 | | | | 03/01/2037 | | | | 1,516,440 | |
| | |
| | 700,000 | | | IL GO | | | 5.000 | | | | 08/01/2025 | | | | 743,092 | |
| | |
| | 1,000,000 | | | IL GO | | | 5.500 | | | | 07/01/2038 | | | | 1,061,050 | |
| | |
| | 330,000 | | | IL Metropolitan Pier & Exposition Authority (McCormick Place Exposition) | | | 5.500 | | | | 06/15/2050 | | | | 356,469 | |
| | |
| | 290,000 | | | IL Sports Facilities Authority | | | 5.000 | | | | 06/15/2032 | | | | 290,186 | |
| | |
| | 2,000,000 | | | IL Sports Facilities Authority5 | | | 5.250 | | | | 06/15/2032 | | | | 2,173,240 | |
| | |
| | 955,000 | | | Jefferson County, IL High School District No. 201 (Mt. Vernon) | | | 6.500 | | | | 12/30/2028 | | | | 1,257,343 | |
| | |
| | 895,000 | | | Jefferson County, IL High School District No. 201 (Mt. Vernon) | | | 6.500 | | | | 12/30/2027 | | | | 1,183,333 | |
| | |
| | 1,160,000 | | | Jefferson County, IL High School District No. 201 (Mt. Vernon) | | | 6.500 | | | | 12/30/2031 | | | | 1,537,754 | |
| | |
| | 4,481,000 | | | Lakemoor Village, IL Special Tax | | | 5.000 | | | | 03/01/2027 | | | | 4,430,141 | |
| | |
| | 2,718,000 | | | Lincolnshire, IL Special Service Area No. 1 Special Tax (Sedgebrook) | | | 6.250 | | | | 03/01/2034 | | | | 2,774,534 | |
| | |
| | 1,455,000 | | | Manhattan, IL Special Service Area Special Tax (Groebe Farm-Stonegate)3 | | | 6.125 | | | | 03/01/2040 | | | | 284,161 | |
| | |
| | 480,000 | | | Markham, IL GO | | | 5.750 | | | | 02/01/2028 | | | | 485,981 | |
| | |
| | 1,094,000 | | | Plano, IL Special Service Area No. 53 | | | 6.000 | | | | 03/01/2036 | | | | 777,243 | |
| | |
| | 500,000 | | | Southwestern IL Devel. Authority (Eden Retirement Center) | | | 5.850 | | | | 12/01/2036 | | | | 430,945 | |
| | |
| | 4,470,000 | | | Southwestern IL Devel. Authority (Local Government Programming) | | | 7.000 | | | | 10/01/2022 | | | | 3,676,933 | |
| | |
| | 1,735,000 | | | Southwestern IL Devel. Authority (Village of Sauget) | | | 5.625 | | | | 11/01/2026 | | | | 1,396,033 | |
| | |
| | 12,000,000 | | | Springfield, IL Electric | | | 5.000 | | | | 03/01/2030 | | | | 12,561,360 | |
| | |
| | 12,000,000 | | | University of Illinois (Auxiliary Facilities System)1 | | | 5.750 | | | | 04/01/2038 | | | | 13,716,000 | |
| | |
| | 1,975,000 | | | Vernon Hills, IL Tax Increment (Town Center) | | | 6.250 | | | | 12/30/2026 | | | | 2,011,873 | |
| | |
| | 940,000 | | | Volo Village, IL Special Service Area (Lancaster Falls) | | | 5.750 | | | | 03/01/2036 | | | | 962,316 | |
32 OPPENHEIMER ROCHESTER AMT-FREE MUNICIPAL FUND
| | | | | | | | | | | | | | | | |
Principal Amount | | | | | Coupon | | | Maturity | | | Value | |
| | |
| Illinois (Continued) | |
| | |
| | $ 3,822,000 | | | Volo Village, IL Special Service Area (Remington Pointe) | | | 6.450 % | | | | 03/01/2034 | | | $ | 3,771,588 | |
| | |
| | 1,870,000 | | | Yorkville, IL United City Special Services Area Special Tax | | | 5.000 | | | | 03/01/2033 | | | | 1,814,854 | |
| | |
| | 2,295,000 | | | Yorkville, IL United City Special Services Area Special Tax (Bristol Bay) | | | 5.875 | | | | 03/01/2036 | | | | 2,327,773 | |
| | |
| | 1,634,000 | | | Yorkville, IL United City Special Services Area Special Tax (Raintree Village II)3 | | | 6.250 | | | | 03/01/2035 | | | | 865,415 | |
| | | | | | | | | | | | | | | | |
| | | | | | | | | | | | | | | 241,494,011 | |
| | |
| Indiana—1.9% | | | | | |
| | 1,700,000 | | | Carmel, IN Redevel. District COP | | | 6.500 | | | | 07/15/2035 | | | | 1,842,477 | |
| | |
| | 1,000,000 | | | Hammond, IN Local Public Improvement District | | | 6.750 | | | | 08/15/2035 | | | | 1,015,900 | |
| | |
| | 1,000,000 | | | Hammond, IN Local Public Improvement District | | | 6.500 | | | | 08/15/2030 | | | | 1,014,220 | |
| | |
| | 465,000 | | | Hammond, IN Local Public Improvement District | | | 5.000 | | | | 02/01/2024 | | | | 487,241 | |
| | |
| | 4,250,000 | | | IN Finance Authority (Marian University) | | | 6.375 | | | | 09/15/2041 | | | | 4,498,412 | |
| | |
| | 4,750,000 | | | IN Finance Authority (Marian University) | | | 6.500 | | | | 09/15/2030 | | | | 5,116,225 | |
| | |
| | 2,885,000 | | | IN Finance Authority (Marian University) | | | 5.250 | | | | 09/15/2025 | | | | 2,949,912 | |
| | |
| | 325,000 | | | IN Finance Authority Educational Facilities (Irvington Community) | | | 9.000 | | | | 07/01/2039 | | | | 335,107 | |
| | |
| | 3,985,000 | | | Indianapolis, IN Multifamily Hsg. (Berkley Common) | | | 6.000 | | | | 07/01/2040 | | | | 4,179,468 | |
| | |
| | 1,000,000 | | | Indianapolis, IN Multifamily Hsg. (Berkley Common) | | | 5.750 | | | | 07/01/2030 | | | | 1,057,610 | |
| | |
| | 2,025,000 | | | Indianapolis, IN Multifamily Hsg. (Stonekey Apartments) | | | 7.000 | | | | 02/01/2039 | | | | 2,200,021 | |
| | |
| | 7,950,000 | | | Mount Vernon, IN School Building Corp. | | | 5.000 | | | | 01/15/2037 | | | | 8,663,831 | |
| | |
| | 2,123,639 | | | North Manchester, IN Economic Devel. (Peabody Retirement Community)2 | | | 1.000 | | | | 12/01/2045 | | | | 21 | |
| | |
| | 2,466,162 | | | North Manchester, IN Economic Devel. (Peabody Retirement Community) | | | 5.130 7 | | | | 12/01/2045 | | | | 1,226,176 | |
| | |
| | 2,155,000 | | | Shelbyville, IN Redevel. District Tax Increment (Central Shelbyville Economic) | | | 6.500 | | | | 07/01/2022 | | | | 2,337,766 | |
| | | | | | | | | | | | | | | | |
| | | | | | | | | | | | | | | 36,924,387 | |
| | |
| Iowa—0.2% | | | | | |
| | 750,000 | | | IA Finance Authority (Amity Fellowserve) | | | 6.500 | | | | 10/01/2036 | | | | 726,832 | |
| | |
| | 400,000 | | | IA Finance Authority (Boys & Girls Home and Family Services)3 | | | 5.900 | | | | 12/01/2028 | | | | 179,972 | |
| | |
| | 1,500,000 | | | IA Finance Authority (Mercy Medical Center) | | | 5.000 | | | | 08/15/2029 | | | | 1,637,775 | |
| | |
| | 1,685,000 | | | IA Finance Authority (Mercy Medical Center) | | | 5.000 | | | | 08/15/2028 | | | | 1,848,378 | |
| | |
| | 410,000 | | | IA Finance Authority Senior Hsg. (Wedum Walnut Ridge) | | | 5.375 | | | | 06/01/2025 | | | | 368,119 | |
| | | | | | | | | | | | | | | | |
| | | | | | | | | | | | | | | 4,761,076 | |
| | |
| Kansas—0.2% | | | | | |
| | 825,000 | | | Hays, KS Sales Tax | | | 6.000 | | | | 01/01/2025 | | | | 825,594 | |
| | |
| | 256,000 | | | Overland Park, KS Transportation Devel. District (Grass Creek) | | | 4.850 | | | | 09/01/2016 | | | | 262,582 | |
33 OPPENHEIMER ROCHESTER AMT-FREE MUNICIPAL FUND
| | |
| |
| STATEMENT OF INVESTMENTS Continued | | |
| | | | | | | | | | | | | | | | |
Principal Amount | | | | | Coupon | | | Maturity | | | Value | |
| | |
| Kansas (Continued) | |
| | |
| | $ 2,435,000 | | | Pittsburgh, KS Special Obligation (North Broadway Redevel.) | | | 4.900 % | | | | 04/01/2024 | | | $ | 2,253,884 | |
| | | | | | | | | | | | | | | | |
| | | | | | | | | | | | | | | 3,342,060 | |
| | |
| Kentucky—0.0% | | | | | |
| | 80,000 | | | Owens County, KY Waterworks System (AWCC/KAWC Obligated Group) | | | 6.250 | | | | 06/01/2039 | | | | 89,041 | |
| | |
| | 15,000 | | | Springfield, KY Educational Devel. (St. Catherine College) | | | 5.750 | | | | 10/01/2035 | | | | 15,091 | |
| | | | | | | | | | | | | | | | |
| | | | | | | | | | | | | | | 104,132 | |
| | |
| Louisiana—2.5% | | | | | |
| | 2,000,000 | | | Jefferson Parish, LA Hospital Service District No. 1 (West Jefferson Medical Center) | | | 5.250 | | | | 01/01/2028 | | | | 2,173,320 | |
| | |
| | 950,000 | | | LA Citizens Property Insurance Corp. | | | 5.000 | | | | 06/01/2024 | | | | 1,083,389 | |
| | |
| | 635,000 | | | LA Citizens Property Insurance Corp. | | | 5.000 | | | | 06/01/2024 | | | | 729,418 | |
| | |
| | 5,000,000 | | | LA HFA (La Chateau) | | | 7.250 | | | | 09/01/2039 | | | | 5,212,300 | |
| | |
| | 8,280,000 | | | LA HFA (La Chateau) | | | 6.875 | | | | 09/01/2029 | | | | 8,544,463 | |
| | |
| | 3,085,000 | | | LA Local Government EF&CD Authority (Baton Rouge Student Hsg.) | | | 5.500 | | | | 09/01/2022 | | | | 2,254,981 | |
| | |
| | 35,000 | | | LA Local Government EF&CD Authority (Baton Rouge Student Hsg.) | | | 5.250 | | | | 09/01/2035 | | | | 25,758 | |
| | |
| | 2,000,000 | | | LA Local Government EF&CD Authority (Baton Rouge Student Hsg.) | | | 5.250 | | | | 09/01/2018 | | | | 1,545,600 | |
| | |
| | 1,240,000 | | | LA Local Government EF&CD Authority (Capital Projects and Equipment) | | | 6.550 | | | | 09/01/2025 | | | | 1,338,357 | |
| | |
| | 19,275,000 | | | LA Public Facilities Authority (OLOLRMC/OLOLMC Obligated Group) | | | 6.750 | | | | 07/01/2039 | | | | 21,802,338 | |
| | |
| | 2,000,000 | | | LA Stadium & Exposition District | | | 5.000 | | | | 07/01/2032 | | | | 2,188,720 | |
| | |
| | 50,000 | | | LA Stadium & Exposition District | | | 5.000 | | | | 07/01/2028 | | | | 55,721 | |
| | |
| | 2,500,000 | | | Lakeshore Villages, LA Master Community Devel. District2 | | | 5.250 | | | | 07/01/2017 | | | | 925,750 | |
| | |
| | 20,000 | | | New Orleans, LA Exhibit Hall Special Tax (Ernest N. Morial) | | | 5.000 | | | | 07/15/2025 | | | | 20,221 | |
| | | | | | | | | | | | | | | | |
| | | | | | | | | | | | | | | 47,900,336 | |
| | |
| Maine—0.4% | | | | | |
| | 5,000 | | | ME H&HEFA (Central Maine Medical Center/St. Joseph’s College/Thomas College Obligated Group) | | | 5.000 | | | | 07/01/2032 | | | | 5,016 | |
| | |
| | 5,000,000 | | | ME H&HEFA (Maine General Medical Center) | | | 7.500 | | | | 07/01/2032 | | | | 5,789,500 | |
| | |
| | 2,000,000 | | | ME H&HEFA (Maine General Medical Center) | | | 6.750 | | | | 07/01/2036 | | | | 2,207,340 | |
| | | | | | | | | | | | | | | | |
| | | | | | | | | | | | | | | 8,001,856 | |
| | |
| Maryland—0.1% | | | | | |
| | 1,000,000 | | | MD EDC Student Hsg. (Morgan State University) | | | 5.000 | | | | 07/01/2034 | | | | 1,022,590 | |
| | |
| | 65,000 | | | MD H&HEFA (Johns Hopkins Hospital) | | | 5.375 | | | | 07/01/2020 | | | | 65,153 | |
| | |
| | 950,000 | | | Prince Georges County, MD Special District (Victoria Falls) | | | 5.250 | | | | 07/01/2035 | | | | 952,736 | |
34 OPPENHEIMER ROCHESTER AMT-FREE MUNICIPAL FUND
| | | | | | | | | | | | | | | | |
Principal Amount | | | | | Coupon | | | Maturity | | | Value | |
| | |
| Maryland (Continued) | |
| | |
| | $ 750,000 | | | Salisbury, MD Special Obligation (Villages at Aydelotte Farm)3 | | | 5.250 % | | | | 01/01/2037 | | | $ | 272,948 | |
| | | | | | | | | | | | | | | | |
| | | | | | | | | | | | | | | 2,313,427 | |
| | |
| Massachusetts—0.5% | | | | | |
| | 260,000 | | | MA Devel. Finance Agency (Evergreen Center) | | | 5.500 | | | | 01/01/2035 | | | | 260,330 | |
| | |
| | 25,000 | | | MA Devel. Finance Agency (Lasell College) | | | 6.000 | | | | 07/01/2031 | | | | 28,554 | |
| | |
| | 750,000 | | | MA Devel. Finance Agency (Lasell College) | | | 5.500 | | | | 07/01/2026 | | | | 840,203 | |
| | |
| | 92,782 | | | MA Devel. Finance Agency (Linden Ponds) | | | 5.500 | | | | 11/15/2046 | | | | 64,733 | |
| | |
| | 461,488 | | | MA Devel. Finance Agency (Linden Ponds) | | | 0.605 4 | | | | 11/15/2056 | | | | 2,049 | |
| | |
| | 14,103 | | | MA Devel. Finance Agency (Linden Ponds) | | | 6.250 | | | | 11/15/2039 | | | | 11,479 | |
| | |
| | 1,733,606 | | | MA Devel. Finance Agency (Linden Ponds) | | | 6.250 | | | | 11/15/2046 | | | | 1,372,756 | |
| | |
| | 6,770,000 | | | MA Devel. Finance Agency (Merrimack College) | | | 5.250 | | | | 07/01/2042 | | | | 6,868,707 | |
| | |
| | 40,000 | | | MA Devel. Finance Agency (Northern Berkshire Community) | | | 6.250 | | | | 08/15/2029 | | | | 30,249 | |
| | |
| | 149,400 | | | MA Devel. Finance Agency (Northern Berkshire Healthcare)2 | | | 35.005 | | | | 02/15/2043 | | | | 1 | |
| | |
| | 120,749 | | | MA Devel. Finance Agency (Northern Berkshire Healthcare)3 | | | 6.000 | | | | 02/15/2043 | | | | 48,279 | |
| | |
| | 78,847 | | | MA Devel. Finance Agency (Northern Berkshire Healthcare)2 | | | 3.184 | | | | 02/15/2043 | | | | 1 | |
| | |
| | 25,000 | | | MA H&EFA (Beverly Hospital Corp.) | | | 5.250 | | | | 07/01/2023 | | | | 25,036 | |
| | | | | | | | | | | | | | | | |
| | | | | | | | | | | | | | | 9,552,377 | |
| | |
| Michigan—3.8% | | | | | |
| | 680,000 | | | Detroit, MI City School District | | | 5.000 | | | | 05/01/2031 | | | | 725,125 | |
| | |
| | 1,100,000 | | | Detroit, MI City School District | | | 5.000 | | | | 05/01/2028 | | | | 1,191,289 | |
| | |
| | 5,000 | | | Detroit, MI Local Devel. Finance Authority | | | 5.500 | | | | 05/01/2021 | | | | 4,674 | |
| | |
| | 13,435,000 | | | Detroit, MI Sewer Disposal System | | | 7.500 | | | | 07/01/2033 | | | | 14,718,177 | |
| | |
| | 2,250,000 | | | Detroit, MI Sewer Disposal System | | | 6.500 | | | | 07/01/2024 | | | | 2,267,010 | |
| | |
| | 2,155,000 | | | Detroit, MI Water and Sewerage Dept. | | | 5.000 | | | | 07/01/2032 | | | | 2,098,927 | |
| | |
| | 1,000,000 | | | Detroit, MI Water Supply System | | | 5.000 | | | | 07/01/2036 | | | | 958,210 | |
| | |
| | 5,300,000 | | | Detroit, MI Water Supply System | | | 5.000 | | | | 07/01/2030 | | | | 5,273,871 | |
| | |
| | 1,555,000 | | | Detroit, MI Water Supply System | | | 5.000 | | | | 07/01/2033 | | | | 1,546,463 | |
| | |
| | 20,000 | | | Flint, MI Hospital Building Authority (Hurley Medical Center) | | | 5.375 | | | | 07/01/2018 | | | | 20,022 | |
| | |
| | 495,000 | | | Grand Traverse Academy, MI Public School Academy | | | 5.000 | | | | 11/01/2022 | | | | 476,814 | |
| | |
| | 1,000,000 | | | Grand Traverse Academy, MI Public School Academy | | | 4.750 | | | | 11/01/2032 | | | | 837,010 | |
| | |
| | 2,200,000 | | | Grand Traverse Academy, MI Public School Academy | | | 4.625 | | | | 11/01/2027 | | | | 1,916,860 | |
| | |
| | 600,000 | | | MI Finance Authority (Old Redford Public School Academy) | | | 5.900 | | | | 12/01/2030 | | | | 577,806 | |
| | |
| | 14,600,000 | | | MI Hospital Finance Authority (Trinity Health)1 | | | 6.125 | | | | 12/01/2023 | | | | 17,064,334 | |
| | |
| | 15,000 | | | MI Hsg. Devel. Authority (Walled Lake Villa) | | | 6.000 | | | | 04/15/2018 | | | | 15,035 | |
| | |
| | 1,155,000 | | | MI Public Educational Facilities Authority (Old Redford Academy) | | | 6.000 | | | | 12/01/2035 | | | | 1,109,297 | |
35 OPPENHEIMER ROCHESTER AMT-FREE MUNICIPAL FUND
| | |
| |
| STATEMENT OF INVESTMENTS Continued | | |
| | | | | | | | | | | | | | | | |
Principal Amount | | | | | Coupon | | | Maturity | | | Value | |
| | |
| Michigan (Continued) | |
| | |
| | $ 433,000 | | | MI Strategic Fund Limited Obligation (Wolverine Human Services) | | | 7.875 % | | | | 08/31/2028 | | | $ | 442,452 | |
| | |
| | 9,720,762 | | | MI Strategic Fund Limited Obligation (Wolverine Human Services) | | | 5.850 | | | | 08/31/2027 | | | | 8,470,867 | |
| | |
| | 1,323,000,000 | | | MI Tobacco Settlement Finance Authority | | | 9.838 4 | | | | 06/01/2058 | | | | 6,641,460 | |
| | |
| | 250,000 | | | Monroe County, MI Hospital Finance Authority (Mercy Memorial Hospital Corp.) | | | 5.500 | | | | 06/01/2035 | | | | 252,887 | |
| | |
| | 400,000 | | | Plymouth, MI Educational Center Charter School (Public School Academy) | | | 5.375 | | | | 11/01/2030 | | | | 324,752 | |
| | |
| | 1,325,000 | | | Plymouth, MI Educational Center Charter School (Public School Academy) | | | 5.625 | | | | 11/01/2035 | | | | 1,059,311 | |
| | |
| | 500,000 | | | Renaissance, MI Public School Academy | | | 6.000 | | | | 05/01/2037 | | | | 514,285 | |
| | |
| | 5,000,000 | | | Wayne County, MI Airport Authority (Detroit Metro Wayne Airport) | | | 5.000 | | | | 12/01/2037 | | | | 5,269,550 | |
| | |
| | 35,000 | | | Wayne County, MI Building Authority | | | 5.250 | | | | 06/01/2016 | | | | 35,142 | |
| | | | | | | | | | | | | | | | |
| | | | | | | | | | | | | | | 73,811,630 | |
| | |
| Minnesota—0.2% | | | | | |
| | 885,000 | | | Columbia Heights, MN EDA Tax Increment (Huset Park Area Redevel.) | | | 5.375 | | | | 02/15/2032 | | | | 844,502 | |
| | |
| | 610,000 | | | Minneapolis, MN Tax Increment (St. Anthony Falls) | | | 5.750 | | | | 02/01/2027 | | | | 610,244 | |
| | |
| | 965,000 | | | Mound, MN Hsg. & Redevel. Authority (Metroplaines) | | | 5.000 | | | | 02/15/2027 | | | | 969,593 | |
| | |
| | 1,500,000 | | | St. Anthony, MN Hsg. & Redevel. Authority (Silver Lake Village) | | | 5.625 | | | | 02/01/2031 | | | | 1,523,385 | |
| | |
| | 110,000 | | | St. Anthony, MN Hsg. & Redevel. Authority (Silver Lake Village) | | | 5.375 | | | | 08/01/2021 | | | | 113,504 | |
| | |
| | 115,000 | | | St. Paul, MN Port Authority (Great Northern) | | | 6.000 | | | | 03/01/2030 | | | | 116,841 | |
| | | | | | | | | | | | | | | | |
| | | | | | | | | | | | | | | 4,178,069 | |
| | |
| Mississippi—0.1% | | | | | |
| | 85,000 | | | Gulfport, MS Hospital Facility (Memorial Hospital at Gulfport) | | | 5.750 | | | | 07/01/2031 | | | | 85,109 | |
| | |
| | 845,000 | | | Meridian, MS Tax Increment (Meridian Crossroads) | | | 8.750 | | | | 12/01/2024 | | | | 946,129 | |
| | | | | | | | | | | | | | | | |
| | | | | | | | | | | | | | | 1,031,238 | |
| | |
| Missouri—3.0% | | | | | |
| | 200,000 | | | Belton, MO Tax Increment (Belton Town Center) | | | 5.625 | | | | 03/01/2025 | | | | 201,812 �� | |
| | |
| | 250,000 | | | Branson Hills, MO Infrastructure Facilities3 | | | 5.500 | | | | 04/01/2027 | | | | 138,292 | |
| | |
| | 900,000 | | | Branson, MO IDA (Branson Hills Redevel.) | | | 5.750 | | | | 05/01/2026 | | | | 908,937 | |
| | |
| | 365,000 | | | Branson, MO IDA (Branson Hills Redevel.) | | | 7.050 | | | | 05/01/2027 | | | | 367,132 | |
| | |
| | 1,345,000 | | | Branson, MO IDA (Branson Landing) | | | 5.250 | | | | 06/01/2021 | | | | 1,336,809 | |
| | |
| | 7,385,000 | | | Branson, MO IDA (Branson Shoppe Redevel.) | | | 5.950 | | | | 11/01/2029 | | | | 7,492,378 | |
| | |
| | 675,000 | | | Broadway-Fairview, MO Transportation Devel. District (Columbia) | | | 5.875 | | | | 12/01/2031 | | | | 563,193 | |
| | |
| | 400,000 | | | Chillicothe, MO Tax Increment (South U.S. 65) | | | 5.625 | | | | 04/01/2027 | | | | 357,356 | |
| | |
| | 400,000 | | | Chillicothe, MO Tax Increment (South U.S. 65) | | | 5.500 | | | | 04/01/2021 | | | | 386,780 | |
| | |
| | 3,840,000 | | | Hawk Ridge, MO Transportation Devel. District | | | 5.000 | | | | 02/01/2030 | | | | 2,372,390 | |
| | |
| | 435,000 | | | Hawk Ridge, MO Transportation Devel. District | | | 4.650 | | | | 02/01/2017 | | | | 406,442 | |
36 OPPENHEIMER ROCHESTER AMT-FREE MUNICIPAL FUND
| | | | | | | | | | | | | | |
Principal
Amount | | | | | Coupon | | Maturity | | | Value | |
| | |
| Missouri (Continued) | |
| | |
| | $ 14,360,000 | | | Hazelwood, MO Transportation Devel. District (370/Missouri Bottom Road/Tausig Road) | | 7.200 % | | | 05/01/2033 | | | $ | 14,378,094 | |
| | |
| | 2,575,000 | | | Independence, MO 39th Street Transportation | | 6.875 | | | 09/01/2032 | | | | 2,697,003 | |
| | |
| | 445,000 | | | Kansas City, MO Tax Increment (Briarcliff West) | | 5.150 | | | 06/01/2016 | | | | 454,590 | |
| | |
| | 800,000 | | | Kansas City, MO Tax Increment (Shoal Creek Parkway) | | 6.500 | | | 06/01/2025 | | | | 812,312 | |
| | |
| | 1,765,000 | | | Kansas City, MO Tax Increment (Southtown) | | 6.000 | | | 03/01/2017 | | | | 1,894,692 | |
| | |
| | 250,000 | | | Lees Summit, MO IDA (Kensington Farms) | | 5.750 | | | 03/01/2029 | | | | 250,918 | |
| | |
| | 225,000 | | | Lees Summit, MO IDA (Kensington Farms) | | 5.500 | | | 03/01/2021 | | | | 231,053 | |
| | |
| | 790,000 | | | Liberty, MO Tax Increment (Liberty Triangle) | | 5.875 | | | 10/01/2029 | | | | 805,547 | |
| | |
| | 2,100,000 | | | Maplewood, MO Tax (Maplewood South Redevel.) | | 5.750 | | | 11/01/2026 | | | | 2,103,444 | |
| | |
| | 355,000 | | | MO Grindstone Plaza Transportation Devel. District | | 5.500 | | | 10/01/2031 | | | | 296,304 | |
| | |
| | 213,000 | | | Northwoods, MO Transportation Devel. District5 | | 5.850 | | | 02/01/2031 | | | | 190,784 | |
| | |
| | 1,500,000 | | | Osage Beach, MO Tax Increment (Prewitts Point) | | 5.000 | | | 05/01/2023 | | | | 1,500,270 | |
| | |
| | 350,000 | | | Ozark Centre, MO Transportation Devel. District | | 5.375 | | | 09/01/2032 | | | | 349,997 | |
| | |
| | 1,500,000 | | | Raymore, MO Tax Increment | | 5.375 | | | 03/01/2020 | | | | 1,518,180 | |
| | |
| | 2,750,000 | | | Raymore, MO Tax Increment | | 5.625 | | | 03/01/2028 | | | | 2,787,263 | |
| | |
| | 2,500,000 | | | Richmond Heights, MO Tax Increment & Transportation Sales Tax | | 5.625 | | | 11/01/2025 | | | | 2,506,350 | |
| | |
| | 1,060,000 | | | St. Louis, MO IDA (Southtown Redevel.) | | 5.125 | | | 05/01/2026 | | | | 1,060,159 | |
| | |
| | 481,000 | | | St. Louis, MO Tax Increment (1505 Missouri Avenue Redevel.)2 | | 6.000 | | | 08/04/2025 | | | | 243,126 | |
| | |
| | 846,000 | | | St. Louis, MO Tax Increment (1601 Washington Redevel.) | | 6.000 | | | 08/21/2026 | | | | 519,046 | |
| | |
| | 1,879,000 | | | St. Louis, MO Tax Increment (1619 Washington Redevel.) | | 5.500 | | | 03/09/2027 | | | | 1,151,207 | |
| | |
| | 662,000 | | | St. Louis, MO Tax Increment (Pet Building Redevel.) | | 5.500 | | | 05/29/2028 | | | | 414,472 | |
| | |
| | 545,000 | | | St. Louis, MO Tax Increment (Printers Lofts)2 | | 6.000 | | | 08/21/2026 | | | | 251,359 | |
| | |
| | 466,000 | | | St. Louis, MO Tax Increment (Washington East Condominiums) | | 5.500 | | | 01/20/2028 | | | | 306,418 | |
| | |
| | 783,000 | | | St. Louis, MO Tax Increment (Washington East Condominiums) | | 5.500 | | | 01/20/2028 | | | | 695,374 | |
| | |
| | 1,080,000 | | | St. Louis, MO Tax Increment Financing (Ludwig Lofts) | | 6.690 | | | 04/21/2029 | | | | 633,377 | |
| | |
| | 373,000 | | | St. Louis, MO Tax Increment Financing, Series A | | 5.500 | | | 09/02/2028 | | | | 227,131 | |
| | |
| | 3,255,000 | | | St. Louis, MO Tax Increment, Series A | | 6.600 | | | 01/21/2028 | | | | 2,295,166 | |
| | |
| | 620,000 | | | Stone Canyon, MO Improvement District (Infrastructure)3 | | 5.700 | | | 04/01/2022 | | | | 307,284 | |
| | |
| | 320,000 | | | Stone Canyon, MO Improvement District (Infrastructure)3 | | 5.750 | | | 04/01/2027 | | | | 158,598 | |
| | |
| | 510,000 | | | Suemandy, MO Mid-Rivers Community Improvement District | | 7.500 | | | 10/01/2029 | | | | 554,804 | |
| | |
37 OPPENHEIMER ROCHESTER AMT-FREE MUNICIPAL FUND
| | |
| |
| STATEMENT OF INVESTMENTS Continued | | |
| | | | | | | | | | | | | | |
Principal Amount | | | | | Coupon | | Maturity | | | Value | |
| | |
| Missouri (Continued) | |
| | |
| | $ 2,500,000 | | | University Place, MO Transportation Devel. District | | 5.000 % | | | 03/01/2032 | | | $ | 2,504,100 | |
| | | | | | | | | | | | | | |
| | | | | | | | | | | | | 58,629,943 | |
|
| | |
| Montana—0.5% | |
| | 11,710,000 | | | Hardin, MT Tax Increment Industrial Infrastructure Devel. (Rocky Mountain Power) | | 0.000 9 | | | 09/01/2031 | | | | 9,261,908 | |
| | |
| | 375,000 | | | MT Facilities Finance Authority (St. John’s Lutheran) | | 6.000 | | | 05/15/2025 | | | | 385,151 | |
| | | | | | | | | | | | | | |
| | | | | | | | | | | | | 9,647,059 | |
|
| | |
| Nebraska—0.7% | |
| | 7,510,000 | | | NE Central Plains Gas Energy | | 5.250 | | | 09/01/2037 | | | | 8,050,795 | |
| | |
| | 2,915,000 | | | NE Educational Facilities Authority (Midland Lutheran College) | | 5.600 | | | 09/15/2029 | | | | 2,731,151 | |
| | |
| | 1,150,000 | | | NE Educational Finance Authority (Concordia University) | | 5.000 | | | 10/01/2037 | | | | 1,153,278 | |
| | |
| | 2,200,000 | | | Santee Sioux Nation, NE Tribal Health Care (Indian Health Service) | | 8.750 | | | 10/01/2020 | | | | 2,283,996 | |
| | | | | | | | | | | | | | |
| | | | | | | | | | | | | 14,219,220 | |
|
| | |
| Nevada—1.9% | |
| | 260,000 | | | Clark County, NV Improvement District | | 5.050 | | | 02/01/2031 | | | | 218,621 | |
| | |
| | 325,000 | | | Clark County, NV Improvement District | | 5.000 | | | 02/01/2026 | | | | 295,045 | |
| | |
| | 20,000,000 | | | Clark County, NV Water Reclamation District1 | | 5.250 | | | 07/01/2038 | | | | 22,863,000 | |
| | |
| | 5,105,000 | | | Director of the State of NV Dept. of Business & Industry (Las Vegas Monorail)2 | | 6.850 4 | | | 01/01/2019 | | | | 714,292 | |
| | |
| | 5,000 | | | Las Vegas, NV Special Improvement District (Sumerlin Village) | | 5.875 | | | 06/01/2021 | | | | 5,173 | |
| | |
| | 235,000 | | | Mesquite, NV Special Improvement District (Canyon Creek) | | 5.300 | | | 08/01/2018 | | | | 226,911 | |
| | |
| | 75,000 | | | Mesquite, NV Special Improvement District (Canyon Creek) | | 5.200 | | | 08/01/2016 | | | | 73,968 | |
| | |
| | 110,000 | | | Mesquite, NV Special Improvement District (Canyon Creek) | | 5.250 | | | 08/01/2017 | | | | 107,506 | |
| | |
| | 695,000 | | | Mesquite, NV Special Improvement District No. 07-01 (Anthem at Mesquite) | | 6.150 | | | 08/01/2037 | | | | 699,761 | |
| | |
| | 905,000 | | | Mesquite, NV Special Improvement District No. 07-01 (Anthem at Mesquite) | | 6.000 | | | 08/01/2023 | | | | 935,652 | |
| | |
| | 560,000 | | | Mesquite, NV Special Improvement District No. 07-01 (Anthem at Mesquite) | | 5.850 | | | 08/01/2018 | | | | 590,610 | |
| | |
| | 480,000 | | | Mesquite, NV Special Improvement District No. 07-01 (Anthem at Mesquite) | | 6.000 | | | 08/01/2027 | | | | 488,678 | |
| | |
| | 2,160,000 | | | Sparks, NV Redevel. Agency (Redevel Area No. 2) | | 6.400 | | | 06/01/2020 | | | | 2,368,742 | |
| | |
38 OPPENHEIMER ROCHESTER AMT-FREE MUNICIPAL FUND
| | | | | | | | | | | | | | |
Principal Amount | | | | | Coupon | | Maturity | | | Value | |
| | |
| Nevada (Continued) | |
| | |
| | $ 7,420,000 | | | Sparks, NV Redevel. Agency (Redevel Area No. 2) | | 6.700 % | | | 06/01/2028 | | | $ | 7,819,864 | |
| | | | | | | | | | | | | | |
| | | | | | | | | | | | | 37,407,823 | |
|
| | |
| New Hampshire—3.0% | |
| | 305,000 | | | Manchester, NH Hsg. & Redevel. Authority, Series B | | 5.650 4 | | | 01/01/2029 | | | | 95,352 | |
| | |
| | 3,220,000 | | | Manchester, NH Hsg. & Redevel. Authority, Series B | | 5.700 4 | | | 01/01/2030 | | | | 923,174 | |
| | |
| | 1,000,000 | | | Manchester, NH Hsg. & Redevel. Authority, Series B | | 6.750 | | | 01/01/2015 | | | | 999,320 | |
| | |
| | 495,000 | | | Manchester, NH Hsg. & Redevel. Authority, Series B | | 6.000 4 | | | 01/01/2023 | | | | 255,994 | |
| | |
| | 415,000 | | | NH Business Finance Authority (Huggins Hospital) | | 6.875 | | | 10/01/2039 | | | | 441,564 | |
| | |
| | 4,010,000 | | | NH H&EFA (Franklin Pierce College) | | 6.050 | | | 10/01/2034 | | | | 3,561,722 | |
| | |
| | 21,745,000 | | | NH H&EFA (LRG Healthcare)1 | | 5.500 | | | 10/01/2034 | | | | 23,638,990 | |
| | |
| | 475,000 | | | NH H&EFA (LRG Healthcare) | | 5.500 | | | 10/01/2034 | | | | 516,363 | |
| | |
| | 20,860,000 | | | NH H&EFA (LRG Healthcare)1 | | 7.000 | | | 04/01/2038 | | | | 24,319,631 | |
| | |
| | 1,500,000 | | | NH H&EFA (Southern New Hampshire University) | | 5.000 | | | 01/01/2027 | | | | 1,589,970 | |
| | |
| | 40,000 | | | NH H&EFA (St. Joseph Hospital/Youville House/Cove) | | 5.500 | | | 07/01/2034 | | | | 40,102 | |
| | |
| | 1,270,000 | | | NH HE&HFA (Franklin Pierce College) | | 5.300 | | | 10/01/2028 | | | | 1,077,811 | |
| | | | | | | | | | | | | | |
| | | | | | | | | | | | | 57,459,993 | |
|
| | |
| New Jersey—0.2% | |
| | 3,640,000 | | | NJ Tobacco Settlement Financing Corp. | | 5.000 | | | 06/01/2029 | | | | 3,056,617 | |
| | |
| | 250,000 | | | NJ Transportation Trust Fund Authority | | 6.000 | | | 06/15/2035 | | | | 299,688 | |
| | | | | | | | | | | | | | |
| | | | | | | | | | | | | 3,356,305 | |
|
| | |
| New Mexico—0.2% | |
| | 1,495,000 | | | Cabezon, NM Public Improvement District | | 6.300 | | | 09/01/2034 | | | | 1,535,305 | |
| | |
| | 270,000 | | | Montecito Estates, NM Public Improvement District | | 7.000 | | | 10/01/2037 | | | | 278,113 | |
| | |
| | 1,925,000 | | | NM Trails Public Improvement District | | 7.750 | | | 10/01/2038 | | | | 1,878,781 | |
| | | | | | | | | | | | | | |
| | | | | | | | | | | | | 3,692,199 | |
|
| | |
| New York—1.3% | |
| | 380,000 | | | NY Counties Tobacco Trust II (TASC) | | 5.750 | | | 06/01/2043 | | | | 368,277 | |
| | |
| | 3,000,000 | | | NY MTA, Series E | | 5.000 | | | 11/15/2030 | | | | 3,363,600 | |
| | |
| | 9,305,000 | | | NYS DA (St. Mary’s Hospital for Children) | | 7.875 | | | 11/15/2041 | | | | 9,965,283 | |
| | |
| | 5,985,000 | | | Suffolk, NY Tobacco Asset Securitization Corp. | | 5.375 | | | 06/01/2028 | | | | 5,717,411 | |
39 OPPENHEIMER ROCHESTER AMT-FREE MUNICIPAL FUND
| | |
| |
| STATEMENT OF INVESTMENTS Continued | | |
| | | | | | | | | | | | | | |
Principal Amount | | | | | Coupon | | Maturity | | | Value | |
| | |
| New York (Continued) | |
| | |
| | $ 5,255,000 | | | Westchester County, NY Healthcare Corp., Series A | | 5.000 % | | | 11/01/2030 | | | $ | 5,609,870 | |
| | | | | | | | | | | | | | |
| | | | | | | | | | | | | 25,024,441 | |
|
| | |
| North Carolina—0.0% | |
| | 20,000 | | | NC Medical Care Commission (AHACHC) | | 5.800 | | | 10/01/2034 | | | | 20,286 | |
|
| | |
| Ohio—8.1% | |
| | 2,250,000 | | | Bowling Green, OH Student Hsg. (CFP I-Bowling Green State University) | | 6.000 | | | 06/01/2045 | | | | 2,356,088 | |
| | |
| | 3,440,000 | | | Bowling Green, OH Student Hsg. (CFP I-Bowling Green State University) | | 5.750 | | | 06/01/2031 | | | | 3,619,499 | |
| | |
| | 6,500,000 | | | Buckeye, OH Tobacco Settlement Financing Authority (TASC) | | 6.250 | | | 06/01/2037 | | | | 5,408,585 | |
| | |
| | 22,380,000 | | | Buckeye, OH Tobacco Settlement Financing Authority (TASC) | | 6.000 | | | 06/01/2042 | | | | 17,763,454 | |
| | |
| | 743,000,000 | | | Buckeye, OH Tobacco Settlement Financing Authority (TASC) | | 7.501 4 | | | 06/01/2052 | | | | 7,920,380 | |
| | |
| | 970,100,000 | | | Buckeye, OH Tobacco Settlement Financing Authority (TASC) | | 7.251 4 | | | 06/01/2047 | | | | 58,477,628 | |
| | |
| | 11,460,000 | | | Buckeye, OH Tobacco Settlement Financing Authority (TASC) | | 5.125 | | | 06/01/2024 | | | | 9,603,251 | |
| | |
| | 2,555,000 | | | Buckeye, OH Tobacco Settlement Financing Authority (TASC) | | 5.375 | | | 06/01/2024 | | | | 2,169,093 | |
| | |
| | 8,820,000 | | | Buckeye, OH Tobacco Settlement Financing Authority (TASC) | | 5.750 | | | 06/01/2034 | | | | 7,038,360 | |
| | |
| | 20,360,000 | | | Buckeye, OH Tobacco Settlement Financing Authority (TASC) | | 5.875 | | | 06/01/2030 | | | | 16,574,058 | |
| | |
| | 2,165,000 | | | Centerville, OH Health Care (Bethany Lutheran Village) | | 6.000 | | | 11/01/2038 | | | | 2,214,665 | |
| | |
| | 110,000 | | | Cleveland, OH Rock Glen Hsg. Assistance Corp. (Ambleside Apartments) | | 7.000 | | | 06/01/2018 | | | | 110,341 | |
| | |
| | 3,445,000 | | | Cleveland-Cuyahoga County, OH Port Authority | | 6.000 | | | 11/15/2035 | | | | 3,876,486 | |
| | |
| | 10,000 | | | Cuyahoga County, OH Hospital (Metro Health System) | | 5.500 | | | 02/15/2027 | | | | 10,011 | |
| | |
| | 295,000 | | | Glenwillow Village, OH GO | | 5.875 | | | 12/01/2024 | | | | 297,218 | |
| | |
| | 1,310,000 | | | Greene County, OH University Hsg. (Central State University) | | 5.625 | | | 09/01/2032 | | | | 1,235,487 | |
| | |
| | 1,000,000 | | | Greene County, OH University Hsg. (Central State University) | | 5.500 | | | 09/01/2027 | | | | 963,830 | |
| | |
| | 2,500,000 | | | Grove City, OH Tax Increment Financing | | 5.375 | | | 12/01/2031 | | | | 2,549,900 | |
| | |
| | 270,000 | | | Grove City, OH Tax Increment Financing | | 5.125 | | | 12/01/2016 | | | | 291,349 | |
| | |
| | 805,000 | | | Jeffrey Place, OH New Community Authority (Jeffrey Place Redevel.) | | 5.000 | | | 12/01/2022 | | | | 816,455 | |
| | |
| | 4,015,000 | | | OH Higher Education Facility Commission (Ashland University) | | 6.250 | | | 09/01/2024 | | | | 3,827,339 | |
| | |
| | 5,860,000 | | | Port of Greater Cincinnati, OH Devel. Authority (Public Parking Infrastructure) | | 6.400 | | | 02/15/2034 | | | | 4,110,790 | |
| | |
| | 2,475,000 | | | Port of Greater Cincinnati, OH Devel. Authority (Public Parking Infrastructure) | | 6.300 | | | 02/15/2024 | | | | 1,736,015 | |
40 OPPENHEIMER ROCHESTER AMT-FREE MUNICIPAL FUND
| | | | | | | | | | | | | | |
Principal Amount | | | | | Coupon | | Maturity | | | Value | |
| | |
| Ohio (Continued) | |
| | |
| | $ 4,065,000 | | | Portage County, OH Port Authority (Northeast Ohio Medical University) | | 5.000 % | | | 12/01/2037 | | | $ | 4,190,934 | |
| | |
| | 510,000 | | | Ross County, OH Hospital (Adena Health System) | | 5.750 | | | 12/01/2028 | | | | 561,556 | |
| | |
| | 645,000 | | | Toledo-Lucas County, OH Port Authority (Town Square at Levis Commons) | | 5.400 | | | 11/01/2036 | | | | 321,216 | |
| | | | | | | | | | | | | | |
| | | | | | | | | | | | | 158,043,988 | |
|
| | |
| Oklahoma—0.7% | |
| | 13,055,000 | | | Grady County, OK Criminal Justice Authority | | 7.000 | | | 11/01/2041 | | | | 12,316,871 | |
| | |
| | 770,000 | | | Langston, OK EDA (Langston University) | | 5.250 | | | 05/01/2026 | | | | 782,543 | |
| | | | | | | | | | | | | | |
| | | | | | | | | | | | | 13,099,414 | |
| | |
| Oregon—0.0% | |
| | 500,000 | | | OR Facilities Authority (Concordia University) | | 6.375 | | | 09/01/2040 | | | | 533,540 | |
| | |
| | 340,000 | | | OR Facilities Authority (Concordia University) | | 6.125 | | | 09/01/2030 | | | | 358,591 | |
| | | | | | | | | | | | | | |
| | | | | | | | | | | | | 892,131 | |
|
| | |
| Pennsylvania—1.0% | |
| | 500,000 | | | Luzerne County, PA IDA | | 7.750 | | | 12/15/2027 | | | | 513,550 | |
| | |
| | 495,000 | | | Luzerne County, PA IDA | | 7.500 | | | 12/15/2019 | | | | 507,420 | |
| | |
| | 25,000 | | | Northumberland County, PA IDA (NHS Youth Services) | | 5.500 | | | 02/15/2033 | | | | 18,952 | |
| | |
| | 3,225,000 | | | Northumberland County, PA IDA (NHS Youth Services) | | 7.750 | | | 02/15/2029 | | | | 2,376,470 | |
| | |
| | 2,000,000 | | | PA HEFA (Shippensburg University) | | 6.250 | | | 10/01/2043 | | | | 2,194,080 | |
| | |
| | 3,000,000 | | | PA Public School Building Authority (School District of Philadelphia) | | 5.000 | | | 04/01/2030 | | | | 3,228,030 | |
| | |
| | 5,000,000 | | | PA Public School Building Authority (School District of Philadelphia) | | 5.000 | | | 04/01/2031 | | | | 5,342,400 | |
| | |
| | 685,000 | | | Philadelphia, PA Authority for Industrial Devel. (Architecture & Design Charter School) | | 6.125 | | | 03/15/2043 | | | | 699,885 | |
| | |
| | 920,000 | | | Philadelphia, PA H&HEFA (Centralized Comprehensive Human Services) | | 7.250 | | | 01/01/2021 | | | | 929,706 | |
| | |
| | 3,500,000 | | | Philadelphia, PA School District | | 6.000 | | | 09/01/2038 | | | | 3,833,676 | |
| | | | | | | | | | | | | | |
| | | | | | | | | | | | | 19,644,169 | |
|
| | |
| Rhode Island—1.0% | |
| | 4,915,000 | | | Central Falls, RI Detention Facility2 | | 7.250 | | | 07/15/2035 | | | | 2,943,839 | |
| | |
| | 50,000 | | | Providence, RI HDC (Barbara Jordan Apartments) | | 6.750 | | | 07/01/2025 | | | | 50,137 | |
| | |
| | 13,600,000 | | | RI Health & Educational Building Corp. (EPBH/RIH/TMH Obligated Group) | | 7.000 | | | 05/15/2039 | | | | 15,584,240 | |
| | |
| | 725,000 | | | RI Health & Educational Building Corp. (EPBH/RIH/TMH Obligated Group) | | 7.000 | | | 05/15/2039 | | | | 805,200 | |
| | |
| | 20,000 | | | RI Hsg. & Mtg. Finance Corp. (Homeownership Opportunity) | | 6.500 | | | 04/01/2027 | | | | 20,257 | |
| | |
| | 10,375,000 | | | RI Tobacco Settlement Financing Corp. (TASC) | | 6.750 4 | | | 06/01/2052 | | | | 81,332 | |
41 OPPENHEIMER ROCHESTER AMT-FREE MUNICIPAL FUND
| | |
| |
| STATEMENT OF INVESTMENTS Continued | | |
| | | | | | | | | | | | | | |
Principal Amount | | | | | Coupon | | Maturity | | | Value | |
| | |
| Rhode Island (Continued) | |
| | |
| | $ 33,305,000 | | | RI Tobacco Settlement Financing Corp. (TASC) | | 6.125 %4 | | | 06/01/2052 | | | $ | 352,700 | |
| | | | | | | | | | | | | | |
| | | | | | | | | | | | | 19,837,705 | |
|
| | |
| South Carolina—0.8% | |
| | 500,000 | | | Allendale County, SC School District Energy Savings Special Obligation | | 8.500 | | | 12/01/2018 | | | | 505,080 | |
| | |
| | 1,735,000 | | | Lancaster County, SC (Sun City Carolina Lakes) | | 5.450 | | | 12/01/2037 | | | | 1,744,647 | |
| | |
| | 5,448,000 | | | Richland County, SC Assessment Revenue (Village at Sandhill Improvement District) | | 6.200 | | | 11/01/2036 | | | | 5,214,335 | |
| | |
| | 6,565,000 | | | SC Connector 2000 Assoc. Toll Road, Series B | | 3.156 4 | | | 01/01/2021 | | | | 1,306,238 | |
| | |
| | 600,000 | | | SC Connector 2000 Assoc. Toll Road, Series B | | 2.746 4 | | | 01/01/2020 | | | | 126,396 | |
| | |
| | 11,240,000 | | | SC Connector 2000 Assoc. Toll Road, Series B | | 3.746 4 | | | 01/01/2026 | | | | 1,628,564 | |
| | |
| | 2,500,000 | | | SC Jobs-EDA (Coastal Hsg. Foundation) | | 6.250 | | | 04/01/2035 | | | | 2,847,025 | |
| | |
| | 2,000,000 | | | SC Jobs-EDA (Coastal Hsg. Foundation) | | 6.500 | | | 04/01/2042 | | | | 2,295,340 | |
| | |
| | 15,000 | | | SC Jobs-EDA (Myrtle Beach Convention) | | 5.250 | | | 04/01/2036 | | | | 15,009 | |
| | | | | | | | | | | | | | |
| | | | | | | | | | | | | 15,682,634 | |
|
| | |
| South Dakota—0.0% | |
| | 500,000 | | | SD Educational Enhancement Funding Corp. Tobacco Settlement | | 5.000 | | | 06/01/2027 | | | | 546,215 | |
|
| | |
| Tennessee—0.6% | |
| | 115,000 | | | Johnson City, TN H&EFB (Johnson City Medical Center) | | 5.250 | | | 07/01/2028 | | | | 115,256 | |
| | |
| | 500,000 | | | Metropolitan Government Nashville & Davidson Counties, TN H&EFB (Belmont University) | | 5.000 | | | 11/01/2027 | | | | 547,965 | |
| | |
| | 10,665,000 | | | TN Energy Acquisition Gas Corp. | | 5.000 | | | 02/01/2027 | | | | 11,861,613 | |
| | | | | | | | | | | | | | |
| | | | | | | | | | | | | 12,524,834 | |
|
| | |
| Texas—5.2% | |
| | 60,000 | | | Collin County, TX HFC (Community College District Foundation) | | 5.250 | | | 06/01/2031 | | | | 52,110 | |
| | |
| | 4,000,000 | | | Dallas-Fort Worth, TX International Airport | | 5.000 | | | 11/01/2038 | | | | 4,332,560 | |
| | |
| | 700,000 | | | Danbury, TX Higher Education Finance Corp. (Island Foundation) | | 6.250 | | | 02/15/2036 | | | | 700,028 | |
| | |
| | 7,450,000 | | | Donna, TX GO | | 6.250 | | | 02/15/2037 | | | | 7,029,671 | |
| | |
| | 4,957,000 | | | Escondido, TX Public Improvement District (Horseshoe Bay) | | 7.250 | | | 10/01/2033 | | | | 4,895,731 | |
| | |
| | 45,000 | | | Harris County-Houston, TX Sports Authority | | 5.000 | | | 11/15/2025 | | | | 45,020 | |
| | |
| | 16,000,000 | | | Houston, TX Airport System, Series A1 | | 5.500 | | | 07/01/2039 | | | | 18,118,880 | |
| | |
| | 300,000 | | | Houston, TX Higher Education Finance Corp. (Cosmos Foundation) | | 6.500 | | | 05/15/2031 | | | | 351,960 | |
| | |
| | 250,000 | | | Houston, TX Higher Education Finance Corp. (Ninos) | | 6.000 | | | 08/15/2036 | | | | 268,403 | |
| | |
| | 250,000 | | | Houston, TX Higher Education Finance Corp. (Ninos) | | 6.000 | | | 08/15/2041 | | | | 266,910 | |
| | |
| | 7,465,000 | | | Irving, TX Hotel Occupancy | | 5.500 | | | 08/15/2038 | | | | 7,803,165 | |
| | |
| | 2,900,000 | | | Lufkin, TX Health Facilities Devel. Corp. (Memorial Health System of East Texas) | | 6.250 | | | 02/15/2037 | | | | 3,187,274 | |
| | |
| | 700,000 | | | Maverick County, TX GO COP | | 8.750 | | | 03/01/2034 | | | | 676,641 | |
| | |
| | 2,350,000 | | | Maverick County, TX GO COP | | 8.750 | | | 03/01/2034 | | | | 2,271,581 | |
42 OPPENHEIMER ROCHESTER AMT-FREE MUNICIPAL FUND
| | | | | | | | | | | | | | |
Principal Amount | | | | | Coupon | | Maturity | | | Value | |
| | |
| Texas (Continued) | |
| | |
| | $ 8,440,000 | | | McLennan County, TX Public Facility Corp. | | 6.625 % | | | 06/01/2035 | | | $ | 8,934,162 | |
| | |
| | 780,000 | | | New Hope, TX Educational Facilities Finance Corp. Student Hsg. (Stephenville-Tarleton State University) | | 6.000 | | | 04/01/2045 | | | | 869,903 | |
| | |
| | 555,000 | | | New Hope, TX Educational Facilities Finance Corp. Student Hsg. (Stephenville-Tarleton State University) | | 5.875 | | | 04/01/2036 | | | | 617,820 | |
| | |
| | 700,000 | | | Newark, TX Cultural Education Facilities Finance Corp. (A.W. Brown Fellowship Charter School) | | 6.000 | | | 08/15/2042 | | | | 725,865 | |
| | |
| | 3,695,000 | | | Sabine River, TX Authority Pollution Control (TXU Electric Company)3 | | 6.150 | | | 08/01/2022 | | | | 341,788 | |
| | |
| | 16,000,000 | | | Tarrant County, TX Cultural Education Facilities Finance Corp. (Baylor Health Care System)1 | | 6.250 | | | 11/15/2029 | | | | 18,544,320 | |
| | |
| | 6,631,000 | | | Trophy Club, TX Public Improvement (Highlands Trophy Club) | | 7.750 | | | 10/01/2037 | | | | 7,201,133 | |
| | |
| | 485,000 | | | TX Dormitory Finance Authority (Temple Junior College Foundation) | | 6.000 | | | 09/01/2033 | | | | 375,589 | |
| | |
| | 110,000 | | | TX Dormitory Finance Authority (Temple Junior College Foundation) | | 5.750 | | | 09/01/2027 | | | | 88,685 | |
| | |
| | 4,500,000 | | | TX Municipal Gas Acquisition & Supply Corp. | | 6.250 | | | 12/15/2026 | | | | 5,465,520 | |
| | |
| | 1,700,000 | | | TX Public Finance Authority Charter School Finance Corp. (Cosmos Foundation) | | 6.000 | | | 02/15/2030 | | | | 1,885,504 | |
| | |
| | 660,000 | | | TX Public Finance Authority Charter School Finance Corp. (Ed-Burnham Wood) | | 6.250 | | | 09/01/2036 | | | | 671,101 | |
| | |
| | 1,085,000 | | | TX Public Finance Authority Charter School Finance Corp. (New Fontiers School) | | 5.800 | | | 08/15/2040 | | | | 1,163,695 | |
| | |
| | 18,750,000 | | | TX Turnpike Authority (Central TX Turnpike System) | | 6.590 4 | | | 08/15/2037 | | | | 4,698,750 | |
| | |
| | 100,000 | | | Williamson County, TX | | 5.125 | | | 02/15/2034 | | | | 100,381 | |
| | | | | | | | | | | | | | |
| | | | | | | | | | | | | 101,684,150 | |
|
| | |
| Utah—0.3% | |
| | 2,330,000 | | | Utah County, UT Charter School (Lakeview Academy) | | 5.250 | | | 07/15/2043 | | | | 2,349,572 | |
| | |
| | 2,315,000 | | | Utah County, UT Charter School (Lakeview Academy) | | 5.625 | | | 07/15/2037 | | | | 2,364,425 | |
| | |
| | 500,000 | | | Utah County, UT Charter School (Lakeview Academy) | | 5.000 | | | 07/15/2032 | | | | 503,535 | |
| | |
| | 275,000 | | | Utah County, UT Charter School (Renaissance Academy) | | 5.625 | | | 07/15/2037 | | | | 264,545 | |
| | |
| | 1,210,000 | | | West Valley City, UT Sewer (East Hollywood High School) | | 5.625 | | | 06/15/2037 | | | | 1,074,226 | |
| | | | | | | | | | | | | | |
| | | | | | | | | | | | | 6,556,303 | |
|
| | |
| Vermont—0.1% | |
| | 445,000 | | | Burlington, VT GO | | 5.000 | | | 11/01/2032 | | | | 459,387 | |
| | |
| | 350,000 | | | Burlington, VT GO | | 5.000 | | | 11/01/2027 | | | | 367,958 | |
43 OPPENHEIMER ROCHESTER AMT-FREE MUNICIPAL FUND
| | |
| |
| STATEMENT OF INVESTMENTS Continued | | |
| | | | | | | | | | | | | | |
Principal Amount | | | | | Coupon | | Maturity | | | Value | |
| | |
| Vermont (Continued) | |
| | |
| | $ 471,322 | | | VT Educational & Health Buildings Financing Agency (Marlboro College) | | 2.779 % | | | 04/01/2019 | | | $ | 460,364 | |
| | | | | | | | | | | | | | |
| | | | | | | | | | | | | 1,287,709 | |
|
| | |
| Virginia—1.1% | |
| | 825,000 | | | Buena Vista, VA Public Recreational Facilities Authority (Golf Course) | | 5.500 | | | 07/15/2035 | | | | 644,614 | |
| | |
| | 2,040,000 | | | Buena Vista, VA Public Recreational Facilities Authority (Golf Course) | | 5.250 | | | 07/15/2025 | | | | 1,741,976 | |
| | |
| | 425,000 | | | Celebrate, VA North Community Devel. Authority Special Assessment2 | | 6.750 | | | 03/01/2034 | | | | 274,418 | |
| | |
| | 3,000,000 | | | Farms New Kent, VA Community Devel. Authority Special Assessment3 | | 5.450 | | | 03/01/2036 | | | | 1,589,220 | |
| | |
| | 371,000 | | | Farms New Kent, VA Community Devel. Authority Special Assessment2 | | 5.125 | | | 03/01/2036 | | | | 196,775 | |
| | |
| | 750,000 | | | Farms New Kent, VA Community Devel. Authority Special Assessment2 | | 5.800 | | | 03/01/2036 | | | | 396,832 | |
| | |
| | 25,000 | | | Greensville County, VA IDA (Georgia-Pacific Corp.) | | 5.300 | | | 08/01/2014 | | | | 25,000 | |
| | |
| | 345,000 | | | Manassas Park, VA Economic Devel. Authority | | 6.000 | | | 07/15/2035 | | | | 382,105 | |
| | |
| | 900,000 | | | New Port, VA CDA | | 5.600 | | | 09/01/2036 | | | | 567,900 | |
| | |
| | 3,375,000 | | | Peninsula, VA Town Center Community Devel. Authority Special Obligation | | 6.450 | | | 09/01/2037 | | | | 3,644,190 | |
| | |
| | 2,630,000 | | | Stafford County & Staunton, VA IDA (Virginia Municipal League/Mt. Rogers)5 | | 6.500 | | | 08/01/2038 | | | | 2,633,261 | |
| | |
| | 675,000 | | | Suffolk, VA IDA (Lake Prince Center) | | 5.300 | | | 09/01/2031 | | | | 676,944 | |
| | |
| | 3,500,000 | | | VA Celebrate South CDA Special Assessment3 | | 6.250 | | | 03/01/2037 | | | | 2,038,295 | |
| | |
| | 2,000,000 | | | VA College Building Authority (Regent University) | | 5.000 | | | 06/01/2029 | | | | 2,032,420 | |
| | |
| | 950,000 | | | VA College Building Authority (Regent University) | | 5.000 | | | 06/01/2026 | | | | 971,138 | |
| | |
| | 585,000 | | | VA College Building Authority Educational Facilities (Regent University) | | 5.000 | | | 06/01/2036 | | | | 590,979 | |
| | |
| | 35,170,000 | | | VA Tobacco Settlement Authority | | 4.785 4 | | | 06/01/2047 | | | | 783,939 | |
| | |
| | 162,770,000 | | | VA Tobacco Settlement Authority | | 4.869 4 | | | 06/01/2047 | | | | 2,713,376 | |
| | | | | | | | | | | | | | |
| | | | | | | | | | | | | 21,903,382 | |
|
| | |
| Washington—3.6% | |
| | 4,145,000 | | | Bremerton, WA Hsg. Authority | | 5.500 | | | 06/01/2037 | | | | 4,141,974 | |
| | |
| | 1,000,000 | | | Bremerton, WA Hsg. Authority | | 5.300 | | | 06/01/2026 | | | | 1,002,270 | |
| | |
| | 75,000 | | | Kelso County, WA Hsg. Authority (Chinook & Columbia Apartments) | | 5.600 | | | 03/01/2028 | | | | 74,993 | |
| | |
| | 25,000 | | | Pierce County, WA Hsg. Authority | | 5.800 | | | 12/01/2023 | | | | 25,001 | |
| | |
| | 1,410,000 | | | Seattle, WA Hsg. Authority (Gamelin House & Genesee) | | 5.700 | | | 11/01/2035 | | | | 1,420,505 | |
| | |
| | 3,000,000 | | | Tacoma, WA Consolidated Local Improvements District No. 65 | | 5.750 | | | 04/01/2043 | | | | 3,009,510 | |
| | |
| | 3,920,000 | | | Vancouver, WA Hsg. Authority (Springbrook Village Apartments) | | 5.000 | | | 03/01/2025 | | | | 4,172,879 | |
44 OPPENHEIMER ROCHESTER AMT-FREE MUNICIPAL FUND
| | | | | | | | | | | | | | |
Principal Amount | | | | | Coupon | | Maturity | | | Value | |
| | |
| Washington (Continued) | |
| | |
| | $ 80,000 | | | Vancouver, WA Hsg. Authority (Springbrook Village Apartments) | | 5.000 % | | | 03/01/2025 | | | $ | 94,279 | |
| | |
| | 33,785,000 | | | WA Health Care Facilities Authority (Catholic Health Initiatives)1 | | 6.375 | | | 10/01/2036 | | | | 39,018,156 | |
| | |
| | 15,000,000 | | | WA Health Care Facilities Authority (Providence Health System-Washington)1 | | 5.250 | | | 10/01/2033 | | | | 16,885,650 | |
| | |
| | 25,000 | | | White Salmon, WA Water & Sewer | | 6.000 | | | 07/01/2015 | | | | 25,097 | |
| | | | | | | | | | | | | | |
| | | | | | | | | | | | | 69,870,314 | |
| | |
| West Virginia—0.2% | | | | | |
| | 1,885,000 | | | Brooke County, WV (Bethany College) | | 6.750 | | | 10/01/2037 | | | | 2,107,242 | |
| | |
| | 960,000 | | | Brooke County, WV (Bethany College) | | 6.500 | | | 10/01/2031 | | | | 1,062,470 | |
| | | | | | | | | | | | | | |
| | | | | | | | | | | | | 3,169,712 | |
|
| | |
| Wisconsin—1.8% | | | | | |
| | 1,750,000 | | | Sokaogon, WI Chippewa Community (Gaming)3 | | 7.000 | | | 01/01/2026 | | | | 782,355 | |
| | |
| | 2,495,000 | | | WI Center District, Series A | | 5.000 | | | 12/15/2030 | | | | 2,752,085 | |
| | |
| | 1,475,000 | | | WI Center District, Series A | | 5.000 | | | 12/15/2029 | | | | 1,633,740 | |
| | |
| | 5,000,000 | | | WI GO | | 6.000 | | | 05/01/2036 | | | | 5,905,650 | |
| | |
| | 1,230,000 | | | WI H&EFA (Beloit College) | | 6.125 | | | 06/01/2035 | | | | 1,356,641 | |
| | |
| | 750,000 | | | WI H&EFA (Beloit College) | | 6.125 | | | 06/01/2039 | | | | 821,925 | |
| | |
| | 1,305,000 | | | WI H&EFA (Richland Hospital) | | 5.375 | | | 06/01/2028 | | | | 1,305,822 | |
| | |
| | 17,260,000 | | | WI H&EFA (SSM Health Care Corp.) | | 5.250 | | | 06/01/2034 | | | | 18,609,042 | |
| | |
| | 200,000 | | | WI Public Finance Authority (Las Ventanas Retirement Community) | | 36.060 4 | | | 10/01/2042 | | | | 2 | |
| | |
| | 465,000 | | | WI Public Finance Authority (Las Ventanas Retirement Community) | | 7.000 | | | 10/01/2042 | | | | 451,059 | |
| | |
| | 200,000 | | | WI Public Finance Authority (Las Ventanas Retirement Community) | | 0.181 4 | | | 10/01/2042 | | | | 62,708 | |
| | |
| | 650,000 | | | WI Public Finance Authority (Thomas Jefferson Classical Academy) | | 7.125 | | | 07/01/2042 | | | | 718,893 | |
| | |
| | 500,000 | | | WI Public Finance Authority Charter School (Explore Knowledge Foundation) | | 5.750 | | | 07/15/2032 | | | | 519,365 | |
| | |
| | 350,000 | | | WI Public Finance Authority Charter School (Explore Knowledge Foundation) | | 6.000 | | | 07/15/2042 | | | | 364,801 | |
| | | | | | | | | | | | | | |
| | | | | | | | | | | | | 35,284,088 | |
|
| | |
| U.S. Possessions—11.5% | | | | | |
| | 7,315,000 | | | Puerto Rico Aqueduct & Sewer Authority | | 5.000 | | | 07/01/2033 | | | | 5,003,167 | |
| | |
| | 1,885,000 | | | Puerto Rico Aqueduct & Sewer Authority | | 5.250 | | | 07/01/2029 | | | | 1,317,521 | |
| | |
| | 1,925,000 | | | Puerto Rico Aqueduct & Sewer Authority | | 6.000 | | | 07/01/2047 | | | | 1,355,315 | |
| | |
| | 5,400,000 | | | Puerto Rico Aqueduct & Sewer Authority | | 5.750 | | | 07/01/2037 | | | | 3,808,620 | |
| | |
| | 11,360,000 | | | Puerto Rico Children’s Trust Fund (TASC) | | 5.500 | | | 05/15/2039 | | | | 9,863,888 | |
| | |
| | 3,000,000 | | | Puerto Rico Commonwealth GO | | 6.000 | | | 07/01/2040 | | | | 2,262,600 | |
| | |
| | 2,000,000 | | | Puerto Rico Commonwealth GO | | 6.000 | | | 07/01/2039 | | | | 1,513,280 | |
| | |
| | 9,000,000 | | | Puerto Rico Commonwealth GO | | 5.750 | | | 07/01/2036 | | | | 6,809,940 | |
| | |
| | 4,000,000 | | | Puerto Rico Commonwealth GO | | 5.625 | | | 07/01/2033 | | | | 2,971,160 | |
| | |
| | 1,250,000 | | | Puerto Rico Commonwealth GO | | 5.375 | | | 07/01/2030 | | | | 937,925 | |
| | |
| | 5,000,000 | | | Puerto Rico Commonwealth GO | | 6.500 | | | 07/01/2037 | | | | 3,883,150 | |
45 OPPENHEIMER ROCHESTER AMT-FREE MUNICIPAL FUND
| | |
| |
| STATEMENT OF INVESTMENTS Continued | | |
| | | | | | | | | | | | | | |
Principal Amount | | | | | Coupon | | Maturity | | | Value | |
| | |
| U.S. Possessions (Continued) | |
| | |
| | $ 1,500,000 | | | Puerto Rico Commonwealth GO | | 5.500 % | | | 07/01/2026 | | | $ | 1,151,460 | |
| | |
| | 5,000,000 | | | Puerto Rico Commonwealth GO | | 5.750 | | | 07/01/2028 | | | | 3,857,650 | |
| | |
| | 500,000 | | | Puerto Rico Commonwealth GO | | 5.500 | | | 07/01/2021 | | | | 507,555 | |
| | |
| | 3,000,000 | | | Puerto Rico Commonwealth GO | | 5.250 | | | 07/01/2023 | | | | 2,298,120 | |
| | |
| | 4,210,000 | | | Puerto Rico Commonwealth GO | | 5.500 | | | 07/01/2039 | | | | 3,117,673 | |
| | |
| | 2,610,000 | | | Puerto Rico Commonwealth GO | | 5.000 | | | 07/01/2023 | | | | 2,006,646 | |
| | |
| | 3,000,000 | | | Puerto Rico Commonwealth GO | | 5.125 | | | 07/01/2028 | | | | 2,244,870 | |
| | |
| | 4,020,000 | | | Puerto Rico Commonwealth GO | | 5.250 | | | 07/01/2030 | | | | 2,982,277 | |
| | |
| | 4,515,000 | | | Puerto Rico Commonwealth GO | | 5.000 | | | 07/01/2020 | | | | 3,672,275 | |
| | |
| | 5,000,000 | | | Puerto Rico Electric Power Authority, Series A | | 6.750 | | | 07/01/2036 | | | | 2,466,150 | |
| | |
| | 20,460,000 | | | Puerto Rico Electric Power Authority, Series A | | 5.000 | | | 07/01/2029 | | | | 9,990,004 | |
| | |
| | 2,830,000 | | | Puerto Rico Electric Power Authority, Series AAA | | 5.250 | | | 07/01/2028 | | | | 1,381,719 | |
| | |
| | 3,000,000 | | | Puerto Rico Electric Power Authority, Series CCC | | 5.250 | | | 07/01/2027 | | | | 1,464,690 | |
| | |
| | 1,850,000 | | | Puerto Rico Electric Power Authority, Series CCC | | 5.000 | | | 07/01/2022 | | | | 902,874 | |
| | |
| | 2,500,000 | | | Puerto Rico Electric Power Authority, Series CCC | | 5.000 | | | 07/01/2028 | | | | 1,220,700 | |
| | |
| | 260,000 | | | Puerto Rico Electric Power Authority, Series RR | | 5.000 | | | 07/01/2024 | | | | 248,620 | |
| | |
| | 4,000,000 | | | Puerto Rico Electric Power Authority, Series SS | | 5.000 | | | 07/01/2025 | | | | 3,780,760 | |
| | |
| | 3,000,000 | | | Puerto Rico Electric Power Authority, Series TT | | 5.000 | | | 07/01/2026 | | | | 1,464,600 | |
| | |
| | 5,000,000 | | | Puerto Rico Electric Power Authority, Series TT | | 5.000 | | | 07/01/2037 | | | | 2,442,150 | |
| | |
| | 4,500,000 | | | Puerto Rico Electric Power Authority, Series TT | | 5.000 | | | 07/01/2032 | | | | 2,197,575 | |
| | |
| | 1,690,000 | | | Puerto Rico Electric Power Authority, Series VV | | 5.250 | | | 07/01/2025 | | | | 1,631,391 | |
| | |
| | 1,500,000 | | | Puerto Rico Electric Power Authority, Series VV | | 5.500 | | | 07/01/2020 | | | | 733,770 | |
| | |
| | 1,985,000 | | | Puerto Rico Electric Power Authority, Series WW | | 5.250 | | | 07/01/2025 | | | | 968,998 | |
| | |
| | 5,000,000 | | | Puerto Rico Electric Power Authority, Series WW | | 5.500 | | | 07/01/2020 | | | | 2,445,900 | |
| | |
| | 5,000,000 | | | Puerto Rico Electric Power Authority, Series WW | | 5.500 | | | 07/01/2021 | | | | 2,439,850 | |
| | |
| | 2,750,000 | | | Puerto Rico Electric Power Authority, Series WW | | 5.375 | | | 07/01/2023 | | | | 1,342,220 | |
| | |
| | 3,050,000 | | | Puerto Rico Electric Power Authority, Series WW | | 5.500 | | | 07/01/2038 | | | | 1,489,468 | |
| | |
| | 2,000,000 | | | Puerto Rico Electric Power Authority, Series WW | | 5.000 | | | 07/01/2028 | | | | 976,560 | |
| | |
| | 1,670,000 | | | Puerto Rico Electric Power Authority, Series XX | | 5.250 | | | 07/01/2040 | | | | 815,645 | |
| | |
| | 410,000 | | | Puerto Rico Electric Power Authority, Series ZZ | | 5.250 | | | 07/01/2022 | | | | 200,092 | |
| | |
| | 7,300,000 | | | Puerto Rico Electric Power Authority, Series ZZ | | 5.250 | | | 07/01/2024 | | | | 3,563,276 | |
| | |
| | 40,000 | | | Puerto Rico Highway & Transportation Authority | | 5.000 | | | 07/01/2022 | | | | 23,431 | |
| | |
| | 3,000,000 | | | Puerto Rico Highway & Transportation Authority, Series L | | 5.250 | | | 07/01/2038 | | | | 2,552,670 | |
| | |
| | 3,500,000 | | | Puerto Rico Highway & Transportation Authority, Series M | | 5.000 | | | 07/01/2046 | | | | 1,599,885 | |
| | |
| | 65,000 | | | Puerto Rico Infrastructure | | 5.000 | | | 07/01/2041 | | | | 34,608 | |
| | |
| | 850,000 | | | Puerto Rico Infrastructure | | 5.500 | | | 07/01/2024 | | | | 568,726 | |
| | |
| | 8,000,000 | | | Puerto Rico Infrastructure | | 7.075 4 | | | 07/01/2030 | | | | 1,585,200 | |
| | |
| | 750,000 | | | Puerto Rico Infrastructure Financing Authority | | 5.500 | | | 07/01/2028 | | | | 494,287 | |
| | |
| | 8,695,000 | | | Puerto Rico Infrastructure Financing Authority | | 6.070 4 | | | 07/01/2031 | | | | 1,682,135 | |
| | |
| | 1,230,000 | | | Puerto Rico ITEMECF (Polytechnic University) | | 5.000 | | | 08/01/2032 | | | | 926,965 | |
| | |
| | 8,575,000 | | | Puerto Rico Public Buildings Authority | | 6.250 | | | 07/01/2026 | | | | 6,442,483 | |
| | |
| | 3,300,000 | | | Puerto Rico Public Buildings Authority | | 5.000 | | | 07/01/2032 | | | | 2,248,587 | |
| | |
| | 2,000,000 | | | Puerto Rico Public Buildings Authority | | 6.000 | | | 07/01/2041 | | | | 1,406,100 | |
| | |
| | 1,000,000 | | | Puerto Rico Public Buildings Authority | | 6.250 | | | 07/01/2031 | | | | 741,520 | |
| | |
| | 4,940,000 | | | Puerto Rico Public Buildings Authority | | 5.375 | | | 07/01/2033 | | | | 3,416,455 | |
| | |
| | 240,000 | | | Puerto Rico Public Buildings Authority | | 5.250 | | | 07/01/2042 | | | | 164,194 | |
| | |
| | 5,615,000 | | | Puerto Rico Public Finance Corp., Series B | | 5.500 | | | 08/01/2031 | | | | 2,588,234 | |
46 OPPENHEIMER ROCHESTER AMT-FREE MUNICIPAL FUND
| | | | | | | | | | | | | | |
Principal Amount | | | | | Coupon | | Maturity | | | Value | |
| | |
| U.S. Possessions (Continued) | |
| | |
| | $ 17,650,000 | | | Puerto Rico Sales Tax Financing Corp., Series A | | 5.500 % | | | 08/01/2037 | | | $ | 13,130,894 | |
| | |
| | 50,000,000 | | | Puerto Rico Sales Tax Financing Corp., Series A | | 7.280 4 | | | 08/01/2034 | | | | 8,070,500 | |
| | |
| | 4,365,000 | | | Puerto Rico Sales Tax Financing Corp., Series A | | 5.375 | | | 08/01/2039 | | | | 3,130,622 | |
| | |
| | 270,000 | | | Puerto Rico Sales Tax Financing Corp., Series A | | 5.000 | | | 08/01/2043 | | | | 184,734 | |
| | |
| | 18,875,000 | | | Puerto Rico Sales Tax Financing Corp., Series A | | 9.410 4 | | | 08/01/2036 | | | | 2,687,045 | |
| | |
| | 5,000,000 | | | Puerto Rico Sales Tax Financing Corp., Series A | | 6.375 | | | 08/01/2039 | | | | 3,957,350 | |
| | |
| | 20,215,000 | | | Puerto Rico Sales Tax Financing Corp., Series A | | 5.750 | | | 08/01/2037 | | | | 15,448,303 | |
| | |
| | 29,670,000 | | | Puerto Rico Sales Tax Financing Corp., Series A | | 6.110 4 | | | 08/01/2044 | | | | 4,132,438 | |
| | |
| | 7,000,000 | | | Puerto Rico Sales Tax Financing Corp., Series A | | 6.500 | | | 08/01/2044 | | | | 5,563,390 | |
| | |
| | 32,560,000 | | | Puerto Rico Sales Tax Financing Corp., Series C | | 8.020 4 | | | 08/01/2038 | | | | 4,046,557 | |
| | |
| | 29,160,000 | | | Puerto Rico Sales Tax Financing Corp., Series C | | 5.000 | | | 08/01/2040 | | | | 22,622,620 | |
| | |
| | 2,205,000 | | | Puerto Rico Sales Tax Financing Corp., Series C | | 6.000 | | | 08/01/2042 | | | | 1,674,212 | |
| | |
| | 3,685,000 | | | Puerto Rico Sales Tax Financing Corp., Series C | | 0.000 9 | | | 08/01/2032 | | | | 2,503,294 | |
| | |
| | 7,450,000 | | | Puerto Rico Sales Tax Financing Corp., Series C | | 5.250 | | | 08/01/2041 | | | | 5,258,806 | |
| | | | | | | | | | | | | | |
| | | | | | | | | | | | | 224,618,349 | |
| | | | | | | | | | | | | | |
| Total Municipal Bonds and Notes (Cost $2,405,868,074) | | | | | | | | | 2,153,234,896 | |
| | |
| Corporate Bonds and Notes—0.0% | | | | | | | | |
| | |
| | 66,847 | | | Las Vegas Monorail Co., Sr. Sec. Nts.8,10 | | 5.500 | | | 07/15/2019 | | | | 8,022 | |
| | |
| | 18,270 | | | Las Vegas Monorail Co., Sub. Nts.8,10 | | 3.000 7 | | | 07/15/2055 | | | | 1,347 | |
| | | | | | | | | | | | | | |
| Total Corporate Bonds and Notes (Cost $0) | | | | 9,369 | |
|
| | |
| Total Investments, at Value (Cost $2,405,868,074)—110.5% | | | | 2,153,244,265 | |
| | |
| Net Other Assets (Liabilities)—(10.5) | | | | (205,508,530) | |
| | | | | | | | | | | | | | |
| Net Assets—100.0% | | | $ | �� 1,947,735,735 | |
| | | | | | | | | | | | | | |
Footnotes to Statement of Investments
1. Security represents the underlying municipal bond with respect to an inverse floating rate security held by the Fund. The bond was purchased by the Fund and subsequently transferred to a trust, which issued the related inverse floating rate security. See Note 1 of the accompanying Notes.
2. This security is accruing partial income at an anticipated effective rate based on expected interest and/or principal payments. The rate shown is the original contractual interest rate.
3. This security is not accruing income because the issuer has missed an interest payment on it and/or is not anticipated to make future interest and or principal payments. The rate shown is the original contractual interest rate. See Note 1 of the accompanying Notes.
4. Zero coupon bond reflects effective yield on the date of purchase.
5. All or a portion of the security position is when-issued or delayed delivery to be delivered and settled after July 31, 2014. See Note 1 of the accompanying Notes.
6. Subject to a forbearance agreement. Rate shown is the original contractual interest rate. See Note 1 of the accompanying Notes.
7. Represents the current interest rate for a variable or increasing rate security.
8. Received as a result of a corporate action
9. Denotes a step bond: a zero coupon bond that converts to a fixed or variable interest rate at a designated future date.
10. Interest or dividend is paid-in-kind, when applicable.
47 OPPENHEIMER ROCHESTER AMT-FREE MUNICIPAL FUND
| | |
| |
| STATEMENT OF INVESTMENTS Continued | | |
To simplify the listings of securities, abbreviations are used per the table below:
| | |
| AHACHC | | ARC/HDS Alamance Country Housing Corp. |
| AWCC | | American Water Capital Corp. |
| CDA | | Communities Devel. Authority |
| COP | | Certificates of Participation |
| DA | | Dormitory Authority |
| DRIVERS | | Derivative Inverse Tax Exempt Receipts |
| EDA | | Economic Devel. Authority |
| EDC | | Economic Devel. Corp. |
| EF&CD | | Environmental Facilities and Community Devel. |
| EPBH | | Emma Pendleton Bradley Hospital |
| GO | | General Obligation |
| H&EFA | | Health and Educational Facilities Authority |
| H&EFB | | Health and Educational Facilities Board |
| H&HEFA | | Hospitals and Higher Education Facilities Authority |
| HDC | | Housing Devel. Corp. |
| HE&HFA | | Higher Education and Health Facilities Authority |
| HEFA | | Higher Education Facilities Authority |
| HEFFA | | Higher Educational Facilities Finance Authority |
| HFA | | Housing Finance Agency |
| HFC | | Housing Finance Corp. |
| IDA | | Industrial Devel. Agency |
| ITEMECF | | Industrial, Tourist, Educational, Medical and Environmental Community Facilities |
| KAWC | | Kentucky American Water Company |
| M-S-R | | Modesto Irrigation District of the City of Santa Clara and the City of Redding |
| MTA | | Metropolitan Transportation Authority |
| NYS | | New York State |
| OLOLMC | | Our Lady Of Lake Medical Center |
| OLOLRMC | | Our Lady of Lourdes Regional Medical Center |
| RIBS | | Residual Interest Bonds |
| RIH | | Rhode Island Hospital |
| ROLs | | Reset Option Longs |
| SJHCN | | St. Joseph Home Care Network |
| SJHE | | St. Joseph Hospital of Eureka |
| SJHO | | St. Joseph Hospital of Orange |
| SJHS | | St. Joseph Health System |
| TASC | | Tobacco Settlement Asset-Backed Bonds |
| TMH | | The Miriam Hospital |
See accompanying Notes to Financial Statements.
48 OPPENHEIMER ROCHESTER AMT-FREE MUNICIPAL FUND
| | |
| |
| STATEMENT OF ASSETS AND LIABILITIES July 31, 2014 | | |
| | | | |
| |
Assets | | | | |
Investments, at value (cost $2,405,868,074)—see accompanying statement of investments | | $ | 2,153,244,265 | |
| |
Cash | | | 7,104,991 | |
| |
Receivables and other assets: | | | | |
Interest | | | 28,478,066 | |
Shares of beneficial interest sold | | | 2,556,821 | |
Investments sold (including $1,991,118 sold on a when-issued or delayed delivery basis) | | | 1,991,118 | |
Other | | | 825,552 | |
| | | | |
Total assets | | | 2,194,200,813 | |
| |
Liabilities | | | | |
Payables and other liabilities: | | | | |
Payable for short-term floating rate notes issued (See Note 1) | | | 235,075,000 | |
Shares of beneficial interest redeemed | | | 5,967,607 | |
Dividends | | | 2,442,144 | |
Investments purchased (including $2,172,460 purchased on a when-issued or delayed delivery basis) | | | 2,172,460 | |
Distribution and service plan fees | | | 364,643 | |
Trustees’ compensation | | | 341,253 | |
Shareholder communications | | | 13,326 | |
Interest expense on borrowings | | | 561 | |
Other | | | 88,084 | |
| | | | |
Total liabilities | | | 246,465,078 | |
| |
Net Assets | | $ | 1,947,735,735 | |
| | | | |
| |
| | | | |
| |
Composition of Net Assets | | | | |
Par value of shares of beneficial interest | | $ | 285,214 | |
| |
Additional paid-in capital | | | 2,639,116,756 | |
| |
Accumulated net investment income | | | 32,376,093 | |
| |
Accumulated net realized loss on investments | | | (471,418,519) | |
| |
Net unrealized depreciation on investments | | | (252,623,809) | |
| | | | |
Net Assets | | $ | 1,947,735,735 | |
| | | | |
49 OPPENHEIMER ROCHESTER AMT-FREE MUNICIPAL FUND
| | |
| |
| STATEMENT OF ASSETS AND LIABILITIES Continued | | |
| | | | |
| |
Net Asset Value Per Share | | | | |
Class A Shares: | | | | |
| |
| Net asset value and redemption price per share (based on net assets of $1,305,585,702 and 190,856,805 shares of beneficial interest outstanding) | | $ | 6.84 | |
| Maximum offering price per share (net asset value plus sales charge of 4.75% of offering price) | | $ | 7.18 | |
| |
| |
| Class B Shares: | | | | |
| |
| Net asset value, redemption price (excludes applicable contingent deferred sales charge) and offering price per share (based on net assets of $19,425,663 and 2,857,349 shares of beneficial interest outstanding) | | $ | 6.80 | |
| |
| |
| Class C Shares: | | | | |
| |
| Net asset value, redemption price (excludes applicable contingent deferred sales charge) and offering price per share (based on net assets of $374,108,227 and 55,054,603 shares of beneficial interest outstanding) | | $ | 6.80 | |
| |
| |
| Class Y Shares: | | | | |
| |
| Net asset value, redemption price and offering price per share (based on net assets of $248,616,143 and 36,444,792 shares of beneficial interest outstanding) | | $ | 6.82 | |
See accompanying Notes to Financial Statements.
50 OPPENHEIMER ROCHESTER AMT-FREE MUNICIPAL FUND
| | |
| |
| STATEMENT OF OPERATIONS For the Year Ended July 31, 2014 | | |
| | | | |
| |
Investment Income | | | | |
Interest | | $ | 153,440,598 | |
| |
Other income | | | 2,473 | |
| | | | |
Total investment income | | | 153,443,071 | |
| |
Expenses | | | | |
Management fees | | | 8,567,916 | |
| |
Distribution and service plan fees: | | | | |
Class A | | | 3,379,838 | |
Class B | | | 223,522 | |
Class C | | | 3,810,166 | |
| |
Transfer and shareholder servicing agent fees: | | | | |
Class A | | | 1,097,861 | |
Class B | | | 22,407 | |
Class C | | | 322,475 | |
Class Y | | | 199,566 | |
| |
Shareholder communications: | | | | |
Class A | | | 121,279 | |
Class B | | | 5,097 | |
Class C | | | 46,350 | |
Class Y | | | 19,057 | |
| |
Interest expense and fees on short-term floating rate notes issued (See Note 1) | | | 3,545,814 | |
| |
Borrowing fees | | | 1,887,915 | |
| |
Legal, auditing and other professional fees | | | 191,431 | |
| |
Interest expense on borrowings | | | 46,492 | |
| |
Trustees’ compensation | | | 38,923 | |
| |
Custodian fees and expenses | | | 34,496 | |
| |
Other | | | 1,208,338 | |
| | | | |
Total expenses | | | 24,768,943 | |
Less waivers and reimbursements of expenses | | | (1,375) | |
| | | | |
Net expenses | | | 24,767,568 | |
| |
Net Investment Income | | | 128,675,503 | |
| | | | |
| |
Realized and Unrealized Gain (Loss) | | | | |
Net realized loss on investments | | | (10,131,089) | |
| |
Net change in unrealized appreciation/depreciation on investments | | | 53,698,935 | |
| |
| | | | |
| |
Net Increase in Net Assets Resulting from Operations | | $ | 172,243,349 | |
| | | | |
See accompanying Notes to Financial Statements.
51 OPPENHEIMER ROCHESTER AMT-FREE MUNICIPAL FUND
| | |
| |
| STATEMENTS OF CHANGES IN NET ASSETS | | |
| | | | | | | | |
| | | Year Ended July 31, 2014 | | | Year Ended July 31, 2013 | |
| |
Operations | | | | | | | | |
Net investment income | | $ | 128,675,503 | | | $ | 148,884,052 | |
| |
Net realized gain (loss) | | | (10,131,089) | | | | 17,903,412 | |
| |
Net change in unrealized appreciation/depreciation | | | 53,698,935 | | | | (218,780,484) | |
| | | | | | | | |
Net increase (decrease) in net assets resulting from operations | | | 172,243,349 | | | | (51,993,020) | |
| |
Dividends and/or Distributions to Shareholders | | | | | | | | |
Dividends from net investment income: | | | | | | | | |
Class A | | | (84,308,049) | | | | (103,703,283) | |
Class B | | | (1,170,638) | | | | (1,547,605) | |
Class C | | | (20,083,177) | | | | (25,222,275) | |
Class Y | | | (15,305,191) | | | | (15,685,209) | |
| | | | |
| | | (120,867,055) | | | | (146,158,372) | |
| |
Beneficial Interest Transactions | | | | | | | | |
Net increase (decrease) in net assets resulting from beneficial interest transactions: | | | | | | | | |
Class A | | | (315,463,166) | | | | (163,776,102) | |
Class B | | | (7,709,050) | | | | (7,622,889) | |
Class C | | | (85,073,174) | | | | (38,198,011) | |
Class Y | | | 42,847,314 | | | | (72,270,339) | |
| | | | | | | | |
| | | (365,398,076) | | | | (281,867,341) | |
| |
Net Assets | | | | | | | | |
Total decrease | | | (314,021,782) | | | | (480,018,733) | |
| |
Beginning of period | | | 2,261,757,517 | | | | 2,741,776,250 | |
| | | | | | | | |
| End of period (including accumulated net investment income of $32,376,093 and $26,422,715, respectively) | | $ | 1,947,735,735 | | | $ | 2,261,757,517 | |
| | | | |
See accompanying Notes to Financial Statements.
52 OPPENHEIMER ROCHESTER AMT-FREE MUNICIPAL FUND
| | |
| |
| STATEMENT OF CASH FLOWS For the Year Ended July 31, 2014 | | |
| | | | |
| |
Cash Flows from Operating Activities | | | | |
| Net increase in net assets from operations | | $ | 172,243,349 | |
| |
| Adjustments to reconcile net increase in net assets from operations to net cash provided by operating activities: | | | | |
Purchase of investment securities | | | (238,918,163) | |
Proceeds from disposition of investment securities | | | 724,486,001 | |
Short-term investment securities, net | | | 2,912,304 | |
Premium amortization | | | 5,286,446 | |
Discount accretion | | | (27,375,661) | |
Net realized loss on investments | | | 10,131,089 | |
Net change in unrealized appreciation/depreciation on investments | | | (53,698,935) | |
| Change in assets: | | | | |
Increase in other assets | | | (135,950) | |
Decrease in interest receivable | | | 4,659,445 | |
Decrease in receivable for securities sold | | | 23,184,122 | |
| Change in liabilities: | | | | |
Decrease in other liabilities | | | (896,015) | |
Decrease in payable for securities purchased | | | (8,469,912) | |
| | | | |
| Net cash provided by operating activities | | | 613,408,120 | |
| |
| | | | |
| |
Cash Flows from Financing Activities | | | | |
| Proceeds from borrowings | | | 412,200,000 | |
| Payments on borrowings | | | (475,200,000) | |
| Payments on short-term floating rate notes issued | | | (60,890,000) | |
| Proceeds from shares sold | | | 603,748,515 | |
| Payments on shares redeemed | | | (1,061,026,553) | |
| Cash distributions paid | | | (27,987,076) | |
| | | | |
| Net cash used in financing activities | | | (609,155,114) | |
| |
| Net increase in cash | | | 4,253,006 | |
| |
| Cash, beginning balance | | | 2,851,985 | |
| | | | |
| Cash, ending balance | | $ | 7,104,991 | |
| | | | |
| |
| Supplemental disclosure of cash flow information: | | | | |
| Noncash financing activities not included herein consist of reinvestment of dividends and distributions of $92,867,604. | |
| Cash paid for interest on borrowings—$58,707. | | | | |
| Cash paid for interest on short-term floating rate notes issued—$3,545,814. | | | | |
See accompanying Notes to Financial Statements.
53 OPPENHEIMER ROCHESTER AMT-FREE MUNICIPAL FUND
| | | | | | | | | | | | | | | | | | | | |
| Class A | | Year Ended July 31, 2014 | | | Year Ended July 31, 2013 | | | Year Ended July 31, 2012 | | | Year Ended July 29, 2011 1 | | | Year Ended July 30, 2010 1 | |
| |
Per Share Operating Data | | | | | | | | | | | | | | | | | | | | |
| Net asset value, beginning of period | | $ | 6.65 | | | $ | 7.19 | | | $ | 6.27 | | | $ | 6.39 | | | $ | 5.51 | |
| |
| Income (loss) from investment operations: | | | | | | | | | | | | | | | | | | | | |
| Net investment income2 | | | 0.43 | | | | 0.40 | | | | 0.43 | | | | 0.46 | | | | 0.45 | |
| Net realized and unrealized gain (loss) | | | 0.16 | | | | (0.55) | | | | 0.90 | | | | (0.17) | | | | 0.89 | |
| | | | |
| Total from investment operations | | | 0.59 | | | | (0.15) | | | | 1.33 | | | | 0.29 | | | | 1.34 | |
| |
| Dividends and/or distributions to shareholders: | | | | | | | | | | | | | | | | | | | | |
| Dividends from net investment income | | | (0.40) | | | | (0.39) | | | | (0.41) | | | | (0.41) | | | | (0.46) | |
| |
| Net asset value, end of period | | $ | 6.84 | | | $ | 6.65 | | | $ | 7.19 | | | $ | 6.27 | | | $ | 6.39 | |
| | | | |
| | | | | | | | | | | | | | | | | | | | |
| |
Total Return, at Net Asset Value3 | | | 9.18% | | | | (2.32)% | | | | 21.90% | | | | 4.97% | | | | 24.64% | |
| | | | | | | | | | | | | | | | | | | | |
| |
Ratios/Supplemental Data | | | | | | | | | | | | | | | | | | | | |
| Net assets, end of period (in thousands) | | $ | 1,305,586 | | | $ | 1,586,019 | | | $ | 1,888,870 | | | $ | 1,619,244 | | | $ | 2,081,580 | |
| |
| Average net assets (in thousands) | | $ | 1,405,201 | | | $ | 1,914,142 | | | $ | 1,677,433 | | | $ | 1,779,808 | | | $ | 1,953,017 | |
| |
| Ratios to average net assets:4 | | | | | | | | | | | | | | | | | | | | |
| Net investment income | | | 6.40% | | | | 5.52% | | | | 6.45% | | | | 7.39% | | | | 7.12% | |
| Expenses excluding interest and fees from borrowings | | | 0.82% | | | | 0.74% | | | | 0.77% | | | | 0.74% | | | | 0.71% | |
| Interest and fees from borrowings | | | 0.09% | | | | 0.08% | | | | 0.10% | | | | 0.13% | | | | 0.23% | |
| Interest and fees on short-term floating rates notes issued5 | | | 0.17% | | | | 0.10% | | | | 0.17% | | | | 0.21% | | | | 0.22% | |
| | | | |
| Total expenses | | | 1.08% | | | | 0.92% | | | | 1.04% | | | | 1.08% | | | | 1.16% | |
| Expenses after payments, waivers and/or reimbursements and reduction to custodian expenses | | | 1.08% | | | | 0.92% | | | | 1.04% | | | | 1.08% | | | | 1.16% | |
| |
| Portfolio turnover rate | | | 10% | | | | 13% | | | | 21% | | | | 30% | | | | 21% | |
1. July 29, 2011 and July 30, 2010 represent the last business days of the Fund’s respective reporting periods.
2. Per share amounts calculated based on the average shares outstanding during the period.
3. Assumes an initial investment on the business day before the first day of the fiscal period, with all dividends and distributions reinvested in additional shares on the reinvestment date, and redemption at the net asset value calculated on the last business day of the fiscal period. Sales charges are not reflected in the total returns. Total returns are not annualized for periods less than one full year. Returns do not reflect the deduction of taxes that a shareholder would pay on fund distributions or the redemption of fund shares.
4. Annualized for periods less than one full year.
5. Interest and fee expense relates to the Fund’s liability for short-term floating rate notes issued in conjunction with inverse floating rate security transactions.
See accompanying Notes to Financial Statements.
54 OPPENHEIMER ROCHESTER AMT-FREE MUNICIPAL FUND
| | | | | | | | | | | | | | | | | | | | |
| Class B | | Year Ended July 31, 2014 | | | Year Ended July 31, 2013 | | | Year Ended July 31, 2012 | | | Year Ended July 29, 2011 1 | | | Year Ended July 30, 2010 1 | |
| |
Per Share Operating Data | | | | | | | | | | | | | | | | | | | | |
| Net asset value, beginning of period | | $ | 6.61 | | | $ | 7.15 | | | $ | 6.24 | | | $ | 6.36 | | | $ | 5.48 | |
| |
| Income (loss) from investment operations: | | | | | | | | | | | | | | | | | | | | |
| Net investment income2 | | | 0.37 | | | | 0.34 | | | | 0.37 | | | | 0.40 | | | | 0.39 | |
| Net realized and unrealized gain (loss) | | | 0.17 | | | | (0.55) | | | | 0.89 | | | | (0.16) | | | | 0.90 | |
| | | | |
| Total from investment operations | | | 0.54 | | | | (0.21) | | | | 1.26 | | | | 0.24 | | | | 1.29 | |
| |
| Dividends and/or distributions to shareholders: | | | | | | | | | | | | | | | | | | | | |
| Dividends from net investment income | | | (0.35) | | | | (0.33) | | | | (0.35) | | | | (0.36) | | | | (0.41) | |
| |
| Net asset value, end of period | | $ | 6.80 | | | $ | 6.61 | | | $ | 7.15 | | | $ | 6.24 | | | $ | 6.36 | |
| | | | |
| | | | | | | | | | | | | | | | | | | | |
| |
Total Return, at Net Asset Value3 | | | 8.39% | | | | (3.15)% | | | | 20.84% | | | | 4.11% | | | | 23.72% | |
| | | | | | | | | | | | | | | | | | | | |
| |
Ratios/Supplemental Data | | | | | | | | | | | | | | | | | | | | |
| Net assets, end of period (in thousands) | | $ | 19,426 | | | $ | 26,593 | | | $ | 36,439 | | | $ | 34,889 | | | $ | 41,234 | |
| |
| Average net assets (in thousands) | | $ | 22,337 | | | $ | 33,430 | | | $ | 34,260 | | | $ | 37,308 | | | $ | 37,974 | |
| |
| Ratios to average net assets:4 | | | | | | | | | | | | | | | | | | | | |
| Net investment income | | | 5.61% | | | | 4.69% | | | | 5.62% | | | | 6.54% | | | | 6.26% | |
| Expenses excluding interest and fees on short-term floating rate notes issued and interest and fees from borrowings | | | 1.61% | | | | 1.57% | | | | 1.61% | | | | 1.60% | | | | 1.56% | |
| Interest and fees from borrowings | | | 0.09% | | | | 0.08% | | | | 0.10% | | | | 0.13% | | | | 0.23% | |
| Interest and fees on short-term floating rate notes issued5 | | | 0.17% | | | | 0.10% | | | | 0.17% | | | | 0.21% | | | | 0.22% | |
| | | | |
| Total expenses | | | 1.87% | | | | 1.75% | | | | 1.88% | | | | 1.94% | | | | 2.01% | |
| Expenses after payments, waivers and/or reimbursements and reduction to custodian expenses | | | 1.87% | | | | 1.75% | | | | 1.88% | | | | 1.94% | | | | 2.01% | |
| |
| Portfolio turnover rate | | | 10% | | | | 13% | | | | 21% | | | | 30% | | | | 21% | |
1. July 29, 2011 and July 30, 2010 represent the last business days of the Fund’s respective reporting periods.
2. Per share amounts calculated based on the average shares outstanding during the period.
3. Assumes an initial investment on the business day before the first day of the fiscal period, with all dividends and distributions reinvested in additional shares on the reinvestment date, and redemption at the net asset value calculated on the last business day of the fiscal period. Sales charges are not reflected in the total returns. Total returns are not annualized for periods less than one full year. Returns do not reflect the deduction of taxes that a shareholder would pay on fund distributions or the redemption of fund shares.
4. Annualized for periods less than one full year.
5. Interest and fee expense relates to the Fund’s liability for short-term floating rate notes issued in conjunction with inverse floating rate security transactions.
See accompanying Notes to Financial Statements.
55 OPPENHEIMER ROCHESTER AMT-FREE MUNICIPAL FUND
| | |
| |
| FINANCIAL HIGHLIGHTS Continued | | |
| | | | | | | | | | | | | | | | | | | | |
| Class C | | Year Ended July 31, 2014 | | | Year Ended July 31, 2013 | | | Year Ended July 31, 2012 | | | Year Ended July 29, 2011 1 | | | Year Ended July 30, 2010 1 | |
| |
Per Share Operating Data | | | | | | | | | | | | | | | | | | | | |
| Net asset value, beginning of period | | $ | 6.60 | | | $ | 7.15 | | | $ | 6.24 | | | $ | 6.36 | | | $ | 5.48 | |
| |
| Income (loss) from investment operations: | | | | | | | | | | | | | | | | | | | | |
| Net investment income2 | | | 0.37 | | | | 0.34 | | | | 0.38 | | | | 0.40 | | | | 0.40 | |
| Net realized and unrealized gain (loss) | | | 0.18 | | | | (0.55) | | | | 0.89 | | | | (0.15) | | | | 0.89 | |
| | | | |
| Total from investment operations | | | 0.55 | | | | (0.21) | | | | 1.27 | | | | 0.25 | | | | 1.29 | |
| |
| Dividends and/or distributions to shareholders: | | | | | | | | | | | | | | | | | | | | |
| Dividends from net investment income | | | (0.35) | | | | (0.34) | | | | (0.36) | | | | (0.37) | | | | (0.41) | |
| |
| Net asset value, end of period | | $ | 6.80 | | | $ | 6.60 | | | $ | 7.15 | | | $ | 6.24 | | | $ | 6.36 | |
| | | | |
| | | | | | | | | | | | | | | | | | | | |
| |
Total Return, at Net Asset Value3 | | | 8.58% | | | | (3.24)% | | | | 20.91% | | | | 4.18% | | | | 23.82% | |
| | | | | | | | | | | | | | | | | | | | |
| |
Ratios/Supplemental Data | | | | | | | | | | | | | | | | | | | | |
| Net assets, end of period (in thousands) | | $ | 374,108 | | | $ | 450,498 | | | $ | 527,392 | | | $ | 418,638 | | | $ | 518,594 | |
| |
| Average net assets (in thousands) | | $ | 381,177 | | | $ | 539,108 | | | $ | 454,431 | | | $ | 455,782 | | | $ | 465,652 | |
| |
| Ratios to average net assets:4 | | | | | | | | | | | | | | | | | | | | |
| Net investment income | | | 5.62% | | | | 4.75% | | | | 5.66% | | | | 6.60% | | | | 6.32% | |
| Expenses excluding interest and fees on short-term floating rate notes issued and interest and fees from borrowings | | | 1.59% | | | | 1.51% | | | | 1.55% | | | | 1.53% | | | | 1.48% | |
| Interest and fees from borrowings | | | 0.09% | | | | 0.08% | | | | 0.10% | | | | 0.13% | | | | 0.23% | |
| Interest and fees on short-term floating rate notes issued5 | | | 0.17% | | | | 0.10% | | | | 0.17% | | | | 0.21% | | | | 0.22% | |
| | | | |
| Total expenses | | | 1.85% | | | | 1.69% | | | | 1.82% | | | | 1.87% | | | | 1.93% | |
| Expenses after payments, waivers and/or reimbursements and reduction to custodian expenses | | | 1.85% | | | | 1.69% | | | | 1.82% | | | | 1.87% | | | | 1.93% | |
| |
| Portfolio turnover rate | | | 10% | | | | 13% | | | | 21% | | | | 30% | | | | 21% | |
1. July 29, 2011 and July 30, 2010 represent the last business days of the Fund’s respective reporting periods.
2. Per share amounts calculated based on the average shares outstanding during the period.
3. Assumes an initial investment on the business day before the first day of the fiscal period, with all dividends and distributions reinvested in additional shares on the reinvestment date, and redemption at the net asset value calculated on the last business day of the fiscal period. Sales charges are not reflected in the total returns. Total returns are not annualized for periods less than one full year. Returns do not reflect the deduction of taxes that a shareholder would pay on fund distributions or the redemption of fund shares.
4. Annualized for periods less than one full year.
5. Interest and fee expense relates to the Fund’s liability for short-term floating rate notes issued in conjunction with inverse floating rate security transactions.
See accompanying Notes to Financial Statements.
56 OPPENHEIMER ROCHESTER AMT-FREE MUNICIPAL FUND
| | | | | | | | | | | | | | | | |
| Class Y | | Year Ended July 31, 2014 | | | Year Ended July 31, 2013 | | | Year Ended July 31, 2012 | | | Period Ended July 29, 20111 | |
| |
Per Share Operating Data | | | | | | | | | | | | | | | | |
| Net asset value, beginning of period | | $ | 6.63 | | | $ | 7.17 | | | $ | 6.26 | | | $ | 6.19 | |
| |
| Income (loss) from investment operations: | | | | | | | | | | | | | | | | |
| Net investment income2 | | | 0.44 | | | | 0.42 | | | | 0.44 | | | | 0.30 | |
| Net realized and unrealized gain (loss) | | | 0.16 | | | | (0.55) | | | | 0.89 | | | | 0.05 | |
| | | | |
| Total from investment operations | | | 0.60 | | | | (0.13) | | | | 1.33 | | | | 0.35 | |
| |
| Dividends and/or distributions to shareholders: | | | | | | | | | | | | | | | | |
| Dividends from net investment income | | | (0.41) | | | | (0.41) | | | | (0.42) | | | | (0.28) | |
| |
| Net asset value, end of period | | $ | 6.82 | | | $ | 6.63 | | | $ | 7.17 | | | $ | 6.26 | |
| | | | |
| | | | | | | | | | | | | | | | |
| |
Total Return, at Net Asset Value3 | | | 9.47% | | | | (2.11)% | | | | 22.06% | | | | 6.03% | |
| | | | | | | | | | | | | | | | |
| |
Ratios/Supplemental Data | | | | | | | | | | | | | | | | |
| Net assets, end of period (in thousands) | | $ | 248,616 | | | $ | 198,648 | | | $ | 289,075 | | | $ | 52,976 | |
| |
| Average net assets (in thousands) | | $ | 245,234 | | | $ | 278,098 | | | $ | 159,256 | | | $ | 22,067 | |
| |
| Ratios to average net assets:4 | | | | | | | | | | | | | | | | |
| Net investment income | | | 6.59% | | | | 5.75% | | | | 6.55% | | | | 7.47% | |
| Expenses excluding interest and fees on short-term floating rate notes issued and interest and fees from borrowings | | | 0.58% | | | | 0.51% | | | | 0.52% | | | | 0.54% | |
| Interest and fees from borrowings | | | 0.09% | | | | 0.08% | | | | 0.10% | | | | 0.10% | |
| Interest and fees on short-term floating rate notes issued5 | | | 0.17% | | | | 0.10% | | | | 0.17% | | | | 0.21% | |
| | | | |
| Total expenses | | | 0.84% | | | | 0.69% | | | | 0.79% | | | | 0.85% | |
| Expenses after payments, waivers and/or reimbursements and reduction to custodian expenses | | | 0.84% | | | | 0.69% | | | | 0.79% | | | | 0.85% | |
| |
| Portfolio turnover rate | | | 10% | | | | 13% | | | | 21% | | | | 30% | |
1. For the period from November 29, 2010 (inception of offering) to July 29, 2011, which represents the last business day of the Fund’s reporting period.
2. Per share amounts calculated based on the average shares outstanding during the period.
3. Assumes an initial investment on the business day before the first day of the fiscal period, with all dividends and distributions reinvested in additional shares on the reinvestment date, and redemption at the net asset value calculated on the last business day of the fiscal period. Sales charges are not reflected in the total returns. Total returns are not annualized for periods less than one full year. Returns do not reflect the deduction of taxes that a shareholder would pay on fund distributions or the redemption of fund shares.
4. Annualized for periods less than one full year.
5. Interest and fee expense relates to the Fund’s liability for short-term floating rate notes issued in conjunction with inverse floating rate security transactions.
See accompanying Notes to Financial Statements.
57 OPPENHEIMER ROCHESTER AMT-FREE MUNICIPAL FUND
| | |
| |
| NOTES TO FINANCIAL STATEMENTS July 31, 2014 | | |
|
1. Significant Accounting Policies |
Oppenheimer Rochester AMT-Free Municipal Fund (the “Fund”), formerly named Oppenheimer AMT-Free Municipals, is a diversified open-end management investment company registered under the Investment Company Act of 1940, as amended. The Fund’s investment objective is to seek tax-free income. The Fund’s investment adviser is OFI Global Asset Management, Inc. (“OFI Global” or the “Manager”), a wholly-owned subsidiary of OppenheimerFunds, Inc. (“OFI” or the “Sub-Adviser”). The Manager has entered into a sub-advisory agreement with OFI.
The Fund offers Class A, Class C and Class Y shares, and previously offered Class B shares for new purchase through June 29, 2012. Subsequent to that date, no new purchases of Class B shares are permitted, however reinvestment of dividend and/or capital gain distributions and exchanges of Class B shares into and from other Oppenheimer funds will be allowed. Class A shares are sold at their offering price, which is normally net asset value plus a front-end sales charge. Class C shares are sold, and Class B shares were sold, without a front-end sales charge but may be subject to a contingent deferred sales charge (“CDSC”). Class Y shares are sold to certain institutional investors or intermediaries without either a front-end sales charge or a CDSC, however, the intermediaries may impose charges on their accountholders who beneficially own Class Y shares. All classes of shares have identical rights and voting privileges with respect to the Fund in general and exclusive voting rights on matters that affect that class alone. Earnings, net assets and net asset value per share may differ due to each class having its own expenses, such as transfer and shareholder servicing agent fees and shareholder communications, directly attributable to that class. Class A, B and C shares have separate distribution and/or service plans under which they pay fees. Class Y shares do not pay such fees. Class B shares will automatically convert to Class A shares 72 months after the date of purchase.
The following is a summary of significant accounting policies consistently followed by the Fund.
Inverse Floating Rate Securities. The Fund invests in inverse floating rate securities that pay interest at a rate that varies inversely with short-term interest rates. Because inverse floating rate securities are leveraged instruments, the value of an inverse floating rate security will change more significantly in response to changes in interest rates and other market fluctuations than the market value of a conventional fixed-rate municipal security of similar maturity and credit quality, including the municipal bond underlying an inverse floating rate security.
An inverse floating rate security is created as part of a financial transaction referred to as a “tender option bond” transaction. In most cases, in a tender option bond transaction the Fund sells a fixed-rate municipal bond (the “underlying municipal bond”) to a broker dealer (the “sponsor”). The sponsor creates a trust (the “Trust”) into which it deposits the underlying municipal bond. The Trust then issues and sells short-term floating rate securities with a fixed principal amount representing a senior interest in the underlying municipal bond to third parties and a residual, subordinate interest in the underlying municipal bond (referred to as an “inverse floating rate security”) to the Fund. The interest rate on the short-term floating rate securities resets periodically, usually weekly, to a prevailing market rate and
58 OPPENHEIMER ROCHESTER AMT-FREE MUNICIPAL FUND
|
1. Significant Accounting Policies (Continued) |
holders of these securities are granted the option to tender their securities back to the Trust for repurchase at their principal amount plus accrued interest thereon (the “purchase price”) periodically, usually daily or weekly. A remarketing agent for the Trust is required to attempt to re-sell any tendered short-term floating rate securities to new investors for the purchase price. If the remarketing agent is unable to successfully re-sell the tendered short-term floating rate securities, a liquidity provider to the Trust (typically an affiliate of the sponsor) must contribute cash to the Trust to ensure that the tendering holders receive the purchase price of their securities on the repurchase date.
Because holders of the short-term floating rate securities are granted the right to tender their securities to the Trust for repurchase at frequent intervals for the purchase price, with such payment effectively guaranteed by the liquidity provider, the securities generally bear short-term rates of interest commensurate with money market instruments. When interest is paid on the underlying municipal bond to the Trust, such proceeds are first used to pay the Trust’s administrative expenses and accrued interest to holders of the short-term floating rate securities, with any remaining amounts being paid to the Fund, as the holder of the inverse floating rate security. Accordingly, the amount of such interest on the underlying municipal bond paid to the Fund is inversely related the rate of interest on the short-term floating rate securities. Additionally, because the principal amount of the short-term floating rate securities is fixed and is not adjusted in response to changes in the market value of the underlying municipal bond, any change in the market value of the underlying municipal bond is reflected entirely in a change to the value of the inverse floating rate security.
Typically, the terms of an inverse floating rate security grant certain rights to the Fund, as holder. For example, the Fund may have the right upon request to require that the Trust compel a tender of the short-term floating rate securities to facilitate the Fund’s acquisition of the underlying municipal bond. Following such a request, the Fund pays the Trust the purchase price of the short-term floating rate securities and a specified portion of any market value gain on the underlying municipal bond since its deposit into the Trust, which the Trust uses to redeem the short-term floating rate securities. The Trust then distributes the underlying municipal bond to the Fund. Similarly, the Fund may have the right to directly purchase the underlying municipal bond from the Trust by paying to the Trust the purchase price of the short-term floating rate securities and a specified portion of any market value gain on the underlying municipal bond since its deposit into the Trust, which the Trust uses to redeem the short-term floating rate securities. Through the exercise of either of these rights, the Fund can voluntarily terminate or “collapse” the Trust, terminate its investment in the related inverse floating rate security and obtain the underlying municipal bond. Additionally, the Fund also typically has the right to exchange with the Trust (i) a principal amount of short-term floating rate securities held by the Fund for a corresponding additional principal amount of the inverse floating rate security or (ii) a principal amount of the inverse floating rate security held by the Fund for a corresponding additional principal amount of short-term floating rate securities (which are typically then sold to other investors). Through the exercise of this right, the Fund may increase (or decrease) the principal amount of short-term floating rate securities outstanding, thereby increasing (or decreasing) the amount of leverage
59 OPPENHEIMER ROCHESTER AMT-FREE MUNICIPAL FUND
| | |
| |
| NOTES TO FINANCIAL STATEMENTS Continued | | |
|
1. Significant Accounting Policies (Continued) |
provided by the short-term floating rate securities to the Fund’s investment exposure to the underlying municipal bond.
The Fund’s investments in inverse floating rate securities involve certain risks. As short-term interest rates rise, an inverse floating rate security produces less current income (and, in extreme cases, may pay no income) and as short-term interest rates fall, an inverse floating rate security produces more current income. Thus, if short-term interest rates rise after the issuance of the inverse floating rate security, any yield advantage is reduced or eliminated. All inverse floating rate securities entail some degree of leverage represented by the outstanding principal amount of the related short-term floating rate securities. The value of, and income earned on, an inverse floating rate security that has a higher degree of leverage will fluctuate more significantly in response to changes in interest rates and to changes in the market value of the related underlying municipal bond than that of an inverse floating rate security with a lower degree of leverage, and is more likely to be eliminated entirely under adverse market conditions. Changes in the value of an inverse floating rate security will also be more significant than changes in the market value of the related underlying municipal bond because the leverage provided by the related short-term floating rate securities increases the sensitivity of an inverse floating rate security to changes in interest rates and to the market value of the underlying municipal bond. An inverse floating rate security can be expected to underperform fixed-rate municipal bonds when the difference between long-term and short-term interest rates is decreasing (or is already small) or when long-term interest rates are rising, but can be expected to outperform fixed-rate municipal bonds when the difference between long-term and short-term interest rates is increasing (or is already large) or when long-term interest rates are falling. Additionally, a tender option bond transaction typically provides for the automatic termination or “collapse” of a Trust upon the occurrence of certain adverse events, usually referred to as “mandatory tender events” or “tender option termination events.” These events may include, among others, a credit ratings downgrade of the underlying municipal bond below a specified level, a decrease in the market value of the underlying municipal bond below a specified amount, a bankruptcy of the liquidity provider or the inability of the remarketing agent to re-sell to new investors short-term floating rate securities that have been tendered for repurchase by holders thereof. Following the occurrence of such an event, the underlying municipal bond is generally sold for current market value and the proceeds distributed to holders of the short-term floating rate securities and inverse floating rate security, with the holder of the inverse floating rate security (the Fund) generally receiving the proceeds of such sale only after the holders of the short-term floating rate securities have received proceeds equal to the purchase price of their securities (and the liquidity provider is generally required to contribute cash to the Trust only in an amount sufficient to ensure that the holders of the short-term floating rate securities receive the purchase price of their securities in connection with such termination of the Trust). Following the occurrence of such events, the Fund could potentially lose the entire amount of its investment in the inverse floating rate security.
Finally, the Fund may enter into shortfall/reimbursement agreements with the liquidity provider of certain tender option bond transactions in connection with certain inverse floating rate securities held by the Fund. These agreements commit the Fund to reimburse the liquidity
60 OPPENHEIMER ROCHESTER AMT-FREE MUNICIPAL FUND
|
1. Significant Accounting Policies (Continued) |
provider to the extent that the liquidity provider must provide cash to a Trust, including following the termination of a Trust resulting from the occurrence of a “mandatory tender event.” In connection with the occurrence of such an event and the termination of the Trust triggered thereby, the shortfall/reimbursement agreement will make the Fund liable for the amount of the negative difference, if any, between the liquidation value of the underlying municipal bond and the purchase price of the short-term floating rate securities issued by the Trust. Under the standard terms of a tender option bond transaction, absent such a shortfall/reimbursement agreement, the Fund, as holder of the inverse floating rate security, would not be required to make such a reimbursement payment to the liquidity provider. The Manager monitors the Fund’s potential exposure with respect to these agreements on a daily basis and intends to take action to terminate the Fund’s investment in related inverse floating rate securities, if it deems it appropriate to do so. As of July 31, 2014, the Fund’s maximum exposure under such agreements is estimated at $98,425,000.
When the Fund creates an inverse floating rate security in a tender option bond transaction by selling an underlying municipal bond to a sponsor for deposit into a Trust, the transaction is considered a secured borrowing for financial reporting purposes. As a result of such accounting treatment, the Fund includes the underlying municipal bond on its Statement of Investments and as an asset on its Statement of Assets and Liabilities (but does not separately include the related inverse floating rate security on either). The Fund also includes a liability on its Statement of Assets and Liabilities equal to the outstanding principal amount and accrued interest on the related short-term floating rate securities issued by the Trust. Interest on the underlying municipal bond is recorded as investment income on the Fund’s Statement of Operations, while interest payable on the related short-term floating rate securities is recorded as interest expense. At July 31, 2014, municipal bond holdings with a value of $403,013,586 shown on the Fund’s Statement of Investments are held by such Trusts and serve as the underlying municipal bonds for the related $235,075,000 in short-term floating rate securities issued and outstanding at that date.
At July 31, 2014, the inverse floating rate securities associated with tender option bond transactions accounted for as secured borrowings were as follows:
| | | | | | | | | | | | | | | | |
Principal
Amount | | | Inverse Floater1 | | Coupon
Rate2 | | | Maturity
Date | | | Value | |
| | |
| | $ 10,000,000 | | | Birmingham, AL Commercial Devel. Authority (Civic Center Improvements) RIBS | | | 10.260% | | | | 4/1/41 | | | $ | 11,961,800 | |
| | 5,000,000 | | | CA Health Facilities Financing Authority ROLs | | | 17.968 | | | | 7/1/39 | | | | 8,175,200 | |
| | 7,500,000 | | | CA Public Works | | | 8.500 | | | | 12/1/31 | | | | 10,898,700 | |
| | 3,000,000 | | | Chicago, IL Park District (Harbor Facilities) DRIVERS | | | 8.257 | | | | 1/1/37 | | | | 3,429,300 | |
| | 5,000,000 | | | Chicago, IL Park District (Harbor Facilities) DRIVERS | | | 8.257 | | | | 1/1/40 | | | | 5,651,400 | |
| | 5,000,000 | | | Clark County, NV Water Reclamation District DRIVERS | | | 15.967 | | | | 7/1/38 | | | | 7,863,000 | |
| | 10,000,000 | | | East Bay, CA Municipal Utility District (Water System) ROLs3 | | | 8.110 | | | | 6/1/36 | | | | 12,733,800 | |
| | 3,480,000 | | | FL COP (Dept. of Management Services) DRIVERS | | | 12.142 | | | | 8/1/28 | | | | 4,913,830 | |
| | 4,000,000 | | | Greater Orlando, FL Aviation Authority ROLs3 | | | 15.331 | | | | 10/1/32 | | | | 5,214,400 | |
| | 4,000,000 | | | Houston, TX Airport System ROLs3 | | | 17.099 | | | | 7/1/39 | | | | 6,118,880 | |
61 OPPENHEIMER ROCHESTER AMT-FREE MUNICIPAL FUND
| | |
| |
| NOTES TO FINANCIAL STATEMENTS Continued | | |
|
1. Significant Accounting Policies (Continued) |
| | | | | | | | | | | | | | | | |
Principal
Amount | | | Inverse Floater1 | | Coupon
Rate2 | | | Maturity
Date | | | Value | |
| | |
| | $ 5,000,000 | | | IL Finance Authority (Northwestern Memorial Hospital) DRIVERS | | | 18.565% | | | | 8/15/39 | | | $ | 8,115,200 | |
| | 1,665,000 | | | IL Finance Authority ROLs3 | | | 15.791 | | | | 5/15/29 | | | | 2,048,433 | |
| | 3,335,000 | | | IL Finance Authority ROLs3 | | | 11.860 | | | | 12/1/30 | | | | 4,368,683 | |
| | 3,650,000 | | | MI Hospital Finance Authority ROLs3 | | | 19.242 | | | | 12/1/23 | | | | 6,114,334 | |
| | 10,875,000 | | | NH H&EFA (LRG Healthcare) DRIVERS | | | 8.689 | | | | 10/1/34 | | | | 12,768,990 | |
| | 5,215,000 | | | NH H&EFA ROLs3 | | | 22.133 | | | | 4/1/38 | | | | 8,674,631 | |
| | 2,500,000 | | | Orange County, FL School Board ROLs3 | | | 16.949 | | | | 8/1/34 | | | | 3,581,800 | |
| | 3,100,000 | | | Pima County, AZ IDA (Metro Police Facility) DRIVERS | | | 15.590 | | | | 7/1/39 | | | | 3,777,288 | |
| | 3,335,000 | | | San Francisco, CA City & County COP ROLs3 | | | 11.840 | | | | 10/1/33 | | | | 4,384,791 | |
| | 4,000,000 | | | Tarrant County, TX Cultural Education Facilities Finance Corp. ROLs3 | | | 18.656 | | | | 11/15/29 | | | | 6,544,320 | |
| | 3,000,000 | | | University of Illinois (Auxiliary Facilities Systems) DRIVERS | | | 17.699 | | | | 4/1/38 | | | | 4,716,000 | |
| | 7,500,000 | | | WA Austin Trust Various States Inverse Certificates | | | 9.889 | | | | 10/1/33 | | | | 9,385,650 | |
| | 11,265,000 | | | WA Health Care Facilities Authority (Catholic Health Initiatives) | | | 14.681 | | | | 10/1/36 | | | | 16,498,156 | |
| | | | | | | | | | | | | | | | |
| | | | | | | | | | | | | | $ | 167,938,586 | |
| | | | | | | | | | | | | | | | |
1. For a list of abbreviations used in the Inverse Floater table see the Portfolio Abbreviations table at the end of the Statement of Investments.
2. Represents the current interest rate for the inverse floating rate security.
3. Represents an inverse floating rate security that is subject to a shortfall/reimbursement agreement.
The Fund may also purchase an inverse floating rate security created as part of a tender option bond transaction not initiated by the Fund when a third party, such as a municipal issuer or financial institution, transfers an underlying municipal bond to a Trust. For financial reporting purposes, the Fund includes the inverse floating rate security related to such transaction on its Statement of Investments and as an asset on its Statement of Assets and Liabilities, and interest on the security is recorded as investment income on the Fund’s Statement of Operations.
The Fund may invest in inverse floating rate securities with any degree of leverage (as measured by the outstanding principal amount of related short-term floating rate securities). However, the Fund may only expose up to 20% of its total assets to the effects of leverage from its investments in inverse floating rate securities. This limitation is measured by comparing the aggregate principal amount of the short-term floating rate securities that are related to the inverse floating rate securities held by the Fund to the total assets of the Fund. The Fund’s exposure to the effects of leverage from its investments in inverse floating rate securities amounts to $235,075,000 or 10.71% of its total assets as of July 31, 2014.
Securities on a When-Issued or Delayed Delivery Basis. The Fund may purchase securities on a “when-issued” basis, and may purchase or sell securities on a “delayed delivery” basis. “When-issued” or “delayed delivery” refers to securities whose terms and indenture are available and for which a market exists, but which are not available for immediate delivery. Delivery and payment for securities that have been purchased by the Fund
62 OPPENHEIMER ROCHESTER AMT-FREE MUNICIPAL FUND
|
1. Significant Accounting Policies (Continued) |
on a when-issued basis normally takes place within six months and possibly as long as two years or more after the trade date. During this period, such securities do not earn interest, are subject to market fluctuation and may increase or decrease in value prior to their delivery. The purchase of securities on a when-issued basis may increase the volatility of the Fund’s net asset value to the extent the Fund executes such transactions while remaining substantially fully invested. When the Fund engages in when-issued or delayed delivery transactions, it relies on the buyer or seller, as the case may be, to complete the transaction. Their failure to do so may cause the Fund to lose the opportunity to obtain or dispose of the security at a price and yield it considers advantageous. The Fund may also sell securities that it purchased on a when-issued basis or forward commitment prior to settlement of the original purchase.
As of July 31, 2014, the Fund had purchased securities issued on a when-issued or delayed delivery basis and sold securities issued on a delayed delivery basis as follows:
| | | | |
| | | When-Issued or Delayed Delivery Basis Transactions | |
| |
Purchased securities | | | $2,172,460 | |
Sold securities | | | 1,991,118 | |
Credit Risk. The Fund invests in high-yield, non-investment-grade bonds, which may be subject to a greater degree of credit risk. Credit risk relates to the ability of the issuer to meet interest or principal payments or both as they become due. The Fund may acquire securities that have missed an interest payment, and is not obligated to dispose of securities whose issuers or underlying obligors subsequently miss an interest payment. Information concerning securities not accruing interest as of July 31, 2014 is as follows:
| | | | |
Cost | | | $100,808,454 | |
Market Value | | | $43,578,095 | |
Market Value as % of Net Assets | | | 2.24% | |
The Fund has entered into forbearance agreements with certain obligors under which the Fund has agreed to temporarily forego receipt of the original principal or coupon interest rates. As of July 31, 2014, securities with an aggregate market value of $789,233, representing 0.04% of the Fund’s net assets, were subject to these forbearance agreements. Interest payments of $179,550 are contractually owed to the Fund with respect to these securities and will not be collected under these forbearance agreements.
Allocation of Income, Expenses, Gains and Losses. Income, expenses (other than those attributable to a specific class), gains and losses are allocated on a daily basis to each class of shares based upon the relative proportion of net assets represented by such class. Operating expenses directly attributable to a specific class are charged against the operations of that class.
63 OPPENHEIMER ROCHESTER AMT-FREE MUNICIPAL FUND
| | |
| |
| NOTES TO FINANCIAL STATEMENTS Continued | | |
|
1. Significant Accounting Policies (Continued) |
Federal Taxes. The Fund intends to comply with provisions of the Internal Revenue Code applicable to regulated investment companies and to distribute substantially all of its investment company taxable income, including any net realized gain on investments not offset by capital loss carryforwards, if any, to shareholders. Therefore, no federal income or excise tax provision is required. The Fund files income tax returns in U.S. federal and applicable state jurisdictions. The statute of limitations on the Fund’s tax return filings generally remain open for the three preceding fiscal reporting period ends.
The tax components of capital shown in the following table represent distribution requirements the Fund must satisfy under the income tax regulations, losses the Fund may be able to offset against income and gains realized in future years and unrealized appreciation or depreciation of securities and other investments for federal income tax purposes.
| | | | | | | | | | | | |
Undistributed Net Investment Income | | Undistributed Long-Term Gain | | | Accumulated Loss Carryforward1,2,3 | | | Net Unrealized Depreciation Based on cost of Securities and Other Investments for Federal Income Tax Purposes | |
| |
$70,441,829 | | | $— | | | | $468,512,668 | | | | $256,033,241 | |
1. As of July 31, 2014, the Fund had $468,512,668 of net capital loss carryforwards available to offset future realized capital gains, if any, and thereby reduce future taxable gain distributions. Details of the capital loss carryforwards are included in the table below. Capital loss carryovers with no expiration, if any, must be utilized prior to those with expiration dates.
| | | | |
| Expiring | | | |
| |
2016 | | $ | 38,527,923 | |
2017 | | | 105,610,446 | |
2018 | | | 177,767,456 | |
2019 | | | 12,340,869 | |
No expiration | | | 134,265,974 | |
| | | | |
Total | | $ | 468,512,668 | |
| | | | |
2. During the fiscal year ended July 31, 2014, the Fund did not utilize any capital loss carryforward.
3. During the fiscal year ended July 31, 2013, the Fund utilized $12,137,570 of capital loss carryforward to offset capital gains realized in that fiscal year.
Net investment income (loss) and net realized gain (loss) may differ for financial statement and tax purposes. The character of dividends and distributions made during the fiscal year from net investment income or net realized gains may differ from their ultimate characterization for federal income tax purposes. Also, due to timing of dividends and distributions, the fiscal year in which amounts are distributed may differ from the fiscal year in which the income or net realized gain was recorded by the Fund.
Accordingly, the following amounts have been reclassified for July 31, 2014. Net assets of the Fund were unaffected by the reclassifications.
64 OPPENHEIMER ROCHESTER AMT-FREE MUNICIPAL FUND
|
1. Significant Accounting Policies (Continued) |
| | | | | | | | |
Reduction to Paid-in Capital | | Reduction to Accumulated Net Investment Income | | | Reduction to Accumulated Net Realized Loss on Investments | |
| |
$1,150,332 | | | $1,855,070 | | | | $3,005,402 | |
The tax character of distributions paid during the years ended July 31, 2014 and July 31, 2013 was as follows:
| | | | | | | | |
| | | Year Ended July 31, 2014 | | | Year Ended July 31, 2013 | |
| |
Distributions paid from: | | | | | | | | |
Exempt-interest dividends | | $ | 119,404,348 | | | $ | 143,385,602 | |
Ordinary income | | | 1,462,707 | | | | 2,772,770 | |
| | | | |
Total | | $ | 120,867,055 | | | $ | 146,158,372 | |
| | | | |
The aggregate cost of securities and other investments and the composition of unrealized appreciation and depreciation of securities and other investments for federal income tax purposes as of July 31, 2014 are noted in the following table. The primary difference between book and tax appreciation or depreciation of securities and other investments, if applicable, is attributable to the tax deferral of losses or tax realization of financial statement unrealized gain or loss.
| | | | |
Federal tax cost of securities | | $ | 2,183,504,686 1 | |
| | | | |
Gross unrealized appreciation | | $ | 142,345,724 | |
Gross unrealized depreciation | | | (398,378,965) | |
| | | | |
Net unrealized depreciation | | $ | (256,033,241) | |
| | | | |
1. The Federal tax cost of securities does not include cost of $225,772,820, which has otherwise been recognized for financial reporting purposes, related to bonds placed into trusts in conjunction with certain investment transactions. See the Inverse Floating Rate Securities note above.
Trustees’ Compensation. The Fund has adopted an unfunded retirement plan (the “Plan”) for the Fund’s independent trustees. Benefits are based on years of service and fees paid to each trustee during their period of service. The Plan was frozen with respect to adding new participants effective December 31, 2006 (the “Freeze Date”) and existing Plan Participants as of the Freeze Date will continue to receive accrued benefits under the Plan. Active independent trustees as of the Freeze Date have each elected a distribution method with respect to their benefits under the Plan. During the year ended July 31, 2014, the Fund’s projected benefit obligations, payments to retired trustees and accumulated liability were as follows:
| | | | |
Projected Benefit Obligations Increased | | $ | 7,097 | |
Payments Made to Retired Trustees | | | 16,253 | |
Accumulated Liability as of July 31, 2014 | | | 151,637 | |
65 OPPENHEIMER ROCHESTER AMT-FREE MUNICIPAL FUND
| | |
| |
| NOTES TO FINANCIAL STATEMENTS Continued | | |
|
1. Significant Accounting Policies (Continued) |
The Board of Trustees has adopted a compensation deferral plan for independent trustees that enables trustees to elect to defer receipt of all or a portion of the annual compensation they are entitled to receive from the Fund. For purposes of determining the amount owed to the Trustee under the plan, deferred amounts are treated as though equal dollar amounts had been invested in shares of the Fund or in other Oppenheimer funds selected by the Trustee. The Fund purchases shares of the funds selected for deferral by the Trustee in amounts equal to his or her deemed investment, resulting in a Fund asset equal to the deferred compensation liability. Such assets are included as a component of “Other” within the asset section of the Statement of Assets and Liabilities. Deferral of trustees’ fees under the plan will not affect the net assets of the Fund, and will not materially affect the Fund’s assets, liabilities or net investment income per share. Amounts will be deferred until distributed in accordance with the compensation deferral plan.
Dividends and Distributions to Shareholders. Dividends and distributions to shareholders, which are determined in accordance with income tax regulations and may differ from U.S. generally accepted accounting principles, are recorded on the ex-dividend date. Income distributions, if any, are declared daily and paid monthly. Capital gain distributions, if any, are declared and paid annually.
Investment Income. Interest income is recognized on an accrual basis. Discount and premium, which are included in interest income on the Statement of Operations, are amortized or accreted daily.
Custodian Fees. “Custodian fees and expenses” in the Statement of Operations may include interest expense incurred by the Fund on any cash overdrafts of its custodian account during the period. Such cash overdrafts may result from the effects of failed trades in portfolio securities and from cash outflows resulting from unanticipated shareholder redemption activity. The Fund pays interest to its custodian on such cash overdraft at a rate equal to the 1 Month LIBOR Rate plus 2.00%. The “Reduction to custodian expenses” line item, if applicable, represents earnings on cash balances maintained by the Fund during the period. Such interest expense and other custodian fees may be paid with these earnings.
Security Transactions. Security transactions are recorded on the trade date. Realized gains and losses on securities sold are determined on the basis of identified cost.
Indemnifications. The Fund’s organizational documents provide current and former trustees and officers with a limited indemnification against liabilities arising in connection with the performance of their duties to the Fund. In the normal course of business, the Fund may also enter into contracts that provide general indemnifications. The Fund’s maximum exposure under these arrangements is unknown as this would be dependent on future claims that may be made against the Fund. The risk of material loss from such claims is considered remote.
66 OPPENHEIMER ROCHESTER AMT-FREE MUNICIPAL FUND
|
1. Significant Accounting Policies (Continued) |
Other. The preparation of financial statements in conformity with accounting principles generally accepted in the United States of America requires management to make estimates and assumptions that affect the reported amounts of assets and liabilities and disclosure of contingent assets and liabilities at the date of the financial statements and the reported amounts of increases and decreases in net assets from operations during the reporting period. Actual results could differ from those estimates.
The Fund calculates the net asset value of its shares as of the close of the New York Stock Exchange (the “Exchange”), normally 4:00 P.M. Eastern time, on each day the Exchange is open for trading.
The Fund’s Board has adopted procedures for the valuation of the Fund’s securities and has delegated the day-to-day responsibility for valuation determinations under those procedures to the Manager. The Manager has established a Valuation Committee which is responsible for determining a “fair valuation” for any security for which market quotations are not “readily available.” The Valuation Committee’s fair valuation determinations are subject to review, approval and ratification by the Fund’s Board at its next regularly scheduled meeting covering the calendar quarter in which the fair valuation was determined.
Valuation Methods and Inputs
Securities are valued using unadjusted quoted market prices, when available, as supplied primarily by third party pricing services or dealers.
The following methodologies are used to determine the market value or the fair value of the types of securities described below:
Securities traded on a registered U.S. securities exchange (including exchange-traded derivatives other than futures and futures options) are valued based on the last sale price of the security reported on the principal exchange on which it is traded, prior to the time when the Fund’s assets are valued. In the absence of a sale, the security is valued at the last sale price on the prior trading day, if it is within the spread of the current day’s closing “bid” and “asked” prices, and if not, at the current day’s closing bid price. A security of a foreign issuer traded on a foreign exchange, but not listed on a registered U.S. securities exchange, is valued based on the last sale price on the principal exchange on which the security is traded, as identified by the third party pricing service used by the Manager, prior to the time when the Fund’s assets are valued. If the last sale price is unavailable, the security is valued at the most recent official closing price on the principal exchange on which it is traded. If the last sales price or official closing price for a foreign security is not available, the security is valued at the mean between the bid and asked price per the exchange or, if not available from the exchange, obtained from two dealers. If bid and asked prices are not available from either the exchange or two dealers, the security is valued by using one of the following methodologies (listed in order of priority): (1) using a bid from the exchange, (2) the mean between the bid and asked price as provided by a single dealer, or (3) a bid from a single dealer.
Shares of a registered investment company that are not traded on an exchange are valued at that investment company’s net asset value per share.
67 OPPENHEIMER ROCHESTER AMT-FREE MUNICIPAL FUND
| | |
| |
| NOTES TO FINANCIAL STATEMENTS Continued | | |
|
2. Securities Valuation (Continued) |
Corporate and government debt securities (of U.S. or foreign issuers) and municipal debt securities, event-linked bonds, loans, mortgage-backed securities, collateralized mortgage obligations, and asset-backed securities are valued at the mean between the “bid” and “asked” prices utilizing evaluated prices obtained from third party pricing services or broker-dealers who may use matrix pricing methods to determine the evaluated prices.
Short-term money market type debt securities with a remaining maturity of sixty days or less are valued at cost adjusted by the amortization of discount or premium to maturity (amortized cost), which approximates market value. Short-term debt securities with a remaining maturity in excess of sixty days are valued at the mean between the “bid” and “asked” prices utilizing evaluated prices obtained from third party pricing services or broker-dealers.
A description of the standard inputs that may generally be considered by the third party pricing vendors in determining their evaluated prices is provided below.
| | |
| Security Type | | Standard inputs generally considered by third-party pricing vendors |
| Corporate debt, government debt, municipal, mortgage-backed and asset-backed securities | | Reported trade data, broker-dealer price quotations, benchmark yields, issuer spreads on comparable securities, the credit quality, yield, maturity, and other appropriate factors. |
| Loans | | Information obtained from market participants regarding reported trade data and broker-dealer price quotations. |
| Event-linked bonds | | Information obtained from market participants regarding reported trade data and broker-dealer price quotations. |
If a market value or price cannot be determined for a security using the methodologies described above, or if, in the “good faith” opinion of the Manager, the market value or price obtained does not constitute a “readily available market quotation,” or a significant event has occurred that would materially affect the value of the security the security is fair valued either (i) by a standardized fair valuation methodology applicable to the security type or the significant event as previously approved by the Valuation Committee and the Fund’s Board or (ii) as determined in good faith by the Manager’s Valuation Committee. The Valuation Committee considers all relevant facts that are reasonably available, through either public information or information available to the Manager, when determining the fair value of a security. Fair value determinations by the Manager are subject to review, approval and ratification by the Fund’s Board at its next regularly scheduled meeting covering the calendar quarter in which the fair valuation was determined. Those fair valuation standardized methodologies include, but are not limited to, valuing securities at the last sale price or initially at cost and subsequently adjusting the value based on: changes in company specific fundamentals, changes in an appropriate securities index, or changes in the value of similar securities which may be further adjusted for any discounts related to security-specific resale restrictions. When possible, such methodologies use observable market inputs such as unadjusted quoted prices of similar securities, observable interest rates, currency rates and yield curves. The methodologies used for valuing securities are not necessarily an indication of the risks associated with investing in those securities nor can it be assured that the Fund can obtain the fair value assigned to a security if it were to sell the security.
68 OPPENHEIMER ROCHESTER AMT-FREE MUNICIPAL FUND
|
2. Securities Valuation (Continued) |
To assess the continuing appropriateness of security valuations, the Manager, or its third party service provider who is subject to oversight by the Manager, regularly compares prior day prices, prices on comparable securities, and sale prices to the current day prices and challenges those prices exceeding certain tolerance levels with the third party pricing service or broker source. For those securities valued by fair valuations, whether through a standardized fair valuation methodology or a fair valuation determination, the Valuation Committee reviews and affirms the reasonableness of the valuations based on such methodologies and fair valuation determinations on a regular basis after considering all relevant information that is reasonably available.
Classifications
Each investment asset or liability of the Fund is assigned a level at measurement date based on the significance and source of the inputs to its valuation. Various data inputs are used in determining the value of each of the Fund’s investments as of the reporting period end. These data inputs are categorized in the following hierarchy under applicable financial accounting standards:
1) Level 1-unadjusted quoted prices in active markets for identical assets or liabilities (including securities actively traded on a securities exchange)
2) Level 2-inputs other than unadjusted quoted prices that are observable for the asset or liability (such as unadjusted quoted prices for similar assets and market corroborated inputs such as interest rates, prepayment speeds, credit risks, etc.)
3) Level 3-significant unobservable inputs (including the Manager’s own judgments about assumptions that market participants would use in pricing the asset or liability).
The inputs used for valuing securities are not necessarily an indication of the risks associated with investing in those securities.
The table below categorizes amounts that are included in the Fund’s Statement of Assets and Liabilities as of July 31, 2014 based on valuation input level:
| | | | | | | | | | | | | | | | |
| | | Level 1— Unadjusted Quoted Prices | | | Level 2— Other Significant Observable Inputs | | | Level 3— Significant Unobservable Inputs | | | Value | |
| |
Assets Table | |
Investments, at Value: | |
Municipal Bonds and Notes | | | | | | | | | | | | | | | | |
Alabama | | $ | — | | | $ | 72,733,107 | | | $ | — | | | $ | 72,733,107 | |
Alaska | | | — | | | | 594,788 | | | | — | | | | 594,788 | |
Arizona | | | — | | | | 68,497,006 | | | | — | | | | 68,497,006 | |
Arkansas | | | — | | | | 303,168 | | | | 1,270,546 | | | | 1,573,714 | |
California | | | — | | | | 327,881,221 | | | | — | | | | 327,881,221 | |
Colorado | | | — | | | | 36,897,943 | | | | 440,000 | | | | 37,337,943 | |
Connecticut | | | — | | | | 4,427,681 | | | | — | | | | 4,427,681 | |
Delaware | | | — | | | | 6,892,006 | | | | — | | | | 6,892,006 | |
District of Columbia | | | — | | | | 15,452,295 | | | | — | | | | 15,452,295 | |
Florida | | | — | | | | 250,835,532 | | | | 1,827,760 | | | | 252,663,292 | |
Georgia | | | — | | | | 16,540,420 | | | | — | | | | 16,540,420 | |
Idaho | | | — | | | | 1,124,458 | | | | — | | | | 1,124,458 | |
69 OPPENHEIMER ROCHESTER AMT-FREE MUNICIPAL FUND
| | |
| |
| NOTES TO FINANCIAL STATEMENTS Continued | | |
|
2. Securities Valuation (Continued) |
| | | | | | | | | | | | | | | | |
| | | Level 1— Unadjusted Quoted Prices | | | Level 2— Other Significant Observable Inputs | | | Level 3— Significant Unobservable Inputs | | | Value | |
| |
Municipal Bonds and Notes (Continued) | | | | | | | | | | | | | | | | |
Illinois | | $ | — | | | $ | 241,494,011 | | | $ | — | | | $ | 241,494,011 | |
Indiana | | | — | | | | 36,924,387 | | | | — | | | | 36,924,387 | |
Iowa | | | — | | | | 4,761,076 | | | | — | | | | 4,761,076 | |
Kansas | | | — | | | | 3,342,060 | | | | — | | | | 3,342,060 | |
Kentucky | | | — | | | | 104,132 | | | | — | | | | 104,132 | |
Louisiana | | | — | | | | 47,900,336 | | | | — | | | | 47,900,336 | |
Maine | | | — | | | | 8,001,856 | | | | — | | | | 8,001,856 | |
Maryland | | | — | | | | 2,313,427 | | | | — | | | | 2,313,427 | |
Massachusetts | | | — | | | | 9,552,375 | | | | 2 | | | | 9,552,377 | |
Michigan | | | — | | | | 73,811,630 | | | | — | | | | 73,811,630 | |
Minnesota | | | — | | | | 4,178,069 | | | | — | | | | 4,178,069 | |
Mississippi | | | — | | | | 1,031,238 | | | | — | | | | 1,031,238 | |
Missouri | | | — | | | | 58,629,943 | | | | — | | | | 58,629,943 | |
Montana | | | — | | | | 9,647,059 | | | | — | | | | 9,647,059 | |
Nebraska | | | — | | | | 14,219,220 | | | | — | | | | 14,219,220 | |
Nevada | | | — | | | | 37,407,823 | | | | — | | | | 37,407,823 | |
New Hampshire | | | — | | | | 57,459,993 | | | | — | | | | 57,459,993 | |
New Jersey | | | — | | | | 3,356,305 | | | | — | | | | 3,356,305 | |
New Mexico | | | — | | | | 3,692,199 | | | | — | | | | 3,692,199 | |
New York | | | — | | | | 25,024,441 | | | | — | | | | 25,024,441 | |
North Carolina | | | — | | | | 20,286 | | | | — | | | | 20,286 | |
Ohio | | | — | | | | 158,043,988 | | | | — | | | | 158,043,988 | |
Oklahoma | | | — | | | | 13,099,414 | | | | — | | | | 13,099,414 | |
Oregon | | | — | | | | 892,131 | | | | — | | | | 892,131 | |
Pennsylvania | | | — | | | | 19,644,169 | | | | — | | | | 19,644,169 | |
Rhode Island | | | — | | | | 19,837,705 | | | | — | | | | 19,837,705 | |
South Carolina | | | — | | | | 10,468,299 | | | | 5,214,335 | | | | 15,682,634 | |
South Dakota | | | — | | | | 546,215 | | | | — | | | | 546,215 | |
Tennessee | | | — | | | | 12,524,834 | | | | — | | | | 12,524,834 | |
Texas | | | — | | | | 101,684,150 | | | | — | | | | 101,684,150 | |
U.S. Possessions | | | — | | | | 224,618,349 | | | | — | | | | 224,618,349 | |
Utah | | | — | | | | 6,556,303 | | | | — | | | | 6,556,303 | |
Vermont | | | — | | | | 1,287,709 | | | | — | | | | 1,287,709 | |
Virginia | | | — | | | | 21,903,382 | | | | — | | | | 21,903,382 | |
Washington | | | — | | | | 69,870,314 | | | | — | | | | 69,870,314 | |
West Virginia | | | — | | | | 3,169,712 | | | | — | | | | 3,169,712 | |
Wisconsin | | | — | | | | 35,284,086 | | | | 2 | | | | 35,284,088 | |
Corporate Bonds and Notes | | | — | | | | 9,369 | | | | — | | | | 9,369 | |
| | | | |
Total Assets | | $ | — | | | $ | 2,144,491,620 | | | $ | 8,752,645 | | | $ | 2,153,244,265 | |
| | | | |
Forward currency exchange contracts and futures contracts, if any, are reported at their unrealized appreciation/depreciation at measurement date, which represents the change in the contract’s value from trade date. All additional assets and liabilities included in the above table are reported at their market value at measurement date.
The table below shows the transfers between Level 2 and Level 3. The Fund’s policy is to recognize transfers in and transfers out as of the beginning of the reporting period.
70 OPPENHEIMER ROCHESTER AMT-FREE MUNICIPAL FUND
|
2. Securities Valuation (Continued) |
| | | | | | | | |
| | | Transfers out of Level 2* | | | Transfers into
Level 3* | |
Assets Table | | | | | | | | |
Investments, at Value: | | | | | | | | |
Municipal Bonds and Notes | | | | | | | | |
Massachusetts | | $ | (8,428 | ) | | | 8,428 | |
Wisconsin | | | (2 | ) | | | 2 | |
Total Assets | | $ | (8,430 | ) | | $ | 8,430 | |
| * | Transferred from Level 2 to Level 3 because of the lack of observable market data. |
3. Shares of Beneficial Interest
The Fund has authorized an unlimited number of $0.001 par value shares of beneficial interest of each class. Transactions in shares of beneficial interest were as follows:
| | | | | | | | | | | | | | | | |
| | | Year Ended July 31, 2014 | | | Year Ended July 31, 2013 | |
| | | Shares | | | Amount | | | Shares | | | Amount | |
| |
Class A | | | | | | | | | | | | | | | | |
Sold | | | 47,578,182 | | | $ | 315,053,184 | | | | 67,539,643 | | | $ | 490,421,994 | |
Dividends and/or distributions reinvested | | | 10,071,602 | | | | 67,102,720 | | | | 11,041,559 | | | | 79,439,013 | |
Redeemed | | | (105,464,626 | ) | | | (697,619,070) | | | | (102,490,481 | ) | | | (733,637,109) | |
| | | | |
Net decrease | | | (47,814,842 | ) | | $ | (315,463,166) | | | | (23,909,279 | ) | | $ | (163,776,102) | |
| | | | |
| | | | | | | | | | | | | | | | |
| |
Class B | | | | | | | | | | | | | | | | |
Sold | | | 141,824 | | | $ | 928,576 | | | | 210,107 | | | $ | 1,520,719 | |
Dividends and/or distributions reinvested | | | 149,679 | | | | 989,797 | | | | 173,861 | | | | 1,244,276 | |
Redeemed | | | (1,459,032 | ) | | | (9,627,423) | | | | (1,452,174 | ) | | | (10,387,884) | |
| | | | |
Net decrease | | | (1,167,529 | ) | | $ | (7,709,050) | | | | (1,068,206 | ) | | $ | (7,622,889) | |
| | | | |
| | | | | | | | | | | | | | | | |
| |
Class C | | | | | | | | | | | | | | | | |
Sold | | | 10,909,233 | | | $ | 71,971,242 | | | | 17,026,251 | | | $ | 122,036,482 | |
Dividends and/or distributions reinvested | | | 2,182,059 | | | | 14,438,697 | | | | 2,489,160 | | | | 17,798,699 | |
Redeemed | | | (26,250,333 | ) | | | (171,483,113) | | | | (25,043,403 | ) | | | (178,033,192) | |
| | | | |
Net decrease | | | (13,159,041 | ) | | $ | (85,073,174) | | | | (5,527,992 | ) | | $ | (38,198,011) | |
| | | | |
| | | | | | | | | | | | | | | | |
| |
Class Y | | | | | | | | | | | | | | | | |
Sold | | | 32,295,724 | | | $ | 213,705,171 | | | | 27,882,789 | | | $ | 202,484,452 | |
Dividends and/or distributions reinvested | | | 1,551,379 | | | | 10,336,390 | | | | 1,399,078 | | | | 10,061,869 | |
Redeemed | | | (27,373,258 | ) | | | (181,194,247) | | | | (39,602,756 | ) | | | (284,816,660) | |
| | | | |
Net increase (decrease) | | | 6,473,845 | | | $ | 42,847,314 | | | | (10,320,889 | ) | | $ | (72,270,339) | |
| | | | |
71 OPPENHEIMER ROCHESTER AMT-FREE MUNICIPAL FUND
| | |
| |
| NOTES TO FINANCIAL STATEMENTS Continued | | |
|
4. Purchases and Sales of Securities |
The aggregate cost of purchases and proceeds from sales of securities, other than short-term obligations, for the year ended July 31, 2014 were as follows:
| | | | | | | | | | |
| | | Purchases | | | | | Sales | |
| |
Investment securities | | | $238,918,163 | | | | | | $724,486,001 | |
5. Fees and Other Transactions with Affiliates
Management Fees. Under the investment advisory agreement, the Fund pays the Manager a management fee based on the daily net assets of the Fund at an annual rate as shown in the following table:
| | | | | | |
| Fee Schedule | | | | | |
Up to $200 million | | | 0.60 | % | | |
Next $100 million | | | 0.55 | | | |
Next $200 million | | | 0.50 | | | |
Next $250 million | | | 0.45 | | | |
Next $250 million | | | 0.40 | | | |
Over $1 billion | | | 0.35 | | | |
Sub-Adviser Fees. The Manager has retained the Sub-Adviser to provide the day-to-day portfolio management of the Fund. Under the Sub-Advisory Agreement, the Manager pays the Sub-Adviser an annual fee in monthly installments, equal to a percentage of the investment management fee collected by the Manager from the Fund, which shall be calculated after any investment management fee waivers. The fee paid to the Sub-Adviser is paid by the Manager, not by the Fund.
Transfer Agent Fees. OFI Global (the “Transfer Agent”) serves as the transfer and shareholder servicing agent for the Fund. The Fund pays the Transfer Agent a fee based on annual net assets. Fees incurred and average net assets for each class with respect to these services are detailed in the Statement of Operations and Financial Highlights, respectively.
Sub-Transfer Agent Fees. The Transfer Agent has retained Shareholder Services, Inc., a wholly-owned subsidiary of OFI (the “Sub-Transfer Agent”), to provide the day-to-day transfer agent and shareholder servicing of the Fund. Under the Sub-Transfer Agency Agreement, the Transfer Agent pays the Sub-Transfer Agent an annual fee in monthly installments, equal to a percentage of the transfer agent fee collected by the Transfer Agent from the Fund, which shall be calculated after any applicable fee waivers. The fee paid to the Sub-Transfer Agent is paid by the Transfer Agent, not by the Fund.
Distribution and Service Plan (12b-1) Fees. Under its General Distributor’s Agreement with the Fund, OppenheimerFunds Distributor, Inc. (the “Distributor”) acts as the Fund’s principal underwriter in the continuous public offering of the Fund’s classes of shares.
Service Plan for Class A Shares. The Fund has adopted a Service Plan (the “Plan”) for Class A shares under Rule
12b-1 of the Investment Company Act of 1940. Under the Plan, the Fund reimburses the Distributor for a portion of its costs incurred for services provided to
72 OPPENHEIMER ROCHESTER AMT-FREE MUNICIPAL FUND
|
5. Fees and Other Transactions with Affiliates (Continued) |
accounts that hold Class A shares. Reimbursement is made periodically at an annual rate of up to 0.25% of the daily net assets of Class A shares of the Fund. The Distributor currently uses all of those fees to pay dealers, brokers, banks and other financial institutions periodically for providing personal service and maintenance of accounts of their customers that hold Class A shares. Any unreimbursed expenses the Distributor incurs with respect to Class A shares in any fiscal year cannot be recovered in subsequent periods. Fees incurred by the Fund under the Plan are detailed in the Statement of Operations.
Distribution and Service Plans for Class B and Class C Shares. The Fund has adopted Distribution and Service Plans (the “Plans”) for Class B and Class C shares under Rule 12b-1 of the Investment Company Act of 1940 to compensate the Distributor for distributing those share classes, maintaining accounts and providing shareholder services. Under the Plans, the Fund pays the Distributor an annual asset-based sales charge of 0.75% on Class B and Class C shares daily net assets. The Fund also pays a service fee under the Plans at an annual rate of 0.25% of daily net assets. The Plans continue in effect from year to year only if the Fund’s Board of Trustees vote annually to approve its continuance at an in person meeting called for that purpose. Fees incurred by the Fund under the Plans are detailed in the Statement of Operations.
Sales Charges. Front-end sales charges and contingent deferred sales charges (“CDSC”) do not represent expenses of the Fund. They are deducted from the proceeds of sales of Fund shares prior to investment or from redemption proceeds prior to remittance, as applicable. The sales charges retained by the Distributor from the sale of shares and the CDSC retained by the Distributor on the redemption of shares is shown in the following table for the period indicated.
| | | | | | | | | | | | | | | | |
| Year Ended | | Class A Front-End Sales Charges Retained by Distributor | | | Class A Contingent Deferred Sales Charges Retained by Distributor | | | Class B Contingent Deferred Sales Charges Retained by Distributor | | | Class C Contingent Deferred Sales Charges Retained by Distributor | |
| |
July 31, 2014 | | | $143,583 | | | | $288,258 | | | | $70,350 | | | | $63,233 | |
Waivers and Reimbursements of Expenses. The Manager has voluntarily agreed to reimburse the Fund for a portion of the legal costs and fees incurred in connection with the pending litigation matters discussed in the “Pending Litigation” note which appears later in this report.
The Transfer Agent has contractually agreed to limit transfer and shareholder servicing agent fees for Classes B, C and Y shares to 0.35% of average annual net assets per class and for Class A shares to 0.30% of average annual net assets of the class.
73 OPPENHEIMER ROCHESTER AMT-FREE MUNICIPAL FUND
| | |
| |
| NOTES TO FINANCIAL STATEMENTS Continued | | |
|
5. Fees and Other Transactions with Affiliates (Continued) |
During the year ended July 31, 2014, the Transfer Agent waived transfer and shareholder servicing agent fees as follows:
| | | | |
Class A | | | $1,022 | |
Class C | | | 248 | |
Class Y | | | 105 | |
Some of these undertakings may be modified or terminated at any time; some may not be modified or terminated until after one year from the date of the current prospectus, as indicated therein.
6. Borrowings
The Fund can borrow money from banks in amounts up to one third of its total assets (including the amount borrowed) less all liabilities and indebtedness other than borrowings (meaning that the value of those assets must be at least 300% of the amount borrowed). The Fund can use those borrowings for investment-related purposes such as purchasing portfolio securities. The Fund also may borrow to meet redemption obligations or for temporary and emergency purposes. When the Fund invests borrowed money in portfolio securities, it is using a speculative investment technique known as leverage and changes in the value of the Fund’s investments will have a larger effect on its share price than if it did not borrow because of the effect of leverage.
The Fund can also use the borrowings for other investment-related purposes, including in connection with the Fund’s inverse floater investments as discussed in Note 1. The Fund may use the borrowings to reduce the leverage amount of, or unwind or “collapse” trusts that issued “inverse floaters” owned by the Fund, or in circumstances in which the Fund has entered into a shortfall and forbearance agreement with the sponsor of the inverse floater trust to meet the Fund’s obligation to reimburse the sponsor of the inverse floater for the difference between the liquidation value of the underlying bond and the amount due to holders of the short-term floating rate notes issued by the Trust. See the discussion in Note 1 (Inverse Floating Rate Securities) for additional information.
The Fund will pay interest and may pay other fees in connection with loans. If the Fund does borrow, it will be subject to greater expenses than funds that do not borrow. The interest on borrowed money and the other fees incurred in conjunction with loans are an expense that might reduce the Fund’s yield and return. Expenses incurred by the Fund with respect to interest on borrowings and commitment fees are disclosed separately or as other expenses on the Statement of Operations.
The Fund entered into a Revolving Credit and Security Agreement (the “Agreement”) with conduit lenders and Citibank N.A. which enables it to participate with certain other Oppenheimer funds in a committed, secured borrowing facility that permits borrowings of up to $2.0 billion, collectively, by the Oppenheimer Rochester Funds. To secure the loan, the Fund pledges investment securities in accordance with the terms of the Agreement. Securities held in collateralized accounts to cover these borrowings are noted in the Statement of Investments. Interest is charged to the Fund, based on its borrowings, at current commercial paper issuance rates (0.1594% as of July 31, 2014). The Fund pays additional fees annually
74 OPPENHEIMER ROCHESTER AMT-FREE MUNICIPAL FUND
|
6. Borrowings (Continued) |
to its lender on its outstanding borrowings to manage and administer the facility and is allocated its pro-rata share of an annual structuring fee and ongoing commitment fees both of which are based on the total facility size. Total fees and interest that are included in expenses on the Fund’s Statement of Operations related to its participation in the borrowing facility during the year ended July 31, 2014 equal 0.07% of the Fund’s average net assets on an annualized basis. The Fund has the right to prepay such loans and terminate its participation in the conduit loan facility at any time upon prior notice.
As of July 31, 2014, the Fund had borrowings outstanding at an interest rate of 0.1594%. Details of the borrowings for the year ended July 31, 2014 are as follows:
| | | | |
Average Daily Loan Balance | | $ | 28,007,945 | |
Average Daily Interest Rate | | | 0.1620 | % |
Fees Paid | | $ | 1,612,799 | |
Interest Paid | | $ | 58,707 | |
7. Reverse Repurchase Agreements
The Fund may engage in reverse repurchase agreements. A reverse repurchase agreement is the sale of one or more securities to a counterparty at an agreed-upon purchase price with the simultaneous agreement to repurchase those securities on a future date at a higher repurchase price. The repurchase price represents the repayment of the purchase price and interest accrued thereon over the term of the repurchase agreement. The cash received by the Fund in connection with a reverse repurchase agreement may be used for investment-related purposes such as purchasing portfolio securities or for other purposes such as those described in the preceding “Borrowings” note.
The Fund entered into a Committed Repurchase Transaction Facility (the “Facility”) with J.P. Morgan Securities LLC (the “counterparty’) which enables it to participate with certain other Oppenheimer funds in a committed reverse repurchase agreement facility that permits aggregate outstanding reverse repurchase agreements of up to $750 million, collectively. Interest is charged to the Fund on the purchase price of outstanding reverse repurchase agreements at current LIBOR rates plus an applicable spread. The Fund is also allocated its pro-rata share of an annual structuring fee based on the total Facility size and ongoing commitment fees based on the total unused amount of the Facility. The Fund retains the economic exposure to fluctuations in the value of securities subject to reverse repurchase agreements under the Facility and therefore these transactions are considered secured borrowings for financial reporting purposes. The Fund also continues to receive the economic benefit of interest payments received on securities subject to reverse repurchase agreements, in the form of a direct payment from the counterparty. These payments are included in interest income on the Statement of Operations. Total fees and interest related to the Fund’s participation in the Facility during the year ended July 31, 2014 are included in expenses on the Fund’s Statement of Operations and equal 0.02% of the Fund’s average net assets on an annualized basis.
The securities subject to reverse repurchase agreements under the Facility are valued on a daily basis. To the extent this value, after adjusting for certain margin requirements of the Facility, exceeds the cash proceeds received, the Fund may request the counterparty to return
75 OPPENHEIMER ROCHESTER AMT-FREE MUNICIPAL FUND
| | |
| |
| NOTES TO FINANCIAL STATEMENTS Continued | | |
|
7. Reverse Repurchase Agreements (Continued) |
securities equal in margin value to this excess. To the extent that the cash proceeds received exceed the margin value of the securities subject to the transaction, the counterparty may request additional securities from the Fund. The Fund has the right to declare the first or fifteenth day of any calendar month as the repurchase date for any outstanding reverse repurchase agreement upon delivery of advanced notification and may also recall any security subject to such a transaction by substituting eligible securities of equal or greater margin value according to the Facility’s terms.
Securities subject to reverse repurchase agreements are separately noted in the Statement of Investments.
The Fund executed no transactions under the Facility during the year ended July 31, 2014.
Details of reverse repurchase agreement transactions for the year ended July 31, 2014 are as follows:
8. Pending Litigation
In 2009, seven class action lawsuits were filed in the U.S. District Court for the District of Colorado against OppenheimerFunds, Inc. (“OFI”), OppenheimerFunds Distributor, Inc., the Fund’s principal underwriter and distributor (the “Distributor”), and certain funds – including the Fund – advised by OFI Global Asset Management, Inc. and distributed by the Distributor (the “Defendant Funds”). The lawsuits also named as defendants certain officers and current and former trustees of the respective Defendant Funds. The lawsuits raised claims under federal securities law and alleged, among other things, that the disclosure documents of the respective Defendant Funds contained misrepresentations and omissions and that the respective Defendant Funds’ investment policies were not followed. The plaintiffs in these actions sought unspecified damages, equitable relief and awards of attorneys’ fees and litigation expenses. The Defendant Funds’ Boards of Trustees also engaged counsel to represent the Funds and the present and former Independent Trustees named in those suits. On March 5, 2014, the parties – including the Fund – in six of these lawsuits executed stipulations and agreements of settlement resolving those actions. On July 31, 2014, the court entered an order and final judgment approving the settlements as fair, reasonable and adequate. The settlements do not resolve a seventh outstanding lawsuit relating to Oppenheimer Rochester California Municipal Fund.
Other class action and individual lawsuits have been filed since 2008 in various state and federal courts against OFI and certain of its affiliates by investors seeking to recover investments they allegedly lost as a result of the “Ponzi” scheme run by Bernard L. Madoff and his firm, Bernard L. Madoff Investment Securities, LLC (“BLMIS”). Plaintiffs in these suits allege that they suffered losses as a result of their investments in several funds managed by an affiliate of OFI and assert a variety of claims, including breach of fiduciary duty, fraud, negligent misrepresentation, unjust enrichment, and violation of federal and state securities laws and regulations, among others. They seek unspecified damages, equitable relief and awards of attorneys’ fees and litigation expenses. Neither the Distributor, nor any of the
76 OPPENHEIMER ROCHESTER AMT-FREE MUNICIPAL FUND
|
8. Pending Litigation (Continued) |
Oppenheimer mutual funds, their independent trustees or directors are named as defendants in these lawsuits. None of the Oppenheimer mutual funds invested in any funds or accounts managed by Madoff or BLMIS. On February 28, 2011, a stipulation of partial settlement of three groups of consolidated putative class action lawsuits relating to these matters was filed in the U.S. District Court for the Southern District of New York. On August 19, 2011, the court entered an order and final judgment approving the settlement as fair, reasonable and adequate. In September 2011, certain parties filed notices of appeal from the court’s order approving the settlement. In June 2014, the appellate court affirmed the lower court’s order approving the settlement. Certain parties subsequently filed a petition for certiorari before the U.S. Supreme Court further challenging the settlement approval order. The settlement does not resolve other outstanding lawsuits against OFI and its affiliates relating to BLMIS.
OFI believes the lawsuits and appeals described above are without legal merit and, with the exception of actions it has settled, is defending against them vigorously. While it is premature to render any opinion as to the outcome in these lawsuits, or whether any costs that the Defendant Funds may bear in defending the suits might not be reimbursed by insurance, OFI believes that these suits should not impair the ability of OFI or the Distributor to perform their respective duties to the Fund, and that the outcome of all of the suits together should not have any material effect on the operations of any of the Oppenheimer mutual funds.
77 OPPENHEIMER ROCHESTER AMT-FREE MUNICIPAL FUND
| | |
| |
| REPORT OF INDEPENDENT REGISTERED PUBLIC ACCOUNTING FIRM | | |
The Board of Trustees and Shareholders of Oppenheimer Rochester AMT-Free Municipal Fund:
We have audited the accompanying statement of assets and liabilities of Oppenheimer Rochester AMT-Free Municipal Fund, formerly Oppenheimer AMT-Free Municipals, including the statement of investments, as of July 31, 2014, and the related statement of operations and cash flows for the year then ended, the statements of changes in net assets for each of the years in the two-year period then ended, and the financial highlights for each of the years or periods in the five-year period then ended. These financial statements and financial highlights are the responsibility of the Fund’s management. Our responsibility is to express an opinion on these financial statements and financial highlights based on our audits.
We conducted our audits in accordance with the standards of the Public Company Accounting Oversight Board (United States). Those standards require that we plan and perform the audit to obtain reasonable assurance about whether the financial statements and financial highlights are free of material misstatement. An audit includes examining, on a test basis, evidence supporting the amounts and disclosures in the financial statements. Our procedures included confirmation of securities owned as of July 31, 2014, by correspondence with the custodian, transfer agent and brokers, or by other appropriate auditing procedures where replies from brokers were not received. An audit also includes assessing the accounting principles used and significant estimates made by management, as well as evaluating the overall financial statement presentation. We believe that our audits provide a reasonable basis for our opinion.
In our opinion, the financial statements and financial highlights referred to above present fairly, in all material respects, the financial position of Oppenheimer Rochester AMT-Free Municipal Fund as of July 31, 2014, the results of its operations and cash flows for the year then ended, the changes in its net assets for each of the years in the two-year period then ended, and the financial highlights for each of the years or periods in the five-year period then ended, in conformity with U.S. generally accepted accounting principles.
KPMGLLP
Denver, Colorado
September 16, 2014
78 OPPENHEIMER ROCHESTER AMT-FREE MUNICIPAL FUND
| | |
| |
| FEDERAL INCOME TAX INFORMATION Unaudited | | |
In early 2014, if applicable, shareholders of record received information regarding all dividends and distributions paid to them by the Fund during calendar year 2013.
None of the dividends paid by the Fund during the fiscal year ended July 31, 2014 are eligible for the corporate dividend-received deduction. 98.79% of the dividends were derived from interest on municipal bonds and are not subject to federal income taxes. To the extent a shareholder is subject to any state or local tax laws, some or all of the dividends received may be taxable.
The foregoing information is presented to assist shareholders in reporting distributions received from the Fund to the Internal Revenue Service. Because of the complexity of the federal regulations which may affect your individual tax return and the many variations in state and local tax regulations, we recommend that you consult your tax advisor for specific guidance.
79 OPPENHEIMER ROCHESTER AMT-FREE MUNICIPAL FUND
| | |
| |
PORTFOLIO PROXY VOTING POLICIES AND PROCEDURES; UPDATES TO STATEMENTS OF INVESTMENTS Unaudited | | |
The Fund has adopted Portfolio Proxy Voting Policies and Procedures under which the Fund votes proxies relating to securities (“portfolio proxies”) held by the Fund. A description of the Fund’s Portfolio Proxy Voting Policies and Procedures is available (i) without charge, upon request, by calling the Fund toll-free at 1.800.CALL OPP (225.5677), (ii) on the Fund’s website at oppenheimerfunds.com, and (iii) on the SEC’s website at www.sec.gov. In addition, the Fund is required to file Form N-PX, with its complete proxy voting record for the 12 months ended June 30th, no later than August 31st of each year. The Fund’s voting record is available (i) without charge, upon request, by calling the Fund toll-free at 1.800.CALL OPP (225.5677), and (ii) in the Form N-PX filing on the SEC’s website at www.sec.gov.
The Fund files its complete schedule of portfolio holdings with the SEC for the first quarter and the third quarter of each fiscal year on Form N-Q. The Fund’s Form N-Q filings are available on the SEC’s website at www.sec.gov. Those forms may be reviewed and copied at the SEC’s Public Reference Room in Washington, D.C. Information on the operation of the Public Reference Room may be obtained by calling 1-800-SEC-0330.
Householding—Delivery of Shareholder Documents
This is to inform you about OppenheimerFunds’ “householding” policy. If more than one member of your household maintains an account in a particular fund, OppenheimerFunds will mail only one copy of the fund’s prospectus (or, if available, the fund’s summary prospectus), annual and semiannual report and privacy policy. The consolidation of these mailings, called householding, benefits your fund through reduced mailing expense, and benefits you by reducing the volume of mail you receive from OppenheimerFunds. Householding does not affect the delivery of your account statements.
Please note that we will continue to household these mailings for as long as you remain an OppenheimerFunds shareholder, unless you request otherwise. If you prefer to receive multiple copies of these materials, please call us at 1.800.CALL-OPP (225-5677). You may also notify us in writing or via email. We will begin sending you individual copies of the prospectus (or, if available, the summary prospectus), reports and privacy policy within 30 days of receiving your request to stop householding.
80 OPPENHEIMER ROCHESTER AMT-FREE MUNICIPAL FUND
| | |
| |
| TRUSTEES AND OFFICERS Unaudited | | |
| | |
| Name, Position(s) Held with the Fund, Length of Service, Year of Birth | | Principal Occupation(s) During the Past 5 Years; Other Trusteeships/Directorships Held; Number of Portfolios in the Fund Complex Currently Overseen |
| |
| INDEPENDENT TRUSTEES | | The address of each Trustee in the chart below is 6803 S. Tucson Way, Centennial, Colorado 80112-3924. Each Trustee serves for an indefinite term, or until his or her resignation, retirement, death or removal. |
| |
Brian F. Wruble, Chairman of the Board of Trustees (since 2007), Trustee (since 2005) Year of Birth: 1943 | | Director of Community Foundation of the Florida Keys (non-profit) (since July 2012); Chairman Emeritus and Non-Voting Trustee of The Jackson Laboratory (non-profit) (since August 2011); Director of Special Value Opportunities Fund, LLC (registered investment company) (affiliate of the Sub-Adviser’s parent company) (since September 2004); Member of Zurich Insurance Advisory Council (insurance) (since 2004); Treasurer (since 2007) and Trustee of the Institute for Advanced Study (non-profit educational institute) (since May 1992); Chairman (August 2007-August 2011) and Trustee (since August 1991) of the Board of Trustees of The Jackson Laboratory (non-profit); General Partner of Odyssey Partners, L.P. (hedge fund) (September 1995-December 2007); Special Limited Partner of Odyssey Investment Partners, LLC (private equity investment) (January 1999-September 2004). Oversees 52 portfolios in the OppenheimerFunds complex. Mr. Wruble has served on the Boards of certain Oppenheimer funds since April 2001, during which time he has become familiar with the Fund’s (and other Oppenheimer funds’) financial, accounting, regulatory and investment matters and has contributed to the Boards’ deliberations. |
| |
David K. Downes, Trustee (since 2007) Year of Birth: 1940 | | Director of THL Credit Inc. (since June 2009); Trustee of Employee Trusts (since January 2006); Chief Executive Officer and Board Member of Community Capital Management (investment management company) (since January 2004); President of The Community Reinvestment Act Qualified Investment Fund (investment management company) (since 2004); Director of Internet Capital Group (information technology company) (since October 2003); formerly, Independent Chairman GSK Employee Benefit Trust (April 2006- June 2013); Director of Correctnet (January 2006-2007); Independent Chairman of the Board of Trustees of Quaker Investment Trust (registered investment company) (2004-2007); Chief Operating Officer and Chief Financial Officer of Lincoln National Investment Companies, Inc. (subsidiary of Lincoln National Corporation, a publicly traded company) and Delaware Investments U.S., Inc. (investment management subsidiary of Lincoln National Corporation) (1993-2003); President, Chief Executive Officer and Trustee of Delaware Investment Family of Funds (1993-2003); President and Board Member of Lincoln National Convertible Securities Funds, Inc. and the Lincoln National Income Funds, TDC (1993-2003); Chairman and Chief Executive Officer of Retirement Financial Services, Inc. (registered transfer agent and investment adviser and subsidiary of Delaware Investments U.S., Inc.) (1993-2003); President and Chief Executive Officer of Delaware Service Company, Inc. (1995-2003); Chief Administrative Officer, Chief Financial Officer, Vice Chairman and Director of Equitable Capital Management Corporation (investment subsidiary of Equitable Life Assurance Society) (1985-1992); Corporate Controller of Merrill Lynch Company (financial services holding company) (1977-1985); held the following positions at the Colonial Penn Group, Inc. (insurance company): Corporate Budget Director (1974-1977), |
81 OPPENHEIMER ROCHESTER AMT-FREE MUNICIPAL FUND
| | |
| |
| TRUSTEES AND OFFICERS Unaudited / Continued | | |
| | |
David K. Downes, Continued | | Assistant Treasurer (1972-1974) and Director of Corporate Taxes (1969-1972); held the following positions at Price Waterhouse Company (financial services firm): Tax Manager (1967-1969), Tax Senior (1965-1967) and Staff Accountant (1963-1965); United States Marine Corps (1957-1959). Oversees 52 portfolios in the OppenheimerFunds complex. Mr. Downes has served on the Boards of certain Oppenheimer funds since December 2005, during which time he has become familiar with the Fund’s (and other Oppenheimer funds’) financial, accounting, regulatory and investment matters and has contributed to the Boards’ deliberations. |
| |
Matthew P. Fink, Trustee (since 2005) Year of Birth: 1941 | | Trustee of the Committee for Economic Development (policy research foundation) (2005-2011); Director of ICI Education Foundation (education foundation) (October 1991-August 2006); President of the Investment Company Institute (trade association) (October 1991-June 2004); Director of ICI Mutual Insurance Company (insurance company) (October 1991-June 2004); Author of The Rise of Mutual Funds: An Insider’s View published by Oxford University Press (second edition 2010). Oversees 52 portfolios in the OppenheimerFunds complex. Mr. Fink has served on the Boards of certain Oppenheimer funds since January 2005, during which time he has become familiar with the Fund’s (and other Oppenheimer funds’) financial, accounting, regulatory and investment matters and has contributed to the Boards’ deliberations. |
| |
Edmund P. Giambastiani, Jr., Trustee (since 2013) Year of Birth: 1948 | | Advisory Board Member of the Maxwell School of Citizenship and Public Affairs of Syracuse University (since April 2012); Director of Mercury Defense Systems Inc. (information technology) (August 2011-February 2013); Trustee of the U.S. Naval Academy Foundation (since November 2010); Advisory Board Member of the Massachusetts Institute of Technology Lincoln Laboratory (federally-funded research development center) (since May 2010); Director of The Boeing Company (aerospace and defense) (since October 2009); Trustee of MITRE Corporation (federally-funded research development center) (since September 2008); Independent Director of QinetiQ Group Plc (defense technology and security) (February 2008-August 2011); Director of Monster Worldwide, Inc. (on-line career services) (since January 2008, Lead Director since June 2011); Chairman of Alenia North America, Inc. (military and defense products) (January 2008-October 2009); Director of SRA International, Inc. (information technology and services) (January 2008-July 2011); President of Giambastiani Group LLC (national security and energy consulting) (since October 2007); United States Navy, career nuclear submarine officer (June 1970-October 2007), Vice Chairman of the Joint Chiefs of Staff (2005-October 2007), NATO Supreme Allied Commander Transformation (2003-2005), Commander, U.S. Joint Forces Command (2002-2005). Since his retirement from the U.S. Navy in October 2007, Admiral Giambastiani has also served on numerous U.S. Government advisory boards, investigations and task forces for the Secretaries of Defense, State and Interior and the Central Intelligence Agency. Oversees 52 portfolios in the OppenheimerFunds complex. Admiral Giambastiani has served on the Boards of certain Oppenheimer funds since February 2013, including as an Advisory Board Member for certain Oppenheimer funds, during which time he has become familiar with the Fund’s (and other Oppenheimer funds’) financial, accounting, regulatory and investment matters and has contributed to the Boards’ deliberations. For purposes of this report, Admiral Giambastiani is identified as a Trustee. |
82 OPPENHEIMER ROCHESTER AMT-FREE MUNICIPAL FUND
| | |
Mary F. Miller, Trustee (since 2004) Year of Birth: 1942 | | Trustee of International House (not-for-profit) (since June 2007); Trustee of the American Symphony Orchestra (not-for-profit) (October 1998-November 2011); and Senior Vice President and General Auditor of American Express Company (financial services company) (July 1998-February 2003). Oversees 52 portfolios in the OppenheimerFunds complex. Ms. Miller has served on the Boards of certain Oppenheimer funds since August 2004, during which time she has become familiar with the Fund’s (and other Oppenheimer funds’) financial, accounting, regulatory and investment matters and has contributed to the Boards’ deliberations. |
| |
Joel W. Motley, Trustee (since 2002) Year of Birth: 1952 | | Member of the Vestry of Trinity Wall Street (since April 2012); Director of Southern Africa Legal Services Foundation (since March 2012); Board Member of Pulitzer Center for Crisis Reporting (non-profit journalism) (since December 2010); Managing Director of Public Capital Advisors, LLC (privately-held financial advisor) (since January 2006); Managing Director of Carmona Motley, Inc. (privately-held financial advisor) (since January 2002); Director of Columbia Equity Financial Corp. (privately-held financial advisor) (2002-2007); Managing Director of Carmona Motley Hoffman Inc. (privately-held financial advisor) (January 1998-December 2001); Member of the Finance and Budget Committee of the Council on Foreign Relations, Member of the Investment Committee and Board of Human Rights Watch and Member of the Investment Committee and Board of Historic Hudson Valley. Oversees 52 portfolios in the OppenheimerFunds complex. Mr. Motley has served on the Boards of certain Oppenheimer funds since October 2002, during which time he has become familiar with the Fund’s (and other Oppenheimer funds’) financial, accounting, regulatory and investment matters and has contributed to the Boards’ deliberations. |
| |
Joanne Pace, Trustee (since 2012) Year of Birth: 1958 | | Board Director of Horizon Blue Cross Blue Shield of New Jersey (since November 2012); Advisory Board Director of The Alberleen Group LLC (since March 2012); Advisory Board Director of The Agile Trading Group LLC (since March 2012); Advisory Council Member of 100 Women in Hedge Funds (non-profit) (since December 2012); Advisory Council Member of Morgan Stanley Children’s Hospital (non-profit) (since May 2012); Board Director of The Komera Project (non-profit) (since April 2012); New York Advisory Board Director of Peace First (non-profit) (since March 2010); Senior Advisor of SECOR Asset Management, LP (2010-2011); Managing Director and Chief Operating Officer of Morgan Stanley Investment Management (2006-2010); Partner and Chief Operating Officer of FrontPoint Partners, LLC (hedge fund) (2005-2006); held the following positions at Credit Suisse: Managing Director (2003-2005); Global Head of Human Resources and member of Executive Board and Operating Committee (2004-2005), Global Head of Operations and Product Control (2003-2004); held the following positions at Morgan Stanley: Managing Director (1997-2003), Controller and Principal Accounting Officer (1999-2003); Chief Financial Officer (temporary assignment) for the Oversight Committee, Long Term Capital Management (1998-1999). Lead Independent Director and Chair of the Audit and Nominating Committee of The Global Chartist Fund, LLC of Oppenheimer Asset Management (2011-2012); Board Director of Managed Funds Association (2008-2010); Board Director of Morgan Stanley Foundation (2007-2010) and Investment Committee Chair (2008-2010). Oversees 52 portfolios in the OppenheimerFunds complex. Ms. Pace has served on the Boards of certain Oppenheimer funds since November 2012, including as an Advisory Board |
83 OPPENHEIMER ROCHESTER AMT-FREE MUNICIPAL FUND
| | |
| |
| TRUSTEES AND OFFICERS Unaudited / Continued | | |
| | |
Joanne Pace, Continued | | Member for certain Oppenheimer funds, during which time she has become familiar with the Fund’s (and other Oppenheimer funds’) financial, accounting, regulatory and investment matters and has contributed to the Board’s deliberations. For purposes of this report, Ms. Pace is identified as a Trustee. |
| |
Joseph M. Wikler, Trustee (since 2005) Year of Birth: 1941 | | Director of C-TASC (bio-statistics services) (2007-2012); formerly, Director of the following medical device companies: Medintec (1992-2011) and Cathco (1996-2011); Member of the Investment Committee of the Associated Jewish Charities of Baltimore (since 1994); Director of Lakes Environmental Association (environmental protection organization) (1996-2008); Director of Fortis/Hartford mutual funds (1994-December 2001). Oversees 52 portfolios in the OppenheimerFunds complex. Mr. Wikler has served on the Boards of certain Oppenheimer funds since August 2005, during which time he has become familiar with the Fund’s (and other Oppenheimer funds’) financial, accounting, regulatory and investment matters and has contributed to the Boards’ deliberations. |
| |
Peter I. Wold, Trustee (since 2005) Year of Birth: 1948 | | Director of Arch Coal, Inc. (since 2010); President of Wold Oil Properties, Inc. (oil and gas exploration and production company) (since 1994); Vice President of American Talc Company, Inc. (talc mining and milling) (since 1999); Managing Member of Hole-in-the-Wall Ranch (cattle ranching) (since 1979); Director and Chairman of Wyoming Enhanced Oil Recovery Institute Commission (enhanced oil recovery study) (2004-2012); Director and Chairman of the Denver Branch of the Federal Reserve Bank of Kansas City (1993-1999); and Director of PacifiCorp. (electric utility) (1995-1999). Oversees 52 portfolios in the OppenheimerFunds complex. Mr. Wold has served on the Boards of certain Oppenheimer funds since August 2005, during which time he has become familiar with the Fund’s (and other Oppenheimer funds’) financial, accounting, regulatory and investment matters and has contributed to the Boards’ deliberations. |
|
| |
| INTERESTED TRUSTEE AND OFFICER | | Mr. Glavin is an “Interested Trustee” because he is affiliated with the Manager and the Sub-Adviser by virtue of his positions as an officer and director of the Manager and a director of the Sub-Adviser, and as a shareholder of the Sub-Adviser’s parent company. Both as a Trustee and as an officer, he serves for an indefinite term, or until his resignation, retirement, death or removal. Mr. Glavin’s address is 225 Liberty Street, 11th Floor, New York, New York 10281-1008. |
| |
William F. Glavin, Jr., Trustee (since 2013), President and Principal Executive Officer (since 2009) Year of Birth: 1958 | | Chairman of the Sub-Adviser (since July 2014 and December 2009-December 2012) and Director of the Sub-Adviser (since January 2009); Chairman, Director and Chief Executive Officer (January 2013-June 2014) of the Manager; President of the Manager (January 2013-May 2013); Chief Executive Officer (January 2009-December 2012); President of the Sub-Adviser (May 2009-December 2012); Management Director (June 2009-June 2014), President (December 2009-June 2014) and Chief Executive Officer (January 2011-June 2014) of Oppenheimer Acquisition Corp. (“OAC”) (the Sub-Adviser’s parent holding company); Director of Oppenheimer Real Asset Management, Inc. (March 2010-June 2014); Executive Vice President (March 2006-February 2009) and Chief Operating Officer (July 2007-February 2009) of Massachusetts Mutual Life Insurance Company (OAC’s parent company); Director (May 2004-March 2006) and |
84 OPPENHEIMER ROCHESTER AMT-FREE MUNICIPAL FUND
| | |
William F. Glavin, Jr., Continued | | Chief Operating Officer and Chief Compliance Officer (May 2004-January 2005), President (January 2005-March 2006) and Chief Executive Officer (June 2005-March 2006) of Babson Capital Management LLC; Director (March 2005-March 2006), President (May 2003-March 2006) and Chief Compliance Officer (July 2005-March 2006) of Babson Capital Securities, Inc. (a brokerdealer); President (May 2003-March 2006) of Babson Investment Company, Inc.; Director (May 2004-August 2006) of Babson Capital Europe Limited; Director (May 2004-October 2006) of Babson Capital Guernsey Limited; Director (May 2004-March 2006) of Babson Capital Management LLC; Non-Executive Director (March 2005-March 2007) of Baring Asset Management Limited; Director (February 2005-June 2006) Baring Pension Trustees Limited; Director and Treasurer (December 2003-November 2006) of Charter Oak Capital Management, Inc.; Director (May 2006-September 2006) of C.M. Benefit Insurance Company; Director (May 2008-June 2009) and Executive Vice President (June 2007-July 2009) of C.M. Life Insurance Company; President (March 2006-May 2007) of MassMutual Assignment Company; Director (January 2005-December2006), Deputy Chairman (March 2005-December 2006) and President (February 2005-March 2005) of MassMutual Holdings (Bermuda) Limited; Director (May 2008-June 2009) and Executive Vice President (June 2007-July 2009) of MML Bay State Life Insurance Company; Chief Executive Officer and President (April 2007-January 2009) of MML Distributors, LLC; and Chairman (March 2006-December 2008) and Chief Executive Officer (May 2007-December 2008) of MML Investors Services, Inc. An officer of 91 portfolios in the OppenheimerFunds complex. Mr. Glavin has served on the Boards of certain Oppenheimer funds since December 2009, during which time he has become familiar with the Fund’s (and other Oppenheimer funds’) financial, accounting, regulatory and investment matters and has contributed to the Boards’ deliberations. |
|
| |
| OTHER OFFICERS OF THE FUND | | The addresses of the Officers in the chart below are as follows: for Messrs. Loughran, Cottier, Willis, DeMitry, Camarella, Pulire, Stein and Gabinet, Mss. Nasta and Picciotto, 225 Liberty Street, New York, New York
10281-1008, for Mr. Wixted, 6803 S. Tucson Way, Centennial, Colorado 80112-3924. Each Officer serves for an indefinite term or until his or her resignation, retirement, death or removal. |
| |
Daniel G. Loughran, Vice President (since 2005) Year of Birth: 1963 | | Senior Vice President of the Sub-Adviser (since July 2007) and a Senior Portfolio Manager (since December 2001); Vice President of the Sub-Adviser (April 2001-June 2007) and a Portfolio Manager with the Sub-Adviser (December 1999- November 2001). Team Leader, a Senior Portfolio Manager, an officer and a trader for the Fund and other Oppenheimer funds. |
| |
Scott S. Cottier, Vice President (since 2005) Year of Birth: 1971 | | Vice President of the Sub-Adviser and a Senior Portfolio Manager (since September 2002). Portfolio Manager and trader at Victory Capital Management (1999-2002). Senior Portfolio Manager, an officer and a trader for the Fund and other Oppenheimer funds. |
85 OPPENHEIMER ROCHESTER AMT-FREE MUNICIPAL FUND
| | |
| |
| TRUSTEES AND OFFICERS Unaudited / Continued | | |
| | |
Troy E. Willis, Vice President (since 2005) Year of Birth: 1972 | | Vice President of the Sub-Adviser (since July 2009) and a Senior Portfolio Manager (since January 2006); Assistant Vice President of the Sub-Adviser (July 2005-June 2009). Portfolio Manager of the Sub-Adviser (June 2003-December 2005). Corporate Attorney for Southern Resource Group (June 1999-December 2003). Senior Portfolio Manager, an officer and a trader for the Fund and other Oppenheimer funds. |
| |
Mark R. DeMitry, Vice President (since 2009) Year of Birth: 1976 | | Vice President of the Sub-Adviser and a Senior Portfolio Manager (since July 2009); Associate Portfolio Manager of the Fund (September 2006- June 2009). Research Analyst of the Sub-Adviser (June 2003-September 2006) and a Credit Analyst of the Sub-Adviser (July 2001-May 2003). Senior Portfolio Manager, an officer and a trader for the Fund and other Oppenheimer funds. |
| |
Michael L. Camarella, Vice President (since 2009) Year of Birth: 1976 | | Vice President of the Sub-Adviser and a Senior Portfolio Manager (since January 2011); Assistant Vice President of the Sub-Adviser (July 2009-December 2010); Associate Portfolio Manager of the Sub-Adviser (January 2008-December 2010). Research Analyst of the Sub-Adviser (April 2006-December 2007) and a Credit Analyst of the Sub-Adviser (June 2003-March 2006). Senior Portfolio Manager, an officer and a trader for the Fund and other Oppenheimer funds. |
| |
Charles S. Pulire, Vice President (since 2011) Year of Birth: 1977 | | Vice President of the Sub-Adviser and a Senior Portfolio Manager (since February 2013); Assistant Vice President of the Sub-Adviser (December 2010-January 2013); Research Analyst of the Manager (February 2008-November 2010); Credit Analyst of the Sub-Adviser (May 2006-January 2008). Senior Portfolio Manager, an officer and a trader for the Fund and other Oppenheimer funds. |
| |
Richard A. Stein, Vice President (since 2007) Year of Birth: 1957 | | Director of the Rochester Credit Analysis team (since March 2004); Senior Vice President of the Sub-Adviser (since June 2011) and a Vice President of the Sub-Adviser (November 1997-May 2011); heads up the Rochester Credit Analysis team (since May 1993). |
| |
Arthur S. Gabinet, Secretary and Chief Legal Officer (since 2011) Year of Birth: 1958 | | Executive Vice President, Secretary and General Counsel of the Manager (since January 2013); General Counsel OFI SteelPath, Inc. (since January 2013); Executive Vice President (May 2010-December 2012) and General Counsel (since January 2011) of the Sub-Adviser; General Counsel of the Distributor (since January 2011); General Counsel of Centennial Asset Management Corporation (January 2011-December 2012); Executive Vice President (January 2011-December 2012) and General Counsel of HarbourView Asset Management Corporation (since January 2011); Assistant Secretary (since January 2011) and Director (since January 2011) of OppenheimerFunds International Ltd. and OppenheimerFunds plc; Director of Oppenheimer Real Asset Management, Inc. (January 2011-December 2012) and General Counsel (since January 2011); Executive Vice President (January 2011-December 2011) and General Counsel of Shareholder Financial Services, Inc. and Shareholder Services, Inc. (since January 2011); Executive Vice President (January 2011-December 2012) and General Counsel of OFI Private Investments Inc. (since January 2011); Vice President of OppenheimerFunds Legacy Program (January 2011-December 2011); Executive Vice President (January 2011-December 2012) and General Counsel of OFI Institutional Asset Management, Inc. (since |
86 OPPENHEIMER ROCHESTER AMT-FREE MUNICIPAL FUND
| | |
Arthur S. Gabinet, Continued | | January 2011); General Counsel, Asset Management of the Sub-Adviser (May 2010-December 2010); Principal, The Vanguard Group (November 2005-April 2010); District Administrator, U.S. Securities and Exchange Commission (January 2003-October 2005). An officer of 91 portfolios in the OppenheimerFunds complex. |
| |
Christina M. Nasta, Vice President and Chief Business Officer (since 2011) Year of Birth: 1973 | | Senior Vice President of OppenheimerFunds Distributor, Inc. (since January 2013); Senior Vice President of the Sub-Adviser (July 2010-December 2012); Vice President of the Sub-Adviser (January 2003-July 2010); Vice President of OppenheimerFunds Distributor, Inc. (January 2003-July 2010). An officer of 91 portfolios in the OppenheimerFunds complex. |
| |
Mary Ann Picciotto, Chief Compliance Officer and Chief Anti-Money Laundering Officer (since 2014) Year of Birth: 1973 | | Senior Vice President and Chief Compliance Officer of the Manager (since March 2014); Chief Compliance Officer of the Sub-Adviser, OFI SteelPath, Inc., OFI Global Trust Company, OFI Global Institutional, Inc., Oppenheimer Real Asset Management, Inc., OFI Private Investments, Inc., Harborview Asset Management Corporation, Trinity Investment Management Corporation, and Shareholder Services, Inc. (since March 2014); Managing Director of Morgan Stanley Investment Management Inc. and certain of its various affiliated entities; Chief Compliance Officer of various Morgan Stanley Funds (May 2010-January 2014); Chief Compliance Officer of Morgan Stanley Investment Management Inc. (April 2007-January 2014). An officer of 91 portfolios in the OppenheimerFunds complex. |
| |
Brian W. Wixted, Treasurer and Principal Financial & Accounting Officer (since 1999) Year of Birth: 1959 | | Senior Vice President of the Manager (since January 2013); Treasurer of the Sub-Adviser, HarbourView Asset Management Corporation, Shareholder Financial Services, Inc., Shareholder Services, Inc., and Oppenheimer Real Asset Management, Inc. (March 1999-June 2008), OFI Private Investments, Inc. (March 2000-June 2008), OppenheimerFunds International Ltd. and OppenheimerFunds plc (since May 2000), OFI Institutional Asset Management, Inc. (November 2000-June 2008), and OppenheimerFunds Legacy Program (charitable trust program established by the Sub-Adviser) (June 2003-December 2011); Treasurer and Chief Financial Officer of OFI Trust Company (since May 2000); Assistant Treasurer of Oppenheimer Acquisition Corporation (March 1999-June 2008). An officer of 91 portfolios in the OppenheimerFunds complex. |
The Fund’s Statement of Additional Information contains additional information about the Fund’s Trustees and Officers and is available without charge upon request, by calling 1.800.CALL OPP (225.5677).
87 OPPENHEIMER ROCHESTER AMT-FREE MUNICIPAL FUND
| | |
| |
| OPPENHEIMER ROCHESTER AMT-FREE MUNICIPAL FUND | | |
| | |
| Manager | | OFI Global Asset Management, Inc. |
| |
| Sub-Adviser | | OppenheimerFunds, Inc. |
| |
| Distributor | | OppenheimerFunds Distributor, Inc. |
| |
| Transfer and Shareholder Servicing Agent | | OFI Global Asset Management, Inc. |
| |
| Sub-Transfer Agent | | Shareholder Services, Inc. DBA OppenheimerFunds Services |
| |
Independent Registered Public Accounting Firm | | KPMGLLP |
| |
| Legal Counsel | | Kramer Levin Naftalis & FrankelLLP |
© 2014 OppenheimerFunds, Inc. All rights reserved.
88 OPPENHEIMER ROCHESTER AMT-FREE MUNICIPAL FUND
As an Oppenheimer fund shareholder, you are entitled to know how we protect your personal information and how we limit its disclosure.
Information Sources
We obtain nonpublic personal information about our shareholders from the following sources:
| — | | Applications or other forms |
| — | | When you create a user ID and password for online account access |
| — | | When you enroll in eDocs Direct, our electronic document delivery service |
| — | | Your transactions with us, our affiliates or others |
| — | | A software program on our website, often referred to as a “cookie,” which indicates which parts of our site you’ve visited |
| — | | When you set up challenge questions to reset your password online |
If you visit oppenheimerfunds.com and do not log on to the secure account information areas, we do not obtain any personal information about you. When you do log on to a secure area, we do obtain your user ID and password to identify you. We also use this information to provide you with products and services you have requested, to inform you about products and services that you may be interested in and assist you in other ways.
We do not collect personal information through our website unless you willingly provide it to us, either directly by email or in those areas of the website that request information. In order to update your personal information (including your mailing address, email address and phone number) you must first log on and visit your user profile.
If you have set your browser to warn you before accepting cookies, you will receive the warning message with each cookie. You can refuse cookies by turning them off in your browser. However, doing so may limit your access to certain sections of our website.
We use cookies to help us improve and manage our website. For example, cookies help us recognize new versus repeat visitors to the site, track the pages visited, and enable some special features on the website. This data helps us provide a better service for our website visitors.
Protection of Information
We do not disclose any non-public personal information (such as names on a customer list) about current or former customers to anyone, except as permitted by law.
Disclosure of Information
We send your financial advisor (as designated by you) copies of confirmations, account statements and other documents reporting activity in your fund accounts. We may also use details about you and your investments to help us, our financial service affiliates, or firms that jointly market their financial products and services with ours, to better serve your investment needs or suggest financial services or educational material that may be of interest to you. If this requires us to provide you with an opportunity to “opt in” or “opt out” of such information sharing with a firm not affiliated with us, you will receive notification on how to do so, before any such sharing takes place.
Right of Refusal
We will not disclose your personal information to unaffiliated third parties (except as permitted by law), unless we first offer you a reasonable opportunity to refuse or “opt out” of such disclosure.
89 OPPENHEIMER ROCHESTER AMT-FREE MUNICIPAL FUND
| | |
| |
| PRIVACY POLICY NOTICE Continued | | |
Internet Security and Encryption
In general, the email services provided by our website are encrypted and provide a secure and private means of communication with us. To protect your own privacy, confidential and/or personal information should only be communicated via email when you are advised that you are using a secure website.
As a security measure, we do not include personal or account information in non-secure emails, and we advise you not to send such information to us in non-secure emails. Instead, you may take advantage of the secure features of our website to encrypt your email correspondence. To do this, you will need to use a browser that supports Secure Sockets Layer (SSL) protocol.
We do not guarantee or warrant that any part of our website, including files available for download, are free of viruses or other harmful code. It is your responsibility to take appropriate precautions, such as use of an anti-virus software package, to protect your computer hardware and software.
| — | | All transactions, including redemptions, exchanges and purchases, are secured by SSL and 128-bit encryption. SSL is used to establish a secure connection between your PC and OppenheimerFunds’ server. It transmits information in an encrypted and scrambled format. |
| — | | Encryption is achieved through an electronic scrambling technology that uses a “key” to code and then decode the data. Encryption acts like the cable converter box you may have on your television set. It scrambles data with a secret code so that no one can make sense of it while it is being transmitted. When the data reaches its destination, the same software unscrambles the data. |
| — | | You can exit the secure area by either closing your browser, or for added security, you can use the Log Out button before you close your browser. |
Other Security Measures
We maintain physical, electronic and procedural safeguards to protect your personal account information. Our employees and agents have access to that information only so that they may offer you products or provide services, for example, when responding to your account questions.
How You Can Help
You can also do your part to keep your account information private and to prevent unauthorized transactions. If you obtain a user ID and password for your account, do not allow it to be used by anyone else. Also, take special precautions when accessing your account on a computer used by others.
Who We Are
This joint notice describes the privacy policies of the Oppenheimer funds, OppenheimerFunds, Inc., and each of its investment adviser subsidiaries, OppenheimerFunds Distributor, Inc. and OFI Global Trust Co. It applies to all Oppenheimer fund accounts you presently have, or may open in the future, using your Social Security number—whether or not you remain a shareholder of our funds. This notice was last updated November 2013. In the event it is updated or changed, we will post an updated notice on our website at oppenheimerfunds.com. If you have any questions about these privacy policies, write to us at P.O. Box 5270, Denver, CO 80217-5270, email us by clicking on the Contact Us section of our website at oppenheimerfunds.com or call us at 1.800.CALL OPP (225.5677).
90 OPPENHEIMER ROCHESTER AMT-FREE MUNICIPAL FUND
THIS PAGE INTENTIONALLY LEFT BLANK.
91 OPPENHEIMER ROCHESTER AMT-FREE MUNICIPAL FUND
THIS PAGE INTENTIONALLY LEFT BLANK.
92 OPPENHEIMER ROCHESTER AMT-FREE MUNICIPAL FUND
THIS PAGE INTENTIONALLY LEFT BLANK.
93 OPPENHEIMER ROCHESTER AMT-FREE MUNICIPAL FUND
THIS PAGE INTENTIONALLY LEFT BLANK.
94 OPPENHEIMER ROCHESTER AMT-FREE MUNICIPAL FUND
THIS PAGE INTENTIONALLY LEFT BLANK.
95 OPPENHEIMER ROCHESTER AMT-FREE MUNICIPAL FUND

The registrant has adopted a code of ethics that applies to the registrant’s principal executive officer, principal financial officer, principal accounting officer or controller or persons performing similar functions.
| Item 3. | Audit Committee Financial Expert. |
The Board of Trustees of the registrant has determined that David Downes, the Board’s Audit Committee Chairman, is an audit committee financial expert and that Mr. Downes is “independent” for purposes of this Item 3.
| Item 4. | Principal Accountant Fees and Services. |
The principal accountant for the audit of the registrant’s annual financial statements billed $56,200 in fiscal 2014 and $55,100 in fiscal 2013.
The principal accountant for the audit of the registrant’s annual financial statements billed $2,500 in fiscal 2014 and $2,500 in fiscal 2013.
The principal accountant for the audit of the registrant’s annual financial statements billed $727,131 in fiscal 2014 and $611,580 in fiscal 2013 to the registrant’s investment adviser or any entity controlling, controlled by, or under common control with the adviser that provides ongoing services to the registrant.
Such services include: Internal control reviews, GIPS attestation procedures, internal audit training, Surprise Exam, reorganization, and system conversion testing
The principal accountant for the audit of the registrant’s annual financial statements billed no such fees in fiscal 2014 and no such fees in fiscal 2013.
The principal accountant for the audit of the registrant’s annual financial statements billed $202,044 in fiscal 2014 and $443,073 in fiscal 2013 to the registrant’s investment adviser or any entity controlling, controlled by, or under common control with the adviser that provides ongoing services to the registrant.
Such services include: tax compliance, tax planning and tax advice. Tax compliance generally involves preparation of original and amended tax returns, claims for a refund and tax payment-planning services. Tax planning and tax advice includes assistance with tax audits and appeals, tax advice related to mergers and acquisitions and requests for rulings or technical advice from taxing authorities.
The principal accountant for the audit of the registrant’s annual financial statements billed no such fees in fiscal 2014 and no such fees in fiscal 2013.
The principal accountant for the audit of the registrant’s annual financial statements billed no such fees in fiscal 2014 and no such fees in fiscal 2013 to the registrant’s investment adviser or any entity controlling, controlled by, or under common control with the adviser that provides ongoing services to the registrant.
Such fees would include the cost to the principal accountant of attending audit committee meetings and consultations regarding the registrant’s retirement plan with respect to its Trustees.
| (e) | (1) During its regularly scheduled periodic meetings, the registrant’s audit committee will pre-approve all audit, audit-related, tax and other services to be provided by the principal accountants of the registrant. |
The audit committee has delegated pre-approval authority to its Chairman for any subsequent new engagements that arise between regularly scheduled meeting dates provided that any fees such pre-approved are presented to the audit committee at its next regularly scheduled meeting.
Under applicable laws, pre-approval of non-audit services may be waived provided that: 1) the aggregate amount of all such services provided constitutes no more than five percent of the total amount of fees paid by the registrant to its principal accountant during the fiscal year in which services are provided 2) such services were not recognized by the registrant at the time of engagement as non-audit services and 3) such services are promptly brought to the attention of the audit committee of the registrant and approved prior to the completion of the audit.
(2) 0%
| (f) | Not applicable as less than 50%. |
| (g) | The principal accountant for the audit of the registrant’s annual financial statements billed $931,675 in fiscal 2014 and $1,057,153 in fiscal 2013 to the registrant and the registrant’s investment adviser or any entity controlling, controlled by, or under common control with the adviser that provides ongoing services to the registrant related to non-audit fees. Those billings did not include any prohibited non-audit services as defined by the Securities Exchange Act of 1934. |
| (h) | The registrant’s audit committee of the board of Trustees has considered whether the provision of non-audit services that were rendered to the registrant’s investment adviser, and any entity controlling, controlled by, or under common control with the investment adviser that provides ongoing services to the registrant that were not pre-approved pursuant to paragraph (c)(7)(ii) of Rule 2-01 of Regulation S-X is compatible with maintaining the principal accountant’s independence. No such services were rendered. |
| Item 5. | Audit Committee of Listed Registrants |
Not applicable.
| Item 6. | Schedule of Investments. |
a) Not applicable. The complete schedule of investments is included in Item 1 of this Form N-CSR.
b) Not applicable.
| Item 7. | Disclosure of Proxy Voting Policies and Procedures for Closed-End Management Investment Companies. |
Not applicable.
| Item 8. | Portfolio Managers of Closed-End Management Investment Companies. |
Not applicable.
| Item 9. | Purchases of Equity Securities by Closed-End Management Investment Company and Affiliated Purchasers. |
Not applicable.
| Item 10. | Submission of Matters to a Vote of Security Holders. |
The Fund’s Governance Committee Provisions with Respect to Nominations of Directors/Trustees to the Respective Boards
None
| Item 11. | Controls and Procedures. |
Based on their evaluation of the registrant’s disclosure controls and procedures (as defined in rule 30a-3(c) under the Investment Company Act of 1940 (17 CFR 270.30a-3(c)) as of 7/31/2014, the registrant’s principal executive officer and principal financial officer found the registrant’s disclosure controls and procedures to provide reasonable assurances that information required to be disclosed by the registrant in the reports that it files under the Securities Exchange Act of 1934 (a) is accumulated and communicated to registrant’s management, including its principal executive officer and principal financial officer, to allow timely decisions regarding required disclosure, and (b) is recorded, processed, summarized and reported, within the time periods specified in the rules and forms adopted by the U.S. Securities and Exchange Commission.
There have been no changes in the registrant’s internal controls over financial reporting that occurred during the registrant’s second fiscal quarter of the period covered by this report that have materially affected, or are reasonably likely to materially affect, the registrant’s internal control over financial reporting.
| (a) | (1) Exhibit attached hereto. |
(2) Exhibits attached hereto.
(3) Not applicable.
| (b) | Exhibit attached hereto. |
SIGNATURES
Pursuant to the requirements of the Securities Exchange Act of 1934 and the Investment Company Act of 1940, the registrant has duly caused this report to be signed on its behalf by the undersigned, thereunto duly authorized.
Oppenheimer Rochester AMT-Free Municipal Fund
| | |
By: | | /s/ William F. Glavin, Jr. |
| | William F. Glavin, Jr. |
| | Principal Executive Officer |
| |
| Date: | | 9/10/2014 |
Pursuant to the requirements of the Securities Exchange Act of 1934 and the Investment Company Act of 1940, this report has been signed below by the following persons on behalf of the registrant and in the capacities and on the dates indicated.
| | |
| By: | | /s/ William F. Glavin, Jr. |
| | William F. Glavin, Jr. |
| | Principal Executive Officer |
| |
| Date: | | 9/10/2014 |
| | |
| By: | | /s/ Brian W. Wixted |
| | Brian W. Wixted |
| | Principal Financial Officer |
| |
| Date: | | 9/10/2014 |