UNITED STATES
SECURITIES AND EXCHANGE COMMISSION
Washington, D.C. 20549
FORM N-CSR
CERTIFIED SHAREHOLDER REPORT OF REGISTERED MANAGEMENT INVESTMENT COMPANIES
Investment Company Act file number:
Name of Fund:
BlackRock Bond Fund, Inc.
BlackRock Total Return Fund
Fund Address: 100 Bellevue Parkway, Wilmington, DE 19809
Name and address of agent for service: John M. Perlowski, Chief Executive Officer, BlackRock Bond Fund, Inc.,
50 Hudson Yards, New York, NY 10001
Registrant's telephone number, including area code:
Date of reporting period:
Item 1 — Reports to Stockholders
(a) The Reports to Shareholders are attached herewith
BlackRock Total Return Fund
Institutional Shares | MAHQX
Annual Shareholder Report — September 30, 2024
This annual shareholder report contains important information about BlackRock Total Return Fund (the “Fund”) for the period of October 1, 2023 to September 30, 2024. You can find additional information about the Fund at blackrock.com/fundreports. You can also request this information by contacting us at (800) 441‑7762.
This report describes changes to the Fund that occurred during the reporting period.
What were the Fund costs for the last year?
(based on a hypothetical $10,000 investment)
| Class name | Costs of a $10,000
investment | Costs paid as a percentage of a
$10,000 investment |
| Institutional Shares | $47(a) | 0.44%(a) |
(a) | Because the Fund invested all of its assets in Master Total Return Portfolio (the “Master Portfolio”), a series of Master Bond LLC, prior to September 16, 2024, the expense example reflects the net expenses of both the Fund and the Master Portfolio in which it invested for a portion of the period. |
How did the Fund perform last year?
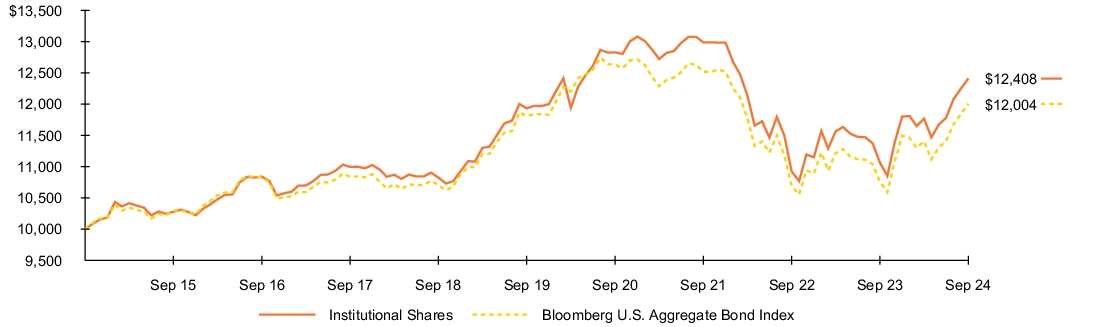
For the reporting period ended September 30, 2024, the Fund's Institutional Shares returned 12.13%
For the same period, the Bloomberg U.S. Aggregate Bond Index returned 11.57%.
What contributed to absolute performance?
The Fund’s allocations to agency mortgage-backed securities, U.S. investment grade corporate bonds, and structured products contributed to performance for the annual period.
What detracted from absolute performance?
The Fund’s positioning with respect to U.S. interest rates was the only source of negative return.
The views expressed reflect the opinions of BlackRock as of the date of this report and are subject to change based on changes in market, economic or other conditions. These views are not intended to be a forecast of future events and are no guarantee of future results.
Fund performance
Cumulative performance: October 1, 2014 through September 30, 2024
Initial investment of $10,000
See “Average annual total returns” for additional information on fund performance.
Average annual total returns
| 1 Year | | 5 Years | | 10 Years | |
| Institutional Shares | 12.13 | % | 0.79 | % | 2.18 | % |
| Bloomberg U.S. Aggregate Bond Index | 11.57 | | 0.33 | | 1.84 | |
| Net Assets | $20,127,307,489 |
| Number of Portfolio Holdings | 5,009 |
| Net Investment Advisory Fees | $54,171,979 |
| Portfolio Turnover Rate | 471% |
Past performance is not an indication of future results. Performance results may include adjustments made for financial reporting purposes in accordance with U.S. generally accepted accounting principles. Performance results do not reflect the deduction of taxes that a shareholder would pay on fund distributions or on the redemption or sale of fund shares. Visit blackrock.com for more recent performance information.
What did the Fund invest in?
(as of September 30, 2024)
| Investment Type | Percent of Total
Investments(a) | |
| U.S. Government Sponsored Agency Securities | 32.8 | % |
| Corporate Bonds | 22.7 | % |
| U.S. Treasury Obligations | 17.4 | % |
| Asset-Backed Securities | 10.2 | % |
| Non-Agency Mortgage-Backed Securities | 9.3 | % |
| Foreign Government Obligations | 4.9 | % |
| Floating Rate Loan Interests | 1.0 | % |
| Municipal Bonds | 0.6 | % |
| Common Stocks | 0.5 | % |
| Preferred Securities | 0.3 | % |
| Fixed Rate Loan Interests | 0.2 | % |
| Foreign Agency Obligations | 0.1 | % |
| Warrants | — | % (b) |
| Investment Companies | — | % (b) |
Credit quality allocation
| Credit Rating(c) | Percent of Total
Investments(a) | |
| AAA/Aaa(d) | 57.7 | % |
| AA/Aa | 2.8 | % |
| A | 8.8 | % |
| BBB/Baa | 13.0 | % |
| BB/Ba | 1.1 | % |
| B | 0.5 | % |
| CCC/Caa | 0.4 | % |
| CC/Ca | 0.3 | % |
| C | 0.2 | % |
| N/R | 15.2 | % |
(a) | Excludes short-term securities, options purchased, options written and TBA sale commitments. |
(b) | Rounds to less than 0.1%. |
(c) | For purposes of this report, credit quality ratings shown above reflect the highest rating assigned by either S&P Global Ratings or Moody’s Investors Service, Inc. if ratings differ. These rating agencies are independent, nationally recognized statistical rating organizations and are widely used. Investment grade ratings are credit ratings of BBB/Baa or higher. Below investment grade ratings are credit ratings of BB/Ba or lower. Investments designated N/R are not rated by either rating agency. Unrated investments do not necessarily indicate low credit quality. Credit quality ratings are subject to change. |
(d) | The investment adviser evaluates the credit quality of unrated investments based upon certain factors including, but not limited to, credit ratings for similar investments and financial analysis of sectors, individual investments and/or issuers. Using this approach, the investment adviser has deemed unrated U.S. Government Sponsored Agency Securities and U.S. Treasury Obligations to be of similar credit quality as investments rated AAA/Aaa. |
Material Fund changes
This is a summary of certain changes to the Fund since September 30, 2023. For more complete information, you may review the Fund’s next prospectus, which we expect to be available approximately 120 days after September 30, 2024 at blackrock.com/fundreports or upon request by contacting us at (800) 441-7762.
Effective September 16, 2024, the Fund ceased to invest in Master Total Return Portfolio (the “Master Portfolio”), a series of Master Bond LLC, as part of a “master/feeder” structure and instead operates as a stand-alone fund. In connection with this change and in accordance with the investment advisory agreement, the Fund now pays a monthly fee at an annual rate equal to the following percentages of the average daily value of the Fund's net assets: 0.48% (first $250 million), 0.43% ($250 million - $500 million), 0.38% ($500 million - $750 million) and 0.34% (greater than $750 million).
Additional information
If you wish to view additional information about the Fund, including but not limited to financial statements, the Fund’s prospectus, and proxy voting policies and procedures, please visit blackrock.com/fundreports. For proxy voting records, visit blackrock.com/proxyrecords.
Householding
The Fund will mail only one copy of shareholder documents, including prospectuses, annual and semi-annual reports and proxy statements, to shareholders with multiple accounts at the same address. This practice is commonly called “householding” and is intended to reduce expenses and eliminate duplicate mailings of shareholder documents. Mailings of your shareholder documents may be householded indefinitely unless you instruct us otherwise. If you do not want the mailing of these documents to be combined with those for other members of your household, please call the Fund at (800) 441-7762.
The Fund is not sponsored, endorsed, issued, sold, or promoted by Bloomberg Index Services Limited and its affiliates, nor does this company make any representation regarding the advisability of investing in the Fund. BlackRock is not affiliated with the company listed above.
©2024 BlackRock, Inc. or its affiliates. All rights reserved. BLACKROCK is a registered trademark of BlackRock, Inc. or its affiliates. All other trademarks are those of their respective owners.
BlackRock Total Return Fund
Institutional Shares | MAHQX
Annual Shareholder Report — September 30, 2024
MAHQX-09/24-AR
BlackRock Total Return Fund
Service Shares | MSHQX
Annual Shareholder Report — September 30, 2024
This annual shareholder report contains important information about BlackRock Total Return Fund (the “Fund”) for the period of October 1, 2023 to September 30, 2024. You can find additional information about the Fund at blackrock.com/fundreports. You can also request this information by contacting us at (800) 441‑7762.
This report describes changes to the Fund that occurred during the reporting period.
What were the Fund costs for the last year?
(based on a hypothetical $10,000 investment)
| Class name | Costs of a $10,000
investment | Costs paid as a percentage of a
$10,000 investment |
| Service Shares | $79(a) | 0.75%(a) |
(a) | Because the Fund invested all of its assets in Master Total Return Portfolio (the “Master Portfolio”), a series of Master Bond LLC, prior to September 16, 2024, the expense example reflects the net expenses of both the Fund and the Master Portfolio in which it invested for a portion of the period. |
How did the Fund perform last year?
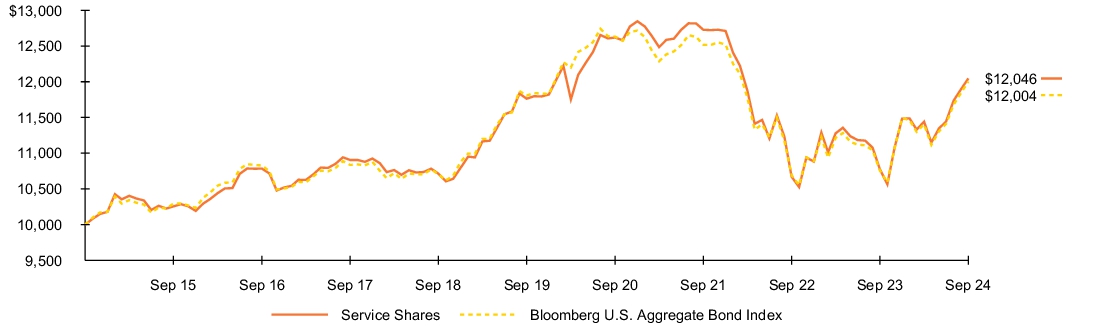
For the reporting period ended September 30, 2024, the Fund's Service Shares returned 11.79%
For the same period, the Bloomberg U.S. Aggregate Bond Index returned 11.57%.
What contributed to absolute performance?
The Fund’s allocations to agency mortgage-backed securities, U.S. investment grade corporate bonds, and structured products contributed to performance for the annual period.
What detracted from absolute performance?
The Fund’s positioning with respect to U.S. interest rates was the only source of negative return.
The views expressed reflect the opinions of BlackRock as of the date of this report and are subject to change based on changes in market, economic or other conditions. These views are not intended to be a forecast of future events and are no guarantee of future results.
Fund performance
Cumulative performance: October 1, 2014 through September 30, 2024
Initial investment of $10,000
See “Average annual total returns” for additional information on fund performance.
Average annual total returns
| 1 Year | | 5 Years | | 10 Years | |
| Service Shares | 11.79 | % | 0.48 | % | 1.88 | % |
| Bloomberg U.S. Aggregate Bond Index | 11.57 | | 0.33 | | 1.84 | |
| Net Assets | $20,127,307,489 |
| Number of Portfolio Holdings | 5,009 |
| Net Investment Advisory Fees | $54,171,979 |
| Portfolio Turnover Rate | 471% |
Average annual total returns reflect reductions for service fees.
Past performance is not an indication of future results. Performance results may include adjustments made for financial reporting purposes in accordance with U.S. generally accepted accounting principles. Performance results do not reflect the deduction of taxes that a shareholder would pay on fund distributions or on the redemption or sale of fund shares. Visit blackrock.com for more recent performance information.
What did the Fund invest in?
(as of September 30, 2024)
| Investment Type | Percent of Total
Investments(a) | |
| U.S. Government Sponsored Agency Securities | 32.8 | % |
| Corporate Bonds | 22.7 | % |
| U.S. Treasury Obligations | 17.4 | % |
| Asset-Backed Securities | 10.2 | % |
| Non-Agency Mortgage-Backed Securities | 9.3 | % |
| Foreign Government Obligations | 4.9 | % |
| Floating Rate Loan Interests | 1.0 | % |
| Municipal Bonds | 0.6 | % |
| Common Stocks | 0.5 | % |
| Preferred Securities | 0.3 | % |
| Fixed Rate Loan Interests | 0.2 | % |
| Foreign Agency Obligations | 0.1 | % |
| Warrants | — | % (b) |
| Investment Companies | — | % (b) |
Credit quality allocation
| Credit Rating(c) | Percent of Total
Investments(a) | |
| AAA/Aaa(d) | 57.7 | % |
| AA/Aa | 2.8 | % |
| A | 8.8 | % |
| BBB/Baa | 13.0 | % |
| BB/Ba | 1.1 | % |
| B | 0.5 | % |
| CCC/Caa | 0.4 | % |
| CC/Ca | 0.3 | % |
| C | 0.2 | % |
| N/R | 15.2 | % |
(a) | Excludes short-term securities, options purchased, options written and TBA sale commitments. |
(b) | Rounds to less than 0.1%. |
(c) | For purposes of this report, credit quality ratings shown above reflect the highest rating assigned by either S&P Global Ratings or Moody’s Investors Service, Inc. if ratings differ. These rating agencies are independent, nationally recognized statistical rating organizations and are widely used. Investment grade ratings are credit ratings of BBB/Baa or higher. Below investment grade ratings are credit ratings of BB/Ba or lower. Investments designated N/R are not rated by either rating agency. Unrated investments do not necessarily indicate low credit quality. Credit quality ratings are subject to change. |
(d) | The investment adviser evaluates the credit quality of unrated investments based upon certain factors including, but not limited to, credit ratings for similar investments and financial analysis of sectors, individual investments and/or issuers. Using this approach, the investment adviser has deemed unrated U.S. Government Sponsored Agency Securities and U.S. Treasury Obligations to be of similar credit quality as investments rated AAA/Aaa. |
Material Fund changes
This is a summary of certain changes to the Fund since September 30, 2023. For more complete information, you may review the Fund’s next prospectus, which we expect to be available approximately 120 days after September 30, 2024 at blackrock.com/fundreports or upon request by contacting us at (800) 441-7762.
Effective September 16, 2024, the Fund ceased to invest in Master Total Return Portfolio (the “Master Portfolio”), a series of Master Bond LLC, as part of a “master/feeder” structure and instead operates as a stand-alone fund. In connection with this change and in accordance with the investment advisory agreement, the Fund now pays a monthly fee at an annual rate equal to the following percentages of the average daily value of the Fund's net assets: 0.48% (first $250 million), 0.43% ($250 million - $500 million), 0.38% ($500 million - $750 million) and 0.34% (greater than $750 million).
Additional information
If you wish to view additional information about the Fund, including but not limited to financial statements, the Fund’s prospectus, and proxy voting policies and procedures, please visit blackrock.com/fundreports. For proxy voting records, visit blackrock.com/proxyrecords.
Householding
The Fund will mail only one copy of shareholder documents, including prospectuses, annual and semi-annual reports and proxy statements, to shareholders with multiple accounts at the same address. This practice is commonly called “householding” and is intended to reduce expenses and eliminate duplicate mailings of shareholder documents. Mailings of your shareholder documents may be householded indefinitely unless you instruct us otherwise. If you do not want the mailing of these documents to be combined with those for other members of your household, please call the Fund at (800) 441-7762.
The Fund is not sponsored, endorsed, issued, sold, or promoted by Bloomberg Index Services Limited and its affiliates, nor does this company make any representation regarding the advisability of investing in the Fund. BlackRock is not affiliated with the company listed above.
©2024 BlackRock, Inc. or its affiliates. All rights reserved. BLACKROCK is a registered trademark of BlackRock, Inc. or its affiliates. All other trademarks are those of their respective owners.
BlackRock Total Return Fund
Service Shares | MSHQX
Annual Shareholder Report — September 30, 2024
MSHQX-09/24-AR
BlackRock Total Return Fund
Investor A Shares | MDHQX
Annual Shareholder Report — September 30, 2024
This annual shareholder report contains important information about BlackRock Total Return Fund (the “Fund”) for the period of October 1, 2023 to September 30, 2024. You can find additional information about the Fund at blackrock.com/fundreports. You can also request this information by contacting us at (800) 441‑7762.
This report describes changes to the Fund that occurred during the reporting period.
What were the Fund costs for the last year?
(based on a hypothetical $10,000 investment)
| Class name | Costs of a $10,000
investment | Costs paid as a percentage of a
$10,000 investment |
| Investor A Shares | $78(a) | 0.74%(a) |
(a) | Because the Fund invested all of its assets in Master Total Return Portfolio (the “Master Portfolio”), a series of Master Bond LLC, prior to September 16, 2024, the expense example reflects the net expenses of both the Fund and the Master Portfolio in which it invested for a portion of the period. |
How did the Fund perform last year?
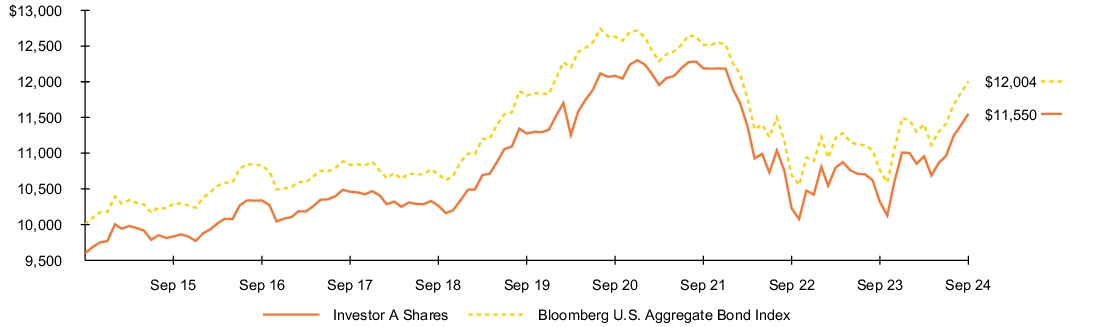
For the reporting period ended September 30, 2024, the Fund's Investor A Shares returned 11.90%
For the same period, the Bloomberg U.S. Aggregate Bond Index returned 11.57%.
What contributed to absolute performance?
The Fund’s allocations to agency mortgage-backed securities, U.S. investment grade corporate bonds, and structured products contributed to performance for the annual period.
What detracted from absolute performance?
The Fund’s positioning with respect to U.S. interest rates was the only source of negative return.
The views expressed reflect the opinions of BlackRock as of the date of this report and are subject to change based on changes in market, economic or other conditions. These views are not intended to be a forecast of future events and are no guarantee of future results.
Fund performance
Cumulative performance: October 1, 2014 through September 30, 2024
Initial investment of $10,000
See “Average annual total returns” for additional information on fund performance.
Average annual total returns
| 1 Year | | 5 Years | | 10 Years | |
| Investor A Shares | 11.90 | % | 0.48 | % | 1.87 | % |
| Investor A Shares (with sales charge) | 7.43 | | (0.33 | ) | 1.45 | |
| Bloomberg U.S. Aggregate Bond Index | 11.57 | | 0.33 | | 1.84 | |
| Net Assets | $20,127,307,489 |
| Number of Portfolio Holdings | 5,009 |
| Net Investment Advisory Fees | $54,171,979 |
| Portfolio Turnover Rate | 471% |
Assuming maximum sales charges. Average annual total returns with and without sales charges reflect reductions for service fees.
Past performance is not an indication of future results. Performance results may include adjustments made for financial reporting purposes in accordance with U.S. generally accepted accounting principles. Performance results do not reflect the deduction of taxes that a shareholder would pay on fund distributions or on the redemption or sale of fund shares. Visit blackrock.com for more recent performance information.
What did the Fund invest in?
(as of September 30, 2024)
| Investment Type | Percent of Total
Investments(a) | |
| U.S. Government Sponsored Agency Securities | 32.8 | % |
| Corporate Bonds | 22.7 | % |
| U.S. Treasury Obligations | 17.4 | % |
| Asset-Backed Securities | 10.2 | % |
| Non-Agency Mortgage-Backed Securities | 9.3 | % |
| Foreign Government Obligations | 4.9 | % |
| Floating Rate Loan Interests | 1.0 | % |
| Municipal Bonds | 0.6 | % |
| Common Stocks | 0.5 | % |
| Preferred Securities | 0.3 | % |
| Fixed Rate Loan Interests | 0.2 | % |
| Foreign Agency Obligations | 0.1 | % |
| Warrants | — | % (b) |
| Investment Companies | — | % (b) |
Credit quality allocation
| Credit Rating(c) | Percent of Total
Investments(a) | |
| AAA/Aaa(d) | 57.7 | % |
| AA/Aa | 2.8 | % |
| A | 8.8 | % |
| BBB/Baa | 13.0 | % |
| BB/Ba | 1.1 | % |
| B | 0.5 | % |
| CCC/Caa | 0.4 | % |
| CC/Ca | 0.3 | % |
| C | 0.2 | % |
| N/R | 15.2 | % |
(a) | Excludes short-term securities, options purchased, options written and TBA sale commitments. |
(b) | Rounds to less than 0.1%. |
(c) | For purposes of this report, credit quality ratings shown above reflect the highest rating assigned by either S&P Global Ratings or Moody’s Investors Service, Inc. if ratings differ. These rating agencies are independent, nationally recognized statistical rating organizations and are widely used. Investment grade ratings are credit ratings of BBB/Baa or higher. Below investment grade ratings are credit ratings of BB/Ba or lower. Investments designated N/R are not rated by either rating agency. Unrated investments do not necessarily indicate low credit quality. Credit quality ratings are subject to change. |
(d) | The investment adviser evaluates the credit quality of unrated investments based upon certain factors including, but not limited to, credit ratings for similar investments and financial analysis of sectors, individual investments and/or issuers. Using this approach, the investment adviser has deemed unrated U.S. Government Sponsored Agency Securities and U.S. Treasury Obligations to be of similar credit quality as investments rated AAA/Aaa. |
Material Fund changes
This is a summary of certain changes to the Fund since September 30, 2023. For more complete information, you may review the Fund’s next prospectus, which we expect to be available approximately 120 days after September 30, 2024 at blackrock.com/fundreports or upon request by contacting us at (800) 441-7762.
Effective September 16, 2024, the Fund ceased to invest in Master Total Return Portfolio (the “Master Portfolio”), a series of Master Bond LLC, as part of a “master/feeder” structure and instead operates as a stand-alone fund. In connection with this change and in accordance with the investment advisory agreement, the Fund now pays a monthly fee at an annual rate equal to the following percentages of the average daily value of the Fund's net assets: 0.48% (first $250 million), 0.43% ($250 million - $500 million), 0.38% ($500 million - $750 million) and 0.34% (greater than $750 million).
Additional information
If you wish to view additional information about the Fund, including but not limited to financial statements, the Fund’s prospectus, and proxy voting policies and procedures, please visit blackrock.com/fundreports. For proxy voting records, visit blackrock.com/proxyrecords.
Householding
The Fund will mail only one copy of shareholder documents, including prospectuses, annual and semi-annual reports and proxy statements, to shareholders with multiple accounts at the same address. This practice is commonly called “householding” and is intended to reduce expenses and eliminate duplicate mailings of shareholder documents. Mailings of your shareholder documents may be householded indefinitely unless you instruct us otherwise. If you do not want the mailing of these documents to be combined with those for other members of your household, please call the Fund at (800) 441-7762.
The Fund is not sponsored, endorsed, issued, sold, or promoted by Bloomberg Index Services Limited and its affiliates, nor does this company make any representation regarding the advisability of investing in the Fund. BlackRock is not affiliated with the company listed above.
©2024 BlackRock, Inc. or its affiliates. All rights reserved. BLACKROCK is a registered trademark of BlackRock, Inc. or its affiliates. All other trademarks are those of their respective owners.
BlackRock Total Return Fund
Investor A Shares | MDHQX
Annual Shareholder Report — September 30, 2024
MDHQX-09/24-AR
BlackRock Total Return Fund
Investor A1 Shares | MEHQX
Annual Shareholder Report — September 30, 2024
This annual shareholder report contains important information about BlackRock Total Return Fund (the “Fund”) for the period of October 1, 2023 to September 30, 2024. You can find additional information about the Fund at blackrock.com/fundreports. You can also request this information by contacting us at (800) 441‑7762.
This report describes changes to the Fund that occurred during the reporting period.
What were the Fund costs for the last year?
(based on a hypothetical $10,000 investment)
| Class name | Costs of a $10,000
investment | Costs paid as a percentage of a
$10,000 investment |
| Investor A1 Shares | $63(a) | 0.59%(a) |
(a) | Because the Fund invested all of its assets in Master Total Return Portfolio (the “Master Portfolio”), a series of Master Bond LLC, prior to September 16, 2024, the expense example reflects the net expenses of both the Fund and the Master Portfolio in which it invested for a portion of the period. |
How did the Fund perform last year?
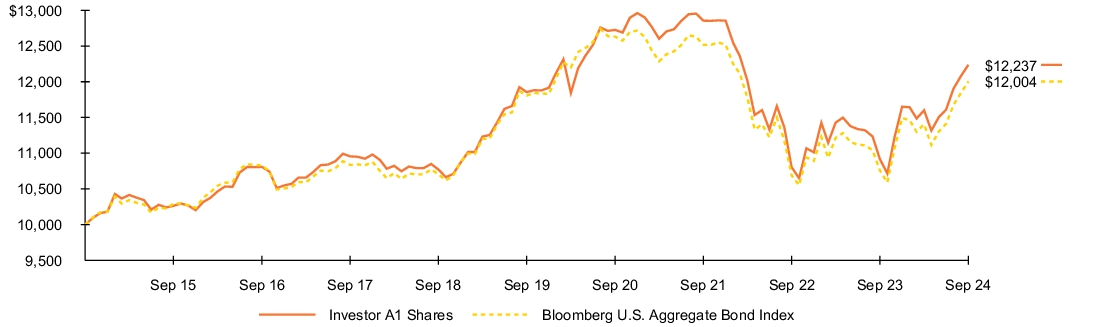
For the reporting period ended September 30, 2024, the Fund's Investor A1 Shares returned 12.08%
For the same period, the Bloomberg U.S. Aggregate Bond Index returned 11.57%.
What contributed to absolute performance?
The Fund’s allocations to agency mortgage-backed securities, U.S. investment grade corporate bonds, and structured products contributed to performance for the annual period.
What detracted from absolute performance?
The Fund’s positioning with respect to U.S. interest rates was the only source of negative return.
The views expressed reflect the opinions of BlackRock as of the date of this report and are subject to change based on changes in market, economic or other conditions. These views are not intended to be a forecast of future events and are no guarantee of future results.
Fund performance
Cumulative performance: October 1, 2014 through September 30, 2024
Initial investment of $10,000
See “Average annual total returns” for additional information on fund performance.
Average annual total returns
| 1 Year | | 5 Years | | 10 Years | |
| Investor A1 Shares | 12.08 | % | 0.64 | % | 2.04 | % |
| Bloomberg U.S. Aggregate Bond Index | 11.57 | | 0.33 | | 1.84 | |
| Net Assets | $20,127,307,489 |
| Number of Portfolio Holdings | 5,009 |
| Net Investment Advisory Fees | $54,171,979 |
| Portfolio Turnover Rate | 471% |
Average annual total returns reflect reductions for service fees.
Past performance is not an indication of future results. Performance results may include adjustments made for financial reporting purposes in accordance with U.S. generally accepted accounting principles. Performance results do not reflect the deduction of taxes that a shareholder would pay on fund distributions or on the redemption or sale of fund shares. Visit blackrock.com for more recent performance information.
What did the Fund invest in?
(as of September 30, 2024)
| Investment Type | Percent of Total
Investments(a) | |
| U.S. Government Sponsored Agency Securities | 32.8 | % |
| Corporate Bonds | 22.7 | % |
| U.S. Treasury Obligations | 17.4 | % |
| Asset-Backed Securities | 10.2 | % |
| Non-Agency Mortgage-Backed Securities | 9.3 | % |
| Foreign Government Obligations | 4.9 | % |
| Floating Rate Loan Interests | 1.0 | % |
| Municipal Bonds | 0.6 | % |
| Common Stocks | 0.5 | % |
| Preferred Securities | 0.3 | % |
| Fixed Rate Loan Interests | 0.2 | % |
| Foreign Agency Obligations | 0.1 | % |
| Warrants | — | % (b) |
| Investment Companies | — | % (b) |
Credit quality allocation
| Credit Rating(c) | Percent of Total
Investments(a) | |
| AAA/Aaa(d) | 57.7 | % |
| AA/Aa | 2.8 | % |
| A | 8.8 | % |
| BBB/Baa | 13.0 | % |
| BB/Ba | 1.1 | % |
| B | 0.5 | % |
| CCC/Caa | 0.4 | % |
| CC/Ca | 0.3 | % |
| C | 0.2 | % |
| N/R | 15.2 | % |
(a) | Excludes short-term securities, options purchased, options written and TBA sale commitments. |
(b) | Rounds to less than 0.1%. |
(c) | For purposes of this report, credit quality ratings shown above reflect the highest rating assigned by either S&P Global Ratings or Moody’s Investors Service, Inc. if ratings differ. These rating agencies are independent, nationally recognized statistical rating organizations and are widely used. Investment grade ratings are credit ratings of BBB/Baa or higher. Below investment grade ratings are credit ratings of BB/Ba or lower. Investments designated N/R are not rated by either rating agency. Unrated investments do not necessarily indicate low credit quality. Credit quality ratings are subject to change. |
(d) | The investment adviser evaluates the credit quality of unrated investments based upon certain factors including, but not limited to, credit ratings for similar investments and financial analysis of sectors, individual investments and/or issuers. Using this approach, the investment adviser has deemed unrated U.S. Government Sponsored Agency Securities and U.S. Treasury Obligations to be of similar credit quality as investments rated AAA/Aaa. |
Material Fund changes
This is a summary of certain changes to the Fund since September 30, 2023. For more complete information, you may review the Fund’s next prospectus, which we expect to be available approximately 120 days after September 30, 2024 at blackrock.com/fundreports or upon request by contacting us at (800) 441-7762.
Effective September 16, 2024, the Fund ceased to invest in Master Total Return Portfolio (the “Master Portfolio”), a series of Master Bond LLC, as part of a “master/feeder” structure and instead operates as a stand-alone fund. In connection with this change and in accordance with the investment advisory agreement, the Fund now pays a monthly fee at an annual rate equal to the following percentages of the average daily value of the Fund's net assets: 0.48% (first $250 million), 0.43% ($250 million - $500 million), 0.38% ($500 million - $750 million) and 0.34% (greater than $750 million).
Additional information
If you wish to view additional information about the Fund, including but not limited to financial statements, the Fund’s prospectus, and proxy voting policies and procedures, please visit blackrock.com/fundreports. For proxy voting records, visit blackrock.com/proxyrecords.
Householding
The Fund will mail only one copy of shareholder documents, including prospectuses, annual and semi-annual reports and proxy statements, to shareholders with multiple accounts at the same address. This practice is commonly called “householding” and is intended to reduce expenses and eliminate duplicate mailings of shareholder documents. Mailings of your shareholder documents may be householded indefinitely unless you instruct us otherwise. If you do not want the mailing of these documents to be combined with those for other members of your household, please call the Fund at (800) 441-7762.
The Fund is not sponsored, endorsed, issued, sold, or promoted by Bloomberg Index Services Limited and its affiliates, nor does this company make any representation regarding the advisability of investing in the Fund. BlackRock is not affiliated with the company listed above.
©2024 BlackRock, Inc. or its affiliates. All rights reserved. BLACKROCK is a registered trademark of BlackRock, Inc. or its affiliates. All other trademarks are those of their respective owners.
BlackRock Total Return Fund
Investor A1 Shares | MEHQX
Annual Shareholder Report — September 30, 2024
MEHQX-09/24-AR
BlackRock Total Return Fund
Investor C Shares | MFHQX
Annual Shareholder Report — September 30, 2024
This annual shareholder report contains important information about BlackRock Total Return Fund (the “Fund”) for the period of October 1, 2023 to September 30, 2024. You can find additional information about the Fund at blackrock.com/fundreports. You can also request this information by contacting us at (800) 441‑7762.
This report describes changes to the Fund that occurred during the reporting period.
What were the Fund costs for the last year?
(based on a hypothetical $10,000 investment)
| Class name | Costs of a $10,000
investment | Costs paid as a percentage of a
$10,000 investment |
| Investor C Shares | $152(a) | 1.44%(a) |
(a) | Because the Fund invested all of its assets in Master Total Return Portfolio (the “Master Portfolio”), a series of Master Bond LLC, prior to September 16, 2024, the expense example reflects the net expenses of both the Fund and the Master Portfolio in which it invested for a portion of the period. |
How did the Fund perform last year?
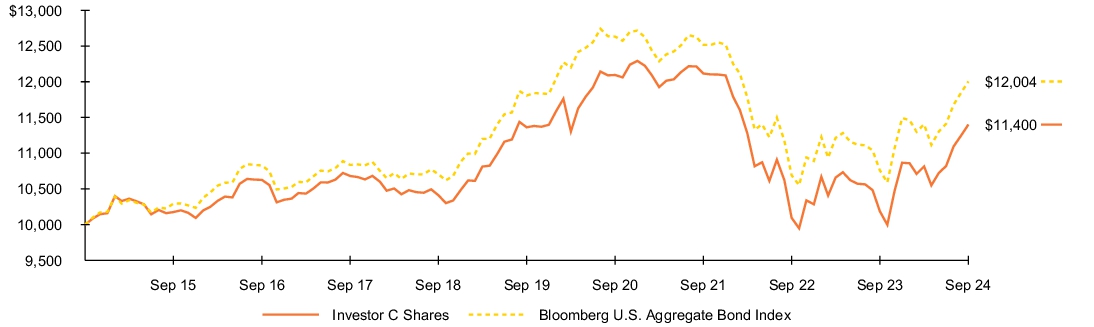
For the reporting period ended September 30, 2024, the Fund's Investor C Shares returned 11.14%
For the same period, the Bloomberg U.S. Aggregate Bond Index returned 11.57%.
What contributed to absolute performance?
The Fund’s allocations to agency mortgage-backed securities, U.S. investment grade corporate bonds, and structured products contributed to performance for the annual period.
What detracted from absolute performance?
The Fund’s positioning with respect to U.S. interest rates was the only source of negative return.
The views expressed reflect the opinions of BlackRock as of the date of this report and are subject to change based on changes in market, economic or other conditions. These views are not intended to be a forecast of future events and are no guarantee of future results.
Fund performance
Cumulative performance: October 1, 2014 through September 30, 2024
Initial investment of $10,000
See “Average annual total returns” for additional information on fund performance.
Average annual total returns
| 1 Year | | 5 Years | | 10 Years | |
| Investor C Shares | 11.14 | % | (0.21 | ) % | 1.32 | % |
| Investor C Shares (with sales charge) | 10.14 | | (0.21 | ) | 1.32 | |
| Bloomberg U.S. Aggregate Bond Index | 11.57 | | 0.33 | | 1.84 | |
| Net Assets | $20,127,307,489 |
| Number of Portfolio Holdings | 5,009 |
| Net Investment Advisory Fees | $54,171,979 |
| Portfolio Turnover Rate | 471% |
Assuming maximum sales charges. Average annual total returns with and without sales charges reflect reductions for distribution and service fees.
Past performance is not an indication of future results. Performance results may include adjustments made for financial reporting purposes in accordance with U.S. generally accepted accounting principles. Performance results do not reflect the deduction of taxes that a shareholder would pay on fund distributions or on the redemption or sale of fund shares. Visit blackrock.com for more recent performance information.
What did the Fund invest in?
(as of September 30, 2024)
| Investment Type | Percent of Total
Investments(a) | |
| U.S. Government Sponsored Agency Securities | 32.8 | % |
| Corporate Bonds | 22.7 | % |
| U.S. Treasury Obligations | 17.4 | % |
| Asset-Backed Securities | 10.2 | % |
| Non-Agency Mortgage-Backed Securities | 9.3 | % |
| Foreign Government Obligations | 4.9 | % |
| Floating Rate Loan Interests | 1.0 | % |
| Municipal Bonds | 0.6 | % |
| Common Stocks | 0.5 | % |
| Preferred Securities | 0.3 | % |
| Fixed Rate Loan Interests | 0.2 | % |
| Foreign Agency Obligations | 0.1 | % |
| Warrants | — | % (b) |
| Investment Companies | — | % (b) |
Credit quality allocation
| Credit Rating(c) | Percent of Total
Investments(a) | |
| AAA/Aaa(d) | 57.7 | % |
| AA/Aa | 2.8 | % |
| A | 8.8 | % |
| BBB/Baa | 13.0 | % |
| BB/Ba | 1.1 | % |
| B | 0.5 | % |
| CCC/Caa | 0.4 | % |
| CC/Ca | 0.3 | % |
| C | 0.2 | % |
| N/R | 15.2 | % |
(a) | Excludes short-term securities, options purchased, options written and TBA sale commitments. |
(b) | Rounds to less than 0.1%. |
(c) | For purposes of this report, credit quality ratings shown above reflect the highest rating assigned by either S&P Global Ratings or Moody’s Investors Service, Inc. if ratings differ. These rating agencies are independent, nationally recognized statistical rating organizations and are widely used. Investment grade ratings are credit ratings of BBB/Baa or higher. Below investment grade ratings are credit ratings of BB/Ba or lower. Investments designated N/R are not rated by either rating agency. Unrated investments do not necessarily indicate low credit quality. Credit quality ratings are subject to change. |
(d) | The investment adviser evaluates the credit quality of unrated investments based upon certain factors including, but not limited to, credit ratings for similar investments and financial analysis of sectors, individual investments and/or issuers. Using this approach, the investment adviser has deemed unrated U.S. Government Sponsored Agency Securities and U.S. Treasury Obligations to be of similar credit quality as investments rated AAA/Aaa. |
Material Fund changes
This is a summary of certain changes to the Fund since September 30, 2023. For more complete information, you may review the Fund’s next prospectus, which we expect to be available approximately 120 days after September 30, 2024 at blackrock.com/fundreports or upon request by contacting us at (800) 441-7762.
Effective September 16, 2024, the Fund ceased to invest in Master Total Return Portfolio (the “Master Portfolio”), a series of Master Bond LLC, as part of a “master/feeder” structure and instead operates as a stand-alone fund. In connection with this change and in accordance with the investment advisory agreement, the Fund now pays a monthly fee at an annual rate equal to the following percentages of the average daily value of the Fund's net assets: 0.48% (first $250 million), 0.43% ($250 million - $500 million), 0.38% ($500 million - $750 million) and 0.34% (greater than $750 million).
Additional information
If you wish to view additional information about the Fund, including but not limited to financial statements, the Fund’s prospectus, and proxy voting policies and procedures, please visit blackrock.com/fundreports. For proxy voting records, visit blackrock.com/proxyrecords.
Householding
The Fund will mail only one copy of shareholder documents, including prospectuses, annual and semi-annual reports and proxy statements, to shareholders with multiple accounts at the same address. This practice is commonly called “householding” and is intended to reduce expenses and eliminate duplicate mailings of shareholder documents. Mailings of your shareholder documents may be householded indefinitely unless you instruct us otherwise. If you do not want the mailing of these documents to be combined with those for other members of your household, please call the Fund at (800) 441-7762.
The Fund is not sponsored, endorsed, issued, sold, or promoted by Bloomberg Index Services Limited and its affiliates, nor does this company make any representation regarding the advisability of investing in the Fund. BlackRock is not affiliated with the company listed above.
©2024 BlackRock, Inc. or its affiliates. All rights reserved. BLACKROCK is a registered trademark of BlackRock, Inc. or its affiliates. All other trademarks are those of their respective owners.
BlackRock Total Return Fund
Investor C Shares | MFHQX
Annual Shareholder Report — September 30, 2024
MFHQX-09/24-AR
BlackRock Total Return Fund
Class K Shares | MPHQX
Annual Shareholder Report — September 30, 2024
This annual shareholder report contains important information about BlackRock Total Return Fund (the “Fund”) for the period of October 1, 2023 to September 30, 2024. You can find additional information about the Fund at blackrock.com/fundreports. You can also request this information by contacting us at (800) 441‑7762.
This report describes changes to the Fund that occurred during the reporting period.
What were the Fund costs for the last year?
(based on a hypothetical $10,000 investment)
| Class name | Costs of a $10,000
investment | Costs paid as a percentage of a
$10,000 investment |
| Class K Shares | $39(a) | 0.37%(a) |
(a) | Because the Fund invested all of its assets in Master Total Return Portfolio (the “Master Portfolio”), a series of Master Bond LLC, prior to September 16, 2024, the expense example reflects the net expenses of both the Fund and the Master Portfolio in which it invested for a portion of the period. |
How did the Fund perform last year?
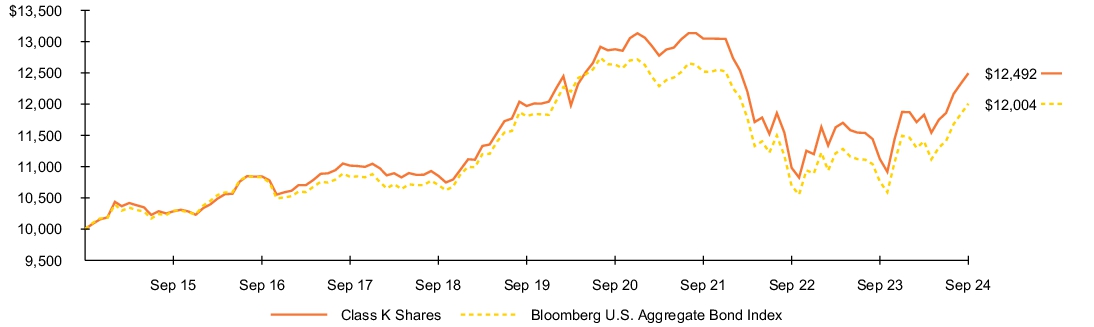
For the reporting period ended September 30, 2024, the Fund's Class K Shares returned 12.33%
For the same period, the Bloomberg U.S. Aggregate Bond Index returned 11.57%.
What contributed to absolute performance?
The Fund’s allocations to agency mortgage-backed securities, U.S. investment grade corporate bonds, and structured products contributed to performance for the annual period.
What detracted from absolute performance?
The Fund’s positioning with respect to U.S. interest rates was the only source of negative return.
The views expressed reflect the opinions of BlackRock as of the date of this report and are subject to change based on changes in market, economic or other conditions. These views are not intended to be a forecast of future events and are no guarantee of future results.
Fund performance
Cumulative performance: October 1, 2014 through September 30, 2024
Initial investment of $10,000
See “Average annual total returns” for additional information on fund performance.
Average annual total returns
| 1 Year | | 5 Years | | 10 Years | |
| Class K Shares | 12.33 | % | 0.86 | % | 2.25 | % |
| Bloomberg U.S. Aggregate Bond Index | 11.57 | | 0.33 | | 1.84 | |
| Net Assets | $20,127,307,489 |
| Number of Portfolio Holdings | 5,009 |
| Net Investment Advisory Fees | $54,171,979 |
| Portfolio Turnover Rate | 471% |
Past performance is not an indication of future results. Performance results may include adjustments made for financial reporting purposes in accordance with U.S. generally accepted accounting principles. Performance results do not reflect the deduction of taxes that a shareholder would pay on fund distributions or on the redemption or sale of fund shares. Visit blackrock.com for more recent performance information.
What did the Fund invest in?
(as of September 30, 2024)
| Investment Type | Percent of Total
Investments(a) | |
| U.S. Government Sponsored Agency Securities | 32.8 | % |
| Corporate Bonds | 22.7 | % |
| U.S. Treasury Obligations | 17.4 | % |
| Asset-Backed Securities | 10.2 | % |
| Non-Agency Mortgage-Backed Securities | 9.3 | % |
| Foreign Government Obligations | 4.9 | % |
| Floating Rate Loan Interests | 1.0 | % |
| Municipal Bonds | 0.6 | % |
| Common Stocks | 0.5 | % |
| Preferred Securities | 0.3 | % |
| Fixed Rate Loan Interests | 0.2 | % |
| Foreign Agency Obligations | 0.1 | % |
| Warrants | — | % (b) |
| Investment Companies | — | % (b) |
Credit quality allocation
| Credit Rating(c) | Percent of Total
Investments(a) | |
| AAA/Aaa(d) | 57.7 | % |
| AA/Aa | 2.8 | % |
| A | 8.8 | % |
| BBB/Baa | 13.0 | % |
| BB/Ba | 1.1 | % |
| B | 0.5 | % |
| CCC/Caa | 0.4 | % |
| CC/Ca | 0.3 | % |
| C | 0.2 | % |
| N/R | 15.2 | % |
(a) | Excludes short-term securities, options purchased, options written and TBA sale commitments. |
(b) | Rounds to less than 0.1%. |
(c) | For purposes of this report, credit quality ratings shown above reflect the highest rating assigned by either S&P Global Ratings or Moody’s Investors Service, Inc. if ratings differ. These rating agencies are independent, nationally recognized statistical rating organizations and are widely used. Investment grade ratings are credit ratings of BBB/Baa or higher. Below investment grade ratings are credit ratings of BB/Ba or lower. Investments designated N/R are not rated by either rating agency. Unrated investments do not necessarily indicate low credit quality. Credit quality ratings are subject to change. |
(d) | The investment adviser evaluates the credit quality of unrated investments based upon certain factors including, but not limited to, credit ratings for similar investments and financial analysis of sectors, individual investments and/or issuers. Using this approach, the investment adviser has deemed unrated U.S. Government Sponsored Agency Securities and U.S. Treasury Obligations to be of similar credit quality as investments rated AAA/Aaa. |
Material Fund changes
This is a summary of certain changes to the Fund since September 30, 2023. For more complete information, you may review the Fund’s next prospectus, which we expect to be available approximately 120 days after September 30, 2024 at blackrock.com/fundreports or upon request by contacting us at (800) 441-7762.
Effective September 16, 2024, the Fund ceased to invest in Master Total Return Portfolio (the “Master Portfolio”), a series of Master Bond LLC, as part of a “master/feeder” structure and instead operates as a stand-alone fund. In connection with this change and in accordance with the investment advisory agreement, the Fund now pays a monthly fee at an annual rate equal to the following percentages of the average daily value of the Fund's net assets: 0.48% (first $250 million), 0.43% ($250 million - $500 million), 0.38% ($500 million - $750 million) and 0.34% (greater than $750 million).
Additional information
If you wish to view additional information about the Fund, including but not limited to financial statements, the Fund’s prospectus, and proxy voting policies and procedures, please visit blackrock.com/fundreports. For proxy voting records, visit blackrock.com/proxyrecords.
Householding
The Fund will mail only one copy of shareholder documents, including prospectuses, annual and semi-annual reports and proxy statements, to shareholders with multiple accounts at the same address. This practice is commonly called “householding” and is intended to reduce expenses and eliminate duplicate mailings of shareholder documents. Mailings of your shareholder documents may be householded indefinitely unless you instruct us otherwise. If you do not want the mailing of these documents to be combined with those for other members of your household, please call the Fund at (800) 441-7762.
The Fund is not sponsored, endorsed, issued, sold, or promoted by Bloomberg Index Services Limited and its affiliates, nor does this company make any representation regarding the advisability of investing in the Fund. BlackRock is not affiliated with the company listed above.
©2024 BlackRock, Inc. or its affiliates. All rights reserved. BLACKROCK is a registered trademark of BlackRock, Inc. or its affiliates. All other trademarks are those of their respective owners.
BlackRock Total Return Fund
Class K Shares | MPHQX
Annual Shareholder Report — September 30, 2024
MPHQX-09/24-AR
BlackRock Total Return Fund
Class R Shares | MRCBX
Annual Shareholder Report — September 30, 2024
This annual shareholder report contains important information about BlackRock Total Return Fund (the “Fund”) for the period of October 1, 2023 to September 30, 2024. You can find additional information about the Fund at blackrock.com/fundreports. You can also request this information by contacting us at (800) 441‑7762.
This report describes changes to the Fund that occurred during the reporting period.
What were the Fund costs for the last year?
(based on a hypothetical $10,000 investment)
| Class name | Costs of a $10,000
investment | Costs paid as a percentage of a
$10,000 investment |
| Class R Shares | $109(a) | 1.03%(a) |
(a) | Because the Fund invested all of its assets in Master Total Return Portfolio (the “Master Portfolio”), a series of Master Bond LLC, prior to September 16, 2024, the expense example reflects the net expenses of both the Fund and the Master Portfolio in which it invested for a portion of the period. |
How did the Fund perform last year?
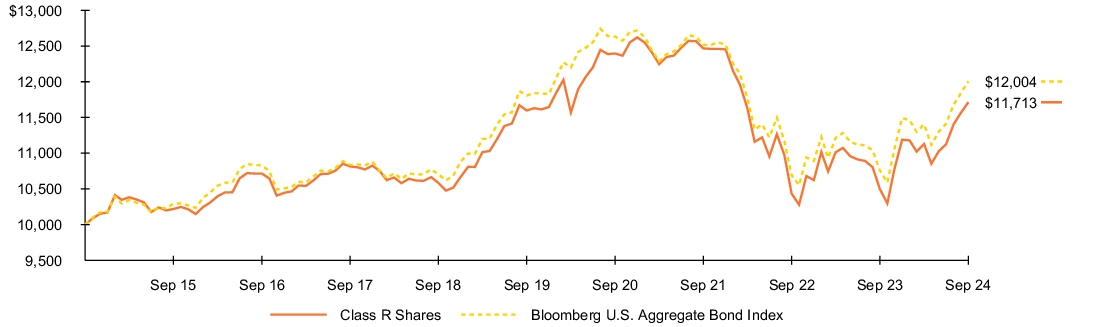
For the reporting period ended September 30, 2024, the Fund's Class R Shares returned 11.59%
For the same period, the Bloomberg U.S. Aggregate Bond Index returned 11.57%.
What contributed to absolute performance?
The Fund’s allocations to agency mortgage-backed securities, U.S. investment grade corporate bonds, and structured products contributed to performance for the annual period.
What detracted from absolute performance?
The Fund’s positioning with respect to U.S. interest rates was the only source of negative return.
The views expressed reflect the opinions of BlackRock as of the date of this report and are subject to change based on changes in market, economic or other conditions. These views are not intended to be a forecast of future events and are no guarantee of future results.
Fund performance
Cumulative performance: October 1, 2014 through September 30, 2024
Initial investment of $10,000
See “Average annual total returns” for additional information on fund performance.
Average annual total returns
| 1 Year | | 5 Years | | 10 Years | |
| Class R Shares | 11.59 | % | 0.20 | % | 1.59 | % |
| Bloomberg U.S. Aggregate Bond Index | 11.57 | | 0.33 | | 1.84 | |
| Net Assets | $20,127,307,489 |
| Number of Portfolio Holdings | 5,009 |
| Net Investment Advisory Fees | $54,171,979 |
| Portfolio Turnover Rate | 471% |
Average annual total returns reflect reductions for distribution and service fees.
Past performance is not an indication of future results. Performance results may include adjustments made for financial reporting purposes in accordance with U.S. generally accepted accounting principles. Performance results do not reflect the deduction of taxes that a shareholder would pay on fund distributions or on the redemption or sale of fund shares. Visit blackrock.com for more recent performance information.
What did the Fund invest in?
(as of September 30, 2024)
| Investment Type | Percent of Total
Investments(a) | |
| U.S. Government Sponsored Agency Securities | 32.8 | % |
| Corporate Bonds | 22.7 | % |
| U.S. Treasury Obligations | 17.4 | % |
| Asset-Backed Securities | 10.2 | % |
| Non-Agency Mortgage-Backed Securities | 9.3 | % |
| Foreign Government Obligations | 4.9 | % |
| Floating Rate Loan Interests | 1.0 | % |
| Municipal Bonds | 0.6 | % |
| Common Stocks | 0.5 | % |
| Preferred Securities | 0.3 | % |
| Fixed Rate Loan Interests | 0.2 | % |
| Foreign Agency Obligations | 0.1 | % |
| Warrants | — | % (b) |
| Investment Companies | — | % (b) |
Credit quality allocation
| Credit Rating(c) | Percent of Total
Investments(a) | |
| AAA/Aaa(d) | 57.7 | % |
| AA/Aa | 2.8 | % |
| A | 8.8 | % |
| BBB/Baa | 13.0 | % |
| BB/Ba | 1.1 | % |
| B | 0.5 | % |
| CCC/Caa | 0.4 | % |
| CC/Ca | 0.3 | % |
| C | 0.2 | % |
| N/R | 15.2 | % |
(a) | Excludes short-term securities, options purchased, options written and TBA sale commitments. |
(b) | Rounds to less than 0.1%. |
(c) | For purposes of this report, credit quality ratings shown above reflect the highest rating assigned by either S&P Global Ratings or Moody’s Investors Service, Inc. if ratings differ. These rating agencies are independent, nationally recognized statistical rating organizations and are widely used. Investment grade ratings are credit ratings of BBB/Baa or higher. Below investment grade ratings are credit ratings of BB/Ba or lower. Investments designated N/R are not rated by either rating agency. Unrated investments do not necessarily indicate low credit quality. Credit quality ratings are subject to change. |
(d) | The investment adviser evaluates the credit quality of unrated investments based upon certain factors including, but not limited to, credit ratings for similar investments and financial analysis of sectors, individual investments and/or issuers. Using this approach, the investment adviser has deemed unrated U.S. Government Sponsored Agency Securities and U.S. Treasury Obligations to be of similar credit quality as investments rated AAA/Aaa. |
Material Fund changes
This is a summary of certain changes to the Fund since September 30, 2023. For more complete information, you may review the Fund’s next prospectus, which we expect to be available approximately 120 days after September 30, 2024 at blackrock.com/fundreports or upon request by contacting us at (800) 441-7762.
Effective September 16, 2024, the Fund ceased to invest in Master Total Return Portfolio (the “Master Portfolio”), a series of Master Bond LLC, as part of a “master/feeder” structure and instead operates as a stand-alone fund. In connection with this change and in accordance with the investment advisory agreement, the Fund now pays a monthly fee at an annual rate equal to the following percentages of the average daily value of the Fund's net assets: 0.48% (first $250 million), 0.43% ($250 million - $500 million), 0.38% ($500 million - $750 million) and 0.34% (greater than $750 million).
Additional information
If you wish to view additional information about the Fund, including but not limited to financial statements, the Fund’s prospectus, and proxy voting policies and procedures, please visit blackrock.com/fundreports. For proxy voting records, visit blackrock.com/proxyrecords.
Householding
The Fund will mail only one copy of shareholder documents, including prospectuses, annual and semi-annual reports and proxy statements, to shareholders with multiple accounts at the same address. This practice is commonly called “householding” and is intended to reduce expenses and eliminate duplicate mailings of shareholder documents. Mailings of your shareholder documents may be householded indefinitely unless you instruct us otherwise. If you do not want the mailing of these documents to be combined with those for other members of your household, please call the Fund at (800) 441-7762.
The Fund is not sponsored, endorsed, issued, sold, or promoted by Bloomberg Index Services Limited and its affiliates, nor does this company make any representation regarding the advisability of investing in the Fund. BlackRock is not affiliated with the company listed above.
©2024 BlackRock, Inc. or its affiliates. All rights reserved. BLACKROCK is a registered trademark of BlackRock, Inc. or its affiliates. All other trademarks are those of their respective owners.
BlackRock Total Return Fund
Class R Shares | MRCBX
Annual Shareholder Report — September 30, 2024
MRCBX-09/24-AR
(b) Not Applicable
| Item 2 – | Code of Ethics – The registrant (or the “Fund”) has adopted a code of ethics, as of the end of the period covered by this report, applicable to the registrant’s principal executive officer, principal financial officer, principal accounting officer or controller, or persons performing similar functions. During the period covered by this report, the code of ethics was amended to update certain information and to make other non-material changes. During the period covered by this report, there have been no waivers granted under the code of ethics. The registrant undertakes to provide a copy of the code of ethics to any person upon request, without charge, who calls 1-800-441-7762. |
| Item 3 – | Audit Committee Financial Expert – The registrant’s board of directors (the “board of directors”), has determined that (i) the registrant has the following audit committee financial experts serving on its audit committee and (ii) each audit committee financial expert is independent: |
Lorenzo A. Flores
Catherine A. Lynch
Arthur P. Steinmetz
Under applicable securities laws, a person determined to be an audit committee financial expert will not be deemed an “expert” for any purpose, including without limitation for the purposes of Section 11 of the Securities Act of 1933, as a result of being designated or identified as an audit committee financial expert. The designation or identification of a person as an audit committee financial expert does not impose on such person any duties, obligations, or liabilities greater than the duties, obligations, and liabilities imposed on such person as a member of the audit committee and board of directors in the absence of such designation or identification. The designation or identification of a person as an audit committee financial expert does not affect the duties, obligations, or liability of any other member of the audit committee or board of directors.
| Item 4 – | Principal Accountant Fees and Services |
The following table presents fees billed by Deloitte & Touche LLP (“D&T”) in each of the last two fiscal years for the services rendered to the Fund:
| | | | | | | | | | | | | | | | |
| | | (a) Audit Fees | | (b) Audit-Related Fees1 | | (c) Tax Fees2 | | (d) All Other Fees |
| Entity Name | | Current
Fiscal
Year End | | Previous
Fiscal
Year End | | Current
Fiscal
Year End | | Previous
Fiscal
Year End | | Current
Fiscal
Year End | | Previous
Fiscal
Year End | | Current
Fiscal
Year End | | Previous
Fiscal
Year End |
| BlackRock Total Return Fund | | $86,700 | | $8,262 | | $7,000 | | $0 | | $62,856 | | $19,700 | | $0 | | $0 |
The following table presents fees billed by D&T that were required to be approved by the registrant’s audit committee (the “Committee”) for services that relate directly to the operations or financial reporting of the Fund and that are rendered on behalf of BlackRock Advisors, LLC ( the “Investment Adviser” or “BlackRock”) and entities controlling, controlled by, or under common control with BlackRock (not including any sub-adviser whose role is primarily portfolio management and is subcontracted with or overseen by another investment adviser) that provide ongoing services to the Fund (“Affiliated Service Providers”):
2
| | | | |
| | | Current Fiscal Year End | | Previous Fiscal Year End |
(b) Audit-Related Fees1 | | $0 | | $0 |
(c) Tax Fees2 | | $0 | | $0 |
(d) All Other Fees3 | | $2,149,000 | | $2,154,000 |
1 The nature of the services includes assurance and related services reasonably related to the performance of the audit or review of financial statements not included in Audit Fees, including accounting consultations, agreed-upon procedure reports, attestation reports, comfort letters, out-of-pocket expenses and internal control reviews not required by regulators.
2 The nature of the services includes tax compliance and/or tax preparation, including services relating to the filing or amendment of federal, state or local income tax returns, regulated investment company qualification reviews, taxable income and tax distribution calculations.
3 Non-audit fees of $2,149,000 and $2,154,000 for the current fiscal year and previous fiscal year, respectively, were paid to the Fund’s principal accountant in their entirety by BlackRock, in connection with services provided to the Affiliated Service Providers of the Fund and of certain other funds sponsored and advised by BlackRock or its affiliates for a service organization review and an accounting research tool subscription. These amounts represent aggregate fees paid by BlackRock and were not allocated on a per fund basis.
(e)(1) Audit Committee Pre-Approval Policies and Procedures:
The Committee has adopted policies and procedures with regard to the pre-approval of services. Audit, audit-related and tax compliance services provided to the registrant on an annual basis require specific pre-approval by the Committee. The Committee also must approve other non-audit services provided to the registrant and those non-audit services provided to the Investment Adviser and Affiliated Service Providers that relate directly to the operations and the financial reporting of the registrant. Certain of these non-audit services that the Committee believes are (a) consistent with the SEC’s auditor independence rules and (b) routine and recurring services that will not impair the independence of the independent accountants may be approved by the Committee without consideration on a specific case-by-case basis (“general pre-approval”). The term of any general pre-approval is 12 months from the date of the pre-approval, unless the Committee provides for a different period. Tax or other non-audit services provided to the registrant which have a direct impact on the operations or financial reporting of the registrant will only be deemed pre-approved provided that any individual project does not exceed $10,000 attributable to the registrant or $50,000 per project. For this purpose, multiple projects will be aggregated to determine if they exceed the previously mentioned cost levels.
Any proposed services exceeding the pre-approved cost levels will require specific pre-approval by the Committee, as will any other services not subject to general pre-approval (e.g., unanticipated but permissible services). The Committee is informed of each service approved subject to general pre-approval at the next regularly scheduled in-person board meeting. At this meeting, an analysis of such services is presented to the Committee for ratification. The Committee may delegate to the Committee Chairman the authority to approve the provision of and fees for any specific engagement of permitted non-audit services, including services exceeding pre-approved cost levels.
(e)(2) None of the services described in each of Items 4(b) through (d) were approved by the Committee pursuant to the de minimis exception in paragraph (c)(7)(i)(C) of Rule 2-01 of Regulation S-X.
(f) Not Applicable
(g) The aggregate non-audit fees, defined as the sum of the fees shown under “Audit-Related Fees,” “Tax Fees” and “All Other Fees,” paid to the accountant for services rendered by the accountant to the registrant, the Investment Adviser and the Affiliated Service Providers were:
3
| | | | |
| Entity Name | | Current Fiscal Year End | | Previous Fiscal Year End |
| BlackRock Total Return Fund | | $69,856 | | $19,700 |
Additionally, the amounts billed by D&T in connection with services provided to the Affiliated Service Providers of the Fund and of other funds sponsored or advised by BlackRock or its affiliates during the current and previous fiscal years for a service organization review and an accounting research tool subscription were:
| | |
Current Fiscal Year End | | Previous Fiscal Year End |
$2,149,000 | | $2,154,000 |
These amounts represent aggregate fees paid by BlackRock and were not allocated on a per fund basis.
(h) The Committee has considered and determined that the provision of non-audit services that were rendered to the Investment Adviser and the Affiliated Service Providers that were not pre-approved pursuant to paragraph (c)(7)(ii) of Rule 2-01 of Regulation S-X is compatible with maintaining the principal accountant’s independence.
(i) – Not Applicable
(j) – Not Applicable
| Item 5 – | Audit Committee of Listed Registrant – Not Applicable |
(a) The registrant’s Schedule of Investments is included as part of the Financial Statement and Financial Highlights for Open-End Management Investment Companies filed under Item 7 of this Form.
(b) Not Applicable due to no such divestments during the semi-annual period covered since the previous Form N-CSR filing.
| Item 7 – | Financial Statements and Financial Highlights for Open-End Management Investment Companies |
(a) The registrant’s Financial Statements are attached herewith.
(b) The registrant’s Financial Highlights are attached herewith.
4
| | |

| | SEPTEMBER 30, 2024 |
| | |
| |
| | 2024 Annual Financial Statements and Additional Information |
BlackRock Bond Fund, Inc.
| · | | BlackRock Total Return Fund |
|
Not FDIC Insured • May Lose Value • No Bank Guarantee |
Table of Contents
Derivative Financial Instruments
The Fund may invest in various derivative financial instruments. These instruments are used to obtain exposure to a security, commodity, index, market, and/or other assets without owning or taking physical custody of securities, commodities and/or other referenced assets or to manage market, equity, credit, interest rate, foreign currency exchange rate, commodity and/or other risks. Derivative financial instruments may give rise to a form of economic leverage and involve risks, including the imperfect correlation between the value of a derivative financial instrument and the underlying asset, possible default of the counterparty to the transaction or illiquidity of the instrument. Pursuant to Rule 18f-4 under the 1940 Act, among other things, the Fund must either use derivative financial instruments with embedded leverage in a limited manner or comply with an outer limit on fund leverage risk based on value-at-risk. The Fund’s successful use of a derivative financial instrument depends on the investment adviser’s ability to predict pertinent market movements accurately, which cannot be assured. The use of these instruments may result in losses greater than if they had not been used, may limit the amount of appreciation the Fund can realize on an investment and/or may result in lower distributions paid to shareholders. The Fund’s investments in these instruments, if any, are discussed in detail in the Notes to Consolidated Financial Statements.
| | |
D E R I V A T I V E F I N A N C I A L I N S T R U M E N T S | | 3 |
| | |
Consolidated Schedule of Investments September 30, 2024 | | BlackRock Total Return Fund (Percentages shown are based on Net Assets) |
| | | | | | | | |
| Security | | Par (000) | | | Value | |
|
Asset-Backed Securities | |
1988 CLO 5 Ltd., Series 2024-5A, Class A1, (3-mo. CME Term SOFR + 1.54%), 6.87%, 07/15/37(a)(b) | | | USD 3,675 | | | $ | 3,676,768 | |
510 Loan Acquisition Trust, Series 2020-1, Class A, 8.11%, 09/25/60(a)(c) | | | 3,923 | | | | 3,893,974 | |
522 Funding CLO Ltd. | | | | | | | | |
Series 2019-4A, Class CR, (3-mo. CME Term SOFR + 2.66%), 7.94%, 04/20/30(a)(b) | | | 625 | | | | 625,435 | |
Series 2019-4A, Class DR, (3-mo. CME Term SOFR + 3.91%), 9.19%, 04/20/30(a)(b) | | | 2,170 | | | | 2,193,308 | |
Series 2019-5A, Class AR, (3-mo. CME Term SOFR + 1.33%), 6.63%, 04/15/35(a)(b) | | | 510 | | | | 510,346 | |
Series 2020-6A, Class A1R, (3-mo. CME Term SOFR + 1.41%), 6.70%, 10/23/34(a)(b) | | | 1,130 | | | | 1,130,688 | |
AB BSL CLO 4 Ltd., Series 2023-4A, Class A, (3-mo. CME Term SOFR + 2.00%), 7.28%, 04/20/36(a)(b) | | | 1,660 | | | | 1,670,796 | |
ACE Securities Corp. Home Equity Loan Trust | | | | | | | | |
Series 2003-OP1, Class A2, (1-mo. CME Term SOFR + 0.83%), 5.69%, 12/25/33(b) | | | 497 | | | | 472,906 | |
Series 2005-AG1, Class M2, (1-mo. CME Term SOFR + 0.80%), 5.66%, 08/25/35(b) | | | 491 | | | | 398,997 | |
Series 2006-CW1, Class A2C, (1-mo. CME Term SOFR + 0.39%), 5.25%, 07/25/36(b) | | | 225 | | | | 182,017 | |
Series 2007-HE4, Class A2A, (1-mo. CME Term SOFR + 0.37%), 5.23%, 05/25/37(b) | | | 2,378 | | | | 407,477 | |
Series 2007-HE4, Class A2C, (1-mo. CME Term SOFR + 0.71%), 5.57%, 05/25/37(b) | | | 210 | | | | 36,268 | |
Affirm Asset Securitization Trust, Series 2024-A, Class A, 5.61%, 02/15/29(a) | | | 3,805 | | | | 3,854,646 | |
AGL CLO 11 Ltd., Series 2021-11A, Class E, (3-mo. CME Term SOFR + 6.62%), 11.92%, 04/15/34(a)(b) | | | 250 | | | | 250,105 | |
AGL CLO 12 Ltd., Series 2021-12A, Class A1, (3-mo. CME Term SOFR + 1.42%), 6.70%, 07/20/34(a)(b) | | | 7,640 | | | | 7,651,361 | |
AGL CLO 13 Ltd., Series 2021-13A, Class A1, (3-mo. CME Term SOFR + 1.42%), 6.70%, 10/20/34(a)(b) | | | 250 | | | | 250,369 | |
AGL CLO 14 Ltd. | | | | | | | | |
Series 2021-14A, Class A, (3-mo. CME Term SOFR + 1.41%), 6.69%, 12/02/34(a)(b) | | | 1,000 | | | | 1,001,103 | |
Series 2021-14A, Class B1, (3-mo. CME Term SOFR + 1.91%), 7.19%, 12/02/34(a)(b) | | | 1,450 | | | | 1,452,908 | |
AGL CLO 20 Ltd., Series 2022-20A, Class BR, (3-mo. CME Term SOFR + 1.75%), 10/20/37(a)(b)(d) | | | 3,331 | | | | 3,331,000 | |
AGL CLO 23 Ltd., Series 2022-23A, Class A, (3-mo. CME Term SOFR + 2.20%), 7.48%, 01/20/36(a)(b) | | | 1,990 | | | | 1,999,438 | |
AGL CLO 32 Ltd., Series 2024-32A, Class A1, (3-mo. CME Term SOFR + 1.38%), 6.65%, 07/21/37(a)(b) | | | 1,230 | | | | 1,234,920 | |
AGL CLO 5 Ltd., Series 2020-5A, Class A1R, (3-mo. CME Term SOFR + 1.42%), 6.70%, 07/20/34(a)(b) | | | 2,830 | | | | 2,834,222 | |
AGL CLO 7 Ltd. | | | | | | | | |
Series 2020-7A, Class AR, (3-mo. CME Term SOFR + 1.46%), 6.76%, 07/15/34(a)(b) | | | 2,400 | | | | 2,400,947 | |
| | | | | | | | |
| Security | | Par (000) | | | Value | |
|
Asset-Backed Securities (continued) | |
AGL CLO 7 Ltd. | | | | | | | | |
Series 2020-7A, Class DR, (3-mo. CME Term SOFR + 3.36%), 8.66%, 07/15/34(a)(b) | | | USD 500 | | | $ | 500,479 | |
AGL Core CLO 15 Ltd., Series 2021-15A, Class A1, (3-mo. CME Term SOFR + 1.41%), 6.69%, 01/20/35(a)(b) | | | 1,344 | | | | 1,345,972 | |
AGL Core CLO 2 Ltd., Series 2019-2A, Class A1R, (3-mo. CME Term SOFR + 1.46%), 6.79%, 07/20/37(a)(b) | | | 14,335 | | | | 14,373,944 | |
AGL Core CLO 4 Ltd., Series 2020-4A, Class AR2, (3-mo. CME Term SOFR + 1.38%), 6.15%, 10/20/37(a)(b) | | | 3,620 | | | | 3,621,187 | |
AIMCO CLO | | | | | | | | |
Series 2017-AA, Class AR, (3-mo. CME Term SOFR + 1.31%), 6.59%, 04/20/34(a)(b) | | | 250 | | | | 250,019 | |
Series 2017-AA, Class CR, (3-mo. CME Term SOFR + 2.36%), 7.64%, 04/20/34(a)(b) | | | 500 | | | | 501,339 | |
Series 2017-AA, Class DR, (3-mo. CME Term SOFR + 3.41%), 8.69%, 04/20/34(a)(b) | | | 250 | | | | 250,775 | |
AIMCO CLO 11 Ltd., Series 2020-11A, Class BR2, (3-mo. CME Term SOFR + 1.65%), 6.89%, 07/17/37(a)(b) | | | 3,490 | | | | 3,500,518 | |
AIMCO CLO 12 Ltd., Series 2020-12A, Class AR, (3-mo. CME Term SOFR + 1.17%), 6.46%, 01/17/32(a)(b) | | | 6,039 | | | | 6,044,539 | |
AIMCO CLO 21 Ltd., Series 2024-21A, Class B, (3-mo. CME Term SOFR + 1.92%), 7.25%, 04/18/37(a)(b) | | | 750 | | | | 755,282 | |
Ajax Mortgage Loan Trust | | | | | | | | |
Series 2021-G, Class A, 1.88%, 06/25/61(a)(b) | | | 32,801 | | | | 31,867,414 | |
Series 2021-G, Class B, 3.75%, 06/25/61(a)(b) | | | 8,006 | | | | 8,541,126 | |
Series 2021-G, Class C, 0.00%, 06/25/61(a)(e) | | | 14,366 | | | | 13,194,036 | |
Series 2023-B, Class A, 4.25%, 10/25/62(a)(c) | | | 14,187 | | | | 13,831,596 | |
Series 2023-B, Class B, 4.25%, 10/25/62(a)(c) | | | 1,749 | | | | 1,663,627 | |
Series 2023-B, Class C, 0.00%, 10/25/62(a)(e) | | | 3,993 | | | | 1,883,634 | |
Series 2023-B, Class SA, 0.00%, 10/25/62(a)(e) | | | 687 | | | | 524,174 | |
AMMC CLO 18 Ltd., Series 2016-18A, Class AR, (3-mo. CME Term SOFR + 1.36%), 6.43%, 05/26/31(a)(b) | | | 762 | | | | 764,296 | |
AMMC CLO 21 Ltd., Series 2017-21A, Class A, (3-mo. CME Term SOFR + 1.51%), 6.75%, 11/02/30(a)(b) | | | 228 | | | | 227,904 | |
AMMC CLO 22 Ltd., Series 2018-22A, Class B, (3-mo. CME Term SOFR + 1.71%), 7.00%, 04/25/31(a)(b) | | | 500 | | | | 501,258 | |
AMMC CLO XII Ltd., Series 2013-12A, Class AR2, (3-mo. CME Term SOFR + 1.21%), 6.31%, 11/10/30(a)(b) | | | 111 | | | | 110,582 | |
AMSR Trust | | | | | | | | |
Series 2020-SFR1, Class E, 3.22%, 04/17/37(a) | | | 1,280 | | | | 1,262,350 | |
Series 2020-SFR2, Class D, 3.28%, 07/17/37(a) | | | 2,437 | | | | 2,405,206 | |
| | |
| 4 | | 2 0 2 4 B L A C K R O C K A N N U A L F I N A N C I A L S T A T E M E N T S A N D A D D I T I O N A L I N F O R M A T I O N |
| | |
Consolidated Schedule of Investments (continued) September 30, 2024 | | BlackRock Total Return Fund (Percentages shown are based on Net Assets) |
| | | | | | | | |
| Security | | Par (000) | | | Value | |
|
Asset-Backed Securities (continued) | |
AMSR Trust | | | | | | | | |
Series 2020-SFR3, Class E1, 2.56%, 09/17/37(a) | | | USD 2,490 | | | $ | 2,417,809 | |
Series 2020-SFR4, Class E2, 2.46%, 11/17/37(a) | | | 2,500 | | | | 2,419,180 | |
Series 2020-SFR4, Class F, 2.86%, 11/17/37(a) | | | 2,760 | | | | 2,678,008 | |
Anchorage Capital CLO 16 Ltd., Series 2020-16A, Class A1R, (3-mo. CME Term SOFR + 1.46%), 6.74%, 01/19/35(a)(b) | | | 250 | | | | 250,254 | |
Anchorage Capital CLO 17 Ltd., Series 2021-17A, Class A1, (3-mo. CME Term SOFR + 1.43%), 6.73%, 07/15/34(a)(b) | | | 11,115 | | | | 11,125,309 | |
Anchorage Capital CLO 29 Ltd., Series 2024-29A, Class A1, (3-mo. CME Term SOFR + 1.60%), 6.92%, 07/20/37(a)(b) | | | 3,020 | | | | 3,032,718 | |
Anchorage Capital CLO 6 Ltd. | | | | | | | | |
Series 2015-6A, Class AR3, (3-mo. CME Term SOFR + 1.44%), 6.77%, 04/22/34(a)(b) | | | 5,470 | | | | 5,471,541 | |
Series 2015-6A, Class BR3, (3-mo. CME Term SOFR + 2.10%), 7.43%, 04/22/34(a)(b) | | | 5,490 | | | | 5,523,763 | |
Anchorage Capital CLO 7 Ltd. | | | | | | | | |
Series 2015-7A, Class AR3, (3-mo. CME Term SOFR + 1.56%), 6.89%, 04/28/37(a)(b) | | | 5,686 | | | | 5,723,056 | |
Series 2015-7A, Class BR3, (3-mo. CME Term SOFR + 2.05%), 7.38%, 04/28/37(a)(b) | | | 7,620 | | | | 7,680,631 | |
Series 2015-7A, Class CR3, (3-mo. CME Term SOFR + 2.45%), 7.78%, 04/28/37(a)(b) | | | 4,250 | | | | 4,314,152 | |
Series 2015-7A, Class DR3, (3-mo. CME Term SOFR + 3.80%), 9.13%, 04/28/37(a)(b) | | | 1,140 | | | | 1,161,177 | |
Anchorage Capital CLO 8 Ltd. | | | | | | | | |
Series 2016-8A, Class AR2A, (3-mo. CME Term SOFR + 1.46%), 6.73%, 10/27/34(a)(b) | | | 2,395 | | | | 2,397,390 | |
Series 2016-8A, Class BR2, (3-mo. CME Term SOFR + 2.06%), 7.33%, 10/27/34(a)(b) | | | 2,800 | | | | 2,811,169 | |
Anchorage Capital Europe CLO 2 DAC | | | | | | | | |
Series 2A, Class B1R, (3-mo. EURIBOR + 1.60%), 5.29%, 04/15/34(a)(b) | | | EUR 1,327 | | | | 1,473,532 | |
Series 2A, Class DR, (3-mo. EURIBOR + 3.55%), 7.24%, 04/15/34(a)(b) | | | 1,380 | | | | 1,544,087 | |
Anchorage Capital Europe CLO DAC, Series 4A, Class D, (3-mo. EURIBOR + 3.20%), 6.89%, 04/25/34(a)(b) | | | 542 | | | | 604,320 | |
Apidos CLO XV, Series 2013-15A, Class A1RR, (3-mo. CME Term SOFR + 1.27%), 6.55%, 04/20/31(a)(b) | | | USD 547 | | | | 547,571 | |
Apidos CLO XVIII, Series 2018-18A, Class AR, (3-mo. CME Term SOFR + 1.15%), 6.43%, 10/22/30(a)(b) | | | 671 | | | | 671,002 | |
Apidos CLO XX | | | | | | | | |
Series 2015-20A, Class A1RA, (3-mo. CME Term SOFR + 1.36%), 6.65%, 07/16/31(a)(b) | | | 283 | | | | 283,723 | |
| | | | | | | | |
| Security | | Par (000) | | | Value | |
|
Asset-Backed Securities (continued) | |
Apidos CLO XX | | | | | | | | |
Series 2015-20A, Class A2RR, (3-mo. CME Term SOFR + 1.81%), 7.10%, 07/16/31(a)(b) | | | USD 250 | | | $ | 250,721 | |
Apidos CLO XXII | | | | | | | | |
Series 2015-22A, Class A1R, (3-mo. CME Term SOFR + 1.32%), 6.60%, 04/20/31(a)(b) | | | 126 | | | | 126,242 | |
Series 2015-22A, Class A2R, (3-mo. CME Term SOFR + 1.76%), 7.04%, 04/20/31(a)(b) | | | 500 | | | | 501,319 | |
Series 2015-22A, Class BR, (3-mo. CME Term SOFR + 2.21%), 7.49%, 04/20/31(a)(b) | | | 250 | | | | 250,740 | |
Series 2015-22A, Class CR, (3-mo. CME Term SOFR + 3.21%), 8.49%, 04/20/31(a)(b) | | | 850 | | | | 856,731 | |
Apidos CLO XXIV, Series 2016-24A, Class A2LX, (3-mo. CME Term SOFR + 1.61%), 6.89%, 10/20/30(a)(b) | | | 660 | | | | 660,778 | |
Apidos CLO XXV | | | | | | | | |
Series 2016-25A, Class A1R2, (3-mo. CME Term SOFR + 1.15%), 6.43%, 10/20/31(a)(b) | | | 856 | | | | 856,687 | |
Series 2016-25A, Class A2R2, (3-mo. CME Term SOFR + 1.80%), 7.08%, 10/20/31(a)(b) | | | 6,850 | | | | 6,863,984 | |
Apidos CLO XXVI, Series 2017-26A, Class BR, (3-mo. CME Term SOFR + 2.21%), 7.49%, 07/18/29(a)(b) | | | 570 | | | | 571,684 | |
Apidos CLO XXXI, Series 2019-31A, Class BR, (3-mo. CME Term SOFR + 1.81%), 7.11%, 04/15/31(a)(b) | | | 500 | | | | 500,660 | |
Apidos CLO XXXII, Series 2019-32A, Class A1R, (3-mo. CME Term SOFR + 1.10%), 6.38%, 01/20/33(a)(b) | | | 830 | | | | 831,309 | |
Apidos CLO XXXIV, Series 2020-34A, Class A1R, (3-mo. CME Term SOFR + 1.41%), 6.69%, 01/20/35(a)(b) | | | 6,244 | | | | 6,249,698 | |
Apidos CLO XXXVI, Series 2021-36A, Class B, (3-mo. CME Term SOFR + 1.86%), 7.14%, 07/20/34(a)(b) | | | 625 | | | | 627,514 | |
Apidos CLO XXXVII | | | | | | | | |
Series 2021-37A, Class A, (3-mo. CME Term SOFR + 1.39%), 6.67%, 10/22/34(a)(b) | | | 450 | | | | 450,227 | |
Series 2021-37A, Class D, (3-mo. CME Term SOFR + 3.31%), 8.59%, 10/22/34(a)(b) | | | 250 | | | | 250,136 | |
Series 2021-37A, Class E, (3-mo. CME Term SOFR + 6.56%), 11.84%, 10/22/34(a)(b) | | | 455 | | | | 455,746 | |
Aqua Finance Trust, Series 2021-A, Class A, 1.54%, 07/17/46(a) | | | 315 | | | | 290,619 | |
Arbor Realty Commercial Real Estate Notes Ltd., Series 2022-FL1, Class A, (SOFR (30-day) + 1.45%), 6.79%, 01/15/37(a)(b) | | | 267 | | | | 265,953 | |
Ares European CLO XII DAC, Series 12A, Class B1R, (3-mo. EURIBOR + 1.70%), 5.39%, 04/20/32(a)(b) | | | EUR 889 | | | | 988,239 | |
Ares LII CLO Ltd. | | | | | | | | |
Series 2019-52A, Class A1R, (3-mo. CME Term SOFR + 1.31%), 6.59%, 04/22/31(a)(b) | | | USD 8,785 | | | | 8,795,980 | |
| | |
C O N S O L I D A T E D S C H E D U L E S O F I N V E S T M E N T S | | 5 |
| | |
Consolidated Schedule of Investments (continued) September 30, 2024 | | BlackRock Total Return Fund (Percentages shown are based on Net Assets) |
| | | | | | | | |
| Security | | Par (000) | | | Value | |
|
Asset-Backed Securities (continued) | |
Ares LII CLO Ltd. | | | | | | | | |
Series 2019-52A, Class A2R, (3-mo. CME Term SOFR + 1.71%), 6.99%, 04/22/31(a)(b) | | USD | 250 | | | $ | 250,094 | |
Ares LIX CLO Ltd., Series 2021-59A, Class A, (3-mo. CME Term SOFR + 1.29%), 6.58%, 04/25/34(a)(b) | | | 500 | | | | 500,652 | |
Ares Loan Funding IV Ltd., Series 2023-ALF4A, Class A1, (3-mo. CME Term SOFR + 1.75%), 7.05%, 10/15/36(a)(b) | | | 1,270 | | | | 1,278,890 | |
Ares LVI CLO Ltd., Series 2020-56A, Class AR, (3-mo. CME Term SOFR + 1.42%), 6.71%, 10/25/34(a)(b) | | | 2,110 | | | | 2,113,087 | |
Ares XLVIII CLO Ltd., Series 2018-48A, Class B, (3-mo. CME Term SOFR + 1.84%), 7.12%, 07/20/30(a)(b) | | | 370 | | | | 371,166 | |
Ares XXXVII CLO Ltd., Series 2015-4A, Class A1RR, (3-mo. CME Term SOFR + 1.08%), 6.38%, 10/15/30(a)(b) | | | 855 | | | | 855,897 | |
Argent Mortgage Loan Trust, Series 2005-W1, Class A2, (1-mo. CME Term SOFR + 0.59%), 5.45%, 05/25/35(b) | | | 2,425 | | | | 1,946,366 | |
Argent Securities Trust | | | | | | | | |
Series 2006-M1, Class A2C, (1-mo. CME Term SOFR + 0.41%), 5.27%, 07/25/36(b) | | | 3,680 | | | | 992,582 | |
Series 2006-W2, Class A2C, (1-mo. CME Term SOFR + 0.69%), 5.55%, 03/25/36(b) | | | 686 | | | | 378,963 | |
ARM Master Trust LLC Agricultural Loan Backed Notes, Series 2021-T1, Class A, 2.43%, 11/15/27(a) | | | 1,646 | | | | 1,624,494 | |
Armada Euro CLO III DAC | | | | | | | | |
Series 3A, Class DR, (3-mo. EURIBOR + 3.30%), 6.99%, 07/15/31(a)(b) | | EUR | 1,563 | | | | 1,740,311 | |
Series 3A, Class DRR, (3-mo. EURIBOR + 3.30%), 10/15/37(a)(b)(d) | | | 1,563 | | | | 1,739,853 | |
Asimi Funding PLC | | | | | | | | |
Series 2024-1, Class B, (1-day SONIA + 1.35%), 6.31%, 09/16/31(b)(f) | | GBP | 600 | | | | 801,530 | |
Series 2024-1, Class C, (1-day SONIA + 1.95%), 6.91%, 09/16/31(b)(f) | | | 556 | | | | 745,379 | |
Assurant CLO II Ltd., Series 2018-2A, Class A, (3-mo. CME Term SOFR + 1.30%), 6.58%, 04/20/31(a)(b) | | USD | 314 | | | | 314,744 | |
Auto ABS Italian Stella Loans SRL | | | | | | | | |
Series 2024-1, Class C, (1-mo. EURIBOR + 1.70%), 5.08%, 12/29/36(b)(f) | | EUR | 480 | | | | 535,295 | |
Series 2024-1, Class D, (1-mo. EURIBOR + 2.30%), 5.68%, 12/29/36(b)(f) | | | 458 | | | | 512,837 | |
Auto1 Car Funding Sarl | | | | | | | | |
Series 2024-1, Class C, (1-mo. EURIBOR + 1.50%), 4.94%, 12/15/33(b)(f) | | | 300 | | | | 335,306 | |
Series 2024-1, Class D, (1-mo. EURIBOR + 3.50%), 6.94%, 12/15/33(b)(f) | | | 300 | | | | 344,930 | |
Avoca CLO XV DAC, Series 15X, Class B2R, (3-mo. EURIBOR + 1.05%), 4.74%, 04/15/31(b)(f) | | | 400 | | | | 441,237 | |
Avoca CLO XVIII DAC, Series 18X, Class C, (3-mo. EURIBOR + 1.75%), 5.44%, 04/15/31(b)(f) | | | 400 | | | | 445,455 | |
Avoca CLO XXII DAC | | | | | | | | |
Series 22A, Class D, (3-mo. EURIBOR + 2.90%), 6.59%, 04/15/35(a)(b) | | | 500 | | | | 554,578 | |
| | | | | | | | |
| Security | | Par (000) | | | Value | |
|
Asset-Backed Securities (continued) | |
Avoca CLO XXII DAC | | | | | | | | |
Series 22X, Class B1, (3-mo. EURIBOR + 1.30%), 4.99%, 04/15/35(b)(f) | | EUR | 850 | | | $ | 939,107 | |
Avoca CLO XXIII DAC, Series 23A, Class D, (3-mo. EURIBOR + 3.05%), 6.74%, 04/15/34(a)(b) | | | 500 | | | | 558,563 | |
Bain Capital Credit CLO Ltd. | | | | | | | | |
Series 2018-2A, Class A1R, (3-mo. CME Term SOFR + 1.08%), 6.36%, 07/19/31(a)(b) | | USD | 1,670 | | | | 1,670,113 | |
Series 2018-2A, Class BR, (3-mo. CME Term SOFR + 1.55%), 6.83%, 07/19/31(a)(b) | | | 500 | | | | 500,480 | |
Series 2021-3A, Class D, (3-mo. CME Term SOFR + 3.36%), 8.65%, 07/24/34(a)(b) | | | 250 | | | | 247,096 | |
Series 2021-4A, Class A1, (3-mo. CME Term SOFR + 1.43%), 6.71%, 10/20/34(a)(b) | | | 560 | | | | 560,333 | |
Series 2024-2A, Class A1, (3-mo. CME Term SOFR + 1.52%), 6.85%, 07/15/37(a)(b) | | | 7,880 | | | | 7,898,338 | |
Ballyrock CLO 14 Ltd. | | | | | | | | |
Series 2020-14A, Class A2R, (3-mo. CME Term SOFR + 1.70%), 7.00%, 07/20/37(a)(b) | | | 2,500 | | | | 2,503,299 | |
Series 2020-14A, Class DR, (3-mo. CME Term SOFR + 5.85%), 11.15%, 07/20/37(a)(b) | | | 250 | | | | 249,992 | |
Ballyrock CLO Ltd. | | | | | | | | |
Series 2018-1A, Class A2, (3-mo. CME Term SOFR + 1.86%), 7.14%, 04/20/31(a)(b) | | | 500 | | | | 500,003 | |
Series 2020-2A, Class DR, (3-mo. CME Term SOFR + 6.41%), 11.69%, 10/20/31(a)(b) | | | 250 | | | | 249,874 | |
Series 2021-1A, Class A1, (3-mo. CME Term SOFR + 1.32%), 6.62%, 04/15/34(a)(b) | | | 6,935 | | | | 6,936,651 | |
BankAmerica Manufactured Housing Contract Trust | | | | | | | | |
Series 1997-2, Class B1, 7.07%, 02/10/22(b) | | | 1,680 | | | | 263,595 | |
Series 1998-2, Class B1, 7.22%, 12/10/25(b) | | | 2,790 | | | | 362,704 | |
Bankers Healthcare Group Securitization Trust, Series 2020-A, Class C, 5.17%, 09/17/31(a) | | | 410 | | | | 406,493 | |
Bardot CLO Ltd., Series 2019-2A, Class DR, (3-mo. CME Term SOFR + 3.26%), 8.54%, 10/22/32(a)(b) | | | 250 | | | | 255,625 | |
Barings CLO Ltd. | | | | | | | | |
Series 2015-2A, Class AR, (3-mo. CME Term SOFR + 1.45%), 6.73%, 10/20/30(a)(b) | | | 1,227 | | | | 1,227,206 | |
Series 2015-IA, Class BR, (3-mo. CME Term SOFR + 1.66%), 6.94%, 01/20/31(a)(b) | | | 980 | | | | 981,234 | |
Series 2019-3A, Class A1R, (3-mo. CME Term SOFR + 1.33%), 6.61%, 04/20/31(a)(b) | | | 1,554 | | | | 1,560,821 | |
Series 2020-1A, Class AR, (3-mo. CME Term SOFR + 1.41%), 6.71%, 10/15/36(a)(b) | | | 1,440 | | | | 1,442,125 | |
Battalion CLO 18 Ltd., Series 2020-18A, Class BR, (3-mo. CME Term SOFR + 2.01%), 7.31%, 10/15/36(a)(b) | | | 1,827 | | | | 1,825,380 | |
Battalion CLO IX Ltd., Series 2015-9A, Class DR, (3-mo. CME Term SOFR + 3.51%), 8.81%, 07/15/31(a)(b) | | | 250 | | | | 248,846 | |
Battalion CLO VIII Ltd. | | | | | | | | |
Series 2015-8A, Class A1R2, (3-mo. CME Term SOFR + 1.33%), 6.61%, 07/18/30(a)(b) | | | 3,271 | | | | 3,274,180 | |
| | |
| 6 | | 2 0 2 4 B L A C K R O C K A N N U A L F I N A N C I A L S T A T E M E N T S A N D A D D I T I O N A L I N F O R M A T I O N |
| | |
Consolidated Schedule of Investments (continued) September 30, 2024 | | BlackRock Total Return Fund (Percentages shown are based on Net Assets) |
| | | | | | | | |
| Security | | Par (000) | | | Value | |
|
Asset-Backed Securities (continued) | |
Battalion CLO VIII Ltd. | | | | | | | | |
Series 2015-8A, Class A2R2, (3-mo. CME Term SOFR + 1.81%), 7.09%, 07/18/30(a)(b) | | USD | 3,250 | | | $ | 3,253,261 | |
Series 2015-8A, Class BR2, (3-mo. CME Term SOFR + 2.26%), 7.54%, 07/18/30(a)(b) | | | 2,901 | | | | 2,906,083 | |
Battalion CLO XI Ltd., Series 2017-11A, Class BR, (3-mo. CME Term SOFR + 1.98%), 7.27%, 04/24/34(a)(b) | | | 1,000 | | | | 1,002,361 | |
Battalion CLO XX Ltd., Series 2021-20A, Class A, (3-mo. CME Term SOFR + 1.44%), 6.74%, 07/15/34(a)(b) | | | 4,520 | | | | 4,522,730 | |
Bayview Financial Revolving Asset Trust | | | | | | | | |
Series 2004-B, Class A1, (1-mo. CME Term SOFR + 1.11%), 5.96%, 05/28/39(a)(b) | | | 5,901 | | | | 4,740,407 | |
Series 2004-B, Class A2, (1-mo. CME Term SOFR + 1.41%), 6.26%, 05/28/39(a)(b) | | | 226 | | | | 116,966 | |
Series 2005-A, Class A1, (1-mo. CME Term SOFR + 1.11%), 5.96%, 02/28/40(a)(b) | | | 1,193 | | | | 1,117,557 | |
Series 2005-E, Class A1, (1-mo. CME Term SOFR + 1.11%), 5.96%, 12/28/40(a)(b) | | | 139 | | | | 138,041 | |
BCMSC Trust | | | | | | | | |
Series 2000-A, Class A2, 7.58%, 06/15/30(b) | | | 1,674 | | | | 149,967 | |
Series 2000-A, Class A3, 7.83%, 06/15/30(b) | | | 1,554 | | | | 143,873 | |
Series 2000-A, Class A4, 8.29%, 06/15/30(b) | | | 1,121 | | | | 109,882 | |
BDS Ltd. | | | | | | | | |
Series 2022-FL11, Class ATS, (1-mo. CME Term SOFR + 1.80%), 6.77%, 03/19/39(a)(b) | | | 2,042 | | | | 2,043,642 | |
Series 2024-FL13, Class A, (1-mo. CME Term SOFR + 1.58%), 6.78%, 09/19/39(a)(b) | | | 2,735 | | | | 2,728,126 | |
Bean Creek CLO Ltd. | | | | | | | | |
Series 2015-1A, Class AR, (3-mo. CME Term SOFR + 1.28%), 6.56%, 04/20/31(a)(b) | | | 100 | | | | 99,989 | |
Series 2015-1A, Class BR, (3-mo. CME Term SOFR + 1.71%), 6.99%, 04/20/31(a)(b) | | | 439 | | | | 439,967 | |
Bear Stearns Asset-Backed Securities I Trust | | | | | | | | |
Series 2004-HE7, Class M2, (1-mo. CME Term SOFR + 1.84%), 6.69%, 08/25/34(b) | | | 12 | | | | 12,173 | |
Series 2006-HE1, Class 1M4, (1-mo. CME Term SOFR + 1.13%), 5.33%, 12/25/35(b) | | | 2,454 | | | | 2,275,171 | |
Series 2006-HE7, Class 1A2, (1-mo. CME Term SOFR + 0.45%), 5.31%, 09/25/36(b) | | | 825 | | | | 828,631 | |
Series 2007-FS1, Class 1A3, (1-mo. CME Term SOFR + 0.45%), 5.31%, 05/25/35(b) | | | 23 | | | | 23,370 | |
Series 2007-HE2, Class 1A4, (1-mo. CME Term SOFR + 0.43%), 5.29%, 03/25/37(b) | | | 1,050 | | | | 952,389 | |
Series 2007-HE2, Class 22A, (1-mo. CME Term SOFR + 0.39%), 5.25%, 03/25/37(b) | | | 379 | | | | 356,721 | |
Series 2007-HE2, Class 23A, (1-mo. CME Term SOFR + 0.39%), 5.25%, 03/25/37(b) | | | 481 | | | | 457,116 | |
Series 2007-HE3, Class 1A3, (1-mo. CME Term SOFR + 0.36%), 5.22%, 04/25/37(b) | | | 74 | | | | 73,785 | |
Series 2007-HE3, Class 1A4, (1-mo. CME Term SOFR + 0.46%), 5.32%, 04/25/37(b) | | | 7,220 | | | | 6,602,460 | |
Benefit Street Partners CLO Ltd., | | | | | | | | |
Series 2021- 23A, Class E, (3-mo. CME Term SOFR + 7.07%), 12.36%, 04/25/34(a)(b) | | | 750 | | | | 750,938 | |
| | | | | | | | |
| Security | | Par (000) | | | Value | |
|
Asset-Backed Securities (continued) | |
Benefit Street Partners CLO V-B Ltd., Series 2018-5BA, Class A1R, (3-mo. CME Term SOFR + 1.53%), 6.83%, 07/20/37(a)(b) | | USD | 4,360 | | | $ | 4,391,509 | |
Benefit Street Partners CLO VIII Ltd., Series 2015-8A, Class A1AR, (3-mo. CME Term SOFR + 1.36%), 6.64%, 01/20/31(a)(b) | | | 1,099 | | | | 1,100,167 | |
Benefit Street Partners CLO X Ltd., Series 2016-10A, Class A2AR, (3-mo. CME Term SOFR + 1.81%), 7.09%, 04/20/34(a)(b) | | | 710 | | | | 710,902 | |
Benefit Street Partners CLO XII-B Ltd. | | | | | | | | |
Series 2017-12BRA, Class A, (3-mo. CME Term SOFR + 1.37%), 6.61%, 10/15/37(a)(b) | | | 3,811 | | | | 3,811,031 | |
Series 2017-12BRA, Class B, (3-mo. CME Term SOFR + 1.70%), 6.94%, 10/15/37(a)(b) | | | 2,000 | | | | 2,002,547 | |
Benefit Street Partners CLO XIV Ltd., Series 2018-14A, Class AR, (3-mo. CME Term SOFR + 1.37%), 5.96%, 10/20/37(a)(b) | | | 750 | | | | 750,000 | |
Benefit Street Partners CLO XIX Ltd. | | | | | | | | |
Series 2019-19A, Class AR, (3-mo. CME Term SOFR + 1.18%), 6.48%, 01/15/33(a)(b) | | | 1,500 | | | | 1,501,149 | |
Series 2019-19A, Class BR, (3-mo. CME Term SOFR + 1.60%), 6.90%, 01/15/33(a)(b) | | | 250 | | | | 250,509 | |
Benefit Street Partners CLO XVII Ltd., Series 2019-17A, Class AR, (3-mo. CME Term SOFR + 1.34%), 6.64%, 07/15/32(a)(b) | | | 1,840 | | | | 1,841,082 | |
Benefit Street Partners CLO XX Ltd. | | | | | | | | |
Series 2020-20A, Class AR, (3-mo. CME Term SOFR + 1.43%), 6.73%, 07/15/34(a)(b) | | | 3,830 | | | | 3,832,222 | |
Series 2020-20A, Class ER, (3-mo. CME Term SOFR + 7.01%), 12.31%, 07/15/34(a)(b) | | | 250 | | | | 250,369 | |
Benefit Street Partners CLO XXI Ltd., Series 2020-21A, Class A1R, (3-mo. CME Term SOFR + 1.43%), 6.73%, 10/15/34(a)(b) | | | 250 | | | | 250,127 | |
Benefit Street Partners CLO XXIII Ltd., Series 2021-23A, Class A1, (3-mo. CME Term SOFR + 1.34%), 6.63%, 04/25/34(a)(b) | | | 800 | | | | 800,638 | |
Benefit Street Partners CLO XXIV Ltd., Series 2021-24A, Class D, (3-mo. CME Term SOFR + 3.61%), 8.89%, 10/20/34(a)(b) | | | 500 | | | | 501,678 | |
Benefit Street Partners CLO XXV Ltd., Series 2021-25A, Class B, (3-mo. CME Term SOFR + 1.96%), 7.26%, 01/15/35(a)(b) | | | 250 | | | | 250,761 | |
Benefit Street Partners CLO XXVI Ltd., Series 2022-26A, Class AR, (3-mo. CME Term SOFR + 1.38%), 6.66%, 07/20/37(a)(b) | | | 1,310 | | | | 1,310,988 | |
Benefit Street Partners CLO XXVII Ltd., Series 2022-27A, Class AR, (3-mo. CME Term SOFR + 1.37%), 6.56%, 10/20/37(a)(b) | | | 12,020 | | | | 12,020,123 | |
BHG Securitization Trust | | | | | | | | |
Series 2021-A, Class B, 2.79%, 11/17/33(a) | | | 1,007 | | | | 960,283 | |
Series 2022-C, Class B, 5.93%, 10/17/35(a) | | | 1,625 | | | | 1,632,963 | |
Birch Grove CLO 2 Ltd., Series 2021-2A, Class A1R, (3-mo. CME Term SOFR + 1.40%), 6.55%, 10/19/37(a)(b) | | | 870 | | | | 870,289 | |
| | |
C O N S O L I D A T E D S C H E D U L E S O F I N V E S T M E N T S | | 7 |
| | |
Consolidated Schedule of Investments (continued) September 30, 2024 | | BlackRock Total Return Fund (Percentages shown are based on Net Assets) |
| | | | | | | | |
| Security | | Par (000) | | | Value | |
|
Asset-Backed Securities (continued) | |
Birch Grove CLO 3 Ltd. | | | | | | | | |
Series 2021-3A, Class B1, (3-mo. CME Term SOFR + 2.06%), 7.34%, 01/19/35(a)(b) | | USD | 520 | | | $ | 521,552 | |
Series 2021-3A, Class B2, (3-mo. CME Term SOFR + 2.06%), 7.34%, 01/19/35(a)(b) | | | 1,000 | | | | 1,002,984 | |
Birch Grove CLO Ltd., Series 19A, Class A1RR, (3-mo. CME Term SOFR + 1.59%), 6.91%, 07/17/37(a)(b) | | | 250 | | | | 251,253 | |
BlueMountain CLO Ltd. | | | | | | | | |
Series 2013-2A, Class A1R, (3-mo. CME Term SOFR + 1.44%), 6.72%, 10/22/30(a)(b) | | | 1,961 | | | | 1,962,664 | |
Series 2013-2A, Class BR, (3-mo. CME Term SOFR + 1.86%), 7.14%, 10/22/30(a)(b) | | | 500 | | | | 501,593 | |
Series 2015-3A, Class A1R, (3-mo. CME Term SOFR + 1.26%), 6.54%, 04/20/31(a)(b) | | | 1,751 | | | | 1,751,298 | |
Series 2016-3A, Class A1R2, (3-mo. CME Term SOFR + 1.20%), 6.32%, 11/15/30(a)(b) | | | 1,013 | | | | 1,014,598 | |
Series 2018-2A, Class B, (3-mo. CME Term SOFR + 1.96%), 7.08%, 08/15/31(a)(b) | | | 1,095 | | | | 1,099,439 | |
Series 2018-3A, Class A1R, (3-mo. CME Term SOFR + 1.19%), 6.48%, 10/25/30(a)(b) | | | 2,267 | | | | 2,267,905 | |
Series 2018-3A, Class BR, (3-mo. CME Term SOFR + 1.85%), 7.14%, 10/25/30(a)(b) | | | 10,020 | | | | 10,039,640 | |
BlueMountain CLO XXII Ltd., Series 2018-22A, Class B, (3-mo. CME Term SOFR + 1.76%), 7.06%, 07/15/31(a)(b) | | | 3,970 | | | | 3,973,006 | |
BlueMountain CLO XXIX Ltd., Series 2020-29A, Class BR, (3-mo. CME Term SOFR + 2.01%), 7.30%, 07/25/34(a)(b) | | | 1,080 | | | | 1,081,299 | |
BlueMountain CLO XXV Ltd., Series 2019-25A, Class BR, (3-mo. CME Term SOFR + 1.96%), 7.26%, 07/15/36(a)(b) | | | 250 | | | | 250,252 | |
BlueMountain CLO XXVIII Ltd., Series 2021-28A, Class A, (3-mo. CME Term SOFR + 1.52%), 6.82%, 04/15/34(a)(b) | | | 570 | | | | 570,526 | |
BlueMountain CLO XXXI Ltd., Series 2021-31A, Class A1, (3-mo. CME Term SOFR + 1.41%), 6.69%, 04/19/34(a)(b) | | | 1,000 | | | | 1,001,013 | |
BlueMountain Euro CLO DAC, Series 2021-2A, Class B1, (3-mo. EURIBOR + 1.75%), 5.44%, 10/15/35(a)(b) | | EUR | 3,280 | | | | 3,651,133 | |
BlueMountain Fuji U.S. CLO III Ltd. | | | | | | | | |
Series 2017-3A, Class A2, (3-mo. CME Term SOFR + 1.41%), 6.71%, 01/15/30(a)(b) | | USD | 750 | | | | 750,382 | |
Series 2017-3A, Class B, (3-mo. CME Term SOFR + 1.64%), 6.94%, 01/15/30(a)(b) | | | 500 | | | | 500,517 | |
BPCRE Ltd., Series 2022-FL2, Class A, (1-mo. CME Term SOFR + 2.40%), 7.41%, 01/16/37(a)(b) | | | 1,778 | | | | 1,771,763 | |
Brex Commercial Charge Card Master Trust, Series 2024-1, Class A1, 6.05%, 07/15/27(a) . | | | 3,325 | | | | 3,378,240 | |
Bridge Street CLO II Ltd., Series 2021-1A, Class A1A, (3-mo. CME Term SOFR + 1.49%), 6.77%, 07/20/34(a)(b) | | | 500 | | | | 500,137 | |
Brignole Co. | | | | | | | | |
Series 2024, Class C, (1-mo. EURIBOR + 2.00%), 5.61%, 02/24/42(b)(f) | | EUR | 301 | | | | 335,660 | |
| | | | | | | | |
| Security | | Par (000) | | | Value | |
|
Asset-Backed Securities (continued) | |
Brignole Co. | | | | | | | | |
Series 2024, Class D, (1-mo. EURIBOR + 4.00%), 7.61%, 02/24/42(b)(f) | | EUR | 434 | | | $ | 483,822 | |
Bristol Park CLO Ltd. | | | | | | | | |
Series 2016-1A, Class AR, (3-mo. CME Term SOFR + 1.25%), 6.55%, 04/15/29(a)(b) | | USD | 5,100 | | | | 5,101,987 | |
Series 2016-1A, Class BR, (3-mo. CME Term SOFR + 1.71%), 7.01%, 04/15/29(a)(b) | | | 400 | | | | 400,922 | |
Bryant Park Funding Ltd. | | | | | | | | |
Series 2023-19A, Class B, (3-mo. CME Term SOFR + 3.90%), 9.20%, 04/15/36(a)(b) | | | 2,000 | | | | 2,032,154 | |
Series 2024-24A, Class A1, (3-mo. CME Term SOFR + 1.40%), 6.01%, 10/15/37(a)(b)(g) | | | 1,500 | | | | 1,500,000 | |
Buckhorn Park CLO Ltd., Series 2019-1A, Class AR, (3-mo. CME Term SOFR + 1.38%), 6.66%, 07/18/34(a)(b) | | | 1,590 | | | | 1,590,844 | |
Canyon Capital CLO Ltd., Series 2016-1A, Class AR, (3-mo. CME Term SOFR + 1.33%), 6.63%, 07/15/31(a)(b) | | | 420 | | | | 420,457 | |
Canyon CLO Ltd. | | | | | | | | |
Series 2018-1A, Class A, (3-mo. CME Term SOFR + 1.33%), 6.63%, 07/15/31(a)(b) | | | 473 | | | | 473,923 | |
Series 2020-3A, Class BR, (3-mo. CME Term SOFR + 1.95%), 7.19%, 10/15/37(a)(b) | | | 1,610 | | | | 1,618,295 | |
Series 2023-2A, Class B, (3-mo. CME Term SOFR + 2.05%), 7.37%, 05/15/37(a)(b) | | | 6,800 | | | | 6,869,571 | |
Cardiff Auto Receivables Securitisation PLC | | | | | | | | |
Series 2024-1, Class C, (1-day SONIA + 1.90%), 6.86%, 08/20/31(b)(f) | | GBP | 1,743 | | | | 2,336,076 | |
Series 2024-1, Class D, (1-day SONIA + 2.60%), 7.56%, 08/20/31(b)(f) | | | 1,320 | | | | 1,771,505 | |
Carlyle C17 CLO Ltd., Series C17A, Class A1AR, (3-mo. CME Term SOFR + 1.29%), 6.55%, 04/30/31(a)(b) | | USD | 4,809 | | | | 4,812,502 | |
Carlyle Global Market Strategies CLO Ltd. | | | | | | | | |
Series 2012-4A, Class A1R4, (3-mo. CME Term SOFR + 1.12%), 5.97%, 04/22/32(a)(b) | | | 4,485 | | | | 4,485,000 | |
Series 2013-3A, Class A1AR, (3-mo. CME Term SOFR + 1.36%), 6.66%, 10/15/30(a)(b) | | | 79 | | | | 78,993 | |
Series 2013-4A, Class A1RR, (3-mo. CME Term SOFR + 1.26%), 6.56%, 01/15/31(a)(b) | | | 985 | | | | 986,230 | |
Series 2014-1A, Class A1R2, (3-mo. CME Term SOFR + 1.23%), 6.52%, 04/17/31(a)(b) | | | 1,937 | | | | 1,940,329 | |
Series 2014-2RA, Class A1, (3-mo. CME Term SOFR + 1.31%), 6.43%, 05/15/31(a)(b) | | | 1,617 | | | | 1,618,134 | |
Series 2014-3RA, Class A1A, (3-mo. CME Term SOFR + 1.31%), 6.58%, 07/27/31(a)(b) | | | 277 | | | | 277,071 | |
Series 2014-5A, Class A1RR, (3-mo. CME Term SOFR + 1.40%), 6.70%, 07/15/31(a)(b) | | | 840 | | | | 841,014 | |
Series 2014-5A, Class A2RR, (3-mo. CME Term SOFR + 1.71%), 7.01%, 07/15/31(a)(b) | | | 830 | | | | 830,474 | |
| | |
| 8 | | 2 0 2 4 B L A C K R O C K A N N U A L F I N A N C I A L S T A T E M E N T S A N D A D D I T I O N A L I N F O R M A T I O N |
| | |
Consolidated Schedule of Investments (continued) September 30, 2024 | | BlackRock Total Return Fund (Percentages shown are based on Net Assets) |
| | | | | | | | |
| Security | | Par (000) | | | Value | |
|
Asset-Backed Securities (continued) | |
Carlyle Global Market Strategies CLO Ltd. | | | | | | | | |
Series 2015-4A, Class A1RR, (3-mo. CME Term SOFR + 1.22%), 6.50%, 07/20/32(a)(b) | | USD | 3,640 | | | $ | 3,642,912 | |
Series 2016-1A, Class A1R2, (3-mo. CME Term SOFR + 1.40%), 6.68%, 04/20/34(a)(b) | | | 250 | | | | 250,408 | |
Carlyle U.S. CLO Ltd. | | | | | | | | |
Series 2017-1A, Class A1R, (3-mo. CME Term SOFR + 1.26%), 6.54%, 04/20/31(a)(b) | | | 395 | | | | 395,285 | |
Series 2017-3A, Class A1R2, (3-mo. CME Term SOFR + 1.40%), 6.54%, 10/21/37(a)(b) | | | 6,810 | | | | 6,810,702 | |
Series 2017-3A, Class BR2, (3-mo. CME Term SOFR + 1.78%), 6.92%, 10/21/37(a)(b) | | | 5,170 | | | | 5,177,410 | |
Series 2017-4A, Class A1, (3-mo. CME Term SOFR + 1.44%), 6.74%, 01/15/30(a)(b) | | | 2,032 | | | | 2,033,907 | |
Series 2019-1A, Class A1AR, (3-mo. CME Term SOFR + 1.34%), 6.62%, 04/20/31(a)(b) | | | 1,304 | | | | 1,305,336 | |
Series 2019-2A, Class A1R, (3-mo. CME Term SOFR + 1.38%), 6.68%, 07/15/32(a)(b) | | | 4,000 | | | | 4,006,158 | |
Series 2021-1A, Class A1, (3-mo. CME Term SOFR + 1.40%), 6.70%, 04/15/34(a)(b) | | | 250 | | | | 250,193 | |
Series 2021-6A, Class A1, (3-mo. CME Term SOFR + 1.42%), 6.72%, 07/15/34(a)(b) | | | 3,590 | | | | 3,592,163 | |
Series 2023-1A, Class B, (3-mo. CME Term SOFR + 2.60%), 7.88%, 07/20/35(a)(b) | | | 750 | | | | 754,018 | |
Carrington Mortgage Loan Trust | | | | | | | | |
Series 2006-NC1, Class M2, (1-mo. CME Term SOFR + 0.74%), 5.60%, 01/25/36(b) | | | 610 | | | | 516,645 | |
Series 2006-NC4, Class A3, (1-mo. CME Term SOFR + 0.27%), 5.13%, 10/25/36(b) | | | 250 | | | | 245,857 | |
CarVal CLO II Ltd., Series 2019-1A, Class CR, (3-mo. CME Term SOFR + 2.26%), 7.54%, 04/20/32(a)(b) | | | 700 | | | | 700,564 | |
CarVal CLO III Ltd., Series 2019-2A, Class E, (3-mo. CME Term SOFR + 6.70%), 11.98%, 07/20/32(a)(b) | | | 250 | | | | 244,922 | |
CarVal CLO VC Ltd. | | | | | | | | |
Series 2021-2A, Class D, (3-mo. CME Term SOFR + 3.51%), 8.81%, 10/15/34(a)(b) | | | 250 | | | | 250,712 | |
Series 2021-2A, Class E, (3-mo. CME Term SOFR + 7.01%), 12.31%, 10/15/34(a)(b) | | | 250 | | | | 249,494 | |
Cascade MH Asset Trust, Series 2019-MH1, Class A, 4.00%, 11/25/44(a)(b) | | | 6,977 | | | | 6,611,031 | |
Cayuga Park CLO Ltd., Series 2020-1A, Class AR, (3-mo. CME Term SOFR + 1.38%), 6.67%, 07/17/34(a)(b) | | | 3,270 | | | | 3,277,521 | |
CBAM Ltd. | | | | | | | | |
Series 2017-1A, Class A1, (3-mo. CME Term SOFR + 1.51%), 6.79%, 07/20/30(a)(b) | | | 2,172 | | | | 2,173,981 | |
Series 2017-1A, Class C, (3-mo. CME Term SOFR + 2.66%), 7.94%, 07/20/30(a)(b) | | | 750 | | | | 752,640 | |
Series 2018-5A, Class B1, (3-mo. CME Term SOFR + 1.66%), 6.95%, 04/17/31(a)(b) | | | 710 | | | | 710,691 | |
Series 2018-6A, Class B1R, (3-mo. CME Term SOFR + 2.36%), 7.66%, 01/15/31(a)(b) | | | 250 | | | | 250,628 | |
| | | | | | | | |
| Security | | Par (000) | | | Value | |
|
Asset-Backed Securities (continued) | |
CBAM Ltd. | | | | | | | | |
Series 2018-7A, Class A, (3-mo. CME Term SOFR + 1.36%), 6.64%, 07/20/31(a)(b) | | USD | 192 | | | $ | 192,060 | |
Series 2018-7A, Class B1, (3-mo. CME Term SOFR + 1.86%), 7.14%, 07/20/31(a)(b) | | | 250 | | | | 250,854 | |
Series 2019-10A, Class A1R, (3-mo. CME Term SOFR + 1.38%), 6.66%, 04/20/32(a)(b) | | | 4,657 | | | | 4,659,265 | |
Series 2020-12A, Class AR, (3-mo. CME Term SOFR + 1.44%), 6.72%, 07/20/34(a)(b) | | | 436 | | | | 436,307 | |
C-BASS Trust | | | | | | | | |
Series 2006-CB7, Class A4, (1-mo. CME Term SOFR + 0.43%), 5.29%, 10/25/36(b) | | | 372 | | | | 245,918 | |
Series 2006-CB9, Class A4, (1-mo. CME Term SOFR + 0.57%), 5.43%, 11/25/36(b) | | | 335 | | | | 151,681 | |
Cedar Funding II CLO Ltd. | | | | | | | | |
Series 2013-1A, Class ARR, (3-mo. CME Term SOFR + 1.34%), 6.62%, 04/20/34(a)(b) | | | 3,255 | | | | 3,257,086 | |
Series 2013-1A, Class BRR, (3-mo. CME Term SOFR + 1.61%), 6.89%, 04/20/34(a)(b) | | | 3,110 | | | | 3,111,041 | |
Cedar Funding V CLO Ltd., Series 2016-5A, Class A1R, (3-mo. CME Term SOFR + 1.36%), 6.65%, 07/17/31(a)(b) | | | 1,697 | | | | 1,698,161 | |
Cedar Funding VI CLO Ltd., Series 2016-6A, Class ARR, (3-mo. CME Term SOFR + 1.31%), 6.59%, 04/20/34(a)(b) | | | 18,290 | | | | 18,304,559 | |
Cedar Funding VII CLO Ltd., Series 2018-7A, Class AR, (3-mo. CME Term SOFR + 1.08%), 6.18%, 01/20/31(a)(b) | | | 180 | | | | 180,180 | |
Cedar Funding VIII CLO Ltd., Series 2017-8A, Class BR, (3-mo. CME Term SOFR + 1.91%), 7.20%, 10/17/34(a)(b) | | | 4,540 | | | | 4,542,023 | |
Cedar Funding XI CLO Ltd., Series 2019-11A, Class A2R, (3-mo. CME Term SOFR + 1.61%), 6.67%, 05/29/32(a)(b) | | | 1,220 | | | | 1,219,993 | |
Cedar Funding XIV CLO Ltd. | | | | | | | | |
Series 2021-14A, Class B, (3-mo. CME Term SOFR + 1.86%), 7.16%, 07/15/33(a)(b) | | | 770 | | | | 769,685 | |
Series 2021-14A, Class D, (3-mo. CME Term SOFR + 3.51%), 8.81%, 07/15/33(a)(b) | | | 250 | | | | 247,326 | |
CIFC European Funding CLO II DAC, Series 2X, Class B1, (3-mo. EURIBOR + 1.60%), 5.29%, 04/15/33(b)(f) | | EUR | 900 | | | | 999,024 | |
CIFC Funding Ltd. | | | | | | | | |
Series 2013-1A, Class A2R, (3-mo. CME Term SOFR + 2.01%), 7.30%, 07/16/30(a)(b) | | USD | 1,250 | | | | 1,253,344 | |
Series 2013-1A, Class CR, (3-mo. CME Term SOFR + 3.81%), 9.10%, 07/16/30(a)(b) | | | 250 | | | | 255,181 | |
Series 2013-2A, Class A1L2, (3-mo. CME Term SOFR + 1.26%), 6.54%, 10/18/30(a)(b) | | | 154 | | | | 154,324 | |
Series 2013-2A, Class A2L2, (3-mo. CME Term SOFR + 1.76%), 7.04%, 10/18/30(a)(b) | | | 250 | | | | 250,256 | |
Series 2013-3RA, Class A1, (3-mo. CME Term SOFR + 1.24%), 6.53%, 04/24/31(a)(b) | | | 633 | | | | 633,828 | |
| | |
C O N S O L I D A T E D S C H E D U L E S O F I N V E S T M E N T S | | 9 |
| | |
Consolidated Schedule of Investments (continued) September 30, 2024 | | BlackRock Total Return Fund (Percentages shown are based on Net Assets) |
| | | | | | | | |
| Security | | Par (000) | | | Value | |
|
Asset-Backed Securities (continued) | |
CIFC Funding Ltd. | | | | | | | | |
Series 2013-4A, Class BRR, (3-mo. CME Term SOFR + 1.86%), 7.13%, 04/27/31(a)(b) | | USD | 500 | | | $ | 501,232 | |
Series 2013-4A, Class DRR, (3-mo. CME Term SOFR + 3.06%), 8.33%, 04/27/31(a)(b) | | | 250 | | | | 250,204 | |
Series 2014-1A, Class BR2, (3-mo. CME Term SOFR + 1.66%), 6.94%, 01/18/31(a)(b) | | | 3,320 | | | | 3,322,943 | |
Series 2014-3A, Class A1R2, (3-mo. CME Term SOFR + 1.46%), 6.74%, 10/22/31(a)(b) | | | 945 | | | | 946,046 | |
Series 2014-3A, Class BR2, (3-mo. CME Term SOFR + 2.06%), 7.34%, 10/22/31(a)(b) | | | 700 | | | | 702,387 | |
Series 2015-1A, Class ARR, (3-mo. CME Term SOFR + 1.37%), 6.65%, 01/22/31(a)(b) | | | 149 | | | | 149,663 | |
Series 2015-1A, Class BRR, (3-mo. CME Term SOFR + 1.71%), 6.99%, 01/22/31(a)(b) | | | 250 | | | | 250,317 | |
Series 2015-3A, Class BR, (3-mo. CME Term SOFR + 1.41%), 6.69%, 04/19/29(a)(b) | | | 1,420 | | | | 1,419,509 | |
Series 2016-1A, Class D1RR, (3-mo. CME Term SOFR + 3.16%), 8.44%, 10/21/31(a) | | | 250 | | | | 251,262 | |
Series 2017-1A, Class ARR, (3-mo. CME Term SOFR + 1.55%), 6.83%, 04/21/37(a)(b) | | | 6,190 | | | | 6,206,278 | |
Series 2017-1A, Class BRR, (3-mo. CME Term SOFR + 2.05%), 7.33%, 04/21/37(a)(b) | | | 3,410 | | | | 3,433,364 | |
Series 2017-1A, Class CRR, (3-mo. CME Term SOFR + 2.45%), 7.73%, 04/21/37(a)(b) | | | 250 | | | | 253,108 | |
Series 2017-5A, Class AR, (3-mo. CME Term SOFR + 1.41%), 6.74%, 07/17/37(a)(b) | | | 1,770 | | | | 1,771,770 | |
Series 2018-1A, Class A, (3-mo. CME Term SOFR + 1.26%), 6.54%, 04/18/31(a)(b) | | | 4,740 | | | | 4,740,007 | |
Series 2018-2A, Class A1R, (3-mo. CME Term SOFR + 1.37%), 10/20/37(a)(b)(d) | | | 250 | | | | 250,000 | |
Series 2018-2A, Class BR, (3-mo. CME Term SOFR + 1.75%), 10/20/37(a)(b)(d) | | | 1,000 | | | | 1,000,000 | |
Series 2018-3A, Class A, (3-mo. CME Term SOFR + 1.36%), 6.64%, 07/18/31(a)(b) | | | 569 | | | | 569,271 | |
Series 2019-1A, Class AR, (3-mo. CME Term SOFR + 1.36%), 6.64%, 04/20/32(a)(b) | | | 1,425 | | | | 1,425,000 | |
Series 2019-3A, Class A2R, (3-mo. CME Term SOFR + 1.91%), 7.20%, 10/16/34(a)(b) | | | 430 | | | | 431,720 | |
Series 2019-5A, Class A1R1, (3-mo. CME Term SOFR + 1.40%), 6.70%, 01/15/35(a)(b) | | | 400 | | | | 400,172 | |
Series 2019-6A, Class A1R, (3-mo. CME Term SOFR + 1.45%), 6.78%, 07/16/37(a)(b) | | | 6,170 | | | | 6,187,403 | |
Series 2020-1A, Class A1R, (3-mo. CME Term SOFR + 1.41%), 6.71%, 07/15/36(a)(b) | | | 1,200 | | | | 1,200,447 | |
Series 2020-1A, Class BR, (3-mo. CME Term SOFR + 1.91%), 7.21%, 07/15/36(a)(b) | | | 3,260 | | | | 3,271,182 | |
| | | | | | | | |
| Security | | Par (000) | | | Value | |
|
Asset-Backed Securities (continued) | |
CIFC Funding Ltd. | | | | | | | | |
Series 2020-3A, Class A1R, (3-mo. CME Term SOFR + 1.39%), 6.67%, 10/20/34(a)(b) | | USD | 12,140 | | | $ | 12,144,695 | |
Series 2020-3A, Class BR, (3-mo. CME Term SOFR + 1.91%), 7.19%, 10/20/34(a)(b) | | | 780 | | | | 783,045 | |
Series 2021-1A, Class A1R, (3-mo. CME Term SOFR + 1.42%), 6.76%, 07/25/37(a)(b) | | | 250 | | | | 250,950 | |
Series 2021-1A, Class BR, (3-mo. CME Term SOFR + 1.75%), 7.09%, 07/25/37(a)(b) | | | 5,280 | | | | 5,285,147 | |
Series 2021-3A, Class B, (3-mo. CME Term SOFR + 1.96%), 7.26%, 07/15/36(a)(b) | | | 490 | | | | 492,045 | |
Series 2021-4A, Class AR, (3-mo. CME Term SOFR + 1.36%), 6.53%, 07/23/37(a)(b) | | | 8,210 | | | | 8,211,584 | |
Series 2021-4A, Class BR, (3-mo. CME Term SOFR + 1.65%), 6.82%, 07/23/37(a)(b) | | | 500 | | | | 499,910 | |
Series 2021-4A, Class CR, (3-mo. CME Term SOFR + 1.90%), 7.07%, 07/23/37(a)(b) | | | 250 | | | | 250,522 | |
Series 2021-5A, Class A, (3-mo. CME Term SOFR + 1.40%), 6.70%, 07/15/34(a)(b) | | | 2,030 | | | | 2,031,143 | |
Series 2021-6A, Class A, (3-mo. CME Term SOFR + 1.40%), 6.70%, 10/15/34(a)(b) | | | 840 | | | | 842,100 | |
Series 2021-6A, Class B, (3-mo. CME Term SOFR + 1.91%), 7.21%, 10/15/34(a)(b) | | | 700 | | | | 702,140 | |
Series 2023-3A, Class A, (3-mo. CME Term SOFR + 1.60%), 6.88%, 01/20/37(a)(b) | | | 2,410 | | | | 2,424,536 | |
CIT Mortgage Loan Trust, Series 2007-1, Class 1M2, (1-mo. CME Term SOFR + 1.86%), 6.72%, 10/25/37(a)(b) | | | 1,821 | | | | 1,767,055 | |
Citigroup Mortgage Loan Trust | | | | | | | | |
Series 2007-AHL2, Class A3B, (1-mo. CME Term SOFR + 0.31%), 5.17%, 05/25/37(b) | | | 4,374 | | | | 2,914,513 | |
Series 2007-AHL2, Class A3C, (1-mo. CME Term SOFR + 0.38%), 5.24%, 05/25/37(b) | | | 1,987 | | | | 1,323,842 | |
Series 2007-AHL3, Class A3B, (1-mo. CME Term SOFR + 0.28%), 5.14%, 07/25/45(b) | | | 3,145 | | | | 2,202,526 | |
Clear Creek CLO | | | | | | | | |
Series 2015-1A, Class AR, (3-mo. CME Term SOFR + 1.46%), 6.74%, 10/20/30(a)(b) | | | 278 | | | | 277,957 | |
Series 2015-1A, Class DR, (3-mo. CME Term SOFR + 3.21%), 8.49%, 10/20/30(a)(b) | | | 620 | | | | 615,974 | |
Clover CLO LLC | | | | | | | | |
Series 2018-1A, Class A1RR, (3-mo. CME Term SOFR + 1.53%), 6.85%, 04/20/37(a)(b) | | | 4,120 | | | | 4,128,948 | |
Series 2018-1A, Class B1RR, (3-mo. CME Term SOFR + 1.95%), 7.27%, 04/20/37(a)(b) | | | 750 | | | | 755,020 | |
Series 2021-1A, Class A, (3-mo. CME Term SOFR + 1.36%), 6.64%, 04/22/34(a)(b) | | | 11,270 | | | | 11,280,008 | |
College Ave Student Loans LLC | | | | | | | | |
Series 2021-B, Class B, 2.42%, 06/25/52(a) | | | 775 | | | | 699,598 | |
Series 2021-B, Class C, 2.72%, 06/25/52(a) | | | 350 | | | | 318,902 | |
Series 2021-B, Class D, 3.78%, 06/25/52(a) | | | 86 | | | | 77,631 | |
Series 2021-C, Class D, 4.11%, 07/26/55(a) | | | 270 | | | | 250,022 | |
College Ave Student Loans Trust, Series 2024-A, Class A1B, (SOFR (30-day) + 1.75%), 7.03%, 06/25/54(a)(b) | | | 8,808 | | | | 8,891,907 | |
Conseco Finance Corp. | | | | | | | | |
Series 1997-3, Class M1, 7.53%, 03/15/28(b) | | | 452 | | | | 448,950 | |
Series 1997-6, Class M1, 7.21%, 01/15/29(b) | | | 80 | | | | 81,180 | |
| | |
| 10 | | 2 0 2 4 B L A C K R O C K A N N U A L F I N A N C I A L S T A T E M E N T S A N D A D D I T I O N A L I N F O R M A T I O N |
| | |
Consolidated Schedule of Investments (continued) September 30, 2024 | | BlackRock Total Return Fund (Percentages shown are based on Net Assets) |
| | | | | | | | |
| Security | | Par (000) | | | Value | |
|
Asset-Backed Securities (continued) | |
Conseco Finance Corp. | | | | | | | | |
Series 1998-4, Class M1, 6.83%, 04/01/30(b) | | USD | 168 | | | $ | 161,609 | |
Series 1999-5, Class A5, 7.86%, 03/01/30(b) | | | 781 | | | | 249,644 | |
Series 1999-5, Class A6, 7.50%, 03/01/30(b) | | | 838 | | | | 255,949 | |
Conseco Finance Securitizations Corp. | | | | | | | | |
Series 2000-1, Class A5, 8.06%, 09/01/29(b) | | | 1,445 | | | | 234,798 | |
Series 2000-4, Class A6, 8.31%, 05/01/32(b) | | | 1,224 | | | | 203,138 | |
Series 2000-5, Class A6, 7.96%, 05/01/31 | | | 2,105 | | | | 487,366 | |
Series 2000-5, Class A7, 8.20%, 05/01/31 | | | 3,840 | | | | 915,888 | |
Cook Park CLO Ltd., Series 2018-1A, Class B, (3-mo. CME Term SOFR + 1.66%), 6.95%, 04/17/30(a)(b) | | | 250 | | | | 250,512 | |
Countrywide Asset-Backed Certificates | | | | | | | | |
Series 2004-5, Class A, (1-mo. CME Term SOFR + 1.01%), 5.87%, 10/25/34(b) | | | 310 | | | | 306,360 | |
Series 2005-16, Class 1AF, 4.51%, 04/25/36(b) | | | 1,995 | | | | 1,777,075 | |
Series 2006-17, Class 2A2, (1-mo. CME Term SOFR + 0.41%), 5.27%, 03/25/47(b) | | | 71 | | | | 69,784 | |
Series 2006-18, Class M1, (1-mo. CME Term SOFR + 0.56%), 5.42%, 03/25/37(b) | | | 6,498 | | | | 5,476,465 | |
Series 2006-22, Class M1, (1-mo. CME Term SOFR + 0.46%), 5.31%, 05/25/47(b) | | | 817 | | | | 716,259 | |
Series 2006-SPS1, Class A, (1-mo. CME Term SOFR + 0.33%), 5.19%, 12/25/25(b) | | | 7 | | | | 32,520 | |
Series 2007-12, Class 1A2, (1-mo. CME Term SOFR + 0.95%), 5.81%, 08/25/47(b) | | | 2,717 | | | | 2,642,247 | |
Series 2007-SEA2, Class 2A1, (1-mo. CME Term SOFR + 1.61%), 6.47%, 06/25/47(a)(b) | | | 1,446 | | | | 1,139,215 | |
Countrywide Asset-Backed Certificates Revolving Home Equity Loan Trust, Series 2004-U, Class 2A, (1-mo. CME Term SOFR + 0.38%), 5.48%, 03/15/34(b) | | | 170 | | | | 168,887 | |
Credit Suisse First Boston Mortgage Securities Corp. | | | | | | | | |
Series 2001-MH29, Class B1, 8.10%, 09/25/31(b) | | | 542 | | | | 547,981 | |
Series 2004-CF2, Class 1B, 6.00%, 01/25/43(a)(c) | | | 305 | | | | 238,812 | |
Credit Suisse Mortgage Trust, Series 2021-JR1, Class A1, 5.47%, 09/27/66(a)(b) | | | 14,451 | | | | 14,400,382 | |
Credit-Based Asset Servicing & Securitization LLC | | | | | | | | |
Series 2006-CB2, Class AF4, 3.03%, 12/25/36(c) | | | 322 | | | | 271,510 | |
Series 2006-MH1, Class B1, 6.75%, 10/25/36(a)(c) | | | 368 | | | | 365,778 | |
Series 2006-MH1, Class B2, 6.75%, 10/25/36(a)(c) | | | 2,962 | | | | 2,426,824 | |
Series 2006-SL1, Class A2, 6.06%, 09/25/36(a)(c) | | | 2,731 | | | | 102,205 | |
Series 2007-CB6, Class A4, (1-mo. CME Term SOFR + 0.45%), 5.73%, 07/25/37(a)(b) | | | 411 | | | | 271,252 | |
Crown City CLO III, Series 2021-1A, Class A1A, (3-mo. CME Term SOFR + 1.43%), 6.71%, 07/20/34(a)(b) | | | 250 | | | | 250,196 | |
Crown Point CLO 10 Ltd., Series 2021-10A, Class B, (3-mo. CME Term SOFR + 1.96%), 7.24%, 07/20/34(a)(b) | | | 490 | | | | 491,455 | |
| | | | | | | | |
| Security | | Par (000) | | | Value | |
|
Asset-Backed Securities (continued) | |
CVC Cordatus Loan Fund IV DAC, Series 4X, Class BR1, (3-mo. EURIBOR + 1.30%), 4.84%, 02/22/34(b)(f) | | EUR | 990 | | | $ | 1,089,889 | |
CVC Cordatus Loan Fund V DAC, Series 5X, Class B1R, (3-mo. EURIBOR + 1.50%), 5.19%, 07/21/30(b)(f) | | | 250 | | | | 277,889 | |
CWHEQ Home Equity Loan Trust | | | | | | | | |
Series 2006-S3, Class A4, 5.46%, 01/25/29(c) | | USD | 37 | | | | 91,487 | |
Series 2006-S5, Class A5, 6.16%, 06/25/35 | | | 48 | | | | 84,354 | |
CWHEQ Revolving Home Equity Loan Trust | | | | | | | | |
Series 2005-B, Class 2A, (1-mo. CME Term SOFR + 0.29%), 5.39%, 05/15/35(b) | | | 59 | | | | 59,329 | |
Series 2006-C, Class 2A, (1-mo. CME Term SOFR + 0.29%), 5.39%, 05/15/36(b) | | | 439 | | | | 432,614 | |
Series 2006-H, Class 1A, (1-mo. CME Term SOFR + 0.26%), 5.36%, 11/15/36(b) | | | 260 | | | | 258,019 | |
Series 2006-I, Class 1A, (1-mo. CME Term SOFR + 0.25%), 5.35%, 01/15/37(b) | | | 226 | | | | 210,325 | |
Diameter Capital CLO 1 Ltd., Series 2021-1A, Class A1A, (3-mo. CME Term SOFR + 1.50%), 6.80%, 07/15/36(a)(b) | | | 1,180 | | | | 1,181,616 | |
Diameter Capital CLO 2 Ltd., Series 2021-2A, Class A1, (3-mo. CME Term SOFR + 1.48%), 6.78%, 10/15/36(a)(b) | | | 250 | | | | 250,373 | |
Diameter Capital CLO 3 Ltd., Series 2022-3A, Class A1A, (3-mo. CME Term SOFR + 1.39%), 6.69%, 04/15/37(a)(b) | | | 2,492 | | | | 2,496,270 | |
Diameter Capital CLO 8 Ltd., Series 2024-8A, Class A1A, (3-mo. CME Term SOFR + 1.40%), 5.95%, 10/20/37(a)(b) | | | 22,190 | | | | 22,190,000 | |
Dryden 104 CLO Ltd., Series 2022-104A, Class A1R, (3-mo. CME Term SOFR + 1.29%), 6.29%, 08/20/34(a)(b) | | | 3,180 | | | | 3,192,564 | |
Dryden 37 Senior Loan Fund, Series 2015-37A, Class AR, (3-mo. CME Term SOFR + 1.36%), 6.66%, 01/15/31(a)(b) | | | 491 | | | | 491,469 | |
Dryden 41 Senior Loan Fund, Series 2015-41A, Class AR, (3-mo. CME Term SOFR + 1.23%), 6.53%, 04/15/31(a)(b) | | | 2,778 | | | | 2,782,789 | |
Dryden 43 Senior Loan Fund, Series 2016-43A, Class AR2, (3-mo. CME Term SOFR + 1.30%), 6.58%, 04/20/34(a)(b) | | | 5,540 | | | | 5,542,770 | |
Dryden 49 Senior Loan Fund | | | | | | | | |
Series 2017-49A, Class AR, (3-mo. CME Term SOFR + 1.21%), 6.49%, 07/18/30(a)(b) | | | 785 | | | | 784,679 | |
Series 2017-49A, Class BR, (3-mo. CME Term SOFR + 1.86%), 7.14%, 07/18/30(a)(b) | | | 500 | | | | 500,487 | |
Dryden 50 Senior Loan Fund, Series 2017-50A, Class B, (3-mo. CME Term SOFR + 1.91%), 7.21%, 07/15/30(a)(b) | | | 450 | | | | 450,789 | |
Dryden 53 CLO Ltd., Series 2017-53A, Class A, (3-mo. CME Term SOFR + 1.38%), 6.68%, 01/15/31(a)(b) | | | 15,876 | | | | 15,886,558 | |
Dryden 54 Senior Loan Fund, Series 2017-54A, Class AR, (3-mo. CME Term SOFR + 1.15%), 6.43%, 10/19/29(a)(b) | | | 2,766 | | | | 2,770,423 | |
Dryden 55 CLO Ltd., Series 2018-55A, Class A1, (3-mo. CME Term SOFR + 1.28%), 6.58%, 04/15/31(a)(b) | | | 2,557 | | | | 2,556,971 | |
| | |
C O N S O L I D A T E D S C H E D U L E S O F I N V E S T M E N T S | | 11 |
| | |
Consolidated Schedule of Investments (continued) September 30, 2024 | | BlackRock Total Return Fund (Percentages shown are based on Net Assets) |
| | | | | | | | |
| Security | | Par (000) | | | Value | |
|
Asset-Backed Securities (continued) | |
Dryden 57 CLO Ltd., Series 2018-57A, Class A, (3-mo. CME Term SOFR + 1.27%), 6.39%, 05/15/31(a)(b) | | USD | 457 | | | $ | 457,538 | |
Dryden 58 CLO Ltd., Series 2018-58A, Class A1, (3-mo. CME Term SOFR + 1.26%), 6.55%, 07/17/31(a)(b) | | | 224 | | | | 223,551 | |
Dryden 64 CLO Ltd., Series 2018-64A, Class A, (3-mo. CME Term SOFR + 1.23%), 6.51%, 04/18/31(a)(b) | | | 468 | | | | 467,980 | |
Dryden 65 CLO Ltd., Series 2018-65A, Class B, (3-mo. CME Term SOFR + 1.86%), 7.14%, 07/18/30(a)(b) | | | 300 | | | | 300,348 | |
Dryden 68 CLO Ltd., Series 2019-68A, Class BR, (3-mo. CME Term SOFR + 1.96%), 7.26%, 07/15/35(a)(b) | | | 1,440 | | | | 1,441,309 | |
Dryden 77 CLO Ltd. | | | | | | | | |
Series 2020-77A, Class AR, (3-mo. CME Term SOFR + 1.38%), 6.51%, 05/20/34(a)(b) | | | 3,580 | | | | 3,585,353 | |
Series 2020-77A, Class XR, (3-mo. CME Term SOFR + 1.26%), 6.39%, 05/20/34(a)(b) | | | 219 | | | | 217,852 | |
Dryden Senior Loan Fund, Series 2021-87A, Class A1, (3-mo. CME Term SOFR + 1.36%), 6.49%, 05/20/34(a)(b) | | | 2,330 | | | | 2,331,152 | |
Dryden XXVI Senior Loan Fund, Series 2013-26A, Class AR, (3-mo. CME Term SOFR + 1.16%), 6.46%, 04/15/29(a)(b) | | | 1,173 | | | | 1,174,956 | |
Eaton Vance CLO Ltd. | | | | | | | | |
Series 2014-1RA, Class A2, (3-mo. CME Term SOFR + 1.75%), 7.05%, 07/15/30(a)(b) | | | 250 | | | | 250,176 | |
Series 2020-2A, Class AR, (3-mo. CME Term SOFR + 1.41%), 6.71%, 01/15/35(a)(b) | | | 2,050 | | | | 2,050,128 | |
Edenbrook Mortgage Funding PLC | | | | | | | | |
Series 2024-1, Class C, (1-day SONIA + 1.95%), 6.93%, 03/22/57(b)(f) | | GBP | 1,611 | | | | 2,156,366 | |
Series 2024-1, Class D, (1-day SONIA + 2.55%), 7.53%, 03/22/57(b)(f) | | | 931 | | | | 1,246,230 | |
EDvestinU Private Education Loan Issue No. 4 LLC, Series 2022-A, Class A, 5.25%, 11/25/40(a) | | USD | 2,520 | | | | 2,533,408 | |
Elmwood CLO 23 Ltd., Series 2023-2A, Class A, (3-mo. CME Term SOFR + 1.80%), 7.09%, 04/16/36(a)(b) | | | 2,030 | | | | 2,041,680 | |
Elmwood CLO 27 Ltd., Series 2024-3A, Class B, (3-mo. CME Term SOFR + 1.95%), 7.23%, 04/18/37(a)(b) | | | 1,040 | | | | 1,050,112 | |
Elmwood CLO 29 Ltd., Series 2024-5A, Class AR1, (3-mo. CME Term SOFR + 1.52%), 6.84%, 04/20/37(a)(b) | | | 4,510 | | | | 4,519,058 | |
Elmwood CLO 30 Ltd., Series 2024-6A, Class A, (3-mo. CME Term SOFR + 1.43%), 6.73%, 07/17/37(a)(b) | | | 2,410 | | | | 2,419,561 | |
Elmwood CLO I Ltd., Series 2019-1A, Class A1RR, (3-mo. CME Term SOFR + 1.52%), 6.80%, 04/20/37(a)(b) | | | 250 | | | | 250,625 | |
Elmwood CLO II Ltd. | | | | | | | | |
Series 2019-2A, Class AR, (3-mo. CME Term SOFR + 1.41%), 6.69%, 04/20/34(a)(b) | | | 6,690 | | | | 6,704,682 | |
Series 2019-2A, Class BR, (3-mo. CME Term SOFR + 1.91%), 7.19%, 04/20/34(a)(b) | | | 1,600 | | | | 1,605,982 | |
| | | | | | | | |
| Security | | Par (000) | | | Value | |
|
Asset-Backed Securities (continued) | |
Elmwood CLO II Ltd. | | | | | | | | |
Series 2019-2A, Class DR, (3-mo. CME Term SOFR + 3.26%), 8.54%, 04/20/34(a)(b) | | USD | 250 | | | $ | 250,138 | |
Series 2019-2A, Class ER, (3-mo. CME Term SOFR + 7.06%), 12.34%, 04/20/34(a)(b) | | | 1,500 | | | | 1,501,733 | |
Elmwood CLO III Ltd., Series 2019-3A, Class BRR, (3-mo. CME Term SOFR + 1.70%), 7.02%, 07/18/37(a)(b) | | | 670 | | | | 671,414 | |
Elmwood CLO IV Ltd., Series 2020-1A, Class DR, (3-mo. CME Term SOFR + 3.35%), 8.67%, 04/18/37(a)(b) | | | 1,000 | | | | 1,016,385 | |
Elmwood CLO VI Ltd., Series 2020-3A, Class ARR, (3-mo. CME Term SOFR + 1.38%), 6.72%, 07/18/37(a)(b) | | | 5,230 | | | | 5,256,150 | |
Elmwood CLO VII Ltd., Series 2020-4A, Class A1RR, (3-mo. CME Term SOFR + 1.36%), 10/17/37(a)(b)(d) | | | 790 | | | | 790,000 | |
Elmwood CLO X Ltd. | | | | | | | | |
Series 2021-3A, Class A1R, (3-mo. CME Term SOFR + 1.27%), 6.55%, 04/20/34(a)(b) | | | 3,000 | | | | 3,004,540 | |
Series 2021-3A, Class BR, (3-mo. CME Term SOFR + 1.75%), 7.03%, 04/20/34(a)(b) | | | 1,250 | | | | 1,252,772 | |
Elmwood CLO XII Ltd. | | | | | | | | |
Series 2021-5A, Class A, (3-mo. CME Term SOFR + 1.41%), 6.69%, 01/20/35(a)(b) | | | 790 | | | | 791,712 | |
Series 2021-5A, Class AR, (3-mo. CME Term SOFR + 1.36%), 10/15/37(a)(b)(d) | | | 4,310 | | | | 4,310,000 | |
Euro-Galaxy III CLO BV | | | | | | | | |
Series 2013-3A, Class CRRR, (3-mo. EURIBOR + 2.35%), 6.06%, 04/24/34(a)(b) | | EUR | 700 | | | | 779,989 | |
Series 2013-3A, Class DRRR, (3-mo. EURIBOR + 3.25%), 6.96%, 04/24/34(a)(b) | | | 1,585 | | | | 1,766,680 | |
Fairstone Financial Issuance Trust I, Series 2020-1A, Class B, 3.74%, 10/20/39(a) | | CAD | 2,743 | | | | 1,970,328 | |
FBR Securitization Trust, Series 2005-5, Class M2, (1-mo. CME Term SOFR + 0.82%), 5.67%, 11/25/35(b) | | USD | 3,911 | | | | 3,867,218 | |
Fidelity Grand Harbour CLO DAC, Series 2021-1A, Class D, (3-mo. EURIBOR + 3.60%), 7.29%, 10/15/34(a)(b) | | EUR | 500 | | | | 556,410 | |
First Franklin Mortgage Loan Trust | | | | | | | | |
Series 2004-FFH3, Class M3, (1-mo. CME Term SOFR + 1.16%), 6.02%, 10/25/34(b) | | USD | 1,000 | | | | 926,880 | |
Series 2006-FF13, Class A1, (1-mo. CME Term SOFR + 0.35%), 5.21%, 10/25/36(b) | | | 1,872 | | | | 1,223,264 | |
Series 2006-FF13, Class A2C, (1-mo. CME Term SOFR + 0.43%), 5.29%, 10/25/36(b) | | | 1,098 | | | | 726,222 | |
Series 2006-FF16, Class 2A3, (1-mo. CME Term SOFR + 0.39%), 5.25%, 12/25/36(b) | | | 9,289 | | | | 3,829,423 | |
Series 2006-FF17, Class A5, (1-mo. CME Term SOFR + 0.26%), 5.12%, 12/25/36(b) | | | 8,692 | | | | 7,374,697 | |
Series 2006-FFH1, Class M2, (1-mo. CME Term SOFR + 0.71%), 5.57%, 01/25/36(b) | | | 2,856 | | | | 2,624,418 | |
FirstKey Homes Trust | | | | | | | | |
Series 2020-SFR1, Class F1, 3.64%, 08/17/37(a) | | | 2,690 | | | | 2,634,321 | |
Series 2022-SFR3, Class E2, 3.50%, 07/17/38(a) | | | 5,641 | | | | 5,370,198 | |
Flatiron CLO 18 Ltd., Series 2018-1A, Class A, (3-mo. CME Term SOFR + 1.21%), 6.50%, 04/17/31(a)(b) | | | 555 | | | | 555,468 | |
| | |
| 12 | | 2 0 2 4 B L A C K R O C K A N N U A L F I N A N C I A L S T A T E M E N T S A N D A D D I T I O N A L I N F O R M A T I O N |
| | |
Consolidated Schedule of Investments (continued) September 30, 2024 | | BlackRock Total Return Fund (Percentages shown are based on Net Assets) |
| | | | | | | | |
| Security | | Par (000) | | | Value | |
|
Asset-Backed Securities (continued) | |
Flatiron CLO 19 Ltd. | | | | | | | | |
Series 2019-1A, Class AR, (3-mo. CME Term SOFR + 1.34%), 6.44%, 11/16/34(a)(b) | | USD | 980 | | | $ | 980,546 | |
Series 2019-1A, Class DR, (3-mo. CME Term SOFR + 3.26%), 8.36%, 11/16/34(a)(b) | | | 250 | | | | 251,338 | |
Flatiron CLO 20 Ltd., Series 2020-1A, Class BR, (3-mo. CME Term SOFR + 1.92%), 7.05%, 05/20/36(a)(b) | | | 1,160 | | | | 1,165,086 | |
Flatiron CLO 21 Ltd. | | | | | | | | |
Series 2021-1A, Class A1R, (3-mo. CME Term SOFR + 1.36%), 6.45%, 10/19/37(a)(b) | | | 13,960 | | | | 13,965,274 | |
Series 2021-1A, Class A2R, (3-mo. CME Term SOFR + 1.58%), 6.67%, 10/19/37(a)(b) | | | 1,980 | | | | 1,980,291 | |
Series 2021-1A, Class BR, (3-mo. CME Term SOFR + 1.70%), 6.79%, 10/19/37(a)(b) | | | 1,200 | | | | 1,205,345 | |
Flatiron CLO 25 Ltd. | | | | | | | | |
Series 2024-2A, Class A, (3-mo. CME Term SOFR + 1.35%), 5.62%, 10/17/37(a)(b) | | | 1,140 | | | | 1,140,000 | |
Series 2024-2A, Class B, (3-mo. CME Term SOFR + 1.60%), 5.87%, 10/17/37(a)(b) | | | 870 | | | | 870,000 | |
Fortuna Consumer Loan Abs DAC | | | | | | | | |
Series 2024-2, Class C, (1-mo. EURIBOR + 1.65%), 10/18/34(b)(d) | | EUR | 800 | | | | 892,481 | |
Series 2024-2, Class E, (1-mo. EURIBOR + 4.10%), 10/18/34(b)(d) | | | 2,300 | | | | 2,560,245 | |
Foundation Finance Trust | | | | | | | | |
Series 2021-2A, Class A, 2.19%, 01/15/42(a) | | USD | 2,657 | | | | 2,498,195 | |
Series 2024-1A, Class B, 5.95%, 12/15/49(a) | | | 970 | | | | 997,794 | |
Series 2024-2A, Class B, 4.93%, 03/15/50(a) | | | 1,572 | | | | 1,574,816 | |
Fremont Home Loan Trust, Series 2006-3, Class 1A1, (1-mo. CME Term SOFR + 0.39%), 5.25%, 02/25/37(b) | | | 1,820 | | | | 1,361,327 | |
FS Rialto Issuer Ltd. | | | | | | | | |
Series 2022-FL4, Class A, (SOFR (30-day) + 1.90%), 7.24%, 01/19/39(a)(b) | | | 11,317 | | | | 11,331,606 | |
Series 2022-FL5, Class A, (1-mo. CME Term SOFR + 2.30%), 7.27%, 06/19/37(a)(b) | | | 3,064 | | | | 3,072,530 | |
Series 2022-FL6, Class A, (1-mo. CME Term SOFR + 2.58%), 7.55%, 08/17/37(a)(b) | | | 10,504 | | | | 10,543,217 | |
Galaxy XIX CLO Ltd. | | | | | | | | |
Series 2015-19A, Class A1RR, (3-mo. CME Term SOFR + 1.21%), 6.50%, 07/24/30(a)(b) | | | 489 | | | | 489,381 | |
Series 2015-19A, Class A2RR, (3-mo. CME Term SOFR + 1.66%), 6.95%, 07/24/30(a)(b) | | | 500 | | | | 501,114 | |
Galaxy XV CLO Ltd., Series 2013-15A, Class ARR, (3-mo. CME Term SOFR + 1.23%), 6.53%, 10/15/30(a)(b) | | | 554 | | | | 554,774 | |
Galaxy XVIII CLO Ltd., Series 2018-28A, Class A1, (3-mo. CME Term SOFR + 1.36%), 6.66%, 07/15/31(a)(b) | | | 941 | | | | 942,097 | |
Galaxy XX CLO Ltd., Series 2015-20A, Class AR, (3-mo. CME Term SOFR + 1.26%), 6.54%, 04/20/31(a)(b) | | | 3,043 | | | | 3,048,066 | |
Galaxy XXII CLO Ltd., Series 2016-22A, Class ARR, (3-mo. CME Term SOFR + 1.46%), 6.75%, 04/16/34(a)(b) | | | 4,180 | | | | 4,185,212 | |
| | | | | | | | |
| Security | | Par (000) | | | Value | |
|
Asset-Backed Securities (continued) | |
Galaxy XXVI CLO Ltd., Series 2018-26A, Class AR, (3-mo. CME Term SOFR + 1.17%), 6.29%, 11/22/31(a)(b) | | USD | 918 | | | $ | 918,861 | |
Galaxy XXVIII CLO Ltd. | | | | | | | | |
Series 2018-28A, Class A2, (3-mo. CME Term SOFR + 1.56%), 6.86%, 07/15/31(a)(b) | | | 557 | | | | 557,142 | |
Series 2018-28A, Class B, (3-mo. CME Term SOFR + 1.86%), 7.16%, 07/15/31(a)(b) | | | 822 | | | | 825,328 | |
Generate CLO 2 Ltd. | | | | | | | | |
Series 2A, Class AR2, (3-mo. CME Term SOFR + 1.41%), 6.61%, 10/22/37(a)(b) | | | 3,015 | | | | 3,015,276 | |
Series 2A, Class BR2, (3-mo. CME Term SOFR + 1.80%), 7.00%, 10/22/37(a)(b) | | | 2,970 | | | | 2,977,969 | |
Generate CLO 4 Ltd. | | | | | | | | |
Series 4A, Class ARR, (3-mo. CME Term SOFR + 1.43%), 6.71%, 07/20/37(a)(b) | | | 8,250 | | | | 8,262,375 | |
Series 4A, Class BRR, (3-mo. CME Term SOFR + 1.75%), 7.03%, 07/20/37(a)(b) | | | 3,000 | | | | 3,004,390 | |
Generate CLO 7 Ltd., Series 7A, Class A1R, (3-mo. CME Term SOFR + 1.62%), 6.90%, 04/22/37(a)(b) | | | 5,673 | | | | 5,695,063 | |
Generate CLO 8 Ltd., Series 8A, Class BR, (3-mo. CME Term SOFR + 2.01%), 7.29%, 10/20/34(a)(b) | | | 610 | | | | 612,977 | |
Golden Bar Securitisation Srl, Series 2024-1, Class B, (3-mo. EURIBOR + 1.50%), 4.93%, 09/22/43(b)(f) | | EUR | 1,923 | | | | 2,147,859 | |
GoldenTree Loan Management U.S. CLO 1 Ltd., Series 2017-1A, Class A1R2, (3-mo. CME Term SOFR + 1.28%), 6.56%, 04/20/34(a)(b) | | USD | 450 | | | | 453,070 | |
GoldenTree Loan Management U.S. CLO 11 Ltd. | | | | | | | | |
Series 2021-11A, Class A, (3-mo. CME Term SOFR + 1.39%), 6.67%, 10/20/34(a)(b) | | | 8,690 | | | | 8,694,050 | |
Series 2021-11A, Class E, (3-mo. CME Term SOFR + 5.61%), 10.89%, 10/20/34(a)(b) | | | 250 | | | | 250,494 | |
GoldenTree Loan Management U.S. CLO 3 Ltd., Series 2018-3A, Class B1, (3-mo. CME Term SOFR + 1.81%), 7.09%, 04/20/30(a)(b) | | | 500 | | | | 500,785 | |
Goldman Home Improvement Trust, Series 2022-GRN2, Class A, 6.80%, 10/25/52(a) | | | 1,616 | | | | 1,662,144 | |
Golub Capital Partners CLO Ltd. | | | | | | | | |
Series 2019-41A, Class AR, (3-mo. CME Term SOFR + 1.58%), 6.86%, 01/20/34(a)(b) | | | 4,840 | | | | 4,846,708 | |
Series 2020-52A, Class BR, (3-mo. CME Term SOFR + 2.00%), 7.28%, 04/20/37(a)(b) | | | 940 | | | | 946,468 | |
Series 2021-55A, Class A, (3-mo. CME Term SOFR + 1.46%), 6.74%, 07/20/34(a)(b) | | | 430 | | | | 430,486 | |
Series 2024-76A, Class A1, (3-mo. CME Term SOFR + 1.37%), 6.11%, 10/25/37(a)(b) | | | 860 | | | | 860,889 | |
Series 2024-76A, Class B, (3-mo. CME Term SOFR + 1.67%), 6.41%, 10/25/37(a)(b) | | | 390 | | | | 390,308 | |
Series 2024-76A, Class D1, (3-mo. CME Term SOFR + 2.90%), 7.64%, 10/25/37(a)(b) | | | 260 | | | | 262,674 | |
| | |
C O N S O L I D A T E D S C H E D U L E S O F I N V E S T M E N T S | | 13 |
| | |
Consolidated Schedule of Investments (continued) September 30, 2024 | | BlackRock Total Return Fund (Percentages shown are based on Net Assets) |
| | | | | | | | |
| Security | | Par (000) | | | Value | |
|
Asset-Backed Securities (continued) | |
GoodLeap Sustainable Home Solutions Trust | | | | | | | | |
Series 2022-3CS, Class A, 4.95%, 07/20/49(a) | | | USD 1,636 | | | $ | 1,566,998 | |
Series 2023-1GS, Class A, 5.52%, 02/22/55(a) | | | 4,210 | | | | 4,181,751 | |
Gracie Point International Funding LLC | | | | | | | | |
Series 2023-1A, Class A, (SOFR (90-day) + 1.95%), 7.32%, 09/01/26(a)(b) | | | 2,548 | | | | 2,562,942 | |
Series 2024-1A, Class A, (SOFR (90-day) + 1.70%), 7.07%, 03/01/28(a)(b) | | | 7,816 | | | | 7,842,162 | |
GreenPoint Manufactured Housing, Series 1999-5, Class M2, 9.23%, 12/15/29(b) | | | 709 | | | | 707,578 | |
GreenSky Home Improvement Trust | | | | | | | | |
Series 2024-1, Class A4, 5.67%, 06/25/59(a) | | | 13,730 | | | | 13,935,781 | |
Series 2024-1, Class B, 5.87%, 06/25/59(a) | | | 1,072 | | | | 1,093,850 | |
Greenwood Park CLO Ltd. | | | | | | | | |
Series 2018-1A, Class A1, (3-mo. CME Term SOFR + 1.29%), 6.59%, 04/15/31(a)(b) | | | 538 | | | | 539,113 | |
Series 2018-1A, Class A2, (3-mo. CME Term SOFR + 1.27%), 6.57%, 04/15/31(a)(b) | | | 390 | | | | 390,852 | |
GSAA Home Equity Trust | | | | | | | | |
Series 2005-14, Class 1A2, (1-mo. CME Term SOFR + 0.81%), 5.67%, 12/25/35(b) | | | 836 | | | | 372,246 | |
Series 2006-18, Class AF2A, 5.63%, 11/25/36(b) | | | 112 | | | | 33,200 | |
Series 2006-18, Class AF3A, 5.77%, 11/25/36(b) | | | 1,108 | | | | 330,942 | |
Series 2006-4, Class 1A1, 4.14%, 03/25/36(b) | | | 1,518 | | | | 1,030,788 | |
Series 2006-5, Class 2A1, (1-mo. CME Term SOFR + 0.25%), 5.11%, 03/25/36(b) | | | 11 | | | | 3,516 | |
Series 2007-2, Class AF3, 5.92%, 03/25/37(b) | | | 445 | | | | 85,107 | |
GSAMP Trust | | | | | | | | |
Series 2007-H1, Class A1B, (1-mo. CME Term SOFR + 0.51%), 5.37%, 01/25/47(b) | | | 679 | | | | 346,279 | |
Series 2007-HS1, Class M6, (1-mo. CME Term SOFR + 3.49%), 8.34%, 02/25/47(b) | | | 1,300 | | | | 1,277,297 | |
GT Loan Financing I Ltd., Series 2013-1A, Class CR, (3-mo. CME Term SOFR + 2.36%), 7.63%, 07/28/31(a)(b) | | | 250 | | | | 250,884 | |
Gulf Stream Meridian 4 Ltd. | | | | | | | | |
Series 2021-4A, Class A1, (3-mo. CME Term SOFR + 1.46%), 6.76%, 07/15/34(a)(b) | | | 12,060 | | | | 12,091,305 | |
Series 2021-4A, Class A2, (3-mo. CME Term SOFR + 2.11%), 7.41%, 07/15/34(a)(b) | | | 1,750 | | | | 1,762,724 | |
Gulf Stream Meridian 5 Ltd. | | | | | | | | |
Series 2021-5A, Class A1, (3-mo. CME Term SOFR + 1.46%), 6.76%, 07/15/34(a)(b) | | | 1,560 | | | | 1,563,934 | |
Series 2021-5A, Class A2, (3-mo. CME Term SOFR + 2.06%), 7.36%, 07/15/34(a)(b) | | | 470 | | | | 473,119 | |
Gulf Stream Meridian 7 Ltd., Series 2022-7A, Class A1, (3-mo. CME Term SOFR + 1.36%), 6.66%, 07/15/35(a)(b) | | | 2,550 | | | | 2,556,914 | |
Halseypoint CLO 4 Ltd., Series 2021-4A, Class A, (3-mo. CME Term SOFR + 1.48%), 6.76%, 04/20/34(a)(b) | | | 1,330 | | | | 1,333,990 | |
Halseypoint CLO 6 Ltd., Series 2022-6A, Class A1, (3-mo. CME Term SOFR + 2.45%), 7.73%, 10/20/34(a)(b) | | | 1,740 | | | | 1,746,438 | |
| | | | | | | | |
| Security | | Par (000) | | | Value | |
|
Asset-Backed Securities (continued) | |
Harriman Park CLO Ltd., Series 2020-1A, Class A1R, (3-mo. CME Term SOFR + 1.38%), 6.66%, 04/20/34(a)(b) | | USD | 500 | | | $ | 500,239 | |
Henley CLO IV DAC | | | | | | | | |
Series 4A, Class D, (3-mo. EURIBOR + 3.00%), 6.69%, 04/25/34(a)(b) | | EUR | 750 | | | | 842,760 | |
Series 4X, Class B1, (3-mo. EURIBOR + 1.35%), 5.04%, 04/25/34(b)(f) | | | 540 | | | | 596,854 | |
Hermitage PLC | | | | | | | | |
Series 2024-1, Class C, (1-day SONIA + 1.60%), 6.56%, 04/21/33(b)(f) | | GBP | 733 | | | | 978,474 | |
Series 2024-1, Class D, (1-day SONIA + 2.35%), 7.31%, 04/21/33(b)(f) | | | 456 | | | | 608,510 | |
Series 2024-1, Class E, (1-day SONIA + 3.90%), 8.86%, 04/21/33(b)(f) | | | 740 | | | | 988,241 | |
Highbridge Loan Management Ltd., Series 3A-2014, Class A1R, (3-mo. CME Term SOFR + 1.44%), 6.72%, 07/18/29(a)(b) | | USD | 292 | | | | 291,952 | |
Hill FL BV, Series 2024-2FL, Class D, (1-mo. EURIBOR + 1.95%), 10/18/32(b)(d)(f) | | EUR | 500 | | | | 557,187 | |
Hipgnosis Music Assets LP, Series 2022-1, Class A, 5.00%, 05/16/62(a) | | USD | 3,683 | | | | 3,638,895 | |
Home Equity Asset Trust | | | | | | | | |
Series 2006-3, Class M2, (1-mo. CME Term SOFR + 0.71%), 5.57%, 07/25/36(b) | | | 2,440 | | | | 2,308,881 | |
Series 2007-1, Class 2A3, (1-mo. CME Term SOFR + 0.41%), 5.27%, 05/25/37(b) | | | 1,731 | | | | 1,363,747 | |
Home Equity Mortgage Loan Asset-Backed Trust, Series 2004-A, Class M2, (1-mo. CME Term SOFR + 2.14%), 3.75%, 07/25/34(b) | | | 256 | | | | 248,682 | |
Home Equity Mortgage Trust, Series 2006-2, Class 1A1, 5.87%, 07/25/36(c) | | | 1,661 | | | | 171,483 | |
Home Partners of America Trust, Series 2021-2, Class F, 3.80%, 12/17/26(a) | | | 8,729 | | | | 8,168,160 | |
HPS Loan Management Ltd. | | | | | | | | |
Series 10A-16, Class A1RR, (3-mo. CME Term SOFR + 1.40%), 6.68%, 04/20/34(a)(b) | | | 5,620 | | | | 5,628,941 | |
Series 6A-2015, Class A1R, (3-mo. CME Term SOFR + 1.26%), 6.50%, 02/05/31(a)(b) | | | 3,485 | | | | 3,488,173 | |
Huntington Bank Auto Credit-Linked Notes, Series 2024-1, Class B2, (SOFR (30-day) + 1.40%), 6.75%, 05/20/32(a)(b) | | | 6,333 | | | | 6,342,109 | |
Invesco CLO Ltd., Series 2022-1A, Class B, (3-mo. CME Term SOFR + 1.80%), 7.08%, 04/20/35(a)(b) | | | 947 | | | | 948,383 | |
Invesco Euro CLO V DAC, Series 5X, Class D, (3-mo. EURIBOR + 3.80%), 7.49%, 01/15/34(b)(f) | | EUR | 350 | | | | 388,855 | |
Jamestown CLO XVI Ltd., Series 2021-16A, Class B, (3-mo. CME Term SOFR + 2.06%), 7.35%, 07/25/34(a)(b) | | USD | 250 | | | | 250,779 | |
JPMorgan Mortgage Acquisition Trust | | | | | | | | |
Series 2006-CW1, Class M1, (1-mo. CME Term SOFR + 0.52%), 5.37%, 05/25/36(b) . | | | 571 | | | | 561,947 | |
Series 2007-CH1, Class MF1, 4.54%, 11/25/36(c) | | | 120 | | | | 123,664 | |
Juniper Valley Park CLO Ltd., Series 2023-1R, Class BR, (3-mo. CME Term SOFR + 1.55%), 6.83%, 07/20/36(a)(b) | | | 2,680 | | | | 2,682,015 | |
| | |
| 14 | | 2 0 2 4 B L A C K R O C K A N N U A L F I N A N C I A L S T A T E M E N T S A N D A D D I T I O N A L I N F O R M A T I O N |
| | |
Consolidated Schedule of Investments (continued) September 30, 2024 | | BlackRock Total Return Fund (Percentages shown are based on Net Assets) |
| | | | | | | | |
| Security | | Par (000) | | | Value | |
|
Asset-Backed Securities (continued) | |
Kings Park CLO Ltd., Series 2021-1A, Class A, (3-mo. CME Term SOFR + 1.39%), 6.67%, 01/21/35(a)(b) | | USD | 810 | | | $ | 810,822 | |
KKR CLO 10 Ltd., Series 10, Class BR, (3-mo. CME Term SOFR + 1.96%), 6.91%, 09/15/29(a)(b) | | | 360 | | | | 360,460 | |
LCM 26 Ltd., Series 26A, Class A1, (3-mo. CME Term SOFR + 1.33%), 6.61%, 01/20/31(a)(b) | | | 3,351 | | | | 3,354,375 | |
LCM 29 Ltd., Series 29A, Class AR, (3-mo. CME Term SOFR + 1.33%), 6.63%, 04/15/31(a)(b) | | | 758 | | | | 759,830 | |
LCM XIV LP, Series 14A, Class AR, (3-mo. CME Term SOFR + 1.30%), 6.58%, 07/20/31(a)(b) | | | 260 | | | | 260,007 | |
LCM XVII LP, Series 17A, Class A1AR, (3-mo. CME Term SOFR + 1.39%), 6.69%, 10/15/31(a)(b) | | | 215 | | | | 215,568 | |
Legacy Mortgage Asset Trust | | | | | | | | |
Series 2019-SL2, Class A, 3.38%, 02/25/59(a)(b) | | | 2,809 | | | | 2,687,233 | |
Series 2019-SL2, Class B, 0.00%, 02/25/59(a)(e) | | | 2,015 | | | | 379,973 | |
Series 2019-SL2, Class M, 4.25%, 02/25/59(a)(b) | | | 2,291 | | | | 2,131,724 | |
Lehman ABS Manufactured Housing Contract Trust | | | | | | | | |
Series 2001-B, Class M1, 6.63%, 04/15/40(b) | | | 1,128 | | | | 1,142,228 | |
Series 2002-A, Class C, 0.00%, 06/15/33(e) | | | 168 | | | | 166,456 | |
Lehman ABS Mortgage Loan Trust, | | | | | | | | |
Series 2007-1, Class 2A1, (1-mo. CME Term SOFR + 0.20%), 5.06%, 06/25/37(a)(b) | | | 298 | | | | 200,084 | |
Lendmark Funding Trust | | | | | | | | |
Series 2021-2A, Class D, 4.46%, 04/20/32(a) | | | 730 | | | | 647,859 | |
Series 2022-1A, Class A, 5.12%, 07/20/32(a) | | | 8,420 | | | | 8,439,999 | |
Series 2023-1A, Class D, 8.69%, 05/20/33(a) | | | 2,291 | | | | 2,322,381 | |
Series 2024-1A, Class B, 5.88%, 06/21/32(a) | | | 2,136 | | | | 2,189,624 | |
Series 2024-1A, Class C, 6.40%, 06/21/32(a) | | | 818 | | | | 839,242 | |
Series 2024-1A, Class D, 7.21%, 06/21/32(a) | | | 953 | | | | 976,163 | |
LoanCore Issuer Ltd., Series 2022-CRE7, Class A, (SOFR (30-day) + 1.55%), 6.89%, 01/17/37(a)(b) | | | 745 | | | | 743,813 | |
Loanpal Solar Loan Ltd. | | | | | | | | |
Series 2020-2GF, Class A, 2.75%, 07/20/47(a) | | | 4,562 | | | | 3,825,122 | |
Series 2021-1GS, Class A, 2.29%, 01/20/48(a) | | | 4,434 | | | | 3,646,692 | |
Long Beach Mortgage Loan Trust | | | | | | | | |
Series 2006-5, Class 2A3, (1-mo. CME Term SOFR + 0.41%), 5.27%, 06/25/36(b) | | | 2,945 | | | | 1,400,602 | |
Series 2006-7, Class 2A3, (1-mo. CME Term SOFR + 0.43%), 5.29%, 08/25/36(b) | | | 7,866 | | | | 3,139,941 | |
Long Point Park CLO Ltd., Series 2017-1A, Class A2, (3-mo. CME Term SOFR + 1.64%), 6.92%, 01/17/30(a)(b) | | | 430 | | | | 429,891 | |
Louisiana Local Government Environmental Facilities & Community Development Authority, Series 2022-ELL, Class A2, 4.15%, 02/01/33 | | | 2,630 | | | | 2,620,844 | |
Madison Park Euro Funding XVI DAC, Series 16A, Class D, (3-mo. EURIBOR + 3.20%), 6.89%, 05/25/34(a)(b) | | EUR | 1,000 | | | | 1,116,541 | |
| | | | | | | | |
| Security | | Par (000) | | | Value | |
|
Asset-Backed Securities (continued) | |
Madison Park Funding LI Ltd., Series 2021-51A, Class B, (3-mo. CME Term SOFR + 1.96%), 7.24%, 07/19/34(a)(b) | | USD | 2,740 | | | $ | 2,751,333 | |
Madison Park Funding LVII Ltd., Series 2022- 57A, Class A1R, (3-mo. CME Term SOFR + 1.28%), 6.38%, 07/27/34(a)(b) | | | 250 | | | | 250,000 | |
Madison Park Funding LXII Ltd., Series 2022- 62A, Class AR, (3-mo. CME Term SOFR + 1.85%), 7.14%, 07/17/36(a)(b) | | | 3,020 | | | | 3,034,451 | |
Madison Park Funding LXVII Ltd., Series 2024- 67A, Class B, (3-mo. CME Term SOFR + 2.05%), 7.34%, 04/25/37(a)(b) | | | 6,610 | | | | 6,682,821 | |
Madison Park Funding XIV Ltd., Series 2014- 14A, Class AR3, (3-mo. CME Term SOFR + 1.20%), 6.48%, 10/22/30(a)(b) | | | 1,711 | | | | 1,712,811 | |
Madison Park Funding XIX Ltd. | | | | | | | | |
Series 2015-19A, Class AR3, (3-mo. CME Term SOFR + 1.60%), 6.88%, 01/22/37(a)(b) | | | 7,000 | | | | 7,021,427 | |
Series 2015-19A, Class BR3, (3-mo. CME Term SOFR + 2.25%), 7.53%, 01/22/37(a)(b) | | | 1,000 | | | | 1,003,185 | |
Madison Park Funding XL Ltd., Series 9A, Class AR2, (3-mo. CME Term SOFR + 1.25%), 6.31%, 05/28/30(a)(b) | | | 3,208 | | | | 3,208,025 | |
Madison Park Funding XLII Ltd. | | | | | | | | |
Series 13A, Class AR, (3-mo. CME Term SOFR + 1.15%), 6.43%, 11/21/30(a)(b) | | | 416 | | | | 416,386 | |
Series 13A, Class B, (3-mo. CME Term SOFR + 1.76%), 7.05%, 11/21/30(a)(b) | | | 1,500 | | | | 1,501,145 | |
Series 13A, Class C, (3-mo. CME Term SOFR + 2.06%), 7.35%, 11/21/30(a)(b) | | | 390 | | | | 390,935 | |
Madison Park Funding XLV Ltd., Series 2020- 45A, Class AR, (3-mo. CME Term SOFR + 1.38%), 6.68%, 07/15/34(a)(b) | | | 4,660 | | | | 4,665,867 | |
Madison Park Funding XLVI Ltd., Series 2020- 46A, Class B1R, (3-mo. CME Term SOFR + 1.91%), 7.21%, 10/15/34(a)(b) | | | 250 | | | | 250,846 | |
Madison Park Funding XVIII Ltd. | | | | | | | | |
Series 2015-18A, Class ARR, (3-mo. CME Term SOFR + 1.20%), 6.48%, 10/21/30(a)(b) | | | 13,771 | | | | 13,798,272 | |
Series 2015-18A, Class BR, (3-mo. CME Term SOFR + 1.86%), 7.14%,
10/21/30(a)(b) | | | 610 | | | | 611,018 | |
Madison Park Funding XXI Ltd., Series 2016- 21A, Class AARR, (3-mo. CME Term SOFR + 1.34%), 6.64%, 10/15/32(a)(b) | | | 1,730 | | | | 1,730,611 | |
Madison Park Funding XXII Ltd. | | | | | | | | |
Series 2016-22A, Class A1R, (3-mo. CME Term SOFR + 1.52%), 6.82%, 01/15/33(a)(b) | | | 3,000 | | | | 3,000,829 | |
Series 2016-22A, Class BR, (3-mo. CME Term SOFR + 1.86%), 7.16%, 01/15/33(a)(b) | | | 2,500 | | | | 2,502,985 | |
Madison Park Funding XXIII Ltd. | | | | | | | | |
Series 2017-23A, Class AR, (3-mo. CME Term SOFR + 1.23%), 6.50%, 07/27/31(a)(b) | | | 1,428 | | | | 1,428,886 | |
Series 2017-23A, Class BR, (3-mo. CME Term SOFR + 1.81%), 7.08%, 07/27/31(a)(b) | | | 500 | | | | 500,776 | |
| | |
C O N S O L I D A T E D S C H E D U L E S O F I N V E S T M E N T S | | 15 |
| | |
Consolidated Schedule of Investments (continued) September 30, 2024 | | BlackRock Total Return Fund (Percentages shown are based on Net Assets) |
| | | | | | | | |
| Security | | Par (000) | | | Value | |
|
Asset-Backed Securities (continued) | |
Madison Park Funding XXIII Ltd. | | | | | | | | |
Series 2017-23A, Class CR, (3-mo. CME Term SOFR + 2.26%), 7.53%, 07/27/31(a)(b) | | USD | 900 | | | $ | 902,826 | |
Madison Park Funding XXIV Ltd., Series 2016-24A, Class BR2, (3-mo. CME Term SOFR + 1.55%), 6.83%, 10/20/29(a)(b) | | | 760 | | | | 761,258 | |
Madison Park Funding XXIX Ltd., Series 2018-29A, Class AR, (3-mo. CME Term SOFR + 1.18%), 6.46%, 10/18/30(a)(b) | | | 876 | | | | 876,824 | |
Madison Park Funding XXVII Ltd., Series 2018-27A, Class A1A, (3-mo. CME Term SOFR + 1.29%), 6.57%, 04/20/30(a)(b) | | | 343 | | | | 342,623 | |
Madison Park Funding XXXI Ltd., Series 2018-31A, Class B1R, (3-mo. CME Term SOFR + 1.80%), 7.14%, 07/23/37(a)(b) | | | 4,110 | | | | 4,118,090 | |
Madison Park Funding XXXIII Ltd., Series 2019-33A, Class AR, (3-mo. CME Term SOFR + 1.29%), 6.59%, 10/15/32(a)(b) | | | 1,560 | | | | 1,561,375 | |
Madison Park Funding XXXV Ltd., Series 2019-35A, Class BR, (3-mo. CME Term SOFR + 1.66%), 6.94%, 04/20/32(a)(b) | | | 1,030 | | | | 1,030,875 | |
Madison Park Funding XXXVIII Ltd., Series 2021-38A, Class A, (3-mo. CME Term SOFR + 1.38%), 6.67%, 07/17/34(a)(b) | | | 5,010 | | | | 5,010,273 | |
Man GLG Euro CLO, Series 6A, Class DR, (3-mo. EURIBOR + 3.50%), 7.19%, 10/15/32(a)(b) | | EUR | 1,680 | | | | 1,864,640 | |
Marble Point CLO XI Ltd., Series 2017-2A, Class A, (3-mo. CME Term SOFR + 1.44%), 6.72%, 12/18/30(a)(b) | | USD | 807 | | | | 807,170 | |
Marble Point CLO XXII Ltd., Series 2021-2A, Class B, (3-mo. CME Term SOFR + 2.11%), 7.40%, 07/25/34(a)(b) | | | 250 | | | | 249,580 | |
Marble Point CLO XXIII Ltd., Series 2021-4A, Class D1, (3-mo. CME Term SOFR + 3.91%), 9.19%, 01/22/35(a)(b) | | | 250 | | | | 251,740 | |
Mariner CLO LLC, Series 2016-3A, Class AR3, (3-mo. CME Term SOFR + 1.59%), 6.87%, 01/23/37(a)(b) | | | 1,350 | | | | 1,353,929 | |
Mariner Finance Issuance Trust | | | | | | | | |
Series 2020-AA, Class C, 4.10%, 08/21/34(a) | | | 1,536 | | | | 1,519,495 | |
Series 2021-BA, Class E, 4.68%, 11/20/36(a) | | | 1,265 | | | | 1,136,326 | |
Series 2024-AA, Class A, 5.13%, 09/22/36(a) | | | 5,718 | | | | 5,813,195 | |
Series 2024-AA, Class D, 6.77%, 09/22/36(a) | | | 304 | | | | 310,755 | |
Series 2024-AA, Class E, 9.02%, 09/22/36(a) | | | 1,277 | | | | 1,306,496 | |
MASTR Asset-Backed Securities Trust | |
Series 2006-AM2, Class A4, (1-mo. CME Term SOFR + 0.63%), 5.49%, 06/25/36(a)(b) | | | 931 | | | | 860,400 | |
Series 2007-HE1, Class A4, (1-mo. CME Term SOFR + 0.39%), 5.25%, 05/25/37(b) | | | 1,318 | | | | 1,107,095 | |
MASTR Specialized Loan Trust, Series 2006-3, Class A, (1-mo. CME Term SOFR + 0.63%), 5.49%, 06/25/46(a)(b) | | | 205 | | | | 199,038 | |
Meacham Park CLO Ltd., Series 2024-1A, Class B, (3-mo. CME Term SOFR + 1.60%), 6.39%, 10/20/37(a)(b) | | | 3,440 | | | | 3,430,056 | |
Merrill Lynch First Franklin Mortgage Loan Trust, Series 2007-2, Class A2C, (1-mo. CME Term SOFR + 0.59%), 5.45%, 05/25/37(b) | | | 1,384 | | | | 993,629 | |
| | | | | | | | |
| Security | | Par (000) | | | Value | |
|
Asset-Backed Securities (continued) | |
Merrill Lynch Mortgage Investors Trust | | | | | | | | |
Series 2006-OPT1, Class M1, (1-mo. CME Term SOFR + 0.50%), 5.36%, 08/25/37(b) | | USD | 393 | | | $ | 346,538 | |
Series 2006-RM3, Class A2B, (1-mo. CME Term SOFR + 0.29%), 5.15%, 06/25/37(b) | | | 830 | | | | 178,171 | |
MF1 LLC | | | | | | | | |
Series 2022-FL10, Class A, (1-mo. CME Term SOFR + 2.64%), 7.60%, 09/17/37(a)(b) | | | 2,265 | | | | 2,269,960 | |
Series 2022-FL9, Class A, (1-mo. CME Term SOFR + 2.15%), 7.12%, 06/19/37(a)(b) | | | 4,614 | | | | 4,619,367 | |
Series 2023-FL12, Class A, (1-mo. CME Term SOFR + 2.07%), 7.03%, 10/19/38(a)(b) | | | 2,218 | | | | 2,223,545 | |
MidOcean Credit CLO III Ltd., Series 2014-3A, Class A3A2, (3-mo. CME Term SOFR + 1.23%), 6.51%, 04/21/31(a)(b) | | | 198 | | | | 197,926 | |
MidOcean Credit CLO VIII, Series 2018-8A, Class A1R, (3-mo. CME Term SOFR + 1.31%), 6.44%, 02/20/31(a)(b) | | | 899 | | | | 899,953 | |
MidOcean Credit CLO XII Ltd., Series 2023- 12A, Class A1R, (3-mo. CME Term SOFR + 1.34%), 6.62%, 04/18/36(a)(b) | | | 3,170 | | | | 3,173,369 | |
Mila BV | | | | | | | | |
Series 2024-1, Class C, (1-mo. EURIBOR + 1.45%), 4.86%, 09/16/41(b)(f) | | EUR | 238 | | | | 264,428 | |
Series 2024-1, Class D, (1-mo. EURIBOR + 2.00%), 5.41%, 09/16/41(b)(f) | | | 188 | | | | 208,278 | |
Mill City Solar Loan Ltd., Series 2019-2GS, Class A, 3.69%, 07/20/43(a) | | USD | 3,907 | | | | 3,571,811 | |
Milos CLO Ltd., Series 2017-1A, Class AR, (3-mo. CME Term SOFR + 1.33%), 6.61%, 10/20/30(a)(b) | | | 656 | | | | 656,844 | |
Morgan Stanley ABS Capital I, Inc. Trust | | | | | | | | |
Series 2005-HE1, Class A2MZ, (1-mo. CME Term SOFR + 0.71%), 5.57%, 12/25/34(b) | | | 820 | | | | 761,713 | |
Series 2005-HE5, Class M4, (1-mo. CME Term SOFR + 0.98%), 5.84%, 09/25/35(b) | | | 2,831 | | | | 2,364,550 | |
Series 2007-SEA1, Class 2A1, (1-mo. CME Term SOFR + 3.91%), 8.77%, 02/25/47(a)(b) | | | 407 | | | | 378,997 | |
Morgan Stanley Home Equity Loan Trust, Series 2006-3, Class A3, (1-mo. CME Term SOFR + 0.43%), 5.29%, 04/25/36(b) | | | 1,341 | | | | 945,416 | |
Morgan Stanley Mortgage Loan Trust | | | | | | | | |
Series 2006-12XS, Class A4, 6.51%, 10/25/36(c) | | | 1,907 | | | | 443,093 | |
Series 2006-12XS, Class A6A, 6.23%, 10/25/36(c) | | | 736 | | | | 210,061 | |
Series 2006-16AX, Class 1A, (1-mo. CME Term SOFR + 0.45%), 5.31%, 11/25/36(b) | | | 3,559 | | | | 613,048 | |
Series 2006-16AX, Class 2A3, (1-mo. CME Term SOFR + 0.61%), 5.47%, 11/25/36(b) | | | 1,020 | | | | 284,607 | |
Series 2007-3XS, Class 2A3S, 6.36%, 01/25/47(c) | | | 1,426 | | | | 518,106 | |
Series 2007-3XS, Class 2A4S, 6.46%, 01/25/47(c) | | | 6,206 | | | | 2,213,667 | |
Mosaic Solar Loan Trust | | | | | | | | |
Series 2018-2GS, Class A, 4.20%, 02/22/44(a) | | | 1,387 | | | | 1,306,878 | |
Series 2019-2A, Class A, 2.88%, 09/20/40(a) | | | 475 | | | | 428,930 | |
Series 2020-1A, Class A, 2.10%, 04/20/46(a) | | | 665 | | | | 591,916 | |
| | |
| 16 | | 2 0 2 4 B L A C K R O C K A N N U A L F I N A N C I A L S T A T E M E N T S A N D A D D I T I O N A L I N F O R M A T I O N |
| | |
Consolidated Schedule of Investments (continued) September 30, 2024 | | BlackRock Total Return Fund (Percentages shown are based on Net Assets) |
| | | | | | | | |
| Security | | Par (000) | | | Value | |
|
Asset-Backed Securities (continued) | |
Mosaic Solar Loan Trust | | | | | | | | |
Series 2022-3A, Class A, 6.10%, 06/20/53(a) | | USD | 1,361 | | | $ | 1,391,020 | |
Series 2023-1A, Class A, 5.32%, 06/20/53(a) | | | 4,682 | | | | 4,689,050 | |
MP CLO III Ltd., Series 2013-1A, Class AR, (3-mo. CME Term SOFR + 1.51%), 6.79%, 10/20/30(a)(b) | | | 909 | | | | 909,199 | |
MP CLO VII Ltd., Series 2015-1A, Class BRR, (3-mo. CME Term SOFR + 1.86%), 7.14%, 10/18/28(a)(b) | | | 750 | | | | 752,085 | |
Myers Park CLO Ltd. | | | | | | | | |
Series 2018-1A, Class A2, (3-mo. CME Term SOFR + 1.66%), 6.94%, 10/20/30(a)(b) | | | 890 | | | | 890,726 | |
Series 2018-1A, Class B1, (3-mo. CME Term SOFR + 1.86%), 7.14%, 10/20/30(a)(b) | | | 250 | | | | 250,483 | |
Series 2018-1A, Class C, (3-mo. CME Term SOFR + 2.31%), 7.59%, 10/20/30(a)(b) | | | 250 | | | | 250,788 | |
Nationstar Home Equity Loan Trust, Series 2007-B, Class M1, (1-mo. CME Term SOFR + 0.52%), 5.38%, 04/25/37(b) | | | 3,320 | | | | 3,163,515 | |
Navient Private Education Loan Trust | | | | | | | | |
Series 2014-AA, Class B, 3.50%, 08/15/44(a) | | | 6,000 | | | | 5,817,605 | |
Series 2020-A, Class A2B, (1-mo. CME Term SOFR + 1.01%), 6.11%, 11/15/68(a)(b) | | | 1,157 | | | | 1,152,592 | |
Navient Private Education Refi Loan Trust | | | | | | | | |
Series 2019-CA, Class A2, 3.13%, 02/15/68(a) | | | 103 | | | | 100,984 | |
Series 2020-FA, Class B, 2.69%, 07/15/69(a) | | | 2,590 | | | | 2,184,856 | |
Series 2021-DA, Class B, 2.61%, 04/15/60(a) | | | 952 | | | | 848,171 | |
Series 2021-DA, Class C, 3.48%, 04/15/60(a) | | | 4,380 | | | | 4,016,605 | |
Series 2021-DA, Class D, 4.00%, 04/15/60(a) | | | 1,400 | | | | 1,284,348 | |
Series 2024-A, Class A, 5.66%, 10/15/72(a) | | | 16,837 | | | | 17,303,171 | |
Nelnet Student Loan Trust | | | | | | | | |
Series 2021-A, Class B1, 2.85%, 04/20/62(a) | | | 3,470 | | | | 3,033,906 | |
Series 2021-A, Class B2, 2.85%, 04/20/62(a) | | | 22,590 | | | | 19,750,880 | |
Series 2021-A, Class C, 3.75%, 04/20/62(a) | | | 1,706 | | | | 1,496,120 | |
Series 2021-A, Class D, 4.93%, 04/20/62(a) | | | 2,323 | | | | 2,030,305 | |
Series 2021-BA, Class B, 2.68%, 04/20/62(a) | | | 13,069 | | | | 11,311,463 | |
Series 2021-BA, Class C, 3.57%, 04/20/62(a) | | | 836 | | | | 707,511 | |
Series 2021-BA, Class D, 4.75%, 04/20/62(a) | | | 1,499 | | | | 1,279,458 | |
Series 2021-CA, Class B, 2.53%, 04/20/62(a) | | | 12,397 | | | | 10,591,557 | |
Series 2021-CA, Class C, 3.36%, 04/20/62(a) | | | 650 | | | | 550,507 | |
Series 2021-CA, Class D, 4.44%, 04/20/62(a) | | | 990 | | | | 834,806 | |
Series 2021-DA, Class B, 2.90%, 04/20/62(a) | | | 6,556 | | | | 5,743,503 | |
Series 2021-DA, Class D, 4.38%, 04/20/62(a) | | | 331 | | | | 275,846 | |
Series 2023-PL1A, Class A1A, (SOFR (30-day) + 2.25%), 7.53%, 11/25/53(a)(b) | | | 4,015 | | | | 4,004,679 | |
Neuberger Berman CLO XIV Ltd., Series 2013-14A, Class AR2, (3-mo. CME Term SOFR + 1.29%), 6.56%, 01/28/30(a)(b) | | | 428 | | | | 428,652 | |
Neuberger Berman CLO XV Ltd. | | | | | | | | |
Series 2013-15A, Class A1R2, (3-mo. CME Term SOFR + 1.18%), 6.48%, 10/15/29(a)(b) | | | 575 | | | | 575,770 | |
Series 2013-15A, Class BR2, (3-mo. CME Term SOFR + 1.61%), 6.91%, 10/15/29(a)(b) | | | 250 | | | | 250,185 | |
Neuberger Berman CLO XVI-S Ltd., Series 2017-16SA, Class AR, (3-mo. CME Term SOFR + 1.30%), 6.60%, 04/15/34(a)(b) | | | 2,690 | | | | 2,690,760 | |
| | | | | | | | |
| Security | | Par (000) | | | Value | |
|
Asset-Backed Securities (continued) | |
Neuberger Berman CLO XX Ltd. | | | | | | | | |
Series 2015-20A, Class ARR, (3-mo. CME Term SOFR + 1.42%), 6.72%, 07/15/34(a)(b) | | USD | 1,000 | | | $ | 1,000,385 | |
Series 2015-20A, Class BRR, (3-mo. CME Term SOFR + 1.91%), 7.21%, 07/15/34(a)(b) | | | 750 | | | | 752,841 | |
Neuberger Berman CLO XXI Ltd., Series 2016- 21A, Class BR2, (3-mo. CME Term SOFR + 1.91%), 7.19%, 04/20/34(a)(b) | | | 2,740 | | | | 2,749,207 | |
Neuberger Berman Loan Advisers CLO 26 Ltd. | | | | | | | | |
Series 2017-26A, Class AR, (3-mo. CME Term SOFR + 1.18%), 6.46%, 10/18/30(a)(b) | | | 6,120 | | | | 6,119,793 | |
Series 2017-26A, Class BR, (3-mo. CME Term SOFR + 1.66%), 6.94%, 10/18/30(a)(b) | | | 250 | | | | 250,000 | |
Neuberger Berman Loan Advisers CLO 31 Ltd., Series 2019-31A, Class AR, (3-mo. CME Term SOFR + 1.30%), 6.58%, 04/20/31(a)(b) | | | 386 | | | | 386,433 | |
Neuberger Berman Loan Advisers CLO 32 Ltd., Series 2019-32A, Class BR, (3-mo. CME Term SOFR + 1.66%), 6.94%, 01/20/32(a)(b) | | | 1,340 | | | | 1,340,200 | |
Neuberger Berman Loan Advisers CLO 33 Ltd., Series 2019-33A, Class AR, (3-mo. CME Term SOFR + 1.34%), 6.63%, 10/16/33(a)(b) | | | 3,550 | | | | 3,552,290 | |
Neuberger Berman Loan Advisers CLO 34 Ltd. | | | | | | | | |
Series 2019-34A, Class A1R, (3-mo. CME Term SOFR + 1.24%), 6.52%, 01/20/35(a)(b) | | | 290 | | | | 290,196 | |
Series 2019-34A, Class BR, (3-mo. CME Term SOFR + 1.75%), 7.03%, 01/20/35(a)(b) | | | 500 | | | | 500,197 | |
Neuberger Berman Loan Advisers CLO 37 Ltd., Series 2020-37A, Class BR, (3-mo. CME Term SOFR + 1.71%), 6.99%, 07/20/31(a)(b) | | | 1,000 | | | | 1,001,957 | |
Neuberger Berman Loan Advisers CLO 40 Ltd., Series 2021-40A, Class A, (3-mo. CME Term SOFR + 1.32%), 6.61%, 04/16/33(a)(b) | | | 4,144 | | | | 4,153,118 | |
Neuberger Berman Loan Advisers CLO 42 Ltd., Series 2021-42A, Class A, (3-mo. CME Term SOFR + 1.36%), 6.65%, 07/16/35(a)(b) | | | 4,090 | | | | 4,096,176 | |
Neuberger Berman Loan Advisers CLO 45 Ltd., Series 2021-45A, Class A, (3-mo. CME Term SOFR + 1.39%), 6.69%, 10/14/35(a)(b) | | | 4,360 | | | | 4,362,513 | |
Neuberger Berman Loan Advisers CLO 46 Ltd., Series 2021-46A, Class B, (3-mo. CME Term SOFR + 1.91%), 7.19%, 01/20/36(a)(b) | | | 780 | | | | 782,910 | |
Neuberger Berman Loan Advisers CLO 47 Ltd., Series 2022-47A, Class A, (3-mo. CME Term SOFR + 1.30%), 6.60%, 04/14/35(a)(b) | | | 750 | | | | 750,266 | |
Neuberger Berman Loan Advisers CLO 54 Ltd., Series 2024-54A, Class B, (3-mo. CME Term SOFR + 1.95%), 7.26%, 04/23/38(a)(b) | | | 1,520 | | | | 1,530,458 | |
New Century Home Equity Loan Trust, Series 2005-C, Class M2, (1-mo. CME Term SOFR + 0.79%), 5.64%, 12/25/35(b) | | | 2,181 | | | | 1,844,764 | |
New Mountain CLO 1 Ltd., Series CLO-1A, Class AR, (3-mo. CME Term SOFR + 1.46%), 6.76%, 10/15/34(a)(b) | | | 660 | | | | 660,309 | |
| | |
C O N S O L I D A T E D S C H E D U L E S O F I N V E S T M E N T S | | 17 |
| | |
Consolidated Schedule of Investments (continued) September 30, 2024 | | BlackRock Total Return Fund (Percentages shown are based on Net Assets) |
| | | | | | | | |
| Security | | Par (000) | | | Value | |
|
Asset-Backed Securities (continued) | |
New Mountain CLO 6 Ltd., Series CLO-6A, Class A, (3-mo. CME Term SOFR + 1.40%), 10/15/37(a)(b)(d) | | USD | 5,410 | | | $ | 5,413,787 | |
New Residential Mortgage Loan Trust, Series 2022-SFR1, Class F, 4.44%, 02/17/39(a) | | | 699 | | | | 636,009 | |
Newark BSL CLO 1 Ltd., Series 2016-1A, Class A1R, (3-mo. CME Term SOFR + 1.36%), 6.63%, 12/21/29(a)(b) | | | 130 | | | | 130,301 | |
Newday Funding Master Issuer PLC | | | | | | | | |
Series 2024-2X, Class B, (1-day SONIA + 1.40%), 6.36%, 07/15/32(b)(f) | | GBP | 655 | | | | 875,752 | |
Series 2024-2X, Class C, (1-day SONIA + 1.90%), 6.86%, 07/15/32(b)(f) | | | 780 | | | | 1,044,927 | |
Series 2024-2X, Class D, (1-day SONIA + 2.65%), 7.61%, 07/15/32(b)(f) | | | 1,645 | | | | 2,204,585 | |
Nomura Asset Acceptance Corp. Alternative Loan Trust, Series 2006-S5, Class A1, (1-mo. CME Term SOFR + 0.51%), 5.37%, 10/25/36(a)(b) | | USD | 51 | | | | 61,816 | |
Noria | | | | | | | | |
Series 2024-DE1, Class D, (1-mo. EURIBOR + 1.65%), 5.00%, 02/25/43(b) | | EUR | 500 | | | | 556,261 | |
Series 2024-DE1, Class E, (1-mo. EURIBOR + 3.55%), 6.90%, 02/25/43(b) | | | 500 | | | | 556,417 | |
Series 2024-DE1, Class F, (1-mo. EURIBOR + 4.50%), 7.85%, 02/25/43(b) | | | 300 | | | | 333,851 | |
OAK Hill European Credit Partners V Designated Activity Co., Series 2016-5A, Class BR, (3-mo. EURIBOR + 1.90%), 5.59%, 01/21/35(a)(b) | | | 400 | | | | 446,302 | |
Oaktree CLO Ltd. | | | | | | | | |
Series 2024-27A, Class A2, (3-mo. CME Term SOFR + 1.57%), 6.35%, 10/22/37(a)(b) | | USD | 790 | | | | 788,626 | |
Series 2024-27A, Class D1, (3-mo. CME Term SOFR + 3.00%), 7.78%, 10/22/37(a)(b) | | | 250 | | | | 252,737 | |
Oakwood Mortgage Investors, Inc. | | | | | | | | |
Series 2001-D, Class A2, 5.26%, 01/15/19(b) | | | 462 | | | | 186,509 | |
Series 2001-D, Class A4, 6.93%, 09/15/31(b) | | | 294 | | | | 141,603 | |
Series 2002-B, Class M1, 7.62%, 06/15/32(b) | | | 3,887 | | | | 3,930,753 | |
Ocean Trails CLO X, Series 2020-10A, Class BR, (3-mo. CME Term SOFR + 2.06%), 7.36%, 10/15/34(a)(b) | | | 250 | | | | 250,182 | |
OCP CLO Ltd. | | | | | | | | |
Series 2014-5A, Class A1R, (3-mo. CME Term SOFR + 1.34%), 6.62%, 04/26/31(a)(b) | | | 393 | | | | 393,476 | |
Series 2014-5A, Class A2R, (3-mo. CME Term SOFR + 1.66%), 6.94%, 04/26/31(a)(b) | | | 1,070 | | | | 1,068,994 | |
Series 2014-6A, Class A2R2, (3-mo. CME Term SOFR + 1.50%), 6.79%, 10/17/30(a)(b) | | | 1,250 | | | | 1,248,138 | |
Series 2014-7A, Class A1RR, (3-mo. CME Term SOFR + 1.38%), 6.66%, 07/20/29(a)(b) | | | 109 | | | | 108,557 | |
Series 2014-7A, Class A2RR, (3-mo. CME Term SOFR + 1.91%), 7.19%, 07/20/29(a)(b) | | | 1,250 | | | | 1,252,025 | |
| | | | | | | | |
| Security | | Par (000) | | | Value | |
|
Asset-Backed Securities (continued) | |
OCP CLO Ltd. | | | | | | | | |
Series 2015-9A, Class A1R2, (3-mo. CME Term SOFR + 1.25%), 6.55%, 01/15/33(a)(b) | | USD | 4,100 | | | $ | 4,103,242 | |
Series 2016-11A, Class A1R2, (3-mo. CME Term SOFR + 1.42%), 6.70%, 04/26/36(a)(b) | | | 1,290 | | | | 1,290,334 | |
Series 2016-12A, Class BAR3, (3-mo. CME Term SOFR + 1.68%), 10/18/37(a)(b)(d) | | | 1,960 | | | | 1,960,000 | |
Series 2016-12A, Class XR3, (3-mo. CME Term SOFR + 1.20%), 10/18/37(a)(b)(d) | | | 2,100 | | | | 2,100,000 | |
Series 2017-13A, Class A1AR, (3-mo. CME Term SOFR + 1.22%), 6.52%, 07/15/30(a)(b) | | | 613 | | | | 613,198 | |
Series 2017-14A, Class D1R, (3-mo. CME Term SOFR + 3.10%), 7.84%, 07/20/37(a)(b) | | | 1,610 | | | | 1,628,265 | |
Series 2019-16A, Class AR, (3-mo. CME Term SOFR + 1.26%), 6.57%, 04/10/33(a)(b) | | | 1,446 | | | | 1,446,318 | |
Series 2019-17A, Class AR2, (3-mo. CME Term SOFR + 1.40%), 6.70%, 07/20/37(a)(b) | | | 1,570 | | | | 1,573,890 | |
Series 2020-18A, Class A1R2, (3-mo. CME Term SOFR + 1.37%), 6.60%, 07/20/37(a)(b) | | | 2,080 | | | | 2,081,052 | |
Series 2020-18A, Class D1R2, (3-mo. CME Term SOFR + 3.10%), 8.33%, 07/20/37(a)(b) | | | 390 | | | | 394,568 | |
Series 2020-19A, Class BR, (3-mo. CME Term SOFR + 1.96%), 7.24%, 10/20/34(a)(b) | | | 500 | | | | 501,984 | |
Series 2020-20A, Class B1R, (3-mo. CME Term SOFR + 1.95%), 7.23%, 04/18/37(a)(b) | | | 360 | | | | 362,320 | |
Series 2020-8RA, Class A1, (3-mo. CME Term SOFR + 1.48%), 6.77%, 01/17/32(a)(b) | | | 1,876 | | | | 1,877,485 | |
Series 2021-22A, Class A, (3-mo. CME Term SOFR + 1.44%), 6.72%, 12/02/34(a)(b) | | | 2,010 | | | | 2,012,263 | |
Series 2021-22A, Class B1, (3-mo. CME Term SOFR + 1.96%), 7.24%, 12/02/34(a)(b) | | | 660 | | | | 662,881 | |
Series 2024-37A, Class A1, (3-mo. CME Term SOFR + 1.36%), 10/15/37(a)(b)(d) | | | 1,390 | | | | 1,390,000 | |
Series 2024-37A, Class B1, (3-mo. CME Term SOFR + 1.68%), 10/15/37(a)(b)(d) | | | 1,390 | | | | 1,390,000 | |
OCP Euro CLO DAC | | | | | | | | |
Series 2019-3A, Class CR, (3-mo. EURIBOR + 2.30%), 5.99%, 04/20/33(a)(b) | | EUR | 250 | | | | 279,393 | |
Series 2019-3A, Class DR, (3-mo. EURIBOR + 3.30%), 6.99%, 04/20/33(a)(b) | | | 250 | | | | 279,514 | |
Octagon 56 Ltd., Series 2021-1A, Class B, (3-mo. CME Term SOFR + 1.91%), 7.21%, 10/15/34(a)(b) | | USD | 250 | | | | 250,356 | |
Octagon 57 Ltd. | | | | | | | | |
Series 2021-1A, Class A, (3-mo. CME Term SOFR + 1.41%), 6.71%, 10/15/34(a)(b) | | | 500 | | | | 500,026 | |
Series 2021-1A, Class B1, (3-mo. CME Term SOFR + 1.91%), 7.21%, 10/15/34(a)(b) | | | 1,280 | | | | 1,283,832 | |
| | |
| 18 | | 2 0 2 4 B L A C K R O C K A N N U A L F I N A N C I A L S T A T E M E N T S A N D A D D I T I O N A L I N F O R M A T I O N |
| | |
Consolidated Schedule of Investments (continued) September 30, 2024 | | BlackRock Total Return Fund (Percentages shown are based on Net Assets) |
| | | | | | | | |
| Security | | Par (000) | | | Value | |
|
Asset-Backed Securities (continued) | |
Octagon 66 Ltd., Series 2022-1A, Class A1R, (3-mo. CME Term SOFR + 1.75%), 6.85%, 11/16/36(a)(b) | | USD | 4,970 | | | $ | 5,004,201 | |
Octagon 67 Ltd., Series 2023-1A, Class A1, (3-mo. CME Term SOFR + 1.80%), 7.09%, 04/25/36(a)(b) | | | 750 | | | | 753,009 | |
Octagon Investment Partners 18-R Ltd., Series 2018-18A, Class A1A, (3-mo. CME Term SOFR + 1.22%), 6.51%, 04/16/31(a)(b) | | | 4,602 | | | | 4,607,885 | |
Octagon Investment Partners 36 Ltd., Series 2018-1A, Class A1, (3-mo. CME Term SOFR + 1.23%), 6.53%, 04/15/31(a)(b) | | | 2,046 | | | | 2,048,506 | |
Octagon Investment Partners 37 Ltd., Series 2018-2A, Class A2, (3-mo. CME Term SOFR + 1.84%), 7.13%, 07/25/30(a)(b) | | | 750 | | | | 750,689 | |
Octagon Investment Partners 39 Ltd. | | | | | | | | |
Series 2018-3A, Class AR, (3-mo. CME Term SOFR + 1.15%), 6.43%, 10/20/30(a)(b) | | | 2,122 | | | | 2,122,684 | |
Series 2018-3A, Class BR, (3-mo. CME Term SOFR + 1.80%), 7.08%, 10/20/30(a)(b) | | | 8,890 | | | | 8,899,307 | |
Octagon Investment Partners 46 Ltd., Series 2020-2A, Class BR, (3-mo. CME Term SOFR + 1.91%), 7.21%, 07/15/36(a)(b) | | | 3,290 | | | | 3,290,903 | |
Octagon Investment Partners XIV Ltd., Series 2012-1A, Class AARR, (3-mo. CME Term SOFR + 1.21%), 6.51%, 07/15/29(a)(b) | | | 31 | | | | 30,770 | |
Octagon Investment Partners XV Ltd., Series 2013-1A, Class A2R, (3-mo. CME Term SOFR + 1.61%), 6.89%, 07/19/30(a)(b) | | | 1,430 | | | | 1,433,314 | |
Octagon Investment Partners XVI Ltd., Series 2013-1A, Class A1R, (3-mo. CME Term SOFR + 1.28%), 6.57%, 07/17/30(a)(b) | | | 3,127 | | | | 3,130,194 | |
Octagon Investment Partners XVII Ltd., Series 2013-1A, Class A1R2, (3-mo. CME Term SOFR + 1.26%), 6.55%, 01/25/31(a)(b) | | | 4,086 | | | | 4,085,888 | |
Octagon Loan Funding Ltd., Series 2014-1A, Class BRR, (3-mo. CME Term SOFR + 1.96%), 7.06%, 11/18/31(a)(b) | | | 250 | | | | 250,572 | |
OHA Credit Funding 17 Ltd., Series 2024-17A, Class A, (3-mo. CME Term SOFR + 1.48%), 6.79%, 04/20/37(a)(b) | | | 3,170 | | | | 3,171,240 | |
OHA Credit Funding 19 Ltd., Series 2024-19A, Class B1, (3-mo. CME Term SOFR + 1.70%), 6.99%, 07/20/37(a)(b) | | | 250 | | | | 251,153 | |
OHA Credit Funding 2 Ltd. | | | | | | | | |
Series 2019-2A, Class AR, (3-mo. CME Term SOFR + 1.41%), 6.69%, 04/21/34(a)(b) | | | 14,640 | | | | 14,644,836 | |
Series 2019-2A, Class BR, (3-mo. CME Term SOFR + 1.86%), 7.14%, 04/21/34(a)(b) | | | 295 | | | | 296,085 | |
OHA Credit Funding 3 Ltd. | | | | | | | | |
Series 2019-3A, Class AR, (3-mo. CME Term SOFR + 1.40%), 6.68%, 07/02/35(a)(b) | | | 6,875 | | | | 6,877,262 | |
Series 2019-3A, Class BR, (3-mo. CME Term SOFR + 1.91%), 7.19%, 07/02/35(a)(b) | | | 2,989 | | | | 3,001,844 | |
OHA Credit Funding 4 Ltd., Series 2019-4A, Class AR, (3-mo. CME Term SOFR + 1.41%), 6.69%, 10/22/36(a)(b) | | | 1,000 | | | | 1,000,309 | |
Oha Credit Funding 5 Ltd. | | | | | | | | |
Series 2020-5A, Class AR, (3-mo. CME Term SOFR + 1.35%), 0.00%, 10/18/37(a)(e) | | | 8,960 | | | | 8,960,000 | |
| | | | | | | | |
| Security | | Par (000) | | | Value | |
|
Asset-Backed Securities (continued) | |
Oha Credit Funding 5 Ltd. | | | | | | | | |
Series 2020-5A, Class B1R, (3-mo. CME Term SOFR + 1.70%), 0.00%, 10/18/37(a)(e) | | USD | 420 | | | $ | 420,000 | |
OHA Credit Funding 6 Ltd., Series 2020-6A, Class AR, (3-mo. CME Term SOFR + 1.40%), 6.68%, 07/20/34(a)(b) | | | 850 | | | | 850,194 | |
OHA Credit Funding 7 Ltd., Series 2020-7A, Class AR, (3-mo. CME Term SOFR + 1.30%), 6.58%, 02/24/37(a)(b) | | | 3,720 | | | | 3,723,073 | |
OHA Credit Funding 9 Ltd. | | | | | | | | |
Series 2021-9A, Class A1R, (3-mo. CME Term SOFR + 1.35%),
10/19/37(a)(b)(d) | | | 2,780 | | | | 2,780,000 | |
Series 2021-9A, Class B, (3-mo. CME Term SOFR + 1.96%), 7.24%, 07/19/35(a)(b) | | | 3,510 | | | | 3,528,064 | |
Series 2021-9A, Class B1R, (3-mo. CME Term SOFR + 1.70%), 10/19/37(a)(b)(d) | | | 3,510 | | | | 3,510,000 | |
OHA Credit Partners XI Ltd., Series 2015-11A, Class A1R2, (3-mo. CME Term SOFR + 1.46%), 6.74%, 04/20/37(a)(b) | | | 3,530 | | | | 3,539,205 | |
OHA Credit Partners XII Ltd., Series 2015-12A, Class B1R2, (3-mo. CME Term SOFR + 1.95%), 7.23%, 04/23/37(a)(b) | | | 1,550 | | | | 1,564,743 | |
OHA Credit Partners XVI, Series 2021-16A, Class AR, (3-mo. CME Term SOFR + 1.35%), 6.20%, 10/18/37(a)(b) | | | 5,388 | | | | 5,387,770 | |
OHA Loan Funding Ltd. | | | | | | | | |
Series 2013-2A, Class AR, (3-mo. CME Term SOFR + 1.30%), 6.40%, 05/23/31(a)(b) | | | 5,139 | | | | 5,145,916 | |
Series 2015-1A, Class AR3, (3-mo. CME Term SOFR + 1.41%), 6.69%, 01/19/37(a)(b) | | | 1,830 | | | | 1,831,850 | |
Series 2016-1A, Class A1R2, (3-mo. CME Term SOFR + 1.46%), 6.80%, 07/20/37(a)(b) | | | 3,750 | | | | 3,754,092 | |
Series 2016-1A, Class B1R2, (3-mo. CME Term SOFR + 1.70%), 7.04%, 07/20/37(a)(b) | | | 250 | | | | 251,030 | |
OneMain Financial Issuance Trust | | | | | | | | |
Series 2020-2A, Class C, 2.76%, 09/14/35(a) . | | | 2,620 | | | | 2,454,723 | |
Series 2021-1A, Class A2, (SOFR (30-day) + 0.76%), 6.10%, 06/16/36(a)(b) | | | 1,958 | | | | 1,958,965 | |
Series 2024-1A, Class A, 5.79%, 05/14/41(a) . | | | 17,503 | | | | 18,509,002 | |
Option One Mortgage Loan Trust | | | | | | | | |
Series 2005-4, Class M3, (1-mo. CME Term SOFR + 0.85%), 5.70%, 11/25/35(b) | | | 4,030 | | | | 3,415,340 | |
Series 2007-CP1, Class 2A3, (1-mo. CME Term SOFR + 0.32%), 5.18%, 03/25/37(b) . | | | 2,360 | | | | 1,998,949 | |
Series 2007-FXD1, Class 1A1, 5.87%, 01/25/37(c) | | | 1,746 | | | | 1,514,970 | |
Series 2007-FXD1, Class 2A1, 5.87%, 01/25/37(c) | | | 4,363 | | | | 3,804,499 | |
Orchard Park CLO Ltd. | | | | | | | | |
Series 2024-1A, Class A, (3-mo. CME Term SOFR + 1.36%), 10/20/37(a)(b)(d) | | | 15,180 | | | | 15,180,000 | |
Series 2024-1A, Class B1, (3-mo. CME Term SOFR + 1.70%), 10/20/37(a)(b)(d) | | | 1,380 | | | | 1,380,000 | |
Origen Manufactured Housing Contract Trust | | | | | | | | |
Series 2001-A, Class M1, 7.82%, 03/15/32(b) | | | 779 | | | | 781,230 | |
Series 2007-B, Class A1, (1-mo. LIBOR US + 1.20%), 6.41%, 10/15/37(a)(b) | | | 307 | | | | 303,283 | |
| | |
C O N S O L I D A T E D S C H E D U L E S O F I N V E S T M E N T S | | 19 |
| | |
Consolidated Schedule of Investments (continued) September 30, 2024 | | BlackRock Total Return Fund (Percentages shown are based on Net Assets) |
| | | | | | | | |
| Security | | Par (000) | | | Value | |
|
Asset-Backed Securities (continued) | |
Owl Rock CLO V Ltd., Series 2020-5A, Class A1R, (3-mo. CME Term SOFR + 1.78%), 7.06%, 04/20/34(a)(b) | | USD | 900 | | | $ | 901,134 | |
Owl Rock CLO XVIII LLC, Series 2024-18A, Class A, (3-mo. CME Term SOFR + 1.70%), 7.00%, 07/24/36(a)(b) | | | 3,925 | | | | 3,919,814 | |
Ownit Mortgage Loan Trust, Series 2006-2, Class A2C, 6.50%, 01/25/37(c) | | | 1,586 | | | | 1,459,182 | |
OZLM VIII Ltd., Series 2014-8A, Class BR3, (3-mo. CME Term SOFR + 2.36%), 7.65%, 10/17/29(a)(b) | | | 1,160 | | | | 1,161,850 | |
OZLM XVIII Ltd. | | | | | | | | |
Series 2018-18A, Class A, (3-mo. CME Term SOFR + 1.28%), 6.58%, 04/15/31(a)(b) | | | 4,025 | | | | 4,024,867 | |
Series 2018-18A, Class B, (3-mo. CME Term SOFR + 1.81%), 7.11%, 04/15/31(a)(b) | | | 700 | | | | 702,030 | |
OZLM XX Ltd., Series 2018-20A, Class A2, (3-mo. CME Term SOFR + 1.91%), 7.19%, 04/20/31(a)(b) | | | 850 | | | | 853,497 | |
OZLM XXII Ltd., Series 2018-22A, Class A1, (3-mo. CME Term SOFR + 1.33%), 6.62%, 01/17/31(a)(b) | | | 475 | | | | 475,174 | |
OZLM XXIV Ltd., Series 2019-24A, Class A2AR, (3-mo. CME Term SOFR + 1.96%), 7.24%, 07/20/32(a)(b) | | | 750 | | | | 751,770 | |
Pagaya AI Technology in Housing Trust, Series 2023-1, Class F, 3.60%, 10/25/40(a) | | | 3,423 | | | | 2,718,591 | |
Palmer Square CLO Ltd. | | | | | | | | |
Series 2013-2A, Class A1A3, (3-mo. CME Term SOFR + 1.26%), 6.55%, 10/17/31(a)(b) | | | 1,847 | | | | 1,848,684 | |
Series 2014-1A, Class A1R2, (3-mo. CME Term SOFR + 1.39%), 6.68%, 01/17/31(a)(b) | | | 827 | | | | 833,023 | |
Series 2015-1A, Class A2R4, (3-mo. CME Term SOFR + 1.96%), 7.09%, 05/21/34(a)(b) | | | 1,250 | | | | 1,253,033 | |
Series 2015-2A, Class A2R2, (3-mo. CME Term SOFR + 1.81%), 7.09%, 07/20/30(a)(b) | | | 2,500 | | | | 2,503,175 | |
Series 2015-2A, Class CR2, (3-mo. CME Term SOFR + 3.01%), 8.29%, 07/20/30(a)(b) | | | 1,000 | | | | 1,002,731 | |
Series 2019-1A, Class A1R, (3-mo. CME Term SOFR + 1.41%), 6.53%, 11/14/34(a)(b) | | | 3,570 | | | | 3,575,712 | |
Series 2020-3A, Class A1R2, (3-mo. CME Term SOFR + 1.65%), 6.77%, 11/15/36(a)(b) | | | 1,270 | | | | 1,274,338 | |
Series 2021-1A, Class A2, (3-mo. CME Term SOFR + 1.66%), 6.94%, 04/20/34(a)(b) | | | 250 | | | | 249,888 | |
Series 2021-3A, Class A1, (3-mo. CME Term SOFR + 1.41%), 6.71%, 01/15/35(a)(b) | | | 360 | | | | 360,378 | |
Series 2021-4A, Class B, (3-mo. CME Term SOFR + 1.91%), 7.21%, 10/15/34(a)(b) | | | 250 | | | | 250,908 | |
Series 2022-3A, Class A1R, (3-mo. CME Term SOFR + 1.35%), 6.54%, 07/20/37(a)(b) | | | 1,040 | | | | 1,040,011 | |
Series 2022-3A, Class D1R, (3-mo. CME Term SOFR + 2.95%), 8.14%, 07/20/37(a)(b) | | | 550 | | | | 552,350 | |
| | | | | | | | |
| Security | | Par (000) | | | Value | |
|
Asset-Backed Securities (continued) | |
Palmer Square CLO Ltd. | | | | | | | | |
Series 2022-5A, Class A, (3-mo. CME Term SOFR + 2.00%), 7.28%, 10/20/35(a)(b) | | USD | 500 | | | $ | 500,000 | |
Series 2024-2A, Class B, (3-mo. CME Term SOFR + 1.65%), 6.94%, 07/20/37(a)(b) | | | 3,270 | | | | 3,272,807 | |
Palmer Square Loan Funding Ltd. | | | | | | | | |
Series 2021-1A, Class D, (3-mo. CME Term SOFR + 6.26%), 11.54%, 04/20/29(a)(b) | | | 500 | | | | 499,945 | |
Series 2021-2A, Class A2, (3-mo. CME Term SOFR + 1.51%), 6.64%, 05/20/29(a)(b) | | | 1,430 | | | | 1,432,125 | |
Series 2021-2A, Class D, (3-mo. CME Term SOFR + 5.26%), 10.39%, 05/20/29(a)(b) | | | 500 | | | | 500,670 | |
Series 2021-4A, Class C, (3-mo. CME Term SOFR + 2.86%), 8.16%, 10/15/29(a)(b) | | | 250 | | | | 249,503 | |
Series 2021-4A, Class D, (3-mo. CME Term SOFR + 5.26%), 10.56%, 10/15/29(a)(b) | | | 1,480 | | | | 1,478,960 | |
Series 2022-2A, Class A2, (3-mo. CME Term SOFR + 1.90%), 7.20%, 10/15/30(a)(b) | | | 1,810 | | | | 1,812,860 | |
Series 2022-2A, Class B, (3-mo. CME Term SOFR + 2.20%), 7.50%, 10/15/30(a)(b) | | | 390 | | | | 391,039 | |
Series 2022-2A, Class C, (3-mo. CME Term SOFR + 3.10%), 8.40%, 10/15/30(a)(b) | | | 250 | | | | 251,500 | |
Series 2022-3A, Class A2R, (3-mo. CME Term SOFR + 1.60%), 6.90%, 04/15/31(a)(b) | | | 16,630 | | | | 16,601,252 | |
Series 2024-1A, Class A2, (3-mo. CME Term SOFR + 1.45%), 6.56%, 10/15/32(a)(b) | | | 1,680 | | | | 1,688,281 | |
Park Avenue Institutional Advisers CLO Ltd. | | | | | | | | |
Series 2019-1A, Class A1, (3-mo. CME Term SOFR + 1.74%), 6.86%, 05/15/32(a)(b) | | | 438 | | | | 437,875 | |
Series 2021-2A, Class D, (3-mo. CME Term SOFR + 3.66%), 8.96%, 07/15/34(a)(b) | | | 250 | | | | 250,681 | |
PCL Funding IX PLC | | | | | | | | |
Series 2024-1, Class B, (1-day SONIA + 1.30%), 6.26%, 07/16/29(b)(f) | | GBP | 684 | | | | 917,200 | |
Series 2024-1, Class C, (1-day SONIA + 2.15%), 7.11%, 07/16/29(b)(f) | | | 151 | | | | 201,696 | |
Pikes Peak CLO 1, Series 2018-1A, Class A, (3-mo. CME Term SOFR + 1.44%), 6.73%, 07/24/31(a)(b) | | USD | 699 | | | | 699,836 | |
Pikes Peak CLO 4, Series 2019-4A, Class AR, (3-mo. CME Term SOFR + 1.46%), 6.76%, 07/15/34(a)(b) | | | 250 | | | | 250,000 | |
Pikes Peak CLO 6, Series 2020-6A, Class AR2, (3-mo. CME Term SOFR + 1.43%), 6.53%, 05/18/34(a)(b) | | | 2,846 | | | | 2,847,124 | |
Pikes Peak CLO 8 | | | | | | | | |
Series 2021-8A, Class A, (3-mo. CME Term SOFR + 1.43%), 6.71%, 07/20/34(a)(b) | | | 8,628 | | | | 8,633,027 | |
Series 2021-8A, Class B, (3-mo. CME Term SOFR + 2.01%), 7.29%, 07/20/34(a)(b) | | | 2,950 | | | | 2,962,935 | |
Pony SA Compartment German Auto Loans | | | | | | | | |
Series 2024-1, Class C, (1-mo. EURIBOR + 1.20%), 4.64%, 01/14/33(b)(f) | | EUR | 400 | | | | 444,733 | |
Series 2024-1, Class D, (1-mo. EURIBOR + 1.65%), 5.09%, 01/14/33(b)(f) | | | 300 | | | | 333,525 | |
Post CLO Ltd., Series 2023-1A, Class A, (3-mo. CME Term SOFR + 1.95%), 7.23%, 04/20/36(a)(b) | | USD | 500 | | | | 502,290 | |
PRET LLC | | | | | | | | |
Series 2021-RN4, Class A1, 2.49%, 10/25/51(a)(b) | | | 4,737 | | | | 4,731,873 | |
| | |
| 20 | | 2 0 2 4 B L A C K R O C K A N N U A L F I N A N C I A L S T A T E M E N T S A N D A D D I T I O N A L I N F O R M A T I O N |
| | |
Consolidated Schedule of Investments (continued) September 30, 2024 | | BlackRock Total Return Fund (Percentages shown are based on Net Assets) |
| | | | | | | | |
| Security | | Par (000) | | | Value | |
|
Asset-Backed Securities (continued) | |
PRET LLC | | | | | | | | |
Series 2023-RN2, Class A1, 8.11%, 11/25/53(a)(c) | | USD | 7,218 | | | $ | 7,322,922 | |
Series 2024-NPL4, Class A1, 7.00%, 07/25/54(a)(c) | | | 6,752 | | | | 6,832,550 | |
Series 2024-NPL5, Class A1, 5.96%, 09/25/54(a)(c) | | | 5,251 | | | | 5,250,959 | |
Prima Capital CRE Securitization Ltd. | | | | | | | | |
Series 2015-4A, Class C, 4.00%, 08/24/49(a) | | | 449 | | | | 436,977 | |
Series 2016-6A, Class C, 4.00%, 08/24/40(a) | | | 7,170 | | | | 6,836,057 | |
Prodigy Finance DAC | | | | | | | | |
Series 2021-1A, Class A, (1-mo. CME Term SOFR + 1.36%), 6.22%, 07/25/51(a)(b) | | | 1,598 | | | | 1,592,207 | |
Series 2021-1A, Class B, (1-mo. CME Term SOFR + 2.61%), 7.47%, 07/25/51(a)(b) | | | 314 | | | | 313,857 | |
Series 2021-1A, Class C, (1-mo. CME Term SOFR + 3.86%), 8.72%, 07/25/51(a)(b) | | | 182 | | | | 182,861 | |
Series 2021-1A, Class D, (1-mo. CME Term SOFR + 6.01%), 10.87%, 07/25/51(a)(b) | | | 124 | | | | 126,073 | |
Progress Residential Trust | | | | | | | | |
Series 2021-SFR1, Class F, 2.76%, 04/17/38(a) | | | 2,900 | | | | 2,773,902 | |
Series 2021-SFR10, Class E2, 3.67%, 12/17/40(a) | | | 2,014 | | | | 1,868,948 | |
Series 2021-SFR10, Class F, 4.61%, 12/17/40(a) | | | 8,135 | | | | 7,632,990 | |
Series 2021-SFR2, Class F, 3.40%, 04/19/38(a) | | | 5,967 | | | | 5,792,631 | |
Series 2021-SFR3, Class F, 3.44%, 05/17/26(a) | | | 6,640 | | | | 6,355,550 | |
Series 2021-SFR4, Class F, 3.41%, 05/17/38(a) | | | 8,330 | | | | 7,841,854 | |
Series 2021-SFR9, Class F, 4.05%, 11/17/40(a) | | | 1,342 | | | | 1,231,137 | |
Series 2022-SFR1, Class F, 4.88%, 02/17/41(a) | | | 2,617 | | | | 2,417,320 | |
Series 2022-SFR1, Class G, 5.52%, 02/17/41(a) | | | 2,617 | | | | 2,360,090 | |
Series 2022-SFR5, Class E1, 6.62%, 06/17/39(a) | | | 1,766 | | | | 1,792,679 | |
Series 2023-SFR2, Class E1, 4.75%, 10/17/40(a) | | | 1,781 | | | | 1,689,184 | |
Series 2024-SFR2, Class E1, 3.40%, 04/17/41(a)(b) | | | 2,025 | | | | 1,824,887 | |
Series 2024-SFR2, Class E2, 3.65%, 04/17/41(a)(b) | | | 1,012 | | | | 908,961 | |
Quarzo Srl | | | | | | | | |
Series 2024-1, Class C, (3-mo. EURIBOR + 2.30%), 5.78%, 06/15/41(b)(f) | | EUR | 421 | | | | 473,516 | |
Series 2024-1, Class D, (3-mo. EURIBOR + 3.70%), 7.18%, 06/15/41(b)(f) | | | 343 | | | | 386,779 | |
Race Point IX CLO Ltd., Series 2015-9A, Class A1A2, (3-mo. CME Term SOFR + 1.20%), 6.50%, 10/15/30(a)(b) | | USD | 2,367 | | | | 2,366,662 | |
Race Point X CLO Ltd., Series 2016-10A, Class A1R, (3-mo. CME Term SOFR + 1.36%), 6.65%, 07/25/31(a)(b) | | | 3,001 | | | | 3,002,953 | |
Rad CLO 15 Ltd. | | | | | | | | |
Series 2021-15A, Class A, (3-mo. CME Term SOFR + 1.35%), 6.63%, 01/20/34(a)(b) | | | 4,110 | | | | 4,113,747 | |
Series 2021-15A, Class B, (3-mo. CME Term SOFR + 1.91%), 7.19%, 01/20/34(a)(b) | | | 430 | | | | 430,579 | |
| | | | | | | | |
| Security | | Par (000) | | | Value | |
|
Asset-Backed Securities (continued) | |
Rad CLO 16 Ltd., Series 2022-16A, Class A1R, (3-mo. CME Term SOFR + 1.55%), 6.85%, 07/15/37(a)(b) | | USD | 325 | | | $ | 325,966 | |
RAD CLO 23 Ltd., Series 2024-23A, Class B1, (3-mo. CME Term SOFR + 2.05%), 7.34%, 04/20/37(a)(b) | | | 1,400 | | | | 1,410,957 | |
Rad CLO 5 Ltd., Series 2019-5A, Class AR, (3-mo. CME Term SOFR + 1.38%), 6.67%, 07/24/32(a)(b) | | | 3,770 | | | | 3,773,461 | |
Rad CLO 7 Ltd. | | | | | | | | |
Series 2020-7A, Class A1R, (3-mo. CME Term SOFR + 1.35%), 6.64%, 04/17/36(a)(b) | | | 1,050 | | | | 1,050,021 | |
Series 2020-7A, Class B1R, (3-mo. CME Term SOFR + 1.90%), 7.19%, 04/17/36(a)(b) | | | 4,540 | | | | 4,544,625 | |
Series 2020-7A, Class CR, (3-mo. CME Term SOFR + 2.60%), 7.89%, 04/17/36(a)(b) | | | 2,410 | | | | 2,432,234 | |
Series 2020-7A, Class D1R, (3-mo. CME Term SOFR + 4.15%), 9.44%, 04/17/36(a)(b) | | | 770 | | | | 784,667 | |
Rad CLO 9 Ltd., Series 2020-9A, Class B1, (3-mo. CME Term SOFR + 2.16%), 7.46%, 01/15/34(a)(b) | | | 250 | | | | 250,531 | |
RAMP Series Trust, Series 2004-RS7, Class A2A, (1-mo. LIBOR US + 0.62%), 5.17%, 07/25/34(b) | | | 1,071 | | | | 842,775 | |
Recette CLO Ltd., Series 2015-1A, Class BRR, (3-mo. CME Term SOFR + 1.66%), 6.94%, 04/20/34(a)(b) | | | 500 | | | | 500,000 | |
Red & Black Auto Italy Srl, Series 3, Class C, (1-mo. EURIBOR + 1.50%), 07/28/36(b)(d)(f) | | EUR | 298 | | | | 331,719 | |
Redwood Funding Trust, Series 2023-1, Class A, 7.50%, 07/25/59(a)(c) | | USD | 468 | | | | 467,886 | |
Regatta IX Funding Ltd., Series 2017-1A, Class B1R, (3-mo. CME Term SOFR + 2.00%), 7.32%, 04/17/37(a)(b) | | | 2,438 | | | | 2,457,084 | |
Regatta VI Funding Ltd., Series 2016-1A, Class AR2, (3-mo. CME Term SOFR + 1.42%), 6.70%, 04/20/34(a)(b) | | | 4,700 | | | | 4,706,148 | |
Regatta VII Funding Ltd. | | | | | | | | |
Series 2016-1A, Class A1R2, (3-mo. CME Term SOFR + 1.41%), 6.23%, 06/20/34(a)(b) | | | 1,600 | | | | 1,603,750 | |
Series 2016-1A, Class BR2, (3-mo. CME Term SOFR + 1.86%), 6.68%, 06/20/34(a)(b) | | | 500 | | | | 502,029 | |
Regatta VIII Funding Ltd., Series 2017-1A, Class BR, (3-mo. CME Term SOFR + 2.05%), 7.38%, 04/17/37(a)(b) | | | 750 | | | | 755,174 | |
Regatta XI Funding Ltd. | | | | | | | | |
Series 2018-1A, Class AR, (3-mo. CME Term SOFR + 1.40%), 6.70%, 07/17/37(a)(b) | | | 5,950 | | | | 5,954,646 | |
Series 2018-1A, Class BR, (3-mo. CME Term SOFR + 1.75%), 7.05%, 07/17/37(a)(b) | | | 3,270 | | | | 3,274,161 | |
Regatta XII Funding Ltd., Series 2019-1A, Class ARR, (3-mo. CME Term SOFR + 1.39%),
10/15/37(a)(b)(d) | | | 3,340 | | | | 3,340,000 | |
Regatta XIX Funding Ltd. | | | | | | | | |
Series 2022-1A, Class A1, (3-mo. CME Term SOFR + 1.32%), 6.60%, 04/20/35(a)(b) | | | 1,020 | | | | 1,021,534 | |
| | |
C O N S O L I D A T E D S C H E D U L E S O F I N V E S T M E N T S | | 21 |
| | |
Consolidated Schedule of Investments (continued) September 30, 2024 | | BlackRock Total Return Fund (Percentages shown are based on Net Assets) |
| | | | | | | | |
| Security | | Par (000) | | | Value | |
|
Asset-Backed Securities (continued) | |
Regatta XIX Funding Ltd. | | | | | | | | |
Series 2022-1A, Class B, (3-mo. CME Term SOFR + 1.85%), 7.13%, 04/20/35(a)(b) | | USD | 680 | | | $ | 683,121 | |
Regatta XVIII Funding Ltd. | | | | | | | | |
Series 2021-1A, Class A1, (3-mo. CME Term SOFR + 1.36%), 6.66%, 01/15/34(a)(b) | | | 250 | | | | 250,300 | |
Series 2021-1A, Class B, (3-mo. CME Term SOFR + 1.71%), 7.01%, 01/15/34(a)(b) | | | 750 | | | | 751,930 | |
Regatta XXIII Funding Ltd., Series 2021-4A, Class A1, (3-mo. CME Term SOFR + 1.41%), 6.69%, 01/20/35(a)(b) | | | 1,300 | | | | 1,301,941 | |
Regatta XXIV Funding Ltd., Series 2021-5A, Class D, (3-mo. CME Term SOFR + 3.36%), 8.64%, 01/20/35(a)(b) | | | 250 | | | | 250,299 | |
Regatta XXVII Funding Ltd., Series 2024-1A, Class A1, (3-mo. CME Term SOFR + 1.53%), 6.83%, 04/26/37(a)(b) | | | 2,990 | | | | 3,010,003 | |
Regional Management Issuance Trust | | | | | | | | |
Series 2021-2, Class A, 1.90%, 08/15/33(a) | | | 1,053 | | | | 983,782 | |
Series 2021-3, Class A, 3.88%, 10/17/33(a)(g). | | | 21,460 | | | | 20,039,348 | |
Series 2022-1, Class A, 3.07%, 03/15/32(a) | | | 417 | | | | 409,914 | |
Series 2022-1, Class B, 3.71%, 03/15/32(a) | | | 810 | | | | 786,658 | |
Series 2022-1, Class C, 4.46%, 03/15/32(a) | | | 534 | | | | 520,356 | |
Series 2022-1, Class D, 6.72%, 03/15/32(a) | | | 1,695 | | | | 1,661,460 | |
Series 2024-1, Class D, 7.46%, 07/15/36(a) | | | 268 | | | | 278,706 | |
Republic Finance Issuance Trust | | | | | | | | |
Series 2024-A, Class B, 6.47%, 08/20/32(a) | | | 695 | | | | 707,383 | |
Series 2024-A, Class C, 7.28%, 08/20/32(a) | | | 340 | | | | 346,767 | |
Series 2024-A, Class D, 9.49%, 08/20/32(a) | | | 1,401 | | | | 1,431,029 | |
Riserva CLO Ltd., Series 2016-3A, Class ARR, (3-mo. CME Term SOFR + 1.32%), 6.60%, 01/18/34(a)(b) | | | 5,690 | | | | 5,691,986 | |
Rockford Tower CLO Ltd. | | | | | | | | |
Series 2017-1A, Class AR2, (3-mo. CME Term SOFR + 1.36%), 6.64%, 04/20/34(a)(b) | | | 4,827 | | | | 4,828,552 | |
Series 2017-2A, Class BR, (3-mo. CME Term SOFR + 1.76%), 7.06%, 10/15/29(a)(b) | | | 8,271 | | | | 8,275,610 | |
Series 2017-2A, Class CR, (3-mo. CME Term SOFR + 2.16%), 7.46%, 10/15/29(a)(b) | | | 2,750 | | | | 2,752,494 | |
Series 2017-2A, Class DR, (3-mo. CME Term SOFR + 3.11%), 8.41%, 10/15/29(a)(b) | | | 4,766 | | | | 4,766,900 | |
Series 2017-3A, Class A, (3-mo. CME Term SOFR + 1.45%), 6.73%, 10/20/30(a)(b) | | | 7,393 | | | | 7,402,382 | |
Series 2018-1A, Class A, (3-mo. CME Term SOFR + 1.36%), 6.49%, 05/20/31(a)(b) | | | 5,822 | | | | 5,828,105 | |
Series 2018-1A, Class B, (3-mo. CME Term SOFR + 1.98%), 7.11%, 05/20/31(a)(b) | | | 1,500 | | | | 1,502,923 | |
Series 2018-2A, Class A, (3-mo. CME Term SOFR + 1.42%), 6.70%, 10/20/31(a)(b) | | | 709 | | | | 709,125 | |
Series 2018-2A, Class B, (3-mo. CME Term SOFR + 2.06%), 7.34%, 10/20/31(a)(b) | | | 600 | | | | 601,331 | |
Series 2019-2A, Class BR, (3-mo. CME Term SOFR + 1.91%), 7.04%, 08/20/32(a)(b) | | | 1,250 | | | | 1,249,986 | |
Series 2021-2A, Class A1, (3-mo. CME Term SOFR + 1.42%), 6.70%, 07/20/34(a)(b) | | | 2,020 | | | | 2,020,487 | |
Romark CLO Ltd. | | | | | | | | |
Series 2017-1A, Class A1R, (3-mo. CME Term SOFR + 1.29%), 6.58%, 10/23/30(a)(b) | | | 692 | | | | 692,550 | |
Series 2017-1A, Class B, (3-mo. CME Term SOFR + 2.41%), 7.70%, 10/23/30(a)(b) | | | 750 | | | | 750,840 | |
| | | | | | | | |
| Security | | Par (000) | | | Value | |
|
Asset-Backed Securities (continued) | |
Romark WM-R Ltd., Series 2018-1A, Class A1, (3-mo. CME Term SOFR + 1.29%), 6.57%, 04/20/31(a)(b) | | USD | 3,571 | | | $ | 3,573,646 | |
RR 1 LLC, Series 2017-1A, Class A1AB, (3-mo. CME Term SOFR + 1.41%), 6.71%, 07/15/35(a)(b) | | | 9,490 | | | | 9,512,713 | |
RR 12 Ltd., Series 2020-12A, Class A2R3, (3-mo. CME Term SOFR + 1.60%), 6.90%, 01/15/36(a)(b) | | | 1,040 | | | | 1,039,956 | |
RR 18 Ltd., Series 2021-18A, Class A2, (3-mo. CME Term SOFR + 1.86%), 7.16%, 10/15/34(a)(b) | | | 485 | | | | 486,641 | |
RR 26 Ltd., Series 2023-26A, Class A1, (3-mo. CME Term SOFR + 1.78%), 7.08%, 04/15/38(a)(b) | | | 1,110 | | | | 1,114,459 | |
RR 28 Ltd., Series 2024-28RA, Class A1R, (3-mo. CME Term SOFR + 1.55%), 6.85%, 04/15/37(a)(b) | | | 6,320 | | | | 6,336,573 | |
RR 29 Ltd., Series 2024-29RA, Class A1R, (3-mo. CME Term SOFR + 1.39%), 6.69%, 07/15/39(a)(b) | | | 300 | | | | 301,541 | |
RR 3 Ltd., Series 2018-3A, Class A1R2, (3-mo. CME Term SOFR + 1.35%), 6.65%, 01/15/30(a)(b) | | | 1,676 | | | | 1,676,502 | |
RR 32 Ltd. | | | | | | | | |
Series 2024-32RA, Class A1R, (3-mo. CME Term SOFR + 1.36%), 10/15/39(a)(b)(d) | | | 12,950 | | | | 12,950,000 | |
Series 2024-32RA, Class A2R, (3-mo. CME Term SOFR + 1.70%), 10/15/39(a)(b)(d) | | | 2,310 | | | | 2,310,000 | |
RR 4 Ltd., Series 2018-4A, Class A2, (3-mo. CME Term SOFR + 1.81%), 7.11%, 04/15/30(a)(b) | | | 1,400 | | | | 1,404,773 | |
RR 5 Ltd., Series 2018-5A, Class A2R, (3-mo. CME Term SOFR + 1.95%), 7.27%, 07/15/39(a)(b) | | | 1,000 | | | | 1,006,778 | |
RRE 5 Loan Management DAC, Series 5A, Class A2R, (3-mo. EURIBOR + 1.75%), 5.44%, 01/15/37(a)(b) | | EUR | 1,160 | | | | 1,296,121 | |
Sandstone Peak Ltd. | | | | | | | | |
Series 2021-1A, Class A2R, (3-mo. CME Term SOFR + 1.68%), 6.53%, 10/15/34(a)(b) | | USD | 2,410 | | | | 2,410,000 | |
Series 2021-1A, Class B1R, (3-mo. CME Term SOFR + 1.83%), 6.68%, 10/15/34(a)(b) | | | 710 | | | | 710,000 | |
Saxon Asset Securities Trust, Series 2004-2, Class MF5, 3.01%, 08/25/35(c) | | | 587 | | | | 445,438 | |
SCF Rahoituspalvelut XIII DAC, Series 13, Class C, (1-mo. EURIBOR + 1.40%), 4.75%, 06/25/34(b)(f) | | EUR | 400 | | | | 445,337 | |
Securitized Asset Backed Receivables LLC Trust, Series 2006-OP1, Class M6, (1-mo. CME Term SOFR + 1.12%), 5.97%, 10/25/35(b) | | USD | 340 | | | | 265,914 | |
Securitized Asset-Backed Receivables LLC Trust | | | | | | | | |
Series 2007-BR1, Class A2A, (1-mo. CME Term SOFR + 0.33%), 5.19%, 02/25/37(b) | | | 344 | | | | 150,244 | |
Series 2007-BR1, Class A2B, (1-mo. CME Term SOFR + 0.65%), 5.51%, 02/25/37(b) | | | 3,662 | | | | 1,600,369 | |
Series 2007-NC2, Class A2C, (1-mo. CME Term SOFR + 0.55%), 5.41%, 01/25/37(b) | | | 575 | | | | 415,684 | |
| | |
| 22 | | 2 0 2 4 B L A C K R O C K A N N U A L F I N A N C I A L S T A T E M E N T S A N D A D D I T I O N A L I N F O R M A T I O N |
| | |
Consolidated Schedule of Investments (continued) September 30, 2024 | | BlackRock Total Return Fund (Percentages shown are based on Net Assets) |
| | | | | | | | |
| Security | | Par (000) | | | Value | |
|
Asset-Backed Securities (continued) | |
Service Experts Issuer LLC | | | | | | | | |
Series 2021-1A, Class A, 2.67%, 02/02/32(a) | | USD | 3,410 | | | $ | 3,302,798 | |
Series 2024-1A, Class A, 6.39%, 11/20/35(a) | | | 4,172 | | | | 4,301,485 | |
SESAC Finance LLC | | | | | | | | |
Series 2019-1, Class A2, 5.22%, 07/25/49(a) | | | 2,850 | | | | 2,837,137 | |
Series 2022-1, Class A2, 5.50%, 07/25/52(a) | | | 2,539 | | | | 2,527,400 | |
Series 2024-1, Class A2, 6.42%, 01/25/54(a) | | | 1,293 | | | | 1,324,386 | |
SG Mortgage Securities Trust, Series 2006- FRE2, Class A2C, (1-mo. CME Term SOFR + 0.43%), 5.29%, 07/25/36(b) | | | 867 | | | | 186,596 | |
Shackleton CLO Ltd., Series 2019-14A, Class BR, (3-mo. CME Term SOFR + 2.06%), 7.34%, 07/20/34(a)(b) | | | 250 | | | | 250,839 | |
Signal Peak CLO 1 Ltd. | | | | | | | | |
Series 2014-1A, Class AR3, (3-mo. CME Term SOFR + 1.42%), 6.71%, 04/17/34(a)(b) | | | 11,570 | | | | 11,584,705 | |
Series 2014-1A, Class BR3, (3-mo. CME Term SOFR + 2.06%), 7.35%, 04/17/34(a)(b) | | | 3,010 | | | | 3,010,849 | |
Signal Peak CLO 5 Ltd. | | | | | | | | |
Series 2018-5A, Class A1R, (3-mo. CME Term SOFR + 1.55%), 6.84%, 04/25/37(a)(b) | | | 2,620 | | | | 2,626,928 | |
Series 2018-5A, Class BR, (3-mo. CME Term SOFR + 2.20%), 7.49%, 04/25/37(a)(b) | | | 610 | | | | 616,875 | |
Signal Peak CLO 7 Ltd. | | | | | | | | |
Series 2019-1A, Class A1R, (3-mo. CME Term SOFR + 1.42%), 5.98%, 10/20/37(a)(b) | | | 400 | | | | 400,000 | |
Series 2019-1A, Class BR, (3-mo. CME Term SOFR + 1.80%), 6.36%, 10/20/37(a)(b) | | | 270 | | | | 270,000 | |
Signal Peak CLO 8 Ltd. | | | | | | | | |
Series 2020-8A, Class A, (3-mo. CME Term SOFR + 1.53%), 6.81%, 04/20/33(a)(b) | | | 3,010 | | | | 3,016,522 | |
Series 2020-8A, Class B, (3-mo. CME Term SOFR + 1.91%), 7.19%, 04/20/33(a)(b) | | | 1,000 | | | | 1,002,152 | |
Silver Point CLO 5 Ltd., Series 2024-5A, Class A1, (3-mo. CME Term SOFR + 1.40%), 6.13%, 10/20/37(a)(b) | | | 860 | | | | 860,420 | |
Sixth Street CLO IX Ltd., Series 2017-9A, Class AR, (3-mo. CME Term SOFR + 1.38%), 6.66%, 07/21/37(a)(b) | | | 1,690 | | | | 1,692,535 | |
Sixth Street CLO XIX Ltd., Series 2021-19A, Class A, (3-mo. CME Term SOFR + 1.36%), 6.64%, 07/20/34(a)(b) | | | 16,995 | | | | 16,998,605 | |
Sixth Street CLO XVII Ltd., Series 2021-17A, Class E, (3-mo. CME Term SOFR + 6.46%), 11.74%, 01/20/34(a)(b) | | | 625 | | | | 623,219 | |
Sixth Street CLO XX Ltd. | | | | | | | | |
Series 2021-20A, Class A1, (3-mo. CME Term SOFR + 1.42%), 6.70%, 10/20/34(a)(b) | | | 250 | | | | 250,066 | |
Series 2021-20A, Class B, (3-mo. CME Term SOFR + 1.91%), 7.19%, 10/20/34(a)(b) | | | 780 | | | | 782,894 | |
SLM Private Credit Student Loan Trust, Series 2004-A, Class A3, (3-mo. CME Term SOFR + 0.66%), 5.61%, 06/15/33(b) | | | 404 | | | | 399,314 | |
SLM Private Education Loan Trust, Series 2010-C, Class A5, (1-mo. CME Term SOFR + 4.86%), 9.96%, 10/15/41(a)(b) | | | 11,012 | | | | 11,525,191 | |
| | | | | | | | |
| Security | | Par (000) | | | Value | |
|
Asset-Backed Securities (continued) | |
SMB Private Education Loan Trust | | | | | | | | |
Series 2015-B, Class B, 3.50%, 12/17/40(a) | | USD | 1,244 | | | $ | 1,226,910 | |
Series 2020-PTA, Class A2A, 1.60%, 09/15/54(a) | | | 8,637 | | | | 8,049,909 | |
Series 2020-PTA, Class B, 2.50%, 09/15/54(a) | | | 6,740 | | | | 5,815,263 | |
Series 2021-A, Class C, 2.99%, 01/15/53(a) | | | 6,521 | | | | 5,639,040 | |
Series 2021-C, Class B, 2.30%, 01/15/53(a) | | | 783 | | | | 747,363 | |
Series 2021-C, Class C, 3.00%, 01/15/53(a) | | | 465 | | | | 409,042 | |
Series 2024-A, Class A1B, (SOFR (30-day) + 1.45%), 6.79%, 03/15/56(a)(b) | | | 10,666 | | | | 10,731,356 | |
Series 2024-A, Class B, 5.88%, 03/15/56(a) | | | 10,533 | | | | 10,831,203 | |
Series 2024-C, Class A1B, (SOFR (30-day) + 1.10%), 6.44%, 06/17/52(a)(b) | | | 4,081 | | | | 4,048,331 | |
SoFi Personal Loan Trust | | | | | | | | |
Series 2023-1A, Class A, 6.00%, 11/12/30(a) | | | 10,046 | | | | 10,226,623 | |
Series 2024-1A, Class A, 6.06%, 02/12/31(a) | | | 11,065 | | | | 11,265,174 | |
Sound Point CLO II Ltd., Series 2013-1A, Class A1R, (3-mo. CME Term SOFR + 1.33%), 6.61%, 01/26/31(a)(b) | | | 450 | | | | 449,757 | |
Sound Point CLO XV Ltd., Series 2017-1A, Class BR, (3-mo. CME Term SOFR + 1.76%), 7.05%, 01/23/29(a)(b) | | | 20 | | | | 20,384 | |
Sound Point CLO XXII Ltd., Series 2019-1A, Class AR, (3-mo. CME Term SOFR + 1.34%), 6.62%, 01/20/32(a)(b) | | | 523 | | | | 524,540 | |
Soundview Home Loan Trust | | | | | | | | |
Series 2004-WMC1, Class M2, (1-mo. CME Term SOFR + 0.91%), 5.76%, 01/25/35(b) | | | 35 | | | | 29,134 | |
Series 2005-OPT3, Class M4, (1-mo. CME Term SOFR + 1.13%), 5.99%, 11/25/35(b) | | | 547 | | | | 426,430 | |
Series 2007-NS1, Class M1, (1-mo. CME Term SOFR + 0.46%), 5.32%, 01/25/37(b) | | | 778 | | | | 743,016 | |
Southwick Park CLO LLC | | | | | | | | |
Series 2019-4A, Class A1R, (3-mo. CME Term SOFR + 1.32%), 6.60%, 07/20/32(a)(b) | | | 550 | | | | 550,335 | |
Series 2019-4A, Class B1R, (3-mo. CME Term SOFR + 1.76%), 7.04%, 07/20/32(a)(b) | | | 370 | | | | 370,321 | |
SPLT | | | | | | | | |
Series 23-1, Class R1, 0.00%, 10/15/30(a)(e) | | | 178 | | | | 8,796,333 | |
Series 24-1, Class R1, 0.00%, 02/12/31(a)(e) | | | 162 | | | | 6,232,866 | |
St. Paul’s CLO XII DAC, Series 12X, Class B1, (3-mo. EURIBOR + 1.60%), 5.29%, 04/15/33(b)(f) | | EUR | 1,420 | | | | 1,575,135 | |
STAR Trust, Series 2021-SFR1, Class F, (1-mo. CME Term SOFR + 2.51%), 7.61%, 04/17/38(a)(b) | | USD | 1,030 | | | | 1,006,723 | |
Steele Creek CLO Ltd., Series 2017-1A, Class A, (3-mo. CME Term SOFR + 1.51%), 6.81%,
10/15/30(a)(b) | | | 1,826 | | | | 1,828,436 | |
Stewart Park CLO Ltd., Series 2015-1A, Class CR, (3-mo. CME Term SOFR + 2.06%), 7.36%, 01/15/30(a)(b) | | | 1,630 | | | | 1,633,914 | |
Stratus CLO Ltd., Series 2021-1A, Class SUB, 0.00%, 12/29/29(a)(b)(e) | | | 1,000 | | | | 2,130 | |
Structured Asset Securities Corp. Assistance Loan Trust, Series 2003-AL2, Class A, 3.36%, 01/25/31(a) | | | 56 | | | | 54,293 | |
| | |
C O N S O L I D A T E D S C H E D U L E S O F I N V E S T M E N T S | | 23 |
| | |
Consolidated Schedule of Investments (continued) September 30, 2024 | | BlackRock Total Return Fund (Percentages shown are based on Net Assets) |
| | | | | | | | |
| Security | | Par (000) | | | Value | |
|
Asset-Backed Securities (continued) | |
Structured Asset Securities Corp. Mortgage Loan Trust, Series 2007-GEL2, Class M1, (1-mo. CME Term SOFR + 1.16%), 6.02%, 05/25/37(a)(b) | | USD | 2,104 | | | $ | 1,655,079 | |
Subway Funding LLC, Series 2024-1A, Class A2II, 6.27%, 07/30/54(a) | | | 5,776 | | | | 5,964,999 | |
Sutton Park CLO DAC, Series 1X, Class BE, (3-mo. EURIBOR + 2.35%), 5.89%, 11/15/31(b)(f) | | EUR | 940 | | | | 1,047,675 | |
Sycamore Tree CLO Ltd., Series 2024-5A, Class B, (3-mo. CME Term SOFR + 2.25%), 7.57%, 04/20/36(a)(b) | | USD | 3,280 | | | | 3,293,528 | |
Symphony CLO 38 Ltd., Series 2023-38A, Class C1, (3-mo. CME Term SOFR + 2.90%), 8.18%, 04/24/36(a)(b) | | | 250 | | | | 252,577 | |
Symphony CLO 40 Ltd., Series 2023-40A, Class A1, (3-mo. CME Term SOFR + 1.64%), 6.94%, 01/14/34(a)(b) | | | 1,790 | | | | 1,792,345 | |
Symphony CLO XIX Ltd., Series 2018-19A, Class A, (3-mo. CME Term SOFR + 1.22%), 6.51%, 04/16/31(a)(b) | | | 197 | | | | 196,645 | |
Symphony CLO XVI Ltd., Series 2015-16A, Class ARR, (3-mo. CME Term SOFR + 1.20%), 6.50%, 10/15/31(a)(b) | | | 2,265 | | | | 2,266,243 | |
Symphony CLO XX Ltd., Series 2018-20A, Class BR2, (3-mo. CME Term SOFR + 1.55%), 6.84%, 01/16/32(a)(b) | | | 1,110 | | | | 1,108,346 | |
Symphony CLO XXI Ltd., Series 2019-21A, Class AR, (3-mo. CME Term SOFR + 1.32%), 6.62%, 07/15/32(a)(b) | | | 475 | | | | 475,542 | |
Symphony CLO XXIII Ltd. | | | | | | | | |
Series 2020-23A, Class BR, (3-mo. CME Term SOFR + 1.86%), 7.16%, 01/15/34(a)(b) | | | 500 | | | | 500,798 | |
Series 2020-23A, Class CR, (3-mo. CME Term SOFR + 2.26%), 7.56%, 01/15/34(a)(b) | | | 500 | | | | 501,425 | |
Series 2020-23A, Class ER, (3-mo. CME Term SOFR + 6.41%), 11.71%, 01/15/34(a)(b) | | | 250 | | | | 250,818 | |
Symphony CLO XXIV Ltd., Series 2020-24A, Class AR, (3-mo. CME Term SOFR + 1.20%), 6.48%, 01/23/32(a)(b) | | | 472 | | | | 472,014 | |
Symphony CLO XXVI Ltd., Series 2021-26A, Class AR, (3-mo. CME Term SOFR + 1.34%), 6.62%, 04/20/33(a)(b) | | | 2,230 | | | | 2,232,123 | |
TCI-Flatiron CLO Ltd., Series 2017-1A, Class AR, (3-mo. CME Term SOFR + 1.22%), 6.32%, 11/18/30(a)(b) | | | 1,263 | | | | 1,262,737 | |
Terwin Mortgage Trust, Series 2005-10HE, Class M5, (1-mo. CME Term SOFR + 1.13%), 5.99%, 06/25/36(b) | | | 357 | | | | 321,286 | |
Thayer Park CLO Ltd., Series 2017-1A, Class A1R, (3-mo. CME Term SOFR + 1.30%), 6.58%, 04/20/34(a)(b) | | | 550 | | | | 550,040 | |
TIAA CLO III Ltd., Series 2017-2A, Class A, (3-mo. CME Term SOFR + 1.41%), 6.70%, 01/16/31(a)(b) | | | 704 | | | | 704,578 | |
TICP CLO VI Ltd., Series 2016-6A, Class AR2, (3-mo. CME Term SOFR + 1.38%), 6.68%, 01/15/34(a)(b) | | | 4,870 | | | | 4,873,019 | |
| | | | | | | | |
| Security | | Par (000) | | | Value | |
|
Asset-Backed Securities (continued) | |
TICP CLO VII Ltd., Series 2017-7A, Class BR2, (3-mo. CME Term SOFR + 1.90%), 7.20%, 04/15/33(a)(b) | | USD | 4,165 | | | $ | 4,175,886 | |
TICP CLO VIII Ltd., Series 2017-8A, Class A2R, (3-mo. CME Term SOFR + 1.96%), 7.24%, 10/20/34(a)(b) | | | 2,450 | | | | 2,456,334 | |
TICP CLO X Ltd., Series 2018-10A, Class B, (3-mo. CME Term SOFR + 1.73%), 7.01%, 04/20/31(a)(b) | | | 680 | | | | 680,504 | |
TICP CLO XI Ltd. | | | | | | | | |
Series 2018-11A, Class AR, (3-mo. CME Term SOFR + 1.53%), 6.82%, 04/25/37(a)(b) | | | 750 | | | | 751,646 | |
Series 2018-11A, Class BR, (3-mo. CME Term SOFR + 2.05%), 7.34%, 04/25/37(a)(b) | | | 2,680 | | | | 2,700,863 | |
Series 2018-11A, Class DR, (3-mo. CME Term SOFR + 3.70%), 8.99%, 04/25/37(a)(b) | | | 250 | | | | 254,792 | |
TICP CLO XII Ltd., Series 2018-12A, Class AR, (3-mo. CME Term SOFR + 1.43%), 6.73%, 07/15/34(a)(b) | | | 500 | | | | 500,182 | |
TICP CLO XV Ltd., Series 2020-15A, Class B, (3-mo. CME Term SOFR + 1.96%), 7.24%, 04/20/33(a)(b) | | | 250 | | | | 250,877 | |
Tower Bridge Funding PLC | | | | | | | | |
Series 2024-3X, Class C, (1-day SONIA + 1.40%), 6.35%, 12/20/66(b)(f) | | GBP | 272 | | | | 364,201 | |
Series 2024-3X, Class D, (1-day SONIA + 1.90%), 6.85%, 12/20/66(b)(f) | | | 334 | | | | 447,453 | |
Trestles CLO III Ltd., Series 2020-3A, Class C, (3-mo. CME Term SOFR + 2.51%), 7.79%, 01/20/33(a)(b) | | USD | 750 | | | | 752,185 | |
Trestles CLO IV Ltd., Series 2021-4A, Class A, (3-mo. CME Term SOFR + 1.43%), 6.71%, 07/21/34(a)(b) | | | 9,420 | | | | 9,430,530 | |
Trestles CLO V Ltd., Series 2021-5A, Class A1, (3-mo. CME Term SOFR + 1.43%), 6.71%, 10/20/34(a)(b) | | | 6,950 | | | | 6,953,132 | |
Tricon American Homes Trust | | | | | | | | |
Series 2018-SFR1, Class E, 4.56%, 05/17/37(a) | | | 890 | | | | 883,626 | |
Series 2018-SFR1, Class F, 4.96%, 05/17/37(a) | | | 610 | | | | 606,390 | |
Series 2020-SFR1, Class D, 2.55%, 07/17/38(a) | | | 6,675 | | | | 6,406,653 | |
Tricon Residential Trust | | | | | | | | |
Series 2021-SFR1, Class F, 3.69%, 07/17/38(a) | | | 4,805 | | | | 4,529,596 | |
Series 2021-SFR1, Class G, 4.13%, 07/17/38(a) | | | 3,324 | | | | 3,109,607 | |
Trimaran Cavu Ltd. | | | | | | | | |
Series 2019-1A, Class A2, (3-mo. CME Term SOFR + 2.16%), 7.44%, 07/20/32(a)(b) | | | 250 | | | | 250,089 | |
Series 2019-1A, Class B, (3-mo. CME Term SOFR + 2.46%), 7.74%, 07/20/32(a)(b) | | | 750 | | | | 753,643 | |
Series 2019-1A, Class C1, (3-mo. CME Term SOFR + 3.41%), 8.69%, 07/20/32(a)(b) | | | 500 | | | | 500,045 | |
Series 2019-2A, Class C, (3-mo. CME Term SOFR + 4.98%), 10.26%, 11/26/32(a)(b) | | | 500 | | | | 497,530 | |
Series 2021-2A, Class D1, (3-mo. CME Term SOFR + 3.51%), 8.80%, 10/25/34(a)(b) | | | 250 | | | | 250,593 | |
| | |
| 24 | | 2 0 2 4 B L A C K R O C K A N N U A L F I N A N C I A L S T A T E M E N T S A N D A D D I T I O N A L I N F O R M A T I O N |
| | |
Consolidated Schedule of Investments (continued) September 30, 2024 | | BlackRock Total Return Fund (Percentages shown are based on Net Assets) |
| | | | | | | | |
| Security | | Par (000) | | | Value | |
|
Asset-Backed Securities (continued) | |
Trinitas CLO IV Ltd., Series 2016-4A, Class A2L2, (3-mo. CME Term SOFR + 1.66%), 6.94%, 10/18/31(a)(b) | | USD | 970 | | | $ | 970,974 | |
Trinitas CLO XIV Ltd., Series 2020-14A, Class BR, (3-mo. CME Term SOFR + 1.95%), 7.24%, 01/25/34(a)(b) | | | 3,460 | | | | 3,463,461 | |
Trinitas CLO XVIII Ltd., Series 2021-18A, Class A1, (3-mo. CME Term SOFR + 1.43%), 6.71%, 01/20/35(a)(b) | | | 250 | | | | 250,160 | |
Trinitas CLO XXVIII Ltd., Series 2024-28A, Class A1, (3-mo. CME Term SOFR + 1.55%), 6.88%, 04/25/37(a)(b) | | | 810 | | | | 812,097 | |
Vantage Data Centers Jersey Borrower Spv Ltd., Series 2024-1X, Class A2, 6.17%, 05/28/39(f) | | GBP | 2,561 | | | | 3,493,294 | |
Venture CLO Ltd., Series 2018-32A, Class A2A, (3-mo. CME Term SOFR + 1.33%), 6.61%, 07/18/31(a)(b) | | USD | 1,280 | | | | 1,280,599 | |
Verdelite Static CLO Ltd. | | | | | | | | |
Series 2024-1A, Class A, (3-mo. CME Term SOFR + 1.13%), 6.42%, 07/20/32(a)(b) | | | 2,410 | | | | 2,414,792 | |
Series 2024-1A, Class B, (3-mo. CME Term SOFR + 1.65%), 6.94%, 07/20/32(a)(b) | | | 210 | | | | 210,171 | |
VOLT CVI LLC, Series 2021-NP12, Class A1, 2.73%, 12/26/51(a)(c) | | | 3,918 | | | | 3,901,403 | |
Voya CLO Ltd. | | | | | | | | |
Series 2014-1A, Class AAR2, (3-mo. CME Term SOFR + 1.25%), 6.53%, 04/18/31(a)(b) | | | 2,825 | | | | 2,827,534 | |
Series 2014-4A, Class A1RA, (3-mo. CME Term SOFR + 1.36%), 6.66%, 07/14/31(a)(b) | | | 131 | | | | 131,692 | |
Series 2015-3A, Class A1R3, (3-mo. CME Term SOFR + 1.15%), 6.43%, 10/20/31(a)(b) | | | 216 | | | | 216,378 | |
Series 2016-1A, Class A1R, (3-mo. CME Term SOFR + 1.33%), 6.61%, 01/20/31(a)(b) | | | 1,178 | | | | 1,183,287 | |
Series 2017-1A, Class A1R, (3-mo. CME Term SOFR + 1.21%), 6.50%, 04/17/30(a)(b) | | | 157 | | | | 156,973 | |
Series 2017-3A, Class A1R, (3-mo. CME Term SOFR + 1.30%), 6.58%, 04/20/34(a)(b) | | | 2,178 | | | | 2,183,116 | |
Series 2018-1A, Class A1, (3-mo. CME Term SOFR + 1.21%), 6.49%, 04/19/31(a)(b) | | | 670 | | | | 672,810 | |
Series 2018-1A, Class A2, (3-mo. CME Term SOFR + 1.56%), 6.84%, 04/19/31(a)(b) | | | 250 | | | | 250,431 | |
Series 2019-1A, Class A1RR, (3-mo. CME Term SOFR + 1.37%), 10/15/37(a)(b)(d) | | | 3,620 | | | | 3,620,000 | |
Series 2019-1A, Class AR, (3-mo. CME Term SOFR + 1.32%), 6.62%, 04/15/31(a)(b) | | | 5,550 | | | | 5,572,388 | |
Series 2021-2A, Class B, (3-mo. CME Term SOFR + 1.86%), 7.14%, 10/20/34(a)(b) | | | 1,440 | | | | 1,444,432 | |
Voya Euro CLO II DAC, Series 2A, Class CR, (3-mo. EURIBOR + 2.15%), 5.84%, 07/15/35(a)(b) | | EUR | 750 | | | | 837,413 | |
Voya Euro CLO V DAC, Series 5A, Class B1, (3-mo. EURIBOR + 1.75%), 5.44%, 04/15/35(a)(b) | | | 1,970 | | | | 2,194,405 | |
| | | | | | | | |
| Security | | Par (000) | | | Value | |
|
Asset-Backed Securities (continued) | |
Washington Mutual Asset-Backed Certificates Trust | | | | | | | | |
Series 2006-HE4, Class 2A2, (1-mo. CME Term SOFR + 0.47%), 5.33%, 09/25/36(b) | | USD | 3,964 | | | $ | 1,070,460 | |
Series 2006-HE5, Class 1A, (1-mo. CME Term SOFR + 0.42%), 4.37%, 10/25/36(b) | | | 1,200 | | | | 906,189 | |
Series 2007-HE3, Class 2A3, (1-mo. CME Term SOFR + 0.35%), 5.21%, 05/25/37(b) | | | 882 | | | | 797,306 | |
Wellfleet CLO Ltd., Series 2017-3A, Class B, (3-mo. CME Term SOFR + 2.21%), 7.50%, 01/17/31(a)(b) | | | 750 | | | | 752,020 | |
Wellington Management CLO 1 Ltd., Series 2023-1A, Class A, (3-mo. CME Term SOFR + 1.80%), 7.08%, 10/20/36(a)(b) | | | 250 | | | | 251,704 | |
Whitebox CLO I Ltd. | | | | | | | | |
Series 2019-1A, Class A1RR, (3-mo. CME Term SOFR + 1.32%), 6.66%, 07/24/36(a)(b) | | | 7,213 | | | | 7,225,733 | |
Series 2019-1A, Class D1RR, (3-mo. CME Term SOFR + 3.10%), 8.44%, 07/24/36(a)(b) | | | 4,120 | | | | 4,167,410 | |
Series 2019-1A, Class ERR, (3-mo. CME Term SOFR + 5.75%), 11.09%, 07/24/36(a)(b) | | | 3,300 | | | | 3,307,435 | |
Whitebox CLO II Ltd. | | | | | | | | |
Series 2020-2A, Class BR, (3-mo. CME Term SOFR + 2.01%), 7.30%, 10/24/34(a)(b) | | | 1,850 | | | | 1,856,063 | |
Series 2020-2A, Class DR, (3-mo. CME Term SOFR + 3.61%), 8.90%, 10/24/34(a)(b) | | | 1,470 | | | | 1,452,084 | |
Whitebox CLO III Ltd. | | | | | | | | |
Series 2021-3A, Class A1, (3-mo. CME Term SOFR + 1.48%), 6.78%, 10/15/34(a)(b) | | | 840 | | | | 840,146 | |
Series 2021-3A, Class A1R, (3-mo. CME Term SOFR + 1.27%), 10/15/35(a)(b)(d) | | | 5,520 | | | | 5,520,000 | |
Series 2021-3A, Class D, (3-mo. CME Term SOFR + 3.61%), 8.91%, 10/15/34(a)(b) | | | 1,250 | | | | 1,234,663 | |
Series 2021-3A, Class DR, (3-mo. CME Term SOFR + 2.85%), 10/15/35(a)(b)(d) | | | 1,250 | | | | 1,250,000 | |
Series 2021-3A, Class E, (3-mo. CME Term SOFR + 7.11%), 12.41%, 10/15/34(a)(b) | | | 1,000 | | | | 998,389 | |
Series 2021-3A, Class ER, (3-mo. CME Term SOFR + 5.65%), 10/15/35(a)(b)(d) | | | 1,000 | | | | 1,000,000 | |
Wildwood Park CLO Ltd. | | | | | | | | |
Series 2024-1A, Class A, (3-mo. CME Term SOFR + 1.36%), 10/20/37(a)(b)(d) | | | 3,170 | | | | 3,166,046 | |
Series 2024-1A, Class E, (3-mo. CME Term SOFR + 5.75%), 10/20/37(a)(b)(d) | | | 900 | | | | 895,516 | |
Yale Mortgage Loan Trust, Series 2007-1, Class A, (1-mo. CME Term SOFR + 0.51%), 5.37%, 06/25/37(a)(b) | | | 2,023 | | | | 637,386 | |
| | | | | | | | |
| |
Total Asset-Backed Securities — 11.1%
(Cost: $2,275,464,407) | | | | 2,226,167,287 | |
| | | | | | | | |
| | |
| | | Shares | | | | |
|
Common Stocks | |
|
Aerospace & Defense — 0.0% | |
Astra Space, Inc., Class A(h) | | | 24,283 | | | | 12,141 | |
| | |
C O N S O L I D A T E D S C H E D U L E S O F I N V E S T M E N T S | | 25 |
| | |
Consolidated Schedule of Investments (continued) September 30, 2024 | | BlackRock Total Return Fund (Percentages shown are based on Net Assets) |
| | | | | | | | |
| Security | | Shares | | | Value | |
|
Aerospace & Defense (continued) | |
Space Exploration Technologies Corp., Class A (Acquired 08/21/23, cost $2,075,706)(g)(h)(i) | | | 25,626 | | | $ | 2,870,112 | |
Space Exploration Technologies Corp., Class C (Acquired 08/21/23, cost $2,227,824)(g)(h)(i) | | | 27,504 | | | | 3,080,448 | |
| | | | | | | | |
| | |
| | | | | | | 5,962,701 | |
|
| Banks — 0.1% | |
Citigroup, Inc. | | | 34,881 | | | | 2,183,551 | |
Comerica, Inc. | | | 6,357 | | | | 380,848 | |
First Citizens BancShares, Inc., Class A(j) | | | 1,684 | | | | 3,100,160 | |
First Horizon Corp. | | | 73,017 | | | | 1,133,954 | |
New York Community Bancorp, Inc. | | | 542,632 | | | | 6,093,757 | |
Texas Capital Bancshares, Inc.(h) | | | 9,190 | | | | 656,717 | |
| | | | | | | | |
| | |
| | | | | | | 13,548,987 | |
|
| Capital Markets — 0.0% | |
Crown PropTech Acquisitions(g)(h) | | | 147,660 | | | | 29,532 | |
Crown PropTech Acquisitions, Class A(h) | | | 85,597 | | | | 919,312 | |
Crown PropTech Founders Unvested(g)(h) | | | 74,897 | | | | 1 | |
| | | | | | | | |
| | |
| | | | | | | 948,845 | |
|
| Construction & Engineering — 0.0% | |
Centuri Holdings, Inc.(h)(j) | | | 19,375 | | | | 312,906 | |
| | | | | | | | |
|
| Consumer Staples Distribution & Retail — 0.0% | |
Albertsons Cos., Inc., Class A | | | 94,578 | | | | 1,747,802 | |
Kroger Co. (The) | | | 37,458 | | | | 2,146,343 | |
| | | | | | | | |
| | |
| | | | | | | 3,894,145 | |
|
| Diversified Telecommunication Services — 0.0% | |
Lumen Technologies, Inc.(h)(j) | | | 399,757 | | | | 2,838,275 | |
| | | | | | | | |
|
| Electrical Equipment — 0.0% | |
FreeWire Technologies, Inc.(g)(h) | | | 153 | | | | — | |
| | | | | | | | |
|
| Energy Equipment & Services — 0.0% | |
Halliburton Co. | | | 56,237 | | | | 1,633,685 | |
Transocean Ltd.(h) | | | 530,387 | | | | 2,254,145 | |
| | | | | | | | |
| | |
| | | | | | | 3,887,830 | |
|
| Entertainment — 0.0% | |
Lions Gate Entertainment Corp., Class A(h) | | | 114,665 | | | | 897,827 | |
Playstudios, Inc., Class A(h) | | | 457,322 | | | | 690,556 | |
Warner Bros Discovery, Inc., Class A(h) | | | 134,223 | | | | 1,107,340 | |
| | | | | | | | |
| | |
| | | | | | | 2,695,723 | |
|
| Financial Services — 0.1% | |
HNG Hospitality Offshore LP (Acquired 02/16/24, cost $13,871,000)(g)(h)(i) | | | 13,871,000 | | | | 13,871,000 | |
Melange Secondaries Partners, LP(k) | | | — | (l) | | | 500,790 | |
Rotor Acquisition Corp.(h) | | | 11,463 | | | | 20,518 | |
| | | | | | | | |
| | |
| | | | | | | 14,392,308 | |
|
| Health Care Providers & Services — 0.0% | |
Concentra Group Holdings Parent, Inc.(h) | | | 37,927 | | | | 848,048 | |
| | | | | | | | |
|
| Hotel & Resort REITs — 0.0% | |
DiamondRock Hospitality Co. | | | 82,729 | | | | 722,224 | |
Park Hotels & Resorts, Inc. | | | 44,333 | | | | 625,095 | |
Service Properties Trust | | | 196,054 | | | | 894,006 | |
Sunstone Hotel Investors, Inc. | | | 49,795 | | | | 513,885 | |
| | | | | | | | |
| | |
| | | | | | | 2,755,210 | |
|
| Hotels, Restaurants & Leisure — 0.1% | |
Boyd Gaming Corp. | | | 11,503 | | | | 743,669 | |
Caesars Entertainment, Inc.(h)(j) | | | 74,337 | | | | 3,102,827 | |
Genius Sports Ltd.(h) | | | 712,487 | | | | 5,585,898 | |
| | | | | | | | |
| Security | | Shares | | | Value | |
|
Hotels, Restaurants & Leisure (continued) | |
Golden Entertainment, Inc. | | | 20,575 | | | $ | 654,079 | |
Sonder Holdings, Inc., Class A(h) | | | 19,017 | | | | 88,998 | |
| | | | | | | | |
| | |
| | | | | | | 10,175,471 | |
|
| Household Durables — 0.0% | |
Landsea Homes Corp.(h) | | | 72,535 | | | | 895,807 | |
| | | | | | | | |
|
| Industrial REITs — 0.0% | |
Lineage, Inc. | | | 3,668 | | | | 287,498 | |
| | | | | | | | |
|
| Machinery — 0.0% | |
Sarcos Technology & Robotics Corp.(h) | | | 464,024 | | | | 830,603 | |
| | | | | | | | |
|
| Media — 0.0% | |
Altice U.S.A., Inc., Class A(h) | | | 195,440 | | | | 480,783 | |
AMC Networks, Inc., Class A(h) | | | 49,557 | | | | 430,650 | |
| | | | | | | | |
| | |
| | | | | | | 911,433 | |
|
| Metals & Mining — 0.1% | |
Algoma Steel Group, Inc. | | | 314,477 | | | | 3,217,100 | |
Constellium SE, Class A(h) | | | 192,747 | | | | 3,134,066 | |
First Quantum Minerals Ltd.(h) | | | 11,186 | | | | 152,515 | |
United States Steel Corp. | | | 271,257 | | | | 9,583,510 | |
| | | | | | | | |
| | |
| | | | | | | 16,087,191 | |
|
| Mortgage Real Estate Investment Trusts (REITs) — 0.1% | |
Blackstone Mortgage Trust, Inc., Class A(m) | | | 533,049 | | | | 10,133,261 | |
| | | | | | | | |
|
| Oil, Gas & Consumable Fuels — 0.1% | |
Cheniere Energy, Inc. | | | 10,277 | | | | 1,848,215 | |
Formentera Partners Fund II LP(g)(k) | | | — | (l) | | | 5,616,123 | |
Green Plains, Inc.(h) | | | 67,342 | | | | 911,811 | |
Kinder Morgan, Inc. | | | 44,086 | | | | 973,860 | |
| | | | | | | | |
| | |
| | | | | | | 9,350,009 | |
|
| Real Estate Management & Development — 0.0% | |
Forestar Group, Inc.(h) | | | 31,138 | | | | 1,007,937 | |
Opendoor Technologies, Inc., Class A(h)(j) | | | 575,955 | | | | 1,151,910 | |
| | | | | | | | |
| | |
| | | | | | | 2,159,847 | |
|
| Residential REITs — 0.0% | |
Invitation Homes, Inc. | | | 138,148 | | | | 4,871,098 | |
| | | | | | | | |
|
| Software — 0.0% | |
Avaya Holdings Corp. | | | 563 | | | | 3,659 | |
Latch, Inc.(h) | | | 411,849 | | | | 205,925 | |
| | | | | | | | |
| | |
| | | | | | | 209,584 | |
|
| Textiles, Apparel & Luxury Goods — 0.0% | |
Capri Holdings Ltd.(h) | | | 40,423 | | | | 1,715,552 | |
| | | | | | | | |
| |
Total Common Stocks — 0.6%
(Cost: $152,072,822) | | | 109,712,332 | |
| | | | | | | | |
| | |
| | | Par (000) | | | | |
|
| Corporate Bonds | |
|
| Aerospace & Defense — 0.9% | |
BAE Systems PLC | | | | | | | | |
3.40%, 04/15/30(a) | | USD | 13,977 | | | | 13,238,429 | |
1.90%, 02/15/31(a) | | | 3,530 | | | | 3,015,155 | |
5.25%, 03/26/31(a) | | | 3,612 | | | | 3,754,253 | |
Boeing Co. (The), 5.93%, 05/01/60 | | | 6,159 | | | | 5,899,507 | |
Huntington Ingalls Industries, Inc., 4.20%, 05/01/30 | | | 1,616 | | | | 1,589,121 | |
L3Harris Technologies, Inc. | | | | | | | | |
3.85%, 12/15/26 | | | 1,407 | | | | 1,397,454 | |
2.90%, 12/15/29 | | | 2,376 | | | | 2,214,315 | |
1.80%, 01/15/31 | | | 5,658 | | | | 4,817,045 | |
| | |
| 26 | | 2 0 2 4 B L A C K R O C K A N N U A L F I N A N C I A L S T A T E M E N T S A N D A D D I T I O N A L I N F O R M A T I O N |
| | |
Consolidated Schedule of Investments (continued) September 30, 2024 | | BlackRock Total Return Fund (Percentages shown are based on Net Assets) |
| | | | | | | | |
| Security | | Par (000) | | | Value | |
|
Aerospace & Defense (continued) | |
L3Harris Technologies, Inc.
5.25%, 06/01/31 | | USD | 9,214 | | | $ | 9,590,420 | |
5.40%, 07/31/33 | | | 21,030 | | | | 21,966,829 | |
5.35%, 06/01/34 | | | 14,315 | | | | 14,892,198 | |
4.85%, 04/27/35 | | | 2,194 | | | | 2,198,373 | |
Lockheed Martin Corp.
1.85%, 06/15/30 | | | 2,613 | | | | 2,313,776 | |
3.60%, 03/01/35 | | | 3,194 | | | | 2,973,073 | |
Series B, 6.15%, 09/01/36 | | | 854 | | | | 979,137 | |
Northrop Grumman Corp.
4.70%, 03/15/33 | | | 4,433 | | | | 4,499,265 | |
4.90%, 06/01/34 | | | 3,292 | | | | 3,365,804 | |
4.03%, 10/15/47 | | | 7,854 | | | | 6,757,048 | |
5.25%, 05/01/50 | | | 975 | | | | 996,016 | |
4.95%, 03/15/53 | | | 3,067 | | | | 3,000,154 | |
5.20%, 06/01/54 | | | 6,325 | | | | 6,440,203 | |
Raytheon Technologies Corp.
7.20%, 08/15/27 | | | 459 | | | | 494,515 | |
7.00%, 11/01/28 | | | 7,205 | | | | 7,882,437 | |
RTX Corp.
6.70%, 08/01/28 | | | 3,450 | | | | 3,742,644 | |
5.15%, 02/27/33 | | | 8,002 | | | | 8,319,047 | |
6.10%, 03/15/34 | | | 5,914 | | | | 6,528,926 | |
5.40%, 05/01/35 | | | 7,092 | | | | 7,491,249 | |
4.05%, 05/04/47 | | | 1,310 | | | | 1,113,122 | |
3.13%, 07/01/50 | | | 2,689 | | | | 1,926,255 | |
2.82%, 09/01/51 | | | 10,848 | | | | 7,256,780 | |
3.03%, 03/15/52 | | | 878 | | | | 613,565 | |
6.40%, 03/15/54 | | | 3,053 | | | | 3,604,702 | |
Sabena Technics SAS, 6.58%, 09/30/29 (Acquired 10/28/22, cost $6,453,325)(g)(i) | | EUR | 6,552 | | | | 7,293,013 | |
Textron, Inc., 3.00%, 06/01/30 | | USD | 2,146 | | | | 1,985,710 | |
| | | | | | | | |
| | |
| | | | | | | 174,149,540 | |
|
| Automobile Components — 0.0% | |
Tenneco, Inc., 8.00%, 11/17/28(a) | | | 2,722 | | | | 2,525,822 | |
| | | | | | | | |
|
| Automobiles — 0.0% | |
Aston Martin Capital Holdings Ltd., 10.00%, 03/31/29(a) | | | 1,973 | | | | 1,936,062 | |
Lightning eMotors, Inc., 7.50%, 05/15/24(a)(h)(n)(o) | | | 2,487 | | | | 24,870 | |
| | | | | | | | |
| | |
| | | | | | | 1,960,932 | |
|
| Banks — 2.8% | |
Associated Banc-Corp, 6.46%, 08/29/30 | | | 8,175 | | | | 8,404,331 | |
Banco Espirito Santo SA
2.63%, 05/08/17(f)(h)(o) | | EUR | 400 | | | | 124,673 | |
4.75%, 01/15/18(f)(h)(o) | | | 2,200 | | | | 685,700 | |
4.00%, 01/21/19(f)(h)(o) | | | 6,300 | | | | 1,963,597 | |
Bancolombia SA, 8.63%, 12/24/34 | | USD | 1,252 | | | | 1,332,128 | |
Bangkok Bank PCL | | | | | | | | |
5.50%, 09/21/33(a) | | | 333 | | | | 345,478 | |
3.73%, 09/25/34(f) | | | 600 | | | | 555,642 | |
Bank of America Corp.
3.42%, 12/20/28 | | | 2,127 | | | | 2,069,151 | |
5.82%, 09/15/29 | | | 42,168 | | | | 44,376,927 | |
1.92%, 10/24/31 | | | 8,252 | | | | 7,110,255 | |
2.69%, 04/22/32 | | | 3,071 | | | | 2,738,930 | |
2.97%, 02/04/33 | | | 1,364 | | | | 1,221,521 | |
5.47%, 01/23/35 | | | 23,566 | | | | 24,782,102 | |
2.68%, 06/19/41 | | | 5,642 | | | | 4,242,095 | |
3.95%, 01/23/49 | | | 296 | | | | 252,912 | |
| | | | | | | | |
| Security | | Par (000) | | | Value | |
|
Banks (continued) | |
Bank of America Corp.
4.33%, 03/15/50 | | | USD 8,627 | | | $ | 7,834,971 | |
4.08%, 03/20/51 | | | 2,633 | | | | 2,287,369 | |
2.97%, 07/21/52 | | | 2,633 | | | | 1,868,765 | |
Citigroup, Inc.
3.67%, 07/24/28 | | | 1,018 | | | | 999,866 | |
5.17%, 02/13/30 | | | 12,128 | | | | 12,458,377 | |
4.54%, 09/19/30 | | | 4,041 | | | | 4,045,686 | |
2.98%, 11/05/30 | | | 1,148 | | | | 1,068,343 | |
2.57%, 06/03/31 | | | 8,509 | | | | 7,657,361 | |
2.56%, 05/01/32 | | | 1,443 | | | | 1,268,285 | |
3.06%, 01/25/33 | | | 7,346 | | | | 6,561,219 | |
3.79%, 03/17/33 | | | 4,109 | | | | 3,849,149 | |
4.91%, 05/24/33 | | | 8,390 | | | | 8,456,819 | |
5.45%, 06/11/35 | | | 24,385 | | | | 25,433,925 | |
Series VAR, 3.07%, 02/24/28 | | | 19,531 | | | | 18,982,288 | |
Citizens Bank NA, 6.06%, 10/24/25 | | | 250 | | | | 249,996 | |
JPMorgan Chase & Co.
5.57%, 04/22/28 | | | 17,346 | | | | 17,884,925 | |
2.18%, 06/01/28 | | | 7,501 | | | | 7,112,851 | |
4.85%, 07/25/28 | | | 10,806 | | | | 10,994,439 | |
5.01%, 01/23/30 | | | 25,607 | | | | 26,262,623 | |
5.58%, 04/22/30 | | | 23,360 | | | | 24,518,431 | |
5.00%, 07/22/30 | | | 41,415 | | | | 42,583,969 | |
4.49%, 03/24/31 | | | 25,862 | | | | 26,000,661 | |
2.52%, 04/22/31 | | | 27,031 | | | | 24,552,517 | |
1.76%, 11/19/31 | | | 21,050 | | | | 18,094,213 | |
2.58%, 04/22/32 | | | 5,868 | | | | 5,233,287 | |
2.55%, 11/08/32 | | | 7,665 | | | | 6,742,471 | |
2.96%, 01/25/33 | | | 7,825 | | | | 7,041,750 | |
5.77%, 04/22/35 | | | 34,079 | | | | 36,724,133 | |
5.29%, 07/22/35 | | | 38,094 | | | | 39,729,518 | |
3.11%, 04/22/51 | | | 2,655 | | | | 1,961,640 | |
3.33%, 04/22/52 | | | 8,050 | | | | 6,205,824 | |
Lehman Brothers Holdings Capital Trust VII, 5.86%(g)(h)(o)(p) | | | 1,888 | | | | — | |
Texas Capital Bancshares, Inc., 4.00%, 05/06/31 | | | 2,000 | | | | 1,898,868 | |
Washington Mutual Escrow Bonds
0.00% (e)(g)(h)(o)(p) | | | 13,308 | | | | 1 | |
0.00% (e)(g)(h)(o)(p) | | | 11,911 | | | | 1 | |
0.00% (e)(g)(h)(o)(p) | | | 2,570 | | | | — | |
0.00% (e)(g)(h)(o)(p) | | | 3,115 | | | | — | |
Wells Fargo & Co.
4.15%, 01/24/29 | | | 5,058 | | | | 5,042,861 | |
5.57%, 07/25/29 | | | 1,508 | | | | 1,568,930 | |
5.20%, 01/23/30 | | | 898 | | | | 925,763 | |
2.57%, 02/11/31 | | | 3,223 | | | | 2,926,711 | |
5.50%, 01/23/35 | | | 30,250 | | | | 31,710,749 | |
3.07%, 04/30/41 | | | 1,400 | | | | 1,104,084 | |
5.01%, 04/04/51 | | | 3,910 | | | | 3,833,693 | |
4.61%, 04/25/53 | | | 10,050 | | | | 9,289,053 | |
| | | | | | | | |
| | |
| | | | | | | 563,171,827 | |
|
| Beverages — 0.1% | |
Coca-Cola Co. (The)
5.30%, 05/13/54 | | | 1,513 | | | | 1,611,559 | |
5.40%, 05/13/64 | | | 8,154 | | | | 8,727,201 | |
| | | | | | | | |
| | |
| | | | | | | 10,338,760 | |
|
| Biotechnology — 0.9% | |
AbbVie, Inc.
5.05%, 03/15/34 | | | 29,799 | | | | 31,125,625 | |
4.55%, 03/15/35 | | | 13,986 | | | | 13,989,470 | |
| | |
C O N S O L I D A T E D S C H E D U L E S O F I N V E S T M E N T S | | 27 |
| | |
Consolidated Schedule of Investments (continued) September 30, 2024 | | BlackRock Total Return Fund (Percentages shown are based on Net Assets) |
| | | | | | | | |
| Security | | Par (000) | | | Value | |
| | |
Biotechnology (continued) | | | | | | | | |
AbbVie, Inc. | | | | | | | | |
4.50%, 05/14/35 | | USD | 12,477 | | | $ | 12,437,052 | |
Amgen, Inc. | | | | | | | | |
4.05%, 08/18/29 | | | 14,285 | | | | 14,184,704 | |
2.45%, 02/21/30 | | | 9,275 | | | | 8,471,163 | |
5.25%, 03/02/30 | | | 41,481 | | | | 43,281,676 | |
3.35%, 02/22/32 | | | 3,281 | | | | 3,058,052 | |
4.40%, 02/22/62 | | | 1,171 | | | | 1,002,171 | |
5.75%, 03/02/63 | | | 24,798 | | | | 26,174,986 | |
Gilead Sciences, Inc. | | | | | | | | |
1.65%, 10/01/30 | | | 7,629 | | | | 6,586,812 | |
2.60%, 10/01/40 | | | 3,354 | | | | 2,510,310 | |
4.80%, 04/01/44 | | | 12,106 | | | | 11,694,340 | |
4.50%, 02/01/45 | | | 2,623 | | | | 2,428,873 | |
| | | | | | | | |
| | |
| | | | | | | 176,945,234 | |
| |
| Broadline Retail — 0.1% | | | | |
Amazon.com, Inc. | | | | | | | | |
2.50%, 06/03/50 | | | 1,512 | | | | 998,896 | |
3.95%, 04/13/52 | | | 5,100 | | | | 4,432,962 | |
4.25%, 08/22/57 | | | 1,112 | | | | 1,006,569 | |
3.25%, 05/12/61 | | | 2,895 | | | | 2,098,279 | |
4.10%, 04/13/62 | | | 18,748 | | | | 16,186,641 | |
| | | | | | | | |
| | |
| | | | | | | 24,723,347 | |
| |
| Building Products — 0.0% | | | | |
STL Holding Co. LLC, 8.75%, 02/15/29(a) | | | 1,232 | | | | 1,310,609 | |
| | | | | | | | |
| |
| Capital Markets — 3.3% | | | | |
Abu Dhabi Developmental Holding Co. PJSC, 10/02/54(a)(d) | | | 200 | | | | 197,500 | |
Credit Suisse AG | | | | | | | | |
2.95%, 04/09/25 | | | 2,485 | | | | 2,460,322 | |
7.50%, 02/15/28 | | | 4,094 | | | | 4,496,803 | |
Deutsche Bank AG, 3.74%, 01/07/33 | | | 4,018 | | | | 3,516,711 | |
Goldman Sachs Group, Inc. (The) | | | | | | | | |
1.43%, 03/09/27 | | | 16,045 | | | | 15,347,288 | |
1.54%, 09/10/27 | | | 13,590 | | | | 12,879,447 | |
1.95%, 10/21/27 | | | 986 | | | | 939,967 | |
2.64%, 02/24/28 | | | 6,357 | | | | 6,110,268 | |
3.62%, 03/15/28 | | | 21,232 | | | | 20,888,868 | |
3.69%, 06/05/28 | | | 6,551 | | | | 6,447,295 | |
3.81%, 04/23/29 | | | 8,784 | | | | 8,611,788 | |
4.22%, 05/01/29 | | | 10,776 | | | | 10,713,167 | |
6.48%, 10/24/29 | | | 18,026 | | | | 19,411,091 | |
5.73%, 04/25/30 | | | 20,136 | | | | 21,161,983 | |
5.05%, 07/23/30 | | | 43,472 | | | | 44,605,559 | |
1.99%, 01/27/32 | | | 10,832 | | | | 9,265,883 | |
2.62%, 04/22/32 | | | 29,138 | | | | 25,749,675 | |
2.38%, 07/21/32 | | | 18,636 | | | | 16,162,076 | |
2.65%, 10/21/32 | | | 41,466 | | | | 36,430,794 | |
3.10%, 02/24/33 | | | 1,667 | | | | 1,499,854 | |
5.85%, 04/25/35 | | | 7,302 | | | | 7,845,976 | |
5.33%, 07/23/35 | | | 45,250 | | | | 46,873,712 | |
4.41%, 04/23/39 | | | 2,633 | | | | 2,482,272 | |
6.25%, 02/01/41 | | | 1,316 | | | | 1,495,927 | |
3.44%, 02/24/43 | | | 3,246 | | | | 2,643,299 | |
4.75%, 10/21/45 | | | 4,190 | | | | 4,071,969 | |
Series VAR, 1.09%, 12/09/26 | | | 8,936 | | | | 8,571,260 | |
Intercontinental Exchange, Inc., 1.85%, 09/15/32 | | | 1,199 | | | | 990,453 | |
Lehman Brothers Holdings, Inc., 6.75%, 12/28/17(g)(h)(o) | | | 7,360 | | | | 1 | |
Moody’s Corp., 3.25%, 01/15/28 | | | 2,458 | | | | 2,402,802 | |
| | | | | | | | |
| Security | | Par (000) | | | Value | |
| | |
Capital Markets (continued) | | | | | | | | |
Morgan Stanley | | | | | | | | |
3.77%, 01/24/29 | | USD | 20,742 | | | $ | 20,400,394 | |
5.16%, 04/20/29 | | | 39,491 | | | | 40,591,249 | |
5.45%, 07/20/29 | | | 7,636 | | | | 7,934,554 | |
5.17%, 01/16/30 | | | 6,856 | | | | 7,067,493 | |
5.66%, 04/18/30 | | | 33,081 | | | | 34,798,415 | |
5.04%, 07/19/30 | | | 35,415 | | | | 36,393,394 | |
2.70%, 01/22/31 | | | 19,382 | | | | 17,751,807 | |
3.62%, 04/01/31 | | | 3,901 | | | | 3,745,606 | |
1.79%, 02/13/32 | | | 25,688 | | | | 21,744,221 | |
2.24%, 07/21/32 | | | 29,755 | | | | 25,617,250 | |
2.51%, 10/20/32 | | | 9,541 | | | | 8,328,308 | |
2.94%, 01/21/33 | | | 5,977 | | | | 5,338,936 | |
5.32%, 07/19/35 | | | 60,944 | | | | 63,285,640 | |
UBS AG | | | | | | | | |
7.95%, 01/09/25 | | | 7,051 | | | | 7,105,578 | |
3.70%, 02/21/25 | | | 9,905 | | | | 9,858,859 | |
5.00%, 07/09/27 | | | 1,186 | | | | 1,212,011 | |
UBS Group AG, 4.55%, 04/17/26 | | | 4,647 | | | | 4,658,687 | |
| | | | | | | | |
| | |
| | | | | | | 660,106,412 | |
| |
| Chemicals — 0.1% | | | | |
Braskem Idesa SAPI, 6.99%, 02/20/32(a) | | | 272 | | | | 214,200 | |
Braskem Netherlands Finance BV, 8.50%, 01/12/31(f) | | | 649 | | | | 688,556 | |
Ecolab, Inc., 2.13%, 08/15/50 | | | 3,280 | | | | 1,965,182 | |
Envalior Deutschland Gmbh, (6-mo. EURIBOR at 0.00% Floor + 9.50%), 12.66%, 04/01/31(b)(g) | | EUR | 10,203 | | | | 10,378,201 | |
Olympus Water U.S. Holding Corp. | | | | | | | | |
7.13%, 10/01/27(a) | | USD | 359 | | | | 366,391 | |
9.75%, 11/15/28(a) | | | 2,149 | | | | 2,293,540 | |
Pioneer Midco, 10.50%,
11/18/30(a)(g) | | | 7,666 | | | | 7,914,857 | |
| | | | | | | | |
| | |
| | | | | | | 23,820,927 | |
| |
| Commercial Services & Supplies — 0.1% | | | | |
Allied Universal Holdco LLC/Allied Universal Finance Corp., 9.75%, 07/15/27(a) | | | 866 | | | | 867,863 | |
Covanta Holding Corp., 4.88%, 12/01/29(a) | | | 585 | | | | 550,684 | |
Garda World Security Corp. | | | | | | | | |
9.50%, 11/01/27(a) | | | 736 | | | | 736,967 | |
7.75%, 02/15/28(a) | | | 377 | | | | 390,914 | |
Pitney Bowes, Inc., 6.88%, 03/15/27(a) | | | 6,925 | | | | 6,882,783 | |
| | | | | | | | |
| | |
| | | | | | | 9,429,211 | |
| |
| Communications Equipment — 0.0% | | | | |
CommScope Technologies LLC, 6.00%, 06/15/25(a) | | | 958 | | | | 926,865 | |
Juniper Networks, Inc., 5.95%, 03/15/41 | | | 1,008 | | | | 1,041,038 | |
Motorola Solutions, Inc. | | | | | | | | |
2.30%, 11/15/30 | | | 1,633 | | | | 1,440,756 | |
5.60%, 06/01/32 | | | 2,687 | | | | 2,840,945 | |
| | | | | | | | |
| | |
| | | | | | | 6,249,604 | |
| |
| Construction & Engineering — 0.0% | | | | |
China City Construction International Co. Ltd., 0.00%,
07/03/17(e)(f)(g)(h)(o) | | | CNH 340 | | | | — | |
GMR Hyderabad International Airport Ltd., 4.25%, 10/27/27(f) | | | USD 384 | | | | 368,280 | |
IHS Holding Ltd., 6.25%, 11/29/28(a) | | | 1,108 | | | | 1,034,595 | |
| | | | | | | | |
| | | | | | | 1,402,875 | |
| |
| Consumer Finance — 0.2% | | | | |
American Express Co. | | | | | | | | |
5.04%, 07/26/28 | | | 6,865 | | | | 7,014,169 | |
| | |
| 28 | | 2 0 2 4 B L A C K R O C K A N N U A L F I N A N C I A L S T A T E M E N T S A N D A D D I T I O N A L I N F O R M A T I O N |
| | |
Consolidated Schedule of Investments (continued) September 30, 2024 | | BlackRock Total Return Fund (Percentages shown are based on Net Assets) |
| | | | | | | | |
| Security | | Par (000) | | | Value | |
| | |
Consumer Finance (continued) | | | | | | | | |
American Express Co. | | | | | | | | |
5.28%, 07/26/35 | | USD | 6,000 | | | $ | 6,247,236 | |
General Motors Financial Co., Inc., 4.00%, 01/15/25 | | | 8,702 | | | | 8,670,537 | |
Toyota Motor Credit Corp. | | | | | | | | |
5.25%, 09/11/28 | | | 8,311 | | | | 8,659,540 | |
5.05%, 05/16/29 | | | 3,364 | | | | 3,489,864 | |
4.55%, 08/09/29 | | | 11,999 | | | | 12,191,730 | |
| | | | | | | | |
| | |
| | | | | | | 46,273,076 | |
| |
| Consumer Staples Distribution & Retail — 0.1% | | | | |
CK Hutchison International 23 Ltd. | | | | | | | | |
4.75%, 04/21/28(f) | | | 640 | | | | 647,597 | |
4.88%, 04/21/33(f) | | | 405 | | | | 408,418 | |
CVS Health Corp. | | | | | | | | |
4.78%, 03/25/38 | | | 7,864 | | | | 7,419,767 | |
6.13%, 09/15/39 | | | 1,843 | | | | 1,943,272 | |
4.13%, 04/01/40 | | | 3,030 | | | | 2,595,259 | |
6.00%, 06/01/44 | | | 3,846 | | | | 3,975,140 | |
4.25%, 04/01/50 | | | 2,462 | | | | 1,987,209 | |
| | | | | | | | |
| | |
| | | | | | | 18,976,662 | |
| |
| Containers & Packaging — 0.1% | | | | |
Ardagh Packaging Finance PLC/Ardagh Holdings U.S.A., Inc., 4.13%, 08/15/26(a) | | | 10,163 | | | | 9,161,385 | |
Berry Global, Inc., 1.65%, 01/15/27 | | | 3,945 | | | | 3,703,468 | |
Mauser Packaging Solutions Holding Co., 7.88%, 04/15/27(a) | | | 1,148 | | | | 1,186,088 | |
Trivium Packaging Finance BV | | | | | | | | |
5.50%, 08/15/26(a) | | | 942 | | | | 938,330 | |
8.50%, 08/15/27(a) | | | 708 | | | | 709,711 | |
| | | | | | | | |
| | |
| | | | | | | 15,698,982 | |
| |
| Diversified REITs — 1.7% | | | | |
American Tower Corp. | | | | | | | | |
3.95%, 03/15/29 | | | 1,687 | | | | 1,653,435 | |
2.90%, 01/15/30 | | | 1,063 | | | | 982,976 | |
1.88%, 10/15/30 | | | 4,000 | | | | 3,445,841 | |
2.70%, 04/15/31 | | | 5,298 | | | | 4,729,415 | |
4.05%, 03/15/32 | | | 3,246 | | | | 3,116,954 | |
Crown Castle International Corp., 3.30%, 07/01/30 | | | 3,383 | | | | 3,163,379 | |
Crown Castle, Inc. | | | | | | | | |
2.25%, 01/15/31 | | | 13,810 | | | | 11,974,932 | |
2.10%, 04/01/31 | | | 13,193 | | | | 11,284,573 | |
2.50%, 07/15/31 | | | 3,294 | | | | 2,866,836 | |
Equinix, Inc. | | | | | | | | |
2.15%, 07/15/30 | | | 12,058 | | | | 10,657,369 | |
2.50%, 05/15/31 | | | 16,550 | | | | 14,621,959 | |
3.90%, 04/15/32 | | | 14,223 | | | | 13,619,269 | |
GLP Capital LP/GLP Financing II, Inc. | | | | | | | | |
5.75%, 06/01/28 | | | 8,819 | | | | 9,052,527 | |
5.30%, 01/15/29 | | | 14,111 | | | | 14,350,713 | |
4.00%, 01/15/30 | | | 12,777 | | | | 12,200,159 | |
4.00%, 01/15/31 | | | 16,818 | | | | 15,765,642 | |
3.25%, 01/15/32 | | | 18,156 | | | | 16,061,693 | |
6.75%, 12/01/33 | | | 9,037 | | | | 9,940,745 | |
6.25%, 09/15/54 | | | 15,929 | | | | 16,832,381 | |
VICI Properties LP | | | | | | | | |
4.75%, 02/15/28 | | | 21,086 | | | | 21,167,434 | |
4.95%, 02/15/30 | | | 17,121 | | | | 17,222,339 | |
5.13%, 05/15/32 | | | 34,524 | | | | 34,664,306 | |
VICI Properties LP/VICI Note Co., Inc. | | | | | | | | |
4.50%, 09/01/26(a) | | | 4,363 | | | | 4,342,833 | |
| | | | | | | | |
| Security | | Par (000) | | | Value | |
| | |
Diversified REITs (continued) | | | | | | | | |
VICI Properties LP/VICI Note Co., Inc. | | | | | | | | |
4.25%, 12/01/26(a) | | USD | 19,217 | | | $ | 19,030,097 | |
5.75%, 02/01/27(a) | | | 11,285 | | | | 11,479,474 | |
3.75%, 02/15/27(a) | | | 11,680 | | | | 11,391,718 | |
4.50%, 01/15/28(a) | | | 6,647 | | | | 6,557,022 | |
3.88%, 02/15/29(a) | | | 12,680 | | | | 12,144,018 | |
4.63%, 12/01/29(a) | | | 17,907 | | | | 17,566,602 | |
4.13%, 08/15/30(a) | | | 15,858 | | | | 15,059,255 | |
| | | | | | | | |
| | |
| | | | | | | 346,945,896 | |
| |
| Diversified Telecommunication Services — 0.8% | | | | |
AT&T Inc. | | | | | | | | |
5.45%, 03/01/47 | | | 1,917 | | | | 1,946,868 | |
4.50%, 03/09/48 | | | 12,361 | | | | 10,960,190 | |
4.55%, 03/09/49 | | | 2,894 | | | | 2,611,277 | |
3.65%, 06/01/51 | | | 1,314 | | | | 1,007,613 | |
3.50%, 09/15/53 | | | 7,450 | | | | 5,473,320 | |
3.55%, 09/15/55 | | | 8,156 | | | | 5,965,580 | |
3.80%, 12/01/57 | | | 17,055 | | | | 12,912,926 | |
3.65%, 09/15/59 | | | 36,700 | | | | 26,627,912 | |
3.85%, 06/01/60 | | | 7,696 | | | | 5,827,054 | |
Colombia Telecomunicaciones SA ESP, 4.95%, 07/17/30(a) | | | 1,281 | | | | 1,087,441 | |
Connect Finco Sarl/Connect U.S. Finco LLC, 9.00%, 09/15/29(a) | | | 1,213 | | | | 1,173,863 | |
Digicel Intermediate Holdings Ltd./Digicel International Finance Ltd./Difl U.S., (12.00% PIK), 12.00%, 05/25/27(q) | | | 557 | | | | 560,371 | |
Digicel Midco Ltd./Difl U.S. II LLC, (10.50% PIK), 10.50%, 11/25/28(q) | | | 375 | | | | 343,155 | |
Frontier Florida LLC, Series E, 6.86%, 02/01/28 | | | 4,835 | | | | 5,010,490 | |
Frontier North, Inc., Series G, 6.73%, 02/15/28 | | | 1,500 | | | | 1,545,200 | |
Level 3 Financing, Inc. | | | | | | | | |
4.63%, 09/15/27(a) | | | 1,102 | | | | 970,608 | |
11.00%, 11/15/29(a) | | | 1,253 | | | | 1,387,544 | |
10.00%, 10/15/32(a) | | | 5,306 | | | | 5,067,626 | |
Verizon Communications, Inc. | | | | | | | | |
3.15%, 03/22/30 | | | 3,377 | | | | 3,182,289 | |
1.50%, 09/18/30 | | | 10,963 | | | | 9,406,029 | |
1.68%, 10/30/30 | | | 14,645 | | | | 12,527,564 | |
1.75%, 01/20/31 | | | 3,677 | | | | 3,136,801 | |
2.36%, 03/15/32 | | | 22,534 | | | | 19,413,969 | |
4.78%, 02/15/35(a) | | | 13,297 | | | | 13,277,905 | |
5.85%, 09/15/35 | | | 5,012 | | | | 5,408,932 | |
3.00%, 11/20/60 | | | 2,687 | | | | 1,734,191 | |
Zayo Group Holdings, Inc., 4.00%, 03/01/27(a) | | | 2,756 | | | | 2,465,085 | |
| | | | | | | | |
| | |
| | | | | | | 161,031,803 | |
| |
| Electric Utilities — 2.3% | | | | |
AEP Texas, Inc. | | | | | | | | |
4.70%, 05/15/32 | | | 2,554 | | | | 2,563,085 | |
5.40%, 06/01/33 | | | 2,146 | | | | 2,204,263 | |
3.80%, 10/01/47 | | | 2,473 | | | | 1,911,069 | |
3.45%, 05/15/51 | | | 2,926 | | | | 2,093,406 | |
Series H, 3.45%, 01/15/50 | | | 4,224 | | | | 3,060,997 | |
AEP Transmission Co. LLC | | | | | | | | |
3.75%, 12/01/47 | | | 4,846 | | | | 3,925,657 | |
3.80%, 06/15/49 | | | 2,302 | | | | 1,849,578 | |
3.15%, 09/15/49 | | | 3,515 | | | | 2,533,672 | |
2.75%, 08/15/51 | | | 5,279 | | | | 3,485,527 | |
5.40%, 03/15/53 | | | 966 | | | | 1,000,796 | |
Series M, 3.65%, 04/01/50 | | | 8,101 | | | | 6,393,349 | |
Series O, 4.50%, 06/15/52 | | | 4,902 | | | | 4,422,959 | |
AES Andes SA, 6.30%, 03/15/29(a) | | | 200 | | | | 207,260 | |
| | |
C O N S O L I D A T E D S C H E D U L E S O F I N V E S T M E N T S | | 29 |
| | |
Consolidated Schedule of Investments (continued) September 30, 2024 | | BlackRock Total Return Fund (Percentages shown are based on Net Assets) |
| | | | | | | | |
| Security | | Par (000) | | | Value | |
| | |
Electric Utilities (continued) | | | | | | | | |
Alabama Power Co. | | | | | | | | |
3.85%, 12/01/42 | | USD | 3,162 | | | $ | 2,713,198 | |
3.75%, 03/01/45 | | | 7,807 | | | | 6,498,659 | |
4.30%, 01/02/46 | | | 3,535 | | | | 3,138,239 | |
Baltimore Gas & Electric Co. | | | | | | | | |
3.75%, 08/15/47 | | | 2,943 | | | | 2,384,571 | |
3.20%, 09/15/49 | | | 6,001 | | | | 4,325,488 | |
4.55%, 06/01/52 | | | 3,693 | | | | 3,334,805 | |
Dominion Energy South Carolina, Inc., 6.25%, 10/15/53 | | | 1,735 | | | | 2,022,422 | |
Duke Energy Carolinas LLC | | | | | | | | |
3.75%, 06/01/45 | | | 2,487 | | | | 2,054,723 | |
3.70%, 12/01/47 | | | 5,364 | | | | 4,296,926 | |
3.95%, 03/15/48 | | | 2,643 | | | | 2,200,963 | |
3.20%, 08/15/49 | | | 4,688 | | | | 3,402,254 | |
3.55%, 03/15/52 | | | 3,193 | | | | 2,459,699 | |
5.35%, 01/15/53 | | | 5,519 | | | | 5,694,633 | |
5.40%, 01/15/54 | | | 1,411 | | | | 1,467,956 | |
Duke Energy Corp. | | | | | | | | |
3.95%, 08/15/47 | | | 3,057 | | | | 2,481,890 | |
5.00%, 08/15/52 | | | 4,645 | | | | 4,398,173 | |
Duke Energy Florida LLC | | | | | | | | |
1.75%, 06/15/30 | | | 2,371 | | | | 2,071,350 | |
4.20%, 07/15/48 | | | 2,168 | | | | 1,861,679 | |
3.00%, 12/15/51 | | | 8,639 | | | | 5,989,027 | |
5.95%, 11/15/52 | | | 7,577 | | | | 8,377,801 | |
Duke Energy Ohio, Inc., 5.65%, 04/01/53 | | | 1,496 | | | | 1,583,684 | |
Duke Energy Progress LLC | | | | | | | | |
3.70%, 10/15/46 | | | 6,073 | | | | 4,886,849 | |
2.50%, 08/15/50 | | | 5,236 | | | | 3,315,457 | |
4.00%, 04/01/52 | | | 4,209 | | | | 3,515,732 | |
5.35%, 03/15/53 | | | 6,297 | | | | 6,515,333 | |
Edison International | | | | | | | | |
4.95%, 04/15/25 | | | 1,764 | | | | 1,762,642 | |
5.75%, 06/15/27 | | | 9,121 | | | | 9,412,724 | |
4.13%, 03/15/28 | | | 5,223 | | | | 5,176,907 | |
5.25%, 11/15/28 | | | 7,304 | | | | 7,504,414 | |
5.45%, 06/15/29 | | | 2,094 | | | | 2,174,750 | |
6.95%, 11/15/29 | | | 7,875 | | | | 8,680,027 | |
Eesti Energia AS, 7.88%(f)(p) | | EUR | 1,525 | | | | 1,761,212 | |
FIEMEX Energia - Banco Actinver SA Institucion de Banca Multiple, 7.25%, 01/31/41(a) | | USD | 1,400 | | | | 1,454,250 | |
FirstEnergy Corp. | | | | | | | | |
2.05%, 03/01/25 | | | 667 | | | | 657,442 | |
Series B, 3.90%, 07/15/27 | | | 22,583 | | | | 22,348,417 | |
Series C, 4.85%, 07/15/47 | | | 11,029 | | | | 10,107,528 | |
Series C, 3.40%, 03/01/50 | | | 11,301 | | | | 8,281,593 | |
FirstEnergy Transmission LLC | | | | | | | | |
5.00%, 01/15/35(a) | | | 8,462 | | | | 8,591,730 | |
4.55%, 04/01/49(a) | | | 14,849 | | | | 13,355,963 | |
Florida Power & Light Co. | | | | | | | | |
3.70%, 12/01/47 | | | 5,039 | | | | 4,119,119 | |
3.95%, 03/01/48 | | | 4,868 | | | | 4,182,274 | |
3.99%, 03/01/49 | | | 6,574 | | | | 5,609,815 | |
3.15%, 10/01/49 | | | 5,732 | | | | 4,210,134 | |
2.88%, 12/04/51 | | | 5,940 | | | | 4,111,693 | |
Generacion Mediterranea SA/Central Termica Roca SA, 9.88%, 12/01/27(a) | | | 602 | | | | 527,642 | |
Georgia Power Co. | | | | | | | | |
4.70%, 05/15/32 | | | 11,371 | | | | 11,584,208 | |
5.13%, 05/15/52 | | | 5,540 | | | | 5,546,022 | |
India Green Power Holdings, 4.00%, 02/22/27(f) | | | 395 | | | | 376,157 | |
| | | | | | | | |
| Security | | Par (000) | | | Value | |
| | |
Electric Utilities (continued) | | | | | | | | |
Interstate Power & Light Co., 5.45%, 09/30/54 | | USD | 610 | | | $ | 630,761 | |
Johnsonville Aeroderivative Combustion Turbine Generation LLC, 10/01/54(d) | | | 6,583 | | | | 6,682,811 | |
MidAmerican Energy Co. | | | | | | | | |
3.65%, 08/01/48 | | | 3,347 | | | | 2,690,506 | |
3.15%, 04/15/50 | | | 5,300 | | | | 3,881,256 | |
5.85%, 09/15/54 | | | 3,351 | | | | 3,732,039 | |
5.30%, 02/01/55 | | | 1,354 | | | | 1,399,506 | |
Northern States Power Co. | | | | | | | | |
5.35%, 11/01/39 | | | 945 | | | | 992,108 | |
4.00%, 08/15/45 | | | 1,818 | | | | 1,560,747 | |
2.90%, 03/01/50 | | | 2,323 | | | | 1,624,432 | |
Ohio Power Co. | | | | | | | | |
2.60%, 04/01/30 | | | 5,619 | | | | 5,105,984 | |
4.00%, 06/01/49 | | | 6,106 | | | | 5,002,870 | |
Series R, 2.90%, 10/01/51 | | | 6,843 | | | | 4,497,676 | |
Pacific Gas & Electric Co. | | | | | | | | |
4.95%, 07/01/50 | | | 16,680 | | | | 15,168,255 | |
5.25%, 03/01/52 | | | 3,249 | | | | 3,079,162 | |
6.70%, 04/01/53 | | | 3,750 | | | | 4,291,867 | |
PECO Energy Co. | | | | | | | | |
3.05%, 03/15/51 | | | 3,661 | | | | 2,593,048 | |
2.85%, 09/15/51 | | | 7,028 | | | | 4,760,851 | |
4.60%, 05/15/52 | | | 4,361 | | | | 4,055,960 | |
PG&E Corp., 7.38%, 03/15/55 | | | 4,975 | | | | 5,218,144 | |
PPL Capital Funding, Inc., 5.25%, 09/01/34 | | | 930 | | | | 957,555 | |
Public Service Electric & Gas Co. | | | | | | | | |
2.05%, 08/01/50 | | | 2,273 | | | | 1,328,206 | |
3.00%, 03/01/51 | | | 1,443 | | | | 1,022,616 | |
5.13%, 03/15/53 | | | 2,575 | | | | 2,621,343 | |
San Diego Gas & Electric Co., Series RRR, 3.75%, 06/01/47 | | | 4,585 | | | | 3,732,511 | |
Sorik Marapi Geothermal Power PT, 7.75%, 08/05/31(a) | | | 349 | | | | 346,819 | |
Southern California Edison Co. | | | | | | | | |
5.65%, 10/01/28 | | | 4,923 | | | | 5,173,246 | |
5.15%, 06/01/29 | | | 6,201 | | | | 6,433,212 | |
2.25%, 06/01/30 | | | 7,483 | | | | 6,685,828 | |
5.45%, 06/01/31 | | | 4,029 | | | | 4,263,087 | |
2.75%, 02/01/32 | | | 1,434 | | | | 1,275,702 | |
5.95%, 11/01/32 | | | 3,777 | | | | 4,110,622 | |
6.00%, 01/15/34 | | | 2,548 | | | | 2,798,061 | |
5.20%, 06/01/34 | | | 3,115 | | | | 3,228,734 | |
Series 05-E, 5.35%, 07/15/35 | | | 3,142 | | | | 3,277,888 | |
Series A, 4.20%, 03/01/29 | | | 7,376 | | | | 7,350,381 | |
Series G, 2.50%, 06/01/31 | | | 5,708 | | | | 5,047,371 | |
Southern Co. (The) | | | | | | | | |
5.70%, 03/15/34 | | | 2,497 | | | | 2,680,072 | |
4.85%, 03/15/35 | | | 15,341 | | | | 15,464,659 | |
Trans-Allegheny Interstate Line Co., 3.85%, 06/01/25(a) | | | 13,300 | | | | 13,199,256 | |
Vistra Operations Co. LLC | | | | | | | | |
6.95%, 10/15/33(a) | | | 17,029 | | | | 19,198,426 | |
6.00%, 04/15/34(a) | | | 9,866 | | | | 10,543,419 | |
Wisconsin Electric Power Co., 5.05%, 10/01/54 | | | 1,560 | | | | 1,549,217 | |
| | | | | | | | |
| | |
| | | | | | | 467,436,006 | |
| |
| Electrical Equipment — 0.0% | | | | |
FreeWire Technologies, Inc., 6.00%, 02/20/28(g) | | | 9,320 | | | | 1 | |
| | | | | | | | |
| |
| Energy Equipment & Services — 0.0% | | | | |
New Generation Gas Bond, 0.00%, 09/30/29(a)(e) | | | 2,812 | | | | 2,770,246 | |
| | |
| 30 | | 2 0 2 4 B L A C K R O C K A N N U A L F I N A N C I A L S T A T E M E N T S A N D A D D I T I O N A L I N F O R M A T I O N |
| | |
Consolidated Schedule of Investments (continued) September 30, 2024 | | BlackRock Total Return Fund (Percentages shown are based on Net Assets) |
| | | | | | | | |
| Security | | Par (000) | | | Value | |
|
Energy Equipment & Services (continued) | |
Transocean, Inc., 8.25%, 05/15/29(a) | | USD | 1,674 | | | $ | 1,659,482 | |
Venture Global LNG, Inc., 9.00%(a)(p) | | | 2,663 | | | | 2,699,294 | |
| | | | | | | | |
| | | | | | | 7,129,022 | |
|
Financial Services — 0.5% | |
ABRA Global Finance, (6.00% Cash and 5.50% PIK), 11.50%, 03/02/28(a)(q) | | | 1,157 | | | | 1,227,647 | |
ASG Finance Designated Activity Co., 9.75%, 05/15/29(a) | | | 216 | | | | 216,000 | |
Avianca Midco 2 Ltd., 9.00%, 12/01/28(a) | | | 731 | | | | 727,417 | |
Azul Secured Finance LLP, 11.93%, 08/28/28(a) | | | 834 | | | | 806,895 | |
Champions Financing, Inc., 8.75%, 02/15/29(a) | | | 340 | | | | 346,308 | |
Clydesdale Acquisition Holdings, Inc., 8.75%, 04/15/30(a) | | | 1,306 | | | | 1,326,169 | |
CNH Industrial Capital LLC, 5.45%, 10/14/25 | | | 6,638 | | | | 6,700,222 | |
Glencore Funding LLC
5.40%, 05/08/28(a) | | | 3,794 | | | | 3,902,056 | |
2.50%, 09/01/30(a) | | | 10,464 | | | | 9,381,283 | |
6.38%, 10/06/30(a) | | | 12,611 | | | | 13,708,836 | |
2.85%, 04/27/31(a) | | | 6,464 | | | | 5,795,598 | |
2.63%, 09/23/31(a) | | | 3,830 | | | | 3,355,553 | |
Homes By West Bay LLC, 11.00%, 02/06/30(g) | | | 21,604 | | | | 22,090,090 | |
Lessen Senior Secured Notes, 10.00%, 01/05/28(a)(g) | | | 11,381 | | | | 10,627,598 | |
Magellan Capital Holdings Ltd., 8.38%, 07/08/29(f) | | | 838 | | | | 853,486 | |
Muthoot Finance Ltd., 7.13%, 02/14/28(a) | | | 234 | | | | 240,435 | |
Nationstar Mortgage Holdings, Inc. 6.00%, 01/15/27(a) | | | 307 | | | | 307,035 | |
5.50%, 08/15/28(a) | | | 1,394 | | | | 1,379,959 | |
5.13%, 12/15/30(a) | | | 1,219 | | | | 1,169,387 | |
5.75%, 11/15/31(a) | | | 601 | | | | 588,722 | |
Oceana Australian Fixed Income Trust 12.00%, 08/31/25(g) | | AUD | 2,009 | | | | 1,398,506 | |
12.50%, 08/31/26(g) | | | 3,013 | | | | 2,099,910 | |
12.50%, 08/31/27(g) | | | 5,022 | | | | 3,528,553 | |
PennyMac Financial Services, Inc., 7.88%, 12/15/29(a) | | USD | 613 | | | | 653,653 | |
Sun Country Airlines | | | | | | | | |
Series 2019-1B, 4.70%, 12/15/25(g) | | | 1,233 | | | | 1,210,009 | |
Series 2022-1A, 4.84%, 03/15/31(g) | | | 3,541 | | | | 3,488,330 | |
| | | | | | | | |
| | |
| | | | | | | 97,129,657 | |
|
Food Products — 0.0% | |
MHP Lux SA, 6.25%, 09/19/29(f) | | | 1,042 | | | | 791,920 | |
Pilgrim’s Pride Corp., 6.25%, 07/01/33 | | | 3,142 | | | | 3,333,539 | |
| | | | | | | | |
| | |
| | | | | | | 4,125,459 | |
|
Gas Utilities — 0.0% | |
ONE Gas, Inc., 5.10%, 04/01/29 | | | 2,857 | | | | 2,959,412 | |
Piedmont Natural Gas Co., Inc., 2.50%, 03/15/31 | | | 4,095 | | | | 3,613,260 | |
| | | | | | | | |
| | | | | | | 6,572,672 | |
|
Ground Transportation — 0.3% | |
Burlington Northern Santa Fe LLC 4.05%, 06/15/48 | | | 1,157 | | | | 1,008,772 | |
3.55%, 02/15/50 | | | 2,477 | | | | 1,977,011 | |
3.05%, 02/15/51 | | | 4,713 | | | | 3,396,035 | |
2.88%, 06/15/52 | | | 1,897 | | | | 1,308,012 | |
4.45%, 01/15/53 | | | 2,114 | | | | 1,958,943 | |
5.20%, 04/15/54 | | | 1,959 | | | | 2,025,024 | |
5.50%, 03/15/55 | | | 6,875 | | | | 7,415,427 | |
CSX Corp.
4.10%, 03/15/44 | | | 1,189 | | | | 1,057,926 | |
| | | | | | | | |
| Security | | Par (000) | | | Value | |
|
Ground Transportation (continued) | |
CSX Corp.
4.90%, 03/15/55 | | USD | 8,983 | | | $ | 8,827,355 | |
Norfolk Southern Corp.
4.05%, 08/15/52 | | | 3,208 | | | | 2,677,242 | |
3.70%, 03/15/53 | | | 5,911 | | | | 4,643,658 | |
5.35%, 08/01/54 | | | 2,462 | | | | 2,529,445 | |
3.16%, 05/15/55 | | | 6,817 | | | | 4,723,041 | |
Union Pacific Corp.
3.55%, 05/20/61 | | | 3,563 | | | | 2,638,917 | |
2.97%, 09/16/62 | | | 8,883 | | | | 5,739,113 | |
3.85%, 02/14/72 | | | 3,852 | | | | 2,991,186 | |
Union Pacific Railroad Co. Pass-Through Trust, Series 2014-1, 3.23%, 05/14/26 | | | 2,135 | | | | 2,095,890 | |
| | | | | | | | |
| | |
| | | | | | | 57,012,997 | |
|
Health Care Equipment & Supplies — 0.1% | |
Becton Dickinson & Co.
2.82%, 05/20/30 | | | 1,839 | | | | 1,696,639 | |
4.30%, 08/22/32 | | | 2,143 | | | | 2,104,766 | |
4.67%, 06/06/47 | | | 2,135 | | | | 1,984,602 | |
Solventum Corp.
5.45%, 02/25/27(a) | | | 6,189 | | | | 6,316,826 | |
6.00%, 05/15/64(a) | | | 7,367 | | | | 7,607,421 | |
Thermo Fisher Scientific, Inc.
4.98%, 08/10/30 | | | 1,951 | | | | 2,033,297 | |
4.95%, 11/21/32 | | | 6,554 | | | | 6,825,205 | |
| | | | | | | | |
| | |
| | | | | | | 28,568,756 | |
|
Health Care Providers & Services — 0.9% | |
Elevance Health, Inc.
4.38%, 12/01/47 | | | 3,403 | | | | 3,012,832 | |
3.60%, 03/15/51 | | | 5,340 | | | | 4,118,014 | |
6.10%, 10/15/52 | | | 3,245 | | | | 3,604,831 | |
HCA, Inc.
5.25%, 04/15/25 | | | 9,447 | | | | 9,457,900 | |
5.88%, 02/15/26 | | | 10,875 | | | | 10,989,102 | |
5.25%, 06/15/26 | | | 22,497 | | | | 22,662,621 | |
5.38%, 09/01/26 | | | 15,542 | | | | 15,710,271 | |
4.50%, 02/15/27 | | | 4,882 | | | | 4,888,211 | |
5.88%, 02/01/29 | | | 205 | | | | 214,847 | |
3.50%, 09/01/30 | | | 34,268 | | | | 32,293,321 | |
5.45%, 04/01/31 | | | 26,293 | | | | 27,394,743 | |
2.38%, 07/15/31 | | | 4,056 | | | | 3,506,754 | |
Humana, Inc.
5.88%, 03/01/33 | | | 3,836 | | | | 4,072,294 | |
5.95%, 03/15/34 | | | 4,241 | | | | 4,538,689 | |
Select Medical Corp., 6.25%, 08/15/26(a) | | | 2,271 | | | | 2,284,815 | |
UnitedHealth Group, Inc.
3.75%, 10/15/47 | | | 5,011 | | | | 4,112,838 | |
3.25%, 05/15/51 | | | 4,467 | | | | 3,308,942 | |
4.75%, 05/15/52 | | | 2,297 | | | | 2,190,430 | |
3.88%, 08/15/59 | | | 1,344 | | | | 1,071,944 | |
4.95%, 05/15/62 | | | 9,313 | | | | 9,008,029 | |
6.05%, 02/15/63 | | | 7,366 | | | | 8,339,467 | |
5.20%, 04/15/63 | | | 1,599 | | | | 1,600,486 | |
5.50%, 04/15/64 | | | 2,970 | | | | 3,105,505 | |
5.75%, 07/15/64 | | | 999 | | | | 1,078,427 | |
| | | | | | | | |
| | |
| | | | | | | 182,565,313 | |
|
Hotel & Resort REITs — 0.1% | |
Park Intermediate Holdings LLC/PK Domestic Property LLC/PK Finance Co-Issuer, 4.88%, 05/15/29(a) | | | 1,876 | | | | 1,820,229 | |
| | |
C O N S O L I D A T E D S C H E D U L E S O F I N V E S T M E N T S | | 31 |
| | |
Consolidated Schedule of Investments (continued) September 30, 2024 | | BlackRock Total Return Fund (Percentages shown are based on Net Assets) |
| | | | | | | | |
| Security | | Par (000) | | | Value | |
|
Hotel & Resort REITs (continued) | |
Service Properties Trust
5.50%, 12/15/27 | | USD | 397 | | | $ | 377,968 | |
8.38%, 06/15/29 | | | 5,709 | | | | 5,702,584 | |
8.88%, 06/15/32 | | | 6,194 | | | | 5,916,614 | |
XHR LP, 4.88%, 06/01/29(a) | | | 289 | | | | 277,003 | |
| | | | | | | | |
| | | | | | | 14,094,398 | |
|
Hotels, Restaurants & Leisure — 0.2% | |
Affinity Interactive, 6.88%, 12/15/27(a) | | | 1,122 | | | | 964,578 | |
Full House Resorts, Inc., 8.25%, 02/15/28(a) | | | 562 | | | | 562,832 | |
Grupo Posadas SAB de CV, 7.00%, 12/30/27(c)(f) | | | 1,274 | | | | 1,165,688 | |
HR Ottawa LP, 11.00%, 03/31/31(a) | | | 23,577 | | | | 25,857,938 | |
Melco Resorts Finance Ltd.
4.88%, 06/06/25(f) | | | 300 | | | | 296,906 | |
7.63%, 04/17/32(a) | | | 615 | | | | 633,219 | |
MGM China Holdings Ltd., 7.13%, 06/26/31(a) | | | 280 | | | | 288,576 | |
Midwest Gaming Borrower LLC/Midwest Gaming Finance Corp., 4.88%, 05/01/29(a) | | | 1,349 | | | | 1,293,922 | |
Minor International PCL, 2.70%(f)(p) | | | 500 | | | | 480,140 | |
REXLot Holdings Ltd., 4.50%,
04/17/19(f)(g)(h)(n)(o) | | HKD | 1,161 | | | | — | |
Sands China Ltd. | | | | | | | | |
5.13%, 08/08/25 | | USD | 400 | | | | 398,700 | |
5.40%, 08/08/28 | | | 300 | | | | 302,250 | |
Sonder Holdings, Inc. 10.00%, 12/31/24(g) | | | 1,324 | | | | 1,316,238 | |
(3-mo. CME Term SOFR at 1.00% Floor + 9.00%), 14.33%, 12/10/27(b)(g) | | | 9,903 | | | | 9,308,742 | |
Wynn Macau Ltd., 4.88%, 10/01/24(a) | | | 253 | | | | 253,000 | |
| | | | | | | | |
| | | | | | | 43,122,729 | |
|
Household Durables — 0.2% | |
Ashton Woods U.S.A. LLC/Ashton Woods Finance Co.
6.63%, 01/15/28(a) | | | 3,130 | | | | 3,158,214 | |
4.63%, 08/01/29(a) | | | 430 | | | | 412,774 | |
4.63%, 04/01/30(a) | | | 1,180 | | | | 1,130,547 | |
Beazer Homes U.S.A., Inc., 7.25%, 10/15/29 | | | 3,721 | | | | 3,820,346 | |
Brookfield Residential Properties, Inc./Brookfield Residential U.S. LLC, 5.00%, 06/15/29(a) | | | 742 | | | | 711,138 | |
Century Communities, Inc., 6.75%, 06/01/27 | | | 249 | | | | 251,391 | |
Landsea Homes Corp., 11.00%, 07/17/28(g) | | | 20,532 | | | | 22,431,210 | |
LG Electronics, Inc., 5.63%, 04/24/27(a) | | | 263 | | | | 269,680 | |
LGI Homes, Inc., 8.75%, 12/15/28(a) | | | 1,568 | | | | 1,679,196 | |
Mattamy Group Corp. | | | | | | | | |
5.25%, 12/15/27(a) | | | 1,074 | | | | 1,067,681 | |
4.63%, 03/01/30(a) | | | 1,691 | | | | 1,618,968 | |
Weekley Homes LLC/Weekley Finance Corp., 4.88%, 09/15/28(a) | | | 1,019 | | | | 992,167 | |
| | | | | | | | |
| | |
| | | | | | | 37,543,312 | |
|
Household Products — 0.0% | |
| | |
Colgate-Palmolive Co., 3.70%, 08/01/47 | | | 1,175 | | | | 1,009,487 | |
| | | | | | | | |
|
Independent Power and Renewable Electricity Producers — 0.1% | |
Algonquin Power & Utilities Corp., 5.37%, 06/15/26(c) | | | 2,280 | | | | 2,307,555 | |
Project Infinity, 5.00%, 09/13/27(a)(g) | | | 9,413 | | | | 9,577,728 | |
SCC Power PLC | | | | | | | | |
(8.00% Cash or 4.00% Cash and 4.00% PIK), 8.00%, 12/31/28(a)(q) | | | 2,692 | | | | 1,102,267 | |
(4.00% Cash or 4.00% PIK), 4.00%, 05/17/32(a)(q) | | | 2,054 | | | | 292,673 | |
| | | | | | | | |
| Security | | Par (000) | | | Value | |
|
Independent Power and Renewable Electricity Producers (continued) | |
Star Energy Geothermal Wayang Windu Ltd., 6.75%, 04/24/33(f) | | USD | 392 | | | $ | 399,209 | |
Stem, Inc., 0.50%, 12/01/28(a)(n) | | | 622 | | | | 172,606 | |
| | | | | | | | |
| | | | | | | 13,852,038 | |
| | |
Industrial Conglomerates — 0.1% | | | | | | | | |
Honeywell International, Inc. | | | | | | | | |
5.25%, 03/01/54 | | | 7,030 | | | | 7,332,039 | |
5.35%, 03/01/64 | | | 5,424 | | | | 5,716,631 | |
| | | | | | | | |
| | |
| | | | | | | 13,048,670 | |
| | |
Insurance — 0.1% | | | | | | | | |
Ambac Assurance Corp., 5.10%(a)(p) | | | 462 | | | | 642,462 | |
American International Group, Inc. | | | | | | | | |
4.75%, 04/01/48 | | | 1,107 | | | | 1,049,335 | |
4.38%, 06/30/50 | | | 2,263 | | | | 2,028,547 | |
FWD Group Holdings Ltd., 8.40%, 04/05/29(f) | | | 3,180 | | | | 3,344,978 | |
Marsh & McLennan Cos., Inc. | | | | | | | | |
4.90%, 03/15/49 | | | 1,039 | | | | 995,283 | |
6.25%, 11/01/52 | | | 1,793 | | | | 2,088,535 | |
5.70%, 09/15/53 | | | 6,452 | | | | 6,935,273 | |
| | |
5.45%, 03/15/54 | | | 2,592 | | | | 2,688,308 | |
| | | | | | | | |
| | |
| | | | | | | 19,772,721 | |
|
Interactive Media & Services — 0.2% | |
Meta Platforms, Inc. | | | | | | | | |
4.65%, 08/15/62 | | | 21,254 | | | | 19,788,168 | |
5.75%, 05/15/63 | | | 2,650 | | | | 2,904,726 | |
5.55%, 08/15/64 | | | 14,453 | | | | 15,436,812 | |
| | | | | | | | |
| | |
| | | | | | | 38,129,706 | |
|
IT Services — 0.2% | |
Gartner, Inc. | | | | | | | | |
4.50%, 07/01/28(a) | | | 2,095 | | | | 2,073,547 | |
3.63%, 06/15/29(a) | | | 22,532 | | | | 21,504,901 | |
Global Payments, Inc.
5.30%, 08/15/29 | | | 2,379 | | | | 2,445,397 | |
2.90%, 05/15/30 | | | 5,294 | | | | 4,821,886 | |
Mastercard, Inc. | | | | | | | | |
4.55%, 01/15/35 | | | 1,751 | | | | 1,758,988 | |
3.95%, 02/26/48 | | | 3,036 | | | | 2,639,691 | |
3.85%, 03/26/50 | | | 2,047 | | | | 1,731,137 | |
Visa, Inc., 4.30%, 12/14/45 | | | 6,812 | | | | 6,346,831 | |
| | | | | | | | |
| | |
| | | | | | | 43,322,378 | |
|
Life Sciences Tools & Services — 0.0% | |
Agilent Technologies, Inc., 2.10%, 06/04/30 | | | 2,238 | | | | 1,981,859 | |
| | | | | | | | |
|
Machinery — 0.0% | |
| | |
Caterpillar, Inc., 3.25%, 09/19/49 | | | 6,670 | | | | 5,122,426 | |
| | | | | | | | |
|
Media — 0.4% | |
AMC Networks, Inc. | | | | | | | | |
10.25%, 01/15/29(a) | | | 1,426 | | | | 1,465,429 | |
4.25%, 02/15/29 | | | 2,160 | | | | 1,562,198 | |
4.25%, 02/15/29(a)(n) | | | 1,097 | | | | 1,009,240 | |
Charter Communications Operating LLC/Charter Communications Operating Capital | | | | | | | | |
3.70%, 04/01/51 | | | 13,496 | | | | 8,615,680 | |
3.90%, 06/01/52 | | | 11,368 | | | | 7,453,366 | |
5.25%, 04/01/53 | | | 1,728 | | | | 1,412,037 | |
Comcast Corp. | | | | | | | | |
2.65%, 02/01/30 | | | 2,332 | | | | 2,158,018 | |
4.25%, 10/15/30 | | | 1,055 | | | | 1,053,205 | |
3.97%, 11/01/47 | | | 3,092 | | | | 2,583,549 | |
| | |
| 32 | | 2 0 2 4 B L A C K R O C K A N N U A L F I N A N C I A L S T A T E M E N T S A N D A D D I T I O N A L I N F O R M A T I O N |
| | |
Consolidated Schedule of Investments (continued) September 30, 2024 | | BlackRock Total Return Fund (Percentages shown are based on Net Assets) |
| | | | | | | | |
| Security | | Par (000) | | | Value | |
|
Media (continued) | |
Comcast Corp. | | | | | | | | |
2.80%, 01/15/51 | | USD | 10,250 | | | $ | 6,800,976 | |
2.65%, 08/15/62 | | | 6,215 | | | | 3,677,594 | |
2.99%, 11/01/63 | | | 23,678 | | | | 15,019,483 | |
CSC Holdings LLC | | | | | | | | |
5.50%, 04/15/27(a) | | | 3,346 | | | | 2,942,647 | |
11.25%, 05/15/28(a) | | | 773 | | | | 746,190 | |
11.75%, 01/31/29(a) | | | 1,731 | | | | 1,673,169 | |
DISH DBS Corp., 5.88%, 11/15/24 | | | 5,840 | | | | 5,806,190 | |
DISH Network Corp. | | | | | | | | |
0.00%, 12/15/25(e)(n) | | | 2,253 | | | | 1,948,982 | |
3.38%, 08/15/26(n) | | | 892 | | | | 715,701 | |
FactSet Research Systems, Inc., 3.45%, 03/01/32 | | | 887 | | | | 809,281 | |
Paramount Global | | | | | | | | |
3.38%, 02/15/28 | | | 1,247 | | | | 1,174,286 | |
5.85%, 09/01/43 | | | 3,623 | | | | 3,159,677 | |
5.25%, 04/01/44 | | | 4,000 | | | | 3,186,570 | |
4.90%, 08/15/44 | | | 1,052 | | | | 808,508 | |
4.60%, 01/15/45 | | | 1,518 | | | | 1,120,347 | |
| | | | | | | | |
| | |
| | | | | | | 76,902,323 | |
Metals & Mining — 0.1% | |
Anglo American Capital PLC | | | | | | | | |
2.25%, 03/17/28(a) | | | 1,071 | | | | 988,405 | |
5.63%, 04/01/30(a) | | | 8,265 | | | | 8,587,335 | |
5.75%, 04/05/34(a) | | | 2,106 | | | | 2,193,210 | |
4.75%, 03/16/52(a) | | | 2,254 | | | | 1,977,276 | |
Big River Steel LLC/BRS Finance Corp., 6.63%, 01/31/29(a) | | | 1,365 | | | | 1,382,892 | |
CSN Resources SA, 5.88%, 04/08/32(a) | | | 232 | | | | 197,084 | |
Metinvest BV, 7.65%, 10/01/27(f) | | | 263 | | | | 178,840 | |
Mineral Resources Ltd., 9.25%, 10/01/28(a) | | | 839 | | | | 893,358 | |
Periama Holdings LLC, 5.95%, 04/19/26(f) | | | 425 | | | | 424,070 | |
Samarco Mineracao SA, (9.00% PIK), 9.00%, 06/30/31(f)(q) | | | 2,928 | | | | 2,727,274 | |
Vale Overseas Ltd., 6.40%, 06/28/54 | | | 195 | | | | 204,789 | |
Vedanta Resources Finance II PLC, 10.88%, 09/17/29(a) | | | 4,524 | | | | 4,589,824 | |
Volcan Cia Minera SAA, 8.75%, 01/24/30(a) | | | 55 | | | | 47,430 | |
| | | | | | | | |
| | |
| | | | | | | 24,391,787 | |
|
Multi-Utilities — 0.1% | |
CenterPoint Energy Resources Corp., 4.40%, 07/01/32 | | | 3,066 | | | | 3,018,775 | |
NiSource, Inc. | | | | | | | | |
5.25%, 03/30/28 | | | 3,289 | | | | 3,387,938 | |
5.40%, 06/30/33 | | | 947 | | | | 985,411 | |
5.35%, 04/01/34 | | | 4,752 | | | | 4,933,565 | |
Virginia Electric & Power Co. | | | | | | | | |
4.60%, 12/01/48 | | | 2,212 | | | | 2,040,164 | |
5.45%, 04/01/53 | | | 3,762 | | | | 3,898,871 | |
5.55%, 08/15/54 | | | 2,077 | | | | 2,183,100 | |
| | | | | | | | |
| | |
| | | | | | | 20,447,824 | |
|
Oil, Gas & Consumable Fuels — 4.4% | |
3R Lux S.a.r.l, 9.75%, 02/05/31(a) | | | 1,793 | | | | 1,893,296 | |
Adnoc Murban Rsc Ltd., 5.13%, 09/11/54(a) | | | 200 | | | | 196,600 | |
Antero Resources Corp. | | | | | | | | |
7.63%, 02/01/29(a) | | | 17,187 | | | | 17,733,134 | |
5.38%, 03/01/30(a) | | | 11,157 | | | | 11,023,003 | |
Apache Corp. | | | | | | | | |
5.10%, 09/01/40 | | | 1,124 | | | | 999,299 | |
5.25%, 02/01/42 | | | 2,915 | | | | 2,613,426 | |
| | | | | | | | |
| Security | | Par (000) | | | Value | |
|
Oil, Gas & Consumable Fuels (continued) | |
Buckeye Partners LP | | | | | | | | |
4.35%, 10/15/24 | | USD | 828 | | | $ | 826,762 | |
4.13%, 03/01/25(a) | | | 415 | | | | 411,552 | |
California Resources Corp., 8.25%, 06/15/29(a) | | | 1,230 | | | | 1,253,466 | |
Calumet Specialty Products Partners | | | | | | | | |
LP/Calumet Finance Corp., 9.75%, 07/15/28(a) | | | 2,504 | | | | 2,461,069 | |
Cameron LNG LLC | | | | | | | | |
3.30%, 01/15/35(a) | | | 16,659 | | | | 14,376,758 | |
3.40%, 01/15/38(a) | | | 10,195 | | | | 8,717,417 | |
Cheniere Corpus Christi Holdings LLC | | | | | | | | |
5.13%, 06/30/27 | | | 20,263 | | | | 20,598,814 | |
2.74%, 12/31/39 | | | 24,454 | | | | 20,301,299 | |
Cheniere Energy Partners LP | | | | | | | | |
4.50%, 10/01/29 | | | 4,346 | | | | 4,286,575 | |
4.00%, 03/01/31 | | | 22,582 | | | | 21,371,347 | |
3.25%, 01/31/32 | | | 16,504 | | | | 14,758,149 | |
Cheniere Energy, Inc., 5.65%, 04/15/34(a) | | | 23,152 | | | | 23,953,291 | |
Chesapeake Energy Corp. | | | | | | | | |
6.63%, 08/15/20(g)(h)(o) | | | 623 | | | | — | |
6.13%, 02/15/21(g)(h)(o) | | | 9,090 | | | | 1 | |
5.38%, 06/15/21(g)(h)(o) | | | 425 | | | | — | |
Chevron U.S.A., Inc. | | | | | | | | |
5.25%, 11/15/43 | | | 3,131 | | | | 3,279,685 | |
2.34%, 08/12/50 | | | 1,585 | | | | 990,046 | |
Civitas Resources, Inc. | | | | | | | | |
5.00%, 10/15/26(a) | | | 1,980 | | | | 1,957,971 | |
8.38%, 07/01/28(a) | | | 1,810 | | | | 1,881,439 | |
Colgate Energy Partners III LLC, 5.88%, 07/01/29(a) | | | 796 | | | | 795,253 | |
ConocoPhillips Co. | | | | | | | | |
3.80%, 03/15/52 | | | 2,923 | | | | 2,343,870 | |
5.30%, 05/15/53 | | | 3,093 | | | | 3,125,842 | |
5.70%, 09/15/63 | | | 1,361 | | | | 1,451,553 | |
Crestwood Midstream Partners LP/Crestwood | | | | | |
Midstream Finance Corp., 7.38%, 02/01/31(a) | | | 33,998 | | | | 36,168,738 | |
Devon Energy Corp. | | | | | | | | |
5.85%, 12/15/25 | | | 1,567 | | | | 1,582,911 | |
5.25%, 10/15/27 | | | 6,792 | | | | 6,823,476 | |
5.88%, 06/15/28 | | | 5,499 | | | | 5,559,042 | |
Diamondback Energy, Inc. | | | | | | | | |
3.25%, 12/01/26 | | | 65,115 | | | | 63,727,490 | |
3.50%, 12/01/29 | | | 48,137 | | | | 45,783,410 | |
5.15%, 01/30/30 | | | 4,778 | | | | 4,902,084 | |
3.13%, 03/24/31 | | | 55,951 | | | | 51,008,689 | |
4.40%, 03/24/51 | | | 4,964 | | | | 4,118,976 | |
4.25%, 03/15/52 | | | 6,938 | | | | 5,624,242 | |
6.25%, 03/15/53 | | | 5,278 | | | | 5,654,237 | |
5.75%, 04/18/54 | | | 11,361 | | | | 11,448,153 | |
5.90%, 04/18/64 | | | 28,442 | | | | 28,667,891 | |
Earthstone Energy Holdings LLC, 8.00%, 04/15/27(a) | | | 2,171 | | | | 2,235,282 | |
EIG Pearl Holdings S.a.r.l, 4.39%, 11/30/46(a) | | | 262 | | | | 214,185 | |
Enbridge, Inc., 5.70%, 03/08/33 | | | 993 | | | | 1,046,572 | |
Energy Transfer LP | | | | | | | | |
5.25%, 04/15/29 | | | 3,358 | | | | 3,454,256 | |
6.10%, 02/15/42 | | | 2,093 | | | | 2,174,023 | |
5.15%, 02/01/43 | | | 1,970 | | | | 1,847,199 | |
5.30%, 04/15/47 | | | 1,423 | | | | 1,340,904 | |
5.40%, 10/01/47 | | | 3,874 | | | | 3,689,005 | |
6.25%, 04/15/49 | | | 968 | | | | 1,017,853 | |
| | |
C O N S O L I D A T E D S C H E D U L E S O F I N V E S T M E N T S | | 33 |
| | |
Consolidated Schedule of Investments (continued) September 30, 2024 | | BlackRock Total Return Fund (Percentages shown are based on Net Assets) |
| | | | | | | | |
| Security | | Par (000) | | | Value | |
|
Oil, Gas & Consumable Fuels (continued) | |
Energy Transfer LP | | | | | | | | |
5.00%, 05/15/50 | | USD | 13,336 | | | $ | 12,048,015 | |
5.95%, 05/15/54 | | | 1,974 | | | | 2,020,292 | |
6.05%, 09/01/54 | | | 10,482 | | | | 10,858,807 | |
EnLink Midstream LLC, 5.65%, 09/01/34 | | | 979 | | | | 1,011,574 | |
EQM Midstream Partners LP, 4.50%, 01/15/29(a) | | | 4,532 | | | | 4,433,529 | |
EQT Corp. | | | | | | | | |
3.13%, 05/15/26(a) | | | 12,370 | | | | 12,043,887 | |
3.90%, 10/01/27 | | | 18,903 | | | | 18,575,736 | |
5.70%, 04/01/28 | | | 11,674 | | | | 12,078,994 | |
5.00%, 01/15/29 | | | 19,822 | | | | 20,050,627 | |
7.00%, 02/01/30 | | | 15,749 | | | | 17,195,010 | |
3.63%, 05/15/31(a) | | | 19,840 | | | | 18,210,450 | |
5.75%, 02/01/34 | | | 15,871 | | | | 16,309,008 | |
Exxon Mobil Corp. | | | | | | | | |
4.23%, 03/19/40 | | | 2,743 | | | | 2,567,984 | |
3.57%, 03/06/45 | | | 2,035 | | | | 1,686,672 | |
3.10%, 08/16/49 | | | 1,380 | | | | 1,013,263 | |
3.45%, 04/15/51 | | | 16,421 | | | | 12,724,408 | |
Gran Tierra Energy, Inc., 9.50%, 10/15/29(a) | | | 1,750 | | | | 1,656,375 | |
Hess Corp. | | | | | | | | |
7.30%, 08/15/31 | | | 6,412 | | | | 7,342,615 | |
6.00%, 01/15/40 | | | 1,812 | | | | 1,953,614 | |
Kinder Morgan Energy Partners LP | | | | | | | | |
6.50%, 02/01/37 | | | 2,734 | | | | 2,981,322 | |
5.50%, 03/01/44 | | | 1,001 | | | | 984,377 | |
5.40%, 09/01/44 | | | 1,080 | | | | 1,044,305 | |
Kinder Morgan, Inc. | | | | | | | | |
5.20%, 06/01/33 | | | 1,985 | | | | 2,009,434 | |
5.05%, 02/15/46 | | | 1,045 | | | | 965,752 | |
MC Brazil Downstream Trading S.a.r.l | | | | | | | | |
7.25%, 06/30/31(a) | | | 894 | | | | 765,708 | |
7.25%, 06/30/31(f) | | | 224 | | | | 191,628 | |
Medco Maple Tree Pte Ltd., 8.96%, 04/27/29(a) | | | 877 | | | | 926,971 | |
NGPL PipeCo LLC, 3.25%, 07/15/31(a) | | | 18,873 | | | | 16,775,497 | |
Permian Resources Operating LLC, 7.00%, 01/15/32(a) | | | 939 | | | | 976,872 | |
Petroleos de Venezuela SA, 9.75%, 05/17/35(f)(h)(o) | | | 3,093 | | | | 355,695 | |
Pioneer Natural Resources Co. | | | | | | | | |
1.90%, 08/15/30 | | | 2,877 | | | | 2,522,347 | |
2.15%, 01/15/31 | | | 2,842 | | | | 2,496,698 | |
Pluspetrol Camisea SA/Pluspetrol Lote 56 SA, 6.24%, 07/03/36(a) | | | 205 | | | | 218,901 | |
Raizen Fuels Finance SA | | | | | | | | |
6.45%, 03/05/34(a) | | | 270 | | | | 283,878 | |
6.95%, 03/05/54(a) | | | 200 | | | | 213,540 | |
Sabine Pass Liquefaction LLC | | | | | | | | |
5.63%, 03/01/25 | | | 9,584 | | | | 9,592,814 | |
5.88%, 06/30/26 | | | 22,639 | | | | 23,008,826 | |
5.00%, 03/15/27 | | | 22,878 | | | | 23,174,951 | |
4.20%, 03/15/28 | | | 4,736 | | | | 4,711,009 | |
4.50%, 05/15/30 | | | 23,805 | | | | 23,741,857 | |
5.90%, 09/15/37 | | | 12,060 | | | | 12,719,308 | |
Saudi Arabian Oil Co., 5.88%, 07/17/64(a) | | | 264 | | | | 266,323 | |
Shelf Drilling Holdings Ltd., 9.63%, 04/15/29(a) | | | 4,841 | | | | 4,453,720 | |
SierraCol Energy Andina LLC, 6.00%, 06/15/28(f) | | | 248 | | | | 227,540 | |
Sitio Royalties Operating Partnership LP/Sitio Finance Corp., 7.88%, 11/01/28(a) | | | 1,352 | | | | 1,414,333 | |
| | | | | | | | |
| Security | | Par (000) | | | Value | |
|
Oil, Gas & Consumable Fuels (continued) | |
South Bow U.S.A. Infrastructure Holdings LLC | | | | | | | | |
4.91%, 09/01/27(a) | | USD | 5,115 | | | $ | 5,154,101 | |
5.03%, 10/01/29(a) | | | 3,075 | | | | 3,083,027 | |
Targa Resources Corp. | | | | | | | | |
4.20%, 02/01/33 | | | 8,132 | | | | 7,700,128 | |
5.50%, 02/15/35 | | | 1,600 | | | | 1,647,811 | |
Targa Resources Partners LP/Targa Resources Partners Finance Corp. | | | | | | | | |
5.00%, 01/15/28 | | | 10,538 | | | | 10,536,982 | |
5.50%, 03/01/30 | | | 5,400 | | | | 5,498,812 | |
4.88%, 02/01/31 | | | 16,562 | | | | 16,440,074 | |
4.00%, 01/15/32 | | | 12,224 | | | | 11,502,015 | |
Texas Eastern Transmission LP, 7.00%, 07/15/32 | | | 980 | | | | 1,110,297 | |
Transcontinental Gas Pipe Line Co. LLC, 7.85%, 02/01/26 | | | 958 | | | | 990,848 | |
Transocean Titan Financing Ltd., 8.38%, 02/01/28(a) | | | 674 | | | | 694,227 | |
Vantage Drilling International, 9.50%, 02/15/28(a) | | | 2,145 | | | | 2,158,880 | |
Viper Energy Partners LP, 5.38%, 11/01/27(a) | | | 32,192 | | | | 32,060,068 | |
Viper Energy, Inc., 7.38%, 11/01/31(a) | | | 11,860 | | | | 12,508,434 | |
Wildfire Intermediate Holdings LLC, 7.50%, 10/15/29(a) | | | 1,053 | | | | 1,036,207 | |
| | | | | | | | |
| | |
| | | | | | | 894,615,912 | |
|
Paper & Forest Products — 0.0% | |
LD Celulose International GmbH, 01/26/32(a)(d) | | | 200 | | | | 204,800 | |
Suzano Austria GmbH, 5.00%, 01/15/30 | | | 351 | | | | 349,333 | |
| | | | | | | | |
| | |
| | | | | | | 554,133 | |
|
Passenger Airlines — 0.1% | |
Air Baltic Corp. AS, 14.50%, 08/14/29(a) | | EUR | 448 | | | | 562,274 | |
Air Canada Pass-Through Trust, Series 2017-1, Class B, 3.70%, 01/15/26(a) | | USD | 10 | | | | 10,023 | |
Allegiant Travel Co., 7.25%, 08/15/27(a) | | | 1,070 | | | | 1,060,897 | |
American Airlines Pass-Through Trust, 3.50%, 06/15/26(g) | | | 3,187 | | | | 3,111,346 | |
Gol Finance SA, (1-mo. CME Term SOFR + 10.50%), 15.34%, 01/29/25(a)(b) | | | 919 | | | | 973,670 | |
Mileage Plus Holdings LLC/Mileage Plus Intellectual Property Assets Ltd., 6.50%, 06/20/27(a) | | | 1,353 | | | | 1,369,500 | |
Turkish Airlines Pass-Through Trust, Series 2015-1, Class A, 4.20%, 03/15/27(a) | | | 676 | | | | 637,895 | |
United Airlines Pass-Through Trust, Series 2024-1, A, 5.88%, 02/15/37 | | | 11,276 | | | | 11,616,751 | |
| | | | | | | | |
| | |
| | | | | | | 19,342,356 | |
|
Pharmaceuticals — 0.2% | |
Bristol-Myers Squibb Co. | | | | | | | | |
5.10%, 02/22/31 | | | 2,180 | | | | 2,282,706 | |
3.70%, 03/15/52 | | | 1,879 | | | | 1,492,840 | |
5.65%, 02/22/64 | | | 3,414 | | | | 3,617,883 | |
Eli Lilly & Co. | | | | | | | | |
4.88%, 02/27/53 | | | 1,446 | | | | 1,447,639 | |
4.15%, 03/15/59 | | | 1,109 | | | | 973,006 | |
5.20%, 08/14/64 | | | 1,001 | | | | 1,033,116 | |
Pfizer Investment Enterprises Pte Ltd. | | | | | | | | |
4.75%, 05/19/33 | | | 8,424 | | | | 8,586,567 | |
5.30%, 05/19/53 | | | 9,504 | | | | 9,831,354 | |
Pfizer, Inc.
4.20%, 09/15/48 | | | 1,101 | | | | 977,921 | |
| | |
| 34 | | 2 0 2 4 B L A C K R O C K A N N U A L F I N A N C I A L S T A T E M E N T S A N D A D D I T I O N A L I N F O R M A T I O N |
| | |
Consolidated Schedule of Investments (continued) September 30, 2024 | | BlackRock Total Return Fund (Percentages shown are based on Net Assets) |
| | | | | | | | |
| Security | | Par (000) | | | Value | |
|
Pharmaceuticals (continued) | |
Pfizer, Inc.
4.00%, 03/15/49 | | USD | 1,140 | | | $ | 989,299 | |
Takeda Pharmaceutical Co. Ltd., 2.05%, 03/31/30 | | | 17,795 | | | | 15,832,354 | |
| | | | | | | | |
| | |
| | | | | | | 47,064,685 | |
|
Real Estate Management & Development — 0.2% | |
Alpha Star Holding VIII Ltd., 8.38%, 04/12/27(f) | | | 906 | | | | 935,785 | |
Fantasia Holdings Group Co. Ltd. | | | | | | | | |
6.95%, 12/17/21(f)(h)(o) | | | 465 | | | | 6,975 | |
11.75%, 04/17/22(f)(h)(o) | | | 2,430 | | | | 36,450 | |
7.95%, 07/05/22(f)(h)(o) | | | 530 | | | | 7,950 | |
12.25%, 10/18/22(f)(h)(o) | | | 200 | | | | 3,000 | |
10.88%, 01/09/23(f)(h)(o) | | | 2,657 | | | | 39,855 | |
11.88%, 06/01/23(f)(h)(o) | | | 1,093 | | | | 15,029 | |
Five Point Operating Co. LP/Five Point Capital Corp., 10.50%, 01/15/28(a)(c) | | | 1,930 | | | | 1,974,943 | |
Forestar Group, Inc., 5.00%, 03/01/28(a) | | | 1,413 | | | | 1,376,286 | |
Freed Corp., 12.00%, 11/30/28(a)(g) | | | 28,679 | | | | 29,146,919 | |
Howard Hughes Corp. (The), 5.38%, 08/01/28(a) | | | 2,364 | | | | 2,329,267 | |
NNN REIT, Inc., 3.00%, 04/15/52 | | | 5,094 | | | | 3,371,646 | |
| | | | | | | | |
| | |
| | | | | | | 39,244,105 | |
|
Residential REITs — 0.0% | |
National Retail Properties, Inc., 3.50%, 04/15/51 | | | 7,070 | | | | 5,218,156 | |
| | | | | | | | |
|
Semiconductors & Semiconductor Equipment — 0.5% | |
Advanced Micro Devices, Inc., 4.39%, 06/01/52 | | | 7,754 | | | | 7,218,060 | |
AP Grange Holdings LLC, 6.50%, 03/20/45 (Acquired 09/20/24,
cost $12,457,598)(g)(i) | | | 12,458 | | | | 12,551,030 | |
Broadcom, Inc. | | | | | | | | |
5.05%, 07/12/29 | | | 10,245 | | | | 10,553,198 | |
4.30%, 11/15/32 | | | 5,558 | | | | 5,459,284 | |
3.42%, 04/15/33(a) | | | 1,741 | | | | 1,581,876 | |
3.47%, 04/15/34(a) | | | 7,168 | | | | 6,454,755 | |
3.14%, 11/15/35(a) | | | 8,602 | | | | 7,355,873 | |
3.19%, 11/15/36(a) | | | 11,914 | | | | 10,097,561 | |
Intel Corp. | | | | | | | | |
4.10%, 05/11/47 | | | 1,214 | | | | 956,931 | |
3.25%, 11/15/49 | | | 2,711 | | | | 1,823,566 | |
5.05%, 08/05/62 | | | 2,265 | | | | 1,993,028 | |
KLA Corp. | | | | | | | | |
4.65%, 07/15/32 | | | 2,444 | | | | 2,501,210 | |
4.70%, 02/01/34 | | | 2,264 | | | | 2,309,925 | |
5.00%, 03/15/49 | | | 2,871 | | | | 2,853,783 | |
3.30%, 03/01/50 | | | 6,646 | | | | 5,027,406 | |
Lam Research Corp., 3.13%, 06/15/60 | | | 1,675 | | | | 1,156,135 | |
NXP BV/NXP Funding LLC/NXP U.S.A., Inc. | | | | | | | | |
2.50%, 05/11/31 | | | 6,004 | | | | 5,238,850 | |
2.65%, 02/15/32 | | | 1,128 | | | | 978,743 | |
Texas Instruments, Inc. | | | | | | | | |
4.10%, 08/16/52 | | | 2,249 | | | | 1,947,476 | |
5.00%, 03/14/53 | | | 2,734 | | | | 2,755,426 | |
5.15%, 02/08/54 | | | 741 | | | | 761,343 | |
| | | | | | | | |
| | |
| | | | | | | 91,575,459 | |
|
Software — 0.4% | |
Cloud Software Group, Inc., 9.00%, 09/30/29(a) | | | 866 | | | | 881,250 | |
Dye & Durham Ltd., 8.63%, 04/15/29(a) | | | 1,193 | | | | 1,262,050 | |
GoTo Group, Inc. | | | | | | | | |
5.50%, 05/01/28(a) | | | 2,925 | | | | 2,250,554 | |
5.50%, 05/01/28(a) | | | 2,925 | | | | 885,058 | |
| | | | | | | | |
| Security | | Par (000) | | | Value | |
|
Software (continued) | |
Oracle Corp. | | | | | | | | |
5.38%, 07/15/40 | | USD | 1,049 | | | $ | 1,069,991 | |
4.00%, 07/15/46 | | | 9,450 | | | | 7,839,152 | |
3.60%, 04/01/50 | | | 21,039 | | | | 16,017,040 | |
3.95%, 03/25/51 | | | 24,948 | | | | 20,078,225 | |
6.90%, 11/09/52 | | | 1,707 | | | | 2,057,585 | |
5.55%, 02/06/53 | | | 958 | | | | 980,370 | |
3.85%, 04/01/60 | | | 9,037 | | | | 6,802,652 | |
5.50%, 09/27/64 | | | 8,747 | | | | 8,713,384 | |
Playtika Holding Corp., 4.25%, 03/15/29(a) | | | 349 | | | | 320,297 | |
Veritas U.S., Inc./Veritas Bermuda Ltd., 7.50%, 09/01/25(a) | | | 582 | | | | 545,997 | |
| | | | | | | | |
| | |
| | | | | | | 69,703,605 | |
|
Specialized REITs — 0.0% | |
Crown Castle, Inc., 3.10%, 11/15/29 | | | 4,308 | | | | 4,031,361 | |
Extra Space Storage LP, 5.50%, 07/01/30 | | | 4,343 | | | | 4,540,020 | |
| | | | | | | | |
| | |
| | | | | | | 8,571,381 | |
| | |
Specialty Retail — 0.2% | | | | | | | | |
Home Depot, Inc. (The) | | | | | | | | |
3.35%, 04/15/50 | | | 1,858 | | | | 1,428,104 | |
5.40%, 06/25/64 | | | 2,726 | | | | 2,886,247 | |
Lowe’s Cos., Inc. | | | | | | | | |
4.50%, 04/15/30 | | | 11,595 | | | | 11,744,172 | |
2.63%, 04/01/31 | | | 2,198 | | | | 1,975,258 | |
2.80%, 09/15/41 | | | 10,202 | | | | 7,490,889 | |
3.70%, 04/15/46 | | | 2,639 | | | | 2,099,030 | |
4.55%, 04/05/49 | | | 1,000 | | | | 890,228 | |
3.50%, 04/01/51 | | | 2,728 | | | | 2,016,467 | |
4.25%, 04/01/52 | | | 1,500 | | | | 1,269,971 | |
5.63%, 04/15/53 | | | 3,115 | | | | 3,242,306 | |
Wayfair LLC, 10/31/29(a)(d) | | | 485 | | | | 496,863 | |
| | | | | | | | |
| | |
| | | | | | | 35,539,535 | |
|
Technology Hardware, Storage & Peripherals — 0.2% | |
CA Magnum Holdings, 5.38%, 10/31/26(f) | | | 400 | | | | 394,356 | |
Dell International LLC/EMC Corp. | | | | | | | | |
6.02%, 06/15/26 | | | 9,674 | | | | 9,906,181 | |
4.90%, 10/01/26 | | | 20,250 | | | | 20,459,900 | |
EquipmentShare.com, Inc., 9.00%, 05/15/28(a) | | | 3,041 | | | | 3,175,634 | |
Hewlett Packard Enterprise Co. | | | | | | | | |
5.25%, 07/01/28 | | | 4,134 | | | | 4,262,287 | |
6.35%, 10/15/45 | | | 653 | | | | 717,040 | |
| | | | | | | | |
| | |
| | | | | | | 38,915,398 | |
|
Textiles, Apparel & Luxury Goods — 0.1% | |
NIKE, Inc. | | | | | | | | |
3.88%, 11/01/45 | | | 6,455 | | | | 5,627,288 | |
3.38%, 11/01/46 | | | 1,270 | | | | 1,015,152 | |
3.38%, 03/27/50 | | | 13,312 | | | | 10,498,121 | |
William Carter Co. (The), 5.63%, 03/15/27(a) | | | 105 | | | | 104,780 | |
| | | | | | | | |
| | |
| | | | | | | 17,245,341 | |
|
Tobacco — 0.5% | |
Altria Group, Inc. | | | | | | | | |
6.88%, 11/01/33 | | | 856 | | | | 966,823 | |
3.40%, 02/04/41 | | | 20,515 | | | | 15,992,618 | |
4.50%, 05/02/43 | | | 6,482 | | | | 5,733,269 | |
5.38%, 01/31/44 | | | 3,379 | | | | 3,411,693 | |
3.88%, 09/16/46 | | | 5,429 | | | | 4,239,664 | |
4.45%, 05/06/50 | | | 3,065 | | | | 2,568,174 | |
3.70%, 02/04/51 | | | 5,705 | | | | 4,210,190 | |
BAT Capital Corp. | | | | | | | | |
4.54%, 08/15/47 | | | 16,653 | | | | 14,066,203 | |
| | |
C O N S O L I D A T E D S C H E D U L E S O F I N V E S T M E N T S | | 35 |
| | |
Consolidated Schedule of Investments (continued) September 30, 2024 | | BlackRock Total Return Fund (Percentages shown are based on Net Assets) |
| | | | | | | | |
| Security | | Par (000) | | | Value | |
|
Tobacco (continued) | |
BAT Capital Corp. | | | | | | | | |
4.76%, 09/06/49 | | USD | 13,354 | | | $ | 11,523,896 | |
5.65%, 03/16/52 | | | 9,188 | | | | 8,968,451 | |
7.08%, 08/02/53 | | | 12,056 | | | | 13,991,009 | |
Reynolds American, Inc., 5.85%, 08/15/45 | | | 10,702 | | | | 10,706,974 | |
| | | | | | | | |
| | |
| | | | | | | 96,378,964 | |
|
Trading Companies & Distributors — 0.0% | |
GATX Corp., 6.05%, 06/05/54 | | | 2,064 | | | | 2,231,638 | |
| | | | | | | | |
|
Water Utilities — 0.0% | |
Thames Water Utilities Finance PLC, 4.00%, 06/19/25(f) | | GBP | 2,796 | | | | 2,877,034 | |
| | | | | | | | |
|
Wireless Telecommunication Services — 0.7% | |
Digicel Group Holdings Ltd., Series 2B14, 0.00%, 12/31/30(a)(e) | | USD | 596 | | | | 223,448 | |
Kenbourne Invest SA | | | | | | | | |
6.88%, 11/26/24(a)(h)(o) | | | 1,804 | | | | 1,082,400 | |
6.88%, 11/26/24(f)(h)(o) | | | 1,315 | | | | 789,000 | |
4.70%, 01/22/28(a)(h)(o) | | | 285 | | | | 171,000 | |
4.70%, 01/22/28(f)(h)(o) | | | 1,292 | | | | 775,200 | |
Rogers Communications, Inc., 5.30%, 02/15/34 | | | 11,735 | | | | 11,938,707 | |
Sprint LLC | | | | | | | | |
7.63%, 02/15/25 | | | 9,730 | | | | 9,760,552 | |
7.63%, 03/01/26 | | | 28,469 | | | | 29,407,054 | |
Sprint Spectrum Co. LLC/Sprint Spectrum Co. II LLC/Sprint Spectrum Co. III LLC, 5.15%, 03/20/28(a) | | | 245 | | | | 247,432 | |
T-Mobile U.S.A., Inc. | | | | | | | | |
3.88%, 04/15/30 | | | 49,780 | | | | 48,409,588 | |
5.05%, 07/15/33 | | | 14,601 | | | | 14,965,923 | |
5.75%, 01/15/34 | | | 7,406 | | | | 7,953,156 | |
5.15%, 04/15/34 | | | 955 | | | | 983,830 | |
VF Ukraine PAT via VFU Funding PLC, 6.20%, 02/11/25(f) | | | 506 | | | | 454,135 | |
Zegona Finance PLC, 8.63%, 07/15/29(a) | | | 2,523 | | | | 2,693,302 | |
| | | | | | | | |
| | |
| | | | | | | 129,854,727 | |
| | | | | | | | |
|
Total Corporate Bonds — 24.6% | |
(Cost: $4,823,781,694) | | | | | | | 4,947,275,489 | |
| | | | | | | | |
|
Fixed Rate Loan Interests | |
|
Chemicals — 0.0% | |
Vedanta Holdings Mauritius II Ltd., Term Loan, 18.00%, 04/17/26(g) | | | 4,749 | | | | 4,986,558 | |
|
Financial Services — 0.2% | |
Aspen Owner LLC, Term Loan (First Lien), 7.27%, 02/09/27(g) | | | 29,088 | | | | 29,447,378 | |
|
Real Estate Management & Development — 0.0% | |
OD Intermediate SUBI Holdco II LLC, Closing Date Advance, 10.00%, 04/01/26(g) | | | 2,901 | | | | 2,842,899 | |
| | | | | | | | |
| |
Total Fixed Rate Loan Interests — 0.2%
(Cost: $36,630,798) | | | | 37,276,835 | |
| | | | | | | | |
| | | | | | | | |
| Security | | Par (000) | | | Value | |
|
Floating Rate Loan Interests | |
|
Beverages — 0.0% | |
Naked Juice LLC, Initial Loan (Second Lien), (3-mo. CME Term SOFR at 0.50% Floor + 6.00%), 10.70%, 01/24/30(b) | | USD | 460 | | | $ | 279,031 | |
Triton Water Holdings, Inc., Initial Term Loan (First Lien), (3-mo. CME Term SOFR at 0.50% Floor + 3.25%), 8.12%, 03/31/28(b) | | | 975 | | | | 973,399 | |
| | | | | | | | |
| | |
| | | | | | | 1,252,430 | |
|
Building Products — 0.0% | |
Cornerstone Building Brands, Inc., Tranche B Term Loan, (1-mo. CME Term SOFR at 0.50% Floor + 3.25%), 8.45%, 04/12/28(b) | | | 983 | | | | 961,522 | |
| | | | | | | | |
|
Chemicals — 0.1% | |
Flexsys Holdings, Inc., Initial Term Loan (First Lien), (3-mo. CME Term SOFR at 0.75% Floor + 5.25%), 10.12%, 11/01/28(b) | | | 2,254 | | | | 1,892,131 | |
Level 3 Financing, Inc., Term Loan B-1, (1-mo. CME Term SOFR at 2.00% Floor + 6.56%), 11.41%, 04/15/29 | | | 540 | | | | 550,684 | |
Montage Hotels & Resorts LLC | | | | | | | | |
Revolver, (3-mo. LIBOR at 0.00% Floor + 0.00%), 6.00%, 02/16/29(g) | | | 343 | | | | 343,115 | |
Term Loan, (3-mo. LIBOR at 0.00% Floor + 0.00%), 12.00%, 02/16/29(g) | | | 6,176 | | | | 6,176,077 | |
Robertshaw U.S. Holding Corp., Fifth-Out Term Loan, (1-mo. CME Term SOFR at 1.00% Floor + 8.00%), 12.94%, 02/28/27(g) | | | 1,795 | | | | 17,950 | |
SCIH Salt Holdings, Inc., Incremental Term B-1 Loan (First Lien), (3-mo. CME Term SOFR at 0.75% Floor + 3.50%), 8.76%, 03/16/27(b) | | | 1,754 | | | | 1,751,958 | |
| | | | | | | | |
| | |
| | | | | | | 10,731,915 | |
|
Commercial Services & Supplies — 0.1% | |
Allied Universal Holdco LLC (FKA USAGM Holdco LLC), Initial U.S. Dollar Term Loan, (1-mo. CME Term SOFR at 0.50% Floor + 3.75%), 8.70%, 05/15/28(b) | | | 3,672 | | | | 3,634,924 | |
Alorica, Inc., Term Loan, (1-mo. CME Term SOFR at 1.00% Floor + 6.88%), 11.72%, 12/21/27(g) | | | 4,938 | | | | 4,857,764 | |
American Auto Auction Group LLC, Tranche B Term Loan (First Lien), (3-mo. CME Term SOFR at 0.75% Floor + 5.00%), 9.75%, 12/30/27(b) | | | 1,535 | | | | 1,539,889 | |
DRI Holding, Inc., Closing Date Term Loan (First Lien), (1-mo. CME Term SOFR at 0.50% Floor + 5.25%), 10.20%, 12/21/28 | | | 3,099 | | | | 2,990,101 | |
Interface Security Systems LLC, Initial Term Loan, (1-mo. CME Term SOFR at 1.75% Floor + 7.00%), 11.95%, 08/07/28(g) | | | 7,820 | | | | 3,753,644 | |
| | | | | | | | |
| | |
| | | | | | | 16,776,322 | |
|
Construction & Engineering — 0.0% | |
Helios Service Partners LLC | | | | | | | | |
First A&R Amendment Incremental Delayed Draw Term Loan, (3-mo. CME Term SOFR at 1.00% Floor + 6.50%), 1.00%, 03/19/27(g) | | | 1,049 | | | | 1,054,140 | |
First A&R Amendment Incremental Term Loan, (3-mo. CME Term SOFR at 1.00% Floor + 6.50%), 11.85%, 03/19/27(g) | | | 234 | | | | 235,105 | |
| | |
| 36 | | 2 0 2 4 B L A C K R O C K A N N U A L F I N A N C I A L S T A T E M E N T S A N D A D D I T I O N A L I N F O R M A T I O N |
| | |
Consolidated Schedule of Investments (continued) September 30, 2024 | | BlackRock Total Return Fund (Percentages shown are based on Net Assets) |
| | | | | | | | |
| Security | | Par (000) | | | Value | |
|
Construction & Engineering (continued) | |
Helios Service Partners LLC | | | | | | | | |
Second A&R Amendment Incremental Delayed Draw Term Loan, (3-mo. CME Term SOFR at 1.00% Floor + 6.25%), 9.80%, 03/19/27(g) | | USD | 1,890 | | | $ | 1,896,486 | |
Orion Group HoldCo LLC | | | | | | | | |
Delayed Draw Term Loan, (3-mo. CME Term SOFR at 1.00% Floor + 6.00%), 10.87%, 03/19/27(g) | | | 396 | | | | 394,181 | |
First Amendment Incremental Delayed Draw Term Loan, (3-mo. CME Term SOFR at 1.00% Floor + 6.00%), 10.87%, 03/19/27(g) | | | 2,344 | | | | 2,356,095 | |
First Amendment Incremental Term Loan, (3-mo. CME Term SOFR at 1.00% Floor + 6.00%), 10.87%, 03/19/27(g) | | | 201 | | | | 201,541 | |
Term Loan, (3-mo. CME Term SOFR at 1.00% Floor + 6.00%), 10.87%, 03/19/27(g) | | | 40 | | | | 39,377 | |
Third A&R Amendment Incremental Delayed Draw Term Loan, (3-mo. CME Term SOFR at 1.00% Floor + 6.00%), 12.82%, 03/19/27(g) | | | 1,244 | | | | 1,237,932 | |
| | | | | | | | |
| | |
| | | | | | | 7,414,857 | |
|
Diversified Telecommunication Services — 0.0% | |
Avaya, Inc., Initial Term Loan, (1-mo. CME Term SOFR at 1.00% Floor + 7.50%), 12.35%, 08/01/28(b) | | | 12 | | | | 10,813 | |
Connect Finco S.a.r.l., Amendment No. 4 Term Loan, (1-mo. CME Term SOFR at 0.50% Floor + 4.50%), 9.35%, 09/28/29(b) | | | 2,428 | | | | 2,271,756 | |
| | | | | | | | |
| | |
| | | | | | | 2,282,569 | |
|
Electronic Equipment, Instruments & Components — 0.0% | |
Emerald Technologies (U.S.) Acquisitionco, Inc., Term B Loan, (1-mo. CME Term SOFR at 1.00% Floor + 6.25%), 11.20%, 12/29/27(g) | | | 1,566 | | | | 1,252,530 | |
| | | | | | | | |
|
Financial Services — 0.2% | |
621 17th Street Operating Co. LLC (633 17th Street Operating Co. LLC), Loan, (1-mo. LIBOR at 0.00% Floor + 0.00%), 7.48%, 08/07/24(g) | | | 7,082 | | | | 81,751 | |
BSREP II Houston Office 1HC Owner LLC, Mezzanine Loan, (3-mo. CME Term SOFR at 0.00% Floor + 2.21%), 7.53%, 03/19/25(g) | | | 12,143 | | | | 5,342,531 | |
HLP Hotel LLC, Term Loan (First Lien), (1-mo. CME Term SOFR at 1.00% Floor + 3.55%), 8.87%, 09/09/26(g) | | | 12,200 | | | | 12,200,000 | |
HP LQ Investment LP, Term Loan (First Lien), (1-mo. CME Term SOFR at 0.00% Floor + 3.00%), 7.70%- 8.21%, 12/09/26(g) | | | 11,561 | | | | 11,526,716 | |
Woof Holdings, Inc., Initial Term Loan (First Lien), (3-mo. CME Term SOFR at 0.75% Floor + 3.75%), 8.62%, 12/21/27(b) | | | 799 | | | | 532,014 | |
| | | | | | | | |
| | |
| | | | | | | 29,683,012 | |
|
Food Products — 0.0% | |
BCPE North Star U.S. Holdco 2, Inc., Initial Term Loan (First Lien), (1-mo. CME Term SOFR at 0.75% Floor + 4.00%), 8.96%, 06/12/28(b) | | | 4,836 | | | | 4,568,482 | |
| | | | | | | | |
| | | | | | | | |
| Security | | Par (000) | | | Value | |
|
Health Care Providers & Services — 0.0% | |
Medical Solutions Holdings, Inc., Initial Term Loan (Second Lien), (3-mo. CME Term SOFR at 0.50% Floor + 7.00%), 12.35%, 11/01/29 | | USD | 1,587 | | | $ | 1,031,550 | |
| | | | | | | | |
|
Hotels, Restaurants & Leisure — 0.3% | |
Aimbridge Acquisition Co., Inc. | | | | | | | | |
2021 Term Loan (First Lien), (1-mo. CME Term SOFR at 0.00% Floor + 4.75%), 9.71%, 02/02/26 | | | 864 | | | | 843,188 | |
Initial Term Loan (2019) (First Lien), (1-mo. CME Term SOFR at 0.00% Floor + 3.75%), 8.71%, 02/02/26(b) | | | 1,647 | | | | 1,601,372 | |
Bally’s Corp., Term B Facility Loan, (3-mo. CME Term SOFR at 0.50% Floor + 3.25%), 8.79%, 10/02/28(b) | | | 11,499 | | | | 10,938,387 | |
CML Terranea Resort (AKA Long Point Development LLC), Refinancing Debt, (1-mo. CME Term SOFR at 0.00% Floor + 4.35%), 9.55%, 01/01/28(g) | | | 7,500 | | | | 7,515,956 | |
ECL Entertainment LLC, 2024 Refinancing Term B Loan, (1-mo. CME Term SOFR at 0.00% Floor + 4.00%), 8.85%, 08/30/30(b) | | | 5,718 | | | | 5,730,667 | |
Hilton Garden Inn Waikiki, Term Loan (First Lien), (1-mo. CME Term SOFR at 0.00% Floor + 3.50%), 8.70%, 05/31/29(g) | | | 14,800 | | | | 14,755,831 | |
HRNI Holdings LLC, Term B Loan, (1-mo. CME Term SOFR at 0.75% Floor + 4.25%), 9.20%, 12/11/28(b) | | | 7,957 | | | | 7,887,234 | |
Maverick Gaming LLC | | | | | | | | |
First Out Term Loan, (3-mo. CME Term SOFR at 1.00% Floor + 7.50%), 12.82%, 06/05/28(b) | | | 1,541 | | | | 1,463,720 | |
Second Out Term Loan, (3-mo. CME Term SOFR at 1.00% Floor + 7.50%), 12.82%, 06/05/28(b) | | | 2,371 | | | | 1,660,043 | |
Sodalite Tahoe Hotel LLC, Loan, (1-mo. CME Term SOFR at 0.00% Floor + 2.90%), 8.45%, 10/25/26(g) | | | 9,699 | | | | 9,538,136 | |
| | | | | | | | |
| | |
| | | | | | | 61,934,534 | |
|
Household Products — 0.0% | |
Conair Holdings LLC, Initial Term Loan (First Lien), (1-mo. CME Term SOFR at 0.50% Floor + 3.75%), 8.71%, 05/17/28(b) | | | 531 | | | | 484,736 | |
| | | | | | | | |
|
IT Services — 0.2% | |
CoreWeave Compute Acquisition Co. II LLC, Delayed Draw Loan, (3-mo. CME Term SOFR at 0.00% Floor + 9.62%), 14.93%, 07/31/28(g) | | | 15,404 | | | | 15,385,765 | |
CoreWeave Compute Acquisition Co. IV LLC, Delayed Draw Loan, (3-mo. CME Term SOFR at 0.00% Floor + 6.00%), 11.28%, 05/16/29(g) | | | 19,545 | | | | 19,251,825 | |
| | | | | | | | |
| | |
| | | | | | | 34,637,590 | |
|
Leisure Products — 0.0% | |
J & J Ventures Gaming LLC, Initial Term Loan, (1-mo. CME Term SOFR at 0.75% Floor + 4.00%), 8.96%, 04/26/28(b) | | | 1,875 | | | | 1,868,588 | |
| | | | | | | | |
| | |
C O N S O L I D A T E D S C H E D U L E S O F I N V E S T M E N T S | | 37 |
| | |
Consolidated Schedule of Investments (continued) September 30, 2024 | | BlackRock Total Return Fund (Percentages shown are based on Net Assets) |
| | | | | | | | |
| Security | | Par (000) | | | Value | |
|
Machinery — 0.0% | |
Hydrofarm Holdings Group, Inc., Term Loan, (1-mo. CME Term SOFR at 1.00% Floor + 5.50%), 10.46%, 10/25/28(g) | | USD | 2,189 | | | $ | 1,751,479 | |
| | | | | | | | |
|
Media — 0.0% | |
DirecTV Financing LLC, Closing Date Term Loan, (1-mo. CME Term SOFR at 0.75% Floor + 5.00%), 9.96%, 08/02/27(b) | | | 824 | | | | 822,988 | |
Gray Television, Inc., Term D Loan, (1-mo. CME Term SOFR at 0.00% Floor + 3.00%), 8.32%, 12/01/28(b) | | | 5 | | | | 4,477 | |
| | | | | | | | |
| | |
| | | | | | | 827,465 | |
|
Oil, Gas & Consumable Fuels — 0.0% | |
DT Midstream, Inc., Initial Term Loan, (1-mo. CME Term SOFR at 0.50% Floor + 2.00%), 7.22%, 06/12/28(b) | | | 734 | | | | 735,804 | |
Ecopetrol S.A., Loan, (6-mo. CME Term SOFR at 0.00% Floor + 4.75%), 9.37%, 09/06/30 | | | 2,850 | | | | 2,931,795 | |
NGP XI Midstream Holdings LLC, Initial Term Loan, (3-mo. CME Term SOFR at 0.00% Floor + 4.00%), 8.60%, 07/25/31(b)(g) | | | 1,359 | | | | 1,357,301 | |
| | | | | | | | |
| | |
| | | | | | | 5,024,900 | |
|
Passenger Airlines — 0.1% | |
Solaris Energy Infrastructure LLC, Term Loan, (1-mo. CME Term SOFR at 0.00% Floor + 6.00%), 11.10%, 09/11/29 | | | 10,822 | | | | 10,605,560 | |
Usavflow II Ltd., Term Loan, 6.50%, 08/16/29 | | | 2,040 | | | | 2,040,000 | |
| | | | | | | | |
| | |
| | | | | | | 12,645,560 | |
|
Personal Care Products — 0.0% | |
AI Mansart (Luxembourg) Bidco S.C.S., Facility A, (6-mo. CME Term SOFR at 0.00% Floor + 6.75%), 11.00%, 09/01/28(g) | | | 1,159 | | | | 1,159,080 | |
| | | | | | | | |
|
Professional Services — 0.0% | |
Vaco Holdings LLC, Initial Term Loan, (1-mo. CME Term SOFR at 0.75% Floor + 5.00%), 9.95%, 01/22/29(b) | | | 1,624 | | | | 1,590,207 | |
| | | | | | | | |
|
Software — 0.1% | |
ConnectWise LLC, Initial Term Loan, (3-mo. CME Term SOFR at 0.50% Floor + 3.50%), 8.37%, 09/29/28(b) | | | 451 | | | | 450,124 | |
EIS Group Ltd. | | | | | | | | |
Closing Date Term Loan, (1-mo. CME Term SOFR at 0.75% Floor + 7.00%), 11.85%, 07/10/28(g) | | | 12,826 | | | | 12,633,198 | |
Revolving Loan, (1-mo. CME Term SOFR at 0.75% Floor + 7.00%), 11.85%, 07/10/28(g) | | | 1,283 | | | | 1,263,320 | |
GoTo Group, Inc. | | | | | | | | |
Exchange First Out Term Loan, (1-mo. CME Term SOFR at 0.00% Floor + 4.75%), 9.97%, 04/28/28(b) | | | 507 | | | | 416,205 | |
Second Out Term Loan, (1-mo. CME Term SOFR at 0.00% Floor + 4.75%), 9.97%, 04/28/28(b) | | | 709 | | | | 238,350 | |
| | | | | | | | |
| | | | | | | 15,001,197 | |
| | | | | | | | |
| Security | | Par (000) | | | Value | |
|
Specialty Retail — 0.0% | |
Fanatics Commerce Intermediate Holdco LLC, Initial Term Loan, (1-mo. CME Term SOFR at 0.50% Floor + 3.25%), 8.21%, 11/24/28(b) | | USD | 655 | | | $ | 650,135 | |
Park River Holdings, Inc., Initial Term Loan (First Lien), (3-mo. CME Term SOFR at 0.75% Floor + 3.25%), 8.84%, 12/28/27(b) | | | 519 | | | | 509,889 | |
| | | | | | | | |
| | |
| | | | | | | 1,160,024 | |
|
Technology Hardware, Storage & Peripherals — 0.0% | |
Redstone Holdco 2 LP | | | | | | | | |
Initial Loan (Second Lien), (3-mo. CME Term SOFR at 0.75% Floor + 7.75%), 13.26%, 04/27/29(b) | | | 4,728 | | | | 3,427,800 | |
Initial Term Loan (First Lien), (3-mo. CME Term SOFR at 0.75% Floor + 4.75%), 10.26%, 04/27/28(b) | | | 4,319 | | | | 3,282,725 | |
| | | | | | | | |
| | |
| | | | | | | 6,710,525 | |
|
Transportation Infrastructure — 0.0% | |
Green Plains Operating Co. LLC, Loan, (3-mo. CME Term SOFR at 0.00% Floor + 8.00%), 13.60%, 07/20/26(g) | | | 5,592 | | | | 5,669,294 | |
| | | | | | | | |
| |
Total Floating Rate Loan Interests — 1.1%
(Cost: $251,781,925) | | | | 226,420,368 | |
| | | | | | | | |
|
Foreign Agency Obligations | |
|
Argentina — 0.0% | |
YPF SA | | | | | | | | |
6.95%, 07/21/27(f) | | | 651 | | | | 631,470 | |
9.50%, 01/17/31(a) | | | 1,965 | | | | 2,070,619 | |
| | | | | | | | |
| | |
| | | | | | | 2,702,089 | |
|
Colombia — 0.0% | |
Ecopetrol S.A. | | | | | | | | |
8.88%, 01/13/33 | | | 419 | | | | 448,833 | |
8.38%, 01/19/36 | | | 220 | | | | 224,400 | |
Oleoducto Central SA, 4.00%, 07/14/27(f) | | | 670 | | | | 640,855 | |
| | | | | | | | |
| | |
| | | | | | | 1,314,088 | |
|
India — 0.0% | |
Greenko Wind Projects Mauritius Ltd., 5.50%, 04/06/25(f) | | | 300 | | | | 298,687 | |
REC Ltd., 5.63%, 04/11/28(f) | | | 200 | | | | 205,438 | |
| | | | | | | | |
| | |
| | | | | | | 504,125 | |
|
Indonesia — 0.0% | |
Bank Negara Indonesia Persero Tbk PT, 3.75%, 03/30/26(f) | | | 420 | | | | 409,370 | |
Pertamina Geothermal Energy PT, 5.15%, 04/27/28(f) | | | 510 | | | | 518,765 | |
| | | | | | | | |
| | |
| | | | | | | 928,135 | |
|
Malaysia — 0.0% | |
Khazanah Global Sukuk Bhd, 4.69%, 06/01/28(f) | | | 895 | | | | 904,230 | |
| | | | | | | | |
|
Mexico — 0.1% | |
Petroleos Mexicanos | | | | | | | | |
3.63%, 11/24/25(f) | | EUR | 152 | | | | 165,498 | |
6.50%, 03/13/27 | | USD | 8,591 | | | | 8,414,884 | |
8.75%, 06/02/29 | | | 116 | | | | 117,977 | |
5.95%, 01/28/31 | | | 217 | | | | 187,249 | |
6.70%, 02/16/32 | | | 145 | | | | 129,652 | |
10.00%, 02/07/33 | | | 271 | | | | 286,691 | |
| | | | | | | | |
| | |
| | | | | | | 9,301,951 | |
| | |
| 38 | | 2 0 2 4 B L A C K R O C K A N N U A L F I N A N C I A L S T A T E M E N T S A N D A D D I T I O N A L I N F O R M A T I O N |
| | |
Consolidated Schedule of Investments (continued) September 30, 2024 | | BlackRock Total Return Fund (Percentages shown are based on Net Assets) |
| | | | | | | | |
| Security | | Par (000) | | | Value | |
|
Morocco — 0.0% | |
OCP SA
4.50%, 10/22/25(f) | | USD | 548 | | | $ | 541,013 | |
6.75%, 05/02/34(a) | | | 1,283 | | | | 1,375,017 | |
| | | | | | | | |
| | |
| | | | | | | 1,916,030 | |
|
Peru — 0.0% | |
Corp Financiera de Desarrollo SA, 4.75%, 07/15/25(f) | | | 319 | | | | 317,874 | |
| | | | | | | | |
|
Ukraine — 0.0% | |
NAK Naftogaz Ukraine via Kondor Finance PLC | | | | | | | | |
7.13%, 07/19/26(f)(q) | | EUR | 3,199 | | | | 2,670,564 | |
7.63%, 11/08/28(a) | | USD | 2,934 | | | | 2,391,210 | |
| | | | | | | | |
| | |
| | | | | | | 5,061,774 | |
|
United Arab Emirates — 0.0% | |
DAE Funding LLC, 2.63%, 03/20/25(f) | | | 260 | | | | 256,789 | |
MDGH GMTN RSC Ltd., 4.38%, 11/22/33(a) | | | 235 | | | | 231,548 | |
| | | | | | | | |
| | |
| | | | | | | 488,337 | |
| | | | | | | | |
| |
Total Foreign Agency Obligations — 0.1%
(Cost: $21,501,493) | | | | 23,438,633 | |
| | | | | | | | |
|
Foreign Government Obligations | |
|
Argentina — 0.0% | |
Republic of Argentina
1.00%, 07/09/29 | | | 333 | | | | 216,478 | |
4.13%, 07/09/35(c) | | | 628 | | | | 301,536 | |
5.00%, 01/09/38(c) | | | 383 | | | | 201,285 | |
3.50%, 07/09/41(c) | | | 609 | | | | 277,841 | |
| | | | | | | | |
| | |
| | | | | | | 997,140 | |
|
Belgium — 0.5% | |
Kingdom of Belgium, 3.30%, 06/22/54(a)(f) | | EUR | 83,681 | | | | 91,135,264 | |
| | | | | | | | |
|
Brazil — 1.0% | |
Brazil Notas do Tesouro Nacional
10.00%, 01/01/29 | | BRL | 139 | | | | 23,594,881 | |
10.00%, 01/01/33 | | | 101 | | | | 16,436,880 | |
10.00%, 01/01/35 | | | 677 | | | | 108,200,434 | |
Federative Republic of Brazil
6.13%, 03/15/34 | | USD | 49,260 | | | | 50,171,310 | |
7.13%, 05/13/54 | | | 300 | | | | 310,998 | |
| | | | | | | | |
| | |
| | | | | | | 198,714,503 | |
|
Cameroon — 0.0% | |
Republic of Cameroon, 9.50%, 07/31/31(f) | | | 1,192 | | | | 1,153,260 | |
| | | | | | | | |
|
Chile — 0.0% | |
Republic of Chile, 4.34%, 03/07/42 | | | 336 | | | | 306,264 | |
| | | | | | | | |
|
Colombia — 0.1% | |
Colombian TES
5.75%, 11/03/27 | | COP | 15,472,700 | | | | 3,386,379 | |
6.00%, 04/28/28 | | | 20,582,500 | | | | 4,445,359 | |
7.00%, 03/26/31 | | | 7,284,200 | | | | 1,525,828 | |
Republic of Colombia
8.00%, 04/20/33 | | USD | 340 | | | | 364,932 | |
8.00%, 11/14/35 | | | 2,665 | | | | 2,836,892 | |
4.13%, 05/15/51 | | | 708 | | | | 445,332 | |
| | | | | | | | |
| | |
| | | | | | | 13,004,722 | |
|
Costa Rica — 0.0% | |
Republic of Costa Rica, 6.55%, 04/03/34(f) | | | 266 | | | | 283,024 | |
| | | | | | | | |
|
Côte d’Ivoire — 0.0% | |
Republic of Cote d’Ivoire
6.38%, 03/03/28(f) | | | 200 | | | | 200,000 | |
| | | | | | | | |
| Security | | Par (000) | | | Value | |
|
Côte d’Ivoire (continued) | |
Republic of Cote d’Ivoire
5.25%, 03/22/30(f) | | EUR | 1,406 | | | $ | 1,490,747 | |
5.88%, 10/17/31(f) | | | 289 | | | | 304,811 | |
6.13%, 06/15/33(f) | | USD | 200 | | | | 188,250 | |
| | | | | | | | |
| | |
| | | | | | | 2,183,808 | |
|
Czechia — 0.0% | |
Czech Republic
2.75%, 07/23/29 | | CZK | 111,480 | | | | 4,778,729 | |
5.00%, 09/30/30 | | | 47,760 | | | | 2,281,350 | |
| | | | | | | | |
| | |
| | | | | | | 7,060,079 | |
|
Dominican Republic — 0.0% | |
Dominican Republic
5.95%, 01/25/27(f) | | USD | 331 | | | | 335,448 | |
4.50%, 01/30/30(a) | | | 244 | | | | 233,401 | |
7.05%, 02/03/31(a) | | | 360 | | | | 387,914 | |
4.88%, 09/23/32(a) | | | 159 | | | | 151,547 | |
10.75%, 06/01/36(a) | | DOP | 95,650 | | | | 1,687,757 | |
| | | | | | | | |
| | |
| | | | | | | 2,796,067 | |
|
Egypt — 0.0% | |
Arab Republic of Egypt
3.88%, 02/16/26(f) | | USD | 1,859 | | | | 1,785,802 | |
4.75%, 04/16/26(f) | | EUR | 2,643 | | | | 2,861,149 | |
5.80%, 09/30/27(f) | | USD | 904 | | | | 853,715 | |
5.63%, 04/16/30(f) | | EUR | 114 | | | | 106,198 | |
7.63%, 05/29/32(f) | | USD | 239 | | | | 211,515 | |
7.50%, 02/16/61(a) | | | 200 | | | | 144,876 | |
| | | | | | | | |
| | |
| | | | | | | 5,963,255 | |
|
France — 0.2% | |
French Republic, 3.00%,
05/25/54(a)(f) | | EUR | 42,887 | | | | 43,077,313 | |
| | | | | | | | |
|
Gabon — 0.0% | |
Gabonese Republic, 7.00%, 11/24/31(f) | | USD | 860 | | | | 661,125 | |
| | | | | | | | |
|
Guatemala — 0.0% | |
Republic of Guatemala
4.88%, 02/13/28(f) | | | 3,791 | | | | 3,730,581 | |
5.25%, 08/10/29(a) | | | 61 | | | | 60,207 | |
7.05%, 10/04/32(a) | | | 282 | | | | 304,560 | |
7.05%, 10/04/32(f) | | | 260 | | | | 280,800 | |
6.60%, 06/13/36(a) | | | 256 | | | | 267,904 | |
| | | | | | | | |
| | |
| | | | | | | 4,644,052 | |
|
Hungary — 0.0% | |
Hungarian People’s Republic
5.25%, 06/16/29(a) | | | 245 | | | | 248,459 | |
4.00%, 07/25/29(f) | | EUR | 5,660 | | | | 6,372,884 | |
5.38%, 09/12/33(f) | | | 322 | | | | 385,326 | |
| | | | | | | | |
| | |
| | | | | | | 7,006,669 | |
|
Indonesia — 0.1% | |
Republic of Indonesia
2.85%, 02/14/30 | | USD | 10,680 | | | | 9,955,042 | |
3.05%, 03/12/51 | | | 11,595 | | | | 8,449,856 | |
| | | | | | | | |
| | |
| | | | | | | 18,404,898 | |
|
Israel — 0.1% | |
State of Israel, 5.75%, 03/12/54 | | | 10,116 | | | | 9,626,006 | |
| | | | | | | | |
|
Japan — 0.3% | |
Japanese Government Bonds (30 Year), 1.80%, 03/20/54 | | JPY | 8,349,200 | | | | 54,380,029 | |
| | | | | | | | |
|
Mexico — 1.2% | |
Mexican Bonos
7.75%, 11/23/34 | | MXN | 16,408 | | | | 74,635,584 | |
| | |
C O N S O L I D A T E D S C H E D U L E S O F I N V E S T M E N T S | | 39 |
| | |
Consolidated Schedule of Investments (continued) September 30, 2024 | | BlackRock Total Return Fund (Percentages shown are based on Net Assets) |
| | | | | | | | |
| Security | | Par (000) | | | Value | |
|
Mexico (continued) | |
Mexican Bonos
8.00%, 11/07/47 | | MXN | 702 | | | $ | 3,007,557 | |
United Mexican States
3.75%, 01/11/28 | | USD | 200 | | | | 194,750 | |
8.50%, 03/01/29 | | MXN | 4,112 | | | | 20,363,693 | |
8.50%, 05/31/29 | | | 8,756 | | | | 43,375,765 | |
2.66%, 05/24/31 | | USD | 30,379 | | | | 26,059,410 | |
3.50%, 02/12/34 | | | 17,319 | | | | 14,721,150 | |
6.35%, 02/09/35 | | | 34,700 | | | | 36,365,600 | |
4.50%, 01/31/50 | | | 25,868 | | | | 20,557,041 | |
6.34%, 05/04/53 | | | 403 | | | | 400,607 | |
| | | | | | | | |
| | |
| | | | | | | 239,681,157 | |
|
Morocco — 0.0% | |
Kingdom of Morocco, 6.50%, 09/08/33(a) | | | 241 | | | | 261,259 | |
| | | | | | | | |
|
Nigeria — 0.0% | |
Republic of Nigeria
7.14%, 02/23/30(f) | | | 2,381 | | | | 2,161,502 | |
7.63%, 11/28/47(f) | | | 238 | | | | 182,144 | |
9.25%, 01/21/49(f) | | | 200 | | | | 181,187 | |
| | | | | | | | |
| | |
| | | | | | | 2,524,833 | |
|
North Macedonia — 0.0% | |
Republic of North Macedonia, 6.96%, 03/13/27(f) | | EUR | 131 | | | | 151,928 | |
| | | | | | | | |
|
Oman — 0.0% | |
Sultanate of Oman, 6.75%, 01/17/48(f) | | USD | 219 | | | | 237,341 | |
| | | | | | | | |
|
Panama — 0.1% | |
Republic of Panama
3.88%, 03/17/28 | | | 17,669 | | | | 17,006,413 | |
7.50%, 03/01/31 | | | 354 | | | | 386,922 | |
4.50%, 04/01/56 | | | 10,739 | | | | 7,712,535 | |
| | | | | | | | |
| | |
| | | | | | | 25,105,870 | |
|
Paraguay — 0.0% | |
Republic of Paraguay, 2.74%, 01/29/33(f) | | | 200 | | | | 170,375 | |
| | | | | | | | |
|
Peru — 0.1% | |
Republic of Peru
2.78%, 01/23/31 | | | 287 | | | | 256,148 | |
6.95%, 08/12/31(a) | | PEN | 16 | | | | 4,561,547 | |
1.86%, 12/01/32 | | USD | 478 | | | | 384,043 | |
7.60%, 08/12/39(a) | | PEN | 5 | | | | 1,451,306 | |
3.55%, 03/10/51 | | USD | 12,975 | | | | 9,842,835 | |
| | | | | | | | |
| | |
| | | | | | | 16,495,879 | |
|
Philippines — 0.1% | |
Republic of the Philippines
3.00%, 02/01/28 | | | 11,468 | | | | 11,048,701 | |
3.20%, 07/06/46 | | | 15,450 | | | | 11,758,686 | |
| | | | | | | | |
| | |
| | | | | | | 22,807,387 | |
|
Poland — 0.1% | |
Republic of Poland
5.75%, 04/25/29 | | PLN | 35,300 | | | | 9,459,189 | |
4.75%, 07/25/29 | | | 17,774 | | | | 4,558,657 | |
2.75%, 10/25/29 | | | 19,386 | | | | 4,562,232 | |
4.88%, 10/04/33 | | USD | 64 | | | | 64,959 | |
5.00%, 10/25/34 | | PLN | 12,281 | | | | 3,126,933 | |
2.00%, 08/25/36 | | | 4,149 | | | | 970,859 | |
5.50%, 04/04/53 | | USD | 283 | | | | 290,231 | |
| | | | | | | | |
| | |
| | | | | | | 23,033,060 | |
| | | | | | | | |
| Security | | Par (000) | | | Value | |
|
Romania — 0.0% | |
Romania | | | | | | | | |
5.25%, 11/25/27(a) | | USD | 32 | | | $ | 32,231 | |
2.13%, 03/07/28(f) | | EUR | 466 | | | | 487,863 | |
2.50%, 02/08/30(f) | | | 73 | | | | 73,248 | |
2.12%, 07/16/31(f) | | | 86 | | | | 80,355 | |
| | | | | | | | |
| | |
| | | | | | | 673,697 | |
|
Saudi Arabia — 0.0% | |
Kingdom of Saudi Arabia | | | | | | | | |
4.50%, 04/17/30(f) | | USD | 200 | | | | 201,125 | |
3.45%, 02/02/61(f) | | | 561 | | | | 380,655 | |
| | | | | | | | |
| | |
| | | | | | | 581,780 | |
|
South Africa — 0.1% | |
Republic of South Africa | | | | | | | | |
8.00%, 01/31/30 | | ZAR | 42,216 | | | | 2,357,273 | |
7.00%, 02/28/31 | | | 87,281 | | | | 4,521,373 | |
5.88%, 04/20/32 | | USD | 296 | | | | 294,150 | |
8.75%, 01/31/44 | | ZAR | 31,058 | | | | 1,503,853 | |
8.75%, 02/28/48 | | | 61,859 | | | | 2,991,761 | |
| | | | | | | | |
| | |
| | | | | | | 11,668,410 | |
|
Supranational — 0.6% | |
European Union | | | | | | | | |
2.50%, 10/04/52(f) | | EUR | 13,790 | | | | 13,090,846 | |
3.00%, 03/04/53(f) | | | 100,384 | | | | 105,234,946 | |
| | | | | | | | |
| | |
| | | | | | | 118,325,792 | |
|
Turkey — 0.0% | |
Republic of Türkiye | | | | | | | | |
37.00%, 02/18/26 | | TRY | 54,517 | | | | 1,578,239 | |
31.08%, 11/08/28 | | | 21,828 | | | | 654,409 | |
26.20%, 10/05/33 | | | 82,672 | | | | 2,378,807 | |
| | | | | | | | |
| | |
| | | | | | | 4,611,455 | |
|
Ukraine — 0.0% | |
Ukraine Government | | | | | | | | |
0.00%, 02/01/30(a)(c) | | USD | 51 | | | | 22,172 | |
0.00%, 02/01/34(a)(c) | | | 190 | | | | 64,474 | |
1.75%, 02/01/34(a)(c) | | | 467 | | | | 206,684 | |
0.00%, 02/01/35(a)(c) | | | 161 | | | | 70,099 | |
1.75%, 02/01/35(a)(c) | | | 280 | | | | 120,651 | |
0.00%, 02/01/36(a)(c) | | | 134 | | | | 57,778 | |
1.75%, 02/01/36(a)(c) | | | 187 | | | | 79,538 | |
7.75%, 08/01/41(b)(f)(h)(o) | | | 4,910 | | | | 3,439,455 | |
| | | | | | | | |
| | |
| | | | | | | 4,060,851 | |
|
United Kingdom — 0.6% | |
United Kingdom Gilt, 4.38%, 07/31/54(f) | | GBP | 96,843 | | | | 124,994,440 | |
| | | | | | | | |
|
Uruguay — 0.1% | |
Oriental Republic of Uruguay | | | | | | | | |
4.38%, 10/27/27 | | USD | 5,923 | | | | 5,967,434 | |
5.75%, 10/28/34 | | | 174 | | | | 188,827 | |
5.10%, 06/18/50 | | | 9,097 | | | | 9,064,762 | |
5.25%, 09/10/60 | | | 177 | | | | 177,000 | |
| | | | | | | | |
| | |
| | | | | | | 15,398,023 | |
|
Uzbekistan — 0.0% | |
Republic of Uzbekistan, 5.38%, 05/29/27(a) | | EUR | 1,071 | | | | 1,200,380 | |
| | | | | | | | |
|
Venezuela — 0.0% | |
Republic of Venezuela, 11.95%, 08/05/31(f)(h)(o) | | USD | 4,614 | | | | 731,319 | |
| | | | | | | | |
|
Total Foreign Government Obligations — 5.3% | |
(Cost: $1,080,781,835) | | | | | | | 1,074,112,714 | |
| | | | | | | | |
| | |
| 40 | | 2 0 2 4 B L A C K R O C K A N N U A L F I N A N C I A L S T A T E M E N T S A N D A D D I T I O N A L I N F O R M A T I O N |
| | |
Consolidated Schedule of Investments (continued) September 30, 2024 | | BlackRock Total Return Fund (Percentages shown are based on Net Assets) |
| | | | | | | | |
| Security | | Shares | | | Value | |
|
Investment Companies | |
|
Fixed-Income Funds — 0.0% | |
iShares iBoxx $ Investment Grade Corporate Bond ETF(j)(r) | | | 45,029 | | | $ | 5,087,376 | |
| | | | | | | | |
|
Total Investment Companies — 0.0% | |
(Cost: $5,071,521) | | | | | | | 5,087,376 | |
| | | | | | | | |
| | |
| | | Par (000) | | | | |
|
Municipal Bonds | |
|
California — 0.2% | |
Bay Area Toll Authority, RB, Series S1, 7.04%, 04/01/50 | | USD | 9,275 | | | | 11,471,973 | |
Los Angeles Community College District, GO, 6.60%, 08/01/42 | | | 3,990 | | | | 4,679,357 | |
State of California | | | | | | | | |
GO, 7.55%, 04/01/39 | | | 4,000 | | | | 5,038,322 | |
Refunding GO, 4.60%, 04/01/38 | | | 22,215 | | | | 22,110,857 | |
University of California, RB, 4.86%, 05/15/2112 | | | 2,467 | | | | 2,307,794 | |
| | | | | | | | |
| | |
| | | | | | | 45,608,303 | |
|
Florida — 0.0% | |
Florida Development Finance Corp., Refunding RB, AMT, 12.00%, 07/15/32(a)(b) | | | 3,855 | | | | 4,097,586 | |
| | | | | | | | |
|
Georgia — 0.0% | |
Municipal Electric Authority of Georgia, RB, 6.64%, 04/01/57 | | | 3,182 | | | | 3,632,431 | |
| | | | | | | | |
|
Illinois — 0.1% | |
State of Illinois, GO, 5.10%, 06/01/33 | | | 16,598 | | | | 16,821,145 | |
| | | | | | | | |
|
New Jersey — 0.1% | |
New Jersey Turnpike Authority, RB, Series F, 7.41%, 01/01/40 | | | 4,596 | | | | 5,647,393 | |
| | | | | | | | |
|
New York — 0.1% | |
Metropolitan Transportation Authority | | | | | | | | |
RB, 6.67%, 11/15/39 | | | 3,060 | | | | 3,447,359 | |
RB, Series E, 6.81%, 11/15/40 | | | 1,025 | | | | 1,165,632 | |
New York City Water & Sewer System | | | | | | | | |
RB, 6.01%, 06/15/42 | | | 2,430 | | | | 2,668,235 | |
RB, 5.88%, 06/15/44 | | | 1,665 | | | | 1,801,362 | |
New York State Dormitory Authority, RB, Series H, 5.39%, 03/15/40 | | | 1,470 | | | | 1,511,957 | |
Port Authority of New York & New Jersey | | | | | | | | |
RB, 5.65%, 11/01/40 | | | 2,780 | | | | 3,027,289 | |
RB, 4.96%, 08/01/46 | | | 5,020 | | | | 5,073,283 | |
RB, 4.93%, 10/01/51 | | | 1,400 | | | | 1,390,755 | |
| | | | | | | | |
| | |
| | | | | | | 20,085,872 | |
|
Ohio — 0.0% | |
American Municipal Power, Inc., RB, Series B, 8.08%, 02/15/50 | | | 3,555 | | | | 4,850,211 | |
| | | | | | | | |
|
Texas — 0.1% | |
City of San Antonio, TX Electric & Gas Systems Revenue, RB, 5.81%, 02/01/41 | | | 4,375 | | | | 4,687,571 | |
Port of Beaumont Navigation District RB, Refunding RB, Series B, 10.00%, 07/01/26(a) | | | 10,185 | | | | 10,490,864 | |
State of Texas, GO, 5.52%, 04/01/39 | | | 5,715 | | | | 6,158,048 | |
| | | | | | | | |
| | |
| | | | | | | 21,336,483 | |
| | | | | | | | |
|
Total Municipal Bonds — 0.6% | |
(Cost: $132,127,659) | | | | | | | 122,079,424 | |
| | | | | | | | |
| | | | | | | | |
| Security | | Par (000) | | | Value | |
|
Non-Agency Mortgage-Backed Securities | |
|
Collateralized Mortgage Obligations — 4.7% | |
A&D Mortgage Trust, Series 2023-NQM5, Class A1, 7.05%, 11/25/68(a)(c) | | USD | 9,436 | | | $ | 9,640,243 | |
Adjustable Rate Mortgage Trust, Series 2005-8, Class 3A1, 5.23%, 11/25/35(b) | | | 3,606 | | | | 2,574,314 | |
Ajax Mortgage Loan Trust | | | | | | | | |
Series 2017-D, Class B, 0.00%, 12/25/57(a)(b)(e) | | | 1 | | | | 498 | |
Series 2020-C, Class C, 0.00%, 09/27/60(a)(e) | | | 71 | | | | 5,715 | |
Series 2020-C, Class RW, 0.00%, 09/25/60(a)(e) | | | 156 | | | | 155,960 | |
Series 2020-D, Class RW, 0.00%, 06/25/60(a)(e) | | | 104 | | | | 104,302 | |
Series 2021-C, Class A, 5.12%, 01/25/61(a)(c) | | | 8,252 | | | | 8,252,064 | |
Series 2021-C, Class B, 3.72%, 01/25/61(a)(c) | | | 3,277 | | | | 3,192,905 | |
Series 2021-C, Class C, 0.00%, 01/25/61(a)(e) | | | 8,105 | | | | 8,790,369 | |
Series 2021-D, Class A, 2.00%, 03/25/60(a)(c) | | | 18,593 | | | | 18,313,955 | |
Series 2021-D, Class B, 4.00%, 03/25/60(a)(b) | | | 5,836 | | | | 6,133,352 | |
Series 2021-D, Class C, 0.00%, 03/25/60(a)(b)(e) | | | 8,508 | | | | 8,892,684 | |
Series 2021-E, Class A1, 1.74%, 12/25/60(a)(b) | | | 21,287 | | | | 18,774,804 | |
Series 2021-E, Class A2, 2.69%, 12/25/60(a)(b) | | | 4,422 | | | | 3,439,568 | |
Series 2021-E, Class B1, 3.73%, 12/25/60(a)(b) | | | 2,669 | | | | 1,879,219 | |
Series 2021-E, Class B3, 4.15%, 12/25/60(a)(b) | | | 7,606 | | | | 2,678,696 | |
Series 2021-E, Class M1, 2.94%, 12/25/60(a)(b) | | | 1,744 | | | | 1,250,263 | |
Series 2021-E, Class SA, 0.00%, 12/25/60(a)(b)(e) | | | 48 | | | | 22,423 | |
Series 2021-F, Class A, 1.88%, 06/25/61(a)(c) | | | 44,252 | | | | 43,613,136 | |
Series 2021-F, Class B, 3.75%, 06/25/61(a)(c) | | | 12,423 | | | | 12,232,070 | |
Series 2021-F, Class C, 0.00%, 06/25/61(a)(e) | | | 18,883 | | | | 18,001,030 | |
Series 2021-F, Class RW1, 0.00%, 06/27/61(a)(e)(g) | | | 44 | | | | 43,145 | |
Series 2022-A, Class A1, 3.50%, 10/25/61(a)(c) | | | 18,338 | | | | 17,685,450 | |
Series 2022-A, Class A2, 3.00%, 10/25/61(a)(b) | | | 1,244 | | | | 1,094,335 | |
Series 2022-A, Class A3, 3.00%, 10/25/61(a)(b) | | | 664 | | | | 560,204 | |
Series 2022-A, Class B, 3.00%, 10/25/61(a) | | | 4,977 | | | | 3,699,661 | |
Series 2022-A, Class C, 3.00%, 10/25/61(a) | | | 2,442 | | | | 2,305,697 | |
Series 2022-A, Class M1, 3.00%, 10/25/61(a) | | | 726 | | | | 591,636 | |
Series 2022-A, Class M2, 3.00%, 10/25/61(a) | | | 3,256 | | | | 2,531,462 | |
Series 2022-A, Class M3, 3.00%, 10/25/61(a) | | | 208 | | | | 160,666 | |
Series 2022-B, Class A1, 3.50%, 03/27/62(a)(c) | | | 19,886 | | | | 19,066,307 | |
Series 2022-B, Class A2, 3.00%, 03/27/62(a)(b) | | | 937 | | | | 806,714 | |
Series 2022-B, Class A3, 3.00%, 03/27/62(a)(b) | | | 804 | | | | 667,098 | |
Series 2022-B, Class B, 3.00%, 03/27/62(a) | | | 4,464 | | | | 3,169,943 | |
Series 2022-B, Class C, 3.00%, 03/27/62(a) | | | 3,807 | | | | 2,885,343 | |
| | |
C O N S O L I D A T E D S C H E D U L E S O F I N V E S T M E N T S | | 41 |
| | |
Consolidated Schedule of Investments (continued) September 30, 2024 | | BlackRock Total Return Fund (Percentages shown are based on Net Assets) |
| | | | | | | | |
| Security | | Par (000) | | | Value | |
|
Collateralized Mortgage Obligations (continued) | |
Ajax Mortgage Loan Trust | | | | | | | | |
Series 2022-B, Class M1, 3.00%, 03/27/62(a) | | USD | 603 | | | $ | 496,574 | |
Series 2022-B, Class M2, 3.00%, 03/27/62(a) | | | 2,991 | | | | 2,383,906 | |
Series 2023-A, Class A1, 3.50%, 07/25/62(a)(c) | | | 25,150 | | | | 23,889,671 | |
Series 2023-A, Class A2, 3.00%, 07/25/62(a)(b) | | | 1,258 | | | | 1,103,923 | |
Series 2023-A, Class A3, 2.50%, 07/25/62(a)(b) | | | 713 | | | | 597,077 | |
Series 2023-A, Class B, 2.50%, 07/25/62(a)(b) | | | 4,194 | | | | 3,037,661 | |
Series 2023-A, Class C, 2.50%, 07/25/62(a)(b) | | | 2,813 | | | | 1,498,859 | |
Series 2023-A, Class M1, 2.50%, 07/25/62(a)(b) | | | 2,160 | | | | 1,748,029 | |
Series 2023-C, Class A1, 3.50%, 05/25/63(a)(c) | | | 24,357 | | | | 23,050,589 | |
Series 2023-C, Class A2, 3.00%, 05/25/63(a)(b) | | | 1,567 | | | | 1,360,489 | |
Series 2023-C, Class A3, 2.50%, 05/25/63(a)(b) | | | 836 | | | | 690,249 | |
Series 2023-C, Class C, 2.50%, 05/25/63(a)(b) | | | 6,946 | | | | 4,904,783 | |
Series 2023-C, Class M1, 2.50%, 05/25/63(a)(b) | | | 731 | | | | 581,088 | |
Series 2023-C, Class M2, 2.50%, 05/25/63(a)(b) | | | 4,534 | | | | 3,217,174 | |
American Home Mortgage Assets Trust | | | | | | | | |
Series 2006-3, Class 2A11, (12-mo. Federal Reserve Cumulative Average US + 0.94%), 6.06%, 10/25/46(b) | | | 578 | | | | 383,600 | |
Series 2006-4, Class 1A12, (1-mo. CME Term SOFR + 0.32%), 5.18%, 10/25/46(b) . | | | 1,597 | | | | 862,552 | |
Series 2007-1, Class A1, (12-mo. Federal Reserve Cumulative Average US + 0.70%), 5.82%, 02/25/47(b) | | | 610 | | | | 217,243 | |
American Home Mortgage Investment Trust, Series 2007-1, Class GA1C, (1-mo. CME Term SOFR + 0.30%), 5.16%, 05/25/47(b) | | | 1,421 | | | | 809,949 | |
Angel Oak Mortgage Trust | | | | | | | | |
Series 2020-4, Class A3, 2.81%, 06/25/65(a)(b) | | | 659 | | | | 634,098 | |
Series 2022-2, Class A1, 3.35%, 01/25/67(a)(b) | | | 415 | | | | 394,209 | |
Series 2023-7, Class A1, 4.80%, 11/25/67(a)(c) | | | 11,599 | | | | 11,524,039 | |
Series 2024-1, Class A1, 5.21%, 08/25/68(a)(c) | | | 1,825 | | | | 1,834,589 | |
Angel Oak Mortgage Trust LLC, Series 2020-3, Class A3, 2.87%, 04/25/65(a)(b) | | | 1,180 | | | | 1,119,962 | |
APS Resecuritization Trust, Series 2016-1, Class 1MZ, 2.14%, 07/31/57(a)(b) | | | 8,018 | | | | 3,129,768 | |
Atlas Funding PLC | | | | | | | | |
Series 2024-1, Class C, (1-day SONIA + 1.55%), 6.51%, 09/20/61(b)(f) | | GBP | 518 | | | | 692,969 | |
Series 2024-1, Class D, (1-day SONIA + 2.20%), 7.16%, 09/20/61(b)(f) | | | 343 | | | | 457,975 | |
Banc of America Alternative Loan Trust, Series 2006-7, Class A4, 6.50%, 10/25/36(c) | | USD | 2,001 | | | | 599,007 | |
Banc of America Funding Trust | | | | | | | | |
Series 2007-1, Class 1A6, 5.75%, 01/25/37 | | | 20 | | | | 16,586 | |
| | | | | | | | |
| Security | | Par (000) | | | Value | |
|
Collateralized Mortgage Obligations (continued) | |
Banc of America Funding Trust | | | | | | | | |
Series 2014-R2, Class 1C, 0.00%, 11/26/36(a)(b)(e) | | USD | 3,356 | | | $ | 1,122,064 | |
Series 2016-R2, Class 1A1, 4.70%, 05/01/33(a)(b) | | | 765 | | | | 761,333 | |
Barclays Mortgage Loan Trust | | | | | | | | |
Series 2021-NPL1, Class A, 2.00%, 11/25/51(a)(c) | | | 14,981 | | | | 14,726,313 | |
Series 2021-NPL1, Class B, 4.63%, 11/25/51(a)(c) | | | 3,139 | | | | 3,051,999 | |
Series 2021-NPL1, Class C, 0.00%, 11/25/51(a)(e) | | | 6,511 | | | | 7,645,266 | |
Series 2021-NPL1, Class RW1, 0.00%, 11/27/51(a)(e)(g) | | | 15 | | | | 14,963 | |
Series 2022-NQM1, Class A1, 4.55%, 07/25/52(a)(c) | | | 5,187 | | | | 5,145,163 | |
Series 2022-RPL1, Class A, 4.25%, 02/25/28(a)(c) | | | 10,583 | | | | 10,433,438 | |
Series 2022-RPL1, Class B, 4.25%, 02/25/28(a)(c) | | | 2,105 | | | | 2,009,944 | |
Series 2022-RPL1, Class C, 0.00%, 02/25/28(a)(e) | | | 3,575 | | | | 703,794 | |
Series 2022-RPL1, Class RW1, 0.00%, 02/25/28(a)(e)(g) | | | 5 | | | | 4,526 | |
Series 2022-RPL1, Class SA, 0.00%, 02/25/28(a)(e) | | | 44 | | | | 30,474 | |
Series 2023-NQM3, Class A1, 6.90%, 10/25/63(a)(c) | | | 36,066 | | | | 36,886,723 | |
Series 2023-NQM3, Class A2, 7.36%, 10/25/63(a)(c) | | | 5,734 | | | | 5,863,264 | |
Series 2023-NQM3, Class A3, 7.69%, 10/25/63(a)(c) | | | 3,462 | | | | 3,538,282 | |
Series 2023-NQM3, Class B1, 8.03%, 10/25/63(a)(b) | | | 1,917 | | | | 1,945,259 | |
Series 2023-NQM3, Class B2, 8.03%, 10/25/63(a)(b) | | | 1,613 | | | | 1,599,052 | |
Series 2023-NQM3, Class B3, 8.03%, 10/25/63(a)(b) | | | 4,413 | | | | 4,063,832 | |
Series 2023-NQM3, Class M1, 8.03%, 10/25/63(a)(b) | | | 3,196 | | | | 3,331,135 | |
Series 2023-NQM3, Class SA, 0.00%, 10/25/63(a)(b)(e) | | | 1 | | | | 647 | |
Series 2024-NQM1, Class A1, 5.90%, 01/25/64(a)(c) | | | 5,499 | | | | 5,551,289 | |
Series 2024-NQM1, Class A2, 6.11%, 01/25/64(a)(c) | | | 3,746 | | | | 3,773,330 | |
Series 2024-NQM1, Class A3, 6.31%, 01/25/64(a)(c) | | | 2,861 | | | | 2,885,781 | |
Series 2024-NQM1, Class B1, 8.09%, 01/25/64(a)(b) | | | 1,442 | | | | 1,462,738 | |
Series 2024-NQM1, Class B2, 8.69%, 01/25/64(a)(b) | | | 1,322 | | | | 1,337,049 | |
Series 2024-NQM1, Class B3, 8.69%, 01/25/64(a)(b) | | | 2,836 | | | | 2,578,321 | |
Series 2024-NQM1, Class M1, 6.80%, 01/25/64(a)(b) | | | 2,475 | | | | 2,516,016 | |
Series 2024-NQM1, Class SA, 0.00%, 01/25/64(a)(b)(e) | | | 7 | | | | 6,198 | |
Series 2024-NQM3, Class A1, 6.04%, 06/25/64(a)(c) | | | 28,821 | | | | 29,214,134 | |
Series 2024-NQM3, Class A2, 6.30%, 06/25/64(a)(c) | | | 2,272 | | | | 2,302,288 | |
| | |
| 42 | | 2 0 2 4 B L A C K R O C K A N N U A L F I N A N C I A L S T A T E M E N T S A N D A D D I T I O N A L I N F O R M A T I O N |
| | |
Consolidated Schedule of Investments (continued) September 30, 2024 | | BlackRock Total Return Fund (Percentages shown are based on Net Assets) |
| | | | | | | | |
| Security | | Par (000) | | | Value | |
|
Collateralized Mortgage Obligations (continued) | |
Barclays Mortgage Loan Trust | | | | | | | | |
Series 2024-NQM3, Class A3, 6.50%, 06/25/64(a)(c) | | USD | 3,965 | | | $ | 4,014,227 | |
Series 2024-NQM3, Class B1, 7.50%, 06/25/64(a)(b) | | | 1,983 | | | | 1,999,325 | |
Series 2024-NQM3, Class B2, 8.07%, 06/25/64(a)(b) | | | 1,816 | | | | 1,802,944 | |
Series 2024-NQM3, Class B3, 8.07%, 06/25/64(a)(b) | | | 4,970 | | | | 4,188,576 | |
Series 2024-NQM3, Class M1, 6.41%, 06/25/64(a)(b) | | | 2,891 | | | | 2,937,200 | |
Series 2024-NQM3, Class SA, 0.00%, 06/25/64(a)(b)(e) | | | 6 | | | | 5,489 | |
BCAP LLC Trust, Series 2011-RR5, Class 11A5, (1-mo. CME Term SOFR + 0.26%), 7.34%, 05/28/36(a)(b) | | | 1,710 | | | | 1,627,740 | |
Bear Stearns ALT-A Trust | | | | | | | | |
Series 2006-2, Class 22A1, 4.47%, 03/25/36(b) | | | 3,226 | | | | 2,120,805 | |
Series 2007-1, Class 1A1, (1-mo. CME Term SOFR + 0.43%), 5.29%, 01/25/47(b) | | | 782 | | | | 645,566 | |
Bear Stearns Asset-Backed Securities I Trust | | | | | | | | |
Series 2005-AC9, Class A5, 6.25%, 12/25/35(c) | | | 145 | | | | 140,040 | |
Series 2006-AC2, Class 1A1, (1-mo. CME Term SOFR + 0.46%), 5.32%, 03/25/36(b) | | | 3,203 | | | | 847,030 | |
Bear Stearns Mortgage Funding Trust | | | | | | | | |
Series 2006-SL1, Class A1, (1-mo. CME Term SOFR + 0.39%), 5.25%, 08/25/36(b) | | | 307 | | | | 303,658 | |
Series 2007-AR2, Class A1, (1-mo. CME Term SOFR + 0.45%), 5.31%, 03/25/37(b) | | | 186 | | | | 174,637 | |
Series 2007-AR3, Class 1A1, (1-mo. CME Term SOFR + 0.25%), 5.11%, 03/25/37(b) | | | 323 | | | | 296,713 | |
Series 2007-AR4, Class 2A1, (1-mo. CME Term SOFR + 0.32%), 5.18%, 06/25/37(b) | | | 299 | | | | 282,774 | |
BlackRock Capital Finance LP, Series 1997-R2, Class AP, 2.23%, 12/25/35(a)(b)(g)(r) | | | 1 | | | | — | |
CFMT LLC | | | | | | | | |
Series 2024-HB14, Class M2, 3.00%, 06/25/34(a)(b) | | | 274 | | | | 248,264 | |
Series 2024-HB14, Class M3, 3.00%, 06/25/34(a)(b) | | | 675 | | | | 593,837 | |
Series 2024-HB15, Class M2, 4.00%, 08/25/34(a)(b) | | | 265 | | | | 249,031 | |
Chase Mortgage Finance Trust, Series 2007- S6, Class 1A1, 6.00%, 12/25/37 | | | 18,847 | | | | 7,995,193 | |
CHNGE Mortgage Trust | | | | | | | | |
Series 2022-1, Class A1, 3.01%, 01/25/67(a)(b) | | | 1,917 | | | | 1,815,717 | |
Series 2022-4, Class A1, 6.00%, 10/25/57(a)(c) | | | 608 | | | | 604,984 | |
CIM Trust, Series 2023-I2, Class A2, 6.85%, 12/25/67(a)(c) | | | 3,301 | | | | 3,341,327 | |
Citicorp Mortgage Securities Trust | | | | | | | | |
Series 2007-4, Class 1A14, 6.00%, 05/25/37 | | | 620 | | | | 562,540 | |
Series 2007-9, Class 1A1, 6.25%, 12/25/37 | | | 966 | | | | 893,991 | |
Series 2008-2, Class 1A1, 6.50%, 06/25/38 | | | 3,196 | | | | 2,576,607 | |
Citigroup Mortgage Loan Trust, Series 2007-6, Class 2A1, (1-mo. CME Term SOFR + 0.61%), 5.47%, 05/25/37(b) | | | 1,860 | | | | 1,673,094 | |
| | | | | | | | |
| Security | | Par (000) | | | Value | |
|
Collateralized Mortgage Obligations (continued) | |
CitiMortgage Alternative Loan Trust,
Series 2007-A6, Class 1A11, 6.00%, 06/25/37 | | USD | 462 | | | $ | 400,527 | |
COLT Mortgage Loan Trust | | | | | | | | |
Series 2020-3, Class A3, 2.38%, 04/27/65(a)(b) | | | 262 | | | | 253,027 | |
Series 2022-1, Class B2, 4.06%, 12/27/66(a)(b) | | | 316 | | | | 258,142 | |
Series 2022-3, Class B1, 4.22%, 02/25/67(a)(b) | | | 1,000 | | | | 845,759 | |
Series 2022-5, Class B1, 4.64%, 03/25/67(a)(b) | | | 2,398 | | | | 2,252,144 | |
Series 2022-8, Class B1, 6.52%, 08/25/67(a)(b) | | | 1,172 | | | | 1,161,482 | |
Countrywide Alternative Loan Trust | | | | | | | | |
Series 2005-11CB, Class 2A1, 5.50%, 06/25/35 | | | 93 | | | | 76,129 | |
Series 2005-11CB, Class 2A6, 5.50%, 06/25/25 | | | 509 | | | | 415,527 | |
Series 2005-22T1, Class A1, (1-mo. CME Term SOFR + 0.46%), 5.32%, 06/25/35(b) | | | 2,617 | | | | 2,208,223 | |
Series 2005-29CB, Class A6, 5.50%, 07/01/35 | | | 330 | | | | 194,316 | |
Series 2005-55CW, Class 2A3, (1-mo. CME Term SOFR + 0.46%), 5.74%, 11/25/35(b) | | | 592 | | | | 409,845 | |
Series 2005-59, Class 1A1, (1-mo. CME Term SOFR + 0.77%), 5.74%, 11/20/35(b) | | | 667 | | | | 631,018 | |
Series 2005-76, Class 2A1, (12-mo. Federal Reserve Cumulative Average US + 1.00%), 6.12%, 02/25/36(b) | | | 436 | | | | 390,255 | |
Series 2006-11CB, Class 3A1, 6.50%, 05/25/36 | | | 1,365 | | | | 661,850 | |
Series 2006-15CB, Class A1, 6.50%, 06/25/36 | | | 308 | | | | 143,960 | |
Series 2006-28CB, Class A14, 6.25%, 10/25/36 | | | 1,133 | | | | 587,278 | |
Series 2006-6CB, Class 2A10, 6.00%, 05/25/36 | | | 221 | | | | 88,767 | |
Series 2006-OA11, Class A4, (1-mo. CME Term SOFR + 0.49%), 5.35%, 09/25/46(b) | | | 284 | | | | 259,755 | |
Series 2006-OA14, Class 1A1, (12-mo. Federal Reserve Cumulative Average US + 1.73%), 6.85%, 11/25/46(b) | | | 1,866 | | | | 1,516,953 | |
Series 2006-OA16, Class A2, (1-mo. CME Term SOFR + 0.49%), 5.35%, 10/25/46(b) | | | 2,159 | | | | 1,996,784 | |
Series 2006-OA16, Class A4C, (1-mo. CME Term SOFR + 0.79%), 5.65%, 10/25/46(b) | | | 3,282 | | | | 2,402,084 | |
Series 2006-OA21, Class A1, (1-mo. CME Term SOFR + 0.30%), 5.27%, 03/20/47(b) | | | 4,690 | | | | 3,942,105 | |
Series 2006-OA8, Class 1A1, (1-mo. CME Term SOFR + 0.49%), 5.35%, 07/25/46(b) | | | 237 | | | | 209,750 | |
Series 2006-OC1, Class 1A1, (1-mo. CME Term SOFR + 0.57%), 5.43%, 03/25/36(b) | | | 1,080 | | | | 1,040,655 | |
Series 2006-OC10, Class 2A3, (1-mo. CME Term SOFR + 0.57%), 5.43%, 11/25/36(b) | | | 1,608 | | | | 1,364,541 | |
Series 2006-OC7, Class 2A3, (1-mo. CME Term SOFR + 0.61%), 5.47%, 07/25/46(b) | | | 1,602 | | | | 1,369,053 | |
Series 2007-14T2, Class A1, 6.00%, 07/25/37 | | | 2,091 | | | | 1,055,736 | |
Series 2007-3T1, Class 1A1, 6.00%, 04/25/37 | | | 266 | | | | 124,049 | |
| | |
C O N S O L I D A T E D S C H E D U L E S O F I N V E S T M E N T S | | 43 |
| | |
Consolidated Schedule of Investments (continued) September 30, 2024 | | BlackRock Total Return Fund (Percentages shown are based on Net Assets) |
| | | | | | | | |
| Security | | Par (000) | | | Value | |
|
Collateralized Mortgage Obligations (continued) | |
Countrywide Alternative Loan Trust | | | | | | | | |
Series 2007-AL1, Class A1, (1-mo. CME Term SOFR + 0.36%), 5.22%, 06/25/37(b) | |
| .
USD 4,304 |
| | $ | 3,543,010 | |
Series 2007-OA3, Class 1A1, (1-mo. CME Term SOFR + 0.39%), 5.25%, 04/25/47(b) | | | 573 | | | | 516,495 | |
Series 2007-OA8, Class 2A1, (1-mo. CME Term SOFR + 0.47%), 5.33%, 06/25/47(b) | | | 174 | | | | 133,681 | |
Series 2007-OH2, Class A2A, (1-mo. CME Term SOFR + 0.59%), 5.45%, 08/25/47(b) | | | 192 | | | | 165,856 | |
Countrywide Home Loan Mortgage Pass- Through Trust | | | | | | | | |
Series 2004-29, Class 1A1, (1-mo. CME Term SOFR + 0.65%), 5.51%, 02/25/35(b) | | | 80 | | | | 75,361 | |
Series 2005-16, Class A28, 5.50%, 09/25/35 | | | 2,914 | | | | 1,882,457 | |
Series 2006-OA4, Class A1, (12-mo. Federal Reserve Cumulative Average US + 0.96%), 6.08%, 04/25/46(b) | | | 1,205 | | | | 366,805 | |
Series 2006-OA5, Class 3A1, (1-mo. CME Term SOFR + 0.51%), 5.37%, 04/25/46(b) | | | 362 | | | | 344,898 | |
Series 2007-1, Class A2, 6.00%, 03/25/37 | | | 407 | | | | 183,028 | |
Series 2007-15, Class 2A2, 6.50%, 09/25/37 . | | | 7,342 | | | | 2,763,952 | |
Series 2007-9, Class A1, 5.75%, 07/25/37 | | | 1,305 | | | | 641,663 | |
Series 2007-9, Class A11, 5.75%, 07/25/37 | | | 713 | | | | 350,655 | |
Credit Suisse Mortgage Capital Certificates, Series 2009-12R, Class 3A1, 6.50%, 10/27/37(a) | | | 8,101 | | | | 3,248,979 | |
Credit Suisse Mortgage Capital Trust, Series 2006-4, Class 1A4, 6.00%, 05/25/36 | | | 734 | | | | 405,135 | |
Credit Suisse Mortgage Trust | | | | | | | | |
Series 2006-4, Class 1A3, 6.00%, 05/25/36 | | | 971 | | | | 535,943 | |
Series 2014-4R, Class 16A3, (1-mo. CME Term SOFR + 0.31%), 4.86%, 02/27/36(a)(b) | | | 11 | | | | 10,882 | |
Series 2014-9R, Class 9A1, (1-mo. CME Term SOFR + 0.23%), 5.63%, 08/27/36(a)(b) | | | 604 | | | | 495,261 | |
Series 2015-6R, Class 5A2, (1-mo. CME Term SOFR + 0.29%), 3.66%, 03/27/36(a)(b) | | | 1,553 | | | | 1,210,587 | |
Series 2021-NQM8, Class M1, 3.26%, 10/25/66(a)(b) | | | 760 | | | | 594,698 | |
Series 2021-RPL9, Class A1, 2.44%, 02/25/61(a)(b) | | | 9,515 | | | | 9,459,822 | |
Series 2022-NQM3, Class A1B, 4.27%, 03/25/67(a)(b) | | | 3,821 | | | | 3,714,090 | |
Series 2022-NQM6, Class PT, 8.92%, 12/25/67(a)(b) | | | 12,274 | | | | 12,277,075 | |
Cross Mortgage Trust, Series 2023-H2, Class A1A, 7.14%, 11/25/68(a)(c) | | | 2,815 | | | | 2,885,284 | |
CSFB Mortgage-Backed Pass-Through Certificates, Series 2005-10, Class 10A1, (1-mo. CME Term SOFR + 1.46%), 6.25%, 11/25/35(b) | | | 1,191 | | | | 251,060 | |
Deephaven Residential Mortgage Trust | | | | | | | | |
Series 2022-2, Class M1, 4.30%, 03/25/67(a)(b) | | | 1,629 | | | | 1,428,738 | |
Series 2022-3, Class B1, 5.24%, 07/25/67(a)(b) | | | 1,716 | | | | 1,609,940 | |
Series 2022-3, Class M1, 5.24%, 07/25/67(a)(b) | | | 3,171 | | | | 3,082,079 | |
| | | | | | | | |
| Security | | Par (000) | | | Value | |
|
Collateralized Mortgage Obligations (continued) | |
Deutsche Alt-A Securities Mortgage Loan Trust, Series 2007-OA4, Class A2A, (1-mo. CME Term SOFR + 0.45%), 5.31%, 08/25/47(b) | | | USD 785 | | | $ | 686,447 | |
Deutsche Alt-B Securities Mortgage Loan Trust | | | | | | | | |
Series 2006-AB3, Class A3, 6.51%, 07/25/36(b) | | | 268 | | | | 231,451 | |
Series 2006-AB3, Class A8, 6.36%, 07/25/36(b) | | | 171 | | | | 147,596 | |
Ellington Financial Mortgage Trust, Series 2022-4, Class B2, 5.96%, 09/25/67(a)(b) | | | 2,288 | | | | 2,019,451 | |
Exmoor Funding PLC | | | | | | | | |
Series 2024-1, Class C, (1-day SONIA + 1.90%), 7.12%, 03/25/94(b)(f) | | | GBP 454 | | | | 606,368 | |
Series 2024-1, Class D, (1-day SONIA + 2.80%), 8.02%, 03/25/94(b)(f) | | | 197 | | | | 263,118 | |
First Horizon Alternative Mortgage Securities Trust, Series 2005-AA12, Class 2A1, 5.62%, 02/25/36(b) | | | USD 21 | | | | 13,300 | |
GCAT Trust | | | | | | | | |
Series 2021-NQM3, Class B1, 3.47%, 05/25/66(a)(b) | | | 1,642 | | | | 1,267,154 | |
Series 2022-HX1, Class A1, 2.89%, 12/27/66(a)(b) | | | 313 | | | | 291,341 | |
Series 2022-NQM1, Class B1, 3.96%, 02/25/67(a)(b) | | | 564 | | | | 432,637 | |
Series 2022-NQM4, Class A1, 5.27%, 08/25/67(a)(c) | | | 5,343 | | | | 5,314,882 | |
Series 2023-NQM4, Class A1, 4.25%, 05/25/67(a)(b) | | | 6,211 | | | | 6,053,988 | |
GreenPoint Mortgage Funding Trust, Series 2006-AR2, Class 4A1, (12-mo. Federal Reserve Cumulative Average US + 2.00%), 7.12%, 03/25/36(b) | | | 405 | | | | 370,371 | |
GS Mortgage Securities Trust, Series 2019-PJ2, Class B4, 4.37%, 11/25/49(a)(b) | | | 1,418 | | | | 1,269,372 | |
GS Mortgage-Backed Securities Trust | | | | | | | | |
Series 2022-NQM1, Class A4, 4.00%, 05/25/62(a)(b) | | | 641 | | | | 601,725 | |
Series 2023-CCM1, Class B1, 7.49%, 08/25/53(a)(b) | | | 1,022 | | | | 1,021,443 | |
GSR Mortgage Loan Trust | | | | | | | | |
Series 2007-1F, Class 2A4, 5.50%, 01/25/37 | | | 34 | | | | 52,548 | |
Series 2007-OA2, Class 2A1, 3.04%, 06/25/47(b) | | | 839 | | | | 520,127 | |
HarborView Mortgage Loan Trust | | | | | | | | |
Series 2006-12, Class 1A1A, (1-mo. CME Term SOFR + 0.52%), 5.49%, 12/19/36(b) | | | 5,180 | | | | 3,979,471 | |
Series 2007-3, Class 1A1A, (1-mo. CME Term SOFR + 0.51%), 5.48%, 05/19/37(b) | | | 1,559 | | | | 1,222,265 | |
Series 2007-4, Class 2A2, (1-mo. CME Term SOFR + 0.61%), 5.33%, 07/19/47(b) | | | 373 | | | | 335,723 | |
Homeward Opportunities Fund I Trust | | | | | | | | |
Series 2020-2, Class A3, 3.20%, 05/25/65(a)(b) | | | 5,763 | | | | 5,590,462 | |
Series 2022-1, Class A1, 5.08%, 07/25/67(a)(c) | | | 9,627 | | | | 9,591,807 | |
Series 2022-1, Class M1, 5.06%, 07/25/67(a)(b) | | | 3,380 | | | | 3,299,132 | |
Impac CMB Trust | | | | | | | | |
Series 2004-11, Class 1A2, (1-mo. CME Term SOFR + 0.63%), 5.49%, 03/25/35(b) | | | 634 | | | | 853,145 | |
| | |
| 44 | | 2 0 2 4 B L A C K R O C K A N N U A L F I N A N C I A L S T A T E M E N T S A N D A D D I T I O N A L I N F O R M A T I O N |
| | |
Consolidated Schedule of Investments (continued) September 30, 2024 | | BlackRock Total Return Fund (Percentages shown are based on Net Assets) |
| | | | | | | | |
| Security | | Par (000) | | | Value | |
|
Collateralized Mortgage Obligations (continued) | |
Impac CMB Trust | | | | | | | | |
Series 2005-6, Class 1A1, (1-mo. CME Term SOFR + 0.61%), 5.47%, 10/25/35(b) | | | USD 445 | | | $ | 391,575 | |
Impac Secured Assets Trust, Series 2006-3, Class A1, (1-mo. CME Term SOFR + 0.45%), 5.31%, 11/25/36(b) | | | 803 | | | | 710,230 | |
IndyMac Index Mortgage Loan Trust | | | | | | | | |
Series 2006-AR15, Class A1, (1-mo. CME Term SOFR + 0.35%), 5.21%, 07/25/36(b) | | | 283 | | | | 271,659 | |
Series 2006-AR35, Class 2A1A, (1-mo. CME Term SOFR + 0.45%), 5.31%, 01/25/37(b) | | | 573 | | | | 505,510 | |
Series 2007-AR19, Class 3A1, 4.02%, 09/25/37(b) | | | 2,412 | | | | 1,582,510 | |
Series 2007-FLX5, Class 2A2, (1-mo. CME Term SOFR + 0.59%), 5.45%, 08/25/37(b) | | | 513 | | | | 461,832 | |
JPMorgan Alternative Loan Trust | | | | | | | | |
Series 2007-A1, Class 1A4, (1-mo. CME Term SOFR + 0.53%), 5.39%, 03/25/37(b) | | | 578 | | | | 492,567 | |
Series 2007-A2, Class 2A1, 4.84%, 05/25/37(b) | | | 165 | | | | 146,964 | |
JPMorgan Mortgage Trust | | | | | | | | |
Series 2021-4, Class B3, 2.90%, 08/25/51(a)(b) | | | 3,538 | | | | 2,849,681 | |
Series 2021-INV5, Class A5A, 2.50%, 12/25/51(a)(b) | | | 8,719 | | | | 7,250,787 | |
Series 2021-INV5, Class B4, 3.19%, 12/25/51(a)(b) | | | 1,241 | | | | 1,005,429 | |
Series 2021-INV5, Class B5, 3.19%, 12/25/51(a)(b) | | | 434 | | | | 329,117 | |
Series 2021-INV5, Class B6, 2.85%, 12/25/51(a)(b) | | | 1,485 | | | | 743,260 | |
Series 2021-INV7, Class A3A, 2.50%, 02/25/52(a)(b) | | | 23,513 | | | | 21,146,600 | |
Series 2021-INV7, Class A4A, 2.50%, 02/25/52(a)(b) | | | 10,539 | | | | 7,335,512 | |
Series 2021-INV7, Class A5A, 2.50%, 02/25/52(a)(b) | | | 5,174 | | | | 4,302,364 | |
Series 2021-INV7, Class B1, 3.27%, 02/25/52(a)(b) | | | 3,152 | | | | 2,697,185 | |
Series 2021-INV7, Class B2, 3.27%, 02/25/52(a)(b) | | | 740 | | | | 626,627 | |
Series 2021-INV7, Class B3, 3.27%, 02/25/52(a)(b) | | | 1,029 | | | | 861,043 | |
Series 2021-INV7, Class B4, 3.27%, 02/25/52(a)(b) | | | 547 | | | | 444,009 | |
Series 2021-INV7, Class B5, 3.27%, 02/25/52(a)(b) | | | 225 | | | | 170,709 | |
Series 2021-INV7, Class B6, 3.27%, 02/25/52(a)(b) | | | 736 | | | | 362,629 | |
Legacy Mortgage Asset Trust, Series 2021- GS2, Class A1, 4.75%, 04/25/61(a)(c) | | | 15,591 | | | | 15,702,313 | |
Lehman XS Trust | | | | | | | | |
Series 2007-16N, Class AF2, (1-mo. CME Term SOFR + 2.01%), 6.87%, 09/25/47(b) | | | 1,660 | | | | 2,157,812 | |
Series 2007-20N, Class A1, (1-mo. CME Term SOFR + 2.41%), 7.27%, 12/25/37(b) | | | 430 | | | | 409,177 | |
MASTR Resecuritization Trust, Series 2008-3, Class A1, 4.75%, 08/25/37(a)(b) | | | 627 | | | | 202,922 | |
MCM Trust | | | | | | | | |
Series 2021-VFN1, Class Cert, 3.00%, 09/25/31(a)(g) | | | 14,556 | | | | 9,490,443 | |
| | | | | | | | |
| Security | | Par (000) | | | Value | |
|
Collateralized Mortgage Obligations (continued) | |
MCM Trust | | | | | | | | |
Series 2021-VFN1, Class Note, 2.50%, 09/25/31(a)(g) | | | USD 11,949 | | | $ | 11,506,681 | |
Merrill Lynch Alternative Note Asset Trust, Series 2007-OAR2, Class A2, (1-mo. CME Term SOFR + 0.53%), 5.39%, 04/25/37(b) | | | 961 | | | | 786,045 | |
Merrill Lynch Mortgage Investors Trust | | | | | | | | |
Series 2006-A3, Class 6A1, 5.02%, 05/25/36(b) | | | 537 | | | | 490,236 | |
Series 2006-AF2, Class AV1, (1-mo. CME Term SOFR + 0.27%), 5.29%, 09/25/37(b) | | | 711 | | | | 390,666 | |
MFA Trust | | | | | | | | |
Series 2020-NQM1, Class A3, 3.30%, 08/25/49(a)(b) | | | 108 | | | | 101,397 | |
Series 2021-NQM1, Class B1, 3.51%, 04/25/65(a)(b) | | | 3,310 | | | | 2,701,265 | |
Series 2022-NQM1, Class B1, 4.26%, 12/25/66(a)(b) | | | 1,000 | | | | 833,889 | |
Series 2022-NQM1, Class M1, 4.26%, 12/25/66(a)(b) | | | 3,429 | | | | 3,069,162 | |
Series 2024-RTL1, Class A1, 7.09%, 02/25/29(a)(c) | | | 5,663 | | | | 5,739,834 | |
Miltonia Mortgage Finance Srl, Series 1, Class B, (3-mo. EURIBOR + 1.30%), 4.99%, 04/28/62(b)(f) | | | EUR 1,776 | | | | 1,934,070 | |
Morgan Stanley Resecuritization Trust, Series 2013-R7, Class 1B, (1-mo. CME Term SOFR + 0.27%), 5.71%, 12/26/46(a)(b) | | | USD 677 | | | | 633,617 | |
Morgan Stanley Residential Mortgage Loan Trust | | | | | | | | |
Series 2014-1A, Class B3, 6.95%, 06/25/44(a)(b) | | | 323 | | | | 322,865 | |
Series 2023-NQM1, Class B1, 7.50%, 09/25/68(a)(b) | | | 1,302 | | | | 1,311,020 | |
Mortgage Loan Resecuritization Trust, | | | | | | | | |
Series 2009-RS1, Class A85, (1-mo. LIBOR US + 0.34%), 5.66%, 04/16/36(a)(b) | | | 1,613 | | | | 1,559,755 | |
NACC Reperforming Loan REMIC Trust | | | | | | | | |
Series 2004-R1, Class A1, 6.50%, 03/25/34(a) | | | 1,578 | | | | 1,412,524 | |
Series 2004-R1, Class A2, 7.50%, 03/25/34(a) | | | 362 | | | | 335,163 | |
New Residential Mortgage Loan Trust | | | | | | | | |
Series 2019-2A, Class A1, 4.25%, 12/25/57(a)(b) | | | 681 | | | | 667,725 | |
Series 2020-RPL1, Class B3, 3.86%, 11/25/59(a)(b) | | | 6,210 | | | | 4,625,519 | |
New York Mortgage Trust, Series 2024-RR1, Class A, 7.38%, 05/25/64(a)(c) | | | 7,152 | | | | 7,101,877 | |
NLT Trust, Series 2021-INV2, Class B1, 3.32%, 08/25/56(a)(b) | | | 910 | | | | 685,807 | |
NMLT Trust, Series 2021-INV1, Class B1, 3.61%, 05/25/56(a)(b) | | | 1,327 | | | | 1,002,454 | |
Nomura Asset Acceptance Corp. Alternative | | | | | | | | |
Loan Trust | | | | | | | | |
Series 2001-R1A, Class A, 7.00%, 02/19/30(a)(b) | | | 241 | | | | 236,422 | |
Series 2006-AF1, Class 1A4, 7.13%, 05/25/36(c) | | | 508 | | | | 92,269 | |
Series 2007-2, Class A4, (1-mo. CME Term SOFR + 0.95%), 5.81%, 06/25/37(b) | | | 251 | | | | 201,979 | |
| | |
C O N S O L I D A T E D S C H E D U L E S O F I N V E S T M E N T S | | 45 |
| | |
Consolidated Schedule of Investments (continued) September 30, 2024 | | BlackRock Total Return Fund (Percentages shown are based on Net Assets) |
| | | | | | | | |
| Security | | Par (000) | | | Value | |
|
Collateralized Mortgage Obligations (continued) | |
PRET LLC | | | | | | | | |
Series 2024-NPL1, Class A1, 7.14%, 01/25/54(a)(c) | | | USD 10,610 | | | $ | 10,622,967 | |
Series 2024-NPL2, Class A1, 7.02%, 02/25/54(a)(c) | | | 10,175 | | | | 10,255,736 | |
Series 2024-RN2, Class A1, 7.13%, 04/25/54(a)(c) | | | 2,136 | | | | 2,154,901 | |
PRKCM Trust | | | | | | | | |
Series 2021-AFC2, Class A1, 2.07%, 11/25/56(a)(b) | | | 1,372 | | | | 1,210,598 | |
Series 2022-AFC1, Class A1A, 4.10%, 04/25/57(a)(b) | | | 717 | | | | 703,617 | |
Series 2022-AFC2, Class A1, 5.34%, 08/25/57(a)(b) | | | 5,298 | | | | 5,292,319 | |
PRP Advisors LLC | | | | | | | | |
Series 2022-1, Class A1, 3.72%, 02/25/27(a)(c) | | | 680 | | | | 673,775 | |
Series 2022-NQM1, Class B1, 5.43%, 08/25/67(a)(b) | | | 471 | | | | 450,309 | |
RALI Trust | | | | | | | | |
Series 2006-QA10, Class A2, (1-mo. CME Term SOFR + 0.47%), 5.33%, 12/25/36(b) | | | 2,456 | | | | 2,103,423 | |
Series 2007-QH9, Class A1, 6.51%, 11/25/37(b) | | | 443 | | | | 367,859 | |
Series 2007-QO2, Class A1, (1-mo. CME Term SOFR + 0.26%), 5.12%, 02/25/47(b) | | | 225 | | | | 77,080 | |
RCO VI Mortgage LLC, Series 2022-1, Class A1, 3.00%, 01/25/27(a)(c) | | | 1,417 | | | | 1,403,748 | |
RCO VII Mortgage LLC, Series 2024-1, Class A1, 7.02%, 01/25/29(a)(c) | | | 6,162 | | | | 6,205,713 | |
Reperforming Loan REMIC Trust | | | | | | | | |
Series 2005-R2, Class 1AF1, (1-mo. CME Term SOFR + 0.45%), 5.31%, 06/25/35(a)(b) | | | 181 | | | | 170,652 | |
Series 2005-R3, Class AF, (1-mo. CME Term SOFR + 0.51%), 5.37%, 09/25/35(a)(b) | | | 63 | | | | 52,405 | |
Residential Mortgage Loan Trust | | | | | | | | |
Series 2019-2, Class B2, 6.04%, 05/25/59(a)(b) | | | 2,434 | | | | 2,413,072 | |
Series 2019-3, Class B2, 5.66%, 09/25/59(a)(b) | | | 282 | | | | 275,990 | |
Series 2020-2, Class M1, 3.57%, 05/25/60(a)(b) | | | 7,854 | | | | 7,227,947 | |
RFMSI Series Trust | | | | | | | | |
Series 2006-SA2, Class 2A1, 5.69%, 08/25/36(b) | | | 4,323 | | | | 3,082,341 | |
Series 2007-SA4, Class 3A1, 6.00%, 10/25/37(b) | | | 276 | | | | 176,081 | |
RMF Buyout Issuance Trust | | | | | | | | |
Series 2021-HB1, Class M3, 3.69%, 11/25/31(a)(b) | | | 3,112 | | | | 2,922,005 | |
Series 2021-HB1, Class M6, 6.00%, 11/25/31(a)(b) | | | 2,167 | | | | 1,872,976 | |
Saluda Grade Alternative Mortgage Trust | | | | | | | | |
Series 2024-RTL4, Class A1, 7.50%, 02/25/30(a)(c) | | | 9,935 | | | | 10,055,914 | |
Series 2024-RTL5, Class A1, 7.76%, 04/25/30(a)(c) | | | 5,768 | | | | 5,858,592 | |
Seasoned Credit Risk Transfer Trust, | | | | | | | | |
Series 2018-1, Class BX, 3.81%, 05/25/57(b) | | | 520 | | | | 219,482 | |
| | | | | | | | |
| Security | | Par (000) | | | Value | |
|
Collateralized Mortgage Obligations (continued) | |
Seasoned Loans Structured Transaction Trust | | | | | | | | |
Series 2020-2, Class M1, 4.75%, 09/25/60(a)(b) | | | USD 12,447 | | | $ | 12,291,995 | |
Series 2020-3, Class M1, 4.75%, 04/26/60(a)(b) | | | 580 | | | | 572,480 | |
Sequoia Mortgage Trust, Series 2007-3, | | | | | | | | |
Class 2AA1, 4.66%, 07/20/37(b) | | | 720 | | | | 548,263 | |
SG Residential Mortgage Trust | | | | | | | | |
Series 2022-2, Class A1, 5.35%, 08/25/62(a)(c) | | | 1,127 | | | | 1,127,670 | |
Series 2022-2, Class B1, 5.28%, 08/25/62(a)(b) | | | 2,583 | | | | 2,426,486 | |
Spruce Hill Mortgage Loan Trust, Series 2022- SH1, Class A3, 4.10%, 07/25/57(a)(c) | | | 927 | | | | 854,424 | |
Stratton Mortgage Funding PLC, Series 2024-3, Class C, (1-day SONIA + 1.50%), 6.48%, 06/25/49(b)(f) | | | GBP 492 | | | | 655,276 | |
Structured Adjustable Rate Mortgage Loan Trust, Series 2006-3, Class 4A, 4.14%, 04/25/36(b) | | | USD 505 | | | | 269,435 | |
Structured Asset Mortgage Investments II Trust | | | | | | | | |
Series 2006-AR4, Class 3A1, (1-mo. CME Term SOFR + 0.49%), 5.35%, 06/25/36(b) | | | 1,646 | | | | 1,420,257 | |
Series 2006-AR5, Class 2A1, (1-mo. CME Term SOFR + 0.53%), 5.39%, 05/25/46(b) | | | 283 | | | | 188,562 | |
Thornburg Mortgage Securities Trust, Series 2006-3, Class A1, 4.29%, 06/25/46(b) | | | 957 | | | | 585,592 | |
Toorak Mortgage Corp. | | | | | | | | |
Series 2021-INV1, Class B1, 3.29%, 07/25/56(a)(b) | | | 937 | | | | 749,755 | |
Series 2021-INV2, Class B1, 4.10%, 11/25/56(a)(b) | | | 3,051 | | | | 2,542,818 | |
TVC DSCR | | | | | | | | |
Series 21-1, Class A, 2.38%, 02/01/51(a)(g) | | | 17,804 | | | | 16,338,610 | |
Series 21-1, Class CERT, 0.00%, 02/01/51(e)(g) | | | 7,160 | | | | 6,189,475 | |
TVC Mortgage Trust, Series 2023-RTL1, Class A1, 8.25%, 11/25/27(a)(c) | | | 3,528 | | | | 3,579,414 | |
Verus Securitization Trust | | | | | | | | |
Series 2019-INV2, Class M1, 3.50%, 07/25/59(a)(b) | | | 835 | | | | 814,978 | |
Series 2020-4, Class A3, 3.32%, 05/25/65(a)(c) | | | 557 | | | | 543,009 | |
Series 2020-4, Class M1, 3.29%, 05/25/65(a)(b) | | | 3,120 | | | | 2,945,956 | |
Series 2020-INV1, Class A2, 4.04%, 03/25/60(a)(b) | | | 1,349 | | | | 1,341,702 | |
Series 2020-INV1, Class A3, 4.89%, 03/25/60(a)(b) | | | 1,800 | | | | 1,807,107 | |
Series 2021-3, Class B1, 3.20%, 06/25/66(a)(b) | | | 1,668 | | | | 1,249,674 | |
Series 2021-6, Class B1, 4.05%, 10/25/66(a)(b) | | | 291 | | | | 244,032 | |
Series 2021-6, Class M1, 2.94%, 10/25/66(a)(b) | | | 806 | | | | 649,282 | |
Series 2022-1, Class B1, 4.01%, 01/25/67(a)(b) | | | 1,354 | | | | 1,064,769 | |
Series 2022-3, Class B1, 4.07%, 02/25/67(a)(b) | | | 3,879 | | | | 3,129,227 | |
Series 2022-4, Class B1, 4.78%, 04/25/67(a)(b) | | | 616 | | | | 574,776 | |
| | |
| 46 | | 2 0 2 4 B L A C K R O C K A N N U A L F I N A N C I A L S T A T E M E N T S A N D A D D I T I O N A L I N F O R M A T I O N |
| | |
Consolidated Schedule of Investments (continued) September 30, 2024 | | BlackRock Total Return Fund (Percentages shown are based on Net Assets) |
| | | | | | | | |
| Security | | Par (000) | | | Value | |
|
Collateralized Mortgage Obligations (continued) | |
Verus Securitization Trust Series 2024-7, Class B1,
6.50%, 09/25/69(a)(b) | | | USD 626 | | | $ | 624,855 | |
Visio Trust | | | | | | | | |
Series 2019-2, Class B1, 3.91%, 11/25/54(a)(b) | | | 906 | | | | 730,810 | |
Series 2020-1, Class M1, 4.45%, 08/25/55(a)(b) | | | 1,100 | | | | 1,042,852 | |
Series 2022-1, Class B1, 5.95%, 08/25/57(a)(b) | | | 2,429 | | | | 2,230,600 | |
Vista Point Securitization Trust | | | | | | | | |
Series 2020-2, Class A3, 2.50%, 04/25/65(a)(b) | | | 726 | | | | 694,480 | |
Series 2020-2, Class B1, 4.90%, 04/25/65(a)(b) | | | 640 | | | | 632,117 | |
Series 2020-2, Class M1, 3.40%, 04/25/65(a)(b) | | | 1,480 | | | | 1,391,966 | |
Washington Mutual Mortgage Pass-Through Certificates Trust | | | | | | | | |
Series 2006-1, Class 4CB, 6.50%, 02/25/36 | | | 794 | | | | 625,226 | |
Series 2006-4, Class 1A1, 6.00%, 04/25/36 | | | 1,612 | | | | 1,488,999 | |
Series 2006-4, Class 3A1, 7.00%, 05/25/36(c) | | | 734 | | | | 638,827 | |
Series 2006-4, Class 3A5, 6.85%, 05/25/36(c) | | | 284 | | | | 247,699 | |
Series 2006-AR10, Class A2A, (1-mo. CME Term SOFR + 0.45%), 5.31%, 12/25/36(b) | | | 654 | | | | 525,710 | |
Series 2007-HY3, Class 4A1, 5.19%, 03/25/37(b) | | | 27 | | | | 25,008 | |
Series 2007-OA1, Class 2A, (12-mo. Federal Reserve Cumulative Average US + 0.72%), 5.84%, 12/25/46(b) | | | 232 | | | | 183,261 | |
Series 2007-OA3, Class 5A, (12-mo. Federal Reserve Cumulative Average US + 1.25%), 6.37%, 04/25/47(b) | | | 900 | | | | 770,952 | |
Series 2007-OA5, Class 1A, (12-mo. Federal Reserve Cumulative Average US + 0.75%), 5.87%, 06/25/47(b) | | | 2,280 | | | | 1,891,748 | |
Series 2007-OA5, Class 2A, (12-mo. Federal Reserve Cumulative Average US + 0.80%), 5.92%, 06/25/47(b) | | | 956 | | | | 773,310 | |
Series 2007-OC2, Class A3, (1-mo. CME Term SOFR + 0.73%), 5.59%, 06/25/37(b) | | | . 889 | | | | 812,273 | |
Western Alliance Bank | | | | | | | | |
Series 2021-CL2, Class M1, (SOFR (30-day) + 3.15%), 8.43%, 07/25/59(a)(b) | | | 6,086 | | | | 6,300,506 | |
Series 2021-CL2, Class M2, (SOFR (30-day) + 3.70%), 8.98%, 07/25/59(a)(b) | | | 8,011 | | | | 8,309,357 | |
| | | | | | | | |
| | | | | | | 936,258,034 | |
|
Commercial Mortgage-Backed Securities — 5.2% | |
1211 Avenue of the Americas Trust | | | | | | | | |
Series 2015-1211, Class C, 4.28%, 08/10/35(a)(b) | | | 600 | | | | 580,726 | |
Series 2015-1211, Class D, 4.28%, 08/10/35(a)(b) | | | 4,972 | | | | 4,734,847 | |
Series 2015-1211, Class E, 4.28%, 08/10/35(a)(b) | | | 1,110 | | | | 1,030,082 | |
245 Park Avenue Trust | | | | | | | | |
Series 2017-245P, Class D, 3.78%, 06/05/37(a)(b) | | | 480 | | | | 432,337 | |
Series 2017-245P, Class E, 3.78%, 06/05/37(a)(b) | | | 2,463 | | | | 2,162,226 | |
| | | | | | | | |
| Security | | Par (000) | | | Value | |
|
Commercial Mortgage-Backed Securities (continued) | |
280 Park Avenue Mortgage Trust | | | | | | | | |
Series 2017-280P, Class B, (1-mo. CME Term SOFR + 1.38%), 6.50%, 09/15/34(a)(b) | | | USD 997 | | | $ | 957,243 | |
Series 2017-280P, Class D, (1-mo. CME Term SOFR + 1.84%), 6.95%, 09/15/34(a)(b) | | | 2,920 | | | | 2,730,200 | |
Series 2017-280P, Class E, (1-mo. CME Term SOFR + 2.42%), 7.54%, 09/15/34(a)(b) | | | 7,007 | | | | 6,482,067 | |
3650R Commercial Mortgage Trust, Series 2022-PF2, Class A5, 5.47%, 11/15/55(b) | | | 1,000 | | | | 1,039,517 | |
ACREC LLC, Series 2023-FL2, Class A, (1-mo. CME Term SOFR + 2.23%), 7.33%, 02/19/38(a)(b) | | | 4,027 | | | | 4,040,051 | |
Alen Mortgage Trust | | | | | | | | |
Series 2021-ACEN, Class A, (1-mo. CME Term SOFR + 1.26%), 6.36%, 04/15/34(a)(b) | | | 1,144 | | | | 1,035,320 | |
Series 2021-ACEN, Class D, (1-mo. CME Term SOFR + 3.21%), 8.31%, 04/15/34(a)(b) | | | 2,670 | | | | 1,343,010 | |
Arbor Multifamily Mortgage Securities Trust | | | | | | | | |
Series 2020-MF1, Class E, 1.75%, 05/15/53(a) | | | 636 | | | | 483,369 | |
Series 2021-MF3, Class A5, 2.58%, 10/15/54(a) | | | 1,529 | | | | 1,353,623 | |
AREIT LLC | | | | | | | | |
Series 2022-CRE7, Class A, (1-mo. CME Term SOFR + 2.24%), 7.33%, 06/17/39(a)(b) | | | 2,560 | | | | 2,567,092 | |
Series 2023-CRE8, Class A, (1-mo. CME Term SOFR + 2.11%), 7.20%, 08/17/41(a)(b) | | | 2,932 | | | | 2,939,095 | |
AREIT Ltd., Series 2024-CRE9, Class A, (1-mo. CME Term SOFR + 1.69%), 6.77%, 05/17/41(a)(b) | | | 14,240 | | | | 14,244,414 | |
ARES Commercial Mortgage Trust | | | | | | | | |
Series 2024-IND, Class A, (1-mo. CME Term SOFR + 1.69%), 6.79%, 07/15/41(a)(b) | | | 8,860 | | | | 8,871,075 | |
Series 2024-IND2, Class A, (1-mo. CME Term SOFR + 1.44%), 10/15/34(a)(b)(d) | | | 12,870 | | | | 12,837,825 | |
Ashford Hospitality Trust, Series 2018-ASHF, Class D, (1-mo. CME Term SOFR + 2.27%), 7.37%, 04/15/35(a)(b) | | | 1,525 | | | | 1,497,839 | |
Atrium Hotel Portfolio Trust, Series 2017-ATRM, Class D, (1-mo. CME Term SOFR + 2.25%), 7.34%, 12/15/36(a)(b) | | | 3,269 | | | | 3,072,860 | |
Banc of America Merrill Lynch Commercial Mortgage Securities Trust | | | | | | | | |
Series 2015-200P, Class F, 3.72%, 04/14/33(a)(b) | | | 1,641 | | | | 1,575,659 | |
Series 2017-SCH, Class AF, (1-mo. CME Term SOFR + 1.05%), 6.14%, 11/15/33(a)(b) | | | 150 | | | | 149,779 | |
Series 2017-SCH, Class BF, (1-mo. CME Term SOFR + 1.45%), 6.54%, 11/15/33(a)(b) | | | 2,870 | | | | 2,866,142 | |
Series 2017-SCH, Class CL, (1-mo. CME Term SOFR + 1.55%), 6.64%, 11/15/32(a)(b) | | | 970 | | | | 967,935 | |
| | |
C O N S O L I D A T E D S C H E D U L E S O F I N V E S T M E N T S | | 47 |
| | |
Consolidated Schedule of Investments (continued) September 30, 2024 | | BlackRock Total Return Fund (Percentages shown are based on Net Assets) |
| | | | | | | | |
| Security | | Par (000) | | | Value | |
|
Commercial Mortgage-Backed Securities (continued) | |
Banc of America Merrill Lynch Commercial Mortgage Securities Trust | | | | | | | | |
Series 2017-SCH, Class DL, (1-mo. CME Term SOFR + 2.05%), 7.14%, 11/15/32(a)(b) | | | USD 1,930 | | | $ | 1,925,983 | |
Series 2024-BHP, Class A, (1-mo. CME Term SOFR + 2.35%), 7.45%, 08/15/39(a)(b) | | | 5,800 | | | | 5,819,994 | |
BANK5 Trust, Series 2024-5YR6, Class A3, 6.23%, 05/15/57 | | | 7,430 | | | | 7,908,936 | |
Bayview Commercial Asset Trust | | | | | | | | |
Series 2005-3A, Class A1, (1-mo. CME Term SOFR + 0.59%), 5.45%, 11/25/35(a)(b) | | | 1,262 | | | | 1,226,700 | |
Series 2005-4A, Class A1, (1-mo. CME Term SOFR + 0.56%), 5.42%, 01/25/36(a)(b) | | | 2,625 | | | | 2,519,550 | |
Series 2005-4A, Class A2, (1-mo. CME Term SOFR + 0.70%), 5.55%, 01/25/36(a)(b) | | | 40 | | | | 38,205 | |
Series 2005-4A, Class M1, (1-mo. CME Term SOFR + 0.79%), 5.64%, 01/25/36(a)(b) | | | 106 | | | | 100,926 | |
Series 2006-1A, Class A2, (1-mo. CME Term SOFR + 0.65%), 5.51%, 04/25/36(a)(b) | | | 139 | | | | 132,088 | |
Series 2006-2A, Class A2, (1-mo. CME Term SOFR + 0.53%), 5.39%, 07/25/36(a)(b) | | | 452 | | | | 439,956 | |
Series 2006-3A, Class A1, (1-mo. CME Term SOFR + 0.49%), 5.34%, 10/25/36(a)(b) | | | 183 | | | | 177,459 | |
Series 2006-3A, Class A2, (1-mo. CME Term SOFR + 0.56%), 5.42%, 10/25/36(a)(b) | | | 127 | | | | 123,941 | |
Series 2006-4A, Class A1, (1-mo. CME Term SOFR + 0.46%), 5.31%, 12/25/36(a)(b) | | | 784 | | | | 756,320 | |
Series 2007-1, Class A2, (1-mo. CME Term SOFR + 0.52%), 5.37%, 03/25/37(a)(b) | | | 616 | | | | 588,897 | |
Series 2007-5A, Class A4, (1-mo. CME Term SOFR + 1.61%), 6.47%, 10/25/37(a)(b) | | | 3,034 | | | | 1,770,003 | |
Series 2007-6A, Class A4A, (1-mo. CME Term SOFR + 1.61%), 6.47%, 12/25/37(a)(b) | | | 1,608 | | | | 1,418,984 | |
Series 2008-2, Class A4A, (1-mo. CME Term SOFR + 2.61%), 7.47%, 04/25/38(a)(b) | | | 1,127 | | | | 1,121,111 | |
BBCMS Mortgage Trust | | | | | | | | |
Series 2015-SRCH, Class A1, 3.31%, 08/10/35(a) | | | 1,260 | | | | 1,215,764 | |
Series 2018-CHRS, Class E, 4.41%, 08/05/38(a)(b) | | | 640 | | | | 521,839 | |
Series 2018-TALL, Class A, (1-mo. CME Term SOFR + 0.92%), 6.02%, 03/15/37(a)(b) | | | 881 | | | | 832,545 | |
Series 2018-TALL, Class B, (1-mo. CME Term SOFR + 1.17%), 6.27%, 03/15/37(a)(b) | | | 1,166 | | | | 1,066,890 | |
Series 2023-5C23, Class D, 7.70%, 12/15/56(a)(b) | | | 553 | | | | 552,862 | |
BB-UBS Trust, Series 2012-SHOW, Class E, 4.16%, 11/05/36(a)(b) | | | 790 | | | | 785,338 | |
BDS LLC, Series 2022-FL12, Class A, (1-mo. CME Term SOFR + 2.14%), 7.10%, 08/19/38(a)(b) | | | 3,060 | | | | 3,067,621 | |
BFLD Trust | | | | | | | | |
Series 2020-EYP, Class E, (1-mo. CME Term SOFR + 3.81%), 8.91%, 10/15/35(a)(b) | | | 3,978 | | | | 209,670 | |
Series 2024-VICT, Class A, (1-mo. CME Term SOFR + 1.89%), 6.99%, 07/15/41(a)(b) | | | 4,170 | | | | 4,170,000 | |
BHMS, Series 2018-ATLS, Class A, (1-mo. CME Term SOFR + 1.55%), 6.64%, 07/15/35(a)(b) | | | 3,695 | | | | 3,694,322 | |
| | | | | | | | |
| Security | | Par (000) | | | Value | |
|
Commercial Mortgage-Backed Securities (continued) | |
BLP Commercial Mortgage Trust, Series 2023- IND, Class A, (1-mo. CME Term SOFR + 1.69%), 6.79%, 03/15/40(a)(b) | | | USD 3,610 | | | $ | 3,600,993 | |
BMO Mortgage Trust | | | | | | | | |
Series 2024-5C5, Class A3, 5.86%, 02/15/57 | | | 1,468 | | | | 1,545,826 | |
Series 2024-5C6, Class A3, 5.32%, 09/15/57 | | | 570 | | | | 586,822 | |
BMP, Series 2024-MF23, Class E, (1-mo. CME Term SOFR + 3.39%), 8.49%, 06/15/41(a)(b) | | | 2,636 | | | | 2,596,454 | |
BPR Trust | | | | | | | | |
Series 2022-SSP, Class A, (1-mo. CME Term SOFR + 3.00%), 8.10%, 05/15/39(a)(b) | | | 1,270 | | | | 1,271,588 | |
Series 2023-STON, Class A, 7.50%, 12/05/39(a) | | | 1,145 | | | | 1,207,455 | |
BSST Mortgage Trust | | | | | | | | |
Series 2021-SSCP, Class A, (1-mo. CME Term SOFR + 0.86%), 5.96%, 04/15/36(a)(b) | | | 4,841 | | | | 4,795,719 | |
Series 2021-SSCP, Class B, (1-mo. CME Term SOFR + 1.21%), 6.31%, 04/15/36(a)(b) | | | 3,597 | | | | 3,530,023 | |
Series 2021-SSCP, Class C, (1-mo. CME Term SOFR + 1.46%), 6.56%, 04/15/36(a)(b) | | | 4,418 | | | | 4,335,358 | |
Series 2021-SSCP, Class D, (1-mo. CME Term SOFR + 1.71%), 6.81%, 04/15/36(a)(b) | | | 4,138 | | | | 4,038,189 | |
Series 2021-SSCP, Class E, (1-mo. CME Term SOFR + 2.21%), 7.31%, 04/15/36(a)(b) | | | 3,519 | | | | 3,400,089 | |
Series 2021-SSCP, Class F, (1-mo. CME Term SOFR + 3.01%), 8.11%, 04/15/36(a)(b) | | | 3,382 | | | | 3,272,252 | |
Series 2021-SSCP, Class G, (1-mo. CME Term SOFR + 3.91%), 9.01%, 04/15/36(a)(b) | | | 3,806 | | | | 3,641,993 | |
Series 2021-SSCP, Class H, (1-mo. CME Term SOFR + 5.02%), 10.11%, 04/15/36(a)(b) | | | 2,674 | | | | 2,554,323 | |
BWAY Mortgage Trust | | | | | | | | |
Series 2013-1515, Class A2, 3.45%, 03/10/33(a) | | | 1,962 | | | | 1,909,546 | |
Series 2013-1515, Class D, 3.63%, 03/10/33(a) | | | 1,400 | | | | 1,235,537 | |
Series 2013-1515, Class E, 3.72%, 03/10/33(a) | | | 250 | | | | 216,882 | |
Series 2013-1515, Class F, 4.06%, 03/10/33(a)(b) | | | 250 | | | | 213,132 | |
BX Commercial Mortgage Trust | | | | | | | | |
Series 2020-VIV2, Class C, 3.66%, 03/09/44(a)(b) | | | 2,550 | | | | 2,322,661 | |
Series 2020-VIV3, Class B, 3.66%, 03/09/44(a)(b) | | | 3,862 | | | | 3,559,964 | |
Series 2020-VIV4, Class A, 2.84%, 03/09/44(a) | | | 4,397 | | | | 3,985,710 | |
Series 2020-VKNG, Class A, (1-mo. CME Term SOFR + 1.04%), 6.14%, 10/15/37(a)(b) | | | 444 | | | | 443,236 | |
Series 2020-VKNG, Class F, (1-mo. CME Term SOFR + 2.86%), 7.96%, 10/15/37(a)(b) | | | 3,269 | | | | 3,222,225 | |
| | |
| 48 | | 2 0 2 4 B L A C K R O C K A N N U A L F I N A N C I A L S T A T E M E N T S A N D A D D I T I O N A L I N F O R M A T I O N |
| | |
Consolidated Schedule of Investments (continued) September 30, 2024 | | BlackRock Total Return Fund (Percentages shown are based on Net Assets) |
| | | | | | | | |
| Security | | Par (000) | | | Value | |
|
Commercial Mortgage-Backed Securities (continued) | |
BX Commercial Mortgage Trust | | | | | | | | |
Series 2021-NWM, Class A, (1-mo. CME Term SOFR + 1.02%), 6.12%, 02/15/33(a)(b) | | | USD 14,244 | | | $ | 14,066,672 | |
Series 2021-NWM, Class B, (1-mo. CME Term SOFR + 2.26%), 7.36%, 02/15/33(a)(b) | | | 8,727 | | | | 8,651,543 | |
Series 2021-NWM, Class C, (1-mo. CME Term SOFR + 4.36%), 9.46%, 02/15/33(a)(b) | | | 5,842 | | | | 5,835,686 | |
Series 2021-SOAR, Class G, (1-mo. CME Term SOFR + 2.91%), 8.01%, 06/15/38(a)(b) | | | 3,573 | | | | 3,519,789 | |
Series 2022-CSMO, Class B, (1-mo. CME Term SOFR + 3.14%), 8.24%, 06/15/27(a)(b) | | | 3,905 | | | | 3,922,084 | |
Series 2023-VLT3, Class A, (1-mo. CME Term SOFR + 1.94%), 7.04%, 11/15/28(a)(b) | | | 1,720 | | | | 1,711,402 | |
Series 2023-XL3, Class A, (1-mo. CME Term SOFR + 1.76%), 6.86%, 12/09/40(a)(b) | | | 4,451 | | | | 4,464,710 | |
Series 2023-XL3, Class D, (1-mo. CME Term SOFR + 3.59%), 8.69%, 12/09/40(a)(b) | | | 5,910 | | | | 5,915,671 | |
Series 2024-AIR2, Class A, (1-mo. CME Term SOFR + 1.49%), 6.59%, 10/15/41(a)(b) | | | 6,160 | | | | 6,160,000 | |
Series 2024-AIRC, Class A, (1-mo. CME Term SOFR + 1.69%), 6.79%, 08/15/39(a)(b) | | | 7,810 | | | | 7,819,763 | |
Series 2024-KING, Class A, (1-mo. CME Term SOFR + 1.54%), 6.64%, 05/15/34(a)(b) | | | 4,390 | | | | 4,388,628 | |
Series 2024-MDHS, Class A, (1-mo. CME Term SOFR + 1.64%), 6.74%, 05/15/41(a)(b) | | | 16,349 | | | | 16,369,392 | |
Series 2024-MF, Class A, (1-mo. CME Term SOFR + 1.44%), 6.54%, 02/15/39(a)(b) | | | 1,364 | | | | 1,362,322 | |
Series 2024-MF, Class E, (1-mo. CME Term SOFR + 3.74%), 8.84%, 02/15/39(a)(b) | | | 3,385 | | | | 3,375,894 | |
Series 2024-XL4, Class A, (1-mo. CME Term SOFR + 1.44%), 6.54%, 02/15/39(a)(b) | | | 3,237 | | | | 3,236,791 | |
Series 2024-XL4, Class D, (1-mo. CME Term SOFR + 3.14%), 8.24%, 02/15/39(a)(b) | | | 9,516 | | | | 9,527,867 | |
Series 2024-XL4, Class E, (1-mo. CME Term SOFR + 4.19%), 9.29%, 02/15/39(a)(b) | | | 5,152 | | | | 5,037,991 | |
Series 2024-XL5, Class A, (1-mo. CME Term SOFR + 1.39%), 6.49%, 03/15/41(a)(b) | | | 214 | | | | 214,513 | |
BX Trust | | | | | | | | |
Series 2019-OC11, Class A, 3.20%, 12/09/41(a) | | | 693 | | | | 643,931 | |
Series 2019-OC11, Class D, 4.08%, 12/09/41(a)(b) | | | 8,267 | | | | 7,610,327 | |
Series 2021-ARIA, Class A, (1-mo. CME Term SOFR + 1.01%), 6.11%, 10/15/36(a)(b) | | | 402 | | | | 399,739 | |
Series 2021-LBA, Class AJV, (1-mo. CME Term SOFR + 0.91%), 6.01%, 02/15/36(a)(b) | | | 4,964 | | | | 4,940,720 | |
Series 2021-LBA, Class AV, (1-mo. CME Term SOFR + 0.91%), 6.01%, 02/15/36(a)(b) | | | 964 | | | | 955,863 | |
| | | | | | | | |
| Security | | Par (000) | | | Value | |
|
Commercial Mortgage-Backed Securities (continued) | |
BX Trust | | | | | | | | |
Series 2021-LBA, Class FJV, (1-mo. CME Term SOFR + 2.51%), 7.61%, 02/15/36(a)(b) | | | USD 6,390 | | | $ | 6,170,967 | |
Series 2021-LBA, Class FV, (1-mo. CME Term SOFR + 2.51%), 7.61%, 02/15/36(a)(b) | | | 4,055 | | | | 3,916,258 | |
Series 2021-LBA, Class GJV, (1-mo. CME Term SOFR + 3.11%), 8.21%, 02/15/36(a)(b) | | | 1,244 | | | | 1,179,746 | |
Series 2021-LBA, Class GV, (1-mo. CME Term SOFR + 3.11%), 8.21%, 02/15/36(a)(b) | | | 4,206 | | | | 3,988,209 | |
Series 2021-MFM1, Class E, (1-mo. CME Term SOFR + 2.36%), 7.46%, 01/15/34(a)(b) | | | 1,155 | | | | 1,136,231 | |
Series 2021-MFM1, Class F, (1-mo. CME Term SOFR + 3.11%), 8.21%, 01/15/34(a)(b) | | | 1,785 | | | | 1,752,400 | |
Series 2021-VIEW, Class F, (1-mo. CME Term SOFR + 4.04%), 9.14%, 06/15/36(a)(b) | | | 1,482 | | | | 1,353,062 | |
Series 2022-GPA, Class A, (1-mo. CME Term SOFR + 2.17%), 7.26%, 08/15/39(a)(b) | | | 19,620 | | | | 19,619,549 | |
Series 2022-GPA, Class B, (1-mo. CME Term SOFR + 2.66%), 7.76%, 08/15/41(a)(b) | | | 609 | | | | 608,510 | |
Series 2022-GPA, Class D, (1-mo. CME Term SOFR + 4.06%), 9.16%, 08/15/43(a)(b) | | | 3,097 | | | | 3,087,823 | |
Series 2022-LBA6, Class A, (1-mo. CME Term SOFR + 1.00%), 6.10%, 01/15/39(a)(b) | | | 5,143 | | | | 5,110,856 | |
Series 2022-LBA6, Class D, (1-mo. CME Term SOFR + 2.00%), 7.10%, 01/15/39(a)(b) | | | 2,890 | | | | 2,855,681 | |
Series 2022-VAMF, Class A, (1-mo. CME Term SOFR + 0.85%), 5.95%, 01/15/39(a)(b) | | | 1,547 | | | | 1,534,431 | |
Series 2022-VAMF, Class B, (1-mo. CME Term SOFR + 1.28%), 6.38%, 01/15/39(a)(b) | | | 673 | | | | 666,691 | |
Series 2023-DELC, Class A, (1-mo. CME Term SOFR + 2.69%), 7.79%, 05/15/38(a)(b) | | | 8,160 | | | | 8,190,600 | |
Series 2023-DELC, Class D, (1-mo. CME Term SOFR + 4.39%), 9.48%, 05/15/38(a)(b) | | | 461 | | | | 465,034 | |
Series 2024-CNYN, Class A, (1-mo. CME Term SOFR + 1.44%), 6.54%, 04/15/41(a)(b) | | | 5,774 | | | | 5,768,236 | |
Series 2024-CNYN, Class D, (1-mo. CME Term SOFR + 2.69%), 7.79%, 04/15/41(a)(b) | | | 2,246 | | | | 2,247,076 | |
Series 2024-CNYN, Class E, (1-mo. CME Term SOFR + 3.69%), 8.79%, 04/15/41(a)(b) | | | 3,624 | | | | 3,593,933 | |
Series 2024-PALM, Class A, (1-mo. CME Term SOFR + 1.54%), 6.64%, 06/15/37(a)(b) | | | 15,530 | | | | 15,525,147 | |
Series 2024-PAT, Class A, (1-mo. CME Term SOFR + 2.09%), 7.19%, 03/15/41(a)(b) | | | 3,750 | | | | 3,761,719 | |
Series 2024-PAT, Class C, (1-mo. CME Term SOFR + 4.44%), 9.54%, 03/15/41(a)(b) | | | 8,022 | | | | 7,992,802 | |
| | |
C O N S O L I D A T E D S C H E D U L E S O F I N V E S T M E N T S | | 49 |
| | |
Consolidated Schedule of Investments (continued) September 30, 2024 | | BlackRock Total Return Fund (Percentages shown are based on Net Assets) |
| | | | | | | | |
| Security | | Par (000) | | | Value | |
|
Commercial Mortgage-Backed Securities (continued) | |
BX Trust | | | | | | | | |
Series 2024-PAT, Class D, (1-mo. CME Term SOFR + 5.39%), 10.49%, 03/15/41(a)(b) | | | USD 3,845 | | | $ | 3,842,017 | |
Series 2024-VLT4, Class A, (1-mo. CME Term SOFR + 1.49%), 6.59%, 07/15/29(a)(b) | | | 18,600 | | | | 18,600,000 | |
Series 2024-VLT4, Class E, (1-mo. CME Term SOFR + 2.89%), 7.99%, 07/15/29(a)(b) | | | 3,100 | | | | 3,092,250 | |
Series 2024-VLT4, Class F, (1-mo. CME Term SOFR + 3.94%), 9.03%, 07/15/29(a)(b) | | | 7,980 | | | | 7,900,185 | |
BXP Trust | | | | | | | | |
Series 2017-CC, Class D, 3.67%, 08/13/37(a)(b) | | | 750 | | | | 644,526 | |
Series 2017-CC, Class E, 3.67%, 08/13/37(a)(b) | | | 1,450 | | | | 1,163,960 | |
Series 2017-GM, Class D, 3.54%, 06/13/39(a)(b) | | | 590 | | | | 549,997 | |
Series 2017-GM, Class E, 3.54%, 06/13/39(a)(b) | | | 1,240 | | | | 1,134,467 | |
Series 2021-601L, Class D, 2.87%, 01/15/44(a)(b) | | | 2,010 | | | | 1,475,556 | |
CALI Mortgage Trust, Series 2024-SUN, Class A, (1-mo. CME Term SOFR + 1.89%), 6.99%, 07/15/41(a)(b) | | | 3,350 | | | | 3,352,094 | |
CAMB Commercial Mortgage Trust, Series 2019-LIFE, Class D, (1-mo. CME Term SOFR + 2.05%), 7.14%, 12/15/37(a)(b) | | | 3,619 | | | | 3,613,977 | |
Cassia SRL, Series 2022-1A, Class A, (3-mo. EURIBOR + 2.50%), 6.04%, 05/22/34(a)(b) | | | EUR 7,964 | | | | 8,838,354 | |
CD Mortgage Trust | | | | | | | | |
Series 2017-CD3, Class A4, 3.63%, 02/10/50 | | | USD 850 | | | | 806,465 | |
Series 2017-CD5, Class B, 3.96%, 08/15/50(b) | | | 2,091 | | | | 1,994,020 | |
Series 2017-CD6, Class B, 3.91%, 11/13/50(b) | | | 597 | | | | 556,878 | |
CENT Trust, Series 2023-CITY, Class A, (1-mo. CME Term SOFR + 2.62%), 7.72%, 09/15/38(a)(b) | | | 9,482 | | | | 9,499,608 | |
CFCRE Commercial Mortgage Trust, Series 2016-C3, Class A3, 3.87%, 01/10/48 | | | 410 | | | | 405,469 | |
CFK Trust, Series 2019-FAX, Class D, 4.79%, 01/15/39(a)(b) | | | 2,643 | | | | 2,422,104 | |
Citigroup Commercial Mortgage Trust | | | | | | | | |
Series 2015-GC27, Class B, 3.77%, 02/10/48 | | | 990 | | | | 980,306 | |
Series 2015-P1, Class D, 3.23%, 09/15/48(a) . | | | 1,007 | | | | 857,404 | |
Series 2016-GC37, Class C, 5.08%, 04/10/49(b) | | | 640 | | | | 538,800 | |
Series 2020-420K, Class E, 3.42%, 11/10/42(a)(b) | | | 1,540 | | | | 1,283,282 | |
COAST Commercial Mortgage Trust | | | | | | | | |
Series 2023-2HTL, Class A, (1-mo. CME Term SOFR + 2.59%), 7.69%, 08/15/36(a)(b) | | | 2,681 | | | | 2,678,002 | |
Series 2023-2HTL, Class D, (1-mo. CME Term SOFR + 4.44%), 9.54%, 08/15/36(a)(b) | | | 4,620 | | | | 4,588,248 | |
| | | | | | | | |
| Security | | Par (000) | | | Value | |
|
Commercial Mortgage-Backed Securities (continued) | |
Commercial Mortgage Trust | | | | | | | | |
Series 2015-LC19, Class B, 3.83%, 02/10/48(b) | | | USD 512 | | | $ | 494,723 | |
Series 2016-667M, Class D, 3.29%, 10/10/36(a)(b) | | | 630 | | | | 506,994 | |
Series 2024-WCL1, Class A, (1-mo. CME Term SOFR + 1.84%), 6.92%, 06/15/41(a)(b) | | | 8,360 | | | | 8,326,038 | |
Series 2024-WCL1, Class B, (1-mo. CME Term SOFR + 2.59%), 7.67%, 06/15/41(a)(b) | | | 2,509 | | | | 2,495,671 | |
Series 2024-WCL1, Class E, (1-mo. CME Term SOFR + 4.49%), 9.57%, 06/15/41(a)(b) | | | 3,312 | | | | 3,295,721 | |
CONE Trust | | | | | | | | |
Series 2024-DFW1, Class A, (1-mo. CME Term SOFR + 1.64%), 6.74%, 08/15/41(a)(b) | | | 3,280 | | | | 3,280,000 | |
Series 2024-DFW1, Class E, (1-mo. CME Term SOFR + 3.89%), 8.99%, 08/15/41(a)(b) | | | 3,244 | | | | 3,238,580 | |
Credit Suisse Mortgage Capital Certificates, Series 2022-LION, Class A, (1-mo. CME Term SOFR + 3.44%), 8.54%, 02/15/25(a)(b)(g) | | | 10,100 | | | | 9,856,157 | |
Credit Suisse Mortgage Trust | | | | | | | | |
Series 2017-CALI, Class C, 3.90%, 11/10/32(a)(b) | | | 1,729 | | | | 570,572 | |
Series 2017-PFHP, Class A, (1-mo. CME Term SOFR + 1.00%), 6.09%, 12/15/30(a)(b) | | | 900 | | | | 867,549 | |
Series 2017-TIME, Class A, 3.65%, 11/13/39(a) | | | 850 | | | | 705,796 | |
Series 2020-FACT, Class E, (1-mo. CME Term SOFR + 5.23%), 10.32%, 10/15/37(a)(b) | | | 2,484 | | | | 2,279,121 | |
Series 2020-NET, Class D, 3.83%, 08/15/37(a)(b) | | | 710 | | | | 679,448 | |
Series 2021-BHAR, Class A, (1-mo. CME Term SOFR + 1.26%), 6.36%, 11/15/38(a)(b) | | | 641 | | | | 635,191 | |
Series 2021-BHAR, Class B, (1-mo. CME Term SOFR + 1.61%), 6.71%, 11/15/38(a)(b) | | | 1,150 | | | | 1,138,859 | |
CRSO Trust, Series 2023-BRND, 7.12%, 07/10/40(a) | | | 2,271 | | | | 2,413,283 | |
CSAIL Commercial Mortgage Trust | | | | | | | | |
Series 2016-C5, Class B, 4.46%, 11/15/48(b) . | | | 2,410 | | | | 2,363,230 | |
Series 2018-CX12, Class C, 4.88%, 08/15/51(b) | | | 570 | | | | 519,985 | |
DBGS Mortgage Trust | | | | | | | | |
Series 2018-5BP, Class B, (1-mo. CME Term SOFR + 1.08%), 6.17%, 06/15/33(a)(b) | | | 2,890 | | | | 2,564,875 | |
Series 2024-SBL, Class A, (1-mo. CME Term SOFR + 1.88%), 6.98%, 08/15/34(a)(b) | | | 790 | | | | 788,689 | |
DBSG Mortgage Trust, Series 2024-ALTA, Class A, 6.14%, 06/10/37(a)(b) | | | 2,584 | | | | 2,634,745 | |
DBWF Mortgage Trust, Series 2024-LCRS, Class A, (1-mo. CME Term SOFR + 1.74%), 6.84%,
04/15/37(a)(b) | | | 705 | | | | 698,611 | |
| | |
| 50 | | 2 0 2 4 B L A C K R O C K A N N U A L F I N A N C I A L S T A T E M E N T S A N D A D D I T I O N A L I N F O R M A T I O N |
| | |
Consolidated Schedule of Investments (continued) September 30, 2024 | | BlackRock Total Return Fund (Percentages shown are based on Net Assets) |
| | | | | | | | |
| Security | | Par (000) | | | Value | |
|
Commercial Mortgage-Backed Securities (continued) | |
DC Trust | | | | | | | | |
Series 2024-HLTN, Class A, 5.93%, 04/13/40(a)(b) | | | USD 830 | | | $ | 846,364 | |
Series 2024-HLTN, Class F, 10.66%, 04/13/40(a)(b) | | | 2,180 | | | | 2,243,221 | |
Deutsche Bank JPMorgan Mortgage Trust, Series 2016-C1, Class A4, 3.28%, 05/10/49 | | | 1,430 | | | | 1,393,862 | |
Deutsche Bank UBS Mortgage Trust | | | | | | | | |
Series 2017-BRBK, Class D, 3.65%, 10/10/34(a)(b) | | | 1,800 | | | | 1,766,188 | |
Series 2017-BRBK, Class E, 3.65%, 10/10/34(a)(b) | | | 3,097 | | | | 3,023,599 | |
Series 2017-BRBK, Class F, 3.65%, 10/10/34(a)(b) | | | 920 | | | | 893,518 | |
DK Trust | | | | | | | | |
Series 2024-SPBX, Class A, (1-mo. CME Term SOFR + 1.50%), 6.60%, 03/15/34(a)(b) | | | 4,850 | | | | 4,846,969 | |
Series 2024-SPBX, Class E, (1-mo. CME Term SOFR + 4.00%), 9.10%, 03/15/34(a)(b) | | | 13,906 | | | | 13,916,498 | |
ELM Trust | | | | | | | | |
Series 2024-ELM, Class A10, 5.99%, 06/10/39(a)(b) | | | 4,860 | | | | 4,969,888 | |
Series 2024-ELM, Class A15, 5.99%, 06/10/39(a)(b) | | | 4,860 | | | | 4,969,888 | |
Series 2024-ELM, Class E10, 8.05%, 06/10/39(a)(b) | | | 6,375 | | | | 6,504,482 | |
ELP Commercial Mortgage Trust, Series 2021- ELP, Class G, (1-mo. CME Term SOFR + 3.23%), 8.33%, 11/15/38(a)(b) | | | 2,485 | | | | 2,418,233 | |
EQT Trust, Series 2024-EXTR, Class A, 5.33%, 07/05/41(a)(b) | | | 1,697 | | | | 1,737,318 | |
Extended Stay America Trust | | | | | | | | |
Series 2021-ESH, Class D, (1-mo. CME Term SOFR + 2.36%), 7.46%, 07/15/38(a)(b) | | | 3,193 | | | | 3,198,748 | |
Series 2021-ESH, Class E, (1-mo. CME Term SOFR + 2.96%), 8.06%, 07/15/38(a)(b) | | | 6,005 | | | | 6,004,687 | |
Series 2021-ESH, Class F, (1-mo. CME Term SOFR + 3.81%), 8.91%, 07/15/38(a)(b) | | | 15,315 | | | | 15,305,544 | |
Fashion Show Mall LLC, Series 2024-SHOW, Class A,
10/10/29(a)(b)(d) | | | 3,188 | | | | 3,179,315 | |
FREMF Mortgage Trust | | | | | | | | |
Series 2017-KGX1, Class BFX, 3.72%, 10/25/27(a)(b) | | | 1,190 | | | | 1,103,562 | |
Series 2018-K74, Class B, 4.23%, 02/25/51(a)(b) | | | 120 | | | | 118,106 | |
Series 2018-K80, Class B, 4.38%, 08/25/50(a)(b) | | | 1,043 | | | | 1,021,689 | |
FS Rialto Issuer Ltd., Series 2022-FL7, Class A, (1-mo. CME Term SOFR + 2.90%), 7.99%, 10/19/39(a)(b) | | | 4,864 | | | | 4,884,250 | |
GCT Commercial Mortgage Trust, Series 2021- GCT, Class D, (1-mo. CME Term SOFR + 2.46%), 7.56%, 02/15/38(a)(b) | | | 440 | | | | 26,178 | |
Grace Trust, Series 2020-GRCE, Class E, 2.77%, 12/10/40(a)(b) | | | 1,489 | | | | 1,164,078 | |
Great Wolf Trust, Series 2024-WOLF, Class A, (1-mo. CME Term SOFR + 1.54%), 6.64%, 03/15/39(a)(b) | | | 2,970 | | | | 2,963,503 | |
GS Mortgage Securities Corp. II, Series 2005- ROCK, Class A, 5.37%, 05/03/32(a) | | | 2,750 | | | | 2,721,988 | |
| | | | | | | | |
| Security | | Par (000) | | | Value | |
|
Commercial Mortgage-Backed Securities (continued) | |
GS Mortgage Securities Trust | | | | | | | | |
Series 2014-GC20, Class B, 4.53%, 04/10/47(b) | | | USD 32 | | | $ | 30,906 | |
Series 2015-590M, Class E, 3.93%, 10/10/35(a)(b) | | | 1,100 | | | | 952,097 | |
Series 2015-GC32, Class C, 4.55%, 07/10/48(b) | | | 1,049 | | | | 1,013,380 | |
Series 2017-GPTX, Class A, 2.86%, 05/10/34(a) | | | 1,943 | | | | 1,660,879 | |
Series 2017-SLP, Class C, 3.92%, 10/10/32(a) | | | 310 | | | | 307,191 | |
Series 2019-GSA1, Class C, 3.93%, 11/10/52(b) | | | 260 | | | | 224,117 | |
Series 2021-DM, Class A, (1-mo. CME Term SOFR + 1.00%), 6.10%, 11/15/36(a)(b) | | | 3,134 | | | | 3,107,557 | |
Series 2022-AGSS, Class A, (1-mo. CME Term SOFR + 2.69%), 7.79%, 11/15/27(a)(b) | | | 7,870 | | | | 7,882,342 | |
Series 2022-ECI, Class A, (1-mo. CME Term SOFR + 2.19%), 7.29%, 08/15/39(a)(b) | | | 5,160 | | | | 5,161,613 | |
Series 2023-FUN, Class A, (1-mo. CME Term SOFR + 2.09%), 7.19%, 03/15/28(a)(b) | | | 5,374 | | | | 5,384,076 | |
Series 2023-SHIP, Class E, 7.68%, 09/10/38(a)(b) | | | 16,757 | | | | 16,928,763 | |
Series 2024-RVR, Class E, 7.72%, 08/10/29(a)(b) | | | 1,802 | | | | 1,800,480 | |
GWT, Series 2024-WLF2, Class A, (1-mo. CME Term SOFR + 1.69%), 6.79%, 05/15/41(a)(b) | | | 18,775 | | | | 18,775,000 | |
HIG RCP LLC, Series 2023-FL1, Class A, (1- mo. CME Term SOFR + 2.27%), 7.37%, 09/19/38(a)(b) | | | 3,354 | | | | 3,360,290 | |
HIH Trust | | | | | | | | |
Series 2024-61P, Class A, (1-mo. CME Term SOFR + 1.84%), 10/15/41(a)(b)(d) | | | 3,330 | | | | 3,321,395 | |
Series 2024-61P, Class D, (1-mo. CME Term SOFR + 3.64%), 10/15/41(a)(b)(d) | | | 1,260 | | | | 1,256,777 | |
HILT Commercial Mortgage Trust | | | | | | | | |
Series 2024-ORL, Class A, (1-mo. CME Term SOFR + 1.54%), 6.64%, 05/15/37(a)(b) | | | 5,375 | | | | 5,364,922 | |
Series 2024-ORL, Class D, (1-mo. CME Term SOFR + 3.19%), 8.29%, 05/15/37(a)(b) | | | 6,057 | | | | 5,973,716 | |
HIT Trust, Series 2022-HI32, Class A, (1-mo. CME Term SOFR + 2.39%), 7.49%, 07/09/25(a)(b) | | | 1,124 | | | | 1,127,012 | |
HLTN Commercial Mortgage Trust, Series 2024- DPLO, Class A, (1-mo. CME Term SOFR + 1.64%), 6.74%, 06/15/41(a)(b) | | | 3,176 | | | | 3,170,045 | |
HMH Trust, Series 2017-NSS, Class A, 3.06%, 07/05/31(a) | | | 2,060 | | | | 1,520,538 | |
HONO Mortgage Trust, Series 2021-LULU, Class A, (1-mo. CME Term SOFR + 1.26%), 6.36%,
10/15/36(a)(b) | | | 7,608 | | | | 7,373,365 | |
HTL Commercial Mortgage Trust | | | | | | | | |
Series 2024-T53, Class A, 6.07%, 05/10/39(a)(b) | | | 1,790 | | | | 1,829,421 | |
Series 2024-T53, Class E, 10.60%, 05/10/39(a)(b) | | | 4,965 | | | | 5,143,802 | |
Hudson Yards Mortgage Trust | | | | | | | | |
Series 2019-30HY, Class A, 3.23%, 07/10/39(a) | | | 195 | | | | 180,323 | |
Series 2019-55HY, Class F, 3.04%, 12/10/41(a)(b) | | | 2,975 | | | | 2,237,135 | |
| | |
C O N S O L I D A T E D S C H E D U L E S O F I N V E S T M E N T S | | 51 |
| | |
Consolidated Schedule of Investments (continued) September 30, 2024 | | BlackRock Total Return Fund (Percentages shown are based on Net Assets) |
| | | | | | | | |
| Security | | Par (000) | | | Value | |
|
Commercial Mortgage-Backed Securities (continued) | |
ILPT Commercial Mortgage Trust, Series 2022- LPF2, Class A, (1-mo. CME Term SOFR + 2.25%), 7.34%, 10/15/39(a)(b) | | USD | 8,682 | | | $ | 8,673,661 | |
Independence Plaza Trust | | | | | | | | |
Series 2018-INDP, Class B, 3.91%, 07/10/35(a) | | | 700 | | | | 679,812 | |
Series 2018-INDP, Class C, 4.16%, 07/10/35(a) | | | 1,600 | | | | 1,548,858 | |
INTOWN Mortgage Trust, Series 2022-STAY, Class A, (1-mo. CME Term SOFR + 2.49%), 7.59%, 08/15/39(a)(b) | | | 5,685 | | | | 5,699,213 | |
JPMBB Commercial Mortgage Securities Trust, Series 2015-C33, Class D1, 4.29%, 12/15/48(a)(b) | | | 785 | | | | 694,670 | |
JPMDB Commercial Mortgage Securities Trust, Series 2018-C8, Class AS, 4.42%, 06/15/51 | | | 198 | | | | 189,435 | |
JPMorgan Chase Commercial Mortgage Securities Corp., Series 2021-MHC, Class F, (1-mo. CME Term SOFR + 3.31%), 8.41%, 04/15/38(a)(b) | | | 2,750 | | | | 2,724,219 | |
JPMorgan Chase Commercial Mortgage Securities Trust | | | | | | | | |
Series 2016-NINE, Class B, 2.95%, 09/06/38(a)(b) | | | 3,688 | | | | 3,482,151 | |
Series 2018-AON, Class A, 4.13%, 07/05/31(a) | | | 1,819 | | | | 1,664,386 | |
Series 2018-PHH, Class A, (1-mo. CME Term SOFR + 1.26%), 6.35%, 06/15/35(a)(b) | | | 959 | | | | 836,249 | |
Series 2019-COR5, Class A3, 3.12%, 06/13/52 | | | 1,700 | | | | 1,597,367 | |
Series 2019-MFP, Class E, (1-mo. CME Term SOFR + 2.21%), 7.30%, 07/15/36(a)(b) | | | 2,460 | | | | 2,400,552 | |
Series 2020-609M, Class D, (1-mo. CME Term SOFR + 3.13%), 8.23%, 10/15/33(a)(b) | | | 1,600 | | | | 1,271,520 | |
Series 2021-MHC, Class A, (1-mo. CME Term SOFR + 1.16%), 6.26%, 04/15/38(a)(b) | | | 1,062 | | | | 1,059,741 | |
Series 2021-MHC, Class E, (1-mo. CME Term SOFR + 2.81%), 7.91%, 04/15/38(a)(b) | | | 10,005 | | | | 9,954,975 | |
Series 2022-NLP, Class F, (1-mo. CME Term SOFR + 3.54%), 8.64%, 04/15/37(a)(b) | | | 4,888 | | | | 4,171,226 | |
Series 2022-NXSS, Class A, (1-mo. CME Term SOFR + 2.18%), 7.28%, 09/15/39(a)(b) | | | 9,160 | | | | 9,160,169 | |
Series 2022-OPO, Class D, 3.57%, 01/05/39(a)(b) | | | 3,034 | | | | 2,321,009 | |
Series 2024-OMNI, Class A, 5.80%, 10/05/39(a)(b) | | | 2,310 | | | | 2,366,697 | |
JW Commercial Mortgage Trust | | | | | | | | |
Series 2024-MRCO, Class A, (1-mo. CME Term SOFR + 1.62%), 6.70%, 06/15/39(a)(b) | | | 3,715 | | | | 3,708,044 | |
Series 2024-MRCO, Class D, (1-mo. CME Term SOFR + 3.19%), 8.27%, 06/15/39(a)(b) | | | 2,148 | | | | 2,148,816 | |
KSL Commercial Mortgage Trust | | | | | | | | |
Series 2023-HT, Class A, (1-mo. CME Term SOFR + 2.29%), 7.39%, 12/15/36(a)(b) | | | 6,423 | | | | 6,439,058 | |
Series 2023-HT, Class D, (1-mo. CME Term SOFR + 4.29%), 9.38%, 12/15/36(a)(b) | | | 19,018 | | | | 19,065,545 | |
| | | | | | | | |
| Security | | Par (000) | | | Value | |
|
Commercial Mortgage-Backed Securities (continued) | |
LBA Trust | | | | | | | | |
Series 2024-7IND, Class A, (1-mo. CME Term SOFR + 1.44%), 6.54%, 10/15/41(a)(b) | | USD | 3,260 | | | $ | 3,257,963 | |
Series 2024-7IND, Class D, (1-mo. CME Term SOFR + 2.64%), 7.74%, 10/15/41(a)(b) | | | 825 | | | | 825,000 | |
Series 2024-BOLT, Class A, (1-mo. CME Term SOFR + 1.59%), 6.69%, 06/15/26(a)(b) | | | 12,850 | | | | 12,850,000 | |
Series 2024-BOLT, Class F, (1-mo. CME Term SOFR + 4.44%), 9.53%, 06/15/26(a)(b) | | | 1,058 | | | | 1,055,019 | |
Lehman Brothers Small Balance Commercial Mortgage Trust, Series 2006-2A, Class M3, (1-mo. CME Term SOFR + 0.56%), 5.42%, 09/25/36(a)(b) | | | 1,095 | | | | 1,039,368 | |
LUX, Series 2023-LION, Class A, (1-mo. CME Term SOFR + 2.69%), 7.79%, 08/15/40(a)(b) | | | 2,294 | | | | 2,304,095 | |
MCR Mortgage Trust | | | | | | | | |
Series 2024-HTL, Class A, (1-mo. CME Term SOFR + 1.76%), 6.86%, 02/15/37(a)(b) | | | 296 | | | | 294,526 | |
Series 2024-HTL, Class E, (1-mo. CME Term SOFR + 4.65%), 9.75%, 02/15/37(a)(b) | | | 2,587 | | | | 2,583,153 | |
Series 2024-TWA, Class A, 5.92%, 06/12/39(a) | | | 3,570 | | | | 3,652,833 | |
Series 2024-TWA, Class E, 8.73%, 06/12/39(a) | | | 3,008 | | | | 3,066,387 | |
MF1, Series 2021-W10, Class G, (1-mo. CME Term SOFR + 4.22%), 9.32%, 12/15/34(a)(b) | | | 1,005 | | | | 951,414 | |
MF1 LLC, Series 2024-FL14, Class A, (1-mo. CME Term SOFR + 1.74%), 6.70%, 03/19/39(a)(b) | | | 1,770 | | | | 1,770,549 | |
MFT Trust, Series 2020-ABC, Class C, 3.59%, 02/10/42(a)(b) | | | 1,773 | | | | 1,012,229 | |
MHC Commercial Mortgage Trust | | | | | | | | |
Series 2021-MHC, Class A, (1-mo. CME Term SOFR + 0.92%), 6.01%, 04/15/38(a)(b) | | | 216 | | | | 214,648 | |
Series 2021-MHC, Class E, (1-mo. CME Term SOFR + 2.22%), 7.31%, 04/15/38(a)(b) | | | 3,880 | | | | 3,857,981 | |
Series 2021-MHC, Class F, (1-mo. CME Term SOFR + 2.72%), 7.81%, 04/15/38(a)(b) | | | 494 | | | | 490,929 | |
MHP, Series 2021-STOR, Class G, (1-mo. CME Term SOFR + 2.86%), 7.96%, 07/15/38(a)(b) | | | 2,100 | | | | 2,082,938 | |
MIRA Trust, Series 2023-MILE, Class A, 6.76%, 06/10/38(a) | | | 3,432 | | | | 3,628,069 | |
Morgan Stanley Bank of America Merrill Lynch Trust, Series 2015-C25, Class B, 4.67%, 10/15/48(b) | | | 2,910 | | | | 2,792,929 | |
Morgan Stanley Capital I Trust | | | | | | | | |
Series 2017-ASHF, Class F, (1-mo. CME Term SOFR + 4.65%), 9.74%, 11/15/34(a)(b) | | | 1,413 | | | | 1,400,785 | |
Series 2017-ASHF, Class G, (1-mo. CME Term SOFR + 7.20%), 12.29%, 11/15/34(a)(b) | | | 1,612 | | | | 1,600,194 | |
Series 2018-MP, Class E, 4.42%, 07/11/40(a)(b) | | | 2,730 | | | | 1,732,375 | |
Series 2019-H6, Class D, 3.00%, 06/15/52(a) | | | 630 | | | | 479,237 | |
| | |
| 52 | | 2 0 2 4 B L A C K R O C K A N N U A L F I N A N C I A L S T A T E M E N T S A N D A D D I T I O N A L I N F O R M A T I O N |
| | |
Consolidated Schedule of Investments (continued) September 30, 2024 | | BlackRock Total Return Fund (Percentages shown are based on Net Assets) |
| | | | | | | | |
| Security | | Par (000) | | | Value | |
|
Commercial Mortgage-Backed Securities (continued) | |
Morgan Stanley Capital I Trust Series 2024-NSTB, Class A, 3.90%, 09/24/57(a)(b) | | USD | 3,230 | | | $ | 3,133,471 | |
MSDB Trust, Series 2017-712F, Class B, 3.57%, 07/11/39(a)(b) | | | 1,650 | | | | 1,435,368 | |
MSWF Commercial Mortgage Trust, Series 2023-2, Class A5, 6.01%, 12/15/56(b) | | | 973 | | | | 1,071,728 | |
MTN Commercial Mortgage Trust, Series 2022- LPFL, Class A, (1-mo. CME Term SOFR + 1.40%), 6.50%, 03/15/39(a)(b) | | | 1,330 | | | | 1,320,856 | |
Natixis Commercial Mortgage Securities Trust | | | | | | | | |
Series 2018-SOX, Class A, 4.40%, 06/17/38(a) | | | 4,162 | | | | 4,071,568 | |
Series 2019-LVL, Class D, 4.44%, 08/15/38(a) | | | 1,550 | | | | 1,355,298 | |
NJ Trust, Series 2023-GSP, Class A, 6.70%, 01/06/29(a)(b) | | | 2,430 | | | | 2,577,122 | |
NYC Trust | | | | | | | | |
Series 2024-3ELV, Class A, (1-mo. CME Term SOFR + 1.99%), 7.09%, 08/15/29(a)(b) | | | 831 | | | | 834,650 | |
Series 2024-3ELV, Class D, (1-mo. CME Term SOFR + 3.84%), 8.94%, 08/15/29(a)(b) | | | 2,195 | | | | 2,205,975 | |
Olympic Tower Mortgage Trust, Series 2017-OT, Class E, 4.08%, 05/10/39(a)(b) | | | 2,910 | | | | 2,102,781 | |
One Bryant Park Trust, Series 2019-OBP, Class A, 2.52%, 09/15/54(a) | | | 1,888 | | | | 1,679,633 | |
One Market Plaza Trust, Series 2017-1MKT, Class D, 4.15%, 02/10/32(a) | | | 1,754 | | | | 1,497,975 | |
One New York Plaza Trust | | | | | | | | |
Series 2020-1NYP, Class A, (1-mo. CME Term SOFR + 1.06%), 6.16%, 01/15/36(a)(b) | | | 1,815 | | | | 1,733,325 | |
Series 2020-1NYP, Class AJ, (1-mo. CME Term SOFR + 1.36%), 6.46%, 01/15/36(a)(b) | | | 2,857 | | | | 2,664,153 | |
Series 2020-1NYP, Class B, (1-mo. CME Term SOFR + 1.61%), 6.71%, 01/15/36(a)(b) | | | 2,345 | | | | 2,180,850 | |
Series 2020-1NYP, Class D, (1-mo. CME Term SOFR + 2.86%), 7.96%, 01/15/36(a)(b) | | | 960 | | | | 813,600 | |
OPEN Trust, Series 2023-AIR, Class A, (1-mo. CME Term SOFR + 3.09%), 8.19%, 10/15/28(a)(b) | | | 5,043 | | | | 5,090,615 | |
PFP Ltd., Series 2022-9, Class A, (1-mo. CME Term SOFR + 2.27%), 7.37%, 08/19/35(a)(b) | | | 2,475 | | | | 2,483,131 | |
PGA Trust, Series 2024-RSR2, Class A, (1-mo. CME Term SOFR + 1.89%), 6.99%, 06/15/39(a)(b) | | | 2,559 | | | | 2,548,604 | |
Ready Capital Mortgage Financing LLC | | | | | | | | |
Series 2022-FL10, Class A, (1-mo. CME Term SOFR + 2.55%), 7.41%, 10/25/39(a)(b) | | | 7,011 | | | | 7,038,989 | |
Series 2022-FL9, Class A, (1-mo. CME Term SOFR + 2.47%), 7.32%, 06/25/37(a)(b) | | | 908 | | | | 911,020 | |
Series 2023-FL11, Class A, (1-mo. CME Term SOFR + 2.37%), 7.23%, 10/25/39(a)(b) | | | 3,226 | | | | 3,237,600 | |
| | | | | | | | |
| Security | | Par (000) | | | Value | |
|
Commercial Mortgage-Backed Securities (continued) | |
RIAL Issuer Ltd., Series 2022-FL8, Class A, (1-mo. CME Term SOFR + 2.25%), 7.35%, 01/19/37(a)(b) | | USD | 9,295 | | | $ | 9,289,191 | |
SG Commercial Mortgage Securities Trust | | | | | | | | |
Series 2019-PREZ, Class D, 3.59%, 09/15/39(a)(b) | | | 2,200 | | | | 1,848,297 | |
Series 2019-PREZ, Class E, 3.59%, 09/15/39(a)(b) | | | 1,792 | | | | 1,466,788 | |
SHER Trust, Series 2024-DAL, Class A, (1-mo. CME Term SOFR + 1.64%), 6.74%, 04/15/37(a)(b) | | | 2,836 | | | | 2,818,275 | |
SHR Trust | | | | | | | | |
Series 2024-LXRY, Class A, (1-mo. CME Term SOFR + 1.95%), 10/15/41(a)(b)(d) | | | 9,388 | | | | 9,388,000 | |
Series 2024-LXRY, Class D, (1-mo. CME Term SOFR + 3.60%), 10/15/41(a)(b)(d) | | | 3,784 | | | | 3,784,000 | |
Series 2024-LXRY, Class E, (1-mo. CME Term SOFR + 4.45%), 10/15/41(a)(b)(d) | | | 2,555 | | | | 2,555,000 | |
SREIT Trust | | | | | | | | |
Series 2021-MFP, Class F, (1-mo. CME Term SOFR + 2.74%), 7.84%, 11/15/38(a)(b) | | | 5,167 | | | | 5,131,722 | |
Series 2021-MFP2, Class F, (1-mo. CME Term SOFR + 2.73%), 7.83%, 11/15/36(a)(b) | | | 4,101 | | | | 4,065,414 | |
Taubman Centers Commercial Mortgage Trust, Series 2022-DPM, Class A, (1-mo. CME Term SOFR + 2.19%), 7.28%, 05/15/37(a)(b) | | | 12,494 | | | | 12,525,235 | |
THPT Mortgage Trust, Series 2023-THL, Class A, 7.23%, 12/10/34(a)(b) | | | 2,019 | | | | 2,095,675 | |
TPGI Trust, Series 2021-DGWD, Class E, (1- mo. CME Term SOFR + 2.46%), 7.56%, 06/15/26(a)(b) | | | 641 | | | | 636,633 | |
TYSN Mortgage Trust, Series 2023-CRNR, Class A, 6.80%,
12/10/33(a)(b) | | | 2,230 | | | | 2,358,060 | |
UBS Commercial Mortgage Trust, Series 2017- C7, Class A4, 3.68%, 12/15/50 | | | 880 | | | | 856,491 | |
UK Logistics DAC, Series 2024-1X, Class A, (1-day SONIA + 1.65%), 6.63%, 05/17/34(b)(f). | | GBP | 1,165 | | | | 1,562,202 | |
Velocity Commercial Capital Loan Trust | | | | | | | | |
Series 2017-2, Class M3, 4.24%, 11/25/47(a)(b) | | USD | 212 | | | | 192,516 | |
Series 2017-2, Class M4, 5.00%, 11/25/47(a)(b) | | | 128 | | | | 114,447 | |
Series 2018-1, Class M2, 4.26%, 04/25/48(a) | | | 109 | | | | 100,377 | |
Series 2020-1, Class AFX, 2.61%, 02/25/50(a)(b) | | | 3,025 | | | | 2,788,044 | |
Series 2020-1, Class M1, 2.80%, 02/25/50(a)(b) | | | 543 | | | | 472,045 | |
Series 2020-1, Class M2, 2.98%, 02/25/50(a)(b) | | | 651 | | | | 563,893 | |
Series 2021-4, Class A, 2.52%, 12/26/51(a)(b) | | | 9,281 | | | | 8,298,499 | |
Series 2021-4, Class M4, 4.48%, 12/26/51(a)(b) | | | 989 | | | | 772,683 | |
Series 2022-1, Class M4, 5.20%, 02/25/52(a)(b) | | | 676 | | | | 530,295 | |
Series 2022-2, Class M3, 5.79%, 04/25/52(a)(b) | | | 2,065 | | | | 1,912,517 | |
Series 2022-4, Class M2, 6.97%, 08/25/52(a)(b) | | | 886 | | | | 884,816 | |
Series 2022-4, Class M3, 7.53%, 08/25/52(a)(b) | | | 624 | | | | 606,223 | |
| | |
C O N S O L I D A T E D S C H E D U L E S O F I N V E S T M E N T S | | 53 |
| | |
Consolidated Schedule of Investments (continued) September 30, 2024 | | BlackRock Total Return Fund (Percentages shown are based on Net Assets) |
| | | | | | | | |
| Security | | Par (000) | | | Value | |
|
Commercial Mortgage-Backed Securities (continued) | |
Velocity Commercial Capital Loan Trust | | | | | | | | |
Series 2022-4, Class M4, 7.53%, 08/25/52(a)(b) | | USD | 1,147 | | | $ | 1,079,760 | |
Series 2023-2, Class A, 6.22%, 05/25/53(a)(b) | | | 3,047 | | | | 3,075,200 | |
Series 2023-2, Class M1, 7.03%, 05/25/53(a)(b) | | | 1,822 | | | | 1,849,673 | |
Series 2024-1, Class A, 6.55%, 01/25/54(a)(b) | | | 7,025 | | | | 7,154,992 | |
Series 2024-1, Class M2, 7.23%, 01/25/54(a)(b) | | | 632 | | | | 645,452 | |
Series 2024-1, Class M3, 8.44%, 01/25/54(a)(b) | | | 734 | | | | 756,532 | |
VNDO Trust, Series 2016-350P, Class D, 4.03%, 01/10/35(a)(b) | | | 3,390 | | | | 3,212,781 | |
Wells Fargo Commercial Mortgage Trust | | | | | | | | |
Series 2016-C32, Class A3FL, (1-mo. CME Term SOFR + 1.53%), 6.62%, 01/15/59(b) | | | 2,724 | | | | 2,701,506 | |
Series 2016-C34, Class A3FL, (1-mo. CME Term SOFR + 1.15%), 6.24%, 06/15/49(a)(b) | | | 1,830 | | | | 1,800,335 | |
Series 2018-1745, Class A, 3.87%, 06/15/36(a)(b) | | | 1,253 | | | | 1,129,730 | |
Series 2018-AUS, Class A, 4.19%, 08/17/36(a)(b) | | | 1,680 | | | | 1,632,216 | |
Series 2019-C49, Class D, 3.00%, 03/15/52(a) | | | 514 | | | | 422,778 | |
Series 2024-1CHI, Class A, 5.48%, 07/15/35(a)(b) | | | 2,829 | | | | 2,849,169 | |
Series 2024-BPRC, Class B, 6.22%, 07/15/43(a) | | | 4,292 | | | | 4,431,741 | |
Series 2024-BPRC, Class C, 6.43%, 07/15/43(a) | | | 2,732 | | | | 2,785,559 | |
Series 2024-BPRC, Class D, 7.08%, 07/15/43(a) | | | 1,160 | | | | 1,187,359 | |
WFRBS Commercial Mortgage Trust, Series 2014-C24, Class B, 4.20%, 11/15/47(b) | | | 770 | | | | 744,530 | |
WMRK Commercial Mortgage Trust | | | | | | | | |
Series 2022-WMRK, Class A, (1-mo. CME Term SOFR + 2.79%), 7.89%, 11/15/27(a)(b) | | | 6,274 | | | | 6,293,606 | |
Series 2022-WMRK, Class B, (1-mo. CME Term SOFR + 3.44%), 8.53%, 11/15/27(a)(b) | | | 2,500 | | | | 2,507,031 | |
| | | | | | | | |
| | |
| | | | | | | 1,048,468,692 | |
|
Interest Only Collateralized Mortgage Obligations — 0.1% | |
Ajax Mortgage Loan Trust, Series 2021-E, Class XS, 0.00%, 12/25/60(a)(b)(e) | | | 100,829 | | | | 3,763,418 | |
Barclays Mortgage Loan Trust | | | | | | | | |
Series 2023-NQM3, Class XS, 0.82%, 10/25/63(a)(b) | | | 56,403 | | | | 819,000 | |
Series 2024-NQM1, Class XS, 2.45%, 01/25/64(a)(b) | | | 42,325 | | | | 2,165,790 | |
Series 2024-NQM3, Class XS, 0.00%, 06/25/64(a)(b)(e) | | | 46,719 | | | | 2,062,419 | |
JPMorgan Mortgage Trust | | | | | | | | |
Series 2021-INV5, Class A2X, 0.50%, 12/25/51(a)(b) | | | 49,304 | | | | 1,391,773 | |
Series 2021-INV5, Class A5X, 0.50%, 12/25/51(a)(b) | | | 5,294 | | | | 149,448 | |
Series 2021-INV5, Class AX1, 0.19%, 12/25/51(a)(b) | | | 95,297 | | | | 978,392 | |
| | | | | | | | |
| Security | | Par (000) | | | Value | |
|
Interest Only Collateralized Mortgage Obligations (continued) | |
JPMorgan Mortgage Trust | | | | | | | | |
Series 2021-INV7, Class A2X, 0.50%, 02/25/52(a)(b) | | USD | 25,646 | | | $ | 730,742 | |
Series 2021-INV7, Class A3X, 0.50%, 02/25/52(a)(b) | | | 15,072 | | | | 291,068 | |
Series 2021-INV7, Class A4X, 0.50%, 02/25/52(a)(b) | | | 6,756 | | | | 302,199 | |
Series 2021-INV7, Class A5X, 0.50%, 02/25/52(a)(b) | | | 2,792 | | | | 79,564 | |
Series 2021-INV7, Class AX1, 0.27%, 02/25/52(a)(b) | | | 50,267 | | | | 740,905 | |
Seasoned Credit Risk Transfer Trust, Series 2017-3, Class BIO, 0.76%, 07/25/56(a)(b) | | | 2,688 | | | | 312,981 | |
Voyager OPTONE Delaware Trust, Series 2009-1, Class SAA7, 5.18%, 02/25/38(a)(b) | | | 11,719 | | | | 2,636,947 | |
| | | | | | | | |
| | |
| | | | | | | 16,424,646 | |
|
Interest Only Commercial Mortgage-Backed Securities — 0.1% | |
245 Park Avenue Trust, Series 2017-245P, Class XA, 0.27%,
06/05/37(a)(b) | | | 13,000 | | | | 56,684 | |
BANK, Series 2019-BN20, Class XB, 0.47%, 09/15/62(b) | | | 39,279 | | | | 642,306 | |
Bank of America Merrill Lynch Commercial Mortgage Trust, Series 2017-BNK3, Class XB, 0.73%, 02/15/50(b) | | | 11,850 | | | | 147,753 | |
BBCMS Mortgage Trust | | | | | | | | |
Series 2015-SRCH, Class XA, 1.03%, 08/10/35(a)(b) | | | 15,583 | | | | 297,017 | |
Series 2020-C7, Class XB, 1.10%, 04/15/53(b) | | | 1,596 | | | | 78,603 | |
Benchmark Mortgage Trust | | | | | | | | |
Series 2019-B9, Class XA, 1.18%, 03/15/52(b) | | | 12,672 | | | | 458,628 | |
Series 2020-B17, Class XB, 0.65%, 03/15/53(b) | | | 7,100 | | | | 150,260 | |
Series 2021-B23, Class XA, 1.37%, 02/15/54(b) | | | 27,238 | | | | 1,500,398 | |
BMO Mortgage Trust, Series 2023-C5, Class XA, 0.95%, 06/15/56(b) | | | 14,302 | | | | 711,589 | |
BX Trust, Series 2022-GPA, Class XCP, 0.00%, 08/15/23(a)(b)(e) | | | 107,548 | | | | 3,151 | |
CFCRE Commercial Mortgage Trust | | | | | | | | |
Series 2016-C3, Class XD, 1.85%, 01/10/48(a)(b) | | | 5,497 | | | | 94,919 | |
Series 2016-C4, Class XB, 0.85%, 05/10/58(b) | | | 5,810 | | | | 54,167 | |
Citigroup Commercial Mortgage Trust, Series 2020-420K, Class X, 0.91%, 11/10/42(a)(b) | | | 46,500 | | | | 1,959,552 | |
Commercial Mortgage Pass-Through Certificates | | | | | | | | |
Series 2015-3BP, Class XA, 0.17%, 02/10/35(a)(b) | | | 150,000 | | | | 1,500 | |
Series 2015-CR25, Class XA, 0.93%, 08/10/48(b) | | | 3,980 | | | | 15,452 | |
Series 2018-COR3, Class XD, 1.75%, 05/10/51(a)(b) | | | 3,200 | | | | 169,408 | |
CSAIL Commercial Mortgage Trust Series 2017-CX10, Class XB, 0.32%, 11/15/50(b) | | | 12,490 | | | | 98,275 | |
| | |
| 54 | | 2 0 2 4 B L A C K R O C K A N N U A L F I N A N C I A L S T A T E M E N T S A N D A D D I T I O N A L I N F O R M A T I O N |
| | |
Consolidated Schedule of Investments (continued) September 30, 2024 | | BlackRock Total Return Fund (Percentages shown are based on Net Assets) |
| | | | | | | | |
| Security | | Par (000) | | | Value | |
|
Interest Only Commercial Mortgage-Backed Securities (continued) | |
CSAIL Commercial Mortgage Trust | | | | | | | | |
Series 2019-C16, Class XA, 1.70%, 06/15/52(b) | | USD | 29,670 | | | $ | 1,672,543 | |
Series 2019-C17, Class XA, 1.46%, 09/15/52(b) | | | 9,529 | | | | 479,373 | |
Series 2019-C17, Class XB, 0.68%, 09/15/52(b) | | | 19,090 | | | | 440,315 | |
DBGS Mortgage Trust, Series 2019-1735, Class X, 0.43%, 04/10/37(a)(b) | | | 21,535 | | | | 268,882 | |
Deutsche Bank JPMorgan Mortgage Trust, Series 2017-C6, Class XD, 1.00%, 06/10/50(a)(b) | | | 5,780 | | | | 130,431 | |
ELM Trust | | | | | | | | |
Series 2024-ELM, Class XP10, 0.24%, 06/10/39(a)(b) | | | 51,484 | | | | 194,151 | |
Series 2024-ELM, Class XP15, 1.61%, 06/10/39(a)(b) | | | 46,635 | | | | 1,165,814 | |
FREMF Mortgage Trust, Series 2019-KW08, Class X2A, 0.10%, 01/25/29(a) | | | 152,854 | | | | 482,592 | |
GS Mortgage Securities Corp. II, Series 2005- ROCK, Class X1, 0.40%, 05/03/32(a)(b) | | | 21,000 | | | | 17,375 | |
GS Mortgage Securities Trust | | | | | | | | |
Series 2019-GSA1, Class XA, 0.93%, 11/10/52(b) | | | 7,721 | | | | 258,891 | |
Series 2020-GSA2, Class XA, 1.82%, 12/12/53(a)(b) | | | 18,277 | | | | 1,390,880 | |
JPMBB Commercial Mortgage Securities Trust | | | | | | | | |
Series 2014-C22, Class XA, 0.54%, 09/15/47(b) | | | 201 | | | | 2 | |
Series 2014-C23, Class XA, 0.63%, 09/15/47(b) | | | 4,000 | | | | 40 | |
Series 2015-C29, Class XA, 0.67%, 05/15/48(b) | | | 1,275 | | | | 2,623 | |
JPMDB Commercial Mortgage Securities Trust, Series 2016-C4, Class XC, 0.75%, 12/15/49(a)(b) | | | 4,940 | | | | 64,203 | |
JPMorgan Chase Commercial Mortgage Securities Trust | | | | | | | | |
Series 2013-LC11, Class XB, 0.86%, 04/15/46(b) | | | 4,570 | | | | 82 | |
Series 2016-JP3, Class XC, 0.75%, 08/15/49(a)(b) | | | 13,040 | | | | 153,839 | |
Ladder Capital Commercial Mortgage Trust, Series 2013-GCP, Class XA, 1.31%, 02/15/36(a)(b) | | | 3,530 | | | | 112,094 | |
LSTAR Commercial Mortgage Trust, Series 2017-5, Class X, 0.99%, 03/10/50(a)(b) | | | 2,396 | | | | 34,905 | |
MCR Mortgage Trust, Series 2024-TWA, Class XA, 0.92%, 06/12/39(a) | | | 16,557 | | | | 309,131 | |
Morgan Stanley Bank of America Merrill Lynch Trust | | | | | | | | |
Series 2014-C19, Class XF, 1.40%, 12/15/47(a)(b) | | | 4,370 | | | | 49,458 | |
Series 2015-C26, Class XD, 1.45%, 10/15/48(a)(b) | | | 4,490 | | | | 50,650 | |
Morgan Stanley Capital I Trust | | | | | | | | |
Series 2016-UBS9, Class XD, 1.75%, 03/15/49(a)(b) | | | 13,984 | | | | 266,327 | |
Series 2017-H1, Class XD, 2.30%, 06/15/50(a)(b) | | | 3,293 | | | | 162,934 | |
Series 2019-H6, Class XB, 0.86%, 06/15/52(b) | | | 23,510 | | | | 678,668 | |
| | | | | | | | |
| Security | | Par (000) | | | Value | |
|
Interest Only Commercial Mortgage-Backed Securities (continued) | |
Morgan Stanley Capital I Trust Series 2019-L2, Class XA, 1.17%, 03/15/52(b) | | USD | 8,305 | | | $ | 301,284 | |
MSWF Commercial Mortgage Trust, Series 2023-2, Class XA, 1.14%, 12/15/56(b) | | | 56,244 | | | | 3,607,856 | |
Olympic Tower Mortgage Trust, Series 2017-OT, Class XA, 0.51%,
05/10/39(a)(b) | | | 36,697 | | | | 315,825 | |
One Market Plaza Trust | | | | | | | | |
Series 2017-1MKT, Class XCP, 0.00%, 02/10/32(a)(b)(e) | | | 44,225 | | | | 138,291 | |
Series 2017-1MKT, Class XNCP, 0.22%, 02/10/32(a)(b) | | | 8,845 | | | | 23,183 | |
UBS Commercial Mortgage Trust | | | | | | | | |
Series 2019-C17, Class XA, 1.58%, 10/15/52(b) | | | 30,546 | | | | 1,731,415 | |
Series 2019-C18, Class XA, 1.13%, 12/15/52(b) | | | 34,070 | | | | 1,216,374 | |
Wells Fargo Commercial Mortgage Trust | | | | | | | | |
Series 2015-NXS4, Class XA, 1.15%, 12/15/48(b) | | | 2,091 | | | | 15,071 | |
Series 2016-BNK1, Class XD, 1.38%, 08/15/49(a)(b) | | | 4,420 | | | | 84,330 | |
Series 2019-C50, Class XA, 1.57%, 05/15/52(b) | | | 21,394 | | | | 1,003,590 | |
Series 2024-BPRC, Class X, 0.31%, 07/15/43(a)(b) | | | 33,871 | | | | 334,906 | |
| | | | | | | | |
| | |
| | | | | | | 23,597,990 | |
|
Principal Only Collateralized Mortgage Obligations — 0.0% | |
Seasoned Credit Risk Transfer Trust, Series 2017-3, Class B, 0.00%, 07/25/56(a)(e) | | | 1,508 | | | | 221,787 | |
| | | | | | | | |
| | |
Total Non-Agency Mortgage-Backed Securities — 10.1%
(Cost: $2,088,618,884) | | | | | | | 2,024,971,149 | |
| | | | | | | | |
| | |
Preferred Securities | | | | | | | | |
| | |
Capital Trusts — 0.0% | | | | | | | | |
| | |
Banks — 0.0% | | | | | | | | |
Bangkok Bank PCL, 5.00%(f)(p) | | | 500 | | | | 494,000 | |
Barclays PLC, 4.38%(p) | | | 462 | | | | 413,518 | |
BNP Paribas SA, 4.63%(a)(p) | | | 462 | | | | 437,803 | |
Citigroup, Inc., Series Y, 4.15%(p) | | | 433 | | | | 415,746 | |
Emirates NBD Bank PJSC, 6.13%(f)(p) | | | 425 | | | | 422,875 | |
JPMorgan Chase & Co., Series KK, 3.65%(p) | | | 433 | | | | 418,902 | |
Krung Thai Bank PCL, 4.40%(f)(p) | | | 500 | | | | 489,687 | |
Rizal Commercial Banking Corp.,
6.50%(f)(p) | | | 500 | | | | 497,969 | |
| | | | | | | | |
| | |
| | | | | | | 3,590,500 | |
| | |
Capital Markets — 0.0% | | | | | | | | |
UBS Group AG | | | | | | | | |
4.88%(a)(p) | | | 483 | | | | 462,190 | |
9.25%(a)(p) | | | 1,875 | | | | 2,211,251 | |
| | | | | | | | |
| | |
| | | | | | | 2,673,441 | |
| | |
Electric Utilities — 0.0% | | | | | | | | |
AES Andes SA, 8.15%, 06/10/55(a) | | | 1,269 | | | | 1,311,435 | |
| | | | | | | | |
| | |
Media — 0.0% | | | | | | | | |
Paramount Global, 6.38%, 03/30/62 | | | 1,698 | | | | 1,570,627 | |
| | | | | | | | |
| | |
Multi-Utilities — 0.0% | | | | | | | | |
Dominion Energy, Inc., Series B, 7.00%, 06/01/54 | | | 2,419 | | | | 2,641,130 | |
| | | | | | | | |
| | |
Total Capital Trusts — 0.0% | | | | | | | 11,787,133 | |
| | | | | | | | |
| | |
C O N S O L I D A T E D S C H E D U L E S O F I N V E S T M E N T S | | 55 |
| | |
Consolidated Schedule of Investments (continued) September 30, 2024 | | BlackRock Total Return Fund (Percentages shown are based on Net Assets) |
| | | | | | | | |
| Security | | Shares | | | Value | |
| | |
Preferred Stocks — 0.3% | | | | | | | | |
| |
| Financial Services — 0.0% | | | | |
SCI PH, Inc. (Acquired 02/10/23, cost $1,875,000)(g)(i) | | | 1,875 | | | $ | 1,881,769 | |
| | | | | | | | |
| |
| Household Durables — 0.1% | | | | |
Dream Finders Homes, Inc.(g) | | | 15,124 | | | | 14,859,330 | |
Lessen Holdings, Inc., Series C(g) | | | 143,367 | | | | 622,213 | |
| | | | | | | | |
| | |
| | | | | | | 15,481,543 | |
| |
| Oil, Gas & Consumable Fuels — 0.0% | | | | |
Insight M, Inc.(g) | | | 3,271,821 | | | | 1,060,724 | |
| | | | | | | | |
| |
| Software — 0.1% | | | | |
Versa Networks, Inc. (Acquired 10/14/22, cost $12,017,972)(g)(i) | | | 4,118,274 | | | | 19,850,081 | |
| | | | | | | | |
| |
| Specialty Retail — 0.1% | | | | |
Davidson Homes(g) | | | 18,658 | | | | 17,471,724 | |
| | | | | | | | |
| |
| Textiles, Apparel & Luxury Goods — 0.0% | | | | |
Cap Hill Brands(g) | | | 2,670,520 | | | | 560,809 | |
| | | | | | | | |
Total Preferred Stocks — 0.3% | | | | | | | 56,306,650 | |
| | | | | | | | |
Total Preferred Securities — 0.3%
(Cost: $65,430,642) | | | | | | | 68,093,783 | |
| | | | | | | | |
| | |
| | | Par (000) | | | | |
|
U.S. Government Sponsored Agency Securities | |
| |
| Agency Obligations — 0.0% | | | | |
Fannie Mae, 6.63%, 11/15/30 | | USD | 1,450 | | | | 1,677,906 | |
| | | | | | | | |
| |
| Collateralized Mortgage Obligations — 0.0% | | | | |
Fannie Mae, Series 2003-W5, Class A, (1-mo. LIBOR US + 0.11%), 5.51%, 04/25/33(b) | | | 1 | | | | 803 | |
Freddie Mac, Series 2015-HQ2, Class B, (SOFR (30-day) + 8.06%), 13.35%, 05/25/25(b) | | | 507 | | | | 527,565 | |
| | | | | | | | |
| | |
| | | | | | | 528,368 | |
| |
| Commercial Mortgage-Backed Securities — 0.0% | | | | |
Fannie Mae, Series 2006-M2, Class A2A, 5.27%, 10/25/32(b) | | | 179 | | | | 179,296 | |
Freddie Mac, Series KJ48, Class A2, 5.03%, 10/25/31 | | | 2,327 | | | | 2,414,287 | |
Ginnie Mae | | | | | | | | |
Series 2023-118, Class BA, 3.75%, 05/16/65(b) | | | 1,374 | | | | 1,341,789 | |
Series 2023-119, Class AD, 2.25%, 04/16/65 | | | 2,545 | | | | 2,106,078 | |
Series 2023-50, Class AC, 3.25%, 09/16/63(b) | | | 1,121 | | | | 1,032,154 | |
| | | | | | | | |
| | |
| | | | | | | 7,073,604 | |
|
| Interest Only Collateralized Mortgage Obligations — 0.3% | |
Fannie Mae | | | | | | | | |
Series 2020-32, Class PI, 4.00%, 05/25/50 | | | 5,153 | | | | 1,088,114 | |
Series 2021-50, Class IO, 4.00%, 08/25/51 | | | 7,533 | | | | 1,473,867 | |
Series 427, Class C71, 3.00%, 10/25/49 | | | 25,757 | | | | 4,271,001 | |
Series 437, Class C11, 3.00%, 07/25/52 | | | 31,942 | | | | 5,483,244 | |
Freddie Mac | | | | | | | | |
Series 5081, Class AI, 3.50%, 03/25/51 | | | 4,579 | | | | 858,569 | |
Series 5112, Class KI, 3.50%, 06/25/51 | | | 20,897 | | | | 3,934,392 | |
Series 5127, Class AI, 3.00%, 06/25/51 | | | 7,520 | | | | 1,270,855 | |
Ginnie Mae | | | | | | | | |
Series 2020-146, Class DI, 2.50%, 10/20/50 . | | | 4,798 | | | | 633,999 | |
Series 2020-175, Class DI, 2.50%, 11/20/50 . | | | 1,695 | | | | 235,540 | |
| | | | | | | | |
| Security | | Par (000) | | | Value | |
|
Interest Only Collateralized Mortgage Obligations (continued) | |
Ginnie Mae | | | | | | | | |
Series 2020-185, Class MI, 2.50%, 12/20/50 | | USD | 6,041 | | | $ | 872,422 | |
Series 2021-58, Class IY, 3.00%, 02/20/51 | | | 38,794 | | | | 6,229,489 | |
Series 2021-67, Class QI, 3.00%, 04/20/51 | | | 3,515 | | | | 564,471 | |
Series 2021-76, Class JI, 3.00%, 08/20/50 | | | 3,611 | | | | 579,073 | |
Series 2021-78, Class IP, 3.00%, 05/20/51 | | | 36,089 | | | | 5,818,294 | |
Series 2021-83, Class PI, 3.00%, 05/20/51 | | | 9,293 | | | | 1,480,876 | |
Series 2021-96, Class MI, 3.00%, 06/20/51 | | | 6,303 | | | | 1,012,440 | |
Series 2021-97, Class LI, 3.00%, 08/20/50 | | | 46,462 | | | | 7,463,446 | |
Series 2022-78, Class IO, 3.00%, 08/20/51 | | | 7,865 | | | | 1,273,581 | |
Series 2022-85, Class IK, 3.00%, 05/20/51 | | | 23,002 | | | | 3,668,474 | |
| | | | | | | | |
| | |
| | | | | | | 48,212,147 | |
|
| Interest Only Commercial Mortgage-Backed Securities — 0.0% | |
Freddie Mac | | | | | | | | |
Series K121, Class X1, 1.12%, 10/25/30(b) | | | 13,615 | | | | 661,866 | |
Series KL06, Class XFX, 1.47%, 12/25/29(b) | | | 6,710 | | | | 317,949 | |
Series KW09, Class X1, 0.94%, 05/25/29(b) | | | 35,907 | | | | 979,499 | |
Ginnie Mae | | | | | | | | |
Series 2013-30, Class IO, 0.52%, 09/16/53(b) | | | 2,656 | | | | 38,144 | |
Series 2016-36, Class IO, 0.66%, 08/16/57(b) | | | 590 | | | | 16,779 | |
Series 2016-96, Class IO, 0.77%, 12/16/57(b) | | | 3,131 | | | | 118,581 | |
| | | | | | | | |
| | |
| | | | | | | 2,132,818 | |
| |
| Mortgage-Backed Securities — 35.2% | | | | |
Fannie Mae Mortgage-Backed Securities | | | | | | | | |
1.50%, 12/01/35 - 03/01/51 | | | 232,297 | | | | 193,059,895 | |
2.00%, 10/01/31 - 03/01/52 | | | 653,968 | | | | 555,186,008 | |
2.50%, 09/01/27 - 02/01/52 | | | 459,701 | | | | 408,065,735 | |
3.00%, 04/01/28 - 05/01/52 | | | 140,016 | | | | 130,228,951 | |
3.50%, 08/01/28 - 01/01/51 | | | 229,212 | | | | 216,587,676 | |
4.00%, 08/01/31 - 04/01/52 | | | 122,955 | | | | 119,958,553 | |
4.50%, 02/01/25 - 07/01/52 | | | 131,179 | | | | 131,769,368 | |
5.00%, 11/01/32 - 04/01/53 | | | 58,684 | | | | 59,304,374 | |
5.50%, 12/01/32 - 06/01/53 | | | 159,739 | | | | 161,961,631 | |
5.81%, 06/01/31 | | | 5,495 | | | | 5,791,007 | |
6.00%, 02/01/34 - 03/01/54 | | | 113,681 | | | | 116,982,104 | |
6.50%, 05/01/40 - 09/01/54 | | | 160,857 | | | | 166,416,663 | |
7.50%, 12/01/53 - 01/01/54 | | | 5,543 | | | | 5,891,970 | |
Freddie Mac Mortgage-Backed Securities | | | | | | | | |
1.50%, 04/01/36 - 10/01/50 | | | 38,707 | | | | 32,976,275 | |
2.00%, 09/01/35 - 02/01/52(s) | | | 578,050 | | | | 488,723,576 | |
2.50%, 04/01/27 - 04/01/52 | | | 285,349 | | | | 251,013,603 | |
3.00%, 09/01/27 - 08/01/52 | | | 254,573 | | | | 233,086,911 | |
3.50%, 02/01/31 - 06/01/50 | | | 75,486 | | | | 72,398,010 | |
4.00%, 08/01/40 - 06/01/52 | | | 109,601 | | | | 107,281,935 | |
4.50%, 02/01/39 - 08/01/52 | | | 77,034 | | | | 76,889,076 | |
5.00%, 07/01/35 - 02/01/53 | | | 55,689 | | | | 56,098,524 | |
5.50%, 02/01/35 - 08/01/53 | | | 47,861 | | | | 48,631,996 | |
6.00%, 11/01/52 - 06/01/53 | | | 48,122 | | | | 49,396,260 | |
6.50%, 10/01/53 - 09/01/54 | | | 55,660 | | | | 57,797,877 | |
7.50%, 12/01/53 - 01/01/54 | | | 2,513 | | | | 2,672,653 | |
Ginnie Mae Mortgage-Backed Securities | | | | | | | | |
2.00%, 08/20/50 - 10/15/54(t) | | | 237,965 | | | | 201,871,706 | |
2.50%, 04/20/51 - 10/15/54(t) | | | 240,332 | | | | 211,813,122 | |
3.00%, 12/20/44 - 10/15/54(t) | | | 175,348 | | | | 160,111,270 | |
3.50%, 01/15/42 - 10/15/54(t) | | | 130,230 | | | | 122,786,937 | |
4.00%, 04/20/39 - 10/15/54(t) | | | 90,868 | | | | 88,150,464 | |
4.50%, 12/20/39 - 10/15/54(t) | | | 84,318 | | | | 83,391,624 | |
5.00%, 04/15/33 - 10/15/54(t) | | | 89,715 | | | | 89,921,282 | |
5.50%, 10/15/54(t) | | | 98,463 | | | | 99,411,166 | |
| | |
| 56 | | 2 0 2 4 B L A C K R O C K A N N U A L F I N A N C I A L S T A T E M E N T S A N D A D D I T I O N A L I N F O R M A T I O N |
| | |
Consolidated Schedule of Investments (continued) September 30, 2024 | | BlackRock Total Return Fund (Percentages shown are based on Net Assets) |
| | | | | | | | |
| Security | | Par (000) | | | Value | |
|
Mortgage-Backed Securities (continued) | |
Ginnie Mae Mortgage-Backed Securities
6.00%, 10/15/54(t) | | USD | 151,656 | | | $ | 154,177,587 | |
6.50%, 10/15/54(t) | | | 102,346 | | | | 104,676,373 | |
Uniform Mortgage-Backed Securities | | | | | | | | |
2.00%, 10/01/39 - 10/01/54(t) | | | 39,891 | | | | 36,019,665 | |
2.50%, 10/01/39 - 10/01/54(t) | | | 90,399 | | | | 79,371,592 | |
3.00%, 10/01/39 - 10/01/54(t) | | | 104,716 | | | | 94,265,852 | |
3.50%, 10/01/39 - 10/01/54(t) | | | 451,319 | | | | 420,257,081 | |
4.00%, 10/01/39 - 10/01/54(t) | | | 45,435 | | | | 43,771,939 | |
4.50%, 10/01/39 - 10/01/54(t) | | | 519,139 | | | | 510,771,533 | |
5.00%, 10/01/54(t) | | | 502,064 | | | | 501,756,585 | |
5.50%, 10/01/54(t) | | | 195,897 | | | | 198,165,854 | |
6.00%, 10/01/54(t) | | | 54,708 | | | | 55,912,983 | |
6.50%, 10/01/54(t) | | | 85,295 | | | | 87,930,129 | |
| | | | | | | | |
| | |
| | | | | | | 7,092,705,375 | |
| | | | | | | | |
| |
Total U.S. Government Sponsored Agency Securities — 35.5%
(Cost: $7,393,479,908) | | | | 7,152,330,218 | |
| | | | | | | | |
|
U.S. Treasury Obligations | |
U.S. Treasury Bonds | | | | | | | | |
4.50%, 08/15/39 - 02/15/44 | | | 105,609 | | | | 111,524,586 | |
4.63%, 02/15/40 - 05/15/44(s)(u) | | | 297,169 | | | | 315,084,737 | |
1.13%, 05/15/40 - 08/15/40 | | | 15,456 | | | | 10,166,848 | |
4.38%, 05/15/40 - 05/15/41 | | | 62,107 | | | | 64,871,080 | |
3.88%, 08/15/40 - 02/15/43(u) | | | 121,626 | | | | 117,521,579 | |
1.38%, 11/15/40 - 08/15/50 | | | 36,878 | | | | 21,300,585 | |
4.25%, 11/15/40 | | | 34,584 | | | | 35,607,805 | |
1.88%, 02/15/41 - 11/15/51 | | | 123,310 | | | | 83,222,901 | |
4.75%, 02/15/41 | | | 29,756 | | | | 32,413,736 | |
2.00%, 11/15/41 - 08/15/51 | | | 56,223 | | | | 38,681,699 | |
2.38%, 02/15/42 - 05/15/51 | | | 76,242 | | | | 55,832,479 | |
3.00%, 05/15/42 - 08/15/52 | | | 349,877 | | | | 284,745,271 | |
2.88%, 05/15/43 - 05/15/49 | | | 95,189 | | | | 77,839,351 | |
3.63%, 08/15/43 - 05/15/53 | | | 166,070 | | | | 151,696,475 | |
3.75%, 11/15/43 | | | 38,288 | | | | 36,020,632 | |
3.13%, 08/15/44 - 05/15/48 | | | 67,606 | | | | 57,006,200 | |
2.50%, 02/15/45 | | | 87,717 | | | | 67,041,829 | |
2.75%, 11/15/47 | | | 88,165 | | | | 68,644,718 | |
2.25%, 08/15/49 - 02/15/52 | | | 79,746 | | | | 54,893,237 | |
1.63%, 11/15/50 | | | 59,060 | | | | 34,739,512 | |
4.13%, 08/15/53 | | | 87,101 | | | | 86,737,044 | |
U.S. Treasury Notes | | | | | | | | |
2.88%, 06/15/25 - 05/15/32 | | | 63,443 | | | | 62,650,252 | |
5.00%, 08/31/25 - 09/30/25 | | | 160,315 | | | | 161,772,290 | |
4.50%, 11/15/25 - 07/15/26 | | | 161,046 | | | | 162,698,147 | |
4.00%, 12/15/25 - 02/15/34 | | | 273,978 | | | | 277,159,772 | |
4.63%, 03/15/26 - 04/30/31 | | | 127,034 | | | | 129,957,957 | |
1.63%, 11/30/26 - 05/15/31 | | | 93,803 | | | | 83,603,689 | |
0.50%, 04/30/27 - 08/31/27 | | | 225,062 | | | | 206,988,721 | |
2.38%, 05/15/27 - 03/31/29 | | | 45,746 | | | | 43,799,725 | |
2.25%, 08/15/27 | | | 17,186 | | | | 16,566,364 | |
0.38%, 09/30/27 | | | 38,219 | | | | 34,776,304 | |
3.88%, 11/30/27 - 12/31/29 | | | 206,330 | | | | 208,694,474 | |
3.63%, 03/31/28 | | | 90,243 | | | | 90,426,406 | |
1.25%, 05/31/28 - 08/15/31(u) | | | 336,854 | | | | 299,302,316 | |
3.13%, 11/15/28 | | | 5,555 | | | | 5,458,221 | |
3.25%, 06/30/29 | | | 77,449 | | | | 76,333,138 | |
1.50%, 02/15/30 | | | 26,900 | | | | 24,154,309 | |
| | | | | | | | |
| Security | | Par (000) | | | Value | |
|
U.S. Treasury Obligations (continued) | |
U.S. Treasury Notes | | | | | | | | |
3.75%, 05/31/30 | | USD | 76,967 | | | $ | 77,475,102 | |
4.88%, 10/31/30 | | | 27,922 | | | | 29,802,265 | |
| | | | | | | | |
| |
Total U.S. Treasury Obligations — 18.9%
(Cost: $3,902,934,059) | | | | 3,797,211,756 | |
| | | | | | | | |
| | |
| | | Shares | | | | |
|
Warrants(h) | |
| |
Automobile Components — 0.0% | | | | | |
Aurora Innovation, Inc. (Issued/Exercisable 05/04/22, 1 Share for 1 Warrant, Expires 12/31/28, Strike Price USD 11.50) | | | 16,026 | | | | 13,285 | |
| | | | | | | | |
| |
Automobiles — 0.0% | | | | | |
Lightning eMotors, Inc. (Issued/Exercisable 03/03/22, 1 Share for 1 Warrant, Expires 12/15/25, Strike Price USD 11.50) | | | 216,261 | | | | 22 | |
| | | | | | | | |
| |
Banks — 0.0% | | | | | |
New York Community Bancorp, Inc. (Issued/Exercisable 03/06/24, 1 Share for 1 Warrant, Expires 03/11/31, Strike Price USD 11.50) (Acquired 03/07/24, cost $0)(i) | | | 948 | | | | 2,234,151 | |
| | | | | | | | |
| |
Capital Markets — 0.0% | | | | | |
Crown PropTech Acquisitions (Issued/Exercisable 01/25/21, 1 Share for 1 Warrant, Expires 02/01/26, Strike Price
USD 11.50)(g) | | | 214,560 | | | | 8,261 | |
Crown PropTech Acquisitions (Issued/Exercisable 01/25/21, 1 Share for 1 Warrant, Expires 12/31/27, Strike Price
USD 11.50)(g) | | | 128,396 | | | | 1 | |
| | | | | | | | |
| | | | | | | 8,262 | |
| |
Financial Services — 0.0% | | | | | |
Rotor Acquisition Corp. (Issued/Exercisable 01/11/22, 1 Share for 1 Warrant, Expires 01/31/26, Strike Price USD 11.50) | | | 72,998 | | | | 2,190 | |
| | | | | | | | |
| |
Hotels, Restaurants & Leisure — 0.0% | | | | | |
Sonder Holdings, Inc. (Issued/Exercisable 06/07/24, 1 Share for 1 Warrant, Expires 12/31/49, Strike Price
USD 11.50)(g) | | | 26,448 | | | | 124,041 | |
| | | | | | | | |
| |
Machinery — 0.0% | | | | | |
Palladyne AI Corp. (Issued/Exercisable 12/21/20, 1 Share for 1 Warrant, Expires 06/15/27, Strike Price USD 11.50) | | | 267,474 | | | | 8,024 | |
| | | | | | | | |
| |
Oil, Gas & Consumable Fuels — 0.0% | | | | | |
Insight M, Inc. (Issued/Exercisable 01/25/24, 1 Share for 1 Warrant, Expires 12/31/49, Strike Price USD 11.50)(g) | | | 3,390,177 | | | | 413,941 | |
| | | | | | | | |
| |
Passenger Airlines — 0.0% | | | | | |
Volato Group, Inc. (Issued/Exercisable 12/08/23, 1 Share for 1 Warrant, Expires 12/03/28, Strike Price USD 11.50) (Acquired 12/03/21,
cost $73,612)(i) | | | 73,612 | | | | 1,332 | |
| | | | | | | | |
| |
Real Estate Management & Development — 0.0% | | | | | |
Offerpad Solutions, Inc. (Issued/Exercisable 10/23/21, 1 Share for 1 Warrant, Expires 09/01/26, Strike Price USD 11.50) | | | 111,610 | | | | 335 | |
| | | | | | | | |
| | |
C O N S O L I D A T E D S C H E D U L E S O F I N V E S T M E N T S | | 57 |
| | |
Consolidated Schedule of Investments (continued) September 30, 2024 | | BlackRock Total Return Fund (Percentages shown are based on Net Assets) |
| | | | | | | | |
| Security | | Shares | | | Value | |
| | |
Software — 0.0% | | | | | | | | |
Latch, Inc. (Issued/Exercisable 11/13/21, 1 Share for 1 Warrant, Expires 06/04/26, Strike Price USD 11.50)(g) | | | 49,166 | | | $ | — | |
Versa Networks, Inc. (Issued/Exercisable 10/05/22, 1 Share for 1 Warrant, Expires 10/07/32, Strike Price USD 11.50) (Acquired 10/14/22, cost $0)(g)(i) | | | 507,586 | | | | 2,070,951 | |
| | | | | | | | |
| | |
| | | | | | | 2,070,951 | |
| | |
| Specialty Retail — 0.0% | | | | | | |
Davidson Homes (Issued/Exercisable 03/21/24, 1 Share for 1 Warrant, Expires 05/16/34, Strike Price USD 8.47)(g) | | | 129,494 | | | | 1,423,139 | |
EVgo, Inc. (Issued/Exercisable 10/02/21, 1 Share for 1 Warrant, Expires 09/15/25, Strike Price USD 11.50) | | | 75,790 | | | | 24,435 | |
| | | | | | | | |
| | |
| | | | | | | 1,447,574 | |
|
| Trading Companies & Distributors — 0.0% | |
Lavoro Ltd. (Issued/Exercisable 12/27/23, 1 Share for 1 Warrant, Expires 12/27/27, Strike Price USD 11.50) | | | 79,561 | | | | 22,675 | |
| | | | | | | | |
| | |
Total Warrants — 0.0%
(Cost: $1,433,474) | | | | | | | 6,346,783 | |
| | | | | | | | |
| |
Total Long-Term Investments — 108.4%
(Cost: $22,231,111,121) | | | | 21,820,524,147 | |
| | | | | | | | |
| | |
| | | Shares | | | | |
| |
Short-Term Securities | | | | | |
| |
| Money Market Funds — 5.4% | | | | |
BlackRock Cash Funds: Institutional, SL Agency Shares, 5.05%(r)(v)(w) | | | 11,641,093 | | | | 11,651,570 | |
BlackRock Liquidity Funds, T-Fund, Institutional Shares, 4.83%(r)(v) | | | 1,075,080,828 | | | | 1,075,080,828 | |
| | | | | | | | |
| |
Total Short-Term Securities — 5.4%
(Cost: $1,086,731,703) | | | | 1,086,732,398 | |
| | | | | | | | |
| |
Options Purchased — 0.2%
(Cost: $26,011,506) | | | | 35,848,887 | |
| | | | | | | | |
| |
Total Investments Before Options Written and TBA Sale Commitments — 114.0%
(Cost: $23,343,854,330) | | | | 22,943,105,432 | |
| | | | | | | | |
| | |
| | | Par (000) | | | | |
| |
TBA Sale Commitments(t) | | | | | |
| |
| Mortgage-Backed Securities — (9.8)% | | | | |
Ginnie Mae Mortgage-Backed Securities | | | | | | | | |
2.00%, 10/15/54 | | | USD (3,263 | ) | | | (2,766,154 | ) |
2.50%, 10/15/54 | | | (3,057 | ) | | | (2,693,864 | ) |
3.00%, 10/15/54 | | | (2,175 | ) | | | (1,983,156 | ) |
3.50%, 10/15/54 | | | (2,100 | ) | | | (1,972,842 | ) |
4.00%, 10/15/54 | | | (1,275 | ) | | | (1,232,628 | ) |
4.50%, 10/15/54 | | | (1,407 | ) | | | (1,389,221 | ) |
5.00%, 10/15/54 | | | (1,496 | ) | | | (1,498,395 | ) |
5.50%, 10/15/54 | | | (1,866 | ) | | | (1,883,969 | ) |
6.00%, 10/15/54 | | | (74,246 | ) | | | (75,503,891 | ) |
6.50%, 10/15/54 | | | (51,126 | ) | | | (52,308,804 | ) |
| | | | | | | | |
| Security | | Par (000) | | | Value | |
| |
Mortgage-Backed Securities (continued) | | | | | |
Uniform Mortgage-Backed Securities | | | | | | | | |
1.50%, 10/01/39 | | | USD (7,425 | ) | | $ | (6,625,950 | ) |
2.00%, 10/01/39 - 10/01/54 | | | (48,032 | ) | | | (40,009,483 | ) |
2.50%, 10/01/39 - 10/01/54 | | | (8,502 | ) | | | (7,409,393 | ) |
3.00%, 10/01/39 - 10/01/54 | | | (4,890 | ) | | | (4,411,826 | ) |
3.50%, 10/01/39 - 10/01/54 | | | (229,542 | ) | | | (213,807,634 | ) |
4.00%, 10/01/39 - 10/01/54 | | | (20,118 | ) | | | (19,322,706 | ) |
4.50%, 10/01/39 - 10/01/54 | | | (1,224,935 | ) | | | (1,204,294,293 | ) |
5.00%, 10/01/54 | | | (167,667 | ) | | | (167,555,659 | ) |
5.50%, 10/01/54 | | | (2,199 | ) | | | (2,224,463 | ) |
6.00%, 10/01/54 | | | (9,675 | ) | | | (9,888,130 | ) |
6.50%, 10/01/54 | | | (148,866 | ) | | | (153,430,246 | ) |
| | | | | | | | |
| |
Total TBA Sale Commitments — (9.8)%
(Proceeds: $(1,979,372,924)) | | | | (1,972,212,707 | ) |
| | | | | | | | |
| |
Options Written — (0.3)%
(Premiums Received: $(38,544,200)) | | | | (51,884,307 | ) |
| | | | | | | | |
| |
Total Investments Net of Options Written and TBA Sale Commitments — 103.9%
(Cost: $21,325,937,206) | | | | 20,919,008,418 | |
| |
Liabilities in Excess of Other Assets — (3.9)% | | | | (791,700,929 | ) |
| | | | | | | | |
| | |
Net Assets — 100.0% | | | | | | $ | 20,127,307,489 | |
| | | | | | | | |
| (a) | Security exempt from registration pursuant to Rule 144A under the Securities Act of 1933, as amended. These securities may be resold in transactions exempt from registration to qualified institutional investors. |
| (b) | Variable rate security. Interest rate resets periodically. The rate shown is the effective interest rate as of period end. Security description also includes the reference rate and spread if published and available. |
| (c) | Step coupon security. Coupon rate will either increase (step-up bond) or decrease (step-down bond) at regular intervals until maturity. Interest rate shown reflects the rate currently in effect. |
| (d) | When-issued security. |
| (f) | This security may be resold to qualified foreign investors and foreign institutional buyers under Regulation S of the Securities Act of 1933. |
| (g) | Security is valued using significant unobservable inputs and is classified as Level 3 in the fair value hierarchy. |
| (h) | Non-income producing security. |
| (i) | Restricted security as to resale, excluding 144A securities. The Fund held restricted securities with a current value of $65,703,887, representing 0.3% of its net assets as of period end, and an original cost of $51,052,037. |
| (j) | All or a portion of this security is on loan. |
| (k) | All or a portion of the security is held by a wholly-owned subsidiary. See Note 1 of the Notes to Consolidated Financial Statements for details on the wholly-owned subsidiary. |
| (l) | Investment does not issue shares. |
| (m) | All or a portion of the security has been pledged and/or segregated as collateral in connection with outstanding exchange-traded options written. |
| (n) | Convertible security. |
| (o) | Issuer filed for bankruptcy and/or is in default. |
| (p) | Perpetual security with no stated maturity date. |
| (q) | Payment-in-kind security which may pay interest/dividends in additional par/shares and/or in cash. Rates shown are the current rate and possible payment rates. |
| (r) | Affiliate of the Fund. |
| (s) | All or a portion of the security has been pledged as collateral in connection with outstanding TBA commitments. |
| (t) | Represents or includes a TBA transaction. |
| (u) | All or a portion of the security has been pledged as collateral in connection with outstanding OTC derivatives. |
| (v) | Annualized 7-day yield as of period end. |
| (w) | All or a portion of this security was purchased with the cash collateral from loaned securities. |
| | |
| 58 | | 2 0 2 4 B L A C K R O C K A N N U A L F I N A N C I A L S T A T E M E N T S A N D A D D I T I O N A L I N F O R M A T I O N |
| | |
Consolidated Schedule of Investments (continued) September 30, 2024 | | BlackRock Total Return Fund |
Affiliates
Investments in issuers considered to be affiliate(s) of the Fund during the year ended September 30, 2024 for purposes of Section 2(a)(3) of the Investment Company Act of 1940, as amended, were as follows:
| | | | | | | | | | | | | | | | | | | | | | | | | | | | | | | | | | | | |
| | | | | | | | | | |
| Affiliated Issuer | | Value at 09/30/23 | | | Purchases at Cost | | | Proceeds from Sales | | | Net Realized Gain (Loss) | | | Change in Unrealized Appreciation (Depreciation) | | | Value at 09/30/24 | | | Par/Shares Held at 09/30/24 | | | Income | | | Capital Gain Distributions from Underlying Funds | |
BlackRock Capital Finance LP, Series 1997- R2, Class AP | | $ | — | (a) | | $ | — | | | $ | (2,004 | ) | | $ | — | | | $ | 2,004 | | | $ | — | | | $ | 830 | | | $ | 14 | | | $ | — | |
BlackRock Cash Funds: Institutional, SL Agency Shares | | | — | | | | 11,648,611 | (b) | | | — | | | | 2,264 | | | | 695 | | | | 11,651,570 | | | | 11,641,093 | | | | 16,548 | (c) | | | — | |
BlackRock Liquidity Funds, T-Fund, Institutional Shares | | | 923,558,671 | (a) | | | 151,522,157 | (b) | | | — | | | | — | | | | — | | | | 1,075,080,828 | | | | 1,075,080,828 | | | | 28,543,060 | | | | — | |
iShares iBoxx $ Investment Grade Corporate Bond ETF | | | 24,382,780 | (a) | | | 713,062,167 | | | | (732,470,459 | ) | | | (1,174,423 | ) | | | 1,287,311 | | | | 5,087,376 | | | | 45,029 | | | | 1,376,342 | | | | — | |
iShares iBoxx High Yield Corporate Bond ETF(d) | | | — | | | | 134,027,124 | | | | (135,809,925 | ) | | | 1,782,801 | | | | — | | | | — | | | | — | | | | — | | | | — | |
iShares Russell 2000 ETF(d) | | | — | | | | 36,682,243 | | | | (37,687,829 | ) | | | 1,005,586 | | | | — | | | | — | | | | — | | | | — | | | | — | |
iShares U.S. Real Estate ETF(d) | | | — | | | | 37,025,484 | | | | (38,468,533 | ) | | | 1,443,049 | | | | — | | | | — | | | | — | | | | — | | | | — | |
SL Liquidity Series, LLC, Money Market Series(d) | | | 28,716,016 | (a) | | | — | | | | (28,713,893 | )(b) | | | 2,206 | | | | (4,329 | ) | | | — | | | | — | | | | 144,609 | (c) | | | — | |
| | | | | | | | | | | | | | | | | | | | | | | | | | | | | | | | | | | | |
| | | | | | | | | | | | | | $ | 3,061,483 | | | $ | 1,285,681 | | | $ | 1,091,819,774 | | | | | | | $ | 30,080,573 | | | $ | — | |
| | | | | | | | | | | | | | | | | | | | | | | | | | | | | | | | | | | | |
| | (a) | Represents value held by the Master Total Return Portfolio (the “Master Portfolio”) as of September 30, 2023. | |
| | (b) | Represents net amount purchased (sold) by the Fund and the Master Portfolio. | |
| | (c) | All or a portion represents securities lending income earned from the reinvestment of cash collateral from loaned securities, net of fees and collateral investment expenses, and other payments to and from borrowers of securities. | |
| | (d) | As of period end, the entity is no longer held by the Fund. | |
For purposes of this report, industry and sector sub-classifications may differ from those utilized by the Fund for compliance purposes.
| | |
C O N S O L I D A T E D S C H E D U L E S O F I N V E S T M E N T S | | 59 |
| | |
Consolidated Schedule of Investments (continued) September 30, 2024 | | BlackRock Total Return Fund |
Derivative Financial Instruments Outstanding as of Period End
Futures Contracts
| | | | | | | | | | | | | | | | |
| Description | | Number of
Contracts | | | Expiration
Date | | | Notional
Amount
(000) | | | Value/
Unrealized
Appreciation
(Depreciation) | |
| | | | |
Long Contracts | | | | | | | | | | | | | | | | |
3-month SONIA Index | | | 78 | | | | 03/18/25 | | | $ | 24,900 | | | $ | 30,863 | |
3-month SONIA Index | | | 186 | | | | 09/16/25 | | | | 59,859 | | | | (29,017 | ) |
Australian 10-Year Bonds | | | 1,667 | | | | 12/16/24 | | | | 134,144 | | | | (1,620,754 | ) |
CBOE Volatility Index | | | 560 | | | | 10/16/24 | | | | 10,552 | | | | 69,878 | |
CBOE Volatility Index | | | 10 | | | | 11/20/24 | | | | 181 | | | | (13,300 | ) |
ECX Emission1 | | | 28 | | | | 12/16/24 | | | | 2,043 | | | | (89,648 | ) |
Euro-Bund | | | 844 | | | | 12/06/24 | | | | 126,757 | | | | (10,953 | ) |
U.S. Treasury Bonds (30 Year) | | | 4,659 | | | | 12/19/24 | | | | 578,590 | | | | (2,984,442 | ) |
U.S. Treasury Notes (10 Year) | | | 6,048 | | | | 12/19/24 | | | | 691,173 | | | | 866,500 | |
U.S. Treasury Notes (2 Year) | | | 2,287 | | | | 12/31/24 | | | | 476,250 | | | | (739,792 | ) |
U.S. Treasury Notes (5 Year) | | | 17,942 | | | | 12/31/24 | | | | 1,971,517 | | | | 2,850,373 | |
U.S. Ultra Treasury Notes (10 Year) | | | 35 | | | | 12/19/24 | | | | 4,140 | | | | (5,210 | ) |
| | | | | | | | | | | | | | | | |
| | | | | | | | | | | | | | | (1,675,502 | ) |
| | | | | | | | | | | | | | | | |
| | | | |
Short Contracts | | | | | | | | | | | | | | | | |
Euro-Buxl | | | 632 | | | | 12/06/24 | | | | 95,874 | | | | 4,207 | |
Japanese Government Bonds (10 Year) | | | 26 | | | | 12/13/24 | | | | 26,167 | | | | 30,693 | |
U.S. Ultra Treasury Bonds | | | 357 | | | | 12/19/24 | | | | 47,514 | | | | 13,449 | |
E-Mini Russell 2000 Index | | | 60 | | | | 12/20/24 | | | | 6,748 | | | | (37,352 | ) |
Euro STOXX 50 Index | | | 273 | | | | 12/20/24 | | | | 15,286 | | | | (511,745 | ) |
S&P 500 E-Mini Index | | | 12 | | | | 12/20/24 | | | | 3,489 | | | | (10,904 | ) |
3-month SOFR | | | 3,539 | | | | 03/17/26 | | | | 858,208 | | | | (215,729 | ) |
| | | | | | | | | | | | | | | | |
| | | | | | | | | | | | | | | (727,381 | ) |
| | | | | | | | | | | | | | | | |
| | | | | | | | | | | | | | $ | (2,402,883 | ) |
| | | | | | | | | | | | | | | | |
| | 1 | All or a portion of the security is held by a wholly-owned subsidiary. See Note 1 of the Notes to Consolidated Financial Statements for details on the wholly-owned subsidiary. | |
Forward Foreign Currency Exchange Contracts
| | | | | | | | | | | | | | | | | | | | |
| | | | | |
| Currency Purchased | | | Currency Sold | | | Counterparty | | Settlement
Date | | | Unrealized
Appreciation
(Depreciation) | |
EUR | | | 360,756 | | | USD | | | 388,958 | | | Commonwealth Bank of Australia | | | 10/01/24 | | | $ | 12,636 | |
EUR | | | 143,553 | | | USD | | | 157,650 | | | Goldman Sachs International | | | 10/01/24 | | | | 2,153 | |
EUR | | | 184,160 | | | USD | | | 202,245 | | | Goldman Sachs International | | | 10/01/24 | | | | 2,762 | |
EUR | | | 237,480 | | | USD | | | 260,802 | | | Goldman Sachs International | | | 10/01/24 | | | | 3,561 | |
BRL | | | 8,543,557 | | | USD | | | 1,517,000 | | | Bank of America N.A. | | | 10/02/24 | | | | 50,914 | |
BRL | | | 5,587,820 | | | USD | | | 1,007,000 | | | Bank of America N.A. | | | 10/02/24 | | | | 18,477 | |
BRL | | | 23,955,120 | | | USD | | | 4,187,958 | | | Bank of New York Mellon | | | 10/02/24 | | | | 208,286 | |
BRL | | | 8,337,141 | | | USD | | | 1,503,000 | | | Barclays Bank PLC | | | 10/02/24 | | | | 27,032 | |
BRL | | | 5,080,372 | | | USD | | | 922,000 | | | BNP Paribas S.A. | | | 10/02/24 | | | | 10,350 | |
BRL | | | 11,250,284 | | | USD | | | 1,988,000 | | | BNP Paribas S.A. | | | 10/02/24 | | | | 76,652 | |
BRL | | | 5,679,394 | | | USD | | | 1,011,000 | | | Goldman Sachs International | | | 10/02/24 | | | | 31,282 | |
BRL | | | 5,602,948 | | | USD | | | 1,007,000 | | | Goldman Sachs International | | | 10/02/24 | | | | 21,253 | |
BRL | | | 8,640,593 | | | USD | | | 1,576,000 | | | Goldman Sachs International | | | 10/02/24 | | | | 9,722 | |
BRL | | | 11,299,620 | | | USD | | | 1,992,000 | | | HSBC Bank PLC | | | 10/02/24 | | | | 81,707 | |
BRL | | | 8,417,534 | | | USD | | | 1,493,000 | | | HSBC Bank PLC | | | 10/02/24 | | | | 51,786 | |
BRL | | | 18,573,149 | | | USD | | | 3,364,000 | | | TD Securities, Inc. | | | 10/02/24 | | | | 44,545 | |
USD | | | 999,000 | | | BRL | | | 5,429,992 | | | Bank of America N.A. | | | 10/02/24 | | | | 2,488 | |
USD | | | 2,613,000 | | | BRL | | | 14,175,525 | | | Bank of America N.A. | | | 10/02/24 | | | | 11,507 | |
USD | | | 1,499,000 | | | BRL | | | 8,147,620 | | | Barclays Bank PLC | | | 10/02/24 | | | | 3,749 | |
USD | | | 2,248,000 | | | BRL | | | 12,210,012 | | | Citibank N.A. | | | 10/02/24 | | | | 7,218 | |
USD | | | 989,000 | | | BRL | | | 5,356,384 | | | Goldman Sachs International | | | 10/02/24 | | | | 5,996 | |
USD | | | 4,712,235 | | | BRL | | | 23,955,120 | | | Morgan Stanley & Co. International PLC | | | 10/02/24 | | | | 315,991 | |
EUR | | | 106,453 | | | USD | | | 116,723 | | | Barclays Bank PLC | | | 10/17/24 | | | | 1,865 | |
EUR | | | 175,881 | | | USD | | | 192,702 | | | Deutsche Bank AG | | | 10/17/24 | | | | 3,227 | |
| | |
| 60 | | 2 0 2 4 B L A C K R O C K A N N U A L F I N A N C I A L S T A T E M E N T S A N D A D D I T I O N A L I N F O R M A T I O N |
| | |
Consolidated Schedule of Investments (continued) September 30, 2024 | | BlackRock Total Return Fund |
Forward Foreign Currency Exchange Contracts (continued)
| | | | | | | | | | | | | | | | | | | | |
| | | | | |
| Currency Purchased | | | Currency Sold | | | Counterparty | | Settlement
Date | | | Unrealized
Appreciation
(Depreciation) | |
EUR | | | 578,802 | | | USD | | | 634,158 | | | Deutsche Bank AG | | | 10/17/24 | | | $ | 10,621 | |
EUR | | | 80,507 | | | USD | | | 88,206 | | | Deutsche Bank AG | | | 10/17/24 | | | | 1,477 | |
EUR | | | 178,684 | | | USD | | | 195,773 | | | Deutsche Bank AG | | | 10/17/24 | | | | 3,279 | |
TRY | | | 35,655,748 | | | USD | | | 951,000 | | | BNP Paribas S.A. | | | 10/23/24 | | | | 65,908 | |
USD | | | 4,022,000 | | | JPY | | | 573,432,105 | | | Deutsche Bank AG | | | 10/24/24 | | | | 17,908 | |
AUD | | | 1,087,843 | | | EUR | | | 664,500 | | | Morgan Stanley & Co. International PLC | | | 10/25/24 | | | | 11,886 | |
AUD | | | 2,921,000 | | | USD | | | 1,994,727 | | | Bank of America N.A. | | | 10/25/24 | | | | 25,550 | |
AUD | | | 1,465,000 | | | USD | | | 1,008,462 | | | BNP Paribas S.A. | | | 10/25/24 | | | | 4,789 | |
CLP | | | 1,344,628,500 | | | USD | | | 1,450,000 | | | Barclays Bank PLC | | | 10/25/24 | | | | 44,893 | |
CNH | | | 11,069,430 | | | USD | | | 1,576,000 | | | Citibank N.A. | | | 10/25/24 | | | | 7,286 | |
GBP | | | 4,576,000 | | | USD | | | 6,073,072 | | | Barclays Bank PLC | | | 10/25/24 | | | | 44,734 | |
IDR | | | 98,423,910,000 | | | USD | | | 6,471,000 | | | Barclays Bank PLC | | | 10/25/24 | | | | 23,001 | |
KRW | | | 570,226,800 | | | USD | | | 429,000 | | | Barclays Bank PLC | | | 10/25/24 | | | | 7,727 | |
KRW | | | 1,314,640,800 | | | USD | | | 1,006,000 | | | Barclays Bank PLC | | | 10/25/24 | | | | 860 | |
NOK | | | 10,644,945 | | | USD | | | 1,008,000 | | | JPMorgan Chase Bank N.A. | | | 10/25/24 | | | | 1,000 | |
PEN | | | 5,349,307 | | | USD | | | 1,425,000 | | | Barclays Bank PLC | | | 10/25/24 | | | | 17,459 | |
SGD | | | 1,934,988 | | | USD | | | 1,499,000 | | | JPMorgan Chase Bank N.A. | | | 10/25/24 | | | | 8,568 | |
THB | | | 55,440,041 | | | USD | | | 1,673,000 | | | Bank of America N.A. | | | 10/25/24 | | | | 53,037 | |
THB | | | 65,932,318 | | | USD | | | 2,014,000 | | | Goldman Sachs International | | | 10/25/24 | | | | 38,698 | |
THB | | | 64,291,920 | | | USD | | | 1,988,000 | | | Morgan Stanley & Co. International PLC | | | 10/25/24 | | | | 13,626 | |
TWD | | | 27,732,250 | | | USD | | | 875,000 | | | HSBC Bank PLC | | | 10/25/24 | | | | 3,328 | |
USD | | | 1,007,000 | | | COP | | | 4,200,197,000 | | | Citibank N.A. | | | 10/25/24 | | | | 11,803 | |
USD | | | 3,584,000 | | | COP | | | 15,051,008,000 | | | Deutsche Bank AG | | | 10/25/24 | | | | 17,807 | |
USD | | | 1,004,000 | | | COP | | | 4,202,242,000 | | | Société Générale | | | 10/25/24 | | | | 8,319 | |
USD | | | 1,502,380 | | | EUR | | | 1,343,000 | | | Goldman Sachs International | | | 10/25/24 | | | | 5,762 | |
USD | | | 6,232,586 | | | EUR | | | 5,586,307 | | | Morgan Stanley & Co. International PLC | | | 10/25/24 | | | | 7,293 | |
USD | | | 2,749,468 | | | EUR | | | 2,464,388 | | | Morgan Stanley & Co. International PLC | | | 10/25/24 | | | | 3,193 | |
USD | | | 946,096 | | | EUR | | | 848,000 | | | Morgan Stanley & Co. International PLC | | | 10/25/24 | | | | 1,099 | |
USD | | | 1,505,273 | | | GBP | | | 1,124,000 | | | Goldman Sachs International | | | 10/25/24 | | | | 2,560 | |
USD | | | 1,499,000 | | | MXN | | | 29,273,239 | | | Goldman Sachs International | | | 10/25/24 | | | | 18,198 | |
USD | | | 2,521,000 | | | MXN | | | 49,695,991 | | | Goldman Sachs International | | | 10/25/24 | | | | 7,103 | |
USD | | | 4,204,000 | | | PLN | | | 16,139,997 | | | Barclays Bank PLC | | | 10/25/24 | | | | 13,041 | |
USD | | | 980,192 | | | PLN | | | 3,761,631 | | | Morgan Stanley & Co. International PLC | | | 10/25/24 | | | | 3,436 | |
USD | | | 21,775,315 | | | PLN | | | 83,721,514 | | | UBS AG | | | 10/25/24 | | | | 35,943 | |
USD | | | 1,513,000 | | | ZAR | | | 26,168,697 | | | UBS AG | | | 10/25/24 | | | | 1,708 | |
ZAR | | | 32,483,165 | | | EUR | | | 1,660,000 | | | TD Securities, Inc. | | | 10/25/24 | | | | 26,086 | |
ZAR | | | 33,387,176 | | | USD | | | 1,928,000 | | | Bank of America N.A. | | | 10/25/24 | | | | 173 | |
ZAR | | | 34,952,366 | | | USD | | | 2,014,000 | | | HSBC Bank PLC | | | 10/25/24 | | | | 4,565 | |
ZAR | | | 7,905,287 | | | USD | | | 450,737 | | | TD Securities, Inc. | | | 10/25/24 | | | | 5,808 | |
TRY | | | 35,092,816 | | | USD | | | 946,000 | | | Barclays Bank PLC | | | 10/28/24 | | | | 49,512 | |
TRY | | | 53,191,425 | | | USD | | | 1,427,000 | | | Citibank N.A. | | | 10/28/24 | | | | 81,933 | |
USD | | | 5,183,155 | | | MXN | | | 101,631,058 | | | State Street Bank and Trust Co. | | | 10/28/24 | | | | 44,545 | |
USD | | | 1,268,128 | | | MXN | | | 24,865,393 | | | State Street Bank and Trust Co. | | | 10/28/24 | | | | 10,899 | |
USD | | | 1,505,000 | | | BRL | | | 8,194,048 | | | Bank of America N.A. | | | 11/04/24 | | | | 7,064 | |
TRY | | | 54,602,928 | | | USD | | | 1,501,000 | | | UBS AG | | | 11/12/24 | | | | 22,595 | |
TRY | | | 110,032,000 | | | USD | | | 3,027,790 | | | UBS AG | | | 11/20/24 | | | | 15,599 | |
USD | | | 3,095,941 | | | COP | | | 13,056,821,000 | | | Deutsche Bank AG | | | 11/27/24 | | | | 14,670 | |
USD | | | 7,188,431 | | | CZK | | | 161,830,296 | | | Deutsche Bank AG | | | 11/27/24 | | | | 35,502 | |
TRY | | | 11,143,400 | | | USD | | | 285,933 | | | Barclays Bank PLC | | | 12/04/24 | | | | 17,677 | |
TRY | | | 22,398,234 | | | USD | | | 551,803 | | | Barclays Bank PLC | | | 12/04/24 | | | | 58,454 | |
TRY | | | 22,286,800 | | | USD | | | 572,557 | | | Goldman Sachs International | | | 12/04/24 | | | | 34,663 | |
TRY | | | 11,031,966 | | | USD | | | 287,515 | | | Goldman Sachs International | | | 12/04/24 | | | | 13,059 | |
TRY | | | 33,430,200 | | | USD | | | 858,175 | | | Goldman Sachs International | | | 12/04/24 | | | | 52,657 | |
TRY | | | 11,143,400 | | | USD | | | 284,961 | | | Goldman Sachs International | | | 12/04/24 | | | | 18,649 | |
TRY | | | 64,302,000 | | | USD | | | 1,503,346 | | | BNP Paribas S.A. | | | 12/06/24 | | | | 244,962 | |
BRL | | | 183,355,800 | | | USD | | | 32,102,353 | | | Bank of New York Mellon | | | 12/18/24 | | | | 1,245,666 | |
IDR | | | 129,680,129,696 | | | USD | | | 8,349,760 | | | Citibank N.A. | | | 12/18/24 | | | | 188,876 | |
USD | | | 97,972 | | | GBP | | | 73,000 | | | Deutsche Bank AG | | | 12/18/24 | | | | 392 | |
USD | | | 818,064 | | | GBP | | | 610,000 | | | TD Securities, Inc. | | | 12/18/24 | | | | 2,669 | |
USD | | | 22,591,050 | | | JPY | | | 3,198,559,000 | | | Bank of New York Mellon | | | 12/18/24 | | | | 94,630 | |
| | |
C O N S O L I D A T E D S C H E D U L E S O F I N V E S T M E N T S | | 61 |
| | |
Consolidated Schedule of Investments (continued) September 30, 2024 | | BlackRock Total Return Fund |
Forward Foreign Currency Exchange Contracts (continued)
| | | | | | | | | | | | | | | | | | | | |
| | | | | |
| Currency Purchased | | | Currency Sold | | | Counterparty | | Settlement
Date | | | Unrealized
Appreciation
(Depreciation) | |
USD | | | 69,773,157 | | | JPY | | | 9,836,379,000 | | | HSBC Bank PLC | | | 12/18/24 | | | $ | 590,968 | |
USD | | | 8,282,592 | | | JPY | | | 1,150,434,000 | | | Royal Bank of Canada | | | 12/18/24 | | | | 191,247 | |
USD | | | 602,944 | | | JPY | | | 84,785,000 | | | UBS AG | | | 12/18/24 | | | | 6,626 | |
USD | | | 41,333,000 | | | MXN | | | 799,894,816 | | | Citibank N.A. | | | 12/18/24 | | | | 1,200,735 | |
CNY | | | 32,755,140 | | | USD | | | 4,686,000 | | | Morgan Stanley & Co. International PLC | | | 01/27/25 | | | | 27,353 | |
| | | | | | | | | | | | | | | | | | | | |
| | | | | | | | | | | | | | | | | | $ | 5,856,293 | |
| | | | | | | | | | | | | | | | | | | | |
USD | | | 624,529 | | | EUR | | | 579,902 | | | JPMorgan Chase Bank N.A. | | | 10/01/24 | | | | (21,018 | ) |
USD | | | 146,828 | | | EUR | | | 136,334 | | | JPMorgan Chase Bank N.A. | | | 10/01/24 | | | | (4,939 | ) |
USD | | | 479,261 | | | EUR | | | 445,007 | | | JPMorgan Chase Bank N.A. | | | 10/01/24 | | | | (16,120 | ) |
USD | | | 1,612,637 | | | EUR | | | 1,497,404 | | | NatWest Markets PLC | | | 10/01/24 | | | | (54,272 | ) |
USD | | | 223,497 | | | EUR | | | 207,527 | | | NatWest Markets PLC | | | 10/01/24 | | | | (7,522 | ) |
BRL | | | 8,164,625 | | | USD | | | 1,505,000 | | | Bank of America N.A. | | | 10/02/24 | | | | (6,628 | ) |
USD | | | 1,007,000 | | | BRL | | | 5,554,209 | | | Barclays Bank PLC | | | 10/02/24 | | | | (12,309 | ) |
USD | | | 1,517,000 | | | BRL | | | 8,467,520 | | | BNP Paribas S.A. | | | 10/02/24 | | | | (36,959 | ) |
USD | | | 1,011,000 | | | BRL | | | 5,643,153 | | | BNP Paribas S.A. | | | 10/02/24 | | | | (24,631 | ) |
USD | | | 999,000 | | | BRL | | | 5,561,037 | | | BNP Paribas S.A. | | | 10/02/24 | | | | (21,562 | ) |
USD | | | 1,992,000 | | | BRL | | | 11,191,661 | | | BNP Paribas S.A. | | | 10/02/24 | | | | (61,894 | ) |
USD | | | 1,499,000 | | | BRL | | | 8,280,476 | | | Citibank N.A. | | | 10/02/24 | | | | (20,633 | ) |
USD | | | 1,007,000 | | | BRL | | | 5,492,158 | | | Goldman Sachs International | | | 10/02/24 | | | | (921 | ) |
USD | | | 1,505,000 | | | BRL | | | 8,265,460 | | | Goldman Sachs International | | | 10/02/24 | | | | (11,877 | ) |
USD | | | 869,144 | | | TRY | | | 30,775,536 | | | Barclays Bank PLC | | | 10/07/24 | | | | (23,913 | ) |
USD | | | 9,656,915 | | | COP | | | 41,046,717,960 | | | Bank of New York Mellon | | | 10/16/24 | | | | (80,690 | ) |
USD | | | 4,426,525 | | | COP | | | 18,912,329,000 | | | Morgan Stanley & Co. International PLC | | | 10/16/24 | | | | (60,089 | ) |
USD | | | 1,147,612 | | | EUR | | | 1,047,264 | | | Deutsche Bank AG | | | 10/17/24 | | | | (19,029 | ) |
USD | | | 160,917 | | | EUR | | | 146,850 | | | Deutsche Bank AG | | | 10/17/24 | | | | (2,673 | ) |
USD | | | 173,675 | | | EUR | | | 158,497 | | | Deutsche Bank AG | | | 10/17/24 | | | | (2,889 | ) |
USD | | | 190,322 | | | EUR | | | 173,701 | | | TD Securities, Inc. | | | 10/17/24 | | | | (3,179 | ) |
USD | | | 188,755 | | | EUR | | | 172,252 | | | TD Securities, Inc. | | | 10/17/24 | | | | (3,132 | ) |
USD | | | 195,661 | | | EUR | | | 178,573 | | | TD Securities, Inc. | | | 10/17/24 | | | | (3,268 | ) |
USD | | | 373,416 | | | EUR | | | 340,808 | | | UBS AG | | | 10/17/24 | | | | (6,241 | ) |
USD | | | 153,469 | | | EUR | | | 140,065 | | | UBS AG | | | 10/17/24 | | | | (2,562 | ) |
USD | | | 244,341 | | | EUR | | | 223,000 | | | UBS AG | | | 10/17/24 | | | | (4,079 | ) |
COP | | | 28,254,392,250 | | | USD | | | 6,793,015 | | | BNP Paribas S.A. | | | 10/23/24 | | | | (96,576 | ) |
COP | | | 9,418,130,750 | | | USD | | | 2,263,190 | | | BNP Paribas S.A. | | | 10/23/24 | | | | (31,044 | ) |
USD | | | 8,826,843 | | | COP | | | 37,672,523,000 | | | Morgan Stanley & Co. International PLC | | | 10/23/24 | | | | (101,743 | ) |
JPY | | | 572,992,219 | | | USD | | | 4,022,000 | | | Bank of America N.A. | | | 10/24/24 | | | | (20,979 | ) |
AUD | | | 2,178,000 | | | USD | | | 1,508,766 | | | Bank of America N.A. | | | 10/25/24 | | | | (2,377 | ) |
AUD | | | 1,453,000 | | | USD | | | 1,006,157 | | | Barclays Bank PLC | | | 10/25/24 | | | | (1,206 | ) |
CHF | | | 1,267,131 | | | USD | | | 1,508,000 | | | JPMorgan Chase Bank N.A. | | | 10/25/24 | | | | (6,273 | ) |
CNH | | | 7,034,539 | | | USD | | | 1,008,000 | | | Goldman Sachs International | | | 10/25/24 | | | | (1,833 | ) |
COP | | | 8,210,840,400 | | | GBP | | | 1,476,000 | | | Deutsche Bank AG | | | 10/25/24 | | | | (27,833 | ) |
COP | | | 4,197,032,000 | | | USD | | | 1,006,000 | | | Bank of America N.A. | | | 10/25/24 | | | | (11,553 | ) |
COP | | | 4,217,372,280 | | | USD | | | 1,004,000 | | | Barclays Bank PLC | | | 10/25/24 | | | | (4,734 | ) |
COP | | | 4,169,312,310 | | | USD | | | 1,007,000 | | | JPMorgan Chase Bank N.A. | | | 10/25/24 | | | | (19,121 | ) |
EUR | | | 3,485,000 | | | GBP | | | 2,929,445 | | | Morgan Stanley & Co. International PLC | | | 10/25/24 | | | | (32,843 | ) |
EUR | | | 248,000 | | | USD | | | 276,690 | | | BNP Paribas S.A. | | | 10/25/24 | | | | (323 | ) |
EUR | | | 2,751,000 | | | USD | | | 3,074,198 | | | Commonwealth Bank of Australia | | | 10/25/24 | | | | (8,527 | ) |
EUR | | | 1,343,000 | | | USD | | | 1,507,488 | | | Goldman Sachs International | | | 10/25/24 | | | | (10,870 | ) |
HUF | | | 1,175,623,354 | | | USD | | | 3,320,000 | | | TD Securities, Inc. | | | 10/25/24 | | | | (29,425 | ) |
IDR | | | 38,006,652,000 | | | USD | | | 2,514,000 | | | HSBC Bank PLC | | | 10/25/24 | | | | (6,325 | ) |
JPY | | | 375,672,138 | | | USD | | | 2,627,000 | | | Bank of America N.A. | | | 10/25/24 | | | | (3,410 | ) |
KRW | | | 1,313,131,800 | | | USD | | | 1,006,000 | | | Morgan Stanley & Co. International PLC | | | 10/25/24 | | | | (296 | ) |
MXN | | | 29,581,076 | | | USD | | | 1,505,000 | | | Goldman Sachs International | | | 10/25/24 | | | | (8,626 | ) |
MXN | | | 49,435,045 | | | USD | | | 2,521,000 | | | Goldman Sachs International | | | 10/25/24 | | | | (20,303 | ) |
MXN | | | 39,104,032 | | | USD | | | 2,014,000 | | | JPMorgan Chase Bank N.A. | | | 10/25/24 | | | | (35,903 | ) |
MXN | | | 29,116,033 | | | USD | | | 1,499,000 | | | State Street Bank and Trust Co. | | | 10/25/24 | | | | (26,151 | ) |
MXN | | | 124,411,883 | | | USD | | | 6,419,000 | | | UBS AG | | | 10/25/24 | | | | (125,562 | ) |
NOK | | | 9,944,152 | | | USD | | | 948,000 | | | State Street Bank and Trust Co. | | | 10/25/24 | | | | (5,426 | ) |
PLN | | | 2,890,576 | | | EUR | | | 675,000 | | | State Street Bank and Trust Co. | | | 10/25/24 | | | | (1,634 | ) |
PLN | | | 11,029,398 | | | USD | | | 2,873,000 | | | Barclays Bank PLC | | | 10/25/24 | | | | (9,074 | ) |
| | |
| 62 | | 2 0 2 4 B L A C K R O C K A N N U A L F I N A N C I A L S T A T E M E N T S A N D A D D I T I O N A L I N F O R M A T I O N |
| | |
Consolidated Schedule of Investments (continued) September 30, 2024 | | BlackRock Total Return Fund |
Forward Foreign Currency Exchange Contracts (continued)
| | | | | | | | | | | | | | | | | | | | |
| | | | | |
| Currency Purchased | | | Currency Sold | | | Counterparty | | Settlement
Date | | | Unrealized
Appreciation
(Depreciation) | |
PLN | | | 8,008,095 | | | USD | | | 2,102,000 | | | HSBC Bank PLC | | | 10/25/24 | | | $ | (22,595 | ) |
PLN | | | 8,061,590 | | | USD | | | 2,102,000 | | | UBS AG | | | 10/25/24 | | | | (8,704 | ) |
SGD | | | 1,286,341 | | | USD | | | 1,006,000 | | | Bank of America N.A. | | | 10/25/24 | | | | (3,799 | ) |
USD | | | 2,007,302 | | | AUD | | | 2,921,000 | | | Bank of America N.A. | | | 10/25/24 | | | | (12,974 | ) |
USD | | | 2,017,091 | | | AUD | | | 2,934,000 | | | Bank of America N.A. | | | 10/25/24 | | | | (12,177 | ) |
USD | | | 235,125 | | | AUD | | | 345,000 | | | NatWest Markets PLC | | | 10/25/24 | | | | (3,490 | ) |
USD | | | 500,000 | | | CHF | | | 422,413 | | | Morgan Stanley & Co. International PLC | | | 10/25/24 | | | | (619 | ) |
USD | | | 1,511,000 | | | CLP | | | 1,359,144,500 | | | Barclays Bank PLC | | | 10/25/24 | | | | (31 | ) |
USD | | | 1,008,000 | | | CLP | | | 909,478,080 | | | Goldman Sachs International | | | 10/25/24 | | | | (3,114 | ) |
USD | | | 1,561,000 | | | CNH | | | 11,007,532 | | | UBS AG | | | 10/25/24 | | | | (13,433 | ) |
USD | | | 3,235,500 | | | IDR | | | 49,176,202,725 | | | Citibank N.A. | | | 10/25/24 | | | | (9,141 | ) |
USD | | | 2,627,000 | | | JPY | | | 377,748,676 | | | JPMorgan Chase Bank N.A. | | | 10/25/24 | | | | (11,092 | ) |
USD | | | 3,519,000 | | | MXN | | | 69,579,428 | | | HSBC Bank PLC | | | 10/25/24 | | | | (711 | ) |
USD | | | 1,947,000 | | | SEK | | | 19,769,924 | | | Deutsche Bank AG | | | 10/25/24 | | | | (2,134 | ) |
USD | | | 4,002,000 | | | THB | | | 132,618,676 | | | Bank of America N.A. | | | 10/25/24 | | | | (126,871 | ) |
USD | | | 883,870 | | | TRY | | | 31,330,717 | | | Barclays Bank PLC | | | 10/25/24 | | | | (7,774 | ) |
USD | | | 875,000 | | | TWD | | | 27,748,875 | | | HSBC Bank PLC | | | 10/25/24 | | | | (3,854 | ) |
USD | | | 1,944,000 | | | ZAR | | | 34,081,529 | | | Deutsche Bank AG | | | 10/25/24 | | | | (24,273 | ) |
USD | | | 1,998,000 | | | ZAR | | | 35,048,057 | | | HSBC Bank PLC | | | 10/25/24 | | | | (26,092 | ) |
ZAR | | | 25,830,892 | | | USD | | | 1,508,000 | | | UBS AG | | | 10/25/24 | | | | (16,217 | ) |
USD | | | 2,769,500 | | | TRY | | | 97,751,441 | | | UBS AG | | | 10/28/24 | | | | (3,510 | ) |
USD | | | 886,813 | | | TRY | | | 31,300,683 | | | UBS AG | | | 10/28/24 | | | | (1,124 | ) |
BRL | | | 14,226,609 | | | USD | | | 2,613,000 | | | Bank of America N.A. | | | 11/04/24 | | | | (12,265 | ) |
BRL | | | 13,695,912 | | | USD | | | 2,521,000 | | | Goldman Sachs International | | | 11/04/24 | | | | (17,281 | ) |
USD | | | 2,811,150 | | | TRY | | | 111,434,000 | | | UBS AG | | | 12/04/24 | | | | (224,954 | ) |
USD | | | 1,635,272 | | | TRY | | | 64,302,000 | | | Barclays Bank PLC | | | 12/06/24 | | | | (113,035 | ) |
USD | | | 6,262,689 | | | PEN | | | 23,884,643 | | | Goldman Sachs International | | | 12/11/24 | | | | (175,693 | ) |
BRL | | | 166,963,978 | | | USD | | | 30,518,000 | | | Citibank N.A. | | | 12/18/24 | | | | (151,260 | ) |
GBP | | | 707,057 | | | USD | | | 946,653 | | | Australia & New Zealand Banking Group Ltd. | | | 12/18/24 | | | | (1,521 | ) |
JPY | | | 7,090,018,000 | | | USD | | | 50,271,594 | | | Morgan Stanley & Co. International PLC | | | 12/18/24 | | | | (405,381 | ) |
MXN | | | 807,150,824 | | | USD | | | 41,333,000 | | | Citibank N.A. | | | 12/18/24 | | | | (836,687 | ) |
USD | | | 184,627,872 | | | BRL | | | 1,055,092,900 | | | Barclays Bank PLC | | | 12/18/24 | | | | (7,268,202 | ) |
USD | | | 5,386,372 | | | CAD | | | 7,303,000 | | | TD Securities, Inc. | | | 12/18/24 | | | | (24,467 | ) |
USD | | | 407,487 | | | EUR | | | 365,000 | | | Commonwealth Bank of Australia | | | 12/18/24 | | | | (116 | ) |
USD | | | 192,658,072 | | | EUR | | | 174,125,700 | | | Deutsche Bank AG | | | 12/18/24 | | | | (1,791,499 | ) |
USD | | | 1,547,040 | | | EUR | | | 1,398,650 | | | Morgan Stanley & Co. International PLC | | | 12/18/24 | | | | (14,860 | ) |
USD | | | 1,678,969 | | | EUR | | | 1,517,924 | | | Morgan Stanley & Co. International PLC | | | 12/18/24 | | | | (16,127 | ) |
USD | | | 658,554 | | | EUR | | | 595,387 | | | Morgan Stanley & Co. International PLC | | | 12/18/24 | | | | (6,325 | ) |
USD | | | 1,858,231 | | | EUR | | | 1,665,000 | | | State Street Bank and Trust Co. | | | 12/18/24 | | | | (1,107 | ) |
USD | | | 111,023,550 | | | EUR | | | 99,441,000 | | | TD Securities, Inc. | | | 12/18/24 | | | | (24,158 | ) |
USD | | | 922,601 | | | GBP | | | 707,057 | | | Barclays Bank PLC | | | 12/18/24 | | | | (22,530 | ) |
USD | | | 799,230 | | | GBP | | | 606,000 | | | HSBC Bank PLC | | | 12/18/24 | | | | (10,818 | ) |
USD | | | 220,736 | | | GBP | | | 167,427 | | | HSBC Bank PLC | | | 12/18/24 | | | | (3,066 | ) |
USD | | | 124,162,976 | | | GBP | | | 95,054,000 | | | State Street Bank and Trust Co. | | | 12/18/24 | | | | (2,896,874 | ) |
USD | | | 6,862,820 | | | GBP | | | 5,224,000 | | | State Street Bank and Trust Co. | | | 12/18/24 | | | | (120,165 | ) |
USD | | | 79,002 | | | HKD | | | 614,000 | | | Bank of America N.A. | | | 12/18/24 | | | | (63 | ) |
USD | | | 717,011 | | | HKD | | | 5,570,000 | | | UBS AG | | | 12/18/24 | | | | (241 | ) |
USD | | | 13,253,812 | | | MXN | | | 265,075,700 | | | State Street Bank and Trust Co. | | | 12/18/24 | | | | (45,547 | ) |
USD | | | 9,976,996 | | | ZAR | | | 176,378,673 | | | Deutsche Bank AG | | | 12/20/24 | | | | (162,023 | ) |
USD | | | 4,686,000 | | | CNH | | | 32,834,802 | | | Morgan Stanley & Co. International PLC | | | 01/27/25 | | | | (42,505 | ) |
COP | | | 13,056,821,000 | | | USD | | | 3,282,258 | | | Citibank N.A. | | | 02/21/25 | | | | (235,442 | ) |
COP | | | 18,912,329,000 | | | USD | | | 4,559,385 | | | HSBC Bank PLC | | | 02/24/25 | | | | (147,992 | ) |
| | | | | | | | | | | | | | | | | | | | |
| | | | | | | | | | | | | | | | | | $ | (16,248,932 | ) |
| | | | | | | | | | | | | | | | | | | | |
| | | | | | | | | | | | | | | | | | $ | (10,392,639 | ) |
| | | | | | | | | | | | | | | | | | | | |
| | |
C O N S O L I D A T E D S C H E D U L E S O F I N V E S T M E N T S | | 63 |
| | |
Consolidated Schedule of Investments (continued) September 30, 2024 | | BlackRock Total Return Fund |
Exchange-Traded Options Purchased
| | | | | | | | | | | | | | | | | | | | | | | | |
| | | | | | | |
| Description | | Number of
Contracts | | | Expiration
Date | | | Exercise Price | | | | | Notional
Amount
(000) | | | Value | |
Call | | | | | | | | | | | | | | | | | | | | | | | | |
CME 3-Month SOFR Futures | | | 10,033 | | | | 11/15/24 | | | USD | | | 95.25 | | | USD | | | 2,406,917 | | | $ | 17,808,575 | |
CME 3-Month SOFR Futures | | | 10,033 | | | | 11/15/24 | | | USD | | | 95.75 | | | USD | | | 2,406,917 | | | | 6,019,800 | |
| | | | | | | | | | | | | | | | | | | | | | | | |
| | | | | | | | | | | | | | | | | | | | | | $ | 23,828,375 | |
| | | | | | | | | | | | | | | | | | | | | | | | |
Put | | | | | | | | | | | | | | | | | | | | | | | | |
1 Year Mid-Curve Options on 3-Month SOFR Futures | | | 33,086 | | | | 10/11/24 | | | USD | | | 96.94 | | | USD | | | 8,023,769 | | | | 7,237,562 | |
| | | | | | | | | | | | | | | | | | | | | | | | |
| | | | | | | | | | | | | | | | | | | | | | $ | 31,065,937 | |
| | | | | | | | | | | | | | | | | | | | | | | | |
OTC Barrier Options Purchased
| | | | | | | | | | | | | | | | | | | | | | | | | | | | | | |
| | | | | | | | | | | |
| Description | | Type of Option | | Counterparty | | Expiration
Date | | | | | Exercise
Price | | | | | Barrier
Price/Range | | | | | Notional
Amount
(000) | | | Value | |
Call | | | | | | | | | | | | | | | | | | | | | | | | | | | | | | |
USD Currency | | One-Touch | | HSBC Bank PLC | | | 10/23/24 | | | CNH | | | 7.50 | | | CNH | | | 7.50 | | | USD | | | 719 | | | $ | 846 | |
USD Currency | | One-Touch | | HSBC Bank PLC | | | 11/27/24 | | | SGD | | | 1.32 | | | SGD | | | 1.32 | | | USD | | | 504 | | | | 40,198 | |
USD Currency | | One-Touch | | HSBC Bank PLC | | | 12/09/24 | | | CNH | | | 7.65 | | | CNH | | | 7.65 | | | USD | | | 332 | | | | 2,108 | |
USD Currency | | One-Touch | | Citibank N.A. | | | 01/17/25 | | | CNH | | | 7.35 | | | CNH | | | 7.35 | | | USD | | | 5,989 | | | | 227,717 | |
CNH Currency | | One-Touch | | JPMorgan Chase Bank N.A. | | | 01/23/25 | | | INR | | | 12.50 | | | INR | | | 12.50 | | | CNH | | | 1,739 | | | | 42,261 | |
USD Currency | | One-Touch | | Citibank N.A. | | | 01/31/25 | | | CNH | | | 7.35 | | | CNH | | | 7.35 | | | USD | | | 5,989 | | | | 242,997 | |
| | | | | | | | | | | | | | | | | | | | | | | | | | | | | | |
| | | | | | | | | | | | | | | | | | | | | | | | | | | | | 556,127 | |
| | | | | | | | | | | | | | | | | | | | | | | | | | | | | | |
Put | | | | | | | | | | | | | | | | | | | | | | | | | | | | | | |
USD Currency | | One-Touch | | Barclays Bank PLC | | | 10/18/24 | | | CNH | | | 7.30 | | | CNH | | | 7.30 | | | USD | | | 249 | | | | 4,104 | |
USD Currency | | One-Touch | | HSBC Bank PLC | | | 10/18/24 | | | PLN | | | 4.25 | | | PLN | | | 4.25 | | | USD | | | 242 | | | | 1,302 | |
USD Currency | | One-Touch | | Morgan Stanley & Co. International PLC | | | 10/18/24 | | | CNH | | | 7.35 | | | CNH | | | 7.35 | | | USD | | | 487 | | | | 4,989 | |
USD Currency | | Down-and-Out | | UBS AG | | | 10/30/24 | | | TRY | | | 35.50 | | | TRY | | | 34.00 | | | USD | | | 2,420 | | | | 35,252 | |
EUR Currency | | One-Touch | | HSBC Bank PLC | | | 11/04/24 | | | USD | | | 1.06 | | | USD | | | 1.06 | | | EUR | | | 440 | | | | 5,365 | |
USD Currency | | One-Touch | | Bank of America N.A. | | | 11/06/24 | | | CNH | | | 7.50 | | | CNH | | | 7.50 | | | USD | | | 731 | | | | 4,109 | |
EUR Currency | | One-Touch | | Bank of America N.A. | | | 11/12/24 | | | USD | | | 1.05 | | | USD | | | 1.05 | | | EUR | | | 219 | | | | 2,391 | |
EUR Currency | | One-Touch | | Bank of America N.A. | | | 11/19/24 | | | USD | | | 1.05 | | | USD | | | 1.05 | | | EUR | | | 219 | | | | 3,738 | |
USD Currency | | One-Touch | | UBS AG | | | 11/21/24 | | | TRY | | | 35.00 | | | TRY | | | 35.00 | | | USD | | | 242 | | | | 61,973 | |
EUR Currency | | One-Touch | | Barclays Bank PLC | | | 12/09/24 | | | USD | | | 1.04 | | | USD | | | 1.04 | | | EUR | | | 332 | | | | 6,234 | |
USD Currency | | One-Touch | | UBS AG | | | 12/12/24 | | | TRY | | | 35.25 | | | TRY | | | 35.25 | | | USD | | | 199 | | | | 37,009 | |
USD Currency | | One-Touch | | Bank of America N.A. | | | 12/17/24 | | | TRY | | | 29.25 | | | TRY | | | 29.25 | | | USD | | | 3,028 | | | | 33 | |
CNH Currency | | One-Touch | | Standard Chartered Bank | | | 01/23/25 | | | INR | | | 11.50 | | | INR | | | 11.50 | | | CNH | | | 3,478 | | | | 25,879 | |
| | | | | | | | | | | | | | | | | | | | | | | | | | | | | | |
| | | | | | | | | | | | | | | | | | | | | | | | | | | | | 192,378 | |
| | | | | | | | | | | | | | | | | | | | | | | | | | | | | | |
| | | | | | | | | | | | | | | | | | | | | | | | | | | | $ | 748,505 | |
| | | | | | | | | | | | | | | | | | | | | | | | | | | | | | |
OTC Options Purchased
| | | | | | | | | | | | | | | | | | | | | | |
| | | | | | | | |
| Description | | Counterparty | | Expiration
Date | | | | | Exercise
Price | | | | | Notional
Amount
(000) | | | Value | |
Call | | | | | | | | | | | | | | | | | | | | | | |
USD Currency | | Morgan Stanley & Co. International PLC | | | 10/09/24 | | | MXN | | | 18.30 | | | USD | | | 2,843 | | | $ | 203,564 | |
USD Currency | | Morgan Stanley & Co. International PLC | | | 10/18/24 | | | MXN | | | 18.30 | | | USD | | | 4,763 | | | | 348,728 | |
USD Currency | | Bank of America N.A. | | | 10/22/24 | | | CAD | | | 1.37 | | | USD | | | 2,627 | | | | 3,707 | |
USD Currency | | Standard Chartered Bank | | | 10/29/24 | | | CNH | | | 7.05 | | | USD | | | 3,025 | | | | 12,799 | |
USD Currency | | Deutsche Bank AG | | | 11/12/24 | | | BRL | | | 5.75 | | | USD | | | 2,861 | | | | 16,740 | |
USD Currency | | Morgan Stanley & Co. International PLC | | | 11/12/24 | | | ZAR | | | 19.00 | | | USD | | | 3,802 | | | | 4,581 | |
USD Currency | | Morgan Stanley & Co. International PLC | | | 11/12/24 | | | COP | | | 4,200.00 | | | USD | | | 4,291 | | | | 95,869 | |
USD Currency | | Bank of America N.A. | | | 03/06/26 | | | CNH | | | 7.75 | | | USD | | | 545,229 | | | | 2,578,961 | |
| | | | | | | | | | | | | | | | | | | | | | |
| | | | | | | | | | | | | | | | | | | | | 3,264,949 | |
| | | | | | | | | | | | | | | | | | | | | | |
Put | | | | | | | | | | | | | | | | | | | | | | |
USD Currency | | Morgan Stanley & Co. International PLC | | | 10/11/24 | | | BRL | | | 5.56 | | | USD | | | 2,509 | | | | 56,837 | |
| | |
| 64 | | 2 0 2 4 B L A C K R O C K A N N U A L F I N A N C I A L S T A T E M E N T S A N D A D D I T I O N A L I N F O R M A T I O N |
| | |
Consolidated Schedule of Investments (continued) September 30, 2024 | | BlackRock Total Return Fund |
OTC Options Purchased (continued)
| | | | | | | | | | | | | | | | | | | | | | | | | | |
| | | | | | | | |
| Description | | Counterparty | | Expiration
Date | | | | | | Exercise
Price | | | | | | Notional
Amount
(000) | | | Value | |
EUR Currency | | JPMorgan Chase Bank N.A. | | | 11/12/24 | | | | USD | | | | 1.06 | | | | EUR | | | | 2,193 | | | $ | 705 | |
EUR Currency | | JPMorgan Chase Bank N.A. | | | 11/19/24 | | | | USD | | | | 1.06 | | | | EUR | | | | 2,193 | | | | 1,135 | |
USD Currency | | Goldman Sachs International | | | 12/06/24 | | | | TRY | | | | 42.50 | | | | USD | | | | 1,949 | | | | 310,383 | |
| | | | | | | | | | | | | | | | | | | | | | | | | | |
| | | | | | | | | | | | | | | | | | | | | | | | | 369,060 | |
| | | | | | | | | | | | | | | | | | | | | | | | | | |
| | | | | | | | | | | | | | | | | | | | | | | | $ | 3,634,009 | |
| | | | | | | | | | | | | | | | | | | | | | | | | | |
OTC Interest Rate Swaptions Purchased
| | | | | | | | | | | | | | | | | | | | | | | | | | | | | | | | | | | | | | | | | | | | |
| | | | | | | | | | |
Description | | | | | | | | | | | Counterparty | | | Expiration Date | | | Exercise Rate | | | | | | Notional Amount (000) | | | Value | |
| | Paid by the Fund | | | | | | Received by the Fund | |
| | Rate | | | Frequency | | | | | | Rate | | | Frequency | |
Put | | | | | | | | | | | | | | | | | | | | | | | | | | | | | | | | | | | | | | | | | | | | |
10-Year Interest Rate Swap, 10/09/34 | | | 3.38 | % | | | Annual | | | | | | | | 1-day SOFR, 4.96 | % | | | Annual | | | | Bank of America N.A. | | | | 10/07/24 | | | | 3.38 | % | | | USD | | | | 11,869 | | | $ | 22,693 | |
10-Year Interest Rate Swap, 10/09/34 | | | 3.38 | % | | | Annual | | | | | | | | 1-day SOFR, 4.96 | % | | | Annual | | | | Bank of America N.A. | | | | 10/07/24 | | | | 3.38 | % | | | USD | | | | 5,935 | | | | 11,346 | |
10-Year Interest Rate Swap, 10/19/34 | | | 4.43 | % | | | Annual | | | | | | | | 1-day SOFR, 4.96 | % | | | Annual | | | | Goldman Sachs International | | | | 10/17/24 | | | | 4.43 | % | | | USD | | | | 233,997 | | | | 8 | |
10-Year Interest Rate Swap, 10/19/34 | | | 4.43 | % | | | Annual | | | | | | | | 1-day SOFR, 4.96 | % | | | Annual | | | | Goldman Sachs International | | | | 10/17/24 | | | | 4.43 | % | | | USD | | | | 116,999 | | | | 3 | |
10-Year Interest Rate Swap, 10/27/34 | | | 4.00 | % | | | Annual | | | | | | | | 1-day SOFR, 4.96 | % | | | Annual | | | | Bank of America N.A. | | | | 10/25/24 | | | | 4.00 | % | | | USD | | | | 4,059 | | | | 148 | |
30-Year Interest Rate Swap, 12/20/54 | | | 3.93 | % | | | Annual | | | | | | | | 1-day SOFR, 4.96 | % | | | Annual | | | | Citibank N.A. | | | | 12/18/24 | | | | 3.93 | % | | | USD | | | | 101,128 | | | | 338,606 | |
1-Year Interest Rate Swap, 01/30/26 | | | 4.10 | % | | | Annual | | | | | | | | 1-day SOFR, 4.96 | % | | | Annual | | | | JPMorgan Chase Bank N.A. | | | | 01/28/25 | | | | 4.10 | % | | | USD | | | | 90,991 | | | | 27,632 | |
| | | | | | | | | | | | | | | | | | | | | | | | | | | | | | | | | | | | | | | | | | | | |
| | | | | | | | | | | | | | | | | | | | | | | | | | | | | | | | | | | | | | | | | | | 400,436 | |
| | | | | | | | | | | | | | | | | | | | | | | | | | | | | | | | | | | | | | | | | | | | |
Exchange-Traded Options Written
| | | | | | | | | | | | | | | | | | | | | | | | | | | | |
| | | | | | | |
| Description | | Number of
Contracts | | | Expiration
Date | | | Exercise Price | | | | | | Notional
Amount
(000) | | | Value | |
Call | | | | | | | | | | | | | | | | | | | | | | | | | | | | |
CME 3-Month SOFR Futures | | | 20,066 | | | | 11/15/24 | | | | USD | | | | 95.50 | | | | USD | | | | 4,813,833 | | | $ | (23,326,725 | ) |
| | | | | | | | | | | | | | | | | | | | | | | | | | | | |
Put | | | | | | | | | | | | | | | | | | | | | | | | | | | | |
1 Year Mid-Curve Options on 3-Month SOFR Futures | | | 30,095 | | | | 10/11/24 | | | | USD | | | | 96.56 | | | | USD | | | | 7,298,414 | | | | (564,281 | ) |
| | | | | | | | | | | | | | | | | | | | | | | | | | | | |
| | | | | | | | | | | | | | | | | | | | | | | | | | $ | (23,891,006 | ) |
| | | | | | | | | | | | | | | | | | | | | | | | | | | | |
OTC Barrier Options Written
| | | | | | | | | | | | | | | | | | | | | | | | | | | | | | | | | | | | | | | | |
| | | | | | | | | | | |
| Description | | Type of
Option | | | Counterparty | | | Expiration
Date | | | | | | Exercise
Price | | | | | | Barrier
Price/Range | | | | | | Notional
Amount
(000) | | | Value | |
Call | | | | | | | | | | | | | | | | | | | | | | | | | | | | | | | | | | | | | | | | |
CNH Currency | | | One-Touch | | | | Standard Chartered Bank | | | | 1/23/25 | | | | INR | | | | 12.50 | | | | INR | | | | 12.50 | | | | CNH | | | | 1,739 | | | $ | (42,261 | ) |
Put | | | | | | | | | | | | | | | | | | | | | | | | | | | | | | | | | | | | | | | | |
CNH Currency | | | One-Touch | | |
| JPMorgan Chase Bank
N.A. |
| | | 1/23/25 | | | | INR | | | | 11.50 | | | | INR | | | | 11.50 | | | | CNH | | | | 1,217 | | | | (9,057 | ) |
| | | | | | | | | | | | | | | | | | | | | | | | | | | | | | | | | | | | | | | | |
| | | | | | | | | | | | | | | | | | | | | | | | | | | | | | | | | | | | | | $ | (51,318 | ) |
| | | | | | | | | | | | | | | | | | | | | | | | | | | | | | | | | | | | | | | | |
OTC Options Written
| | | | | | | | | | | | | | | | | | | | | | | | | | | | |
| | | | | | | | |
| Description | | Counterparty | | | Expiration
Date | | | | | | Exercise
Price | | | | | | Notional
Amount
(000) | | | Value | |
Call | | | | | | | | | | | | | | | | | | | | | | | | | | | | |
USD Currency | | | HSBC Bank PLC | | | | 10/04/24 | | | | BRL | | | | 5.95 | | | | USD | | | | 1,462 | | | $ | (1 | ) |
USD Currency | | | Morgan Stanley & Co. International PLC | | | | 10/09/24 | | | | MXN | | | | 19.10 | | | | USD | | | | 4,265 | | | | (137,717 | ) |
USD Currency | | | Bank of America N.A. | | | | 10/17/24 | | | | KRW | | | | 1,380.00 | | | | USD | | | | 1,452 | | | | (335 | ) |
| | |
C O N S O L I D A T E D S C H E D U L E S O F I N V E S T M E N T S | | 65 |
| | |
Consolidated Schedule of Investments (continued) September 30, 2024 | | BlackRock Total Return Fund |
OTC Options Written (continued)
| | | | | | | | | | | | | | | | | | | | | | | | | | | | |
| | | | | | | | |
| Description | | Counterparty | | | Expiration
Date | | | | | | Exercise Price | | | | | | Notional
Amount
(000) | | | Value | |
USD Currency | | | Deutsche Bank AG | | | | 11/12/24 | | | | BRL | | | | 6.00 | | | | USD | | | | 1,430 | | | $ | (2,876 | ) |
USD Currency | | | Morgan Stanley & Co. International PLC | | | | 11/12/24 | | | | ZAR | | | | 20.00 | | | | USD | | | | 1,901 | | | | (555 | ) |
USD Currency | | | Morgan Stanley & Co. International PLC | | | | 11/12/24 | | | | COP | | | | 4,500.00 | | | | USD | | | | 2,384 | | | | (10,246 | ) |
USD Currency | | | Bank of America N.A. | | | | 11/22/24 | | | | CAD | | | | 1.40 | | | | USD | | | | 2,627 | | | | (1,303 | ) |
USD Currency | | | Bank of America N.A. | | | | 12/30/24 | | | | ZAR | | | | 17.60 | | | | USD | | | | 1,508 | | | | (32,467 | ) |
| | | | | | | | | | | | | | | | | | | | | | | | | | | | |
| | | | | | | | | | | | | | | | | | | | | | | | | | | (185,500 | ) |
| | | | | | | | | | | | | | | | | | | | | | | | | | | | |
Put | | | | | | | | | | | | | | | | | | | | | | | | | | | | |
USD Currency | | | Morgan Stanley & Co. International PLC | | | | 10/18/24 | | | | MXN | | | | 17.00 | | | | USD | | | | 2,382 | | | | (8 | ) |
USD Currency | | | Goldman Sachs International | | | | 12/06/24 | | | | TRY | | | | 40.50 | | | | USD | | | | 2,923 | | | | (314,566 | ) |
| | | | | | | | | | | | | | | | | | | | | | | | | | | | |
| | | | | | | | | | | | | | | | | | | | | | | | | | | (314,574 | ) |
| | | | | | | | | | | | | | | | | | | | | | | | | | | | |
| | | | | | | | | | | | | | | | | | | | | | | | | | $ | (500,074 | ) |
| | | | | | | | | | | | | | | | | | | | | | | | | | | | |
OTC Interest Rate Swaptions Written
| | | | | | | | | | | | | | | | | | | | | | | | | | | | | | | | | | | | | | | | | | | | |
| | | | | | | | | | | | |
Description | | | | | | | | | | | | | | | | | Counterparty | | | Expiration Date | | | Exercise Rate | | | | | | Notional Amount (000) | | | Value | |
| | Paid by the Fund | | | | | | Received by the Fund | |
| | Rate | | | Frequency | | | | | | Rate | | | Frequency | |
Call | | | | | | | | | | | | | | | | | | | | | | | | | | | | | | | | | | | | | | | | | | | | |
10-Year Interest Rate Swap, 03/30/35 | | | 2.76% | | | | Annual | | | | | | |
| 1-day SOFR,
4.96% |
| | | Annual | | | | JPMorgan Chase Bank N.A. | | | | 03/28/25 | | | | 2.76 | % | | | USD | | | | 121,744 | | | $ | (931,725 | ) |
10-Year Interest Rate Swap, 04/04/35 | | | 2.76% | | | | Annual | | | | | | |
| 1-day SOFR,
4.96% |
| | | Annual | | | | JPMorgan Chase Bank N.A. | | | | 04/02/25 | | | | 2.76 | % | | | USD | | | | 122,499 | | | | (963,214 | ) |
10-Year Interest Rate Swap, 05/13/36 | | | 3.98% | | | | Annual | | | | | | |
| 1-day SOFR,
4.96% |
| | | Annual | | | | Bank of America N.A. | | | | 05/11/26 | | | | 3.98 | % | | | USD | | | | 18,269 | | | | (1,364,324 | ) |
10-Year Interest Rate Swap, 08/23/36 | | | 3.29% | | | | Annual | | | | | | |
| 1-day SOFR,
4.96% |
| | | Annual | | | | Deutsche Bank AG | | | | 08/21/26 | | | | 3.29 | % | | | USD | | | | 16,157 | | | | (640,009 | ) |
10-Year Interest Rate Swap, 08/26/36 | | | 3.32% | | | | Annual | | | | | | |
| 1-day SOFR,
4.96% |
| | | Annual | | | | Bank of America N.A. | | | | 08/24/26 | | | | 3.32 | % | | | USD | | | | 16,128 | | | | (660,452 | ) |
10-Year Interest Rate Swap, 09/02/36 | | | 3.38% | | | | Annual | | | | | | |
| 1-day SOFR,
4.96% |
| | | Annual | | | | Bank of America N.A. | | | | 08/31/26 | | | | 3.38 | % | | | USD | | | | 14,330 | | | | (627,636 | ) |
10-Year Interest Rate Swap, 09/11/36 | | | 3.22% | | | | Annual | | | | | | |
| 1-day SOFR,
4.96% |
| | | Annual | | | | Citibank N.A. | | | | 09/09/26 | | | | 3.22 | % | | | USD | | | | 36,640 | | | | (1,351,533 | ) |
10-Year Interest Rate Swap, 09/12/36 | | | 3.17% | | | | Annual | | | | | | |
| 1-day SOFR,
4.96% |
| | | Annual | | | | Bank of America N.A. | | | | 09/10/26 | | | | 3.17 | % | | | USD | | | | 73,240 | | | | (2,578,707 | ) |
| | |
| 66 | | 2 0 2 4 B L A C K R O C K A N N U A L F I N A N C I A L S T A T E M E N T S A N D A D D I T I O N A L I N F O R M A T I O N |
| | |
Consolidated Schedule of Investments (continued) September 30, 2024 | | BlackRock Total Return Fund |
OTC Interest Rate Swaptions Written (continued)
| | | | | | | | | | | | | | | | | | | | | | | | | | | | | | | | | | | | | | | | | | |
| | | | | | | | | | | | |
Description | | | | | | | | | | | | | | | | Counterparty | | | Expiration Date | | | Exercise Rate | | | | | | Notional Amount (000) | | | Value | |
| | Paid by the Fund | | | | | | Received by the Fund | |
| | Rate | | | Frequency | | | | | | Rate | | Frequency | |
10-Year Interest Rate Swap, 09/13/36 | | | 3.19% | | | | Annual | | | | | | | 1-day SOFR,
4.96% | | | Annual | | | | Bank of America N.A. | | | | 09/11/26 | | | | 3.19 | % | | | USD | | | | 32,647 | | | $ | (1,172,556 | ) |
10-Year Interest Rate Swap, 09/23/36 | | | 3.28% | | | | Annual | | | | | | | 1-day SOFR,
4.96% | | | Annual | | | | Barclays Bank PLC | | | | 09/21/26 | | | | 3.28 | % | | | USD | | | | 41,447 | | | | (1,650,951 | ) |
10-Year Interest Rate Swap, 09/30/36 | | | 3.34% | | | | Annual | | | | | | | 1-day SOFR,
4.96% | | | Annual | | | | Bank of America N.A. | | | | 09/28/26 | | | | 3.34 | % | | | USD | | | | 28,427 | | | | (1,206,811 | ) |
| | | | | | | | | | | | | | | | | | | | | | | | | | | | | | | | | | | | | | | | | | |
| | | | | | | | | | | | | | | | | | | | | | | | | | | | | | | | | | | | | | | | | (13,147,918 | ) |
| | | | | | | | | | | | | | | | | | | | | | | | | | | | | | | | | | | | | | | | | | |
Put | | | | | | | | | | | | | | | | | | | | | | | | | | | | | | | | | | | | | | | | | | |
10-Year Interest Rate Swap, 10/09/34 | |
| 1-day SOFR,
4.96% |
| | | Annual | | | | | | | 3.55% | | | Annual | | | | Bank of America N.A. | | | | 10/07/24 | | | | 3.55 | % | | | USD | | | | 11,869 | | | $ | (1,437 | ) |
10-Year Interest Rate Swap, 10/09/34 | |
| 1-day SOFR,
4.96% |
| | | Annual | | | | | | | 3.55% | | | Annual | | | | Bank of America N.A. | | | | 10/07/24 | | | | 3.55 | % | | | USD | | | | 5,935 | | | | (718 | ) |
1-Year Interest Rate Swap, 10/19/25 | |
| 1-day SOFR,
4.96% |
| | | Annual | | | | | | | 5.10% | | | Annual | | | | Goldman Sachs International | | | | 10/17/24 | | | | 5.10 | % | | | USD | | | | 1,965,577 | | | | — | |
1-Year Interest Rate Swap, 10/19/25 | |
| 1-day SOFR,
4.96% |
| | | Annual | | | | | | | 5.10% | | | Annual | | | | Goldman Sachs International | | | | 10/17/24 | | | | 5.10 | % | | | USD | | | | 982,789 | | | | — | |
3-Year Interest Rate Swap, 10/27/27 | |
| 1-day SOFR,
4.96% |
| | | Annual | | | | | | | 4.00% | | | Annual | | | | Bank of America N.A. | | | | 10/25/24 | | | | 4.00 | % | | | USD | | | | 11,887 | | | | (114 | ) |
1-Year Interest Rate Swap, 01/30/26 | |
| 1-day SOFR,
4.96% |
| | | Annual | | | | | | | 4.30% | | | Annual | | | | JPMorgan Chase Bank N.A. | | | | 01/28/25 | | | | 4.30 | % | | | USD | | | | 90,991 | | | | (13,650 | ) |
1-Year Interest Rate Swap, 01/30/26 | |
| 1-day SOFR,
4.96% |
| | | Annual | | | | | | | 4.55% | | | Annual | | | | JPMorgan Chase Bank N.A. | | | | 01/28/25 | | | | 4.55 | % | | | USD | | | | 90,991 | | | | (5,538 | ) |
10-Year Interest Rate Swap, 03/30/35 | |
| 1-day SOFR,
4.96% |
| | | Annual | | | | | | | 3.76% | | | Annual | | | | JPMorgan Chase Bank N.A. | | | | 03/28/25 | | | | 3.76 | % | | | USD | | | | 121,744 | | | | (1,055,115 | ) |
| | |
C O N S O L I D A T E D S C H E D U L E S O F I N V E S T M E N T S | | 67 |
| | |
Consolidated Schedule of Investments (continued) September 30, 2024 | | BlackRock Total Return Fund |
OTC Interest Rate Swaptions Written (continued)
| | | | | | | | | | | | | | | | | | | | | | | | | | | | | | | | |
| | | | | | | | | | | | |
Description | | | | | | | | | | | | Counterparty | | Expiration Date | | | Exercise Rate | | | | | | Notional Amount (000) | | | Value | |
| | Paid by the Fund | | | | Received by the Fund |
| | Rate | | Frequency | | | | Rate | | Frequency |
10-Year Interest Rate Swap, 04/04/35 | | 1-day SOFR,
4.96% | | Annual | | | | 3.76% | | Annual | | JPMorgan Chase Bank N.A. | | | 04/02/25 | | | | 3.76 | % | | | USD | | | | 122,499 | | | $ | (1,090,146 | ) |
10-Year Interest Rate Swap, 05/13/36 | | 1-day SOFR,
4.96% | | Annual | | | | 3.98% | | Annual | | Bank of America N.A. | | | 05/11/26 | | | | 3.98 | % | | | USD | | | | 18,269 | | | | (383,969 | ) |
10-Year Interest Rate Swap, 08/23/36 | | 1-day SOFR,
4.96% | | Annual | | | | 3.29% | | Annual | | Deutsche Bank AG | | | 08/21/26 | | | | 3.29 | % | | | USD | | | | 16,157 | | | | (693,265 | ) |
10-Year Interest Rate Swap, 08/26/36 | | 1-day SOFR,
4.96% | | Annual | | | | 3.32% | | Annual | | Bank of America N.A. | | | 08/24/26 | | | | 3.32 | % | | | USD | | | | 16,128 | | | | (675,161 | ) |
10-Year Interest Rate Swap, 09/02/36 | | 1-day SOFR,
4.96% | | Annual | | | | 3.38% | | Annual | | Bank of America N.A. | | | 08/31/26 | | | | 3.38 | % | | | USD | | | | 14,330 | | | | (570,003 | ) |
10-Year Interest Rate Swap, 09/11/36 | | 1-day SOFR,
4.96% | | Annual | | | | 3.22% | | Annual | | Citibank N.A. | | | 09/09/26 | | | | 3.22 | % | | | USD | | | | 36,640 | | | | (1,700,387 | ) |
10-Year Interest Rate Swap, 09/12/36 | | 1-day SOFR,
4.96% | | Annual | | | | 3.17% | | Annual | | Bank of America N.A. | | | 09/10/26 | | | | 3.17 | % | | | USD | | | | 73,240 | | | | (3,531,010 | ) |
10-Year Interest Rate Swap, 09/13/36 | | 1-day SOFR,
4.96% | | Annual | | | | 3.19% | | Annual | | Bank of America N.A. | | | 09/11/26 | | | | 3.19 | % | | | USD | | | | 32,647 | | | | (1,550,265 | ) |
10-Year Interest Rate Swap, 09/23/36 | | 1-day SOFR,
4.96% | | Annual | | | | 3.28% | | Annual | | Barclays Bank PLC | | | 09/21/26 | | | | 3.28 | % | | | USD | | | | 41,447 | | | | (1,827,437 | ) |
10-Year Interest Rate Swap, 09/30/36 | | 1-day SOFR,
4.96% | | Annual | | | | 3.34% | | Annual | | Bank of America N.A. | | | 09/28/26 | | | | 3.34 | % | | | USD | | | | 28,427 | | | | (1,195,776 | ) |
| | | | | | | | | | | | | | | | | | | | | | | | | | | | | | | | |
| | | | | | | | | | | | | | | | | | | | | | | | | | | | | | | (14,293,991 | ) |
| | | | | | | | | | | | | | | | | | | | | | | | | | | | | | | | |
| | | | | | | | | | | | | | | | | | | | | | | | | | | | | | $ | (27,441,909 | ) |
| | | | | | | | | | | | | | | | | | | | | | | | | | | | | | | | |
| | |
| 68 | | 2 0 2 4 B L A C K R O C K A N N U A L F I N A N C I A L S T A T E M E N T S A N D A D D I T I O N A L I N F O R M A T I O N |
| | |
Consolidated Schedule of Investments (continued) September 30, 2024 | | BlackRock Total Return Fund |
Centrally Cleared Credit Default Swaps — Buy Protection
| | | | | | | | | | | | | | | | | | | | | | | | | | | | | | | | |
| | | | | | | | | |
| Reference Obligation/Index | | Financing
Rate
Paid by
the Fund | | | Payment
Frequency | | | Termination
Date | | | | | | Notional
Amount
(000) | | | Value | | | Upfront
Premium
Paid
(Received) | | | Unrealized
Appreciation
(Depreciation) | |
CDX.NA.HY.43.V1 | | | 5.00 | % | | | Quarterly | | | | 06/20/29 | | | | USD | | | | 6,385 | | | $ | (504,810 | ) | | $ | (495,426 | ) | | $ | (9,384 | ) |
ITRAXX.EUR.42.V1 | | | 1.00 | | | | Quarterly | | | | 12/20/29 | | | | EUR | | | | 17,284 | | | | (392,022 | ) | | | (392,124 | ) | | | 102 | |
ITRAXX.FINSR.42.V1 | | | 1.00 | | | | Quarterly | | | | 12/20/29 | | | | EUR | | | | 54,428 | | | | (986,573 | ) | | | (1,014,023 | ) | | | 27,450 | |
ITRAXX.XO.42.V1 | | | 5.00 | | | | Quarterly | | | | 12/20/29 | | | | EUR | | | | 6,582 | | | | (617,408 | ) | | | (603,292 | ) | | | (14,116 | ) |
| | | | | | | | | | | | | | | | | | | | | | | | | | | | | | | | |
| | | | | | | | | | | | | | | | | | | | | | $ | (2,500,813 | ) | | $ | (2,504,865 | ) | | $ | 4,052 | |
| | | | | | | | | | | | | | | | | | | | | | | | | | | | | | | | |
Centrally Cleared Credit Default Swaps — Sell Protection
| | | | | | | | | | | | | | | | | | | | | | | | | | | | | | | | | | | | |
| | | | | | | | | | |
| Reference Obligation/Index | | Financing
Rate
Received
by the
Fund | | | Payment
Frequency | | | Termination
Date | | | Credit
Rating(a)
| | | | | | Notional
Amount
(000)(b) | | | Value | | | Upfront
Premium
Paid
(Received) | | | Unrealized
Appreciation
(Depreciation) | |
CDX.NA.HY.43.V1 | | | 5.00 | % | | | Quarterly | | | | 12/20/29 | | | | B+ | | | | USD | | | | 371,050 | | | $ | 27,642,999 | | | $ | 27,164,114 | | | $ | 478,885 | |
| | | | | | | | | | | | | | | | | | | | | | | | | | | | | | | | | | | | |
| | (a) | Using the rating of the issuer or the underlying securities of the index, as applicable, provided by S&P Global Ratings. | |
| | (b) | The maximum potential amount the Fund may pay should a negative credit event take place as defined under the terms of the agreement. | |
Centrally Cleared Inflation Swaps
| | | | | | | | | | | | | | | | | | | | | | | | | | | | | | | | | | | | | | | | |
| | | | | | | | | | | |
| | | | | | | | | | | | | | | Termination Date | | | | | | Notional Amount (000) | | | Value | | | Upfront Premium Paid (Received) | | | Unrealized Appreciation (Depreciation) | |
| Paid by the Fund | | | | | | Received by the Fund | |
| Reference | | Frequency | | | | | | Rate | | | Frequency | |
2.56% | | | At Termination | | | | | | |
| U.S. CPI Urban Consumers
NAS (CPURNSA) |
| | | At Termination | | | | 06/07/34 | | | | USD | | | | 1,666 | | | $ | (28,568 | ) | | $ | (161 | ) | | $ | (28,407 | ) |
2.30% | | | At Termination | | | | | | |
| U.S. CPI Urban Consumers
NAS (CPURNSA) |
| | | At Termination | | | | 09/10/54 | | | | USD | | | | 11,135 | | | | 154,509 | | | | — | | | | 154,509 | |
2.31% | | | At Termination | | | | | | |
| U.S. CPI Urban Consumers
NAS (CPURNSA) |
| | | At Termination | | | | 09/10/54 | | | | USD | | | | 11,134 | | | | 144,731 | | | | — | | | | 144,731 | |
2.28% | | | At Termination | | | | | | |
| U.S. CPI Urban Consumers
NAS (CPURNSA) |
| | | At Termination | | | | 09/11/54 | | | | USD | | | | 11,135 | | | | 201,962 | | | | — | | | | 201,962 | |
2.29% | | | At Termination | | | | | | |
| U.S. CPI Urban Consumers
NAS (CPURNSA) |
| | | At Termination | | | | 09/11/54 | | | | USD | | | | 11,135 | | | | 189,823 | | | | — | | | | 189,823 | |
UK RPI All Items Monthly | | | At Termination | | | | | | | | 3.10% | | | | At Termination | | | | 09/15/54 | | | | GBP | | | | 30,890 | | | | (795,632 | ) | | | (43,014 | ) | | | (752,618 | ) |
| | | | | | | | | | | | | | | | | | | | | | | | | | | | | | | | | | | | | | | | |
| | | | | | | | | | | | | | | | | | | | | | | | | | | | | | $ | (133,175 | ) | | $ | (43,175 | ) | | $ | (90,000 | ) |
| | | | | | | | | | | | | | | | | | | | | | | | | | | | | | | | | | | | | | | | |
Centrally Cleared Interest Rate Swaps
| | | | | | | | | | | | | | | | | | | | | | | | | | | | | | | | |
| | | | | | | | | | | | |
| | | | | | | | | | | Effective Date | | Termination Date | | | | | Notional Amount (000) | | | Value | | | Upfront
Premium Paid (Received) | | | Unrealized Appreciation (Depreciation) | |
| Paid by the Fund | | | | Received by the Fund |
| Rate | | Frequency | | | | Rate | | Frequency |
4.68% | | Quarterly | | | | 3-month PRIBOR, 4.24% | | Annual | | N/A | | | 03/20/25 | | | CZK | | | 339,287 | | | $ | (399,485 | ) | | $ | — | | | $ | (399,485 | ) |
5.14% | | Semi-Annual | | | | 6-month WIBOR, 5.85% | | Annual | | N/A | | | 12/20/25 | | | PLN | | | 25,383 | | | | (132,171 | ) | | | — | | | | (132,171 | ) |
8.15% | | Quarterly | | | | 3-month JIBAR, 8.05% | | Quarterly | | 05/07/25(a) | | | 05/07/26 | | | ZAR | | | 150,989 | | | | (100,457 | ) | | | — | | | | (100,457 | ) |
7.97% | | Quarterly | | | | 3-month JIBAR, 8.05% | | Quarterly | | 06/06/25(a) | | | 06/06/26 | | | ZAR | | | 103,987 | | | | (58,428 | ) | | | — | | | | (58,428 | ) |
| | |
C O N S O L I D A T E D S C H E D U L E S O F I N V E S T M E N T S | | 69 |
| | |
Consolidated Schedule of Investments (continued) September 30, 2024 | | BlackRock Total Return Fund |
Centrally Cleared Interest Rate Swaps (continued)
| | | | | | | | | | | | | | | | | | | | | | | | | | | | | | | | | | |
| | | | | | | | | | | | |
| | | | | | | | | | | Effective Date | | Termination Date | | | | | | Notional Amount (000) | | | Value | | | Upfront
Premium Paid (Received) | | | Unrealized Appreciation (Depreciation) | |
| Paid by the Fund | | | | Received by the Fund |
| Rate | | Frequency | | | | Rate | | Frequency |
28-day MXIBTIIE, 10.74% | | Monthly | | | | 10.76% | | Monthly | | N/A | | | 06/11/26 | | | | MXN | | | | 60,912 | | | $ | 79,136 | | | $ | — | | | $ | 79,136 | |
0.77% | | At Termination | | | | 1-day TONA,
0.23% | | At
Termination | | 07/27/26(a)
| | | 07/27/27 | | | | JPY | | | | 14,756,468 | | | | (149,682 | ) | | | — | | | | (149,682 | ) |
0.77% | | At Termination | | | | 1-day TONA,
0.23% | | At
Termination | | 07/27/26(a)
| | | 07/27/27 | | | | JPY | | | | 14,756,468 | | | | (147,151 | ) | | | — | | | | (147,151 | ) |
3.02% | | Annual | | | | 1-day SOFR,
4.96% | | Annual | | 09/25/26(a)
| | | 09/25/28 | | | | USD | | | | 10,740 | | | | 10,445 | | | | — | | | | 10,445 | |
28-day MXIBTIIE, 10.74% | | Monthly | | | | 9.41% | | Monthly | | N/A | | | 07/24/29 | | | | MXN | | | | 66,992 | | | | 112,813 | | | | — | | | | 112,813 | |
7.46% | | Quarterly | | | | 3-month
JIBAR,
8.05% | | Quarterly | | 12/18/24(a)
| | | 12/18/29 | | | | ZAR | | | | 42,960 | | | | 32 | | | | — | | | | 32 | |
4.09% | | Annual | | | | 1-day SOFR,
4.96% | | Annual | | N/A | | | 02/28/31 | | | | USD | | | | 9,920 | | | | (434,766 | ) | | | — | | | | (434,766 | ) |
1-day SOFR, 4.96% | | Annual | | | | 3.06% | | Annual | | 12/02/24(a)
| | | 06/30/31 | | | | USD | | | | 9,690 | | | | (88,528 | ) | | | — | | | | (88,528 | ) |
3.14% | | Annual | | | | 1-day SOFR,
4.96% | | Annual | | 12/02/24(a)
| | | 06/30/31 | | | | USD | | | | 16,332 | | | | 74,044 | | | | — | | | | 74,044 | |
3.39% | | Annual | | | | 1-day SOFR,
4.96% | | Annual | | 09/25/29(a)
| | | 09/25/34 | | | | USD | | | | 4,550 | | | | 208 | | | | — | | | | 208 | |
3.84% | | Annual | | | | 1-day SOFR,
4.96% | | Annual | | N/A | | | 10/01/34 | | | | USD | | | | 58,738 | | | | (2,609,611 | ) | | | — | | | | (2,609,611 | ) |
1-day SOFR, 4.96% | | Annual | | | | 3.29% | | Annual | | 12/02/24(a)
| | | 02/15/40 | | | | USD | | | | 8,128 | | | | (101,717 | ) | | | — | | | | (101,717 | ) |
1-day SOFR, 4.96% | | Annual | | | | 3.31% | | Annual | | N/A | | | 09/06/49 | | | | USD | | | | 2,215 | | | | (26,773 | ) | | | 1,244 | | | | (28,017 | ) |
1-day SOFR, 4.96% | | Annual | | | | 3.31% | | Annual | | 12/02/24(a)
| | | 11/15/53 | | | | USD | | | | 10,462 | | | | 3,277 | | | | — | | | | 3,277 | |
3.18% | | Annual | | | | 1-day SOFR,
4.96% | | Annual | | 12/02/24(a)
| | | 11/15/53 | | | | USD | | | | 10,484 | | | | 237,257 | | | | — | | | | 237,257 | |
2.49% | | Semi-Annual | | | | 6-month
EURIBOR,
3.11% | | Annual | | N/A | | | 02/19/54 | | | | EUR | | | | 41,301 | | | | (2,506,827 | ) | | | — | | | | (2,506,827 | ) |
2.51% | | Semi-Annual | | | | 6-month
EURIBOR,
3.11% | | Annual | | N/A | | | 02/20/54 | | | | EUR | | | | 41,301 | | | | (2,664,538 | ) | | | — | | | | (2,664,538 | ) |
2.51% | | Semi-Annual | | | | 6-month
EURIBOR,
3.11% | | Annual | | N/A | | | 02/20/54 | | | | EUR | | | | 40,708 | | | | (2,700,081 | ) | | | — | | | | (2,700,081 | ) |
2.51% | | Semi-Annual | | | | 6-month
EURIBOR,
3.11% | | Annual | | N/A | | | 03/01/54 | | | | EUR | | | | 20,868 | | | | (1,381,051 | ) | | | — | | | | (1,381,051 | ) |
2.46% | | Semi-Annual | | | | 6-month
EURIBOR,
3.11% | | Annual | | N/A | | | 03/22/54 | | | | EUR | | | | 8,764 | | | | (474,445 | ) | | | — | | | | (474,445 | ) |
2.54% | | Semi-Annual | | | | 6-month
EURIBOR,
3.11% | | Annual | | N/A | | | 04/22/54 | | | | EUR | | | | 33,918 | | | | (1,872,910 | ) | | | (73,530 | ) | | | (1,799,380 | ) |
2.43% | | Semi-Annual | | | | 6-month
EURIBOR,
3.11% | | Annual | | N/A | | | 06/19/54 | | | | EUR | | | | 8,347 | | | | (258,171 | ) | | | — | | | | (258,171 | ) |
2.43% | | Semi-Annual | | | | 6-month
EURIBOR,
3.11% | | Annual | | N/A | | | 06/20/54 | | | | EUR | | | | 8,082 | | | | (250,805 | ) | | | — | | | | (250,805 | ) |
6-month EURIBOR, 3.11% | | Annual | | | | 2.44% | | Semi-Annual | | N/A | | | 06/24/54 | | | | EUR | | | | 5,548 | | | | 190,127 | | | | — | | | | 190,127 | |
| | | | | | | | | | | | | | | | | | | | | | | | | | | | | | | | | | |
| | | | | | | | | | | | | | | | | | | | | | | | $ | (15,650,258 | ) | | $ | (72,286 | ) | | $ | (15,577,972 | ) |
| | | | | | | | | | | | | | | | | | | | | | | | | | | | | | | | | | |
| | |
| 70 | | 2 0 2 4 B L A C K R O C K A N N U A L F I N A N C I A L S T A T E M E N T S A N D A D D I T I O N A L I N F O R M A T I O N |
| | |
Consolidated Schedule of Investments (continued) September 30, 2024 | | BlackRock Total Return Fund |
OTC Credit Default Swaps — Buy Protection
| | | | | | | | | | | | | | | | | | | | | | | | | | | | | | | | | | |
| | | | | | | | | | |
| Reference Obligation/Index | | Financing
Rate
Paid by the
Fund | | | Payment
Frequency | | | Counterparty | | Termination
Date | | | | | | Notional
Amount
(000) | | | Value | | | Upfront
Premium
Paid
(Received) | | | Unrealized
Appreciation
(Depreciation) | |
Avis Budget Group, Inc. | | | 5.00 | % | | | Quarterly | | | JPMorgan Chase Bank N.A. | | | 12/20/24 | | | | USD | | | | 750 | | | $ | (7,765 | ) | | $ | 2,781 | | | $ | (10,546 | ) |
Avis Budget Group, Inc. | | | 5.00 | | | | Quarterly | | | JPMorgan Chase Bank N.A. | | | 12/20/24 | | | | USD | | | | 1,680 | | | | (17,456 | ) | | | 6,172 | | | | (23,628 | ) |
Boeing Co. (The) | | | 1.00 | | | | Quarterly | | | BNP Paribas S.A. | | | 12/20/24 | | | | USD | | | | 2,250 | | | | (3,356 | ) | | | (1,967 | ) | | | (1,389 | ) |
Boeing Co. (The) | | | 1.00 | | | | Quarterly | | | Morgan Stanley & Co. International PLC | | | 12/20/24 | | | | USD | | | | 5,950 | | | | (8,875 | ) | | | (3,080 | ) | | | (5,795 | ) |
Federative Republic of Brazil | | | 1.00 | | | | Quarterly | | | Barclays Bank PLC | | | 12/20/24 | | | | USD | | | | 3,216 | | | | (6,051 | ) | | | 3,554 | | | | (9,605 | ) |
Federative Republic of Brazil | | | 1.00 | | | | Quarterly | | | Barclays Bank PLC | | | 12/20/24 | | | | USD | | | | 3,215 | | | | (6,049 | ) | | | 3,553 | | | | (9,602 | ) |
Federative Republic of Brazil | | | 1.00 | | | | Quarterly | | | Barclays Bank PLC | | | 12/20/24 | | | | USD | | | | 3,220 | | | | (6,059 | ) | | | 3,558 | | | | (9,617 | ) |
Federative Republic of Brazil | | | 1.00 | | | | Quarterly | | | Barclays Bank PLC | | | 12/20/24 | | | | USD | | | | 3,215 | | | | (6,049 | ) | | | 3,485 | | | | (9,534 | ) |
Federative Republic of Brazil | | | 1.00 | | | | Quarterly | | | Barclays Bank PLC | | | 12/20/24 | | | | USD | | | | 4,500 | | | | (8,467 | ) | | | 4,878 | | | | (13,345 | ) |
Federative Republic of Brazil | | | 1.00 | | | | Quarterly | | | Barclays Bank PLC | | | 12/20/24 | | | | USD | | | | 1,948 | | | | (3,665 | ) | | | 2,112 | | | | (5,777 | ) |
Avis Budget Group, Inc. | | | 5.00 | | | | Quarterly | | | JPMorgan Chase Bank N.A. | | | 06/20/25 | | | | USD | | | | 2,540 | | | | (74,803 | ) | | | 45,271 | | | | (120,074 | ) |
Caterpillar, Inc. | | | 1.00 | | | | Quarterly | | | Deutsche Bank AG | | | 06/20/27 | | | | USD | | | | 4,300 | | | | (94,359 | ) | | | (56,233 | ) | | | (38,126 | ) |
BorgWarner, Inc. | | | 1.00 | | | | Quarterly | | | BNP Paribas S.A. | | | 12/20/27 | | | | USD | | | | 1,000 | | | | (17,813 | ) | | | 8,944 | | | | (26,757 | ) |
Pitney Bowes, Inc. | | | 1.00 | | | | Quarterly | | | Bank of America N.A. | | | 12/20/27 | | | | USD | | | | 620 | | | | 28,941 | | | | 106,032 | | | | (77,091 | ) |
Pitney Bowes, Inc. | | | 1.00 | | | | Quarterly | | | Citibank N.A. | | | 12/20/27 | | | | USD | | | | 250 | | | | 11,670 | | | | 43,972 | | | | (32,302 | ) |
Pitney Bowes, Inc. | | | 1.00 | | | | Quarterly | | | Citibank N.A. | | | 12/20/27 | | | | USD | | | | 380 | | | | 17,738 | | | | 68,866 | | | | (51,128 | ) |
Pitney Bowes, Inc. | | | 1.00 | | | | Quarterly | | | Goldman Sachs International | | | 12/20/27 | | | | USD | | | | 780 | | | | 36,410 | | | | 175,331 | | | | (138,921 | ) |
Simon Property Group LP | | | 1.00 | | | | Quarterly | | | Goldman Sachs International | | | 12/20/27 | | | | USD | | | | 3,640 | | | | (70,983 | ) | | | 36,436 | | | | (107,419 | ) |
Credit Suisse Group AG | | | 1.00 | | | | Quarterly | | | Barclays Bank PLC | | | 06/20/28 | | | | EUR | | | | 1,350 | | | | (29,484 | ) | | | 66,263 | | | | (95,747 | ) |
Credit Suisse Group AG | | | 1.00 | | | | Quarterly | | | JPMorgan Chase Bank N.A. | | | 06/20/28 | | | | EUR | | | | 3,500 | | | | (76,440 | ) | | | 94,672 | | | | (171,112 | ) |
Deutsche Bank AG | | | 1.00 | | | | Quarterly | | | BNP Paribas S.A. | | | 06/20/28 | | | | EUR | | | | 4,400 | | | | (80,730 | ) | | | 275,208 | | | | (355,938 | ) |
Deutsche Bank AG | | | 1.00 | | | | Quarterly | | | Goldman Sachs International | | | 06/20/28 | | | | EUR | | | | 4,400 | | | | (80,730 | ) | | | 191,749 | | | | (272,479 | ) |
Boeing Co. (The) | | | 1.00 | | | | Quarterly | | | Deutsche Bank AG | | | 12/20/28 | | | | USD | | | | 4,700 | | | | 42,929 | | | | (19,384 | ) | | | 62,313 | |
Boeing Co. (The) | | | 1.00 | | | | Quarterly | | | JPMorgan Chase Bank N.A. | | | 06/20/29 | | | | USD | | | | 4,700 | | | | 68,612 | | | | 53,206 | | | | 15,406 | |
Republic of Columbia | | | 1.00 | | | | Quarterly | | | Barclays Bank PLC | | | 12/20/29 | | | | USD | | | | 4,564 | | | | 207,931 | | | | 230,482 | | | | (22,551 | ) |
Republic of Turkey | | | 1.00 | | | | Quarterly | | | Goldman Sachs International | | | 12/20/29 | | | | USD | | | | 5,020 | | | | 372,262 | | | | 416,887 | | | | (44,625 | ) |
American Electric Power Co., Inc. | | | 1.00 | | | | Quarterly | | | Bank of America N.A. | | | 12/20/29 | | | | USD | | | | 39,219 | | | | (1,234,175 | ) | | | (1,138,879 | ) | | | (95,296 | ) |
American Express Co. | | | 1.00 | | | | Quarterly | | | Goldman Sachs International | | | 12/20/29 | | | | USD | | | | 19,990 | | | | (628,320 | ) | | | (592,409 | ) | | | (35,911 | ) |
Dominion Energy, Inc. | | | 1.00 | | | | Quarterly | | | Goldman Sachs International | | | 12/20/29 | | | | USD | | | | 19,396 | | | | (588,205 | ) | | | (545,514 | ) | | | (42,691 | ) |
Federative Republic of Brazil | | | 1.00 | | | | Quarterly | | | Barclays Bank PLC | | | 12/20/29 | | | | USD | | | | 7,097 | | | | 170,524 | | | | 224,807 | | | | (54,283 | ) |
Federative Republic of Brazil | | | 1.00 | | | | Quarterly | | | Barclays Bank PLC | | | 12/20/29 | | | | USD | | | | 12,243 | | | | 294,182 | | | | 387,830 | | | | (93,648 | ) |
Republic of Turkey | | | 1.00 | | | | Quarterly | | | Goldman Sachs International | | | 12/20/29 | | | | USD | | | | 454 | | | | 33,638 | | | | 37,670 | | | | (4,032 | ) |
CMBX.NA.9.AAA | | | 0.50 | | | | Monthly | | | Morgan Stanley & Co. International PLC | | | 09/17/58 | | | | USD | | | | 3,024 | | | | 372 | | | | 30,616 | | | | (30,244 | ) |
CMBX.NA.9.AAA | | | 0.50 | | | | Monthly | | | Morgan Stanley & Co. International PLC | | | 09/17/58 | | | | USD | | | | 63 | | | | 8 | | | | 705 | | | | (697 | ) |
CMBX.NA.9.BBB- | | | 3.00 | | | | Monthly | | | Citigroup Global Markets, Inc. | | | 09/17/58 | | | | USD | | | | 2,080 | | | | 329,160 | | | | 63,261 | | | | 265,899 | |
CMBX.NA.9.BBB- | | | 3.00 | | | | Monthly | | | Goldman Sachs International | | | 09/17/58 | | | | USD | | | | 3,544 | | | | 560,838 | | | | 254,011 | | | | 306,827 | |
CMBX.NA.9.BBB- | | | 3.00 | | | | Monthly | | | Morgan Stanley & Co. International PLC | | | 09/17/58 | | | | USD | | | | 204 | | | | 32,283 | | | | 10,158 | | | | 22,125 | |
CMBX.NA.6.AAA | | | 0.50 | | | | Monthly | | | Deutsche Bank AG | | | 05/11/63 | | | | USD | | | | 7 | | | | (1 | ) | | | (2 | ) | | | 1 | |
| | | | | | | | | | | | | | | | | | | | | | | | | | | | | | | | | | |
| | | | | | | | | | | | | | | | | | | | | | | | $ | (842,337 | ) | | $ | 495,002 | | | $ | (1,337,339 | ) |
| | | | | | | | | | | | | | | | | | | | | | | | | | | | | | | | | | |
| | |
C O N S O L I D A T E D S C H E D U L E S O F I N V E S T M E N T S | | 71 |
| | |
Consolidated Schedule of Investments (continued) September 30, 2024 | | BlackRock Total Return Fund |
OTC Credit Default Swaps — Sell Protection
| | | | | | | | | | | | | | | | | | | | | | | | | | | | | | | | | | |
| | | | | | | | | | |
| Reference Obligation/Index | | Financing
Rate
Received
by the Fund | | | Payment
Frequency | | | Counterparty | | Termination
Date | | | Credit
Rating(a)
| | | Notional
Amount
(000)(b) | | | Value | | | Upfront
Premium
Paid (Received) | | | Unrealized
Appreciation
(Depreciation) | |
Vistra Operations Co. LLC | | | 5.00 | % | | | Quarterly | | | JPMorgan Chase Bank N.A. | | | 12/20/25 | | | | BB | | | USD | 1,015 | | | $ | 55,668 | | | $ | 21,821 | | | $ | 33,847 | |
CMBX.NA.9.BBB- | | | 3.00 | | | | Monthly | | | Deutsche Bank AG | | | 09/17/58 | | | | N/R | | | USD | 906 | | | | (143,375 | ) | | | (93,289 | ) | | | (50,086 | ) |
CMBX.NA.9.BBB- | | | 3.00 | | | | Monthly | | | Goldman Sachs International | | | 09/17/58 | | | | N/R | | | USD | 1,310 | | | | (207,308 | ) | | | (131,367 | ) | | | (75,941 | ) |
CMBX.NA.9.BBB- | | | 3.00 | | | | Monthly | | | J.P. Morgan Securities LLC | | | 09/17/58 | | | | N/R | | | USD | 121 | | | | (19,148 | ) | | | (24,554 | ) | | | 5,406 | |
CMBX.NA.9.BBB- | | | 3.00 | | | | Monthly | | | Morgan Stanley & Co. International PLC | | | 09/17/58 | | | | N/R | | | USD | 231 | | | | (36,556 | ) | | | (12,077 | ) | | | (24,479 | ) |
CMBX.NA.9.BBB- | | | 3.00 | | | | Monthly | | | Morgan Stanley & Co. International PLC | | | 09/17/58 | | | | N/R | | | USD | 1,060 | | | | (167,745 | ) | | | (46,096 | ) | | | (121,649 | ) |
CMBX.NA.9.BBB- | | | 3.00 | | | | Monthly | | | Morgan Stanley & Co. International PLC | | | 09/17/58 | | | | N/R | | | USD | 1,200 | | | | (189,900 | ) | | | (1,340 | ) | | | (188,560 | ) |
CMBX.NA.9.BBB- | | | 3.00 | | | | Monthly | | | Morgan Stanley & Co. International PLC | | | 09/17/58 | | | | N/R | | | USD | 1,000 | | | | (158,250 | ) | | | (237,016 | ) | | | 78,766 | |
CMBX.NA.10.BBB- | | | 3.00 | | | | Monthly | | | J.P. Morgan Securities LLC | | | 11/17/59 | | | | BBB- | | | USD | 60 | | | | (10,353 | ) | | | (4,453 | ) | | | (5,900 | ) |
| | | | | | | | | | | | | | | | | | | | | | | | | | | | | | | | | | |
| | | | | | | | | | | | | | | | | | | | | | | | $ | (876,967 | ) | | $ | (528,371 | ) | | $ | (348,596 | ) |
| | | | | | | | | | | | | | | | | | | | | | | | | | | | | | | | | | |
| | (a) | Using the rating of the issuer or the underlying securities of the index, as applicable, provided by S&P Global Ratings. | |
| | (b) | The maximum potential amount the Fund may pay should a negative credit event take place as defined under the terms of agreement. | |
OTC Interest Rate Swaps
| | | | | | | | | | | | | | | | | | | | | | | | | | |
| | | | | | | | | | |
| Paid by the Fund | | | | Received by the Fund | | | | Termination Date | | | | Notional
Amount (000) | | | | | | Upfront
Premium
Paid (Received) | | Unrealized
Appreciation (Depreciation) |
Rate | | Frequency | | | | Rate | | Frequency | | Counterparty | | | | | Value | |
9.73% | | At Termination | | | | 1-day COOIS, 10.08% | | At Termination | | Morgan Stanley & Co. International PLC | | 05/10/25 | | COP | | | 16,035,300 | | | $ | (25,295 | ) | | $ — | | $ (25,295) |
9.81% | | At Termination | | | | 1-day COOIS, 10.08% | | At Termination | | JPMorgan Chase Bank N.A. | | 05/10/25 | | COP | | | 23,970,250 | | | | (41,158 | ) | | — | | (41,158) |
1-day BZDIOVER, 0.04% | | At Termination | | | | 10.81% | | At Termination | | BNP Paribas S.A. | | 07/01/25 | | BRL | | | 44,581 | | | | (55,309 | ) | | — | | (55,309) |
1-day BZDIOVER, 0.04% | | At Termination | | | | 10.98% | | At Termination | | BNP Paribas S.A. | | 07/01/25 | | BRL | | | 28,021 | | | | (26,612 | ) | | — | | (26,612) |
8.62% | | At Termination | | | | 1-day COOIS, 10.08% | | At Termination | | JPMorgan Chase Bank N.A. | | 11/05/25 | | COP | | | 44,297,919 | | | | (77,553 | ) | | — | | (77,553) |
1-day BZDIOVER, 0.04% | | At Termination | | | | 10.11% | | At Termination | | Goldman Sachs International | | 01/02/26 | | BRL | | | 12,885 | | | | (94,580 | ) | | — | | (94,580) |
1-day BZDIOVER, 0.04% | | At Termination | | | | 9.79% | | At Termination | | BNP Paribas S.A. | | 01/04/27 | | BRL | | | 43,250 | | | | (481,864 | ) | | — | | (481,864) |
1-day BZDIOVER, 0.04% | | At Termination | | | | 10.32% | | At Termination | | Bank of America N.A. | | 01/04/27 | | BRL | | | 616 | | | | (4,924 | ) | | — | | (4,924) |
10.97% | | At Termination | | | | 1-day BZDIOVER, 0.04% | | At Termination | | Barclays Bank PLC | | 01/04/27 | | BRL | | | 50,523 | | | | 247,423 | | | — | | 247,423 |
11.57% | | At Termination | | | | 1-day BZDIOVER, 0.04% | | At Termination | | BNP Paribas S.A. | | 01/04/27 | | BRL | | | 21,383 | | | | 49,371 | | | — | | 49,371 |
4.34% | | At Termination | | | | 1-day CLICP, 24,449.94 | | At Termination | | Goldman Sachs International | | 09/13/27 | | CLP | | | 5,011,019 | | | | (1,951 | ) | | — | | (1,951) |
| | | | | | | | | | | | | | | | | | | | | | | | | | |
| | | | | | | | | | | | | | | | | | | | $ | (512,452 | ) | | $ — | | $ (512,452) |
| | | | | | | | | | | | | | | | | | | | | | | | | | |
| | |
| 72 | | 2 0 2 4 B L A C K R O C K A N N U A L F I N A N C I A L S T A T E M E N T S A N D A D D I T I O N A L I N F O R M A T I O N |
| | |
Consolidated Schedule of Investments (continued) September 30, 2024 | | BlackRock Total Return Fund |
OTC Total Return Swaps
| | | | | | | | | | | | | | | | | | | | | | | | | | | | | | | | |
| | | | | | | | | | |
| Paid by the Fund | | | | Received by the Fund | | Counterparty | | Termination | | | | | Notional
Amount | | | | | | Upfront
Premium
Paid | | | Unrealized
Appreciation | |
| Reference | | Frequency | | | | Rate | | Frequency | | Date | | | | | (000) | | | Value | | | (Received) | | | (Depreciation) | |
0.00% | | Quarterly | | | | Goldman Sachs Systematic Skew U.S. Series 10 Excess Return Strategy | | Quarterly | | Goldman Sachs International | | | 12/06/24 | | | USD | | | 10,010 | | | $ | 3,778 | | | $ | — | | | $ | 3,778 | |
0.00% | | Quarterly | | | | Goldman Sachs Systematic Skew U.S. Series 10 Excess Return Strategy | | Quarterly | | Goldman Sachs International | | | 12/06/24 | | | USD | | | 4,927 | | | | (12,949 | ) | | | — | | | | (12,949 | ) |
0.00% | | Quarterly | | | | Goldman Sachs Intraday Delta Replication VVol Series 5 Excess Return Strategy | | Quarterly | | Goldman Sachs International | | | 05/06/25 | | | USD | | | 72,034 | | | | (695,762 | ) | | | — | | | | (695,762 | ) |
0.00% | | Quarterly | | | | Goldman Sachs Intraday Delta Replication VVol Series 5 Excess Return Strategy | | Quarterly | | Goldman Sachs International | | | 05/06/25 | | | USD | | | 21,886 | | | | (211,391 | ) | | | — | | | | (211,391 | ) |
| | | | | | | | | | | | | | | | | | | | | | | | | | | | | | | | |
| | | | | | | | | | | | | | | | | | | | | | $ | (916,324 | ) | | $ | — | | | $ | (916,324 | ) |
| | | | | | | | | | | | | | | | | | | | | | | | | | | | | | | | |
OTC Total Return Swaps
| | | | | | | | | | | | | | | | | | | | | | |
| | | | | | | | |
| Reference Entity | | Payment
Frequency | | Counterparty(a) | | Termination Date | | Net Notional | | | Accrued
Unrealized
Appreciation
(Depreciation) | | | Net Value of
Reference
Entity | | | Gross Notional
Amount
Net Asset
Percentage | |
| Equity Securities Long/Short | | Monthly | | Barclays Bank PLC(b) | | 03/26/25–02/25/27 | | $ | (14,649,509 | ) | | $ | (560,232 | )(c) | | $ | (15,067,639 | ) | | | 0.7 | % |
| | Monthly | | Citibank N.A.(d) | | 02/27/25–02/24/28 | | | (15,530,817 | ) | | | 290,414 | (e) | | | (15,382,222 | ) | | | 0.7 | |
| | Monthly | | JPMorgan Chase Bank N.A.(f) | | 02/10/25–02/18/25 | | | 6,896,303 | | | | (536,030 | )(g) | | | 6,406,007 | | | | 0.6 | |
| | Monthly | | Merrill Lynch International(h) | | 02/15/28–03/15/28 | | | (11,462,946 | ) | | | 877,946 | (i) | | | (10,780,494 | ) | | | 0.8 | |
| | | | | | | | | | | | | | | | | | | | | | |
| | | | | | | | | | | | $ | 72,098 | | | $ | (34,824,348 | ) | | | | |
| | | | | | | | | | | | | | | | | | | | | | |
| | (a) | The Fund receives the total return on a portfolio of long positions underlying the total return swap. The Fund pays the total return on a portfolio of short positions underlying the total return swap. In addition, the Fund pays or receives a variable rate of interest, based on a specified benchmark. The benchmark and spread are determined based upon the country and/or currency of the individual underlying positions. | |
| | (c) | Amount includes $(142,102) of net dividends and financing fees. | |
| | (e) | Amount includes $141,819 of net dividends and financing fees. | |
| | (g) | Amount includes $(45,734) of net dividends and financing fees. | |
| | (i) | Amount includes $195,494 of net dividends and financing fees. | |
The following are the specified benchmarks (plus or minus a range) used in determining the variable rate of interest:
| | | | | | |
| | (b) | | (d) | | (f) |
| Range: | | 5-39 basis points | | 0-75 basis points | | 15-150 basis points |
| Benchmarks: | | Bank of Canada Overnight Rate Target: | | Canadian Overnight Repo Rate Average: | | Overnight Reserve Bank of Australia Rate: |
| | CAD 1-day | | CAD 1-day | | AUD 1-day |
| | Swiss Average Rate O/N: | | Swiss Average Rate O/N: | | Overnight Interbank Rate: |
| | CHF 1-day | | CHF 1-day | | CAD 1-day |
| | Euro Short Term Rate: | | Euro Short Term Rate: | | Swiss Average Rate O/N: |
| | EUR 1-day | | EUR 1-day | | CHF 1-day |
| | Sterling Overnight Index Average: | | Sterling Overnight Index Average: | | Annualized Overnight Deposit MID Rate: |
| | GBP 1-day | | GBP 1-day | | DKK 1-day |
| | Tokyo Overnight Average Rate: | | Tokyo Overnight Average Rate: | | Euro Short-Term Rate: |
| | JPY 1-day | | JPY 1-day | | EUR 1-day |
| | Norwegian Overnight Weighted Average: | | Stockholm Overnight Interbank Offer Rate: | | Sterling Overnight Index Average: |
| | NOK 1-day | | SEK 1-day | | GBP 1-day |
| | Stockholm Overnight Interbank Offer Rate: | | Overnight Bank Funding Rate: | | Hong Kong Overnight Index Average: |
| | SEK 1-day | | USD 1-day | | HKD 1-day |
| | |
C O N S O L I D A T E D S C H E D U L E S O F I N V E S T M E N T S | | 73 |
| | |
Consolidated Schedule of Investments (continued) September 30, 2024 | | BlackRock Total Return Fund |
The following are the specified benchmarks (plus or minus a range) used in determining the variable rate of interest:
| | | | | | |
| | | Overnight Bank Funding Rate: | | | | Tokyo Overnight Average Rate: |
| | USD 1-day | | | | JPY 1-day |
| | | | | | Mexican Interbank Rate: |
| | | | | | MXN 28-day |
| | | | | | Overnight Bank Funding Rate: |
| | | | | | USD 1-day |
| | | | | | Rand Overnight Interest Rate Fixing: |
| | | | | | ZAR 1-day |
| | | |
| | (h) | | | | |
| Range: | | 8-2500 basis points | | | | |
| Benchmarks: | | Overnight Reserve Bank of Australia Rate: | | | | |
| | AUD 1-day | | | | |
| | Bank of Canada Overnight Rate Target: | | | | |
| | CAD 1-day | | | | |
| | Swiss Average Rate O/N: | | | | |
| | CHF 1-day | | | | |
| | Copenhagen Interbank Swap Rate: | | | | |
| | DKK 1-week | | | | |
| | Euro Short-Term Rate: | | | | |
| | EUR 1-day | | | | |
| | Sterling Overnight Index Average: | | | | |
| | GBP 1-day | | | | |
| | Hong Kong Overnight Index Average: | | | | |
| | HKD 1-day | | | | |
| | Tokyo Overnight Average Rate: | | | | |
| | JPY 1-day | | | | |
| | Mexican Interbank Rate: | | | | |
| | MXN 28-day | | | | |
| | Stockholm Overnight Interbank Offer Rate: | | | | |
| | SEK 1-day | | | | |
| | Overnight Bank Funding Rate: | | | | |
| | USD 1-day | | | | |
| | Johannesburg Interbank Agreed Rate: | | | | |
| | ZAR 1-month | | | | |
The following table represents the individual long and short positions and related values of equity securities underlying the total return swap with Barclays Bank PLC, as of period end, termination dates March 26, 2025 to February 25, 2027:
| | | | | | | | | | | | |
| | | Shares | | | Value | | | % of
Basket
Value | |
| | | |
Reference Entity — Long | | | | | | | | | | | | |
| | | |
| Common Stocks | | | | | | | | | |
| | | |
| Aerospace & Defense | | | | | | | | | |
Rheinmetall AG | | | 1,100 | | | $ | 597,989 | | | | (4.0 | )% |
| | | | | | | | | | | | |
| | | |
| Banks | | | | | | | | | |
Banque Cantonale Vaudoise, Registered Shares . | | | 8,100 | | | | 836,599 | | | | (5.5 | )% |
Credicorp Ltd. | | | 5,900 | | | | 1,067,723 | | | | (7.1 | )% |
Standard Chartered PLC | | | 86,800 | | | | 920,599 | | | | (6.1 | )% |
| | | | | | | | | | | | |
| | | |
| | | | | | | 2,824,921 | | | | | |
| | | |
| Biotechnology | | | | | | | | | |
Biogen, Inc. | | | 5,000 | | | | 969,200 | | | | (6.4 | )% |
| | | | | | | | | | | | |
| | | |
| Building Products | | | | | | | | | |
Geberit AG, Registered Shares | | | 1,200 | | | | 783,367 | | | | (5.2 | )% |
Trane Technologies PLC | | | 2,800 | | | | 1,088,444 | | | | (7.2 | )% |
| | | | | | | | | | | | |
| | | |
| | | | | | | 1,871,811 | | | | | |
| | | | | | | | | | | | |
| | | Shares | | | Value | | | % of
Basket
Value | |
| | | |
| Capital Markets | | | | | | | | | |
Julius Baer Group Ltd. | | | 12,600 | | | $ | 759,830 | | | | (5.1 | )% |
Schroders PLC | | | 156,600 | | | | 733,789 | | | | (4.9 | )% |
T Rowe Price Group, Inc. | | | 27,300 | | | | 2,973,789 | | | | (19.7 | )% |
| | | | | | | | | | | | |
| | | |
| | | | | | | 4,467,408 | | | | | |
| | | |
| Chemicals | | | | | | | | | |
Arkema SA | | | 7,600 | | | | 723,891 | | | | (4.8 | )% |
DIC Corp | | | 55,900 | | | | 1,267,132 | | | | (8.4 | )% |
| | | | | | | | | | | | |
| | | |
| | | | | | | 1,991,023 | | | | | |
| | | |
| Commercial Services & Supplies | | | | | | | | | |
Pluxee NV | | | 40,500 | | | | 853,074 | | | | (5.7 | )% |
| | | | | | | | | | | | |
| | | |
| Construction & Engineering | | | | | | | | | |
SHO-BOND Holdings Co. Ltd. | | | 38,800 | | | | 1,538,444 | | | | (10.2 | )% |
| | | | | | | | | | | | |
| | | |
| Consumer Staples Distribution & Retail | | | | | | | | | |
Koninklijke Ahold Delhaize NV | | | 37,600 | | | | 1,298,743 | | | | (8.6 | )% |
| | | | | | | | | | | | |
| | | |
| Diversified Telecommunication Services | | | | | | | | | |
Elisa Oyj | | | 12,700 | | | | 673,284 | | | | (4.5 | )% |
Telenor ASA | | | 165,500 | | | | 2,117,181 | | | | (14.0 | )% |
| | | | | | | | | | | | |
| | | |
| | | | | | | 2,790,465 | | | | | |
| | | |
| Electric Utilities | | | | | | | | | |
Eversource Energy | | | 16,500 | | | | 1,122,825 | | | | (7.5 | )% |
| | | | | | | | | | | | |
| | |
| 74 | | 2 0 2 4 B L A C K R O C K A N N U A L F I N A N C I A L S T A T E M E N T S A N D A D D I T I O N A L I N F O R M A T I O N |
| | |
Consolidated Schedule of Investments (continued) September 30, 2024 | | BlackRock Total Return Fund |
| | | | | | | | | | | | |
| | | Shares | | | Value | | | % of
Basket
Value | |
| | | |
| Electrical Equipment | | | | | | | | | |
Mabuchi Motor Co. Ltd. | | | 63,600 | | | $ | 987,392 | | | | (6.5 | )% |
Mitsubishi Electric Corp. | | | 65,700 | | | | 1,065,716 | | | | (7.1 | )% |
| | | | | | | | | | | | |
| | | |
| | | | | | | 2,053,108 | | | | | |
| | | |
Electronic Equipment, Instruments & Components | | | | | | | | | | | | |
Japan Aviation Electronics Industry Ltd. | | | 49,600 | | | | 885,479 | | | | (5.9 | )% |
| | | | | | | | | | | | |
| | | |
| Entertainment | | | | | | | | | |
Nexon Co. Ltd. | | | 28,000 | | | | 556,413 | | | | (3.7 | )% |
| | | | | | | | | | | | |
| | | |
| Financial Services | | | | | | | | | |
Eurazeo SE | | | 20,200 | | | | 1,661,705 | | | | (11.0 | )% |
| | | | | | | | | | | | |
| | | |
| Food Products | | | | | | | | | |
NH Foods Ltd. | | | 16,000 | | | | 593,204 | | | | (3.9 | )% |
| | | | | | | | | | | | |
| | | |
| Ground Transportation | | | | | | | | | |
Canadian National Railway Co. | | | 7,300 | | | | 854,820 | | | | (5.7 | )% |
Odakyu Electric Railway Co. Ltd. | | | 83,300 | | | | 929,113 | | | | (6.1 | )% |
| | | | | | | | | | | | |
| | | |
| | | | | | | 1,783,933 | | | | | |
| | | |
| Health Care REITs | | | | | | | | | |
Ventas, Inc. | | | 14,500 | | | | 929,885 | | | | (6.2 | )% |
| | | | | | | | | | | | |
| | | |
| Health Care Technology | | | | | | | | | |
M3, Inc. | | | 42,400 | | | | 424,593 | | | | (2.8 | )% |
| | | | | | | | | | | | |
| | | |
| Hotels, Restaurants & Leisure | | | | | | | | | |
Carnival Corp. | | | 42,900 | | | | 792,792 | | | | (5.3 | )% |
| | | | | | | | | | | | |
| | | |
| Household Products | | | | | | | | | |
Henkel AG & Co. KGaA, Preference Shares | | | 16,200 | | | | 1,522,797 | | | | (10.1 | )% |
| | | | | | | | | | | | |
| | | |
| Industrial REITs | | | | | | | | | |
Warehouses De Pauw CVA | | | 25,000 | | | | 667,120 | | | | (4.4 | )% |
| | | | | | | | | | | | |
| | | |
| Insurance | | | | | | | | | |
Dai-ichi Life Holdings, Inc. | | | 42,600 | | | | 1,105,358 | | | | (7.4 | )% |
MS&AD Insurance Group Holdings, Inc. | | | 30,900 | | | | 726,279 | | | | (4.8 | )% |
| | | | | | | | | | | | |
| | | |
| | | | | | | 1,831,637 | | | | | |
| | | |
| Machinery | | | | | | | | | |
Ebara Corp. | | | 57,700 | | | | 945,753 | | | | (6.3 | )% |
Volvo AB, B Shares | | | 67,300 | | | | 1,780,233 | | | | (11.8 | )% |
| | | | | | | | | | | | |
| | | |
| | | | | | | 2,725,986 | | | | | |
| | | |
| Marine Transportation | | | | | | | | | |
Kuehne + Nagel International AG, Registered Shares | | | 4,400 | | | | 1,202,162 | | | | (8.0 | )% |
| | | | | | | | | | | | |
| | | |
| Media | | | | | | | | | |
AMC Networks, Inc., Class A | | | 45,315 | | | | 393,787 | | | | (2.6 | )% |
| | | | | | | | | | | | |
| | | |
| Metals & Mining | | | | | | | | | |
Dowa Holdings Co. Ltd. | | | 26,900 | | | | 988,644 | | | | (6.6 | )% |
Mitsui Mining & Smelting Co. Ltd. | | | 27,900 | | | | 954,952 | | | | (6.3 | )% |
| | | | | | | | | | | | |
| | | |
| | | | | | | 1,943,596 | | | | | |
| | | |
| Oil, Gas & Consumable Fuels | | | | | | | | | |
ConocoPhillips | | | 12,100 | | | | 1,273,888 | | | | (8.5 | )% |
Devon Energy Corp. | | | 44,100 | | | | 1,725,192 | | | | (11.4 | )% |
Koninklijke Vopak NV | | | 21,500 | | | | 997,810 | | | | (6.6 | )% |
| | | | | | | | | | | | |
| | | |
| | | | | | | 3,996,890 | | | | | |
| | | |
| Pharmaceuticals | | | | | | | | | |
Zoetis, Inc. | | | 4,700 | | | | 918,286 | | | | (6.1 | )% |
| | | | | | | | | | | | |
| | | | | | | | | | | | |
| | | Shares | | | Value | | | % of
Basket
Value | |
| | | |
| Professional Services | | | | | | | | | |
Adecco Group AG, Registered Shares | | | 14,200 | | | $ | 484,281 | | | | (3.2 | )% |
Intertek Group PLC | | | 22,400 | | | | 1,548,679 | | | | (10.3 | )% |
| | | | | | | | | | | | |
| | | |
| | | | | | | 2,032,960 | | | | | |
| | | |
| Semiconductors & Semiconductor Equipment | | | | | | | | | |
Kokusai Electric Corp. | | | 18,700 | | | | 421,658 | | | | (2.8 | )% |
Lam Research Corp. | | | 1,500 | | | | 1,224,120 | | | | (8.1 | )% |
Skyworks Solutions, Inc. | | | 5,800 | | | | 572,866 | | | | (3.8 | )% |
| | | | | | | | | | | | |
| | | |
| | | | | | | 2,218,644 | | | | | |
| | | |
| Software | | | | | | | | | |
Atlassian Corp., Class A | | | 4,000 | | | | 635,240 | | | | (4.2 | )% |
Dassault Systemes SE | | | 19,800 | | | | 786,472 | | | | (5.2 | )% |
Fortinet, Inc. | | | 7,900 | | | | 612,645 | | | | (4.1 | )% |
ServiceNow, Inc. | | | 600 | | | | 536,634 | | | | (3.6 | )% |
Workday, Inc., Class A | | | 8,200 | | | | 2,004,162 | | | | (13.3 | )% |
| | | | | | | | | | | | |
| | | |
| | | | | | | 4,575,153 | | | | | |
| | | |
| Specialized REITs | | | | | | | | | |
Equinix, Inc. | | | 900 | | | | 798,867 | | | | (5.3 | )% |
| | | | | | | | | | | | |
| | | |
| Specialty Retail | | | | | | | | | |
Shimamura Co. Ltd. | | | 11,900 | | | | 650,047 | | | | (4.3 | )% |
TJX Cos., Inc. (The) | | | 14,700 | | | | 1,727,838 | | | | (11.5 | )% |
| | | | | | | | | | | | |
| | | |
| | | | | | | 2,377,885 | | | | | |
| | | |
| Technology Hardware, Storage & Peripherals | | | | | | | | | |
Dell Technologies, Inc., Class C | | | 6,800 | | | | 806,072 | | | | (5.4 | )% |
| | | | | | | | | | | | |
| | | |
| Textiles, Apparel & Luxury Goods | | | | | | | | | |
Goldwin, Inc. | | | 13,500 | | | | 782,126 | | | | (5.2 | )% |
| | | | | | | | | | | | |
| | | |
| Trading Companies & Distributors | | | | | | | | | |
Mitsui & Co. Ltd. | | | 49,500 | | | | 1,107,020 | | | | (7.4 | )% |
Toyota Tsusho Corp. | | | 57,900 | | | | 1,058,627 | | | | (7.0 | )% |
| | | | | | | | | | | | |
| | | |
| | | | | | | 2,165,647 | | | | | |
| | | |
| Transportation Infrastructure | | | | | | | | | |
Kamigumi Co. Ltd. | | | 58,900 | | | | 1,347,157 | | | | (8.9 | )% |
| | | | | | | | | | | | |
| | | |
Total Reference Entity — Long | | | | | | | 62,313,787 | | | | | |
| | | | | | | | | | | | |
| | |
Reference Entity — Short | | | | | | | | | |
| | | |
| Common Stocks | | | | | | | | | |
| | | |
| Aerospace & Defense | | | | | | | | | |
General Dynamics Corp. | | | 4,300 | | | | (1,299,460 | ) | | | 8.6 | % |
| | | | | | | | | | | | |
| | | |
| Air Freight & Logistics | | | | | | | | | |
NIPPON EXPRESS HOLDINGS, Inc. | | | 23,700 | | | | (1,248,203 | ) | | | 8.3 | % |
SG Holdings Co. Ltd. | | | 52,000 | | | | (557,719 | ) | | | 3.7 | % |
| | | | | | | | | | | | |
| | | |
| | | | | | | (1,805,922 | ) | | | | |
| | | |
| Automobile Components | | | | | | | | | |
Koito Manufacturing Co. Ltd. | | | 32,400 | | | | (450,779 | ) | | | 3.0 | % |
| | | | | | | | | | | | |
| | | |
| Automobiles | | | | | | | | | |
Nissan Motor Co. Ltd. | | | 420,600 | | | | (1,194,771 | ) | | | 7.9 | % |
Volvo Car AB, Class B | | | 152,500 | | | | (419,831 | ) | | | 2.8 | % |
| | | | | | | | | | | | |
| | | |
| | | | | | | (1,614,602 | ) | | | | |
| | | |
| Banks | | | | | | | | | |
Commerzbank AG | | | 28,000 | | | | (516,444 | ) | | | 3.4 | % |
HSBC Holdings PLC | | | 102,300 | | | | (917,736 | ) | | | 6.1 | % |
Nordea Bank Abp | | | 90,100 | | | | (1,063,157 | ) | | | 7.1 | % |
| | | | | | | | | | | | |
| | | |
| | | | | | | (2,497,337 | ) | | | | |
| | |
C O N S O L I D A T E D S C H E D U L E S O F I N V E S T M E N T S | | 75 |
| | |
Consolidated Schedule of Investments (continued) September 30, 2024 | | BlackRock Total Return Fund |
| | | | | | | | | | | | |
| | | Shares | | | Value | | | % of
Basket
Value | |
| | | |
| Beverages | | | | | | | | | |
Diageo PLC | | | 59,100 | | | $ | (2,064,358 | ) | | | 13.7 | % |
Sapporo Holdings Ltd. | | | 4,600 | | | | (253,812 | ) | | | 1.7 | % |
| | | | | | | | | | | | |
| | | |
| | | | | | | (2,318,170 | ) | | | | |
| | | |
| Broadline Retail | | | | | | | | | |
Mercari, Inc. | | | 32,000 | | | | (558,552 | ) | | | 3.7 | % |
| | | | | | | | | | | | |
| | | |
| Capital Markets | | | | | | | | | |
SBI Holdings, Inc. | | | 47,500 | | | | (1,099,270 | ) | | | 7.3 | % |
| | | | | | | | | | | | |
| | | |
| Chemicals | | | | | | | | | |
Kaneka Corp. | | | 15,500 | | | | (424,201 | ) | | | 2.8 | % |
Mitsui Chemicals, Inc. | | | 22,600 | | | | (603,693 | ) | | | 4.0 | % |
Sherwin-Williams Co. (The) | | | 2,300 | | | | (877,841 | ) | | | 5.8 | % |
| | | | | | | | | | | | |
| | | |
| | | | | | | (1,905,735 | ) | | | | |
| | | |
| Construction Materials | | | | | | | | | |
Martin Marietta Materials, Inc. | | | 2,300 | | | | (1,237,975 | ) | | | 8.2 | % |
| | | | | | | | | | | | |
| | | |
| Consumer Finance | | | | | | | | | |
Orient Corp. | | | 234,500 | | | | (1,538,441 | ) | | | 10.2 | % |
| | | | | | | | | | | | |
| | | |
Consumer Staples Distribution & Retail | | | | | | | | | | | | |
Aeon Co. Ltd. | | | 69,200 | | | | (1,879,493 | ) | | | 12.5 | % |
Kobe Bussan Co. Ltd. | | | 36,600 | | | | (1,141,489 | ) | | | 7.6 | % |
MatsukiyoCocokara & Co. | | | 86,000 | | | | (1,416,880 | ) | | | 9.4 | % |
| | | | | | | | | | | | |
| | | |
| | | | | | | (4,437,862 | ) | | | | |
| | | |
| Containers & Packaging | | | | | | | | | |
Smurfit WestRock PLC | | | 17,600 | | | | (879,563 | ) | | | 5.8 | % |
| | | | | | | | | | | | |
| | | |
| Diversified REITs | | | | | | | | | |
Nomura Real Estate Master Fund, Inc. | | | 900 | | | | (897,936 | ) | | | 6.0 | % |
| | | | | | | | | | | | |
| | | |
Diversified Telecommunication Services | | | | | | | | | | | | |
Telecom Italia SpA/Milano | | | 45,000 | | | | (12,511 | ) | | | 0.1 | % |
| | | | | | | | | | | | |
| | | |
| Electrical Equipment | | | | | | | | | |
Emerson Electric Co. | | | 10,800 | | | | (1,181,196 | ) | | | 7.8 | % |
| | | | | | | | | | | | |
| | | |
Electronic Equipment, Instruments & Components | | | | | | | | | | | | |
Anritsu Corp. | | | 88,000 | | | | (670,635 | ) | | | 4.5 | % |
Corning, Inc. | | | 15,700 | | | | (708,855 | ) | | | 4.7 | % |
| | | | | | | | | | | | |
| | | |
| | | | | | | (1,379,490 | ) | | | | |
| | | |
| Entertainment | | | | | | | | | |
Daiichikosho Co. Ltd. | | | 144,400 | | | | (1,759,680 | ) | | | 11.7 | % |
| | | | | | | | | | | | |
| | | |
| Financial Services | | | | | | | | | |
Wendel SE | | | 14,000 | | | | (1,432,475 | ) | | | 9.5 | % |
Worldline SA/France | | | 59,400 | | | | (432,825 | ) | | | 2.9 | % |
Zenkoku Hosho Co. Ltd. | | | 33,900 | | | | (1,338,005 | ) | | | 8.9 | % |
| | | | | | | | | | | | |
| | | |
| | | | | | | (3,203,305 | ) | | | | |
| | | |
| Food Products | | | | | | | | | |
Calbee, Inc. | | | 51,000 | | | | (1,242,070 | ) | | | 8.2 | % |
Mondelez International, Inc., Class A | | | 11,200 | | | | (825,104 | ) | | | 5.5 | % |
Yakult Honsha Co. Ltd. | | | 41,400 | | | | (958,773 | ) | | | 6.4 | % |
| | | | | | | | | | | | |
| | | |
| | | | | | | (3,025,947 | ) | | | | |
| | | |
| Gas Utilities | | | | | | | | | |
Tokyo Gas Co. Ltd. | | | 30,500 | | | | (710,440 | ) | | | 4.7 | % |
| | | | | | | | | | | | |
| | | | | | | | | | | | |
| | | Shares | | | Value | | | % of
Basket
Value | |
| | | |
| Health Care Equipment & Supplies | | | | | | | | | |
Nipro Corp. | | | 53,400 | | | $ | (532,542 | ) | | | 3.5 | % |
Solventum Corp. | | | 9,700 | | | | (676,284 | ) | | | 4.5 | % |
| | | | | | | | | | | | |
| | | |
| | | | | | | (1,208,826 | ) | | | | |
| | | |
| Hotel & Resort REITs | | | | | | | | | |
Invincible Investment Corp. | | | 1,700 | | | | (736,266 | ) | | | 4.9 | % |
| | | | | | | | | | | | |
| | | |
| Household Durables | | | | | | | | | |
SEB SA | | | 8,700 | | | | (993,067 | ) | | | 6.6 | % |
Sharp Corp./Japan | | | 59,400 | | | | (395,048 | ) | | | 2.6 | % |
| | | | | | | | | | | | |
| | | |
| | | | | | | (1,388,115 | ) | | | | |
| | | |
| Insurance | | | | | | | | | |
Arthur J Gallagher & Co. | | | 4,600 | | | | (1,294,302 | ) | | | 8.6 | % |
Swiss Life Holding AG, Registered Shares | | | 3,000 | | | | (2,510,276 | ) | | | 16.7 | % |
| | | | | | | | | | | | |
| | | |
| | | | | | | (3,804,578 | ) | | | | |
| | | |
| IT Services | | | | | | | | | |
Obic Co. Ltd. | | | 21,000 | | | | (736,769 | ) | | | 4.9 | % |
| | | | | | | | | | | | |
| | | |
| Life Sciences Tools & Services | | | | | | | | | |
Bio-Rad Laboratories, Inc., Class A | | | 1,500 | | | | (501,870 | ) | | | 3.3 | % |
Bio-Techne Corp. | | | 6,900 | | | | (551,517 | ) | | | 3.7 | % |
Charles River Laboratories International, Inc. | | | 4,800 | | | | (945,456 | ) | | | 6.3 | % |
Tecan Group AG, Registered Shares | | | 4,700 | | | | (1,544,515 | ) | | | 10.2 | % |
| | | | | | | | | | | | |
| | | |
| | | | | | | (3,543,358 | ) | | | | |
| | | |
| Machinery | | | | | | | | | |
DMG Mori Co. Ltd. | | | 45,300 | | | | (966,259 | ) | | | 6.4 | % |
Fortive Corp. | | | 8,100 | | | | (639,333 | ) | | | 4.2 | % |
Hitachi Construction Machinery Co. Ltd. | | | 39,900 | | | | (977,952 | ) | | | 6.5 | % |
Husqvarna AB, B Shares | | | 162,500 | | | | (1,138,266 | ) | | | 7.6 | % |
Mitsubishi Heavy Industries Ltd. | | | 33,300 | | | | (497,635 | ) | | | 3.3 | % |
OSG Corp. | | | 114,500 | | | | (1,618,749 | ) | | | 10.7 | % |
Parker-Hannifin Corp. | | | 3,500 | | | | (2,211,370 | ) | | | 14.7 | % |
Pentair PLC | | | 15,400 | | | | (1,505,966 | ) | | | 10.0 | % |
| | | | | | | | | | | | |
| | | |
| | | | | | | (9,555,530 | ) | | | | |
| | | |
| Media | | | | | | | | | |
RTL Group SA | | | 42,400 | | | | (1,439,654 | ) | | | 9.5 | % |
WPP PLC | | | 140,600 | | | | (1,440,227 | ) | | | 9.6 | % |
| | | | | | | | | | | | |
| | | |
| | | | | | | (2,879,881 | ) | | | | |
| | | |
| Multi-Utilities | | | | | | | | | |
Public Service Enterprise Group, Inc. | | | 10,300 | | | | (918,863 | ) | | | 6.1 | % |
| | | | | | | | | | | | |
| | | |
| Office REITs | | | | | | | | | |
Japan Real Estate Investment Corp. | | | 200 | | | | (795,120 | ) | | | 5.3 | % |
| | | | | | | | | | | | |
| | | |
| Oil, Gas & Consumable Fuels | | | | | | | | | |
EQT Corp. | | | 39,100 | | | | (1,432,624 | ) | | | 9.5 | % |
| | | | | | | | | | | | |
| | | |
| Personal Care Products | | | | | | | | | |
Unilever PLC | | | 20,300 | | | | (1,316,116 | ) | | | 8.7 | % |
| | | | | | | | | | | | |
| | | |
| Pharmaceuticals | | | | | | | | | |
Otsuka Holdings Co. Ltd. | | | 24,000 | | | | (1,363,179 | ) | | | 9.0 | % |
| | | | | | | | | | | | |
| | | |
| Professional Services | | | | | | | | | |
Paychex, Inc. | | | 6,600 | | | | (885,654 | ) | | | 5.9 | % |
Paycom Software, Inc. | | | 3,100 | | | | (516,367 | ) | | | 3.4 | % |
Recruit Holdings Co. Ltd. | | | 21,200 | | | | (1,287,951 | ) | | | 8.6 | % |
| | | | | | | | | | | | |
| | | |
| | | | | | | (2,689,972 | ) | | | | |
| | |
| 76 | | 2 0 2 4 B L A C K R O C K A N N U A L F I N A N C I A L S T A T E M E N T S A N D A D D I T I O N A L I N F O R M A T I O N |
| | |
Consolidated Schedule of Investments (continued) September 30, 2024 | | BlackRock Total Return Fund |
| | | | | | | | | | | | |
| | | Shares | | | Value | | | % of
Basket
Value | |
| | | |
Real Estate Management & Development | | | | | | | | | | | | |
Nomura Real Estate Holdings, Inc. | | | 34,800 | | | $ | (937,620 | ) | | | 6.2 | % |
Relo Group, Inc. | | | 49,500 | | | | (650,736 | ) | | | 4.3 | % |
| | | | | | | | | | | | |
| | | |
| | | | | | | (1,588,356 | ) | | | | |
| | | |
| Retail REITs | | | | | | | | | |
Federal Realty Investment Trust | | | 11,400 | | | | (1,310,658 | ) | | | 8.7 | % |
Japan Metropolitan Fund Invest | | | 1,000 | | | | (671,322 | ) | | | 4.5 | % |
| | | | | | | | | | | | |
| | | |
| | | | | | | (1,981,980 | ) | | | | |
| | | |
Semiconductors & Semiconductor Equipment | | | | | | | | | | | | |
Advantest Corp. | | | 12,000 | | | | (564,375 | ) | | | 3.8 | % |
Sanken Electric Co. Ltd. | | | 20,300 | | | | (955,355 | ) | | | 6.3 | % |
Shinko Electric Industries Co. Ltd. | | | 27,100 | | | | (1,036,407 | ) | | | 6.9 | % |
SUMCO Corp. | | | 131,400 | | | | (1,421,215 | ) | | | 9.4 | % |
| | | | | | | | | | | | |
| | | |
| | | | | | | (3,977,352 | ) | | | | |
| | | |
| Software | | | | | | | | | |
Gen Digital, Inc. | | | 28,500 | | | | (781,755 | ) | | | 5.2 | % |
| | | | | | | | | | | | |
| | | |
| Specialty Retail | | | | | | | | | |
Lowe’s Cos., Inc. | | | 4,800 | | | | (1,300,080 | ) | | | 8.6 | % |
| | | | | | | | | | | | |
| | | |
Technology Hardware, Storage & Peripherals | | | | | | | | | | | | |
Brother Industries Ltd. | | | 32,300 | | | | (633,482 | ) | | | 4.2 | % |
| | | | | | | | | | | | |
| | | |
Wireless Telecommunication Services | | | | | | | | | | | | |
SoftBank Corp. | | | 171,000 | | | | (223,256 | ) | | | 1.5 | % |
SoftBank Group Corp. | | | 12,000 | | | | (711,795 | ) | | | 4.7 | % |
| | | | | | | | | | | | |
| | | |
| | | | | | | (935,051 | ) | | | | |
| | | | | | | | | | | | |
| | | |
Total Reference Entity — Short | | | | | | | (77,381,426) | | | | | |
| | | | | | | | | | | | |
Net Value of Reference Entity — Barclays Bank PLC | | | | | | $ | (15,067,639 | ) | | | | |
| | | | | | | | | | | | |
The following table represents the individual long and short positions and related values of equity securities underlying the total return swap with Citibank N.A., as of period end, termination dates February 27, 2025 to February 24, 2028:
| | | | | | | | | | | | |
| | | Shares | | | Value | | | % of
Basket
Value | |
| | | |
Reference Entity — Long | | | | | | | | | | | | |
| | | |
| Common Stocks | | | | | | | | | |
| | | |
| Aerospace & Defense | | | | | | | | | |
Lockheed Martin Corp. | | | 3,100 | | | $ | 1,812,136 | | | | (11.8 | )% |
Rolls-Royce Holdings PLC | | | 100,900 | | | | 714,119 | | | | (4.6 | )% |
| | | | | | | | | | | | |
| | | |
| | | | | | | 2,526,255 | | | | | |
| | | |
| Air Freight & Logistics | | | | | | | | | |
Expeditors International of Washington, Inc. | | | 14,800 | | | | 1,944,720 | | | | (12.6 | )% |
| | | | | | | | | | | | |
| | | |
| Automobiles | | | | | | | | | |
Yamaha Motor Co. Ltd. | | | 141,100 | | | | 1,270,762 | | | | (8.3 | )% |
| | | | | | | | | | | | |
| | | |
| Banks | | | | | | | | | |
Mitsubishi UFJ Financial Group, Inc. | | | 66,900 | | | | 686,969 | | | | (4.5 | )% |
PNC Financial Services Group, Inc. (The) | | | 5,100 | | | | 942,735 | | | | (6.1 | )% |
| | | | | | | | | | | | |
| | | |
| | | | | | | 1,629,704 | | | | | |
| | | | | | | | | | | | |
| | | Shares | | | Value | | | % of
Basket
Value | |
| | | |
| Beverages | | | | | | | | | |
Coca-Cola Bottlers Japan Holdings, Inc. | | | 9,100 | | | $ | 126,442 | | | | (0.8 | )% |
Ito En Ltd. | | | 39,700 | | | | 944,858 | | | | (6.2 | )% |
| | | | | | | | | | | | |
| | | |
| | | | | | | 1,071,300 | | | | | |
| | | |
| Broadline Retail | | | | | | | | | |
Etsy, Inc. | | | 14,600 | | | | 810,738 | | | | (5.3 | )% |
Isetan Mitsukoshi Holdings Ltd. | | | 30,200 | | | | 474,094 | | | | (3.1 | )% |
PDD Holdings, Inc. | | | 8,800 | | | | 1,186,328 | | | | (7.7 | )% |
| | | | | | | | | | | | |
| | | |
| | | | | | | 2,471,160 | | | | | |
| | | |
| Building Products | | | | | | | | | |
Daikin Industries Ltd. | | | 14,100 | | | | 1,979,090 | | | | (12.9 | )% |
| | | | | | | | | | | | |
| | | |
| Capital Markets | | | | | | | | | |
CME Group, Inc. | | | 2,800 | | | | 617,820 | | | | (4.0 | )% |
Franklin Resources, Inc. | | | 35,600 | | | | 717,340 | | | | (4.7 | )% |
MSCI, Inc. | | | 2,800 | | | | 1,632,204 | | | | (10.6 | )% |
State Street Corp. | | | 15,900 | | | | 1,406,673 | | | | (9.1 | )% |
| | | | | | | | | | | | |
| | | |
| | | | | | | 4,374,037 | | | | | |
| | | |
| Chemicals | | | | | | | | | |
DuPont de Nemours, Inc. | | | 21,000 | | | | 1,871,310 | | | | (12.2 | )% |
Umicore SA | | | 47,900 | | | | 621,652 | | | | (4.0 | )% |
| | | | | | | | | | | | |
| | | |
| | | | | | | 2,492,962 | | | | | |
| | | |
| Construction & Engineering | | | | | | | | | |
Bouygues SA | | | 34,200 | | | | 1,144,714 | | | | (7.4 | )% |
| | | | | | | | | | | | |
| | | |
| Diversified REITs | | | | | | | | | |
British Land Co. PLC (The) | | | 170,500 | | | | 993,462 | | | | (6.5 | )% |
| | | | | | | | | | | | |
| | | |
Diversified Telecommunication Services | | | | | | | | | | | | |
Orange SA | | | 148,100 | | | | 1,696,176 | | | | (11.0 | )% |
Telia Co. AB | | | 429,500 | | | | 1,388,833 | | | | (9.1 | )% |
| | | | | | | | | | | | |
| | | |
| | | | | | | 3,085,009 | | | | | |
| | | |
| Electrical Equipment | | | | | | | | | |
ABB Ltd., Registered Shares | | | 20,700 | | | | 1,200,924 | | | | (7.8 | )% |
NIDEC Corp. | | | 46,200 | | | | 972,653 | | | | (6.3 | )% |
Rockwell Automation, Inc. | | | 4,800 | | | | 1,288,608 | | | | (8.4 | )% |
| | | | | | | | | | | | |
| | | |
| | | | | | | 3,462,185 | | | | | |
| | | |
| Energy Equipment & Services | | | | | | | | | |
Tenaris SA | | | 39,400 | | | | 625,353 | | | | (4.1 | )% |
| | | | | | | | | | | | |
| | | |
| Entertainment | | | | | | | | | |
Netflix, Inc. | | | 2,000 | | | | 1,418,540 | | | | (9.2 | )% |
Walt Disney Co. (The) | | | 17,000 | | | | 1,635,230 | | | | (10.7 | )% |
| | | | | | | | | | | | |
| | | |
| | | | | | | 3,053,770 | | | | | |
| | | |
| Financial Services | | | | | | | | | |
Edenred SE | | | 28,200 | | | | 1,068,092 | | | | (6.9 | )% |
| | | | | | | | | | | | |
| | | |
| Food Products | | | | | | | | | |
Yamazaki Baking Co. Ltd. | | | 31,300 | | | | 620,192 | | | | (4.0 | )% |
| | | | | | | | | | | | |
| | | |
| Health Care Equipment & Supplies | | | | | | | | | |
Asahi Intecc Co. Ltd. | | | 34,300 | | | | 603,450 | | | | (3.9 | )% |
Dexcom, Inc. | | | 21,000 | | | | 1,407,840 | | | | (9.2 | )% |
| | | | | | | | | | | | |
| | | |
| | | | | | | 2,011,290 | | | | | |
| | | |
| Health Care Providers & Services | | | | | | | | | |
Elevance Health, Inc. | | | 1,700 | | | | 884,000 | | | | (5.8 | )% |
Fresenius Medical Care AG | | | 16,400 | | | | 696,864 | | | | (4.5 | )% |
McKesson Corp. | | | 1,600 | | | | 791,072 | | | | (5.1 | )% |
| | | | | | | | | | | | |
| | | |
| | | | | | | 2,371,936 | | | | | |
| | |
C O N S O L I D A T E D S C H E D U L E S O F I N V E S T M E N T S | | 77 |
| | |
Consolidated Schedule of Investments (continued) September 30, 2024 | | BlackRock Total Return Fund |
| | | | | | | | | | | | |
| | | Shares | | | Value | | | % of
Basket
Value | |
| | | |
| Health Care REITs | | | | | | | | | |
Healthpeak Properties, Inc. | | | 80,700 | | | $ | 1,845,609 | | | | (12.0 | )% |
| | | | | | | | | | | | |
| | | |
| Hotels, Restaurants & Leisure | | | | | | | | | |
Booking Holdings, Inc. | | | 200 | | | | 842,424 | | | | (5.5 | )% |
DoorDash, Inc., Class A | | | 3,700 | | | | 528,101 | | | | (3.4 | )% |
| | | | | | | | | | | | |
| | | |
| | | | | | | 1,370,525 | | | | | |
| | | |
| Household Products | | | | | | | | | |
Procter & Gamble Co. (The) | | | 4,600 | | | | 796,720 | | | | (5.2 | )% |
| | | | | | | | | | | | |
| | | |
Independent Power and Renewable Electricity Producers | | | | | | | | | | | | |
Electric Power Development Co. Ltd. | | | 47,800 | | | | 799,366 | | | | (5.2 | )% |
| | | | | | | | | | | | |
| | | |
| Insurance | | | | | | | | | |
Fairfax Financial Holdings Ltd. | | | 1,600 | | | | 2,020,239 | | | | (13.1 | )% |
Japan Post Holdings Co. Ltd. | | | 102,100 | | | | 979,052 | | | | (6.4 | )% |
Sampo Oyj, A Shares | | | 17,900 | | | | 834,863 | | | | (5.4 | )% |
| | | | | | | | | | | | |
| | | |
| | | | | | | 3,834,154 | | | | | |
| | | |
| IT Services | | | | | | | | | |
GoDaddy, Inc., Class A | | | 4,800 | | | | 752,544 | | | | (4.9 | )% |
| | | | | | | | | | | | |
| | | |
| Machinery | | | | | | | | | |
Sandvik AB | | | 47,100 | | | | 1,053,964 | | | | (6.8 | )% |
Spirax Group PLC | | | 6,500 | | | | 655,232 | | | | (4.3 | )% |
| | | | | | | | | | | | |
| | | |
| | | | | | | 1,709,196 | | | | | |
| | | |
| Marine Transportation | | | | | | | | | |
Kawasaki Kisen Kaisha Ltd. | | | 31,700 | | | | 494,188 | | | | (3.2 | )% |
| | | | | | | | | | | | |
| | | |
| Media | | | | | | | | | |
Hakuhodo DY Holdings, Inc. | | | 87,300 | | | | 715,361 | | | | (4.6 | )% |
| | | | | | | | | | | | |
| | | |
| Metals & Mining | | | | | | | | | |
Mitsubishi Materials Corp. | | | 69,900 | | | | 1,263,115 | | | | (8.2 | )% |
| | | | | | | | | | | | |
| | | |
| Oil, Gas & Consumable Fuels | | | | | | | | | |
Canadian Natural Resources Ltd. | | | 37,700 | | | | 1,251,881 | | | | (8.1 | )% |
| | | | | | | | | | | | |
| | | |
| Passenger Airlines | | | | | | | | | |
International Consolidated Airlines Group SA | | | 187,500 | | | | 515,049 | | | | (3.3 | )% |
| | | | | | | | | | | | |
| | | |
| Personal Care Products | | | | | | | | | |
Estee Lauder Cos., Inc. (The), Class A | | | 11,500 | | | | 1,146,435 | | | | (7.5 | )% |
L’Oreal SA | | | 3,100 | | | | 1,390,464 | | | | (9.0 | )% |
| | | | | | | | | | | | |
| | | |
| | | | | | | 2,536,899 | | | | | |
| | | |
| Pharmaceuticals | | | | | | | | | |
Johnson & Johnson | | | 9,500 | | | | 1,539,570 | | | | (10.0 | )% |
| | | | | | | | | | | | |
| | | |
| Professional Services | | | | | | | | | |
Bureau Veritas SA | | | 27,200 | | | | 902,404 | | | | (5.9 | )% |
Thomson Reuters Corp. | | | 5,400 | | | | 921,088 | | | | (6.0 | )% |
| | | | | | | | | | | | |
| | | |
| | | | | | | 1,823,492 | | | | | |
| | | |
| Software | | | | | | | | | |
Datadog, Inc., Class A | | | 9,500 | | | | 1,093,070 | | | | (7.1 | )% |
Sage Group PLC (The) | | | 61,900 | | | | 850,273 | | | | (5.5 | )% |
| | | | | | | | | | | | |
| | | |
| | | | | | | 1,943,343 | | | | | |
| | | |
| Specialty Retail | | | | | | | | | |
USS Co. Ltd. | | | 105,300 | | | | 999,505 | | | | (6.5 | )% |
| | | | | | | | | | | | |
| | | | | | | | | | | | |
| | | Shares | | | Value | | | % of
Basket
Value | |
| | | |
| Textiles, Apparel & Luxury Goods | | | | | | | | | |
Deckers Outdoor Corp. | | | 12,000 | | | $ | 1,913,400 | | | | (12.5 | )% |
Kering SA | | | 2,100 | | | | 604,490 | | | | (3.9 | )% |
| | | | | | | | | | | | |
| | | |
| | | | | | | 2,517,890 | | | | | |
| | | |
| Tobacco | | | | | | | | | |
Imperial Brands PLC | | | 38,400 | | | | 1,117,020 | | | | (7.3 | )% |
| | | | | | | | | | | | |
| | | |
| Transportation Infrastructure | | | | | | | | | |
Mitsubishi Logistics Corp. | | | 21,000 | | | | 769,563 | | | | (5.0 | )% |
| | | | | | | | | | | | |
| | | |
Total Reference Entity — Long | | | | | | | 66,790,983 | | | | | |
| | | | | | | | | | | | |
| | | |
Reference Entity — Short | | | | | | | | | | | | |
| | | |
| Common Stocks | | | | | | | | | |
| | | |
| Air Freight & Logistics | | | | | | | | | |
Deutsche Post AG | | | 28,300 | | | | (1,262,369 | ) | | | 8.2 | % |
FedEx Corp. | | | 7,300 | | | | (1,997,864 | ) | | | 13.0 | % |
| | | | | | | | | | | | |
| | | |
| | | | | | | (3,260,233 | ) | | | | |
| | | |
| Automobiles | | | | | | | | | |
Renault SA | | | 18,100 | | | | (786,859 | ) | | | 5.1 | % |
| | | | | | | | | | | | |
| | | |
| Banks | | | | | | | | | |
NU Holdings Ltd., Class A | | | 75,000 | | | | (1,023,750 | ) | | | 6.7 | % |
| | | | | | | | | | | | |
| | | |
| Beverages | | | | | | | | | |
Brown-Forman Corp., Class B | | | 23,400 | | | | (1,151,280 | ) | | | 7.5 | % |
Coca-Cola Europacific Partners PLC | | | 24,400 | | | | (1,921,500 | ) | | | 12.5 | % |
Constellation Brands, Inc., Class A | | | 6,000 | | | | (1,546,140 | ) | | | 10.1 | % |
Davide Campari-Milano NV | | | 120,400 | | | | (1,020,579 | ) | | | 6.6 | % |
Pernod Ricard SA | | | 11,200 | | | | (1,694,475 | ) | | | 11.0 | % |
Remy Cointreau SA | | | 1,400 | | | | (109,058 | ) | | | 0.7 | % |
| | | | | | | | | | | | |
| | | |
| | | | | | | (7,443,032 | ) | | | | |
| | | |
| Biotechnology | | | | | | | | | |
Swedish Orphan Biovitrum AB | | | 26,300 | | | | (846,812 | ) | | | 5.5 | % |
| | | | | | | | | | | | |
| | | |
| Capital Markets | | | | | | | | | |
Blackstone, Inc. | | | 11,300 | | | | (1,730,369 | ) | | | 11.3 | % |
Brookfield Asset Management Ltd., Class A | | | 27,400 | | | | (1,295,394 | ) | | | 8.4 | % |
KKR & Co., Inc. | | | 7,000 | | | | (914,060 | ) | | | 5.9 | % |
| | | | | | | | | | | | |
| | | |
| | | | | | | (3,939,823 | ) | | | | |
| | | |
| Chemicals | | | | | | | | | |
Air Products & Chemicals, Inc. | | | 3,400 | | | | (1,012,316 | ) | | | 6.6 | % |
Albemarle Corp. | | | 7,600 | | | | (719,796 | ) | | | 4.7 | % |
Celanese Corp. | | | 8,500 | | | | (1,155,660 | ) | | | 7.5 | % |
Corteva, Inc. | | | 22,400 | | | | (1,316,896 | ) | | | 8.6 | % |
DSM-Firmenich AG | | | 7,200 | | | | (993,653 | ) | | | 6.4 | % |
| | | | | | | | | | | | |
| | | |
| | | | | | | (5,198,321 | ) | | | | |
| | | |
| Commercial Services & Supplies | | | | | | | | | |
Rentokil Initial PLC | | | 267,900 | | | | (1,309,996 | ) | | | 8.5 | % |
| | | | | | | | | | | | |
| | | |
| Communications Equipment | | | | | | | | | |
Telefonaktiebolaget LM Ericsson, B Shares | | | 169,500 | | | | (1,280,819 | ) | | | 8.3 | % |
| | | | | | | | | | | | |
| | | |
| Construction Materials | | | | | | | | | |
Vulcan Materials Co. | | | 4,000 | | | | (1,001,720 | ) | | | 6.5 | % |
| | | | | | | | | | | | |
| | | |
Consumer Staples Distribution & Retail | | | | | | | | | | | | |
Walgreens Boots Alliance, Inc. | | | 126,700 | | | | (1,135,232 | ) | | | 7.4 | % |
| | | | | | | | | | | | |
| | | |
| Containers & Packaging | | | | | | | | | |
Smurfit WestRock PLC | | | 21,400 | | | | (1,057,588 | ) | | | 6.9 | % |
| | | | | | | | | | | | |
| | |
| 78 | | 2 0 2 4 B L A C K R O C K A N N U A L F I N A N C I A L S T A T E M E N T S A N D A D D I T I O N A L I N F O R M A T I O N |
| | |
Consolidated Schedule of Investments (continued) September 30, 2024 | | BlackRock Total Return Fund |
| | | | | | | | | | | | |
| | | Shares | | | Value | | | % of
Basket
Value | |
| | | |
| Distributors | | | | | | | | | |
D’ieteren Group | | | 3,300 | | | $ | (698,784 | ) | | | 4.5 | % |
| | | | | | | | | | | | |
| | | |
| Electric Utilities | | | | | | | | | |
American Electric Power Co., Inc. | | | 8,500 | | | | (872,100 | ) | | | 5.7 | % |
Edison International | | | 18,900 | | | | (1,646,001 | ) | | | 10.7 | % |
| | | | | | | | | | | | |
| | | |
| | | | | | | (2,518,101 | ) | | | | |
| | | |
Electronic Equipment, Instruments & Components | | | | | | | | | | | | |
Halma PLC | | | 32,200 | | | | (1,125,888 | ) | | | 7.3 | % |
| | | | | | | | | | | | |
| | | |
| Financial Services | | | | | | | | | |
Fiserv, Inc. | | | 14,100 | | | | (2,533,065 | ) | | | 16.5 | % |
Nexi SpA | | | 142,800 | | | | (970,214 | ) | | | 6.3 | % |
| | | | | | | | | | | | |
| | | |
| | | | | | | (3,503,279 | ) | | | | |
| | | |
| Food Products | | | | | | | | | |
Hershey Co. (The) | | | 5,600 | | | | (1,073,968 | ) | | | 7.0 | % |
Saputo, Inc. | | | 7,800 | | | | (168,348 | ) | | | 1.1 | % |
| | | | | | | | | | | | |
| | | |
| | | | | | | (1,242,316 | ) | | | | |
| | | |
| Health Care Equipment & Supplies | | | | | | | | | |
DiaSorin SpA | | | 14,900 | | | | (1,742,205 | ) | | | 11.3 | % |
GE HealthCare Technologies, Inc. | | | 28,700 | | | | (2,693,495 | ) | | | 17.5 | % |
STERIS PLC | | | 3,000 | | | | (727,620 | ) | | | 4.8 | % |
| | | | | | | | | | | | |
| | | |
| | | | | | | (5,163,320 | ) | | | | |
| | | |
| Health Care Providers & Services | | | | | | | | | |
Henry Schein, Inc. | | | 14,600 | | | | (1,064,340 | ) | | | 6.9 | % |
| | | | | | | | | | | | |
| | | |
| Hotels, Restaurants & Leisure | | | | | | | | | |
Delivery Hero SE | | | 16,900 | | | | (683,935 | ) | | | 4.5 | % |
Starbucks Corp. | | | 10,300 | | | | (1,004,147 | ) | | | 6.5 | % |
| | | | | | | | | | | | |
| | | |
| | | | | | | (1,688,082 | ) | | | | |
| | | |
| Household Durables | | | | | | | | | |
Sharp Corp./Japan | | | 1,300 | | | | (8,646 | ) | | | 0.1 | % |
| | | | | | | | | | | | |
| | | |
| Industrial Conglomerates | | | | | | | | | |
Lifco AB, B Shares | | | 59,400 | | | | (1,956,262 | ) | | | 12.7 | % |
| | | | | | | | | | | | |
| | | |
| Insurance | | | | | | | | | |
Aegon Ltd. | | | 134,200 | | | | (861,984 | ) | | | 5.6 | % |
Beazley PLC | | | 119,300 | | | | (1,218,313 | ) | | | 7.9 | % |
Chubb Ltd. | | | 6,700 | | | | (1,932,213 | ) | | | 12.6 | % |
Manulife Financial Corp. | | | 56,700 | | | | (1,675,699 | ) | | | 10.9 | % |
| | | | | | | | | | | | |
| | | |
| | | | | | | (5,688,209 | ) | | | | |
| | | |
| IT Services | | | | | | | | | |
Capgemini SE | | | 4,800 | | | | (1,036,323 | ) | | | 6.7 | % |
| | | | | | | | | | | | |
| | | |
| Machinery | | | | | | | | | |
Deere & Co. | | | 2,000 | | | | (834,660 | ) | | | 5.4 | % |
Valmet Oyj | | | 21,200 | | | | (680,021 | ) | | | 4.4 | % |
Xylem, Inc./NY | | | 9,200 | | | | (1,242,276 | ) | | | 8.1 | % |
| | | | | | | | | | | | |
| | | |
| | | | | | | (2,756,957 | ) | | | | |
| | | |
| Metals & Mining | | | | | | | | | |
Newmont Corp. | | | 18,000 | | | | (962,100 | ) | | | 6.2 | % |
thyssenkrupp AG | | | 273,000 | | | | (1,057,704 | ) | | | 6.9 | % |
| | | | | | | | | | | | |
| | | |
| | | | | | | (2,019,804 | ) | | | | |
| | | |
| Oil, Gas & Consumable Fuels | | | | | | | | | |
APA Corp. | | | 69,100 | | | | (1,690,186 | ) | | | 11.0 | % |
Exxon Mobil Corp. | | | 16,700 | | | | (1,957,574 | ) | | | 12.7 | % |
| | | | | | | | | | | | |
| | | |
| | | | | | | (3,647,760 | ) | | | | |
| | | | | | | | | | | | |
| | | Shares | | | Value | | | % of
Basket
Value | |
| | | |
| Passenger Airlines | | | | | | | | | |
Deutsche Lufthansa AG, Registered Shares | | | 135,500 | | | $ | (992,455 | ) | | | 6.4 | % |
Southwest Airlines Co. | | | 38,700 | | | | (1,146,681 | ) | | | 7.5 | % |
| | | | | | | | | | | | |
| | | |
| | | | | | | (2,139,136 | ) | | | | |
| | | |
| Personal Care Products | | | | | | | | | |
Haleon PLC | | | 331,600 | | | | (1,735,097 | ) | | | 11.3 | % |
| | | | | | | | | | | | |
| | | |
Semiconductors & Semiconductor Equipment | | | | | | | | | | | | |
Enphase Energy, Inc. | | | 4,900 | | | | (553,798 | ) | | | 3.6 | % |
First Solar, Inc. | | | 3,700 | | | | (922,928 | ) | | | 6.0 | % |
SOITEC | | | 12,300 | | | | (1,231,953 | ) | | | 8.0 | % |
Teradyne, Inc. | | | 6,700 | | | | (897,331 | ) | | | 5.8 | % |
| | | | | | | | | | | | |
| | | |
| | | | | | | (3,606,010 | ) | | | | |
| | | |
| Software | | | | | | | | | |
Constellation Software, Inc./Canada | | | 500 | | | | (1,626,678 | ) | | | 10.6 | % |
PTC, Inc. | | | 6,900 | | | | (1,246,554 | ) | | | 8.1 | % |
SAP SE | | | 4,000 | | | | (914,930 | ) | | | 5.9 | % |
| | | | | | | | | | | | |
| | | |
| | | | | | | (3,788,162 | ) | | | | |
| | | |
| Specialty Retail | | | | | | | | | |
Tractor Supply Co. | | | 2,600 | | | | (756,418 | ) | | | 4.9 | % |
| | | | | | | | | | | | |
| | | |
Technology Hardware, Storage & Peripherals | | | | | | | | | | | | |
Super Micro Computer, Inc. | | | 1,300 | | | | (541,320 | ) | | | 3.5 | % |
| | | | | | | | | | | | |
| | | |
| Textiles, Apparel & Luxury Goods | | | | | | | | | |
Descente Ltd. | | | 15,500 | | | | (469,836 | ) | | | 3.1 | % |
Ralph Lauren Corp. | | | 4,600 | | | | (891,802 | ) | | | 5.8 | % |
Tapestry, Inc. | | | 36,100 | | | | (1,695,978 | ) | | | 11.0 | % |
| | | | | | | | | | | | |
| | | |
| | | | | | | (3,057,616 | ) | | | | |
| | | |
| Trading Companies & Distributors | | | | | | | | | |
Ashtead Group PLC | | | 14,200 | | | | (1,100,227 | ) | | | 7.1 | % |
Howden Joinery Group PLC | | | 82,200 | | | | (998,919 | ) | | | 6.5 | % |
WW Grainger, Inc. | | | 1,000 | | | | (1,038,810 | ) | | | 6.8 | % |
| | | | | | | | | | | | |
| | | |
| | | | | | | (3,137,956 | ) | | | | |
| | | |
Wireless Telecommunication Services | | | | | | | | | | | | |
Rogers Communications, Inc., Class B | | | 25,100 | | | | (1,009,234 | ) | | | 6.6 | % |
| | | | | | | | | | | | |
| | | |
Total Reference Entity — Short | | | | | | | (82,173,205) | | | | | |
| | | | | | | | | | | | |
| | | |
Net Value of Reference Entity — Citibank N.A | | | | | | $ | (15,382,222) | | | | | |
| | | | | | | | | | | | |
The following table represents the individual long and short positions and related values of equity securities underlying the total return swap with JPMorgan Chase Bank N.A., as of period end, termination dates February 10, 2025 to February 18, 2025:
| | | | | | | | | | | | |
| | | Shares | | | Value | | | % of
Basket
Value | |
| | | |
Reference Entity — Long | | | | | | | | | | | | |
| | | |
| Common Stocks | | | | | | | | | |
| | | |
| Automobile Components | | | | | | | | | |
Sumitomo Rubber Industries Ltd. | | | 84,400 | | | $ | 928,628 | | | | 14.5 | % |
| | | | | | | | | | | | |
| | | |
| Banks | | | | | | | | | |
Banc of California, Inc. | | | 1 | | | | 15 | | | | 0.0 | % |
CaixaBank SA | | | 143,900 | | | | 858,787 | | | | 13.4 | % |
| | |
C O N S O L I D A T E D S C H E D U L E S O F I N V E S T M E N T S | | 79 |
| | |
Consolidated Schedule of Investments (continued) September 30, 2024 | | BlackRock Total Return Fund |
| | | | | | | | | | | | |
| | | Shares | | | Value | | | % of
Basket
Value | |
| | | |
| Banks (continued) | | | | | | | | | |
Eagle Bancorp, Inc. | | | 17,230 | | | $ | 389,053 | | | | 6.1 | % |
Grupo Financiero Banorte SAB de CV, Class O | | | 203,400 | | | | 1,447,663 | | | | 22.6 | % |
NatWest Group PLC | | | 149,700 | | | | 693,015 | | | | 10.8 | % |
New York Community Bancorp, Inc. | | | 291,187 | | | | 3,270,037 | | | | 51.0 | % |
| | | | | | | | | | | | |
| | | |
| | | | | | | 6,658,570 | | | | | |
| | | |
| Beverages | | | | | | | | | |
Carlsberg AS, Class B | | | 13,500 | | | | 1,607,534 | | | | 25.1 | % |
Nongfu Spring Co. Ltd., Class H | | | 434,200 | | | | 1,870,126 | | | | 29.2 | % |
| | | | | | | | | | | | |
| | | |
| | | | | | | 3,477,660 | | | | | |
| | | |
| Biotechnology | | | | | | | | | |
Gilead Sciences, Inc. | | | 10,500 | | | | 880,320 | | | | 13.7 | % |
| | | | | | | | | | | | |
| | | |
| Capital Markets | | | | | | | | | |
B3 SA - Brasil Bolsa Balcao | | | 647,800 | | | | 1,277,121 | | | | 19.9 | % |
| | | | | | | | | | | | |
| | | |
| Chemicals | | | | | | | | | |
Evonik Industries AG | | | 137,200 | | | | 3,211,767 | | | | 50.2 | % |
Johnson Matthey PLC | | | 55,700 | | | | 1,135,896 | | | | 17.7 | % |
Mitsubishi Chemical Group Corp. | | | 215,400 | | | | 1,385,546 | | | | 21.6 | % |
Nippon Paint Holdings Co. Ltd. | | | 167,000 | | | | 1,271,860 | | | | 19.9 | % |
| | | | | | | | | | | | |
| | | |
| | | | | | | 7,005,069 | | | | | |
| | | |
| Construction & Engineering | | | | | | | | | |
COMSYS Holdings Corp. | | | 35,800 | | | | 781,528 | | | | 12.2 | % |
| | | | | | | | | | | | |
| | | |
| Consumer Finance | | | | | | | | | |
Samsung Card Co. Ltd. | | | 19,100 | | | | 600,607 | | | | 9.4 | % |
| | | | | | | | | | | | |
| | | |
Consumer Staples Distribution & Retail | | | | | | | | | | | | |
Carrefour SA | | | 42,200 | | | | 719,571 | | | | 11.2 | % |
Endeavour Group Ltd. | | | 162,100 | | | | 560,564 | | | | 8.8 | % |
Marks & Spencer Group PLC | | | 159,500 | | | | 795,978 | | | | 12.4 | % |
| | | | | | | | | | | | |
| | | |
| | | | | | | 2,076,113 | | | | | |
| | | |
Diversified Telecommunication Services | | | | | | | | | | | | |
Verizon Communications, Inc. | | | 22,100 | | | | 992,511 | | | | 15.5 | % |
| | | | | | | | | | | | |
| | | |
| Electrical Equipment | | | | | | | | | |
Vestas Wind Systems A/S | | | 41,300 | | | | 908,753 | | | | 14.2 | % |
| | | | | | | | | | | | |
| | | |
| Food Products | | | | | | | | | |
Toyo Suisan Kaisha Ltd. | | | 7,800 | | | | 512,109 | | | | 8.0 | % |
| | | | | | | | | | | | |
| | | |
| Health Care Providers & Services | | | | | | | | | |
Humana, Inc. | | | 3,400 | | | | 1,076,916 | | | | 16.8 | % |
Labcorp Holdings, Inc. | | | 4,800 | | | | 1,072,704 | | | | 16.8 | % |
Ship Healthcare Holdings, Inc. | | | 62,000 | | | | 1,013,093 | | | | 15.8 | % |
| | | | | | | | | | | | |
| | | |
| | | | | | | 3,162,713 | | | | | |
| | | |
| Household Products | | | | | | | | | |
Kimberly-Clark Corp. | | | 14,600 | | | | 2,077,288 | | | | 32.4 | % |
| | | | | | | | | | | | |
| | | |
| Insurance | | | | | | | | | |
AIA Group Ltd. | | | 168,800 | | | | 1,474,106 | | | | 23.0 | % |
Medibank Pvt Ltd. | | | 639,400 | | | | 1,613,177 | | | | 25.2 | % |
Power Corp. of Canada | | | 49,700 | | | | 1,567,675 | | | | 24.5 | % |
Steadfast Group Ltd. | | | 665,100 | | | | 2,603,371 | | | | 40.6 | % |
| | | | | | | | | | | | |
| | | |
| | | | | | | 7,258,329 | | | | | |
| | | |
| Interactive Media & Services | | | | | | | | | |
Tencent Holdings Ltd. | | | 13,300 | | | | 739,545 | | | | 11.5 | % |
| | | | | | | | | | | | |
| | | |
| Marine Transportation | | | | | | | | | |
Wan Hai Lines Ltd. | | | 317,000 | | | | 978,715 | | | | 15.3 | % |
| | | | | | | | | | | | |
| | | | | | | | | | | | |
| | | Shares | | | Value | | | % of
Basket
Value | |
| | | |
| Media | | | | | | | | | |
AMC Networks, Inc., Class A | | | 27,137 | | | $ | 235,821 | | | | 3.7 | % |
| | | | | | | | | | | | |
| | | |
| Metals & Mining | | | | | | | | | |
Bradespar SA, Preference Shares | | | 345,500 | | | | 1,286,183 | | | | 20.1 | % |
Franco-Nevada Corp. | | | 14,000 | | | | 1,738,859 | | | | 27.1 | % |
Rio Tinto Ltd. | | | 8,200 | | | | 725,253 | | | | 11.3 | % |
| | | | | | | | | | | | |
| | | |
| | | | | | | 3,750,295 | | | | | |
| | | |
| Pharmaceuticals | | | | | | | | | |
Astellas Pharma, Inc. | | | 45,500 | | | | 525,861 | | | | 8.2 | % |
Novo Nordisk A/S, Class B | | | 11,300 | | | | 1,340,310 | | | | 20.9 | % |
| | | | | | | | | | | | |
| | | |
| | | | | | | 1,866,171 | | | | | |
| | | |
| Professional Services | | | | | | | | | |
SGS SA, Registered Shares | | | 7,000 | | | | 781,630 | | | | 12.2 | % |
Wolters Kluwer NV | | | 8,200 | | | | 1,383,108 | | | | 21.6 | % |
| | | | | | | | | | | | |
| | | |
| | | | | | | 2,164,738 | | | | | |
| | | |
Real Estate Management & Development | | | | | | | | | | | | |
City Developments Ltd. | | | 476,600 | | | | 1,996,617 | | | | 31.2 | % |
Swiss Prime Site AG, Registered Shares | | | 5,600 | | | | 627,613 | | | | 9.8 | % |
UOL Group Ltd. | | | 326,700 | | | | 1,411,819 | | | | 22.0 | % |
| | | | | | | | | | | | |
| | | |
| | | | | | | 4,036,049 | | | | | |
| | | |
| Residential REITs | | | | | | | | | |
Equity Residential | | | 19,600 | | | | 1,459,416 | | | | 22.8 | % |
| | | | | | | | | | | | |
| | | |
Semiconductors & Semiconductor Equipment | | | | | | | | | | | | |
ASMedia Technology, Inc. | | | 13,000 | | | | 660,706 | | | | 10.3 | % |
MediaTek, Inc. | | | 19,000 | | | | 700,256 | | | | 10.9 | % |
Realtek Semiconductor Corp. | | | 67,000 | | | | 994,452 | | | | 15.5 | % |
Tokyo Electron Ltd. | | | 3,500 | | | | 624,175 | | | | 9.8 | % |
| | | | | | | | | | | | |
| | | |
| | | | | | | 2,979,589 | | | | | |
| | | |
| Software | | | | | | | | | |
Salesforce, Inc. | | | 4,400 | | | | 1,204,324 | | | | 18.8 | % |
| | | | | | | | | | | | |
| | | |
Technology Hardware, Storage & Peripherals | | | | | | | | | | | | |
NetApp, Inc. | | | 12,100 | | | | 1,494,471 | | | | 23.3 | % |
Seagate Technology Holdings PLC | | | 5,300 | | | | 580,509 | | | | 9.1 | % |
| | | | | | | | | | | | |
| | | |
| | | | | | | 2,074,980 | | | | | |
| | | |
| Tobacco | | | | | | | | | |
Altria Group, Inc. | | | 34,800 | | | | 1,776,192 | | | | 27.7 | % |
British American Tobacco PLC | | | 28,000 | | | | 1,020,826 | | | | 16.0 | % |
| | | | | | | | | | | | |
| | | |
| | | | | | | 2,797,018 | | | | | |
| | | | | | | | | | | | |
| | | |
Total Reference Entity — Long | | | | | | | 62,883,980 | | | | | |
| | | | | | | | | | | | |
| | | |
Reference Entity — Short | | | | | | | | | | | | |
| | | |
| Common Stocks | | | | | | | | | |
| | | |
| Banks | | | | | | | | | |
Atlantic Union Bankshares Corp. | | | 7,830 | | | | (294,956 | ) | | | (4.6 | )% |
Community Bank System, Inc. | | | 6,998 | | | | (406,374 | ) | | | (6.3 | )% |
CVB Financial Corp. | | | 18,856 | | | | (336,014 | ) | | | (5.2 | )% |
First Financial Holding Co. Ltd. | | | 1,159,449 | | | | (1,003,335 | ) | | | (15.7 | )% |
Hua Nan Financial Holdings Co. Ltd. | | | 1,418,620 | | | | (1,151,018 | ) | | | (18.0 | )% |
Independent Bank Group, Inc. | | | 8,987 | | | | (518,190 | ) | | | (8.1 | )% |
Provident Financial Services, Inc. | | | 26,255 | | | | (487,293 | ) | | | (7.6 | )% |
ServisFirst Bancshares, Inc. | | | 6,398 | | | | (514,719 | ) | | | (8.0 | )% |
| | | | | | | | | | | | |
| | | |
| | | | | | | (4,711,899 | ) | | | | |
| | |
| 80 | | 2 0 2 4 B L A C K R O C K A N N U A L F I N A N C I A L S T A T E M E N T S A N D A D D I T I O N A L I N F O R M A T I O N |
| | |
Consolidated Schedule of Investments (continued) September 30, 2024 | | BlackRock Total Return Fund |
| | | | | | | | | | | | |
| | | Shares | | | Value | | | % of
Basket
Value | |
| | | |
| Beverages | | | | | | | | | |
Treasury Wine Estates Ltd. | | | 151,700 | | | $ | (1,252,352 | ) | | | (19.5 | )% |
| | | | | | | | | | | | |
| | | |
| Capital Markets | | | | | | | | | |
Perpetual Ltd. | | | 66,900 | | | | (857,385 | ) | | | (13.4 | )% |
| | | | | | | | | | | | |
| | | |
| Chemicals | | | | | | | | | |
Formosa Plastics Corp. | | | 984,605 | | | | (1,659,729 | ) | | | (25.9 | )% |
Nan Ya Plastics Corp. | | | 677,805 | | | | (982,559 | ) | | | (15.3 | )% |
Orica Ltd. | | | 110,300 | | | | (1,408,967 | ) | | | (22.0 | )% |
| | | | | | | | | | | | |
| | | |
| | | | | | | (4,051,255 | ) | | | | |
| | | |
Consumer Staples Distribution & Retail | | | | | | | | | | | | |
Atacadao SA | | | 188,300 | | | | (320,072 | ) | | | (5.0 | )% |
| | | | | | | | | | | | |
| | | |
| Diversified REITs | | | | | | | | | |
Growthpoint Properties Ltd. | | | 1,174,200 | | | | (953,496 | ) | | | (14.9 | )% |
| | | | | | | | | | | | |
| | | |
Diversified Telecommunication Services | | | | | | | | | | | | |
Telecom Italia SpA | | | 2,395,100 | | | | (665,910 | ) | | | (10.4 | )% |
| | | | | | | | | | | | |
| | | |
| Electrical Equipment | | | | | | | | | |
WEG SA | | | 108,400 | | | | (1,086,845 | ) | | | (17.0 | )% |
| | | | | | | | | | | | |
| | | |
Electronic Equipment, Instruments & Components | | | | | | | | | | | | |
Innolux Corp. | | | 10,000 | | | | (5,089 | ) | | | (0.1 | )% |
| | | | | | | | | | | | |
| | | |
| Health Care Technology | | | | | | | | | |
Pro Medicus Ltd. | | | 7,600 | | | | (935,443 | ) | | | (14.6 | )% |
| | | | | | | | | | | | |
| | | |
| Insurance | | | | | | | | | |
KGI Financial Holding Co. Ltd. | | | 832,000 | | | | (433,264 | ) | | | (6.7 | )% |
| | | | | | | | | | | | |
| | | |
| Interactive Media & Services | | | | | | | | | |
CAR Group Ltd. | | | 42,200 | | | | (1,091,562 | ) | | | (17.1 | )% |
SEEK Ltd. | | | 139,700 | | | | (2,391,408 | ) | | | (37.3 | )% |
| | | | | | | | | | | | |
| | | | | | | (3,482,970 | ) | | | | |
| | | |
| Machinery | | | | | | | | | |
Alstom SA | | | 64,800 | | | | (1,346,339 | ) | | | (21.0 | )% |
Seatrium Ltd. | | | 46,330 | | | | (64,177 | ) | | | (1.0 | )% |
| | | | | | | | | | | | |
| | | | | | | (1,410,516 | ) | | | | |
| | | |
| Media | | | | | | | | | |
MultiChoice Group | | | 66,700 | | | | (420,796 | ) | | | (6.6 | )% |
| | | | | | | | | | | | |
| | | |
| Metals & Mining | | | | | | | | | |
BlueScope Steel Ltd. | | | 78,300 | | | | (1,195,243 | ) | | | (18.6 | )% |
China Steel Corp. | | | 96,353 | | | | (70,272 | ) | | | (1.1 | )% |
Impala Platinum Holdings Ltd. | | | 146,500 | | | | (821,093 | ) | | | (12.8 | )% |
Lynas Rare Earths Ltd. | | | 336,100 | | | | (1,844,025 | ) | | | (28.8 | )% |
Mineral Resources Ltd. | | | 54,200 | | | | (1,932,422 | ) | | | (30.2 | )% |
Northam Platinum Holdings Ltd. | | | 100,100 | | | | (631,741 | ) | | | (9.9 | )% |
| | | | | | | | | | | | |
| | | | | | | (6,494,796 | ) | | | | |
| | | |
| Office REITs | | | | | | | | | |
Dexus | | | 441,200 | | | | (2,302,036 | ) | | | (35.9 | )% |
| | | | | | | | | | | | |
| | | |
| Oil, Gas & Consumable Fuels | | | | | | | | | |
Orlen SA | | | 130,500 | | | | (1,894,189 | ) | | | (29.6 | )% |
| | | | | | | | | | | | |
| | | |
Semiconductors & Semiconductor Equipment | | | | | | | | | | | | |
Shinko Electric Industries Co. Ltd. | | | 16,400 | | | | (627,198 | ) | | | (9.8 | )% |
| | | | | | | | | | | | |
| | | |
| Software | | | | | | | | | |
WiseTech Global Ltd. | | | 17,300 | | | | (1,638,248 | ) | | | (25.6 | )% |
| | | | | | | | | | | | |
| | | | | | | | | | | | |
| | | Shares | | | Value | | | % of
Basket
Value | |
| | | |
| Textiles, Apparel & Luxury Goods | | | | | | | | | |
Pou Chen Corp. | | | 162,000 | | | $ | (184,293 | ) | | | (2.9 | )% |
| | | | | | | | | | | | |
| | | |
| Trading Companies & Distributors | | | | | | | | | |
Seven Group Holdings Ltd. | | | 25,900 | | | | (764,891 | ) | | | (11.9 | )% |
| | | | | | | | | | | | |
| | | |
| Water Utilities | | | | | | | | | |
Cia de Saneamento Basico do Estado de Sao Paulo SABESP | | | 27,900 | | | | (462,260 | ) | | | (7.2 | )% |
| | | | | | | | | | | | |
| | | |
| Investment Companies | | | | | | | | | |
| | | |
| Fixed-Income Funds | | | | | | | | | |
iShares iBoxx $ Investment Grade Corporate Bond ETF | | | 114,463 | | | | (12,932,030 | ) | | | (201.9 | )% |
Vanguard Intermediate-Term Corporate Bond ETF | | | 102,576 | | | | (8,590,740 | ) | | | (134.1 | )% |
| | | | | | | | | | | | |
| | | |
| | | | | | | (21,522,770 | ) | | | | |
| | | | | | | | | | | | |
| | | |
Total Reference Entity — Short | | | | | | | (56,477,973 | ) | | | | |
| | | | | | | | | | | | |
| | | |
Net Value of Reference Entity — JPMorgan Chase Bank N.A | | | | | | $ | 6,406,007 | | | | | |
| | | | | | | | | | | | |
The following table represents the individual long and short positions and related values of equity securities underlying the total return swap with Merrill Lynch International, as of period end, termination dates February 15, 2028 to March 15, 2028:
| | | | | | | | | | | | |
| | | Shares | | | Value | | | % of
Basket
Value | |
| | | |
Reference Entity — Long | | | | | | | | | | | | |
| | | |
Common Stocks | | | | | | | | | | | | |
| | | |
| Aerospace & Defense | | | | | | | | | |
Huntington Ingalls Industries, Inc. | | | 2,700 | | | $ | 713,826 | | | | (6.6 | )% |
| | | | | | | | | | | | |
| | | |
| Automobiles | | | | | | | | | |
Geely Automobile Holdings Ltd. | | | 962,000 | | | | 1,475,707 | | | | (13.7 | )% |
Great Wall Motor Co. Ltd., Class H | | | 791,500 | | | | 1,453,721 | | | | (13.5 | )% |
| | | | | | | | | | | | |
| | | |
| | | | | | | 2,929,428 | | | | | |
| | | |
| Banks | | | | | | | | | |
Banco Bilbao Vizcaya Argentaria SA | | | 93,400 | | | | 1,008,932 | | | | (9.4 | )% |
Banco do Brasil SA | | | 131,300 | | | | 657,500 | | | | (6.1 | )% |
Bankinter SA | | | 147,100 | | | | 1,298,590 | | | | (12.0 | )% |
BNK Financial Group, Inc. | | | 77,800 | | | | 536,513 | | | | (5.0 | )% |
Kyushu Financial Group, Inc. | | | 142,400 | | | | 697,976 | | | | (6.5 | )% |
Mediobanca Banca di Credito Finanziario SpA | | | 86,700 | | | | 1,481,390 | | | | (13.7 | )% |
Nedbank Group Ltd. | | | 56,200 | | | | 970,668 | | | | (9.0 | )% |
| | | | | | | | | | | | |
| | | |
| | | | | | | 6,651,569 | | | | | |
| | | |
| Beverages | | | | | | | | | |
Budweiser Brewing Co. APAC Ltd. | | | 725,000 | | | | 956,726 | | | | (8.9 | )% |
| | | | | | | | | | | | |
| | | |
| Biotechnology | | | | | | | | | |
Amgen, Inc. | | | 2,000 | | | | 644,420 | | | | (6.0 | )% |
BeiGene Ltd. | | | 62,600 | | | | 1,100,211 | | | | (10.2 | )% |
| | | | | | | | | | | | |
| | | |
| | | | | | | 1,744,631 | | | | | |
| | |
C O N S O L I D A T E D S C H E D U L E S O F I N V E S T M E N T S | | 81 |
| | |
Consolidated Schedule of Investments (continued) September 30, 2024 | | BlackRock Total Return Fund |
| | | | | | | | | | | | |
| | | Shares | | | Value | | | % of
Basket
Value | |
| | | |
| Broadline Retail | | | | | | | | | |
Magazine Luiza SA | | | 263,600 | | | $ | 467,422 | | | | (4.3 | )% |
| | | | | | | | | | | | |
| | | |
| Building Products | | | | | | | | | |
Belimo Holding AG, Registered Shares | | | 1,700 | | | | 1,213,647 | | | | (11.3 | )% |
| | | | | | | | | | | | |
| | | |
| Capital Markets | | | | | | | | | |
CITIC Securities Co. Ltd., Class H | | | 511,500 | | | | 1,331,063 | | | | (12.4 | )% |
Magellan Financial Group Ltd. | | | 124,000 | | | | 855,399 | | | | (7.9 | )% |
| | | | | | | | | | | | |
| | | |
| | | | | | | 2,186,462 | | | | | |
| | | |
| Construction & Engineering | | | | | | | | | |
Eiffage SA | | | 10,100 | | | | 975,313 | | | | (9.0 | )% |
Worley Ltd. | | | 69,400 | | | | 707,269 | | | | (6.6 | )% |
| | | | | | | | | | | | |
| | | |
| | | | | | | 1,682,582 | | | | | |
| | | |
| Construction Materials | | | | | | | | | |
Cemex SAB de CV | | | 1,806,400 | | | | 1,105,491 | | | | (10.3 | )% |
| | | | | | | | | | | | |
| | | |
| Consumer Finance | | | | | | | | | |
Credit Saison Co. Ltd. | | | 22,500 | | | | 564,613 | | | | (5.2 | )% |
Synchrony Financial | | | 23,000 | | | | 1,147,240 | | | | (10.7 | )% |
| | | | | | | | | | | | |
| | | |
| | | | | | | 1,711,853 | | | | | |
| | | |
Consumer Staples Distribution & Retail | | | | | | | | | | | | |
Alimentation Couche-Tard, Inc. | | | 19,000 | | | | 1,050,412 | | | | (9.7 | )% |
Coles Group Ltd. | | | 118,200 | | | | 1,473,541 | | | | (13.7 | )% |
J Sainsbury PLC | | | 212,800 | | | | 842,123 | | | | (7.8 | )% |
Metcash Ltd. | | | 382,100 | | | | 944,529 | | | | (8.8 | )% |
Wal-Mart de Mexico SAB de CV | | | 303,400 | | | | 915,439 | | | | (8.5 | )% |
Woolworths Group Ltd. | | | 47,300 | | | | 1,086,919 | | | | (10.1 | )% |
| | | | | | | | | | | | |
| | | |
| | | | | | | 6,312,963 | | | | | |
| | | |
Diversified Telecommunication Services | | | | | | | | | | | | |
Koninklijke KPN NV | | | 432,700 | | | | 1,767,270 | | | | (16.4 | )% |
| | | | | | | | | | | | |
| | | |
| Electric Utilities | | | | | | | | | |
Cia Energetica de Minas Gerais, Preference Shares | | | 371,690 | | | | 781,220 | | | | (7.2 | )% |
Neoenergia SA | | | 354,700 | | | | 1,281,366 | | | | (11.9 | )% |
Transmissora Alianca de Energia Eletrica S/A | | | 168,700 | | | | 1,062,794 | | | | (9.9 | )% |
| | | | | | | | | | | | |
| | | |
| | | | | | | 3,125,380 | | | | | |
| | | |
Electronic Equipment, Instruments & Components | | | | | | | | | | | | |
Amphenol Corp., Class A | | | 11,300 | | | | 736,308 | | | | (6.8 | )% |
Genius Electronic Optical Co. Ltd. | | | 71,000 | | | | 1,085,392 | | | | (10.1 | )% |
| | | | | | | | | | | | |
| | | |
| | | | | | | 1,821,700 | | | | | |
| | | |
Entertainment | | | | | | | | | | | | |
NetEase, Inc. | | | 41,000 | | | | 765,869 | | | | (7.1 | )% |
| | | | | | | | | | | | |
| | | |
| Financial Services | | | | | | | | | |
Block, Inc. | | | 12,200 | | | | 818,986 | | | | (7.6 | )% |
| | | | | | | | | | | | |
| | | |
| Food Products | | | | | | | | | |
Morinaga & Co. Ltd. | | | 79,800 | | | | 1,598,482 | | | | (14.8 | )% |
Morinaga Milk Industry Co. Ltd. | | | 32,300 | | | | 789,167 | | | | (7.3 | )% |
SLC Agricola SA | | | 176,100 | | | | 590,588 | | | | (5.5 | )% |
| | | | | | | | | | | | |
| | | |
| | | | | | | 2,978,237 | | | | | |
| | | |
| Health Care Providers & Services | | | | | | | | | |
Alfresa Holdings Corp. | | | 66,100 | | | | 1,045,569 | | | | (9.7 | )% |
| | | | | | | | | | | | |
| | | |
| Hotels, Restaurants & Leisure | | | | | | | | | |
Evolution AB | | | 8,100 | | | | 796,660 | | | | (7.4 | )% |
Haidilao International Holding Ltd. | | | 606,000 | | | | 1,450,309 | | | | (13.4 | )% |
| | | | | | | | | | | | |
| | | Shares | | | Value | | | % of
Basket
Value | |
| | | |
Hotels, Restaurants & Leisure (continued) | | | | | | | | | | | | |
MGM China Holdings Ltd. | | | 479,200 | | | $ | 755,089 | | | | (7.0 | )% |
Royal Caribbean Cruises Ltd. | | | 3,400 | | | | 603,024 | | | | (5.6 | )% |
| | | | | | | | | | | | |
| | | |
| | | | | | | 3,605,082 | | | | | |
| | | |
| Household Durables | | | | | | | | | |
Panasonic Holdings Corp. | | | 88,900 | | | | 780,965 | | | | (7.2 | )% |
| | | | | | | | | | | | |
| | | |
Independent Power and Renewable Electricity Producers | | | | | | | | | | | | |
RWE AG | | | 39,300 | | | | 1,431,810 | | | | (13.3 | )% |
| | | | | | | | | | | | |
| | | |
| Industrial Conglomerates | | | | | | | | | |
Hitachi Ltd. | | | 30,900 | | | | 819,386 | | | | (7.6 | )% |
Honeywell International, Inc. | | | 10,600 | | | | 2,191,126 | | | | (20.3 | )% |
| | | | | | | | | | | | |
| | | |
| | | | | | | 3,010,512 | | | | | |
| | | |
| Insurance | | | | | | | | | |
Admiral Group PLC | | | 20,400 | | | | 760,410 | | | | (7.0 | )% |
Mapfre SA | | | 265,600 | | | | 707,320 | | | | (6.6 | )% |
Powszechny Zaklad Ubezpieczen SA | | | 88,400 | | | | 966,388 | | | | (9.0 | )% |
Sompo Holdings, Inc. | | | 57,000 | | | | 1,284,826 | | | | (11.9 | )% |
| | | | | | | | | | | | |
| | | |
| | | | | | | 3,718,944 | | | | | |
| | | |
| Interactive Media & Services | | | | | | | | | |
Kuaishou Technology | | | 107,800 | | | | 740,723 | | | | (6.9 | )% |
| | | | | | | | | | | | |
| | | |
| IT Services | | | | | | | | | |
Snowflake, Inc., Class A | | | 8,300 | | | | 953,338 | | | | (8.8 | )% |
| | | | | | | | | | | | |
| | | |
| Machinery | | | | | | | | | |
Weichai Power Co. Ltd., Class H | | | 1,015,000 | | | | 1,855,156 | | | | (17.2 | )% |
| | | | | | | | | | | | |
| | | |
| Marine Transportation | | | | | | | | | |
Evergreen Marine Corp. Taiwan Ltd. | | | 148,000 | | | | 940,589 | | | | (8.7 | )% |
Orient Overseas International Ltd. | | | 32,000 | | | | 450,342 | | | | (4.2 | )% |
U-Ming Marine Transport Corp. | | | 484,000 | | | | 853,273 | | | | (7.9 | )% |
| | | | | | | | | | | | |
| | | |
| | | | | | | 2,244,204 | | | | | |
| | | |
| Metals & Mining | | | | | | | | | |
Barrick Gold Corp. | | | 41,800 | | | | 831,395 | | | | (7.7 | )% |
Gerdau SA, Preference Shares | | | 269,200 | | | | 945,810 | | | | (8.8 | )% |
Gold Fields Ltd. | | | 31,000 | | | | 480,744 | | | | (4.4 | )% |
| | | | | | | | | | | | |
| | | |
| | | | | | | 2,257,949 | | | | | |
| | | |
| Oil, Gas & Consumable Fuels | | | | | | | | | |
Ultrapar Participacoes SA | | | 313,100 | | | | 1,223,042 | | | | (11.3 | )% |
| | | | | | | | | | | | |
| | | |
| Passenger Airlines | | | | | | | | | |
China Airlines Ltd. | | | 973,000 | | | | 660,205 | | | | (6.1 | )% |
| | | | | | | | | | | | |
| | | |
| Pharmaceuticals | | | | | | | | | |
Bristol-Myers Squibb Co. | | | 25,700 | | | | 1,329,718 | | | | (12.3 | )% |
CSPC Pharmaceutical Group Ltd. | | | 1,246,000 | | | | 954,207 | | | | (8.9 | )% |
Daiichi Sankyo Co. Ltd. | | | 33,400 | | | | 1,103,281 | | | | (10.2 | )% |
| | | | | | | | | | | | |
| | | |
| | | | | | | 3,387,206 | | | | | |
| | | |
| Professional Services | | | | | | | | | |
ALS Ltd. | | | 64,200 | | | | 636,446 | | | | (5.9 | )% |
| | | | | | | | | | | | |
| | | |
Real Estate Management & Development | | | | | | | | | | | | |
New World Development Co. Ltd. | | | 649,000 | | | | 794,883 | | | | (7.4 | )% |
| | | | | | | | | | | | |
| | | |
| Residential REITs | | | | | | | | | |
UNITE Group PLC (The) | | | 120,200 | | | | 1,513,819 | | | | (14.0 | )% |
| | | | | | | | | | | | |
| | |
| 82 | | 2 0 2 4 B L A C K R O C K A N N U A L F I N A N C I A L S T A T E M E N T S A N D A D D I T I O N A L I N F O R M A T I O N |
| | |
Consolidated Schedule of Investments (continued) September 30, 2024 | | BlackRock Global Long/Short Equity Fund (Percentages shown are based on Net Assets) |
| | | | | | | | | | | | |
| | | Shares | | | Value | | | % of
Basket
Value | |
| | | |
Semiconductors & Semiconductor Equipment | | | | | | | | | | | | |
eMemory Technology, Inc. | | | 7,000 | | | $ | 576,126 | | | | (5.4 | )% |
Global Unichip Corp. | | | 17,000 | | | | 583,579 | | | | (5.4 | )% |
| | | | | | | | | | | | |
| | | |
| | | | | | | 1,159,705 | | | | | |
| | | |
| Software | | | | | | | | | |
Adobe, Inc. | | | 2,400 | | | | 1,242,672 | | | | (11.6 | )% |
Rakus Co. Ltd. | | | 30,600 | | | | 476,619 | | | | (4.4 | )% |
Trend Micro, Inc./Japan | | | 9,800 | | | | 581,878 | | | | (5.4 | )% |
| | | | | | | | | | | | |
| | | |
| | | | | | | 2,301,169 | | | | | |
| | | |
| Specialty Retail | | | | | | | | | |
JB Hi-Fi Ltd. | | | 9,200 | | | | 506,338 | | | | (4.7 | )% |
| | | | | | | | | | | | |
| | | |
Technology Hardware, Storage & Peripherals | | | | | | | | | | | | |
Acer, Inc. | | | 431,000 | | | | 554,753 | | | | (5.2 | )% |
Chicony Electronics Co. Ltd. | | | 152,000 | | | | 783,719 | | | | (7.3 | )% |
Compal Electronics, Inc. | | | 751,000 | | | | 788,061 | | | | (7.3 | )% |
Lenovo Group Ltd. | | | 436,000 | | | | 584,474 | | | | (5.4 | )% |
Quanta Computer, Inc. | | | 117,000 | | | | 975,105 | | | | (9.0 | )% |
Xiaomi Corp., Class B | | | 216,000 | | | | 608,406 | | | | (5.6 | )% |
| | | | | | | | | | | | |
| | | |
| | | | | | | 4,294,518 | | | | | |
| | | |
| Textiles, Apparel & Luxury Goods | | | | | | | | | |
Alpargatas SA, Preference Shares | | | 478,900 | | | | 613,603 | | | | (5.7 | )% |
ANTA Sports Products Ltd. | | | 53,400 | | | | 632,141 | | | | (5.9 | )% |
Yue Yuen Industrial Holdings Ltd. | | | 325,000 | | | | 616,135 | | | | (5.7 | )% |
| | | | | | | | | | | | |
| | | |
| | | | | | | 1,861,879 | | | | | |
| | | |
| Transportation Infrastructure | | | | | | | | | |
Transurban Group | | | 172,700 | | | | 1,560,359 | | | | (14.5 | )% |
| | | | | | | | | | | | |
| | | |
| Total Reference Entity — Long | | | | | 80,497,863 | | | | |
| | | |
Reference Entity — Short | | | | | | | | | | | | |
| | | |
| Common Stocks | | | | | | | | | |
| | | |
| Air Freight & Logistics | | | | | | | | | |
DSV A/S | | | 5,100 | | | | (1,049,631 | ) | | | 9.7 | % |
| | | | | | | | | | | | |
| | | |
| Automobiles | | | | | | | | | |
Guangzhou Automobile Group Co. Ltd., Class H | | | 3,072,000 | | | | (1,195,830 | ) | | | 11.1 | % |
| | | | | | | | | | | | |
| | | |
| Banks | | | | | | | | | |
Bank of China Ltd., Class H | | | 3,099,000 | | | | (1,447,232 | ) | | | 13.4 | % |
Bank of Communications Co. Ltd., Class H | | | 1,958,000 | | | | (1,489,292 | ) | | | 13.8 | % |
China Everbright Bank Co. Ltd., Class H | | | 4,449,000 | | | | (1,505,248 | ) | | | 14.0 | % |
Hang Seng Bank Ltd. | | | 88,400 | | | | (1,099,888 | ) | | | 10.2 | % |
Postal Savings Bank of China Co. Ltd., Class H | | | 2,258,000 | | | | (1,334,546 | ) | | | 12.4 | % |
Royal Bank of Canada | | | 10,500 | | | | (1,310,510 | ) | | | 12.1 | % |
| | | | | | | | | | | | |
| | | |
| | | | | | | (8,186,716 | ) | | | | |
| | | |
| Beverages | | | | | | | | | |
Remy Cointreau SA | | | 12,300 | | | | (958,155 | ) | | | 8.9 | % |
Sapporo Holdings Ltd. | | | 13,400 | | | | (739,366 | ) | | | 6.9 | % |
| | | | | | | | | | | | |
| | | |
| | | | | | | (1,697,521 | ) | | | | |
| | | |
| Biotechnology | | | | | | | | | |
Grifols SA | | | 88,900 | | | | (1,010,333 | ) | | | 9.4 | % |
| | | | | | | | | | | | |
| | | |
| Broadline Retail | | | | | | | | | |
Rakuten Group, Inc. | | | 198,000 | | | | (1,277,577 | ) | | | 11.9 | % |
| | | | | | | | | | | | |
| | | | | | | | | | | | |
| | | Shares | | | Value | | | % of
Basket
Value | |
| | | |
| Building Products | | | | | | | | | |
Xinyi Glass Holdings Ltd. | | | 753,526 | | | $ | (883,030 | ) | | | 8.2 | % |
| | | | | | | | | | | | |
| | | |
| Chemicals | | | | | | | | | |
Clariant AG, Registered Shares | | | 92,800 | | | | (1,406,486 | ) | | | 13.0 | % |
FMC Corp. | | | 9,300 | | | | (613,242 | ) | | | 5.7 | % |
Novonesis (Novozymes), Class B | | | 16,100 | | | | (1,159,127 | ) | | | 10.8 | % |
| | | | | | | | | | | | |
| | | |
| | | | | | | (3,178,855 | ) | | | | |
| | | |
| Construction Materials | | | | | | | | | |
Anhui Conch Cement Co. Ltd., Class H | | | 596,000 | | | | (1,737,904 | ) | | | 16.1 | % |
| | | | | | | | | | | | |
| | | |
| Consumer Staples Distribution & Retail | | | | | | | | | |
Atacadao SA | | | 89,000 | | | | (151,282 | ) | | | 1.4 | % |
Kobe Bussan Co. Ltd. | | | 6,600 | | | | (205,843 | ) | | | 1.9 | % |
Sendas Distribuidora S/A | | | 275,600 | | | | (379,932 | ) | | | 3.5 | % |
Seven & i Holdings Co. Ltd. | | | 76,200 | | | | (1,147,393 | ) | | | 10.7 | % |
| | | | | | | | | | | | |
| | | |
| | | | | | | (1,884,450 | ) | | | | |
| | | |
Diversified Telecommunication Services | | | | | | | | | | | | |
Telecom Italia SpA/Milano | | | 807,700 | | | | (224,565 | ) | | | 2.1 | % |
Telefonica SA | | | 274,400 | | | | (1,342,389 | ) | | | 12.4 | % |
| | | | | | | | | | | | |
| | | |
| | | | | | | (1,566,954 | ) | | | | |
| | | |
| Electric Utilities | | | | | | | | | |
Centrais Eletricas Brasileiras SA | | | 134,800 | | | | (972,454 | ) | | | 9.0 | % |
| | | | | | | | | | | | |
| | | |
Electronic Equipment, Instruments & Components | | | | | | | | | | | | |
Anritsu Corp. | | | 17,900 | | | | (136,413 | ) | | | 1.3 | % |
CDW Corp. | | | 4,500 | | | | (1,018,350 | ) | | | 9.4 | % |
| | | | | | | | | | | | |
| | | |
| | | | | | | (1,154,763 | ) | | | | |
| | | |
| Entertainment | | | | | | | | | |
Bollore SE | | | 136,500 | | | | (911,152 | ) | | | 8.5 | % |
| | | | | | | | | | | | |
| | | |
| Food Products | | | | | | | | | |
Grupo Bimbo SAB de CV | | | 198,100 | | | | (681,226 | ) | | | 6.3 | % |
Lamb Weston Holdings, Inc. | | | 19,400 | | | | (1,255,956 | ) | | | 11.7 | % |
Saputo, Inc. | | | 63,100 | | | | (1,361,891 | ) | | | 12.6 | % |
| | | | | | | | | | | | |
| | | |
| | | | | | | (3,299,073 | ) | | | | |
| | | |
| Ground Transportation | | | | | | | | | |
Canadian Pacific Kansas City Ltd. | | | 22,200 | | | | (1,898,683 | ) | | | 17.6 | % |
Localiza Rent a Car SA | | | 230,036 | | | | (1,741,832 | ) | | | 16.2 | % |
Norfolk Southern Corp. | | | 7,000 | | | | (1,739,500 | ) | | | 16.1 | % |
| | | | | | | | | | | | |
| | | |
| | | | | | | (5,380,015 | ) | | | | |
| | | |
| Health Care Equipment & Supplies | | | | | | | | | |
Coloplast A/S, Class B | | | 15,000 | | | | (1,955,183 | ) | | | 18.1 | % |
| | | | | | | | | | | | |
| | | |
| Health Care Providers & Services | | | | | | | | | |
Shanghai Pharmaceuticals Holding Co. Ltd., Class H | | | 639,200 | | | | (1,035,671 | ) | | | 9.6 | % |
| | | | | | | | | | | | |
| | | |
| Hotel & Resort REITs | | | | | | | | | |
Invincible Investment Corp. | | | 700 | | | | (303,168 | ) | | | 2.8 | % |
| | | | | | | | | | | | |
| | | |
| Hotels, Restaurants & Leisure | | | | | | | | | |
Entain PLC | | | 95,000 | | | | (970,629 | ) | | | 9.0 | % |
| | | | | | | | | | | | |
| | | |
| Household Durables | | | | | | | | | |
Sharp Corp./Japan | | | 82,300 | | | | (547,348 | ) | | | 5.1 | % |
| | | | | | | | | | | | |
| | | |
Independent Power and Renewable Electricity Producers | | | | | | | | | | | | |
China Resources Power Holdings Co. Ltd. | | | 384,000 | | | | (1,035,175 | ) | | | 9.6 | % |
| | | | | | | | | | | | |
| | |
C O N S O L I D A T E D S C H E D U L E S O F I N V E S T M E N T S | | 83 |
| | |
Consolidated Schedule of Investments (continued) September 30, 2024 | | BlackRock Total Return Fund |
| | | | | | | | | | | | |
| | | Shares | | | Value | | | % of
Basket
Value | |
| | | |
| Industrial Conglomerates | | | | | | | | | |
Alfa SAB de CV, Class A | | | 2,385,700 | | | $ | (1,955,571 | ) | | | 18.1 | % |
Grupo Carso SAB de CV | | | 215,100 | | | | (1,327,743 | ) | | | 12.3 | % |
Jardine Cycle & Carriage Ltd. | | | 30,400 | | | | (652,162 | ) | | | 6.1 | % |
| | | | | | | | | | | | |
| | | |
| | | | | | | (3,935,476 | ) | | | | |
| | | |
| Insurance | | | | | | | | | |
Baloise Holding AG | | | 4,500 | | | | (920,222 | ) | | | 8.5 | % |
China Life Insurance Co. Ltd., Class H | | | 403,000 | | | | (793,705 | ) | | | 7.4 | % |
Everest Group Ltd. | | | 1,800 | | | | (705,294 | ) | | | 6.5 | % |
PICC Property & Casualty Co. Ltd., Class H | | | 734,000 | | | | (1,086,516 | ) | | | 10.1 | % |
| | | | | | | | | | | | |
| | | |
| | | | | | | (3,505,737 | ) | | | | |
| | | |
| Life Sciences Tools & Services | | | | | | | | | |
Bachem Holding AG | | | 7,000 | | | | (590,110 | ) | | | 5.5 | % |
Revvity, Inc. | | | 6,200 | | | | (792,050 | ) | | | 7.3 | % |
| | | | | | | | | | | | |
| | | |
| | | | | | | (1,382,160 | ) | | | | |
| | | |
| Machinery | | | | | | | | | |
CRRC Corp. Ltd., Class H | | | 1,067,000 | | | | (694,487 | ) | | | 6.4 | % |
| | | | | | | | | | | | |
| | | |
| Media | | | | | | | | | |
Charter Communications, Inc., Class A | | | 4,100 | | | | (1,328,728 | ) | | | 12.3 | % |
| | | | | | | | | | | | |
| | | |
| Metals & Mining | | | | | | | | | |
Zijin Mining Group Co. Ltd., Class H | | | 378,000 | | | | (843,941 | ) | | | 7.8 | % |
| | | | | | | | | | | | |
| | | |
| Oil, Gas & Consumable Fuels | | | | | | | | | |
Cosan SA | | | 820,500 | | | | (1,973,044 | ) | | | 18.3 | % |
PRIO SA/Brazil | | | 95,500 | | | | (760,992 | ) | | | 7.1 | % |
| | | | | | | | | | | | |
| | | |
| | | | | | | (2,734,036 | ) | | | | |
| | | |
| Personal Care Products | | | | | | | | | |
Kobayashi Pharmaceutical Co. Ltd. | | | 13,800 | | | | (548,857 | ) | | | 5.1 | % |
| | | | | | | | | | | | |
| | | |
| Pharmaceuticals | | | | | | | | | |
Hypera SA | | | 142,000 | | | | (685,537 | ) | | | 6.3 | % |
UCB SA | | | 4,700 | | | | (848,430 | ) | | | 7.9 | % |
| | | | | | | | | | | | |
| | | |
| | | | | | | (1,533,967 | ) | | | | |
| | | |
| Professional Services | | | | | | | | | |
Teleperformance SE | | | 6,600 | | | | (682,773 | ) | | | 6.3 | % |
| | | | | | | | | | | | |
| | | |
Real Estate Management & Development | | | | | | | | | | | | |
Henderson Land Development Co. Ltd. | | | 189,000 | | | | (598,515 | ) | | | 5.6 | % |
| | | | | | | | | | | | |
| | | Shares | | | Value | | | % of
Basket
Value | |
| | | |
Real Estate Management & Development (continued) | | | | | | | | | | | | |
Relo Group, Inc. | | | 2,300 | | | $ | (30,236 | ) | | | 0.3 | % |
Sino Land Co. Ltd. | | | 476,000 | | | | (519,835 | ) | | | 4.8 | % |
Sun Hung Kai Properties Ltd. | | | 87,000 | | | | (942,632 | ) | | | 8.7 | % |
Wharf Holdings Ltd. (The) | | | 539,000 | | | | (1,530,484 | ) | | | 14.2 | % |
| | | | | | | | | | | | |
| | | |
| | | | | | | (3,621,702 | ) | | | | |
| | | |
| Software | | | | | | | | | |
Synopsys, Inc. | | | 1,100 | | | | (557,029 | ) | | | 5.2 | % |
| | | | | | | | | | | | |
| | | |
| Specialty Retail | | | | | | | | | |
Sanrio Co. Ltd. | | | 29,900 | | | | (861,723 | ) | | | 8.0 | % |
| | | | | | | | | | | | |
| | | |
| Textiles, Apparel & Luxury Goods | | | | | | | | | |
Cie Financiere Richemont SA | | | 5,800 | | | | (921,065 | ) | | | 8.6 | % |
Swatch Group AG (The) | | | 5,300 | | | | (1,136,461 | ) | | | 10.5 | % |
| | | | | | | | | | | | |
| | | |
| | | | | | | (2,057,526 | ) | | | | |
| | | |
| Trading Companies & Distributors | | | | | | | | | |
Beijer Ref AB | | | 55,400 | | | | (912,088 | ) | | | 8.5 | % |
BOC Aviation Ltd. | | | 63,100 | | | | (521,920 | ) | | | 4.8 | % |
| | | | | | | | | | | | |
| | | |
| | | | | | | (1,434,008 | ) | | | | |
| | | |
| Transportation Infrastructure | | | | | | | | | |
SATS Ltd. | | | 489,900 | | | | (1,376,160 | ) | | | 12.8 | % |
| | | | | | | | | | | | |
| | | |
| Wireless Telecommunication Services | | | | | | | | | |
SoftBank Corp. | | | 465,000 | | | | (607,100 | ) | | | 5.6 | % |
T-Mobile U.S., Inc. | | | 5,400 | | | | (1,114,344 | ) | | | 10.4 | % |
| | | | | | | | | | | | |
| | | |
| | | | | | | (1,721,444 | ) | | | | |
| | | |
Investment Companies | | | | | | | | | | | | |
| | | |
| Fixed-Income Funds | | | | | | | | | |
iShares iBoxx $ Investment Grade Corporate Bond ETF | | | 59,482 | | | | (6,720,276 | ) | | | 62.3 | % |
iShares Preferred & Income Securities ETF | | | 436,500 | | | | (14,504,895 | ) | | | 134.6 | % |
| | | | | | | | | | | | |
| | | |
| | | | | | | (21,225,171 | ) | | | | |
| | | | | | | | | | | | |
Total Reference Entity — Short | | | | | | | (91,278,357 | ) | | | | |
| | | | | | | | | | | | |
| | | |
Net Value of Reference Entity — Merrill Lynch International | | | | | | $ | (10,780,494 | ) | | | | |
| | | | | | | | | | | | |
Balances Reported in the Statements of Assets and Liabilities for Centrally Cleared Swaps, OTC Swaps and Options Written
| | | | | | | | | | | | | | | | | | | | |
| | | | | | |
| | |
| Swap/Options
Premiums
Paid |
| |
| Swap/Options
Premiums
Received |
| |
| Unrealized
Appreciation |
| |
| Unrealized
Depreciation |
| | | Value | |
Centrally Cleared Swaps(a) | | $ | 27,165,358 | | | $ | (2,621,570 | ) | | $ | 1,904,801 | | | $ | (17,089,836 | ) | | $ | — | |
OTC Swaps | | | 2,874,291 | | | | (2,907,660 | ) | | | 2,259,522 | | | | (5,302,135 | ) | | | — | |
Options Written | | | N/A | | | | (38,544,200 | ) | | | 7,618,421 | | | | (20,958,528 | ) | | | (51,884,307 | ) |
| | (a) | Includes cumulative appreciation (depreciation) on centrally cleared swaps, as reported in the Consolidated Schedule of Investments. Only current day’s variation margin is reported within the Consolidated Statement of Assets and Liabilities and is net of any previously paid (received) swap premium amounts. | |
| | |
| 84 | | 2 0 2 4 B L A C K R O C K A N N U A L F I N A N C I A L S T A T E M E N T S A N D A D D I T I O N A L I N F O R M A T I O N |
| | |
Consolidated Schedule of Investments (continued) September 30, 2024 | | BlackRock Total Return Fund |
Derivative Financial Instruments Categorized by Risk Exposure
As of period end, the fair values of derivative financial instruments located in the Consolidated Statement of Assets and Liabilities were as follows:
| | | | | | | | | | | | | | | | | | | | | | | | | | | | |
| | | | | | | | |
| | | Commodity
Contracts | | | Credit
Contracts | | | Equity
Contracts | | | Foreign
Currency
Exchange
Contracts | | | Interest Rate Contracts | | | Other
Contracts | | | Total | |
| | | | | | | |
Assets — Derivative Financial Instruments | | | | | | | | | | | | | | | | | | | | | | | | | | | | |
Futures contracts | | | | | | | | | | | | | | | | | | | | | | | | | | | | |
Unrealized appreciation on futures contracts(a) | | $ | — | | | $ | — | | | $ | 69,878 | | | $ | — | | | $ | 3,796,085 | | | $ | — | | | $ | 3,865,963 | |
Forward foreign currency exchange contracts | | | | | | | | | | | | | | | | | | | | | | | | | | | | |
Unrealized appreciation on forward foreign currency exchange contracts | | | — | | | | — | | | | — | | | | 5,856,293 | | | | — | | | | — | | | | 5,856,293 | |
Options purchased | | | | | | | | | | | | | | | | | | | | | | | | | | | | |
Investments at value — unaffiliated(b) | | | — | | | | — | | | | — | | | | 4,382,514 | | | | 31,466,373 | | | | — | | | | 35,848,887 | |
Swaps — centrally cleared | | | | | | | | | | | | | | | | | | | | | | | | | | | | |
Unrealized appreciation on centrally cleared swaps(a) | | | — | | | | 506,437 | | | | — | | | | — | | | | 707,339 | | | | 691,025 | | | | 1,904,801 | |
Swaps — OTC | | | | | | | | | | | | | | | | | | | | | | | | | | | | |
Unrealized appreciation on OTC swaps; Swap premiums paid | | | — | | | | 3,664,881 | | | | 1,159,189 | | | | — | | | | 296,794 | | | | — | | | | 5,120,864 | |
| | | | | | | | | | | | | | | | | | | | | | | | | | | | |
| | $ | — | | | $ | 4,171,318 | | | $ | 1,229,067 | | | $ | 10,238,807 | | | $ | 36,266,591 | | | $ | 691,025 | | | $ | 52,596,808 | |
| | | | | | | | | | | | | | | | | | | | | | | | | | | | |
| | | | | | | |
Liabilities — Derivative Financial Instruments | | | | | | | | | | | | | | | | | | | | | | | | | | | | |
Futures contracts | | | | | | | | | | | | | | | | | | | | | | | | | | | | |
Unrealized depreciation on futures contracts(a) | | $ | 89,648 | | | $ | — | | | $ | 573,301 | | | $ | — | | | $ | 5,605,897 | | | $ | — | | | $ | 6,268,846 | |
Forward foreign currency exchange contracts | | | | | | | | | | | | | | | | | | | | | | | | | | | | |
Unrealized depreciation on forward foreign currency exchange contracts | | | — | | | | — | | | | — | | | | 16,248,932 | | | | — | | | | — | | | | 16,248,932 | |
Options written | | | | | | | | | | | | | | | | | | | | | | | | | | | | |
Options written at value | | | — | | | | — | | | | — | | | | 551,392 | | | | 51,332,915 | | | | — | | | | 51,884,307 | |
Swaps — centrally cleared | | | | | | | | | | | | | | | | | | | | | | | | | | | | |
Unrealized depreciation on centrally cleared swaps(a) | | | — | | | | 23,500 | | | | — | | | | — | | | | 16,285,311 | | | | 781,025 | | | | 17,089,836 | |
Swaps — OTC | | | | | | | | | | | | | | | | | | | | | | | | | | | | |
Unrealized depreciation on OTC swaps; Swap premiums received | | | — | | | | 5,384,185 | | | | 2,003,415 | | | | — | | | | 809,246 | | | | — | | | | 8,196,846 | |
| | | | | | | | | | | | | | | | | | | | | | | | | | | | |
| | $ | 89,648 | | | $ | 5,407,685 | | | $ | 2,576,716 | | | $ | 16,800,324 | | | $ | 74,033,369 | | | $ | 781,025 | | | $ | 99,688,767 | |
| | | | | | | | | | | | | | | | | | | | | | | | | | | | |
| | (a) | Net cumulative unrealized appreciation (depreciation) on futures contracts and centrally cleared swaps, if any, are reported in the Consolidated Schedule of Investments. In the Consolidated Statement of Assets and Liabilities, only current day’s variation margin is reported in receivables or payables and the net cumulative unrealized appreciation (depreciation) is included in accumulated earnings (loss) | |
| | (b) | Includes options purchased at value as reported in the Consolidated Schedule of Investments. | |
For the period October 1, 2023 through September 13, 2024, the effect of derivative financial instruments allocated from the Master Portfolio in the Consolidated Statement of Operations was as follows:
| | | | | | | | | | | | | | | | | | | | | | | | | | | | |
| | | | | | | | |
| | | Commodity
Contracts | | | Credit
Contracts | | | Equity
Contracts | | | Foreign
Currency
Exchange
Contracts | | | Interest Rate Contracts | | | Other
Contracts | | | Total | |
| | | | | | | |
Net Realized Gain (Loss) from: | | | | | | | | | | | | | | | | | | | | | | | | | | | | |
Futures contracts | | $ | (9,261 | ) | | $ | — | | | $ | (1,749,999 | ) | | $ | — | | | $ | 75,331,238 | | | $ | — | | | $ | 73,571,978 | |
Forward foreign currency exchange contracts | | | — | | | | — | | | | — | | | | 7,432,717 | | | | — | | | | — | | | | 7,432,717 | |
Options purchased(a) | | | — | | | | — | | | | 4,193,102 | | | | (11,069,997 | ) | | | (84,038,684 | ) | | | — | | | | (90,915,579 | ) |
Options written | | | — | | | | — | | | | 530,707 | | | | 5,118,041 | | | | 72,972,739 | | | | — | | | | 78,621,487 | |
Swaps | | | — | | | | 1,069,490 | | | | (4,408,839 | ) | | | — | | | | (27,419,669 | ) | | | 3,568,799 | | | | (27,190,219 | ) |
| | | | | | | | | | | | | | | | | | | | | | | | | | | | |
| | $ | (9,261 | ) | | $ | 1,069,490 | | | $ | (1,435,029 | ) | | $ | 1,480,761 | | | $ | 36,845,624 | | | $ | 3,568,799 | | | $ | 41,520,384 | |
| | | | | | | | | | | | | | | | | | | | | | | | | | | | |
| | | | | | | |
Net Change in Unrealized Appreciation (Depreciation) on: | | | | | | | | | | | | | | | | | | | | | | | | | | | | |
Futures contracts | | $ | (94,745 | ) | | $ | — | | | $ | (1,085,245 | ) | | $ | — | | | $ | 30,140,779 | | | $ | — | | | $ | 28,960,789 | |
Forward foreign currency exchange contracts | | | — | | | | — | | | | — | | | | (9,755,716 | ) | | | — | | | | — | | | | (9,755,716 | ) |
Options purchased(b) | | | — | | | | — | | | | 397,920 | | | | (994,270 | ) | | | (23,398,018 | ) | | | — | | | | (23,994,368 | ) |
Options written | | $ | — | | | $ | — | | | $ | (56,897 | ) | | $ | 232,930 | | | $ | 27,239,548 | | | $ | — | | | $ | 27,415,581 | |
Swaps | | | — | | | | 10,264,673 | | | | (2,552,865 | ) | | | — | | | | (15,192,429 | ) | | | (906,343 | ) | | | (8,386,964 | ) |
| | | | | | | | | | | | | | | | | | | | | | | | | | | | |
| | $ | (94,745 | ) | | $ | 10,264,673 | | | $ | (3,297,087 | ) | | $ | (10,517,056 | ) | | $ | 18,789,880 | | | $ | (906,343 | ) | | $ | 14,239,322 | |
| | | | | | | | | | | | | | | | | | | | | | | | | | | | |
| | |
C O N S O L I D A T E D S C H E D U L E S O F I N V E S T M E N T S | | 85 |
| | |
Consolidated Schedule of Investments (continued) September 30, 2024 | | BlackRock Total Return Fund |
For the period September 16, 2024 through September 30, 2024, the effect of the Fund’s derivative financial instruments in the Consolidated Statement of Operations was as follows:
| | | | | | | | | | | | | | | | | | | | | | | | | | | | |
| | | | | | | | |
| | | Commodity
Contracts | | | Credit
Contracts | | | Equity
Contracts | | | Foreign
Currency
Exchange
Contracts | | | Interest Rate Contracts | | | Other
Contracts | | | Total | |
| | | | | | | |
Net Realized Gain (Loss) from: | | | | | | | | | | | | | | | | | | | | | | | | | | | | |
Futures contracts | | $ | — | | | $ | — | | | $ | 1,099,001 | | | $ | — | | | $ | 389,753 | | | $ | — | | | $ | 1,488,754 | |
Forward foreign currency exchange contracts | | | — | | | | — | | | | — | | | | (5,812,600 | ) | | | — | | | | — | | | | (5,812,600 | ) |
Options purchased(a) | | | — | | | | — | | | | — | | | | (115,114 | ) | | | (3,348,111 | ) | | | — | | | | (3,463,225 | ) |
Options written | | | — | | | | — | | | | — | | | | — | | | | 8,745,554 | | | | — | | | | 8,745,554 | |
Swaps | | | — | | | | 8,939,655 | | | | (22,870 | ) | | | — | | | | (12,997,942 | ) | | | — | | | | (4,081,157 | ) |
| | | | | | | | | | | | | | | | | | | | | | | | | | | | |
| | $ | — | | | $ | 8,939,655 | | | $ | 1,076,131 | | | $ | (5,927,714 | ) | | $ | (7,210,746 | ) | | $ | — | | | $ | (3,122,674 | ) |
| | | | | | | | | | | | | | | | | | | | | | | | | | | | |
| | | | | | | |
Net Change in Unrealized Appreciation (Depreciation) on: | | | | | | | | | | | | | | | | | | | | | | | | | | | | |
Futures contracts | | $ | 5,097 | | | $ | — | | | $ | (726,325 | ) | | $ | — | | | $ | (25,385,076 | ) | | $ | — | | | $ | (26,106,304 | ) |
Forward foreign currency exchange contracts | | | — | | | | — | | | | — | | | | (673,979 | ) | | | — | | | | — | | | | (673,979 | ) |
Options purchased(b) | | | — | | | | — | | | | — | | | | (487,048 | ) | | | 4,352,974 | | | | — | | | | 3,865,926 | |
Options written | | | — | | | | — | | | | — | | | | (125,884 | ) | | | 4,083,778 | | | | — | | | | 3,957,894 | |
Swaps | | | — | | | | (8,413,140 | ) | | | 202,528 | | | | — | | | | 240,076 | | | | (167,329 | ) | | | (8,137,865 | ) |
| | | | | | | | | | | | | | | | | | | | | | | | | | | | |
| | $ | 5,097 | | | $ | (8,413,140 | ) | | $ | (523,797 | ) | | $ | (1,286,911 | ) | | $ | (16,708,248 | ) | | $ | (167,329 | ) | | $ | (27,094,328 | ) |
| | | | | | | | | | | | | | | | | | | | | | | | | | | | |
| | (a) | Options purchased are included in net realized gain (loss) from investments — unaffiliated. | |
| | (b) | Options purchased are included in net change in unrealized appreciation (depreciation) on investments — unaffiliated. | |
Average Quarterly Balances of Outstanding Derivative Financial Instruments
| | | | |
| |
Futures contracts | | | | |
Average notional value of contracts — long | | $ | 3,654,533,800 | |
Average notional value of contracts — short | | $ | 1,875,230,348 | |
Forward foreign currency exchange contracts | | | | |
Average amounts purchased — in USD | | $ | 723,006,064 | |
Average amounts sold — in USD | | $ | 232,124,507 | |
Options: | | | | |
Average value of option contracts purchased | | $ | 15,176,438 | |
Average value of option contracts written | | $ | 9,361,858 | |
Average notional value of swaption contracts purchased | | $ | 2,281,130,201 | |
Average notional value of swaption contracts written | | $ | 4,798,359,367 | |
Credit default swaps | | | | |
Average notional value — buy protection | | $ | 315,817,734 | |
Average notional value — sell protection | | $ | 304,109,761 | |
Total return swaps | | | | |
Average notional amount | | $ | 119,152,477 | |
Interest rate swaps | | | | |
Average notional value — pays fixed rate | | $ | 9,830,082,181 | |
Average notional value — received fixed rate | | $ | 781,341,400 | |
Inflation swaps | | | | |
Average notional amount — pays | | $ | 45,620,733 | |
Average notional amount — receives | | $ | 45,093,986 | |
| |
| | |
| 86 | | 2 0 2 4 B L A C K R O C K A N N U A L F I N A N C I A L S T A T E M E N T S A N D A D D I T I O N A L I N F O R M A T I O N |
| | |
Consolidated Schedule of Investments (continued) September 30, 2024 | | BlackRock Total Return Fund |
For the period October 1, 2023 through September 13, 2024, the average quarterly balances of outstanding derivative financial instruments were as follows:
| | | | |
| |
Futures contracts | | | | |
Average notional value of contracts — long | | $ | 3,326,582,699 | |
Average notional value of contracts — short | | $ | 1,611,908,956 | |
Forward foreign currency exchange contracts | | | | |
Average amounts purchased — in USD | | $ | 690,860,051 | |
Average amounts sold — in USD | | $ | 549,701,789 | |
Options: | | | | |
Average value of option contracts purchased | | $ | 14,575,946 | |
Average value of option contracts written | | $ | 9,448,718 | |
Average notional value of swaption contracts purchased | | $ | 2,793,859,951 | |
Average notional value of swaption contracts written | | $ | 4,952,754,261 | |
Credit default swaps | | | | |
Average notional value — buy protection | | $ | 315,573,037 | |
Average notional value — sell protection | | $ | 302,513,511 | |
Total return swaps | | | | |
Average notional amount | | $ | 119,152,477 | |
Interest rate swaps | | | | |
Average notional value — pays fixed rate | | $ | 9,946,862,397 | |
Average notional value — received fixed rate | | $ | 849,962,260 | |
Inflation swaps | | | | |
Average notional amount — pays | | $ | 45,431,529 | |
Average notional amount — receives | | $ | 45,093,986 | |
| |
For more information about the Fund’s investment risks regarding derivative financial instruments, refer to the Notes to Consolidated Financial Statements.
Derivative Financial Instruments – Offsetting as of Period End
The Fund’s derivative assets and liabilities (by type) were as follows:
| | | | | | | | |
| | | |
| | | Assets | | | Liabilities | |
Derivative Financial Instruments | | | | | | | | |
Futures contracts | | $ | 1,579,573 | | | $ | 13,867,834 | |
Forward foreign currency exchange contracts | | | 5,856,293 | | | | 16,248,932 | |
Options | | | 35,848,887 | (a) | | | 51,884,307 | |
Swaps — centrally cleared | | | — | | | | 265,386 | |
Swaps — OTC(b) | | | 5,133,813 | | | | 8,209,795 | |
| | | | | | | | |
Total derivative assets and liabilities in the Consolidated Statement of Assets and Liabilities | | $ | 48,418,566 | | | $ | 90,476,254 | |
| | | | | | | | |
Derivatives not subject to a Master Netting Agreement or similar agreement (“MNA”) | | | (32,645,510 | ) | | | (38,024,226 | ) |
| | | | | | | | |
Total derivative assets and liabilities subject to an MNA | | $ | 15,773,056 | | | $ | 52,452,028 | |
| | | | | | | | |
| | (a) | Includes options purchased at value which is included in Investments at value — unaffiliated in the Consolidated Statement of Assets and Liabilities and reported in the Consolidated Schedule of Investments. | |
| | (b) | Includes unrealized appreciation (depreciation) on OTC swaps and swap premiums paid/(received) in the Consolidated Statement of Assets and Liabilities. | |
The following tables present the Fund’s derivative assets and liabilities by counterparty net of amounts available for offset under an MNA and net of the related collateral received and pledged by the Fund:
| | | | | | | | | | | | | | | | | | | | |
| | | | | | |
| Counterparty | | Derivative Assets Subject to an MNA by
Counterparty | | | Derivatives Available for Offset(a) | | | Non- Cash Collateral Received(b) | | | Cash Collateral Received(b) | | | Net Amount of Derivative Assets(c) | |
Bank of America N.A. | | $ | 2,902,368 | | | $ | (2,902,368 | ) | | $ | — | | | $ | — | | | $ | — | |
Bank of New York Mellon | | | 1,548,582 | | | | (80,690 | ) | | | — | | | | (460,000 | ) | | | 1,007,892 | |
Barclays Bank PLC | | | 1,498,287 | | | | (1,498,287 | ) | | | — | | | | — | | | | — | |
BNP Paribas S.A. | | | 736,184 | | | | (736,184 | ) | | | — | | | | — | | | | — | |
Citibank N.A. | | | 2,710,423 | | | | (2,710,423 | ) | | | — | | | | — | | | | — | |
Citigroup Global Markets, Inc. | | | 329,160 | | | | — | | | | — | | | | — | | | | 329,160 | |
Commonwealth Bank of Australia | | | 12,636 | | | | (8,643 | ) | | | — | | | | — | | | | 3,993 | |
Deutsche Bank AG | | | 183,937 | | | | (183,937 | ) | | | — | | | | — | | | | — | |
Goldman Sachs International | | | 2,001,161 | | | | (2,001,161 | ) | | | — | | | | — | | | | — | |
HSBC Bank PLC | | | 782,173 | | | | (221,454 | ) | | | — | | | | — | | | | 560,719 | |
| | |
C O N S O L I D A T E D S C H E D U L E S O F I N V E S T M E N T S | | 87 |
| | |
Consolidated Schedule of Investments (continued) September 30, 2024 | | BlackRock Total Return Fund |
| | | | | | | | | | | | | | | | | | | | |
| | | | | | |
| Counterparty | | Derivative Assets Subject to an MNA by
Counterparty | | | Derivatives Available for Offset(a) | | | Non- Cash Collateral Received(b) | | | Cash Collateral Received(b) | | | Net Amount of Derivative Assets(c) | |
J.P. Morgan Securities LLC | | $ | 5,406 | | | $ | (5,406 | ) | | $ | — | | | $ | — | | | $ | — | |
JPMorgan Chase Bank N.A. | | | 354,477 | | | | (354,477 | ) | | | — | | | | — | | | | — | |
Merrill Lynch International | | | 877,946 | | | | — | | | | — | | | | — | | | | 877,946 | |
Morgan Stanley & Co. International PLC | | | 1,240,815 | | | | (1,240,815 | ) | | | — | | | | — | | | | — | |
Royal Bank of Canada | | | 191,247 | | | | — | | | | — | | | | — | | | | 191,247 | |
Societe Generale SA | | | 8,319 | | | | — | | | | — | | | | — | | | | 8,319 | |
Standard Chartered Bank | | | 38,678 | | | | (38,678 | ) | | | — | | | | — | | | | — | |
State Street Bank and Trust Co. | | | 55,444 | | | | (55,444 | ) | | | — | | | | — | | | | — | |
TD Securities, Inc. | | | 79,108 | | | | (79,108 | ) | | | — | | | | — | | | | — | |
UBS AG | | | 216,705 | | | | (216,705 | ) | | | — | | | | — | | | | — | |
| | | | | | | | | | | | | | | | | | | | |
| | $ | 15,773,056 | | | $ | (12,333,780 | ) | | $ | — | | | $ | (460,000 | ) | | $ | 2,979,276 | |
| | | | | | | | | | | | | | | | | | | | |
| | | | | |
| Counterparty | | Derivative Liabilities Subject to an MNA by Counterparty | | | Derivatives Available for Offset(a) | | | Non- Cash Collateral Pledged(b) | | | Cash Collateral Pledged(b) | | | Net Amount of Derivative Liabilities(d) | |
Australia & New Zealand Banking Group Ltd. | | $ | 1,521 | | | $ | — | | | $ | — | | | $ | — | | | $ | 1,521 | |
Bank of America N.A. | | | 17,082,330 | | | | (2,902,368 | ) | | | (12,039,438 | ) | | | (2,140,524 | ) | | | — | |
Bank of New York Mellon | | | 80,690 | | | | (80,690 | ) | | | — | | | | — | | | | — | |
Barclays Bank PLC | | | 11,825,137 | | | | (1,498,287 | ) | | | (10,326,850 | ) | | | — | | | | — | |
BNP Paribas S.A. | | | 1,222,825 | | | | (736,184 | ) | | | (486,641 | ) | | | — | | | | — | |
Citibank N.A. | | | 4,388,513 | | | | (2,710,423 | ) | | | (1,678,090 | ) | | | — | | | | — | |
Commonwealth Bank of Australia | | | 8,643 | | | | (8,643 | ) | | | — | | | | — | | | | — | |
Deutsche Bank AG | | | 3,625,623 | | | | (183,937 | ) | | | (3,441,686 | ) | | | — | | | | — | |
Goldman Sachs International | | | 3,573,026 | | | | (2,001,161 | ) | | | (1,571,865 | ) | | | — | | | | — | |
HSBC Bank PLC | | | 221,454 | | | | (221,454 | ) | | | — | | | | — | | | | — | |
J.P. Morgan Securities LLC | | | 34,907 | | | | (5,406 | ) | | | — | | | | — | | | | 29,501 | |
JPMorgan Chase Bank N.A. | | | 5,163,012 | | | | (354,477 | ) | | | (1,387,335 | ) | | | — | | | | 3,421,200 | |
Morgan Stanley & Co. International PLC | | | 1,525,642 | | | | (1,240,815 | ) | | | — | | | | — | | | | 284,827 | |
NatWest Markets PLC | | | 65,284 | | | | — | | | | — | | | | — | | | | 65,284 | |
Standard Chartered Bank | | | 42,261 | | | | (38,678 | ) | | | — | | | | — | | | | 3,583 | |
State Street Bank and Trust Co. | | | 3,096,904 | | | | (55,444 | ) | | | — | | | | — | | | | 3,041,460 | |
TD Securities, Inc. | | | 87,629 | | | | (79,108 | ) | | | — | | | | — | | | | 8,521 | |
UBS AG | | | 406,627 | | | | (216,705 | ) | | | — | | | | — | | | | 189,922 | |
| | | | | | | | | | | | | | | | | | | | |
| | $ | 52,452,028 | | | $ | (12,333,780 | ) | | $ | (30,931,905 | ) | | $ | (2,140,524 | ) | | $ | 7,045,819 | |
| | | | | | | | | | | | | | | | | | | | |
| | (a) | The amount of derivatives available for offset is limited to the amount of derivative assets and/or liabilities that are subject to an MNA. | |
| | (b) | Excess of collateral received/pledged, if any, from the individual counterparty is not shown for financial reporting purposes. | |
| | (c) | Net amount represents the net amount receivable from the counterparty in the event of default. | |
| | (d) | Net amount represents the net amount payable due to the counterparty in the event of default. Net amount may be offset further by the options written receivable/payable on the Consolidated Statement of Assets and Liabilities. | |
Fair Value Hierarchy as of Period End
Various inputs are used in determining the fair value of financial instruments at the measurement date. For a description of the input levels and information about the Fund’s policy regarding valuation of financial instruments, refer to the Notes to Consolidated Financial Statements.
The following table summarizes the Fund’s financial instruments categorized in the fair value hierarchy. The breakdown of the Fund’s financial instruments into major categories is disclosed in the Consolidated Schedule of Investments above.
| | | | | | | | | | | | | | | | | | | | | | | | | | | | |
| |
| | | | | | | |
| | | Level 1 | | | | | | Level 2 | | | | | | Level 3 | | | | | | Total | |
| |
| | | | | | | |
Assets | | | | | | | | | | | | | | | | | | | | | | | | | | | | |
Investments | | | | | | | | | | | | | | | | | | | | | | | | | | | | |
Long-Term Investments | | | | | | | | | | | | | | | | | | | | | | | | | | | | |
Asset-Backed Securities | | $ | — | | | | | | | $ | 2,204,627,939 | | | | | | | $ | 21,539,348 | | | | | | | $ | 2,226,167,287 | |
Common Stocks | | | | | | | | | | | | | | | | | | | | | | | | | | | | |
Aerospace & Defense | | | — | | | | | | | | 12,141 | | | | | | | | 5,950,560 | | | | | | | | 5,962,701 | |
| | |
| 88 | | 2 0 2 4 B L A C K R O C K A N N U A L F I N A N C I A L S T A T E M E N T S A N D A D D I T I O N A L I N F O R M A T I O N |
| | |
Consolidated Schedule of Investments (continued) September 30, 2024 | | BlackRock Total Return Fund |
Fair Value Hierarchy as of Period End (continued)
| | | | | | | | | | | | | | | | | | | | | | | | | | | | |
| |
| | | | | | | |
| | | Level 1 | | | | | | Level 2 | | | | | | Level 3 | | | | | | Total | |
| |
Common Stocks (continued) | | | | | | | | | | | | | | | | | | | | | | | | | | | | |
Banks | | $ | 13,548,987 | | | | | | | $ | — | | | | | | | $ | — | | | | | | | $ | 13,548,987 | |
Capital Markets | | | — | | | | | | | | 919,312 | | | | | | | | 29,533 | | | | | | | | 948,845 | |
Construction & Engineering | | | 312,906 | | | | | | | | — | | | | | | | | — | | | | | | | | 312,906 | |
Consumer Staples Distribution & Retail | | | 3,894,145 | | | | | | | | — | | | | | | | | — | | | | | | | | 3,894,145 | |
Diversified Telecommunication Services | | | 2,838,275 | | | | | | | | — | | | | | | | | — | | | | | | | | 2,838,275 | |
Electrical Equipment | | | — | | | | | | | | — | | | | | | | | — | | | | | | | | — | |
Energy Equipment & Services | | | 3,887,830 | | | | | | | | — | | | | | | | | — | | | | | | | | 3,887,830 | |
Entertainment | | | 2,005,167 | | | | | | | | 690,556 | | | | | | | | — | | | | | | | | 2,695,723 | |
Financial Services | | | — | | | | | | | | 521,308 | | | | | | | | 13,871,000 | | | | | | | | 14,392,308 | |
Health Care Providers & Services | | | 848,048 | | | | | | | | — | | | | | | | | — | | | | | | | | 848,048 | |
Hotel & Resort REITs | | | 2,755,210 | | | | | | | | — | | | | | | | | — | | | | | | | | 2,755,210 | |
Hotels, Restaurants & Leisure | | | 10,086,473 | | | | | | | | 88,998 | | | | | | | | — | | | | | | | | 10,175,471 | |
Household Durables | | | 895,807 | | | | | | | | — | | | | | | | | — | | | | | | | | 895,807 | |
Industrial REITs | | | 287,498 | | | | | | | | — | | | | | | | | — | | | | | | | | 287,498 | |
Machinery | | | — | | | | | | | | 830,603 | | | | | | | | — | | | | | | | | 830,603 | |
Media | | | 911,433 | | | | | | | | — | | | | | | | | — | | | | | | | | 911,433 | |
Metals & Mining | | | 16,087,191 | | | | | | | | — | | | | | | | | — | | | | | | | | 16,087,191 | |
Mortgage Real Estate Investment Trusts (REITs) | | | 10,133,261 | | | | | | | | — | | | | | | | | — | | | | | | | | 10,133,261 | |
Oil, Gas & Consumable Fuels | | | 3,733,886 | | | | | | | | — | | | | | | | | 5,616,123 | | | | | | | | 9,350,009 | |
Real Estate Management & Development | | | 2,159,847 | | | | | | | | — | | | | | | | | — | | | | | | | | 2,159,847 | |
Residential REITs | | | 4,871,098 | | | | | | | | — | | | | | | | | — | | | | | | | | 4,871,098 | |
Software | | | — | | | | | | | | 209,584 | | | | | | | | — | | | | | | | | 209,584 | |
Textiles, Apparel & Luxury Goods | | | 1,715,552 | | | | | | | | — | | | | | | | | — | | | | | | | | 1,715,552 | |
Corporate Bonds | | | — | | | | | | | | 4,789,803,204 | | | | | | | | 157,472,285 | | | | | | | | 4,947,275,489 | |
Fixed Rate Loan Interests | | | — | | | | | | | | — | | | | | | | | 37,276,835 | | | | | | | | 37,276,835 | |
Floating Rate Loan Interests | | | — | | | | | | | | 83,172,248 | | | | | | | | 143,248,120 | | | | | | | | 226,420,368 | |
Foreign Agency Obligations | | | — | | | | | | | | 23,438,633 | | | | | | | | — | | | | | | | | 23,438,633 | |
Foreign Government Obligations | | | — | | | | | | | | 1,074,112,714 | | | | | | | | — | | | | | | | | 1,074,112,714 | |
Investment Companies | | | 5,087,376 | | | | | | | | — | | | | | | | | — | | | | | | | | 5,087,376 | |
Municipal Bonds | | | — | | | | | | | | 122,079,424 | | | | | | | | — | | | | | | | | 122,079,424 | |
Non-Agency Mortgage-Backed Securities | | | — | | | | | | | | 1,971,527,149 | | | | | | | | 53,444,000 | | | | | | | | 2,024,971,149 | |
Preferred Securities | | | — | | | | | | | | 11,787,133 | | | | | | | | 56,306,650 | | | | | | | | 68,093,783 | |
U.S. Government Sponsored Agency Securities | | | — | | | | | | | | 7,152,330,218 | | | | | | | | — | | | | | | | | 7,152,330,218 | |
U.S. Treasury Obligations | | | — | | | | | | | | 3,797,211,756 | | | | | | | | — | | | | | | | | 3,797,211,756 | |
Warrants | | | | | | | | | | | | | | | | | | | | | | | | | | | | |
Automobile Components | | | 13,285 | | | | | | | | — | | | | | | | | — | | | | | | | | 13,285 | |
Automobiles | | | — | | | | | | | | 22 | | | | | | | | — | | | | | | | | 22 | |
Banks | | | — | | | | | | | | 2,234,151 | | | | | | | | — | | | | | | | | 2,234,151 | |
Capital Markets | | | — | | | | | | | | — | | | | | | | | 8,262 | | | | | | | | 8,262 | |
Financial Services | | | — | | | | | | | | 2,190 | | | | | | | | — | | | | | | | | 2,190 | |
Hotels, Restaurants & Leisure | | | — | | | | | | | | — | | | | | | | | 124,041 | | | | | | | | 124,041 | |
Machinery | | | 8,024 | | | | | | | | — | | | | | | | | — | | | | | | | | 8,024 | |
Oil, Gas & Consumable Fuels | | | — | | | | | | | | — | | | | | | | | 413,941 | | | | | | | | 413,941 | |
Passenger Airlines | | | — | | | | | | | | 1,332 | | | | | | | | — | | | | | | | | 1,332 | |
Real Estate Management & Development | | | 335 | | | | | | | | — | | | | | | | | — | | | | | | | | 335 | |
Software | | | — | | | | | | | | — | | | | | | | | 2,070,951 | | | | | | | | 2,070,951 | |
Specialty Retail | | | 24,435 | | | | | | | | — | | | | | | | | 1,423,139 | | | | | | | | 1,447,574 | |
Trading Companies & Distributors | | | 22,675 | | | | | | | | — | | | | | | | | — | | | | | | | | 22,675 | |
Short-Term Securities | | | | | | | | | | | | | | | | | | | | | | | | | | | | |
Money Market Funds | | | 1,086,732,398 | | | | | | | | — | | | | | | | | — | | | | | | | | 1,086,732,398 | |
Options Purchased | | | | | | | | | | | | | | | | | | | | | | | | | | | | |
Foreign Currency Exchange Contracts | | | — | | | | | | | | 4,382,514 | | | | | | | | — | | | | | | | | 4,382,514 | |
Interest Rate Contracts | | | 31,065,937 | | | | | | | | 400,436 | | | | | | | | — | | | | | | | | 31,466,373 | |
Unfunded Floating Rate Loan Interests | | | — | | | | | | | | — | | | | | | | | 60,330 | | | | | | | | 60,330 | |
| | | | | | | |
Liabilities | | | | | | | | | | | | | | | | | | | | | | | | | | | | |
TBA Sale Commitments | | | — | | | | | | | | (1,972,212,707 | ) | | | | | | | — | | | | | | | | (1,972,212,707 | ) |
Unfunded Floating Rate Loan Interests | | | — | | | | | | | | — | | | | | | | | (744 | ) | | | | | | | (744 | ) |
| | | | | | | | | | | | | | | | | | | | | | | | | | | | |
| | $ | 1,203,927,079 | | | | | | | $ | 19,268,170,858 | | | | | | | $ | 498,854,374 | | | | | | | $ | 20,970,952,311 | |
| | | | | | | | | | | | | | | | | | | | | | | | | | | | |
| | | | | | | |
Derivative Financial Instruments(a) | | | | | | | | | | | | | | | | | | | | | | | | | | | | |
Assets | | | | | | | | | | | | | | | | | | | | | | | | | | | | |
Credit Contracts | | $ | — | | | | | | | $ | 1,297,027 | | | | | | | $ | — | | | | | | | $ | 1,297,027 | |
| | |
C O N S O L I D A T E D S C H E D U L E S O F I N V E S T M E N T S | | 89 |
| | |
Consolidated Schedule of Investments (continued) September 30, 2024 | | BlackRock Total Return Fund |
Fair Value Hierarchy as of Period End (continued)
| | | | | | | | | | | | | | | | | | | | | | | | | | | | |
| |
| | | | | | | |
| | | Level 1 | | | | | | Level 2 | | | | | | Level 3 | | | | | | Total | |
| |
Assets | | | | | | | | | | | | | | | | | | | | | | | | | | | | |
Equity Contracts | | $ | 69,878 | | | | | | | $ | 1,159,189 | | | | | | | $ | — | | | | | | | $ | 1,229,067 | |
Foreign Currency Exchange Contracts | | | — | | | | | | | | 5,856,293 | | | | | | | | — | | | | | | | | 5,856,293 | |
Interest Rate Contracts | | | 3,796,085 | | | | | | | | 1,004,133 | | | | | | | | — | | | | | | | | 4,800,218 | |
Other Contracts | | | — | | | | | | | | 691,025 | | | | | | | | — | | | | | | | | 691,025 | |
Liabilities | | | | | | | | | | | | | | | | | | | | | | | | | | | | |
Commodity Contracts | | | (89,648 | ) | | | | | | | — | | | | | | | | — | | | | | | | | (89,648 | ) |
Credit Contracts | | | — | | | | | | | | (2,500,025 | ) | | | | | | | — | | | | | | | | (2,500,025 | ) |
Equity Contracts | | | (573,301 | ) | | | | | | | (2,003,415 | ) | | | | | | | — | | | | | | | | (2,576,716 | ) |
Foreign Currency Exchange Contracts | | | — | | | | | | | | (16,800,324 | ) | | | | | | | — | | | | | | | | (16,800,324 | ) |
Interest Rate Contracts | | | (29,496,903 | ) | | | | | | | (44,536,466 | ) | | | | | | | — | | | | | | | | (74,033,369 | ) |
Other Contracts | | | — | | | | | | | | (781,025 | ) | | | | | | | — | | | | | | | | (781,025 | ) |
| | | | | | | | | | | | | | | | | | | | | | | | | | | | |
| | $ | (26,293,889 | ) | | | | | | $ | (56,613,588 | ) | | | | | | $ | — | | | | | | | $ | (82,907,477 | ) |
| | | | | | | | | | | | | | | | | | | | | | | | | | | | |
| | (a) | Derivative financial instruments are swaps, futures contracts, forward foreign currency exchange contracts and options written. Swaps, futures contracts and forward foreign currency exchange contracts are valued at the unrealized appreciation (depreciation) on the instrument and options written are shown at value. | |
A reconciliation of Level 3 investments is presented when the Fund and/or the Master Portfolio had a significant amount of Level 3 investments at the beginning and/or end of the period in relation to net assets. The following tables are a reconciliation of Level 3 investments for which significant unobservable inputs were used in determining fair value:
| | | | | | | | | | | | | | | | | | | | | | | | |
| | | | | | | |
| | | Asset-
Backed
Securities | | | Common
Stocks | | | Corporate
Bonds | | | Fixed Rate
Loan Interests | | | Floating Rate
Loan Interests | | | Investment
Companies | |
Assets | | | | | | | | | | | | | | | | | | | | | | | | |
Opening Balance, as of September 30, 2023 | | $ | 18,670,200 | | | $ | 4,720,839 | | | $ | 103,107,859 | | | $ | 7,240,690 | | | $ | 193,563,637 | | | $ | 2,580,111 | |
Transfers into Level 3 | | | — | | | | — | | | | 148 | | | | — | | | | 235,106 | | | | — | |
Transfers out of Level 3 | | | — | | | | — | | | | — | | | | — | | | | 3,484,266 | | | | — | |
Other(a) | | | — | | | | 2,580,111 | | | | — | | | | 15,349,632 | | | | (15,349,632 | ) | | | (2,580,111 | ) |
Accrued discounts/premiums | | | — | | | | — | | | | 576,673 | | | | 64,350 | | | | 159,116 | | | | — | |
Net realized gain (loss) | | | — | | | | 898,026 | | | | 235,774 | | | | 92,577 | | | | (416,421 | ) | | | — | |
Net change in unrealized appreciation (depreciation)(b) | | | 1,369,148 | | | | 1,062,548 | | | | (114,917 | ) | | | 1,503,588 | | | | (6,470,315 | ) | | | — | |
Purchases | | | 1,500,000 | | | | 17,104,112 | | | | 85,481,257 | | | | 18,167,758 | | | | 71,464,231 | | | | — | |
Sales | | | — | | | | (898,420 | ) | | | (31,814,509 | ) | | | (5,141,760 | ) | | | (103,421,868 | ) | | | — | |
| | | | | | | | | | | | | | | | | | | | | | | | |
Closing Balance, as of September 30, 2024 | | $ | 21,539,348 | | | $ | 25,467,216 | | | $ | 157,472,285 | | | $ | 37,276,835 | | | $ | 143,248,120 | | | $ | — | |
| | | | | | | | | | | | | | | | | | | | | | | | |
Net change in unrealized appreciation (depreciation) on investments still held at September 30, 2024(b) | | $ | 1,369,148 | | | $ | 1,384,962 | | | $ | (717,827) | | | $ | 1,503,588 | | | $ | (10,558,736 | ) | | $ | — | |
| | | | | | | | | | | | | | | | | | | | | | | | |
| | | | | | | | | | | | | | | | |
| | | | | |
| | | Non-Agency
Mortgage-Backed
Securities | | | Preferred
Securities | | | Warrants | | | Total | |
Assets | | | | | | | | | | | | | | | | |
Opening Balance, as of September 30, 2023 | | $ | 87,351,455 | | | $ | 30,752,892 | | | $ | 1,602,947 | | | $ | 449,590,630 | |
Transfers into Level 3 | | | — | | | | — | | | | 3,210 | | | | 238,464 | |
Transfers out of Level 3 | | | (10,629,624 | ) | | | — | | | | — | | | | (7,145,358 | ) |
Other(a) | | | — | | | | — | | | | — | | | | — | |
Accrued discounts/premiums | | | 522,371 | | | | — | | | | — | | | | 1,322,510 | |
Net realized gain (loss) | | | (2,005 | ) | | | (644,833 | ) | | | (70,789 | ) | | | 92,329 | |
Net change in unrealized appreciation (depreciation)(b) | | | 1,157,310 | | | | 6,796,751 | | | | 2,615,469 | | | | 7,919,582 | |
Purchases | | | 112,812 | | | | 21,257,919 | | | | 5 | | | | 215,088,094 | |
Sales | | | (25,068,319 | ) | | | (1,856,079 | ) | | | (110,508 | ) | | | (168,311,463 | ) |
| | | | | | | | | | | | | | | | |
Closing Balance, as of September 30, 2024 | | $ | 53,444,000 | | | $ | 56,306,650 | | | $ | 4,040,334 | | | $ | 498,794,788 | |
| | | | | | | | | | | | | | | | |
Net change in unrealized appreciation (depreciation) on investments still held at September 30, 2024(b) | | $ | 1,064,206 | | | $ | 6,223,814 | | | $ | 2,596,360 | | | $ | 2,865,515 | |
| | | | | | | | | | | | | | | | |
| | |
| 90 | | 2 0 2 4 B L A C K R O C K A N N U A L F I N A N C I A L S T A T E M E N T S A N D A D D I T I O N A L I N F O R M A T I O N |
| | |
Consolidated Schedule of Investments (continued) September 30, 2024 | | BlackRock Total Return Fund |
| | | | |
| | |
| | | Unfunded
Floating Rate
Loan Interests | |
Liabilities | | | | |
Opening Balance, as of September 30, 2023 | | $ | (423,460 | ) |
Transfers into Level 3 | | | — | |
Transfers out of Level 3 | | | — | |
Accrued discounts/premiums | | | — | |
Net realized gain (loss) | | | — | |
Net change in unrealized appreciation (depreciation)(b) | | | 483,046 | |
Purchases | | | — | |
Sales | | | — | |
| | | | |
Closing Balance, as of September 30, 2024 | | $ | 59,586 | |
| | | | |
Net change in unrealized appreciation (depreciation) on investments still held at September 30, 2024(b) | | $ | 298,753 | |
| | | | |
| | (a) | Certain Level 3 investments were re-classified between Fixed Rate Loan Interests, Floating Rate Loan Interests, Common Stocks and Investment Companies. | |
| | (b) | Any difference between net change in unrealized appreciation (depreciation) and net change in unrealized appreciation (depreciation) on investments still held at September 30, 2024, is generally due to investments no longer held or categorized as Level 3 at period end. | |
The following table summarizes the valuation approaches used and unobservable inputs utilized by the Valuation Committee to determine the value of certain of the Fund’s Level 3 investments as of period end. The table does not include Level 3 investments with values based upon unadjusted third party pricing information in the amount of $68,243,708. A significant change in the third party information could result in a significantly lower or higher value of such Level 3 investments.
| | | | | | | | | | | | | | | | | | |
| | | | | | |
| | | Value | | | Valuation Approach | | | Unobservable
Inputs | | Range of
Unobservable Inputs
Utilized(a) | | | Weighted Average of
Unobservable Inputs
Based on Fair Value | |
Assets | | | | | | | | | | | | | | | | | | |
Asset Backed Securities | | $ | 20,039,348 | | | | Income | | | Discount Rate | | | 7% | | | | — | |
Non-Agency Mortgage-Backed Securities | | | 9,856,157 | | | | Income | | | Discount Rate | | | 10% | | | | — | |
Common Stocks | | | 25,467,215 | | | | Market | | | Volatility | | | 75% | | | | — | |
| | | | | | | | | | Time to Exit | | | 5.6 years | | | | — | |
| | | | | | | | | | EBITDA Multiple | | | 12.38x -14.94x | | | | 13.15x | |
| | | | | | | Income | | | Discount Rate | | | 10% - 12% | | | | 10% | |
Corporate Bonds | | | 157,472,280 | | | | Income | | | Discount Rate | | | 3% - 16% | | | | 10% | |
| | | | | | | Market | | | Revenue Multiple | | | 5.36x | | | | — | |
Floating Rate Loan Interests | | | 125,138,406 | | | | Income | | | Discount Rate | | | 6% - 14% | | | | 10% | |
| | | | | | | | | | Estimated Recovery Value | | | 1% - 44% | | | | 43% | |
| | | | | | | Market | | | EBITDA Multiple | | | 15.00x | | | | — | |
Fixed Rate Loan Interests | | | 32,290,277 | | | | Income | | | Discount Rate | | | 7% - 12% | | | | 7% | |
Preferred Stock | | | 56,306,650 | | | | Income | | | Discount Rate | | | 10% - 14% | | | | 12% | |
| | | | | | | Market | | | Revenue Multiple | | | 3.25x-10.25x | | | | 9.73x | |
| | | | | | | | | | EBITDA Multiple | | | 7.00x | | | | — | |
| | | | | | | | | | Volatility | | | 30% -90% | | | | 52% | |
| | | | | | | | | | Time to Exit | | | 2.0 - 3.4 years | | | | 3.0 years | |
Warrants(b) | | | 4,040,333 | | | | Market | | | Revenue Multiple | | | 3.25x-10.25x | | | | 9.08x | |
| | | | | | | | | | Volatility | | | 49% - 59% | | | | 50% | |
| | | | | | | | | | Time to Exit | | | 0.8 years | | | | — | |
| | | | | | | Income | | | Discount Rate | | | 12% | | | | — | |
| | | | | | | | | | | | | | | | | | |
| | $ | 430,610,666 | | | | | | | | | | | | | | | |
| | | | | | | | | | | | | | | | | | |
| | (a) | A significant change in unobservable input would have resulted in a correlated (inverse) significant change to value. | |
| | (b) | The fund valued certain of its Level 3 Warrants using recent transactions as the best approximation of fair value. The value of Level 3 investments obtained using recent prior transaction prices, for which inputs are unobservable, is $124,041 as of September 30, 2024. | |
See notes to consolidated financial statements.
| | |
C O N S O L I D A T E D S C H E D U L E S O F I N V E S T M E N T S | | 91 |
Consolidated Statement of Assets and Liabilities
September 30, 2024
| | | | |
| |
| | | BlackRock Total Return Fund | |
| |
ASSETS | | | | |
Investments, at value — unaffiliated(a)(b) | | $ | 21,851,285,658 | |
Investments, at value — affiliated(c) | | | 1,091,819,774 | |
Cash | | | 4,887,933 | |
Cash pledged: | | | | |
Collateral — exchange-traded options written | | | 10,000 | |
Collateral — OTC derivatives | | | 2,140,524 | |
Futures contracts | | | 55,474,010 | |
Centrally cleared swaps | | | 67,437,000 | |
Foreign currency, at value(d) | | | 60,725,613 | |
Receivables: | | | | |
Investments sold | | | 13,590,161 | |
Options written | | | 4,536,668 | |
Securities lending income — affiliated | | | 316 | |
Swaps | | | 18,052,585 | |
TBA sale commitments | | | 1,979,372,924 | |
Capital shares sold | | | 100,319,316 | |
Interest — unaffiliated | | | 159,729,598 | |
From the Manager | | | 374,386 | |
Variation margin on futures contracts | | | 1,579,573 | |
Swap premiums paid | | | 2,874,291 | |
Unrealized appreciation on: | | | | |
Forward foreign currency exchange contracts | | | 5,856,293 | |
OTC swaps | | | 2,259,522 | |
Unfunded floating rate loan interests | | | 60,330 | |
Prepaid expenses | | | 238,099 | |
| | | | |
| |
Total assets | | | 25,422,624,574 | |
| | | | |
| |
LIABILITIES | | | | |
Cash received: | | | | |
Collateral — OTC derivatives | | | 928,427 | |
Collateral — TBA commitments | | | 440,000 | |
Centrally cleared swaps | | | 370 | |
Collateral on securities loaned | | | 11,650,875 | |
Options written, at value(e) | | | 51,884,307 | |
TBA sale commitments, at value(f) | | | 1,972,212,707 | |
Payables: | | | | |
Investments purchased | | | 3,100,827,826 | |
Swaps | | | 21,602,348 | |
Capital shares redeemed | | | 79,744,759 | |
Income dividend distributions | | | 8,709,404 | |
Investment advisory fees | | | 5,558,532 | |
Directors’ and Officer’s fees | | | 426,641 | |
Other accrued expenses | | | 1,137,764 | |
Other affiliate fees | | | 88,438 | |
Professional fees | | | 156,459 | |
Registration fees | | | 1,026,470 | |
Service and distribution fees | | | 329,067 | |
Variation margin on futures contracts | | | 13,867,834 | |
Variation margin on centrally cleared swaps | | | 265,386 | |
Swap premiums received | | | 2,907,660 | |
Unrealized depreciation on: | | | | |
Forward foreign currency exchange contracts | | | 16,248,932 | |
OTC swaps | | | 5,302,135 | |
Unfunded floating rate loan interests | | | 744 | |
| | | | |
| |
Total liabilities | | | 5,295,317,085 | |
| | | | |
| |
Commitments and contingent liabilities | | | | |
| |
NET ASSETS | | $ | 20,127,307,489 | |
| | | | |
| | |
| 92 | | 2 0 2 4 B L A C K R O C K A N N U A L F I N A N C I A L S T A T E M E N T S A N D A D D I T I O N A L I N F O R M A T I O N |
Consolidated Statement of Assets and Liabilities (continued)
September 30, 2024
| | | | |
| |
| | | BlackRock Total Return Fund | |
| |
NET ASSETS CONSIST OF: | | | | |
Paid-in capital | | $ | 22,982,867,239 | |
Accumulated loss | | | (2,855,559,750 | ) |
| | | | |
| |
NET ASSETS | | $ | 20,127,307,489 | |
| | | | |
| |
(a) Investments, at cost — unaffiliated | | $ | 22,252,050,278 | |
(b) Securities loaned, at value | | $ | 11,373,789 | |
(c) Investments, at cost — affiliated | | $ | 1,091,804,052 | |
(d) Foreign currency, at cost | | $ | 61,599,178 | |
(e) Premiums received | | $ | 38,544,200 | |
(f) Proceeds from TBA sale commitments | | $ | 1,979,372,924 | |
| | |
C O N S O L I D A T E D S T A T E M E N T O F A S S E T S A N D L I A B I L I T I E S | | 93 |
Consolidated Statement of Assets and Liabilities (continued)
September 30, 2024
| | | | |
| |
| | | BlackRock Total Return Fund | |
NET ASSET VALUE | | | | |
| |
| Institutional | | | |
Net assets | | $ | 11,315,504,170 | |
| | | | |
Shares outstanding | | | 1,111,317,129 | |
| | | | |
Net asset value | | $ | 10.18 | |
| | | | |
Shares authorized | | | 1.6 billion | |
| | | | |
Par value | | $ | 0.10 | |
| | | | |
| |
| Service | | | |
Net assets | | $ | 38,544,199 | |
| | | | |
Shares outstanding | | | 3,784,775 | |
| | | | |
Net asset value | | $ | 10.18 | |
| | | | |
Shares authorized | | | 50 million | |
| | | | |
Par value | | $ | 0.10 | |
| | | | |
| |
| Investor A | | | |
Net assets | | $ | 1,316,589,572 | |
| | | | |
Shares outstanding | | | 129,251,977 | |
| | | | |
Net asset value | | $ | 10.19 | |
| | | | |
Shares authorized | | | 450 million | |
| | | | |
Par value | | $ | 0.10 | |
| | | | |
| |
| Investor A1 | | | |
Net assets | | $ | 15,731,764 | |
| | | | |
Shares outstanding | | | 1,545,723 | |
| | | | |
Net asset value | | $ | 10.18 | |
| | | | |
Shares authorized | | | 50 million | |
| | | | |
Par value | | $ | 0.10 | |
| | | | |
| |
| Investor C | | | |
Net assets | | $ | 36,125,913 | |
| | | | |
Shares outstanding | | | 3,549,341 | |
| | | | |
Net asset value | | $ | 10.18 | |
| | | | |
Shares authorized | | | 100 million | |
| | | | |
Par value | | $ | 0.10 | |
| | | | |
| |
| Class K | | | |
Net assets | | $ | 7,332,440,794 | |
| | | | |
Shares outstanding | | | 720,212,506 | |
| | | | |
Net asset value | | $ | 10.18 | |
| | | | |
Shares authorized | | | 1 billion | |
| | | | |
Par value | | $ | 0.10 | |
| | | | |
| |
| Class R | | | |
Net assets | | $ | 72,371,077 | |
| | | | |
Shares outstanding | | | 7,103,821 | |
| | | | |
Net asset value | | $ | 10.19 | |
| | | | |
Shares authorized | | | 250 million | |
| | | | |
Par value | | $ | 0.10 | |
| | | | |
See notes to consolidated financial statements.
| | |
| 94 | | 2 0 2 4 B L A C K R O C K A N N U A L F I N A N C I A L S T A T E M E N T S A N D A D D I T I O N A L I N F O R M A T I O N |
Consolidated Statement of Operations
Year Ended September 30, 2024
| | | | |
| |
| | | BlackRock Total Return Fund | |
| |
INVESTMENT INCOME | | | | |
Dividends — unaffiliated | | $ | 1,394,646 | |
Dividends — affiliated | | | 2,126,559 | |
Interest — unaffiliated | | | 38,410,823 | |
Securities lending income — affiliated — net | | | 316 | |
Net investment income allocated from the Master Portfolio: | | | | |
Dividends — unaffiliated | | | 1,789,024 | |
Dividends — affiliated | | | 27,792,857 | |
Interest — unaffiliated | | | 884,834,855 | |
Securities lending income — affiliated — net | | | 160,841 | |
Foreign taxes withheld | | | (74,088 | ) |
Expenses | | | (11,916,027 | ) |
Fees waived | | | 376,195 | |
| | | | |
| |
Total investment income | | | 944,896,001 | |
| | | | |
| |
EXPENSES | | | | |
Investment advisory | | | 54,224,171 | |
Transfer agent — class specific | | | 12,487,078 | |
Service and distribution — class specific | | | 3,952,859 | |
Registration | | | 417,712 | |
Printing and postage | | | 170,258 | |
Custodian | | | 166,706 | |
Professional | | | 41,440 | |
Accounting services | | | 27,786 | |
Directors and Officer | | | 24,684 | |
Miscellaneous | | | 424,550 | |
| | | | |
Total expenses | | | 71,937,244 | |
Less: | | | | |
Fees waived and/or reimbursed by the Manager | | | (52,192 | ) |
Transfer agent fees waived and/or reimbursed by the Manager — class specific | | | (1,782,428 | ) |
| | | | |
| |
Total expenses after fees waived and/or reimbursed | | | 70,102,624 | |
| | | | |
| |
Net investment income | | | 874,793,377 | |
| | | | |
| |
REALIZED AND UNREALIZED GAIN (LOSS) | | | | |
Net realized gain (loss) from: | | | | |
Investments — unaffiliated(a) | | | 16,538,071 | |
Investments — affiliated | | | 14,941 | |
Options written | | | 8,745,554 | |
Futures contracts | | | 1,488,754 | |
Forward foreign currency exchange contracts | | | (5,812,600 | ) |
Foreign currency transactions | | | 1,076,411 | |
Swaps | | | (4,081,157 | ) |
Net realized gain (loss) allocated from the Master Portfolio: | | | | |
Investments — unaffiliated(b) | | | (272,245,130 | ) |
Investments — affiliated | | | 3,046,542 | |
Options written | | | 78,621,487 | |
Futures contracts | | | 73,571,978 | |
Forward foreign currency exchange contracts | | | 7,432,717 | |
Foreign currency transactions | | | (11,164,085 | ) |
Payments by affiliates | | | 26,690 | |
Swaps | | | (27,190,219 | ) |
| | | | |
| | $ | (129,930,046 | ) |
| | | | |
| | |
C O N S O L I D A T E D S T A T E M E N T O F O P E R A T I O N S | | 95 |
Consolidated Statement of Operations (continued)
Year Ended September 30, 2024
| | | | |
| |
| | | BlackRock Total Return Fund | |
| |
Net change in unrealized appreciation (depreciation) on: | | | | |
Investments — unaffiliated | | $ | (164,020,726 | ) |
Investments — affiliated | | | (1,031 | ) |
Options written | | | 3,957,894 | |
Futures contracts | | | (26,106,304 | ) |
Forward foreign currency exchange contracts | | | (673,979 | ) |
Foreign currency translations | | | 9,007,048 | |
Swaps | | | (8,137,865 | ) |
Net change in unrealized appreciation (depreciation) allocated from the Master Portfolio: | | | | |
Investments — unaffiliated | | | 1,492,605,646 | |
Investments — affiliated | | | 1,286,712 | |
Options written | | | 27,415,581 | |
Futures contracts | | | 28,960,789 | |
Forward foreign currency exchange contracts | | | (9,755,716 | ) |
Foreign currency translations | | | 19,092,183 | |
Swaps | | | (8,386,964 | ) |
Unfunded floating rate loan interests | | | 483,068 | |
| | | | |
| | | 1,365,726,336 | |
| | | | |
| |
Net realized and unrealized gain | | | 1,235,796,290 | |
| | | | |
| |
NET INCREASE IN NET ASSETS RESULTING FROM OPERATIONS | | $ | 2,110,589,667 | |
| | | | |
| |
(a) Net of foreign capital gain tax of | | | $(23,364 | ) |
(b) Net of foreign capital gain tax of | | | $(95,379 | ) |
See notes to consolidated financial statements.
| | |
| 96 | | 2 0 2 4 B L A C K R O C K A N N U A L F I N A N C I A L S T A T E M E N T S A N D A D D I T I O N A L I N F O R M A T I O N |
Statements of Changes in Net Assets
| | | | | | | | |
| | | BlackRock Total Return Fund | |
| | |
| | | Year Ended
09/30/24(a) | | | Year Ended 09/30/23 | |
| | |
INCREASE (DECREASE) IN NET ASSETS | | | | | | | | |
| | |
OPERATIONS | | | | | | | | |
Net investment income | | $ | 874,793,377 | | | $ | 709,208,126 | |
Net realized loss | | | (129,930,046 | ) | | | (1,106,283,552 | ) |
Net change in unrealized appreciation (depreciation) | | | 1,365,726,336 | | | | 570,178,841 | |
| | | | | | | | |
Net increase in net assets resulting from operations | | | 2,110,589,667 | | | | 173,103,415 | |
| | | | | | | | |
| | |
DISTRIBUTIONS TO SHAREHOLDERS(b) | | | | | | | | |
From net investment income and net realized gain: | | | | | | | | |
Institutional | | | (482,984,458 | ) | | | (349,245,498 | ) |
Service | | | (1,616,783 | ) | | | (1,408,690 | ) |
Investor A | | | (54,049,354 | ) | | | (45,920,335 | ) |
Investor A1 | | | (709,072 | ) | | | (703,801 | ) |
Investor C | | | (1,413,948 | ) | | | (1,382,997 | ) |
Class K | | | (318,861,885 | ) | | | (255,446,599 | ) |
Class R | | | (2,863,354 | ) | | | (2,103,389 | ) |
Return of capital: | | | | | | | | |
Institutional | | | — | | | | (22,267,190 | ) |
Service | | | — | | | | (89,815 | ) |
Investor A | | | — | | | | (2,927,788 | ) |
Investor A1 | | | — | | | | (44,873 | ) |
Investor C | | | — | | | | (88,177 | ) |
Class K | | | — | | | | (16,286,761 | ) |
Class R | | | — | | | | (134,108 | ) |
| | | | | | | | |
Decrease in net assets resulting from distributions to shareholders | | | (862,498,854 | ) | | | (698,050,021 | ) |
| | | | | | | | |
| | |
CAPITAL SHARE TRANSACTIONS | | | | | | | | |
Net increase in net assets derived from capital share transactions | | | 1,359,076,595 | | | | 1,381,778,602 | |
| | | | | | | | |
| | |
NET ASSETS | | | | | | | | |
Total increase in net assets | | | 2,607,167,408 | | | | 856,831,996 | |
Beginning of year | | | 17,520,140,081 | | | | 16,663,308,085 | |
| | | | | | | | |
End of year | | $ | 20,127,307,489 | | | $ | 17,520,140,081 | |
| | | | | | | | |
| (a) | Consolidated Statements of Changes in Net Assets. |
| (b) | Distributions for annual periods determined in accordance with U.S. federal income tax regulations. |
See notes to consolidated financial statements.
| | |
S T A T E M E N T S O F C H A N G E S I N N E T A S S E T S | | 97 |
Financial Highlights
(For a share outstanding throughout each period)
| | | | | | | | | | | | | | | | | | | | |
| | | BlackRock Total Return Fund | |
| |
| | | Institutional | |
| | | | | |
| |
| Year Ended
09/30/24 |
(a) | |
| Year Ended
09/30/23 |
| |
| Year Ended
09/30/22 |
| |
| Year Ended
09/30/21 |
| |
| Year Ended
09/30/20 |
|
| | | | | | |
Net asset value, beginning of year | | $ | 9.51 | | | $ | 9.76 | | | $ | 11.96 | | | $ | 12.53 | | | $ | 11.95 | |
| | | | | | | | | | | | | | | | | | | | |
Net investment income(b) | | | 0.46 | | | | 0.41 | | | | 0.25 | | | | 0.23 | | | | 0.28 | |
Net realized and unrealized gain (loss) | | | 0.67 | | | | (0.26 | ) | | | (2.13 | ) | | | (0.07 | ) | | | 0.60 | |
| | | | | | | | | | | | | | | | | | | | |
Net increase (decrease) from investment operations | | | 1.13 | | | | 0.15 | | | | (1.88 | ) | | | 0.16 | | | | 0.88 | |
| | | | | | | | | | | | | | | | | | | | |
| | | | | |
Distributions(c) | | | | | | | | | | | | | | | | | | | | |
From net investment income | | | (0.46 | ) | | | (0.38 | ) | | | (0.25 | ) | | | (0.24 | ) | | | (0.30 | ) |
From net realized gain | | | — | | | | — | | | | (0.07 | ) | | | (0.49 | ) | | | — | |
Return of capital | | | — | | | | (0.02 | ) | | | — | | | | — | | | | — | |
| | | | | | | | | | | | | | | | | | | | |
Total distributions | | | (0.46 | ) | | | (0.40 | ) | | | (0.32 | ) | | | (0.73 | ) | | | (0.30 | ) |
| | | | | | | | | | | | | | | | | | | | |
| | | | | |
Net asset value, end of year | | $ | 10.18 | | | $ | 9.51 | | | $ | 9.76 | | | $ | 11.96 | | | $ | 12.53 | |
| | | | | | | | | | | | | | | | | | | | |
| | | | | |
Total Return(d) | | | | | | | | | | | | | | | | | | | | |
Based on net asset value | | | 12.13 | %(e) | | | 1.41 | % | | | (15.99 | )% | | | 1.25 | % | | | 7.51 | %(e) |
| | | | | | | | | | | | | | | | | | | | |
| | | | | |
Ratios to Average Net Assets(f)(g) | | | | | | | | | | | | | | | | | | | | |
Total expenses | | | 0.46 | %(h) | | | 0.45 | %(i) | | | 0.47 | %(i) | | | 0.47 | %(i) | | | 0.47 | %(j) |
| | | | | | | | | | | | | | | | | | | | |
Total expenses after fees waived and/or reimbursed | | | 0.44 | %(h) | | | 0.44 | %(i) | | | 0.45 | %(i) | | | 0.45 | %(i) | | | 0.44 | %(j) |
| | | | | | | | | | | | | | | | | | | | |
Net investment income | | | 4.72 | %(h) | | | 4.08 | %(i) | | | 2.30 | %(i) | | | 1.88 | %(i) | | | 2.32 | %(j) |
| | | | | | | | | | | | | | | | | | | | |
| | | | | |
Supplemental Data | | | | | | | | | | | | | | | | | | | | |
Net assets, end of year (000) | | $ | 11,315,504 | | | $ | 9,557,512 | | | $ | 8,809,121 | | | $ | 9,915,659 | | | $ | 9,067,527 | |
| | | | | | | | | | | | | | | | | | | | |
Portfolio turnover rate(k)(l) | | | 471 | % | | | 380 | % | | | 289 | % | | | 459 | % | | | 556 | % |
| | | | | | | | | | | | | | | | | | | | |
| (a) | Consolidated Financial Highlights. |
| (b) | Based on average shares outstanding. |
| (c) | Distributions for annual periods determined in accordance with U.S. federal income tax regulations. |
| (d) | Where applicable, assumes the reinvestment of distributions. |
| (e) | Includes a payment received from an affiliate, which had no impact on the Fund’s total return. |
| (f) | Includes the Fund’s share of the Master Portfolio’s allocated expenses and/or net investment income. |
| (g) | Excludes fees and expenses incurred indirectly as a result of investments in underlying funds. |
| (h) | From October 1, 2023 through September 13, 2024, the Fund invested in the Master Portfolio as part of a master-feeder structure and received its corresponding allocated fees waived and expenses and/or net investment income from the Master Portfolio. Includes the Fund’s share of the Master Portfolio’s allocated fees waived of less than 0.01%. |
| (i) | Includes the Fund’s share of the Master Portfolio’s allocated fees waived of less than 0.01%. |
| (j) | Includes the Fund’s share of the Master Portfolio’s allocated fees waived of 0.01%. |
| (k) | Portfolio turnover rate includes transactions from the Master Portfolio prior to September 16, 2024. |
| (l) | Includes mortgage dollar roll transactions (“MDRs”). Additional information regarding portfolio turnover rate is as follows: |
| | | | | | | | | | | | | | | | | | | | | | | | |
| | | | | | | |
| | | Year Ended
09/30/24 | | | Year Ended
09/30/23 | | | Year Ended
09/30/22 | | | Year Ended
09/30/21 | | | Year Ended
09/30/20 | | | Year Ended
09/30/19 | |
| | | | | | |
Portfolio turnover rate (excluding MDRs)(k) | | | 292 | % | | | 171 | % | | | 42 | % | | | 161 | % | | | 274 | % | | | 241 | % |
| | | | | | | | | | | | | | | | | | | | | | | | |
See notes to consolidated financial statements.
| | |
| 98 | | 2 0 2 4 B L A C K R O C K A N N U A L F I N A N C I A L S T A T E M E N T S A N D A D D I T I O N A L I N F O R M A T I O N |
Financial Highlights (continued)
(For a share outstanding throughout each period)
| | | | | | | | | | | | | | | | | | | | |
| | | BlackRock Total Return Fund (continued) | |
| |
| | | Service | |
| | | | | |
| | |
| Year Ended
09/30/24 |
(a) | |
| Year Ended
09/30/23 |
| |
| Year Ended
09/30/22 |
| |
| Year Ended
09/30/21 |
| |
| Year Ended
09/30/20 |
|
| | | | | |
Net asset value, beginning of year | | $ | 9.51 | | | $ | 9.77 | | | $ | 11.96 | | | $ | 12.54 | | | $ | 11.95 | |
| | | | | | | | | | | | | | | | | | | | |
Net investment income(b) | | | 0.43 | | | | 0.37 | | | | 0.22 | | | | 0.19 | | | | 0.26 | |
Net realized and unrealized gain (loss) | | | 0.67 | | | | (0.26 | ) | | | (2.12 | ) | | | (0.08 | ) | | | 0.60 | |
| | | | | | | | | | | | | | | | | | | | |
Net increase (decrease) from investment operations | | | 1.10 | | | | 0.11 | | | | (1.90 | ) | | | 0.11 | | | | 0.86 | |
| | | | | | | | | | | | | | | | | | | | |
| | | | | |
Distributions(c) | | | | | | | | | | | | | | | | | | | | |
From net investment income | | | (0.43 | ) | | | (0.35 | ) | | | (0.22 | ) | | | (0.20 | ) | | | (0.27 | ) |
From net realized gain | | | — | | | | — | | | | (0.07 | ) | | | (0.49 | ) | | | — | |
Return of capital | | | — | | | | (0.02 | ) | | | — | | | | — | | | | — | |
| | | | | | | | | | | | | | | | | | | | |
Total distributions | | | (0.43 | ) | | | (0.37 | ) | | | (0.29 | ) | | | (0.69 | ) | | | (0.27 | ) |
| | | | | | | | | | | | | | | | | | | | |
Net asset value, end of year | | $ | 10.18 | | | $ | 9.51 | | | $ | 9.77 | | | $ | 11.96 | | | $ | 12.54 | |
| | | | | | | | | | | | | | | | | | | | |
| | | | | |
Total Return(d) | | | | | | | | | | | | | | | | | | | | |
Based on net asset value | | | 11.79 | %(e) | | | 1.00 | % | | | (16.17 | )% | | | 0.86 | % | | | 7.28 | %(e) |
| | | | | | | | | | | | | | | | | | | | |
| | | | | |
Ratios to Average Net Assets(f)(g) | | | | | | | | | | | | | | | | | | | | |
Total expenses | | | 0.77 | %(h) | | | 0.79 | %(i) | | | 0.80 | %(i) | | | 0.80 | %(i) | | | 0.74 | %(j) |
| | | | | | | | | | | | | | | | | | | | |
Total expenses after fees waived and/or reimbursed | | | 0.75 | %(h) | | | 0.75 | %(i) | | | 0.76 | %(i) | | | 0.76 | %(i) | | | 0.74 | %(j) |
| | | | | | | | | | | | | | | | | | | | |
Net investment income | | | 4.40 | %(h) | | | 3.75 | %(i) | | | 1.98 | %(i) | | | 1.57 | %(i) | | | 2.15 | %(j) |
| | | | | | | | | | | | | | | | | | | | |
| | | | | |
Supplemental Data | | | | | | | | | | | | | | | | | | | | |
Net assets, end of year (000) | | $ | 38,544 | | | $ | 36,341 | | | $ | 42,155 | | | $ | 55,378 | | | $ | 57,849 | |
| | | | | | | | | | | | | | | | | | | | |
Portfolio turnover rate(k)(l) | | | 471 | % | | | 380 | % | | | 289 | % | | | 459 | % | | | 556 | % |
| | | | | | | | | | | | | | | | | | | | |
| (a) | Consolidated Financial Highlights. |
| (b) | Based on average shares outstanding. |
| (c) | Distributions for annual periods determined in accordance with U.S. federal income tax regulations. |
| (d) | Where applicable, assumes the reinvestment of distributions. |
| (e) | Includes a payment received from an affiliate, which had no impact on the Fund’s total return. |
| (f) | Includes the Fund’s share of the Master Portfolio’s allocated expenses and/or net investment income. |
| (g) | Excludes fees and expenses incurred indirectly as a result of investments in underlying funds. |
| (h) | From October 1, 2023 through September 13, 2024, the Fund invested in the Master Portfolio as part of a master-feeder structure and received its corresponding allocated fees waived and expenses and/or net investment income from the Master Portfolio. Includes the Fund’s share of the Master Portfolio’s allocated fees waived of less than 0.01%. |
| (i) | Includes the Fund’s share of the Master Portfolio’s allocated fees waived of less than 0.01%. |
| (j) | Includes the Fund’s share of the Master Portfolio’s allocated fees waived of 0.01%. |
| (k) | Portfolio turnover rate includes transactions from the Master Portfolio prior to September 16, 2024. |
| (l) | Includes mortgage dollar roll transactions (“MDRs”). Additional information regarding portfolio turnover rate is as follows: |
| | | | | | | | | | | | | | | | | | | | | | | | |
| | | | | | | |
| | | Year Ended
09/30/24 | | | Year Ended
09/30/23 | | | Year Ended
09/30/22 | | | Year Ended
09/30/21 | | | Year Ended
09/30/20 | | | Year Ended
09/30/19 | |
| | | | | | |
Portfolio turnover rate (excluding MDRs)(k) | | | 292 | % | | | 171 | % | | | 42 | % | | | 161 | % | | | 274 | % | | | 241 | % |
| | | | | | | | | | | | | | | | | | | | | | | | |
See notes to consolidated financial statements.
| | |
F I N A N C I A L H I G H L I G H T S | | 99 |
Financial Highlights (continued)
(For a share outstanding throughout each period)
| | | | | | | | | | | | | | | | | | | | |
| | | BlackRock Total Return Fund (continued) | |
| |
| | | Investor A | |
| | | | | |
| | |
| Year Ended
09/30/24 |
(a) | |
| Year Ended
09/30/23 |
| |
| Year Ended
09/30/22 |
| |
| Year Ended
09/30/21 |
| |
| Year Ended
09/30/20 |
|
| | | | | |
Net asset value, beginning of year | | $ | 9.51 | | | $ | 9.77 | | | $ | 11.96 | | | $ | 12.54 | | | $ | 11.96 | |
| | | | | | | | | | | | | | | | | | | | |
Net investment income(b) | | | 0.43 | | | | 0.38 | | | | 0.22 | | | | 0.19 | | | | 0.25 | |
Net realized and unrealized gain (loss) | | | 0.68 | | | | (0.27 | ) | | | (2.12 | ) | | | (0.08 | ) | | | 0.60 | |
| | | | | | | | | | | | | | | | | | | | |
Net increase (decrease) from investment operations | | | 1.11 | | | | 0.11 | | | | (1.90 | ) | | | 0.11 | | | | 0.85 | |
| | | | | | | | | | | | | | | | | | | | |
| | | | | |
Distributions(c) | | | | | | | | | | | | | | | | | | | | |
From net investment income | | | (0.43 | ) | | | (0.35 | ) | | | (0.22 | ) | | | (0.20 | ) | | | (0.27 | ) |
From net realized gain | | | — | | | | — | | | | (0.07 | ) | | | (0.49 | ) | | | — | |
Return of capital | | | — | | | | (0.02 | ) | | | — | | | | — | | | | — | |
| | | | | | | | | | | | | | | | | | | | |
Total distributions | | | (0.43 | ) | | | (0.37 | ) | | | (0.29 | ) | | | (0.69 | ) | | | (0.27 | ) |
| | | | | | | | | | | | | | | | | | | | |
Net asset value, end of year | | $ | 10.19 | | | $ | 9.51 | | | $ | 9.77 | | | $ | 11.96 | | | $ | 12.54 | |
| | | | | | | | | | | | | | | | | | | | |
| | | | | |
Total Return(d) | | | | | | | | | | | | | | | | | | | | |
Based on net asset value | | | 11.90 | %(e) | | | 1.01 | % | | | (16.16 | )% | | | 0.87 | % | | | 7.16 | %(e) |
| | | | | | | | | | | | | | | | | | | | |
| | | | | |
Ratios to Average Net Assets(f)(g) | | | | | | | | | | | | | | | | | | | | |
Total expenses | | | 0.74 | %(h) | | | 0.74 | %(i) | | | 0.76 | %(i) | | | 0.74 | %(i) | | | 0.76 | %(j) |
| | | | | | | | | | | | | | | | | | | | |
Total expenses after fees waived and/or reimbursed | | | 0.74 | %(h) | | | 0.74 | %(i) | | | 0.76 | %(i) | | | 0.74 | %(i) | | | 0.76 | %(j) |
| | | | | | | | | | | | | | | | | | | | |
Net investment income | | | 4.42 | %(h) | | | 3.78 | %(i) | | | 1.98 | %(i) | | | 1.58 | %(i) | | | 2.02 | %(j) |
| | | | | | | | | | | | | | | | | | | | |
| | | | | |
Supplemental Data | | | | | | | | | | | | | | | | | | | | |
Net assets, end of year (000) | | $ | 1,316,590 | | | $ | 1,237,078 | | | $ | 1,330,459 | | | $ | 1,822,670 | | | $ | 2,147,025 | |
| | | | | | | | | | | | | | | | | | | | |
Portfolio turnover rate(k)(l) | | | 471 | % | | | 380 | % | | | 289 | % | | | 459 | % | | | 556 | % |
| | | | | | | | | | | | | | | | | | | | |
| (a) | Consolidated Financial Highlights. |
| (b) | Based on average shares outstanding. |
| (c) | Distributions for annual periods determined in accordance with U.S. federal income tax regulations. |
| (d) | Where applicable, excludes the effects of any sales charges and assumes the reinvestment of distributions. |
| (e) | Includes a payment received from an affiliate, which had no impact on the Fund’s total return. |
| (f) | Includes the Fund’s share of the Master Portfolio’s allocated expenses and/or net investment income. |
| (g) | Excludes fees and expenses incurred indirectly as a result of investments in underlying funds. |
| (h) | From October 1, 2023 through September 13, 2024, the Fund invested in the Master Portfolio as part of a master-feeder structure and received its corresponding allocated fees waived and expenses and/or net investment income from the Master Portfolio. Includes the Fund’s share of the Master Portfolio’s allocated fees waived of less than 0.01%. |
| (i) | Includes the Fund’s share of the Master Portfolio’s allocated fees waived of less than 0.01%. |
| (j) | Includes the Fund’s share of the Master Portfolio’s allocated fees waived of 0.01%. |
| (k) | Portfolio turnover rate includes transactions from the Master Portfolio prior to September 16, 2024. |
| (l) | Includes mortgage dollar roll transactions (“MDRs”). Additional information regarding portfolio turnover rate is as follows: |
| | | | | | | | | | | | | | | | | | | | | | | | |
| | | | | | | |
| | | Year Ended
09/30/24 | | | Year Ended
09/30/23 | | | Year Ended
09/30/22 | | | Year Ended
09/30/21 | | | Year Ended
09/30/20 | | | Year Ended
09/30/19 | |
| | | | | | |
Portfolio turnover rate (excluding MDRs)(k) | | | 292 | % | | | 171 | % | | | 42 | % | | | 161 | % | | | 274 | % | | | 241 | % |
| | | | | | | | | | | | | | | | | | | | | | | | |
See notes to consolidated financial statements.
| | |
| 100 | | 2 0 2 4 B L A C K R O C K A N N U A L F I N A N C I A L S T A T E M E N T S A N D A D D I T I O N A L I N F O R M A T I O N |
Financial Highlights (continued)
(For a share outstanding throughout each period)
| | | | | | | | | | | | | | | | | | | | |
| | | BlackRock Total Return Fund (continued) | |
| |
| | | Investor A1 | |
| | | | | |
| |
| Year Ended
09/30/24 |
(a) | |
| Year Ended
09/30/23 |
| |
| Year Ended
09/30/22 |
| |
| Year Ended
09/30/21 |
| |
| Year Ended
09/30/20 |
|
| | | | | | |
Net asset value, beginning of year | | $ | 9.50 | | | $ | 9.76 | | | $ | 11.95 | | | $ | 12.53 | | | $ | 11.95 | |
| | | | | | | | | | | | | | | | | | | | |
Net investment income(b) | | | 0.45 | | | | 0.39 | | | | 0.24 | | | | 0.21 | | | | 0.27 | |
Net realized and unrealized gain (loss) | | | 0.67 | | | | (0.27 | ) | | | (2.13 | ) | | | (0.08 | ) | | | 0.60 | |
| | | | | | | | | | | | | | | | | | | | |
Net increase (decrease) from investment operations | | | 1.12 | | | | 0.12 | | | | (1.89 | ) | | | 0.13 | | | | 0.87 | |
| | | | | | | | | | | | | | | | | | | | |
| | | | | |
Distributions(c) | | | | | | | | | | | | | | | | | | | | |
From net investment income | | | (0.44 | ) | | | (0.36 | ) | | | (0.23 | ) | | | (0.22 | ) | | | (0.29 | ) |
From net realized gain | | | — | | | | — | | | | (0.07 | ) | | | (0.49 | ) | | | — | |
Return of capital | | | — | | | | (0.02 | ) | | | — | | | | — | | | | — | |
| | | | | | | | | | | | | | | | | | | | |
Total distributions | | | (0.44 | ) | | | (0.38 | ) | | | (0.30 | ) | | | (0.71 | ) | | | (0.29 | ) |
| | | | | | | | | | | | | | | | | | | | |
| | | | | |
Net asset value, end of year | | $ | 10.18 | | | $ | 9.50 | | | $ | 9.76 | | | $ | 11.95 | | | $ | 12.53 | |
| | | | | | | | | | | | | | | | | | | | |
| | | | | |
Total Return(d) | | | | | | | | | | | | | | | | | | | | |
Based on net asset value | | | 12.08 | %(e) | | | 1.15 | % | | | (16.04 | )% | | | 1.02 | % | | | 7.35 | %(e) |
| | | | | | | | | | | | | | | | | | | | |
| | | | | |
Ratios to Average Net Assets(f)(g) | | | | | | | | | | | | | | | | | | | | |
Total expenses | | | 0.68 | %(h) | | | 0.71 | %(i) | | | 0.70 | %(i) | | | 0.68 | %(i) | | | 0.61 | %(j) |
| | | | | | | | | | | | | | | | | | | | |
Total expenses after fees waived and/or reimbursed | | | 0.59 | %(h) | | | 0.59 | %(i) | | | 0.60 | %(i) | | | 0.60 | %(i) | | | 0.59 | %(j) |
| | | | | | | | | | | | | | | | | | | | |
Net investment income | | | 4.57 | %(h) | | | 3.90 | %(i) | | | 2.19 | %(i) | | | 1.73 | %(i) | | | 2.22 | %(j) |
| | | | | | | | | | | | | | | | | | | | |
| | | | | |
Supplemental Data | | | | | | | | | | | | | | | | | | | | |
Net assets, end of year (000) | | $ | 15,732 | | | $ | 16,619 | | | $ | 20,124 | | | $ | 21,957 | | | $ | 24,443 | |
| | | | | | | | | | | | | | | | | | | | |
Portfolio turnover rate(k)(l) | | | 471 | % | | | 380 | % | | | 289 | % | | | 459 | % | | | 556 | % |
| | | | | | | | | | | | | | | | | | | | |
| (a) | Consolidated Financial Highlights. |
| (b) | Based on average shares outstanding. |
| (c) | Distributions for annual periods determined in accordance with U.S. federal income tax regulations. |
| (d) | Where applicable, excludes the effects of any sales charges and assumes the reinvestment of distributions. |
| (e) | Includes a payment received from an affiliate, which had no impact on the Fund’s total return. |
| (f) | Includes the Fund’s share of the Master Portfolio’s allocated expenses and/or net investment income. |
| (g) | Excludes fees and expenses incurred indirectly as a result of investments in underlying funds. |
| (h) | From October 1, 2023 through September 13, 2024, the Fund invested in the Master Portfolio as part of a master-feeder structure and received its corresponding allocated fees waived and expenses and/or net investment income from the Master Portfolio. Includes the Fund’s share of the Master Portfolio’s allocated fees waived of less than 0.01%. |
| (i) | Includes the Fund’s share of the Master Portfolio’s allocated fees waived of less than 0.01%. |
| (j) | Includes the Fund’s share of the Master Portfolio’s allocated fees waived of 0.01%. |
| (k) | Portfolio turnover rate includes transactions from the Master Portfolio prior to September 16, 2024. |
| (l) | Includes mortgage dollar roll transactions (“MDRs”). Additional information regarding portfolio turnover rate is as follows: |
| | | | | | | | | | | | | | | | | | | | | | | | |
| | | | | | | |
| | | Year Ended
09/30/24 | | | Year Ended
09/30/23 | | | Year Ended
09/30/22 | | | Year Ended
09/30/21 | | | Year Ended
09/30/20 | | | Year Ended
09/30/19 | |
| | | | | | |
Portfolio turnover rate (excluding MDRs)(k) | | | 292 | % | | | 171 | % | | | 42 | % | | | 161 | % | | | 274 | % | | | 241 | % |
| | | | | | | | | | | | | | | | | | | | | | | | |
See notes to consolidated financial statements.
| | |
F I N A N C I A L H I G H L I G H T S | | 101 |
Financial Highlights (continued)
(For a share outstanding throughout each period)
| | | | | | | | | | | | | | | | | | | | |
| | | BlackRock Total Return Fund (continued) | |
| |
| | | Investor C | |
| | | | | |
| |
| Year Ended
09/30/24 |
(a) | |
| Year Ended
09/30/23 |
| |
| Year Ended
09/30/22 |
| |
| Year Ended
09/30/21 |
| |
| Year Ended
09/30/20 |
|
| | | | | | |
Net asset value, beginning of year | | $ | 9.50 | | | $ | 9.76 | | | $ | 11.95 | | | $ | 12.53 | | | $ | 11.95 | |
| | | | | | | | | | | | | | | | | | | | |
Net investment income(b) | | | 0.36 | | | | 0.30 | | | | 0.14 | | | | 0.11 | | | | 0.16 | |
Net realized and unrealized gain (loss) | | | 0.68 | | | | (0.26 | ) | | | (2.12 | ) | | | (0.08 | ) | | | 0.60 | |
| | | | | | | | | | | | | | | | | | | | |
Net increase (decrease) from investment operations | | | 1.04 | | | | 0.04 | | | | (1.98 | ) | | | 0.03 | | | | 0.76 | |
| | | | | | | | | | | | | | | | | | | | |
| | | | | |
Distributions(c) | | | | | | | | | | | | | | | | | | | | |
From net investment income | | | (0.36 | ) | | | (0.28 | ) | | | (0.14 | ) | | | (0.12 | ) | | | (0.18 | ) |
From net realized gain | | | — | | | | — | | | | (0.07 | ) | | | (0.49 | ) | | | — | |
Return of capital | | | — | | | | (0.02 | ) | | | — | | | | — | | | | — | |
| | | | | | | | | | | | | | | | | | | | |
Total distributions | | | (0.36 | ) | | | (0.30 | ) | | | (0.21 | ) | | | (0.61 | ) | | | (0.18 | ) |
| | | | | | | | | | | | | | | | | | | | |
| | | | | |
Net asset value, end of year | | $ | 10.18 | | | $ | 9.50 | | | $ | 9.76 | | | $ | 11.95 | | | $ | 12.53 | |
| | | | | | | | | | | | | | | | | | | | |
| | | | | |
Total Return(d) | | | | | | | | | | | | | | | | | | | | |
Based on net asset value | | | 11.14 | %(e) | | | 0.30 | % | | | (16.76 | )% | | | 0.16 | % | | | 6.44 | %(e) |
| | | | | | | | | | | | | | | | | | | | |
| | | | | |
Ratios to Average Net Assets(f)(g) | | | | | | | | | | | | | | | | | | | | |
Total expenses | | | 1.50 | %(h) | | | 1.49 | %(i) | | | 1.48 | %(i)(j) | | | 1.47 | %(i) | | | 1.49 | %(k) |
| | | | | | | | | | | | | | | | | | | | |
Total expenses after fees waived and/or reimbursed | | | 1.44 | %(h) | | | 1.44 | %(i) | | | 1.46 | %(i)(j) | | | 1.45 | %(i) | | | 1.44 | %(k) |
| | | | | | | | | | | | | | | | | | | | |
Net investment income | | | 3.71 | %(h) | | | 3.06 | %(i) | | | 1.23 | %(i) | | | 0.89 | %(i) | | | 1.36 | %(k) |
| | | | | | | | | | | | | | | | | | | | |
| | | | | |
Supplemental Data | | | | | | | | | | | | | | | | | | | | |
Net assets, end of year (000) | | $ | 36,126 | | | $ | 42,501 | | | $ | 56,468 | | | $ | 100,462 | | | $ | 140,034 | |
| | | | | | | | | | | | | | | | | | | | |
Portfolio turnover rate(l)(m) | | | 471 | % | | | 380 | % | | | 289 | % | | | 459 | % | | | 556 | % |
| | | | | | | | | | | | | | | | | | | | |
| (a) | Consolidated Financial Highlights. |
| (b) | Based on average shares outstanding. |
| (c) | Distributions for annual periods determined in accordance with U.S. federal income tax regulations. |
| (d) | Where applicable, excludes the effects of any sales charges and assumes the reinvestment of distributions. |
| (e) | Includes a payment received from an affiliate, which had no impact on the Fund’s total return. |
| (f) | Includes the Fund’s share of the Master Portfolio’s allocated expenses and/or net investment income. |
| (g) | Excludes fees and expenses incurred indirectly as a result of investments in underlying funds. |
| (h) | From October 1, 2023 through September 13, 2024, the Fund invested in the Master Portfolio as part of a master-feeder structure and received its corresponding allocated fees waived and expenses and/or net investment income from the Master Portfolio. Includes the Fund’s share of the Master Portfolio’s allocated fees waived of less than 0.01%. |
| (i) | Includes the Fund’s share of the Master Portfolio’s allocated fees waived of less than 0.01%. |
| (j) | Includes non-recurring expenses of proxy costs. Without these costs, total expenses and total expenses after fees waived and/or reimbursed would have been 1.46% and 1.44%, respectively. |
| (k) | Includes the Fund’s share of the Master Portfolio’s allocated fees waived of 0.01%. |
| (l) | Portfolio turnover rate includes transactions from the Master Portfolio prior to September 16, 2024. |
| (m) | Includes mortgage dollar roll transactions (“MDRs”). Additional information regarding portfolio turnover rate is as follows: |
| | | | | | | | | | | | | | | | | | | | | | | | |
| | | | | | | |
| | | Year Ended
09/30/24 | | | Year Ended
09/30/23 | | | Year Ended
09/30/22 | | | Year Ended
09/30/21 | | | Year Ended
09/30/20 | | | Year Ended
09/30/19 | |
| | | | | | |
Portfolio turnover rate (excluding MDRs)(l) | | | 292 | % | | | 171 | % | | | 42 | % | | | 161 | % | | | 274 | % | | | 241 | % |
| | | | | | | | | | | | | | | | | | | | | | | | |
See notes to consolidated financial statements.
| | |
| 102 | | 2 0 2 4 B L A C K R O C K A N N U A L F I N A N C I A L S T A T E M E N T S A N D A D D I T I O N A L I N F O R M A T I O N |
Financial Highlights (continued)
(For a share outstanding throughout each period)
| | | | | | | | | | | | | | | | | | | | |
| | | BlackRock Total Return Fund (continued) | |
| |
| | | Class K | |
| | | | | |
| |
| Year Ended
09/30/24 |
(a) | |
| Year Ended
09/30/23 |
| |
| Year Ended
09/30/22 |
| |
| Year Ended
09/30/21 |
| |
| Year Ended
09/30/20 |
|
| | | | | | |
Net asset value, beginning of year | | $ | 9.50 | | | $ | 9.76 | | | $ | 11.96 | | | $ | 12.53 | | | $ | 11.95 | |
| | | | | | | | | | | | | | | | | | | | |
Net investment income(b) | | | 0.47 | | | | 0.41 | | | | 0.26 | | | | 0.24 | | | | 0.29 | |
Net realized and unrealized gain (loss) | | | 0.67 | | | | (0.26 | ) | | | (2.13 | ) | | | (0.07 | ) | | | 0.60 | |
| | | | | | | | | | | | | | | | | | | | |
Net increase (decrease) from investment operations | | | 1.14 | | | | 0.15 | | | | (1.87 | ) | | | 0.17 | | | | 0.89 | |
| | | | | | | | | | | | | | | | | | | | |
| | | | | |
Distributions(c) | | | | | | | | | | | | | | | | | | | | |
From net investment income | | | (0.46 | ) | | | (0.39 | ) | | | (0.26 | ) | | | (0.25 | ) | | | (0.31 | ) |
From net realized gain | | | — | | | | — | | | | (0.07 | ) | | | (0.49 | ) | | | — | |
Return of capital | | | — | | | | (0.02 | ) | | | — | | | | — | | | | — | |
| | | | | | | | | | | | | | | | | | | | |
Total distributions | | | (0.46 | ) | | | (0.41 | ) | | | (0.33 | ) | | | (0.74 | ) | | | (0.31 | ) |
| | | | | | | | | | | | | | | | | | | | |
| | | | | |
Net asset value, end of year | | $ | 10.18 | | | $ | 9.50 | | | $ | 9.76 | | | $ | 11.96 | | | $ | 12.53 | |
| | | | | | | | | | | | | | | | | | | | |
| | | | | |
Total Return(d) | | | | | | | | | | | | | | | | | | | | |
Based on net asset value | | | 12.33 | %(e) | | | 1.38 | % | | | (15.93 | )% | | | 1.32 | % | | | 7.59 | %(e) |
| | | | | | | | | | | | | | | | | | | | |
| | | | | |
Ratios to Average Net Assets(f)(g) | | | | | | | | | | | | | | | | | | | | |
Total expenses | | | 0.37 | %(h) | | | 0.37 | %(i) | | | 0.38 | %(i) | | | 0.38 | %(i) | | | 0.37 | %(j) |
| | | | | | | | | | | | | | | | | | | | |
Total expenses after fees waived and/or reimbursed | | | 0.37 | %(h) | | | 0.37 | %(i) | | | 0.38 | %(i) | | | 0.38 | %(i) | | | 0.37 | %(j) |
| | | | | | | | | | | | | | | | | | | | |
Net investment income | | | 4.79 | %(h) | | | 4.16 | %(i) | | | 2.37 | %(i) | | | 1.94 | %(i) | | | 2.41 | %(j) |
| | | | | | | | | | | | | | | | | | | | |
| | | | | |
Supplemental Data | | | | | | | | | | | | | | | | | | | | |
Net assets, end of year (000) | | $ | 7,332,441 | | | $ | 6,563,237 | | | $ | 6,340,122 | | | $ | 8,472,180 | | | $ | 7,491,107 | |
| | | | | | | | | | | | | | | | | | | | |
Portfolio turnover rate(k)(l) | | | 471 | % | | | 380 | % | | | 289 | % | | | 459 | % | | | 556 | % |
| | | | | | | | | | | | | | | | | | | | |
| (a) | Consolidated Financial Highlights. |
| (b) | Based on average shares outstanding. |
| (c) | Distributions for annual periods determined in accordance with U.S. federal income tax regulations. |
| (d) | Where applicable, assumes the reinvestment of distributions. |
| (e) | Includes a payment received from an affiliate, which had no impact on the Fund’s total return. |
| (f) | Includes the Fund’s share of the Master Portfolio’s allocated expenses and/or net investment income. |
| (g) | Excludes fees and expenses incurred indirectly as a result of investments in underlying funds. |
| (h) | From October 1, 2023 through September 13, 2024, the Fund invested in the Master Portfolio as part of a master-feeder structure and received its corresponding allocated fees waived and expenses and/or net investment income from the Master Portfolio. Includes the Fund’s share of the Master Portfolio’s allocated fees waived of less than 0.01%. |
| (i) | Includes the Fund’s share of the Master Portfolio’s allocated fees waived of less than 0.01%. |
| (j) | Includes the Fund’s share of the Master Portfolio’s allocated fees waived of 0.01%. |
| (k) | Portfolio turnover rate includes transactions from the Master Portfolio prior to September 16, 2024. |
| (l) | Includes mortgage dollar roll transactions (“MDRs”). Additional information regarding portfolio turnover rate is as follows: |
| | | | | | | | | | | | | | | | | | | | | | | | |
| | | | | | | |
| | | Year Ended
09/30/24 | | | Year Ended
09/30/23 | | | Year Ended
09/30/22 | | | Year Ended
09/30/21 | | | Year Ended
09/30/20 | | | Year Ended
09/30/19 | |
| | | | | | |
Portfolio turnover rate (excluding MDRs)(k) | | | 292 | % | | | 171 | % | | | 42 | % | | | 161 | % | | | 274 | % | | | 241 | % |
| | | | | | | | | | | | | | | | | | | | | | | | |
See notes to consolidated financial statements.
| | |
F I N A N C I A L H I G H L I G H T S | | 103 |
Financial Highlights (continued)
(For a share outstanding throughout each period)
| | | | | | | | | | | | | | | | | | | | |
| | | BlackRock Total Return Fund (continued) | |
| |
| | | Class R | |
| | | | | |
| |
| Year Ended
09/30/24 |
(a) | |
| Year Ended
09/30/23 |
| |
| Year Ended
09/30/22 |
| |
| Year Ended
09/30/21 |
| |
| Year Ended
09/30/20 |
|
| | | | | | |
Net asset value, beginning of year | | $ | 9.51 | | | $ | 9.77 | | | $ | 11.96 | | | $ | 12.54 | | | $ | 11.96 | |
| | | | | | | | | | | | | | | | | | | | |
Net investment income(b) | | | 0.41 | | | | 0.35 | | | | 0.19 | | | | 0.16 | | | | 0.22 | |
Net realized and unrealized gain (loss) | | | 0.67 | | | | (0.27 | ) | | | (2.13 | ) | | | (0.08 | ) | | | 0.59 | |
| | | | | | | | | | | | | | | | | | | | |
Net increase (decrease) from investment operations | | | 1.08 | | | | 0.08 | | | | (1.94 | ) | | | 0.08 | | | | 0.81 | |
| | | | | | | | | | | | | | | | | | | | |
| | | | | |
Distributions(c) | | | | | | | | | | | | | | | | | | | | |
From net investment income | | | (0.40 | ) | | | (0.32 | ) | | | (0.18 | ) | | | (0.17 | ) | | | (0.23 | ) |
From net realized gain | | | — | | | | — | | | | (0.07 | ) | | | (0.49 | ) | | | — | |
Return of capital | | | — | | | | (0.02 | ) | | | — | | | | — | | | | — | |
| | | | | | | | | | | | | | | | | | | | |
Total distributions | | | (0.40 | ) | | | (0.34 | ) | | | (0.25 | ) | | | (0.66 | ) | | | (0.23 | ) |
| | | | | | | | | | | | | | | | | | | | |
| | | | | |
Net asset value, end of year | | $ | 10.19 | | | $ | 9.51 | | | $ | 9.77 | | | $ | 11.96 | | | $ | 12.54 | |
| | | | | | | | | | | | | | | | | | | | |
| | | | | |
Total Return(d) | | | | | | | | | | | | | | | | | | | | |
Based on net asset value | | | 11.59 | %(e) | | | 0.72 | % | | | (16.40 | )% | | | 0.57 | % | | | 6.88 | %(e) |
| | | | | | | | | | | | | | | | | | | | |
| | | | | |
Ratios to Average Net Assets(f)(g) | | | | | | | | | | | | | | | | | | | | |
Total expenses | | | 1.04 | %(h) | | | 1.05 | %(i) | | | 1.06 | %(i) | | | 1.05 | %(i) | | | 1.04 | %(j) |
| | | | | | | | | | | | | | | | | | | | |
Total expenses after fees waived and/or reimbursed | | | 1.03 | %(h) | | | 1.03 | %(i) | | | 1.04 | %(i) | | | 1.04 | %(i) | | | 1.03 | %(j) |
| | | | | | | | | | | | | | | | | | | | |
Net investment income | | | 4.13 | %(h) | | | 3.48 | %(i) | | | 1.71 | %(i) | | | 1.29 | %(i) | | | 1.80 | %(j) |
| | | | | | | | | | | | | | | | | | | | |
| | | | | |
Supplemental Data | | | | | | | | | | | | | | | | | | | | |
Net assets, end of year (000) | | $ | 72,371 | | | $ | 66,850 | | | $ | 64,860 | | | $ | 85,906 | | | $ | 85,550 | |
| | | | | | | | | | | | | | | | | | | | |
Portfolio turnover rate(k)(l) | | | 471 | % | | | 380 | % | | | 289 | % | | | 459 | % | | | 556 | % |
| | | | | | | | | | | | | | | | | | | | |
| (a) | Consolidated Financial Highlights. |
| (b) | Based on average shares outstanding. |
| (c) | Distributions for annual periods determined in accordance with U.S. federal income tax regulations. |
| (d) | Where applicable, assumes the reinvestment of distributions. |
| (e) | Includes a payment received from an affiliate, which had no impact on the Fund’s total return. |
| (f) | Includes the Fund’s share of the Master Portfolio’s allocated expenses and/or net investment income. |
| (g) | Excludes fees and expenses incurred indirectly as a result of investments in underlying funds. |
| (h) | From October 1, 2023 through September 13, 2024, the Fund invested in the Master Portfolio as part of a master-feeder structure and received its corresponding allocated fees waived and expenses and/or net investment income from the Master Portfolio. Includes the Fund’s share of the Master Portfolio’s allocated fees waived of less than 0.01%. |
| (i) | Includes the Fund’s share of the Master Portfolio’s allocated fees waived of less than 0.01%. |
| (j) | Includes the Fund’s share of the Master Portfolio’s allocated fees waived of 0.01%. |
| (k) | Portfolio turnover rate includes transactions from the Master Portfolio prior to September 16, 2024. |
| (l) | Includes mortgage dollar roll transactions (“MDRs”). Additional information regarding portfolio turnover rate is as follows: |
| | | | | | | | | | | | | | | | | | | | | | | | |
| | | | | | | |
| | | Year Ended
09/30/24 | | | Year Ended
09/30/23 | | | Year Ended
09/30/22 | | | Year Ended
09/30/21 | | | Year Ended
09/30/20 | | | Year Ended
09/30/19 | |
| | | | | | |
Portfolio turnover rate (excluding MDRs)(k) | | | 292 | % | | | 171 | % | | | 42 | % | | | 161 | % | | | 274 | % | | | 241 | % |
| | | | | | | | | | | | | | | | | | | | | | | | |
See notes to consolidated financial statements.
| | |
| 104 | | 2 0 2 4 B L A C K R O C K A N N U A L F I N A N C I A L S T A T E M E N T S A N D A D D I T I O N A L I N F O R M A T I O N |
Notes to Consolidated Financial Statements
1. ORGANIZATION
BlackRock Bond Fund, Inc. (the “Corporation”) is registered under the Investment Company Act of 1940, as amended (the “1940 Act”), as an open-end management investment company. The Corporation is organized as a Maryland corporation. BlackRock Total Return Fund (the “Fund”) is a series of the Corporation. The Fund is classified as diversified.
The Fund offers multiple classes of shares. All classes of shares have identical voting, dividend, liquidation and other rights and are subject to the same terms and conditions, except that certain classes bear expenses related to the shareholder servicing and distribution of such shares. Institutional, Service and Class K Shares are sold only to certain eligible investors. Service, Investor A, Investor A1, Investor C and Class R Shares bear certain expenses related to shareholder servicing of such shares, and Investor C and Class R Shares also bear certain expenses related to the distribution of such shares. Investor A and Investor C Shares are generally available through financial intermediaries. Investor A1 Shares are only available for dividend and capital gain reinvestment by existing shareholders, and for purchase by certain employer-sponsored retirement plans. Class R Shares are sold only to certain employer-sponsored retirement plans. Each class has exclusive voting rights with respect to matters relating to its shareholder servicing and distribution expenditures (except that Investor C shareholders may vote on material changes to the Investor A Shares distribution and service plan).
The Board of Directors of the Corporation are referred to throughout this report as the “Board of Directors” or the “Board” and the members are referred to as “Directors”.
| | | | | | | | | | |
| Share Class | | Initial Sales Charge | | | CDSC | | | Conversion Privilege |
Institutional, Service, Class K and Class R Shares | | | No | | | | No | | | None |
Investor A Shares | | | Yes | | | | No | (a) | | None |
Investor A1 Shares | | | No | (b) | | | No | (c) | | None |
| Investor C Shares | | | No | | | | Yes | (d) | | To Investor A Shares after approximately 8 years |
| (a) | Investor A Shares may be subject to a contingent deferred sales charge (“CDSC”) for certain redemptions where no initial sales charge was paid at the time of purchase. |
| (b) | Investor A1 Shares are subject to a maximum sales charge on purchases of 1.00%. The sales charge does not apply to dividend and capital gain reinvestments by existing shareholders and new purchases for certain employer-sponsored retirement plans, which are currently the only investors who may invest in Investor A1 Shares. |
| (c) | Investor A1 Shares may be subject to a CDSC for certain redemptions where no initial sales charge was paid at the time of purchase. However, the CDSC does not apply to redemptions by certain employer-sponsored retirement plans or to redemptions of shares acquired through reinvestment of dividends and capital gains by existing shareholders. |
| (d) | A CDSC of 1.00% is assessed on certain redemptions of Investor C Shares made within one year after purchase. |
Prior to September 16, 2024, the Fund invested all of its assets in Master Total Return Portfolio (the “Master Portfolio”), a series of Master Bond LLC (the “Master LLC”) and an affiliate of the Fund, which had the same investment objective and strategies as the Fund. The value of the Fund’s investment in the Master Portfolio reflected the Fund’s proportionate interest in the net assets of the Master Portfolio. The performance of the Fund was directly affected by the performance of the Master Portfolio. As of September 16, 2024, the Fund owned 100% of the Master Portfolio. For the period October 1, 2023 to September 16, 2024, the Master Portfolio allocated $902,963,657, $(147,900,020) and $1,551,701,299 from net investment income, net realized losses and net change in unrealized appreciation (depreciation), respectively, to the Fund.
On September 16, 2024, the Fund ceased to invest in the Master Portfolio as part of a “master-feeder” structure and began to operate as a stand-alone fund. The Fund received net assets of $20,147,557,834, which included net unrealized depreciation of $(257,176,897) in exchange for its ownership in the Master Portfolio. The cost basis for the investments received from the Master Portfolio was carried forward to align ongoing reporting of the Fund’s realized and unrealized gains and losses with amounts distributable to shareholders for tax purposes. The change into a stand-alone structure did not result in a change in net assets of the Fund and did not create a taxable event for the Fund or its shareholders.
Basis of Consolidation: The accompanying consolidated financial statements of the Fund include the accounts of BlackRock Cayman Master Total Return Portfolio II, Ltd. (the “Cayman Subsidiary”), which is a wholly-owned subsidiary of the Fund and primarily invests in commodity-related instruments. The Cayman Subsidiary enables the Fund to hold these commodity-related instruments and satisfy regulated investment company tax requirements. The Fund may invest up to 25% of its total assets in the Cayman Subsidiary. The net assets of the Cayman Subsidiary as of period end were $267,000, which is less than 0.1% of the Fund’s consolidated net assets. Intercompany accounts and transactions, if any, have been eliminated. The Cayman Subsidiary is subject to the same investment policies and restrictions that apply to the Fund, except that the Cayman Subsidiary may invest without limitation in commodity-related instruments.
The accompanying consolidated financial statements of the Fund include the accounts of BlackRock Master Total Return Portfolio Subsidiary, LLC (the “Taxable Subsidiary”), which is a wholly-owned taxable subsidiary of the Fund. The Taxable Subsidiary enables the Fund to hold certain pass-through investments and satisfy regulated investment company tax requirements. Income earned and gains realized on the investment held by the Taxable Subsidiary are taxable to such subsidiary. A tax provision for income, if any, is shown as income tax in the Consolidated Statement of Operations for the Fund. A tax provision for realized and unrealized gains, if any, is included as a reduction of realized and/or unrealized gain (loss) in the Consolidated Statement of Operations for the Fund. Taxes payable or deferred as of September 30, 2024, if any, are disclosed in the Consolidated Statement of Assets and Liabilities. The Fund may invest up to 25% of its total assets in the Taxable Subsidiary. The net assets of the Taxable Subsidiary as of period end were $6,116,913, which is less than 0.1% of the Fund’s consolidated net assets. Intercompany accounts and transactions, if any, have been eliminated. The Taxable Subsidiary is subject to the same investment policies and restrictions that apply to the Fund.
The Fund, together with certain other registered investment companies advised by the Manager its affiliates, is included in a complex of funds referred to as the BlackRock Fixed-Income Complex.
2. SIGNIFICANT ACCOUNTING POLICIES
The consolidated financial statements are prepared in conformity with accounting principles generally accepted in the United States of America (“U.S. GAAP”), which may require management to make estimates and assumptions that affect the reported amounts of assets and liabilities in the financial statements, disclosure of contingent assets and liabilities at the date of the financial statements and the reported amounts of increases and decreases in net assets from operations during the reporting period. Actual
| | |
N O T E S T O C O N S O L I D A T E D F I N A N C I A L S T A T E M E N T S | | 105 |
Notes to Consolidated Financial Statements (continued)
results could differ from those estimates. The Fund is considered an investment company under U.S. GAAP and follows the accounting and reporting guidance applicable to investment companies. Below is a summary of significant accounting policies:
Investment Transactions and Income Recognition: For financial reporting purposes, investment transactions are recorded on the dates the transactions are executed. Realized gains and losses on investment transactions are determined using the specific identification method. Dividend income and capital gain distributions, if any, are recorded on the ex-dividend dates. Non-cash dividends, if any, are recorded on the ex-dividend dates at fair value. Dividends from foreign securities where the ex-dividend dates may have passed are subsequently recorded when the Fund is informed of the ex-dividend dates. Under the applicable foreign tax laws, a withholding tax at various rates may be imposed on capital gains, dividends and interest. Upon notification from issuers, a portion of the dividend income received from a real estate investment trust may be redesignated as a reduction of cost of the related investment and/or realized gain. Interest income, including amortization and accretion of premiums and discounts on debt securities, and payment-in-kind interest are recognized daily on an accrual basis. Income, expenses and realized and unrealized gains and losses are allocated daily to each class based on its relative net assets. For convertible securities, premiums attributable to the debt instrument are amortized, but premiums attributable to the conversion feature are not amortized.
Prior to September 16, 2024, for financial reporting purposes, the Fund’s contributions to and withdrawals from the Master Portfolio were accounted for on a trade date basis. The Fund recorded its proportionate share of the Master Portfolio’s income, expenses and realized and unrealized gains and losses on a daily basis. Realized and unrealized gains and losses were adjusted utilizing partnership tax allocation rules. In addition, the Fund accrued its own expenses. Income, expenses and realized and unrealized gains and losses were allocated daily to each class based on its relative net assets.
Foreign Currency Translation: The Fund’s books and records are maintained in U.S. dollars. Securities and other assets and liabilities denominated in foreign currencies are translated into U.S. dollars using exchange rates determined as of the close of trading on the New York Stock Exchange (“NYSE”). Purchases and sales of investments are recorded at the rates of exchange prevailing on the respective dates of such transactions. Generally, when the U.S. dollar rises in value against a foreign currency, the investments denominated in that currency will lose value; the opposite effect occurs if the U.S. dollar falls in relative value.
The Fund does not isolate the effect of fluctuations in foreign exchange rates from the effect of fluctuations in the market prices of investments for financial reporting purposes. Accordingly, the effects of changes in exchange rates on investments are not segregated in the Consolidated Statement of Operations from the effects of changes in market prices of those investments, but are included as a component of net realized and unrealized gain (loss) from investments. The Fund reports realized currency gains (losses) on foreign currency related transactions as components of net realized gain (loss) for financial reporting purposes, whereas such components are generally treated as ordinary income for U.S. federal income tax purposes.
Foreign Taxes: The Fund may be subject to foreign taxes (a portion of which may be reclaimable) on income, stock dividends, capital gains on investments, or certain foreign currency transactions. All foreign taxes are recorded in accordance with the applicable foreign tax regulations and rates that exist in the foreign jurisdictions in which the Fund invests. These foreign taxes, if any, are paid by the Fund and are reflected in its Consolidated Statement of Operations as follows: foreign taxes withheld at source are presented as a reduction of income, foreign taxes on securities lending income are presented as a reduction of securities lending income, foreign taxes on stock dividends are presented as “Foreign taxes withheld”, and foreign taxes on capital gains from sales of investments and foreign taxes on foreign currency transactions are included in their respective net realized gain (loss) categories. Foreign taxes payable or deferred as of September 30, 2024, if any, are disclosed in the Consolidated Statement of Assets and Liabilities.
Consistent with U.S. GAAP accrual requirements for uncertain tax positions, the Fund recognizes tax reclaims when the Fund determines that it is more likely than not that the Fund will sustain its position that it is due the reclaim.
The Fund files withholding tax reclaims in certain jurisdictions to recover a portion of amounts previously withheld. The Fund may record a reclaim receivable based on collectability, which includes factors such as the jurisdiction’s applicable laws, payment history and market convention. The Consolidated Statement of Operations includes tax reclaims recorded as well as professional and other fees, if any, associated with recovery of foreign withholding taxes.
Bank Overdraft: The Fund had outstanding cash disbursements exceeding deposited cash amounts at the custodian during the reporting period . The Fund is obligated to repay the custodian for any overdraft, including any related costs or expenses, where applicable. For financial reporting purposes, overdraft fees, if any,are included in interest expense in the Consolidated Statement of Operations.
Collateralization: If required by an exchange or counterparty agreement, the Fund may be required to deliver/deposit cash and/or securities to/with an exchange, or broker-dealer or custodian as collateral for certain investments.
Distributions: Distributions from net investment income are declared daily and paid monthly. Distributions of capital gains are recorded on the ex-dividend dates and made at least annually. The portion of distributions, if any, that exceeds a fund’s current and accumulated earnings and profits, as measured on a tax basis, constitute a non-taxable return of capital. The character and timing of distributions are determined in accordance with U.S. federal income tax regulations, which may differ from U.S. GAAP. Net income and realized gains from investments held by the Cayman Subsidiary are treated as ordinary income for tax purposes. If a net loss is realized by the Cayman Subsidiary in any taxable year, the loss will generally not be available to offset the Fund’s ordinary income and/or capital gains for that year.
Deferred Compensation Plan: Under the Deferred Compensation Plan (the “Plan”) approved by the Corporation’s Board, the directors who are not “interested persons” of the Corporation, as defined in the 1940 Act (“Independent Directors”), may defer a portion of their annual complex-wide compensation. Deferred amounts earn an approximate return as though equivalent dollar amounts had been invested in common shares of certain funds in the BlackRock Fixed-Income Complex selected by the Independent Directors. This has the same economic effect for the Independent Directors as if the Independent Directors had invested the deferred amounts directly in certain funds in the BlackRock Fixed-Income Complex.
| | |
| 106 | | 2 0 2 4 B L A C K R O C K A N N U A L F I N A N C I A L S T A T E M E N T S A N D A D D I T I O N A L I N F O R M A T I O N |
Notes to Consolidated Financial Statements (continued)
The Plan is not funded and obligations thereunder represent general unsecured claims against the general assets of the Fund, as applicable. Deferred compensation liabilities, if any, are included in the Officer’s fees payable in the Statement of Assets and Liabilities and will remain as a liability of the Fund until such amounts are distributed in accordance with the Plan. Net appreciation (depreciation) in the value of participants’ deferral accounts is allocated among the participating funds in the BlackRock Fixed Income Complex and reflected as Trustee and Officer expense on the Statement of Operations. The Trustee and Officer expense may be negative as a result of a decrease in value of the deferred account.
Indemnifications: In the normal course of business, the Fund enters into contracts that contain a variety of representations that provide general indemnification. The Fund’s maximum exposure under these arrangements is unknown because it involves future potential claims against the Fund, which cannot be predicted with any certainty.
Other: Expenses directly related to the Fund or its classes are charged to the Fund or the applicable class. Expenses directly related to the Fund and other shared expenses prorated to the Fund are allocated daily to each class based on its relative net assets or other appropriate methods. Other operating expenses shared by several funds, including other funds managed by the Manager, are prorated among those funds on the basis of relative net assets or other appropriate methods.
The Fund has an arrangement with its custodian whereby credits are earned on uninvested cash balances. For financial reporting purposes, custodian credits, if any, are included in interest income in the Consolidated Statement of Operations.
3. INVESTMENT VALUATION AND FAIR VALUE MEASUREMENTS
Investment Valuation Policies: The Fund’s investments are valued at fair value (also referred to as “market value” within the financial statements) each day that the Fund is open for business and, for financial reporting purposes, as of the report date. U.S. GAAP defines fair value as the price a fund would receive to sell an asset or pay to transfer a liability in an orderly transaction between market participants at the measurement date. The Board has approved the designation of the Manager as the valuation designee for the Fund under rule 2a-5 under the 1940 Act. The Fund determines the fair values of its financial instruments using various independent dealers or pricing services under the Manager’s policies. If a security’s market price is not readily available or does not otherwise accurately represent the fair value of the security, the security will be valued in accordance with the Manager’s policies and procedures as reflecting fair value. The Manager has formed a committee (the “Valuation Committee”) to develop pricing policies and procedures and to oversee the pricing function for all financial instruments, with assistance from other BlackRock pricing committees. Prior to September 16, 2024, the Fund recorded its investment in the Master Portfolio at fair value based on the Fund’s proportionate interest in the net assets of the Master Portfolio.
Fair Value Inputs and Methodologies: The following methods and inputs are used to establish the fair value of the Fund’s assets and liabilities:
| | • | | Equity investments traded on a recognized securities exchange are valued at that day’s official closing price, as applicable, on the exchange where the stock is primarily traded. Equity investments traded on a recognized exchange for which there were no sales on that day may be valued at the last trade or last available bid (long positions) or ask (short positions) price. |
| | • | | Fixed-income investments for which market quotations are readily available are generally valued using the last available bid price or current market quotations provided by independent dealers or third-party pricing services. Floating rate loan interests are valued at the mean of the bid prices from one or more independent brokers or dealers as obtained from a third-party pricing service. Pricing services generally value fixed-income securities assuming orderly transactions of an institutional round lot size, but a fund may hold or transact in such securities in smaller, odd lot sizes. Odd lots may trade at lower prices than institutional round lots. The pricing services may use matrix pricing or valuation models that utilize certain inputs and assumptions to derive values, including transaction data (e.g., recent representative bids and offers), market data, credit quality information, perceived market movements, news, and other relevant information. Certain fixed-income securities, including asset-backed and mortgage related securities may be valued based on valuation models that consider the estimated cash flows of each tranche of the entity, establish a benchmark yield and develop an estimated tranche specific spread to the benchmark yield based on the unique attributes of the tranche. The amortized cost method of valuation may be used with respect to debt obligations with sixty days or less remaining to maturity unless the Manager determines such method does not represent fair value. |
| | • | | Investments in open-end U.S. mutual funds (including money market funds) are valued at that day’s net asset value (“NAV”). |
| | • | | Futures contracts are valued based on that day’s last reported settlement or trade price on the exchange where the contract is traded. |
| | • | | Forward foreign currency exchange contracts are valued at the mean between the bid and ask prices and are determined as of the close of trading on the NYSE based on that day’s prevailing forward exchange rate for the underlying currencies. |
| | • | | Exchange-traded options are valued at the mean between the last bid and ask prices at the close of the options market in which the options trade. An exchange-traded option for which there is no mean price, is valued at the last bid (long positions) or ask (short positions) price. If no bid or ask price is available, the prior day’s price will be used, unless it is determined that the prior day’s price no longer reflects the fair value of the option. Over-the-counter (“OTC”) options and options on swaps (“swaptions”) are valued by an independent pricing service using a mathematical model, which incorporates a number of market data factors, such as the trades and prices of the underlying instruments. |
| | • | | Interest rate, credit default, inflation and currency swap agreements are valued utilizing quotes received daily by independent pricing services or through brokers, which are derived using daily swap curves and models that incorporate market data and discounted cash flows. Total return swap agreements are valued utilizing quotes received daily by independent pricing services or through brokers, which are derived using models that incorporate market trades and fair value of the underlying reference instruments. |
Generally, trading in foreign instruments is substantially completed each day at various times prior to the close of trading on the New York Stock Exchange (“NYSE”). Each business day, the Fund uses current market factors supplied by independent pricing services to value certain foreign instruments (“Systematic Fair Value Price”). The Systematic Fair Value Price is designed to value such foreign securities at fair value as of the close of trading on the NYSE, which occurs after the close of the local markets.
If events (e.g., market volatility, company announcement or a natural disaster) occur that are expected to materially affect the value of such investment, or in the event that application of these methods of valuation results in a price for an investment that is deemed not to be representative of the market value of such investment, or if a price is not
| | |
N O T E S T O C O N S O L I D A T E D F I N A N C I A L S T A T E M E N T S | | 107 |
Notes to Consolidated Financial Statements (continued)
available, the investment will be valued by the Valuation Committee in accordance with the Manager’s policies and procedures as reflecting fair value (“Fair Valued Investments”). The fair valuation approaches that may be used by the Valuation Committee include market approach, income approach and cost approach. Valuation techniques such as discounted cash flow, use of market comparables and matrix pricing are types of valuation approaches and are typically used in determining fair value. When determining the price for Fair Valued Investments, the Valuation Committee seeks to determine the price that the Fund might reasonably expect to receive or pay from the current sale or purchase of that asset or liability in an arm’s-length transaction. Fair value determinations shall be based upon all available factors that the Valuation Committee deems relevant and consistent with the principles of fair value measurement as of the measurement date.
For investments in equity or debt issued by privately held companies or funds (“Private Company” or collectively, the “Private Companies”) and other Fair Valued Investments, the fair valuation approaches that are used by the Valuation Committee and third-party pricing services utilized by the Valuation Committee include one or a combination of, but not limited to, the following inputs:
(i) recent market transactions, including secondary market transactions, merger or acquisition activity and subsequent rounds of financing in the underlying investment or comparable issuers
(ii) recapitalizations and other transactions across the capital structure
(iii) market or relevant indices multiples of comparable issuers
(iv) future cash flows discounted to present and adjusted as appropriate for liquidity, credit, and/or market risks
(v) quoted prices for similar investments or assets in active markets
(vi) other risk factors, such as interest rates, yield curves, volatilities, prepayment speeds, loss severities, credit risks, recovery rates, liquidation amounts and/or default rates
(vii) audited or unaudited financial statements, investor communications and Private Company financial or operational metrics
(viii) relevant market news and other public sources.
Investments in series of preferred stock issued by Private Companies are typically valued utilizing a market approach to determine the enterprise value of the company. Such investments often contain rights and preferences that differ from other series of preferred and common stock of the same issuer. Enterprise valuation techniques such as an option pricing model (“OPM”), a probability weighted expected return model (“PWERM”), current value method or a hybrid of those techniques are used as deemed appropriate under the circumstances. The use of these valuation techniques involves a determination of the exit scenarios of the investment in order to appropriately allocate the enterprise value of the company among the various parts of its capital structure.
Private Companies are not subject to public company disclosure, timing, and reporting standards applicable to other investments held by the Fund. Certain information made available by a Private Company is as of a date that is earlier than the date the Fund is calculating its NAV. This factor may result in a difference between the value of the investment and the price the Fund could receive upon the sale of the investment.
Fair Value Hierarchy: Various inputs are used in determining the fair value of financial instruments at the measurement date. These inputs to valuation techniques are categorized into a fair value hierarchy consisting of three broad levels for financial reporting purposes as follows:
| • | | Level 1 – Unadjusted price quotations in active markets/exchanges that the Fund has the ability to access for identical assets or liabilities; |
| • | | Level 2 – Inputs other than quoted prices included within level 1 that are observable for the asset or liability, either directly or indirectly; and |
| • | | Level 3 – Inputs that are unobservable and significant to the entire fair value measurement for the asset or liability (including the Valuation Committee’s assumptions used in determining the fair value of financial instruments). |
The hierarchy gives the highest priority to unadjusted quoted prices in active markets for identical assets or liabilities (Level 1 measurements) and the lowest priority to unobservable inputs (Level 3 measurements). Accordingly, the degree of judgment exercised in determining fair value is greatest for instruments categorized in Level 3. The inputs used to measure fair value may fall into different levels of the fair value hierarchy. In such cases, for disclosure purposes, the fair value hierarchy classification is determined based on the lowest level input that is significant to the fair value measurement in its entirety. Investments classified within Level 3 have significant unobservable inputs used by the Valuation Committee in determining the price for Fair Valued Investments. Level 3 investments include equity or debt issued by Private Companies that may not have a secondary market and/or may have a limited number of investors. The categorization of a value determined for financial instruments is based on the pricing transparency of the financial instruments and is not necessarily an indication of the risks associated with investing in those securities.
4. SECURITIES AND OTHER INVESTMENTS
Asset-Backed and Mortgage-Backed Securities: Asset-backed securities are generally issued as pass-through certificates or as debt instruments. Asset-backed securities issued as pass-through certificates represent undivided fractional ownership interests in an underlying pool of assets. Asset-backed securities issued as debt instruments, which are also known as collateralized obligations, are typically issued as the debt of a special purpose entity organized solely for the purpose of owning such assets and issuing such debt. Asset-backed securities are often backed by a pool of assets representing the obligations of a number of different parties. The yield characteristics of certain asset-backed securities may differ from traditional debt securities. One such major difference is that all or a principal part of the obligations may be prepaid at any time because the underlying assets (i.e., loans) may be prepaid at any time. As a result, a decrease in interest rates in the market may result in increases in the level of prepayments as
| | |
| 108 | | 2 0 2 4 B L A C K R O C K A N N U A L F I N A N C I A L S T A T E M E N T S A N D A D D I T I O N A L I N F O R M A T I O N |
Notes to Consolidated Financial Statements (continued)
borrowers, particularly mortgagors, refinance and repay their loans. An increased prepayment rate with respect to an asset-backed security will have the effect of shortening the maturity of the security. In addition, a fund may subsequently have to reinvest the proceeds at lower interest rates. If a fund has purchased such an asset-backed security at a premium, a faster than anticipated prepayment rate could result in a loss of principal to the extent of the premium paid.
For mortgage pass-through securities (the “Mortgage Assets”) there are a number of important differences among the agencies and instrumentalities of the U.S. Government that issue mortgage-related securities and among the securities that they issue. For example, mortgage-related securities guaranteed by Ginnie Mae are guaranteed as to the timely payment of principal and interest by Ginnie Mae and such guarantee is backed by the full faith and credit of the United States. However, mortgage-related securities issued by Freddie Mac and Fannie Mae, including Freddie Mac and Fannie Mae guaranteed mortgage pass-through certificates, which are solely the obligations of Freddie Mac and Fannie Mae, are not backed by or entitled to the full faith and credit of the United States, but are supported by the right of the issuer to borrow from the U.S. Treasury.
Non-agency mortgage-backed securities are securities issued by non-governmental issuers and have no direct or indirect government guarantees of payment and are subject to various risks. Non-agency mortgage loans are obligations of the borrowers thereunder only and are not typically insured or guaranteed by any other person or entity. The ability of a borrower to repay a loan is dependent upon the income or assets of the borrower. A number of factors, including a general economic downturn, acts of God, terrorism, social unrest and civil disturbances, may impair a borrower’s ability to repay its loans.
Collateralized Debt Obligations: Collateralized debt obligations (“CDOs”), including collateralized bond obligations (“CBOs”) and collateralized loan obligations (“CLOs”), are types of asset-backed securities. A CDO is an entity that is backed by a diversified pool of debt securities (CBOs) or syndicated bank loans (CLOs). The cash flows of the CDO can be split into multiple segments, called “tranches,” which will vary in risk profile and yield. The riskiest segment is the subordinated or “equity” tranche. This tranche bears the greatest risk of defaults from the underlying assets in the CDO and serves to protect the other, more senior, tranches from default in all but the most severe circumstances. Since it is shielded from defaults by the more junior tranches, a “senior” tranche will typically have higher credit ratings and lower yields than their underlying securities, and often receive investment grade ratings from one or more of the nationally recognized rating agencies. Despite the protection from the more junior tranches, senior tranches can experience substantial losses due to actual defaults, increased sensitivity to future defaults and the disappearance of one or more protecting tranches as a result of changes in the credit profile of the underlying pool of assets.
Inflation-Indexed Bonds: Inflation-indexed bonds (other than municipal inflation-indexed and certain corporate inflation-indexed bonds) are fixed-income securities whose principal value is periodically adjusted according to the rate of inflation. If the index measuring inflation rises or falls, the principal value of inflation-indexed bonds (other than municipal inflation-indexed and certain corporate inflation-indexed bonds) will be adjusted upward or downward, and consequently the interest payable on these securities (calculated with respect to a larger or smaller principal amount) will be increased or reduced, respectively. Any upward or downward adjustment in the principal amount of an inflation-indexed bond is included as interest income in the Consolidated Statement of Operations, even though investors do not receive their principal until maturity. Repayment of the original bond principal upon maturity (as adjusted for inflation) is guaranteed in the case of U.S. Treasury inflation-indexed bonds. For bonds that do not provide a similar guarantee, the adjusted principal value of the bond repaid at maturity may be less than the original principal. With regard to municipal inflation-indexed bonds and certain corporate inflation-indexed bonds, the inflation adjustment is typically reflected in the semi-annual coupon payment. As a result, the principal value of municipal inflation-indexed bonds and such corporate inflation-indexed bonds does not adjust according to the rate of inflation.
Multiple Class Pass-Through Securities: Multiple class pass-through securities, including collateralized mortgage obligations (“CMOs”) and commercial mortgage-backed securities, may be issued by Ginnie Mae, U.S. Government agencies or instrumentalities or by trusts formed by private originators of, or investors in, mortgage loans. In general, CMOs are debt obligations of a legal entity that are collateralized by a pool of residential or commercial mortgage loans or Mortgage Assets. The payments on these are used to make payments on the CMOs or multiple pass-through securities. Multiple class pass-through securities represent direct ownership interests in the Mortgage Assets. Classes of CMOs include interest only (“IOs”), principal only (“POs”), planned amortization classes and targeted amortization classes. IOs and POs are stripped mortgage-backed securities representing interests in a pool of mortgages, the cash flow from which has been separated into interest and principal components. IOs receive the interest portion of the cash flow while POs receive the principal portion. IOs and POs can be extremely volatile in response to changes in interest rates. As interest rates rise and fall, the value of IOs tends to move in the same direction as interest rates. POs perform best when prepayments on the underlying mortgages rise since this increases the rate at which the principal is returned and the yield to maturity on the PO. When payments on mortgages underlying a PO are slower than anticipated, the life of the PO is lengthened and the yield to maturity is reduced. If the underlying Mortgage Assets experience greater than anticipated prepayments of principal, a fund’s initial investment in the IOs may not fully recoup.
Stripped Mortgage-Backed Securities: Stripped mortgage-backed securities are typically issued by the U.S. Government, its agencies and instrumentalities. Stripped mortgage-backed securities are usually structured with two classes that receive different proportions of the interest (IOs) and principal (POs) distributions on a pool of Mortgage Assets. Stripped mortgage-backed securities may be privately issued.
Zero-Coupon Bonds: Zero-coupon bonds are normally issued at a significant discount from face value and do not provide for periodic interest payments. These bonds may experience greater volatility in market value than other debt obligations of similar maturity which provide for regular interest payments.
Capital Securities and Trust Preferred Securities: Capital securities, including trust preferred securities, are typically issued by corporations, generally in the form of interest-bearing notes with preferred securities characteristics. In the case of trust preferred securities, an affiliated business trust of a corporation issues these securities, generally in the form of beneficial interests in subordinated debentures or similarly structured securities. The securities can be structured with either a fixed or adjustable coupon that can have either a perpetual or stated maturity date. For trust preferred securities, the issuing bank or corporation pays interest to the trust, which is then distributed to holders of these securities as a dividend. Dividends can be deferred without creating an event of default or acceleration, although maturity cannot take place unless all cumulative payment obligations have been met. The deferral of payments does not affect the purchase or sale of these securities in the open market. These securities generally are rated below that of the issuing company’s senior debt securities and are freely callable at the issuer’s option.
Preferred Stocks: Preferred stock has a preference over common stock in liquidation (and generally in receiving dividends as well), but is subordinated to the liabilities of the issuer in all respects. As a general rule, the market value of preferred stock with a fixed dividend rate and no conversion element varies inversely with interest rates and perceived credit risk, while the market price of convertible preferred stock generally also reflects some element of conversion value. Because preferred stock is junior to debt
| | |
N O T E S T O C O N S O L I D A T E D F I N A N C I A L S T A T E M E N T S | | 109 |
Notes to Consolidated Financial Statements (continued)
securities and other obligations of the issuer, deterioration in the credit quality of the issuer will cause greater changes in the value of a preferred stock than in a more senior debt security with similar stated yield characteristics. Unlike interest payments on debt securities, preferred stock dividends are payable only if declared by the issuer’s board of directors. Preferred stock also may be subject to optional or mandatory redemption provisions.
Warrants: Warrants entitle a fund to purchase a specified number of shares of common stock and are non-income producing. The purchase price and number of shares are subject to adjustment under certain conditions until the expiration date of the warrants, if any. If the price of the underlying stock does not rise above the strike price before the warrant expires, the warrant generally expires without any value and a fund will lose any amount it paid for the warrant. Thus, investments in warrants may involve more risk than investments in common stock. Warrants may trade in the same markets as their underlying stock; however, the price of the warrant does not necessarily move with the price of the underlying stock.
Floating Rate Loan Interests: Floating rate loan interests are typically issued to companies (the “borrower”) by banks, other financial institutions, or privately and publicly offered corporations (the “lender”). Floating rate loan interests are generally non-investment grade, often involve borrowers whose financial condition is troubled or uncertain and companies that are highly leveraged or in bankruptcy proceedings. In addition, transactions in floating rate loan interests may settle on a delayed basis, which may result in proceeds from the sale not being readily available for a fund to make additional investments or meet its redemption obligations. Floating rate loan interests may include fully funded term loans or revolving lines of credit. Floating rate loan interests are typically senior in the corporate capital structure of the borrower. Floating rate loan interests generally pay interest at rates that are periodically determined by reference to a base lending rate plus a premium. Since the rates reset only periodically, changes in prevailing interest rates (and particularly sudden and significant changes) can be expected to cause some fluctuations in the NAV of a fund to the extent that it invests in floating rate loan interests. The base lending rates are generally the lending rate offered by one or more European banks, such as the Secured Overnight Financing Rate (“SOFR”), the prime rate offered by one or more U.S. banks or the certificate of deposit rate. Floating rate loan interests may involve foreign borrowers, and investments may be denominated in foreign currencies. These investments are treated as investments in debt securities for purposes of a fund’s investment policies.
When a fund purchases a floating rate loan interest, it may receive a facility fee and when it sells a floating rate loan interest, it may pay a facility fee. On an ongoing basis, a fund may receive a commitment fee based on the undrawn portion of the underlying line of credit amount of a floating rate loan interest. Facility and commitment fees are typically amortized to income over the term of the loan or term of the commitment, respectively. Consent and amendment fees are recorded to income as earned. Prepayment penalty fees, which may be received by a fund upon the prepayment of a floating rate loan interest by a borrower, are recorded as realized gains. A fund may invest in multiple series or tranches of a loan. A different series or tranche may have varying terms and carry different associated risks.
Floating rate loan interests are usually freely callable at the borrower’s option. A fund may invest in such loans in the form of participations in loans (“Participations”) or assignments (“Assignments”) of all or a portion of loans from third parties. Participations typically will result in a fund having a contractual relationship only with the lender, not with the borrower. A fund has the right to receive payments of principal, interest and any fees to which it is entitled only from the lender selling the Participation and only upon receipt by the lender of the payments from the borrower. In connection with purchasing Participations, a fund generally will have no right to enforce compliance by the borrower with the terms of the loan agreement, nor any rights of offset against the borrower. A fund may not benefit directly from any collateral supporting the loan in which it has purchased the Participation. As a result, a fund assumes the credit risk of both the borrower and the lender that is selling the Participation. A fund’s investment in loan participation interests involves the risk of insolvency of the financial intermediaries who are parties to the transactions. In the event of the insolvency of the lender selling the Participation, a fund may be treated as a general creditor of the lender and may not benefit from any offset between the lender and the borrower. Assignments typically result in a fund having a direct contractual relationship with the borrower, and a fund may enforce compliance by the borrower with the terms of the loan agreement.
In connection with floating rate loan interests, the Fund may also enter into unfunded floating rate loan interests (“commitments”). In connection with these commitments, the Fund earns a commitment fee, typically set as a percentage of the commitment amount. Such fee income, which is included in interest income in the Consolidated Statement of Operations, is recognized ratably over the commitment period. Unfunded floating rate loan interests are marked-to-market daily, and any unrealized appreciation (depreciation) is included in the Consolidated Statement of Assets and Liabilities and Consolidated Statement of Operations. As of period end, the Fund had the following unfunded floating rate loan interests:
| | | | | | | | | | | | | | | | |
| | | | | |
| Borrower | | Par | | | Commitment
Amount | | | Value | | | Unrealized
Appreciation
(Depreciation) | |
ConnectWise LLC, Initial Term Loan | | $ | 2,266,174 | | | $ | 2,260,213 | | | $ | 2,260,460 | | | $ | 247 | |
CPPIB OVM Member U.S. LLC, Initial Term Loan | | | 2,862,000 | | | | 2,840,535 | | | | 2,860,798 | | | | 20,263 | |
CSC Holdings LLC, September 2019 Initial Term Loan | | | 1,080,000 | | | | 961,200 | | | | 985,889 | | | | 24,689 | |
Helios Service Partners LLC, Second A&R Amendment Incremental Delayed Draw Term Loan | | | 435,454 | | | | 427,144 | | | | 428,700 | | | | 1,556 | |
HP LQ Investment LP, Term Loan | | | 639,176 | | | | 647,445 | | | | 646,701 | | | | (744 | ) |
Montage Hotels & Resorts LLC, Revolver | | | 2,401,808 | | | | 2,401,808 | | | | 2,401,808 | | | | — | |
Orion Group HoldCo LLC, Delayed Draw Term Loan | | | 1,244,153 | | | | 1,217,514 | | | | 1,231,089 | | | | 13,575 | |
| | | | | | | | | | | | | | | | |
| | | | | | | | | | | | | | | $59,586 | |
| | | | | | | | | | | | | | | | |
Forward Commitments, When-Issued and Delayed Delivery Securities: The Fund may purchase securities on a when-issued basis and may purchase or sell securities on a forward commitment basis. Settlement of such transactions normally occurs within a month or more after the purchase or sale commitment is made. The Fund may purchase securities under such conditions with the intention of actually acquiring them but may enter into a separate agreement to sell the securities before the settlement date. Since the value of securities purchased may fluctuate prior to settlement, the Fund may be required to pay more at settlement than the security is worth. In addition, a fund is not entitled to any of the interest earned prior to settlement. When purchasing a security on a delayed delivery basis, the Fund assumes the rights and risks of ownership of the security, including the risk of price and yield fluctuations. In the event of default by the counterparty, the Fund’s maximum amount of loss is the unrealized appreciation of
| | |
| 110 | | 2 0 2 4 B L A C K R O C K A N N U A L F I N A N C I A L S T A T E M E N T S A N D A D D I T I O N A L I N F O R M A T I O N |
Notes to Consolidated Financial Statements (continued)
unsettled when-issued transactions. These types of securities may be considered unfunded and may obligate the Fund to make future cash payments. An unfunded commitment is marked-to-market and any unrealized appreciation (depreciation) is separately presented in the Consolidated Statement of Assets and Liabilities and Consolidated Statement of Operations.
TBA Commitments: TBA commitments are forward agreements for the purchase or sale of securities, including mortgage-backed securities for a fixed price, with payment and delivery on an agreed upon future settlement date. The specific securities to be delivered are not identified at the trade date. However, delivered securities must meet specified terms, including issuer, rate and mortgage terms. When entering into TBA commitments, a fund may take possession of or deliver the underlying mortgage-backed securities but can extend the settlement or roll the transaction. TBA commitments involve a risk of loss if the value of the security to be purchased or sold declines or increases, respectively, prior to settlement date, if there are expenses or delays in connection with the TBA transactions, or if the counterparty fails to complete the transaction.
In order to better define contractual rights and to secure rights that will help a fund mitigate its counterparty risk, TBA commitments may be entered into by a fund under Master Securities Forward Transaction Agreements (each, an “MSFTA”). An MSFTA typically contains, among other things, collateral posting terms and netting provisions in the event of default and/or termination event. The collateral requirements are typically calculated by netting the mark-to-market amount for each transaction under such agreement and comparing that amount to the value of the collateral currently pledged by a fund and the counterparty. Cash collateral that has been pledged to cover the obligations of a fund and cash collateral received from the counterparty, if any, is reported separately in the Consolidated Statement of Assets and Liabilities as cash pledged as collateral for TBA commitments or cash received as collateral for TBA commitments, respectively. Non-cash collateral pledged by a fund, if any, is noted in the Consolidated Schedule of Investments. Typically, a fund is permitted to sell, re-pledge or use the collateral it receives; however, the counterparty is not permitted to do so. To the extent amounts due to a fund are not fully collateralized, contractually or otherwise, a fund bears the risk of loss from counterparty non-performance.
Mortgage Dollar Roll Transactions: The Fund may sell TBA mortgage-backed securities and simultaneously contract to repurchase substantially similar (i.e., same type, coupon and maturity) securities on a specific future date at an agreed upon price. During the period between the sale and repurchase, a fund is not entitled to receive interest and principal payments on the securities sold. Mortgage dollar roll transactions are treated as purchases and sales and a fund realizes gains and losses on these transactions. Mortgage dollar rolls involve the risk that the market value of the securities that a fund is required to purchase may decline below the agreed upon repurchase price of those securities.
Commitments: Commitments are agreements to acquire an investment at a future date (subject to conditions) in connection with a potential public or non-public offering. Such agreements may obligate a fund to make future cash payments. As of September 30, 2024, the Fund had outstanding commitments of $31,136,981. These commitments are not included in the net assets of the Fund as of September 30, 2024.
Securities Lending: The Fund may lend its securities to approved borrowers, such as brokers, dealers and other financial institutions. The borrower pledges and maintains with the Fund collateral consisting of cash, an irrevocable letter of credit issued by a bank, or securities issued or guaranteed by the U.S. Government. The initial collateral received by the Fund is required to have a value of at least 102% of the current value of the loaned securities for securities traded on U.S. exchanges and a value of at least 105% for all other securities. The collateral is maintained thereafter at a value equal to at least 100% of the current market value of the securities on loan. The market value of the loaned securities is determined at the close of each business day of the Fund and any additional required collateral is delivered to the Fund, or excess collateral returned by the Fund, on the next business day. During the term of the loan, the Fund is entitled to all distributions made on or in respect of the loaned securities, but does not receive interest income on securities received as collateral. Loans of securities are terminable at any time and the borrower, after notice, is required to return borrowed securities within the standard time period for settlement of securities transactions.
As of period end, any securities on loan were collateralized by cash and/or U.S. Government obligations. Cash collateral invested by the securities lending agent, BlackRock Investment Management, LLC (“BIM”), if any, is disclosed in the Consolidated Schedule of Investments. Any non-cash collateral received cannot be sold, re-invested or pledged by the Fund, except in the event of borrower default. The securities on loan, if any, are disclosed in the Fund’s Consolidated Schedule of Investments. The market value of any securities on loan and the value of related collateral, if any, are shown separately in the Consolidated Statement of Assets and Liabilities as a component of investments at value – unaffiliated and collateral on securities loaned, respectively.
Securities lending transactions are entered into by the Fund under Master Securities Lending Agreements (each, an “MSLA”), which provide the right, in the event of default (including bankruptcy or insolvency), for the non-defaulting party to liquidate the collateral and calculate a net exposure to the defaulting party or request additional collateral. In the event that a borrower defaults, the Fund, as lender, would offset the market value of the collateral received against the market value of the securities loaned. When the value of the collateral is greater than that of the market value of the securities loaned, the lender is left with a net amount payable to the defaulting party. However, bankruptcy or insolvency laws of a particular jurisdiction may impose restrictions on or prohibitions against such a right of offset in the event of an MSLA counterparty’s bankruptcy or insolvency. Under the MSLA, absent an event of default, the borrower can resell or re-pledge the loaned securities, and the Fund can reinvest cash collateral received in connection with loaned securities. Upon an event of default, the parties’ obligations to return the securities or collateral to the other party are extinguished, and the parties can resell or re-pledge the loaned securities or the collateral received in connection with the loaned securities in order to satisfy the defaulting party’s net payment obligation for all transactions under the MSLA. The defaulting party remains liable for any deficiency.
| | |
N O T E S T O C O N S O L I D A T E D F I N A N C I A L S T A T E M E N T S | | 111 |
Notes to Consolidated Financial Statements (continued)
As of period end, the following table is a summary of the Fund’s securities on loan by counterparty which are subject to offset under an MSLA:
| | | | | | | | | | | | | | | | |
| | | | | |
| Counterparty | |
| Securities
Loaned at Value |
| |
| Cash
Collateral Received |
(a) | |
| Non-Cash
Collateral Received,
at Fair Value |
(a) | |
| Net
Amount(b) |
|
BofA Securities, Inc. | | $ | 1,045,856 | | | $ | (1,045,856 | ) | | $ | — | | | $ | — | |
Citigroup Global Markets, Inc. | | | 5,173,003 | | | | (5,173,003 | ) | | | — | | | | — | |
Goldman Sachs & Co. LLC | | | 4,992,089 | | | | (4,992,089 | ) | | | — | | | | — | |
National Financial Services LLC | | | 162,841 | | | | (158,807 | ) | | | — | | | | 4,034 | |
| | | | | | | | | | | | | | | | |
| | $ | 11,373,789 | | | $ | (11,369,755 | ) | | $ | — | | | $ | 4,034 | |
| | | | | | | | | | | | | | | | |
| | (a) | Collateral received, if any, in excess of the market value of securities on loan is not presented in this table. The total cash collateral received by the Fund is disclosed in the Fund’s Consolidated Statement of Assets and Liabilities. | |
| | (b) | The market value of the loaned securities is determined as of September 30, 2024. Additional collateral is delivered to the Fund on the next business day in accordance with the MSLA. The net amount would be subject to the borrower default indemnity in the event of default by the counterparty. | |
The risks of securities lending include the risk that the borrower may not provide additional collateral when required or may not return the securities when due. To mitigate these risks, the Fund benefits from a borrower default indemnity provided by BIM. BIM’s indemnity allows for full replacement of the securities loaned to the extent the collateral received does not cover the value on the securities loaned in the event of borrower default. The Fund could incur a loss if the value of an investment purchased with cash collateral falls below the market value of loaned securities or if the value of an investment purchased with cash collateral falls below the value of the original cash collateral received. Such losses are borne entirely by the Fund.
5. DERIVATIVE FINANCIAL INSTRUMENTS
The Fund engages in various portfolio investment strategies using derivative contracts both to increase the returns of the Fund and/or to manage its exposure to certain risks such as credit risk, equity risk, interest rate risk, foreign currency exchange rate risk, commodity price risk or other risks (e.g., inflation risk). Derivative financial instruments categorized by risk exposure are included in the Consolidated Schedule of Investments. These contracts may be transacted on an exchange or OTC.
Futures Contracts: Futures contracts are purchased or sold to gain exposure to, or manage exposure to, changes in interest rates (interest rate risk) and changes in the value of equity securities (equity risk) or foreign currencies (foreign currency exchange rate risk) or carbon credits or to the applicable commodities market (commodities price risk).
Futures contracts are exchange-traded agreements between the Fund and a counterparty to buy or sell a specific quantity of an underlying instrument at a specified price and on a specified date. Depending on the terms of a contract, it is settled either through physical delivery of the underlying instrument on the settlement date or by payment of a cash amount on the settlement date. The Fund may invest in carbon credit futures that are traded on a commodity exchanges with the Commodity Futures Trading Commission. Upon entering into a futures contract, the Fund is required to deposit initial margin with the broker in the form of cash or securities in an amount that varies depending on a contract’s size and risk profile. The initial margin deposit must then be maintained at an established level over the life of the contract. Amounts pledged, which are considered restricted, are included in cash pledged for futures contracts in the Consolidated Statement of Assets and Liabilities.
Securities deposited as initial margin are designated in the Consolidated Schedule of Investments and cash deposited, if any, are shown as cash pledged for futures contracts in the Consolidated Statement of Assets and Liabilities. Pursuant to the contract, the Fund agrees to receive from or pay to the broker an amount of cash equal to the daily fluctuation in market value of the contract (“variation margin”). Variation margin is recorded as unrealized appreciation (depreciation) and, if any, shown as variation margin receivable (or payable) on futures contracts in the Consolidated Statement of Assets and Liabilities. When the contract is closed, a realized gain or loss is recorded in the Consolidated Statement of Operations equal to the difference between the notional amount of the contract at the time it was opened and the notional amount at the time it was closed. The use of futures contracts involves the risk of an imperfect correlation in the movements in the price of futures contracts and interest rates, foreign currency exchange rates or underlying assets.
Forward Foreign Currency Exchange Contracts: Forward foreign currency exchange contracts are entered into to gain or reduce exposure to foreign currencies (foreign currency exchange rate risk).
A forward foreign currency exchange contract is an agreement between two parties to buy and sell a currency at a set exchange rate on a specified date. These contracts help to manage the overall exposure to the currencies in which some of the investments held by the Fund are denominated and in some cases, may be used to obtain exposure to a particular market. The contracts are traded OTC and not on an organized exchange.
The contract is marked-to-market daily and the change in market value is recorded as unrealized appreciation (depreciation) in the Consolidated Statement of Assets and Liabilities. When a contract is closed, a realized gain or loss is recorded in the Consolidated Statement of Operations equal to the difference between the value at the time it was opened and the value at the time it was closed. Non-deliverable forward foreign currency exchange contracts are settled with the counterparty in cash without the delivery of foreign currency. The use of forward foreign currency exchange contracts involves the risk that the value of a forward foreign currency exchange contract changes unfavorably due to movements in the value of the referenced foreign currencies, and such value may exceed the amount(s) reflected in the Consolidated Statement of Assets and Liabilities. Cash amounts pledged for forward foreign currency exchange contracts are considered restricted and are included in cash pledged as collateral for OTC derivatives in the Consolidated Statement of Assets and Liabilities. The Fund’s risk of loss from counterparty credit risk on OTC derivatives is generally limited to the aggregate unrealized gain netted against any collateral held by the Fund.
Options: The Fund may purchase and write call and put options to increase or decrease its exposure to the risks of underlying instruments, including equity risk, interest rate risk and/or commodity price risk and/or, in the case of options written, to generate gains from options premiums.
| | |
| 112 | | 2 0 2 4 B L A C K R O C K A N N U A L F I N A N C I A L S T A T E M E N T S A N D A D D I T I O N A L I N F O R M A T I O N |
Notes to Consolidated Financial Statements (continued)
A call option gives the purchaser (holder) of the option the right (but not the obligation) to buy, and obligates the seller (writer) to sell (when the option is exercised) the underlying instrument at the exercise or strike price at any time or at a specified time during the option period. A put option gives the holder the right to sell and obligates the writer to buy the underlying instrument at the exercise or strike price at any time or at a specified time during the option period.
Premiums paid on options purchased and premiums received on options written, as well as the daily fluctuation in market value, are included in investments at value –unaffiliated and options written at value, respectively, in the Consolidated Statement of Assets and Liabilities. When an instrument is purchased or sold through the exercise of an option, the premium is offset against the cost or proceeds of the underlying instrument. When an option expires, a realized gain or loss is recorded in the Consolidated Statement of Operations to the extent of the premiums received or paid. When an option is closed or sold, a gain or loss is recorded in the Consolidated Statement of Operations to the extent the cost of the closing transaction exceeds the premiums received or paid. When the Fund writes a call option, such option is typically “covered,” meaning that it holds the underlying instrument subject to being called by the option counterparty. When the Fund writes a put option, cash is segregated in an amount sufficient to cover the obligation. These amounts, which are considered restricted, are included in cash pledged as collateral for options written in the Consolidated Statement of Assets and Liabilities.
| | • | | Swaptions – The Fund may purchase and write swaptions primarily to preserve a return or spread on a particular investment or portion of the Fund’s holdings, as a duration management technique or to protect against an increase in the price of securities it anticipates purchasing at a later date. The purchaser and writer of a swaption is buying or granting the right to enter into a previously agreed upon interest rate or credit default swap agreement (interest rate risk and/or credit risk) at any time before the expiration of the option. |
| | • | | Interest rate caps and floors – Interest rate caps and floors are entered into to gain or reduce exposure to interest rates (interest rate risk and/or other risk). Caps are agreements whereby one party agrees to make payments to the other, in return for a premium, to the extent that interest rate indexes exceed a specified rate, or “cap.” Floors are agreements whereby one party agrees to make payments to the other, in return for a premium, to the extent that interest rate indexes fall below a specified rate, or “floor.” The maximum potential amount of future payments that the Fund would be required to make under an interest rate cap would be the notional amount times the percentage increase in interest rates determined by the difference between the interest rate index current value and the value at the time the cap was entered into. |
| | • | | Foreign currency options – The Fund may purchase and write foreign currency options, foreign currency futures and options on foreign currency futures to gain or reduce exposure to foreign currencies (foreign currency exchange rate risk). Foreign currency options give the purchaser the right to buy from or sell to the writer a foreign currency at any time before the expiration of the option. |
| | • | | Barrier options – The Fund may purchase and write a variety of options with non-standard payout structures or other features (“barrier options”) that are generally traded OTC. |
The Fund may invest in various types of barrier options, including down-and-out options, down-and-in options, double no-touch options, one-touch options, instant one-touch options, up-and-out options and up-and-in options. Down-and-out options expire worthless to the purchaser if the price of the underlying instrument falls below a specific barrier price level prior to the expiration date. Down-and-in options expire worthless to the purchaser unless the price of the underlying instrument falls below a specific barrier price level prior to the expiration date. Double no-touch options provide the purchaser an agreed-upon payout if the price of the underlying instrument does not reach or surpass predetermined barrier price levels prior to the option’s expiration date. One-touch options and instant one-touch options provide the purchaser an agreed-upon payout if the price of the underlying instrument reaches or surpasses predetermined barrier price levels prior to the expiration date. Up-and-out options expire worthless to the purchaser if the price of the underlying instrument increases beyond a predetermined barrier price level prior to the expiration date. Up-and-in options can only be exercised when the price of the underlying instrument increases beyond a predetermined barrier price level.
In purchasing and writing options, the Fund bears the risk of an unfavorable change in the value of the underlying instrument or the risk that it may not be able to enter into a closing transaction due to an illiquid market. Exercise of a written option could result in the Fund purchasing or selling a security when it otherwise would not, or at a price different from the current market value.
Swaps: Swap contracts are entered into to manage exposure to issuers, markets and securities. Such contracts are agreements between the Fund and a counterparty to make periodic net payments on a specified notional amount or a net payment upon termination. Swap agreements are privately negotiated in the OTC market and may be entered into as a bilateral contract (“OTC swaps”) or centrally cleared (“centrally cleared swaps”).
For OTC swaps, any upfront premiums paid and any upfront fees received are shown as swap premiums paid and swap premiums received, respectively, in the Consolidated Statement of Assets and Liabilities and amortized over the term of the contract. The daily fluctuation in market value is recorded as unrealized appreciation (depreciation) on OTC swaps in the Consolidated Statement of Assets and Liabilities. Payments received or paid are recorded in the Consolidated Statement of Operations as realized gains or losses, respectively. When an OTC swap is terminated, a realized gain or loss is recorded in the Consolidated Statement of Operations equal to the difference between the proceeds from (or cost of) the closing transaction and the Fund’s basis in the contract, if any. Generally, the basis of the contract is the premium received or paid.
In a centrally cleared swap, immediately following execution of the swap contract, the swap contract is novated to a central counterparty (the “CCP”) and the CCP becomes the Fund’s counterparty on the swap. The Fund is required to interface with the CCP through the broker. Upon entering into a centrally cleared swap, the Fund is required to deposit initial margin with the broker in the form of cash or securities in an amount that varies depending on the size and risk profile of the particular swap. Securities deposited as initial margin are designated in the Consolidated Schedule of Investments and cash deposited is shown as cash pledged for centrally cleared swaps in the Consolidated Statement of Assets and Liabilities. Amounts pledged, which are considered restricted cash, are included in cash pledged for centrally cleared swaps in the Consolidated Statement of Assets and Liabilities. Pursuant to the contract, the Fund agrees to receive from or pay to the broker variation margin. Variation margin is recorded as unrealized appreciation (depreciation) and shown as variation margin receivable (or payable) on centrally cleared swaps in the Consolidated Statement of Assets and Liabilities. Payments received from (paid to) the counterparty are amortized over the term of the contract and recorded as realized gains (losses) in the Consolidated Statement of Operations, including those at termination.
| | • | | Credit default swaps — Credit default swaps are entered into to manage exposure to the market or certain sectors of the market, to reduce risk exposure to defaults of corporate and/or sovereign issuers or to create exposure to corporate and/or sovereign issuers to which a fund is not otherwise exposed (credit risk). |
| | |
N O T E S T O C O N S O L I D A T E D F I N A N C I A L S T A T E M E N T S | | 113 |
Notes to Consolidated Financial Statements (continued)
The Fund may either buy or sell (write) credit default swaps on single-name issuers (corporate or sovereign), a combination or basket of single-name issuers or traded indexes. Credit default swaps are agreements in which the protection buyer pays fixed periodic payments to the seller in consideration for a promise from the protection seller to make a specific payment should a negative credit event take place with respect to the referenced entity (e.g., bankruptcy, failure to pay, obligation acceleration, repudiation, moratorium or restructuring). As a buyer, if an underlying credit event occurs, the Fund will either (i) receive from the seller an amount equal to the notional amount of the swap and deliver the referenced security or underlying securities comprising the index, or (ii) receive a net settlement of cash equal to the notional amount of the swap less the recovery value of the security or underlying securities comprising the index. As a seller (writer), if an underlying credit event occurs, the Fund will either pay the buyer an amount equal to the notional amount of the swap and take delivery of the referenced security or underlying securities comprising the index or pay a net settlement of cash equal to the notional amount of the swap less the recovery value of the security or underlying securities comprising the index.
| | • | | Total return swaps — Total return swaps are entered into to obtain exposure to a security or market without owning such security or investing directly in such market or to exchange the risk/return of one security or market (e.g., fixed-income) with another security or market (e.g., equity or commodity prices) (equity risk, commodity price risk and/or interest rate risk). |
Total return swaps are agreements in which there is an exchange of cash flows whereby one party commits to make payments based on the total return (distributions plus capital gains/losses) of an underlying instrument, or basket of underlying instruments, in exchange for fixed or floating rate interest payments. If the total return of the instrument(s) or index underlying the transaction exceeds or falls short of the offsetting fixed or floating interest rate obligation, the Fund receives payment from or makes a payment to the counterparty.
Certain total return swaps are designed to function as a portfolio of direct investments in long and short equity positions. This means that the Fund has the ability to trade in and out of these long and short positions within the swap and will receive the economic benefits and risks equivalent to direct investment in these positions, subject to certain adjustments due to events related to the counterparty. Benefits and risks include capital appreciation (depreciation), corporate actions and dividends received and paid, all of which are reflected in the swap’s market value. The market value also includes interest charges and credits (“financing fees”) related to the notional values of the long and short positions and cash balances within the swap. These interest charges and credits are based on a specified benchmark rate plus or minus a specified spread determined based upon the country and/or currency of the positions in the portfolio.
Positions within the swap and financing fees are reset periodically. During a reset, any unrealized appreciation (depreciation) on positions and accrued financing fees become available for cash settlement between the Fund and the counterparty. The amounts that are available for cash settlement are recorded as realized gains or losses in the Consolidated Statement of Operations. Cash settlement in and out of the swap may occur at a reset date or any other date, at the discretion of the Fund and the counterparty, over the life of the agreement. Certain swaps have no stated expiration and can be terminated by either party at any time.
| | • | | Interest rate swaps — Interest rate swaps are entered into to gain or reduce exposure to interest rates or to manage duration, the yield curve or interest rate (interest rate risk). |
Interest rate swaps are agreements in which one party pays a stream of interest payments, either fixed or floating, in exchange for another party’s stream of interest payments, either fixed or floating, on the same notional amount for a specified period of time. In more complex interest rate swaps, the notional principal amount may decline (or amortize) over time.
| | • | | Currency swaps — Currency swaps are entered into to gain or reduce exposure to foreign currencies (foreign currency exchange rate risk). |
Currency swaps are interest rate swaps in which one party pays a stream of interest payments, either fixed or floating, in exchange for another party’s stream of interest payments, either fixed or floating, based on the notional amounts of two different currencies. The notional amounts are typically determined based on the spot exchange rates at the inception of the trade. Currency swaps may also involve an exchange of notional amounts at the start, during and/or at expiration of the contract, either at the current spot rate or another specified rate.
| | • | | Forward swaps — The Fund may enter into forward interest rate swaps and forward total return swaps. In a forward swap, the Fund and the counterparty agree to make periodic net payments beginning on a specified date or a net payment at termination. |
| | • | | Inflation swaps — Inflation swaps are entered into to gain or reduce exposure to inflation (inflation risk). In an inflation swap, one party makes fixed interest payments on a notional principal amount in exchange for another party’s variable payments based on an inflation index, such as the Consumer Price Index. |
Swap transactions involve, to varying degrees, elements of interest rate, credit and market risks in excess of the amounts recognized in the Consolidated Statement of Assets and Liabilities. Such risks involve the possibility that there will be no liquid market for these agreements, that the counterparty to the agreements may default on its obligation to perform or disagree as to the meaning of the contractual terms in the agreements, and that there may be unfavorable changes in interest rates and/or market values associated with these transactions.
Master Netting Arrangements: In order to define its contractual rights and to secure rights that will help mitigate its counterparty risk, the Fund may enter into an International Swaps and Derivatives Association, Inc. Master Agreement (“ISDA Master Agreement”) or similar agreement with its derivative contract counterparties. An ISDA Master Agreement is a bilateral agreement between the Fund and a counterparty that governs certain OTC derivatives and typically contains, among other things, collateral posting terms and netting provisions in the event of a default and/or termination event. Under an ISDA Master Agreement, the Fund may, under certain circumstances, offset with the counterparty certain derivative financial instruments’ payables and/or receivables with collateral held and/or posted and create one single net payment. The provisions of the ISDA Master Agreement typically permit a single net payment in the event of default including the bankruptcy or insolvency of the counterparty. When the Fund enters into an ISDA Master Agreement and an MRA and/or MSLA with the same counterparty, the agreements may contain a set-off provision allowing the Fund to offset a net amount payable with amounts due to the Fund upon default of the counterparty. Bankruptcy or insolvency laws of a particular jurisdiction may restrict or prohibit the right of offset in bankruptcy, insolvency or other events. For example, notwithstanding what contractual rights may be included in an ISDA Master Agreement, such laws may prohibit the Fund from setting off amounts owed to a defaulting counterparty under an ISDA Master Agreement against amounts owed to the Fund by affiliates of the defaulting counterparty. The
| | |
| 114 | | 2 0 2 4 B L A C K R O C K A N N U A L F I N A N C I A L S T A T E M E N T S A N D A D D I T I O N A L I N F O R M A T I O N |
Notes to Consolidated Financial Statements (continued)
insolvency regimes of many jurisdictions do, however, generally permit set-off of simultaneous payables and receivables under certain types of financial contracts between the same legal entity upon a default of the entity, regardless of the existence of a contractual set-off right in those contracts.
Collateral Requirements: For derivatives traded under an ISDA Master Agreement, the collateral requirements are typically calculated by netting the mark-to-market amount for each transaction under such agreement and comparing that amount to the value of any collateral currently pledged by the Fund and the counterparty.
Cash collateral that has been pledged to cover obligations of the Fund and cash collateral received from the counterparty, if any, is reported separately in the Consolidated Statement of Assets and Liabilities as cash pledged as collateral and cash received as collateral, respectively. Non-cash collateral pledged by the Fund, if any, is noted in the Consolidated Schedule of Investments. Generally, the amount of collateral due from or to a counterparty is subject to a certain minimum transfer amount threshold before a transfer is required, which is determined at the close of business of the Fund. Any additional required collateral is delivered to/pledged by the Fund on the next business day. Typically, the counterparty is not permitted to sell, re-pledge or use cash and non-cash collateral it receives. The Fund generally agrees not to use non-cash collateral that it receives but may, absent default or certain other circumstances defined in the underlying ISDA Master Agreement, be permitted to use cash collateral received. In such cases, interest may be paid pursuant to the collateral arrangement with the counterparty. To the extent amounts due to the Fund from the counterparties are not fully collateralized, the Fund bears the risk of loss from counterparty non-performance. Likewise, to the extent the Fund has delivered collateral to a counterparty and stands ready to perform under the terms of its agreement with such counterparty, the Fund bears the risk of loss from a counterparty in the amount of the value of the collateral in the event the counterparty fails to return such collateral. Based on the terms of agreements, collateral may not be required for all derivative contracts.
For financial reporting purposes, the Fund does not offset derivative assets and derivative liabilities that are subject to netting arrangements, if any, in the Consolidated Statement of Assets and Liabilities.
6. INVESTMENT ADVISORY AGREEMENT AND OTHER TRANSACTIONS WITH AFFILIATES
Investment Advisory: The Corporation, on behalf of the Fund, entered into an Investment Advisory Agreement with the Manager, the Fund’s investment adviser and an indirect, wholly-owned subsidiary of BlackRock, Inc. (“BlackRock”), to provide investment advisory and administrative services. The Manager is responsible for the management of the Fund’s portfolio and provides the personnel, facilities, equipment and certain other services necessary to the operations of the Fund.
For such services, the Fund pays the Manager a monthly fee at an annual rate equal to the following percentages of the average daily value of the Fund’s net assets:
| | | | |
| Average Daily Net Assets | | Investment
Advisory Fees | |
First $250 million | | | 0.48 | % |
$250 million — $500 million | | | 0.43 | |
$500 million — $750 million | | | 0.38 | |
Greater than $750 million | | | 0.34 | |
Prior to September 16, 2024, the Master Portfolio entered into an Investment Advisory Agreement with the Manager, the Master Portfolio’s investment adviser and an indirect, wholly-owned subsidiary of BlackRock, Inc. (“BlackRock”), to provide investment advisory and administrative services. The Manager was responsible for the management of the Master Portfolio’s portfolio and provided the personnel, facilities, equipment and certain other services necessary to the operations of the Master Portfolio.
Prior to September 16, 2024, under the terms of the Investment Advisory Agreement between the Corporation, on behalf of the Fund, and the Manager, the Fund paid the Manager a monthly fee at an annual rate equal to the following percentages of the average daily value of the Fund’s net assets for as long as the Fund invested in the Master Portfolio or another master fund advised by BlackRock or an affiliate thereof in a master/feeder structure. Prior to September 16, 2024, for such services, the Master Portfolio paid the Manager a monthly fee at an annual rate equal to the following percentages of the average daily value of the Master Portfolio’s net assets. Effective September 16, 2024, these percentages no longer apply:
| | | | | | | | |
| Average Daily Net Assets | | Fund’s Investment Advisory Fees | | | Master Portfolio’s Investment Advisory Fees | |
First $250 million | | | 0.32 | % | | | 0.16 | % |
$250 million — $500 million | | | 0.31 | | | | 0.12 | |
$500 million — $750 million | | | 0.30 | | | | 0.08 | |
Greater than $750 million | | | 0.29 | | | | 0.05 | |
With respect to the Fund, the Manager entered into separate sub-advisory agreements with each of BlackRock International Limited (“BIL”) and BlackRock (Singapore) Limited (“BSL”), each an affiliate of the Manager. The Manager pays BIL and BSL for services they provide for that portion of the Fund for which BIL and BSL, as applicable, acts as Sub-Advisor, a monthly fee that is equal to a percentage of the investment advisory fees paid by the Fund to the Manager.
| | |
N O T E S T O C O N S O L I D A T E D F I N A N C I A L S T A T E M E N T S | | 115 |
Notes to Consolidated Financial Statements (continued)
Service and Distribution Fees: The Corporation, on behalf of the Fund, entered into a Distribution Agreement and a Distribution and Service Plan with BlackRock Investments, LLC (“BRIL”), an affiliate of the Manager. Pursuant to the Distribution and Service Plan and in accordance with Rule 12b-1 under the 1940 Act, the Fund pays BRIL ongoing service and distribution fees. The fees are accrued daily and paid monthly at annual rates based upon the average daily net assets of the relevant share class of the Fund as follows:
| | | | | | | | |
| | | |
| Share Class | | Service Fees | | | Distribution Fees | |
Service | | | 0.25 | % | | | N/A | |
Investor A | | | 0.25 | | | | N/A | |
Investor A1 | | | 0.10 | | | | N/A | |
Investor C | | | 0.25 | | | | 0.75 | % |
Class R | | | 0.25 | | | | 0.25 | |
BRIL and broker-dealers, pursuant to sub-agreements with BRIL, provide shareholder servicing and distribution services to the Fund. The ongoing service and/or distribution fee compensates BRIL and each broker-dealer for providing shareholder servicing and/or distribution related services to shareholders.
For the year ended September 30, 2024, the following table shows the class specific service and distribution fees borne directly by each share class of the Fund:
| | | | | | | | | | | | | | | | | | | | | | | | |
| | | | | | | |
| | | Service | | | Investor A | | | Investor A1 | | | Investor C | | | Class R | | | Total | |
Service and distribution — class specific | | $ | 93,078 | | | $ | 3,104,186 | | | $ | 15,745 | | | $ | 387,841 | | | $ | 352,009 | | | $ | 3,952,859 | |
Transfer Agent: Pursuant to written agreements, certain financial intermediaries, some of which may be affiliates, provide the Fund with sub-accounting, recordkeeping, sub-transfer agency and other administrative services with respect to servicing of underlying investor accounts. For these services, these entities receive an asset-based fee or an annual fee per shareholder account, which will vary depending on share class and/or net assets. For the year ended September 30, 2024, the Fund paid $896,469 for the Fund’s Institutional Shares to affiliates of BlackRock in return for these services, which are included in transfer agent — class specific in the Statement of Operations.
The Manager maintains a call center that is responsible for providing certain shareholder services to the Fund. Shareholder services include responding to inquiries and processing purchases and sales based upon instructions from shareholders. For the year ended September 30, 2024, the Fund reimbursed the Manager the following amounts for costs incurred in running the call center, which are included in transfer agent — class specific in the Statement of Operations.
| | | | | | | | | | | | | | | | | | | | | | | | | | | | | | | | |
| | | | | | | | | |
| | | Institutional | | | Service | | | Investor A | | | Investor A1 | | | Investor C | | | Class K | | | Class R | | | Total | |
Reimbursed amounts | | $ | 34,295 | | | $ | 579 | | | $ | 11,146 | | | $ | 143 | | | $ | 2,394 | | | $ | 14,829 | | | $ | 1,681 | | | $ | 65,067 | |
For the year ended September 30, 2024, the following table shows the class specific transfer agent fees borne directly by each share class of the Fund:
| | | | | | | | | | | | | | | | | | | | | | | | | | | | | | | | |
| | | | | | | | | |
| | | Institutional | | | Service | | | Investor A | | | Investor A1 | | | Investor C | | | Class K | | | Class R | | | Total | |
Transfer agent — class specific | | $ | 10,170,118 | | | $ | 59,642 | | | $ | 1,622,343 | | | $ | 35,085 | | | $ | 53,277 | | | $ | 419,692 | | | $ | 126,921 | | | $ | 12,487,078 | |
Other Fees: For the year ended September 30, 2024, affiliates earned underwriting discounts, direct commissions and dealer concessions on sales of the Fund’s Investor A Shares for a total of $8,652.
For the year ended September 30, 2024, affiliates received CDSCs as follows:
| | | | |
| |
| |
| Share Class | | Amounts | |
| |
| |
Investor A | | | $ 24,873 | |
Investor C | | | 4,574 | |
Expense Limitations, Waivers and Reimbursements: With the exception of the Fund’s investment in the Master Portfolio, prior to September 16, 2024, the Manager contractually agreed to waive its investment advisory fee with respect to any portion of the Fund’s assets invested in affiliated equity and fixed-income mutual funds and affiliated exchange-traded funds that have a contractual management fee through June 30, 2025. The contractual agreement may be terminated upon 90 days’ notice by a majority of the Independent Directors, or by a vote of a majority of the outstanding voting securities of the Fund. This amount is included in fees waived and/or reimbursed by the Manager in the Consolidated Statement of Operations. For the period October 1, 2023 through September 13, 2024, the Manager waived $14,957 in investment advisory fees pursuant to this arrangement. For the period September 16, 2024 through September 30, 2024, the Manager waived $462 in investment advisory fees pursuant to this arrangement.
Prior to September 16, 2024, with respect to the Master Portfolio, the Manager contractually agreed to waive its investment advisory fees by the amount of investment advisory fees the Master Portfolio pays to the Manager indirectly through its investment in affiliated money market funds (the “affiliated money market fund waiver”) through June 30, 2025. The contractual agreement may be terminated upon 90 days’ notice by a majority of the Independent Directors, or by a vote of a majority of the outstanding voting securities of the Master Portfolio. This amount is included in fees waived and/or reimbursed by the Manager in the Consolidated Statement of Operations. For the period October 1, 2023 through September 13, 2024, the amount waived was $361,238. For the period September 16, 2024 through September 30, 2024, the amount waived $51,730.
| | |
| 116 | | 2 0 2 4 B L A C K R O C K A N N U A L F I N A N C I A L S T A T E M E N T S A N D A D D I T I O N A L I N F O R M A T I O N |
Notes to Consolidated Financial Statements (continued)
With respect to the Fund, the Manager contractually agreed to waive and/or reimburse fees or expenses in order to limit expenses, excluding interest expense, dividend expense, tax expense, acquired fund fees and expenses, and certain other fund expenses, which constitute extraordinary expenses not incurred in the ordinary course of the Fund’s business (“expense limitation”). The expense limitations as a percentage of average daily net assets are as follows:
| | | | |
| |
| |
| Share Class | | Expense Limitations | |
| |
Institutional | | | 0.44 | % |
Service | | | 0.75 | |
Investor A | | | 0.78 | |
Investor A1 | | | 0.59 | |
Investor C | | | 1.44 | |
Class K | | | 0.39 | |
Class R | | | 1.03 | |
| |
The Manager has agreed not to reduce or discontinue the contractual expense limitations through June 30, 2025, unless approved by the Board, including a majority of the Independent Directors, or by a vote of a majority of the outstanding voting securities of the Fund.
In addition, these amounts waived and/or reimbursed by the Manager are included in transfer agent fees waived and/or reimbursed by the Manager — class specific in the Statement of Operations. For the year ended September 30, 2024, class specific waivers and/or reimbursements were as follows:
| | | | | | | | | | | | | | | | | | | | | | | | |
| | | | | | | |
| | | Institutional | | | Service | | | Investor A1 | | | Investor C | | | Class R | | | Total | |
| | | | | | |
Transfer agent fees waived and/or reimbursed — class specific | | $ | 1,731,502 | | | $ | 7,158 | | | $ | 14,856 | | | $ | 21,836 | | | $ | 7,076 | | | $ | 1,782,428 | |
Securities Lending: The U.S. Securities and Exchange Commission (“SEC”) has issued an exemptive order which permits BIM, an affiliate of the Manager, to serve as securities lending agent for the Fund, subject to applicable conditions. As securities lending agent, BIM bears all operational costs directly related to securities lending. The Fund is responsible for fees in connection with the investment of cash collateral received for securities on loan (the “collateral investment fees”). The cash collateral is invested in a money market fund, BlackRock Cash Funds: Institutional, managed by the Manager or its affiliates. However, BIM has agreed to reduce the amount of securities lending income it receives in order to effectively limit the collateral investment fees the Fund bears to an annual rate of 0.04%. The SL Agency Shares of such money market fund will not be subject to a sales load, redemption fee, distribution fee or service fee. The money market fund in which the cash collateral has been reinvested may impose a discretionary liquidity fee of up to 2% of the value redeemed, if such fee, is determined to be in the best interests of such money market fund.
Securities lending income is generally equal to the total of income earned from the reinvestment of cash collateral, (and excludes collateral investment fees), and any fees or other payments to and from borrowers of securities. The Fund retains a portion of the securities lending income and remits the remaining portion to BIM as compensation for its services as securities lending agent.
Pursuant to the current securities lending agreement, the Fund retains 81% of securities lending income (which excludes collateral investment fees), and this amount retained can never be less than 70% of the total of securities lending income plus the collateral investment fees.
In addition, commencing the business day following the date that the aggregate securities lending income earned across the BlackRock Fixed-Income Complex in a calendar year exceeds a specified threshold, the Fund, pursuant to the securities lending agreement, will retain for the remainder of that calendar year securities lending income in an amount equal to 81% of securities lending income (which excludes collateral investment fees), and this amount retained can never be less than 70% of the total of securities lending income plus the collateral investment fees.
The share of securities lending income earned by the Fund is shown as securities lending income — affiliated — net in the Consolidated Statement of Operations. For the year ended September 30, 2024, the Fund paid BIM $38,432 for securities lending agent services.
Interfund Lending: In accordance with an exemptive order (the “Order”) from the SEC, the Fund may participate in a joint lending and borrowing facility for temporary purposes (the “Interfund Lending Program”), subject to compliance with the terms and conditions of the Order, and to the extent permitted by the Fund’s investment policies and restrictions. The Fund is currently permitted to borrow and lend under the Interfund Lending Program.
A lending BlackRock fund may lend in aggregate up to 15% of its net assets but may not lend more than 5% of its net assets to any one borrowing fund through the Interfund Lending Program. A borrowing BlackRock fund may not borrow through the Interfund Lending Program or from any other source more than 33 1/3% of its total assets (or any lower threshold provided for by the fund’s investment restrictions). If a borrowing BlackRock fund’s total outstanding borrowings exceed 10% of its total assets, each of its outstanding interfund loans will be subject to collateralization of at least 102% of the outstanding principal value of the loan. All interfund loans are for temporary or emergency purposes and the interest rate to be charged will be the average of the highest current overnight repurchase agreement rate available to a lending fund and the bank loan rate, as calculated according to a formula established by the Board.
During the year ended September 30, 2024, the Fund did not participate in the Interfund Lending Program.
Directors and Officers: Certain directors and/or officers of the Corporation are directors and/or officers of BlackRock or its affiliates. The Fund reimburses the Manager for a portion of the compensation paid to the Corporation’s Chief Compliance Officer, which is included in Officer in the Statement of Operations.
Other Transactions: During the year ended September 30, 2024, the Fund received a reimbursement of $26,690 from an affiliate, which is included in payments by affiliates in the Statement of Operations, related to operating events.
| | |
N O T E S T O C O N S O L I D A T E D F I N A N C I A L S T A T E M E N T S | | 117 |
Notes to Consolidated Financial Statements (continued)
7. PURCHASES AND SALES
For the year ended September 30, 2024, purchases and sales of investments, including paydowns, mortgage dollar rolls and excluding short-term securities, were as follows:
| | | | | | | | |
| |
| | | Purchases | | | Sales | |
| |
Non-U.S. Government Securities | | $ | 14,582,320,197 | | | $ | 12,733,440,310 | |
U.S. Government Securities | | | 79,301,228,188 | | | | 82,230,415,459 | |
| |
These amounts include purchases and sales of investments from the Master Portfolio for the period from October 1, 2023 through September 13, 2024, which include paydowns, mortgage dollar rolls and exclude short-term securities were as follows:
| | | | | | | | |
| |
| | | Purchases | | | Sales | |
| |
Non-U.S. Government Securities | | $ | 13,721,129,245 | | | $ | 12,049,459,681 | |
U.S. Government Securities | | | 74,493,680,952 | | | | 77,611,732,755 | |
| |
For the year ended September 30, 2024, purchases and sales related to mortgage dollar rolls were as follows:
| | | | | | | | |
| |
| | | Purchases | | | Sales | |
| |
Mortgage Dollar Rolls | | $ | 40,231,858,024 | | | $ | 40,222,692,455 | |
| |
8. INCOME TAX INFORMATION
It is the Fund’s policy to comply with the requirements of the Internal Revenue Code of 1986, as amended, applicable to regulated investment companies, and to distribute substantially all of its taxable income to its shareholders. Therefore, no U.S. federal income tax provision is required.
The Fund files U.S. federal and various state and local tax returns. No income tax returns are currently under examination. The statute of limitations on the Fund’s U.S. federal tax returns generally remains open for a period of three years after they are filed. The statutes of limitations on the Fund’s state and local tax returns may remain open for an additional year depending upon the jurisdiction.
Management has analyzed tax laws and regulations and their application to the Fund as of September 30, 2024, inclusive of the open tax return years, and does not believe that there are any uncertain tax positions that require recognition of a tax liability in the Fund’s financial statements. Management’s analysis is based on the tax laws and judicial and administrative interpretations thereof in effect as of date of these financial statements, all of which are subject to change, possibly with retroactive effect which may impact the Fund’s NAV.
U.S. GAAP requires that certain components of net assets be adjusted to reflect permanent differences between financial and tax reporting. These reclassifications have no effect on net assets or NAVs per share. As of period end, the following permanent differences attributable to net losses derived form the Fund’s wholly owned subsidiary and the timing and recognition of partnership income were reclassified to the following accounts:
| | | | |
| |
| |
| | | Amounts | |
| |
Paid-in capital | | $ | (108,012,640 | ) |
Accumulated earnings (loss) | | | 108,012,640 | |
| |
The tax character of distributions paid was as follows:
| | | | | | | | |
| |
| | |
| Fund Name | | Year Ended 09/30/24 | | | Year Ended 09/30/23 | |
| |
Ordinary income | | $ | 862,498,854 | | | $ | 656,211,309 | |
Return of capital | | | — | | | | 41,838,712 | |
| | | | | | | | |
| | $ | 862,498,854 | | | $ | 698,050,021 | |
| | | | | | | | |
| | |
| | | | | | | | |
| |
As of September 30, 2024, the tax components of accumulated earnings (loss) were as follows:
| | | | | | | | | | | | | | | | |
| |
| | | | |
| Fund Name | |
| Undistributed
Ordinary Income |
| |
| Non-expiring
Capital Loss
Carryforwards |
(a) | |
| Net Unrealized
Gains (Losses) |
(b) | | | Total | |
| |
BlackRock Total Return Fund | | $ | 17,270,264 | | | $ | (2,384,582,678 | ) | | $ | (488,247,336 | ) | | $ | (2,855,559,750 | ) |
| | | | | | | | | | | | | | | | |
| |
| (a) | Amounts available to offset future realized capital gains. |
| (b) | The difference between book-basis and tax-basis net unrealized gains was attributable primarily to the tax deferral of losses on wash sales, the realization for tax purposes of unrealized gains (losses) on certain foreign currency contracts, the realization for tax purposes of unrealized gains (losses) on certain futures contracts, accounting for swap agreements, classification of investments and tax deferral of losses on straddles. |
| | |
| 118 | | 2 0 2 4 B L A C K R O C K A N N U A L F I N A N C I A L S T A T E M E N T S A N D A D D I T I O N A L I N F O R M A T I O N |
Notes to Consolidated Financial Statements (continued)
As of September 30, 2024, gross unrealized appreciation and depreciation based on cost of investments (including short positions and derivatives, if any) for U.S. federal income tax purposes were as follows:
| | | | |
| |
| |
| | | Amounts | |
| |
Tax cost | | $ | 23,402,394,429 | |
| | | | |
Gross unrealized appreciation | | $ | 416,529,726 | |
Gross unrealized depreciation | | | (905,285,033 | ) |
| | | | |
Net unrealized appreciation (depreciation) | | $ | (488,755,307 | ) |
| | | | |
| | | | |
| |
9. PRINCIPAL RISKS
In the normal course of business, the Fund invests in securities or other instruments and may enter into certain transactions, and such activities subject the Fund to various risks, including among others, fluctuations in the market (market risk) or failure of an issuer to meet all of its obligations. The value of securities or other instruments may also be affected by various factors, including, without limitation: (i) the general economy; (ii) the overall market as well as local, regional or global political and/or social instability; (iii) regulation, taxation or international tax treaties between various countries; or (iv) currency, interest rate and price fluctuations. Local, regional or global events such as war, acts of terrorism, the spread of infectious illness or other public health issues, recessions, or other events could have a significant impact on the Fund and its investments. The Fund’s prospectus provides details of the risks to which the Fund is subject.
The Fund may be exposed to additional risks when reinvesting cash collateral in money market funds that do not seek to maintain a stable NAV per share of $1.00, which may be subject to discretionary liquidity fees under certain circumstances.
Market Risk: The Fund may be exposed to prepayment risk, which is the risk that borrowers may exercise their option to prepay principal earlier than scheduled during periods of declining interest rates, which would force the Fund to reinvest in lower yielding securities. The Fund may also be exposed to reinvestment risk, which is the risk that income from the Fund’s portfolio will decline if the Fund invests the proceeds from matured, traded or called fixed-income securities at market interest rates that are below the Fund portfolio’s current earnings rate.
Municipal securities are subject to the risk that litigation, legislation or other political events, local business or economic conditions, credit rating downgrades, or the bankruptcy of the issuer could have a significant effect on an issuer’s ability to make payments of principal and/or interest or otherwise affect the value of such securities. Municipal securities can be significantly affected by political or economic changes, including changes made in the law after issuance of the securities, as well as uncertainties in the municipal market related to, taxation, legislative changes or the rights of municipal security holders, including in connection with an issuer insolvency. Municipal securities backed by current or anticipated revenues from a specific project or specific assets can be negatively affected by the discontinuance of the tax benefits supporting the project or assets or the inability to collect revenues for the project or from the assets. Municipal securities may be less liquid than taxable bonds, and there may be less publicly available information on the financial condition of municipal security issuers than for issuers of other securities.
Valuation Risk: The market values of equities, such as common stocks and preferred securities or equity related investments, such as futures and options, may decline due to general market conditions which are not specifically related to a particular company. They may also decline due to factors which affect a particular industry or industries. The Fund may invest in illiquid investments. An illiquid investment is any investment that the Fund reasonably expects cannot be sold or disposed of in current market conditions in seven calendar days or less without the sale or disposition significantly changing the market value of the investment. The Fund may experience difficulty in selling illiquid investments in a timely manner at the price that it believes the investments are worth. Prices may fluctuate widely over short or extended periods in response to company, market or economic news. Markets also tend to move in cycles, with periods of rising and falling prices. This volatility may cause the Fund’s NAV to experience significant increases or decreases over short periods of time. If there is a general decline in the securities and other markets, the NAV of the Fund may lose value, regardless of the individual results of the securities and other instruments in which the Fund invests. The Fund’s ability to value its investments may also be impacted by technological issues and/or errors by pricing services or other third-party service providers.
The price the Fund could receive upon the sale of any particular portfolio investment may differ from the Fund’s valuation of the investment, particularly for securities that trade in thin or volatile markets or that are valued using a fair valuation technique or a price provided by an independent pricing service. Changes to significant unobservable inputs and assumptions (i.e., publicly traded company multiples, growth rate, time to exit) due to the lack of observable inputs may significantly impact the resulting fair value and therefore the Fund’s results of operations. As a result, the price received upon the sale of an investment may be less than the value ascribed by the Fund, and the Fund could realize a greater than expected loss or lesser than expected gain upon the sale of the investment.
Counterparty Credit Risk: The Fund may be exposed to counterparty credit risk, or the risk that an entity may fail to or be unable to perform on its commitments related to unsettled or open transactions, including making timely interest and/or principal payments or otherwise honoring its obligations. The Fund manages counterparty credit risk by entering into transactions only with counterparties that the Manager believes have the financial resources to honor their obligations and by monitoring the financial stability of those counterparties. Financial assets, which potentially expose the Fund to market, issuer and counterparty credit risks, consist principally of financial instruments and receivables due from counterparties. The extent of the Fund’s exposure to market, issuer and counterparty credit risks with respect to these financial assets is approximately their value recorded in the Consolidated Statement of Assets and Liabilities, less any collateral held by the Fund.
A derivative contract may suffer a mark-to-market loss if the value of the contract decreases due to an unfavorable change in the market rates or values of the underlying instrument. Losses can also occur if the counterparty does not perform under the contract.
| | |
N O T E S T O C O N S O L I D A T E D F I N A N C I A L S T A T E M E N T S | | 119 |
Notes to Consolidated Financial Statements (continued)
For OTC options purchased, the Fund bears the risk of loss in the amount of the premiums paid plus the positive change in market values net of any collateral held by the Fund should the counterparty fail to perform under the contracts. Options written by the Fund do not typically give rise to counterparty credit risk, as options written generally obligate the Fund, and not the counterparty, to perform. The Fund may be exposed to counterparty credit risk with respect to options written to the extent the Fund deposits collateral with its counterparty to a written option.
With exchange-traded options purchased and exchange-traded futures and centrally cleared swaps, there is less counterparty credit risk to the Fund since the exchange or clearinghouse, as counterparty to such instruments, guarantees against a possible default. The clearinghouse stands between the buyer and the seller of the contract; therefore, credit risk is limited to failure of the clearinghouse. While offset rights may exist under applicable law, the Fund does not have a contractual right of offset against a clearing broker or clearinghouse in the event of a default (including the bankruptcy or insolvency). Additionally, credit risk exists in exchange-traded futures and centrally cleared swaps with respect to initial and variation margin that is held in a clearing broker’s customer accounts. While clearing brokers are required to segregate customer margin from their own assets, in the event that a clearing broker becomes insolvent or goes into bankruptcy and at that time there is a shortfall in the aggregate amount of margin held by the clearing broker for all its clients, typically the shortfall would be allocated on a pro rata basis across all the clearing broker’s customers, potentially resulting in losses to the Fund.
Geographic/Asset Class Risk: A diversified portfolio, where this is appropriate and consistent with a fund’s objectives, minimizes the risk that a price change of a particular investment will have a material impact on the NAV of a fund. The investment concentrations within the Fund’s portfolio are disclosed in its Consolidated Schedule of Investments.
The Fund invests a significant portion of its assets in fixed-income securities and/or uses derivatives tied to the fixed-income markets. Changes in market interest rates or economic conditions may affect the value and/or liquidity of such investments. Interest rate risk is the risk that prices of bonds and other fixed-income securities will decrease as interest rates rise and increase as interest rates fall. The Fund may be subject to a greater risk of rising interest rates during a period of historically low interest rates. The Federal Reserve has raised the federal funds rate as part of its efforts to address inflation. Changing interest rates may have unpredictable effects on markets, may result in heightened market volatility, and could negatively impact the Fund’s performance.
The Fund invests a significant portion of its assets in securities backed by commercial or residential mortgage loans or in issuers that hold mortgage and other asset-backed securities. When a fund concentrates its investments in this manner, it assumes a greater risk of prepayment or payment extension by securities issuers. Changes in economic conditions, including delinquencies and/or defaults on assets underlying these securities, can affect the value, income and/or liquidity of such positions. Investment percentages in these securities are presented in the Consolidated Schedule of Investments.
The Fund invests a significant portion of its assets in securities of issuers located in the United States. A decrease in imports or exports, changes in trade regulations, inflation and/or an economic recession in the United States may have a material adverse effect on the U.S. economy and the securities listed on U.S. exchanges. Proposed and adopted policy and legislative changes in the United States may also have a significant effect on U.S. markets generally, as well as on the value of certain securities. Governmental agencies project that the United States will continue to maintain elevated public debt levels for the foreseeable future which may constrain future economic growth. Circumstances could arise that could prevent the timely payment of interest or principal on U.S. government debt, such as reaching the legislative “debt ceiling.” Such non-payment would result in substantial negative consequences for the U.S. economy and the global financial system. If U.S. relations with certain countries deteriorate, it could adversely affect issuers that rely on the United States for trade. The United States has also experienced increased internal unrest and discord. If these trends were to continue, they may have an adverse impact on the U.S. economy and the issuers in which the Fund invests.
Significant Shareholder Redemption Risk: Certain shareholders may own or manage a substantial amount of fund shares and/or hold their fund investments for a limited period of time. Large redemptions of fund shares by these shareholders may force a fund to sell portfolio securities, which may negatively impact the fund’s NAV, increase the fund’s brokerage costs, and/or accelerate the realization of taxable income/gains and cause the fund to make additional taxable distributions to shareholders.
LIBOR Transition Risk: The Fund may be exposed to financial instruments that recently transitioned from, or continue to be tied to, the London Interbank Offered Rate (“LIBOR”) to determine payment obligations, financing terms, hedging strategies or investment value. The United Kingdom’s Financial Conduct Authority, which regulates LIBOR, has ceased publishing all LIBOR settings, but some USD LIBOR settings will continue to be published under a synthetic methodology until September 30, 2024 for certain legacy contracts. SOFR has been used increasingly on a voluntary basis in new instruments and transactions. Under U.S. regulations that implement a statutory fallback mechanism to replace LIBOR, benchmark rates based on SOFR have replaced LIBOR in certain financial contracts. The ultimate effect of the LIBOR transition process on the Fund is uncertain.
| 10. | CAPITAL SHARE TRANSACTIONS |
Transactions in capital shares for each class were as follows:
| | | | | | | | | | | | | | | | |
| | | Year Ended 09/30/24 | | | Year Ended 09/30/23 | |
| | | | |
| Share Class | | Shares | | | Amount | | | Shares | | | Amount | |
| | | | |
Institutional | | | | | | | | | | | | | | | | |
Shares sold | | | 481,902,649 | | | $ | 4,752,842,030 | | | | 448,340,202 | | | $ | 4,464,830,242 | |
Shares issued in reinvestment of distributions | | | 46,490,349 | | | | 457,662,091 | | | | 34,294,163 | | | | 340,307,553 | |
Shares redeemed | | | (422,542,420 | ) | | | (4,150,302,091 | ) | | | (379,303,795 | ) | | | (3,763,225,096 | ) |
| | | | | | | | | | | | | | | | |
| | | | |
| | | 105,850,578 | | | $ | 1,060,202,030 | | | | 103,330,570 | | | $ | 1,041,912,699 | |
| | | | | | | | | | | | | | | | |
| | |
| 120 | | 2 0 2 4 B L A C K R O C K A N N U A L F I N A N C I A L S T A T E M E N T S A N D A D D I T I O N A L I N F O R M A T I O N |
Notes to Consolidated Financial Statements (continued)
| | | | | | | | | | | | | | | | |
| | | Year Ended 09/30/24 | | | Year Ended 09/30/23 | |
| | | | |
| Share Class | | Shares | | | Amount | | | Shares | | | Amount | |
| | | | |
Service | | | | | | | | | | | | | | | | |
Shares sold | | | 633,782 | | | $ | 6,250,232 | | | | 847,711 | | | $ | 8,451,565 | |
Shares issued in reinvestment of distributions | | | 164,508 | | | | 1,616,783 | | | | 149,370 | | | | 1,483,527 | |
Shares redeemed | | | (835,989 | ) | | | (8,226,413 | ) | | | (1,490,796 | ) | | | (14,858,247 | ) |
| | | | | | | | | | | | | | | | |
| | | | |
| | | (37,699 | ) | | $ | (359,398 | ) | | | (493,715 | ) | | $ | (4,923,155 | ) |
| | | | | | | | | | | | | | | | |
| | | | |
Investor A | | | | | | | | | | | | | | | | |
Shares sold | | | 35,802,100 | | | $ | 353,628,091 | | | | 32,659,966 | | | $ | 325,116,421 | |
Shares issued in reinvestment of distributions | | | 5,182,565 | | | | 51,014,846 | | | | 3,441,563 | | | | 34,175,875 | |
Shares redeemed | | | (41,825,232 | ) | | | (410,440,969 | ) | | | (42,205,930 | ) | | | (419,585,117 | ) |
| | | | | | | | | | | | | | | | |
| | | | |
| | | (840,567 | ) | | $ | (5,798,032 | ) | | | (6,104,401 | ) | | $ | (60,292,821 | ) |
| | | | | | | | | | | | | | | | |
| | | | |
Investor A1 | | | | | | | | | | | | | | | | |
Shares sold | | | 153,547 | | | $ | 1,511,625 | | | | 424,387 | | | $ | 4,215,352 | |
Shares issued in reinvestment of distributions | | | 62,442 | | | | 613,930 | | | | 8,157 | | | | 80,955 | |
Shares redeemed | | | (419,384 | ) | | | (4,097,351 | ) | | | (745,157 | ) | | | (7,439,964 | ) |
| | | | | | | | | | | | | | | | |
| | | | |
| | | (203,395 | ) | | $ | (1,971,796 | ) | | | (312,613 | ) | | $ | (3,143,657 | ) |
| | | | | | | | | | | | | | | | |
| | | | |
Investor C | | | | | | | | | | | | | | | | |
Shares sold | | | 765,030 | | | $ | 7,493,953 | | | | 1,007,181 | | | $ | 10,042,763 | |
Shares issued in reinvestment of distributions | | | 138,687 | | | | 1,362,957 | | | | 127,481 | | | | 1,264,934 | |
Shares redeemed | | | (1,827,325 | ) | | | (17,860,187 | ) | | | (2,446,949 | ) | | | (24,283,023 | ) |
| | | | | | | | | | | | | | | | |
| | | | |
| | | (923,608 | ) | | $ | (9,003,277 | ) | | | (1,312,287 | ) | | $ | (12,975,326 | ) |
| | | | | | | | | | | | | | | | |
| | | | |
Class K | | | | | | | | | | | | | | | | |
Shares sold | | | 202,661,708 | | | $ | 2,002,649,570 | | | | 196,109,413 | | | $ | 1,957,201,931 | |
Shares issued in reinvestment of distributions | | | 30,433,597 | | | | 299,455,102 | | | | 25,220,951 | | | | 250,297,342 | |
Shares redeemed | | | (203,443,991 | ) | | | (1,986,821,082 | ) | | | (180,124,640 | ) | | | (1,790,195,524 | ) |
| | | | | | | | | | | | | | | | |
| | | | |
| | | 29,651,314 | | | $ | 315,283,590 | | | | 41,205,724 | | | $ | 417,303,749 | |
| | | | | | | | | | | | | | | | |
| | | | |
Class R | | | | | | | | | | | | | | | | |
Shares sold | | | 2,016,157 | | | $ | 19,843,367 | | | | 2,065,525 | | | $ | 20,551,929 | |
Shares issued in reinvestment of distributions | | | 290,020 | | | | 2,855,542 | | | | 221,838 | | | | 2,202,186 | |
Shares redeemed | | | (2,231,236 | ) | | | (21,975,431 | ) | | | (1,896,891 | ) | | | (18,857,002 | ) |
| | | | | | | | | | | | | | | | |
| | | | |
| | | 74,941 | | | $ | 723,478 | | | | 390,472 | | | $ | 3,897,113 | |
| | | | | | | | | | | | | | | | |
| | | | |
| | | 133,571,564 | | | $ | 1,359,076,595 | | | | 136,703,750 | | | $ | 1,381,778,602 | |
| | | | | | | | | | | | | | | | |
As of September 30, 2024, BlackRock HoldCo 2, Inc., an affiliate of the Fund, owned 264,970 Class K shares of the Fund.
Management has evaluated the impact of all subsequent events on the Fund through the date the financial statements were issued and has determined that there were no subsequent events requiring adjustment or additional disclosure in the financial statements.
| | |
N O T E S T O C O N S O L I D A T E D F I N A N C I A L S T A T E M E N T S | | 121 |
Report of Independent Registered Public Accounting Firm
To the Shareholders of BlackRock Total Return Fund and the Board of Directors of BlackRock Bond Fund, Inc.:
Opinion on the Financial Statements and Financial Highlights
We have audited the accompanying statement of assets and liabilities of BlackRock Total Return Fund of BlackRock Bond Fund, Inc. (the “Fund”), including the schedule of investments, as of September 30, 2024, the related statement of operations for the year then ended, the statements of changes in net assets for each of the two years in the period then ended, the financial highlights for each of the five years in the period then ended, and the related notes. Such financial statements and financial highlights are consolidated as of and for the year ended September 30, 2024. In our opinion, the financial statements and financial highlights present fairly, in all material respects, the financial position of the Fund as of September 30, 2024, and the results of its operations for the year then ended, the changes in its net assets for each of the two years in the period then ended, and the financial highlights for each of the five years in the period then ended, in conformity with accounting principles generally accepted in the United States of America.
Basis for Opinion
These financial statements and financial highlights are the responsibility of the Fund’s management. Our responsibility is to express an opinion on the Fund’s financial statements and financial highlights based on our audits. We are a public accounting firm registered with the Public Company Accounting Oversight Board (United States) (PCAOB) and are required to be independent with respect to the Fund in accordance with the U.S. federal securities laws and the applicable rules and regulations of the Securities and Exchange Commission and the PCAOB.
We conducted our audits in accordance with the standards of the PCAOB. Those standards require that we plan and perform the audit to obtain reasonable assurance about whether the financial statements and financial highlights are free of material misstatement, whether due to error or fraud. The Fund is not required to have, nor were we engaged to perform, an audit of its internal control over financial reporting. As part of our audits we are required to obtain an understanding of internal control over financial reporting but not for the purpose of expressing an opinion on the effectiveness of the Fund’s internal control over financial reporting. Accordingly, we express no such opinion.
Our audits included performing procedures to assess the risks of material misstatement of the financial statements and financial highlights, whether due to error or fraud, and performing procedures that respond to those risks. Such procedures included examining, on a test basis, evidence regarding the amounts and disclosures in the financial statements and financial highlights. Our audits also included evaluating the accounting principles used and significant estimates made by management, as well as evaluating the overall presentation of the financial statements and financial highlights. Our procedures included confirmation of securities owned as of September 30, 2024, by correspondence with custodians or counterparties; when replies were not received, we performed other auditing procedures. We believe that our audits provide a reasonable basis for our opinion.
Deloitte & Touche LLP
Boston, Massachusetts
November 21, 2024
We have served as the auditor of one or more BlackRock investment companies since 1992.
| | |
| 122 | | 2 0 2 4 B L A C K R O C K A N N U A L F I N A N C I A L S T A T E M E N T S A N D A D D I T I O N A L I N F O R M A T I O N |
Important Tax Information (unaudited)
The following amount, or maximum amount allowable by law, is hereby designated as qualified dividend income for individuals for the fiscal year ended September 30, 2024:
| | | | |
| | |
| Fund Name | | Qualified Dividend
Income | |
BlackRock Total Return Fund | | $ | 1,056,876 | |
The following amount, or maximum amount allowable by law, are hereby designated as qualified business income for individuals for the fiscal year ended September 30, 2024:
| | | | |
| | |
| Fund Name | | Qualified Business
Income | |
BlackRock Total Return Fund | | $ | 45,803 | |
The Fund hereby designates the following amount, or maximum amount allowable by law, of distributions from direct federal obligation interest for the fiscal year ended September 30, 2024:
| | | | |
| | |
| Fund Name | | Federal Obligation
Interest | |
BlackRock Total Return Fund | | $ | 150,913,217 | |
The law varies in each state as to whether and what percent of ordinary income dividends attribute to federal obligations is exempt from state income tax. Shareholders are advised to check with their tax advisers to determine if any portion of the dividends received is exempt from state income tax.
The following percentage, or maximum percentage allowable by law, of ordinary income distributions paid during the fiscal year ended September 30, 2024 qualified for the dividends-received deduction for corporate shareholders:
| | | | |
| |
| |
| Fund Name | | Dividends-Received
Deduction | |
| |
BlackRock Total Return Fund | | | 0.07 | % |
| |
The Fund hereby designates the following amount, or maximum amount allowable by law, as interest income eligible to be treated as a Section 163(j) interest dividend for the fiscal year ended September 30, 2024:
| | | | |
| | |
| Fund Name | | Interest Dividends | |
BlackRock Total Return Fund | | $ | 864,850,276 | |
The Fund hereby designates the following amount, or maximum amount allowable by law, as interest-related dividends eligible for exemption from U.S. withholding tax for nonresident aliens and foreign corporations, for the fiscal year ended September 30, 2024:
| | | | |
| | |
| Fund Name | | Interest-
Related
Dividends | |
BlackRock Total Return Fund | | $ | 713,117,742 | |
| | |
I M P O R T A N T T A X I N F O R M A T I O N | | 123 |
Disclosure of Investment Advisory Agreements and Sub-Advisory Agreements
The Board of Directors of Master Bond LLC (the “Master Portfolio”) met on May 3, 2024 (the “May Meeting”) and June 6-7, 2024 (the “June Meeting”) to consider the approval to continue the investment advisory agreement (the “Master Fund Advisory Agreement”) between the Master Portfolio, on behalf of Master Total Return Portfolio (the “Master Fund”) and BlackRock Advisors, LLC (the “Manager”), the Master Portfolio’s investment advisor. The Board of Directors of the Master Portfolio also considered the approval to continue the sub-advisory agreements (together, the “Master Fund Sub-Advisory Agreements”) between the Manager and BlackRock International Limited and BlackRock (Singapore) Limited (together, the “Sub-Advisors”), with respect to the Master Fund. The BlackRock Total Return Fund (the “Feeder Fund”), a series of BlackRock Bond Fund, Inc. (the “Feeder Corporation”), is a “feeder” fund that invests all of its investable assets in the Master Fund. Accordingly, the Board of Directors of the Feeder Corporation also considered the approval to continue the investment advisory agreement (the “Feeder Fund Advisory Agreement” and together with the Master Fund Advisory Agreement, the “Advisory Agreements”) between the Feeder Corporation, on behalf of the Feeder Fund, and the Manager, and the sub-advisory agreements (the “Feeder Fund Sub-Advisory Agreements” and collectively with the Master Fund Sub-Advisory Agreements, the “Sub-Advisory Agreements”) between the Manager and the Sub-Advisors, with respect to the Feeder Fund. The Manager and the Sub-Advisors are referred to herein as “BlackRock.” The Advisory Agreements and the Sub-Advisory Agreements are referred to herein as the “Agreements.” For simplicity: (a) the Board of Directors of the Master Portfolio and the Board of Directors of the Feeder Corporation are referred to herein collectively as the “Board,” and the members are referred to as “Board Members”; (b) the shareholders of the Feeder Fund and the interest holders of the Master Fund are referred to as “shareholders,” and (c) the Master Fund and the Feeder Fund are referred to herein together as the “Fund.”
The Approval Process
Consistent with the requirements of the Investment Company Act of 1940 (the “1940 Act”), the Board considers the approval of the continuation of the Agreements for the Master Portfolio on an annual basis. The Board members who are not “interested persons” of the Master Portfolio, as defined in the 1940 Act, are considered independent Board members (the “Independent Board Members”). The Board’s consideration entailed a year-long deliberative process during which the Board and its committees assessed BlackRock’s various services to the Master Portfolio, including through the review of written materials and oral presentations, and the review of additional information provided in response to requests from the Independent Board Members. The Board had four quarterly meetings per year, each of which extended over a two-day period, as well as additional ad hoc meetings and executive sessions throughout the year, as needed. The committees of the Board similarly met throughout the year. The Board also had an additional one-day meeting to consider specific information regarding the renewals of the Agreements. In considering the renewal of the Agreements, the Board assessed, among other things, the nature, extent and quality of the services provided to the Fund by BlackRock, BlackRock’s personnel and affiliates, including (as applicable): investment management services; accounting oversight; administrative and shareholder services; oversight of the Fund’s service providers; risk management and oversight; and legal, regulatory and compliance services. Throughout the year, including during the contract renewal process, the Independent Board Members were advised by independent legal counsel, and met with independent legal counsel in various executive sessions outside of the presence of BlackRock’s management.
During the year, the Board, acting directly and through its committees, considers information that was relevant to its annual consideration of the renewal of the Agreements, including the services and support provided by BlackRock to the Master Fund, the Feeder Fund and their shareholders. BlackRock also furnished additional information to the Board in response to specific questions from the Board. Among the matters the Board considered were: (a) investment performance for one-year, three-year, five-year, and/or since inception periods, as applicable, against peer funds, relevant benchmarks, and other performance metrics, as applicable, as well as BlackRock senior management’s and portfolio managers’ investment performance analyses, and the reasons for any outperformance or underperformance relative to its peers, benchmarks, and other performance metrics, as applicable; (b) fees, including advisory, administration, if applicable, and other amounts paid to BlackRock and its affiliates by the Fund for services; (c) the Fund’s operating expenses and how BlackRock allocates expenses to the Fund; (d) the resources devoted to risk oversight of, and compliance reports relating to, implementation of the Fund’s investment objective, policies and restrictions, and meeting regulatory requirements; (e) BlackRock’s and the Fund’s adherence to applicable compliance policies and procedures; (f) the nature, character and scope of non-investment management services provided by BlackRock and its affiliates and the estimated cost of such services, as applicable; (g) BlackRock’s and other service providers’ internal controls and risk and compliance oversight mechanisms; (h) BlackRock’s implementation of the proxy voting policies approved by the Board; (i) execution quality of portfolio transactions; (j) BlackRock’s implementation of the Fund’s valuation and liquidity procedures; (k) an analysis of management fees paid to BlackRock for products with similar investment mandates across the open-end fund, exchange-traded fund (“ETF”), closed-end fund, sub-advised mutual fund, separately managed account, collective investment trust, and institutional separate account product channels, as applicable, and the similarities and differences between these products and the services provided as compared to the Fund; (l) BlackRock’s compensation methodology for its investment professionals and the incentives and accountability it creates, along with investment professionals’ investments in the fund(s) they manage; and (m) periodic updates on BlackRock’s business.
Prior to and in preparation for the May Meeting, the Board received and reviewed materials specifically relating to the renewal of the Agreements. The Independent Board Members continuously engaged in a process with their independent legal counsel and BlackRock to review the nature and scope of the information provided to the Board to better assist its deliberations. The materials provided in connection with the May Meeting included, among other things: (a) information independently compiled and prepared by Broadridge Financial Solutions, Inc. (“Broadridge”), based on either a Lipper classification or Morningstar category, regarding fees and expenses of the Fund, as applicable, as compared with a peer group of funds as determined by Broadridge (“Expense Peers”), and the investment performance of the Fund as compared with a peer group of funds (“ Performance Peers”); (b) information on the composition of the Expense Peers and Performance Peers, and a description of Broadridge’s methodology; (c) information on the estimated profits realized by BlackRock and its affiliates pursuant to the Agreements and a discussion of fall-out benefits to BlackRock and its affiliates; (d) a general analysis provided by BlackRock concerning investment management fees received in connection with other types of investment products, such as institutional accounts, sub-advised mutual funds, ETFs, closed-end funds, open-end funds, and separately managed accounts, under similar investment mandates, as well as the performance of such other products, as applicable; (e) a review of non-management fees; (f) the existence, impact and sharing of potential economies of scale, if any, with the Fund; (g) a summary of aggregate amounts paid by the Fund to BlackRock; (h) sales and redemption data regarding the Feeder Fund’s shares; and (i) various additional information requested by the Board as appropriate regarding BlackRock’s, the Fund’s operations.
At the May Meeting, the Board reviewed materials relating to its consideration of the Agreements, and the Independent Board Members presented BlackRock with questions and requests for additional information. BlackRock responded to these questions and requests with additional written information in advance of the June Meeting, and such responses were reviewed by the Board Members.
At the June Meeting, the Board concluded its assessment of, among other things: (a) the nature, extent and quality of the services provided by BlackRock; (b) the investment performance of the Fund as compared to its Performance Peers and to other metrics, as applicable; (c) the advisory fee and the estimated cost of the services and estimated
| | |
| 124 | | 2 0 2 4 B L A C K R O C K A N N U A L F I N A N C I A L S T A T E M E N T S A N D A D D I T I O N A L I N F O R M A T I O N |
Disclosure of Investment Advisory Agreements and Sub-Advisory Agreements (continued)
profits realized by BlackRock and its affiliates from their relationship with the Fund; (d) the Fund’s fees and expenses compared to its Expense Peers; (e) the existence and sharing of potential economies of scale; (f) any fall-out benefits to BlackRock and its affiliates as a result of BlackRock’s relationship with the Fund; and (g) other factors deemed relevant by the Board Members.
The Board also considered other matters it deemed important to the approval process, such as other payments made to BlackRock or its affiliates relating to securities lending and cash management, and BlackRock’s services related to the valuation and pricing of portfolio holdings of the Master Fund. The Board noted the willingness of BlackRock’s personnel to engage in open, candid discussions with the Board. The Board evaluated the information available to it on a fund-by-fund basis. The following paragraphs provide more information about some of the primary factors that were relevant to the Board’s decision. The Board Members did not identify any particular information, or any single factor as determinative, and each Board Member may have attributed different weights to the various items and factors considered.
A. Nature, Extent and Quality of the Services Provided by BlackRock
The Board, including the Independent Board Members, reviewed the nature, extent and quality of services provided by BlackRock, including the investment advisory services and the resulting performance of the Fund. Throughout the year, the Board compared the Fund’s performance to the performance of a comparable group of mutual funds, relevant benchmarks, and performance metrics, as applicable. The Board met with BlackRock’s senior management personnel responsible for investment activities, including the senior investment officers. The Board also reviewed the materials provided by the Fund’s portfolio management team discussing the Fund’s performance and the Fund’s investment strategies and outlook.
The Board considered, among other factors, with respect to BlackRock: the experience of the Fund’s portfolio management team; research capabilities; investments by portfolio managers in the funds they manage; portfolio trading capabilities; use of technology; commitment to compliance; credit analysis capabilities; risk analysis and oversight capabilities; and the approach to training and retaining portfolio managers and other research, advisory and management personnel. The Board also considered BlackRock’s overall risk management program, including the continued efforts of BlackRock and its affiliates to address cybersecurity risks and the role of BlackRock’s Risk & Quantitative Analysis Group. The Board engaged in a review of BlackRock’s compensation structure with respect to the Master Fund’s portfolio management team and BlackRock’s ability to attract and retain high-quality talent and create performance incentives.
In addition to investment advisory services, the Board considered the nature and quality of the administrative and other non-investment advisory services provided to the Fund. BlackRock and its affiliates provide the Fund with certain administrative, shareholder and other services (in addition to any such services provided to the Fund by third parties) and officers and other personnel as are necessary for the operations of the Fund. In particular, BlackRock and its affiliates provide the Fund with administrative services including, among others: (i) responsibility for disclosure documents, such as the prospectus, the summary prospectus (as applicable), the statement of additional information and periodic shareholder reports; (ii) oversight of daily accounting and pricing; (iii) responsibility for periodic filings with regulators; (iv) overseeing and coordinating the activities of third-party service providers including, among others, the custodian, fund accountant, transfer agent, and auditor for the Fund, as applicable; (v) organizing Board meetings and preparing the materials for such Board meetings; (vi) providing legal and compliance support; (vii) furnishing analytical and other support to assist the Board in its consideration of strategic issues such as the merger, consolidation or repurposing of certain open-end funds; and (viii) performing or managing administrative functions necessary for the operation of the Fund, such as tax reporting, expense management, fulfilling regulatory filing requirements, overseeing the Feeder Fund’s distribution partners, and shareholder call center and other services. The Board reviewed the structure and duties of BlackRock’s fund administration, shareholder services, and legal and compliance departments and considered BlackRock’s policies and procedures for assuring compliance with applicable laws and regulations. The Board considered the operation of BlackRock’s business continuity plans.
The Board noted that the engagement of the Sub-Advisors with respect to the Fund facilitates the provision of investment advice and trading by investment personnel out of non-U.S. jurisdictions. The Board considered that this arrangement provides additional flexibility to the portfolio management team, which may benefit the Fund and its shareholders.
B. The Investment Performance of the Fund
The Board, including the Independent Board Members, also reviewed and considered the performance history of the Fund throughout the year and at the May Meeting. The Board noted that the Feeder Fund’s investment results correspond directly to the investment results of the Master Fund. In preparation for the May Meeting, the Board was provided with reports independently prepared by Broadridge, which included an analysis of the Fund’s performance as of December 31, 2023, as compared to its Performance Peers. Broadridge ranks funds in quartiles, ranging from first to fourth, where first is the most desirable quartile position and fourth is the least desirable. In connection with its review, the Board received and reviewed information regarding the investment performance of the Fund as compared to its Performance Peers and the respective Morningstar Category (“Morningstar Category”). The Board and its Performance Oversight Committee regularly review, and meet with Fund management to discuss, the performance of the Fund, as applicable, throughout the year.
In evaluating performance, the Board focused particular attention on funds with less favorable performance records. The Board also noted that while it found the data provided by Broadridge generally useful, it recognized the limitations of such data, including in particular, that notable differences may exist between a fund and its Performance Peers (for example, the investment objectives and strategies). Further, the Board recognized that the performance data reflects a snapshot of a period as of a particular date and that selecting a different performance period could produce significantly different results. The Board also acknowledged that long-term performance could be impacted by even one period of significant outperformance or underperformance and that a single investment theme could have the ability to disproportionately affect long-term performance.
The Board noted that for the one-, three- and five-year periods reported, the Fund ranked in the third, third and second quartiles, respectively, against its Morningstar Category. The Board noted that BlackRock believes that the Morningstar Category is an appropriate performance metric for the Fund, and that BlackRock has explained its rationale for this belief to the Board. The Board and BlackRock reviewed the Fund’s underperformance relative to its Morningstar Category during the applicable periods.
| | |
D I S C L O S U R E O F I N V E S T M E N T A D V I S O R Y A G R E E M E N T S A N D S U B - A D V I S O R Y A G R E E M E N T S | | 125 |
Disclosure of Investment Advisory Agreements and Sub-Advisory Agreements (continued)
C. Consideration of the Advisory/Management Fees and the Estimated Cost of the Services and Estimated Profits Realized by BlackRock and its Affiliates from their Relationship with the Fund
The Board, including the Independent Board Members, reviewed the Fund’s contractual management fee rate compared with those of the Fund’s Expense Peers. The contractual management fee rate represents a combination of the advisory fee and any administrative fees, before taking into account any reimbursements or fee waivers. The Board also compared the Fund’s total expense ratio, as well as the Fund’s actual management fee rate, to those of the Fund’s Expense Peers. The total expense ratio represents a fund’s total net operating expenses, including any 12b-1 or non 12b-1 service fees. The total expense ratio gives effect to any expense reimbursements or fee waivers, and the actual management fee rate gives effect to any management fee reimbursements or waivers. The Board considered that the fee and expense information in the Broadridge report for the Fund reflected information for a specific period and that historical asset levels and expenses may differ from current levels, particularly in a period of market volatility. The Board considered the services provided and the fees charged by BlackRock and its affiliates to other types of clients with similar investment mandates, as applicable, including institutional accounts and sub-advised mutual funds (including mutual funds sponsored by third parties).
The Board received and reviewed statements relating to BlackRock’s financial condition. The Board reviewed BlackRock’s profitability methodology and was also provided with an estimated profitability analysis that detailed the revenues earned and the expenses incurred by BlackRock for services provided to the Fund. The Board reviewed BlackRock’s estimated profitability with respect to the Fund and other funds the Board currently oversees for the year ended December 31, 2023 compared to available aggregate estimated profitability data provided for the prior two years. The Board reviewed BlackRock’s estimated profitability with respect to certain other U.S. fund complexes managed by the Manager and/or its affiliates. The Board reviewed BlackRock’s assumptions and methodology of allocating expenses in the estimated profitability analysis, noting the inherent limitations in allocating costs among various advisory products. The Board recognized that profitability may be affected by numerous factors including, among other things, fee waivers and expense reimbursements by the Manager, the types of funds managed, precision of expense allocations and business mix. The Board thus recognized that calculating and comparing profitability at the individual fund level is difficult.
The Board noted that, in general, individual fund or product line profitability of other advisors is not publicly available. The Board reviewed BlackRock’s overall operating margin, in general, compared to that of certain other publicly traded asset management firms. The Board considered the differences between BlackRock and these other firms, including the contribution of technology at BlackRock, BlackRock’s expense management, and the relative product mix.
The Board considered whether BlackRock has the financial resources necessary to attract and retain high quality investment management personnel to perform its obligations under the Agreements and to continue to provide the high quality of services that is expected by the Board. The Board further considered factors including but not limited to BlackRock’s commitment of time and resources, assumption of risk, and liability profile in servicing the Fund, including in contrast to what is required of BlackRock with respect to other products with similar investment mandates across the open-end fund, ETF, closed-end fund, sub-advised mutual fund, separately managed account, collective investment trust, and institutional separate account product channels, as applicable.
The Board noted that the Fund’s contractual management fee rate ranked in the second quartile, and that the actual management fee rate and total expense ratio ranked in the third and second quartiles, respectively, relative to the Fund’s Expense Peers. The Board also noted that the Fund has an advisory fee arrangement that includes breakpoints that adjust the fee rate downward as the size of the Fund increases above certain contractually specified levels. The Board additionally noted that the breakpoints can, conversely, adjust the advisory fee rate upward as the size of the Fund decreases below certain contractually specified levels. The Board noted that BlackRock and the Board have contractually agreed to a cap on the Fund’s total expenses as a percentage of the Fund’s average daily net assets on a class-by-class basis.
D. Economies of Scale
The Board, including the Independent Board Members, considered the extent to which any economies of scale might benefit the Fund in a variety of ways as the assets of the Fund increase. The Board considered multiple factors, including the advisory fee rate and breakpoints, unitary fee structure, fee waivers, and/or expense caps, as applicable. The Board considered the Fund’s asset levels and whether the current fee schedule was appropriate.
E. Other Factors Deemed Relevant by the Board Members
The Board, including the Independent Board Members, also took into account other ancillary or “fall-out” benefits that BlackRock or its affiliates may derive from BlackRock’s respective relationships with the Fund, both tangible and intangible, such as BlackRock’s ability to leverage its investment professionals who manage other portfolios and its risk management personnel, an increase in BlackRock’s profile in the investment advisory community, and the engagement of BlackRock’s affiliates as service providers to the Fund, including for administrative, distribution, securities lending and cash management services. With respect to securities lending, during the year the Board also considered information provided by independent third-party consultants related to the performance of each BlackRock affiliate as securities lending agent. The Board also considered BlackRock’s overall operations and its efforts to expand the scale of, and improve the quality of, its operations. The Board also noted that, subject to applicable law, BlackRock may use and benefit from third party research obtained by soft dollars generated by certain registered fund transactions to assist in managing all or a number of its other client accounts.
In connection with its consideration of the Agreements, the Board also received information regarding BlackRock’s brokerage and soft dollar practices. The Board received reports from BlackRock which included information on brokerage commissions and trade execution practices throughout the year.
The Board noted the competitive nature of the open-end fund marketplace, and that shareholders are able to redeem their Feeder Fund shares if they believe that the Fund’s fees and expenses are too high or if they are dissatisfied with the performance of the Fund.
Conclusion
At the June Meeting, in a continuation of the discussions that occurred during the May Meeting, and as a culmination of the Board’s year-long deliberative process, the Board of the Master Portfolio, including the Independent Board Members, unanimously approved the continuation of the Master Fund Advisory Agreement between the Manager and the Master Portfolio, on behalf of the Master Fund, and the Feeder Fund Advisory Agreement between the Manager and the Feeder Corporation, on behalf of the Feeder Fund,
| | |
| 126 | | 2 0 2 4 B L A C K R O C K A N N U A L F I N A N C I A L S T A T E M E N T S A N D A D D I T I O N A L I N F O R M A T I O N |
Disclosure of Investment Advisory Agreements and Sub-Advisory Agreements (continued)
for a one-year term ending June 30, 2025, and the Master Fund Sub-Advisory Agreements between the Manager and the Sub-Advisors, with respect to the Master Fund, and the Feeder Fund Sub-Advisory Agreements between the Manager and the Sub-Advisors, with respect to the Feeder Fund, for a one-year term ending June 30, 2025. Based upon its evaluation of all of the aforementioned factors in their totality, as well as other information, the Board of the Master Portfolio, including the Independent Board Members, was satisfied that the terms of the Agreements were fair and reasonable and in the best interest of the Master Fund and its shareholders. The Board of the Feeder Trust, including the Independent Board Members, also considered the continuation of the Agreements with respect to the Master Fund and found the Agreements to be satisfactory. In arriving at its decision to approve the Agreements, the Board of the Master Portfolio did not identify any single factor or group of factors as all-important or controlling, but considered all factors together, and different Board Members may have attributed different weights to the various factors considered. The Independent Board Members were advised by independent legal counsel throughout the deliberative process.
| | |
D I S C L O S U R E O F I N V E S T M E N T A D V I S O R Y A G R E E M E N T S A N D S U B - A D V I S O R Y A G R E E M E N T S | | 127 |
Additional Information
Changes in and Disagreements with Accountants
Not applicable.
Proxy Results
Not applicable.
Remuneration Paid to Directors, Officers, and Others
Compensation to the independent directors/trustees of the Corporation is paid by the Corporation, on behalf of the Fund.
General Information
Quarterly performance, semi-annual and annual reports, current net asset value and other information regarding the Fund may be found on BlackRock’s website, which can be accessed at blackrock.com. Any reference to BlackRock’s website in this report is intended to allow investors public access to information regarding the Fund and does not, and is not intended to, incorporate BlackRock’s website in this report.
Electronic Delivery
Shareholders can sign up for e-mail notifications of quarterly statements, annual and semi-annual shareholder reports and prospectuses by enrolling in the electronic delivery program.
To enroll in electronic delivery:
Shareholders Who Hold Accounts with Investment Advisors, Banks or Brokerages:
Please contact your financial advisor. Please note that not all investment advisors, banks or brokerages may offer this service.
Shareholders Who Hold Accounts Directly with BlackRock:
1. Access the BlackRock website at blackrock.com
2. Select “Access Your Account”
3. Next, select “eDelivery” in the “Related Resources” box and follow the sign-up instructions.
BlackRock’s Mutual Fund Family
BlackRock offers a diverse lineup of open-end mutual funds crossing all investment styles and managed by experts in equity, fixed-income and tax-exempt investing. Visit blackrock.com for more information.
Shareholder Privileges
Account Information
Call us at (800) 441-7762 from 8:00 AM to 6:00 PM ET on any business day to get information about your account balances, recent transactions and share prices. You can also visit blackrock.com for more information.
Automatic Investment Plans
Investor class shareholders who want to invest regularly can arrange to have $50 or more automatically deducted from their checking or savings account and invested in any of the BlackRock funds.
Systematic Withdrawal Plans
Investor class shareholders can establish a systematic withdrawal plan and receive periodic payments of $50 or more from their BlackRock funds, as long as their account balance is at least $10,000.
Retirement Plans
Shareholders may make investments in conjunction with Traditional, Rollover, Roth, Coverdell, Simple IRAs, SEP IRAs and 403(b) Plans.
| | |
| 128 | | 2 0 2 4 B L A C K R O C K A N N U A L F I N A N C I A L S T A T E M E N T S A N D A D D I T I O N A L I N F O R M A T I O N |
Additional Information (continued)
Fund and Service Providers
| | |
| Investment Adviser | | Independent Registered Public Accounting Firm |
| BlackRock Advisors, LLC | | Deloitte & Touche LLP |
| Wilmington, DE 19809 | | Boston, MA 02110 |
| | |
| Sub-Advisers | | Distributor |
| BlackRock International Limited | | BlackRock Investments, LLC |
| Edinburgh, EH3 8BL | | New York, NY 10001 |
| United Kingdom | | |
| | Legal Counsel |
| BlackRock (Singapore) Limited | | Willkie Farr & Gallagher LLP |
| 079912 Singapore | | New York, NY 10019 |
| | |
| Accounting Agent and Transfer Agent | | Address of the Fund |
| BNY Mellon Investment Servicing (US) Inc. | | 100 Bellevue Parkway |
| Wilmington, DE 19809 | | Wilmington, DE 19809 |
| | |
| Custodian | | |
| The Bank of New York Mellon | | |
| New York, NY 10286 | | |
| | |
| | |
| | |
| | |
| | |
A D D I T I O N A L I N F O R M A T I O N | | 129 |
Glossary of Terms Used in this Report
Currency Abbreviation
| | |
| |
| AUD | | Australian Dollar |
| |
| BRL | | Brazilian Real |
| |
| CAD | | Canadian Dollar |
| |
| CHF | | Swiss Franc |
| |
| CLP | | Chilean Peso |
| |
| CNH | | Chinese Yuan Offshore |
| |
| CNY | | Chinese Yuan |
| |
| COP | | Colombian Peso |
| |
| CZK | | Czech Koruna |
| |
| DKK | | Danish Krone |
| |
| DOP | | Dominican Peso |
| |
| EUR | | Euro |
| |
| GBP | | British Pound |
| |
| HKD | | Hong Kong Dollar |
| |
| HUF | | Hungarian Forint |
| |
| IDR | | Indonesian Rupiah |
| |
| INR | | Indian Rupee |
| |
| JPY | | Japanese Yen |
| |
| KRW | | South Korean Won |
| |
| MXN | | Mexican Peso |
| |
| NOK | | Norwegian Krone |
| |
| PEN | | Peruvian Sol |
| |
| PLN | | Polish Zloty |
| |
| SEK | | Swedish Krona |
| |
| SGD | | Singapore Dollar |
| |
| THB | | Thai Baht |
| |
| TRY | | Turkish Lira |
| |
| TWD | | Taiwan New Dollar |
| |
| USD | | United States Dollar |
| |
| ZAR | | South African Rand |
Portfolio Abbreviation
| | |
| |
| ABS | | Asset-Backed Security |
| |
| AKA | | Also Known As |
| |
| AMT | | Alternative Minimum Tax |
| |
| BZDIOVER | | Overnight Brazil CETIP - Interbank Rate |
| |
| CLICP | | Chile Indice de Camara Promedio Interbank Overnight Index |
| |
| CLO | | Collateralized Loan Obligation |
| |
| COOIS | | Colombia Overnight Interbank Reference Rate |
| |
| DAC | | Designated Activity Co. |
| |
| ETF | | Exchange-Traded Fund |
| |
| EURIBOR | | Euro Interbank Offered Rate |
| |
| FKA | | Formally Known As |
| |
| GMTN | | Global Medium-Term Note |
| |
| GO | | General Obligation Bonds |
| |
| IO | | Interest Only |
| |
| JIBAR | | Johannesburg Interbank Average Rate |
| |
| LIBOR | | London Interbank Offered Rate |
| |
| LP | | Limited Partnership |
| |
| MXIBTIIE | | Mexico Interbank TIIE 28-Day |
| |
| OTC | | Over-the-Counter |
| |
| PIK | | Payment-in-Kind |
| |
| PRIBOR | | Prague Interbank Offered Rate |
| |
| RB | | Revenue Bonds |
| |
| REIT | | Real Estate Investment Trust |
| |
| REMIC | | Real Estate Mortgage Investment Conduit |
| |
| SOFR | | Secured Overnight Financing Rate |
| |
| SONIA | | Sterling Overnight Index Average |
| |
| TBA | | To-be-Announced |
| |
| TONA | | Tokyo Overnight Average Rate |
| |
| UK RPI | | United Kingdom Retail Price Index |
| |
| WIBOR | | Warsaw Interbank Offer Rate |
| | |
| 130 | | 2 0 2 4 B L A C K R O C K A N N U A L F I N A N C I A L S T A T E M E N T S A N D A D D I T I O N A L I N F O R M A T I O N |
THIS PAGE INTENTIONALLY LEFT BLANK.
Want to know more?
blackrock.com | 800-441-7762
This report is intended for current holders. It is not authorized for use as an offer of sale or a solicitation of an offer to buy shares of the Fund unless preceded or accompanied by the Fund’s current prospectus. Past performance results shown in this report should not be considered a representation of future performance. Investment returns and principal value of shares will fluctuate so that shares, when redeemed, may be worth more or less than their original cost. Statements and other information herein are as dated and are subject to change.
| Item 8 – | Changes in and Disagreements with Accountants for Open-End Management Investment Companies – See Item 7 |
| Item 9 – | Proxy Disclosures for Open-End Management Investment Companies – See Item 7 |
| Item 10 – | Remuneration Paid to Directors, Officers, and Others of Open-End Management Investment Companies – See
Item 7 |
5
| Item 11 – | Statement Regarding Basis for Approval of Investment Advisory Contract – See Item 7 |
| Item 12 – | Disclosure of Proxy Voting Policies and Procedures for Closed-End Management Investment Companies – Not Applicable |
| Item 13 – | Portfolio Managers of Closed-End Management Investment Companies – Not Applicable |
| Item 14 – | Purchases of Equity Securities by Closed-End Management Investment Company and Affiliated Purchasers – Not Applicable |
| Item 15 – | Submission of Matters to a Vote of Security Holders – There have been no material changes to these procedures. |
| Item 16 – | Controls and Procedures |
(a) The registrant’s principal executive and principal financial officers, or persons performing similar functions, have concluded that the registrant’s disclosure controls and procedures (as defined in Rule 30a-3(c) under the Investment Company Act of 1940, as amended (the “1940 Act”)) are effective as of a date within 90 days of the filing date of this report based on the evaluation of these controls and procedures required by Rule 30a-3(b) under the 1940 Act and Rule 13a-15(b) or 15d-15(b) under the Securities Exchange Act of 1934, as amended.
(b) There were no changes in the registrant’s internal control over financial reporting (as defined in Rule 30a-3(d) under the 1940 Act) that occurred during the period covered by this report that have materially affected, or are reasonably likely to materially affect, the registrant’s internal control over financial reporting.
| Item 17 – | Disclosure of Securities Lending Activities for Closed-End Management Investment Companies – Not Applicable |
| Item 18 – | Recovery of Erroneously Awarded Compensation – Not Applicable |
| Item 19 – | Exhibits attached hereto |
(a)(1) Code of Ethics – See Item 2
(a)(2) Any policy required by the listing standards adopted pursuant to Rule 10D-1 under the Exchange Act (17 CFR 240.10D-1) by the registered national securities exchange or registered national securities association upon which the registrant’s securities are listed – Not Applicable
(a)(3) Section 302 Certifications are attached
(a)(4) Any written solicitation to purchase securities under Rule 23c-1 – Not Applicable
(a)(5) Change in registrant’s independent public accountant – Not Applicable
(b) Section 906 Certifications are attached
6
Pursuant to the requirements of the Securities Exchange Act of 1934 and the Investment Company Act of 1940, the registrant has duly caused this report to be signed on its behalf by the undersigned, thereunto duly authorized.
BlackRock Bond Fund, Inc.
| | | | |
| | By: | | /s/ John M. Perlowski |
| | | | John M. Perlowski |
| | | | Chief Executive Officer (principal executive officer) of |
| | | | BlackRock Bond Fund, Inc. |
Date: November 21, 2024
Pursuant to the requirements of the Securities Exchange Act of 1934 and the Investment Company Act of 1940, this report has been signed below by the following persons on behalf of the registrant and in the capacities and on the dates indicated.
| | | | |
| | By: | | /s/ John M. Perlowski |
| | | | John M. Perlowski |
| | | | Chief Executive Officer (principal executive officer) of |
| | | | BlackRock Bond Fund, Inc. |
Date: November 21, 2024
| | | | |
| | By: | | /s/ Trent Walker |
| | | | Trent Walker |
| | | | Chief Financial Officer (principal financial officer) of |
| | | | BlackRock Bond Fund, Inc. |
Date: November 21, 2024
7