UNITED STATES
SECURITIES AND EXCHANGE COMMISSION
Washington, D.C. 20549
FORM N-CSR
CERTIFIED SHAREHOLDER REPORT OF REGISTERED MANAGEMENT INVESTMENT COMPANIES
Investment Company Act file number: 811-02857
Name of Fund: BlackRock Bond Fund, Inc.
BlackRock Sustainable Total Return Fund
Fund Address: 100 Bellevue Parkway, Wilmington, DE 19809
Name and address of agent for service: John M. Perlowski, Chief Executive Officer, BlackRock Bond Fund, Inc., 50 Hudson Yards, New York, NY 10001
Registrant’s telephone number, including area code: (800) 441-7762
Date of fiscal year end: 09/30/2024
Date of reporting period: 09/30/2024
Item 1 – Reports to Stockholders
(a) The Reports to Shareholders are attached herewith.
BlackRock Sustainable Total Return Fund
Annual Shareholder Report — September 30, 2024
This annual shareholder report contains important information about BlackRock Sustainable Total Return Fund (the “Fund”) for the period of October 1, 2023 to September 30, 2024.You can find additional information about the Fund at blackrock.com/fundreports. You can also request this information by contacting us at (800) 441-7762.
What were the Fund costs for the last year?
(based on a hypothetical $10,000 investment)
| Class name | Costs of a $10,000 investment | Costs paid as a percentage of a $10,000 investment |
|---|
| Class K Shares | $42 | 0.39% |
How did the Fund perform last year?
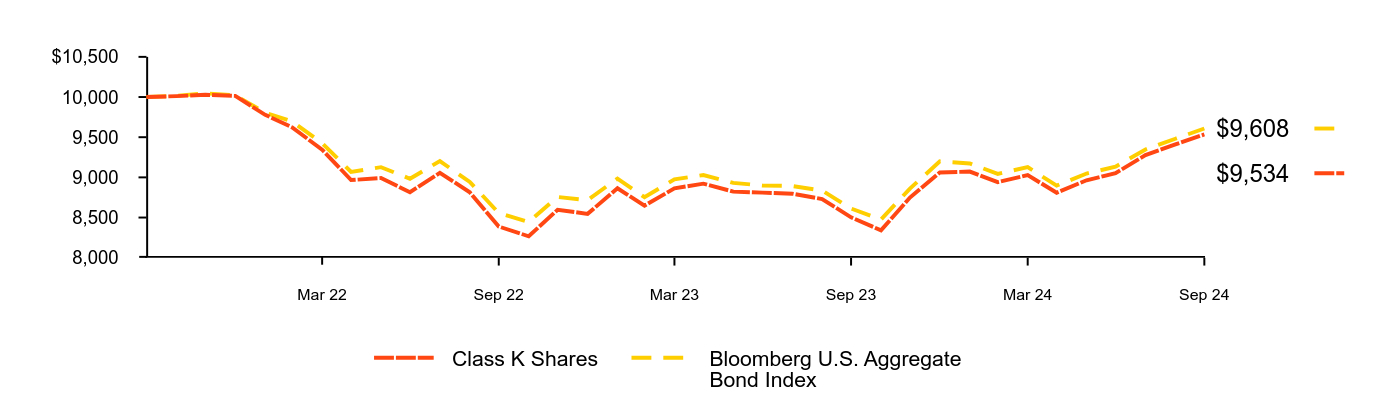
For the reporting period ended September 30, 2024, the Fund's Class K Shares returned 12.12%
For the same period, the Bloomberg U.S. Aggregate Bond Index returned 11.57%.
What contributed to performance?
Allocations to structured products, high yield bonds, and agency mortgage-backed securities contributed.
What detracted from performance?
Duration positioning and currency strategies detracted. (Duration is a measure of interest rate sensitivity.) The Fund’s use of derivatives, namely futures and forward currency contracts, also detracted.
The views expressed reflect the opinions of BlackRock as of the date of this report and are subject to change based on changes in market, economic or other conditions. These views are not intended to be a forecast of future events and are no guarantee of future results.
Cumulative performance: October 18, 2021 through September 30, 2024
Initial Investment of $10,000
| Class K Shares | Bloomberg U.S. Aggregate Bond Index |
|---|
| Sep 21 | $10,000 | $10,000 |
| Oct 21 | $10,011 | $10,016 |
| Nov 21 | $10,028 | $10,046 |
| Dec 21 | $10,014 | $10,020 |
| Jan 22 | $9,779 | $9,805 |
| Feb 22 | $9,622 | $9,695 |
| Mar 22 | $9,345 | $9,426 |
| Apr 22 | $8,967 | $9,068 |
| May 22 | $8,992 | $9,127 |
| Jun 22 | $8,815 | $8,983 |
| Jul 22 | $9,057 | $9,203 |
| Aug 22 | $8,814 | $8,943 |
| Sep 22 | $8,388 | $8,556 |
| Oct 22 | $8,267 | $8,446 |
| Nov 22 | $8,597 | $8,756 |
| Dec 22 | $8,546 | $8,717 |
| Jan 23 | $8,864 | $8,985 |
| Feb 23 | $8,648 | $8,753 |
| Mar 23 | $8,863 | $8,975 |
| Apr 23 | $8,922 | $9,029 |
| May 23 | $8,823 | $8,931 |
| Jun 23 | $8,810 | $8,899 |
| Jul 23 | $8,797 | $8,893 |
| Aug 23 | $8,731 | $8,836 |
| Sep 23 | $8,503 | $8,612 |
| Oct 23 | $8,341 | $8,476 |
| Nov 23 | $8,749 | $8,860 |
| Dec 23 | $9,061 | $9,199 |
| Jan 24 | $9,072 | $9,173 |
| Feb 24 | $8,940 | $9,044 |
| Mar 24 | $9,028 | $9,127 |
| Apr 24 | $8,809 | $8,897 |
| May 24 | $8,964 | $9,048 |
| Jun 24 | $9,053 | $9,133 |
| Jul 24 | $9,277 | $9,347 |
| Aug 24 | $9,411 | $9,481 |
| Sep 24 | $9,534 | $9,608 |
See “Average annual total returns” for additional information on fund performance.
Average annual total returns
| Average Annual Total Returns | 1 Year | Since Fund Inception |
|---|
Class K Shares ........................................................................................................................................................................................................................................................................................................................................................................................................................................................................................................................................................................................................................................................................................................................................................................................................................................................................................................................................................................................................................................ | 12.12% | (1.60)% |
Bloomberg U.S. Aggregate Bond Index........................................................................................................................................................................................................................................................................................................................................................................................................................................................................................................................................................................................................................................................................................................................................................................................................................................................................................................................................................................................................................................ | 11.57 | (1.35) |
Net Assets........................................................................................................................................................................................................................................................................................................................................................................................................................................................................................................................................................................................................................................................................................................................................................................................................................................................................................................................................................................................................................................ | $45,177,787 |
Number of Portfolio Holdings........................................................................................................................................................................................................................................................................................................................................................................................................................................................................................................................................................................................................................................................................................................................................................................................................................................................................................................................................................................................................................................ | 700 |
Net Investment Advisory Fees........................................................................................................................................................................................................................................................................................................................................................................................................................................................................................................................................................................................................................................................................................................................................................................................................................................................................................................................................................................................................................................ | $0 |
Portfolio Turnover Rate........................................................................................................................................................................................................................................................................................................................................................................................................................................................................................................................................................................................................................................................................................................................................................................................................................................................................................................................................................................................................................................ | 832% |
The Fund commenced operations on October 18, 2021.
Past performance is not an indication of future results. Performance results may include adjustments made for financial reporting purposes in accordance with U.S. generally accepted accounting principles. Performance results do not reflect the deduction of taxes that a shareholder would pay on fund distributions or on the redemption or sale of fund shares. Visit blackrock.com for more recent performance information.
What did the Fund invest in?
(as of September 30, 2024)
Credit quality allocation
| Investment Type | Percent of Total InvestmentsFootnote Reference(a) |
|---|
U.S. Government Sponsored Agency Securities........................................................................................................................................................................................................................................................................................................................................................................................................................................................................................................................................................................................................................................................................................................................................................................................................................................................................................................................................................................................................................................ | 34.8% |
Corporate Bonds........................................................................................................................................................................................................................................................................................................................................................................................................................................................................................................................................................................................................................................................................................................................................................................................................................................................................................................................................................................................................................................ | 29.8 |
U.S. Treasury Obligations........................................................................................................................................................................................................................................................................................................................................................................................................................................................................................................................................................................................................................................................................................................................................................................................................................................................................................................................................................................................................................................ | 13.5 |
Asset-Backed Securities........................................................................................................................................................................................................................................................................................................................................................................................................................................................................................................................................................................................................................................................................................................................................................................................................................................................................................................................................................................................................................................ | 9.4 |
Non-Agency Mortgage-Backed Securities........................................................................................................................................................................................................................................................................................................................................................................................................................................................................................................................................................................................................................................................................................................................................................................................................................................................................................................................................................................................................................................ | 6.3 |
Foreign Government Obligations........................................................................................................................................................................................................................................................................................................................................................................................................................................................................................................................................................................................................................................................................................................................................................................................................................................................................................................................................................................................................................................ | 3.9 |
Foreign Agency Obligations........................................................................................................................................................................................................................................................................................................................................................................................................................................................................................................................................................................................................................................................................................................................................................................................................................................................................................................................................................................................................................................ | 1.0 |
Investment Companies........................................................................................................................................................................................................................................................................................................................................................................................................................................................................................................................................................................................................................................................................................................................................................................................................................................................................................................................................................................................................................................ | 0.7 |
Municipal Bonds........................................................................................................................................................................................................................................................................................................................................................................................................................................................................................................................................................................................................................................................................................................................................................................................................................................................................................................................................................................................................................................ | 0.5 |
Common Stocks........................................................................................................................................................................................................................................................................................................................................................................................................................................................................................................................................................................................................................................................................................................................................................................................................................................................................................................................................................................................................................................ | 0.1 |
|
Credit RatingFootnote Reference(b) | Percent of Total InvestmentsFootnote Reference(a) |
|---|
AAA/AaaFootnote Reference(c)........................................................................................................................................................................................................................................................................................................................................................................................................................................................................................................................................................................................................................................................................................................................................................................................................................................................................................................................................................................................................................................ | 54.8% |
AA/Aa........................................................................................................................................................................................................................................................................................................................................................................................................................................................................................................................................................................................................................................................................................................................................................................................................................................................................................................................................................................................................................................ | 4.8 |
A........................................................................................................................................................................................................................................................................................................................................................................................................................................................................................................................................................................................................................................................................................................................................................................................................................................................................................................................................................................................................................................ | 11.2 |
BBB/Baa........................................................................................................................................................................................................................................................................................................................................................................................................................................................................................................................................................................................................................................................................................................................................................................................................................................................................................................................................................................................................................................ | 20.5 |
BB/Ba........................................................................................................................................................................................................................................................................................................................................................................................................................................................................................................................................................................................................................................................................................................................................................................................................................................................................................................................................................................................................................................ | 1.0 |
B........................................................................................................................................................................................................................................................................................................................................................................................................................................................................................................................................................................................................................................................................................................................................................................................................................................................................................................................................................................................................................................ | 0.0Footnote Reference(d) |
CC/Ca........................................................................................................................................................................................................................................................................................................................................................................................................................................................................................................................................................................................................................................................................................................................................................................................................................................................................................................................................................................................................................................ | 0.5 |
N/R........................................................................................................................................................................................................................................................................................................................................................................................................................................................................................................................................................................................................................................................................................................................................................................................................................................................................................................................................................................................................................................ | 7.2 |
| Footnote | Description |
Footnote(a) | Excludes short-term securities, short investments and options, if any. |
Footnote(b) | For purposes of this report, credit quality ratings shown above reflect the highest rating assigned by either S&P Global Ratings or Moody’s Investors Service, Inc. if ratings differ. These rating agencies are independent, nationally recognized statistical rating organizations and are widely used. Investment grade ratings are credit ratings of BBB/Baa or higher. Below investment grade ratings are credit ratings of BB/Ba or lower. Investments designated N/R are not rated by either rating agency. Unrated investments do not necessarily indicate low credit quality. Credit quality ratings are subject to change. |
Footnote(c) | The investment adviser evaluates the credit quality of unrated investments based upon certain factors including, but not limited to, credit ratings for similar investments and financial analysis of sectors, individual investments and/or issuers. Using this approach, the investment adviser has deemed unrated U.S. Government Sponsored Agency Securities and U.S. Treasury Obligations to be of similar credit quality as investments rated AAA/Aaa. |
Footnote(d) | Rounds to less than 0.1%. |
If you wish to view additional information about the Fund, including but not limited to financial statements, the Fund’s prospectus, and proxy voting policies and procedures, please visit blackrock.com/fundreports. For proxy voting records, visit blackrock.com/proxyrecords.
The Fund will mail only one copy of shareholder documents, including prospectuses, annual and semi-annual reports and proxy statements, to shareholders with multiple accounts at the same address. This practice is commonly called “householding” and is intended to reduce expenses and eliminate duplicate mailings of shareholder documents. Mailings of your shareholder documents may be householded indefinitely unless you instruct us otherwise. If you do not want the mailing of these documents to be combined with those for other members of your household, please call the Fund at (800) 441-7762.
The Fund is not sponsored, endorsed, issued, sold, or promoted by Bloomberg Index Services Limited and its affiliates, nor does this company make any representation regarding the advisability of investing in the Fund. BlackRock is not affiliated with the company listed above.
© 2024 BlackRock, Inc. or its affiliates. All rights reserved. BLACKROCK is a registered trademark of BlackRock, Inc. or its affiliates. All other trademarks are those of their respective owners.
BlackRock Sustainable Total Return Fund
Annual Shareholder Report — September 30, 2024
BlackRock Sustainable Total Return Fund
Institutional Shares | BISTX
Annual Shareholder Report — September 30, 2024
This annual shareholder report contains important information about BlackRock Sustainable Total Return Fund (the “Fund”) for the period of October 1, 2023 to September 30, 2024.You can find additional information about the Fund at blackrock.com/fundreports. You can also request this information by contacting us at (800) 441-7762.
What were the Fund costs for the last year?
(based on a hypothetical $10,000 investment)
| Class name | Costs of a $10,000 investment | Costs paid as a percentage of a $10,000 investment |
|---|
| Institutional Shares | $46 | 0.43% |
How did the Fund perform last year?
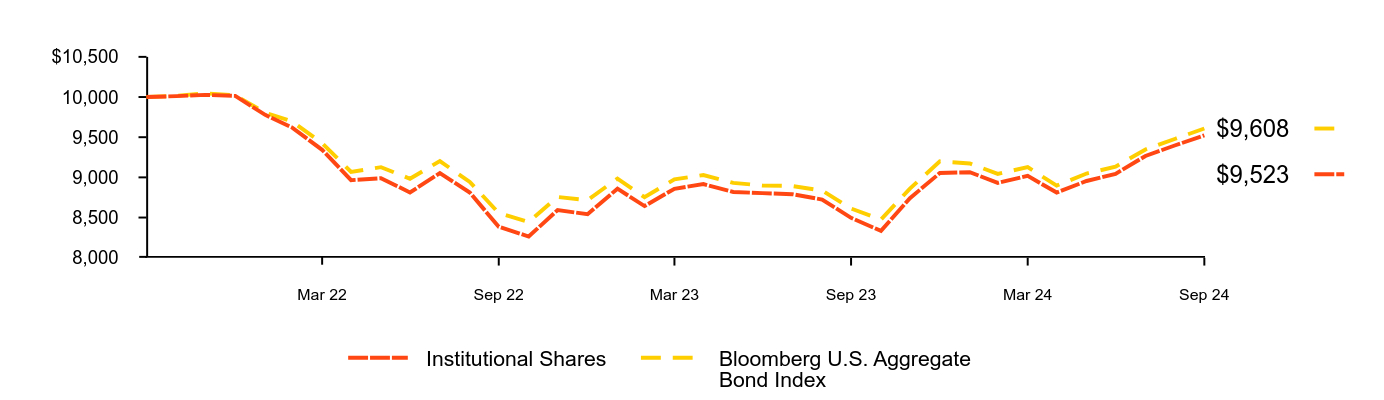
For the reporting period ended September 30, 2024, the Fund's Instititional Shares returned 12.08%
For the same period, the Bloomberg U.S. Aggregate Bond Index returned 11.57%.
What contributed to performance?
Allocations to structured products, high yield bonds, and agency mortgage-backed securities contributed.
What detracted from performance?
Duration positioning and currency strategies detracted. (Duration is a measure of interest rate sensitivity.) The Fund’s use of derivatives, namely futures and forward currency contracts, also detracted.
The views expressed reflect the opinions of BlackRock as of the date of this report and are subject to change based on changes in market, economic or other conditions. These views are not intended to be a forecast of future events and are no guarantee of future results.
Cumulative performance: October 18, 2021 through September 30, 2024
Initial Investment of $10,000
| Institutional Shares | Bloomberg U.S. Aggregate Bond Index |
|---|
| Sep 21 | $10,000 | $10,000 |
| Oct 21 | $10,011 | $10,016 |
| Nov 21 | $10,027 | $10,046 |
| Dec 21 | $10,014 | $10,020 |
| Jan 22 | $9,778 | $9,805 |
| Feb 22 | $9,620 | $9,695 |
| Mar 22 | $9,343 | $9,426 |
| Apr 22 | $8,965 | $9,068 |
| May 22 | $8,990 | $9,127 |
| Jun 22 | $8,812 | $8,983 |
| Jul 22 | $9,054 | $9,203 |
| Aug 22 | $8,811 | $8,943 |
| Sep 22 | $8,385 | $8,556 |
| Oct 22 | $8,264 | $8,446 |
| Nov 22 | $8,593 | $8,756 |
| Dec 22 | $8,542 | $8,717 |
| Jan 23 | $8,859 | $8,985 |
| Feb 23 | $8,643 | $8,753 |
| Mar 23 | $8,858 | $8,975 |
| Apr 23 | $8,917 | $9,029 |
| May 23 | $8,818 | $8,931 |
| Jun 23 | $8,804 | $8,899 |
| Jul 23 | $8,791 | $8,893 |
| Aug 23 | $8,724 | $8,836 |
| Sep 23 | $8,496 | $8,612 |
| Oct 23 | $8,334 | $8,476 |
| Nov 23 | $8,741 | $8,860 |
| Dec 23 | $9,054 | $9,199 |
| Jan 24 | $9,064 | $9,173 |
| Feb 24 | $8,932 | $9,044 |
| Mar 24 | $9,019 | $9,127 |
| Apr 24 | $8,811 | $8,897 |
| May 24 | $8,955 | $9,048 |
| Jun 24 | $9,044 | $9,133 |
| Jul 24 | $9,266 | $9,347 |
| Aug 24 | $9,400 | $9,481 |
| Sep 24 | $9,523 | $9,608 |
See “Average annual total returns” for additional information on fund performance.
Average annual total returns
| Average Annual Total Returns | 1 Year | Since Fund Inception |
|---|
Institutional Shares ........................................................................................................................................................................................................................................................................................................................................................................................................................................................................................................................................................................................................................................................................................................................................................................................................................................................................................................................................................................................................................................ | 12.08% | (1.64)% |
Bloomberg U.S. Aggregate Bond Index........................................................................................................................................................................................................................................................................................................................................................................................................................................................................................................................................................................................................................................................................................................................................................................................................................................................................................................................................................................................................................................ | 11.57 | (1.35) |
Net Assets........................................................................................................................................................................................................................................................................................................................................................................................................................................................................................................................................................................................................................................................................................................................................................................................................................................................................................................................................................................................................................................ | $45,177,787 |
Number of Portfolio Holdings........................................................................................................................................................................................................................................................................................................................................................................................................................................................................................................................................................................................................................................................................................................................................................................................................................................................................................................................................................................................................................................ | 700 |
Net Investment Advisory Fees........................................................................................................................................................................................................................................................................................................................................................................................................................................................................................................................................................................................................................................................................................................................................................................................................................................................................................................................................................................................................................................ | $0 |
Portfolio Turnover Rate........................................................................................................................................................................................................................................................................................................................................................................................................................................................................................................................................................................................................................................................................................................................................................................................................................................................................................................................................................................................................................................ | 832% |
The Fund commenced operations on October 18, 2021.
Past performance is not an indication of future results. Performance results may include adjustments made for financial reporting purposes in accordance with U.S. generally accepted accounting principles. Performance results do not reflect the deduction of taxes that a shareholder would pay on fund distributions or on the redemption or sale of fund shares. Visit blackrock.com for more recent performance information.
What did the Fund invest in?
(as of September 30, 2024)
Credit quality allocation
| Investment Type | Percent of Total InvestmentsFootnote Reference(a) |
|---|
U.S. Government Sponsored Agency Securities........................................................................................................................................................................................................................................................................................................................................................................................................................................................................................................................................................................................................................................................................................................................................................................................................................................................................................................................................................................................................................................ | 34.8% |
Corporate Bonds........................................................................................................................................................................................................................................................................................................................................................................................................................................................................................................................................................................................................................................................................................................................................................................................................................................................................................................................................................................................................................................ | 29.8 |
U.S. Treasury Obligations........................................................................................................................................................................................................................................................................................................................................................................................................................................................................................................................................................................................................................................................................................................................................................................................................................................................................................................................................................................................................................................ | 13.5 |
Asset-Backed Securities........................................................................................................................................................................................................................................................................................................................................................................................................................................................................................................................................................................................................................................................................................................................................................................................................................................................................................................................................................................................................................................ | 9.4 |
Non-Agency Mortgage-Backed Securities........................................................................................................................................................................................................................................................................................................................................................................................................................................................................................................................................................................................................................................................................................................................................................................................................................................................................................................................................................................................................................................ | 6.3 |
Foreign Government Obligations........................................................................................................................................................................................................................................................................................................................................................................................................................................................................................................................................................................................................................................................................................................................................................................................................................................................................................................................................................................................................................................ | 3.9 |
Foreign Agency Obligations........................................................................................................................................................................................................................................................................................................................................................................................................................................................................................................................................................................................................................................................................................................................................................................................................................................................................................................................................................................................................................................ | 1.0 |
Investment Companies........................................................................................................................................................................................................................................................................................................................................................................................................................................................................................................................................................................................................................................................................................................................................................................................................................................................................................................................................................................................................................................ | 0.7 |
Municipal Bonds........................................................................................................................................................................................................................................................................................................................................................................................................................................................................................................................................................................................................................................................................................................................................................................................................................................................................................................................................................................................................................................ | 0.5 |
Common Stocks........................................................................................................................................................................................................................................................................................................................................................................................................................................................................................................................................................................................................................................................................................................................................................................................................................................................................................................................................................................................................................................ | 0.1 |
|
Credit RatingFootnote Reference(b) | Percent of Total InvestmentsFootnote Reference(a) |
|---|
AAA/AaaFootnote Reference(c)........................................................................................................................................................................................................................................................................................................................................................................................................................................................................................................................................................................................................................................................................................................................................................................................................................................................................................................................................................................................................................................ | 54.8% |
AA/Aa........................................................................................................................................................................................................................................................................................................................................................................................................................................................................................................................................................................................................................................................................................................................................................................................................................................................................................................................................................................................................................................ | 4.8 |
A........................................................................................................................................................................................................................................................................................................................................................................................................................................................................................................................................................................................................................................................................................................................................................................................................................................................................................................................................................................................................................................ | 11.2 |
BBB/Baa........................................................................................................................................................................................................................................................................................................................................................................................................................................................................................................................................................................................................................................................................................................................................................................................................................................................................................................................................................................................................................................ | 20.5 |
BB/Ba........................................................................................................................................................................................................................................................................................................................................................................................................................................................................................................................................................................................................................................................................................................................................................................................................................................................................................................................................................................................................................................ | 1.0 |
B........................................................................................................................................................................................................................................................................................................................................................................................................................................................................................................................................................................................................................................................................................................................................................................................................................................................................................................................................................................................................................................ | 0.0Footnote Reference(d) |
CC/Ca........................................................................................................................................................................................................................................................................................................................................................................................................................................................................................................................................................................................................................................................................................................................................................................................................................................................................................................................................................................................................................................ | 0.5 |
N/R........................................................................................................................................................................................................................................................................................................................................................................................................................................................................................................................................................................................................................................................................................................................................................................................................................................................................................................................................................................................................................................ | 7.2 |
| Footnote | Description |
Footnote(a) | Excludes short-term securities, short investments and options, if any. |
Footnote(b) | For purposes of this report, credit quality ratings shown above reflect the highest rating assigned by either S&P Global Ratings or Moody’s Investors Service, Inc. if ratings differ. These rating agencies are independent, nationally recognized statistical rating organizations and are widely used. Investment grade ratings are credit ratings of BBB/Baa or higher. Below investment grade ratings are credit ratings of BB/Ba or lower. Investments designated N/R are not rated by either rating agency. Unrated investments do not necessarily indicate low credit quality. Credit quality ratings are subject to change. |
Footnote(c) | The investment adviser evaluates the credit quality of unrated investments based upon certain factors including, but not limited to, credit ratings for similar investments and financial analysis of sectors, individual investments and/or issuers. Using this approach, the investment adviser has deemed unrated U.S. Government Sponsored Agency Securities and U.S. Treasury Obligations to be of similar credit quality as investments rated AAA/Aaa. |
Footnote(d) | Rounds to less than 0.1%. |
If you wish to view additional information about the Fund, including but not limited to financial statements, the Fund’s prospectus, and proxy voting policies and procedures, please visit blackrock.com/fundreports. For proxy voting records, visit blackrock.com/proxyrecords.
The Fund will mail only one copy of shareholder documents, including prospectuses, annual and semi-annual reports and proxy statements, to shareholders with multiple accounts at the same address. This practice is commonly called “householding” and is intended to reduce expenses and eliminate duplicate mailings of shareholder documents. Mailings of your shareholder documents may be householded indefinitely unless you instruct us otherwise. If you do not want the mailing of these documents to be combined with those for other members of your household, please call the Fund at (800) 441-7762.
The Fund is not sponsored, endorsed, issued, sold, or promoted by Bloomberg Index Services Limited and its affiliates, nor does this company make any representation regarding the advisability of investing in the Fund. BlackRock is not affiliated with the company listed above.
© 2024 BlackRock, Inc. or its affiliates. All rights reserved. BLACKROCK is a registered trademark of BlackRock, Inc. or its affiliates. All other trademarks are those of their respective owners.
BlackRock Sustainable Total Return Fund
Institutional Shares | BISTX
Annual Shareholder Report — September 30, 2024
BlackRock Sustainable Total Return Fund
Investor A Shares | BASTX
Annual Shareholder Report — September 30, 2024
This annual shareholder report contains important information about BlackRock Sustainable Total Return Fund (the “Fund”) for the period of October 1, 2023 to September 30, 2024.You can find additional information about the Fund at blackrock.com/fundreports. You can also request this information by contacting us at (800) 441-7762.
What were the Fund costs for the last year?
(based on a hypothetical $10,000 investment)
| Class name | Costs of a $10,000 investment | Costs paid as a percentage of a $10,000 investment |
|---|
| Investor A Shares | $79 | 0.75% |
How did the Fund perform last year?
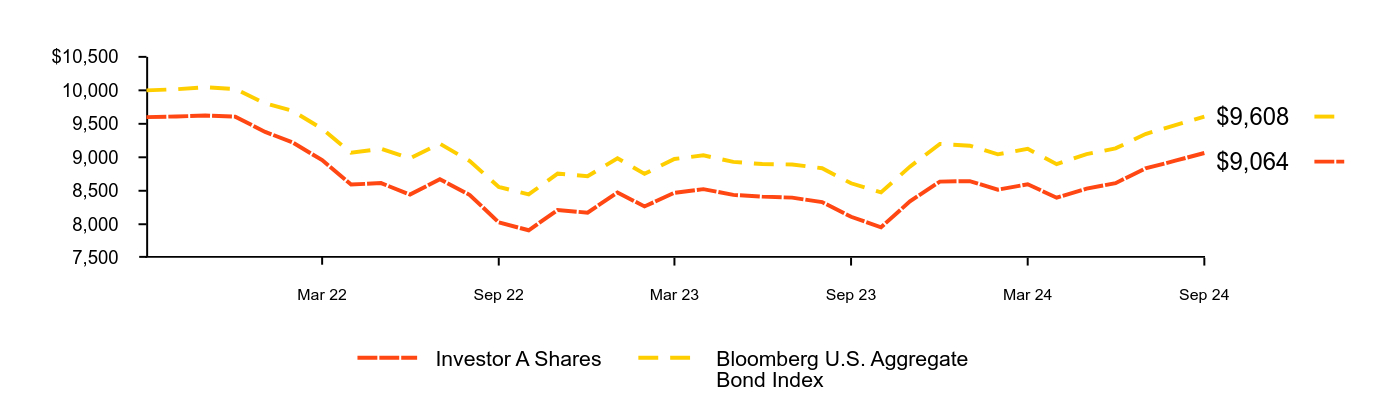
For the reporting period ended September 30, 2024, the Fund's Investor A Shares returned 11.73%
For the same period, the Bloomberg U.S. Aggregate Bond Index returned 11.57%.
What contributed to performance?
Allocations to structured products, high yield bonds, and agency mortgage-backed securities contributed.
What detracted from performance?
Duration positioning and currency strategies detracted. (Duration is a measure of interest rate sensitivity.) The Fund’s use of derivatives, namely futures and forward currency contracts, also detracted.
The views expressed reflect the opinions of BlackRock as of the date of this report and are subject to change based on changes in market, economic or other conditions. These views are not intended to be a forecast of future events and are no guarantee of future results.
Cumulative performance: October 18, 2021 through September 30, 2024
Initial Investment of $10,000
| Investor A Shares | Bloomberg U.S. Aggregate Bond Index |
|---|
| Sep 21 | $9,600 | $10,000 |
| Oct 21 | $9,610 | $10,016 |
| Nov 21 | $9,623 | $10,046 |
| Dec 21 | $9,607 | $10,020 |
| Jan 22 | $9,379 | $9,805 |
| Feb 22 | $9,225 | $9,695 |
| Mar 22 | $8,958 | $9,426 |
| Apr 22 | $8,593 | $9,068 |
| May 22 | $8,615 | $9,127 |
| Jun 22 | $8,443 | $8,983 |
| Jul 22 | $8,673 | $9,203 |
| Aug 22 | $8,437 | $8,943 |
| Sep 22 | $8,027 | $8,556 |
| Oct 22 | $7,910 | $8,446 |
| Nov 22 | $8,213 | $8,756 |
| Dec 22 | $8,173 | $8,717 |
| Jan 23 | $8,474 | $8,985 |
| Feb 23 | $8,266 | $8,753 |
| Mar 23 | $8,470 | $8,975 |
| Apr 23 | $8,524 | $9,029 |
| May 23 | $8,438 | $8,931 |
| Jun 23 | $8,412 | $8,899 |
| Jul 23 | $8,397 | $8,893 |
| Aug 23 | $8,331 | $8,836 |
| Sep 23 | $8,112 | $8,612 |
| Oct 23 | $7,955 | $8,476 |
| Nov 23 | $8,342 | $8,860 |
| Dec 23 | $8,637 | $9,199 |
| Jan 24 | $8,644 | $9,173 |
| Feb 24 | $8,516 | $9,044 |
| Mar 24 | $8,597 | $9,127 |
| Apr 24 | $8,397 | $8,897 |
| May 24 | $8,532 | $9,048 |
| Jun 24 | $8,614 | $9,133 |
| Jul 24 | $8,834 | $9,347 |
| Aug 24 | $8,949 | $9,481 |
| Sep 24 | $9,064 | $9,608 |
See “Average annual total returns” for additional information on fund performance.
Average annual total returns
| Average Annual Total Returns | 1 Year | Since Fund Inception |
|---|
Investor A Shares ........................................................................................................................................................................................................................................................................................................................................................................................................................................................................................................................................................................................................................................................................................................................................................................................................................................................................................................................................................................................................................................ | 11.73% | (1.93)% |
Investor A Shares (with sales charge)........................................................................................................................................................................................................................................................................................................................................................................................................................................................................................................................................................................................................................................................................................................................................................................................................................................................................................................................................................................................................................................ | 7.26 | (3.28) |
Bloomberg U.S. Aggregate Bond Index........................................................................................................................................................................................................................................................................................................................................................................................................................................................................................................................................................................................................................................................................................................................................................................................................................................................................................................................................................................................................................................ | 11.57 | (1.35) |
Net Assets........................................................................................................................................................................................................................................................................................................................................................................................................................................................................................................................................................................................................................................................................................................................................................................................................................................................................................................................................................................................................................................ | $45,177,787 |
Number of Portfolio Holdings........................................................................................................................................................................................................................................................................................................................................................................................................................................................................................................................................................................................................................................................................................................................................................................................................................................................................................................................................................................................................................................ | 700 |
Net Investment Advisory Fees........................................................................................................................................................................................................................................................................................................................................................................................................................................................................................................................................................................................................................................................................................................................................................................................................................................................................................................................................................................................................................................ | $0 |
Portfolio Turnover Rate........................................................................................................................................................................................................................................................................................................................................................................................................................................................................................................................................................................................................................................................................................................................................................................................................................................................................................................................................................................................................................................ | 832% |
Assuming maximum sales charges. Average annual total returns with and without sales charges reflect reductions for service fees.
The Fund commenced operations on October 18, 2021.
Past performance is not an indication of future results. Performance results may include adjustments made for financial reporting purposes in accordance with U.S. generally accepted accounting principles. Performance results do not reflect the deduction of taxes that a shareholder would pay on fund distributions or on the redemption or sale of fund shares. Visit blackrock.com for more recent performance information.
What did the Fund invest in?
(as of September 30, 2024)
Credit quality allocation
| Investment Type | Percent of Total InvestmentsFootnote Reference(a) |
|---|
U.S. Government Sponsored Agency Securities........................................................................................................................................................................................................................................................................................................................................................................................................................................................................................................................................................................................................................................................................................................................................................................................................................................................................................................................................................................................................................................ | 34.8% |
Corporate Bonds........................................................................................................................................................................................................................................................................................................................................................................................................................................................................................................................................................................................................................................................................................................................................................................................................................................................................................................................................................................................................................................ | 29.8 |
U.S. Treasury Obligations........................................................................................................................................................................................................................................................................................................................................................................................................................................................................................................................................................................................................................................................................................................................................................................................................................................................................................................................................................................................................................................ | 13.5 |
Asset-Backed Securities........................................................................................................................................................................................................................................................................................................................................................................................................................................................................................................................................................................................................................................................................................................................................................................................................................................................................................................................................................................................................................................ | 9.4 |
Non-Agency Mortgage-Backed Securities........................................................................................................................................................................................................................................................................................................................................................................................................................................................................................................................................................................................................................................................................................................................................................................................................................................................................................................................................................................................................................................ | 6.3 |
Foreign Government Obligations........................................................................................................................................................................................................................................................................................................................................................................................................................................................................................................................................................................................................................................................................................................................................................................................................................................................................................................................................................................................................................................ | 3.9 |
Foreign Agency Obligations........................................................................................................................................................................................................................................................................................................................................................................................................................................................................................................................................................................................................................................................................................................................................................................................................................................................................................................................................................................................................................................ | 1.0 |
Investment Companies........................................................................................................................................................................................................................................................................................................................................................................................................................................................................................................................................................................................................................................................................................................................................................................................................................................................................................................................................................................................................................................ | 0.7 |
Municipal Bonds........................................................................................................................................................................................................................................................................................................................................................................................................................................................................................................................................................................................................................................................................................................................................................................................................................................................................................................................................................................................................................................ | 0.5 |
Common Stocks........................................................................................................................................................................................................................................................................................................................................................................................................................................................................................................................................................................................................................................................................................................................................................................................................................................................................................................................................................................................................................................ | 0.1 |
|
Credit RatingFootnote Reference(b) | Percent of Total InvestmentsFootnote Reference(a) |
|---|
AAA/AaaFootnote Reference(c)........................................................................................................................................................................................................................................................................................................................................................................................................................................................................................................................................................................................................................................................................................................................................................................................................................................................................................................................................................................................................................................ | 54.8% |
AA/Aa........................................................................................................................................................................................................................................................................................................................................................................................................................................................................................................................................................................................................................................................................................................................................................................................................................................................................................................................................................................................................................................ | 4.8 |
A........................................................................................................................................................................................................................................................................................................................................................................................................................................................................................................................................................................................................................................................................................................................................................................................................................................................................................................................................................................................................................................ | 11.2 |
BBB/Baa........................................................................................................................................................................................................................................................................................................................................................................................................................................................................................................................................................................................................................................................................................................................................................................................................................................................................................................................................................................................................................................ | 20.5 |
BB/Ba........................................................................................................................................................................................................................................................................................................................................................................................................................................................................................................................................................................................................................................................................................................................................................................................................................................................................................................................................................................................................................................ | 1.0 |
B........................................................................................................................................................................................................................................................................................................................................................................................................................................................................................................................................................................................................................................................................................................................................................................................................................................................................................................................................................................................................................................ | 0.0Footnote Reference(d) |
CC/Ca........................................................................................................................................................................................................................................................................................................................................................................................................................................................................................................................................................................................................................................................................................................................................................................................................................................................................................................................................................................................................................................ | 0.5 |
N/R........................................................................................................................................................................................................................................................................................................................................................................................................................................................................................................................................................................................................................................................................................................................................................................................................................................................................................................................................................................................................................................ | 7.2 |
| Footnote | Description |
Footnote(a) | Excludes short-term securities, short investments and options, if any. |
Footnote(b) | For purposes of this report, credit quality ratings shown above reflect the highest rating assigned by either S&P Global Ratings or Moody’s Investors Service, Inc. if ratings differ. These rating agencies are independent, nationally recognized statistical rating organizations and are widely used. Investment grade ratings are credit ratings of BBB/Baa or higher. Below investment grade ratings are credit ratings of BB/Ba or lower. Investments designated N/R are not rated by either rating agency. Unrated investments do not necessarily indicate low credit quality. Credit quality ratings are subject to change. |
Footnote(c) | The investment adviser evaluates the credit quality of unrated investments based upon certain factors including, but not limited to, credit ratings for similar investments and financial analysis of sectors, individual investments and/or issuers. Using this approach, the investment adviser has deemed unrated U.S. Government Sponsored Agency Securities and U.S. Treasury Obligations to be of similar credit quality as investments rated AAA/Aaa. |
Footnote(d) | Rounds to less than 0.1%. |
If you wish to view additional information about the Fund, including but not limited to financial statements, the Fund’s prospectus, and proxy voting policies and procedures, please visit blackrock.com/fundreports. For proxy voting records, visit blackrock.com/proxyrecords.
The Fund will mail only one copy of shareholder documents, including prospectuses, annual and semi-annual reports and proxy statements, to shareholders with multiple accounts at the same address. This practice is commonly called “householding” and is intended to reduce expenses and eliminate duplicate mailings of shareholder documents. Mailings of your shareholder documents may be householded indefinitely unless you instruct us otherwise. If you do not want the mailing of these documents to be combined with those for other members of your household, please call the Fund at (800) 441-7762.
The Fund is not sponsored, endorsed, issued, sold, or promoted by Bloomberg Index Services Limited and its affiliates, nor does this company make any representation regarding the advisability of investing in the Fund. BlackRock is not affiliated with the company listed above.
© 2024 BlackRock, Inc. or its affiliates. All rights reserved. BLACKROCK is a registered trademark of BlackRock, Inc. or its affiliates. All other trademarks are those of their respective owners.
BlackRock Sustainable Total Return Fund
Investor A Shares | BASTX
Annual Shareholder Report — September 30, 2024
(b) Not Applicable
Item 2 – Code of Ethics – The registrant (or the “Fund”) has adopted a code of ethics, as of the end of the period covered by this report, applicable to the registrant’s principal executive officer, principal financial officer, principal accounting officer or controller, or persons performing similar functions. During the period covered by this report, the code of ethics was amended to update certain information and to make other non-material changes. During the period covered by this report, there have been no waivers granted under the code of ethics. The registrant undertakes to provide a copy of the code of ethics to any person upon request, without charge, who calls 1-800-441-7762.
Item 3 – Audit Committee Financial Expert – The registrant’s board of directors (the “board of directors”), has determined that (i) the registrant has the following audit committee financial experts serving on its audit committee and (ii) each audit committee financial expert is independent:
Lorenzo A. Flores
Catherine A. Lynch
Arthur P. Steinmetz
Under applicable securities laws, a person determined to be an audit committee financial expert will not be deemed an “expert” for any purpose, including without limitation for the purposes of Section 11 of the Securities Act of 1933, as a result of being designated or identified as an audit committee financial expert. The designation or identification of a person as an audit committee financial expert does not impose on such person any duties, obligations, or liabilities greater than the duties, obligations, and liabilities imposed on such person as a member of the audit committee and board of directors in the absence of such designation or identification. The designation or identification of a person as an audit committee financial expert does not affect the duties, obligations, or liability of any other member of the audit committee or board of directors.
Item 4 – Principal Accountant Fees and Services
The following table presents fees billed by Deloitte & Touche LLP (“D&T”) in each of the last two fiscal years for the services rendered to the Fund:
| | (a) Audit Fees | (b) Audit-Related Fees1 | (c) Tax Fees2 | (d) All Other Fees |
Entity Name | Current Fiscal Year End | Previous Fiscal Year End | Current Fiscal Year End | Previous Fiscal Year End | Current Fiscal Year End | Previous Fiscal Year End | Current Fiscal Year End | Previous Fiscal Year End |
| BlackRock Sustainable Total Return Fund | $86,700 | $86,700 | $0 | $0 | $17,600 | $17,600 | $0 | $407 |
The following table presents fees billed by D&T that were required to be approved by the registrant’s audit committee (the “Committee”) for services that relate directly to the operations or financial reporting of the Fund and that are rendered on behalf of BlackRock Advisors, LLC (the “Investment Adviser” or “BlackRock”) and entities controlling, controlled by, or under common control with BlackRock (not including any sub-adviser whose role is primarily portfolio management and is subcontracted with or overseen by another investment adviser) that provide ongoing services to the Fund (“Affiliated Service Providers”):
| | Current Fiscal Year End | Previous Fiscal Year End |
(b) Audit-Related Fees1 | $0 | $0 |
(c) Tax Fees2 | $0 | $0 |
(d) All Other Fees3 | $2,149.000 | $2,154,000 |
1 The nature of the services includes assurance and related services reasonably related to the performance of the audit or review of financial statements not included in Audit Fees, including accounting consultations, agreed upon procedure reports, attestation reports, comfort letters, out-of-pocket expenses and internal control reviews not required by regulators.
2 The nature of the services includes tax compliance and/or tax preparation, including services relating to the filing or amendment of federal, state or local income tax returns, regulated investment company qualification reviews, taxable income and tax distribution calculations.
3 Paid in their entirety by BlackRock, relating to a service organization review ("SSAE 18") and subscription to the Deloitte Accounting Research Tool. These amounts represent the aggregate fees paid by BlackRock and were not specifically allocated on a per Fund basis.
(e)(1) Audit Committee Pre-Approval Policies and Procedures:
The Committee has adopted policies and procedures with regard to the pre-approval of services. Audit, audit-related and tax compliance services provided to the registrant on an annual basis require specific pre-approval by the Committee. The Committee also must approve other non-audit services provided to the registrant and those non-audit services provided to the Investment Adviser and Affiliated Service Providers that relate directly to the operations and the financial reporting of the registrant. Certain of these non-audit services that the Committee believes are (a) consistent with the SEC’s auditor independence rules and (b) routine and recurring services that will not impair the independence of the independent accountants may be approved by the Committee without consideration on a specific case-by-case basis (“general pre-approval”). The term of any general pre-approval is 12 months from the date of the pre-approval, unless the Committee provides for a different period. Tax or other non-audit services provided to the registrant which have a direct impact on the operations or financial reporting of the registrant will only be deemed pre-approved provided that any individual project does not exceed $10,000 attributable to the registrant or $50,000 per project. For this purpose, multiple projects will be aggregated to determine if they exceed the previously mentioned cost levels.
Any proposed services exceeding the pre-approved cost levels will require specific pre-approval by the Committee, as will any other services not subject to general pre-approval (e.g., unanticipated but permissible services). The Committee is informed of each service approved subject to general pre-approval at the next regularly scheduled in-person board meeting. At this meeting, an analysis of such services is presented to the Committee for ratification. The Committee may delegate to the Committee Chairman the authority to approve the provision of and fees for any specific engagement of permitted non-audit services, including services exceeding pre-approved cost levels.
(e)(2) None of the services described in each of Items 4(b) through (d) were approved by the Committee pursuant to the de minimis exception in paragraph (c)(7)(i)(C) of Rule 2-01 of Regulation S-X.
(f) Not Applicable
(g) The aggregate non-audit fees, defined as the sum of the fees shown under “Audit-Related Fees,” “Tax Fees” and “All Other Fees,” paid to the accountant for services rendered by the accountant to the registrant, the Investment Adviser and the Affiliated Service Providers were:
Entity Name | Current Fiscal Year End | Previous Fiscal Year End |
| BlackRock Sustainable Total Return Fund | $17,600 | $18,007 |
Additionally, the amounts billed by D&T in connection with services provided to the Affiliated Service Providers of the Fund and of other funds sponsored or advised by BlackRock or its affiliates during the current and previous fiscal years for a service organization review and an accounting research tool subscription were:
Current Fiscal Year End | Previous Fiscal Year End |
| $2,149,000 | $2,154,000 |
These amounts represent aggregate fees paid by BlackRock and were not allocated on a per fund basis.
(h) The Committee has considered and determined that the provision of non-audit services that were rendered to the Investment Adviser and the Affiliated Service Providers that were not pre-approved pursuant to paragraph (c)(7)(ii) of Rule 2-01 of Regulation S-X is compatible with maintaining the principal accountant’s independence.
(i) – Not Applicable
(j) – Not Applicable
Item 5 – Audit Committee of Listed Registrant – Not Applicable
Item 6 – Investments
(a) The registrant’s Schedule of Investments is included as part of the Financial Statements and Financial Highlights for Open-End Management Investment Companies filed under Item 7 of this Form.
(b) Not Applicable due to no such divestments during the semi-annual period covered since the previous Form N-CSR filing.
Item 7 – Financial Statements and Financial Highlights for Open-End Management Investment Companies
(a) The registrant’s Financial Statements are attached herewith.
(b) The registrant’s Financial Highlights are attached herewith.
Not
FDIC
Insured
-
May
Lose
Value
-
No
Bank
Guarantee
2024
Annual
Financial
Statements
and
Additional
Information
BlackRock
Funds
V
BlackRock
Sustainable
High
Yield
Bond
Fund
BlackRock
Bond
Fund,
Inc.
BlackRock
Sustainable
Total
Return
Fund
Derivative
Financial
Instruments
.............................................................................................
3
Schedules
of
Investments
.................................................................................................
4
Statements
of
Assets
and
Liabilities
...........................................................................................
33
Statements
of
Operations
.................................................................................................
36
Statements
of
Changes
in
Net
Assets
..........................................................................................
37
Financial
Highlights
.....................................................................................................
38
Notes
to
Financial
Statements
...............................................................................................
44
Report
of
Independent
Registered
Public
Accounting
Firm
..............................................................................
58
Important
Tax
Information
.................................................................................................
59
Additional
Information
....................................................................................................
60
Disclosure
of
Investment
Advisory
Agreements
and
Sub-Advisory
Agreements
.................................................................
62
Glossary
of
Terms
Used
in
this
Report
..........................................................................................
66
Derivative
Financial
Instruments
Derivative
Financial
Instruments
The
Funds
may
invest
in
various
derivative
financial
instruments.
These
instruments
are
used
to
obtain
exposure
to
a
security,
commodity,
index,
market,
and/or
other
assets
without
owning
or
taking
physical
custody
of
securities,
commodities
and/or
other
referenced
assets
or
to
manage
market,
equity,
credit,
interest
rate,
foreign
currency
exchange
rate,
commodity
and/or
other
risks.
Derivative
financial
instruments
may
give
rise
to
a
form
of
economic
leverage
and
involve
risks,
including
the
imperfect
correlation
between
the
value
of
a
derivative
financial
instrument
and
the
underlying
asset,
possible
default
of
the
counterparty
to
the
transaction
or
illiquidity
of
the
instrument.
Pursuant
to
Rule
18f-4
under
the
1940
Act,
among
other
things,
the
Funds
must
either
use
derivative
financial
instruments
with
embedded
leverage
in
a
limited
manner
or
comply
with
an
outer
limit
on
fund
leverage
risk
based
on
value-at-risk. The
Funds’
successful
use
of
a
derivative
financial
instrument
depends
on
the
investment
adviser’s
ability
to
predict
pertinent
market
movements
accurately,
which
cannot
be
assured.
The
use
of
these
instruments
may
result
in
losses
greater
than
if
they
had
not
been
used,
may
limit
the
amount
of
appreciation a
Fund
can
realize
on
an
investment
and/or
may
result
in
lower
distributions
paid
to
shareholders.
The
Funds’
investments
in
these
instruments,
if
any,
are
discussed
in
detail
in
the
Notes
to
Financial
Statements.
2024
BlackRock
Annual
Financial
Statements
and
Additional
Information
Schedule
of
Investments
September
30,
2024
BlackRock
Sustainable
High
Yield
Bond
Fund
(Percentages
shown
are
based
on
Net
Assets)
Security
Shares
Shares
Value
Common
Stocks
Building
Products
—
0.1%
JELD-WEN
Holding,
Inc.
(a)
..............
2,228
$
35,225
Life
Sciences
Tools
&
Services
—
0.1%
Avantor,
Inc.
(a)
......................
2,228
57,638
Total
Common
Stocks
—
0
.2
%
(Cost:
$
87,962
)
.................................
92,863
Par
(000)
Par
(000)
Corporate
Bonds
Aerospace
&
Defense
—
3.5%
(b)
Bombardier,
Inc.
7.88%
,
04/15/27
..................
USD
28
28,078
6.00%
,
02/15/28
..................
88
88,582
8.75%
,
11/15/30
..................
102
112,003
7.25%
,
07/01/31
..................
47
49,688
7.00%
,
06/01/32
..................
53
55,435
TransDigm,
Inc.
6.38%
,
03/01/29
..................
405
417,847
7.13%
,
12/01/31
..................
43
45,480
6.63%
,
03/01/32
..................
378
393,627
6.00%
,
01/15/33
..................
237
240,357
Triumph
Group,
Inc.,
9.00%,
03/15/28
.....
152
159,116
1,590,213
Automobile
Components
—
1.8%
Aptiv
plc,
(5-Year
US
Treasury
Yield
Curve
Rate
T
Note
Constant
Maturity
+
3.39%),
6.88%,
12/15/54
(c)
.....................
200
202,102
Clarios
Global
LP
(b)
8.50%
,
05/15/27
..................
393
394,279
6.75%
,
05/15/28
..................
78
80,399
Garrett
Motion
Holdings,
Inc.,
7.75%,
05/31/32
(b)
40
40,936
Goodyear
Tire
&
Rubber
Co.
(The)
5.00%
,
07/15/29
..................
71
65,301
5.63%
,
04/30/33
..................
2
1,764
Phinia,
Inc.,
6.63%,
10/15/32
(b)
..........
24
24,198
Tenneco,
Inc.,
8.00%,
11/17/28
(b)
........
42
38,973
847,952
Broadline
Retail
—
0.2%
(b)
ANGI
Group
LLC,
3.88%,
08/15/28
.......
36
33,013
Match
Group
Holdings
II
LLC,
3.63%,
10/01/31
17
15,224
NMG
Holding
Co.,
Inc.,
8.50%,
10/01/28
....
25
25,445
73,682
Building
Products
—
2.5%
(b)
Advanced
Drainage
Systems,
Inc.,
6.38%,
06/15/30
......................
107
109,298
Builders
FirstSource,
Inc.,
6.38%,
03/01/34
..
43
44,649
Camelot
Return
Merger
Sub,
Inc.,
8.75%,
08/01/28
......................
60
60,715
EMRLD
Borrower
LP
6.63%
,
12/15/30
..................
443
456,775
6.75%
,
07/15/31
..................
47
49,014
JELD-WEN,
Inc.,
7.00%,
09/01/32
.......
80
80,841
Standard
Building
Solutions,
Inc.,
6.50%,
08/15/32
......................
65
67,305
Standard
Industries,
Inc.
5.00%
,
02/15/27
..................
8
7,932
4.75%
,
01/15/28
..................
2
1,959
4.38%
,
07/15/30
..................
55
52,058
3.38%
,
01/15/31
..................
56
49,887
Summit
Materials
LLC,
7.25%,
01/15/31
....
102
108,049
Security
Par
(000)
Par
(000)
Value
Building
Products
(continued)
Wilsonart
LLC,
11.00%,
08/15/32
........
USD
58
$
58,017
1,146,499
Capital
Markets
—
0.6%
(b)
Compass
Group
Diversified
Holdings
LLC,
5.25%,
04/15/29
.................
47
45,661
Focus
Financial
Partners
LLC,
6.75%,
09/15/31
52
52,496
HAT
Holdings
I
LLC
3.38%
,
06/15/26
..................
106
102,649
8.00%
,
06/15/27
..................
59
62,503
263,309
Chemicals
—
2.4%
Avient
Corp.,
6.25%,
11/01/31
(b)
.........
32
32,804
Chemours
Co.
(The)
5.38%
,
05/15/27
..................
28
27,410
5.75%
,
11/15/28
(b)
.................
47
44,646
4.63%
,
11/15/29
(b)
.................
36
32,239
Element
Solutions,
Inc.,
3.88%,
09/01/28
(b)
..
213
203,050
HB
Fuller
Co.,
4.00%,
02/15/27
.........
47
45,869
Herens
Holdco
SARL,
4.75%,
05/15/28
(b)
...
200
174,555
Kobe
U.S.
Midco
2,
Inc.,
9.25%,
11/01/26
(b)
..
63
52,395
Olympus
Water
US
Holding
Corp.,
7.25%,
06/15/31
(b)
.....................
200
208,116
WR
Grace
Holdings
LLC
(b)
4.88%
,
06/15/27
..................
24
23,649
5.63%
,
08/15/29
..................
235
220,755
7.38%
,
03/01/31
..................
32
33,528
1,099,016
Commercial
Services
&
Supplies
—
4.4%
ADT
Security
Corp.
(The)
(b)
4.13%
,
08/01/29
..................
3
2,865
4.88%
,
07/15/32
..................
53
50,623
Allied
Universal
Holdco
LLC
(b)
4.63%
,
06/01/28
..................
200
187,680
7.88%
,
02/15/31
..................
329
336,069
APi
Group
DE,
Inc.
(b)
4.13%
,
07/15/29
..................
19
17,865
4.75%
,
10/15/29
..................
24
23,014
APX
Group,
Inc.
(b)
6.75%
,
02/15/27
..................
13
13,036
5.75%
,
07/15/29
..................
80
79,204
Aramark
Services,
Inc.,
5.00%,
02/01/28
(b)
...
103
102,669
Brink's
Co.
(The)
(b)
6.50%
,
06/15/29
..................
33
34,186
6.75%
,
06/15/32
..................
50
52,154
Garda
World
Security
Corp.
(b)
4.63%
,
02/15/27
..................
48
47,128
9.50%
,
11/01/27
..................
29
29,038
7.75%
,
02/15/28
..................
99
102,654
6.00%
,
06/01/29
..................
14
13,436
8.25%
,
08/01/32
..................
78
79,833
GFL
Environmental,
Inc.
(b)
3.75%
,
08/01/25
..................
5
4,960
4.00%
,
08/01/28
..................
37
35,534
3.50%
,
09/01/28
..................
4
3,808
4.75%
,
06/15/29
..................
132
128,761
4.38%
,
08/15/29
..................
29
27,797
6.75%
,
01/15/31
..................
36
37,758
Madison
IAQ
LLC
(b)
4.13%
,
06/30/28
..................
30
28,949
5.88%
,
06/30/29
..................
128
124,616
Prime
Security
Services
Borrower
LLC,
6.25%,
01/15/28
(b)
.....................
110
110,030
Reworld
Holding
Corp.
4.88%
,
12/01/29
(b)
.................
20
18,827
Schedule
of
Investments
(continued)
September
30,
2024
BlackRock
Sustainable
High
Yield
Bond
Fund
(Percentages
shown
are
based
on
Net
Assets)
Security
Par
(000)
Par
(000)
Value
Commercial
Services
&
Supplies
(continued)
5.00%
,
09/01/30
..................
USD
40
$
37,517
RR
Donnelley
&
Sons
Co.,
9.50%,
08/01/29
(b)
.
54
54,460
Stericycle,
Inc.,
3.88%,
01/15/29
(b)
........
73
72,731
Williams
Scotsman,
Inc.
(b)
4.63%
,
08/15/28
..................
38
36,935
6.63%
,
06/15/29
..................
31
31,917
7.38%
,
10/01/31
..................
76
80,329
Wrangler
Holdco
Corp.,
6.63%,
04/01/32
(b)
..
19
19,749
2,026,132
Communications
Equipment
—
0.1%
(b)
CommScope
LLC,
4.75%,
09/01/29
.......
42
35,280
Viavi
Solutions,
Inc.,
3.75%,
10/01/29
.....
17
15,426
50,706
Construction
&
Engineering
—
0.1%
(b)
Dycom
Industries,
Inc.,
4.50%,
04/15/29
....
31
29,925
Pike
Corp.,
8.63%,
01/31/31
...........
20
21,384
51,309
Consumer
Finance
—
1.7%
Bread
Financial
Holdings,
Inc.,
9.75%,
03/15/29
(b)
.....................
18
19,022
GGAM
Finance
Ltd.
(b)
7.75%
,
05/15/26
..................
10
10,225
8.00%
,
02/15/27
..................
84
87,781
8.00%
,
06/15/28
..................
28
30,012
6.88%
,
04/15/29
..................
50
52,014
5.88%
,
03/15/30
..................
45
45,059
Global
Aircraft
Leasing
Co.
Ltd.,
8.75%,
09/01/27
(b)
.....................
27
27,424
Navient
Corp.,
9.38%,
07/25/30
.........
79
87,634
OneMain
Finance
Corp.
6.63%
,
01/15/28
..................
20
20,364
9.00%
,
01/15/29
..................
101
107,026
7.88%
,
03/15/30
..................
85
88,858
4.00%
,
09/15/30
..................
104
92,630
7.50%
,
05/15/31
..................
23
23,676
7.13%
,
11/15/31
..................
37
37,445
SLM
Corp.,
3.13%,
11/02/26
...........
41
39,415
768,585
Consumer
Staples
Distribution
&
Retail
—
0.8%
Albertsons
Cos.,
Inc.
(b)
4.63%
,
01/15/27
..................
8
7,783
6.50%
,
02/15/28
..................
44
44,801
3.50%
,
03/15/29
..................
49
45,688
4.88%
,
02/15/30
..................
113
111,177
KeHE
Distributors
LLC,
9.00%,
02/15/29
(b)
...
18
18,718
United
Natural
Foods,
Inc.,
6.75%,
10/15/28
(b)
19
18,121
US
Foods,
Inc.
(b)
4.75%
,
02/15/29
..................
47
45,822
4.63%
,
06/01/30
..................
5
4,831
7.25%
,
01/15/32
..................
67
70,909
Walgreens
Boots
Alliance,
Inc.,
8.13%,
08/15/29
19
18,964
386,814
Containers
&
Packaging
—
3.2%
Ardagh
Metal
Packaging
Finance
USA
LLC
(b)
6.00%
,
06/15/27
..................
200
201,438
4.00%
,
09/01/29
..................
200
178,523
Clydesdale
Acquisition
Holdings,
Inc.
(b)
6.63%
,
04/15/29
..................
91
91,863
6.88%
,
01/15/30
..................
96
98,039
8.75%
,
04/15/30
..................
93
94,436
Crown
Americas
LLC,
4.25%,
09/30/26
....
68
66,925
Graphic
Packaging
International
LLC,
3.50%,
03/15/28
(b)
.....................
27
25,712
Security
Par
(000)
Par
(000)
Value
Containers
&
Packaging
(continued)
Mauser
Packaging
Solutions
Holding
Co.
(b)
7.88%
,
04/15/27
..................
USD
387
$
399,840
9.25%
,
04/15/27
..................
22
22,558
Owens-Brockway
Glass
Container,
Inc.,
7.25%,
05/15/31
(b)
.....................
158
162,318
Sealed
Air
Corp.
(b)
4.00%
,
12/01/27
..................
70
67,637
5.00%
,
04/15/29
..................
8
7,879
7.25%
,
02/15/31
..................
16
16,934
6.50%
,
07/15/32
..................
51
52,590
1,486,692
Distributors
—
0.4%
(b)
American
Builders
&
Contractors
Supply
Co.,
Inc.,
3.88%,
11/15/29
..............
12
11,219
Resideo
Funding,
Inc.
4.00%
,
09/01/29
..................
8
7,536
6.50%
,
07/15/32
..................
83
85,200
Ritchie
Bros
Holdings,
Inc.,
7.75%,
03/15/31
.
59
62,835
166,790
Diversified
Consumer
Services
—
1.3%
Champions
Financing,
Inc.,
8.75%,
02/15/29
(b)
5
5,093
Service
Corp.
International
3.38%
,
08/15/30
..................
2
1,813
4.00%
,
05/15/31
..................
100
92,534
5.75%
,
10/15/32
..................
198
199,296
Sotheby's,
5.88%,
06/01/29
(b)
...........
200
175,296
Wand
NewCo
3,
Inc.,
7.63%,
01/30/32
(b)
....
136
143,276
617,308
Diversified
REITs
—
0.9%
(b)
Iron
Mountain
Information
Management
Services,
Inc.,
5.00%,
07/15/32
........
76
73,254
Uniti
Group
LP
Series
MAY
,
10.50%
,
02/15/28
.........
76
81,123
10.50%
,
02/15/28
.................
240
256,177
410,554
Diversified
Telecommunication
Services
—
5.1%
(b)
Altice
Financing
SA,
5.75%,
08/15/29
.....
200
160,728
CCO
Holdings
LLC
5.38%
,
06/01/29
..................
9
8,673
6.38%
,
09/01/29
..................
239
239,283
4.75%
,
03/01/30
..................
8
7,359
4.25%
,
02/01/31
..................
82
72,302
7.38%
,
03/01/31
..................
112
114,674
4.25%
,
01/15/34
..................
62
50,856
Frontier
Communications
Holdings
LLC
5.88%
,
10/15/27
..................
71
71,289
5.00%
,
05/01/28
..................
49
48,558
8.75%
,
05/15/30
..................
224
238,708
8.63%
,
03/15/31
..................
44
47,436
Iliad
Holding
SASU,
7.00%,
10/15/28
......
200
203,463
Level
3
Financing,
Inc.
10.50%
,
04/15/29
.................
141
153,697
4.88%
,
06/15/29
..................
58
48,720
11.00%
,
11/15/29
.................
171
189,179
10.50%
,
05/15/30
.................
216
232,470
10.75%
,
12/15/30
.................
6
6,585
Lumen
Technologies,
Inc.
4.13%
,
04/15/29
..................
25
20,618
4.13%
,
04/15/30
..................
25
19,815
Windstream
Escrow
LLC
7.75%
,
08/15/28
..................
62
62,059
8.25%
,
10/01/31
..................
51
51,848
2024
BlackRock
Annual
Financial
Statements
and
Additional
Information
Schedule
of
Investments
(continued)
September
30,
2024
BlackRock
Sustainable
High
Yield
Bond
Fund
(Percentages
shown
are
based
on
Net
Assets)
Security
Par
(000)
Par
(000)
Value
Diversified
Telecommunication
Services
(continued)
Zayo
Group
Holdings,
Inc.
4.00%
,
03/01/27
..................
USD
228
$
203,933
6.13%
,
03/01/28
..................
95
78,850
2,331,103
Electric
Utilities
—
1.1%
NextEra
Energy
Capital
Holdings,
Inc.,
(5-Year
US
Treasury
Yield
Curve
Rate
T
Note
Constant
Maturity
+
2.46%),
6.75%,
06/15/54
(c)
.....................
85
91,723
NRG
Energy,
Inc.,
7.00%,
03/15/33
(b)
......
22
24,439
Pattern
Energy
Operations
LP,
4.50%,
08/15/28
(b)
.....................
249
240,879
PG&E
Corp.
4.25%
,
12/01/27
(b)
(d)
................
81
87,723
(5-Year
US
Treasury
Yield
Curve
Rate
T
Note
Constant
Maturity
+
3.88%),
7.38%
,
03/15/55
(c)
....................
50
52,444
497,208
Electrical
Equipment
—
0.2%
Vertiv
Group
Corp.,
4.13%,
11/15/28
(b)
.....
109
105,348
Electronic
Equipment,
Instruments
&
Components
—
0.5%
CDW
LLC,
5.55%,
08/22/34
...........
48
49,111
Insight
Enterprises,
Inc.,
6.63%,
05/15/32
(b)
..
33
34,445
Sensata
Technologies,
Inc.
(b)
4.38%
,
02/15/30
..................
92
87,921
3.75%
,
02/15/31
..................
18
16,480
Zebra
Technologies
Corp.,
6.50%,
06/01/32
(b)
.
25
26,101
214,058
Entertainment
—
0.3%
(b)
Cinemark
USA,
Inc.,
7.00%,
08/01/32
.....
23
24,011
Lions
Gate
Capital
Holdings
1,
Inc.,
5.50%,
04/15/29
......................
48
43,090
Live
Nation
Entertainment,
Inc.
4.75%
,
10/15/27
..................
26
25,632
3.75%
,
01/15/28
..................
24
23,062
Playtika
Holding
Corp.,
4.25%,
03/15/29
....
10
9,178
124,973
Financial
Services
—
4.1%
Block,
Inc.
2.75%
,
06/01/26
..................
105
101,798
3.50%
,
06/01/31
..................
25
22,796
6.50%
,
05/15/32
(b)
.................
411
427,982
Boost
Newco
Borrower
LLC,
7.50%,
01/15/31
(b)
224
240,363
Enact
Holdings,
Inc.,
6.25%,
05/28/29
.....
23
23,880
Hannon
Armstrong
Sustainable
Infrastructure
Capital,
Inc.,
6.38%,
07/01/34
(b)
........
39
39,922
Nationstar
Mortgage
Holdings,
Inc.
(b)
5.00%
,
02/01/26
..................
171
170,170
6.00%
,
01/15/27
..................
16
16,002
6.50%
,
08/01/29
..................
104
105,750
5.13%
,
12/15/30
..................
18
17,267
5.75%
,
11/15/31
..................
40
39,183
7.13%
,
02/01/32
..................
88
91,903
NCR
Atleos
Corp.,
9.50%,
04/01/29
(b)
......
51
56,144
PennyMac
Financial
Services,
Inc.
(b)
7.88%
,
12/15/29
..................
62
66,112
7.13%
,
11/15/30
..................
58
60,055
Rocket
Mortgage
LLC
(b)
2.88%
,
10/15/26
..................
116
111,369
3.88%
,
03/01/31
..................
46
42,354
4.00%
,
10/15/33
..................
8
7,146
Shift4
Payments
LLC
(b)
4.63%
,
11/01/26
..................
47
46,516
Security
Par
(000)
Par
(000)
Value
Financial
Services
(continued)
6.75%
,
08/15/32
..................
USD
188
$
196,279
1,882,991
Food
Products
—
1.4%
(b)
B&G
Foods,
Inc.,
8.00%,
09/15/28
.......
19
19,875
Chobani
LLC
4.63%
,
11/15/28
..................
173
168,478
7.63%
,
07/01/29
..................
247
259,380
Darling
Ingredients,
Inc.,
6.00%,
06/15/30
...
118
119,123
Fiesta
Purchaser,
Inc.
7.88%
,
03/01/31
..................
27
28,643
9.63%
,
09/15/32
..................
28
28,984
624,483
Gas
Utilities
—
0.0%
Suburban
Propane
Partners
LP,
5.00%,
06/01/31
(b)
.....................
16
14,917
Ground
Transportation
—
0.4%
(b)
Genesee
&
Wyoming,
Inc.,
6.25%,
04/15/32
.
117
120,317
GN
Bondco
LLC,
9.50%,
10/15/31
.......
58
61,050
181,367
Health
Care
Equipment
&
Supplies
—
1.9%
Avantor
Funding,
Inc.
(b)
4.63%
,
07/15/28
..................
92
89,920
3.88%
,
11/01/29
..................
24
22,708
Bausch
+
Lomb
Corp.,
8.38%,
10/01/28
(b)
...
271
286,583
Medline
Borrower
LP
(b)
3.88%
,
04/01/29
..................
30
28,403
6.25%
,
04/01/29
..................
65
66,971
5.25%
,
10/01/29
..................
289
283,562
Neogen
Food
Safety
Corp.,
8.63%,
07/20/30
(b)
46
50,914
Teleflex,
Inc.
4.63%
,
11/15/27
..................
3
2,958
4.25%
,
06/01/28
(b)
.................
44
42,615
874,634
Health
Care
Providers
&
Services
—
3.6%
Acadia
Healthcare
Co.,
Inc.,
5.00%,
04/15/29
(b)
3
2,857
AHP
Health
Partners,
Inc.,
5.75%,
07/15/29
(b)
.
115
112,463
Community
Health
Systems,
Inc.
(b)
5.63%
,
03/15/27
..................
54
53,140
6.00%
,
01/15/29
..................
157
152,414
5.25%
,
05/15/30
..................
124
114,118
4.75%
,
02/15/31
..................
55
48,347
10.88%
,
01/15/32
.................
139
153,176
Concentra
Escrow
Issuer
Corp.,
6.88%,
07/15/32
(b)
.....................
68
71,503
DaVita,
Inc.,
6.88%,
09/01/32
(b)
.........
46
47,520
Encompass
Health
Corp.,
4.63%,
04/01/31
..
18
17,236
HAH
Group
Holding
Co.
LLC,
9.75%,
10/01/31
(b)
28
28,233
HealthEquity,
Inc.,
4.50%,
10/01/29
(b)
......
63
60,886
LifePoint
Health,
Inc.
(b)
9.88%
,
08/15/30
..................
42
46,242
11.00%
,
10/15/30
.................
121
136,535
10.00%
,
06/01/32
.................
57
62,664
Molina
Healthcare,
Inc.
(b)
4.38%
,
06/15/28
..................
30
29,165
3.88%
,
11/15/30
..................
10
9,289
3.88%
,
05/15/32
..................
8
7,317
Option
Care
Health,
Inc.,
4.38%,
10/31/29
(b)
..
56
53,206
Star
Parent,
Inc.,
9.00%,
10/01/30
(b)
.......
185
198,612
Surgery
Center
Holdings,
Inc.,
7.25%,
04/15/32
(b)
.....................
123
128,384
Tenet
Healthcare
Corp.,
6.75%,
05/15/31
...
132
137,593
1,670,900
Schedule
of
Investments
(continued)
September
30,
2024
BlackRock
Sustainable
High
Yield
Bond
Fund
(Percentages
shown
are
based
on
Net
Assets)
Security
Par
(000)
Par
(000)
Value
Hotel
&
Resort
REITs
—
0.2%
Host
Hotels
&
Resorts
LP,
5.50%,
04/15/35
..
USD
61
$
61,884
Pebblebrook
Hotel
LP,
6.38%,
10/15/29
(b)
...
25
25,166
87,050
Hotels,
Restaurants
&
Leisure
—
6.5%
1011778
BC
ULC
(b)
4.38%
,
01/15/28
..................
139
135,041
6.13%
,
06/15/29
..................
66
67,898
5.63%
,
09/15/29
..................
52
52,751
4.00%
,
10/15/30
..................
62
57,173
Acushnet
Co.,
7.38%,
10/15/28
(b)
........
7
7,379
Boyne
USA,
Inc.,
4.75%,
05/15/29
(b)
......
112
107,669
Caesars
Entertainment,
Inc.
(b)
7.00%
,
02/15/30
..................
175
182,822
6.50%
,
02/15/32
..................
191
197,573
Churchill
Downs,
Inc.
(b)
4.75%
,
01/15/28
..................
22
21,571
5.75%
,
04/01/30
..................
187
187,205
6.75%
,
05/01/31
..................
93
96,037
Fertitta
Entertainment
LLC
(b)
4.63%
,
01/15/29
..................
190
181,417
6.75%
,
01/15/30
..................
21
19,565
Hilton
Domestic
Operating
Co.,
Inc.
5.88%
,
04/01/29
(b)
.................
163
167,115
3.75%
,
05/01/29
(b)
.................
13
12,322
4.88%
,
01/15/30
..................
52
51,310
3.63%
,
02/15/32
(b)
.................
16
14,455
6.13%
,
04/01/32
(b)
.................
59
60,751
5.88%
,
03/15/33
(b)
.................
178
181,373
Light
&
Wonder
International,
Inc.
(b)
7.25%
,
11/15/29
..................
44
45,523
7.50%
,
09/01/31
..................
60
62,933
Lindblad
Expeditions
Holdings,
Inc.,
9.00%,
05/15/28
(b)
.....................
38
39,760
Lindblad
Expeditions
LLC,
6.75%,
02/15/27
(b)
.
80
80,544
MajorDrive
Holdings
IV
LLC,
6.38%,
06/01/29
(b)
76
73,924
MGM
China
Holdings
Ltd.,
5.88%,
05/15/26
(b)
.
200
199,563
MGM
Resorts
International,
6.13%,
09/15/29
.
124
125,543
Midwest
Gaming
Borrower
LLC,
4.88%,
05/01/29
(b)
.....................
38
36,449
Sabre
GLBL,
Inc.
(b)
8.63%
,
06/01/27
..................
88
86,559
11.25%
,
12/15/27
.................
2
2,075
Six
Flags
Entertainment
Corp.
(b)
7.25%
,
05/15/31
..................
126
130,501
6.63%
,
05/01/32
..................
22
22,783
Station
Casinos
LLC,
6.63%,
03/15/32
(b)
....
42
42,934
Vail
Resorts,
Inc.,
6.50%,
05/15/32
(b)
......
76
79,414
Wyndham
Hotels
&
Resorts,
Inc.,
4.38%,
08/15/28
(b)
.....................
71
68,488
Wynn
Resorts
Finance
LLC
(b)
7.13%
,
02/15/31
..................
39
42,077
6.25%
,
03/15/33
..................
39
39,509
2,980,006
Household
Durables
—
0.8%
Ashton
Woods
USA
LLC,
4.63%,
08/01/29
(b)
.
25
23,999
Beazer
Homes
USA,
Inc.,
7.50%,
03/15/31
(b)
.
19
19,715
Brookfield
Residential
Properties,
Inc.,
5.00%,
06/15/29
(b)
.....................
97
92,966
CD&R
Smokey
Buyer,
Inc.,
9.50%,
10/15/29
(b)
78
78,074
Dream
Finders
Homes,
Inc.,
8.25%,
08/15/28
(b)
26
27,475
Empire
Communities
Corp.,
9.75%,
05/01/29
(b)
17
18,151
K.
Hovnanian
Enterprises,
Inc.,
11.75%,
09/30/29
(b)
.....................
40
44,491
LGI
Homes,
Inc.,
8.75%,
12/15/28
(b)
.......
25
26,773
Security
Par
(000)
Par
(000)
Value
Household
Durables
(continued)
New
Home
Co.,
Inc.
(The),
9.25%,
10/01/29
(b)
USD
47
$
49,521
TRI
Pointe
Homes,
Inc.,
5.25%,
06/01/27
...
9
9,008
390,173
Household
Products
—
0.1%
(b)
Kronos
Acquisition
Holdings,
Inc.,
8.25%,
06/30/31
......................
13
13,049
Spectrum
Brands,
Inc.
3.38%
,
06/01/29
(d)
.................
40
41,409
3.88%
,
03/15/31
..................
2
1,751
56,209
Independent
Power
and
Renewable
Electricity
Producers
—
1.6%
Clearway
Energy
Operating
LLC
(b)
4.75%
,
03/15/28
..................
240
235,498
3.75%
,
01/15/32
..................
101
91,395
NextEra
Energy
Partners
LP
(b)(d)
0.00%
,
11/15/25
(e)
.................
127
118,618
2.50%
,
06/15/26
..................
32
30,079
TransAlta
Corp.,
7.75%,
11/15/29
........
238
251,392
726,982
Insurance
—
7.8%
(b)
Acrisure
LLC,
7.50%,
11/06/30
..........
56
57,629
Alliant
Holdings
Intermediate
LLC
4.25%
,
10/15/27
..................
167
159,871
6.75%
,
10/15/27
..................
244
243,085
6.75%
,
04/15/28
..................
9
9,146
5.88%
,
11/01/29
..................
196
188,211
7.00%
,
01/15/31
..................
107
109,953
7.38%
,
10/01/32
..................
189
191,618
AmWINS
Group,
Inc.
6.38%
,
02/15/29
..................
31
31,756
4.88%
,
06/30/29
..................
33
31,644
Ardonagh
Group
Finance
Ltd.,
8.88%,
02/15/32
200
206,702
AssuredPartners,
Inc.,
7.50%,
02/15/32
....
83
85,304
Baldwin
Insurance
Group
Holdings
LLC,
7.13%,
05/15/31
......................
17
17,887
Howden
UK
Refinance
plc
7.25%
,
02/15/31
..................
172
178,478
8.13%
,
02/15/32
..................
207
212,790
HUB
International
Ltd.
7.25%
,
06/15/30
..................
451
469,888
7.38%
,
01/31/32
..................
565
583,416
Jones
Deslauriers
Insurance
Management,
Inc.
8.50%
,
03/15/30
..................
118
126,249
10.50%
,
12/15/30
.................
93
101,136
Panther
Escrow
Issuer
LLC,
7.13%,
06/01/31
.
381
399,634
Ryan
Specialty
LLC
4.38%
,
02/01/30
..................
27
26,020
5.88%
,
08/01/32
..................
41
41,683
USI,
Inc.,
7.50%,
01/15/32
............
99
102,559
3,574,659
IT
Services
—
0.5%
Fortress
Intermediate
3,
Inc.,
7.50%,
06/01/31
(b)
122
128,713
Twilio,
Inc.
3.63%
,
03/15/29
..................
18
16,748
3.88%
,
03/15/31
..................
95
87,764
233,225
Life
Sciences
Tools
&
Services
—
0.2%
(b)
Charles
River
Laboratories
International,
Inc.
4.25%
,
05/01/28
..................
32
31,121
4.00%
,
03/15/31
..................
14
12,906
Fortrea
Holdings,
Inc.,
7.50%,
07/01/30
....
34
34,223
78,250
2024
BlackRock
Annual
Financial
Statements
and
Additional
Information
Schedule
of
Investments
(continued)
September
30,
2024
BlackRock
Sustainable
High
Yield
Bond
Fund
(Percentages
shown
are
based
on
Net
Assets)
Security
Par
(000)
Par
(000)
Value
Machinery
—
1.3%
(b)
Manitowoc
Co.,
Inc.
(The),
9.25%,
10/01/31
..
USD
28
$
28,700
Mueller
Water
Products,
Inc.,
4.00%,
06/15/29
43
41,016
Terex
Corp.
5.00%
,
05/15/29
..................
63
61,491
6.25%
,
10/15/32
..................
47
47,000
TK
Elevator
Holdco
GmbH,
7.63%,
07/15/28
.
200
201,276
TK
Elevator
US
Newco,
Inc.,
5.25%,
07/15/27
200
197,842
577,325
Media
—
4.5%
Cable
One,
Inc.
0.00%
,
03/15/26
(d)
(e)
................
22
20,130
1.13%
,
03/15/28
(d)
.................
160
128,741
4.00%
,
11/15/30
(b)
.................
55
43,842
Clear
Channel
Outdoor
Holdings,
Inc.
(b)
5.13%
,
08/15/27
..................
43
42,273
7.75%
,
04/15/28
..................
28
25,055
9.00%
,
09/15/28
..................
130
138,205
7.50%
,
06/01/29
..................
146
125,744
7.88%
,
04/01/30
..................
168
175,677
CSC
Holdings
LLC,
11.25%,
05/15/28
(b)
....
200
193,063
DirecTV
Financing
LLC,
5.88%,
08/15/27
(b)
..
155
152,184
GCI
LLC,
4.75%,
10/15/28
(b)
...........
8
7,682
Gray
Television,
Inc.,
10.50%,
07/15/29
(b)
...
124
129,514
Neptune
Bidco
US,
Inc.,
9.29%,
04/15/29
(b)
..
90
88,160
Outfront
Media
Capital
LLC
(b)
5.00%
,
08/15/27
..................
105
104,401
4.25%
,
01/15/29
..................
18
17,139
4.63%
,
03/15/30
..................
79
75,065
7.38%
,
02/15/31
..................
58
61,914
Radiate
Holdco
LLC,
4.50%,
09/15/26
(b)
....
43
36,684
Sirius
XM
Radio,
Inc.
(b)
3.13%
,
09/01/26
..................
97
93,718
5.00%
,
08/01/27
..................
54
53,124
4.00%
,
07/15/28
..................
12
11,321
Univision
Communications,
Inc.
(b)
6.63%
,
06/01/27
..................
96
96,117
8.00%
,
08/15/28
..................
152
155,415
8.50%
,
07/31/31
..................
82
82,183
2,057,351
Metals
&
Mining
—
4.1%
(b)
Big
River
Steel
LLC,
6.63%,
01/31/29
.....
681
689,927
Constellium
SE
5.63%
,
06/15/28
..................
250
249,463
3.75%
,
04/15/29
..................
250
233,465
First
Quantum
Minerals
Ltd.,
9.38%,
03/01/29
200
212,000
Novelis
Corp.
3.25%
,
11/15/26
..................
392
378,269
4.75%
,
01/30/30
..................
18
17,451
3.88%
,
08/15/31
..................
108
98,730
1,879,305
Mortgage
Real
Estate
Investment
Trusts
(REITs)
—
0.2%
(b)
Ladder
Capital
Finance
Holdings
LLLP,
7.00%,
07/15/31
......................
47
49,831
Starwood
Property
Trust,
Inc.
4.38%
,
01/15/27
..................
9
8,771
7.25%
,
04/01/29
..................
36
37,748
6.00%
,
04/15/30
..................
18
18,007
114,357
Oil,
Gas
&
Consumable
Fuels
—
0.2%
ITT
Holdings
LLC,
6.50%,
08/01/29
(b)
......
98
92,841
Security
Par
(000)
Par
(000)
Value
Passenger
Airlines
—
0.6%
(b)
American
Airlines,
Inc.,
8.50%,
05/15/29
....
USD
127
$
134,749
United
Airlines,
Inc.,
4.63%,
04/15/29
......
142
137,180
271,929
Personal
Care
Products
—
0.3%
Coty,
Inc.,
6.63%,
07/15/30
(b)
...........
69
71,693
Perrigo
Finance
Unlimited
Co.,
Series
USD,
6.13%,
09/30/32
.................
66
66,510
Prestige
Brands,
Inc.,
3.75%,
04/01/31
(b)
....
17
15,570
153,773
Pharmaceuticals
—
1.1%
1375209
BC
Ltd.,
9.00%,
01/30/28
(b)
......
31
30,724
Bausch
Health
Cos.,
Inc.
(b)
6.13%
,
02/01/27
..................
39
35,224
5.75%
,
08/15/27
..................
5
4,248
11.00%
,
09/30/28
.................
52
48,490
Catalent
Pharma
Solutions,
Inc.
(b)
5.00%
,
07/15/27
..................
37
36,817
3.13%
,
02/15/29
..................
106
104,124
3.50%
,
04/01/30
..................
25
24,591
Teva
Pharmaceutical
Finance
Netherlands
III
BV,
3.15%,
10/01/26
..............
211
202,362
486,580
Professional
Services
—
0.6%
(b)
CoreLogic,
Inc.,
4.50%,
05/01/28
........
189
178,378
Dun
&
Bradstreet
Corp.
(The),
5.00%,
12/15/29
104
103,559
281,937
Real
Estate
Management
&
Development
—
0.8%
(b)
Anywhere
Real
Estate
Group
LLC,
7.00%,
04/15/30
......................
71
65,595
Cushman
&
Wakefield
US
Borrower
LLC
6.75%
,
05/15/28
..................
154
155,397
8.88%
,
09/01/31
..................
72
78,609
Howard
Hughes
Corp.
(The),
5.38%,
08/01/28
62
61,089
360,690
Retail
REITs
—
0.1%
Brookfield
Property
REIT,
Inc.,
4.50%,
04/01/27
(b)
.....................
34
33,089
Semiconductors
&
Semiconductor
Equipment
—
0.6%
(b)
Entegris,
Inc.,
4.75%,
04/15/29
.........
195
192,163
MKS
Instruments,
Inc.,
1.25%,
06/01/30
(d)
...
79
78,724
Synaptics,
Inc.,
4.00%,
06/15/29
.........
24
22,734
293,621
Software
—
8.8%
(b)
AthenaHealth
Group,
Inc.,
6.50%,
02/15/30
..
386
370,786
Camelot
Finance
SA,
4.50%,
11/01/26
.....
29
28,578
Capstone
Borrower,
Inc.,
8.00%,
06/15/30
...
108
114,432
Central
Parent
LLC,
8.00%,
06/15/29
......
101
105,049
Central
Parent,
Inc.,
7.25%,
06/15/29
......
113
115,555
Clarivate
Science
Holdings
Corp.
3.88%
,
07/01/28
..................
253
242,797
4.88%
,
07/01/29
..................
200
192,368
Cloud
Software
Group,
Inc.
6.50%
,
03/31/29
..................
560
557,181
9.00%
,
09/30/29
..................
462
470,136
8.25%
,
06/30/32
..................
399
417,074
Elastic
NV,
4.13%,
07/15/29
...........
102
95,295
Fair
Isaac
Corp.,
4.00%,
06/15/28
........
127
122,883
Gen
Digital,
Inc.,
6.75%,
09/30/27
........
68
69,868
McAfee
Corp.,
7.38%,
02/15/30
.........
100
97,536
SS&C
Technologies,
Inc.
5.50%
,
09/30/27
..................
110
109,953
6.50%
,
06/01/32
..................
86
88,907
Schedule
of
Investments
(continued)
September
30,
2024
BlackRock
Sustainable
High
Yield
Bond
Fund
(Percentages
shown
are
based
on
Net
Assets)
Security
Par
(000)
Par
(000)
Value
Software
(continued)
UKG,
Inc.,
6.88%,
02/01/31
............
USD
586
$
605,514
Veritas
US,
Inc.,
7.50%,
09/01/25
........
57
53,474
ZoomInfo
Technologies
LLC,
3.88%,
02/01/29
205
189,497
4,046,883
Specialized
REITs
—
0.7%
Iron
Mountain,
Inc.
(b)
5.25%
,
07/15/30
..................
3
2,962
5.63%
,
07/15/32
..................
164
163,579
SBA
Communications
Corp.
3.88%
,
02/15/27
..................
21
20,466
3.13%
,
02/01/29
..................
146
134,947
321,954
Specialty
Retail
—
1.1%
Asbury
Automotive
Group,
Inc.
4.50%
,
03/01/28
..................
2
1,947
5.00%
,
02/15/32
(b)
.................
14
13,276
Carvana
Co.
(b)(f)
11.00%
,
(
11.00
%
Cash
or
13.00
%
PIK),
06/01/30
.....................
54
58,252
14.00%
,
(
14.00
%
Cash
or
14.00
%
PIK),
06/01/31
.....................
138
159,851
Cougar
JV
Subsidiary
LLC,
8.00%,
05/15/32
(b)
40
42,290
Group
1
Automotive,
Inc.,
6.38%,
01/15/30
(b)
.
35
35,556
GYP
Holdings
III
Corp.,
4.63%,
05/01/29
(b)
...
117
111,535
Staples,
Inc.,
10.75%,
09/01/29
(b)
........
62
60,159
482,866
Technology
Hardware,
Storage
&
Peripherals
—
0.6%
Seagate
HDD
Cayman
(b)
8.25%
,
12/15/29
..................
115
124,839
8.50%
,
07/15/31
..................
129
140,776
265,615
Textiles,
Apparel
&
Luxury
Goods
—
0.3%
(b)
Crocs,
Inc.
4.25%
,
03/15/29
..................
34
32,143
4.13%
,
08/15/31
..................
4
3,633
Hanesbrands,
Inc.
4.88%
,
05/15/26
..................
23
22,798
9.00%
,
02/15/31
..................
2
2,159
Kontoor
Brands,
Inc.,
4.13%,
11/15/29
.....
23
21,711
Levi
Strauss
&
Co.,
3.50%,
03/01/31
......
54
48,943
S&S
Holdings
LLC,
8.38%,
10/01/31
......
17
17,117
148,504
Trading
Companies
&
Distributors
—
2.3%
(b)
Beacon
Roofing
Supply,
Inc.
4.13%
,
05/15/29
..................
22
20,727
6.50%
,
08/01/30
..................
51
52,784
Boise
Cascade
Co.,
4.88%,
07/01/30
......
61
58,833
Fortress
Transportation
&
Infrastructure
Investors
LLC
5.50%
,
05/01/28
..................
8
7,967
7.88%
,
12/01/30
..................
111
119,582
7.00%
,
05/01/31
..................
215
226,612
7.00%
,
06/15/32
..................
120
125,964
5.88%
,
04/15/33
..................
84
83,580
Foundation
Building
Materials,
Inc.,
6.00%,
03/01/29
......................
18
15,851
Herc
Holdings,
Inc.
5.50%
,
07/15/27
..................
99
98,878
6.63%
,
06/15/29
..................
53
54,896
Imola
Merger
Corp.,
4.75%,
05/15/29
......
25
24,394
United
Rentals
North
America,
Inc.,
6.13%,
03/15/34
......................
66
68,207
Security
Par
(000)
Par
(000)
Value
Trading
Companies
&
Distributors
(continued)
WESCO
Distribution,
Inc.
6.38%
,
03/15/29
..................
USD
38
$
39,258
6.63%
,
03/15/32
..................
44
45,831
1,043,364
Wireless
Telecommunication
Services
—
0.4%
Connect
Finco
SARL,
9.00%,
09/15/29
(b)
....
200
193,547
Total
Corporate
Bonds
—
88
.8
%
(Cost:
$
39,677,267
)
...............................
40,739,628
Fixed
Rate
Loan
Interests
Media
—
0.5%
Clear
Channel
International
BV,
1st
Lien
Term
Loan
,
7.50
%
,
08/12/27
..............
216
214,380
Total
Fixed
Rate
Loan
Interests
—
0
.5
%
(Cost:
$
214,200
)
.................................
214,380
Floating
Rate
Loan
Interests
Air
Freight
&
Logistics
—
0.1%
Clue
Opco
LLC,
1st
Lien
Term
Loan
B
,
(3-mo.
CME
Term
SOFR
at
0.75%
Floor
+
4.50%),
9.75
%
,
12/19/30
(c)
.................
43
42,369
Automobile
Components
—
0.2%
Champions
Financing,
Inc.,
1st
Lien
Term
Loan
,
(3-mo.
CME
Term
SOFR
at
0.00%
Floor
+
4.75%),
9.85
%
,
02/06/29
(c)
...........
75
72,000
Building
Products
—
0.2%
(c)
Cornerstone
Building
Brands
Inc.,
1st
Lien
Term
Loan
C
,
(1-mo.
CME
Term
SOFR
at
0.50%
Floor
+
4.50%),
9.60
%
,
05/15/31
.......
17
16,782
Wilsonart
LLC,
1st
Lien
Term
Loan
,
(3-mo.
CME
Term
SOFR
at
0.00%
Floor
+
4.25%),
8.81
%
-
9.49
%
,
08/05/31
.................
63
62,265
79,047
Capital
Markets
—
0.1%
Grant
Thornton
Advisors
LLC,
1st
Lien
Term
Loan
,
(1-mo.
CME
Term
SOFR
at
0.00%
Floor
+
3.25%),
8.10
%
-
8.50
%
,
05/31/31
(c)
54
54,554
Chemicals
—
0.1%
(c)
Aruba
Investments
Holdings
LLC,
2nd
Lien
Term
Loan
,
(1-mo.
CME
Term
SOFR
at
0.75%
Floor
+
7.75%),
12.70
%
-
13.10
%
,
11/24/28
.................
12
11,450
Chemours
Co.
(The),
1st
Lien
Term
Loan
B
,
(1-mo.
CME
Term
SOFR
at
0.50%
Floor
+
3.50%),
8.35
%
-
8.75
%
,
08/18/28
.......
39
39,380
50,830
Commercial
Services
&
Supplies
—
0.2%
(c)
Allied
Universal
Holdco
LLC,
1st
Lien
Term
Loan
,
(1-mo.
CME
Term
SOFR
at
0.50%
Floor
+
3.75%),
8.70
%
-
9.10
%
,
05/12/28
.
72
70,892
GFL
Environmental,
Inc.,
1st
Lien
Term
Loan
,
(3-mo.
CME
Term
SOFR
at
0.50%
Floor
+
2.00%),
7.32
%
-
7.46
%
,
07/03/31
.......
15
14,650
85,542
2024
BlackRock
Annual
Financial
Statements
and
Additional
Information
Schedule
of
Investments
(continued)
September
30,
2024
BlackRock
Sustainable
High
Yield
Bond
Fund
(Percentages
shown
are
based
on
Net
Assets)
Security
Par
(000)
Par
(000)
Value
Containers
&
Packaging
—
0.0%
Mauser
Packaging
Solutions
Holding
Co.,
Facility
1st
Lien
Term
Loan
,
(1-mo.
CME
Term
SOFR
at
0.00%
Floor
+
3.50%),
8.70
%
,
04/15/27
(c)
.................
USD
19
$
18,534
Diversified
Consumer
Services
—
0.5%
(c)
Ascend
Learning
LLC,
1st
Lien
Term
Loan
,
(1-mo.
CME
Term
SOFR
at
0.50%
Floor
+
3.50%),
8.85
%
,
12/11/28
.............
20
20,002
Ascend
Learning
LLC,
2nd
Lien
Term
Loan
,
(1-mo.
CME
Term
SOFR
at
0.50%
Floor
+
5.75%),
10.70
%
-
11.10
%
,
12/10/29
.....
29
28,021
Wand
Newco
3,
Inc.,
1st
Lien
Term
Loan
,
(1-mo.
CME
Term
SOFR
at
0.00%
Floor
+
3.25%),
7.85
%
-
8.50
%
,
01/30/31
............
158
158,190
206,213
Diversified
Telecommunication
Services
—
0.7%
(c)
Frontier
Communications
Holdings
LLC,
1st
Lien
Term
Loan
,
(6-mo.
CME
Term
SOFR
at
0.00%
Floor
+
3.50%),
8.71
%
-
8.76
%
,
07/01/31
..................
16
16,080
Level
3
Financing,
Inc.,
1st
Lien
Term
Loan
B1
,
(1-mo.
CME
Term
SOFR
at
2.00%
Floor
+
6.56%),
11.41
%
,
04/16/29
............
7
7,620
Level
3
Financing,
Inc.,
1st
Lien
Term
Loan
B2
,
(1-mo.
CME
Term
SOFR
at
2.00%
Floor
+
6.56%),
11.41
%
,
04/15/30
............
8
7,650
Lumen
Technologies,
Inc.,
1st
Lien
Term
Loan
A
,
(1-mo.
CME
Term
SOFR
at
2.00%
Floor
+
6.00%),
10.85
%
-
11.25
%
,
06/01/28
.....
8
7,978
Radiate
HoldCo
LLC,
1st
Lien
Term
Loan
,
(1-mo.
CME
Term
SOFR
at
0.75%
Floor
+
3.25%),
8.21
%
-
8.61
%
,
09/25/26
.......
159
136,297
Windstream
Services
LLC,
1st
Lien
Term
Loan
B
,
09/25/31
(g)
(h)
...................
25
25,000
Zayo
Group
Holdings,
Inc.,
1st
Lien
Term
Loan
,
03/09/27
(g)
......................
137
124,717
325,342
Entertainment
—
0.0%
Motion
Finco
SARL,
Facility
1st
Lien
Term
Loan
B3
,
(3-mo.
CME
Term
SOFR
at
0.00%
Floor
+
3.50%),
8.10
%
-
8.84
%
,
11/13/29
(c)
....
18
17,336
Financial
Services
—
0.2%
(c)
Neon
Maple
US
Debt
Mergersub,
Inc.,
1st
Lien
Term
Loan
,
07/18/31
(g)
..............
73
72,179
Vortex
Opco
LLC,
1st
Lien
Term
Loan
,
(3-mo.
CME
Term
SOFR
at
0.50%
Floor
+
4.25%),
9.12
%
,
12/18/28
..................
32
22,857
95,036
Food
Products
—
0.1%
Chobani
LLC,
1st
Lien
Term
Loan
,
(1-mo.
CME
Term
SOFR
at
0.00%
Floor
+
3.75%),
8.60
%
-
9.09
%
,
10/25/27
(c)
................
37
37,296
Ground
Transportation
—
0.1%
Genesee
&
Wyoming,
Inc.,
1st
Lien
Term
Loan
,
(3-mo.
CME
Term
SOFR
at
0.00%
Floor
+
2.00%),
6.60
%
-
7.34
%
,
04/10/31
(c)
......
62
62,160
Security
Par
(000)
Par
(000)
Value
Health
Care
Equipment
&
Supplies
—
0.3%
(c)
Bausch
&
Lomb,
Inc.,
1st
Lien
Term
Loan
,
(1-mo.
CME
Term
SOFR
at
0.50%
Floor
+
3.25%),
8.27
%
,
05/10/27
............
USD
74
$
73,804
Bausch
+
Lomb
Corp.,
1st
Lien
Term
Loan
,
(1-mo.
CME
Term
SOFR
at
0.00%
Floor
+
4.00%),
8.85
%
-
9.25
%
,
09/29/28
.......
45
44,467
118,271
Health
Care
Providers
&
Services
—
0.4%
(c)
Lifepoint
Health,
Inc.,
1st
Lien
Term
Loan
,
(1-mo.
CME
Term
SOFR
at
0.00%
Floor
+
4.00%),
8.96
%
-
9.01
%
,
05/19/31
.......
35
34,947
Lifepoint
Health,
Inc.,
1st
Lien
Term
Loan
B
(3-mo.
CME
Term
SOFR
at
0.00%
Floor
+
4.75%),
10.05
%
,
11/16/28
..........
13
13,199
05/16/31
(g)
......................
41
40,749
Medline
Borrower
LP,
1st
Lien
Term
Loan
,
(1-mo.
CME
Term
SOFR
at
0.50%
Floor
+
2.25%),
7.10
%
-
7.74
%
,
10/23/28
.......
93
92,467
Surgery
Center
Holdings,
Inc.,
1st
Lien
Term
Loan
,
(1-mo.
CME
Term
SOFR
at
0.00%
Floor
+
2.75%),
7.67
%
-
7.99
%
,
12/19/30
.
5
5,132
186,494
Health
Care
Technology
—
0.8%
AthenaHealth
Group,
Inc.,
1st
Lien
Term
Loan
,
(1-mo.
CME
Term
SOFR
at
0.50%
Floor
+
3.25%),
8.50
%
,
02/15/29
(c)
...........
353
350,800
Hotels,
Restaurants
&
Leisure
—
0.1%
1011778
BC
Unlimited
Liability
Co.,
1st
Lien
Term
Loan
B5
,
(1-mo.
CME
Term
SOFR
at
0.00%
Floor
+
1.75%),
6.60
%
-
7.00
%
,
09/20/30
(c)
.................
62
61,160
Household
Durables
—
0.1%
SWF
Holdings
I
Corp.,
1st
Lien
Term
Loan
,
(1-mo.
CME
Term
SOFR
at
0.75%
Floor
+
4.00%),
8.96
%
-
9.36
%
,
10/06/28
(c)
......
71
58,482
Industrial
Conglomerates
—
0.1%
EMRLD
Borrower
LP,
1st
Lien
Term
Loan
,
(3-mo.
CME
Term
SOFR
at
0.00%
Floor
+
2.50%),
7.56
%
-
7.73
%
,
08/04/31
(c)
......
22
22,361
Insurance
—
0.4%
(c)
Alliant
Holdings
Intermediate
LLC,
1st
Lien
Term
Loan
,
09/19/31
(g)
..................
25
24,851
AssuredPartners,
Inc.,
1st
Lien
Term
Loan
,
(1-mo.
CME
Term
SOFR
at
0.50%
Floor
+
3.50%),
8.35
%
-
8.75
%
,
02/14/31
.......
59
59,419
Truist
Insurance
Holdings,
Inc.,
1st
Lien
Term
Loan
,
(3-mo.
CME
Term
SOFR
at
0.00%
Floor
+
3.25%),
7.85
%
-
8.59
%
,
05/06/31
.
114
113,715
197,985
IT
Services
—
0.5%
(c)
Central
Parent
LLC,
1st
Lien
Term
Loan
,
(3-mo.
CME
Term
SOFR
at
0.00%
Floor
+
3.25%),
7.85
%
-
8.59
%
,
07/06/29
............
47
46,032
Fortress
Intermediate
3,
Inc.,
1st
Lien
Term
Loan
,
(1-mo.
CME
Term
SOFR
at
0.00%
Floor
+
3.75%),
8.60
%
-
9.00
%
,
06/27/31
.
135
134,663
Neptune
Bidco
US,
Inc.,
1st
Lien
Term
Loan
B
,
04/11/29
(g)
......................
41
37,986
Schedule
of
Investments
(continued)
September
30,
2024
BlackRock
Sustainable
High
Yield
Bond
Fund
(Percentages
shown
are
based
on
Net
Assets)
Security
Par
(000)
Par
(000)
Value
IT
Services
(continued)
Project
Alpha
Intermediate
Holding,
Inc.,
1st
Lien
Term
Loan
,
(3-mo.
CME
Term
SOFR
at
0.50%
Floor
+
3.75%),
9.00
%
,
10/28/30
..
USD
20
$
19,907
238,588
Life
Sciences
Tools
&
Services
—
0.2%
Star
Parent,
Inc.,
1st
Lien
Term
Loan
,
09/27/30
(c)
(g)
.....................
98
95,497
Machinery
—
0.4%
(c)
TK
Elevator
Midco
GmbH,
1st
Lien
Term
Loan
C
,
(6-mo.
CME
Term
SOFR
at
0.50%
Floor
+
3.50%),
8.59
%
,
04/30/30
............
169
169,444
Wec
US
Holdings
Ltd.,
1st
Lien
Term
Loan
,
(1-mo.
CME
Term
SOFR
at
0.00%
Floor
+
2.75%),
7.60
%
-
8.00
%
,
01/27/31
.......
11
11,321
180,765
Media
—
0.7%
(c)
Altice
France
SA,
1st
Lien
Term
Loan
B14
,
(3-mo.
CME
Term
SOFR
at
0.00%
Floor
+
5.50%),
10.80
%
,
08/15/28
............
185
137,967
Clear
Channel
Outdoor
Holdings,
Inc.,
1st
Lien
Term
Loan
,
(1-mo.
CME
Term
SOFR
at
0.00%
Floor
+
4.00%),
8.96
%
-
9.36
%
,
08/23/28
..................
146
145,144
CSC
Holdings
LLC,
1st
Lien
Term
Loan
B5
,
(6-mo.
CME
Term
SOFR
at
0.00%
Floor
+
2.50%),
7.17
%
-
7.71
%
,
04/15/27
.......
5
4,729
Gray
Television,
Inc.,
1st
Lien
Term
Loan
B
,
(1-mo.
CME
Term
SOFR
at
0.00%
Floor
+
5.25%),
10.45
%
-
10.49
%
,
05/23/29
.....
30
28,684
Univision
Communications,
Inc.,
1st
Lien
Term
Loan
,
(1-mo.
CME
Term
SOFR
at
0.50%
Floor
+
3.50%),
8.46
%
-
8.86
%
,
01/23/29
.
15
15,057
331,581
Passenger
Airlines
—
0.0%
AAdvantage
Loyalty
IP
Ltd.,
1st
Lien
Term
Loan
,
(3-mo.
CME
Term
SOFR
at
0.75%
Floor
+
4.75%),
10.29
%
,
04/20/28
(c)
...........
1
906
Pharmaceuticals
—
0.1%
(c)
Bausch
Health
Cos.,
Inc.,
1st
Lien
Term
Loan
,
02/01/27
(g)
......................
53
51,133
Organon
&
Co.,
1st
Lien
Term
Loan
,
(1-mo.
CME
Term
SOFR
at
0.50%
Floor
+
2.50%),
7.46
%
-
7.74
%
,
05/19/31
............
3
3,282
54,415
Professional
Services
—
0.0%
CoreLogic,
Inc.,
1st
Lien
Term
Loan
,
(1-mo.
CME
Term
SOFR
at
0.50%
Floor
+
3.50%),
8.46
%
-
8.86
%
,
06/02/28
(c)
...........
14
13,629
Real
Estate
Management
&
Development
—
0.0%
Cushman
&
Wakefield
US
Borrower
LLC,
1st
Lien
Term
Loan
,
(1-mo.
CME
Term
SOFR
at
0.50%
Floor
+
3.75%),
8.60
%
-
9.00
%
,
01/31/30
(c)
.................
3
3,470
Security
Par
(000)
Par
(000)
Value
Software
—
1.5%
(c)
Boxer
Parent
Co.,
Inc.,
1st
Lien
Term
Loan
,
(3-mo.
CME
Term
SOFR
at
0.00%
Floor
+
3.75%),
8.96
%
-
9.01
%
,
07/30/31
.......
USD
200
$
199,038
Boxer
Parent
Co.,
Inc.,
2nd
Lien
Term
Loan
,
(3-mo.
CME
Term
SOFR
at
0.00%
Floor
+
5.75%),
10.98
%
-
11.01
%
,
07/02/32
.....
45
44,269
Cast
&
Crew
LLC,
Facility
1st
Lien
Term
Loan
,
(1-mo.
CME
Term
SOFR
at
0.50%
Floor
+
3.75%),
8.60
%
-
9.00
%
,
12/29/28
.......
36
35,914
Cloud
Software
Group,
Inc.,
1st
Lien
Term
Loan
,
(3-mo.
CME
Term
SOFR
at
0.50%
Floor
+
4.50%),
9.10
%
-
9.84
%
,
03/21/31
.......
81
81,169
Cloud
Software
Group,
Inc.,
Facility
1st
Lien
Term
Loan
B
,
(3-mo.
CME
Term
SOFR
at
0.50%
Floor
+
4.00%),
8.60
%
-
9.34
%
,
03/30/29
..................
135
134,238
Genesys
Cloud
Services
Holdings
II
LLC,
1st
Lien
Term
Loan
,
(1-mo.
CME
Term
SOFR
at
0.75%
Floor
+
3.75%),
8.71
%
-
9.11
%
,
12/01/27
..................
38
38,288
McAfee
Corp.,
1st
Lien
Term
Loan
B1
,
(1-mo.
CME
Term
SOFR
at
0.50%
Floor
+
3.25%),
8.45
%
-
8.49
%
,
03/01/29
............
36
36,093
Sabre
GLBL,
Inc.,
1st
Lien
Term
Loan
B1
,
(1-mo.
CME
Term
SOFR
at
0.50%
Floor
+
3.50%),
8.46
%
-
8.86
%
,
12/17/27
.......
7
6,286
Sabre
GLBL,
Inc.,
1st
Lien
Term
Loan
B2
,
(1-mo.
CME
Term
SOFR
at
0.50%
Floor
+
3.50%),
8.46
%
-
8.86
%
,
12/17/27
.......
11
9,930
UKG,
Inc.,
1st
Lien
Term
Loan
,
(3-mo.
CME
Term
SOFR
at
0.00%
Floor
+
3.25%),
8.55
%
,
02/10/31
..................
79
78,900
664,125
Specialty
Retail
—
0.1%
PetSmart,
Inc.,
1st
Lien
Term
Loan
,
(1-mo.
CME
Term
SOFR
at
0.75%
Floor
+
3.75%),
8.70
%
-
9.10
%
,
02/11/28
(c)
................
32
32,138
Trading
Companies
&
Distributors
—
0.2%
Foundation
Building
Materials,
Inc.,
1st
Lien
Term
Loan
,
(1-mo.
CME
Term
SOFR
at
0.00%
Floor
+
4.00%),
9.25
%
,
01/29/31
(c)
.
93
90,375
Total
Floating
Rate
Loan
Interests
—
8
.4
%
(Cost:
$
3,908,663
)
...............................
3,847,301
Preferred
Securities
Capital
Trusts
—
0.4%
Electric
Utilities
—
0.2%
NRG
Energy,
Inc.
,
(5-Year
US
Treasury
Yield
Curve
Rate
T
Note
Constant
Maturity
+
5.92%),
10.25
%
(b)
(c)
(i)
................
103
116,180
Independent
Power
and
Renewable
Electricity
Producers
—
0.2%
Vistra
Corp.
,
(5-Year
US
Treasury
Yield
Curve
Rate
T
Note
Constant
Maturity
+
5.74%),
7.00
%
(b)
(c)
(i)
......................
82
83,706
Total
Preferred
Securities
—
0
.4
%
(Cost:
$
184,883
)
.................................
199,886
Total
Long-Term
Investments
—
98.3%
(Cost:
$
44,072,975
)
...............................
45,094,058
2024
BlackRock
Annual
Financial
Statements
and
Additional
Information
Schedule
of
Investments
(continued)
September
30,
2024
BlackRock
Sustainable
High
Yield
Bond
Fund
(Percentages
shown
are
based
on
Net
Assets)
Affiliates
Investments
in
issuers
considered
to
be
affiliate(s)
of
the
Fund
during
the year
ended
September
30,
2024
for
purposes
of
Section
2(a)(3)
of
the
Investment
Company
Act
of
1940,
as
amended,
were
as
follows:
Security
Shares
Shares
Value
Short-Term
Securities
Money
Market
Funds
—
2.0%
BlackRock
Liquidity
Funds,
T-Fund,
Institutional
Class
,
4.83
%
(j)
(k)
...................
897,178
$
897,178
Total
Short-Term
Securities
—
2
.0
%
(Cost:
$
897,178
)
.................................
897,178
Total
Investments
—
100
.3
%
(Cost:
$
44,970,153
)
...............................
45,991,236
Liabilities
in
Excess
of
Other
Assets
—
(
0.3
)
%
.............
(
140,357
)
Net
Assets
—
100.0%
...............................
$
45,850,879
(a)
Non-income
producing
security.
(b)
Security
exempt
from
registration
pursuant
to
Rule
144A
under
the
Securities
Act
of
1933,
as
amended.
These
securities
may
be
resold
in
transactions
exempt
from
registration
to
qualified
institutional
investors.
(c)
Variable
rate
security.
Interest
rate
resets
periodically.
The
rate
shown
is
the
effective
interest
rate
as
of
period
end.
Security
description
also
includes
the
reference
rate
and
spread
if
published
and
available.
(d)
Convertible
security.
(e)
Zero-coupon
bond.
(f)
Payment-in-kind
security
which
may
pay
interest/dividends
in
additional
par/shares
and/or
in
cash.
Rates
shown
are
the
current
rate
and
possible
payment
rates.
(g)
Represents
an
unsettled
loan
commitment
at
period
end.
Certain
details
associated
with
this
purchase
are
not
known
prior
to
the
settlement
date,
including
coupon
rate.
(h)
Security
is
valued
using
significant
unobservable
inputs
and
is
classified
as
Level
3
in
the
fair
value
hierarchy.
(i)
Perpetual
security
with
no
stated
maturity
date.
(j)
Affiliate
of
the
Fund.
(k)
Annualized
7-day
yield
as
of
period
end.
Affiliated
Issuer
Value
at
09/30/23
Purchases
at
Cost
Proceeds
from
Sales
Net
Realized
Gain
(Loss)
Change
in
Unrealized
Appreciation
(Depreciation)
Value
at
09/30/24
Shares
Held
at
09/30/24
Income
Capital
Gain
Distributions
from
Underlying
Funds
BlackRock
Liquidity
Funds,
T-Fund,
Institutional
Class
.
$
84,681
$
812,497
(a)
$
—
$
—
$
—
$
897,178
897,178
$
47,737
$
—
—
—
(a)
Represents
net
amount
purchased
(sold).
For
purposes
of
this
report,
industry
and
sector
sub-classifications
may
differ
from
those
utilized
by
the
Fund
for
compliance
purposes.
Schedule
of
Investments
(continued)
September
30,
2024
BlackRock
Sustainable
High
Yield
Bond
Fund
Derivative
Financial
Instruments
Categorized
by
Risk
Exposure
For
more
information
about
the
Fund’s
investment
risks
regarding
derivative
financial
instruments,
refer
to
the
Notes
to
Financial
Statements.
Fair
Value
Hierarchy
as
of Period
End
Various
inputs
are
used
in
determining
the
fair
value
of
financial
instruments
at
the
measurement
date.
For
a
description
of
the
input
levels
and
information
about
the
Fund’s
policy
regarding
valuation
of
financial
instruments,
refer
to
the
Notes
to
Financial
Statements.
The
following
table
summarizes
the
Fund’s
financial
instruments
categorized
in
the
fair
value
hierarchy.
The
breakdown
of
the
Fund's
financial
instruments
into
major
categories
is
disclosed
in
the Schedule
of
Investments
above.
Derivative
Financial
Instruments
Outstanding
as
of
Period
End
Futures
Contracts
Description
Number
of
Contracts
Expiration
Date
Notional
Amount
(000)
Value/
Unrealized
Appreciation
(Depreciation)
Long
Contracts
U.S.
Treasury
5-Year
Note
....................................................
6
12/31/24
$
660
$
1,398
As
of
period
end,
the
fair
values
of
derivative
financial
instruments
located
in
the
Statements
of
Assets
and
Liabilities
were
as
follows:
Commodity
Contracts
Credit
Contracts
Equity
Contracts
Foreign
Currency
Exchange
Contracts
Interest
Rate
Contracts
Other
Contracts
Total
Assets
—
Derivative
Financial
Instruments
Futures
contracts
Unrealized
appreciation
on
futures
contracts
(a)
......
$
—
$
—
$
—
$
—
$
1,398
$
—
$
1,398
(a)
Net
cumulative
unrealized
appreciation
(depreciation)
on
futures
contracts,
if
any,
are
reported
in
the
Schedule
of
Investments.
In
the
Statements
of
Assets
and
Liabilities,
only
current
day’s
variation
margin
is
reported
in
receivables
or
payables
and
the
net
cumulative
unrealized
appreciation
(depreciation)
is
included
in
accumulated
earnings
(loss).
For
the
period
ended
September
30,
2024,
the
effect
of
derivative
financial
instruments
in
the
Statements
of
Operations
was
as
follows:
Commodity
Contracts
Credit
Contracts
Equity
Contracts
Foreign
Currency
Exchange
Contracts
Interest
Rate
Contracts
Other
Contracts
Total
Net
Realized
Gain
(Loss)
from
Futures
c
ontracts
.......................
$
—
$
—
$
(
18,933
)
$
—
$
10,288
$
—
$
(
8,645
)
Net
Change
in
Unrealized
Appreciation
(Depreciation)
on
Futures
c
ontracts
.......................
$
—
$
—
$
—
$
—
$
6,300
$
—
$
6,300
Average
Quarterly
Balances
of
Outstanding
Derivative
Financial
Instruments
Futures
contracts
Average
notional
value
of
contracts
—
long
..................................................................................
$
648,387
Level
1
Level
2
Level
3
Total
Assets
Investments
Long-Term
Investments
Common
Stocks
.........................................
$
92,863
$
—
$
—
$
92,863
Corporate
Bonds
........................................
—
40,739,628
—
40,739,628
Fixed
Rate
Loan
Interests
...................................
—
214,380
—
214,380
Floating
Rate
Loan
Interests
Air
Freight
&
Logistics
....................................
—
42,369
—
42,369
Automobile
Components
..................................
—
72,000
—
72,000
2024
BlackRock
Annual
Financial
Statements
and
Additional
Information
Schedule
of
Investments
(continued)
September
30,
2024
BlackRock
Sustainable
High
Yield
Bond
Fund
See
notes
to
financial
statements.
Level
1
Level
2
Level
3
Total
Building
Products
.......................................
$
—
$
79,047
$
—
$
79,047
Capital
Markets
........................................
—
54,554
—
54,554
Chemicals
............................................
—
50,830
—
50,830
Commercial
Services
&
Supplies
.............................
—
85,542
—
85,542
Containers
&
Packaging
..................................
—
18,534
—
18,534
Diversified
Consumer
Services
..............................
—
206,213
—
206,213
Diversified
Telecommunication
Services
........................
—
300,342
25,000
325,342
Entertainment
.........................................
—
17,336
—
17,336
Financial
Services
......................................
—
95,036
—
95,036
Food
Products
.........................................
—
37,296
—
37,296
Ground
Transportation
...................................
—
62,160
—
62,160
Health
Care
Equipment
&
Supplies
...........................
—
118,271
—
118,271
Health
Care
Providers
&
Services
............................
—
186,494
—
186,494
Health
Care
Technology
..................................
—
350,800
—
350,800
Hotels,
Restaurants
&
Leisure
..............................
—
61,160
—
61,160
Household
Durables
.....................................
—
58,482
—
58,482
Industrial
Conglomerates
..................................
—
22,361
—
22,361
Insurance
............................................
—
197,985
—
197,985
IT
Services
...........................................
—
238,588
—
238,588
Life
Sciences
Tools
&
Services
..............................
—
95,497
—
95,497
Machinery
............................................
—
180,765
—
180,765
Media
...............................................
—
331,581
—
331,581
Passenger
Airlines
......................................
—
906
—
906
Pharmaceuticals
.......................................
—
54,415
—
54,415
Professional
Services
....................................
—
13,629
—
13,629
Real
Estate
Management
&
Development
.......................
—
3,470
—
3,470
Software
.............................................
—
664,125
—
664,125
Specialty
Retail
........................................
—
32,138
—
32,138
Trading
Companies
&
Distributors
............................
—
90,375
—
90,375
Preferred
Securities
.......................................
—
199,886
—
199,886
Short-Term
Securities
Money
Market
Funds
......................................
897,178
—
—
897,178
$
990,041
$
44,976,195
$
25,000
$
45,991,236
Derivative
Financial
Instruments
(a)
Assets
Interest
rate
contracts
.......................................
$
1,398
$
—
$
—
$
1,398
(a)
Derivative
financial
instruments
are
futures
contracts.
Futures
contracts
are
valued
at
the
unrealized
appreciation
(depreciation)
on
the
instrument.
Fair
Value
Hierarchy
as
of Period
End
(continued)
Schedule
of
Investments
September
30,
2024
BlackRock
Sustainable
Total
Return
Fund
(Percentages
shown
are
based
on
Net
Assets)
Security
Par
(000)
Pa
r
(
000)
Value
Asset-Backed
Securities
Cayman
Islands
—
5.0%
(a)(b)
AGL
Core
CLO
4
Ltd.,
Series
2020-4A,
Class
AR2,
(3-mo.
CME
Term
SOFR
at
1.38%
Floor
+
1.38%),
6.15%,
10/20/37
.................
USD
250
$
250,082
Anchorage
Capital
CLO
8
Ltd.,
Series
2016-8A,
Class
BR2,
(3-mo.
CME
Term
SOFR
at
1.80%
Floor
+
2.06%),
7.33%,
10/27/34
.......
250
250,997
Bridge
Street
CLO
II
Ltd.,
Series
2021-
1A,
Class
A1A,
(3-mo.
CME
Term
SOFR
at
1.23%
Floor
+
1.49%),
6.77%,
07/20/34
............
250
250,069
CIFC
Funding
Ltd.,
Series
2020-3A,
Class
A1R,
(3-mo.
CME
Term
SOFR
at
1.39%
Floor
+
1.39%),
6.67%,
10/20/34
.................
250
250,097
Madison
Park
Funding
XIX
Ltd.,
Series
2015-19A,
Class
AR3,
(3-mo.
CME
Term
SOFR
at
1.60%
Floor
+
1.60%),
6.88%,
01/22/37
.......
250
250,765
Neuberger
Berman
Loan
Advisers
CLO
35
Ltd.,
Series
2019-35A,
Class
CR,
(3-mo.
CME
Term
SOFR
at
2.30%
Floor
+
2.30%),
7.58%,
01/19/33
.
250
251,184
Palmer
Square
CLO
Ltd.,
Series
2021-
3A,
Class
A1,
(3-mo.
CME
Term
SOFR
at
1.41%
Floor
+
1.41%),
6.71%,
01/15/35
............
250
250,263
Pikes
Peak
CLO
8,
Series
2021-8A,
Class
B,
(3-mo.
CME
Term
SOFR
at
1.75%
Floor
+
2.01%),
7.29%,
07/20/34
.................
250
251,096
Trimaran
CAVU
Ltd.,
Series
2021-2A,
Class
D1,
(3-mo.
CME
Term
SOFR
at
3.25%
Floor
+
3.51%),
8.80%,
10/25/34
.................
250
250,593
2,255,146
Ireland
—
0.2%
Prodigy
Finance
DAC,
Series
2021-1A,
Class
A,
(1-mo.
CME
Term
SOFR
at
0.00%
Floor
+
1.36%),
6.22%,
07/25/51
(a)
(b)
...............
96
95,242
United
States
—
5.4%
BDS
LLC,
Series
2024-FL13,
Class
A,
(1-mo.
CME
Term
SOFR
at
1.58%
Floor
+
1.58%),
6.78%,
09/19/39
(a)
(b)
100
99,749
Diameter
Capital
CLO
1
Ltd.,
Series
2021-1A,
Class
A1A,
(3-mo.
CME
Term
SOFR
at
1.50%
Floor
+
1.50%),
6.80%,
07/15/36
(a)
(b)
....
250
250,342
Home
Partners
of
America
Trust,
Series
2021-2,
Class
F,
3.80%,
12/17/26
(a)
480
449,590
Legacy
Mortgage
Asset
Trust,
Series
2019-SL2,
Class
M,
4.25%,
02/25/59
(a)
(b)
...............
220
204,678
Lendmark
Funding
Trust,
Series
2022-
1A,
Class
A,
5.12%,
07/20/32
(a)
..
100
100,237
Long
Beach
Mortgage
Loan
Trust,
Series
2006-2,
Class
1A,
(1-mo.
CME
Term
SOFR
at
0.36%
Floor
+
0.47%),
5.33%,
03/25/46
(b)
.....
119
95,768
Security
Par
(000)
Par
(000)
Value
United
States
(continued)
MF1
LLC,
Series
2023-FL12,
Class
A,
(1-mo.
CME
Term
SOFR
at
2.07%
Floor
+
2.07%),
7.03%,
10/19/38
(a)
(b)
USD
100
$
100,250
Navient
Private
Education
Loan
Trust,
Series
2015-AA,
Class
A3,
(1-mo.
CME
Term
SOFR
at
0.00%
Floor
+
1.81%),
6.91%,
11/15/30
(a)
(b)
....
43
42,889
Navient
Private
Education
Refi
Loan
Trust,
Series
2024-A,
Class
A,
5.66%,
10/15/72
(a)
...........
95
97,127
PRET
LLC,
Series
2021-NPL6,
Class
A1,
2.49%,
07/25/51
(a)
(c)
.......
127
126,713
Progress
Residential
Trust,
Series
2021-SFR10,
Class
F,
4.61%,
12/17/40
(a)
................
473
444,088
Ready
Capital
Mortgage
Financing
LLC,
Series
2023-FL11,
Class
A,
(1-mo.
CME
Term
SOFR
at
2.37%
Floor
+
2.37%),
7.23%,
10/25/39
(a)
(b)
29
28,856
Redwood
Funding
Trust,
Series
2023-1,
Class
A,
7.50%,
07/25/59
(a)
(c)
....
85
84,762
Regional
Management
Issuance
Trust
(a)
Series
2020-1,
Class
A,
2.34%,
10/15/30
...............
13
12,619
Series
2021-1,
Class
A,
1.68%,
03/17/31
...............
44
43,337
Series
2021-2,
Class
A,
1.90%,
08/15/33
...............
100
93,427
Sesac
Finance
LLC,
Series
2019-1,
Class
A2,
5.22%,
07/25/49
(a)
....
48
47,286
SMB
Private
Education
Loan
Trust,
Series
2021-A,
Class
B,
2.31%,
01/15/53
(a)
................
86
81,743
Subway
Funding
LLC,
Series
2024-1A,
Class
A2II,
6.27%,
07/30/54
(a)
...
30
30,982
2,434,443
Total
Asset-Backed
Securities
—
10.6%
(Cost:
$
4,790,076
)
..............................
4,784,831
Shares
Shares
Common
Stocks
United
States
—
0.1%
Blackstone
Mortgage
Trust,
Inc.
,
Class
A
(d)
.....................
1,198
22,774
Invitation
Homes,
Inc.
...........
307
10,825
33,599
Total
Common
Stocks
—
0.1%
(Cost:
$
32,432
)
................................
33,599
Par
(000)
Pa
r
(
000)
Corporate
Bonds
Belgium
—
0.2%
KBC
Group
NV
,
(3-mo.
EURIBOR
+
0.72%),
0.38%
,
06/16/27
(b)
(e)
....
EUR
100
106,884
2024
BlackRock
Annual
Financial
Statements
and
Additional
Information
Schedule
of
Investments
(continued)
September
30,
2024
BlackRock
Sustainable
Total
Return
Fund
(Percentages
shown
are
based
on
Net
Assets)
Security
Par
(000)
Par
(000)
Value
Canada
—
0.4%
Algonquin
Power
&
Utilities
Corp.
,
5.37%
,
06/15/26
(c)
...........
USD
30
$
30,363
Canadian
Pacific
Railway
Co.
,
4.80%
,
08/01/45
.................
15
14,372
Enbridge,
Inc.
,
5.70%
,
03/08/33
....
39
41,104
Rogers
Communications,
Inc.
,
5.30%
,
02/15/34
.................
75
76,302
162,141
China
—
0.1%
NXP
BV
5.55%
,
12/01/28
............
32
33,223
3.40%
,
05/01/30
............
5
4,719
37,942
France
—
1.7%
(e)
Banque
Federative
du
Credit
Mutuel
SA
0.10%
,
10/08/27
............
EUR
100
102,862
4.13%
,
09/18/30
............
200
235,109
BNP
Paribas
SA
(b)
(3-mo.
EURIBOR
+
0.80%),
0.38%
,
10/14/27
...............
100
105,469
(3-mo.
EURIBOR
+
1.60%),
4.75%
,
11/13/32
...............
100
119,478
Elis
SA
,
3.75%
,
03/21/30
........
100
112,238
Engie
SA
,
1.75%
,
03/27/28
.......
100
107,209
782,365
Germany
—
1.2%
Deutsche
Bank
AG
,
(1-day
SOFR
+
5.44%),
5.88%
,
07/08/31
(b)
.....
USD
200
205,366
E.ON
SE
,
1.00%
,
10/07/25
(e)
......
EUR
100
109,212
Eurogrid
GmbH
,
3.92%
,
02/01/34
(e)
..
100
114,383
Sartorius
Finance
BV
,
4.50%
,
09/14/32
(e)
................
100
117,394
546,355
Italy
—
0.5%
(e)
Iren
SpA
,
1.95%
,
09/19/25
.......
100
110,135
Snam
SpA
,
3.38%
,
02/19/28
......
100
112,903
223,038
Spain
—
0.5%
(b)(e)
Banco
de
Sabadell
SA
,
(1-Year
EUR
Swap
Annual
+
1.60%),
4.00%
,
01/15/30
.................
100
115,276
CaixaBank
SA
,
(3-mo.
EURIBOR
+
0.85%),
0.38%
,
11/18/26
.......
100
107,807
223,083
Switzerland
—
0.7%
UBS
AG
(e)
0.45%
,
05/19/25
............
100
109,348
0.01%
,
06/29/26
............
200
212,508
321,856
United
Kingdom
—
0.3%
RELX
Capital,
Inc.
,
3.00%
,
05/22/30
.
USD
13
12,171
SSE
plc
,
0.88%
,
09/06/25
(e)
.......
EUR
100
109,233
121,404
United
States
—
27.9%
AbbVie,
Inc.
5.05%
,
03/15/34
............
USD
121
126,387
4.55%
,
03/15/35
............
30
30,008
4.70%
,
05/14/45
............
31
29,998
5.40%
,
03/15/54
............
15
15,905
Security
Par
(000)
Par
(000)
Value
United
States
(continued)
Advanced
Micro
Devices,
Inc.
,
4.39%
,
06/01/52
.................
USD
32
$
29,788
AEP
Texas,
Inc.
3.95%
,
06/01/28
............
51
50,329
5.25%
,
05/15/52
............
22
21,494
Agilent
Technologies,
Inc.
,
3.05%
,
09/22/26
.................
37
36,117
American
Express
Co.
,
(1-day
SOFR
+
0.93%),
5.04%
,
07/26/28
(b)
.....
25
25,543
American
International
Group,
Inc.
,
4.75%
,
04/01/48
............
8
7,583
American
Tower
Corp.
3.80%
,
08/15/29
............
355
345,387
2.10%
,
06/15/30
............
30
26,422
Amgen,
Inc.
4.05%
,
08/18/29
............
18
17,873
4.40%
,
02/22/62
............
30
25,675
5.75%
,
03/02/63
............
66
69,665
Associated
Banc-Corp.
,
(1-day
SOFR
+
3.03%),
6.46%
,
08/29/30
(b)
.....
20
20,561
AT&T,
Inc.
5.25%
,
03/01/37
............
4
4,123
4.75%
,
05/15/46
............
59
55,207
4.50%
,
03/09/48
............
64
56,747
3.50%
,
09/15/53
............
20
14,694
3.80%
,
12/01/57
............
30
22,714
3.65%
,
09/15/59
............
134
97,225
Baltimore
Gas
&
Electric
Co.
3.50%
,
08/15/46
............
14
10,986
5.40%
,
06/01/53
............
42
43,521
Bank
of
America
Corp.
(b)
(1-day
SOFR
+
1.99%),
6.20%
,
11/10/28
...............
50
52,778
(1-day
SOFR
+
1.57%),
5.82%
,
09/15/29
...............
50
52,619
(3-mo.
CME
Term
SOFR
+
1.25%),
2.50%
,
02/13/31
..........
23
20,851
(1-day
SOFR
+
1.65%),
5.47%
,
01/23/35
...............
29
30,496
(1-day
SOFR
+
1.93%),
2.68%
,
06/19/41
...............
20
15,038
(3-mo.
CME
Term
SOFR
+
3.41%),
4.08%
,
03/20/51
..........
40
34,749
(1-day
SOFR
+
1.56%),
2.97%
,
07/21/52
...............
16
11,356
Becton
Dickinson
&
Co.
,
4.67%
,
06/06/47
.................
12
11,155
Berry
Global,
Inc.
,
1.65%
,
01/15/27
..
101
94,816
Blackstone
Secured
Lending
Fund
,
5.88%
,
11/15/27
............
11
11,185
Bristol-Myers
Squibb
Co.
5.10%
,
02/22/31
............
15
15,707
6.25%
,
11/15/53
............
11
12,742
Broadcom,
Inc.
4.30%
,
11/15/32
............
30
29,467
2.60%
,
02/15/33
(a)
...........
106
90,868
3.42%
,
04/15/33
(a)
...........
38
34,527
Burlington
Northern
Santa
Fe
LLC
5.40%
,
06/01/41
............
15
15,734
3.30%
,
09/15/51
............
18
13,616
5.20%
,
04/15/54
............
47
48,584
5.50%
,
03/15/55
............
10
10,786
Cameron
LNG
LLC
,
3.30%
,
01/15/35
(a)
209
180,368
Schedule
of
Investments
(continued)
September
30,
2024
BlackRock
Sustainable
Total
Return
Fund
(Percentages
shown
are
based
on
Net
Assets)
Security
Par
(000)
Par
(000)
Value
United
States
(continued)
CenterPoint
Energy
Houston
Electric
LLC
Series
AE
,
2.35%
,
04/01/31
.....
USD
10
$
8,788
Series
AF
,
3.35%
,
04/01/51
.....
15
11,156
Charter
Communications
Operating
LLC
,
4.80%
,
03/01/50
.........
94
71,964
Citigroup,
Inc.
(b)
(3-mo.
CME
Term
SOFR
+
1.41%),
3.52%
,
10/27/28
..........
5
4,881
(1-day
SOFR
+
1.36%),
5.17%
,
02/13/30
...............
10
10,272
(1-day
SOFR
+
1.18%),
2.52%
,
11/03/32
...............
85
73,773
(1-day
SOFR
+
1.35%),
3.06%
,
01/25/33
...............
5
4,466
(1-day
SOFR
+
2.09%),
4.91%
,
05/24/33
...............
39
39,311
(1-day
SOFR
+
1.45%),
5.45%
,
06/11/35
...............
70
73,011
CNH
Industrial
Capital
LLC
3.95%
,
05/23/25
............
350
347,679
5.45%
,
10/14/25
............
71
71,665
Coca-Cola
Co.
(The)
,
5.40%
,
05/13/64
14
14,984
Comcast
Corp.
3.25%
,
09/26/32
............
EUR
100
111,897
4.65%
,
02/15/33
............
USD
30
30,429
2.94%
,
11/01/56
............
32
20,914
2.99%
,
11/01/63
............
41
26,007
5.50%
,
05/15/64
............
12
12,408
Crown
Castle,
Inc.
3.10%
,
11/15/29
............
321
300,387
2.25%
,
01/15/31
............
25
21,678
CVS
Health
Corp.
4.78%
,
03/25/38
............
43
40,571
5.05%
,
03/25/48
............
18
16,429
Deere
&
Co.
,
3.75%
,
04/15/50
.....
9
7,666
Dell
International
LLC
,
4.90%
,
10/01/26
92
92,954
Edison
International
5.75%
,
06/15/27
............
58
59,855
5.25%
,
11/15/28
............
30
30,823
6.95%
,
11/15/29
............
46
50,703
Elevance
Health,
Inc.
4.55%
,
03/01/48
............
29
26,155
5.13%
,
02/15/53
............
5
4,906
Eli
Lilly
&
Co.
4.88%
,
02/27/53
............
5
5,006
5.20%
,
08/14/64
............
5
5,160
Equinix,
Inc.
3.20%
,
11/18/29
............
294
277,506
2.15%
,
07/15/30
............
6
5,303
3.90%
,
04/15/32
............
70
67,029
Eversource
Energy
,
5.45%
,
03/01/28
55
57,021
Extra
Space
Storage
LP
5.50%
,
07/01/30
............
10
10,454
2.35%
,
03/15/32
............
2
1,688
FactSet
Research
Systems,
Inc.
,
3.45%
,
03/01/32
............
8
7,299
FirstEnergy
Transmission
LLC
,
4.55%
,
04/01/49
(a)
................
114
102,538
Florida
Power
&
Light
Co.
,
5.60%
,
06/15/54
.................
15
16,358
Gartner,
Inc.
,
4.50%
,
07/01/28
(a)
....
420
415,699
GATX
Corp.
,
6.05%
,
06/05/54
.....
5
5,406
General
Motors
Financial
Co.,
Inc.
2.75%
,
06/20/25
............
80
78,715
Security
Par
(000)
Par
(000)
Value
United
States
(continued)
5.85%
,
04/06/30
............
USD
2
$
2,084
5.75%
,
02/08/31
............
48
49,629
5.60%
,
06/18/31
............
15
15,402
6.40%
,
01/09/33
............
8
8,531
6.10%
,
01/07/34
............
11
11,456
Gilead
Sciences,
Inc.
1.65%
,
10/01/30
............
40
34,535
4.00%
,
09/01/36
............
14
13,162
2.60%
,
10/01/40
............
25
18,711
4.80%
,
04/01/44
............
58
56,028
Global
Payments,
Inc.
5.30%
,
08/15/29
............
14
14,391
2.90%
,
05/15/30
............
16
14,573
Goldman
Sachs
Group,
Inc.
(The)
(1-day
SOFR
+
1.11%),
2.64%
,
02/24/28
(b)
..............
4
3,845
(1-day
SOFR
+
1.85%),
3.62%
,
03/15/28
(b)
..............
4
3,935
(3-mo.
CME
Term
SOFR
+
1.42%),
3.81%
,
04/23/29
(b)
.........
96
94,118
3.80%
,
03/15/30
............
96
93,392
(1-day
SOFR
+
1.27%),
5.73%
,
04/25/30
(b)
..............
70
73,567
(1-day
SOFR
+
1.21%),
5.05%
,
07/23/30
(b)
..............
53
54,382
(1-day
SOFR
+
1.25%),
2.38%
,
07/21/32
(b)
..............
51
44,230
(1-day
SOFR
+
1.26%),
2.65%
,
10/21/32
(b)
..............
108
94,886
(1-day
SOFR
+
1.95%),
6.56%
,
10/24/34
(b)
..............
70
79,029
(1-day
SOFR
+
1.55%),
5.85%
,
04/25/35
(b)
..............
51
54,799
(1-day
SOFR
+
1.55%),
5.33%
,
07/23/35
(b)
..............
85
88,050
(3-mo.
CME
Term
SOFR
+
1.69%),
4.41%
,
04/23/39
(b)
.........
6
5,657
6.25%
,
02/01/41
............
3
3,410
(1-day
SOFR
+
1.51%),
3.21%
,
04/22/42
(b)
..............
6
4,784
(1-day
SOFR
+
1.47%),
2.91%
,
07/21/42
(b)
..............
1
760
HCA,
Inc.
3.50%
,
09/01/30
............
184
173,397
5.45%
,
04/01/31
............
104
108,358
5.50%
,
06/15/47
............
35
34,786
Hewlett
Packard
Enterprise
Co.
5.90%
,
10/01/24
............
130
130,000
5.25%
,
07/01/28
............
5
5,155
Home
Depot,
Inc.
(The)
4.95%
,
09/15/52
............
5
4,988
5.30%
,
06/25/54
............
5
5,255
5.40%
,
06/25/64
............
5
5,294
Humana,
Inc.
,
5.50%
,
03/15/53
....
15
14,809
Ingersoll
Rand,
Inc.
,
5.31%
,
06/15/31
4
4,182
Invitation
Homes
Operating
Partnership
LP
5.45%
,
08/15/30
............
5
5,211
2.00%
,
08/15/31
............
2
1,679
JPMorgan
Chase
&
Co.
(b)
(1-day
SOFR
+
1.33%),
6.07%
,
10/22/27
...............
53
54,929
(3-mo.
CME
Term
SOFR
+
1.52%),
4.20%
,
07/23/29
..........
4
3,985
2024
BlackRock
Annual
Financial
Statements
and
Additional
Information
Schedule
of
Investments
(continued)
September
30,
2024
BlackRock
Sustainable
Total
Return
Fund
(Percentages
shown
are
based
on
Net
Assets)
Security
Par
(000)
Par
(000)
Value
United
States
(continued)
(1-day
SOFR
+
1.13%),
5.00%
,
07/22/30
...............
USD
172
$
176,855
(3-mo.
CME
Term
SOFR
+
3.79%),
4.49%
,
03/24/31
..........
136
136,729
(1-day
SOFR
+
1.81%),
6.25%
,
10/23/34
...............
44
48,936
(1-day
SOFR
+
1.62%),
5.34%
,
01/23/35
...............
15
15,679
(1-day
SOFR
+
1.49%),
5.77%
,
04/22/35
...............
55
59,269
(1-day
SOFR
+
1.46%),
5.29%
,
07/22/35
...............
37
38,589
(3-mo.
CME
Term
SOFR
+
1.64%),
3.96%
,
11/15/48
..........
5
4,318
(1-day
SOFR
+
2.44%),
3.11%
,
04/22/51
...............
5
3,694
(1-day
SOFR
+
1.58%),
3.33%
,
04/22/52
...............
38
29,295
Juniper
Networks,
Inc.
,
3.75%
,
08/15/29
.................
16
15,427
KLA
Corp.
3.30%
,
03/01/50
............
48
36,310
4.95%
,
07/15/52
............
6
5,962
Lam
Research
Corp.
,
3.13%
,
06/15/60
8
5,522
Lowe's
Cos.,
Inc.
2.80%
,
09/15/41
............
72
52,867
5.63%
,
04/15/53
............
74
77,024
Marriott
International,
Inc.
5.30%
,
05/15/34
............
81
83,465
5.35%
,
03/15/35
............
30
30,747
Marsh
&
McLennan
Cos.,
Inc.
,
5.45%
,
03/15/53
.................
11
11,438
Meta
Platforms,
Inc.
,
5.75%
,
05/15/63
104
113,997
MidAmerican
Energy
Co.
,
5.85%
,
09/15/54
.................
109
121,394
Moody's
Corp.
,
3.25%
,
01/15/28
....
39
38,124
Morgan
Stanley
(b)
(1-day
SOFR
+
0.88%),
1.59%
,
05/04/27
...............
319
305,247
(1-day
SOFR
+
1.01%),
5.65%
,
04/13/28
...............
75
77,426
(1-day
SOFR
+
1.63%),
5.45%
,
07/20/29
...............
167
173,529
(1-day
SOFR
+
1.22%),
5.04%
,
07/19/30
...............
90
92,486
(1-day
SOFR
+
3.12%),
3.62%
,
04/01/31
...............
187
179,551
(1-day
SOFR
+
1.58%),
5.83%
,
04/19/35
...............
73
78,413
(1-day
SOFR
+
1.56%),
5.32%
,
07/19/35
...............
136
141,226
Motorola
Solutions,
Inc.
,
5.60%
,
06/01/32
.................
18
19,031
MSCI,
Inc.
,
4.00%
,
11/15/29
(a)
.....
223
216,340
MSD
Netherlands
Capital
BV
,
3.50%
,
05/30/37
.................
EUR
100
112,832
National
Grid
North
America,
Inc.
,
4.67%
,
09/12/33
(e)
...........
100
119,333
Newmont
Corp.
2.80%
,
10/01/29
............
USD
21
19,692
3.25%
,
05/13/30
............
100
94,545
NIKE,
Inc.
,
3.38%
,
03/27/50
.......
6
4,732
NNN
REIT,
Inc.
,
3.50%
,
04/15/51
...
6
4,428
Norfolk
Southern
Corp.
4.15%
,
02/28/48
............
33
28,501
Security
Par
(000)
Par
(000)
Value
United
States
(continued)
5.35%
,
08/01/54
............
USD
57
$
58,561
Northern
States
Power
Co.
4.50%
,
06/01/52
............
10
9,187
5.40%
,
03/15/54
............
8
8,448
Ohio
Power
Co.
Series
P
,
2.60%
,
04/01/30
......
5
4,543
Series
Q
,
1.63%
,
01/15/31
.....
20
16,789
5.00%
,
06/01/33
............
13
13,226
Series
R
,
2.90%
,
10/01/51
.....
37
24,319
Omnicom
Group,
Inc.
,
3.60%
,
04/15/26
82
81,034
ONE
Gas,
Inc.
,
5.10%
,
04/01/29
....
19
19,681
Oracle
Corp.
4.00%
,
07/15/46
............
45
37,329
4.00%
,
11/15/47
............
4
3,284
3.60%
,
04/01/50
............
38
28,930
5.55%
,
02/06/53
............
12
12,280
4.38%
,
05/15/55
............
62
52,917
5.50%
,
09/27/64
............
17
16,935
Otis
Worldwide
Corp.
,
5.25%
,
08/16/28
62
64,246
Owens
Corning
,
3.95%
,
08/15/29
...
33
32,250
Pacific
Gas
&
Electric
Co.
4.95%
,
07/01/50
............
45
40,922
3.50%
,
08/01/50
............
123
89,075
6.75%
,
01/15/53
............
11
12,542
5.90%
,
10/01/54
............
10
10,357
Paramount
Global
3.38%
,
02/15/28
............
3
2,825
5.85%
,
09/01/43
............
9
7,849
5.25%
,
04/01/44
............
5
3,983
4.90%
,
08/15/44
............
3
2,306
4.60%
,
01/15/45
............
2
1,476
(5-Year
US
Treasury
Yield
Curve
Rate
T
Note
Constant
Maturity
+
4.00%),
6.38%
,
03/30/62
(b)
...
3
2,775
PECO
Energy
Co.
3.90%
,
03/01/48
............
7
5,873
2.85%
,
09/15/51
............
29
19,645
4.60%
,
05/15/52
............
26
24,181
5.25%
,
09/15/54
............
5
5,168
Pfizer
Investment
Enterprises
Pte.
Ltd.
4.75%
,
05/19/33
............
23
23,444
5.30%
,
05/19/53
............
39
40,343
PG&E
Corp.
,
(5-Year
US
Treasury
Yield
Curve
Rate
T
Note
Constant
Maturity
+
3.88%),
7.38%
,
03/15/55
(b)
................
15
15,733
Piedmont
Natural
Gas
Co.,
Inc.
,
2.50%
,
03/15/31
.................
11
9,706
Prologis
Targeted
US
Logistics
Fund
LP
,
5.25%
,
01/15/35
(a)
.........
10
10,227
Public
Service
Co.
of
New
Hampshire
,
5.15%
,
01/15/53
............
7
7,031
Public
Service
Electric
&
Gas
Co.
3.70%
,
05/01/28
............
63
62,188
5.45%
,
08/01/53
............
5
5,300
Realty
Income
Corp.
,
5.38%
,
09/01/54
5
5,090
Republic
Services,
Inc.
,
3.95%
,
05/15/28
.................
7
6,962
RPM
International,
Inc.
,
2.95%
,
01/15/32
.................
5
4,431
Ryder
System,
Inc.
,
4.30%
,
06/15/27
9
9,001
San
Diego
Gas
&
Electric
Co.
4.15%
,
05/15/48
............
6
5,134
5.35%
,
04/01/53
............
8
8,211
Schedule
of
Investments
(continued)
September
30,
2024
BlackRock
Sustainable
Total
Return
Fund
(Percentages
shown
are
based
on
Net
Assets)
Security
Par
(000)
Par
(000)
Value
United
States
(continued)
5.55%
,
04/15/54
............
USD
2
$
2,114
Solventum
Corp.
(a)
5.45%
,
02/25/27
............
21
21,434
6.00%
,
05/15/64
............
33
34,077
Southern
California
Edison
Co.
5.30%
,
03/01/28
............
95
98,266
5.65%
,
10/01/28
............
10
10,508
2.85%
,
08/01/29
............
18
16,900
2.25%
,
06/01/30
............
82
73,264
5.45%
,
06/01/31
............
46
48,673
5.95%
,
11/01/32
............
75
81,625
Spire
Missouri,
Inc.
,
3.30%
,
06/01/51
6
4,337
Sprint
LLC
7.63%
,
02/15/25
............
561
562,761
7.63%
,
03/01/26
............
368
380,126
Texas
Instruments,
Inc.
4.15%
,
05/15/48
............
5
4,457
5.00%
,
03/14/53
............
12
12,094
Thermo
Fisher
Scientific,
Inc.
,
4.95%
,
11/21/32
..................
25
26,034
T-Mobile
USA,
Inc.
4.75%
,
02/01/28
............
576
576,574
3.88%
,
04/15/30
............
11
10,697
3.50%
,
04/15/31
............
15
14,114
5.20%
,
01/15/33
............
41
42,487
5.05%
,
07/15/33
............
56
57,400
Toyota
Motor
Credit
Corp.
,
4.55%
,
08/09/29
.................
20
20,321
Uber
Technologies,
Inc.
4.80%
,
09/15/34
............
10
9,986
5.35%
,
09/15/54
............
5
4,959
Union
Electric
Co.
,
2.63%
,
03/15/51
.
15
9,730
Union
Pacific
Corp.
3.84%
,
03/20/60
............
3
2,397
3.55%
,
05/20/61
............
40
29,626
United
Airlines
Pass-Through
Trust
,
Series
2024-1
,
Class
A
,
5.88%
,
02/15/37
.................
26
26,786
UnitedHealth
Group,
Inc.
4.25%
,
04/15/47
............
48
42,472
5.88%
,
02/15/53
............
4
4,428
6.05%
,
02/15/63
............
23
26,040
5.50%
,
04/15/64
............
5
5,228
5.75%
,
07/15/64
............
15
16,192
Verizon
Communications,
Inc.
2.55%
,
03/21/31
............
50
44,646
2.36%
,
03/15/32
............
200
172,308
5.05%
,
05/09/33
............
52
53,668
5.25%
,
03/16/37
............
25
25,994
Waste
Management,
Inc.
4.15%
,
04/15/32
............
39
38,677
4.88%
,
02/15/34
............
11
11,345
Wells
Fargo
&
Co.
(b)
(1-day
SOFR
+
1.99%),
5.56%
,
07/25/34
...............
61
63,999
(1-day
SOFR
+
1.78%),
5.50%
,
01/23/35
...............
45
47,173
(1-day
SOFR
+
2.53%),
3.07%
,
04/30/41
...............
6
4,732
(3-mo.
CME
Term
SOFR
+
4.50%),
5.01%
,
04/04/51
..........
6
5,883
Security
Par
(000)
Par
(000)
Value
United
States
(continued)
(1-day
SOFR
+
2.13%),
4.61%
,
04/25/53
...............
USD
63
$
58,230
12,603,134
Total
Corporate
Bonds
—
33.5%
(Cost:
$
14,763,103
)
..............................
15,128,202
Foreign
Agency
Obligations
France
—
0.3%
Electricite
de
France
SA
,
3.75%
,
06/05/27
(e)
................
EUR
100
113,797
Italy
—
0.2%
ACEA
SpA
,
0.00%
,
09/28/25
(e)
.....
100
108,062
Supranational
—
0.7%
European
Union
(e)
2.50%
,
10/04/52
............
170
161,381
Series
NGEU
,
3.00%
,
03/04/53
..
137
143,421
304,802
Total
Foreign
Agency
Obligations
—
1.2%
(Cost:
$
493,362
)
................................
526,661
Foreign
Government
Obligations
Belgium
—
0.4%
Kingdom
of
Belgium
,
3.30%
,
06/22/54
(a)
(e)
...............
180
195,991
Brazil
—
0.7%
Federative
Republic
of
Brazil
10.00%
,
01/01/29
...........
BRL
—
(f)
51,035
10.00%
,
01/01/35
...........
2
255,755
Notas
do
Tesouro
Nacional
,
10.00%
,
01/01/33
.................
—
(f)
32,548
339,338
France
—
0.2%
French
Republic
,
3.00%
,
05/25/54
(a)
(e)
EUR
93
93,372
Germany
—
0.5%
Federal
Republic
of
Germany
,
2.60%
,
08/15/34
(e)
................
190
220,290
Japan
—
0.3%
Japan
Government
Bond
,
1.80%
,
03/20/54
.................
JPY
18,700
121,797
Mexico
—
1.1%
United
Mexican
States
8.50%
,
03/01/29
............
MXN
10
49,523
8.50%
,
05/31/29
............
20
99,074
2.66%
,
05/24/31
............
USD
200
171,562
7.75%
,
11/23/34
............
MXN
38
170,583
490,742
Panama
—
0.4%
Republic
of
Panama
,
3.88%
,
03/17/28
USD
200
192,500
Peru
—
0.1%
Republic
of
Peru
,
3.55%
,
03/10/51
..
35
26,551
United
Kingdom
—
0.6%
U.K.
Treasury
Bonds
,
4.38%
,
07/31/54
(e)
................
GBP
218
281,371
2024
BlackRock
Annual
Financial
Statements
and
Additional
Information
Schedule
of
Investments
(continued)
September
30,
2024
BlackRock
Sustainable
Total
Return
Fund
(Percentages
shown
are
based
on
Net
Assets)
Security
Par
(000)
Par
(000)
Value
Uruguay
—
0.1%
Oriental
Republic
of
Uruguay
,
5.10%
,
06/18/50
.................
USD
25
$
24,912
Total
Foreign
Government
Obligations
—
4.4%
(Cost:
$
2,069,168
)
..............................
1,986,864
Shares
Shares
Investment
Companies
iShares
J.P.
Morgan
USD
Emerging
Markets
Bond
ETF
(g)
..........
3,695
345,778
Total
Investment
Companies
—
0.8%
(Cost:
$
342,231
)
................................
345,778
Par
(000)
Pa
r
(
000)
Municipal
Bonds
California
-
0
.3
%
Bay
Area
Toll
Authority
,
Series
2010S-1
,
RB
,
7.04
%
,
04/01/50
.........
20
24,737
Los
Angeles
Community
College
District
,
Series
2010E
,
GO
,
6.60
%
,
08/01/42
............
5
5,864
State
of
California
,
Series
2018
,
GO
,
4.60
%
,
04/01/38
............
70
69,672
University
of
California
,
Series
2012AD
,
RB
,
4.86
%
,
05/15/2112
........
15
14,032
114,305
Illinois
-
0
.1
%
State
of
Illinois
,
Series
2003
,
GO
,
5.10
%
,
06/01/33
............
38
38,154
New
Jersey
-
0
.0
%
New
Jersey
Turnpike
Authority
,
Series
2009F
,
RB
,
7.41
%
,
01/01/40
....
8
9,830
New
York
-
0
.0
%
Metropolitan
Transportation
Authority
,
Series
2010A
,
RB
,
6.67
%
,
11/15/39
10
11,266
New
York
City
Municipal
Water
Finance
Authority
,
Series
2010EE
,
RB
,
6.01
%
,
06/15/42
............
5
5,490
Port
Authority
of
New
York
&
New
Jersey
,
Series
2011-168
,
RB
,
4.93
%
,
10/01/51
............
15
14,901
31,657
Ohio
-
0
.0
%
American
Municipal
Power,
Inc.
,
Series
2010A
,
RB
,
8.08
%
,
02/15/50
....
10
13,643
Texas
-
0
.1
%
City
of
San
Antonio
Electric
&
Gas
Systems
,
Series
2010A
,
RB
,
5.81
%
,
02/01/41
............
10
10,715
State
of
Texas
,
Series
2009A
,
GO
,
5.52
%
,
04/01/39
............
15
16,163
26,878
Total
Municipal
Bonds
—
0.5%
(Cost:
$
280,179
)
................................
234,467
Security
Par
(000)
Pa
r
(
000)
Value
Non-Agency
Mortgage-Backed
Securities
Collateralized
Mortgage
Obligations
—
1
.3
%
United
States
—
1.3%
Alternative
Loan
Trust
(b)
Series
2006-OA6,
Class
1A1A,
(1-
mo.
CME
Term
SOFR
at
0.42%
Floor
+
0.53%),
5.39%,
07/25/46
USD
15
$
13,613
Series
2006-OC10,
Class
2A3,
(1-
mo.
CME
Term
SOFR
at
0.46%
Floor
+
0.57%),
5.43%,
11/25/36
189
160,467
AOMT,
Series
2024-6,
Class
A3,
4.65%,
11/25/67
(a)
(c)
..........
49
47,902
CFMT
LLC,
Series
2024-HB15,
Class
M2,
4.00%,
08/25/34
(a)
(b)
.......
100
93,968
RFMSI
Trust,
Series
2007-SA4,
Class
3A1,
6.00%,
10/25/37
(b)
........
120
76,652
TVC
Mortgage
Trust,
Series
2023-
RTL1,
Class
A1,
8.25%,
11/25/27
(a)
(c)
100
101,458
Verus
Securitization
Trust,
Series
2021-
3,
Class
B1,
3.20%,
06/25/66
(a)
(b)
.
100
74,921
568,981
Commercial
Mortgage-Backed
Securities
—
5
.7
%
Cayman
Islands
—
0.2%
MF1
Multifamily
Housing
Mortgage
Loan
Trust,
Series
2021-W10,
Class
G,
(1-mo.
CME
Term
SOFR
at
4.22%
Floor
+
4.22%),
9.32%,
12/15/34
(a)
(b)
...............
125
118,335
United
States
—
5.5%
1211
Avenue
of
the
Americas
Trust,
Series
2015-1211,
Class
A1A2,
3.90%,
08/10/35
(a)
...........
250
245,465
ARES
Commercial
Mortgage
Trust,
Series
2024-IND,
Class
A,
(1-mo.
CME
Term
SOFR
at
1.69%
Floor
+
1.69%),
6.79%,
07/15/41
(a)
(b)
....
22
22,027
ARES1,
Series
2024-IND2,
Class
A,
(1-mo.
CME
Term
SOFR
at
1.44%
Floor
+
1.44%),
6.29%,
10/15/34
(a)
(b)
30
29,925
BAMLL
Trust,
Series
2024-BHP,
Class
A,
(1-mo.
CME
Term
SOFR
at
2.35%
Floor
+
2.35%),
7.45%,
08/15/39
(a)
(b)
...............
10
10,034
BANK,
Series
2022-BNK41,
Class
A4,
3.92%,
04/15/65
(b)
...........
80
76,197
BANK5
Trust,
Series
2024-5YR6,
Class
A3,
6.23%,
05/15/57
.........
18
19,160
BBCMS
Mortgage
Trust,
Series
2018-
TALL,
Class
B,
(1-mo.
CME
Term
SOFR
at
1.12%
Floor
+
1.17%),
6.27%,
03/15/37
(a)
(b)
..........
25
22,875
BMO
Mortgage
Trust,
Series
2024-5C5,
Class
A3,
5.86%,
02/15/57
.....
17
17,901
BMP,
Series
2024-MF23,
Class
E,
(1-mo.
CME
Term
SOFR
at
3.39%
Floor
+
3.39%),
8.49%,
06/15/41
(a)
(b)
10
9,850
BSST
Mortgage
Trust,
Series
2021-
SSCP,
Class
A,
(1-mo.
CME
Term
SOFR
at
0.75%
Floor
+
0.86%),
5.96%,
04/15/36
(a)
(b)
..........
29
28,654
BX
Commercial
Mortgage
Trust
(a)(b)
Series
2020-VKNG,
Class
A,
(1-mo.
CME
Term
SOFR
at
0.93%
Floor
+
1.04%),
6.14%,
10/15/37
...
111
110,809
Schedule
of
Investments
(continued)
September
30,
2024
BlackRock
Sustainable
Total
Return
Fund
(Percentages
shown
are
based
on
Net
Assets)
Security
Par
(000)
Par
(000)
Value
United
States
(continued)
Series
2022-CSMO,
Class
B,
(1-mo.
CME
Term
SOFR
at
3.14%
Floor
+
3.14%),
8.24%,
06/15/27
...
USD
40
$
40,175
Series
2022-LP2,
Class
A,
(1-mo.
CME
Term
SOFR
at
1.01%
Floor
+
1.01%),
6.11%,
02/15/39
...
46
45,298
Series
2024-KING,
Class
A,
(1-mo.
CME
Term
SOFR
at
1.54%
Floor
+
1.54%),
6.64%,
05/15/34
...
104
103,967
Series
2024-MDHS,
Class
A,
(1-mo.
CME
Term
SOFR
at
1.64%
Floor
+
1.64%),
6.74%,
05/15/41
...
95
94,714
BX
Trust
(a)(b)
Series
2021-ARIA,
Class
C,
(1-mo.
CME
Term
SOFR
at
1.65%
Floor
+
1.76%),
6.86%,
10/15/36
...
20
19,831
Series
2021-MFM1,
Class
C,
(1-mo.
CME
Term
SOFR
at
1.20%
Floor
+
1.31%),
6.41%,
01/15/34
...
10
10,402
Series
2022-IND,
Class
A,
(1-mo.
CME
Term
SOFR
at
1.49%
Floor
+
1.49%),
6.59%,
04/15/37
...
43
43,392
Series
2024-VLT4,
Class
A,
(1-mo.
CME
Term
SOFR
at
1.49%
Floor
+
1.49%),
6.59%,
07/15/29
...
30
30,000
Series
2024-VLT4,
Class
E,
(1-mo.
CME
Term
SOFR
at
2.89%
Floor
+
2.89%),
7.99%,
07/15/29
...
10
9,975
Series
2024-VLT4,
Class
F,
(1-mo.
CME
Term
SOFR
at
3.94%
Floor
+
3.94%),
9.03%,
07/15/29
...
30
29,700
BXP
Trust,
Series
2017-GM,
Class
D,
3.54%,
06/13/39
(a)
(b)
..........
45
41,949
Commercial
Mortgage
Trust
(a)(b)
Series
2013-300P,
Class
D,
4.54%,
08/10/30
...............
25
20,902
Series
2024-WCL1,
Class
A,
(1-mo.
CME
Term
SOFR
at
1.84%
Floor
+
1.84%),
6.92%,
06/15/41
...
11
10,955
Series
2024-WCL1,
Class
B,
(1-mo.
CME
Term
SOFR
at
2.59%
Floor
+
2.59%),
7.67%,
06/15/41
...
10
9,947
Series
2024-WCL1,
Class
E,
(1-mo.
CME
Term
SOFR
at
4.49%
Floor
+
4.49%),
9.57%,
06/15/41
...
10
9,951
CONE
Trust
(a)(b)
Series
2024-DFW1,
Class
A,
(1-mo.
CME
Term
SOFR
at
1.64%
Floor
+
1.64%),
6.74%,
08/15/41
...
150
150,000
Series
2024-DFW1,
Class
E,
(1-mo.
CME
Term
SOFR
at
3.89%
Floor
+
3.89%),
8.98%,
08/15/41
...
22
21,963
ELM
Trust,
Series
2024-ELM,
Class
E10,
8.05%,
06/10/39
(a)
(b)
......
20
20,406
EQT
Trust,
Series
2024-EXTR,
Class
A,
5.33%,
07/05/41
(a)
(b)
..........
10
10,238
Fashion
Show
Mall
LLC,
Series
2024-
SHOW,
Class
A,
1.00%,
10/10/29
(a)
(b)
10
9,973
Grace
Trust,
Series
2020-GRCE,
Class
D,
2.77%,
12/10/40
(a)
(b)
........
250
205,281
Great
Wolf
Trust,
Series
2024-WLF2,
Class
A,
(1-mo.
CME
Term
SOFR
+
1.69%),
6.79%,
05/15/41
(a)
(b)
....
100
100,000
GS
Mortgage
Securities
Corp.
Trust,
Series
2024-RVR,
Class
E,
7.72%,
08/10/29
(a)
(b)
...............
10
9,992
Security
Par
(000)
Par
(000)
Value
United
States
(continued)
HIH
Trust,
Series
2024-61P,
Class
A,
(1-mo.
CME
Term
SOFR
at
1.84%
Floor
+
1.84%),
6.79%,
10/15/41
(a)
(b)
USD
10
$
9,974
HLTN
Commercial
Mortgage
Trust,
Series
2024-DPLO,
Class
A,
(1-mo.
CME
Term
SOFR
at
1.64%
Floor
+
1.64%),
6.74%,
06/15/41
(a)
(b)
....
10
9,981
J.P.
Morgan
Chase
Commercial
Mortgage
Securities
Trust
(a)(b)
Series
2021-MHC,
Class
D,
(1-mo.
CME
Term
SOFR
at
1.70%
Floor
+
2.06%),
7.16%,
04/15/38
...
250
248,750
Series
2022-NXSS,
Class
A,
(1-mo.
CME
Term
SOFR
at
2.18%
Floor
+
2.18%),
7.28%,
09/15/39
...
10
10,000
JW
Commercial
Mortgage
Trust
(a)(b)
Series
2024-MRCO,
Class
A,
(1-mo.
CME
Term
SOFR
at
1.62%
Floor
+
1.62%),
6.70%,
06/15/39
...
10
9,981
Series
2024-MRCO,
Class
D,
(1-mo.
CME
Term
SOFR
at
3.19%
Floor
+
3.19%),
8.27%,
06/15/39
...
10
10,004
LBA
Trust
(a)(b)
Series
2024-7IND,
Class
A,
(1-mo.
CME
Term
SOFR
at
1.44%
Floor
+
1.44%),
6.54%,
10/15/41
...
10
9,994
Series
2024-BOLT,
Class
F,
(1-mo.
CME
Term
SOFR
at
4.44%
Floor
+
4.44%),
9.53%,
06/15/26
...
10
9,972
MCR
Mortgage
Trust
(a)
Series
2024-HTL,
Class
C,
(1-mo.
CME
Term
SOFR
at
3.11%
Floor
+
3.11%),
8.20%,
02/15/37
(b)
..
43
43,109
Series
2024-TWA,
Class
A,
5.92%,
06/12/39
...............
13
13,302
Series
2024-TWA,
Class
E,
8.73%,
06/12/39
...............
10
10,194
Morgan
Stanley
Capital
I
Trust
(a)(b)
Series
2017-ASHF,
Class
G,
(1-mo.
CME
Term
SOFR
at
6.90%
Floor
+
7.20%),
12.29%,
11/15/34
..
10
9,927
Series
2024-NSTB,
Class
A,
3.90%,
07/20/32
...............
10
9,701
One
New
York
Plaza
Trust
(a)(b)
Series
2020-1NYP,
Class
A,
(1-mo.
CME
Term
SOFR
at
0.95%
Floor
+
1.06%),
6.16%,
01/15/36
...
21
20,055
Series
2020-1NYP,
Class
AJ,
(1-mo.
CME
Term
SOFR
at
1.25%
Floor
+
1.36%),
6.46%,
01/15/36
...
20
18,650
PGA
Trust,
Series
2024-RSR2,
Class
A,
(1-mo.
CME
Term
SOFR
at
1.89%
Floor
+
1.89%),
6.99%,
06/15/39
(a)
(b)
10
9,959
SUMIT
Mortgage
Trust,
Series
2022-
BVUE,
Class
D,
2.99%,
02/12/41
(a)
(b)
40
28,679
Velocity
Commercial
Capital
Loan
Trust,
Series
2021-4,
Class
M4,
4.48%,
12/26/51
(a)
(b)
..........
402
313,844
Wells
Fargo
Commercial
Mortgage
Trust
Series
2015-C26,
Class
AS,
3.58%,
02/15/48
...............
20
19,806
Series
2024-BPRC,
Class
B,
6.22%,
07/15/43
(a)
..............
10
10,326
2024
BlackRock
Annual
Financial
Statements
and
Additional
Information
Schedule
of
Investments
(continued)
September
30,
2024
BlackRock
Sustainable
Total
Return
Fund
(Percentages
shown
are
based
on
Net
Assets)
Security
Par
(000)
Par
(000)
Value
United
States
(continued)
Series
2024-BPRC,
Class
C,
6.43%,
07/15/43
(a)
..............
USD
10
$
10,196
2,478,312
Interest
Only
Commercial
Mortgage-Backed
Securities
—
0
.0
%
United
States
—
0.0%
BMO
Mortgage
Trust,
Series
2023-C5,
Class
XA,
0.95%,
06/15/56
(b)
....
199
9,883
MCR
Mortgage
Trust,
Series
2024-
TWA,
Class
XA,
0.92%,
06/12/39
(a)
37
691
Wells
Fargo
Commercial
Mortgage
Trust,
Series
2024-BPRC,
Class
X,
0.31%,
07/15/43
(a)
(b)
..........
78
771
11,345
Total
Non-Agency
Mortgage-Backed
Securities
—
7.0%
(Cost:
$
3,309,690
)
..............................
3,176,973
U.S.
Government
Sponsored
Agency
Securities
Commercial
Mortgage-Backed
Securities
—
0.1%
(b)
Federal
Home
Loan
Mortgage
Corp.
Variable
Rate
Notes
,
Series
2018-W5FX
,
Class
CFX
,
3.79
%
,
04/25/28
(a)
...........
50
45,226
Government
National
Mortgage
Association
Variable
Rate
Notes
,
Series
2023-50
,
Class
AC
,
3.25
%
,
09/16/63
............
3
2,709
47,935
Interest
Only
Collateralized
Mortgage
Obligations
—
0.2%
Federal
National
Mortgage
Association
,
Series
437
,
Class
C11
,
3.00
%
,
07/25/52
............
92
15,802
Government
National
Mortgage
Association
Series
2021-58
,
Class
IY
,
3.00
%
,
02/20/51
........
65
10,429
Series
2021-78
,
Class
IP
,
3.00
%
,
05/20/51
........
68
11,023
Series
2021-97
,
Class
LI
,
3.00
%
,
08/20/50
........
58
9,353
Series
2022-78
,
Class
D
,
3.00
%
,
08/20/51
........
142
23,063
Series
2022-85
,
Class
IK
,
3.00
%
,
05/20/51
........
75
11,988
81,658
Mortgage-Backed
Securities
—
38.8%
Federal
National
Mortgage
Association
5.81
%
,
06/01/31
..........
13
13,700
3.00
%
,
12/01/50
..........
586
537,996
Government
National
Mortgage
Association
2.00
%
,
08/20/50
-
11/20/50
...
99
84,168
2.50
%
,
10/20/51
-
12/20/51
...
83
73,480
3.00
%
,
03/20/52
..........
268
242,750
3.50
%
,
03/20/52
..........
56
52,168
4.00
%
,
03/20/52
..........
14
13,240
2.00
%
,
10/15/54
(h)
.........
452
382,921
2.50
%
,
10/15/54
(h)
.........
454
400,070
3.00
%
,
10/15/54
(h)
.........
142
129,201
3.50
%
,
10/15/54
(h)
.........
2,092
1,965,045
4.00
%
,
10/15/54
(h)
.........
197
189,970
Security
Par
(000)
Par
(000)
Value
Mortgage-Backed
Securities
(continued)
4.50
%
,
10/15/54
(h)
.........
USD
183
$
180,688
5.00
%
,
10/15/54
(h)
.........
179
179,287
5.50
%
,
10/15/54
(h)
.........
219
221,109
6.00
%
,
10/15/54
-
11/15/54
(h)
..
336
341,581
6.50
%
,
10/15/54
-
11/15/54
(h)
..
196
200,458
Uniform
Mortgage-Backed
Securities
1.50
%
,
10/25/39
(h)
.........
293
261,476
2.00
%
,
10/25/39
(h)
.........
430
393,344
2.50
%
,
10/25/39
(h)
.........
168
157,460
3.00
%
,
10/25/39
-
10/25/54
(h)
..
269
247,513
3.50
%
,
10/25/39
(h)
.........
35
34,259
4.00
%
,
10/25/39
-
10/25/54
(h)
..
532
511,778
4.50
%
,
10/25/39
-
10/25/54
(h)
..
599
589,810
3.50
%
,
09/01/46
-
11/01/51
...
939
896,493
4.00
%
,
04/01/47
-
04/01/52
...
1,113
1,072,919
4.50
%
,
06/01/50
..........
197
195,973
1.50
%
,
06/01/51
..........
318
251,212
2.00
%
,
10/01/51
-
11/01/51
...
2,550
2,116,467
2.50
%
,
11/01/51
-
12/01/51
...
2,845
2,480,736
3.00
%
,
11/01/51
..........
244
223,243
5.00
%
,
04/01/53
-
10/01/53
...
690
689,883
5.50
%
,
09/01/53
..........
292
295,372
6.00
%
,
09/01/53
-
01/01/54
...
342
352,610
6.50
%
,
10/01/53
-
09/01/54
...
397
411,572
7.50
%
,
12/01/53
-
01/01/54
...
18
18,981
5.00
%
,
10/25/54
(h)
.........
310
309,967
5.50
%
,
10/25/54
(h)
.........
653
660,440
6.00
%
,
10/25/54
(h)
.........
131
133,886
6.50
%
,
10/25/54
(h)
.........
21
21,649
17,534,875
Total
U.S.
Government
Sponsored
Agency
Securities
—
39
.1
%
(Cost:
$
18,472,228
)
..............................
17,664,468
U.S.
Treasury
Obligations
U.S.
Treasury
Bonds
4.50
%
,
08/15/39
-
02/15/44
.....
250
263,735
1.13
%
,
05/15/40
-
08/15/40
.....
280
184,183
4.38
%
,
05/15/40
-
05/15/41
.....
92
95,797
1.38
%
,
11/15/40
-
08/15/50
.....
230
144,577
4.25
%
,
11/15/40
............
120
123,553
1.88
%
,
02/15/41
-
11/15/51
.....
182
124,802
4.75
%
,
02/15/41
-
11/15/43
.....
79
85,247
1.75
%
,
08/15/41
............
140
99,263
2.00
%
,
11/15/41
-
08/15/51
.....
263
180,656
3.00
%
,
05/15/42
-
08/15/52
.....
597
489,801
3.88
%
,
02/15/43
............
262
252,362
2.88
%
,
05/15/43
-
05/15/52
.....
396
315,102
3.63
%
,
08/15/43
-
02/15/53
.....
76
69,912
3.75
%
,
11/15/43
............
75
70,559
4.63
%
,
05/15/44
-
05/15/54
.....
681
722,133
2.75
%
,
11/15/47
............
198
154,162
3.13
%
,
05/15/48
............
90
74,749
2.25
%
,
08/15/49
-
02/15/52
.....
145
99,715
1.63
%
,
11/15/50
............
110
64,467
2.38
%
,
05/15/51
............
125
88,118
4.00
%
,
11/15/52
............
28
27,245
4.13
%
,
08/15/53
............
15
14,738
U.S.
Treasury
Notes
5.00
%
,
08/31/25
............
96
96,803
4.63
%
,
02/28/26
-
05/31/31
.....
418
425,345
0.88
%
,
06/30/26
-
09/30/26
.....
183
174,034
0.63
%
,
07/31/26
............
52
49,207
4.38
%
,
07/31/26
-
05/15/34
.....
261
272,584
Schedule
of
Investments
(continued)
September
30,
2024
BlackRock
Sustainable
Total
Return
Fund
(Percentages
shown
are
based
on
Net
Assets)
Security
Par
(000)
Par
(000)
Value
U.S.
Treasury
Obligations
(continued)
1.13
%
,
10/31/26
............
USD
42
$
39,892
1.63
%
,
11/30/26
-
05/15/31
.....
234
213,517
1.50
%
,
01/31/27
............
5
4,765
4.13
%
,
02/15/27
-
11/15/32
.....
74
75,095
1.88
%
,
02/28/27
-
02/28/29
.....
149
143,004
0.50
%
,
04/30/27
-
05/31/27
.....
281
259,431
2.75
%
,
04/30/27
-
08/15/32
.....
193
186,719
0.38
%
,
09/30/27
............
66
60,055
3.50
%
,
01/31/28
............
2
1,995
1.25
%
,
03/31/28
-
08/15/31
.....
703
627,634
3.63
%
,
03/31/28
............
76
76,255
4.00
%
,
06/30/28
-
02/15/34
.....
306
311,093
1.75
%
,
01/31/29
............
8
7,416
4.25
%
,
02/28/29
-
06/30/31
.....
18
18,627
2.88
%
,
04/30/29
............
32
31,051
4.88
%
,
10/31/30
............
3
3,202
3.38
%
,
05/15/33
............
7
6,806
3.88
%
,
08/15/34
............
7
7,049
Total
U.S.
Treasury
Obligations
—
15.1%
(Cost:
$
7,060,584
)
..............................
6,836,455
Total
Long-Term
Investments
—
112
.3
%
(Cost:
$
51,613,053
)
..............................
50,718,298
Shares
Shares
Short-Term
Securities
Money
Market
Funds
—
3.1%
BlackRock
Liquidity
Funds,
T-Fund,
Institutional
Class
,
4.83
%
(g)
(i)
....
1,415,929
1,415,929
Total
Short-Term
Securities
—
3
.1
%
(Cost:
$
1,415,929
)
..............................
1,415,929
Security
Shares
Shares
Value
Total
Options
Purchased
—
0
.1
%
(Cost:
$
51,166
)
................................
$
71,983
Total
Investments
Before
Options
Written
and
TBA
Sale
Commitments
—
115.5%
(Cost:
$
53,080,148
)
..............................
52,206,210
Total
Options
Written
—
(
0
.2
)
%
(Premiums
Received
—
$
(
83,167
)
)
...................
(
111,574
)
Par
(000)
Pa
r
(
000)
TBA
Sale
Commitments
(h)
Government
National
Mortgage
Association
6.00
%
,
10/15/54
............
USD
(
168
)
(
170,846
)
6.50
%
,
10/15/54
............
(
98
)
(
100,267
)
Uniform
Mortgage-Backed
Securities
4.00
%
,
10/25/39
-
11/25/54
.....
(
1,023
)
(
982,473
)
2.00
%
,
10/25/54
............
(
269
)
(
222,345
)
2.50
%
,
10/25/54
............
(
1,164
)
(
1,004,719
)
3.50
%
,
10/25/54
............
(
1,483
)
(
1,380,921
)
4.50
%
,
10/25/54
-
11/25/54
.....
(
1,925
)
(
1,892,630
)
5.50
%
,
10/25/54
............
(
6
)
(
6,069
)
6.00
%
,
10/25/54
............
(
6
)
(
6,132
)
6.50
%
,
11/25/54
............
(
90
)
(
92,841
)
Total
TBA
Sale
Commitments
—
(
13
.0
)
%
(Proceeds:
$
(
5,893,588
)
)
..........................
(
5,859,243
)
Total
Investments
Net
of
Options
Written
and
TBA
Sale
Commitments
—
102
.3
%
(Cost:
$
47,103,393
)
..............................
46,235,393
Liabilities
in
Excess
of
Other
Assets
—
(
2.3
)
%
............
(
1,057,606
)
Net
Assets
—
100.0%
..............................
$
45,177,787
(a)
Security
exempt
from
registration
pursuant
to
Rule
144A
under
the
Securities
Act
of
1933,
as
amended.
These
securities
may
be
resold
in
transactions
exempt
from
registration
to
qualified
institutional
investors.
(b)
Variable
rate
security.
Interest
rate
resets
periodically.
The
rate
shown
is
the
effective
interest
rate
as
of
period
end.
Security
description
also
includes
the
reference
rate
and
spread
if
published
and
available.
(c)
Step
coupon
security.
Coupon
rate
will
either
increase
(step-up
bond)
or
decrease
(step-down
bond)
at
regular
intervals
until
maturity.
Interest
rate
shown
reflects
the
rate
currently
in
effect.
(d)
All
or
a
portion
of
the
security
has
been
pledged
and/or
segregated
as
collateral
in
connection
with
outstanding
exchange-traded
options
written.
(e)
This
security
may
be
resold
to
qualified
foreign
investors
and
foreign
institutional
buyers
under
Regulation
S
of
the
Securities
Act
of
1933.
(f)
Rounds
to
less
than
1,000.
(g)
Affiliate
of
the
Fund.
(h)
Represents
or
includes
a
TBA
transaction.
(i)
Annualized
7-day
yield
as
of
period
end.
2024
BlackRock
Annual
Financial
Statements
and
Additional
Information
Schedule
of
Investments
(continued)
September
30,
2024
BlackRock
Sustainable
Total
Return
Fund
Affiliates
Investments
in
issuers
considered
to
be
affiliate(s)
of
the
Fund
during
the year
ended
September
30,
2024
for
purposes
of
Section
2(a)(3)
of
the
Investment
Company
Act
of
1940,
as
amended,
were
as
follows:
Affiliated
Issuer
Value
at
09/30/23
Purchases
at
Cost
Proceeds
from
Sales
Net
Realized
Gain
(Loss)
Change
in
Unrealized
Appreciation
(Depreciation)
Value
at
09/30/24
Shares
Held
at
09/30/24
Income
Capital
Gain
Distributions
from
Underlying
Funds
BlackRock
Liquidity
Funds,
T-Fund,
Institutional
Class
.
$
2,232,587
$
—
$
(
820,318
)
(a)
$
3,660
$
—
$
1,415,929
1,415,929
$
72,500
$
—
iShares
J.P.
Morgan
USD
Emerging
Markets
Bond
ETF
................
—
342,231
—
—
3,547
345,778
3,695
—
—
$
3,660
$
3,547
$
1,761,707
$
72,500
$
—
—
—
(a)
Represents
net
amount
purchased
(sold).
For
purposes
of
this
report,
industry
and
sector
sub-classifications
may
differ
from
those
utilized
by
the
Fund
for
compliance
purposes.
Schedule
of
Investments
(continued)
September
30,
2024
BlackRock
Sustainable
Total
Return
Fund
Derivative
Financial
Instruments
Outstanding
as
of
Period
End
Futures
Contracts
Description
Number
of
Contracts
Expiration
Date
Notional
Amount
(000)
Value/
Unrealized
Appreciation
(Depreciation)
Long
Contracts
Australia
10-Year
Bond
......................................................
4
12/16/24
$
322
$
(3,847)
U.S.
Treasury
10-Year
Note
...................................................
11
12/19/24
1,258
3,623
U.S.
Treasury
Long
Bond
.....................................................
9
12/19/24
1,119
(5,381)
U.S.
Treasury
Ultra
Bond
.....................................................
2
12/19/24
267
(142)
U.S.
Treasury
2-Year
Note
....................................................
8
12/31/24
1,666
(2,785)
U.S.
Treasury
5-Year
Note
....................................................
42
12/31/24
4,618
7,231
(1,301)
Short
Contracts
Euro-Bobl
...............................................................
4
12/06/24
535
(6,347)
Euro-Bund
..............................................................
6
12/06/24
901
(6,369)
Euro-Schatz
.............................................................
4
12/06/24
477
(2,779)
U.S.
Treasury
10-Year
Ultra
Note
...............................................
1
12/19/24
118
1,409
3-mo.
SOFR
.............................................................
9
03/17/26
2,183
1,537
(12,549)
$
(13,850)
Forward
Foreign
Currency
Exchange
Contracts
Currency
Purchased
Currency
Sold
Counterparty
Settlement
Date
Unrealized
Appreciation
(Depreciation)
BRL
381,400
USD
66,860
Goldman
Sachs
International
12/18/24
$
2,511
USD
164,377
JPY
23,132,710
HSBC
Bank
plc
12/18/24
1,688
USD
6,509
JPY
904,000
Royal
Bank
of
Canada
12/18/24
150
USD
55,797
JPY
7,900,000
UBS
AG
12/18/24
238
USD
98,000
MXN
1,896,540
Citibank
NA
12/18/24
2,840
7,427
BRL
382,970
USD
70,000
Citibank
NA
12/18/24
(343)
JPY
16,000,000
USD
113,441
Deutsche
Bank
AG
12/18/24
(915)
MXN
1,913,744
USD
98,000
Citibank
NA
12/18/24
(1,977)
USD
435,990
BRL
2,491,553
Barclays
Bank
plc
12/18/24
(17,189)
USD
514,987
EUR
464,700
State
Street
Bank
and
Trust
Co.
12/18/24
(3,944)
USD
2,930,751
EUR
2,625,000
UBS
AG
12/18/24
(586)
USD
471,723
GBP
358,000
State
Street
Bank
and
Trust
Co.
12/18/24
(6,820)
USD
28,626
MXN
572,515
State
Street
Bank
and
Trust
Co.
12/18/24
(100)
(31,874)
$
(24,447)
Exchange-Traded
Options
Purchased
Description
Number
of
Contracts
Expiration
Date
Exercise
Price
Notional
Amount
(000)
Value
Call
3-mo.
SOFR
...............................
21
11/15/24
USD
95.75
USD
5,250
$
12,600
3-mo.
SOFR
...............................
21
11/15/24
USD
95.25
USD
5,250
37,275
49,875
Put
3-mo.
SOFR
...............................
72
10/11/24
USD
96.94
USD
18,000
15,750
$
65,625
2024
BlackRock
Annual
Financial
Statements
and
Additional
Information
Schedule
of
Investments
(continued)
September
30,
2024
BlackRock
Sustainable
Total
Return
Fund
OTC
Currency
Options
Purchased
Description
Counterparty
Expiration
Date
Exercise
Price
Notional
Amount
(000)
Value
Call
USD
Currency
...........................
Bank
of
America
NA
03/06/26
CNH
7.75
USD
1,154
$
5,459
OTC
Dual
Binary
Options
Purchased
Description
(a)
Counterparty
Units
Expiration
Date
Notional
Amount
(000)
Value
Put
Payout
at
expiry
if
USDCNHC
>=
7.35
and
difference
of
US
30-Year
swap
and
US
5-Year
swap
>=
0.23
.......................
Citibank
NA
24,000
01/17/25
USD
176
$
166
(a)
Option
only
pays
if
both
terms
are
met
on
the
expiration
date.
OTC
Interest
Rate
Swaptions
Purchased
Paid
by
the
Fund
Received
by
the
Fund
Description
Rate
Frequency
Rate
Frequency
Counterparty
Expiration
Date
Exercise
Rate
Notional
Amount
(000)
Value
Put
10-Year
Interest
Rate
Swap
(a)
4.43%
Annual
1-day
SOFR
Annual
Goldman
Sachs
International
10/17/24
4.43
%
USD
719
$
—
30-Year
Interest
Rate
Swap
(a)
3.93%
Annual
1-day
SOFR
Annual
Citibank
NA
12/18/24
3.93
USD
219
733
$
733
(a)
Forward
settling
swaption.
Exchange-Traded
Options
Written
Description
Number
of
Contracts
Expiration
Date
Exercise
Price
Notional
Amount
(000)
Value
Call
3-mo.
SOFR
................................
42
11/15/24
USD
95.50
USD
10,500
$
(48,824)
Put
3-mo.
SOFR
................................
65
10/11/24
USD
96.56
USD
16,250
(1,219)
$
(50,043)
OTC
Interest
Rate
Swaptions
Written
Paid
by
the
Fund
Received
by
the
Fund
Description
Rate
Frequency
Rate
Frequency
Counterparty
Expiration
Date
Exercise
Rate
Notional
Amount
(000)
Value
Call
10-Year
Interest
Rate
Swap
(a)
2.76%
Annual
1-day
SOFR
Annual
JPMorgan
Chase
Bank
NA
03/28/25
2.76
%
USD
264
$
(2,021)
10-Year
Interest
Rate
Swap
(a)
2.76%
Annual
1-day
SOFR
Annual
JPMorgan
Chase
Bank
NA
04/02/25
2.76
USD
266
(2,150)
10-Year
Interest
Rate
Swap
(a)
3.98%
Annual
1-day
SOFR
Annual
Bank
of
America
NA
05/11/26
3.98
USD
47
(3,435)
10-Year
Interest
Rate
Swap
(a)
3.28%
Annual
1-day
SOFR
Annual
Deutsche
Bank
AG
08/05/26
3.28
USD
—
(19)
10-Year
Interest
Rate
Swap
(a)
3.29%
Annual
1-day
SOFR
Annual
Deutsche
Bank
AG
08/21/26
3.29
USD
36
(1,416)
10-Year
Interest
Rate
Swap
(a)
3.32%
Annual
1-day
SOFR
Annual
Bank
of
America
NA
08/24/26
3.32
USD
30
(1,244)
10-Year
Interest
Rate
Swap
(a)
3.38%
Annual
1-day
SOFR
Annual
Bank
of
America
NA
08/31/26
3.38
USD
33
(1,424)
10-Year
Interest
Rate
Swap
(a)
3.22%
Annual
1-day
SOFR
Annual
Citibank
NA
09/09/26
3.22
USD
83
(3,048)
Schedule
of
Investments
(continued)
September
30,
2024
BlackRock
Sustainable
Total
Return
Fund
OTC
Interest
Rate
Swaptions
Written
(continued)
Paid
by
the
Fund
Received
by
the
Fund
Description
Rate
Frequency
Rate
Frequency
Counterparty
Expiration
Date
Exercise
Rate
Notional
Amount
(000)
Value
10-Year
Interest
Rate
Swap
(a)
3.17%
Annual
1-day
SOFR
Annual
Bank
of
America
NA
09/10/26
3.17
%
USD
165
$
(5,815)
10-Year
Interest
Rate
Swap
(a)
3.19%
Annual
1-day
SOFR
Annual
Bank
of
America
NA
09/11/26
3.19
USD
76
(2,730)
10-Year
Interest
Rate
Swap
(a)
3.28%
Annual
1-day
SOFR
Annual
Barclays
Bank
plc
09/21/26
3.28
USD
95
(3,784)
10-Year
Interest
Rate
Swap
(a)
3.34%
Annual
1-day
SOFR
Annual
Bank
of
America
NA
09/28/26
3.34
USD
61
(2,590)
(29,676)
Put
1-Year
Interest
Rate
Swap
(a)
.
1-day
SOFR
At
Termination
5.10%
At
Termination
Goldman
Sachs
International
10/17/24
5.10
USD
6,030
—
10-Year
Interest
Rate
Swap
(a)
1-day
SOFR
Annual
3.76%
Annual
JPMorgan
Chase
Bank
NA
03/28/25
3.76
USD
264
(2,288)
10-Year
Interest
Rate
Swap
(a)
1-day
SOFR
Annual
3.76%
Annual
JPMorgan
Chase
Bank
NA
04/02/25
3.76
USD
266
(2,359)
10-Year
Interest
Rate
Swap
(a)
1-day
SOFR
Annual
3.98%
Annual
Bank
of
America
NA
05/11/26
3.98
USD
47
(927)
10-Year
Interest
Rate
Swap
(a)
1-day
SOFR
Annual
3.28%
Annual
Deutsche
Bank
AG
08/05/26
3.28
USD
—
(21)
10-Year
Interest
Rate
Swap
(a)
1-day
SOFR
Annual
3.29%
Annual
Deutsche
Bank
AG
08/21/26
3.29
USD
36
(1,534)
10-Year
Interest
Rate
Swap
(a)
1-day
SOFR
Annual
3.32%
Annual
Bank
of
America
NA
08/24/26
3.32
USD
30
(1,272)
10-Year
Interest
Rate
Swap
(a)
1-day
SOFR
Annual
3.38%
Annual
Bank
of
America
NA
08/31/26
3.38
USD
33
(1,294)
10-Year
Interest
Rate
Swap
(a)
1-day
SOFR
Annual
3.22%
Annual
Citibank
NA
09/09/26
3.22
USD
83
(3,834)
10-Year
Interest
Rate
Swap
(a)
1-day
SOFR
Annual
3.17%
Annual
Bank
of
America
NA
09/10/26
3.17
USD
165
(7,962)
10-Year
Interest
Rate
Swap
(a)
1-day
SOFR
Annual
3.19%
Annual
Bank
of
America
NA
09/11/26
3.19
USD
76
(3,609)
10-Year
Interest
Rate
Swap
(a)
1-day
SOFR
Annual
3.28%
Annual
Barclays
Bank
plc
09/21/26
3.28
USD
95
(4,189)
10-Year
Interest
Rate
Swap
(a)
1-day
SOFR
Annual
3.34%
Annual
Bank
of
America
NA
09/28/26
3.34
USD
61
(2,566)
(31,855)
$
(61,531)
(a)
Forward
settling
swaption.
Centrally
Cleared
Credit
Defa
ul
t
Swaps
—
Sell
Protection
Reference
Obligation/Index
Financing
Rate
Received
by
the
Fund
Payment
Frequency
Termination
Date
Credit
Rating
(a)
Notional
Amount
(000)
(b)
Value
Upfront
Premium
Paid
(Received)
Unrealized
Appreciation
(Depreciation)
Markit
CDX
North
American
High
Yield
Index
Series
43.V1
...........
5.00
%
Quarterly
12/20/29
B+
USD
802
$
59,753
$
58,941
$
812
(a)
Using
the
rating
of
the
issuer
or
the
underlying
securities
of
the
index,
as
applicable,
provided
by
S&P
Global
Ratings.
(b)
The
maximum
potential
amount
the
Fund
may
pay
should
a
negative
credit
event
take
place
as
defined
under
the
terms
of
the
agreement.
Centrally
Cleared
Interest
Rate
Swap
s
Paid
by
the
Fund
Received
by
the
Fund
Rate
Frequency
Rate
Frequency
Effective
Date
Termination
Date
Notional
Amount
(000)
Value
Upfront
Premium
Paid
(Received)
Unrealized
Appreciation
(Depreciation)
3.84%
Annual
1-day
SOFR
Annual
10/01/24
(a)
10/01/34
USD
134
$
(5,953)
$
—
$
(5,953)
2.49%
Annual
6-mo.
EURIBOR
Semi-Annual
N/A
02/19/54
EUR
90
(5,473)
—
(5,473)
2.51%
Annual
6-mo.
EURIBOR
Semi-Annual
N/A
02/20/54
EUR
126
(8,363)
—
(8,363)
2.51%
Annual
6-mo.
EURIBOR
Semi-Annual
N/A
02/20/54
EUR
90
(5,816)
—
(5,816)
2.51%
Annual
6-mo.
EURIBOR
Semi-Annual
N/A
03/01/54
EUR
45
(2,984)
—
(2,984)
2.46%
Annual
6-mo.
EURIBOR
Semi-Annual
N/A
03/22/54
EUR
19
(1,031)
—
(1,031)
2.54%
Annual
6-mo.
EURIBOR
Semi-Annual
N/A
04/22/54
EUR
73
(4,035)
(150)
(3,885)
2.50%
Annual
6-mo.
EURIBOR
Semi-Annual
N/A
05/14/54
EUR
48
(2,192)
(232)
(1,960)
2024
BlackRock
Annual
Financial
Statements
and
Additional
Information
Schedule
of
Investments
(continued)
September
30,
2024
BlackRock
Sustainable
Total
Return
Fund
Centrally
Cleared
Interest
Rate
Swaps
(continued)
Paid
by
the
Fund
Received
by
the
Fund
Rate
Frequency
Rate
Frequency
Effective
Date
Termination
Date
Notional
Amount
(000)
Value
Upfront
Premium
Paid
(Received)
Unrealized
Appreciation
(Depreciation)
2.43%
Annual
6-mo.
EURIBOR
Semi-Annual
N/A
06/19/54
EUR
19
$
(589)
$
—
$
(589)
2.43%
Annual
6-mo.
EURIBOR
Semi-Annual
N/A
06/20/54
EUR
17
(529)
—
(529)
6-mo.
EURIBOR
Semi-Annual
2.44%
Annual
N/A
06/24/54
EUR
11
378
—
378
2.59%
Annual
6-mo.
EURIBOR
Semi-Annual
N/A
07/04/54
EUR
47
(3,311)
(262)
(3,049)
2.28%
Annual
6-mo.
EURIBOR
Semi-Annual
N/A
07/11/54
EUR
20
91
(132)
223
2.25%
Annual
6-mo.
EURIBOR
Semi-Annual
N/A
07/11/54
EUR
38
410
158
252
2.54%
Annual
6-mo.
EURIBOR
Semi-Annual
N/A
07/11/54
EUR
19
(1,130)
(102)
(1,028)
2.55%
Annual
6-mo.
EURIBOR
Semi-Annual
N/A
07/11/54
EUR
19
(1,142)
—
(1,142)
$
(41,669)
$
(720)
$
(40,949)
(a)
Forward
swap.
Centrally
Cleared
Inflation
Swap
s
Paid
by
the
Fund
Received
by
the
Fund
Reference
Frequency
Rate
Frequency
Termination
Date
Notional
Amount
(000)
Value
Upfront
Premium
Paid
(Received)
Unrealized
Appreciation
(Depreciation)
2.30%
At
Termination
U.S.
Consumer
Price
Index
All
Items
Monthly
At
Termination
09/10/54
USD
25
$
347
$
—
$
347
2.31%
At
Termination
U.S.
Consumer
Price
Index
All
Items
Monthly
At
Termination
09/10/54
USD
25
325
—
325
2.28%
At
Termination
U.S.
Consumer
Price
Index
All
Items
Monthly
At
Termination
09/11/54
USD
25
453
—
453
2.29%
At
Termination
U.S.
Consumer
Price
Index
All
Items
Monthly
At
Termination
09/11/54
USD
25
426
—
426
UK
Retail
Price
Index
All
Items
Monthly
At
Termination
3.10%
At
Termination
09/15/54
GBP
70
(1,797)
(98)
(1,699)
$
(246)
$
(98)
$
(148)
The
following
reference
rates,
and
their
values
as
of
period
end,
are
used
for
security
descriptions:
Reference
Index
Reference
Rate
1-day
SOFR
.........................................
Secured
Overnight
Financing
Rate
5.16
%
6-mo.
EURIBOR
......................................
Euro
Interbank
Offered
Rate
3.11
Balances
Reported
in
the
Statements
of
Assets
and
Liabilities
for
Centrally
Cleared
Swaps
and
Options
Written
Description
Swap
Premiums
Paid
Swap
Premiums
Received
Unrealized
Appreciation
Unrealized
Depreciation
Value
Centrally
Cleared
Swaps
(a)
............................................
$
59,099
$
(976)
$
3,216
$
(43,501)
$
—
Options
Written
...................................................
N/A
N/A
15,115
(43,522)
(111,574)
(a)
Includes
cumulative
appreciation
(depreciation)
on
centrally
cleared
swaps,
as
reported
in
the
Schedule
of
Investments.
Only
current
day’s
variation
margin
is
reported
within
the
Statements
of
Assets
and
Liabilities
and
is
net
of
any
previously
paid
(received)
swap
premium
amounts.
Schedule
of
Investments
(continued)
September
30,
2024
BlackRock
Sustainable
Total
Return
Fund
Derivative
Financial
Instruments
Categorized
by
Risk
Exposure
As
of
period
end,
the
fair
values
of
derivative
financial
instruments
located
in
the
Statements
of
Assets
and
Liabilities
were
as
follows:
Commodity
Contracts
Credit
Contracts
Equity
Contracts
Foreign
Currency
Exchange
Contracts
Interest
Rate
Contracts
Other
Contracts
Total
Assets
—
Derivative
Financial
Instruments
Futures
contracts
Unrealized
appreciation
on
futures
contracts
(a)
......
$
—
$
—
$
—
$
—
$
13,800
$
—
$
13,800
Forward
foreign
currency
exchange
contracts
Unrealized
appreciation
on
forward
foreign
currency
exchange
contracts
......................
—
—
—
7,427
—
—
7,427
Options
purchased
(b)
Investments
at
value
—
unaffiliated
(c)
............
—
—
—
5,459
66,358
166
(d)
71,983
Swaps
—
centrally
cleared
Unrealized
appreciation
on
centrally
cleared
swaps
(a)
.
—
812
—
—
853
1,551
3,216
$
—
$
812
$
—
$
12,886
$
81,011
$
1,717
$
96,426
Liabilities
—
Derivative
Financial
Instruments
Futures
contracts
Unrealized
depreciation
on
futures
contracts
(a)
......
$
—
$
—
$
—
$
—
$
27,650
$
—
$
27,650
Forward
foreign
currency
exchange
contracts
Unrealized
depreciation
on
forward
foreign
currency
exchange
contracts
......................
—
—
—
31,874
—
—
31,874
Options
written
(b)
Options
written
at
value
.....................
—
—
—
—
111,574
—
111,574
Swaps
—
centrally
cleared
Unrealized
depreciation
on
centrally
cleared
swaps
(a)
.
—
—
—
—
41,802
1,699
43,501
$
—
$
—
$
—
$
31,874
$
181,026
$
1,699
$
214,599
(a)
Net
cumulative
unrealized
appreciation
(depreciation)
on
futures
contracts
and
centrally
cleared
swaps,
if
any,
are
reported
in
the
Schedule
of
Investments.
In
the
Statements
of
Assets
and
Liabilities,
only
current
day’s
variation
margin
is
reported
in
receivables
or
payables
and
the
net
cumulative
unrealized
appreciation
(depreciation)
is
included
in
accumulated
earnings
(loss).
(b)
Includes
forward
settling
swaptions.
(c)
Includes
options
purchased
at
value
as
reported
in
the
Schedule
of
Investments.
(d)
Includes
dual
binary
options
at
value.
For
the
period
ended
September
30,
2024,
the
effect
of
derivative
financial
instruments
in
the
Statements
of
Operations
was
as
follows:
Commodity
Contracts
Credit
Contracts
Equity
Contracts
Foreign
Currency
Exchange
Contracts
Interest
Rate
Contracts
Other
Contracts
Total
Net
Realized
Gain
(Loss)
from
Futures
contracts
.......................
$
—
$
—
$
(622)
$
—
$
237,418
$
—
$
236,796
Forward
foreign
currency
exchange
contracts
....
—
—
—
(58,439)
—
—
(58,439)
Options
purchased
(a)
.....................
—
—
14,014
(9,435)
(199,630)
—
(195,051)
Options
written
........................
—
—
2,606
3,044
182,332
—
187,982
Swaps
..............................
—
54,057
—
—
(101,542)
6,645
(40,840)
$
—
$
54,057
$
15,998
$
(64,830)
$
118,578
$
6,645
$
130,448
Net
Change
in
Unrealized
Appreciation
(Depreciation)
on
Futures
contracts
.......................
$
—
$
—
$
—
$
—
$
(9,341)
$
—
$
(9,341)
Forward
foreign
currency
exchange
contracts
....
—
—
—
(45,362)
—
—
(45,362)
Options
purchased
(b)
.....................
—
—
—
(2,965)
(42,801)
(1,322)
(47,088)
Options
written
........................
—
—
—
—
69,646
—
69,646
Swaps
..............................
—
890
—
—
(48,210)
(2,036)
(49,356)
$
—
$
890
$
—
$
(48,327)
$
(30,706)
$
(3,358)
$
(81,501)
(a)
Options
purchased
are
included
in
net
realized
gain
(loss)
from
investments
—
unaffiliated.
(b)
Options
purchased
are
included
in
net
change
in
unrealized
appreciation
(depreciation)
on
investments
—
unaffiliated.
2024
BlackRock
Annual
Financial
Statements
and
Additional
Information
Schedule
of
Investments
(continued)
September
30,
2024
BlackRock
Sustainable
Total
Return
Fund
For
more
information
about
the
Fund’s
investment
risks
regarding
derivative
financial
instruments,
refer
to
the
Notes
to
Financial
Statements.
Derivative
Financial
Instruments
—
Offsetting
as
of
Period
End
Average
Quarterly
Balances
of
Outstanding
Derivative
Financial
Instruments
Futures
contracts
Average
notional
value
of
contracts
—
long
..................................................................................
$
8,707,087
Average
notional
value
of
contracts
—
short
.................................................................................
$
5,554,671
Forward
foreign
currency
exchange
contracts
Average
amounts
purchased
—
in
USD
....................................................................................
$
3,438,221
Average
amounts
sold
—
in
USD
........................................................................................
$
87,075
Options
Average
value
of
option
contracts
purchased
................................................................................
$
28,000
Average
value
of
option
contracts
written
...................................................................................
$
17,152
Average
notional
value
of
swaption
contracts
purchased
.........................................................................
$
4,666,208
Average
notional
value
of
swaption
contracts
written
...........................................................................
$
10,124,973
Credit
default
swaps
Average
notional
value
—
buy
protection
...................................................................................
$
12,750
Average
notional
value
—
sell
protection
...................................................................................
$
647,839
Interest
rate
swaps
Average
notional
value
—
pays
fixed
rate
...................................................................................
$
749,533
Average
notional
value
—
receives
fixed
rate
................................................................................
$
21,474,611
Inflation
swaps
Average
notional
value
—
pays
fixed
rate
...................................................................................
$
79,532
Average
notional
value
—
receives
fixed
rate
................................................................................
$
79,621
Total
return
swaps
Average
notional
value
...............................................................................................
$
—
(a)
(a)
Derivative
financial
instrument
not
held
at
any
quarter-end.
The
risk
exposure
table
serves
as
an
indicator
of
activity
during
the
period.
The
Fund's
derivative
assets
and
liabilities
(by
type)
were
as
follows:
Assets
Liabilities
Derivative
Financial
Instruments
$
—
Futures
contracts
....................................................................................
$
2,907
$
32,141
Forward
foreign
currency
exchange
contracts
.................................................................
7,427
31,874
Options
(a)(b)
........................................................................................
71,983
111,574
Swaps
—
centrally
cleared
..............................................................................
—
7,244
Total
derivative
assets
and
liabilities
in
the
Statements
of
Assets
and
Liabilities
............................................
$
82,317
$
182,833
Derivatives
not
subject
to
a
Master
Netting
Agreement
or
similar
agreement
("MNA")
........................................
(68,532)
(89,428)
Total
derivative
assets
and
liabilities
subject
to
an
MNA
............................................................
$
13,785
$
93,405
(a)
Includes
options
purchased
at
value
which
is
included
in
Investments
at
value
–
unaffiliated
in
the
Statements
of
Assets
and
Liabilities
and
reported
in
the
Schedule
of
Investments.
(b)
Includes
forward
settling
swaptions.
The
following
tables
present
the
Fund's
derivative
assets
and
liabilities
by
counterparty
net
of
amounts
available
for
offset
under
an
MNA
and
net
of
the
related
collateral
received
and
pledged
by
the
Fund:
Counterparty
Derivative
Assets
Subject
to
an
MNA
by
Counterparty
Derivatives
Available
for
Offset
(a)
Non-cash
Collateral
Received
Cash
Collateral
Received
Net
Amount
of
Derivative
Assets
(b)(c)
Bank
of
America
NA
..............................
$
5,459
$
(5,459)
$
—
$
—
$
—
Citibank
NA
....................................
3,739
(3,739)
—
—
—
Goldman
Sachs
International
........................
2,511
—
—
—
2,511
HSBC
Bank
plc
..................................
1,688
—
—
—
1,688
Royal
Bank
of
Canada
.............................
150
—
—
—
150
UBS
AG
......................................
238
(238)
—
—
—
$
13,785
$
(9,436)
$
—
$
—
$
4,349
Schedule
of
Investments
(continued)
September
30,
2024
BlackRock
Sustainable
Total
Return
Fund
Fair
Value
Hierarchy
as
of Period
End
Various
inputs
are
used
in
determining
the
fair
value
of
financial
instruments
at
the
measurement
date.
For
a
description
of
the
input
levels
and
information
about
the
Fund’s
policy
regarding
valuation
of
financial
instruments,
refer
to
the
Notes
to
Financial
Statements.
The
following
table
summarizes
the
Fund’s
financial
instruments
categorized
in
the
fair
value
hierarchy.
The
breakdown
of
the
Fund's
financial
instruments
into
major
categories
is
disclosed
in
the Schedule
of
Investments
above.
Counterparty
Derivative
Liabilities
Subject
to
an
MNA
by
Counterparty
Derivatives
Available
for
Offset
(a)
Non-cash
Collateral
Pledged
Cash
Collateral
Pledged
Net
Amount
of
Derivative
Liabilities
(b)(d)
Bank
of
America
NA
..............................
$
34,868
$
(5,459)
$
—
$
—
$
29,409
Barclays
Bank
plc
................................
25,162
—
—
—
25,162
Citibank
NA
....................................
9,202
(3,739)
—
—
5,463
Deutsche
Bank
AG
...............................
3,905
—
—
—
3,905
JPMorgan
Chase
Bank
NA
..........................
8,818
—
—
—
8,818
State
Street
Bank
and
Trust
Co.
......................
10,864
—
—
—
10,864
UBS
AG
......................................
586
(238)
—
—
348
$
93,405
$
(9,436)
$
—
$
—
$
83,969
(a)
The
amount
of
derivatives
available
for
offset
is
limited
to
the
amount
of
derivative
assets
and/or
liabilities
that
are
subject
to
an
MNA.
(b)
Net
amount
may
also
include
forward
foreign
currency
exchange
contracts
that
are
not
required
to
be
collateralized.
(c)
Net
amount
represents
the
net
amount
receivable
from
the
counterparty
in
the
event
of
default.
(d)
Net
amount
represents
the
net
amount
payable
due
to
the
counterparty
in
the
event
of
default.
Net
amount
may
be
offset
further
by
the
options
receivable/payable
on
the
Statements
of
Assets
and
Liabilities.
Level
1
Level
2
Level
3
Total
Assets
Investments
Long-Term
Investments
Asset-Backed
Securities
...................................
$
—
$
4,784,831
$
—
$
4,784,831
Common
Stocks
.........................................
33,599
—
—
33,599
Corporate
Bonds
........................................
—
15,128,202
—
15,128,202
Foreign
Agency
Obligations
.................................
—
526,661
—
526,661
Foreign
Government
Obligations
..............................
—
1,986,864
—
1,986,864
Investment
Companies
....................................
345,778
—
—
345,778
Municipal
Bonds
.........................................
—
234,467
—
234,467
Non-Agency
Mortgage-Backed
Securities
........................
—
3,176,973
—
3,176,973
U.S.
Government
Sponsored
Agency
Securities
....................
—
17,664,468
—
17,664,468
U.S.
Treasury
Obligations
...................................
—
6,836,455
—
6,836,455
Short-Term
Securities
Money
Market
Funds
......................................
1,415,929
—
—
1,415,929
Options
Purchased
Foreign
currency
exchange
contracts
...........................
—
5,459
—
5,459
Interest
rate
contracts
......................................
65,625
733
—
66,358
Other
contracts
..........................................
—
166
—
166
Liabilities
Investments
TBA
Sale
Commitments
....................................
—
(5,859,243)
—
(5,859,243)
$
1,860,931
$
44,486,036
$
—
$
46,346,967
Derivative
Financial
Instruments
(a)
Assets
Credit
contracts
...........................................
$
—
$
812
$
—
$
812
Foreign
currency
exchange
contracts
............................
—
7,427
—
7,427
Interest
rate
contracts
.......................................
13,800
853
—
14,653
Other
contracts
...........................................
—
1,551
—
1,551
Liabilities
Foreign
currency
exchange
contracts
............................
—
(31,874)
—
(31,874)
Interest
rate
contracts
.......................................
(77,693)
(103,333)
—
(181,026)
Other
contracts
...........................................
—
(1,699)
—
(1,699)
$
(63,893)
$
(126,263)
$
—
$
(190,156)
2024
BlackRock
Annual
Financial
Statements
and
Additional
Information
Schedule
of
Investments
(continued)
September
30,
2024
BlackRock
Sustainable
Total
Return
Fund
See
notes
to
financial
statements.
(a)
Derivative
financial
instruments
are
swaps,
futures
contracts,
forward
foreign
currency
exchange
contracts
and
options
written.
Swaps,
futures
contracts
and
forward
foreign
currency
exchange
contracts
are
valued
at
the
unrealized
appreciation
(depreciation)
on
the
instrument
and
options
written
are
shown
at
value.
Fair
Value
Hierarchy
as
of Period
End
(continued)
Statements
of
Assets
and
Liabilities
September
30,
2024
Statements
of
Assets
and
Liabilities
BlackRock
Sustainable
High
Yield
Bond
Fund
BlackRock
Sustainable
Total
Return
Fund
ASSETS
Investments,
at
value
—
unaffiliated
(a)
.........................................................................
$
45,094,058
$
50,444,503
Investments,
at
value
—
affiliated
(b)
...........................................................................
897,178
1,761,707
Cash
..............................................................................................
13,456
313
Cash
pledged:
Futures
contracts
.....................................................................................
9,000
152,000
Centrally
cleared
swaps
.................................................................................
—
179,000
Foreign
currency,
at
value
(c)
................................................................................
—
289,271
Receivables:
–
–
Investment
s
sold
.....................................................................................
139,466
—
Options
written
.......................................................................................
—
9,729
TBA
sale
commitments
.................................................................................
—
5,893,588
Dividends
—
unaffiliated
................................................................................
—
649
Dividends
—
affiliated
..................................................................................
3,619
5,824
Interest
—
unaffiliated
..................................................................................
680,416
343,753
From
the
Manager
....................................................................................
13,656
10,742
Variation
margin
on
futures
contracts
........................................................................
—
2,907
Unrealized
appreciation
on:
–
–
Forward
foreign
currency
exchange
contracts
..................................................................
—
7,427
Prepaid
e
xpenses
......................................................................................
40,142
59,688
Total
a
ssets
..........................................................................................
46,890,991
59,161,101
LIABILITIES
Options
written,
at
value
(d)
.................................................................................
—
111,574
TBA
sale
commitments,
at
value
(e)
...........................................................................
—
5,859,243
Payables:
–
–
Investments
purchased
.................................................................................
634,828
7,595,292
Swaps
...........................................................................................
—
17
Accounting
services
fees
................................................................................
37,243
40,862
Administration
fees
....................................................................................
1
2
Capital
shares
redeemed
................................................................................
—
692
Custodian
fees
.......................................................................................
7,596
14,184
Income
dividend
distributions
.............................................................................
243,095
151,482
Interest
expense
.....................................................................................
73
70
Professional
fees
.....................................................................................
86,514
85,102
Registration
fees
.....................................................................................
1,727
68
Service
fees
........................................................................................
19
27
Transfer
agent
fees
...................................................................................
171
975
Other
accrued
expenses
................................................................................
26,541
52,465
Variation
margin
on
futures
contracts
........................................................................
2,304
32,141
Variation
margin
on
centrally
cleared
swaps
...................................................................
—
7,244
Unrealized
depreciation
on:
–
–
Forward
foreign
currency
exchange
contracts
..................................................................
—
31,874
Total
li
abilities
.........................................................................................
1,040,112
13,983,314
Commitments
and
contingent
liabilities
—
—
NET
ASSETS
.........................................................................................
$
45,850,879
$
45,177,787
Statements
of
Assets
and
Liabilities
(continued)
September
30,
2024
2024
BlackRock
Annual
Financial
Statements
and
Additional
Information
See
notes
to
financial
statements.
BlackRock
Sustainable
High
Yield
Bond
Fund
BlackRock
Sustainable
Total
Return
Fund
NET
ASSETS
CONSIST
OF:
Paid-in
capital
.........................................................................................
$
50,236,917
$
52,196,940
Accumulated
loss
......................................................................................
(
4,386,038
)
(
7,019,153
)
NET
ASSETS
.........................................................................................
$
45,850,879
$
45,177,787
(a)
Investments,
at
cost
—
unaffiliated
...................................................................
$
44,072,975
$
51,321,988
(b)
Investments,
at
cost
—
affiliated
.....................................................................
$
897,178
$
1,758,160
(c)
Foreign
currency,
at
cost
.........................................................................
$
—
$
288,847
(d)
Premiums
received
.............................................................................
$
—
$
83,167
(e)
Proceeds
received
from
TBA
sale
commitments
...........................................................
$
—
$
5,893,588
Statements
of
Assets
and
Liabilities
(continued)
September
30,
2024
Statements
of
Assets
and
Liabilities
See
notes
to
financial
statements.
BlackRock
Sustainable
High
Yield
Bond
Fund
BlackRock
Sustainable
Total
Return
Fund
NET
ASSET
VALUE
Institutional
Net
assets
.........................................................................................
$
419,038
$
2,665,034
Shares
outstanding
...................................................................................
46,035
313,206
Net
asset
value
.....................................................................................
$
9.10
$
8.51
Shares
authorized
...................................................................................
Unlimited
500
million
Par
value
.........................................................................................
$
0.001
$
0.10
Investor
A
Net
assets
.........................................................................................
$
98,161
$
139,810
Shares
outstanding
...................................................................................
10,784
16,430
Net
asset
value
.....................................................................................
$
9.10
$
8.51
Shares
authorized
...................................................................................
Unlimited
300
million
Par
value
.........................................................................................
$
0.001
$
0.10
Class
K
Net
assets
.........................................................................................
$
45,333,680
$
42,372,943
Shares
outstanding
...................................................................................
4,980,000
4,980,016
Net
asset
value
.....................................................................................
$
9.10
$
8.51
Shares
authorized
...................................................................................
Unlimited
500
million
Par
value
.........................................................................................
$
0.001
$
0.10
Statements
of
Operations
Year
Ended
September
30,
2024
2024
BlackRock
Annual
Financial
Statements
and
Additional
Information
See
notes
to
financial
statements.
BlackRock
Sustainable
High
Yield
Bond
Fund
BlackRock
Sustainable
Total
Return
Fund
INVESTMENT
INCOME
–
–
Dividends
—
unaffiliated
................................................................................
$
1,154
$
1,478
Dividends
—
affiliated
..................................................................................
47,737
72,500
Interest
—
unaffiliated
..................................................................................
3,087,766
1,956,345
Total
investment
income
..................................................................................
3,136,657
2,030,323
EXPENSES
Investment
advisory
...................................................................................
220,691
164,717
Professional
........................................................................................
125,499
169,514
Accounting
services
...................................................................................
77,313
80,016
Printing
and
postage
..................................................................................
75,149
85,485
Registration
........................................................................................
57,198
80,192
Administration
......................................................................................
18,759
17,950
Custodian
..........................................................................................
13,120
26,036
Administration
—
class
specific
...........................................................................
8,828
8,447
Directors
and
Officer
..................................................................................
1,617
1,611
Transfer
agent
—
class
specific
...........................................................................
369
1,718
Service
and
distribution
—
class
specific
.....................................................................
246
334
Miscellaneous
.......................................................................................
11,047
32,050
Total
expenses
excluding
interest
expense
......................................................................
609,836
668,070
Interest
expense
.....................................................................................
146
407
Total
e
xpenses
........................................................................................
609,982
668,477
Less:
–
–
Administration
fees
waived
..............................................................................
(
18,759
)
(
17,950
)
Administration
fees
waived
by
the
Manager
—
class
specific
........................................................
(
8,771
)
(
8,380
)
Fees
waived
and/or
reimbursed
by
the
Manager
................................................................
(
346,336
)
(
473,572
)
Transfer
agent
fees
waived
and/or
reimbursed
by
the
Manager
—
class
specific
...........................................
(
265
)
(
1,063
)
Total
ex
penses
after
fees
waived
and/or
reimbursed
...............................................................
235,851
167,512
Net
investment
income
...................................................................................
2,900,806
1,862,811
REALIZED
AND
UNREALIZED
GAIN
(LOSS)
$
3,369,733
$
3,024,050
Net
realized
gain
(loss)
from:
Investments
—
unaffiliated
............................................................................
$
(
960,176
)
$
(
696,253
)
Investments
—
affiliated
..............................................................................
—
3,660
Forward
foreign
currency
exchange
contracts
................................................................
—
(
58,439
)
Foreign
currency
transactions
..........................................................................
—
9,370
Futures
contracts
...................................................................................
(
8,645
)
236,796
Options
written
....................................................................................
—
187,982
Swaps
.........................................................................................
—
(
40,840
)
(968,821)
(357,724)
Net
change
in
unrealized
appreciation
(depreciation)
on:
Investments
—
unaffiliated
............................................................................
4,332,254
3,411,801
Investments
—
affiliated
..............................................................................
—
3,547
Forward
foreign
currency
exchange
contracts
................................................................
—
(
45,362
)
Foreign
currency
translations
...........................................................................
—
839
Futures
contracts
...................................................................................
6,300
(
9,341
)
Options
written
....................................................................................
—
69,646
Swaps
.........................................................................................
—
(
49,356
)
4,338,554
3,381,774
Net
realized
and
unrealized
gain
............................................................................
3,369,733
3,024,050
NET
INCREASE
IN
NET
ASSETS
RESULTING
FROM
OPERATIONS
...................................................
$
6,270,539
$
4,886,861
Statements
of
Changes
in
Net
Assets
Statements
of
Changes
in
Net
Assets
See
notes
to
financial
statements.
BlackRock
Sustainable
High
Yield
Bond
Fund
BlackRock
Sustainable
Total
Return
Fund
Year
Ended
09/30/24
Year
Ended
09/30/23
Year
Ended
09/30/24
Year
Ended
09/30/23
INCREASE
(DECREASE)
IN
NET
ASSETS
OPERATIONS
Net
investment
income
............................................
$
2,900,806
$
2,417,720
$
1,862,811
$
1,526,865
Net
realized
loss
................................................
(
968,821
)
(
2,434,185
)
(
357,724
)
(
2,947,064
)
Net
change
in
unrealized
appreciation
(depreciation)
........................
4,338,554
3,804,030
3,381,774
2,026,803
Net
increase
in
net
assets
resulting
from
operations
...........................
6,270,539
3,787,565
4,886,861
606,604
DISTRIBUTIONS
TO
SHAREHOLDERS
(a)
From
net
investment
income:
Institutional
...................................................
(
18,785
)
(
6,726
)
(
47,959
)
(
4,251
)
Investor
A
....................................................
(
6,216
)
(
5,049
)
(
4,696
)
(
5,248
)
Class
K
......................................................
(
2,900,235
)
(
2,511,492
)
(
1,561,149
)
(
2,103,823
)
Return
of
capital:
–
–
–
–
Institutional
...................................................
—
—
(
7,230
)
—
Investor
A
....................................................
—
—
(
708
)
—
Class
K
......................................................
—
—
(
235,343
)
—
Decrease
in
net
assets
resulting
from
distributions
to
shareholders
.................
(2,925,236)
(2,523,267)
(1,857,085)
(2,113,322)
CAPITAL
SHARE
TRANSACTIONS
$
–
$
–
$
–
$
–
Net
increase
in
net
assets
derived
from
capital
share
transactions
.................
169,819
148,952
2,351,958
146,033
NET
ASSETS
Total
increase
(decrease)
in
net
assets
...................................
3,515,122
1,413,250
5,381,734
(
1,360,685
)
Beginning
of
year
..................................................
42,335,757
40,922,507
39,796,053
41,156,738
End
of
year
......................................................
$
45,850,879
$
42,335,757
$
45,177,787
$
39,796,053
(a)
Distributions
for
annual
periods
determined
in
accordance
with
U.S.
federal
income
tax
regulations.
Financial
Highlights
(For
a
share
outstanding
throughout
each
period)
2024
BlackRock
Annual
Financial
Statements
and
Additional
Information
BlackRock
Sustainable
High
Yield
Bond
Fund
Institutional
Year
Ended
09/30/24
Year
Ended
09/30/23
Year
Ended
09/30/22
Period
from
07/22/21
(a)
to
09/30/21
Net
asset
value,
beginning
of
period
........................................
$
8.44
$
8.18
$
9.94
$
10.00
Net
investment
income
(b)
................................................
0
.57
0
.49
0
.37
0
.05
Net
realized
and
unrealized
gain
(loss)
.......................................
0
.67
0
.27
(
1
.72
)
(
0
.05
)
Net
increase
(decrease)
from
investment
operations
...............................
1.24
0.76
(1.35
)
0.00
Distributions
from
net
investment
income
(c)
...................................
(0.58
)
(0.50
)
(0.41
)
(0.06
)
Net
asset
value,
end
of
period
.............................................
$
9.10
$
8.44
$
8.18
$
9.94
Total
Return
(d)
Based
on
net
asset
value
.................................................
15.12
%
9.40
%
(13.97
)%
0.01
%
(e)
Ratios
to
Average
Net
Assets
(f)
Total
expen
ses
........................................................
1.40
%
1.56
%
1.75
%
1.32
%
(g)
(h)
Total
expenses
after
fees
waived
and/or
reimbursed
...............................
0.57
%
0.58
%
0.57
%
0.58
%
(g)
Net
investment
income
..................................................
6.52
%
5.70
%
3.96
%
2.80
%
(g)
Supplemental
Data
Net
assets,
end
of
period
(000)
.............................................
$
419
$
217
$
83
$
99
Portfolio
turnover
rate
....................................................
66
%
37
%
47
%
10
%
(a)
Commencement
of
operations.
(b)
Based
on
average
shares
outstanding.
(c)
Distributions
for
annual
periods
determined
in
accordance
with
U.S.
federal
income
tax
regulations.
(d)
Where
applicable,
assumes
the
reinvestment
of
distributions.
(e)
Not
annualized.
(f)
Excludes
fees
and
expenses
incurred
indirectly
as
a
result
of
investments
in
underlying
funds.
(g)
Annualized.
(h)
Audit,
offering
and
organization
costs
were
not
annualized
in
the
calculation
of
the
expense
ratios.
If
these
expenses
were
annualized,
the
total
expenses
would
have
been
2.40%.
See
notes
to
financial
statements.
Financial
Highlights
(continued)
(For
a
share
outstanding
throughout
each
period)
BlackRock
Sustainable
High
Yield
Bond
Fund
Investor
A
Year
Ended
09/30/24
Year
Ended
09/30/23
Year
Ended
09/30/22
Period
from
07/22/21
(a)
to
09/30/21
Net
asset
value,
beginning
of
period
.........................................
$
8.44
$
8.18
$
9.94
$
10.00
Net
investment
income
(b)
.................................................
0
.55
0
.46
0
.34
0
.05
Net
realized
and
unrealized
gain
(loss)
........................................
0
.67
0
.28
(
1
.72
)
(
0
.05
)
Net
increase
(decrease)
from
investment
operations
................................
1.22
0.74
(1.38
)
0.00
Distributions
from
net
investment
income
(c)
....................................
(0.56
)
(0.48
)
(0.38
)
(0.06
)
Net
asset
value,
end
of
period
..............................................
$
9.10
$
8.44
$
8.18
$
9.94
Total
Return
(d)
Based
on
net
asset
value
..................................................
14.82
%
9.13
%
(14.18
)%
(0.03
)%
(e)
Ratios
to
Average
Net
Assets
(f)
Total
expen
ses
.........................................................
1.85
%
1.83
%
2.00
%
1.58
%
(g)
(h)
Total
expenses
after
fees
waived
and/or
reimbursed
................................
0.83
%
0.83
%
0.82
%
0.83
%
(g)
Net
investment
income
...................................................
6.27
%
5.39
%
3.71
%
2.55
%
(g)
Supplemental
Data
Net
assets,
end
of
period
(000)
..............................................
$
98
$
101
$
84
$
99
Portfolio
turnover
rate
.....................................................
66
%
37
%
47
%
10
%
(a)
Commencement
of
operations.
(b)
Based
on
average
shares
outstanding.
(c)
Distributions
for
annual
periods
determined
in
accordance
with
U.S.
federal
income
tax
regulations.
(d)
Where
applicable,
excludes
the
effects
of
any
sales
charges
and
assumes
the
reinvestment
of
distributions.
(e)
Not
annualized.
(f)
Excludes
fees
and
expenses
incurred
indirectly
as
a
result
of
investments
in
underlying
funds.
(g)
Annualized.
(h)
Audit,
offering
and
organization
costs
were
not
annualized
in
the
calculation
of
the
expense
ratios.
If
these
expenses
were
annualized,
the
total
expenses
would
have
been
2.65%.
See
notes
to
financial
statements.
Financial
Highlights
(continued)
(For
a
share
outstanding
throughout
each
period)
2024
BlackRock
Annual
Financial
Statements
and
Additional
Information
BlackRock
Sustainable
High
Yield
Bond
Fund
Class
K
Year
Ended
09/30/24
Year
Ended
09/30/23
Year
Ended
09/30/22
Period
from
07/22/21
(a)
to
09/30/21
Net
asset
value,
beginning
of
period
........................................
$
8.44
$
8.18
$
9.94
$
10.00
Net
investment
income
(b)
................................................
0
.58
0
.48
0
.37
0
.05
Net
realized
and
unrealized
gain
(loss)
.......................................
0
.66
0
.28
(
1
.72
)
(
0
.05
)
Net
increase
(decrease)
from
investment
operations
...............................
1.24
0.76
(1.35
)
0.00
Distributions
from
net
investment
income
(c)
...................................
(0.58
)
(0.50
)
(0.41
)
(0.06
)
Net
asset
value,
end
of
period
.............................................
$
9.10
$
8.44
$
8.18
$
9.94
Total
Return
(d)
Based
on
net
asset
value
.................................................
15.16
%
9.44
%
(13.93
)%
0.02
%
(e)
Ratios
to
Average
Net
Assets
(f)
Total
expen
ses
........................................................
1.38
%
1.52
%
1.46
%
0.96
%
(g)
(h)
Total
expenses
after
fees
waived
and/or
reimbursed
...............................
0.53
%
0.53
%
0.53
%
0.53
%
(g)
Net
investment
income
..................................................
6.57
%
5.67
%
4.00
%
2.85
%
(g)
Supplemental
Data
Net
assets,
end
of
period
(000)
.............................................
$
45,334
$
42,017
$
40,755
$
49,509
Portfolio
turnover
rate
....................................................
66
%
37
%
47
%
10
%
(a)
Commencement
of
operations.
(b)
Based
on
average
shares
outstanding.
(c)
Distributions
for
annual
periods
determined
in
accordance
with
U.S.
federal
income
tax
regulations.
(d)
Where
applicable,
assumes
the
reinvestment
of
distributions.
(e)
Not
annualized.
(f)
Excludes
fees
and
expenses
incurred
indirectly
as
a
result
of
investments
in
underlying
funds.
(g)
Annualized.
(h)
Audit,
offering
and
organization
costs
were
not
annualized
in
the
calculation
of
the
expense
ratios.
If
these
expenses
were
annualized,
the
total
expenses
would
have
been
2.04%.
See
notes
to
financial
statements.
Financial
Highlights
(For
a
share
outstanding
throughout
each
period)
(a)
Commencement
of
operations.
(b)
Based
on
average
shares
outstanding.
(c)
Distributions
for
annual
periods
determined
in
accordance
with
U.S.
federal
income
tax
regulations.
(d)
applicable,
assumes
the
reinvestment
of
distributions.
(e)
Not
annualized.
(f)
Includes
payment
from
an
affiliate,
which
had
no
impact
on
the
Fund’s
total
return.
(g)
Excludes
fees
and
expenses
incurred
indirectly
as
a
result
of
investments
in
underlying
funds.
(h)
Annualized.
(i)
Audit,
offering,
organization
and
printing
costs
were
not
annualized
in
the
calculation
of
the
expense
ratios.
If
these
expenses
were
annualized,
the
total
expenses
and
total
expenses
after
fees
waived
and/or
reimbursed
would
have
been
1.61%
and
0.43%,
respectively.
(j)
Includes
mortgage
dollar
roll
transactions
("MDRs").
Additional
information
regarding
portfolio
turnover
rate
is
as
follows:
BlackRock
Sustainable
Total
Return
Fund
Institutional
Year
Ended
09/30/24
Year
Ended
09/30/23
Period
from
10/18/21
(a)
to
09/30/22
Net
asset
value,
beginning
of
period
........................................................
$
7.93
$
8.23
$
10.00
Net
investment
income
(b)
................................................................
0
.36
0
.30
0
.16
Net
realized
and
unrealized
gain
(loss)
.......................................................
0
.58
(
0
.18
)
(
1
.76
)
Net
increase
(decrease)
from
investment
operations
...............................................
0.94
0.12
(1.60
)
Distributions
(c)
–
–
–
From
net
investment
income
.............................................................
(
0
.31
)
(
0
.42
)
(
0
.17
)
Return
of
capital
......................................................................
(
0
.05
)
—
—
Total
distributions
.......................................................................
(0.36
)
(0.42
)
(0.17
)
Net
asset
value,
end
of
period
.............................................................
$
8.51
$
7.93
$
8.23
Total
Return
(d)
Based
on
net
asset
value
.................................................................
12.08
%
1.33
%
(16.16
)%
(e)
(f)
Ratios
to
Average
Net
Assets
(g)
Total
expen
ses
........................................................................
1.59
%
1.80
%
1.58
%
(h)
(i)
Total
expenses
after
fees
waived
and/or
reimbursed
...............................................
0.43
%
0.43
%
0.40
%
(h)
(i)
Net
investment
income
..................................................................
4.35
%
3.64
%
1.80
%
(h)
Supplemental
Data
Net
assets,
end
of
period
(000)
.............................................................
$
2,665
$
182
$
82
Portfolio
turnover
rate
(j)
...................................................................
832
%
704
%
604
%
Year
Ended
09/30/24
Year
Ended
09/30/23
Period
from
10/18/21
to
09/30/22
Portfolio
turnover
rate
(excluding
MDRs)
..................................................................
524%
434%
360%
See
notes
to
financial
statements.
Financial
Highlights
(continued)
(For
a
share
outstanding
throughout
each
period)
2024
BlackRock
Annual
Financial
Statements
and
Additional
Information
(a)
Commencement
of
operations.
(b)
Based
on
average
shares
outstanding.
(c)
Distributions
for
annual
periods
determined
in
accordance
with
U.S.
federal
income
tax
regulations.
(d)
applicable,
excludes
the
effects
of
any
sales
charges
and
assumes
the
reinvestment
of
distributions.
(e)
Not
annualized.
(f)
Includes
payment
from
an
affiliate,
which
had
no
impact
on
the
Fund’s
total
return.
(g)
Excludes
fees
and
expenses
incurred
indirectly
as
a
result
of
investments
in
underlying
funds.
(h)
Annualized.
(i)
Audit,
offering,
organization
and
printing
costs
were
not
annualized
in
the
calculation
of
the
expense
ratios.
If
these
expenses
were
annualized,
the
total
expenses
and
total
expenses
after
fees
waived
and/or
reimbursed
would
have
been
1.84%
and
0.73%,
respectively.
(j)
Includes
mortgage
dollar
roll
transactions
("MDRs").
Additional
information
regarding
portfolio
turnover
rate
is
as
follows:
BlackRock
Sustainable
Total
Return
Fund
Investor
A
Year
Ended
09/30/24
Year
Ended
09/30/23
Period
from
10/18/21
(a)
to
09/30/22
Net
asset
value,
beginning
of
period
........................................................
$
7.93
$
8.23
$
10.00
Net
investment
income
(b)
................................................................
0
.33
0
.28
0
.13
Net
realized
and
unrealized
gain
(loss)
.......................................................
0
.58
(
0
.18
)
(
1
.76
)
Net
increase
(decrease)
from
investment
operations
...............................................
0.91
0.10
(1.63
)
Distributions
(c)
–
–
–
From
net
investment
income
.............................................................
(
0
.29
)
(
0
.40
)
(
0
.14
)
Return
of
capital
......................................................................
(
0
.04
)
—
—
Total
distributions
.......................................................................
(0.33
)
(0.40
)
(0.14
)
Net
asset
value,
end
of
period
.............................................................
$
8.51
$
7.93
$
8.23
Total
Return
(d)
Based
on
net
asset
value
.................................................................
11.73
%
1.06
%
(16.38
)%
(e)
(f)
Ratios
to
Average
Net
Assets
(g)
Total
expen
ses
........................................................................
1.97
%
2.05
%
1.81
%
(h)
(i)
Total
expenses
after
fees
waived
and/or
reimbursed
...............................................
0.75
%
0.71
%
0.70
%
(h)
(i)
Net
investment
income
..................................................................
4.06
%
3.42
%
1.53
%
(h)
Supplemental
Data
Net
assets,
end
of
period
(000)
.............................................................
$
140
$
128
$
92
Portfolio
turnover
rate
(j)
...................................................................
832
%
704
%
604
%
Year
Ended
09/30/24
Year
Ended
09/30/23
Period
from
10/18/21
to
09/30/22
Portfolio
turnover
rate
(excluding
MDRs)
..................................................................
524%
434%
360%
See
notes
to
financial
statements.
Financial
Highlights
(continued)
(For
a
share
outstanding
throughout
each
period)
(a)
Commencement
of
operations.
(b)
Based
on
average
shares
outstanding.
(c)
Distributions
for
annual
periods
determined
in
accordance
with
U.S.
federal
income
tax
regulations.
(d)
applicable,
assumes
the
reinvestment
of
distributions.
(e)
Not
annualized.
(f)
Includes
payment
from
an
affiliate,
which
had
no
impact
on
the
Fund’s
total
return.
(g)
Excludes
fees
and
expenses
incurred
indirectly
as
a
result
of
investments
in
underlying
funds.
(h)
Annualized.
(i)
Audit,
offering,
organization
and
printing
costs
were
not
annualized
in
the
calculation
of
the
expense
ratios.
If
these
expenses
were
annualized,
the
total
expenses
and
total
expenses
after
fees
waived
and/or
reimbursed
would
have
been
1.33%
and
0.39%,
respectively.
(j)
Includes
mortgage
dollar
roll
transactions
("MDRs").
Additional
information
regarding
portfolio
turnover
rate
is
as
follows:
BlackRock
Sustainable
Total
Return
Fund
Class
K
Year
Ended
09/30/24
Year
Ended
09/30/23
Period
from
10/18/21
(a)
to
09/30/22
Net
asset
value,
beginning
of
period
........................................................
$
7.93
$
8.23
$
10.00
Net
investment
income
(b)
................................................................
0
.36
0
.31
0
.16
Net
realized
and
unrealized
gain
(loss)
.......................................................
0
.58
(
0
.19
)
(
1
.76
)
Net
increase
(decrease)
from
investment
operations
...............................................
0.94
0.12
(1.60
)
Distributions
(c)
–
–
–
From
net
investment
income
.............................................................
(
0
.31
)
(
0
.42
)
(
0
.17
)
Return
of
capital
......................................................................
(
0
.05
)
—
—
Total
distributions
.......................................................................
(0.36
)
(0.42
)
(0.17
)
Net
asset
value,
end
of
period
.............................................................
$
8.51
$
7.93
$
8.23
Total
Return
(d)
Based
on
net
asset
value
.................................................................
12.12
%
1.37
%
(16.12
)%
(e)
(f)
Ratios
to
Average
Net
Assets
(g)
Total
expen
ses
........................................................................
1.58
%
1.68
%
1.30
%
(h)
(i)
Total
expenses
after
fees
waived
and/or
reimbursed
...............................................
0.39
%
0.39
%
0.36
%
(h)
(i)
Net
investment
income
..................................................................
4.41
%
3.68
%
1.84
%
(h)
Supplemental
Data
Net
assets,
end
of
period
(000)
.............................................................
$
42,373
$
39,486
$
40,982
Portfolio
turnover
rate
(j)
...................................................................
832
%
704
%
604
%
Year
Ended
09/30/24
Year
Ended
09/30/23
Period
from
10/18/21
to
09/30/22
Portfolio
turnover
rate
(excluding
MDRs)
..................................................................
524%
434%
360%
See
notes
to
financial
statements.
Notes
to
Financial
Statements
2024
BlackRock
Annual
Financial
Statements
and
Additional
Information
1.
ORGANIZATION
BlackRock
Funds
V
(the
“Trust”) and
BlackRock
Bond
Fund,
Inc.
(the
“Corporation”)
are
each
registered
under
the
Investment
Company
Act
of
1940,
as
amended
(the
“1940
Act”),
as open-end
management
investment
companies.
The
Trust
is
organized
as
a
Massachusetts
business
trust.
The
Corporation
is
organized
as
a
Maryland
corporation.
The
following
are
referred
to
herein
collectively
as
the
“Funds”
or
individually
as
a
“Fund”:
Each Fund
offers
multiple
classes
of
shares.
All
classes
of
shares
have
identical
voting,
dividend,
liquidation
and
other
rights
and
are
subject
to
the
same
terms
and
conditions,
except
that
certain
classes
bear
expenses
related
to
the
shareholder
servicing
and
distribution
of
such
shares. Institutional
and
Class
K
Shares
are
sold
without
a
sales
charge
and
only
to
certain
eligible
investors.
Investor
A
Shares
bear
certain
expenses
related
to
shareholder
servicing
of
such
shares.
Investor
A
Shares
are
generally available
through
financial
intermediaries.
Each
class
has
exclusive
voting
rights
with
respect
to
matters
relating
to
its
shareholder
servicing
and
distribution
expenditures.
(a)
Investor
A
Shares
may
be
subject
to
a
CDSC
for
certain
redemptions
where
no
initial
sales
charge
was
paid
at
the
time
of
purchase.
The
Board
of
Trustees
of
BlackRock
Funds
V
and
Board
of
Directors
of
BlackRock
Bond
Fund,
Inc.
are
collectively
referred
to
throughout
this
report
as
the
“Board”,
and
the
directors/trustees
thereof
are
collectively
referred
to
throughout
this
report
as
“Directors”.
The
Funds,
together
with
certain
other
registered
investment
companies
advised
by
BlackRock
Advisors,
LLC
(the
“Manager”) or
its
affiliates,
are
included
in
a
complex
of
funds
referred
to
as
the BlackRock
Fixed-Income
Complex.
2.
SIGNIFICANT
ACCOUNTING
POLICIES
The
financial
statements
are
prepared
in
conformity
with
accounting
principles
generally
accepted
in
the
United
States
of
America
(“U.S.
GAAP”),
which
may
require
management
to
make
estimates
and
assumptions
that
affect
the
reported
amounts
of
assets
and
liabilities
in
the
financial
statements,
disclosure
of
contingent
assets
and
liabilities
at
the
date
of
the
financial
statements
and
the
reported
amounts
of
increases
and
decreases
in
net
assets
from
operations
during
the
reporting
period.
Actual
results
could
differ
from
those
estimates.
Each
Fund
is
considered
an
investment
company
under
U.S.
GAAP
and
follows
the
accounting
and
reporting
guidance
applicable
to
investment
companies.
Below
is
a
summary
of
significant
accounting
policies:
Investment
Transactions
and
Income
Recognition:
For
financial
reporting
purposes,
investment
transactions
are
recorded
on
the
dates
the
transactions
are
executed.
Realized
gains
and
losses
on
investment
transactions
are
determined
using
the
specific
identification
method.
Dividend
income
and
capital
gain
distributions,
if
any,
are
recorded
on
the
ex-dividend
dates.
Non-cash
dividends,
if
any,
are
recorded
on
the
ex-dividend
dates
at
fair
value.
Dividends
from
foreign
securities
where
the
ex-dividend
dates
may
have
passed
are
subsequently
recorded
when
the
Funds
are
informed
of
the
ex-dividend
dates.
Under
the
applicable
foreign
tax
laws,
a
withholding
tax
at
various
rates
may
be
imposed
on
capital
gains,
dividends
and
interest.
Interest
income,
including
amortization
and
accretion
of
premiums
and
discounts
on
debt
securities,
are
recognized
daily
on
an
accrual
basis.
Income,
expenses
and
realized
and
unrealized
gains
and
losses
are
allocated
daily
to
each
class
based
on
its
relative
net
assets.
For
convertible
securities,
premiums
attributable
to
the
debt
instrument
are
amortized,
but
premiums
attributable
to
the
conversion
feature
are
not
amortized.
Foreign
Currency
Translation:
Each
Fund’s
books
and
records
are
maintained
in
U.S.
dollars.
Securities
and
other
assets
and
liabilities
denominated
in
foreign
currencies
are
translated
into
U.S.
dollars
using
exchange
rates
determined
as
of
the
close
of
trading
on
the
New
York
Stock
Exchange
(“NYSE”).
Purchases
and
sales
of
investments
are
recorded
at
the
rates
of
exchange
prevailing
on
the
respective
dates
of
such
transactions.
Generally,
when
the
U.S.
dollar
rises
in
value
against
a
foreign
currency,
the
investments
denominated
in
that
currency
will
lose
value;
the
opposite
effect
occurs
if
the
U.S.
dollar
falls
in
relative
value.
Each
Fund
does
not
isolate
the
effect
of
fluctuations
in
foreign
exchange
rates
from
the
effect
of
fluctuations
in
the
market
prices
of
investments
for
financial
reporting
purposes.
Accordingly,
the
effects
of
changes
in
exchange
rates
on
investments
are
not
segregated
in
the
Statements
of
Operations
from
the
effects
of
changes
in
market
prices
of
those
investments,
but
are
included
as
a
component
of
net
realized
and
unrealized
gain
(loss)
from
investments.
Each
Fund
reports
realized
currency
gains
(losses)
on
foreign
currency
related
transactions
as
components
of
net
realized
gain
(loss)
for
financial
reporting
purposes,
whereas
such
components
are
generally
treated
as
ordinary
income
for
U.S.
federal
income
tax
purposes.
Bank
Overdraft
:
The
Funds
had
outstanding
cash
disbursements
exceeding
deposited
cash
amounts
at
the
custodian
during
the
reporting
period.
The
Funds are
obligated
to
repay
the
custodian
for
any
overdraft,
including
any
related
costs
or
expenses,
where
applicable.
For
financial
reporting
purposes,
overdraft
fees,
if
any,
are
included
in
interest
expense
in
the
Statements
of
Operations.
Collateralization:
If
required
by
an
exchange
or
counterparty
agreement,
the
Funds
may
be
required
to
deliver/deposit
cash
and/or
securities
to/with
an
exchange,
or
broker-
dealer
or
custodian
as
collateral
for
certain
investments.
Distributions:
Distributions
from
net
investment
income
are
declared daily
and
paid
monthly.
Distributions
of
capital
gains
are
recorded
on
the
ex-dividend
dates
and
made
at
least
annually.
The
portion
of
distributions,
if
any,
that
exceeds
a
fund’s
current
and
accumulated
earnings
and
profits,
as
measured
on
a
tax
basis,
constitute
a
non-taxable
return
of
capital.
The
character
and
timing
of
distributions
are
determined
in
accordance
with
U.S.
federal
income
tax
regulations,
which
may
differ
from
U.S.
GAAP.
Registrant
Name
Fund
Name
Herein
Referred
To
As
Diversification
Classification
BlackRock
Funds
V
.....................
BlackRock
Sustainable
High
Yield
Bond
Fund
Sustainable
High
Yield
Bond
Diversified
BlackRock
Bond
Fund,
Inc.
................
BlackRock
Sustainable
Total
Return
Fund
Sustainable
Total
Return
Diversified
Share
Class
Initial
Sales
Charge
Contingent
Deferred
Sales
Charge
(“CDSC”)
Conversion
Privilege
Institutional
and
Class
K
Shares
.....................................
No
No
None
Investor
A
Shares
..............................................
Yes
No
(a)
None
Notes
to
Financial
Statements
(continued)
Notes
to
Financial
Statements
Deferred
Compensation
Plan:
Under
the
Deferred
Compensation
Plan
(the
“Plan”)
approved
by the
Board,
the
Directors
who
are
not
“interested
persons”
of
the
Funds,
as
defined
in
the
1940
Act
(“Independent
Directors
”),
may
defer
a
portion
of
their
annual
complex-wide
compensation.
Deferred
amounts
earn
an
approximate
return
as
though
equivalent
dollar
amounts
had
been
invested
in
common
shares
of
certain
funds
in
the
BlackRock
Fixed-Income
Complex
selected
by
the
Independent
Directors
.
This
has
the
same
economic
effect
for
the
Independent
Directors
as
if
the
Independent
Directors
had
invested
the
deferred
amounts
directly
in
certain
funds
in
the
BlackRock
Fixed-
Income
Complex.
The
Plan
is
not
funded
and
obligations
thereunder
represent
general
unsecured
claims
against
the
general
assets
of
each
Fund,
as
applicable.
Deferred
compensation
liabilities,
if
any, are
included
in
the
Directors’
and
Officer’s
fees
payable
in
the
Statements
of
Assets
and
Liabilities
and
will
remain
as
a
liability
of
the
Funds
until
such
amounts
are
distributed
in
accordance
with
the
Plan. Net
appreciation
(depreciation)
in
the
value
of
participants’
deferral
accounts
is
allocated
among
the
participating
funds
in
the
BlackRock
Fixed-Income
Complex
and
reflected
as Directors
and
Officer
expense
on
the
Statements
of
Operations.
The Directors
and
Officer
expense
may
be
negative
as
a
result
of
a
decrease
in
value
of
the
deferred
accounts.
Indemnifications:
In
the
normal
course
of
business,
a
Fund
enters
into
contracts
that
contain
a
variety
of
representations
that
provide
general
indemnification.
A
Fund’s
maximum
exposure
under
these
arrangements
is
unknown
because
it
involves
future
potential
claims
against
a
Fund,
which
cannot
be
predicted
with
any
certainty.
Other:
Expenses
directly
related
to
a
Fund
or
its
classes
are
charged
to
that
Fund
or
the
applicable
class.
Expenses
directly
related
to
the
Funds
and
other
shared
expenses
prorated
to
the
Funds
are
allocated
daily
to
each
class
based
on
their
relative
net
assets
or
other
appropriate
methods.
Other
operating
expenses
shared
by
several
funds,
including
other
funds
managed
by
the
Manager,
are
prorated
among
those
funds
on
the
basis
of
relative
net
assets
or
other
appropriate
methods.
3.
INVESTMENT
VALUATION
AND
FAIR
VALUE
MEASUREMENTS
Investment
Valuation
Policies:
Each
Fund’s
investments
are
valued
at
fair
value
(also
referred
to
as
“market
value”
within
the
financial
statements)
each
day
that
the
Fund
is
open
for
business
and,
for
financial
reporting
purposes,
as
of
the
report
date.
U.S.
GAAP
defines
fair
value
as
the
price
a
fund
would
receive
to
sell
an
asset
or
pay
to
transfer
a
liability
in
an
orderly
transaction
between
market
participants
at
the
measurement
date.
The
Board
of
each
Fund
has
approved
the
designation
of
each
Fund’s
Manager
as
the
valuation
designee
for
each
Fund.
Each
Fund
determines
the
fair
values
of
its
financial
instruments
using
various
independent
dealers
or
pricing
services
under
the
Manager’s
policies.
If
a
security’s
market
price
is
not
readily
available
or
does
not
otherwise
accurately
represent
the
fair
value
of
the
security,
the
security
will
be
valued
in
accordance
with
the
Manager’s
policies
and
procedures
as
reflecting
fair
value.
The
Manager
has
formed
a
committee
(the
“Valuation
Committee”)
to
develop
pricing
policies
and
procedures
and
to
oversee
the
pricing
function
for
all
financial
instruments,
with
assistance
from
other
BlackRock
pricing
committees.
Fair
Value
Inputs
and
Methodologies:
The
following
methods
and
inputs
are
used
to
establish
the
fair
value
of
each
Fund’s
assets
and
liabilities:
Equity
investments
traded
on
a
recognized
securities
exchange
are
valued
at
that
day’s official
closing
price,
as
applicable,
on
the
exchange
where
the
stock
is
primarily
traded.
Equity
investments
traded
on
a
recognized
exchange
for
which
there
were
no
sales
on
that
day
may
be
valued
at
the
last
trade
or
last
available
bid
(long
positions)
or
ask
(short
positions)
price.
Fixed-income investments
for
which
market
quotations
are
readily
available
are
generally
valued
using
the
last
available
bid
price
or
current
market
quotations
provided
by
independent
dealers
or
third-party
pricing
services. Floating
rate
loan
interests
are
valued
at
the
mean
of
the
bid
prices
from
one
or
more
independent
brokers
or
dealers
as
obtained
from
a
third-party
pricing
service. Pricing
services
generally
value
fixed-income
securities
assuming
orderly
transactions
of
an
institutional
round
lot
size,
but
a
fund
may
hold
or
transact
in
such
securities
in
smaller,
odd
lot
sizes.
Odd
lots
may
trade
at
lower
prices
than
institutional
round
lots.
The
pricing
services
may
use
matrix
pricing
or
valuation
models
that
utilize
certain
inputs
and
assumptions
to
derive
values,
including
transaction
data
(e.g.,
recent
representative
bids
and
offers),
market
data, credit
quality
information,
perceived
market
movements,
news,
and
other
relevant
information.
Certain
fixed-income
securities,
including
asset-
backed
and
mortgage
related
securities
may
be
valued
based
on
valuation
models
that
consider
the
estimated
cash
flows
of
each
tranche
of
the
entity,
establish
a
benchmark
yield
and
develop
an
estimated
tranche
specific
spread
to
the
benchmark
yield
based
on
the
unique
attributes
of
the
tranche.
The
amortized
cost
method
of
valuation
may
be
used
with
respect
to
debt
obligations
with
sixty
days
or
less
remaining
to
maturity
unless
the
Manager
determines
such
method
does
not
represent
fair
value.
Investments
in
open-end
U.S.
mutual
funds
(including
money
market
funds) are
valued
at
that
day’s
net
asset
value
(“NAV”).
Futures
contracts
are valued
based
on
that
day’s
last
reported
settlement
or
trade price
on
the
exchange
where
the
contract
is
traded.
Forward
foreign
currency
exchange
contracts
are
valued
at
the
mean
between
the
bid
and
ask
prices
and
are
determined
as
of
the
close
of
trading
on
the
NYSE
based
on
that
day’s
prevailing
forward
exchange
rate
for
the
underlying
currencies.
Exchange-traded
options
are
valued
at
the
mean
between
the
last bid
and
ask
prices
at
the
close
of
the
options
market in
which
the
options
trade.
An
exchange-
traded
option
for
which there
is
no
mean
price
is
valued
at
the
last
bid
(long
positions)
or
ask
(short
positions)
price.
If
no
bid
or
ask
price
is
available,
the
prior
day’s
price will
be
used,
unless
it
is
determined
that
the
prior
day’s
price
no
longer
reflects
the
fair
value
of
the
option.
Over-the-counter
(“OTC”)
options
and
options
on
swaps
(“swaptions”)
are
valued
by
an
independent
pricing
service
using
a
mathematical
model,
which
incorporates
a
number
of
market
data
factors,
such
as
the
trades
and
prices
of
the
underlying
instruments.
Interest
rate,
credit
default,
inflation
and
currency
swap
agreements
are
valued
utilizing
quotes
received
daily
by
independent pricing
services
or
through
brokers,
which
are
derived
using
daily
swap
curves
and
models
that
incorporate
market
data
and discounted
cash
flows.
Total
return
swap
agreements
are
valued
utilizing
quotes
received
daily
by
independent
pricing
services
or
through
brokers,
which
are
derived
using
models
that
incorporate
market
trades
and
fair
value
of
the
underlying
reference
instruments.
Notes
to
Financial
Statements
(continued)
2024
BlackRock
Annual
Financial
Statements
and
Additional
Information
Generally,
trading
in
foreign
instruments
is
substantially
completed
each
day
at
various
times
prior
to
the
close
of
trading
on
the
NYSE.
Each
business
day,
the
Funds
use
current
market
factors
supplied
by
independent
pricing
services
to
value
certain
foreign
instruments
(“Systematic
Fair
Value
Price”).
The
Systematic
Fair
Value
Price
is
designed
to
value
such
foreign
securities
at
fair
value
as
of
the
close
of
trading
on
the
NYSE,
which occurs
after
the
close
of
the
local
markets.
If
events
(e.g.,
market
volatility,
company
announcement or
a
natural
disaster)
occur
that
are
expected
to
materially
affect
the
value
of
such
investment,
or
in
the
event
that application
of
these
methods
of
valuation
results
in
a
price
for
an
investment
that
is
deemed
not
to
be
representative
of
the
market
value
of
such
investment,
or
if
a
price
is
not
available,
the
investment
will
be
valued
by
the
Valuation
Committee
in
accordance
with
the
Manager’s
policies
and
procedures
as
reflecting
fair
value
(“Fair
Valued
Investments”).
The
fair
valuation
approaches
that
may
be
used
by
the
Valuation
Committee include
market
approach,
income
approach
and
cost
approach.
Valuation
techniques
such
as
discounted
cash
flow,
use
of
market
comparables
and
matrix
pricing
are
types
of
valuation
approaches
and
are
typically
used
in
determining
fair
value.
When
determining
the
price
for
Fair
Valued
Investments,
the
Valuation
Committee
seeks
to
determine
the
price
that
each
Fund
might
reasonably
expect
to
receive
or
pay
from
the
current
sale
or
purchase
of
that
asset
or
liability
in
an
arm’s-length
transaction.
Fair
value
determinations
shall
be
based
upon
all
available
factors
that
the
Valuation
Committee
deems
relevant
and
consistent
with
the
principles
of
fair
value
measurement
as
of
the
measurement
date.
For
investments
in
equity
or
debt
issued
by
privately
held
companies
or
funds
(“Private
Company”
or
collectively,
the
“Private
Companies”)
and
other
Fair
Valued
Investments,
the
fair
valuation
approaches
that
are
used
by
the
Valuation
Committee
and
third-party
pricing
services
utilized
by
the
Valuation
Committee
include one
or
a
combination
of,
but
not
limited
to,
the
following
inputs:
(i)
recent
market
transactions,
including
secondary
market
transactions,
merger
or
acquisition
activity
and
subsequent
rounds
of
financing
in
the
underlying
investment
or
comparable
issuers
(ii)
recapitalizations
and
other
transactions
across
the
capital
structure
(iii)
market
or
relevant
indices
multiples
of
comparable
issuers
(iv)
future
cash
flows
discounted
to
present
and
adjusted
as
appropriate
for
liquidity,
credit,
and/or
market
risks
(v)
quoted
prices
for
similar
investments
or
assets
in
active
markets
(vi)
other
risk
factors,
such
as
interest
rates,
yield
curves,
volatilities,
prepayment
speeds,
loss
severities,
credit
risks,
recovery
rates,
liquidation
amounts
and/
or default
rates
(vii) audited
or
unaudited
financial
statements,
investor
communications
and
Private
Company
financial
or
operational
metrics
(viii) relevant
market
news
and
other
public
sources.
Investments
in
series
of
preferred
stock
issued
by
Private
Companies
are
typically
valued
utilizing
a
market
approach to
determine the
enterprise
value
of
the
company.
Such
investments
often
contain
rights
and
preferences
that
differ
from
other
series
of
preferred
and
common
stock
of
the
same
issuer.
Enterprise
valuation
techniques
such
as
an
option
pricing
model
(“OPM”),
a
probability
weighted
expected
return
model
(“PWERM”),
current
value
method or
a
hybrid
of
those
techniques
are
used
as
deemed
appropriate
under
the
circumstances.
The
use
of these
valuation techniques
involves
a
determination
of
the
exit
scenarios
of
the
investment
in
order
to
appropriately
allocate
the
enterprise
value
of
the
company
among
the
various
parts
of
its
capital
structure.
Private
Companies
are
not
subject
to
public
company
disclosure,
timing,
and
reporting
standards
applicable
to other
investments
held
by
a
Fund. Certain
information
made
available
by
a
Private
Company
is
as
of
a
date
that
is
earlier
than
the
date
a
Fund
is
calculating
its
NAV.
This
factor
may
result
in
a
difference
between
the
value
of
the
investment
and
the
price
a
Fund
could
receive
upon
the
sale
of
the
investment.
Fair
Value
Hierarchy:
Various
inputs
are
used
in
determining
the
fair
value
of
financial
instruments
at
the
measurement
date.
These
inputs
to
valuation
techniques
are
categorized
into
a
fair
value
hierarchy
consisting
of
three
broad
levels
for
financial reporting purposes
as
follows:
Level
1
—
Unadjusted
price
quotations
in
active
markets/exchanges
that
each
Fund
has
the
ability
to
access
for
identical
assets
or
liabilities;
Level
2
—
Inputs
other
than
quoted
prices
included
within
level
1
that
are
observable
for
the
asset
or
liability,
either
directly
or
indirectly;
and
Level
3 —
Inputs
that
are
unobservable
and
significant
to
the
entire
fair
value
measurement
for the
asset
or
liability
(including
the
Valuation
Committee’s
assumptions
used
in
determining
the
fair
value
of
financial
instruments).
The
hierarchy
gives
the
highest
priority
to
unadjusted
quoted
prices
in
active
markets
for
identical
assets
or
liabilities
(Level
1
measurements)
and
the
lowest
priority
to
unobservable
inputs
(Level
3
measurements).
Accordingly,
the
degree
of
judgment
exercised
in
determining
fair
value
is
greatest
for
instruments
categorized
in
Level
3.
The
inputs
used
to
measure
fair
value
may
fall
into
different
levels
of
the
fair
value
hierarchy.
In
such
cases,
for
disclosure
purposes,
the
fair
value
hierarchy
classification
is
determined
based
on
the
lowest
level
input
that
is
significant
to
the
fair
value
measurement
in
its
entirety. Investments
classified
within
Level
3
have
significant
unobservable
inputs
used
by
the
Valuation
Committee
in
determining
the
price
for
Fair
Valued
Investments.
Level
3
investments
include
equity
or
debt
issued
by
Private
Companies
that
may
not
have
a
secondary
market
and/or
may
have
a
limited
number
of
investors.
The
categorization
of
a
value
determined
for
financial
instruments
is
based
on
the
pricing
transparency
of
the financial
instruments
and
is
not
necessarily
an
indication
of
the
risks
associated
with
investing
in
those
securities.
Notes
to
Financial
Statements
(continued)
Notes
to
Financial
Statements
4.
SECURITIES
AND
OTHER
INVESTMENTS
Asset-Backed
and
Mortgage-Backed
Securities:
Asset-backed
securities
are
generally
issued
as
pass-through
certificates
or
as
debt
instruments.
Asset-backed
securities
issued
as
pass-through
certificates
represent
undivided
fractional
ownership
interests
in
an
underlying
pool
of
assets.
Asset-backed
securities
issued
as
debt
instruments,
which
are
also
known
as
collateralized
obligations,
are
typically
issued
as
the
debt
of
a
special
purpose
entity
organized
solely
for
the
purpose
of
owning
such
assets
and
issuing
such
debt.
Asset-backed
securities
are
often
backed
by
a
pool
of
assets
representing
the
obligations
of
a
number
of
different
parties.
The
yield
characteristics
of
certain
asset-backed
securities
may
differ
from
traditional
debt
securities.
One
such
major
difference
is
that
all
or
a
principal
part
of
the
obligations
may
be
prepaid
at
any
time
because
the
underlying
assets
(i.e.,
loans)
may
be
prepaid
at
any
time.
As
a
result,
a
decrease
in
interest
rates
in
the
market
may
result
in
increases
in
the
level
of
prepayments
as
borrowers,
particularly
mortgagors,
refinance
and
repay
their
loans.
An
increased
prepayment
rate
with
respect
to
an
asset-backed
security
will
have
the
effect
of
shortening
the
maturity
of
the
security.
In
addition,
a
fund
may
subsequently
have
to
reinvest
the
proceeds
at
lower
interest
rates.
If
a
fund
has
purchased
such
an
asset-backed
security
at
a
premium,
a
faster
than
anticipated
prepayment
rate
could
result
in
a
loss
of
principal
to
the
extent
of
the
premium
paid.
For
mortgage
pass-through
securities
(the
“Mortgage
Assets”)
there
are
a
number
of
important
differences
among
the
agencies
and
instrumentalities
of
the
U.S.
Government
that
issue
mortgage-related
securities
and
among
the
securities
that
they
issue.
For
example,
mortgage-related
securities
guaranteed
by
Ginnie
Mae
are
guaranteed
as
to
the
timely
payment
of
principal
and
interest
by
Ginnie
Mae
and
such
guarantee
is
backed
by
the
full
faith
and
credit
of
the
United
States.
However,
mortgage-related
securities
issued
by
Freddie
Mac
and
Fannie
Mae,
including
Freddie
Mac
and
Fannie
Mae
guaranteed
mortgage
pass-through
certificates,
which
are
solely
the
obligations
of
Freddie
Mac
and
Fannie
Mae,
are
not
backed
by
or
entitled
to
the
full
faith
and
credit
of
the
United
States,
but
are
supported
by
the
right
of
the
issuer
to
borrow
from
the
U.S.
Treasury.
Non-agency
mortgage-backed
securities
are
securities
issued
by
non-governmental
issuers
and
have
no
direct
or
indirect
government
guarantees
of
payment
and
are
subject
to
various
risks.
Non-agency
mortgage
loans
are
obligations
of
the
borrowers
thereunder
only
and
are
not
typically
insured
or
guaranteed
by
any
other
person
or
entity.
The
ability
of
a
borrower
to
repay
a
loan
is
dependent
upon
the
income
or
assets
of
the
borrower.
A
number
of
factors,
including
a
general
economic
downturn,
acts
of
God,
terrorism,
social
unrest
and
civil
disturbances,
may
impair
a
borrower’s
ability
to
repay
its
loans.
Collateralized
Debt
Obligations:
Collateralized
debt
obligations
(“CDOs”),
including
collateralized
bond
obligations
(“CBOs”)
and
collateralized
loan
obligations
(“CLOs”),
are
types
of
asset-backed
securities.
A
CDO
is
an
entity
that
is
backed
by
a
diversified
pool
of
debt
securities
(CBOs)
or
syndicated
bank
loans
(CLOs).
The
cash
flows
of
the
CDO
can
be
split
into
multiple
segments,
called
“tranches,”
which
will
vary
in
risk
profile
and
yield.
The
riskiest
segment
is
the
subordinated
or
“equity”
tranche.
This
tranche
bears
the
greatest
risk
of
defaults
from
the
underlying
assets
in
the
CDO
and
serves
to
protect
the
other,
more
senior,
tranches
from
default
in
all
but
the
most
severe
circumstances.
Since
it
is
shielded
from
defaults
by
the
more
junior
tranches,
a
“senior”
tranche
will
typically
have
higher
credit
ratings
and
lower
yields
than
their
underlying
securities,
and
often
receive
investment
grade
ratings
from
one
or
more
of
the
nationally
recognized
rating
agencies.
Despite
the
protection
from
the
more
junior
tranches,
senior
tranches
can
experience
substantial
losses
due
to
actual
defaults,
increased
sensitivity
to
future
defaults
and
the
disappearance
of
one
or
more
protecting
tranches
as
a
result
of
changes
in
the
credit
profile
of
the
underlying
pool
of
assets.
Multiple
Class
Pass-Through
Securities:
Multiple
class
pass-through
securities,
including
collateralized
mortgage
obligations
(“CMOs”)
and
commercial
mortgage-backed
securities,
may
be
issued
by
Ginnie
Mae,
U.S.
Government
agencies
or
instrumentalities
or
by
trusts
formed
by
private
originators
of,
or
investors
in,
mortgage
loans.
In
general,
CMOs
are
debt
obligations
of
a
legal
entity
that
are
collateralized
by
a
pool
of
residential
or
commercial
mortgage
loans
or
Mortgage
Assets.
The
payments
on
these
are
used
to
make
payments
on
the
CMOs
or
multiple
pass-through
securities.
Multiple
class
pass-through
securities
represent
direct
ownership
interests
in
the
Mortgage
Assets.
Classes
of
CMOs
include
interest
only
(“IOs”),
principal
only
(“POs”),
planned
amortization
classes
and
targeted
amortization
classes.
IOs
and
POs
are
stripped
mortgage-backed
securities
representing
interests
in
a
pool
of
mortgages,
the
cash
flow
from
which
has
been
separated
into
interest
and
principal
components.
IOs
receive
the
interest
portion
of
the
cash
flow
while
POs
receive
the
principal
portion.
IOs
and
POs
can
be
extremely
volatile
in
response
to
changes
in
interest
rates.
As
interest
rates
rise
and
fall,
the
value
of
IOs
tends
to
move
in
the
same
direction
as
interest
rates.
POs
perform
best
when
prepayments
on
the
underlying
mortgages
rise
since
this
increases
the
rate
at
which
the
principal
is
returned
and
the
yield
to
maturity
on
the
PO.
When
payments
on
mortgages
underlying
a
PO
are
slower
than
anticipated,
the
life
of
the
PO
is
lengthened
and
the
yield
to
maturity
is
reduced.
If
the
underlying
Mortgage
Assets
experience
greater
than
anticipated
prepayments
of
principal,
a
fund’s
initial
investment
in
the
IOs
may
not
fully
recoup.
Stripped
Mortgage-Backed
Securities:
Stripped
mortgage-backed
securities
are
typically
issued
by
the
U.S.
Government,
its
agencies
and
instrumentalities.
Stripped
mortgage-backed
securities
are
usually
structured
with
two
classes
that
receive
different
proportions
of
the
interest
(IOs)
and
principal
(POs)
distributions
on
a
pool
of
Mortgage
Assets.
Stripped
mortgage-backed
securities
may
be
privately
issued.
Zero-Coupon
Bonds:
Zero-coupon
bonds
are
normally
issued
at
a
significant
discount
from
face
value
and
do
not
provide
for
periodic
interest
payments.
These
bonds
may
experience
greater
volatility
in
market
value
than
other
debt
obligations
of
similar
maturity
which
provide
for
regular
interest
payments.
Capital
Securities
and
Trust
Preferred
Securities:
Capital
securities,
including
trust
preferred
securities,
are
typically
issued
by
corporations,
generally
in
the
form
of
interest-bearing
notes
with
preferred
securities
characteristics.
In
the
case
of
trust
preferred
securities,
an
affiliated
business
trust
of
a
corporation
issues
these
securities,
generally
in
the
form
of
beneficial
interests
in
subordinated
debentures
or
similarly
structured
securities.
The
securities
can
be
structured
with
either
a
fixed
or
adjustable
coupon
that
can
have
either
a
perpetual
or
stated
maturity
date.
For
trust
preferred
securities,
the
issuing
bank
or
corporation
pays
interest
to
the
trust,
which
is
then
distributed
to
holders
of
these
securities
as
a
dividend.
Dividends
can
be
deferred
without
creating
an
event
of
default
or
acceleration,
although
maturity
cannot
take
place
unless
all
cumulative
payment
obligations
have
been
met.
The
deferral
of
payments
does
not
affect
the
purchase
or
sale
of
these
securities
in
the
open
market.
These
securities
generally
are
rated
below
that
of
the
issuing
company’s
senior
debt
securities
and
are
freely
callable
at
the
issuer’s
option.
Preferred
Stocks:
Preferred
stock
has
a
preference
over
common
stock
in
liquidation
(and
generally
in
receiving
dividends
as
well),
but
is
subordinated
to
the
liabilities
of
the
issuer
in
all
respects.
As
a
general
rule,
the
market
value
of
preferred
stock
with
a
fixed
dividend
rate
and
no
conversion
element
varies
inversely
with
interest
rates
and
perceived
credit
risk,
while
the
market
price
of
convertible
preferred
stock
generally
also
reflects
some
element
of
conversion
value.
Because
preferred
stock
is
junior
to
debt
securities
and
other
obligations
of
the
issuer,
deterioration
in
the
credit
quality
of
the
issuer
will
cause
greater
changes
in
the
value
of
a
preferred
stock
than
in
a
more
senior
debt
security
with
similar
stated
yield
characteristics.
Unlike
interest
payments
on
debt
securities,
preferred
stock
dividends
are
payable
only
if
declared
by
the
issuer’s
board
of
directors.
Preferred
stock
also
may
be
subject
to
optional
or
mandatory
redemption
provisions.
Notes
to
Financial
Statements
(continued)
2024
BlackRock
Annual
Financial
Statements
and
Additional
Information
Floating
Rate
Loan
Interests:
Floating
rate
loan
interests
are
typically
issued
to
companies
(the
“borrower”)
by
banks,
other
financial
institutions,
or
privately
and
publicly
offered
corporations
(the
“lender”).
Floating
rate
loan
interests
are
generally
non-investment
grade,
often
involve
borrowers
whose
financial
condition
is
troubled
or
uncertain
and
companies
that
are
highly
leveraged
or
in
bankruptcy
proceedings.
In
addition,
transactions
in
floating
rate
loan
interests
may
settle
on
a
delayed
basis,
which
may
result
in
proceeds
from
the
sale
not
being
readily
available
for
a
fund
to
make
additional
investments
or
meet
its
redemption
obligations.
Floating
rate
loan
interests
may
include
fully
funded
term
loans
or
revolving
lines
of
credit.
Floating
rate
loan
interests
are
typically
senior
in
the
corporate
capital
structure
of
the
borrower.
Floating
rate
loan
interests
generally
pay
interest
at
rates
that
are
periodically
determined
by
reference
to
a
base
lending
rate
plus
a
premium.
Since
the
rates
reset
only
periodically,
changes
in
prevailing
interest
rates
(and
particularly
sudden
and
significant
changes)
can
be
expected
to
cause
some
fluctuations
in
the
NAV
of
a
fund
to
the
extent
that
it
invests
in
floating
rate
loan
interests.
The
base
lending
rates
are
generally
the
lending
rate
offered
by
one
or
more
European
banks,
such
as
the
Secured
Overnight
Financing
Rate
(“SOFR”),
the
prime
rate
offered
by
one
or
more
U.S.
banks
or
the
certificate
of
deposit
rate.
Floating
rate
loan
interests
may
involve
foreign
borrowers,
and
investments
may
be
denominated
in
foreign
currencies.
These
investments
are
treated
as
investments
in
debt
securities
for
purposes
of
a
fund’s
investment
policies.
When
a
fund
purchases
a
floating
rate
loan
interest,
it
may
receive
a
facility
fee
and
when
it
sells
a
floating
rate
loan
interest,
it
may
pay
a
facility
fee.
On
an
ongoing
basis,
a
fund
may
receive
a
commitment
fee
based
on
the
undrawn
portion
of
the
underlying
line
of
credit
amount
of
a
floating
rate
loan
interest.
Facility
and
commitment
fees
are
typically
amortized
to
income
over
the
term
of
the
loan
or
term
of
the
commitment,
respectively.
Consent
and
amendment
fees
are
recorded
to
income
as
earned.
Prepayment
penalty
fees,
which
may
be
received
by
a
fund
upon
the
prepayment
of
a
floating
rate
loan
interest
by
a
borrower,
are
recorded
as
realized
gains.
A
fund
may
invest
in
multiple
series
or
tranches
of
a
loan.
A
different
series
or
tranche
may
have
varying
terms
and
carry
different
associated
risks.
Floating
rate
loan
interests
are
usually
freely
callable
at
the
borrower’s
option.
A
fund
may
invest
in
such
loans
in
the
form
of
participations
in
loans
(“Participations”)
or
assignments
(“Assignments”)
of
all
or
a
portion
of
loans
from
third
parties.
Participations
typically
will
result
in
a
fund
having
a
contractual
relationship
only
with
the
lender,
not
with
the
borrower.
A
fund
has
the
right
to
receive
payments
of
principal,
interest
and
any
fees
to
which
it
is
entitled
only
from
the
lender
selling
the
Participation
and
only
upon
receipt
by
the
lender
of
the
payments
from
the
borrower.
In
connection
with
purchasing
Participations,
a
fund
generally
will
have
no
right
to
enforce
compliance
by
the
borrower
with
the
terms
of
the
loan
agreement,
nor
any
rights
of
offset
against
the
borrower.
A
fund
may
not
benefit
directly
from
any
collateral
supporting
the
loan
in
which
it
has
purchased
the
Participation.
As
a
result,
a
fund
assumes
the
credit
risk
of
both
the
borrower
and
the
lender
that
is
selling
the
Participation.
A
fund’s
investment
in
loan
participation
interests
involves
the
risk
of
insolvency
of
the
financial
intermediaries
who
are
parties
to
the
transactions.
In
the
event
of
the
insolvency
of
the
lender
selling
the
Participation,
a
fund
may
be
treated
as
a
general
creditor
of
the
lender
and
may
not
benefit
from
any
offset
between
the
lender
and
the
borrower.
Assignments
typically
result
in
a
fund
having
a
direct
contractual
relationship
with
the
borrower,
and
a
fund
may
enforce
compliance
by
the
borrower
with
the
terms
of
the
loan
agreement.
TBA
Commitments:
TBA
commitments
are
forward
agreements
for
the
purchase
or
sale
of
securities,
including
mortgage-backed
securities
for
a
fixed
price,
with
payment
and
delivery
on
an
agreed
upon
future
settlement
date.
The
specific
securities
to
be
delivered
are
not
identified
at
the
trade
date.
However,
delivered
securities
must
meet
specified
terms,
including
issuer,
rate
and
mortgage
terms.
When
entering
into
TBA
commitments,
a
fund
may
take
possession
of
or
deliver
the
underlying
mortgage-backed
securities
but
can
extend
the
settlement
or
roll
the
transaction.
TBA
commitments
involve
a
risk
of
loss
if
the
value
of
the
security
to
be
purchased
or
sold
declines
or
increases,
respectively,
prior
to
settlement
date,
if
there
are
expenses
or
delays
in
connection
with
the
TBA
transactions,
or
if
the
counterparty
fails
to
complete
the
transaction.
In
order
to
better
define
contractual
rights
and
to
secure
rights
that
will
help
a
fund
mitigate its
counterparty
risk,
TBA
commitments
may
be
entered
into
by
a
fund
under
Master
Securities
Forward
Transaction
Agreements
(each,
an
“MSFTA”).
An
MSFTA
typically
contains,
among
other
things,
collateral
posting
terms
and
netting
provisions
in
the
event
of
default
and/or
termination
event. The
collateral
requirements
are
typically
calculated
by
netting
the
mark-to-market
amount
for
each
transaction
under
such
agreement
and
comparing
that
amount
to
the
value
of
the
collateral
currently
pledged
by
a
fund
and
the
counterparty. Cash
collateral
that
has
been
pledged
to
cover
the
obligations
of
a
fund
and
cash
collateral
received
from
the
counterparty,
if
any,
is
reported
separately
in
the
Statements
of
Assets
and
Liabilities
as
cash
pledged
as
collateral
for
TBA
commitments
or
cash
received
as
collateral
for
TBA
commitments,
respectively.
Non-cash
collateral
pledged
by
a
fund,
if
any,
is
noted
in
the
Schedules
of
Investments. Typically,
a
fund
is
permitted
to
sell,
re-pledge
or
use
the
collateral
it
receives;
however,
the
counterparty
is
not
permitted
to
do
so.
To
the
extent
amounts
due
to
a
fund
are
not
fully
collateralized,
contractually
or
otherwise,
a
fund
bears
the
risk
of
loss
from
counterparty
non-performance.
Mortgage
Dollar
Roll
Transactions
:
The
Funds
may
sell
TBA
mortgage-backed
securities
and
simultaneously
contract
to
repurchase
substantially
similar
(i.e.,
same
type,
coupon
and
maturity)
securities
on
a
specific
future
date
at
an
agreed
upon
price.
During
the
period
between
the
sale
and
repurchase,
a
fund
is
not
entitled
to
receive
interest
and
principal
payments
on
the
securities
sold.
Mortgage
dollar
roll
transactions
are
treated
as
purchases
and
sales
and
a
fund realizes
gains
and
losses
on
these
transactions.
Mortgage
dollar
rolls
involve
the
risk
that
the
market
value
of
the
securities
that
a
fund
is
required
to
purchase
may
decline
below
the
agreed
upon
repurchase
price
of
those
securities.
5.
Derivative
Financial
Instruments
The
Funds
engage
in
various
portfolio
investment
strategies
using
derivative
contracts
both
to
increase
the
returns
of
the
Funds
and/or
to
manage
their
exposure
to
certain
risks
such
as
credit
risk,
equity
risk,
interest
rate
risk,
foreign
currency
exchange
rate
risk,
commodity
price
risk
or
other
risks
(e.g.,
inflation
risk).
Derivative
financial
instruments
categorized
by
risk
exposure
are
included
in
the
Schedules
of
Investments.
These
contracts
may
be
transacted
on
an
exchange
or
OTC.
Futures
Contracts:
Futures
contracts
are
purchased
or
sold
to
gain
exposure
to,
or
manage
exposure
to,
changes
in
interest
rates
(interest
rate
risk)
and
changes
in
the
value
of
equity
securities
(equity
risk)
or
foreign
currencies
(foreign
currency
exchange
rate
risk)
.
Futures
contracts
are
exchange-traded agreements
between
the
Funds
and
a
counterparty
to
buy
or
sell
a
specific
quantity
of
an
underlying
instrument
at
a
specified
price
and
on
a
specified
date.
Depending
on
the
terms
of
a
contract,
it
is
settled
either
through
physical
delivery
of
the
underlying
instrument
on
the
settlement
date
or
by
payment
of
a
cash
amount
on
the
settlement
date.
Upon
entering
into
a
futures
contract,
the
Funds
are
required
to
deposit
initial
margin
with
the
broker
in
the
form
of
cash
or
securities
in
an
amount
that
varies
depending
on
a
contract’s
size
and
risk
profile.
The
initial
margin
deposit
must
then
be
maintained
at
an
established
level
over
the
life
of
the
contract.
Amounts
pledged,
which
are
considered
restricted,
are
included
in
cash
pledged
for
futures
contracts
in
the
Statements
of
Assets
and
Liabilities.
Securities
deposited
as
initial
margin
are
designated
in
the
Schedules
of
Investments
and
cash
deposited,
if
any, are
shown
as
cash
pledged
for
futures
contracts
in
the
Statements
of
Assets
and
Liabilities.
Pursuant
to
the
contract,
the
Funds
agree
to
receive
from
or
pay
to
the
broker
an
amount
of
cash
equal
to
the
daily
fluctuation
in
market
Notes
to
Financial
Statements
(continued)
Notes
to
Financial
Statements
value
of
the
contract
(“variation
margin”).
Variation
margin
is
recorded
as
unrealized
appreciation
(depreciation)
and,
if
any,
shown
as
variation
margin
receivable
(or
payable)
on
futures
contracts
in
the
Statements
of
Assets
and
Liabilities.
When
the
contract
is
closed,
a
realized
gain
or
loss
is
recorded
in
the
Statements
of
Operations
equal
to
the
difference
between
the
notional
amount
of
the
contract
at
the
time
it
was
opened
and
the
notional
amount
at
the
time
it
was
closed.
The
use
of
futures
contracts
involves
the
risk
of
an
imperfect
correlation
in
the
movements
in
the
price
of
futures
contracts
and
interest
rates,
foreign
currency
exchange
rates
or
underlying
assets.
Forward
Foreign
Currency
Exchange
Contracts
:
Forward
foreign
currency
exchange
contracts
are
entered
into
to
gain
or
reduce
exposure
to
foreign
currencies
(foreign
currency
exchange
rate
risk).
A
forward
foreign
currency
exchange
contract
is
an
agreement
between
two
parties
to
buy
and
sell
a
currency
at
a
set
exchange
rate
on
a
specified
date.
These
contracts
help
to
manage
the
overall
exposure
to
the
currencies
in
which
some
of
the
investments
held
by
the
Funds
are
denominated
and
in
some
cases,
may
be
used
to
obtain
exposure
to
a
particular
market.
The
contracts
are
traded
OTC
and
not
on
an
organized
exchange.
The
contract
is
marked-to-market
daily
and
the
change
in
market
value
is
recorded
as
unrealized
appreciation
(depreciation)
in
the
Statements
of
Assets
and
Liabilities.
When
a
contract
is
closed,
a
realized
gain
or
loss
is
recorded
in
the
Statements
of
Operations
equal
to
the
difference
between
the
value
at
the
time
it
was
opened
and
the
value
at
the
time
it
was
closed.
Non-deliverable
forward
foreign
currency
exchange
contracts
are
settled
with
the
counterparty
in
cash
without
the
delivery
of
foreign
currency.
The
use
of
forward
foreign
currency
exchange
contracts
involves
the
risk
that
the
value
of
a
forward
foreign
currency
exchange
contract
changes
unfavorably
due
to
movements
in
the
value
of
the
referenced
foreign
currencies,
and
such
value
may
exceed
the
amount(s)
reflected
in
the
Statements
of
Assets
and
Liabilities. Cash
amounts
pledged
for
forward
foreign
currency
exchange
contracts
are
considered
restricted
and
are
included
in
cash
pledged
as
collateral
for
OTC
derivatives
in
the
Statements
of
Assets
and
Liabilities. The
Fund’s
risk
of
loss
from
counterparty
credit
risk
on
OTC
derivatives
is
generally
limited
to
the
aggregate
unrealized
gain
netted
against
any
collateral
held
by
the
Fund.
Options:
The
Funds
may purchase
and
write
call
and
put
options
to
increase
or
decrease
their
exposure
to
the
risks
of
underlying
instruments,
including
equity
risk,
interest
rate
risk
and/or
commodity
price
risk
and/or,
in
the
case
of
options
written,
to
generate
gains
from
options
premiums.
A
call
option
gives
the
purchaser
(holder)
of
the
option
the
right
(but
not
the
obligation)
to
buy,
and
obligates
the
seller
(writer)
to
sell
(when
the
option
is
exercised)
the
underlying
instrument
at
the
exercise
or
strike
price
at
any
time
or
at
a
specified
time
during
the
option
period.
A
put
option
gives
the
holder
the
right
to
sell
and
obligates
the
writer
to
buy
the
underlying
instrument
at
the
exercise
or
strike
price
at
any
time
or
at
a
specified
time
during
the
option
period.
Premiums
paid
on
options
purchased
and
premiums
received
on
options
written,
as
well
as
the
daily
fluctuation
in
market
value,
are
included
in
investments
at
value
–
unaffiliated
and
options
written
at
value,
respectively,
in
the
Statements
of
Assets
and
Liabilities.
When
an
instrument
is
purchased
or
sold
through
the
exercise
of
an
option,
the
premium
is
offset
against
the
cost
or
proceeds
of
the
underlying
instrument.
When
an
option
expires,
a
realized
gain
or
loss
is
recorded
in
the
Statements
of
Operations
to
the
extent
of
the
premiums
received
or
paid.
When
an
option
is
closed
or
sold,
a
gain
or
loss
is
recorded
in
the
Statements
of
Operations
to
the
extent
the
cost
of
the
closing
transaction
exceeds
the
premiums
received
or
paid.
When
the
Funds
write
a
call
option,
such
option
is
typically
“covered,”
meaning
that
they
hold
the
underlying
instrument
subject
to
being
called
by
the
option
counterparty.
When
the
Funds
write
a
put
option,
cash
is
segregated
in
an
amount
sufficient
to
cover
the
obligation.
These
amounts,
which
are
considered
restricted,
are
included
in
cash
pledged
as
collateral
for
options
written
in
the
Statements
of
Assets
and
Liabilities.
Swaptions
–
The
Funds
may purchase
and
write options
on
swaps
(“swaptions”)
primarily
to
preserve
a
return
or
spread
on
a
particular
investment
or
portion
of
the
Funds’
holdings,
as
a
duration
management
technique
or
to
protect
against
an
increase
in
the
price
of
securities
it
anticipates
purchasing
at
a
later
date.
The
purchaser
and
writer
of
a
swaption
is
buying
or
granting
the
right
to
enter
into
a
previously
agreed
upon
interest
rate
or
credit
default
swap
agreement
(interest
rate
risk
and/or
credit
risk)
at
any
time
before
the
expiration
of
the
option.
Foreign
currency
options
– The
Funds
may purchase
and
write
foreign
currency
options,
foreign
currency
futures
and
options
on
foreign
currency
futures
to
gain
or
reduce
exposure
to
foreign
currencies
(foreign
currency
exchange
rate
risk).
Foreign
currency
options
give
the
purchaser
the
right
to
buy
from
or
sell
to
the
writer
a
foreign
currency
at
any
time
before
the
expiration
of
the
option.
In
purchasing
and
writing
options,
the
Funds
bear
the
risk
of
an
unfavorable
change
in
the
value
of
the
underlying
instrument
or
the
risk
that
they
may
not
be
able
to
enter
into
a
closing
transaction
due
to
an
illiquid
market.
Exercise
of
a
written
option
could
result
in
the
Funds
purchasing
or
selling
a
security
when they
otherwise
would
not,
or
at
a
price
different
from
the
current
market
value.
Swaps:
Swap
contracts
are
entered
into
to
manage
exposure
to
issuers,
markets
and
securities.
Such
contracts
are
agreements
between
the
Funds
and
a
counterparty
to
make
periodic
net
payments
on
a
specified
notional
amount
or
a
net
payment
upon
termination.
Swap
agreements
are
privately
negotiated
in
the
OTC
market
and
may
be
entered
into
as
a
bilateral
contract
(“OTC
swaps”)
or
centrally
cleared
(“centrally
cleared
swaps”).
For
OTC
swaps,
any
upfront
premiums
paid
and
any
upfront
fees
received
are
shown
as
swap
premiums
paid
and
swap
premiums
received,
respectively,
in
the
Statements
of
Assets
and
Liabilities
and
amortized
over
the
term
of
the
contract.
The
daily
fluctuation
in
market
value
is
recorded
as
unrealized
appreciation
(depreciation)
on
OTC
swaps
in
the
Statements
of
Assets
and
Liabilities.
Payments
received
or
paid
are
recorded
in
the
Statements
of
Operations
as
realized
gains
or
losses,
respectively.
When
an
OTC
swap
is
terminated,
a
realized
gain
or
loss
is
recorded
in
the
Statements
of
Operations
equal
to
the
difference
between
the
proceeds
from
(or
cost
of)
the
closing
transaction
and
the
Funds’
basis
in
the
contract,
if
any.
Generally,
the
basis
of
the
contract
is
the
premium
received
or
paid.
In
a
centrally
cleared
swap,
immediately
following
execution
of
the
swap
contract,
the
swap
contract
is
novated
to
a
central
counterparty
(the
“CCP”)
and
the
CCP
becomes
the Funds’
counterparty
on
the
swap. Each
Fund is
required
to
interface
with
the
CCP
through
the
broker.
Upon
entering
into
a
centrally
cleared
swap, each
Fund is
required
to
deposit
initial
margin
with
the
broker
in
the
form
of
cash
or
securities
in
an
amount
that
varies
depending
on
the
size
and
risk
profile
of
the
particular
swap.
Securities
deposited
as
initial
margin
are
designated
in
the
Schedules
of
Investments
and
cash
deposited
is
shown
as
cash
pledged
for
centrally
cleared
swaps
in
the
Statements
of
Assets
and
Liabilities.
Amounts
pledged,
which
are
considered
restricted
cash,
are
included
in
cash
pledged
for
centrally
cleared
swaps
in
the
Statements
of
Assets
and
Liabilities.
Pursuant
to
the
contract, each
Fund
agrees
to
receive
from
or
pay
to
the
broker
variation
margin.
Variation
margin
is
recorded
as
unrealized
appreciation
Notes
to
Financial
Statements
(continued)
2024
BlackRock
Annual
Financial
Statements
and
Additional
Information
(depreciation)
and
shown
as
variation
margin
receivable
(or
payable)
on
centrally
cleared
swaps
in
the
Statements
of
Assets
and
Liabilities.
Payments
received
from
(paid
to)
the
counterparty
are
amortized
over
the
term
of
the
contract
and recorded
as
realized
gains
(losses)
in
the
Statements
of
Operations,
including
those
at
termination.
Credit
default
swaps
—
Credit
default
swaps
are
entered
into
to
manage
exposure
to
the
market
or
certain
sectors
of
the
market,
to
reduce
risk
exposure
to
defaults
of
corporate
and/or
sovereign
issuers
or
to
create
exposure
to
corporate
and/or
sovereign
issuers
to
which
a
fund
is
not
otherwise
exposed
(credit
risk).
The
Funds
may
either
buy
or
sell
(write)
credit
default
swaps
on
single-name
issuers
(corporate
or
sovereign),
a
combination
or
basket
of
single-name
issuers
or
traded
indexes.
Credit
default
swaps
are
agreements
in
which
the
protection
buyer
pays
fixed
periodic
payments
to
the
seller
in
consideration
for
a
promise
from
the
protection
seller
to
make
a
specific
payment
should
a
negative
credit
event
take
place
with
respect
to
the
referenced
entity
(e.g.,
bankruptcy,
failure
to
pay,
obligation
acceleration,
repudiation,
moratorium
or
restructuring).
As
a
buyer,
if
an
underlying
credit
event
occurs,
the
Funds
will
either
(i)
receive
from
the
seller
an
amount
equal
to
the
notional
amount
of
the
swap
and
deliver
the
referenced
security
or
underlying
securities
comprising
the
index,
or
(ii)
receive
a
net
settlement
of
cash
equal
to
the
notional
amount
of
the
swap
less
the
recovery
value
of
the
security
or
underlying
securities
comprising
the
index.
As
a
seller
(writer),
if
an
underlying
credit
event
occurs,
the
Funds
will
either
pay
the
buyer
an
amount
equal
to
the
notional
amount
of
the
swap
and
take
delivery
of
the
referenced
security
or
underlying
securities
comprising
the
index
or
pay
a
net
settlement
of
cash
equal
to
the
notional
amount
of
the
swap
less
the
recovery
value
of
the
security
or
underlying
securities
comprising
the
index.
Total
return
swaps
—
Total
return
swaps
are
entered
into
to
obtain
exposure
to
a
security
or
market
without
owning
such
security
or
investing
directly
in
such
market
or
to
exchange
the
risk/return
of
one
security
or
market
(e.g.,
fixed-income)
with
another
security
or
market
(e.g.,
equity
or
commodity
prices)
(equity
risk,
commodity
price
risk
and/or
interest
rate
risk).
Total
return
swaps
are
agreements
in
which
there
is
an
exchange
of
cash
flows
whereby
one
party
commits
to
make
payments
based
on
the
total
return
(distributions
plus
capital
gains/losses)
of
an
underlying
instrument,
or
basket
of
underlying
instruments,
in
exchange
for
fixed
or
floating
rate
interest
payments.
If
the
total
return
of
the
instrument(s)
or
index
underlying
the
transaction
exceeds
or
falls
short
of
the
offsetting
fixed
or
floating
interest
rate
obligation,
the
Funds
receive
payment
from
or
make
a
payment
to
the
counterparty.
Interest
rate
swaps
—
Interest
rate
swaps
are
entered
into
to
gain
or
reduce
exposure
to
interest
rates
or
to
manage
duration,
the
yield
curve
or
interest
rate
(interest
rate
risk).
Interest
rate
swaps
are
agreements
in
which
one
party
pays
a
stream
of
interest
payments,
either
fixed
or
floating,
in
exchange
for
another
party’s
stream
of
interest
payments,
either
fixed
or
floating,
on
the
same
notional
amount
for
a
specified
period
of
time.
In
more
complex
interest
rate
swaps,
the
notional
principal
amount
may
decline
(or
amortize)
over
time.
Forward
swaps
— The
Funds
may enter
into
forward
interest
rate
swaps
and
forward
total
return
swaps.
In
a
forward
swap,
each
Fund
and
the
counterparty
agree
to
make
periodic
net
payments
beginning
on
a
specified
date
or
a
net
payment
at
termination.
Inflation
swaps
—
Inflation
swaps
are
entered
into
to
gain
or
reduce
exposure
to
inflation
(inflation
risk).
In
an
inflation
swap,
one
party
makes
fixed
interest
payments
on
a
notional
principal
amount
in
exchange
for
another
party’s
variable
payments
based
on
an
inflation
index,
such
as
the
Consumer
Price
Index.
Swap
transactions
involve,
to
varying
degrees,
elements
of
interest
rate,
credit
and
market
risks
in
excess
of
the
amounts
recognized
in
the
Statements
of
Assets
and
Liabilities.
Such
risks
involve
the
possibility
that
there
will
be
no
liquid
market
for
these
agreements,
that
the
counterparty
to
the
agreements
may
default
on
its
obligation
to
perform
or
disagree
as
to
the
meaning
of
the
contractual
terms
in
the
agreements,
and
that
there
may
be
unfavorable
changes
in
interest
rates
and/or
market
values
associated
with
these
transactions.
Master
Netting
Arrangements:
In
order
to
define
its
contractual
rights
and
to
secure
rights
that
will
help
it mitigate its
counterparty
risk, a
Fund
may
enter
into
an
International
Swaps
and
Derivatives
Association,
Inc.
Master
Agreement
(“ISDA
Master
Agreement”)
or
similar
agreement
with
its
derivative
contract
counterparties.
An
ISDA
Master
Agreement
is
a
bilateral
agreement
between a
Fund
and
a
counterparty
that
governs
certain
OTC
derivatives
and
typically
contains,
among
other
things,
collateral
posting
terms
and
netting
provisions
in
the
event
of
a
default
and/or
termination
event.
Under
an
ISDA
Master
Agreement, a
Fund
may,
under
certain
circumstances,
offset
with
the
counterparty
certain
derivative
financial
instruments’
payables
and/or
receivables
with
collateral
held
and/or
posted
and
create
one
single
net
payment.
The
provisions
of
the
ISDA
Master
Agreement
typically
permit
a
single
net
payment
in
the
event
of
default
including
the
bankruptcy
or
insolvency
of
the
counterparty.
However,
bankruptcy
or
insolvency
laws
of
a
particular
jurisdiction
may
impose
restrictions
on
or
prohibitions
against
the
right
of
offset
in
bankruptcy,
insolvency
or
other
events.
Collateral
Requirements:
For
derivatives
traded
under
an
ISDA
Master
Agreement,
the
collateral
requirements
are
typically
calculated
by
netting
the
mark-to-market
amount
for
each
transaction
under
such
agreement
and
comparing
that
amount
to
the
value
of
any
collateral
currently
pledged
by
the
Fund(s)
and
the
counterparty.
Cash
collateral
that
has
been
pledged
to
cover
obligations
of
the
Funds
and
cash
collateral
received
from
the
counterparty,
if
any,
is
reported
separately
in
the
Statements
of
Assets
and
Liabilities
as
cash
pledged
as
collateral
and
cash
received
as
collateral,
respectively.
Non-cash
collateral
pledged
by
the
Funds,
if
any,
is
noted
in
the
Schedules
of
Investments.
Generally,
the
amount
of
collateral
due
from
or
to
a
counterparty
is
subject
to
a
certain
minimum
transfer
amount
threshold
before
a
transfer
is
required,
which
is
determined
at
the
close
of
business
of
the
Funds.
Any
additional
required
collateral
is
delivered
to/pledged
by
the
Funds
on
the
next
business
day.
Typically,
the
counterparty
is
not
permitted
to
sell,
re-pledge
or
use
cash
and
non-cash
collateral
it
receives.
A
Fund
generally
agrees
not
to
use
non-cash
collateral
that
it
receives
but
may,
absent
default
or
certain
other
circumstances
defined
in
the
underlying
ISDA
Master
Agreement,
be
permitted
to
use
cash
collateral
received.
In
such
cases,
interest
may
be
paid
pursuant
to
the
collateral
arrangement
with
the
counterparty.
To
the
extent
amounts
due
to
the
Funds
from the
counterparties
are
not
fully
collateralized, each
Fund bears
the
risk
of
loss
from
counterparty
non-performance.
Likewise,
to
the
extent
the
Funds have
delivered
collateral
to
a
counterparty
and
stand
ready
to
perform
under
the
terms
of
their
agreement
with
such
counterparty, each
Fund bears
the
risk
of
loss
from
a
counterparty
in
the
amount
of
the
value
of
the
collateral
in
the
event
the
counterparty
fails
to
return
such
collateral.
Based
on
the
terms
of
agreements,
collateral
may
not
be
required
for
all
derivative
contracts.
Notes
to
Financial
Statements
(continued)
Notes
to
Financial
Statements
For
financial
reporting
purposes,
the
Funds
do
not
offset
derivative
assets
and
derivative
liabilities
that
are
subject
to
netting
arrangements,
if
any,
in
the
Statements
of
Assets
and
Liabilities.
6.
INVESTMENT
ADVISORY
AGREEMENT
AND
OTHER
TRANSACTIONS
WITH
AFFILIATES
Investment
Advisory:
The
Corporation
and
the
Trust,
on
behalf
of the
applicable Funds,
entered
into
an
Investment
Advisory
Agreement
with
the
Manager,
the
Funds’
investment
adviser
and
an
indirect,
wholly-owned
subsidiary
of
BlackRock,
Inc.
(“BlackRock”),
to
provide
investment
advisory
and
administrative
services.
The
Manager
is
responsible
for
the
management
of each
Fund’s
portfolio
and
provides
the
personnel,
facilities,
equipment
and
certain
other
services
necessary
to
the
operations
of each
Fund.
For
such
services,
each
Fund
pays
the
Manager
a
monthly
fee
at
an
annual
rate
equal
to
the
following
percentages
of
the
average
daily
value
of
each
Fund’s
net
assets:
With
respect
to
each
Fund,
the
Manager
entered
into
separate
sub-advisory
agreements
with
each
of
BlackRock
International
Limited
(“BIL”),
and
with
respect
to
Sustainable
Total
Return,
BlackRock
(Singapore)
Limited
(“BSL”)
(collectively,
the
“Sub-Advisers”),
each
an
affiliate
of
the
Manager.
The
Manager
pays
BIL
and
BSL
for
services
they
provide
for
that
portion
of
each
Fund
for
which
BIL
and
BSL,
as
applicable,
acts
as
Sub-Adviser,
a
monthly
fee
that
is
equal
to
a
percentage
of
the
investment
advisory
fees
paid
by
each
Fund
to
the
Manager.
Service
Fees:
The
Corporation
and
the
Trust
,
on behalf
of the
applicable Funds,
entered
into
a
Distribution
Agreement
and
a Distribution and
Service
Plan
with
BlackRock
Investments,
LLC
(“BRIL”),
an
affiliate
of
the
Manager. Pursuant
to
the
Distribution
and
Service
Plan
and in
accordance
with
Rule
12b-1
under
the
1940
Act,
each
Fund
pays
BRIL
ongoing
service fees.
The
fees
are
accrued
daily
and
paid
monthly
at
annual
rates
based
upon
the
average
daily
net
assets
of
the
relevant
share
class
of
each
Fund
as
follows:
BRIL
and
broker-dealers,
pursuant
to
sub-agreements
with
BRIL,
provide
shareholder
servicing
to
the
Funds.
The
ongoing
service
fee compensates
BRIL
and
each
broker-
dealer
for
providing
shareholder
servicing related
services
to
shareholders.
For
the year
ended
September
30,
2024,
the
following
table
shows
the
class
specific
service
borne
directly
by
each
share
class
of
each
Fund:
Administration:
The
Corporation
and
the
Trust,
on
behalf
of the
applicable
Funds,
entered
into
an
Administration
Agreement
with
the
Manager,
an
indirect,
wholly-owned
subsidiary
of
BlackRock,
to
provide
administrative
services.
For
these
services,
the
Manager
receives
an
administration
fee
computed
daily
and
payable
monthly,
based
on
a
percentage
of
the
average
daily
net
assets
of
each
Fund.
The
administration
fee,
which
is
shown
as
administration
in
the
Statements
of
Operations,
is
paid
at
the
annual
rates
below.
In
addition,
the
Manager
charges
each
of
the
share
classes
an
administration
fee,
which
is
shown
as
administration —
class
specific
in
the
Statements
of
Operations,
at
an
annual
rate
of
0.02% of
the
average
daily
net
assets
of
each
respective
class.
For
the
year
ended
September
30,
2024, the
following
table
shows
the
class
specific
administration
fees
borne
directly
by
each
share
class
of
each
Fund:
Transfer
Agent:
Pursuant
to
written
agreements,
certain
financial
intermediaries,
some
of
which
may
be
affiliates,
provide
the
Funds
with
sub-accounting,
recordkeeping,
sub-transfer
agency
and
other
administrative
services
with
respect
to
servicing
of
underlying
investor
accounts.
For
these
services,
these
entities
receive
an
asset-based
fee
or
an
annual
fee
per
shareholder
account,
which
will
vary
depending
on
share
class
and/or
net
assets.
For
the
year
ended September
30,
2024,
the
Funds
did
not
pay
any
amounts
to
affiliates
in
return
for
these
services.
Investment
Advisory
Fees
Average
Daily
Net
Assets
Sustainable
High
Yield
Bond
Sustainable
Total
Return
First
$1
billion
...........................................................................................
0.500%
0.390%
$1
billion
-
$3
billion
.......................................................................................
0.470
0.370
$3
billion
-
$5
billion
.......................................................................................
0.450
0.350
$5
billion
-
$10
billion
......................................................................................
0.440
0.340
Greater
than
$10
billion
.....................................................................................
0.430
0.330
Share
Class
Service
Fees
Investor
A
..............................................................................................................
0.25
%
Fund
Name
Investor
A
Sustainable
High
Yield
Bond
..................................................................................................
$
246
Sustainable
Total
Return
.....................................................................................................
334
Average
Daily
Net
Assets
Administration
Fees
First
$500
million
......................................................................................................
0.0425%
$500
million
-
$1
billion
..................................................................................................
0.0400
$1
billion
-
$2
billion
....................................................................................................
0.0375
$2
billion
-
$4
billion
....................................................................................................
0.0350
$4
billion
-
$13
billion
...................................................................................................
0.0325
Greater
than
$13
billion
..................................................................................................
0.0300
Fund
Name
Institutional
Investor
A
Class
K
Total
Sustainable
High
Yield
Bond
...................................................................
$
58
$
19
$
8,751
$
8,828
Sustainable
Total
Return
......................................................................
254
26
8,167
8,447
Notes
to
Financial
Statements
(continued)
2024
BlackRock
Annual
Financial
Statements
and
Additional
Information
The
Manager
maintains
a
call
center
that
is
responsible
for
providing
certain
shareholder
services
to
the
Funds.
Shareholder
services
include
responding
to
inquiries
and
processing
purchases
and
sales
based
upon
instructions
from
shareholders.
For
the year
ended
September
30,
2024,
each
Fund
reimbursed
the
Manager
the
following
amounts
for
costs
incurred
in
running
the
call
center,
which
are
included
in
transfer
agent
—
class
specific
in
the
Statements
of
Operations:
For
the
year ended
September
30,
2024,
the
following
table
shows
the
class
specific
transfer
agent
fees
borne
directly
by
each
share
class
of
each
Fund:
Expense
Limitations,
Waivers,
Reimbursements
and
Recoupments:
The
Manager
contractually
agreed
to
waive
its
investment
advisory
fees
by
the
amount
of
investment
advisory
fees each
Fund
pays
to
the
Manager
indirectly
through
its
investment
in
affiliated
money
market
funds
(the
“affiliated
money
market
fund
waiver”)
through
June
30,
2025.
The
contractual
agreement
may
be
terminated upon
90
days’
notice
by
a
majority
of
the
Independent
Directors,
or
by
a
vote
of
a
majority
of
the
outstanding
voting
securities
of a
Fund.
The
amount
of
waivers
and/or
reimbursements
of
fees
and
expenses
made
pursuant
to
the
expense
limitation
described
below
will
be
reduced
by
the
amount
of
the
affiliated
money
market
fund
waiver. These
amounts
are
included
in
fees
waived
and/or
reimbursed
by
the
Manager
in
the
Statements
of
Operations.
For
the
year
ended
September
30,
2024,
the
amounts
waived
were
as
follows:
The
Manager
has
contractually
agreed
to
waive
its
investment
advisory
fee
with
respect
to
any
portion
of each
Fund’s
assets
invested
in
affiliated
equity
and
fixed-
income mutual
funds
and
affiliated
exchange-traded
funds
that
have
a
contractual
management
fee
through
June
30,
2025.
The
contractual
agreement
may
be
terminated
upon
90
days’
notice
by
a
majority
of
the
Independent
Directors,
or
by
a
vote
of
a
majority
of
the
outstanding
voting
securities
of a
Fund.
These
amounts
are
included
in
fees
waived
and/or
reimbursed
by
the
Manager
in
the
Statements
of
Operations.
For
the
year
ended
September
30,
2024,
the
Manager
waived
$138
in
investment
advisory
fees
with
respect
to
Sustainable
Total
Return
pursuant
to
these
arrangements.
With
respect
to
each
Fund,
the
Manager
contractually
agreed
to
waive
and/or
reimburse
fees
or
expenses
in
order
to
limit
expenses,
excluding
interest
expense,
dividend
expense,
tax
expense,
acquired
fund
fees
and
expenses,
and
certain
other
fund
expenses,
which
constitute
extraordinary
expenses
not
incurred
in
the
ordinary
course
of each
Fund’s
business
(“expense
limitation”).
The
expense
limitations
as
a
percentage
of
average
daily
net
assets
are
as
follows:
The
Manager
has
agreed
not
to
reduce
or
discontinue
the
contractual
expense
limitations
through
June
30,
2025,
unless
approved
by
the
Board,
including
a
majority
of
Independent
Directors,
or
by
a
vote
of
a
majority
of
the
outstanding
voting
securities
of
a
Fund.
For
the year
ended
September
30,
2024,
the
amounts
included
in
fees
waived
and/or
reimbursed
by
the
Manager
in
the
Statements
of
Operations
were
as
follows:
The
Funds
also
had
a
waiver
of
administration
fees,
which
are
included
in
Administration
fees
waived
by
the
Manager
in
the
Statements
of
Operations.
For
the year
ended
September
30,
2024,
the
amounts
waived
were
as
follows:
Fund
Name
Institutional
Investor
A
Class
K
Total
Sustainable
High
Yield
Bond
...................................................................
$
48
$
122
$
93
$
263
Sustainable
Total
Return
......................................................................
18
72
70
160
Fund
Name
Institutional
Investor
A
Class
K
Total
Sustainable
High
Yield
Bond
...................................................................
$
65
$
211
$
93
$
369
Sustainable
Total
Return
......................................................................
1,459
189
70
1,718
Fund
Name
Amounts
Waived
Sustainable
High
Yield
Bond
.............................................................................................
$
690
Sustainable
Total
Return
................................................................................................
1,010
Fund
Name
Institutional
Investor
A
Class
K
Sustainable
High
Yield
Bond
..........................................................................
0.58
%
0.83
%
0.53
%
Sustainable
Total
Return
.............................................................................
0.44
0.75
0.39
Fund
Name
Fees
Waived
and/or
Reimbursed
by
the
Manager
Sustainable
High
Yield
Bond
...................................................................................................
$
345,646
Sustainable
Total
Return
......................................................................................................
472,424
Fund
Name
Administration
Fees
Waived
Sustainable
High
Yield
Bond
...................................................................................................
$
18,759
Sustainable
Total
Return
......................................................................................................
17,950
Notes
to
Financial
Statements
(continued)
Notes
to
Financial
Statements
In
addition,
these
amounts
waived
and/or
reimbursed
by
the
Manager are
included
in administration
fees
waived
by
the
Manager
—
class
specific
and
transfer
agent
fees
waived
and/or
reimbursed
by
the
Manager
—
class
specific,
respectively,
in
the
Statements
of
Operations.
For
the
year ended
September
30,
2024,
class
specific
expense
waivers
and/or
reimbursements were
as
follows:
With
respect
to
the
contractual
expense
limitation,
if
during
a
Fund’s
fiscal
year
the
operating
expenses
of
a
share
class,
that
at
any
time
during
the
prior
two
fiscal
years
received
a
waiver
and/or
reimbursement
from
the
Manager,
are
less
than
the
current
expense
limitation
for
that
share
class,
the
Manager
is
entitled
to
be
reimbursed
by
such
share
class
up
to
the
lesser
of:
(a)
the
amount
of
fees
waived
and/or
expenses
reimbursed
during
those
prior
two
fiscal
years
under
the
agreement
and
(b)
an
amount
not
to
exceed
either
the
current
expense
limitation
of
that
share
class
or
the
expense
limitation
of
the
share
class
in
effect
at
the
time
that
the
share
class
received
the
applicable
waiver
and/or
reimbursement,
provided
that:
(1)
each
Fund,
of
which
the
share
class
is
a
part,
has
more
than
$50
million
in
assets
for
the
fiscal
year,
and
(2)
the
Manager
or
an
affiliate
continues
to
serve
as
a
Fund’s
investment
adviser
or
administrator.
This
repayment
applies
only
to
the
contractual
expense
limitation
on
net
expenses
and
does
not
apply
to
the
contractual
investment
advisory
fee
waiver
described
above
or
any
voluntary
waivers
that
may
be
in
effect
from
time
to
time.
Effective
July
22,
2028,
the
repayment
arrangement
between
Sustainable
High
Yield
Bond
and
the
Manager
pursuant
to
which
such
Fund
may
be
required
to
repay
amounts
waived
and/or
reimbursed
under the
Fund’s
contractual
caps
on
net
expenses
will
be
terminated.
Effective
October
19,
2028,
the
repayment
arrangement
between
Sustainable
Total
Return
and
the
Manager
pursuant
to
which
such
Fund
may
be
required
to
repay
amounts
waived
and/or
reimbursed
under
each
Fund's
contractual
caps
on
net
expenses
will
be
terminated.
As
of September
30,
2024,
the
fund
level
and
class
specific
waivers
and/or
reimbursements
subject
to
possible
future
recoupment
under
the
expense
limitation
agreement were
as
follows:
The
following
fund
level
and
class
specific
waivers
and/or
reimbursements
previously
recorded
by
the
Funds,
which
were
subject
to
recoupment
by
the
Manager,
expired
on
September
30,
2024:
Interfund
Lending:
In
accordance
with
an
exemptive
order
(the
“Order”)
from
the
U.S.
Securities
and
Exchange
Commission
(“SEC”),
each
Fund
may
participate
in
a
joint
lending
and
borrowing
facility
for
temporary
purposes
(the
“Interfund
Lending
Program”),
subject
to
compliance
with
the
terms
and
conditions
of
the
Order,
and
to
the
extent
permitted
by each
Fund’s
investment
policies
and
restrictions. Each
Fund
is
currently
permitted
to
borrow
and
lend
under
the
Interfund
Lending
Program.
Fund
Name/Share
Class
Administration
Fees
Waived
by
the
Manager
—
Class
Specific
Transfer
Agent
Fees
Waived
and/or
Reimbursed
by
the
Manager
—
Class
Specific
Sustainable
High
Yield
Bond
Institutional
....................................................................................
$
6
$
4
Investor
A
.....................................................................................
14
168
Class
K
......................................................................................
8,751
93
$
8,771
$
265
Sustainable
Total
Return
Institutional
....................................................................................
195
935
Investor
A
.....................................................................................
18
58
Class
K
......................................................................................
8,167
70
$
8,380
$
1,063
Expiring
September
30,
2025
2026
Sustainable
High
Yield
Bond
Fund
Level
......................................................................................
$
409,708
$
364,405
Institutional
......................................................................................
43
10
Investor
A
.......................................................................................
41
182
Class
K
.........................................................................................
8,681
8,844
Sustainable
Total
Return
Fund
Level
......................................................................................
523,479
490,374
Institutional
......................................................................................
14
1,130
Investor
A
.......................................................................................
27
76
Class
K
.........................................................................................
8,451
8,237
Sustainable
High
Yield
Bond
Fund
Level
.............................................................................................................
$
419,665
Institutional
.............................................................................................................
246
Investor
A
..............................................................................................................
246
Class
K
...............................................................................................................
9,456
Sustainable
Total
Return
Fund
Level
.............................................................................................................
$
381,248
Institutional
.............................................................................................................
231
Investor
A
..............................................................................................................
187
Class
K
...............................................................................................................
9,014
Notes
to
Financial
Statements
(continued)
2024
BlackRock
Annual
Financial
Statements
and
Additional
Information
A
lending
BlackRock
fund
may
lend
in
aggregate
up
to
15%
of
its
net
assets
but
may
not
lend
more
than
5%
of
its
net
assets
to
any
one
borrowing
fund
through
the
Interfund
Lending
Program.
A
borrowing
BlackRock
fund
may
not
borrow
through
the
Interfund
Lending
Program
or
from
any
other
source
more
than
33
1/3%
of
its
total
assets
(or
any
lower
threshold
provided
for
by
the fund’s
investment
restrictions).
If
a
borrowing
BlackRock
fund’s
total
outstanding
borrowings
exceed
10%
of
its
total
assets,
each
of
its
outstanding
interfund
loans
will
be
subject
to
collateralization
of
at
least
102%
of
the
outstanding
principal
value
of
the
loan.
All
interfund
loans
are
for
temporary
or
emergency
purposes
and
the
interest
rate
to
be
charged
will
be
the
average
of
the
highest
current
overnight
repurchase
agreement
rate
available
to
a
lending
fund
and
the
bank
loan
rate,
as
calculated
according
to
a
formula
established
by
the
Board.
During the
year
ended
September
30,
2024,
the
Funds
did
not
participate
in
the
Interfund
Lending
Program.
Directors
and
Officers:
Certain
directors
and/or
officers
of
the
Corporation
and
the
Trust
are
directors
and/or
officers
of
BlackRock
or
its
affiliates.
The
Funds
reimburse
the
Manager
for
a
portion
of
the
compensation
paid
to
the
Trust’s
and
the
Corporation’s
Chief
Compliance
Officer,
which
is
included
in
Directors
and
Officer
in
the
Statements
of
Operations.
7.
PURCHASES
AND
SALES
For
the year ended
September
30,
2024,
purchases
and
sales
of
investments,
including
paydowns/payups,
mortgage
dollar
rolls and
excluding
short-term
securities,
were
as
follows:
For
the year ended
September
30,
2024,
purchases
and
sales
related
to
mortgage
dollar
rolls
were
as
follows:
8.
INCOME
TAX
INFORMATION
It
is
each
Fund’s
policy
to
comply
with
the
requirements
of
the
Internal
Revenue
Code
of
1986,
as
amended,
applicable
to
regulated
investment
companies,
and
to
distribute
substantially
all
of
its
taxable
income
to
its
shareholders.
Therefore,
no
U.S.
federal
income
tax
provision
is
required.
Each Fund
files
U.S.
federal
and
various
state
and
local
tax
returns.
No
income
tax
returns
are
currently
under
examination.
The
statute
of
limitations
on
each
Fund’s
U.S.
federal
tax
returns
generally
remains
open
for
a
period
of
three
years
after
they
are
filed.
The
statutes
of
limitations
on
each
Fund’s
state
and
local
tax
returns
may
remain
open
for
an
additional
year
depending
upon
the
jurisdiction.
Management
has
analyzed
tax
laws
and
regulations
and
their
application
to
the Funds
as
of
September
30,
2024,
inclusive
of
the
open
tax
return
years,
and
does
not
believe
that
there
are
any
uncertain
tax
positions
that
require
recognition
of
a
tax
liability
in
the
Funds’
financial
statements.
Management’s
analysis
is
based
on
the
tax
laws
and
judicial
and
administrative
interpretations
thereof
in
effect
as
of
date
of
these
financial
statements,
all
of
which
are
subject
to
change,
possibly
with
retroactive
effect
which
may
impact
the
Funds’
NAV.
The
tax
character
of
distributions
paid
was
as
follows:
As
of
September
30,
2024,
the
tax
components
of
accumulated earnings
(loss) were
as
follows:
(a)
Amounts
available
to
offset
future
realized
capital
gains.
(b)
The
difference
between
book-basis
and
tax-basis
net
unrealized
gains
(losses)
was
attributable
primarily
to
the
tax
deferral
of
losses
on
wash
sales
and
straddles,
amortization
and
accretion
methods
of
premiums
and
discounts
on
fixed
income
securities,
the
realization
for
tax
purposes
of
unrealized
gains
(losses)
on
certain
futures
and
foreign
currency
exchange
contracts,
the
accounting
for
swap
agreements
and
classification
of
investments.
U.S.
Government
Securities
Other
Securities
Fund
Name
Purchases
Sales
Purchases
Sales
Sustainable
High
Yield
Bond
..............................................
$
—
$
—
$
28,543,328
$
28,668,021
Sustainable
Total
Return
.................................................
339,279,393
345,889,890
25,995,600
21,878,110
Fund
Name
Purchases
Sales
Sustainable
Total
Return
.................................................................................
$
135,348,094
$
135,324,291
Fund
Name
Year
Ended
09/30/24
Year
Ended
09/30/23
Sustainable
High
Yield
Bond
Ordinary
income
...........................................................................................
$
2,925,236
$
2,523,267
Sustainable
Total
Return
Ordinary
income
...........................................................................................
$
1,613,804
$
2,113,322
Return
of
capital
...........................................................................................
243,281
—
$
1,857,085
$
2,113,322
Fund
Name
Undistributed
Ordinary
Income
Non-Expiring
Capital
Loss
Carryforwards
(a)
Net
Unrealized
Gains
(Losses)
(b)
Total
Sustainable
High
Yield
Bond
...............................................
$
2,446
$
(5,290,940
)
$
902,456
$
(4,386,038
)
Sustainable
Total
Return
..................................................
—
(5,938,365
)
(1,080,788
)
(7,019,153
)
Notes
to
Financial
Statements
(continued)
Notes
to
Financial
Statements
As
of
September
30,
2024, gross
unrealized
appreciation
and
depreciation
based
on
cost
of
investments
(including
short
positions
and
derivatives,
if
any)
for
U.S.
federal
income
tax
purposes
were
as
follows:
9.
BANK
BORROWINGS
The
Corporation
and
the
Trust,
on
behalf
of
the
Funds,
along
with
certain
other
funds
managed
by
the
Manager
and
its
affiliates
(“Participating
Funds”),
is party
to
a
364-day,
$2.40
billion
credit
agreement
with
a
group
of
lenders.
Under
this
agreement,
the
Funds
may
borrow
to
fund
shareholder
redemptions.
Excluding
commitments
designated
for
certain
individual
funds,
the
Participating
Funds,
including
the
Funds,
can
borrow
up
to
an
aggregate
commitment
amount
of
$1.75
billion
at
any
time
outstanding,
subject
to
asset
coverage
and
other
limitations
as
specified
in
the
agreement.
The
credit
agreement
has
the
following
terms:
a
fee
of
0.10%
per
annum
on
unused
commitment
amounts
and
interest
at
a
rate
equal
to
the
higher
of
(a)
Overnight
Bank
Funding
Rate
(“OBFR”)
(but,
in
any
event,
not
less
than
0.00%)
on
the
date
the
loan
is
made
plus
0.80%
per
annum,
(b)
the
Fed
Funds
rate
(but,
in
any
event,
not
less
than
0.00%)
in
effect
from
time
to
time
plus
0.80%
per
annum
on
amounts
borrowed
or
(c)
the
sum
of
(x) Daily
Simple
SOFR
(but,
in
any
event,
not
less
than
0.00%)
on
the
date
the
loan
is
made
plus
0.10%
and
(y) 0.80%
per
annum.
The
agreement
expires
in
April
2025
unless
extended
or
renewed.
Prior
to
April
11,
2024,
the
aggregate
commitment
amount
was
$2.50
billion.
These
fees
were
allocated
among
such
funds
based
upon
portions
of
the
aggregate
commitment
available
to
them
and
relative
net
assets
of
Participating
Funds.
During
the year ended
September
30,
2024,
the
Funds
did
not
borrow
under
the
credit
agreement.
10.
PRINCIPAL
RISKS
In
the
normal
course
of
business,
the
Funds
invest
in
securities
or
other
instruments
and
may
enter
into
certain
transactions,
and
such
activities
subject
each
Fund
to
various
risks,
including
among
others,
fluctuations
in
the
market
(market
risk)
or
failure
of
an
issuer
to
meet
all
of
its
obligations.
The
value
of
securities
or
other
instruments
may
also
be
affected
by
various
factors,
including,
without
limitation:
(i)
the
general
economy;
(ii)
the
overall
market
as
well
as
local,
regional
or
global
political
and/or
social
instability;
(iii)
regulation,
taxation
or
international
tax
treaties
between
various
countries;
or
(iv)
currency,
interest
rate
and
price
fluctuations.
Local,
regional
or
global
events
such
as
war,
acts
of
terrorism,
the
spread
of
infectious
illness
or
other
public
health
issues,
recessions,
or
other
events
could
have
a
significant
impact
on
the
Funds
and their
investments.
Each
Fund’s
prospectus
provides
details
of
the
risks
to
which
each
Fund
is
subject.
Market
Risk
:
Each
Fund
may
be
exposed
to
prepayment
risk,
which
is
the
risk
that
borrowers
may
exercise
their
option
to
prepay
principal
earlier
than
scheduled
during
periods
of
declining
interest
rates,
which
would
force
each
Fund
to
reinvest
in
lower
yielding
securities. Each
Fund
may
also
be
exposed
to
reinvestment
risk,
which
is
the
risk
that
income
from
each
Fund’s
portfolio
will
decline
if
each
Fund
invests
the
proceeds
from
matured,
traded
or
called
fixed-income
securities
at
market
interest
rates
that
are
below
each
Fund
portfolio’s
current
earnings
rate.
Municipal
securities
are
subject
to
the
risk
that
litigation,
legislation
or
other
political
events,
local
business
or
economic
conditions,
credit
rating
downgrades,
or
the
bankruptcy
of
the
issuer
could
have
a
significant
effect
on
an
issuer’s
ability
to
make
payments
of
principal
and/or
interest
or
otherwise
affect
the
value
of
such
securities.
Municipal
securities
can
be
significantly
affected
by
political
or
economic
changes,
including
changes
made
in
the
law
after
issuance
of
the
securities,
as
well
as
uncertainties
in
the
municipal
market
related
to,
taxation,
legislative
changes
or
the
rights
of
municipal
security
holders,
including
in
connection
with
an
issuer
insolvency.
Municipal
securities
backed
by
current
or
anticipated
revenues
from
a
specific
project
or
specific
assets
can
be
negatively
affected
by
the
discontinuance
of
the
tax
benefits
supporting
the
project
or
assets
or
the
inability
to
collect
revenues
for
the
project
or
from
the
assets.
Municipal
securities
may
be
less
liquid
than
taxable
bonds,
and
there
may
be
less
publicly
available
information
on
the
financial
condition
of
municipal
security
issuers
than
for
issuers
of
other
securities.
Valuation
Risk:
The
market
values
of
equities,
such
as
common
stocks
and
preferred
securities
or
equity
related
investments,
such
as
futures
and
options,
may
decline
due
to
general
market
conditions
which
are
not
specifically
related
to
a
particular
company.
They
may
also
decline
due
to
factors
which
affect
a
particular
industry
or
industries. A
Fund
may
invest
in
illiquid
investments.
An
illiquid
investment
is
any
investment
that a
Fund
reasonably
expects
cannot
be
sold
or
disposed
of
in
current
market
conditions
in
seven
calendar
days
or
less
without
the
sale
or
disposition
significantly
changing
the
market
value
of
the
investment. A
Fund
may
experience
difficulty
in
selling
illiquid
investments
in
a
timely
manner
at
the
price
that it
believes
the
investments
are
worth.
Prices
may
fluctuate
widely
over
short
or
extended
periods
in
response
to
company,
market
or
economic
news.
Markets
also
tend
to
move
in
cycles,
with
periods
of
rising
and
falling
prices.
This
volatility
may
cause
each
Fund’s
NAV
to
experience
significant
increases
or
decreases
over
short
periods
of
time.
If
there
is
a
general
decline
in
the
securities
and
other
markets,
the
NAV
of a
Fund
may
lose
value,
regardless
of
the
individual
results
of
the
securities
and
other
instruments
in
which a
Fund
invests.
A
Fund’s
ability
to
value
its
investments
may
also
be
impacted
by
technological
issues
and/
or
errors
by
pricing
services
or
other
third-party
service
providers.
The
price a
Fund
could
receive
upon
the
sale
of
any
particular
portfolio
investment
may
differ
from a
Fund’s
valuation
of
the
investment,
particularly
for
securities
that
trade
in
thin
or
volatile
markets
or
that
are
valued
using
a
fair
valuation
technique
or
a
price
provided
by
an
independent
pricing
service.
Changes
to
significant
unobservable
inputs
and
assumptions
(i.e.,
publicly
traded
company
multiples,
growth
rate,
time
to
exit)
due
to
the
lack
of
observable
inputs
may
significantly
impact
the
resulting
fair
value
and
therefore a
Fund’s
results
of
operations.
As
a
result,
the
price
received
upon
the
sale
of
an
investment
may
be
less
than
the
value
ascribed
by a
Fund,
and a
Fund
could
realize
a
greater
than
expected
loss
or
lesser
than
expected
gain
upon
the
sale
of
the
investment.
Counterparty
Credit
Risk:
The
Funds
may
be
exposed
to
counterparty
credit
risk,
or
the
risk
that
an
entity
may
fail
to
or
be
unable
to
perform
on
its
commitments
related
to
unsettled
or
open
transactions,
including
making
timely
interest
and/or
principal
payments
or
otherwise
honoring
its
obligations.
The
Funds
manage
counterparty
credit
risk
by
entering
into
transactions
only
with
counterparties
that
the
Manager
believes
have
the
financial
resources
to
honor
their
obligations
and
by
monitoring
the
financial
stability
of
those
counterparties.
Financial
assets,
which
potentially
expose
the
Funds
to
market,
issuer
and
counterparty
credit
risks,
consist
principally
of
financial
instruments
and
Fund
Name
Tax
Cost
Gross
Unrealized
Appreciation
Gross
Unrealized
Depreciation
Net
Unrealized
Appreciation
(Depreciation)
Sustainable
High
Yield
Bond
..........................................
$
45,088,780
$
1,422,168
$
(519,712)
$
902,456
Sustainable
Total
Return
............................................
53,097,230
1,037,404
(1,964,381)
(926,977)
Notes
to
Financial
Statements
(continued)
2024
BlackRock
Annual
Financial
Statements
and
Additional
Information
receivables
due
from
counterparties.
The
extent
of
the
Funds’
exposure
to
market,
issuer
and
counterparty
credit
risks
with
respect
to
these
financial
assets
is
approximately
their
value
recorded
in
the
Statements
of
Assets
and
Liabilities,
less
any
collateral
held
by
the
Funds.
A
derivative
contract
may
suffer
a
mark-to-market
loss
if
the
value
of
the
contract
decreases
due
to
an
unfavorable
change
in
the
market
rates
or
values
of
the
underlying
instrument.
Losses
can
also
occur
if
the
counterparty
does
not
perform
under
the
contract.
For
OTC
options
purchased,
each
Fund
bears
the
risk
of
loss
in
the
amount
of
the
premiums
paid
plus
the
positive
change
in
market
values
net
of
any
collateral
held
by
the
Funds
should
the
counterparty
fail
to
perform
under
the
contracts.
Options
written
by
the
Funds
do
not
typically
give
rise
to
counterparty
credit
risk,
as
options
written
generally
obligate
the
Funds,
and
not
the
counterparty,
to
perform.
The
Funds
may
be
exposed
to
counterparty
credit
risk
with
respect
to
options
written
to
the
extent
each
Fund
deposits
collateral
with
its
counterparty
to
a
written
option.
With
exchange-traded
options
purchased
and
exchange-traded
futures
and
centrally
cleared
swaps,
there
is
less
counterparty
credit
risk
to
the
Funds
since
the
exchange
or
clearinghouse,
as
counterparty
to
such
instruments,
guarantees
against
a
possible
default.
The
clearinghouse
stands
between
the
buyer
and
the
seller
of
the
contract;
therefore,
credit
risk
is
limited
to
failure
of
the
clearinghouse.
While
offset
rights
may
exist
under
applicable
law, a
Fund
does
not
have
a
contractual
right
of
offset
against
a
clearing
broker
or
clearinghouse
in
the
event
of
a
default
(including
the
bankruptcy
or
insolvency).
Additionally,
credit
risk
exists
in exchange-traded
futures
and
centrally
cleared
swaps
with
respect
to
initial
and
variation
margin
that
is
held
in
a
clearing
broker’s
customer
accounts.
While
clearing
brokers
are
required
to
segregate
customer
margin
from
their
own
assets,
in
the
event
that
a
clearing
broker
becomes
insolvent
or
goes
into
bankruptcy
and
at
that
time
there
is
a
shortfall
in
the
aggregate
amount
of
margin
held
by
the
clearing
broker
for
all
its
clients,
typically
the
shortfall
would
be
allocated
on
a
pro
rata
basis
across
all
the
clearing
broker’s
customers,
potentially
resulting
in
losses
to
the
Funds.
Geographic/Asset
Class
Risk:
A
diversified
portfolio,
where
this
is appropriate
and
consistent
with
a
fund’s
objectives,
minimizes
the
risk
that
a
price
change
of
a
particular
investment
will
have
a
material
impact
on
the
NAV
of
a
fund.
The
investment
concentrations
within
each Fund’s
portfolio
are
disclosed
in
its Schedule
of
Investments.
Certain
Funds
invest
a
significant
portion
of their
assets
in
high
yield
securities.
High
yield
securities
that
are
rated
below
investment-grade
(commonly
referred
to
as
“junk
bonds”)
or
are
unrated
may
be
deemed
speculative,
involve
greater
levels
of
risk
than
higher-rated
securities
of
similar
maturity
and
are
more
likely
to
default.
High
yield
securities
may
be
issued
by
less
creditworthy
issuers,
and
issuers
of
high
yield
securities
may
be
unable
to
meet
their
interest
or
principal
payment
obligations.
High
yield
securities
are
subject
to
extreme
price
fluctuations,
may
be
less
liquid
than
higher
rated
fixed-income
securities,
even
under
normal
economic
conditions,
and
frequently
have
redemption
features.
The
Funds
invest
a
significant
portion
of
their
assets
in fixed-income securities and/or use
derivatives tied
to
the
fixed-income
markets.
Changes
in
market
interest
rates
or
economic
conditions
may affect
the
value
and/or
liquidity
of
such investments.
Interest
rate
risk
is
the
risk
that
prices
of
bonds
and
other
fixed-income
securities
will
decrease
as
interest
rates
rise
and
increase
as
interest
rates
fall.
The
Funds
may
be
subject
to
a
greater
risk
of
rising
interest
rates
during
a
period
of
historically
low
interest
rates. The
Federal
Reserve
has raised the
federal
funds
rate
as
part
of
its
efforts
to
address
inflation.
Changing
interest
rates
may
have
unpredictable
effects
on
markets,
may
result
in
heightened
market
volatility,
and
could
negatively
impact
the
Funds'
performance.
The
Funds invest
a
significant
portion
of their
assets
in
securities
of
issuers
located
in
the
United
States.
A
decrease
in
imports
or
exports,
changes
in
trade
regulations,
inflation
and/or
an
economic
recession
in
the
United
States
may
have
a
material
adverse
effect
on
the
U.S.
economy
and
the
securities
listed
on
U.S.
exchanges.
Proposed
and
adopted
policy
and
legislative
changes
in
the
United
States
may
also
have
a
significant
effect
on
U.S.
markets
generally,
as
well
as
on
the
value
of
certain
securities.
Governmental
agencies
project
that
the
United
States
will
continue
to
maintain
elevated
public
debt
levels
for
the
foreseeable
future
which
may
constrain
future
economic
growth.
Circumstances
could
arise
that
could
prevent
the
timely
payment
of
interest
or
principal
on
U.S.
government
debt,
such
as
reaching
the
legislative
“debt
ceiling.”
Such
non-payment
would
result
in
substantial
negative
consequences
for
the
U.S.
economy
and
the
global
financial
system.
If
U.S.
relations
with
certain
countries
deteriorate,
it
could
adversely
affect
issuers
that
rely
on
the
United
States
for
trade.
The
United
States
has
also
experienced
increased
internal
unrest
and
discord.
If
these
trends
were
to
continue,
they
may
have
an
adverse
impact
on
the
U.S.
economy
and
the
issuers
in
which
the
Funds
invest.
Certain
Funds
invest
a
significant
portion
of their
assets
in
securities
backed
by
commercial
or
residential
mortgage
loans
or
in
issuers
that
hold
mortgage
and
other
asset-
backed
securities.
When
a
fund
concentrates
its
investments
in
this
manner,
it
assumes
a
greater
risk
of
prepayment
or
payment
extension
by
securities
issuers.
Changes
in
economic
conditions,
including
delinquencies
and/or
defaults
on
assets
underlying
these
securities,
can
affect
the
value,
income
and/or
liquidity
of
such
positions.
Investment
percentages
in
these
securities
are
presented
in
the
Schedules
of
Investments.
Significant
Shareholder
Redemption
Risk:
Certain
shareholders
may
own
or
manage
a
substantial
amount
of
fund
shares
and/or
hold
their
fund
investments
for
a
limited
period
of
time.
Large
redemptions
of
fund
shares
by
these
shareholders
may
force
a
fund
to
sell
portfolio
securities,
which
may
negatively
impact
the
fund’s
NAV,
increase
the
fund’s
brokerage
costs,
and/or
accelerate
the
realization
of
taxable
income/gains
and
cause
the
fund
to
make
additional
taxable
distributions
to
shareholders.
11.
CAPITAL
SHARE
TRANSACTIONS
Transactions
in
capital
shares
for
each
class
were
as
follows:
d
Year
Ended
09/30/24
Year
Ended
09/30/23
Fund
Name/Share
Class
Shares
Amount
Shares
Amount
Sustainable
High
Yield
Bond
Institutional
Shares
sold
..........................................
18,995
$
168,945
15,390
$
132,950
Shares
issued
in
reinvestment
of
distributions
.....................
1,469
12,995
201
1,720
Shares
redeemed
......................................
(207)
(1,822)
—
—
20,257
$
180,118
15,591
$
134,670
Notes
to
Financial
Statements
(continued)
Notes
to
Financial
Statements
As
of
September
30,
2024,
shares
owned
by
BlackRock
Financial
Management,
Inc.,
an
affiliate
of
the
Funds,
were
as
follows:
12.
SUBSEQUENT
EVENTS
Management's
evaluation
of
the
impact
of
all
subsequent
events
on
the
Funds'
financial
statements
was
completed
through
the
date
the
financial
statements
were
issued
and
has
determined
that
there
were
no
subsequent
events
requiring
adjustment
or
additional
disclosure
in
the
financial
statements.
d
Year
Ended
09/30/24
Year
Ended
09/30/23
Fund
Name/Share
Class
Shares
Amount
Shares
Amount
Investor
A
Shares
sold
..........................................
619
$
5,483
1,631
$
14,027
Shares
issued
in
reinvestment
of
distributions
.....................
72
633
30
255
Shares
redeemed
......................................
(1,857)
(16,415)
—
—
(1,166)
$
(10,299)
1,661
$
14,282
19,091
$
169,819
17,252
$
148,952
Sustainable
Total
Return
Institutional
Shares
sold
..........................................
294,694
$
2,385,337
12,913
$
103,566
Shares
issued
in
reinvestment
of
distributions
.....................
6,226
51,613
8
60
Shares
redeemed
......................................
(10,635)
(86,251)
—
—
290,285
$
2,350,699
12,921
$
103,626
Investor
A
Shares
sold
..........................................
9
$
72
5,978
$
50,290
Shares
issued
in
reinvestment
of
distributions
.....................
255
2,085
151
1,251
Shares
redeemed
......................................
(37)
(286)
(1,118)
(9,134)
227
$
1,871
5,011
$
42,407
Class
K
Shares
sold
..........................................
121
$
282
—
$
—
Shares
issued
in
reinvestment
of
distributions
.....................
—
2
—
—
Shares
redeemed
......................................
(105)
(896)
—
—
16
$
(612)
—
$
—
290,528
$
2,351,958
17,932
$
146,033
Fund
Name
Institutional
Investor
A
Class
K
Sustainable
High
Yield
Bond
..........................................................................
10,000
10,000
4,980,000
Sustainable
Total
Return
.............................................................................
10,000
10,000
4,980,000
Report
of
Independent
Registered
Public
Accounting
Firm
2024
BlackRock
Annual
Financial
Statements
and
Additional
Information
To
the
Shareholders
of
BlackRock
Sustainable
High
Yield
Bond
Fund
and
BlackRock
Sustainable
Total
Return
Fund,
and
the
Board
of
Trustees/Directors
of
BlackRock
Funds
V
and
BlackRock
Bond
Fund,
Inc.:
Opinion
on
the
Financial
Statements
and
Financial
Highlights
We
have
audited
the
accompanying
statements
of
assets
and
liabilities
of
BlackRock
Sustainable
High
Yield
Bond
Fund
of
BlackRock
Funds
V
and
Blackrock
Sustainable
Total
Return
Fund
of
BlackRock
Bond
Fund,
Inc.
(the
“Funds”),
including
the
schedules
of
investments,
as
of
September
30,
2024,
the
related
statements
of
operations
for
the
year
then
ended,
the
statements
of
changes
in
net
assets
for
each
of
the
two
years
in
the
period
then
ended,
the
financial
highlights
for
the
periods
indicated
in
the
table
below,
and
the
related
notes.
In
our
opinion,
the
financial
statements
and
financial
highlights
present
fairly,
in
all
material
respects,
the
financial
position
of
the
Funds
as
of
September
30,
2024,
and
the
results
of
their
operations
for
the
year
then
ended,
the
changes
in
their
net
assets
for
each
of
the
two
years
in
the
period
then
ended,
and
the
financial
highlights
for
the
periods
indicated
in
the
table
below,
in
conformity
with
accounting
principles
generally
accepted
in
the
United
States
of
America.
Basis
for
Opinion
These
financial
statements
and
financial
highlights
are
the
responsibility
of
the
Funds’
management.
Our
responsibility
is
to
express
an
opinion
on
the
Funds’
financial
statements
and
financial
highlights
based
on
our
audits.
We
are
a
public
accounting
firm
registered
with
the
Public
Company
Accounting
Oversight
Board
(United
States)
(PCAOB)
and
are
required
to
be
independent
with
respect
to
the
Funds
in
accordance
with
the
U.S.
federal
securities
laws
and
the
applicable
rules
and
regulations
of
the
Securities
and
Exchange
Commission
and
the
PCAOB.
We
conducted
our
audits
in
accordance
with
the
standards
of
the
PCAOB.
Those
standards
require
that
we
plan
and
perform
the
audit
to
obtain
reasonable
assurance
about
whether
the
financial
statements
and
financial
highlights
are
free
of
material
misstatement,
whether
due
to
error
or
fraud.
The
Funds
are
not
required
to
have,
nor
were
we
engaged
to
perform,
an
audit
of
their
internal
control
over
financial
reporting.
As
part
of
our
audits
we
are
required
to
obtain
an
understanding
of
internal
control
over
financial
reporting
but
not
for
the
purpose
of
expressing
an
opinion
on
the
effectiveness
of
the
Funds’
internal
control
over
financial
reporting.
Accordingly,
we
express
no
such
opinion.
Our
audits
included
performing
procedures
to
assess
the
risks
of
material
misstatement
of
the
financial
statements
and
financial
highlights,
whether
due
to
error
or
fraud,
and
performing
procedures
that
respond
to
those
risks.
Such
procedures
included
examining,
on
a
test
basis,
evidence
regarding
the
amounts
and
disclosures
in
the
financial
statements
and
financial
highlights.
Our
audits
also
included
evaluating
the
accounting
principles
used
and
significant
estimates
made
by
management,
as
well
as
evaluating
the
overall
presentation
of
the
financial
statements
and
financial
highlights.
Our
procedures
included
confirmation
of
securities
owned
as
of
September
30,
2024,
by
correspondence
with custodians
or
counterparties; when
replies
were
not
received,
we
performed
other
auditing
procedures.
We
believe
that
our
audits
provide
a
reasonable
basis
for
our
opinion.
Deloitte
&
Touche
LLP
Boston,
Massachusetts
November
21,
2024
We
have
served
as
the
auditor
of
one
or
more
BlackRock
investment
companies
since
1992.
Fund
Financial
Highlights
BlackRock
Sustainable
High
Yield
Bond
Fund
For
each
of
the
three
years
in
the
period
ended
September
30,
2024
and
for
the
period
from
July
22,
2021
(commencement
of
operations)
through
September
30,
2021
BlackRock
Sustainable
Total
Return
Fund
For
each
of
the
two
years
in
the
period
ended
September
30,
2024
and
for
the
period
from
October
18,
2021
(commencement
of
operations)
through
September
30,
2022
Important
Tax
Information
(unaudited)
The
following
amounts,
or maximum
amounts
allowable
by
law, are
hereby
designated
as
qualified
dividend
income
for
individuals
for
the
fiscal
year
ended
September
30,
2024:
The
Funds
hereby
designate
the
following
amounts,
or
maximum
amounts
allowable
by
law,
of
distributions
from
direct
federal
obligation
interest
for
the
fiscal
year
ended
September
30,
2024:
The
law
varies
in
each
state
as
to
whether
and
what
percent
of
ordinary
income
dividends
attributable
to
federal
obligations
is
exempt
from
state
income
tax.
Shareholders
are
advised
to
check
with
their
tax
advisers
to
determine
if
any
portion
of
the
dividends
received
is
exempt
from
state
income
tax.
The
following
percentages,
or
maximum
percentages
allowable
by
law,
of
ordinary
income
distributions
paid
during
the
fiscal
year
ended
September
30,
2024
qualified
for
the
dividends-received
deduction
for
corporate
shareholders:
The
Funds
hereby
designate
the
following
amounts,
or
maximum
amounts
allowable by
law,
as
interest
income
eligible
to
be
treated
as
a
Section
163(j)
interest
dividend
for
the
fiscal
year
ended
September
30,
2024:
The
Funds
hereby
designate
the
following
amounts,
or
maximum
amounts
allowable
by
law,
as
interest-related
dividends
eligible
for
exemption
from
U.S.
withholding
tax
for
nonresident
aliens
and
foreign
corporations
for
the
fiscal
year
ended
September
30,
2024
Fund
Name
Qualified
Dividend
Income
Sustainable
High
Yield
Bond
...........................................................................................
$
30,162
Sustainable
Total
Return
..............................................................................................
729
Fund
Name
Federal
Obligation
Interest
Sustainable
High
Yield
Bond
...........................................................................................
$
6,924
Sustainable
Total
Return
..............................................................................................
294,692
Fund
Name
Dividends-Received
Deduction
Sustainable
High
Yield
Bond
...........................................................................................
0
.54
%
Sustainable
Total
Return
..............................................................................................
0
.05
Fund
Name
Interest
Dividends
Sustainable
High
Yield
Bond
...........................................................................................
$
2,895,851
Sustainable
Total
Return
..............................................................................................
1,864,575
Fund
Name
Interest-Related
Dividends
Sustainable
High
Yield
Bond
...........................................................................................
$
2,359,758
Sustainable
Total
Return
..............................................................................................
1,478,761
2024
BlackRock
Annual
Financial
Statements
and
Additional
Information
Changes
in
and
Disagreements
with
Accountants
Not
applicable.
Proxy
Results
Not
applicable.
Remuneration
Paid
to
Directors,
Officers,
and
Others
Compensation
to
the
independent
directors/trustees
of
the
Company
is
paid
by
the
Company,
on
behalf
of
the
Funds.
General
Information
Quarterly
performance,
semi-annual
and
annual
reports,
current
net
asset
value
and
other
information
regarding
the
Funds
may
be
found
on
BlackRock’s
website,
which
can
be
accessed
at
blackrock.com
.
Any
reference
to
BlackRock’s
website
in
this
report
is
intended
to
allow
investors
public
access
to
information
regarding
the
Funds
and
does
not,
and
is
not
intended
to,
incorporate
BlackRock’s
website
in
this
report.
Electronic
Delivery
Shareholders
can
sign
up
for
e-mail
notifications
of
quarterly
statements,
annual
and
semi-annual
shareholder
reports
and
prospectuses
by
enrolling
in
the
electronic
delivery
program.
To
enroll
in
electronic
delivery:
Shareholders
Who
Hold
Accounts
with
Investment
Advisors,
Banks
or
Brokerages:
Please
contact
your
financial
advisor.
Please
note
that
not
all
investment
advisors,
banks
or
brokerages
may
offer
this
service.
Shareholders
Who
Hold
Accounts
Directly
with
BlackRock:
1.
Access
the
BlackRock
website
at
blackrock.com
2.
Select
"Access
Your
Account"
3.
Next,
select
"eDelivery"
in
the
"Related
Resources"
box
and
follow
the
sign-up
instructions.
BlackRock’s
Mutual
Fund
Family
BlackRock
offers
a
diverse
lineup
of
open-end
mutual
funds
crossing
all
investment
styles
and
managed
by
experts
in
equity,
fixed-income
and
tax-exempt
investing.
Visit
blackrock.com
for
more
information.
Shareholder
Privileges
Account
Information
Call
us
at
(800)
441-7762
from
8:00
AM
to
6:00
PM
ET
on
any
business
day
to
get
information
about
your
account
balances,
recent
transactions
and
share
prices.
You
can
also
visit
blackrock.com
for
more
information.
Automatic
Investment
Plans
Investor
class
shareholders
who
want
to
invest
regularly
can
arrange
to
have
$50
or
more
automatically
deducted
from
their
checking
or
savings
account
and
invested
in
any
of
the
BlackRock
funds.
Systematic
Withdrawal
Plans
Investor
class
shareholders
can
establish
a
systematic
withdrawal
plan
and
receive
periodic
payments
of
$50
or
more
from
their
BlackRock
funds,
as
long
as
their
account
balance
is
at
least
$10,000.
Retirement
Plans
Shareholders
may
make
investments
in
conjunction
with
Traditional,
Rollover,
Roth,
Coverdell,
Simple
IRAs,
SEP
IRAs
and
403(b)
Plans.
Additional
Information
(continued)
Fund
and
Service
Providers
Investment
Adviser
and
Administrator
BlackRock
Advisors,
LLC
Wilmington,
DE
19809
Sub-Advisers
BlackRock
International
Limited
Edinburgh,
EH3
8BL
United
Kingdom
BlackRock
(Singapore)
Limited
(a)
079912
Singapore
Accounting
Agent
JPMorgan
Chase
Bank,
N.A.
New
York,
NY
10179
Transfer
Agent
BNY
Mellon
Investment
Servicing
(US)
Inc.
Wilmington,
DE
19809
Custodian
JPMorgan
Chase
Bank,
N.A.
New
York,
NY
10179
Independent
Registered
Public
Accounting
Firm
Deloitte
&
Touche
LLP
Boston,
MA
02110
Distributor
BlackRock
Investments,
LLC
New
York,
NY
10001
Legal
Counsel
Willkie
Farr
&
Gallagher
LLP
New
York,
NY
10019
Address
of
the
Trust
100
Bellevue
Parkway
Wilmington,
DE
19809
(a)
For
BlackRock
Sustainable
Total
Return
Fund.
Disclosure
of
Investment
Advisory
Agreements
and
Sub-Advisory
Agreements
2024
BlackRock
Annual
Financial
Statements
and
Additional
Information
The
Board
of
Directors/Trustees
(the
“Board,”
the
members
of
which
are
referred
to
as
“Board
Members”),
as
applicable,
of
BlackRock
Funds
V
(the
“Trust”)
and
BlackRock
Bond
Fund,
Inc.
(the
“Corporation”
and
together
with
the
Trust,
the
“Registrants”)
met
on
May
3,
2024
(the
“May
Meeting”)
and
June
6-7,
2024
(the
“June
Meeting”)
to
consider
the
approval
to
continue
the
investment
advisory
agreements
(the
“Advisory
Agreements”)
between
(1)
the
Trust,
on
behalf
of
BlackRock
Sustainable
High
Yield
Bond
Fund
(the
“Sustainable
High
Yield
Bond
Fund”),
and
(2)
the
Corporation,
on
behalf
of
BlackRock
Sustainable
Total
Return
Fund
(the
“Sustainable
Total
Return
Fund”
and
together
with
the
Sustainable
High
Yield
Bond
Fund,
the
“Funds”
and
each,
a
“Fund,”),
and
BlackRock
Advisors,
LLC
(the
“Manager”),
each
Fund’s
investment
advisor.
The
Board
also
considered
the
approval
to
continue
the
sub-advisory
agreements
(the
“Sub-Advisory
Agreements”)
between
(1)
the
Manager
and
BlackRock
International
Limited
(“BIL”),
with
respect
to
each
Fund,
and
(2)
BlackRock
(Singapore)
Limited
(“BRS”
and
together
with
BIL,
the
“Sub-Advisors”),
with
respect
to
the
Sustainable
Total
Return
Fund.
The
Manager
and
the
Sub-Advisors
are
referred
to
herein
as
“BlackRock.”
The
Advisory
Agreements
and
the
Sub-Advisory
Agreements
are
referred
to
herein
as
the
“Agreements.”
The
Approval
Process
Consistent
with
the
requirements
of
the
Investment
Company
Act
of
1940
(the
“1940
Act”),
the
Board
considers
the
approval
of
the
continuation
of
the
Agreements
for
each
Fund
on
an
annual
basis.
The
Board
members
who
are
not
“interested
persons”
of
the
Registrants,
as
defined
in
the
1940
Act,
are
considered
independent
Board
members
(the
“Independent
Board
Members”).
The
Board’s
consideration
entailed
a
year-long
deliberative
process
during
which
the
Board
and
its
committees
assessed
BlackRock’s
various
services
to
each
Fund,
including
through
the
review
of
written
materials
and
oral
presentations,
and
the
review
of
additional
information
provided
in
response
to
requests
from
the
Independent
Board
Members.
The
Board
had
four
quarterly
meetings
per
year,
each
of
which
extended
over
a
two-day
period,
as
well
as
additional
ad
hoc
meetings
and
executive
sessions
throughout
the
year,
as
needed.
The
committees
of
the
Board
similarly
met
throughout
the
year.
The
Board
also
had
an
additional
one-day
meeting
to
consider
specific
information
regarding
the
renewal
of
the
Agreements.
In
considering
the
renewal
of
the
Agreements,
the
Board
assessed,
among
other
things,
the
nature,
extent
and
quality
of
the
services
provided
to
each
Fund
by
BlackRock,
BlackRock’s
personnel
and
affiliates,
including
(as
applicable):
investment
management
services;
accounting
oversight;
administrative
and
shareholder
services;
oversight
of
each
Fund’s
service
providers;
risk
management
and
oversight;
and
legal,
regulatory
and
compliance
services.
Throughout
the
year,
including
during
the
contract
renewal
process,
the
Independent
Board
Members
were
advised
by
independent
legal
counsel,
and
met
with
independent
legal
counsel
in
various
executive
sessions
outside
of
the
presence
of
BlackRock’s
management.
During
the
year,
the
Board,
acting
directly
and
through
its
committees,
considered
information
that
was
relevant
to
its
annual
consideration
of
the
renewal
of
the
Agreements,
including
the
services
and
support
provided
by
BlackRock
to
each
Fund
and
its
shareholders.
BlackRock
also
furnished
additional
information
to
the
Board
in
response
to
specific
questions
from
the
Board.
Among
the
matters
the
Board
considered
were:
(a)
investment
performance
for
one-year,
three-year,
five-year,
and/or
since
inception
periods,
as
applicable,
against
peer
funds,
relevant
benchmarks,
and
other
performance
metrics,
as
applicable,
as
well
as
BlackRock
senior
management’s
and
portfolio
managers’
investment
performance
analyses,
and
the
reasons
for
any
outperformance
or
underperformance
relative
to
its
peers,
benchmarks,
and
other
performance
metrics,
as
applicable;
(b)
fees,
including
advisory,
administration,
if
applicable,
and
other
amounts
paid
to
BlackRock
and
its
affiliates
by
each
Fund
for
services;
(c)
Fund
operating
expenses
and
how
BlackRock
allocates
expenses
to
each
Fund;
(d)
the
resources
devoted
to,
risk
oversight
of,
and
compliance
reports
relating
to,
implementation
of
each
Fund’s
investment
objective,
policies
and
restrictions,
and
meeting
regulatory
requirements;
(e)
BlackRock’s
and
each
Fund’s
adherence
to
applicable
compliance
policies
and
procedures;
(f)
the
nature,
character
and
scope
of
non-investment
management
services
provided
by
BlackRock
and
its
affiliates
and
the
estimated
cost
of
such
services,
as
applicable;
(g)
BlackRock’s
and
other
service
providers’
internal
controls
and
risk
and
compliance
oversight
mechanisms;
(h)
BlackRock’s
implementation
of
the
proxy
voting
policies
approved
by
the
Board;
(i)
execution
quality
of
portfolio
transactions;
(j)
BlackRock’s
implementation
of
each
Fund’s
valuation
and
liquidity
procedures;
(k)
an
analysis
of
management
fees
paid
to
BlackRock
for
products
with
similar
investment
mandates
across
the
open-end
fund,
exchange-traded
fund
(“ETF”),
closed-end
fund,
sub-advised
mutual
fund,
separately
managed
account,
collective
investment
trust,
and
institutional
separate
account
product
channels,
as
applicable,
and
the
similarities
and
differences
between
these
products
and
the
services
provided
as
compared
to
each
Fund;
(l)
BlackRock’s
compensation
methodology
for
its
investment
professionals
and
the
incentives
and
accountability
it
creates,
along
with
investment
professionals’
investments
in
the
fund(s)
they
manage;
and
(m)
periodic
updates
on
BlackRock’s
business.
Prior
to
and
in
preparation
for
the
May
Meeting,
the
Board
received
and
reviewed
materials
specifically
relating
to
the
renewal
of
the
Agreements.
The
Independent
Board
Members
continuously
engaged
in
a
process
with
their
independent
legal
counsel
and
BlackRock
to
review
the
nature
and
scope
of
the
information
provided
to
the
Board
to
better
assist
its
deliberations.
The
materials
provided
in
connection
with
the
May
Meeting
included,
among
other
things:
(a)
information
independently
compiled
and
prepared
by
Broadridge
Financial
Solutions,
Inc.
(“Broadridge”),
based
on
either
a
Lipper
classification
or
Morningstar
category,
regarding
each
Fund’s
fees
and
expenses
as
compared
with
a
peer
group
of
funds
as
determined
by
Broadridge
(“Expense
Peers”)
and
the
investment
performance
of
each
Fund
as
compared
with
a
peer
group
of
funds
(“Performance
Peers”);
(b)
information
on
the
composition
of
the
Expense
Peers
and
Performance
Peers
and
a
description
of
Broadridge’s
methodology;
(c)
information
on
the
estimated
profits
realized
by
BlackRock
and
its
affiliates
pursuant
to
the
Agreements
and
a
discussion
of
fall-out
benefits
to
BlackRock
and
its
affiliates;
(d)
a
general
analysis
provided
by
BlackRock
concerning
investment
management
fees
received
in
connection
with
other
types
of
investment
products,
such
as
institutional
accounts,
sub-advised
mutual
funds,
ETFs,
closed-end
funds,
open-end
funds,
and
separately
managed
accounts,
under
similar
investment
mandates,
as
well
as
the
performance
of
such
other
products,
as
applicable;
(e)
a
review
of
non-management
fees;
(f)
the
existence,
impact
and
sharing
of
potential
economies
of
scale,
if
any,
with
each
Fund;
(g)
a
summary
of
aggregate
amounts
paid
by
each
Fund
to
BlackRock;
(h)
sales
and
redemption
data
regarding
each
Fund’s
shares;
and
(i)
various
additional
information
requested
by
the
Board
as
appropriate
regarding
BlackRock’s
and
each
Fund’s
operations.
At
the
May
Meeting,
the
Board
reviewed
materials
relating
to
its
consideration
of
the
Agreements
and
the
Independent
Board
Members
presented
BlackRock
with
questions
and
requests
for
additional
information.
BlackRock
responded
to
these
questions
and
requests
with
additional
written
information
in
advance
of
the
June
Meeting,
and
such
responses
were
reviewed
by
the
Board
Members.
At
the
June
Meeting,
the
Board
concluded
its
assessment
of,
among
other
things:
(a)
the
nature,
extent
and
quality
of
the
services
provided
by
BlackRock;
(b)
the
investment
performance
of
each
Fund
as
compared
to
its
Performance
Peers
and
to
other
metrics,
as
applicable;
(c)
the
advisory
fee
and
the
estimated
cost
of
the
services
and
estimated
profits
realized
by
BlackRock
and
its
affiliates
from
their
relationship
with
each
Fund;
(d)
each
Fund’s
fees
and
expenses
compared
to
its
Expense
Peers;
(e)
the
existence
and
sharing
of
potential
economies
of
scale;
(f)
any
fall-out
benefits
to
BlackRock
and
its
affiliates
as
a
result
of
BlackRock’s
relationship
with
each
Fund;
and
(g)
other
factors
deemed
relevant
by
the
Board
Members.
Disclosure
of
Investment
Advisory
Agreements
and
Sub-Advisory
Agreements
(continued)
Disclosure
of
Investment
Advisory
Agreements
and
Sub-Advisory
Agreements
The
Board
also
considered
other
matters
it
deemed
important
to
the
approval
process,
such
as
other
payments
made
to
BlackRock
or
its
affiliates
relating
to
securities
lending
and
cash
management,
and
BlackRock’s
services
related
to
the
valuation
and
pricing
of
Fund
portfolio
holdings.
The
Board
noted
the
willingness
of
BlackRock’s
personnel
to
engage
in
open,
candid
discussions
with
the
Board.
The
Board
evaluated
the
information
available
to
it
on
a
fund-by-fund
basis.
The
following
paragraphs
provide
more
information
about
some
of
the
primary
factors
that
were
relevant
to
the
Board’s
decision.
The
Board
Members
did
not
identify
any
particular
information,
or
any
single
factor
as
determinative,
and
each
Board
Member
may
have
attributed
different
weights
to
the
various
items
and
factors
considered.
A.
Nature,
Extent
and
Quality
of
the
Services
Provided
by
BlackRock
The
Board,
including
the
Independent
Board
Members,
reviewed
the
nature,
extent
and
quality
of
services
provided
by
BlackRock,
including
the
investment
advisory
services,
and
the
resulting
performance
of
each
Fund.
Throughout
the
year,
the
Board
compared
Fund
performance
to
the
performance
of
a
comparable
group
of
mutual
funds,
relevant
benchmarks,
and
performance
metrics,
as
applicable.
The
Board
met
with
BlackRock’s
senior
management
personnel
responsible
for
investment
activities,
including
the
senior
investment
officers.
The
Board
also
reviewed
the
materials
provided
by
each
Fund’s
portfolio
management
team
discussing
each
Fund’s
performance,
investment
strategies
and
outlook.
The
Board
considered,
among
other
factors,
with
respect
to
BlackRock:
the
experience
of
each
Fund’s
portfolio
management
team;
research
capabilities;
investments
by
portfolio
managers
in
the
funds
they
manage;
portfolio
trading
capabilities;
use
of
technology;
commitment
to
compliance;
credit
analysis
capabilities;
risk
analysis
and
oversight
capabilities;
and
the
approach
to
training
and
retaining
portfolio
managers
and
other
research,
advisory
and
management
personnel.
The
Board
also
considered
BlackRock’s
overall
risk
management
program,
including
the
continued
efforts
of
BlackRock
and
its
affiliates
to
address
cybersecurity
risks
and
the
role
of
BlackRock’s
Risk
&
Quantitative
Analysis
Group.
The
Board
engaged
in
a
review
of
BlackRock’s
compensation
structure
with
respect
to
each
Fund’s
portfolio
management
team
and
BlackRock’s
ability
to
attract
and
retain
high-quality
talent
and
create
performance
incentives.
In
addition
to
investment
advisory
services,
the
Board
considered
the
nature
and
quality
of
the
administrative
and
other
non-investment
advisory
services
provided
to
each
Fund.
BlackRock
and
its
affiliates
provide
each
Fund
with
certain
administrative,
shareholder
and
other
services
(in
addition
to
any
such
services
provided
to
each
Fund
by
third
parties)
and
officers
and
other
personnel
as
are
necessary
for
the
operations
of
each
Fund.
In
particular,
BlackRock
and
its
affiliates
provide
each
Fund
with
administrative
services
including,
among
others:
(i)
responsibility
for
disclosure
documents,
such
as
the
prospectus,
the
summary
prospectus
(as
applicable),
the
statement
of
additional
information
and
periodic
shareholder
reports;
(ii)
oversight
of
daily
accounting
and
pricing;
(iii)
responsibility
for
periodic
filings
with
regulators;
(iv)
overseeing
and
coordinating
the
activities
of
third-party
service
providers
including,
among
others,
each
Fund’s
custodian,
fund
accountant,
transfer
agent,
and
auditor;
(v)
organizing
Board
meetings
and
preparing
the
materials
for
such
Board
meetings;
(vi)
providing
legal
and
compliance
support;
(vii)
furnishing
analytical
and
other
support
to
assist
the
Board
in
its
consideration
of
strategic
issues
such
as
the
merger,
consolidation
or
repurposing
of
certain
open-end
funds;
and
(viii)
performing
or
managing
administrative
functions
necessary
for
the
operation
of
each
Fund,
such
as
tax
reporting,
expense
management,
fulfilling
regulatory
filing
requirements,
each
Fund’s
distribution
partners,
and
shareholder
call
center
and
other
services.
The
Board
reviewed
the
structure
and
duties
of
BlackRock’s
fund
administration,
shareholder
services,
and
legal
and
compliance
departments
and
considered
BlackRock’s
policies
and
procedures
for
assuring
compliance
with
applicable
laws
and
regulations.
The
Board
considered
the
operation
of
BlackRock’s
business
continuity
plans.
The
Board
noted
that
the
engagement
of
BIL,
with
respect
to
each
Fund,
and
BRS,
with
respect
to
the
Sustainable
Total
Return
Fund,
facilitates
the
provision
of
investment
advice
and
trading
by
investment
personnel
out
of
non-U.S.
jurisdictions.
The
Board
considered
that
this
arrangement
provides
additional
flexibility
to
the
portfolio
management
team,
which
may
benefit
each
Fund
and
its
shareholders.
B.
The
Investment
Performance
of
each
Fund
The
Board,
including
the
Independent
Board
Members,
reviewed
and
considered
the
performance
history
of
each
Fund
throughout
the
year
and
at
the
May
Meeting.
In
preparation
for
the
May
Meeting,
the
Board
was
provided
with
reports
independently
prepared
by
Broadridge,
which
included
an
analysis
of
each
Fund’s
performance
as
of
December
31,
2023,
as
compared
to
its
Performance
Peers.
Broadridge
ranks
funds
in
quartiles,
ranging
from
first
to
fourth,
where
first
is
the
most
desirable
quartile
position
and
fourth
is
the
least
desirable.
In
connection
with
its
review,
the
Board
received
and
reviewed
information
regarding
the
investment
performance
of
each
Fund
as
compared
to
its
Performance
Peers
and
the
respective
Morningstar
Category
(“Morningstar
Category”).
The
Board
and
its
Performance
Oversight
Committee
regularly
review
and
meet
with
Fund
management
to
discuss
the
performance
of
each
Fund
throughout
the
year.
In
evaluating
performance,
the
Board
focused
particular
attention
on
funds
with
less
favorable
performance
records.
The
Board
also
noted
that
while
it
found
the
data
provided
by
Broadridge
generally
useful,
it
recognized
the
limitations
of
such
data,
including
in
particular,
that
notable
differences
may
exist
between
a
fund
and
its
Performance
Peers
(for
example,
the
investment
objectives
and
strategies).
Further,
the
Board
recognized
that
the
performance
data
reflects
a
snapshot
of
a
period
as
of
a
particular
date
and
that
selecting
a
different
performance
period
could
produce
significantly
different
results.
The
Board
also
acknowledged
that
long-term
performance
could
be
impacted
by
even
one
period
of
significant
outperformance
or
underperformance,
and
that
a
single
investment
theme
could
have
the
ability
to
disproportionately
affect
long-term
performance.
The
Board
noted
that
for
the
one-year
and
since
inception
periods
reported,
the
Sustainable
High
Yield
Bond
Fund
ranked
in
the
second
and
third
quartiles,
respectively,
against
its
Morningstar
Category.
The
Board
noted
that
BlackRock
believes
that
the
Morningstar
Category
is
an
appropriate
performance
metric
for
the
Sustainable
High
Yield
Bond
Fund,
and
that
BlackRock
has
explained
its
rationale
for
this
belief
to
the
Board.
The
Board
and
BlackRock
reviewed
the
Sustainable
High
Yield
Bond
Fund’s
underperformance
relative
to
its
Morningstar
Category
during
the
applicable
period.
The
Board
noted
that
for
each
of
the
one-year
and
since
inception
periods
reported,
the
Sustainable
Total
Return
Fund
ranked
in
the
third
quartile
against
its
Morningstar
Category.
The
Board
noted
that
BlackRock
believes
that
the
Morningstar
Category
is
an
appropriate
performance
metric
for
the
Sustainable
Total
Return
Fund,
and
that
BlackRock
has
explained
its
rationale
for
this
belief
to
the
Board.
The
Board
and
BlackRock
reviewed
the
Sustainable
Total
Return
Fund’s
underperformance
relative
to
its
Morningstar
Category
during
the
applicable
periods.
C.
Consideration
of
the
Advisory/Management
Fees
and
the
Estimated
Cost
of
the
Services
and
Estimated
Profits
Realized
by
BlackRock
and
its
Affiliates
from
their
Relationship
with
each
Fund
Disclosure
of
Investment
Advisory
Agreements
and
Sub-Advisory
Agreements
(continued)
2024
BlackRock
Annual
Financial
Statements
and
Additional
Information
The
Board,
including
the
Independent
Board
Members,
reviewed
each
Fund’s
contractual
management
fee
rate
compared
with
those
of
its
Expense
Peers.
The
contractual
management
fee
rate
represents
a
combination
of
the
advisory
fee
and
any
administrative
fees,
before
taking
into
account
any
reimbursements
or
fee
waivers.
The
Board
also
compared
each
Fund’s
total
expense
ratio,
as
well
as
its
actual
management
fee
rate,
to
those
of
its
Expense
Peers.
The
total
expense
ratio
represents
a
fund’s
total
net
operating
expenses,
including
any
12b-1
or
non-12b-1
service
fees.
The
total
expense
ratio
gives
effect
to
any
expense
reimbursements
or
fee
waivers,
and
the
actual
management
fee
rate
gives
effect
to
any
management
fee
reimbursements
or
waivers.
The
Board
considered
that
the
fee
and
expense
information
in
the
Broadridge
report
for
each
Fund
reflected
information
for
a
specific
period
and
that
historical
asset
levels
and
expenses
may
differ
from
current
levels,
particularly
in
a
period
of
market
volatility.
The
Board
considered
the
services
provided
and
the
fees
charged
by
BlackRock
and
its
affiliates
to
other
types
of
clients
with
similar
investment
mandates,
as
applicable,
including
institutional
accounts
and
sub-advised
mutual
funds
(including
mutual
funds
sponsored
by
third
parties).
The
Board
received
and
reviewed
statements
relating
to
BlackRock’s
financial
condition.
The
Board
reviewed
BlackRock’s
profitability
methodology
and
was
also
provided
with
an
estimated
profitability
analysis
that
detailed
the
revenues
earned
and
the
expenses
incurred
by
BlackRock
for
services
provided
to
each
Fund.
The
Board
reviewed
BlackRock’s
estimated
profitability
with
respect
to
each
Fund
and
other
funds
the
Board
currently
oversees
for
the
year
ended
December
31,
2023
compared
to
available
aggregate
estimated
profitability
data
provided
for
the
prior
two
years.
The
Board
reviewed
BlackRock’s
estimated
profitability
with
respect
to
certain
other
U.S.
fund
complexes
managed
by
the
Manager
and/or
its
affiliates.
The
Board
reviewed
BlackRock’s
assumptions
and
methodology
of
allocating
expenses
in
the
estimated
profitability
analysis,
noting
the
inherent
limitations
in
allocating
costs
among
various
advisory
products.
The
Board
recognized
that
profitability
may
be
affected
by
numerous
factors
including,
among
other
things,
fee
waivers
and
expense
reimbursements
by
the
Manager,
the
types
of
funds
managed,
precision
of
expense
allocations
and
business
mix.
The
Board
thus
recognized
that
calculating
and
comparing
profitability
at
the
individual
fund
level
is
difficult.
The
Board
noted
that,
in
general,
individual
fund
or
product
line
profitability
of
other
advisors
is
not
publicly
available.
The
Board
reviewed
BlackRock’s
overall
operating
margin,
in
general,
compared
to
that
of
certain
other
publicly
traded
asset
management
firms.
The
Board
considered
the
differences
between
BlackRock
and
these
other
firms,
including
the
contribution
of
technology
at
BlackRock,
BlackRock’s
expense
management,
and
the
relative
product
mix.
The
Board
considered
whether
BlackRock
has
the
financial
resources
necessary
to
attract
and
retain
high
quality
investment
management
personnel
to
perform
its
obligations
under
the
Agreements
and
to
continue
to
provide
the
high
quality
of
services
that
is
expected
by
the
Board.
The
Board
further
considered
factors
including
but
not
limited
to
BlackRock’s
commitment
of
time
and
resources,
assumption
of
risk,
and
liability
profile
in
servicing
each
Fund,
including
in
contrast
to
what
is
required
of
BlackRock
with
respect
to
other
products
with
similar
investment
mandates
across
the
open-end
fund,
ETF,
closed-end
fund,
sub-advised
mutual
fund,
separately
managed
account,
collective
investment
trust,
and
institutional
separate
account
product
channels,
as
applicable.
The
Board
noted
that
the
Sustainable
High
Yield
Bond
Fund’s
contractual
management
fee
rate
ranked
in
the
second
quartile,
and
that
the
actual
management
fee
rate
and
total
expense
ratio
each
ranked
in
the
first
quartile
relative
to
the
Sustainable
High
Yield
Bond
Fund’s
Expense
Peers.
The
Board
also
noted
that
the
Sustainable
High
Yield
Bond
Fund
has
an
advisory
fee
arrangement
that
includes
breakpoints
that
adjust
the
fee
rate
downward
as
the
size
of
the
Sustainable
High
Yield
Bond
Fund
increases
above
certain
contractually
specified
levels.
The
Board
additionally
noted
that
the
breakpoints
can,
conversely,
adjust
the
advisory
fee
rate
upward
as
the
size
of
the
Sustainable
High
Yield
Bond
Fund
decreases
below
certain
contractually
specified
levels.
The
Board
further
noted
that
BlackRock
and
the
Board
have
contractually
agreed
to
a
cap
on
the
Sustainable
High
Yield
Bond
Fund’s
total
expenses
as
a
percentage
of
the
Sustainable
High
Yield
Bond
Fund’s
average
daily
net
assets
on
a
class-by-class
basis.
The
Board
noted
that
the
Sustainable
Total
Return
Fund’s
contractual
management
fee
rate
ranked
in
the
third
quartile,
and
that
the
actual
management
fee
rate
and
total
expense
ratio
each
ranked
in
the
first
quartile
relative
to
the
Sustainable
Total
Return
Fund’s
Expense
Peers.
The
Board
also
noted
that
the
Sustainable
Total
Return
Fund
has
an
advisory
fee
arrangement
that
includes
breakpoints
that
adjust
the
fee
rate
downward
as
the
size
of
the
Sustainable
Total
Return
Fund
increases
above
certain
contractually
specified
levels.
The
Board
additionally
noted
that
the
breakpoints
can,
conversely,
adjust
the
advisory
fee
rate
upward
as
the
size
of
the
Sustainable
Total
Return
Fund
decreases
below
certain
contractually
specified
levels.
The
Board
further
noted
that
BlackRock
and
the
Board
have
contractually
agreed
to
a
cap
on
the
Sustainable
Total
Return
Fund’s
total
expenses
as
a
percentage
of
the
Sustainable
Total
Return
Fund’s
average
daily
net
assets
on
a
class-by-class
basis.
D.
Economies
of
Scale
The
Board,
including
the
Independent
Board
Members,
considered
the
extent
to
which
any
economies
of
scale
might
benefit
each
Fund
in
a
variety
of
ways
as
the
assets
of
each
Fund
increase.
The
Board
considered
multiple
factors,
including
the
advisory
fee
rate
and
breakpoints,
unitary
fee
structure,
fee
waivers,
and/or
expense
caps,
as
applicable.
The
Board
considered
each
Fund’s
asset
levels
and
whether
the
current
fee
schedule
was
appropriate.
E.
Other
Factors
Deemed
Relevant
by
the
Board
Members
The
Board,
including
the
Independent
Board
Members,
also
took
into
account
other
ancillary
or
“fall-out”
benefits
that
BlackRock
or
its
affiliates
may
derive
from
BlackRock’s
respective
relationships
with
each
Fund,
both
tangible
and
intangible,
such
as
BlackRock’s
ability
to
leverage
its
investment
professionals
who
manage
other
portfolios
and
its
risk
management
personnel,
an
increase
in
BlackRock’s
profile
in
the
investment
advisory
community,
and
the
engagement
of
BlackRock’s
affiliates
as
service
providers
to
each
Fund,
including
for
administrative,
distribution,
securities
lending,
and
cash
management
services.
With
respect
to
securities
lending,
during
the
year
the
Board
also
considered
information
provided
by
independent
third-party
consultants
related
to
the
performance
of
each
BlackRock
affiliate
as
securities
lending
agent.
The
Board
also
considered
BlackRock’s
overall
operations
and
its
efforts
to
expand
the
scale
of,
and
improve
the
quality
of,
its
operations.
The
Board
also
noted
that,
subject
to
applicable
law,
BlackRock
may
use
and
benefit
from
third-party
research
obtained
by
soft
dollars
generated
by
certain
registered
fund
transactions
to
assist
in
managing
all
or
a
number
of
its
other
client
accounts.
In
connection
with
its
consideration
of
the
Agreements,
the
Board
also
received
information
regarding
BlackRock’s
brokerage
and
soft
dollar
practices.
The
Board
received
reports
from
BlackRock
which
included
information
on
brokerage
commissions
and
trade
execution
practices
throughout
the
year.
The
Board
noted
the
competitive
nature
of
the
open-end
fund
marketplace,
and
that
shareholders
are
able
to
redeem
their
Fund
shares
if
they
believe
that
each
Fund’s
fees
and
expenses
are
too
high
or
if
they
are
dissatisfied
with
the
performance
of
each
Fund.
Disclosure
of
Investment
Advisory
Agreements
and
Sub-Advisory
Agreements
(continued)
Disclosure
of
Investment
Advisory
Agreements
and
Sub-Advisory
Agreements
Conclusion
At
the
June
Meeting,
in
a
continuation
of
the
discussions
that
occurred
during
the
May
Meeting,
and
as
a
culmination
of
the
Board’s
year-long
deliberative
process,
the
Board,
including
the
Independent
Board
Members,
unanimously
approved
the
continuation
of
the
Advisory
Agreements
between
the
Manager
and
the
Registrants,
on
behalf
of
each
Fund,
for
a
one-year
term
ending
June
30,
2025,
and
the
Sub-Advisory
Agreements
between
(1)
the
Manager
and
BIL,
with
respect
to
each
Fund,
and
(2)
the
Manager
and
BRS,
with
respect
the
Sustainable
Total
Return
Fund,
for
a
one-year
term
ending
June
30,
2025.
Based
upon
its
evaluation
of
all
of
the
aforementioned
factors
in
their
totality,
as
well
as
other
information,
the
Board,
including
the
Independent
Board
Members,
was
satisfied
that
the
terms
of
the
Agreements
were
fair
and
reasonable
and
in
the
best
interest
of
each
Fund
and
its
shareholders.
In
arriving
at
its
decision
to
approve
the
Agreements,
the
Board
did
not
identify
any
single
factor
or
group
of
factors
as
all-important
or
controlling,
but
considered
all
factors
together,
and
different
Board
Members
may
have
attributed
different
weights
to
the
various
factors
considered.
The
Independent
Board
Members
were
advised
by
independent
legal
counsel
throughout
the
deliberative
process.
Glossary
of
Terms
Used
in
this
Report
2024
BlackRock
Annual
Financial
Statements
and
Additional
Information
Currency
Abbreviation
BRL
Brazilian
Real
CNH
Chinese
Yuan
Offshore
EUR
Euro
GBP
British
Pound
JPY
Japanese
Yen
MXN
Mexican
Peso
USD
United
States
Dollar
Portfolio
Abbreviation
CLO
Collateralized
Loan
Obligation
DAC
Designated
Activity
Company
ETF
Exchange-Traded
Fund
EURIBOR
Euro
Interbank
Offered
Rate
GO
General
Obligation
Bonds
MSCI
Morgan
Stanley
Capital
International
OTC
Over-the-counter
PIK
Payment-In-Kind
RB
Revenue
Bonds
REIT
Real
Estate
Investment
Trust
SOFR
Secured
Overnight
Financing
Rate
TBA
To-be-announced
Want
to
know
more?
blackrock.com
|
800-441-7762
This
report
is
intended
for
current
holders.
It
is
not
authorized
for
use
as
an
offer
of
sale
or
a
solicitation
of
an
offer
to
buy
shares
of
the
Funds
unless
preceded
or
accompanied
by
the
Funds’
current
prospectus.
Past
performance
results
shown
in
this
report
should
not
be
considered
a
representation
of
future
performance.
Investment
returns
and
principal
value
of
shares
will
fluctuate
so
that
shares,
when
redeemed,
may
be
worth
more
or
less
than
their
original
cost.
Statements
and
other
information
herein
are
as
dated
and
are
subject
to
change.
Item 8 – Changes in and Disagreements with Accountants for Open-End Management Investment Companies – See Item 7
Item 9 – Proxy Disclosures for Open-End Management Investment Companies – See Item 7
Item 10 – Remuneration Paid to Directors, Officers, and Others of Open-End Management Investment Companies – See Item 7
Item 11 – Statement Regarding Basis for Approval of Investment Advisory Contract – See Item 7
Item 12 – Disclosure of Proxy Voting Policies and Procedures for Closed-End Management Investment Companies – Not Applicable
Item 13 – Portfolio Managers of Closed-End Management Investment Companies - Not Applicable
Item 14 – Purchases of Equity Securities by Closed-End Management Investment Company and Affiliated Purchasers – Not Applicable
Item 15 – Submission of Matters to a Vote of Security Holders – There have been no material changes to these procedures.
Item 16 – Controls and Procedures
(a) The registrant’s principal executive and principal financial officers, or persons performing similar functions, have concluded that the registrant’s disclosure controls and procedures (as defined in Rule 30a-3(c) under the Investment Company Act of 1940, as amended (the “1940 Act”)) are effective as of a date within 90 days of the filing date of this report based on the evaluation of these controls and procedures required by Rule 30a-3(b) under the 1940 Act and Rule 13a-15(b) or 15d-15(b) under the Securities Exchange Act of 1934, as amended.
(b) There were no changes in the registrant’s internal control over financial reporting (as defined in Rule 30a-3(d) under the 1940 Act) that occurred during the period covered by this report that have materially affected, or are reasonably likely to materially affect, the registrant’s internal control over financial reporting.
Item 17 – Disclosure of Securities Lending Activities for Closed-End Management Investment Companies –Not Applicable
Item 18 – Recovery of Erroneously Awarded Compensation – Not Applicable
Item 19 – Exhibits attached hereto
(a)(1) Code of Ethics – See Item 2
(a)(2) Any policy required by the listing standards adopted pursuant to Rule 10D-1 under the Exchange Act (17 CFR 240.10D-1) by the registered national securities exchange or registered national securities association upon which the registrant’s securities are listed – Not Applicable
(a)(3) Section 302 Certifications are attached
(a)(4) Any written solicitation to purchase securities under Rule 23c-1 – Not Applicable
(a)(5) Change in Registrant’s independent public accountant – Not Applicable
(b) Section 906 Certifications are attached
Pursuant to the requirements of the Securities Exchange Act of 1934 and the Investment Company Act of 1940, the registrant has duly caused this report to be signed on its behalf by the undersigned, thereunto duly authorized.
BlackRock Bond Fund, Inc.
By: /s/ John M. Perlowski
John M. Perlowski
Chief Executive Officer (principal executive officer) of
BlackRock Bond Fund, Inc.
Date: November 21, 2024
Pursuant to the requirements of the Securities Exchange Act of 1934 and the Investment Company Act of 1940, this report has been signed below by the following persons on behalf of the registrant and in the capacities and on the dates indicated.
By: /s/ John M. Perlowski
John M. Perlowski
Chief Executive Officer (principal executive officer) of
BlackRock Bond Fund, Inc.
Date: November 21, 2024
By: /s/ Trent Walker
Trent Walker
Chief Financial Officer (principal financial officer) of
BlackRock Bond Fund, Inc.
Date: November 21, 2024