UNITED STATES
SECURITIES AND EXCHANGE COMMISSION
Washington, D.C. 20549
FORM N-CSR
CERTIFIED SHAREHOLDER REPORT OF REGISTERED
MANAGEMENT INVESTMENT COMPANIES
Investment Company Act file number 811-02864
Pioneer Bond Fund
(Exact name of registrant as specified in charter)
60 State Street, Boston, MA 02109
(Address of principal executive offices) (ZIP code)
Christopher J. Kelley, Amundi Asset Management, Inc.,
60 State Street, Boston, MA 02109
(Name and address of agent for service)
Registrant’s telephone number, including area code: (617) 742-7825
Date of fiscal year end: June 30, 2023
Date of reporting period: July 1, 2022 through June 30, 2023
Form N-CSR is to be used by management investment companies to file reports with the Commission not later than 10 days after the transmission to stockholders of any report that is required to be transmitted to stockholders under Rule 30e-1 under the Investment Company Act of 1940 (17 CFR 270.30e-1). The Commission may use the information provided on Form N-CSR in its regulatory, disclosure review, inspection, and policymaking roles.
A registrant is required to disclose the information specified by Form N-CSR, and the Commission will make this information public. A registrant is not required to respond to the collection of information contained in Form N-CSR unless the Form displays a currently valid Office of Management and Budget (“OMB”) control number. Please direct comments concerning the accuracy of the information collection burden estimate and any suggestions for reducing the burden to Secretary, Securities and Exchange Commission, 450 Fifth Street, NW, Washington, DC 20549-0609. The OMB has reviewed this collection of information under the clearance requirements of 44 U.S.C. ss. 3507.
ITEM 1. REPORTS TO STOCKHOLDERS.
Pioneer Bond Fund
Annual Report | June 30, 2023
| | | | | |
| A: PIOBX | C: PCYBX | K: PBFKX | R: PBFRX | Y: PICYX |
visit us: www.amundi.com/us
Pioneer Bond Fund | Annual Report | 6/30/231
President’s Letter
Dear Shareholders,
On February 13, 2023, Amundi US celebrated the 95th anniversary of Pioneer Fund, the second-oldest mutual fund in the United States. We recognized the anniversary with ringing of the closing bell at the New York Stock Exchange, which seemed fitting for this special milestone.
Pioneer Fund was launched on February 13, 1928 by Phil Carret, one of the earliest proponents of value investing and a leading innovator in the asset management industry. Mr. Carret began investing in the 1920s and founded Pioneer Investments (now Amundi US) in 1928, and was one of the first investors to realize he could uncover value through rigorous, innovative, fundamental research techniques.
Consistent with Mr. Carret’s investment approach and employing many of the same techniques utilized in the 1920s, Amundi US's portfolio managers have adapted Mr. Carret’s philosophy to a new age of “active” investing.
The last few years have seen investors face some unprecedented challenges, from a global pandemic that shuttered much of the world’s economy for months, to geopolitical strife, to rising inflation that has reached levels not seen in decades. Now, more than ever, Amundi US believes active management – that is, making active investment decisions across all of our portfolios – can help mitigate risk during periods of market volatility.
At Amundi US, active management begins with our own fundamental, bottom-up research process. Our team of dedicated research analysts and portfolio managers analyzes each security under consideration, communicating frequently with the management teams of the companies and other entities issuing the securities, and working together to identify those securities that we believe best meet our investment criteria for our family of funds. Our risk management approach begins with each security under consideration, as we strive to develop a deep understanding of the potential opportunity, while considering any potential risk factors.
Today, as shareholders, we have many options. It is our view that active management can serve shareholders well, not only when markets are thriving, but also during periods of market stress. As you consider your long-term investment goals, we encourage you to work with your financial professional to develop an investment plan that paves the way for you to pursue both your short-term and long-term goals.
2Pioneer Bond Fund | Annual Report | 6/30/23
We greatly appreciate the trust you have placed in us and look forward to continuing to serve you in the future.
Lisa M. Jones
Head of the Americas, President and CEO of US
Amundi Asset Management US, Inc.
August 2023
Any information in this shareowner report regarding market or economic trends or the factors influencing the Fund’s historical or future performance are statements of opinion as of the date of this report. Past performance is no guarantee of future results.
Pioneer Bond Fund | Annual Report | 6/30/233
Portfolio Management Discussion | 6/30/23
In the following interview, Brad Komenda discusses the factors that affected the performance of Pioneer Bond Fund during the 12-month period ended June 30, 2023. Mr. Komenda, a Managing Director and Director of Investment-Grade Corporates, and a portfolio manager at Amundi Asset Management US, Inc. (Amundi US), is responsible for the daily management of the Fund, along with Kenneth J. Taubes, Executive Vice President and Chief Investment Officer, US, and a portfolio manager at Amundi US, Timothy Rowe, a Managing Director and a portfolio manager at Amundi US, and Jonathan Scott, a senior vice president, Deputy Director of Multi-Sector Fixed Income, and a portfolio manager at Amundi US.
| Q | How did the Fund perform during the 12-month period ended June 30, 2023? |
| A | Pioneer Bond Fund’s Class A shares returned -1.70% at net asset value during the 12-month period ended June 30, 2023, while the Fund’s benchmark, the Bloomberg US Aggregate Bond Index, returned -0.94%. During the same 12-month period, the average return of the 621 mutual funds in Morningstar’s Intermediate Core-Plus Bond Funds Category was -0.29%. |
| Q | How would you describe the investment environment in the fixed-income markets during the 12-month period ended June 30, 2023? |
| A | Entering the period in July of 2022, the prospect of continued tightening of monetary policy by various central banks dominated the market’s focus, even as an inverted yield curve signaled a possible recession. (A yield curve is a line that plots the interest rates, at a set point in time, of bonds having equal credit quality but differing maturity dates. An inverted yield curve represents a yield curve where shorter-term yields are higher than longer-term yields.) |
| | With data showing that US year-over-year consumer price inflation had reached a new high of 9.1% in June of 2022, expectations were that the Federal Reserve (Fed) would continue to aggressively raise the target range of its benchmark federal funds rate, a pattern that had begun earlier in 2022. Indeed, the Fed implemented successive increases to the federal funds rate target range of 75 basis points (bps) at its July and September 2022 meetings. Those moves had the effect of diminishing investors’ sentiment for credit-sensitive investments, and |
4Pioneer Bond Fund | Annual Report | 6/30/23
| | dampened returns within the broader bond market. (A basis point is equal to 1/100th of a percentage point.) |
| | As post-June 2022 inflation data showed signs of modest easing, investors began to anticipate a pivot by the Fed to a more dovish policy stance, leading to strong bond market returns in October and November, despite another 75 bps increase to the federal funds target range in early November. However, in December, the markets soon turned their attention to the potential recessionary effects of the higher-interest-rate regime put in place by the Fed, which led riskier assets, such as stocks and corporate bonds, to give back some of the gains they had realized early in the fourth quarter. The Fed implemented a more modest 50 bps increase to the federal funds target range at its December meeting, leaving the target range at 4.25% ‒ 4.50% at the end of 2022, its highest level since the fall of 2007. |
| | As inflation showed signs of moderating entering 2023, riskier assets rallied again, amid renewed investor optimism that the Fed and other leading central banks were poised to stop raising interest rates. January 2023 saw Treasury yields pull back from their more recent highs on the market's outlook for a potential easing of monetary policy. That, in turn, boosted performance for bonds in general. On February 1, the Fed increased the federal funds rate target again, but this time by a comparatively moderate 25 bps, bringing the target range to 4.50% – 4.75%. |
| | In March, however, the failure of multiple US banks and the collapse of European banking giant Credit Suisse raised fears of a financial crisis. In response, the Fed implemented a new lending program to support bank liquidity, while market participants began to anticipate decreases in the federal funds rate target range by the Fed over the second half of the calendar year. The prospect of a more dovish stance on monetary policy and a “flight to safety” by investors in the wake of the banking-system issues drove Treasury yields lower, which in turn lent support to bond-market returns. At its March 23 meeting, the Fed went forward with another modest 25 bps increase to the federal funds target, bringing the range to 4.75% ‒ 5.00%. The financial markets viewed that increase as an indication that the Fed believed the financial system, overall, remained on solid footing. The Fed would implement another increase to the federal funds |
Pioneer Bond Fund | Annual Report | 6/30/235
| | target range of 25 bps in early May, bringing the range to 5.00% ‒ 5.25%, before taking a pause at its June meeting. |
| | Against that backdrop, the US Treasury yield curve moved higher, with the rise in yields most significant for securities with shorter maturities as the market priced in more interest-rate increases by the Fed, and the yield curve’s inversion became more pronounced. For the 12-month period ended June 30, 2023, the two-year Treasury yield finished 202 bps higher from where it was a year earlier, increasing from 2.92% to 4.94%, while the 10-year Treasury yield rose by a more modest 88 bps, from 2.98% to 3.86%, and the 30-year Treasury yield rose by 71 bps, from 3.14% to 3.85%. As a result and as mentioned earlier, the Treasury curve ended the 12-month period significantly inverted, a development that has typically been viewed as a predictor of recession. |
| | The upward move in interest rates weighed on returns in the fixed-income markets over the 12-month period. The Fund’s benchmark, the Bloomberg US Aggregate Bond Index (the Bloomberg Index), posted a return of -0.94% for the period, with the positive 1.55% return for corporate bonds notably better than returns for the more interest-rate-sensitive Treasury and securitized-asset sectors. On the other hand, below-investment-grade, high-yield corporate bonds returned 9.06% for the 12-month period, on the strength of credit-spread tightening (credit spreads are commonly defined as the differences in yield between Treasuries and other types of fixed-income securities with similar maturities). |
| Q | What factors influenced the Fund’s performance relative to the Bloomberg Index during the 12-month period ended June 30, 2023? |
| A | The Fund’s positioning along the yield curve weighed on benchmark-relative performance for the 12-month period. Specifically, the Fund was overweight versus the Bloomberg Index to the long end of the curve, which constrained relative returns due to the lower income available on bonds with longer maturities, a result of the inverted curve. |
| | The Fund’s sector allocation results also detracted from relative returns for the period. Most notably, the portfolio’s overweights |
6Pioneer Bond Fund | Annual Report | 6/30/23
| | to non-agency mortgage-backed securities (MBS) and commercial MBS (CMBS) weighed on the Fund’s relative performance. Concerns about credit conditions as well as an imbalance between supply and demand had a negative effect on the performance of non-agency MBS, while investors’ sentiment with respect to CMBS weakened due to fears of impairment in underlying collateral in the event of a recession. Partially offsetting the negative effects of the Fund’s allocations to those securitized sectors was the portfolio’s benchmark-relative underweight to US Treasuries, which underperformed due to rising yields and corresponding price weakness. (Bond prices and interest rates/yields tend to move in opposite directions.) |
| | The Fund’s positioning within corporate credit significantly underperformed and detracted from relative returns during the 12-month period. Most notably, a short credit-default-swap index (CDX) position, which we utilized to try to reduce credit exposure in the portfolio, detracted from relative performance as spreads tightened and bond prices rose over the period. Partially offsetting that negative were strong security selection results among the Fund’s holdings within the industrials and financials sectors, as overweights to subordinated financials and to “BBB” rated industrials issues aided relative performance. |
| | Finally, within the Fund��s allocation to agency MBS, an overweight to higher-coupon pools (versus the Bloomberg Index) modestly supported relative returns, as higher-coupon MBS outperformed, driven by rising mortgage rates and extended durations for securities backed by lower-coupon pools. |
| Q | Did the Fund have any investments in derivative securities during the 12-month period ended June 30, 2023? If so, did the derivatives have a material effect on the Fund’s performance? |
| A | Yes, we invested the Fund in Treasury futures and CDX. We invest in Treasury futures as part of our duration-management strategy for the portfolio. (Duration is a measure of the sensitivity of the price, or the value of principal, of a fixed-income investment to a change in interest rates, expressed as a number of years.) We believe the use of Treasury futures allows us to express our views on duration and yield-curve positioning in the most efficient manner. |
Pioneer Bond Fund | Annual Report | 6/30/237
| | We typically have used the CDX positions as part of our efforts to either gain or reduce the Fund’s exposures to both investment-grade and high-yield corporate securities more efficiently, as cash bond transactions take a little more time to execute, and have a higher liquidity cost. The use of derivatives, we think, may allow the Fund to potentially benefit from the performance effects of the targeted asset class, while retaining a better liquidity profile, which may help reduce risk. The use of Treasury futures had a negligible effect on the Fund's relative performance during the 12-month period, while the use of CDX, as noted earlier, detracted from relative results. |
| Q | What factors affected the Fund’s yield, or distributions*to shareholders, during the 12-month period ended June 30, 2023? |
| A | The Fund’s monthly distribution rate increased over the 12-month period. While the Treasury yield curve finished the period higher than where it began one year ago, most notably on the short end, tightening credit spreads seen across both corporate credit and securitized assets partially offset those effects. In addition, we took steps to position the Fund’s portfolio more conservatively as the period progressed, as the likelihood of an economic slowdown or recession increased sharply, in our view, as interest rates moved into restrictive territory. |
| Q | What is your investment outlook, and how is the Fund positioned heading into its new fiscal year? |
| A | With elevated inflation proving to be sticky and the Fed committed to bringing inflation down to its 2% long-term target, we believe the federal funds rate target range will remain “higher for longer,” contrary to current market expectations, which have continued to price in rate cuts for the latter part of 2023. We believe financial conditions will become more restrictive, and that the likelihood of a recession has risen, particularly as banks tighten lending standards and as the Fed maintains higher interest rates. Consequently, we expect to maintain a somewhat defensive posture in the Fund’s portfolio as recession risk increases over the course of the year. |
| * | Distributions are not guaranteed. |
8Pioneer Bond Fund | Annual Report | 6/30/23
| | As is typically the case during recessions, we would expect some credit-oriented bond issuers to end up in trouble, which could lead to increased defaults. However, we do not expect a deep recession, such as during the global financial crisis (GFC) of 2008. In our opinion, the economy will likely be on the upswing and the default rate headed lower at some point in 2024. |
| | In our view, US fixed-income duration exposures remain attractive in both nominal and inflation-indexed terms. As spreads in credit-oriented sectors have narrowed back to early March (pre-bank crisis) levels, we have been selectively reducing the size of the Fund’s corporate, securitized credit, and agency MBS allocations. However, we anticipate the Fund’s positioning to continue actively evolving along with shifts in our outlook, and our views on relative valuations. |
Pioneer Bond Fund | Annual Report | 6/30/239
Please refer to the Schedule of Investments on pages 21- 92 for a full listing of Fund securities.
All investments are subject to risk, including the possible loss of principal. In the past several years, financial markets have experienced increased volatility and heightened uncertainty. The market prices of securities may go up or down, sometimes rapidly or unpredictably, due to general market conditions, such as real or perceived adverse economic, political, or regulatory conditions, recessions, inflation, changes in interest or currency rates, lack of liquidity in the bond markets, the spread of infectious illness or other public health issues, armed conflict including Russia's military invasion of Ukraine, sanctions against Russia, other nations or individuals or companies and possible countermeasures, market disruptions caused by tariffs, trade disputes or other government actions, or adverse investor sentiment. These conditions may continue, recur, worsen or spread.
Until recently, a commonly used reference rate for floating rate securities was LIBOR (London Interbank Offered Rate). Publication of most LIBOR settings has ceased on a representative basis. The impact of the transition from LIBOR on the Fund's transactions and financial markets generally cannot yet be determined.
The market price of securities may fluctuate when interest rates change. When interest rates rise, the prices of fixed-income securities in the Fund will generally fall. Conversely, when interest rates fall, the prices of fixed-income securities in the Fund will generally rise.
Investments in the Fund are subject to possible loss due to the financial failure of the issuers of the underlying securities and their inability to meet their debt obligations.
Prepayment risk is the chance that an issuer may exercise its right to prepay its security, if falling interest rates prompt the issuer to do so. Forced to reinvest the unanticipated proceeds at lower interest rates, the Fund would experience a decline in income and lose the opportunity for additional price appreciation.
Investments in high-yield or lower-rated securities are subject to greater-than-average price volatility, illiquidity and possibility of default.
The securities issued by US government- sponsored entities (i.e., FNMA, Freddie Mac) are neither guaranteed nor issued by the US government.
The Fund may invest in mortgage-backed securities, which during times of fluctuating interest rates may increase or decrease more than other fixed-income securities. Mortgage-backed securities are also subject to prepayments.
10Pioneer Bond Fund | Annual Report | 6/30/23
For more information on this or any Pioneer fund, please visit amundi.com/usinvestors or call 1-800-622-9876. This material must be preceded or accompanied by the Fund's current prospectus or summary prospectus.
Any information in this shareholder report regarding market or economic trends or the factors influencing the Fund’s historical or future performance are statements of opinion as of the date of this report. Past performance is no guarantee of future results.
Pioneer Bond Fund | Annual Report | 6/30/2311
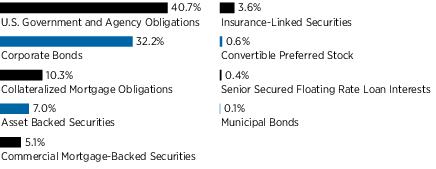
Portfolio Summary | 6/30/23
Portfolio Diversification
(As a percentage of total investments)*
10 Largest Holdings
| (As a percentage of total investments)* |
| 1. | U.S. Treasury Bonds, 2.875%, 5/15/52 | 3.66% |
| 2. | U.S. Treasury Bonds, 2.25%, 2/15/52 | 3.19 |
| 3. | U.S. Treasury Notes, 3.625%, 4/30/28 | 2.39 |
| 4. | U.S. Treasury Notes, 3.50%, 2/15/33 | 2.09 |
| 5. | Federal National Mortgage Association, 5.50%, 7/1/53 (TBA) | 1.75 |
| 6. | U.S. Treasury Bonds, 3.625%, 2/15/53 | 1.73 |
| 7. | Federal National Mortgage Association, 6.00%, 7/1/53 (TBA) | 1.70 |
| 8. | U.S. Treasury Inflation Indexed Notes, 0.125%, 7/15/24 | 1.34 |
| 9. | Federal Home Loan Mortgage Corp., 3.00%, 4/1/52 | 0.95 |
| 10. | Federal National Mortgage Association, 5.00%, 7/1/38 (TBA) | 0.88 |
| | |
| * | Excludes short-term investments and all derivative contracts except for options purchased. The Fund is actively managed, and current holdings may be different. The holdings listed should not be considered recommendations to buy or sell any securities. |
12Pioneer Bond Fund | Annual Report | 6/30/23
Prices and Distributions | 6/30/23
Net Asset Value per Share
| Class | 6/30/23 | 6/30/22 |
| A | $8.22 | $8.60 |
| C | $8.12 | $8.51 |
| K | $8.21 | $8.60 |
| R | $8.29 | $8.68 |
| Y | $8.13 | $8.51 |
| | | |
Distributions per Share: 7/1/22 - 6/30/23
| Class | Net
Investment
Income | Short-Term
Capital Gains | Long-Term
Capital Gains |
| A | $0.2330 | $— | $— |
| C | $0.1783 | $— | $— |
| K | $0.2728 | $— | $— |
| R | $0.2112 | $— | $— |
| Y | $0.2601 | $— | $— |
Index Definition
The Bloomberg U.S. Aggregate Bond Index is an unmanaged measure of the US bond market. Indices are unmanaged and their returns assume reinvestment of dividends and do not reflect any fees or expenses. It is not possible to invest directly in an index.
The index defined here pertains to the “Value of $10,000 Investment” and “Value of $5 Million Investment” charts on pages 14- 18.
Pioneer Bond Fund | Annual Report | 6/30/2313
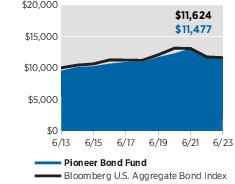
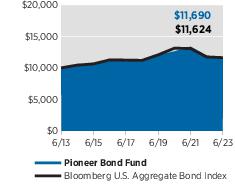
| Performance Update | 6/30/23 | Class A Shares |
Investment Returns
The mountain chart on the right shows the change in value of a $10,000 investment made in Class A shares of Pioneer Bond Fund at public offering price during the periods shown, compared to that of the Bloomberg U.S. Aggregate Bond Index.
Average Annual Total Returns
(As of June 30, 2023) |
| Period | Net
Asset
Value
(NAV) | Public
Offering
Price
(POP) | Bloomberg
U.S.
Aggregate
Bond
Index |
| 10 Years | 1.86% | 1.39% | 1.52% |
| 5 Years | 0.94 | 0.00 | 0.77 |
| 1 Year | -1.70 | -6.17 | -0.94 |
Expense Ratio
(Per prospectus dated November 1, 2022) |
| Gross |
| 0.79% |
Value of $10,000 Investment
Call 1-800-225-6292 or visit www.amundi.com/us for the most recent month-end performance results. Current performance may be lower or higher than the performance data quoted.
The performance data quoted represents past performance, which is no guarantee of future results. Investment return and principal value will fluctuate, and shares, when redeemed, may be worth more or less than their original cost.
NAV results represent the percent change in net asset value per share. NAV returns would have been lower had sales charges been reflected. POP returns reflect deduction of maximum 4.50% sales charge. All results are historical and assume the reinvestment of dividends and capital gains. Other share classes are available for which performance and expenses will differ.
Performance results reflect any applicable expense waivers in effect during the periods shown. Without such waivers Fund performance would be lower. Waivers may not be in effect for all funds. Certain fee waivers are contractual through a specified period. Otherwise, fee waivers can be rescinded at any time. See the prospectus and financial statements for more information.
The performance table and graph do not reflect the deduction of fees and taxes that a shareowner would pay on Fund distributions or the redemption of Fund shares.
Please refer to the financial highlights for a more current expense ratio.
14Pioneer Bond Fund | Annual Report | 6/30/23
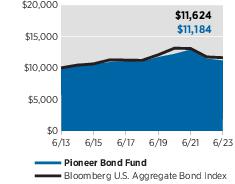
| Performance Update | 6/30/23 | Class C Shares |
Investment Returns
The mountain chart on the right shows the change in value of a $10,000 investment made in Class C shares of Pioneer Bond Fund during the periods shown, compared to that of the Bloomberg U.S. Aggregate Bond Index.
Average Annual Total Returns
(As of June 30, 2023) |
| Period | If
Held | If
Redeemed | Bloomberg
U.S.
Aggregate
Bond
Index |
| 10 Years | 1.12% | 1.12% | 1.52% |
| 5 Years | 0.27 | 0.27 | 0.77 |
| 1 Year | -2.49 | -3.44 | -0.94 |
Expense Ratio
(Per prospectus dated November 1, 2022) |
| Gross |
| 1.43% |
Value of $10,000 Investment
Call 1-800-225-6292 or visit www.amundi.com/us for the most recent month-end performance results. Current performance may be lower or higher than the performance data quoted.
The performance data quoted represents past performance, which is no guarantee of future results. Investment return and principal value will fluctuate, and shares, when redeemed, may be worth more or less than their original cost.
Class C shares held for less than one year are also subject to a 1% contingent deferred sales charge (CDSC). “If Held” results represent the percent change in net asset value per share. “If Redeemed” returns reflect deduction of the CDSC for the one-year period, assuming a complete redemption of shares at the last price calculated on the last business day of the period, and no CDSC for the five- and 10-year periods. All results are historical and assume the reinvestment of dividends and capital gains. Other share classes are available for which performance and expenses will differ.
Performance results reflect any applicable expense waivers in effect during the periods shown. Without such waivers Fund performance would be lower. Waivers may not be in effect for all funds. Certain fee waivers are contractual through a specified period. Otherwise, fee waivers can be rescinded at any time. See the prospectus and financial statements for more information.
The performance table and graph do not reflect the deduction of fees and taxes that a shareowner would pay on Fund distributions or the redemption of Fund shares.
Please refer to the financial highlights for a more current expense ratio.
Pioneer Bond Fund | Annual Report | 6/30/2315
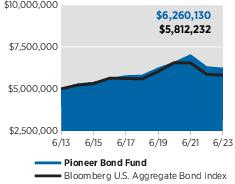
| Performance Update | 6/30/23 | Class K Shares |
Investment Returns
The mountain chart on the right shows the change in value of a $5 million investment made in Class K shares of Pioneer Bond Fund during the periods shown, compared to that of the Bloomberg U.S. Aggregate Bond Index.
Average Annual Total Returns
(As of June 30, 2023) |
| Period | Net
Asset
Value
(NAV) | Bloomberg
U.S.
Aggregate
Bond
Index |
| 10 Years | 2.27% | 1.52% |
| 5 Years | 1.39 | 0.77 |
| 1 Year | -1.34 | -0.94 |
Expense Ratio
(Per prospectus dated November 1, 2022) |
| Gross |
| 0.33% |
Value of $5 Million Investment
Call 1-800-225-6292 or visit www.amundi.com/us for the most recent month-end performance results. Current performance may be lower or higher than the performance data quoted.
The performance data quoted represents past performance, which is no guarantee of future results. Investment return and principal value will fluctuate, and shares, when redeemed, may be worth more or less than their original cost.
Class K shares are not subject to sales charges and are available for limited groups of eligible investors, including institutional investors. All results are historical and assume the reinvestment of dividends and capital gains. Other share classes are available for which performance and expenses will differ.
Performance results reflect any applicable expense waivers in effect during the periods shown. Without such waivers Fund performance would be lower. Waivers may not be in effect for all funds. Certain fee waivers are contractual through a specified period. Otherwise, fee waivers can be rescinded at any time. See the prospectus and financial statements for more information.
The performance table and graph do not reflect the deduction of fees and taxes that a shareowner would pay on Fund distributions or the redemption of Fund shares.
Please refer to the financial highlights for a more current expense ratio.
16Pioneer Bond Fund | Annual Report | 6/30/23
| Performance Update | 6/30/23 | Class R Shares |
Investment Returns
The mountain chart on the right shows the change in value of a $10,000 investment made in Class R shares of Pioneer Bond Fund during the periods shown, compared to that of the Bloomberg U.S. Aggregate Bond Index.
Average Annual Total Returns
(As of June 30, 2023) |
| Period | Net
Asset
Value
(NAV) | Bloomberg
U.S.
Aggregate
Bond
Index |
| 10 Years | 1.57% | 1.52% |
| 5 Years | 0.65 | 0.77 |
| 1 Year | -2.05 | -0.94 |
Expense Ratio
(Per prospectus dated November 1, 2022) |
| Gross |
| 1.07% |
Value of $10,000 Investment
Call 1-800-225-6292 or visit www.amundi.com/us for the most recent month-end performance results. Current performance may be lower or higher than the performance data quoted.
The performance data quoted represents past performance, which is no guarantee of future results. Investment return and principal value will fluctuate, and shares, when redeemed, may be worth more or less than their original cost.
Class R shares are not subject to sales charges and are available for limited groups of eligible investors, including institutional investors. All results are historical and assume the reinvestment of dividends and capital gains. Other share classes are available for which performance and expenses will differ.
Performance results reflect any applicable expense waivers in effect during the periods shown. Without such waivers Fund performance would be lower. Waivers may not be in effect for all funds. Certain fee waivers are contractual through a specified period. Otherwise, fee waivers can be rescinded at any time. See the prospectus and financial statements for more information.
The performance table and graph do not reflect the deduction of fees and taxes that a shareowner would pay on Fund distributions or the redemption of Fund shares.
Please refer to the financial highlights for a more current expense ratio.
Pioneer Bond Fund | Annual Report | 6/30/2317
| Performance Update | 6/30/23 | Class Y Shares |
Investment Returns
The mountain chart on the right shows the change in value of a $5 million investment made in Class Y shares of Pioneer Bond Fund during the periods shown, compared to that of the Bloomberg U.S. Aggregate Bond Index.
Average Annual Total Returns
(As of June 30, 2023) |
| Period | Net
Asset
Value
(NAV) | Bloomberg
U.S.
Aggregate
Bond
Index |
| 10 Years | 2.16% | 1.52% |
| 5 Years | 1.26 | 0.77 |
| 1 Year | -1.39 | -0.94 |
Expense Ratio
(Per prospectus dated November 1, 2022) |
| Gross |
| 0.44% |
Value of $5 Million Investment
Call 1-800-225-6292 or visit www.amundi.com/us for the most recent month-end performance results. Current performance may be lower or higher than the performance data quoted.
The performance data quoted represents past performance, which is no guarantee of future results. Investment return and principal value will fluctuate, and shares, when redeemed, may be worth more or less than their original cost.
Class Y shares are not subject to sales charges and are available for limited groups of eligible investors, including institutional investors. All results are historical and assume the reinvestment of dividends and capital gains. Other share classes are available for which performance and expenses will differ.
Performance results reflect any applicable expense waivers in effect during the periods shown. Without such waivers Fund performance would be lower. Waivers may not be in effect for all funds. Certain fee waivers are contractual through a specified period. Otherwise, fee waivers can be rescinded at any time. See the prospectus and financial statements for more information.
The performance table and graph do not reflect the deduction of fees and taxes that a shareowner would pay on Fund distributions or the redemption of Fund shares.
Please refer to the financial highlights for a more current expense ratio.
18Pioneer Bond Fund | Annual Report | 6/30/23
Comparing Ongoing Fund Expenses
As a shareowner in the Fund, you incur two types of costs:
| (1) | ongoing costs, including management fees, distribution and/or service (12b-1) fees, and other Fund expenses; and |
| (2) | transaction costs, including sales charges (loads) on purchase payments. |
This example is intended to help you understand your ongoing expenses (in dollars) of investing in the Fund and to compare these costs with the ongoing costs of investing in other mutual funds. The example is based on an investment of $1,000 at the beginning of the Fund’s latest six-month period and held throughout the six months.
Using the Tables
Actual Expenses
The first table below provides information about actual account values and actual expenses. You may use the information in this table, together with the amount you invested, to estimate the expenses that you paid over the period as follows:
| (1) | Divide your account value by $1,000
Example: an $8,600 account value ÷ $1,000 = 8.6 |
| (2) | Multiply the result in (1) above by the corresponding share class’s number in the third row under the heading entitled “Expenses Paid During Period” to estimate the expenses you paid on your account during this period. |
Expenses Paid on a $1,000 Investment in Pioneer Bond Fund
Based on actual returns from January 1, 2023 through June 30, 2023.
| Share Class | A | C | K | R | Y |
Beginning Account
Value on 1/1/23 | $1,000.00 | $1,000.00 | $1,000.00 | $1,000.00 | $1,000.00 |
Ending Account Value
(after expenses) on 6/30/23 | $1,027.30 | $1,022.90 | $1,029.80 | $1,025.80 | $1,028.00 |
Expenses Paid
During Period* | $4.17 | $7.47 | $1.81 | $5.58 | $2.36 |
| | |
| * | Expenses are equal to the Fund’s annualized expense ratio of 0.83%, 1.49%, 0.36%, 1.11%, and 0.47% for Class A, Class C, Class K, Class R, and Class Y shares, respectively, multiplied by the average account value over the period, multiplied by 181/365 (to reflect the partial year period). |
Pioneer Bond Fund | Annual Report | 6/30/2319
Comparing Ongoing Fund Expenses (continued)
Hypothetical Example for Comparison Purposes
The table below provides information about hypothetical account values and hypothetical expenses based on the Fund’s actual expense ratio and an assumed rate of return of 5% per year before expenses, which is not the Fund’s actual return. The hypothetical account values and expenses may not be used to estimate the actual ending account balance or expenses you paid for the period.
You may use this information to compare the ongoing costs of investing in the Fund and other funds. To do so, compare this 5% hypothetical example with the 5% hypothetical examples that appear in the shareholder reports of the other funds.
Please note that the expenses shown in the tables are meant to highlight your ongoing costs only and do not reflect any transaction costs, such as sales charges (loads) that are charged at the time of the transaction. Therefore, the table below is useful in comparing ongoing costs only and will not help you determine the relative total costs of owning different funds. In addition, if these transaction costs were included, your costs would have been higher.
Expenses Paid on a $1,000 Investment in Pioneer Bond Fund
Based on a hypothetical 5% return per year before expenses, reflecting the period from January 1, 2023 through June 30, 2023.
| Share Class | A | C | K | R | Y |
Beginning Account
Value on 1/1/23 | $1,000.00 | $1,000.00 | $1,000.00 | $1,000.00 | $1,000.00 |
Ending Account Value
(after expenses) on 6/30/23 | $1,020.68 | $1,017.41 | $1,023.01 | $1,019.29 | $1,022.46 |
Expenses Paid
During Period* | $4.16 | $7.45 | $1.81 | $5.56 | $2.36 |
| | |
| * | Expenses are equal to the Fund’s annualized expense ratio of 0.83%, 1.49%, 0.36%, 1.11%, and 0.47% for Class A, Class C, Class K, Class R, and Class Y shares, respectively, multiplied by the average account value over the period, multiplied by 181/365 (to reflect the partial year period). |
20Pioneer Bond Fund | Annual Report | 6/30/23
Schedule of Investments | 6/30/23
Principal
Amount
USD ($) | | | | | | Value |
| | UNAFFILIATED ISSUERS — 103.1% | |
| | Senior Secured Floating Rate Loan
Interests — 0.4% of Net Assets*(a) | |
| | Chemicals-Diversified — 0.1% | |
| 1,397,313 | LSF11 A5 HoldCo LLC, Term Loan, 8.717% (Term SOFR + 350 bps), 10/15/28 | $ 1,377,881 |
| | Total Chemicals-Diversified | $1,377,881 |
|
|
| | Chemicals-Specialty — 0.1% | |
| 4,277,700 | Mativ Holdings, Inc., Term B Loan, 9.00% (Term SOFR + 375 bps), 4/20/28 | $ 4,127,981 |
| | Total Chemicals-Specialty | $4,127,981 |
|
|
| | Electric-Generation — 0.0%† | |
| 317,551 | Eastern Power LLC (Eastern Covert Midco LLC), Term Loan, 8.852% (Term SOFR + 375 bps), 10/2/25 | $ 305,510 |
| | Total Electric-Generation | $305,510 |
|
|
| | Electronic Composition — 0.0%† | |
| 1,005,962 | Energy Acquisition LP, First Lien Initial Term Loan, 9.614% (Term SOFR + 425 bps), 6/26/25 | $ 939,317 |
| | Total Electronic Composition | $939,317 |
|
|
| | Finance-Leasing Company — 0.0%† | |
| 611,334 | Avolon TLB Borrower 1 (US) LLC, Term B-4 Loan, 6.646% (LIBOR + 150 bps), 2/12/27 | $ 603,961 |
| | Total Finance-Leasing Company | $603,961 |
|
|
| | Medical-Wholesale Drug Distribution — 0.1% | |
| 2,076,562 | Owens & Minor, Inc., Term B-1 Loan, 8.952% (Term SOFR + 375 bps), 3/29/29 | $ 2,077,860 |
| | Total Medical-Wholesale Drug Distribution | $2,077,860 |
|
|
| | Metal Processors & Fabrication — 0.1% | |
| 3,463,312 | Grinding Media, Inc. (Molycop, Ltd.), First Lien Initial Term Loan, 9.199% (Term SOFR + 400 bps), 10/12/28 | $ 3,381,059 |
| | Total Metal Processors & Fabrication | $3,381,059 |
|
|
| | Physical Practice Management — 0.0%† | |
| 920,963 | Team Health Holdings, Inc., Extended Term Loan, 10.352% (Term SOFR + 525 bps), 3/2/27 | $ 640,069 |
| | Total Physical Practice Management | $640,069 |
|
|
The accompanying notes are an integral part of these financial statements.
Pioneer Bond Fund | Annual Report | 6/30/2321
Schedule of Investments | 6/30/23 (continued)
Principal
Amount
USD ($) | | | | | | Value |
| | Recreational Centers — 0.0%† | |
| 190,787 | Fitness International LLC, Term B Loan, 8.445% (Term SOFR + 325 bps), 4/18/25 | $ 190,131 |
| | Total Recreational Centers | $190,131 |
|
|
| | Retail — 0.0%† | |
| 344,112 | Staples, Inc., 2019 Refinancing New Term B-2 Loan, 9.799% (LIBOR + 450 bps), 9/12/24 | $ 340,707 |
| | Total Retail | $340,707 |
|
|
| | Retail-Restaurants — 0.0%† | |
| 1,365,910 | 1011778 B.C. Unlimited Liability Co., Term B-4 Loan, 6.943% (LIBOR + 175 bps), 11/19/26 | $ 1,357,054 |
| | Total Retail-Restaurants | $1,357,054 |
|
|
| | Telephone-Integrated — 0.0%† | |
| 627,394 | Level 3 Financing, Inc., Tranche B 2027 Term Loan, 6.967% (Term SOFR + 175 bps), 3/1/27 | $ 579,686 |
| | Total Telephone-Integrated | $579,686 |
|
|
| | Total Senior Secured Floating Rate Loan Interests
(Cost $16,475,250) | $15,921,216 |
|
|
| | Asset Backed Securities — 6.3% of Net
Assets | |
| 500,000 | 321 Henderson Receivables III LLC, Series 2008-1A, Class B, 8.37%, 1/15/46 (144A) | $ 506,978 |
| 250,257(a) | 321 Henderson Receivables LLC, Series 2005-1A, Class A1, 5.423% (1 Month USD LIBOR + 23 bps), 11/15/40 (144A) | 243,221 |
| 1,750,000(a) | ABPCI Direct Lending Fund CLO X LP, Series 2020-10A, Class A1A, 7.20% (3 Month USD LIBOR + 195 bps), 1/20/32 (144A) | 1,728,598 |
| 1,830,702 | Accelerated LLC, Series 2021-1H, Class C, 2.35%, 10/20/40 (144A) | 1,626,670 |
| 3,500,000 | Amur Equipment Finance Receivables XII LLC, Series 2023-1A, Class C, 6.36%, 12/20/29 (144A) | 3,485,849 |
| 4,776,876 | Aqua Finance Trust, Series 2019-A, Class C, 4.01%, 7/16/40 (144A) | 4,201,504 |
| 2,110,000 | Aqua Finance Trust, Series 2020-AA, Class C, 3.97%, 7/17/46 (144A) | 1,781,373 |
| 6,975,000(a) | Arbor Realty Commercial Real Estate Notes, Ltd., Series 2021-FL3, Class C, 7.043% (1 Month USD LIBOR + 185 bps), 8/15/34 (144A) | 6,492,532 |
| 7,740,000(a) | Arbor Realty Commercial Real Estate Notes, Ltd., Series 2022-FL1, Class C, 7.367% (SOFR30A + 230 bps), 1/15/37 (144A) | 7,277,953 |
The accompanying notes are an integral part of these financial statements.
22Pioneer Bond Fund | Annual Report | 6/30/23
Principal
Amount
USD ($) | | | | | | Value |
| | Asset Backed Securities — (continued) | |
| 10,600,000(a) | Arbor Realty Commercial Real Estate Notes, Ltd., Series 2022-FL2, Class C, 8.597% (1 Month Term SOFR + 345 bps), 5/15/37 (144A) | $ 10,305,229 |
| 7,699,593 | Blackbird Capital Aircraft, Series 2021-1A, Class A, 2.443%, 7/15/46 (144A) | 6,629,514 |
| 4,980,000(a) | BSPRT Issuer, Ltd., Series 2022-FL8, Class C, 7.367% (SOFR30A + 230 bps), 2/15/37 (144A) | 4,687,580 |
| 2,750,000(a) | Carlyle US CLO, Ltd., Series 2019-4A, Class CR, 8.186% (3 Month Term SOFR + 320 bps), 4/15/35 (144A) | 2,533,250 |
| 5,370,280(b) | Cascade MH Asset Trust, Series 2019-MH1, Class A, 4.00%, 11/25/44 (144A) | 5,046,802 |
| 3,773,000 | Cascade MH Asset Trust, Series 2021-MH1, Class M1, 2.992%, 2/25/46 (144A) | 2,793,118 |
| 1,906,000 | Cascade MH Asset Trust, Series 2021-MH1, Class M2, 3.693%, 2/25/46 (144A) | 1,451,050 |
| 4,405,000 | Commercial Equipment Finance LLC, Series 2021-A, Class C, 3.55%, 12/15/28 (144A) | 4,114,467 |
| 253,128(a) | Commonbond Student Loan Trust, Series 2017-BGS, Class A2, 5.80% (1 Month USD LIBOR + 65 bps), 9/25/42 (144A) | 246,057 |
| 544,215 | Continental Credit Card ABS LLC, Series 2019-1A, Class A, 3.83%, 8/15/26 (144A) | 542,633 |
| 12,425,000 | Continental Finance Credit Card ABS Master Trust, Series 2022-A, Class A, 6.19%, 10/15/30 (144A) | 11,922,435 |
| 2,400,000 | DataBank Issuer, Series 2021-1A, Class B, 2.65%, 2/27/51 (144A) | 2,056,434 |
| 309,352 | Diamond Resorts Owner Trust, Series 2019-1A, Class B, 3.53%, 2/20/32 (144A) | 293,508 |
| 8,257,612 | Domino's Pizza Master Issuer LLC, Series 2019-1A, Class A2, 3.668%, 10/25/49 (144A) | 7,215,337 |
| 1,515,000 | Drive Auto Receivables Trust, Series 2020-2, Class D, 3.05%, 5/15/28 | 1,481,877 |
| 4,000,000 | ExteNet LLC, Series 2019-1A, Class C, 5.219%, 7/26/49 (144A) | 3,777,672 |
| 12,575,000(b) | Finance of America HECM Buyout, Series 2022-HB1, Class M3, 5.084%, 2/25/32 (144A) | 10,902,279 |
| 1,575,000(a) | First Eagle BSL CLO, Ltd., Series 2019-1A, Class C, 9.60% (3 Month USD LIBOR + 435 bps), 1/20/33 (144A) | 1,444,831 |
| 1,000,000(a) | First Eagle BSL CLO, Ltd., Series 2019-1A, Class D, 12.95% (3 Month USD LIBOR + 770 bps), 1/20/33 (144A) | 874,142 |
| 3,440,000 | Foundation Finance Trust, Series 2019-1A, Class B, 4.22%, 11/15/34 (144A) | 3,280,495 |
The accompanying notes are an integral part of these financial statements.
Pioneer Bond Fund | Annual Report | 6/30/2323
Schedule of Investments | 6/30/23 (continued)
Principal
Amount
USD ($) | | | | | | Value |
| | Asset Backed Securities — (continued) | |
| 2,441,323 | Foundation Finance Trust, Series 2021-1A, Class A, 1.27%, 5/15/41 (144A) | $ 2,144,843 |
| 4,200,000 | Four Seas LP, Series 2017-1A, Class A2, 5.927%, 8/28/27 (144A) | 3,739,773 |
| 3,000,000(a) | Goldentree Loan Management US CLO 6, Ltd., Series 2019-6A, Class DR, 8.148% (3 Month Term SOFR + 310 bps), 4/20/35 (144A) | 2,760,675 |
| 3,957,638 | Hardee's Funding LLC, Series 2018-1A, Class A2II, 4.959%, 6/20/48 (144A) | 3,688,178 |
| 3,440,000(a) | HGI CRE CLO, Ltd., Series 2021-FL2, Class C, 6.958% (1 Month USD LIBOR + 180 bps), 9/17/36 (144A) | 3,237,883 |
| 421,532 | HIN Timeshare Trust, Series 2020-A, Class D, 5.50%, 10/9/39 (144A) | 387,084 |
| 5,860,612 | HOA Funding LLC - HOA, Series 2021-1A, Class A2, 4.723%, 8/20/51 (144A) | 4,809,975 |
| 2,971,233 | Home Partners of America Trust, Series 2019-1, Class D, 3.406%, 9/17/39 (144A) | 2,610,927 |
| 4,248,391 | Home Partners of America Trust, Series 2019-2, Class E, 3.32%, 10/19/39 (144A) | 3,607,480 |
| 1,484,916 | Horizon Funding LLC, Series 2019-1A, Class A1, 4.21%, 9/15/27 (144A) | 1,457,074 |
| 3,120,947 | J.G. Wentworth XLI LLC, Series 2018-1A, Class A, 3.74%, 10/17/72 (144A) | 2,659,247 |
| 4,902,263 | JG Wentworth XLIII LLC, Series 2019-1A, Class A, 3.82%, 8/17/71 (144A) | 4,178,926 |
| 134,571 | JG Wentworth XXII LLC, Series 2010-3A, Class A, 3.82%, 12/15/48 (144A) | 132,143 |
| 1,950,000 | JPMorgan Chase Bank NA - CACLN, Series 2021-3, Class F, 3.694%, 2/26/29 (144A) | 1,703,106 |
| 3,031,550 | Libra Solutions LLC, Series 2022-2A, Class B, 8.85%, 10/15/34 (144A) | 2,996,687 |
| 306,544 | Marlette Funding Trust, Series 2019-2A, Class C, 4.11%, 7/16/29 (144A) | 306,269 |
| 8,585,000(a) | MF1, Ltd., Series 2021-FL7, Class D, 7.707% (1 Month USD LIBOR + 255 bps), 10/16/36 (144A) | 7,987,767 |
| 1,695,169 | Mosaic Solar Loan Trust, Series 2019-2A, Class A, 2.88%, 9/20/40 (144A) | 1,476,930 |
| 803 | Mosaic Solar Loan Trust, Series 2019-2A, Class C, 4.35%, 9/20/40 (144A) | 801 |
| 760,626 | Mosaic Solar Loan Trust, Series 2020-1A, Class A, 2.10%, 4/20/46 (144A) | 651,274 |
| 353,733 | MVW LLC, Series 2020-1A, Class C, 4.21%, 10/20/37 (144A) | 332,292 |
| 5,095,000 | Nelnet Student Loan Trust, Series 2021-A, Class B1, 2.85%, 4/20/62 (144A) | 4,173,920 |
The accompanying notes are an integral part of these financial statements.
24Pioneer Bond Fund | Annual Report | 6/30/23
Principal
Amount
USD ($) | | | | | | Value |
| | Asset Backed Securities — (continued) | |
| 2,850,000(a) | Newark BSL CLO 1, Ltd., Series 2016-1A, Class CR, 8.34% (3 Month Term SOFR + 326 bps), 12/21/29 (144A) | $ 2,660,763 |
| 750,791 | NMEF Funding LLC, Series 2019-A, Class C, 3.30%, 8/17/26 (144A) | 749,924 |
| 2,300,000 | NMEF Funding LLC, Series 2021-A, Class C, 2.58%, 12/15/27 (144A) | 2,194,046 |
| 2,690,000 | NMEF Funding LLC, Series 2022-B, Class C, 8.54%, 6/15/29 (144A) | 2,684,383 |
| 3,517,648 | Oportun Funding XIV LLC, Series 2021-A, Class C, 3.44%, 3/8/28 (144A) | 3,368,677 |
| 1,680,732 | Orange Lake Timeshare Trust, Series 2019-A, Class D, 4.93%, 4/9/38 (144A) | 1,563,026 |
| 674,254 | Oxford Finance Funding LLC, Series 2019-1A, Class B, 5.438%, 2/15/27 (144A) | 668,639 |
| 4,000,000(a) | Palmer Square Loan Funding, Ltd., Series 2020-1A, Class B, 7.279% (3 Month USD LIBOR + 190 bps), 2/20/28 (144A) | 3,962,660 |
| 4,000,000(a) | Palmer Square Loan Funding, Ltd., Series 2020-1A, Class D, 10.229% (3 Month USD LIBOR + 485 bps), 2/20/28 (144A) | 3,958,240 |
| 3,000,000(a) | Palmer Square Loan Funding, Ltd., Series 2022-1A, Class C, 7.586% (3 Month Term SOFR + 260 bps), 4/15/30 (144A) | 2,932,479 |
| 5,500,000 | Perimeter Master Note Business Trust, Series 2019-2A, Class B, 5.21%, 5/15/24 (144A) | 5,383,188 |
| 5,000,000 | PG Receivables Finance, Series 2020-1, Class A1, 3.968%, 7/20/25 (144A) | 4,889,062 |
| 2,350,000 | PG Receivables Finance, Series 2020-1, Class B, 4.705%, 7/20/25 (144A) | 2,297,859 |
| 8,500,000(a) | Race Point VIII CLO, Ltd., Series 2013-8A, Class CR2, 7.429% (3 Month USD LIBOR + 205 bps), 2/20/30 (144A) | 8,156,829 |
| 4,000,000(a) | Race Point VIII CLO, Ltd., Series 2013-8A, Class DR2, 8.879% (3 Month USD LIBOR + 350 bps), 2/20/30 (144A) | 3,804,244 |
| 9,010,000 | Republic Finance Issuance Trust, Series 2021-A, Class A, 2.30%, 12/22/31 (144A) | 8,272,362 |
| 2,300,000 | Republic Finance Issuance Trust, Series 2021-A, Class C, 3.53%, 12/22/31 (144A) | 1,959,570 |
| 447,124 | Santander Bank N.A. - SBCLN, Series 2021-1A, Class C, 3.268%, 12/15/31 (144A) | 432,192 |
| 1,925,000 | Santander Bank N.A. - SBCLN, Series 2021-1A, Class D, 5.004%, 12/15/31 (144A) | 1,782,599 |
The accompanying notes are an integral part of these financial statements.
Pioneer Bond Fund | Annual Report | 6/30/2325
Schedule of Investments | 6/30/23 (continued)
Principal
Amount
USD ($) | | | | | | Value |
| | Asset Backed Securities — (continued) | |
| 1,877,922 | Santander Bank NA - SBCLN, Series 2021-1A, Class B, 1.833%, 12/15/31 (144A) | $ 1,815,989 |
| 6,975,000 | SBA Tower Trust, Series 2014-2C, 3.869%, 10/15/49 (144A) | 6,760,768 |
| 4,600,000 | SCF Equipment Leasing LLC, Series 2019-2A, Class C, 3.11%, 6/21/27 (144A) | 4,407,634 |
| 5,000,000(a) | Signal Peak CLO 2 LLC, Series 2015-1A, Class DR2, 8.10% (3 Month USD LIBOR + 285 bps), 4/20/29 (144A) | 4,741,765 |
| 2,750,000(a) | Sound Point CLO XXVIII, Ltd., Series 2020-3A, Class D, 8.905% (3 Month USD LIBOR + 365 bps), 1/25/32 (144A) | 2,545,271 |
| 4,561,220 | SpringCastle America Funding LLC, Series 2020-AA, Class A, 1.97%, 9/25/37 (144A) | 4,077,424 |
| 10,345,000(a) | STWD, Ltd., Series 2022-FL3, Class B, 7.017% (SOFR30A + 195 bps), 11/15/38 (144A) | 9,864,483 |
| 3,292,459 | Tricolor Auto Securitization Trust, Series 2021-1A, Class D, 1.92%, 5/15/26 (144A) | 3,262,440 |
| 5,650,000 | Tricon American Homes Trust, Series 2020-SFR2, Class E1, 2.73%, 11/17/39 (144A) | 4,788,420 |
| 33,556 | United States Small Business Administration, Series 2005-20B, Class 1, 4.625%, 2/1/25 | 32,783 |
| 27,971 | United States Small Business Administration, Series 2005-20E, Class 1, 4.84%, 5/1/25 | 27,364 |
| 62,576 | United States Small Business Administration, Series 2008-20D, Class 1, 5.37%, 4/1/28 | 61,455 |
| 59,505 | United States Small Business Administration, Series 2008-20H, Class 1, 6.02%, 8/1/28 | 57,970 |
| 38,338 | United States Small Business Administration, Series 2008-20J, Class 1, 5.63%, 10/1/28 | 37,488 |
| 36,708 | United States Small Business Administration, Series 2008-20L, Class 1, 6.22%, 12/1/28 | 36,613 |
| 18,130 | United States Small Business Administration, Series 2009-20A, Class 1, 5.72%, 1/1/29 | 17,714 |
| 42,754 | United States Small Business Administration, Series 2009-20I, Class 1, 4.20%, 9/1/29 | 41,258 |
| 2,272,680 | Upstart Securitization Trust, Series 2020-1, Class C, 4.899%, 4/22/30 (144A) | 2,242,382 |
| 682,820 | Welk Resorts LLC, Series 2019-AA, Class C, 3.34%, 6/15/38 (144A) | 653,931 |
| 327,655 | Welk Resorts LLC, Series 2019-AA, Class D, 4.03%, 6/15/38 (144A) | 314,685 |
| 1,395,413 | Westgate Resorts LLC, Series 2020-1A, Class C, 6.213%, 3/20/34 (144A) | 1,375,760 |
The accompanying notes are an integral part of these financial statements.
26Pioneer Bond Fund | Annual Report | 6/30/23
Principal
Amount
USD ($) | | | | | | Value |
| | Asset Backed Securities — (continued) | |
| 8,238,814 | Westgate Resorts LLC, Series 2022-1A, Class C, 2.488%, 8/20/36 (144A) | $ 7,715,021 |
| 1,800,000(a) | Whitebox CLO II, Ltd., Series 2020-2A, Class ER, 12.373% (3 Month USD LIBOR + 710 bps), 10/24/34 (144A) | 1,599,212 |
| 1,500,000(a) | Woodmont Trust, Series 2020-7A, Class A1A, 7.16% (3 Month USD LIBOR + 190 bps), 1/15/32 (144A) | 1,477,974 |
| | Total Asset Backed Securities
(Cost $306,981,478) | $283,663,188 |
|
|
| | Collateralized Mortgage
Obligations—9.3% of Net Assets | |
| 6,327,451(a) | Bellemeade Re, Ltd., Series 2018-3A, Class M2, 7.90% (1 Month USD LIBOR + 275 bps), 10/25/28 (144A) | $ 6,357,968 |
| 3,145,905(a) | Bellemeade Re, Ltd., Series 2019-1A, Class M2, 7.85% (1 Month USD LIBOR + 270 bps), 3/25/29 (144A) | 3,168,767 |
| 3,723,513(a) | Bellemeade Re, Ltd., Series 2020-3A, Class M1C, 8.85% (1 Month USD LIBOR + 370 bps), 10/25/30 (144A) | 3,766,447 |
| 2,085,888(a) | Bellemeade Re, Ltd., Series 2020-4A, Class M2B, 8.75% (1 Month USD LIBOR + 360 bps), 6/25/30 (144A) | 2,100,979 |
| 12,559,000(b) | BINOM Securitization Trust, Series 2022-RPL1, Class M2, 3.00%, 2/25/61 (144A) | 8,669,975 |
| 3,380,957(b) | Brean Asset Backed Securities Trust, Series 2021-RM1, Class A, 1.40%, 10/25/63 (144A) | 2,871,481 |
| 2,985,000(b) | Bunker Hill Loan Depositary Trust, Series 2020-1, Class A3, 3.253%, 2/25/55 (144A) | 2,528,693 |
| 1,292,268(b) | Cascade Funding Mortgage Trust, Series 2018-RM2, Class A, 4.00%, 10/25/68 (144A) | 1,246,664 |
| 3,299,930(b) | Cascade Funding Mortgage Trust, Series 2018-RM2, Class C, 4.00%, 10/25/68 (144A) | 3,106,424 |
| 3,580,000(b) | Cascade Funding Mortgage Trust, Series 2021-HB6, Class M3, 3.735%, 6/25/36 (144A) | 3,260,693 |
| 3,485,000(b) | CFMT LLC, Series 2021-HB5, Class M3, 2.91%, 2/25/31 (144A) | 3,190,200 |
| 7,600,000(b) | CFMT LLC, Series 2021-HB7, Class M3, 3.849%, 10/27/31 (144A) | 6,874,571 |
| 3,745,000(b) | CFMT LLC, Series 2022-HB9, Class M3, 3.25%, 9/25/37 (144A) | 2,901,231 |
| 5,170,000(b) | CIM Trust, Series 2020-R2, Class M3, 3.00%, 10/25/59 (144A) | 3,766,811 |
| 5,635,236(b) | CIM Trust, Series 2021-J1, Class B1, 2.657%, 3/25/51 (144A) | 4,342,618 |
The accompanying notes are an integral part of these financial statements.
Pioneer Bond Fund | Annual Report | 6/30/2327
Schedule of Investments | 6/30/23 (continued)
Principal
Amount
USD ($) | | | | | | Value |
| | Collateralized Mortgage
Obligations—(continued) | |
| 3,284,221(b) | CIM Trust, Series 2021-J2, Class B2, 2.672%, 4/25/51 (144A) | $ 2,350,086 |
| 3,141,164(b) | Citigroup Mortgage Loan Trust, Series 2021-INV1, Class B1W, 2.708%, 5/25/51 (144A) | 2,407,180 |
| 62,209(a) | Connecticut Avenue Securities Trust, Series 2019-R03, Class 1M2, 7.30% (1 Month USD LIBOR + 215 bps), 9/25/31 (144A) | 62,286 |
| 2,035,000(a) | Connecticut Avenue Securities Trust, Series 2022-R02, Class 2M2, 8.067% (SOFR30A + 300 bps), 1/25/42 (144A) | 2,016,605 |
| 2,490,163(b) | CSMC Trust, Series 2021-RPL2, Class M1, 2.75%, 1/25/60 (144A) | 1,856,325 |
| 2,350,000(b) | CSMC Trust, Series 2021-RPL2, Class M2, 3.25%, 1/25/60 (144A) | 1,685,349 |
| 1,450,000(b) | Deephaven Residential Mortgage Trust, Series 2020-2, Class M1, 4.112%, 5/25/65 (144A) | 1,323,655 |
| 1,727,526(a) | Eagle Re, Ltd., Series 2018-1, Class M1, 6.85% (1 Month USD LIBOR + 170 bps), 11/25/28 (144A) | 1,729,283 |
| 6,126,937(a) | Eagle Re, Ltd., Series 2019-1, Class M1B, 6.95% (1 Month USD LIBOR + 180 bps), 4/25/29 (144A) | 6,119,571 |
| 169,735(b) | Fannie Mae Grantor Trust, Series 2004-T2, Class 2A, 4.069%, 7/25/43 | 165,859 |
| 4,877,948(a)(c) | Federal Home Loan Mortgage Corp. REMICs, Series 4091, Class SH, 1.357% (1 Month USD LIBOR + 655 bps), 8/15/42 | 544,035 |
| 2,830,863(c) | Federal Home Loan Mortgage Corp. REMICs, Series 4999, Class QI, 4.00%, 5/25/50 | 512,258 |
| 2,972,074(c) | Federal Home Loan Mortgage Corp. REMICs, Series 5067, Class GI, 4.00%, 12/25/50 | 563,747 |
| 32,651 | Federal National Mortgage Association REMICs, Series 2009-36, Class HX, 4.50%, 6/25/29 | 32,015 |
| 2,354,575(c) | Federal National Mortgage Association REMICs, Series 2020-83, Class EI, 4.00%, 11/25/50 | 468,661 |
| 5,272,320(d) | Finance of America Structured Securities Trust, Series 2021-S2, Class A2, 1.75%, 9/25/71 (144A) | 4,921,514 |
| 7,838,388(d) | Finance of America Structured Securities Trust, Series 2022-S1, Class A1, 2.00%, 2/25/52 (144A) | 7,209,826 |
| 8,258,997(d) | Finance of America Structured Securities Trust, Series 2022-S1, Class A2, 3.00%, 2/25/52 (144A) | 7,402,126 |
| 169,061,362(b)(c) | Flagstar Mortgage Trust, Series 2021-4, Class AX1, 0.206%, 6/1/51 (144A) | 1,698,086 |
| 6,940,000(a) | Freddie Mac STACR REMIC Trust, Series 2019-HRP1, Class M3, 7.40% (1 Month USD LIBOR + 225 bps), 2/25/49 (144A) | 6,793,222 |
The accompanying notes are an integral part of these financial statements.
28Pioneer Bond Fund | Annual Report | 6/30/23
Principal
Amount
USD ($) | | | | | | Value |
| | Collateralized Mortgage
Obligations—(continued) | |
| 5,087,687(a) | Freddie Mac STACR REMIC Trust, Series 2020-DNA3, Class B1, 10.25% (1 Month USD LIBOR + 510 bps), 6/25/50 (144A) | $ 5,475,623 |
| 8,097,387(a) | Freddie Mac STACR REMIC Trust, Series 2020-DNA4, Class B1, 11.15% (1 Month USD LIBOR + 600 bps), 8/25/50 (144A) | 8,992,898 |
| 2,304,588(a) | Freddie Mac STACR REMIC Trust, Series 2020-DNA5, Class M2, 7.867% (SOFR30A + 280 bps), 10/25/50 (144A) | 2,343,600 |
| 22,504 | Government National Mortgage Association, Series 2012-130, Class PA, 3.00%, 4/20/41 | 22,250 |
| 301,768 | Government National Mortgage Association, Series 2013-169, Class TE, 3.25%, 4/16/27 | 288,402 |
| 13,908,995(c) | Government National Mortgage Association, Series 2019-159, Class CI, 3.50%, 12/20/49 | 2,324,719 |
| 11,878,600(a)(c) | Government National Mortgage Association, Series 2020-9, Class SA, 3.35% (1 Month USD LIBOR + 335 bps), 1/20/50 | 216,230 |
| 6,071,000(b) | GS Mortgage-Backed Securities Corp. Trust, Series 2021-RPL1, Class B1, 2.75%, 12/25/60 (144A) | 4,511,744 |
| 4,820,000(b) | GS Mortgage-Backed Securities Corp. Trust, Series 2022-PJ4, Class A33, 3.00%, 9/25/52 (144A) | 3,345,173 |
| 137,384(b) | GS Mortgage-Backed Securities Trust, Series 2020-NQM1, Class A3, 2.352%, 9/27/60 (144A) | 124,939 |
| 2,940,798(b) | GS Mortgage-Backed Securities Trust, Series 2021-PJ9, Class B3, 2.925%, 2/26/52 (144A) | 2,095,565 |
| 1,782,124(a) | Home Re, Ltd., Series 2019-1, Class M1, 6.80% (1 Month USD LIBOR + 165 bps), 5/25/29 (144A) | 1,781,845 |
| 3,612,221(a) | Home Re, Ltd., Series 2020-1, Class M2, 10.40% (1 Month USD LIBOR + 525 bps), 10/25/30 (144A) | 3,661,929 |
| 3,990,000(b) | Homeward Opportunities Fund I Trust, Series 2020-2, Class A3, 3.196%, 5/25/65 (144A) | 3,665,251 |
| 2,185,000(b) | Homeward Opportunities Fund I Trust, Series 2020-2, Class M1, 3.897%, 5/25/65 (144A) | 1,948,963 |
| 59,490,239(b)(c) | Hundred Acre Wood Trust, Series 2021-INV1, Class AX1, 0.225%, 7/25/51 (144A) | 615,105 |
| 4,559,260(b) | Hundred Acre Wood Trust, Series 2021-INV1, Class B1, 3.225%, 7/25/51 (144A) | 3,673,173 |
| 11,913,872(b) | Hundred Acre Wood Trust, Series 2021-INV3, Class A3, 2.50%, 12/25/51 (144A) | 9,563,217 |
| 1,800,000(b) | Imperial Fund Mortgage Trust, Series 2021-NQM2, Class B1, 3.295%, 9/25/56 (144A) | 1,036,141 |
| 2,065,000(b) | Imperial Fund Mortgage Trust, Series 2021-NQM2, Class M1, 2.489%, 9/25/56 (144A) | 1,217,472 |
The accompanying notes are an integral part of these financial statements.
Pioneer Bond Fund | Annual Report | 6/30/2329
Schedule of Investments | 6/30/23 (continued)
Principal
Amount
USD ($) | | | | | | Value |
| | Collateralized Mortgage
Obligations—(continued) | |
| 12,404,217 | IMS Ecuadorian Mortgage Trust, Series 2021-1, Class GA, 3.40%, 8/18/43 (144A) | $ 11,334,353 |
| 111,641,429(b)(c) | JP Morgan Mortgage Trust, Series 2021-10, Class AX1, 0.122%, 12/25/51 (144A) | 676,089 |
| 5,707,435(b) | JP Morgan Mortgage Trust, Series 2021-10, Class B1, 2.809%, 12/25/51 (144A) | 4,345,315 |
| 4,109,081(b) | JP Morgan Mortgage Trust, Series 2021-12, Class B1, 3.165%, 2/25/52 (144A) | 3,238,190 |
| 3,921,316(b) | JP Morgan Mortgage Trust, Series 2021-13, Class B1, 3.142%, 4/25/52 (144A) | 3,073,428 |
| 4,889,673(b) | JP Morgan Mortgage Trust, Series 2021-7, Class B2, 2.80%, 11/25/51 (144A) | 3,555,477 |
| 97,116,584(b)(c) | JP Morgan Mortgage Trust, Series 2021-8, Class AX1, 0.123%, 12/25/51 (144A) | 555,050 |
| 8,974,671(b) | JP Morgan Mortgage Trust, Series 2021-8, Class B2, 2.848%, 12/25/51 (144A) | 6,542,252 |
| 2,663,655(b) | JP Morgan Mortgage Trust, Series 2021-INV1, Class B1, 2.983%, 10/25/51 (144A) | 2,075,857 |
| 3,290,620(b) | JP Morgan Mortgage Trust, Series 2021-INV1, Class B2, 2.983%, 10/25/51 (144A) | 2,382,722 |
| 4,586,957(b) | JP Morgan Mortgage Trust, Series 2021-INV4, Class B2, 3.221%, 1/25/52 (144A) | 3,454,890 |
| 4,861,964(b) | JP Morgan Mortgage Trust, Series 2021-INV4, Class B3, 3.221%, 1/25/52 (144A) | 3,400,107 |
| 6,420,000(b) | JP Morgan Mortgage Trust, Series 2022-4, Class A5, 3.00%, 10/25/52 (144A) | 4,447,680 |
| 7,114,000(b) | JP Morgan Mortgage Trust, Series 2022-LTV1, Class M1, 3.524%, 7/25/52 (144A) | 4,348,047 |
| 1,188,087 | La Hipotecaria El Salvadorian Mortgage Trust, Series 2016-1A, Class A, 3.358%, 1/15/46 (144A) | 1,093,040 |
| 367,607(a) | La Hipotecaria Panamanian Mortgage Trust, Series 2010-1GA, Class A, 2.75% (Panamanian Mortgage Reference Rate - 300 bps), 9/8/39 (144A) | 349,226 |
| 1,870,130(a) | La Hipotecaria Panamanian Mortgage Trust, Series 2014-1A, Class A1, 3.508% (Panamanian Mortgage Reference Rate - 224 bps), 11/24/42 (144A) | 1,743,896 |
| 7,468,767 | La Hipotecaria Panamanian Mortgage Trust, Series 2021-1, Class GA, 4.35%, 7/13/52 (144A) | 6,721,890 |
| 10,281,968(b) | Mello Mortgage Capital Acceptance, Series 2021-INV2, Class A15, 2.50%, 8/25/51 (144A) | 7,944,825 |
| 3,988,276(b) | Mello Mortgage Capital Acceptance, Series 2021-MTG1, Class B2, 2.648%, 4/25/51 (144A) | 2,847,459 |
The accompanying notes are an integral part of these financial statements.
30Pioneer Bond Fund | Annual Report | 6/30/23
Principal
Amount
USD ($) | | | | | | Value |
| | Collateralized Mortgage
Obligations—(continued) | |
| 4,613,497(b) | Mello Mortgage Capital Acceptance, Series 2021-MTG2, Class B1, 2.669%, 6/25/51 (144A) | $ 3,394,174 |
| 4,790,751(b) | Mello Mortgage Capital Acceptance, Series 2022-INV1, Class B1, 3.322%, 3/25/52 (144A) | 3,751,239 |
| 133,496(b) | MFA Trust, Series 2020-NQM1, Class A3, 2.30%, 8/25/49 (144A) | 118,540 |
| 3,176,784(b) | Mill City Mortgage Loan Trust, Series 2017-3, Class B2, 3.25%, 1/25/61 (144A) | 2,469,919 |
| 7,800,000(b) | Mill City Mortgage Loan Trust, Series 2019-GS1, Class M3, 3.25%, 7/25/59 (144A) | 5,739,139 |
| 10,950,000(b) | New Residential Mortgage Loan Trust, Series 2019-RPL2, Class M2, 3.75%, 2/25/59 (144A) | 9,328,232 |
| 4,175,000 | NYMT Loan Trust, Series 2022-CP1, Class M1, 3.215%, 7/25/61 (144A) | 3,392,921 |
| 2,847,796(a) | Oaktown Re V, Ltd., Series 2020-2A, Class M2, 10.40% (1 Month USD LIBOR + 525 bps), 10/25/30 (144A) | 2,904,571 |
| 8,492,798(b) | Oceanview Mortgage Trust, Series 2021-1, Class B2, 3.242%, 6/25/51 (144A) | 6,583,349 |
| 2,794,996(b) | Oceanview Mortgage Trust, Series 2021-5, Class B2, 2.974%, 10/25/51 (144A) | 2,125,079 |
| 6,581,884(b) | PRMI Securitization Trust, Series 2021-1, Class B1, 2.479%, 4/25/51 (144A) | 4,773,122 |
| 2,697,911(b) | PRMI Securitization Trust, Series 2021-1, Class B2, 2.479%, 4/25/51 (144A) | 1,903,598 |
| 3,376,429(b) | Provident Funding Mortgage Trust, Series 2021-1, Class B1, 2.384%, 4/25/51 (144A) | 2,557,310 |
| 3,401,134(b) | Provident Funding Mortgage Trust, Series 2021-2, Class B1, 2.353%, 4/25/51 (144A) | 2,429,347 |
| 2,842,350(b) | Provident Funding Mortgage Trust, Series 2021-J1, Class B1, 2.637%, 10/25/51 (144A) | 2,185,280 |
| 2,929,574(b) | Provident Funding Mortgage Trust, Series 2021-J1, Class B2, 2.637%, 10/25/51 (144A) | 2,199,377 |
| 3,437,000(a) | Radnor Re, Ltd., Series 2019-1, Class M2, 8.35% (1 Month USD LIBOR + 320 bps), 2/25/29 (144A) | 3,469,176 |
| 2,706,518(b) | Rate Mortgage Trust, Series 2021-HB1, Class B1, 2.705%, 12/25/51 (144A) | 2,012,001 |
| 4,052,562(b) | Rate Mortgage Trust, Series 2021-HB1, Class B2, 2.705%, 12/25/51 (144A) | 2,883,575 |
| 3,989,157(b) | Rate Mortgage Trust, Series 2021-J3, Class B2, 2.716%, 10/25/51 (144A) | 2,967,858 |
| 3,973,083(b) | Rate Mortgage Trust, Series 2021-J4, Class B3, 2.633%, 11/25/51 (144A) | 2,680,562 |
The accompanying notes are an integral part of these financial statements.
Pioneer Bond Fund | Annual Report | 6/30/2331
Schedule of Investments | 6/30/23 (continued)
Principal
Amount
USD ($) | | | | | | Value |
| | Collateralized Mortgage
Obligations—(continued) | |
| 5,074,528(b) | RCKT Mortgage Trust, Series 2021-1, Class B2A, 2.719%, 3/25/51 (144A) | $ 3,824,932 |
| 5,329,031(b) | RCKT Mortgage Trust, Series 2021-2, Class B1A, 2.563%, 6/25/51 (144A) | 4,002,776 |
| 3,793,547(b) | RCKT Mortgage Trust, Series 2021-2, Class B2A, 2.563%, 6/25/51 (144A) | 2,807,208 |
| 3,361,182(b) | RCKT Mortgage Trust, Series 2021-3, Class A25, 2.50%, 7/25/51 (144A) | 2,588,765 |
| 10,518,161(b) | RCKT Mortgage Trust, Series 2021-4, Class B1A, 3.007%, 9/25/51 (144A) | 8,199,966 |
| 12,685,000(b) | RCKT Mortgage Trust, Series 2022-3, Class A17, 3.00%, 5/25/52 (144A) | 8,758,824 |
| 3,000,000(b) | RMF Buyout Issuance Trust, Series 2021-HB1, Class M3, 3.69%, 11/25/31 (144A) | 2,469,422 |
| 4,693,484(b) | RMF Proprietary Issuance Trust, Series 2021-2, Class A, 2.125%, 9/25/61 (144A) | 3,268,223 |
| 14,232,820(b) | Saluda Grade Alternative Mortgage Trust, Series 2021-FIG2, Class A2, 3.50%, 10/25/51 (144A) | 12,658,314 |
| 4,125,000(b) | Saluda Grade Alternative Mortgage Trust, Series 2022-SEQ2, Class A3, 4.50%, 5/25/55 (144A) | 3,626,823 |
| 455,048(b) | Sequoia Mortgage Trust, Series 2012-6, Class B3, 3.699%, 12/25/42 | 427,297 |
| 75,779(b) | Sequoia Mortgage Trust, Series 2018-CH3, Class A1, 4.50%, 8/25/48 (144A) | 73,279 |
| 2,831,083(b) | Sequoia Mortgage Trust, Series 2021-1, Class B2, 2.661%, 3/25/51 (144A) | 2,122,377 |
| 4,725,000(b) | Sequoia Mortgage Trust, Series 2022-1, Class A7, 2.50%, 2/25/52 (144A) | 3,089,666 |
| 11,220,000(a) | STACR Trust, Series 2018-HRP2, Class B1, 9.35% (1 Month USD LIBOR + 420 bps), 2/25/47 (144A) | 11,994,327 |
| 3,261,490(a) | STACR Trust, Series 2018-HRP2, Class M3, 7.55% (1 Month USD LIBOR + 240 bps), 2/25/47 (144A) | 3,292,037 |
| 10,000,000(b) | Towd Point Mortgage Trust, Series 2019-3, Class M2D, 3.25%, 2/25/59 (144A) | 7,498,588 |
| 2,000,000(a) | Towd Point Mortgage Trust, Series 2019-HY2, Class B1, 7.40% (1 Month USD LIBOR + 225 bps), 5/25/58 (144A) | 1,973,518 |
| 11,704,843(b) | Towd Point Mortgage Trust, Series 2021-R1, Class A1, 2.918%, 11/30/60 (144A) | 9,245,562 |
| 388,672(a) | Triangle Re, Ltd., Series 2020-1, Class M2, 10.75% (1 Month USD LIBOR + 560 bps), 10/25/30 (144A) | 389,655 |
| 3,928,786(b) | UWM Mortgage Trust, Series 2021-INV4, Class B2, 3.228%, 12/25/51 (144A) | 3,013,791 |
The accompanying notes are an integral part of these financial statements.
32Pioneer Bond Fund | Annual Report | 6/30/23
Principal
Amount
USD ($) | | | | | | Value |
| | Collateralized Mortgage
Obligations—(continued) | |
| 4,971,005(b) | UWM Mortgage Trust, Series 2021-INV5, Class B1, 3.24%, 1/25/52 (144A) | $ 3,953,961 |
| 2,810,000(b) | Wells Fargo Mortgage Backed Securities Trust, Series 2022-2, Class A5, 3.00%, 12/25/51 (144A) | 1,953,164 |
| 11,105,000(b) | Wells Fargo Mortgage Backed Securities Trust, Series 2022-2, Class A6, 2.50%, 12/25/51 (144A) | 7,255,875 |
| | Total Collateralized Mortgage Obligations
(Cost $502,909,431) | $417,405,962 |
|
|
| | Commercial Mortgage-Backed
Securities—4.7% of Net Assets | |
| 4,360,000(a) | AREIT Trust, Series 2022-CRE6, Class D, 7.917% (SOFR30A + 285 bps), 1/20/37 (144A) | $ 3,949,982 |
| 7,460,000 | BANK, Series 2017-BNK5, Class AS, 3.624%, 6/15/60 | 6,734,933 |
| 2,289,290(c)(d) | Bayview Commercial Asset Trust, Series 2007-2A, Class IO, 0.000%, 7/25/37 (144A) | — |
| 7,340,000 | Benchmark Mortgage Trust, Series 2018-B8, Class A4, 3.963%, 1/15/52 | 6,888,324 |
| 2,615,000(b) | Benchmark Mortgage Trust, Series 2020-IG3, Class B, 3.391%, 9/15/48 (144A) | 2,031,525 |
| 3,030,000(b) | Benchmark Mortgage Trust, Series 2022-B34, Class AM, 3.96%, 4/15/55 | 2,539,836 |
| 1,375,000(a) | BSREP Commercial Mortgage Trust, Series 2021-DC, Class B, 6.544% (1 Month USD LIBOR + 135 bps), 8/15/38 (144A) | 1,221,557 |
| 7,615,000(b) | BX Commercial Mortgage Trust, Series 2021-VIV5, Class A, 2.843%, 3/9/44 (144A) | 6,307,335 |
| 17,400,000 | BX Trust, Series 2019-OC11, Class A, 3.202%, 12/9/41 (144A) | 14,869,361 |
| 13,115,000(a) | BX Trust, Series 2021-ARIA, Class D, 7.088% (1 Month USD LIBOR + 190 bps), 10/15/36 (144A) | 12,522,706 |
| 3,101,567(a) | CHC Commercial Mortgage Trust, Series 2019-CHC, Class D, 7.243% (1 Month USD LIBOR + 205 bps), 6/15/34 (144A) | 2,975,943 |
| 5,552,000(b) | Citigroup Commercial Mortgage Trust, Series 2015-GC33, Class B, 4.726%, 9/10/58 | 4,555,043 |
| 3,000,000(b) | Citigroup Commercial Mortgage Trust, Series 2018-B2, Class AS, 4.179%, 3/10/51 | 2,711,620 |
| 4,869,730 | Citigroup Commercial Mortgage Trust, Series 2018-C5, Class A3, 3.963%, 6/10/51 | 4,491,183 |
| 39,467,166(b)(c) | COMM Mortgage Trust, Series 2014-CR18, Class XA, 1.075%, 7/15/47 | 228,586 |
| 2,000,000(b) | COMM Mortgage Trust, Series 2015-DC1, Class B, 4.035%, 2/10/48 | 1,721,352 |
The accompanying notes are an integral part of these financial statements.
Pioneer Bond Fund | Annual Report | 6/30/2333
Schedule of Investments | 6/30/23 (continued)
Principal
Amount
USD ($) | | | | | | Value |
| | Commercial Mortgage-Backed
Securities—(continued) | |
| 1,375,000(b) | COMM Mortgage Trust, Series 2018-COR3, Class B, 4.664%, 5/10/51 | $ 1,211,382 |
| 644,055(a) | Freddie Mac Multifamily Structured Credit Risk, Series 2021-MN1, Class M1, 7.067% (SOFR30A + 200 bps), 1/25/51 (144A) | 617,292 |
| 6,790,000(a) | Freddie Mac Multifamily Structured Credit Risk, Series 2021-MN3, Class M2, 9.067% (SOFR30A + 400 bps), 11/25/51 (144A) | 6,159,399 |
| 2,500,000(b) | FREMF Mortgage Trust, Series 2017-KW03, Class B, 4.216%, 7/25/27 (144A) | 2,277,129 |
| 3,250,715(a) | FREMF Mortgage Trust, Series 2018-KSW4, Class B, 7.643% (1 Month USD LIBOR + 245 bps), 10/25/28 | 3,010,015 |
| 1,748,283(a) | FREMF Mortgage Trust, Series 2018-KSW4, Class C, 10.193% (1 Month USD LIBOR + 500 bps), 10/25/28 | 1,560,376 |
| 4,590,000(b) | FREMF Mortgage Trust, Series 2019-K88, Class C, 4.529%, 2/25/52 (144A) | 4,239,858 |
| 4,106,918(a) | FREMF Mortgage Trust, Series 2019-KF64, Class B, 7.493% (1 Month USD LIBOR + 230 bps), 6/25/26 (144A) | 3,906,920 |
| 6,620,254(a) | FREMF Mortgage Trust, Series 2019-KF66, Class B, 7.593% (1 Month USD LIBOR + 240 bps), 7/25/29 (144A) | 6,063,015 |
| 2,831,491(b) | FREMF Mortgage Trust, Series 2019-KJ24, Class B, 7.60%, 10/25/27 (144A) | 2,568,678 |
| 5,000,000(a) | FREMF Mortgage Trust, Series 2019-KS12, Class C, 12.093% (1 Month USD LIBOR + 690 bps), 8/25/29 | 4,739,033 |
| 9,000,000(e) | FREMF Mortgage Trust, Series 2021-KG05, Class C, 0.000%, 1/25/31 (144A) | 4,472,887 |
| 110,999,571(c) | FREMF Mortgage Trust, Series 2021-KG05, Class X2A, 0.10%, 1/25/31 (144A) | 598,399 |
| 9,000,000(c) | FREMF Mortgage Trust, Series 2021-KG05, Class X2B, 0.10%, 1/25/31 (144A) | 45,087 |
| 2,698,039(b) | FRESB Mortgage Trust, Series 2018-SB52, Class A7F, 3.39%, 6/25/25 | 2,579,997 |
| 16,224,246(b)(c) | Government National Mortgage Association, Series 2017-21, Class IO, 0.633%, 10/16/58 | 534,868 |
| 4,885,000(a) | GS Mortgage Securities Corportation Trust, Series 2021-IP, Class D, 7.293% (1 Month USD LIBOR + 210 bps), 10/15/36 (144A) | 4,389,804 |
| 8,216,000 | ILPT Trust, Series 2019-SURF, Class A, 4.145%, 2/11/41 (144A) | 7,452,798 |
| 5,685,000 | JP Morgan Chase Commercial Mortgage Securities Trust, Series 2016-JP3, Class AS, 3.144%, 8/15/49 | 5,005,753 |
The accompanying notes are an integral part of these financial statements.
34Pioneer Bond Fund | Annual Report | 6/30/23
Principal
Amount
USD ($) | | | | | | Value |
| | Commercial Mortgage-Backed
Securities—(continued) | |
| 6,150,000 | JP Morgan Chase Commercial Mortgage Securities Trust, Series 2018-WPT, Class AFX, 4.248%, 7/5/33 (144A) | $ 5,519,625 |
| 3,450,000(b) | JPMDB Commercial Mortgage Securities Trust, Series 2016-C2, Class B, 3.99%, 6/15/49 | 2,668,756 |
| 2,000,000(b) | JPMDB Commercial Mortgage Securities Trust, Series 2016-C4, Class D, 3.194%, 12/15/49 (144A) | 1,146,224 |
| 7,010,000 | JPMDB Commercial Mortgage Securities Trust, Series 2018-C8, Class A4, 4.211%, 6/15/51 | 6,530,161 |
| 45,714,000(b)(c) | JPMDB Commercial Mortgage Securities Trust, Series 2018-C8, Class XB, 0.228%, 6/15/51 | 252,762 |
| 6,560,000 | Key Commercial Mortgage Securities Trust, Series 2019-S2, Class A3, 3.469%, 6/15/52 (144A) | 5,859,106 |
| 8,210,595(a) | Med Trust, Series 2021-MDLN, Class E, 8.344% (1 Month USD LIBOR + 315 bps), 11/15/38 (144A) | 7,757,481 |
| 2,250,000(a) | MF1 Multifamily Housing Mortgage Loan Trust, Series 2021-FL5, Class D, 7.761% (1 Month Term SOFR + 261 bps), 7/15/36 (144A) | 2,113,822 |
| 2,628,500(b) | Morgan Stanley Bank of America Merrill Lynch Trust, Series 2015-C21, Class C, 4.265%, 3/15/48 | 2,022,384 |
| 6,330,000(b) | Morgan Stanley Capital I Trust, Series 2018-MP, Class A, 4.419%, 7/11/40 (144A) | 5,159,091 |
| 2,000,000 | Palisades Center Trust, Series 2016-PLSD, Class A, 2.713%, 4/13/33 (144A) | 1,120,000 |
| 6,380,000(a) | Ready Capital Mortgage Financing LLC, Series 2021-FL7, Class D, 8.10% (1 Month USD LIBOR + 295 bps), 11/25/36 (144A) | 5,955,519 |
| 261,830 | ReadyCap Commercial Mortgage Trust, Series 2019-6, Class A, 2.833%, 10/25/52 (144A) | 244,455 |
| 16,245,000 | SLG Office Trust, Series 2021-OVA, Class E, 2.851%, 7/15/41 (144A) | 11,522,830 |
| 2,375,000(b) | Soho Trust, Series 2021-SOHO, Class A, 2.786%, 8/10/38 (144A) | 1,655,342 |
| 9,760,000(a) | Taubman Centers Commercial Mortgage Trust, Series 2022-DPM, Class B, 8.079% (1 Month Term SOFR + 293 bps), 5/15/37 (144A) | 9,461,168 |
| 1,774,000(b) | UBS Commercial Mortgage Trust, Series 2018-C9, Class C, 5.113%, 3/15/51 | 1,285,404 |
| 28,617,762(b)(c) | Wells Fargo Commercial Mortgage Trust, Series 2015-NXS3, Class XA, 1.025%, 9/15/57 | 453,388 |
The accompanying notes are an integral part of these financial statements.
Pioneer Bond Fund | Annual Report | 6/30/2335
Schedule of Investments | 6/30/23 (continued)
Principal
Amount
USD ($) | | | | | | Value |
| | Commercial Mortgage-Backed
Securities—(continued) | |
| 21,936,936(b)(c) | Wells Fargo Commercial Mortgage Trust, Series 2016-LC24, Class XA, 1.749%, 10/15/49 | $ 860,891 |
| 2,795,000 | Wells Fargo Commercial Mortgage Trust, Series 2019-C51, Class A4, 3.311%, 6/15/52 | 2,456,840 |
| | Total Commercial Mortgage-Backed Securities
(Cost $244,110,113) | $209,227,225 |
|
|
| | Corporate Bonds — 29.3% of Net Assets | |
| | Aerospace & Defense — 0.4% | |
| 13,240,000 | Boeing Co., 3.90%, 5/1/49 | $ 10,120,670 |
| 7,995,000 | Boeing Co., 5.805%, 5/1/50 | 7,965,825 |
| | Total Aerospace & Defense | $18,086,495 |
|
|
| | Airlines — 0.3% | |
| 4,887,730 | Air Canada 2017-1 Class AA Pass Through Trust, 3.30%, 1/15/30 (144A) | $ 4,324,239 |
| 1,260,600 | American Airlines 2021-1 Class B Pass Through Trust, 3.95%, 7/11/30 | 1,097,351 |
| 2,490,000 | Delta Air Lines, Inc./SkyMiles IP, Ltd., 4.75%, 10/20/28 (144A) | 2,417,016 |
| 4,008,030 | JetBlue 2019-1 Class AA Pass Through Trust, 2.75%, 5/15/32 | 3,406,287 |
| 1,494,660 | JetBlue 2020-1 Class A Pass Through Trust, 4.00%, 11/15/32 | 1,361,239 |
| 1,883,750 | United Airlines 2020-1 Class B Pass Through Trust, 4.875%, 1/15/26 | 1,797,951 |
| | Total Airlines | $14,404,083 |
|
|
| | Auto Manufacturers — 0.8% | |
| 3,640,000 | Ford Motor Co., 6.10%, 8/19/32 | $ 3,527,728 |
| 6,150,000 | Ford Motor Credit Co. LLC, 3.625%, 6/17/31 | 5,040,693 |
| 3,140,000 | Ford Motor Credit Co. LLC, 7.35%, 3/6/30 | 3,206,700 |
| 6,464,000 | General Motors Co., 6.60%, 4/1/36 | 6,636,963 |
| 1,605,000 | General Motors Financial Co., Inc., 3.10%, 1/12/32 | 1,298,126 |
| 7,475,000 | General Motors Financial Co., Inc., 6.40%, 1/9/33 | 7,597,892 |
| 8,805,000 | Hyundai Capital America, 5.80%, 4/1/30 (144A) | 8,865,044 |
| | Total Auto Manufacturers | $36,173,146 |
|
|
| | Auto Parts & Equipment — 0.1% | |
| 2,640,000 | ZF North America Capital, Inc., 6.875%, 4/14/28 (144A) | $ 2,677,963 |
| | Total Auto Parts & Equipment | $2,677,963 |
|
|
The accompanying notes are an integral part of these financial statements.
36Pioneer Bond Fund | Annual Report | 6/30/23
Principal
Amount
USD ($) | | | | | | Value |
| | Banks — 9.8% | |
| 16,300,000(b) | ABN AMRO Bank NV, 2.47% (1 Year CMT Index + 110 bps), 12/13/29 (144A) | $ 13,644,162 |
| 2,600,000(b) | ABN AMRO Bank NV, 3.324% (5 Year CMT Index + 190 bps), 3/13/37 (144A) | 1,975,073 |
| 14,720,000(b) | AIB Group Plc, 4.263% (3 Month USD LIBOR + 187 bps), 4/10/25 (144A) | 14,382,544 |
| 2,693,000(b) | ANZ Bank New Zealand, Ltd., 5.548% (5 Year CMT Index + 270 bps), 8/11/32 (144A) | 2,654,113 |
| 9,413,000 | Banco Santander Chile, 2.70%, 1/10/25 (144A) | 9,001,156 |
| 8,200,000(b) | Banco Santander SA, 1.722% (1 Year CMT Index + 90 bps), 9/14/27 | 7,119,332 |
| 2,800,000 | Banco Santander SA, 2.749%, 12/3/30 | 2,194,395 |
| 17,000,000(b) | Banco Santander SA, 3.225% (1 Year CMT Index + 160 bps), 11/22/32 | 13,467,779 |
| 11,055,000(b) | Bank of America Corp., 2.572% (SOFR + 121 bps), 10/20/32 | 9,004,302 |
| 18,900,000(b) | Bank of America Corp., 2.884% (3 Month Term SOFR + 145 bps), 10/22/30 | 16,272,012 |
| 4,385,000(b) | Bank of New York Mellon Corp., 5.834% (SOFR + 207 bps), 10/25/33 | 4,571,594 |
| 19,195,000(b) | Bank of Nova Scotia, 4.588% (5 Year CMT Index + 205 bps), 5/4/37 | 16,540,451 |
| 10,825,000(b) | Barclays Plc, 5.746% (1 Year CMT Index + 300 bps), 8/9/33 | 10,469,332 |
| 1,105,000(b) | Barclays Plc, 6.224% (SOFR + 298 bps), 5/9/34 | 1,100,619 |
| 4,435,000(b) | Barclays Plc, 7.437% (1 Year CMT Index + 350 bps), 11/2/33 | 4,798,182 |
| 7,275,000(b) | BNP Paribas SA, 2.159% (SOFR + 122 bps), 9/15/29 (144A) | 6,058,208 |
| 11,470,000(b) | BPCE SA, 3.116% (SOFR + 173 bps), 10/19/32 (144A) | 8,852,852 |
| 5,625,000(b) | BPCE SA, 3.648% (5 Year CMT Index + 190 bps), 1/14/37 (144A) | 4,469,101 |
| 4,740,000(b) | CaixaBank SA, 6.208% (SOFR + 270 bps), 1/18/29 (144A) | 4,728,221 |
| 7,440,000(b) | Citigroup, Inc., 2.52% (SOFR + 118 bps), 11/3/32 | 5,994,482 |
| 5,530,000(b) | Citigroup, Inc., 4.91% (SOFR + 209 bps), 5/24/33 | 5,351,133 |
| 3,015,000(b) | Citigroup, Inc., 6.174% (SOFR + 266 bps), 5/25/34 | 3,041,268 |
| 10,660,000(b) | Comerica Bank, 5.332% (SOFR + 261 bps), 8/25/33 | 8,534,448 |
| 7,000,000(b) | Goldman Sachs Group, Inc., 2.65% (SOFR + 126 bps), 10/21/32 | 5,705,884 |
| 5,815,000(b) | Goldman Sachs Group, Inc., 4.223% (3 Month Term SOFR + 156 bps), 5/1/29 | 5,492,213 |
| 10,240,000(b) | HSBC Holdings Plc, 2.206% (SOFR + 129 bps), 8/17/29 | 8,566,447 |
The accompanying notes are an integral part of these financial statements.
Pioneer Bond Fund | Annual Report | 6/30/2337
Schedule of Investments | 6/30/23 (continued)
Principal
Amount
USD ($) | | | | | | Value |
| | Banks — (continued) | |
| 11,015,000(b) | HSBC Holdings Plc, 2.871% (SOFR + 141 bps), 11/22/32 | $ 8,881,216 |
| 1,835,000(b) | HSBC Holdings Plc, 5.402% (SOFR + 287 bps), 8/11/33 | 1,794,015 |
| 5,835,000(b) | HSBC Holdings Plc, 6.161% (SOFR + 197 bps), 3/9/29 | 5,884,657 |
| 1,800,000(b) | ING Groep NV, 4.252% (SOFR + 207 bps), 3/28/33 | 1,645,564 |
| 15,574,000(b)(f) | ING Groep NV, 4.25% (5 Year CMT Index + 286 bps) | 10,361,415 |
| 900,000(b) | Intesa Sanpaolo S.p.A., 4.198% (1 Year CMT Index + 260 bps), 6/1/32 (144A) | 670,759 |
| 4,695,000(b) | Intesa Sanpaolo S.p.A., 4.95% (1 Year CMT Index + 275 bps), 6/1/42 (144A) | 3,092,026 |
| 7,560,000(b) | Intesa Sanpaolo S.p.A., 7.778% (1 Year CMT Index + 390 bps), 6/20/54 (144A) | 7,531,619 |
| 6,480,000(b) | Intesa Sanpaolo S.p.A., 8.248% (1 Year CMT Index + 440 bps), 11/21/33 (144A) | 6,806,415 |
| 9,060,000(b) | JPMorgan Chase & Co., 2.545% (SOFR + 118 bps), 11/8/32 | 7,423,078 |
| 2,960,000(b) | JPMorgan Chase & Co., 4.586% (SOFR + 180 bps), 4/26/33 | 2,821,746 |
| 4,961,000 | KeyBank NA, 4.90%, 8/8/32 | 3,941,212 |
| 5,400,000(b) | Lloyds Banking Group Plc, 4.976% (1 Year CMT Index + 230 bps), 8/11/33 | 5,051,166 |
| 8,408,000(b) | Lloyds Banking Group Plc, 7.953% (1 Year CMT Index + 375 bps), 11/15/33 | 9,121,616 |
| 6,185,000(b)(f) | Lloyds Banking Group Plc, 8.00% (5 Year CMT Index + 391 bps) | 5,650,925 |
| 9,860,000(b) | Macquarie Group, Ltd., 2.691% (SOFR + 144 bps), 6/23/32 (144A) | 7,770,117 |
| 6,190,000(b) | Macquarie Group, Ltd., 2.871% (SOFR + 153 bps), 1/14/33 (144A) | 4,943,664 |
| 3,490,000(b) | Mitsubishi UFJ Financial Group, Inc., 2.494% (1 Year CMT Index + 97 bps), 10/13/32 | 2,805,713 |
| 4,030,000(b) | Mizuho Financial Group, Inc., 5.669% (1 Year CMT Index + 240 bps), 9/13/33 | 4,058,820 |
| 9,845,000(b) | Morgan Stanley, 5.297% (SOFR + 262 bps), 4/20/37 | 9,315,289 |
| 1,830,000(b) | Morgan Stanley, 5.948% (5 Year CMT Index + 243 bps), 1/19/38 | 1,806,287 |
| 10,926,000(b)(f) | Nordea Bank Abp, 3.75% (5 Year CMT Index + 260 bps) (144A) | 8,084,147 |
| 3,370,000(b) | PNC Financial Services Group, Inc., 5.068% (SOFR + 193 bps), 1/24/34 | 3,231,696 |
| 6,210,000(b) | Santander Holdings USA, Inc., 2.49% (SOFR + 125 bps), 1/6/28 | 5,363,455 |
The accompanying notes are an integral part of these financial statements.
38Pioneer Bond Fund | Annual Report | 6/30/23
Principal
Amount
USD ($) | | | | | | Value |
| | Banks — (continued) | |
| 2,195,000(b) | Societe Generale SA, 2.797% (1 Year CMT Index + 130 bps), 1/19/28 (144A) | $ 1,944,131 |
| 3,095,000(b) | Societe Generale SA, 4.027% (1 Year CMT Index + 190 bps), 1/21/43 (144A) | 2,064,571 |
| 4,550,000(b)(f) | Societe Generale SA, 5.375% (5 Year CMT Index + 451 bps) (144A) | 3,376,006 |
| 8,090,000(b) | Societe Generale SA, 6.221% (1 Year CMT Index + 320 bps), 6/15/33 (144A) | 7,531,170 |
| 1,000,000(b) | Societe Generale SA, 6.691% (1 Year CMT Index + 295 bps), 1/10/34 (144A) | 1,018,066 |
| 17,125,000(b) | Standard Chartered Plc, 3.603% (1 Year CMT Index + 190 bps), 1/12/33 (144A) | 13,709,509 |
| 810,000(b)(g) | Standard Chartered Plc, 6.296% (1 Year CMT Index + 258 bps), 7/6/34 (144A) | 810,603 |
| 2,100,000(b) | State Street Corp., 4.421% (SOFR + 161 bps), 5/13/33 | 1,992,679 |
| 10,530,000(b) | State Street Corp., 5.159% (SOFR + 189 bps), 5/18/34 | 10,466,989 |
| 8,350,000 | Toronto-Dominion Bank, 4.456%, 6/8/32 | 7,923,652 |
| 15,765,000(b) | Truist Financial Corp., 4.916% (SOFR + 224 bps), 7/28/33 | 14,406,773 |
| 12,330,000(b) | UBS Group AG, 2.746% (1 Year CMT Index + 110 bps), 2/11/33 (144A) | 9,603,627 |
| 2,615,000(b) | UBS Group AG, 4.988% (1 Year CMT Index + 240 bps), 8/5/33 (144A) | 2,423,140 |
| 19,295,000(b) | UniCredit S.p.A., 2.569% (1 Year CMT Index + 230 bps), 9/22/26 (144A) | 17,416,131 |
| 4,578,000(b) | UniCredit S.p.A., 5.459% (5 Year CMT Index + 475 bps), 6/30/35 (144A) | 3,885,117 |
| 7,483,000(b) | UniCredit S.p.A., 7.296% (5 Year USD ICE Swap Rate + 491 bps), 4/2/34 (144A) | 7,050,665 |
| 17,775,000(b) | US Bancorp, 2.491% (5 Year CMT Index + 95 bps), 11/3/36 | 13,002,174 |
| | Total Banks | $440,670,923 |
|
|
| | Biotechnology — 0.1% | |
| 5,095,000 | Amgen, Inc., 5.25%, 3/2/33 | $ 5,101,499 |
| | Total Biotechnology | $5,101,499 |
|
|
| | Building Materials — 0.1% | |
| 4,490,000 | Fortune Brands Innovations, Inc., 4.50%, 3/25/52 | $ 3,495,892 |
| | Total Building Materials | $3,495,892 |
|
|
| | Chemicals — 0.8% | |
| 7,048,000 | Albemarle Corp., 5.05%, 6/1/32 | $ 6,823,900 |
| 9,792,000 | Albemarle Corp., 5.65%, 6/1/52 | 9,317,772 |
The accompanying notes are an integral part of these financial statements.
Pioneer Bond Fund | Annual Report | 6/30/2339
Schedule of Investments | 6/30/23 (continued)
Principal
Amount
USD ($) | | | | | | Value |
| | Chemicals — (continued) | |
| 6,041,000 | Celanese US Holdings LLC, 6.379%, 7/15/32 | $ 6,093,395 |
| 11,770,000 | OCI NV, 6.70%, 3/16/33 (144A) | 11,507,022 |
| | Total Chemicals | $33,742,089 |
|
|
| | Commercial Services — 0.5% | |
| 3,646,000 | Allied Universal Holdco LLC/Allied Universal Finance Corp., 6.625%, 7/15/26 (144A) | $ 3,459,848 |
| 2,115,000 | Allied Universal Holdco LLC/Allied Universal Finance Corp./Atlas Luxco 4 S.a.r.l., 4.625%, 6/1/28 (144A) | 1,790,284 |
| 1,230,000 | Allied Universal Holdco LLC/Allied Universal Finance Corp./Atlas Luxco 4 S.a.r.l., 4.625%, 6/1/28 (144A) | 1,034,737 |
| 4,500,000 | Ashtead Capital, Inc., 5.50%, 8/11/32 (144A) | 4,350,886 |
| 6,660,000 | Garda World Security Corp., 4.625%, 2/15/27 (144A) | 6,093,909 |
| 5,385,000 | Prime Security Services Borrower LLC/Prime Finance, Inc., 6.25%, 1/15/28 (144A) | 5,044,676 |
| | Total Commercial Services | $21,774,340 |
|
|
| | Cosmetics/Personal Care — 0.1% | |
| 6,300,000 | Estee Lauder Cos., Inc., 5.15%, 5/15/53 | $ 6,416,146 |
| | Total Cosmetics/Personal Care | $6,416,146 |
|
|
| | Diversified Financial Services — 2.7% | |
| 6,710,000 | AerCap Ireland Capital DAC/AerCap Global Aviation Trust, 3.30%, 1/30/32 | $ 5,489,443 |
| 7,725,000 | Air Lease Corp., 2.10%, 9/1/28 | 6,416,689 |
| 4,915,000 | Air Lease Corp., 2.875%, 1/15/32 | 3,946,492 |
| 6,235,000 | Air Lease Corp., 3.125%, 12/1/30 | 5,193,931 |
| 11,780,000 | Ally Financial, Inc., 4.75%, 6/9/27 | 10,935,693 |
| 1,815,000(b) | Ally Financial, Inc., 6.992% (SOFR + 326 bps), 6/13/29 | 1,792,319 |
| 2,120,000 | Ally Financial, Inc., 8.00%, 11/1/31 | 2,200,816 |
| 7,335,000 | Ameriprise Financial, Inc., 5.15%, 5/15/33 | 7,282,769 |
| 905,000 | Avolon Holdings Funding, Ltd., 3.95%, 7/1/24 (144A) | 877,896 |
| 9,040,000 | Avolon Holdings Funding, Ltd., 6.375%, 5/4/28 (144A) | 8,942,926 |
| 6,515,000 | B3 SA - Brasil Bolsa Balcao, 4.125%, 9/20/31 (144A) | 5,547,436 |
| 8,534,000 | Bread Financial Holdings, Inc., 7.00%, 1/15/26 (144A) | 8,045,078 |
| 3,750,000(b) | Capital One Financial Corp., 5.247% (SOFR + 260 bps), 7/26/30 | 3,535,158 |
| 9,235,000(b) | Capital One Financial Corp., 5.268% (SOFR + 237 bps), 5/10/33 | 8,647,017 |
| 860,000(b) | Capital One Financial Corp., 5.817% (SOFR + 260 bps), 2/1/34 | 820,504 |
The accompanying notes are an integral part of these financial statements.
40Pioneer Bond Fund | Annual Report | 6/30/23
Principal
Amount
USD ($) | | | | | | Value |
| | Diversified Financial Services — (continued) | |
| 4,840,000(b) | Capital One Financial Corp., 6.377% (SOFR + 286 bps), 6/8/34 | $ 4,805,323 |
| 6,770,000(b) | Charles Schwab Corp., 5.853% (SOFR + 250 bps), 5/19/34 | 6,870,777 |
| 14,325,000 | Nomura Holdings, Inc., 2.999%, 1/22/32 | 11,607,011 |
| 4,645,000 | Nomura Holdings, Inc., 5.605%, 7/6/29 | 4,581,370 |
| 4,020,000 | OneMain Finance Corp., 3.50%, 1/15/27 | 3,448,919 |
| 1,795,000 | OneMain Finance Corp., 9.00%, 1/15/29 | 1,810,168 |
| 8,559,000 | United Wholesale Mortgage LLC, 5.50%, 4/15/29 (144A) | 7,339,343 |
| | Total Diversified Financial Services | $120,137,078 |
|
|
| | Electric — 0.6% | |
| 6,305,000(b) | Algonquin Power & Utilities Corp., 4.75% (5 Year CMT Index + 325 bps), 1/18/82 | $ 5,012,475 |
| 2,125,000 | Entergy Louisiana LLC, 4.75%, 9/15/52 | 1,948,913 |
| 3,820,000 | Niagara Mohawk Power Corp., 5.783%, 9/16/52 (144A) | 3,828,871 |
| 2,501,000 | NRG Energy, Inc., 2.45%, 12/2/27 (144A) | 2,107,613 |
| 6,870,000 | Puget Energy, Inc., 2.379%, 6/15/28 | 5,924,885 |
| 7,185,000 | Puget Energy, Inc., 4.10%, 6/15/30 | 6,541,901 |
| 2,120,000 | Puget Energy, Inc., 4.224%, 3/15/32 | 1,904,960 |
| | Total Electric | $27,269,618 |
|
|
| | Energy-Alternate Sources — 0.1% | |
| 4,479,370 | Adani Renewable Energy RJ, Ltd./Kodangal Solar Parks Pvt, Ltd./Wardha Solar Maharash, 4.625%, 10/15/39 (144A) | $ 3,271,067 |
| 248,483 | Alta Wind Holdings LLC, 7.00%, 6/30/35 (144A) | 227,131 |
| | Total Energy-Alternate Sources | $3,498,198 |
|
|
| | Entertainment — 0.2% | |
| 8,400,000 | Resorts World Las Vegas LLC/RWLV Capital, Inc., 4.625%, 4/16/29 (144A) | $ 6,929,205 |
| 2,700,000 | Resorts World Las Vegas LLC/RWLV Capital, Inc., 4.625%, 4/6/31 (144A) | 2,079,039 |
| | Total Entertainment | $9,008,244 |
|
|
| | Food — 0.6% | |
| 3,430,000 | JBS USA LUX SA/JBS USA Food Co./JBS USA Finance, Inc., 3.00%, 2/2/29 (144A) | $ 2,908,674 |
| 1,654,000 | JBS USA LUX SA/JBS USA Food Co./JBS USA Finance, Inc., 3.00%, 5/15/32 (144A) | 1,269,363 |
| 7,490,000 | JBS USA LUX SA/JBS USA Food Co./JBS USA Finance, Inc., 5.75%, 4/1/33 (144A) | 7,040,248 |
The accompanying notes are an integral part of these financial statements.
Pioneer Bond Fund | Annual Report | 6/30/2341
Schedule of Investments | 6/30/23 (continued)
Principal
Amount
USD ($) | | | | | | Value |
| | Food — (continued) | |
| 2,335,000 | JBS USA LUX SA/JBS USA Food Co./JBS USA Finance, Inc., 6.50%, 12/1/52 (144A) | $ 2,212,882 |
| 5,405,000 | Minerva Luxembourg SA, 4.375%, 3/18/31 (144A) | 4,229,097 |
| 6,070,000 | Smithfield Foods, Inc., 2.625%, 9/13/31 (144A) | 4,485,571 |
| 5,935,000 | Smithfield Foods, Inc., 3.00%, 10/15/30 (144A) | 4,653,375 |
| 668,000 | Smithfield Foods, Inc., 5.20%, 4/1/29 (144A) | 615,573 |
| | Total Food | $27,414,783 |
|
|
| | Gas — 0.4% | |
| 2,810,000 | Boston Gas Co., 3.15%, 8/1/27 (144A) | $ 2,556,677 |
| 11,700,000 | KeySpan Gas East Corp., 5.994%, 3/6/33 (144A) | 11,790,818 |
| 1,525,238 | Nakilat, Inc., 6.267%, 12/31/33 (144A) | 1,611,032 |
| 3,730,000 | NiSource, Inc., 5.40%, 6/30/33 | 3,732,494 |
| | Total Gas | $19,691,021 |
|
|
| | Hand & Machine Tools — 0.2% | |
| 3,559,000 | Kennametal, Inc., 2.80%, 3/1/31 | $ 2,846,374 |
| 3,755,000 | Regal Rexnord Corp., 6.30%, 2/15/30 (144A) | 3,743,885 |
| | Total Hand & Machine Tools | $6,590,259 |
|
|
| | Healthcare-Products — 0.2% | |
| 2,139,000 | Edwards Lifesciences Corp., 4.30%, 6/15/28 | $ 2,067,420 |
| 10,178,000 | Smith & Nephew Plc, 2.032%, 10/14/30 | 8,234,540 |
| | Total Healthcare-Products | $10,301,960 |
|
|
| | Healthcare-Services — 0.3% | |
| 2,500,000 | Elevance Health, Inc., 6.10%, 10/15/52 | $ 2,738,689 |
| 16,810,000 | Fresenius Medical Care US Finance III, Inc., 2.375%, 2/16/31 (144A) | 12,754,447 |
| | Total Healthcare-Services | $15,493,136 |
|
|
| | Insurance — 1.8% | |
| 5,530,000 | Brown & Brown, Inc., 4.20%, 3/17/32 | $ 4,966,088 |
| 8,430,000 | CNA Financial Corp., 5.50%, 6/15/33 | 8,220,610 |
| 1,680,000 | CNO Financial Group, Inc., 5.25%, 5/30/29 | 1,589,259 |
| 12,306,000 | CNO Global Funding, 2.65%, 1/6/29 (144A) | 10,351,675 |
| 2,720,000(b) | Farmers Exchange Capital III, 5.454% (3 Month USD LIBOR + 345 bps), 10/15/54 (144A) | 2,391,696 |
| 8,910,000(b) | Farmers Insurance Exchange, 4.747% (3 Month USD LIBOR + 323 bps), 11/1/57 (144A) | 6,983,302 |
| 16,962,000 | Liberty Mutual Insurance Co., 7.697%, 10/15/97 (144A) | 18,989,366 |
| 7,760,000 | Metropolitan Life Global Funding I, 5.15%, 3/28/33 (144A) | 7,674,631 |
| 14,190,000 | Nationwide Mutual Insurance Co., 4.35%, 4/30/50 (144A) | 10,765,834 |
The accompanying notes are an integral part of these financial statements.
42Pioneer Bond Fund | Annual Report | 6/30/23
Principal
Amount
USD ($) | | | | | | Value |
| | Insurance — (continued) | |
| 9,700,000(b) | Nippon Life Insurance Co., 2.90% (5 Year CMT Index + 260 bps), 9/16/51 (144A) | $ 7,921,257 |
| 2,590,000 | Primerica, Inc., 2.80%, 11/19/31 | 2,141,712 |
| 635,000 | Teachers Insurance & Annuity Association of America, 6.85%, 12/16/39 (144A) | 700,153 |
| | Total Insurance | $82,695,583 |
|
|
| | Iron & Steel — 0.0%† | |
| 2,136,000 | Commercial Metals Co., 4.375%, 3/15/32 | $ 1,845,921 |
| | Total Iron & Steel | $1,845,921 |
|
|
| | Lodging — 0.4% | |
| 2,230,000 | Marriott International, Inc., 4.90%, 4/15/29 | $ 2,169,661 |
| 14,805,000 | Marriott International, Inc., 3.50%, 10/15/32 | 12,787,049 |
| 2,845,000 | Marriott International, Inc., 4.625%, 6/15/30 | 2,724,034 |
| | Total Lodging | $17,680,744 |
|
|
| | Machinery-Construction & Mining — 0.1% | |
| 5,155,000 | Weir Group Plc, 2.20%, 5/13/26 (144A) | $ 4,617,210 |
| | Total Machinery-Construction & Mining | $4,617,210 |
|
|
| | Machinery-Diversified — 0.1% | |
| 6,395,000 | CNH Industrial Capital LLC, 4.55%, 4/10/28 | $ 6,183,557 |
| | Total Machinery-Diversified | $6,183,557 |
|
|
| | Media — 0.4% | |
| 1,085,000 | CCO Holdings LLC/CCO Holdings Capital Corp., 4.50%, 6/1/33 (144A) | $ 852,035 |
| 7,800,000 | CCO Holdings LLC/CCO Holdings Capital Corp., 4.75%, 3/1/30 (144A) | 6,669,653 |
| 2,130,000 | CCO Holdings LLC/CCO Holdings Capital Corp., 7.375%, 3/1/31 (144A) | 2,075,538 |
| 4,380,000 | Charter Communications Operating LLC/Charter Communications Operating Capital, 4.40%, 4/1/33 | 3,844,569 |
| 8,827,000 | CSC Holdings LLC, 4.50%, 11/15/31 (144A) | 6,154,327 |
| | Total Media | $19,596,122 |
|
|
| | Mining — 0.6% | |
| 4,204,000 | Anglo American Capital Plc, 2.25%, 3/17/28 (144A) | $ 3,612,745 |
| 2,800,000 | Anglo American Capital Plc, 5.50%, 5/2/33 (144A) | 2,735,581 |
| 4,092,000 | AngloGold Ashanti Holdings Plc, 3.75%, 10/1/30 | 3,512,438 |
| 8,260,000 | First Quantum Minerals, Ltd., 8.625%, 6/1/31 (144A) | 8,465,509 |
| 8,310,000 | Rio Tinto Finance USA Plc, 5.125%, 3/9/53 | 8,379,320 |
| | Total Mining | $26,705,593 |
|
|
The accompanying notes are an integral part of these financial statements.
Pioneer Bond Fund | Annual Report | 6/30/2343
Schedule of Investments | 6/30/23 (continued)
Principal
Amount
USD ($) | | | | | | Value |
| | Multi-National — 0.2% | |
| 6,560,000 | Banque Ouest Africaine de Developpement, 4.70%, 10/22/31 (144A) | $ 5,324,030 |
| 2,030,000 | Banque Ouest Africaine de Developpement, 5.00%, 7/27/27 (144A) | 1,858,465 |
| | Total Multi-National | $7,182,495 |
|
|
| | Oil & Gas — 0.8% | |
| 18,980,000 | Aker BP ASA, 3.10%, 7/15/31 (144A) | $ 15,706,394 |
| 1,225,000 | Harbour Energy Plc, 5.50%, 10/15/26 (144A) | 1,122,484 |
| 1,735,000 | Lundin Energy Finance BV, 2.00%, 7/15/26 (144A) | 1,558,183 |
| 11,125,000 | Phillips 66 Co., 3.75%, 3/1/28 | 10,426,296 |
| 7,773,000 | Valero Energy Corp., 6.625%, 6/15/37 | 8,340,302 |
| | Total Oil & Gas | $37,153,659 |
|
|
| | Oil & Gas Services — 0.1% | |
| 2,065,000 | Halliburton Co., 7.60%, 8/15/96 (144A) | $ 2,164,644 |
| | Total Oil & Gas Services | $2,164,644 |
|
|
| | Pharmaceuticals — 0.3% | |
| 1,180,000 | CVS Health Corp., 5.25%, 1/30/31 | $ 1,176,297 |
| 7,765,000 | CVS Health Corp., 5.25%, 2/21/33 | 7,734,841 |
| 2,720,000 | Teva Pharmaceutical Finance Netherlands III BV, 4.75%, 5/9/27 | 2,516,197 |
| 2,720,000 | Teva Pharmaceutical Finance Netherlands III BV, 5.125%, 5/9/29 | 2,467,314 |
| | Total Pharmaceuticals | $13,894,649 |
|
|
| | Pipelines — 2.0% | |
| 2,265,000 | Boardwalk Pipelines LP, 3.60%, 9/1/32 | $ 1,922,908 |
| 3,720,000 | Crestwood Midstream Partners LP/Crestwood Midstream Finance Corp., 7.375%, 2/1/31 (144A) | 3,666,624 |
| 2,930,000 | Energy Transfer LP, 4.15%, 9/15/29 | 2,696,590 |
| 13,251,000 | Energy Transfer LP, 4.95%, 5/15/28 | 12,820,416 |
| 4,800,000 | Energy Transfer LP, 5.35%, 5/15/45 | 4,194,955 |
| 3,750,000 | Energy Transfer LP, 6.00%, 6/15/48 | 3,556,140 |
| 7,285,000(b)(f) | Energy Transfer LP, 7.125% (5 Year CMT Index + 531 bps) | 6,177,109 |
| 7,631,000 | EnLink Midstream Partners LP, 5.45%, 6/1/47 | 6,272,720 |
| 3,944,000 | EnLink Midstream Partners LP, 5.60%, 4/1/44 | 3,302,015 |
| 16,180,000 | Kinder Morgan, Inc., 5.45%, 8/1/52 | 14,772,867 |
| 7,725,000 | MPLX LP, 4.95%, 3/14/52 | 6,560,799 |
| 6,295,000 | NGPL PipeCo LLC, 3.25%, 7/15/31 (144A) | 5,184,326 |
| 2,060,000 | Venture Global LNG, Inc., 8.125%, 6/1/28 (144A) | 2,092,208 |
| 3,655,000 | Venture Global LNG, Inc., 8.375%, 6/1/31 (144A) | 3,684,852 |
The accompanying notes are an integral part of these financial statements.
44Pioneer Bond Fund | Annual Report | 6/30/23
Principal
Amount
USD ($) | | | | | | Value |
| | Pipelines — (continued) | |
| 2,270,000 | Williams Cos., Inc., 7.75%, 6/15/31 | $ 2,511,253 |
| 7,360,000 | Williams Cos., Inc., 7.50%, 1/15/31 | 8,080,727 |
| | Total Pipelines | $87,496,509 |
|
|
| | REITs — 1.4% | |
| 1,955,000 | GLP Capital LP/GLP Financing II, Inc., 3.25%, 1/15/32 | $ 1,578,493 |
| 4,748,000 | HAT Holdings I LLC/HAT Holdings II LLC , 3.375%, 6/15/26 (144A) | 4,255,364 |
| 8,169,000 | Healthcare Realty Holdings LP, 3.10%, 2/15/30 | 6,997,422 |
| 1,876,000 | Highwoods Realty LP, 2.60%, 2/1/31 | 1,374,794 |
| 406,000 | Highwoods Realty LP, 3.05%, 2/15/30 | 315,124 |
| 2,539,000 | Highwoods Realty LP, 4.125%, 3/15/28 | 2,220,285 |
| 7,870,000 | LXP Industrial Trust, 2.375%, 10/1/31 | 5,990,604 |
| 4,880,000 | LXP Industrial Trust, 2.70%, 9/15/30 | 3,897,199 |
| 15,000,000 | Simon Property Group LP , 5.50%, 3/8/33 | 14,893,160 |
| 15,090,000 | Sun Communities Operating LP , 5.70%, 1/15/33 | 14,697,678 |
| 4,865,000 | UDR, Inc., 4.40%, 1/26/29 | 4,575,413 |
| | Total REITs | $60,795,536 |
|
|
| | Retail — 0.7% | |
| 1,675,000 | AutoNation, Inc., 1.95%, 8/1/28 | $ 1,364,423 |
| 1,675,000 | AutoNation, Inc., 2.40%, 8/1/31 | 1,270,783 |
| 7,335,000 | AutoNation, Inc., 3.85%, 3/1/32 | 6,222,891 |
| 3,775,000 | AutoNation, Inc., 4.75%, 6/1/30 | 3,529,647 |
| 11,070,000 | Dollar Tree, Inc., 2.65%, 12/1/31 | 9,053,294 |
| 8,895,000 | Lowe's Cos., Inc., 3.75%, 4/1/32 | 8,050,639 |
| 2,655,000 | Tractor Supply Co., 5.25%, 5/15/33 | 2,634,425 |
| | Total Retail | $32,126,102 |
|
|
| | Semiconductors — 0.7% | |
| 978,000 | Broadcom, Inc., 3.137%, 11/15/35 (144A) | $ 750,170 |
| 14,123,000 | Broadcom, Inc., 3.187%, 11/15/36 (144A) | 10,673,501 |
| 3,930,000 | Broadcom, Inc., 4.15%, 4/15/32 (144A) | 3,559,678 |
| 2,960,000 | Broadcom, Inc., 4.30%, 11/15/32 | 2,715,148 |
| 4,470,000 | Foundry JV Holdco LLC, 5.875%, 1/25/34 (144A) | 4,452,329 |
| 8,577,000 | Skyworks Solutions, Inc., 3.00%, 6/1/31 | 6,928,560 |
| | Total Semiconductors | $29,079,386 |
|
|
| | Software — 0.2% | |
| 12,416,000 | Autodesk, Inc., 2.40%, 12/15/31 | $ 10,159,846 |
| | Total Software | $10,159,846 |
|
|
| | Telecommunications — 0.9% | |
| 1,945,000 | Altice France SA, 5.125%, 7/15/29 (144A) | $ 1,380,704 |
The accompanying notes are an integral part of these financial statements.
Pioneer Bond Fund | Annual Report | 6/30/2345
Schedule of Investments | 6/30/23 (continued)
Principal
Amount
USD ($) | | | | | | Value |
| | Telecommunications — (continued) | |
| 7,584,000 | Altice France SA, 5.50%, 1/15/28 (144A) | $ 5,726,730 |
| 9,430,000 | Motorola Solutions, Inc., 2.30%, 11/15/30 | 7,617,204 |
| 4,420,000 | Motorola Solutions, Inc., 5.60%, 6/1/32 | 4,379,708 |
| 5,250,000 | T-Mobile USA, Inc., 2.70%, 3/15/32 | 4,336,659 |
| 5,150,000 | T-Mobile USA, Inc., 5.05%, 7/15/33 | 5,056,778 |
| 4,265,000 | T-Mobile USA, Inc., 5.20%, 1/15/33 | 4,237,580 |
| 7,285,000 | Verizon Communications, Inc., 5.05%, 5/9/33 | 7,203,934 |
| | Total Telecommunications | $39,939,297 |
|
|
| | Trucking & Leasing — 0.3% | |
| 2,897,000 | Penske Truck Leasing Co. LP/PTL Finance Corp., 4.40%, 7/1/27 (144A) | $ 2,734,344 |
| 8,305,000 | Penske Truck Leasing Co. LP/PTL Finance Corp., 5.55%, 5/1/28 (144A) | 8,176,893 |
| 1,120,000 | Penske Truck Leasing Co. LP/PTL Finance Corp., 6.20%, 6/15/30 (144A) | 1,125,852 |
| | Total Trucking & Leasing | $12,037,089 |
|
|
| | Total Corporate Bonds
(Cost $1,481,058,395) | $1,313,300,815 |
|
|
| Shares | | | | | | |
| | Convertible Preferred Stock — 0.6% of
Net Assets | |
| | Banks — 0.6% | |
| 22,514(f) | Wells Fargo & Co., 7.50% | $ 25,936,128 |
| | Total Banks | $25,936,128 |
|
|
| | Total Convertible Preferred Stock
(Cost $28,773,488) | $25,936,128 |
|
|
Principal
Amount
USD ($) | | | | | | |
| | Municipal Bonds — 0.1% of Net Assets(h) | |
| | Virginia — 0.1% | |
| 2,335,000 | Virginia Commonwealth Transportation Board, Transportation Capital Projects, 4.00%, 5/15/32 | $ 2,356,809 |
| | Total Virginia | $ 2,356,809 |
|
|
| | Total Municipal Bonds
(Cost $2,453,151) | $ 2,356,809 |
|
|
The accompanying notes are an integral part of these financial statements.
46Pioneer Bond Fund | Annual Report | 6/30/23
Principal
Amount
USD ($) | | | | | | Value |
|
| | Insurance-Linked Securities — 3.3% of
Net Assets# | |
| | Event Linked Bonds — 1.2% | |
| | Earthquakes – California — 0.0%† | |
| 1,000,000(a) | Phoenician Re, 8.182%, (3 Month U.S. Treasury Bill + 290 bps), 12/14/24 (144A) | $ 979,100 |
| | Earthquakes – Mexico — 0.0%† | |
| 250,000(a) | International Bank for Reconstruction & Development, 8.964%, (3 Month USD LIBOR + 350 bps), 3/13/24 (144A) | $ 248,925 |
| | Earthquakes – U.S. — 0.0%† | |
| 750,000(a) | Ursa Re, 10.784%, (3 Month U.S. Treasury Bill + 550 bps), 12/6/25 (144A) | $ 755,400 |
| 500,000(b) | Veraison Re, 11.784%, (1 Month U.S. Treasury Bill + 650 bps), 3/9/26 (144A) | 526,950 |
| | | | | | | $ 1,282,350 |
|
|
| | Flood – U.S. — 0.1% | |
| 2,000,000(a) | FloodSmart Re, 17.114%, (3 Month U.S. Treasury Bill + 1,183 bps), 2/25/25 (144A) | $ 1,890,600 |
| 1,250,000(a) | FloodSmart Re, 18.864%, (3 Month U.S. Treasury Bill + 1,358 bps), 3/1/24 (144A) | 1,172,375 |
| | | | | | | $ 3,062,975 |
|
|
| | Health – U.S. — 0.1% | |
| 2,250,000(a) | Vitality Re XIII, 7.284%, (3 Month U.S. Treasury Bill + 200 bps), 1/6/26 (144A) | $ 2,201,625 |
| 3,250,000(a) | Vitality Re XIV, 8.784%, (3 Month U.S. Treasury Bill + 350 bps), 1/5/27 (144A) | 3,327,675 |
| 750,000(a) | Vitality Re XIV, 9.784%, (3 Month U.S. Treasury Bill + 450 bps), 1/5/27 (144A) | 749,700 |
| | | | | | | $ 6,279,000 |
|
|
| | Multiperil – U.S. — 0.4% | |
| 100,000(a) | Caelus Re V, 5.384%, (1 Month U.S. Treasury Bill + 10 bps), 6/5/24 (144A) | $ 80,000 |
| 250,000(a) | Easton Re Pte, 9.814%, (3 Month U.S. Treasury Bill + 453 bps), 1/8/24 (144A) | 247,225 |
| 500,000(a) | Four Lakes Re, 9.554%, (3 Month U.S. Treasury Bill + 427 bps), 1/7/25 (144A) | 470,900 |
| 3,000,000(a) | Four Lakes Re, 11.784%, (3 Month U.S. Treasury Bill + 650 bps), 1/7/26 (144A) | 3,031,800 |
| 500,000(a) | Herbie Re, 15.004%, (3 Month U.S. Treasury Bill + 972 bps), 1/8/25 (144A) | 483,050 |
| 2,000,000(a) | Matterhorn Re, 10.341%, (SOFR + 525 bps), 3/24/25 (144A) | 1,896,800 |
The accompanying notes are an integral part of these financial statements.
Pioneer Bond Fund | Annual Report | 6/30/2347
Schedule of Investments | 6/30/23 (continued)
Principal
Amount
USD ($) | | | | | | Value |
| | Multiperil – U.S. — (continued) | |
| 1,000,000(a) | Matterhorn Re, 12.841%, (SOFR + 775 bps), 3/24/25 (144A) | $ 949,900 |
| 3,400,000(a) | Mystic Re IV, 14.534%, (3 Month U.S. Treasury Bill + 925 bps), 1/8/26 (144A) | 3,363,280 |
| 1,750,000(a) | Residential Re, 12.284%, (3 Month U.S. Treasury Bill + 700 bps), 12/6/26 (144A) | 1,740,900 |
| 750,000(a) | Sakura Re, 18.784%, (3 Month U.S. Treasury Bill + 1,350 bps), 1/5/26 (144A) | 799,575 |
| 2,750,000(a) | Sanders Re II, 8.374%, (3 Month U.S. Treasury Bill + 309 bps), 4/7/25 (144A) | 2,609,200 |
| 1,000,000(a) | Sanders Re III, 11.534%, (3 Month U.S. Treasury Bill + 625 bps), 4/7/27 (144A) | 1,023,800 |
| | | | | | | $ 16,696,430 |
|
|
| | Multiperil – U.S. & Canada — 0.1% | |
| 250,000(a) | Matterhorn Re, 10.84%, (SOFR + 575 bps), 12/8/25 (144A) | $ 223,200 |
| 1,000,000(a) | Mona Lisa Re, 17.784%, (3 Month U.S. Treasury Bill + 1,250 bps), 1/8/26 (144A) | 1,056,000 |
| 750,000(a) | Northshore Re II, 13.284%, (3 Month U.S. Treasury Bill + 800 bps), 7/8/25 (144A) | 751,200 |
| | | | | | | $ 2,030,400 |
|
|
| | Multiperil – U.S. Regional — 0.2% | |
| 850,000(a) | Aquila Re I, 12.784%, (3 Month U.S. Treasury Bill + 750 bps), 6/8/26 (144A) | $ 846,175 |
| 1,000,000(a) | Kilimanjaro III Re, 5.25%, (3 Month U.S. Treasury Bill + 525 bps), 6/25/25 (144A) | 985,100 |
| 1,000,000(a) | Locke Tavern Re, 4.75%, (3 Month U.S. Treasury Bill + 475 bps), 4/9/26 (144A) | 1,004,700 |
| 3,500,000(a) | Long Point Re IV, 9.534%, (3 Month U.S. Treasury Bill + 425 bps), 6/1/26 (144A) | 3,473,750 |
| 1,250,000(a) | Matterhorn Re, 10.284%, (3 Month U.S. Treasury Bill + 500 bps), 1/8/24 (144A) | 1,025,000 |
| | | | | | | $ 7,334,725 |
|
|
| | Multiperil – Worldwide — 0.0%† | |
| 2,000,000(a) | Atlas Capital, 12.31%, (SOFR + 725 bps), 6/5/26 (144A) | $ 2,016,000 |
| | Pandemic – U.S — 0.0%† | |
| 1,000,000(a) | Vitality Re XI, 7.084%, (3 Month U.S. Treasury Bill + 180 bps), 1/9/24 (144A) | $ 986,500 |
| | Windstorm – Florida — 0.0%† | |
| 750,000(a) | Integrity Re, 12.284%, (3 Month U.S. Treasury Bill + 700 bps), 6/6/25 (144A) | $ 675,000 |
The accompanying notes are an integral part of these financial statements.
48Pioneer Bond Fund | Annual Report | 6/30/23
Principal
Amount
USD ($) | | | | | | Value |
| | Windstorm – U.S. — 0.2% | |
| 1,000,000(a) | Alamo Re, 13.784%, (1 Month U.S. Treasury Bill + 850 bps), 6/7/26 (144A) | $ 980,200 |
| 250,000(a) | Bonanza Re, 11.034%, (3 Month U.S. Treasury Bill + 575 bps), 3/16/25 (144A) | ��� 210,300 |
| 300,000(a) | Bonanza Re, 13.534%, (3 Month U.S. Treasury Bill + 825 bps), 1/8/26 (144A) | 297,030 |
| 1,100,000(a) | Cape Lookout Re, 11.784%, (1 Month U.S. Treasury Bill + 650 bps), 4/28/26 (144A) | 1,108,800 |
| 700,000(a) | Gateway Re, 18.284%, (1 Month U.S. Treasury Bill + 1,300 bps), 2/24/26 (144A) | 723,100 |
| 250,000(a) | Gateway Re II, 14.784%, (3 Month U.S. Treasury Bill + 950 bps), 4/27/26 (144A) | 247,400 |
| 3,000,000(a) | Queen Street 2023 Re, 12.784%, (3 Month U.S. Treasury Bill + 750 bps), 12/8/25 (144A) | 3,006,900 |
| | | | | | | $ 6,573,730 |
| |
| |
| | Windstorm – U.S. Regional — 0.0%† | | |
| 1,000,000(a) | Commonwealth Re, 8.784%, (3 Month U.S. Treasury Bill + 350 bps), 7/8/25 (144A) | $ 986,600 | |
| | Winterstorm – Florida — 0.1% | | |
| 1,500,000(a) | Integrity Re, 17.284%, (1 Month U.S. Treasury Bill + 1,200 bps), 6/6/25 (144A) | $ 1,483,200 | |
| 1,000,000(a) | Lightning Re, 16.284%, (3 Month U.S. Treasury Bill + 1,100 bps), 3/31/26 (144A) | 1,028,000 | |
| | | | | | | $ 2,511,200 | |
| |
| |
| | Total Event Linked Bonds | $ 51,662,935 | |
| |
| |
Face
Amount
USD ($) | | | | | | |
| | Collateralized Reinsurance — 0.6% | |
| | Multiperil – Massachusetts — 0.1% | |
| 1,250,000(i)(j) + | Ailsa Re 2022, 5/31/28 | $ 1,294,465 |
| 1,750,000(i)(j) + | Denning Re 2022, 6/30/28 | 1,810,917 |
| 500,000(i)(j) + | Portsalon Re 2022, 5/31/28 | 458,460 |
| | | | | | | $ 3,563,842 |
|
|
| | Multiperil – U.S. — 0.4% | |
| 8,000,000(i)(j) + | Ballybunion Re 2020, 2/29/24 | $ 903,793 |
| 2,250,000(i)(j) + | Ballybunion Re 2021-3, 7/31/25 | 50,308 |
| 1,750,000(i)(j) + | Ballybunion Re 2022, 12/31/27 | 33,163 |
| 3,000,000(i)(j) + | Ballybunion Re 2022-2, 5/31/28 | 3,046,530 |
| 4,000,000(i)(j) + | Ballybunion Re 2022-3, 6/30/28 | 4,138,433 |
The accompanying notes are an integral part of these financial statements.
Pioneer Bond Fund | Annual Report | 6/30/2349
Schedule of Investments | 6/30/23 (continued)
Face
Amount
USD ($) | | | | | | Value |
| | Multiperil – U.S. — (continued) | |
| 3,500,000(i)(j) + | Ballybunion Re 2023, 12/31/28 | $ 3,598,917 |
| 5,750,000(i)(j) + | Gamboge Re, 3/31/29 | 5,153,453 |
| | | | | | | $ 16,924,597 |
|
|
| | Multiperil – Worldwide — 0.1% | |
| 1,000,000(i)(j) + | Clarendon Re 2023, 12/31/28 | $ 982,780 |
| 167,000(j) + | Limestone Re 2019-2B, 10/1/23 (144A) | — |
| 1,420,000(j) + | Limestone Re 2020-1, 3/1/24 (144A) | — |
| 480,000(j) + | Limestone Re 2020-1, 3/1/24 (144A) | — |
| 500,000(i)(j) + | Merion Re 2023-1, 12/31/28 | 482,230 |
| 250,000(i)(j) + | Old Head Re 2022, 12/31/27 | 125,000 |
| 250,000(i)(j) + | Old Head Re 2023, 12/31/28 | 215,361 |
| 1,000,000(i)(j) + | Pine Valley Re 2023, 12/31/28 | 47,560 |
| 250,000(i)(j) + | Porthcawl Re 2023, 12/31/28 | 229,890 |
| 350,000(i)(j) + | Walton Health Re 2019, 6/30/24 | 184,811 |
| 2,500,000(i)(j) + | Walton Health Re 2022, 12/15/27 | 1,761,599 |
| | | | | | | $ 4,029,231 |
|
|
| | Windstorm – Florida — 0.0%† | |
| 1,500,000(i)(j) + | Formby Re 2018, 2/29/24 | $ 48,036 |
| 2,000,000(i)(j) + | Isosceles Re 2022, 5/31/28 | 1,998,000 |
| | | | | | | $ 2,046,036 |
|
|
| | Windstorm – U.S. Regional — 0.0%† | |
| 7,255,240(j) + | Oakmont Re 2020, 4/30/24 | $ — |
| 4,500,000(i)(j) + | Oakmont Re 2022, 4/1/28 | 1,415,275 |
| | | | | | | $ 1,415,275 |
|
|
| | Total Collateralized Reinsurance | $27,978,981 |
|
|
| | Reinsurance Sidecars — 1.5% | |
| | Multiperil – U.S. — 0.0%† | |
| 2,000,000(i)(j) + | Carnoustie Re 2020, 12/31/23 | $ 230,656 |
| 2,000,000(i)(k) + | Harambee Re 2018, 12/31/24 | — |
| 5,000,000(k) + | Harambee Re 2019, 12/31/24 | 8,500 |
| 4,000,000(k) + | Harambee Re 2020, 12/31/23 | 56,800 |
| | | | | | | $ 295,956 |
|
|
| | Multiperil – Worldwide — 1.5% | |
| 24,550(k) + | Alturas Re 2019-3, 9/12/23 | $ 2,308 |
| 225,450(k) + | Alturas Re 2020-3, 9/30/24 | — |
| 3,959,302(i)(k) + | Alturas Re 2021-2, 12/31/24 | — |
| 213,682(i)(k) + | Alturas Re 2021-3, 7/31/25 | 27,052 |
| 3,497,182(i)(k) + | Alturas Re 2022-2, 12/31/27 | 1,586,671 |
| 5,000,000(i)(j) + | Bantry Re 2021, 12/31/24 | 10,000 |
| 4,171,573(i)(j) + | Bantry Re 2022, 12/31/27 | 487,494 |
The accompanying notes are an integral part of these financial statements.
50Pioneer Bond Fund | Annual Report | 6/30/23
Face
Amount
USD ($) | | | | | | Value |
| | Multiperil – Worldwide — (continued) | |
| 6,000,000(i)(j) + | Bantry Re 2023, 12/31/28 | $ 6,510,000 |
| 7,281,734(i)(j) + | Berwick Re 2019-1, 12/31/24 | 1,161,437 |
| 3,000,000(i)(j) + | Berwick Re 2020-1, 12/31/23 | 300 |
| 4,500,000(i)(j) + | Berwick Re 2022, 12/31/27 | 286,913 |
| 4,500,000(i)(j) + | Berwick Re 2023, 12/31/28 | 4,837,500 |
| 640,000(i)(j) + | Eden Re II, 3/22/24 (144A) | 229,120 |
| 210,000(i)(j) + | Eden Re II, 3/22/24 (144A) | 94,290 |
| 624,097(i)(j) + | Eden Re II, 3/21/25 (144A) | 352,116 |
| 1,040,000(i)(j) + | Eden Re II, 3/20/26 (144A) | 626,361 |
| 3,600,000(i)(j) + | Eden Re II, 3/19/27 (144A) | 3,668,040 |
| 1,250,000(i)(j) + | Gleneagles Re 2021, 12/31/24 | 125 |
| 1,250,000(i)(j) + | Gleneagles Re 2022, 12/31/27 | 617,905 |
| 2,118,314(j) + | Gullane Re 2018, 12/31/24 | 100,036 |
| 6,381,951(i)(j) + | Gullane Re 2023, 12/31/28 | 6,894,316 |
| 500,000(i)(k) + | Lion Rock Re 2020, 1/31/24 | — |
| 500,000(i)(k) + | Lion Rock Re 2021, 12/31/24 | 104,650 |
| 2,993,180(i)(k) + | Lorenz Re 2019, 6/30/24 | 33,224 |
| 7,000,000(j) + | Merion Re 2018-2, 12/31/24 | 489,888 |
| 9,000,000(i)(j) + | Merion Re 2021-2, 12/31/24 | 1,768,500 |
| 6,551,154(i)(j) + | Merion Re 2022-2, 12/31/27 | 6,211,224 |
| 2,750,000(i)(j) + | Pangaea Re 2022-3, 5/31/28 | 2,970,693 |
| 4,750,000(i)(j) + | Pangaea Re 2023-1, 12/31/28 | 5,106,250 |
| 1,250,000(i)(j) + | Phoenix 3 Re 2023-3, 1/4/27 | 1,325,000 |
| 2,000,000(i)(j) + | RosaPenna Re 2022, 6/30/28 | 2,121,000 |
| 600,000(j) + | Sector Re V, 3/1/24 (144A) | 302,700 |
| 1,914(j) + | Sector Re V, 3/1/24 (144A) | 46,222 |
| 99,999(j) + | Sector Re V, 12/1/24 (144A) | 172,128 |
| 200,000(j) + | Sector Re V, 12/1/24 (144A) | 344,260 |
| 10,000(a)(i)(j) + | Sector Re V, 12/1/26 (144A) | 57,495 |
| 84,000(a)(i)(j) + | Sector Re V, 12/1/26 (144A) | 482,958 |
| 4,605,987(i)(j) + | Sector Re V, 12/1/27 (144A) | 4,930,709 |
| 3,609,700(j) + | Sussex Re 2020-1, 12/31/24 | 4,693 |
| 1,250,000(j) + | Sussex Re 2021-1, 12/31/24 | 41,000 |
| 3,000,000(k) + | Thopas Re 2019, 12/31/24 | 9,900 |
| 6,000,000(k) + | Thopas Re 2020, 12/31/23 | — |
| 7,000,000(k) + | Thopas Re 2021, 12/31/24 | 112,700 |
| 4,000,000(k) + | Thopas Re 2022, 12/31/27 | — |
| 4,256,392(i)(k) + | Thopas Re 2023, 12/31/28 | 4,620,313 |
| 4,228,426(k) + | Torricelli Re 2021, 7/31/25 | 133,614 |
| 4,500,000(i)(k) + | Torricelli Re 2022, 6/30/28 | 4,990,257 |
| 1,000,000(i)(k) + | Viribus Re 2018, 12/31/24 | — |
| 3,650,000(k) + | Viribus Re 2019, 12/31/24 | 25,915 |
| 4,139,570(i)(k) + | Viribus Re 2020, 12/31/23 | 142,815 |
The accompanying notes are an integral part of these financial statements.
Pioneer Bond Fund | Annual Report | 6/30/2351
Schedule of Investments | 6/30/23 (continued)
Face
Amount
USD ($) | | | | | | Value |
| | Multiperil – Worldwide — (continued) | |
| 3,000,000(k) + | Viribus Re 2022, 12/31/27 | $ 147,600 |
| 2,000,000(i)(k) + | Viribus Re 2023, 12/31/28 | 2,320,600 |
| 1,623,326(i)(j) + | Woburn Re 2018, 12/31/24 | 35,837 |
| 4,979,452(i)(j) + | Woburn Re 2019, 12/31/24 | 861,848 |
| | | | | | | $ 67,405,977 |
|
|
| | Total Reinsurance Sidecars | $67,701,933 |
|
|
| | Total Insurance-Linked Securities
(Cost $143,676,900) | $147,343,849 |
|
|
Principal
Amount
USD ($) | | | | | | |
| | U.S. Government and Agency
Obligations — 37.0% of Net Assets | |
| 13,258,645 | Federal Home Loan Mortgage Corp., 1.500%, 12/1/41 | $ 10,739,338 |
| 2,834,094 | Federal Home Loan Mortgage Corp., 1.500%, 1/1/42 | 2,294,393 |
| 2,154,431 | Federal Home Loan Mortgage Corp., 1.500%, 1/1/42 | 1,744,163 |
| 14,287,089 | Federal Home Loan Mortgage Corp., 1.500%, 1/1/42 | 11,566,380 |
| 7,338,695 | Federal Home Loan Mortgage Corp., 1.500%, 2/1/42 | 5,941,177 |
| 10,219,582 | Federal Home Loan Mortgage Corp., 1.500%, 2/1/42 | 8,269,202 |
| 1,461,309 | Federal Home Loan Mortgage Corp., 1.500%, 3/1/42 | 1,181,814 |
| 338,753 | Federal Home Loan Mortgage Corp., 2.000%, 2/1/42 | 286,357 |
| 3,798,060 | Federal Home Loan Mortgage Corp., 2.000%, 3/1/52 | 3,103,236 |
| 33,220,353 | Federal Home Loan Mortgage Corp., 2.500%, 5/1/51 | 28,292,690 |
| 4,200,876 | Federal Home Loan Mortgage Corp., 2.500%, 4/1/52 | 3,566,929 |
| 18,947,970 | Federal Home Loan Mortgage Corp., 2.500%, 6/1/52 | 16,075,165 |
| 563,366 | Federal Home Loan Mortgage Corp., 3.000%, 10/1/29 | 537,441 |
| 490,758 | Federal Home Loan Mortgage Corp., 3.000%, 9/1/42 | 443,553 |
| 2,545,732 | Federal Home Loan Mortgage Corp., 3.000%, 11/1/42 | 2,300,827 |
| 2,268,325 | Federal Home Loan Mortgage Corp., 3.000%, 6/1/46 | 2,041,505 |
| 600,250 | Federal Home Loan Mortgage Corp., 3.000%, 12/1/46 | 537,902 |
| 45,188 | Federal Home Loan Mortgage Corp., 3.000%, 10/1/48 | 40,314 |
| 44,128,870 | Federal Home Loan Mortgage Corp., 3.000%, 4/1/52 | 38,876,277 |
| 155,409 | Federal Home Loan Mortgage Corp., 3.500%, 9/1/44 | 144,994 |
| 2,254,472 | Federal Home Loan Mortgage Corp., 3.500%, 6/1/45 | 2,101,226 |
| 94,279 | Federal Home Loan Mortgage Corp., 3.500%, 7/1/45 | 87,851 |
The accompanying notes are an integral part of these financial statements.
52Pioneer Bond Fund | Annual Report | 6/30/23
Principal
Amount
USD ($) | | | | | | Value |
| | U.S. Government and Agency Obligations —
(continued) | |
| 1,965,712 | Federal Home Loan Mortgage Corp., 3.500%, 10/1/45 | $ 1,831,276 |
| 2,284,540 | Federal Home Loan Mortgage Corp., 3.500%, 7/1/46 | 2,133,301 |
| 2,966,114 | Federal Home Loan Mortgage Corp., 3.500%, 8/1/46 | 2,761,709 |
| 2,630,621 | Federal Home Loan Mortgage Corp., 3.500%, 8/1/46 | 2,449,328 |
| 4,099,451 | Federal Home Loan Mortgage Corp., 3.500%, 12/1/46 | 3,809,623 |
| 477,532 | Federal Home Loan Mortgage Corp., 3.500%, 1/1/47 | 443,775 |
| 232,382 | Federal Home Loan Mortgage Corp., 3.500%, 6/1/47 | 214,710 |
| 51,170 | Federal Home Loan Mortgage Corp., 3.500%, 1/1/52 | 46,726 |
| 3,690,639 | Federal Home Loan Mortgage Corp., 3.500%, 4/1/52 | 3,380,967 |
| 261,983 | Federal Home Loan Mortgage Corp., 3.500%, 4/1/52 | 238,884 |
| 3,180,462 | Federal Home Loan Mortgage Corp., 3.500%, 4/1/52 | 2,918,776 |
| 3,554,044 | Federal Home Loan Mortgage Corp., 4.000%, 11/1/41 | 3,453,102 |
| 26,732 | Federal Home Loan Mortgage Corp., 4.000%, 7/1/42 | 25,731 |
| 1,192,793 | Federal Home Loan Mortgage Corp., 4.000%, 10/1/42 | 1,148,140 |
| 16,201 | Federal Home Loan Mortgage Corp., 4.000%, 11/1/42 | 15,571 |
| 433,618 | Federal Home Loan Mortgage Corp., 4.000%, 4/1/47 | 412,309 |
| 369,742 | Federal Home Loan Mortgage Corp., 4.000%, 6/1/50 | 350,371 |
| 360,744 | Federal Home Loan Mortgage Corp., 4.000%, 2/1/51 | 340,534 |
| 202,650 | Federal Home Loan Mortgage Corp., 4.000%, 4/1/51 | 190,678 |
| 182,871 | Federal Home Loan Mortgage Corp., 4.000%, 9/1/51 | 171,740 |
| 1,069,303 | Federal Home Loan Mortgage Corp., 4.000%, 9/1/51 | 1,005,078 |
| 194,580 | Federal Home Loan Mortgage Corp., 4.000%, 6/1/52 | 182,718 |
| 645,817 | Federal Home Loan Mortgage Corp., 4.500%, 11/1/40 | 636,818 |
| 405,103 | Federal Home Loan Mortgage Corp., 4.500%, 3/1/42 | 400,515 |
| 43,505 | Federal Home Loan Mortgage Corp., 4.500%, 11/1/43 | 42,742 |
| 2,015,956 | Federal Home Loan Mortgage Corp., 4.500%, 3/1/53 | 1,946,233 |
| 3,085 | Federal Home Loan Mortgage Corp., 5.000%, 11/1/34 | 3,110 |
| 44,838 | Federal Home Loan Mortgage Corp., 5.000%, 6/1/35 | 44,408 |
| 94,752 | Federal Home Loan Mortgage Corp., 5.000%, 9/1/38 | 95,540 |
| 91,554 | Federal Home Loan Mortgage Corp., 5.000%, 10/1/38 | 92,315 |
| 798 | Federal Home Loan Mortgage Corp., 5.000%, 5/1/39 | 801 |
| 1,887 | Federal Home Loan Mortgage Corp., 5.000%, 12/1/39 | 1,892 |
| 718,023 | Federal Home Loan Mortgage Corp., 5.000%, 9/1/49 | 713,699 |
The accompanying notes are an integral part of these financial statements.
Pioneer Bond Fund | Annual Report | 6/30/2353
Schedule of Investments | 6/30/23 (continued)
Principal
Amount
USD ($) | | | | | | Value |
| | U.S. Government and Agency Obligations —
(continued) | |
| 1,907,008 | Federal Home Loan Mortgage Corp., 5.000%, 10/1/49 | $ 1,900,046 |
| 345,480 | Federal Home Loan Mortgage Corp., 5.000%, 10/1/49 | 340,025 |
| 3,002,347 | Federal Home Loan Mortgage Corp., 5.000%, 12/1/49 | 2,975,612 |
| 738,309 | Federal Home Loan Mortgage Corp., 5.000%, 8/1/50 | 731,051 |
| 1,775,373 | Federal Home Loan Mortgage Corp., 5.000%, 12/1/50 | 1,754,992 |
| 2,070,185 | Federal Home Loan Mortgage Corp., 5.000%, 9/1/52 | 2,077,344 |
| 2,436,003 | Federal Home Loan Mortgage Corp., 5.000%, 10/1/52 | 2,444,426 |
| 460,299 | Federal Home Loan Mortgage Corp., 5.000%, 3/1/53 | 451,187 |
| 6,402,861 | Federal Home Loan Mortgage Corp., 5.000%, 4/1/53 | 6,274,521 |
| 11,514,002 | Federal Home Loan Mortgage Corp., 5.000%, 4/1/53 | 11,283,331 |
| 1,802,503 | Federal Home Loan Mortgage Corp., 5.000%, 4/1/53 | 1,769,518 |
| 484,037 | Federal Home Loan Mortgage Corp., 5.000%, 4/1/53 | 474,417 |
| 235,778 | Federal Home Loan Mortgage Corp., 5.000%, 4/1/53 | 231,227 |
| 368,742 | Federal Home Loan Mortgage Corp., 5.000%, 4/1/53 | 362,069 |
| 57,293 | Federal Home Loan Mortgage Corp., 5.500%, 9/1/33 | 58,690 |
| 3,086 | Federal Home Loan Mortgage Corp., 5.500%, 1/1/34 | 3,153 |
| 29,322 | Federal Home Loan Mortgage Corp., 5.500%, 11/1/34 | 30,060 |
| 2,999 | Federal Home Loan Mortgage Corp., 5.500%, 11/1/34 | 2,989 |
| 45,518 | Federal Home Loan Mortgage Corp., 5.500%, 8/1/35 | 45,742 |
| 8,656 | Federal Home Loan Mortgage Corp., 5.500%, 11/1/35 | 8,712 |
| 290,572 | Federal Home Loan Mortgage Corp., 5.500%, 6/1/41 | 298,838 |
| 3,302,664 | Federal Home Loan Mortgage Corp., 5.500%, 7/1/49 | 3,336,001 |
| 484,963 | Federal Home Loan Mortgage Corp., 5.500%, 3/1/53 | 487,259 |
| 1,453,449 | Federal Home Loan Mortgage Corp., 5.500%, 3/1/53 | 1,450,172 |
| 691,549 | Federal Home Loan Mortgage Corp., 5.500%, 3/1/53 | 689,574 |
| 497,430 | Federal Home Loan Mortgage Corp., 5.500%, 4/1/53 | 495,493 |
| 314,854 | Federal Home Loan Mortgage Corp., 5.500%, 4/1/53 | 313,867 |
| 445,698 | Federal Home Loan Mortgage Corp., 5.500%, 4/1/53 | 444,194 |
| 274,956 | Federal Home Loan Mortgage Corp., 5.500%, 4/1/53 | 274,578 |
| 1,140,108 | Federal Home Loan Mortgage Corp., 5.500%, 4/1/53 | 1,136,218 |
| 31,417 | Federal Home Loan Mortgage Corp., 6.000%, 1/1/33 | 31,811 |
| 11,085 | Federal Home Loan Mortgage Corp., 6.000%, 1/1/33 | 11,206 |
| 12,691 | Federal Home Loan Mortgage Corp., 6.000%, 2/1/33 | 13,067 |
| 1,285 | Federal Home Loan Mortgage Corp., 6.000%, 2/1/33 | 1,300 |
| 38,002 | Federal Home Loan Mortgage Corp., 6.000%, 3/1/33 | 39,252 |
The accompanying notes are an integral part of these financial statements.
54Pioneer Bond Fund | Annual Report | 6/30/23
Principal
Amount
USD ($) | | | | | | Value |
| | U.S. Government and Agency Obligations —
(continued) | |
| 7,027 | Federal Home Loan Mortgage Corp., 6.000%, 3/1/33 | $ 7,098 |
| 32,842 | Federal Home Loan Mortgage Corp., 6.000%, 9/1/33 | 34,030 |
| 16,786 | Federal Home Loan Mortgage Corp., 6.000%, 11/1/33 | 17,054 |
| 4,242 | Federal Home Loan Mortgage Corp., 6.000%, 11/1/33 | 4,333 |
| 30,424 | Federal Home Loan Mortgage Corp., 6.000%, 12/1/33 | 30,758 |
| 6,643 | Federal Home Loan Mortgage Corp., 6.000%, 12/1/33 | 6,710 |
| 26,583 | Federal Home Loan Mortgage Corp., 6.000%, 1/1/34 | 27,020 |
| 9,184 | Federal Home Loan Mortgage Corp., 6.000%, 1/1/34 | 9,524 |
| 123,114 | Federal Home Loan Mortgage Corp., 6.000%, 5/1/34 | 127,765 |
| 16,821 | Federal Home Loan Mortgage Corp., 6.000%, 5/1/34 | 16,991 |
| 11,949 | Federal Home Loan Mortgage Corp., 6.000%, 4/1/35 | 12,075 |
| 36,948 | Federal Home Loan Mortgage Corp., 6.000%, 6/1/35 | 37,336 |
| 39,798 | Federal Home Loan Mortgage Corp., 6.000%, 4/1/36 | 40,292 |
| 24,825 | Federal Home Loan Mortgage Corp., 6.000%, 7/1/36 | 25,091 |
| 3,172 | Federal Home Loan Mortgage Corp., 6.000%, 7/1/36 | 3,297 |
| 8,366 | Federal Home Loan Mortgage Corp., 6.000%, 12/1/36 | 8,514 |
| 20,317 | Federal Home Loan Mortgage Corp., 6.000%, 1/1/38 | 21,062 |
| 21,600 | Federal Home Loan Mortgage Corp., 6.000%, 7/1/38 | 21,860 |
| 1,010,839 | Federal Home Loan Mortgage Corp., 6.000%, 10/1/52 | 1,032,760 |
| 526,664 | Federal Home Loan Mortgage Corp., 6.000%, 3/1/53 | 542,481 |
| 377,868 | Federal Home Loan Mortgage Corp., 6.000%, 3/1/53 | 385,405 |
| 310,906 | Federal Home Loan Mortgage Corp., 6.000%, 4/1/53 | 320,665 |
| 217,076 | Federal Home Loan Mortgage Corp., 6.000%, 4/1/53 | 219,410 |
| 353,296 | Federal Home Loan Mortgage Corp., 6.000%, 4/1/53 | 356,830 |
| 300,016 | Federal Home Loan Mortgage Corp., 6.000%, 4/1/53 | 304,381 |
| 600,000 | Federal Home Loan Mortgage Corp., 6.000%, 7/1/53 | 605,480 |
| 132 | Federal Home Loan Mortgage Corp., 6.500%, 11/1/30 | 135 |
| 124 | Federal Home Loan Mortgage Corp., 6.500%, 3/1/31 | 127 |
| 742 | Federal Home Loan Mortgage Corp., 6.500%, 3/1/31 | 759 |
| 2,046 | Federal Home Loan Mortgage Corp., 6.500%, 5/1/31 | 2,123 |
| 3,485 | Federal Home Loan Mortgage Corp., 6.500%, 5/1/31 | 3,565 |
| 200 | Federal Home Loan Mortgage Corp., 6.500%, 8/1/31 | 205 |
| 2,627 | Federal Home Loan Mortgage Corp., 6.500%, 8/1/31 | 2,685 |
| 3,481 | Federal Home Loan Mortgage Corp., 6.500%, 7/1/32 | 3,596 |
| 34 | Federal Home Loan Mortgage Corp., 6.500%, 1/1/33 | 35 |
The accompanying notes are an integral part of these financial statements.
Pioneer Bond Fund | Annual Report | 6/30/2355
Schedule of Investments | 6/30/23 (continued)
Principal
Amount
USD ($) | | | | | | Value |
| | U.S. Government and Agency Obligations —
(continued) | |
| 11,671 | Federal Home Loan Mortgage Corp., 6.500%, 10/1/33 | $ 12,126 |
| 1,292,472 | Federal Home Loan Mortgage Corp., 6.500%, 1/1/53 | 1,328,177 |
| 8,659,566 | Federal Home Loan Mortgage Corp., 6.500%, 2/1/53 | 9,110,387 |
| 325,795 | Federal Home Loan Mortgage Corp., 6.500%, 4/1/53 | 336,735 |
| 260,399 | Federal Home Loan Mortgage Corp., 6.500%, 4/1/53 | 267,753 |
| 966 | Federal Home Loan Mortgage Corp., 7.000%, 11/1/30 | 993 |
| 132,524 | Federal National Mortgage Association, 1.500%, 3/1/41 | 107,826 |
| 35,873,527 | Federal National Mortgage Association, 1.500%, 11/1/41 | 29,057,138 |
| 1,197,002 | Federal National Mortgage Association, 1.500%, 1/1/42 | 969,550 |
| 18,433,042 | Federal National Mortgage Association, 1.500%, 1/1/42 | 14,938,071 |
| 12,196,155 | Federal National Mortgage Association, 1.500%, 1/1/42 | 9,873,613 |
| 15,193,612 | Federal National Mortgage Association, 1.500%, 2/1/42 | 12,293,926 |
| 4,048,757 | Federal National Mortgage Association, 1.500%, 3/1/42 | 3,274,366 |
| 20,399,522 | Federal National Mortgage Association, 2.000%, 12/1/41 | 17,255,241 |
| 1,054,333 | Federal National Mortgage Association, 2.000%, 2/1/42 | 889,499 |
| 372,382 | Federal National Mortgage Association, 2.000%, 2/1/42 | 314,161 |
| 962,225 | Federal National Mortgage Association, 2.000%, 11/1/50 | 796,790 |
| 624,313 | Federal National Mortgage Association, 2.000%, 1/1/51 | 521,333 |
| 10,630,782 | Federal National Mortgage Association, 2.000%, 11/1/51 | 8,765,772 |
| 11,194,241 | Federal National Mortgage Association, 2.000%, 3/1/52 | 9,138,549 |
| 393,465 | Federal National Mortgage Association, 2.500%, 7/1/30 | 365,650 |
| 345,576 | Federal National Mortgage Association, 2.500%, 7/1/30 | 321,119 |
| 608,552 | Federal National Mortgage Association, 2.500%, 7/1/30 | 565,463 |
| 102,720 | Federal National Mortgage Association, 2.500%, 12/1/42 | 88,675 |
The accompanying notes are an integral part of these financial statements.
56Pioneer Bond Fund | Annual Report | 6/30/23
Principal
Amount
USD ($) | | | | | | Value |
| | U.S. Government and Agency Obligations —
(continued) | |
| 94,949 | Federal National Mortgage Association, 2.500%, 12/1/42 | $ 81,969 |
| 96,073 | Federal National Mortgage Association, 2.500%, 1/1/43 | 82,938 |
| 1,061,940 | Federal National Mortgage Association, 2.500%, 2/1/43 | 916,761 |
| 39,083 | Federal National Mortgage Association, 2.500%, 2/1/43 | 33,451 |
| 38,036 | Federal National Mortgage Association, 2.500%, 2/1/43 | 32,282 |
| 122,768 | Federal National Mortgage Association, 2.500%, 3/1/43 | 105,983 |
| 71,778 | Federal National Mortgage Association, 2.500%, 4/1/43 | 60,963 |
| 104,153 | Federal National Mortgage Association, 2.500%, 8/1/43 | 89,916 |
| 45,892 | Federal National Mortgage Association, 2.500%, 12/1/43 | 39,622 |
| 99,511 | Federal National Mortgage Association, 2.500%, 3/1/44 | 85,608 |
| 622,117 | Federal National Mortgage Association, 2.500%, 4/1/45 | 537,078 |
| 583,786 | Federal National Mortgage Association, 2.500%, 4/1/45 | 503,940 |
| 213,029 | Federal National Mortgage Association, 2.500%, 4/1/45 | 183,448 |
| 113,735 | Federal National Mortgage Association, 2.500%, 4/1/45 | 98,186 |
| 182,453 | Federal National Mortgage Association, 2.500%, 4/1/45 | 157,413 |
| 241,137 | Federal National Mortgage Association, 2.500%, 4/1/45 | 208,176 |
| 63,584 | Federal National Mortgage Association, 2.500%, 4/1/45 | 54,892 |
| 99,396 | Federal National Mortgage Association, 2.500%, 4/1/45 | 85,575 |
| 20,732 | Federal National Mortgage Association, 2.500%, 5/1/45 | 17,897 |
| 48,995 | Federal National Mortgage Association, 2.500%, 7/1/45 | 42,295 |
| 50,573 | Federal National Mortgage Association, 2.500%, 8/1/45 | 43,656 |
| 39,227 | Federal National Mortgage Association, 2.500%, 1/1/46 | 33,738 |
The accompanying notes are an integral part of these financial statements.
Pioneer Bond Fund | Annual Report | 6/30/2357
Schedule of Investments | 6/30/23 (continued)
Principal
Amount
USD ($) | | | | | | Value |
| | U.S. Government and Agency Obligations —
(continued) | |
| 554,351 | Federal National Mortgage Association, 2.500%, 9/1/50 | $ 477,404 |
| 2,919,795 | Federal National Mortgage Association, 2.500%, 9/1/50 | 2,512,511 |
| 594,806 | Federal National Mortgage Association, 2.500%, 9/1/50 | 517,008 |
| 282,151 | Federal National Mortgage Association, 2.500%, 10/1/50 | 245,250 |
| 36,949,402 | Federal National Mortgage Association, 2.500%, 5/1/51 | 31,766,233 |
| 9,680,788 | Federal National Mortgage Association, 2.500%, 11/1/51 | 8,318,001 |
| 10,554,525 | Federal National Mortgage Association, 2.500%, 12/1/51 | 9,024,430 |
| 22,333,082 | Federal National Mortgage Association, 2.500%, 1/1/52 | 19,092,137 |
| 1,818,289 | Federal National Mortgage Association, 2.500%, 2/1/52 | 1,560,637 |
| 26,408,964 | Federal National Mortgage Association, 2.500%, 4/1/52 | 22,404,568 |
| 4,086,920 | Federal National Mortgage Association, 2.500%, 4/1/52 | 3,503,795 |
| 3,890,747 | Federal National Mortgage Association, 2.500%, 4/1/52 | 3,302,389 |
| 25,515,510 | Federal National Mortgage Association, 2.500%, 4/1/52 | 21,658,427 |
| 1,323,036 | Federal National Mortgage Association, 2.500%, 7/1/52 | 1,122,855 |
| 992,182 | Federal National Mortgage Association, 3.000%, 10/1/30 | 945,270 |
| 372,888 | Federal National Mortgage Association, 3.000%, 4/1/31 | 351,038 |
| 165,582 | Federal National Mortgage Association, 3.000%, 6/1/40 | 151,124 |
| 1,719,218 | Federal National Mortgage Association, 3.000%, 9/1/42 | 1,552,010 |
| 311,866 | Federal National Mortgage Association, 3.000%, 3/1/45 | 281,519 |
| 1,868,912 | Federal National Mortgage Association, 3.000%, 4/1/47 | 1,672,915 |
| 1,263,815 | Federal National Mortgage Association, 3.000%, 12/1/47 | 1,138,564 |
| 15,252,350 | Federal National Mortgage Association, 3.000%, 1/1/52 | 13,560,339 |
The accompanying notes are an integral part of these financial statements.
58Pioneer Bond Fund | Annual Report | 6/30/23
Principal
Amount
USD ($) | | | | | | Value |
| | U.S. Government and Agency Obligations —
(continued) | |
| 20,499,093 | Federal National Mortgage Association, 3.000%, 3/1/52 | $ 18,341,637 |
| 7,677,988 | Federal National Mortgage Association, 3.000%, 3/1/52 | 6,764,086 |
| 4,450,000 | Federal National Mortgage Association, 3.000%, 7/1/53 (TBA) | 3,916,174 |
| 5,455,757 | Federal National Mortgage Association, 3.000%, 2/1/57 | 4,756,052 |
| 769,887 | Federal National Mortgage Association, 3.500%, 6/1/28 | 741,580 |
| 230,842 | Federal National Mortgage Association, 3.500%, 10/1/41 | 216,126 |
| 1,432,781 | Federal National Mortgage Association, 3.500%, 11/1/41 | 1,338,933 |
| 175,265 | Federal National Mortgage Association, 3.500%, 6/1/42 | 164,094 |
| 101,950 | Federal National Mortgage Association, 3.500%, 10/1/42 | 95,084 |
| 172,253 | Federal National Mortgage Association, 3.500%, 12/1/42 | 161,279 |
| 175,858 | Federal National Mortgage Association, 3.500%, 12/1/42 | 164,650 |
| 1,232,343 | Federal National Mortgage Association, 3.500%, 9/1/45 | 1,146,356 |
| 1,151,526 | Federal National Mortgage Association, 3.500%, 5/1/46 | 1,070,929 |
| 2,598,282 | Federal National Mortgage Association, 3.500%, 1/1/47 | 2,411,813 |
| 33,428 | Federal National Mortgage Association, 3.500%, 2/1/47 | 31,137 |
| 47,723 | Federal National Mortgage Association, 3.500%, 7/1/47 | 44,613 |
| 40,181 | Federal National Mortgage Association, 3.500%, 10/1/47 | 37,466 |
| 238,527 | Federal National Mortgage Association, 3.500%, 12/1/47 | 223,604 |
| 28,600 | Federal National Mortgage Association, 3.500%, 2/1/49 | 26,093 |
| 698,021 | Federal National Mortgage Association, 3.500%, 5/1/49 | 650,494 |
| 1,092,684 | Federal National Mortgage Association, 3.500%, 5/1/49 | 1,024,338 |
| 29,755 | Federal National Mortgage Association, 3.500%, 7/1/49 | 27,521 |
The accompanying notes are an integral part of these financial statements.
Pioneer Bond Fund | Annual Report | 6/30/2359
Schedule of Investments | 6/30/23 (continued)
Principal
Amount
USD ($) | | | | | | Value |
| | U.S. Government and Agency Obligations —
(continued) | |
| 213,757 | Federal National Mortgage Association, 3.500%, 12/1/51 | $ 195,008 |
| 273,022 | Federal National Mortgage Association, 3.500%, 2/1/52 | 252,751 |
| 270,055 | Federal National Mortgage Association, 3.500%, 3/1/52 | 246,280 |
| 444,698 | Federal National Mortgage Association, 3.500%, 3/1/52 | 409,151 |
| 1,244,866 | Federal National Mortgage Association, 3.500%, 3/1/52 | 1,136,081 |
| 911,851 | Federal National Mortgage Association, 3.500%, 4/1/52 | 831,458 |
| 3,386,290 | Federal National Mortgage Association, 3.500%, 4/1/52 | 3,086,555 |
| 2,083,199 | Federal National Mortgage Association, 3.500%, 4/1/52 | 1,911,788 |
| 6,120,107 | Federal National Mortgage Association, 3.500%, 5/1/52 | 5,606,580 |
| 470,801 | Federal National Mortgage Association, 3.500%, 6/1/52 | 431,115 |
| 605,798 | Federal National Mortgage Association, 3.500%, 6/1/52 | 552,469 |
| 5,995,378 | Federal National Mortgage Association, 3.500%, 6/1/52 | 5,467,569 |
| 334,747 | Federal National Mortgage Association, 3.500%, 8/1/58 | 305,074 |
| 1,733 | Federal National Mortgage Association, 4.000%, 10/1/25 | 1,693 |
| 70,046 | Federal National Mortgage Association, 4.000%, 11/1/34 | 68,089 |
| 636,092 | Federal National Mortgage Association, 4.000%, 4/1/39 | 611,669 |
| 2,500,016 | Federal National Mortgage Association, 4.000%, 10/1/40 | 2,422,757 |
| 426,414 | Federal National Mortgage Association, 4.000%, 12/1/40 | 412,630 |
| 306,704 | Federal National Mortgage Association, 4.000%, 4/1/41 | 294,896 |
| 307,910 | Federal National Mortgage Association, 4.000%, 10/1/41 | 296,050 |
| 682,013 | Federal National Mortgage Association, 4.000%, 1/1/42 | 655,732 |
| 707,038 | Federal National Mortgage Association, 4.000%, 4/1/42 | 679,801 |
The accompanying notes are an integral part of these financial statements.
60Pioneer Bond Fund | Annual Report | 6/30/23
Principal
Amount
USD ($) | | | | | | Value |
| | U.S. Government and Agency Obligations —
(continued) | |
| 82,341 | Federal National Mortgage Association, 4.000%, 7/1/42 | $ 79,164 |
| 385,662 | Federal National Mortgage Association, 4.000%, 10/1/42 | 370,808 |
| 38,027 | Federal National Mortgage Association, 4.000%, 6/1/45 | 36,925 |
| 194,593 | Federal National Mortgage Association, 4.000%, 7/1/45 | 186,109 |
| 50,919 | Federal National Mortgage Association, 4.000%, 5/1/50 | 48,360 |
| 344,442 | Federal National Mortgage Association, 4.000%, 7/1/50 | 324,871 |
| 67,336 | Federal National Mortgage Association, 4.000%, 10/1/50 | 63,531 |
| 211,721 | Federal National Mortgage Association, 4.000%, 11/1/50 | 199,638 |
| 1,743,893 | Federal National Mortgage Association, 4.000%, 11/1/50 | 1,646,715 |
| 870,525 | Federal National Mortgage Association, 4.000%, 12/1/50 | 819,821 |
| 79,535 | Federal National Mortgage Association, 4.000%, 1/1/51 | 75,106 |
| 20,317 | Federal National Mortgage Association, 4.000%, 1/1/51 | 19,205 |
| 362,165 | Federal National Mortgage Association, 4.000%, 1/1/51 | 340,758 |
| 194,542 | Federal National Mortgage Association, 4.000%, 2/1/51 | 183,804 |
| 518,432 | Federal National Mortgage Association, 4.000%, 2/1/51 | 488,281 |
| 659,942 | Federal National Mortgage Association, 4.000%, 4/1/51 | 621,833 |
| 63,262 | Federal National Mortgage Association, 4.000%, 5/1/51 | 59,588 |
| 1,320,960 | Federal National Mortgage Association, 4.000%, 6/1/51 | 1,242,125 |
| 312,638 | Federal National Mortgage Association, 4.000%, 7/1/51 | 297,161 |
| 3,745,374 | Federal National Mortgage Association, 4.000%, 7/1/51 | 3,521,567 |
| 210,389 | Federal National Mortgage Association, 4.000%, 8/1/51 | 197,728 |
| 144,177 | Federal National Mortgage Association, 4.000%, 9/1/51 | 135,573 |
The accompanying notes are an integral part of these financial statements.
Pioneer Bond Fund | Annual Report | 6/30/2361
Schedule of Investments | 6/30/23 (continued)
Principal
Amount
USD ($) | | | | | | Value |
| | U.S. Government and Agency Obligations —
(continued) | |
| 301,650 | Federal National Mortgage Association, 4.000%, 6/1/52 | $ 283,259 |
| 1,600,000 | Federal National Mortgage Association, 4.000%, 7/1/53 (TBA) | 1,501,437 |
| 746,896 | Federal National Mortgage Association, 4.000%, 7/1/56 | 703,282 |
| 1,100,302 | Federal National Mortgage Association, 4.000%, 1/1/57 | 1,034,681 |
| 41,978 | Federal National Mortgage Association, 4.500%, 10/1/35 | 41,352 |
| 23,000,000 | Federal National Mortgage Association, 4.500%, 7/1/38 (TBA) | 22,550,781 |
| 108,053 | Federal National Mortgage Association, 4.500%, 8/1/40 | 106,705 |
| 414,403 | Federal National Mortgage Association, 4.500%, 11/1/40 | 408,155 |
| 101,340 | Federal National Mortgage Association, 4.500%, 2/1/41 | 99,812 |
| 401,067 | Federal National Mortgage Association, 4.500%, 4/1/41 | 396,062 |
| 18,832 | Federal National Mortgage Association, 4.500%, 5/1/41 | 18,597 |
| 738,671 | Federal National Mortgage Association, 4.500%, 5/1/41 | 727,531 |
| 1,016,447 | Federal National Mortgage Association, 4.500%, 5/1/41 | 1,003,758 |
| 325,342 | Federal National Mortgage Association, 4.500%, 7/1/41 | 321,284 |
| 1,249,419 | Federal National Mortgage Association, 4.500%, 1/1/42 | 1,233,837 |
| 1,092,742 | Federal National Mortgage Association, 4.500%, 1/1/42 | 1,079,109 |
| 132,356 | Federal National Mortgage Association, 4.500%, 3/1/43 | 130,703 |
| 4,652,708 | Federal National Mortgage Association, 4.500%, 9/1/43 | 4,594,690 |
| 3,119,442 | Federal National Mortgage Association, 4.500%, 1/1/44 | 3,080,540 |
| 1,610,156 | Federal National Mortgage Association, 4.500%, 3/1/44 | 1,591,508 |
| 13,619,868 | Federal National Mortgage Association, 4.500%, 7/1/44 | 13,401,581 |
| 151,087 | Federal National Mortgage Association, 4.500%, 1/1/47 | 147,518 |
The accompanying notes are an integral part of these financial statements.
62Pioneer Bond Fund | Annual Report | 6/30/23
Principal
Amount
USD ($) | | | | | | Value |
| | U.S. Government and Agency Obligations —
(continued) | |
| 60,524 | Federal National Mortgage Association, 4.500%, 2/1/47 | $ 59,096 |
| 2,004,726 | Federal National Mortgage Association, 4.500%, 8/1/47 | 1,973,974 |
| 1,000,000 | Federal National Mortgage Association, 4.500%, 7/1/53 (TBA) | 961,406 |
| 26,230 | Federal National Mortgage Association, 5.000%, 7/1/34 | 25,494 |
| 102,819 | Federal National Mortgage Association, 5.000%, 10/1/34 | 102,995 |
| 36,000,000 | Federal National Mortgage Association, 5.000%, 7/1/38 (TBA) | 35,762,344 |
| 200,647 | Federal National Mortgage Association, 5.000%, 2/1/39 | 200,174 |
| 171,369 | Federal National Mortgage Association, 5.000%, 6/1/40 | 172,597 |
| 116,354 | Federal National Mortgage Association, 5.000%, 6/1/40 | 117,186 |
| 109,617 | Federal National Mortgage Association, 5.000%, 7/1/40 | 110,104 |
| 165,292 | Federal National Mortgage Association, 5.000%, 7/1/40 | 166,476 |
| 247,482 | Federal National Mortgage Association, 5.000%, 7/1/40 | 246,564 |
| 189,014 | Federal National Mortgage Association, 5.000%, 8/1/40 | 190,368 |
| 666,885 | Federal National Mortgage Association, 5.000%, 2/1/41 | 669,845 |
| 2,690,257 | Federal National Mortgage Association, 5.000%, 12/1/44 | 2,709,503 |
| 143,707 | Federal National Mortgage Association, 5.000%, 6/1/49 | 141,638 |
| 510,876 | Federal National Mortgage Association, 5.000%, 9/1/49 | 510,093 |
| 2,583,068 | Federal National Mortgage Association, 5.000%, 9/1/49 | 2,595,042 |
| 3,864,635 | Federal National Mortgage Association, 5.000%, 10/1/50 | 3,837,390 |
| 1,906,380 | Federal National Mortgage Association, 5.000%, 6/1/52 | 1,896,767 |
| 5,941,671 | Federal National Mortgage Association, 5.000%, 8/1/52 | 5,823,555 |
| 8,799,632 | Federal National Mortgage Association, 5.000%, 8/1/52 | 8,631,390 |
The accompanying notes are an integral part of these financial statements.
Pioneer Bond Fund | Annual Report | 6/30/2363
Schedule of Investments | 6/30/23 (continued)
Principal
Amount
USD ($) | | | | | | Value |
| | U.S. Government and Agency Obligations —
(continued) | |
| 3,973,357 | Federal National Mortgage Association, 5.000%, 11/1/52 | $ 3,896,703 |
| 435,636 | Federal National Mortgage Association, 5.000%, 2/1/53 | 427,309 |
| 712,266 | Federal National Mortgage Association, 5.000%, 2/1/53 | 699,445 |
| 922,809 | Federal National Mortgage Association, 5.000%, 2/1/53 | 905,097 |
| 1,856,616 | Federal National Mortgage Association, 5.000%, 3/1/53 | 1,820,030 |
| 435,585 | Federal National Mortgage Association, 5.000%, 3/1/53 | 427,969 |
| 1,547,941 | Federal National Mortgage Association, 5.000%, 4/1/53 | 1,518,063 |
| 353,729 | Federal National Mortgage Association, 5.000%, 4/1/53 | 348,033 |
| 421,746 | Federal National Mortgage Association, 5.000%, 4/1/53 | 413,684 |
| 697,754 | Federal National Mortgage Association, 5.000%, 4/1/53 | 683,768 |
| 2,800,000 | Federal National Mortgage Association, 5.000%, 7/1/53 (TBA) | 2,743,562 |
| 4,361 | Federal National Mortgage Association, 5.500%, 6/1/33 | 4,373 |
| 24,941 | Federal National Mortgage Association, 5.500%, 7/1/33 | 25,519 |
| 155,169 | Federal National Mortgage Association, 5.500%, 7/1/34 | 158,773 |
| 6,010 | Federal National Mortgage Association, 5.500%, 10/1/35 | 6,130 |
| 50,489 | Federal National Mortgage Association, 5.500%, 3/1/36 | 50,507 |
| 43,186 | Federal National Mortgage Association, 5.500%, 5/1/36 | 43,342 |
| 52,050 | Federal National Mortgage Association, 5.500%, 6/1/36 | 53,437 |
| 828,225 | Federal National Mortgage Association, 5.500%, 5/1/49 | 836,330 |
| 2,659,304 | Federal National Mortgage Association, 5.500%, 4/1/50 | 2,686,146 |
| 6,252,337 | Federal National Mortgage Association, 5.500%, 4/1/50 | 6,315,447 |
| 1,265,084 | Federal National Mortgage Association, 5.500%, 11/1/52 | 1,263,421 |
The accompanying notes are an integral part of these financial statements.
64Pioneer Bond Fund | Annual Report | 6/30/23
Principal
Amount
USD ($) | | | | | | Value |
| | U.S. Government and Agency Obligations —
(continued) | |
| 3,392,643 | Federal National Mortgage Association, 5.500%, 1/1/53 | $ 3,399,696 |
| 3,667,418 | Federal National Mortgage Association, 5.500%, 1/1/53 | 3,690,882 |
| 1,674,755 | Federal National Mortgage Association, 5.500%, 1/1/53 | 1,682,886 |
| 2,378,706 | Federal National Mortgage Association, 5.500%, 2/1/53 | 2,372,277 |
| 598,017 | Federal National Mortgage Association, 5.500%, 2/1/53 | 600,922 |
| 904,627 | Federal National Mortgage Association, 5.500%, 2/1/53 | 906,509 |
| 2,436,565 | Federal National Mortgage Association, 5.500%, 4/1/53 | 2,428,928 |
| 1,846,817 | Federal National Mortgage Association, 5.500%, 4/1/53 | 1,840,515 |
| 409,396 | Federal National Mortgage Association, 5.500%, 4/1/53 | 411,335 |
| 571,929 | Federal National Mortgage Association, 5.500%, 4/1/53 | 572,519 |
| 1,114,780 | Federal National Mortgage Association, 5.500%, 4/1/53 | 1,110,667 |
| 1,532,039 | Federal National Mortgage Association, 5.500%, 4/1/53 | 1,535,038 |
| 527,170 | Federal National Mortgage Association, 5.500%, 4/1/53 | 526,641 |
| 704,189 | Federal National Mortgage Association, 5.500%, 4/1/53 | 701,363 |
| 71,800,000 | Federal National Mortgage Association, 5.500%, 7/1/53 (TBA) | 71,452,219 |
| 200,000(g) | Federal National Mortgage Association, 5.500%, 7/1/53 | 200,493 |
| 15,729 | Federal National Mortgage Association, 5.720%, 11/1/28 | 15,591 |
| 13,086 | Federal National Mortgage Association, 5.720%, 6/1/29 | 13,026 |
| 22,846 | Federal National Mortgage Association, 5.900%, 4/1/28 | 22,736 |
| 213 | Federal National Mortgage Association, 6.000%, 9/1/29 | 220 |
| 696 | Federal National Mortgage Association, 6.000%, 1/1/32 | 703 |
| 3,886 | Federal National Mortgage Association, 6.000%, 2/1/32 | 3,989 |
The accompanying notes are an integral part of these financial statements.
Pioneer Bond Fund | Annual Report | 6/30/2365
Schedule of Investments | 6/30/23 (continued)
Principal
Amount
USD ($) | | | | | | Value |
| | U.S. Government and Agency Obligations —
(continued) | |
| 1,675 | Federal National Mortgage Association, 6.000%, 3/1/32 | $ 1,722 |
| 968 | Federal National Mortgage Association, 6.000%, 8/1/32 | 996 |
| 137 | Federal National Mortgage Association, 6.000%, 9/1/32 | 141 |
| 12,926 | Federal National Mortgage Association, 6.000%, 10/1/32 | 13,293 |
| 3,817 | Federal National Mortgage Association, 6.000%, 2/1/33 | 3,850 |
| 20,457 | Federal National Mortgage Association, 6.000%, 3/1/33 | 21,114 |
| 23,548 | Federal National Mortgage Association, 6.000%, 4/1/33 | 23,784 |
| 40,975 | Federal National Mortgage Association, 6.000%, 7/1/33 | 41,377 |
| 11,984 | Federal National Mortgage Association, 6.000%, 11/1/33 | 12,379 |
| 36,116 | Federal National Mortgage Association, 6.000%, 8/1/34 | 37,378 |
| 11,262 | Federal National Mortgage Association, 6.000%, 9/1/34 | 11,457 |
| 9,642 | Federal National Mortgage Association, 6.000%, 9/1/34 | 9,989 |
| 35,965 | Federal National Mortgage Association, 6.000%, 9/1/34 | 36,317 |
| 1,055 | Federal National Mortgage Association, 6.000%, 9/1/34 | 1,070 |
| 3,490 | Federal National Mortgage Association, 6.000%, 10/1/34 | 3,622 |
| 3,594 | Federal National Mortgage Association, 6.000%, 11/1/34 | 3,730 |
| 31,622 | Federal National Mortgage Association, 6.000%, 11/1/34 | 31,903 |
| 1,174 | Federal National Mortgage Association, 6.000%, 2/1/35 | 1,219 |
| 2,451 | Federal National Mortgage Association, 6.000%, 2/1/35 | 2,544 |
| 52,447 | Federal National Mortgage Association, 6.000%, 4/1/35 | 53,804 |
| 7,977 | Federal National Mortgage Association, 6.000%, 5/1/35 | 8,048 |
| 68,014 | Federal National Mortgage Association, 6.000%, 10/1/35 | 68,650 |
The accompanying notes are an integral part of these financial statements.
66Pioneer Bond Fund | Annual Report | 6/30/23
Principal
Amount
USD ($) | | | | | | Value |
| | U.S. Government and Agency Obligations —
(continued) | |
| 33,437 | Federal National Mortgage Association, 6.000%, 12/1/35 | $ 33,779 |
| 7,439 | Federal National Mortgage Association, 6.000%, 12/1/37 | 7,695 |
| 56,921 | Federal National Mortgage Association, 6.000%, 6/1/38 | 57,957 |
| 6,635 | Federal National Mortgage Association, 6.000%, 7/1/38 | 6,695 |
| 2,494,142 | Federal National Mortgage Association, 6.000%, 1/1/53 | 2,564,821 |
| 804,924 | Federal National Mortgage Association, 6.000%, 1/1/53 | 822,281 |
| 376,596 | Federal National Mortgage Association, 6.000%, 1/1/53 | 383,681 |
| 3,557,342 | Federal National Mortgage Association, 6.000%, 1/1/53 | 3,624,196 |
| 878,564 | Federal National Mortgage Association, 6.000%, 2/1/53 | 888,325 |
| 283,335 | Federal National Mortgage Association, 6.000%, 2/1/53 | 292,508 |
| 605,384 | Federal National Mortgage Association, 6.000%, 3/1/53 | 611,550 |
| 416,810 | Federal National Mortgage Association, 6.000%, 3/1/53 | 421,466 |
| 236,397 | Federal National Mortgage Association, 6.000%, 3/1/53 | 239,454 |
| 400,233 | Federal National Mortgage Association, 6.000%, 3/1/53 | 406,018 |
| 565,843 | Federal National Mortgage Association, 6.000%, 4/1/53 | 571,586 |
| 3,399,764 | Federal National Mortgage Association, 6.000%, 5/1/53 | 3,496,210 |
| 3,355,156 | Federal National Mortgage Association, 6.000%, 5/1/53 | 3,408,717 |
| 365,631 | Federal National Mortgage Association, 6.000%, 6/1/53 | 371,789 |
| 316,223 | Federal National Mortgage Association, 6.000%, 6/1/53 | 322,641 |
| 258,914 | Federal National Mortgage Association, 6.000%, 6/1/53 | 262,573 |
| 289,819 | Federal National Mortgage Association, 6.000%, 6/1/53 | 292,501 |
| 384,000 | Federal National Mortgage Association, 6.000%, 6/1/53 | 387,968 |
The accompanying notes are an integral part of these financial statements.
Pioneer Bond Fund | Annual Report | 6/30/2367
Schedule of Investments | 6/30/23 (continued)
Principal
Amount
USD ($) | | | | | | Value |
| | U.S. Government and Agency Obligations —
(continued) | |
| 750,473 | Federal National Mortgage Association, 6.000%, 6/1/53 | $ 759,945 |
| 1,635,956 | Federal National Mortgage Association, 6.000%, 6/1/53 | 1,673,997 |
| 1,011,823 | Federal National Mortgage Association, 6.000%, 6/1/53 | 1,028,772 |
| 68,800,000 | Federal National Mortgage Association, 6.000%, 7/1/53 (TBA) | 69,407,375 |
| 200,000(g) | Federal National Mortgage Association, 6.000%, 7/1/53 | 203,455 |
| 3,916 | Federal National Mortgage Association, 6.500%, 7/1/29 | 3,999 |
| 273 | Federal National Mortgage Association, 6.500%, 4/1/31 | 279 |
| 1,373 | Federal National Mortgage Association, 6.500%, 5/1/31 | 1,403 |
| 1,855 | Federal National Mortgage Association, 6.500%, 9/1/31 | 1,895 |
| 1,949 | Federal National Mortgage Association, 6.500%, 9/1/31 | 1,994 |
| 494 | Federal National Mortgage Association, 6.500%, 10/1/31 | 504 |
| 52,853 | Federal National Mortgage Association, 6.500%, 12/1/31 | 53,996 |
| 3,226 | Federal National Mortgage Association, 6.500%, 2/1/32 | 3,294 |
| 11,065 | Federal National Mortgage Association, 6.500%, 3/1/32 | 11,299 |
| 20,624 | Federal National Mortgage Association, 6.500%, 7/1/32 | 21,080 |
| 10,353 | Federal National Mortgage Association, 6.500%, 7/1/34 | 10,582 |
| 34,295 | Federal National Mortgage Association, 6.500%, 11/1/37 | 36,183 |
| 8,454 | Federal National Mortgage Association, 6.500%, 11/1/47 | 8,598 |
| 255,056 | Federal National Mortgage Association, 6.500%, 2/1/53 | 263,009 |
| 2,000,248 | Federal National Mortgage Association, 6.500%, 3/1/53 | 2,069,381 |
| 393,905 | Federal National Mortgage Association, 6.500%, 3/1/53 | 406,987 |
| 1,924,046 | Federal National Mortgage Association, 6.500%, 3/1/53 | 1,967,684 |
The accompanying notes are an integral part of these financial statements.
68Pioneer Bond Fund | Annual Report | 6/30/23
Principal
Amount
USD ($) | | | | | | Value |
| | U.S. Government and Agency Obligations —
(continued) | |
| 265,928 | Federal National Mortgage Association, 6.500%, 4/1/53 | $ 273,682 |
| 342,640 | Federal National Mortgage Association, 6.500%, 4/1/53 | 356,918 |
| 389,271 | Federal National Mortgage Association, 6.500%, 4/1/53 | 400,109 |
| 5 | Federal National Mortgage Association, 7.000%, 12/1/30 | 5 |
| 2,588 | Federal National Mortgage Association, 7.000%, 12/1/30 | 2,578 |
| 1,817 | Federal National Mortgage Association, 7.000%, 4/1/31 | 1,855 |
| 2,879 | Federal National Mortgage Association, 7.000%, 9/1/31 | 2,963 |
| 10,492 | Federal National Mortgage Association, 7.000%, 12/1/31 | 10,376 |
| 7,171 | Federal National Mortgage Association, 7.000%, 1/1/32 | 7,412 |
| 2,000,000 | Government National Mortgage Association, 3.000%, 7/20/53 (TBA) | 1,786,953 |
| 1,000,000 | Government National Mortgage Association, 3.000%, 8/20/53 (TBA) | 894,258 |
| 7,000,000 | Government National Mortgage Association, 5.000%, 7/20/53 (TBA) | 6,878,594 |
| 17,000,000 | Government National Mortgage Association, 5.500%, 7/20/53 (TBA) | 16,920,312 |
| 24,000,000 | Government National Mortgage Association, 6.000%, 7/20/53 (TBA) | 24,159,375 |
| 2,293,205 | Government National Mortgage Association I, 3.500%, 11/15/41 | 2,162,953 |
| 1,619,574 | Government National Mortgage Association I, 3.500%, 7/15/42 | 1,527,969 |
| 299,368 | Government National Mortgage Association I, 3.500%, 10/15/42 | 282,356 |
| 490,141 | Government National Mortgage Association I, 3.500%, 1/15/44 | 462,281 |
| 1,677,831 | Government National Mortgage Association I, 3.500%, 1/15/45 | 1,582,491 |
| 568,155 | Government National Mortgage Association I, 3.500%, 8/15/46 | 531,912 |
| 6,135 | Government National Mortgage Association I, 4.000%, 5/15/39 | 5,917 |
| 985 | Government National Mortgage Association I, 4.000%, 6/15/39 | 958 |
The accompanying notes are an integral part of these financial statements.
Pioneer Bond Fund | Annual Report | 6/30/2369
Schedule of Investments | 6/30/23 (continued)
Principal
Amount
USD ($) | | | | | | Value |
| | U.S. Government and Agency Obligations —
(continued) | |
| 1,447 | Government National Mortgage Association I, 4.000%, 8/15/40 | $ 1,400 |
| 119,039 | Government National Mortgage Association I, 4.000%, 8/15/40 | 115,801 |
| 1,705 | Government National Mortgage Association I, 4.000%, 9/15/40 | 1,650 |
| 1,756 | Government National Mortgage Association I, 4.000%, 10/15/40 | 1,709 |
| 7,126 | Government National Mortgage Association I, 4.000%, 11/15/40 | 6,862 |
| 15,223 | Government National Mortgage Association I, 4.000%, 11/15/40 | 14,809 |
| 4,672 | Government National Mortgage Association I, 4.000%, 1/15/41 | 4,522 |
| 18,128 | Government National Mortgage Association I, 4.000%, 1/15/41 | 17,635 |
| 2,661 | Government National Mortgage Association I, 4.000%, 2/15/41 | 2,589 |
| 23,312 | Government National Mortgage Association I, 4.000%, 6/15/41 | 22,677 |
| 37,055 | Government National Mortgage Association I, 4.000%, 7/15/41 | 35,865 |
| 88,439 | Government National Mortgage Association I, 4.000%, 9/15/41 | 85,596 |
| 1,798 | Government National Mortgage Association I, 4.000%, 10/15/41 | 1,725 |
| 4,693 | Government National Mortgage Association I, 4.000%, 10/15/41 | 4,526 |
| 1,177 | Government National Mortgage Association I, 4.000%, 11/15/41 | 1,133 |
| 1,112 | Government National Mortgage Association I, 4.000%, 11/15/41 | 1,071 |
| 1,365 | Government National Mortgage Association I, 4.000%, 12/15/41 | 1,322 |
| 12,133 | Government National Mortgage Association I, 4.000%, 2/15/42 | 11,743 |
| 238,413 | Government National Mortgage Association I, 4.000%, 8/15/43 | 230,747 |
| 3,293 | Government National Mortgage Association I, 4.000%, 11/15/43 | 3,213 |
| 176,478 | Government National Mortgage Association I, 4.000%, 3/15/44 | 170,869 |
| 709,945 | Government National Mortgage Association I, 4.000%, 3/15/44 | 687,356 |
The accompanying notes are an integral part of these financial statements.
70Pioneer Bond Fund | Annual Report | 6/30/23
Principal
Amount
USD ($) | | | | | | Value |
| | U.S. Government and Agency Obligations —
(continued) | |
| 21,366 | Government National Mortgage Association I, 4.000%, 3/15/44 | $ 20,784 |
| 2,842 | Government National Mortgage Association I, 4.000%, 3/15/44 | 2,765 |
| 466,368 | Government National Mortgage Association I, 4.000%, 4/15/44 | 449,064 |
| 2,904 | Government National Mortgage Association I, 4.000%, 4/15/44 | 2,801 |
| 4,826 | Government National Mortgage Association I, 4.000%, 4/15/44 | 4,673 |
| 55,393 | Government National Mortgage Association I, 4.000%, 8/15/44 | 53,886 |
| 538,574 | Government National Mortgage Association I, 4.000%, 9/15/44 | 521,249 |
| 36,046 | Government National Mortgage Association I, 4.000%, 9/15/44 | 34,618 |
| 53,158 | Government National Mortgage Association I, 4.000%, 9/15/44 | 51,554 |
| 98,668 | Government National Mortgage Association I, 4.000%, 11/15/44 | 95,493 |
| 293,542 | Government National Mortgage Association I, 4.000%, 12/15/44 | 282,952 |
| 157,837 | Government National Mortgage Association I, 4.000%, 1/15/45 | 153,589 |
| 343,742 | Government National Mortgage Association I, 4.000%, 1/15/45 | 329,263 |
| 122,437 | Government National Mortgage Association I, 4.000%, 1/15/45 | 117,591 |
| 352,561 | Government National Mortgage Association I, 4.000%, 2/15/45 | 341,919 |
| 310,240 | Government National Mortgage Association I, 4.000%, 2/15/45 | 300,871 |
| 797,213 | Government National Mortgage Association I, 4.000%, 3/15/45 | 773,139 |
| 681,484 | Government National Mortgage Association I, 4.000%, 4/15/45 | 659,562 |
| 782,240 | Government National Mortgage Association I, 4.000%, 5/15/45 | 753,204 |
| 995,327 | Government National Mortgage Association I, 4.000%, 6/15/45 | 968,684 |
| 135,206 | Government National Mortgage Association I, 4.000%, 7/15/45 | 131,524 |
| 204,231 | Government National Mortgage Association I, 4.000%, 8/15/45 | 197,660 |
The accompanying notes are an integral part of these financial statements.
Pioneer Bond Fund | Annual Report | 6/30/2371
Schedule of Investments | 6/30/23 (continued)
Principal
Amount
USD ($) | | | | | | Value |
| | U.S. Government and Agency Obligations —
(continued) | |
| 23,882 | Government National Mortgage Association I, 4.500%, 6/15/25 | $ 23,426 |
| 15,196 | Government National Mortgage Association I, 4.500%, 7/15/33 | 14,891 |
| 39,301 | Government National Mortgage Association I, 4.500%, 9/15/33 | 38,607 |
| 65,415 | Government National Mortgage Association I, 4.500%, 10/15/33 | 64,026 |
| 44,802 | Government National Mortgage Association I, 4.500%, 10/15/33 | 43,746 |
| 3,174 | Government National Mortgage Association I, 4.500%, 2/15/34 | 3,102 |
| 1,678 | Government National Mortgage Association I, 4.500%, 3/15/35 | 1,636 |
| 48,288 | Government National Mortgage Association I, 4.500%, 4/15/35 | 47,152 |
| 22,346 | Government National Mortgage Association I, 4.500%, 10/15/35 | 21,837 |
| 26,650 | Government National Mortgage Association I, 4.500%, 4/15/38 | 26,145 |
| 239,449 | Government National Mortgage Association I, 4.500%, 12/15/39 | 235,417 |
| 101,295 | Government National Mortgage Association I, 4.500%, 1/15/40 | 99,974 |
| 58,468 | Government National Mortgage Association I, 4.500%, 9/15/40 | 57,754 |
| 158,625 | Government National Mortgage Association I, 4.500%, 10/15/40 | 156,540 |
| 99,246 | Government National Mortgage Association I, 4.500%, 4/15/41 | 97,367 |
| 215,353 | Government National Mortgage Association I, 4.500%, 5/15/41 | 210,749 |
| 129,740 | Government National Mortgage Association I, 4.500%, 6/15/41 | 126,855 |
| 99,551 | Government National Mortgage Association I, 4.500%, 7/15/41 | 98,058 |
| 80,815 | Government National Mortgage Association I, 4.500%, 8/15/41 | 79,044 |
| 23,860 | Government National Mortgage Association I, 5.000%, 7/15/33 | 23,920 |
| 20,254 | Government National Mortgage Association I, 5.000%, 9/15/33 | 20,463 |
| 22,247 | Government National Mortgage Association I, 5.000%, 4/15/34 | 22,474 |
The accompanying notes are an integral part of these financial statements.
72Pioneer Bond Fund | Annual Report | 6/30/23
Principal
Amount
USD ($) | | | | | | Value |
| | U.S. Government and Agency Obligations —
(continued) | |
| 134,901 | Government National Mortgage Association I, 5.000%, 4/15/35 | $ 136,288 |
| 48,045 | Government National Mortgage Association I, 5.000%, 7/15/40 | 48,156 |
| 26,565 | Government National Mortgage Association I, 5.500%, 1/15/29 | 26,667 |
| 3,285 | Government National Mortgage Association I, 5.500%, 6/15/33 | 3,300 |
| 19,430 | Government National Mortgage Association I, 5.500%, 7/15/33 | 19,690 |
| 9,748 | Government National Mortgage Association I, 5.500%, 7/15/33 | 9,790 |
| 6,201 | Government National Mortgage Association I, 5.500%, 8/15/33 | 6,295 |
| 14,265 | Government National Mortgage Association I, 5.500%, 8/15/33 | 14,388 |
| 9,386 | Government National Mortgage Association I, 5.500%, 8/15/33 | 9,527 |
| 19,868 | Government National Mortgage Association I, 5.500%, 9/15/33 | 19,947 |
| 22,960 | Government National Mortgage Association I, 5.500%, 9/15/33 | 23,060 |
| 9,735 | Government National Mortgage Association I, 5.500%, 10/15/33 | 9,772 |
| 18,100 | Government National Mortgage Association I, 5.500%, 10/15/33 | 18,392 |
| 90,262 | Government National Mortgage Association I, 5.500%, 7/15/34 | 92,003 |
| 13,892 | Government National Mortgage Association I, 5.500%, 10/15/34 | 13,982 |
| 117,957 | Government National Mortgage Association I, 5.500%, 11/15/34 | 120,628 |
| 56,767 | Government National Mortgage Association I, 5.500%, 1/15/35 | 57,550 |
| 8,203 | Government National Mortgage Association I, 5.500%, 2/15/35 | 8,239 |
| 29,146 | Government National Mortgage Association I, 5.500%, 2/15/35 | 29,264 |
| 24,102 | Government National Mortgage Association I, 5.500%, 6/15/35 | 24,194 |
| 103,460 | Government National Mortgage Association I, 5.500%, 7/15/35 | 105,884 |
| 10,014 | Government National Mortgage Association I, 5.500%, 10/15/35 | 10,102 |
The accompanying notes are an integral part of these financial statements.
Pioneer Bond Fund | Annual Report | 6/30/2373
Schedule of Investments | 6/30/23 (continued)
Principal
Amount
USD ($) | | | | | | Value |
| | U.S. Government and Agency Obligations —
(continued) | |
| 42,367 | Government National Mortgage Association I, 5.500%, 10/15/35 | $ 42,943 |
| 11,570 | Government National Mortgage Association I, 5.500%, 2/15/37 | 11,840 |
| 3,499 | Government National Mortgage Association I, 6.000%, 12/15/23 | 3,494 |
| 467 | Government National Mortgage Association I, 6.000%, 1/15/24 | 472 |
| 7,678 | Government National Mortgage Association I, 6.000%, 4/15/28 | 7,915 |
| 41,060 | Government National Mortgage Association I, 6.000%, 9/15/28 | 41,534 |
| 1,502 | Government National Mortgage Association I, 6.000%, 10/15/28 | 1,518 |
| 11,946 | Government National Mortgage Association I, 6.000%, 2/15/29 | 12,081 |
| 11,764 | Government National Mortgage Association I, 6.000%, 2/15/29 | 11,952 |
| 4,759 | Government National Mortgage Association I, 6.000%, 11/15/31 | 4,851 |
| 383 | Government National Mortgage Association I, 6.000%, 3/15/32 | 391 |
| 1,661 | Government National Mortgage Association I, 6.000%, 8/15/32 | 1,717 |
| 3,441 | Government National Mortgage Association I, 6.000%, 9/15/32 | 3,479 |
| 62,636 | Government National Mortgage Association I, 6.000%, 9/15/32 | 63,327 |
| 49,935 | Government National Mortgage Association I, 6.000%, 9/15/32 | 50,485 |
| 4,420 | Government National Mortgage Association I, 6.000%, 10/15/32 | 4,469 |
| 5,531 | Government National Mortgage Association I, 6.000%, 10/15/32 | 5,592 |
| 3,230 | Government National Mortgage Association I, 6.000%, 11/15/32 | 3,266 |
| 2,806 | Government National Mortgage Association I, 6.000%, 11/15/32 | 2,837 |
| 108,977 | Government National Mortgage Association I, 6.000%, 12/15/32 | 110,263 |
| 2,182 | Government National Mortgage Association I, 6.000%, 12/15/32 | 2,206 |
| 68,682 | Government National Mortgage Association I, 6.000%, 12/15/32 | 69,574 |
The accompanying notes are an integral part of these financial statements.
74Pioneer Bond Fund | Annual Report | 6/30/23
Principal
Amount
USD ($) | | | | | | Value |
| | U.S. Government and Agency Obligations —
(continued) | |
| 24,031 | Government National Mortgage Association I, 6.000%, 12/15/32 | $ 24,323 |
| 4,701 | Government National Mortgage Association I, 6.000%, 12/15/32 | 4,767 |
| 26,688 | Government National Mortgage Association I, 6.000%, 12/15/32 | 26,983 |
| 69,988 | Government National Mortgage Association I, 6.000%, 12/15/32 | 70,760 |
| 50,390 | Government National Mortgage Association I, 6.000%, 1/15/33 | 52,655 |
| 13,161 | Government National Mortgage Association I, 6.000%, 1/15/33 | 13,321 |
| 30,860 | Government National Mortgage Association I, 6.000%, 2/15/33 | 31,477 |
| 42,145 | Government National Mortgage Association I, 6.000%, 2/15/33 | 42,740 |
| 37,213 | Government National Mortgage Association I, 6.000%, 2/15/33 | 37,662 |
| 8,614 | Government National Mortgage Association I, 6.000%, 2/15/33 | 8,909 |
| 37,129 | Government National Mortgage Association I, 6.000%, 3/15/33 | 38,804 |
| 36,873 | Government National Mortgage Association I, 6.000%, 3/15/33 | 38,530 |
| 19,515 | Government National Mortgage Association I, 6.000%, 3/15/33 | 19,965 |
| 33,874 | Government National Mortgage Association I, 6.000%, 3/15/33 | 34,248 |
| 8,788 | Government National Mortgage Association I, 6.000%, 3/15/33 | 8,885 |
| 41,455 | Government National Mortgage Association I, 6.000%, 3/15/33 | 42,519 |
| 162,958 | Government National Mortgage Association I, 6.000%, 3/15/33 | 167,056 |
| 69,147 | Government National Mortgage Association I, 6.000%, 3/15/33 | 72,255 |
| 288 | Government National Mortgage Association I, 6.000%, 4/15/33 | 291 |
| 13,374 | Government National Mortgage Association I, 6.000%, 4/15/33 | 13,521 |
| 43,249 | Government National Mortgage Association I, 6.000%, 5/15/33 | 43,771 |
| 3,574 | Government National Mortgage Association I, 6.000%, 6/15/33 | 3,679 |
The accompanying notes are an integral part of these financial statements.
Pioneer Bond Fund | Annual Report | 6/30/2375
Schedule of Investments | 6/30/23 (continued)
Principal
Amount
USD ($) | | | | | | Value |
| | U.S. Government and Agency Obligations —
(continued) | |
| 18,288 | Government National Mortgage Association I, 6.000%, 9/15/33 | $ 18,858 |
| 171 | Government National Mortgage Association I, 6.000%, 9/15/33 | 173 |
| 9,795 | Government National Mortgage Association I, 6.000%, 10/15/33 | 9,908 |
| 34,841 | Government National Mortgage Association I, 6.000%, 11/15/33 | 35,225 |
| 73,593 | Government National Mortgage Association I, 6.000%, 3/15/34 | 75,156 |
| 15,948 | Government National Mortgage Association I, 6.000%, 6/15/34 | 16,445 |
| 9,265 | Government National Mortgage Association I, 6.000%, 8/15/34 | 9,635 |
| 34,893 | Government National Mortgage Association I, 6.000%, 8/15/34 | 35,278 |
| 4,070 | Government National Mortgage Association I, 6.000%, 9/15/34 | 4,118 |
| 29,156 | Government National Mortgage Association I, 6.000%, 9/15/34 | 29,508 |
| 45,850 | Government National Mortgage Association I, 6.000%, 9/15/34 | 47,512 |
| 34,881 | Government National Mortgage Association I, 6.000%, 10/15/34 | 35,266 |
| 33,134 | Government National Mortgage Association I, 6.000%, 10/15/34 | 33,556 |
| 37,273 | Government National Mortgage Association I, 6.000%, 10/15/34 | 37,724 |
| 45,748 | Government National Mortgage Association I, 6.000%, 11/15/34 | 46,587 |
| 178,767 | Government National Mortgage Association I, 6.000%, 9/15/35 | 182,845 |
| 63,049 | Government National Mortgage Association I, 6.000%, 8/15/36 | 65,880 |
| 28,233 | Government National Mortgage Association I, 6.000%, 10/15/36 | 28,789 |
| 14,503 | Government National Mortgage Association I, 6.000%, 11/15/37 | 15,083 |
| 11,565 | Government National Mortgage Association I, 6.000%, 8/15/38 | 11,739 |
| 663 | Government National Mortgage Association I, 6.500%, 10/15/24 | 658 |
| 2,657 | Government National Mortgage Association I, 6.500%, 4/15/28 | 2,709 |
The accompanying notes are an integral part of these financial statements.
76Pioneer Bond Fund | Annual Report | 6/30/23
Principal
Amount
USD ($) | | | | | | Value |
| | U.S. Government and Agency Obligations —
(continued) | |
| 18,474 | Government National Mortgage Association I, 6.500%, 4/15/28 | $ 19,043 |
| 2,121 | Government National Mortgage Association I, 6.500%, 6/15/28 | 2,163 |
| 1,871 | Government National Mortgage Association I, 6.500%, 8/15/28 | 1,907 |
| 1,714 | Government National Mortgage Association I, 6.500%, 10/15/28 | 1,747 |
| 1,114 | Government National Mortgage Association I, 6.500%, 10/15/28 | 1,136 |
| 10,667 | Government National Mortgage Association I, 6.500%, 1/15/29 | 10,875 |
| 1,978 | Government National Mortgage Association I, 6.500%, 2/15/29 | 2,016 |
| 3,048 | Government National Mortgage Association I, 6.500%, 2/15/29 | 3,108 |
| 398 | Government National Mortgage Association I, 6.500%, 2/15/29 | 406 |
| 936 | Government National Mortgage Association I, 6.500%, 3/15/29 | 955 |
| 923 | Government National Mortgage Association I, 6.500%, 3/15/29 | 941 |
| 3,999 | Government National Mortgage Association I, 6.500%, 3/15/29 | 4,077 |
| 11,857 | Government National Mortgage Association I, 6.500%, 3/15/29 | 12,089 |
| 7,753 | Government National Mortgage Association I, 6.500%, 3/15/29 | 7,905 |
| 14,675 | Government National Mortgage Association I, 6.500%, 5/15/29 | 14,961 |
| 488 | Government National Mortgage Association I, 6.500%, 5/15/29 | 497 |
| 424 | Government National Mortgage Association I, 6.500%, 5/15/29 | 432 |
| 15,047 | Government National Mortgage Association I, 6.500%, 4/15/31 | 15,348 |
| 4,156 | Government National Mortgage Association I, 6.500%, 5/15/31 | 4,287 |
| 26,008 | Government National Mortgage Association I, 6.500%, 5/15/31 | 26,524 |
| 4,575 | Government National Mortgage Association I, 6.500%, 5/15/31 | 4,674 |
| 2,697 | Government National Mortgage Association I, 6.500%, 6/15/31 | 2,751 |
The accompanying notes are an integral part of these financial statements.
Pioneer Bond Fund | Annual Report | 6/30/2377
Schedule of Investments | 6/30/23 (continued)
Principal
Amount
USD ($) | | | | | | Value |
| | U.S. Government and Agency Obligations —
(continued) | |
| 8,869 | Government National Mortgage Association I, 6.500%, 7/15/31 | $ 9,042 |
| 17,322 | Government National Mortgage Association I, 6.500%, 8/15/31 | 17,660 |
| 4,981 | Government National Mortgage Association I, 6.500%, 9/15/31 | 5,078 |
| 23,660 | Government National Mortgage Association I, 6.500%, 10/15/31 | 24,122 |
| 2,276 | Government National Mortgage Association I, 6.500%, 10/15/31 | 2,321 |
| 1,914 | Government National Mortgage Association I, 6.500%, 11/15/31 | 1,951 |
| 30,337 | Government National Mortgage Association I, 6.500%, 11/15/31 | 31,595 |
| 39,055 | Government National Mortgage Association I, 6.500%, 1/15/32 | 39,816 |
| 8,803 | Government National Mortgage Association I, 6.500%, 1/15/32 | 8,974 |
| 6,567 | Government National Mortgage Association I, 6.500%, 2/15/32 | 6,739 |
| 9,709 | Government National Mortgage Association I, 6.500%, 2/15/32 | 9,982 |
| 2,190 | Government National Mortgage Association I, 6.500%, 2/15/32 | 2,233 |
| 5,710 | Government National Mortgage Association I, 6.500%, 2/15/32 | 5,824 |
| 13,873 | Government National Mortgage Association I, 6.500%, 2/15/32 | 14,144 |
| 6,458 | Government National Mortgage Association I, 6.500%, 3/15/32 | 6,584 |
| 15,334 | Government National Mortgage Association I, 6.500%, 3/15/32 | 15,633 |
| 3,076 | Government National Mortgage Association I, 6.500%, 4/15/32 | 3,136 |
| 3,401 | Government National Mortgage Association I, 6.500%, 4/15/32 | 3,467 |
| 14,651 | Government National Mortgage Association I, 6.500%, 4/15/32 | 14,943 |
| 1,661 | Government National Mortgage Association I, 6.500%, 5/15/32 | 1,693 |
| 1,848 | Government National Mortgage Association I, 6.500%, 5/15/32 | 1,884 |
| 3,666 | Government National Mortgage Association I, 6.500%, 5/15/32 | 3,743 |
The accompanying notes are an integral part of these financial statements.
78Pioneer Bond Fund | Annual Report | 6/30/23
Principal
Amount
USD ($) | | | | | | Value |
| | U.S. Government and Agency Obligations —
(continued) | |
| 995 | Government National Mortgage Association I, 6.500%, 5/15/32 | $ 1,014 |
| 4,896 | Government National Mortgage Association I, 6.500%, 6/15/32 | 5,003 |
| 4,928 | Government National Mortgage Association I, 6.500%, 7/15/32 | 5,024 |
| 39,892 | Government National Mortgage Association I, 6.500%, 7/15/32 | 40,671 |
| 5,568 | Government National Mortgage Association I, 6.500%, 7/15/32 | 5,677 |
| 13,260 | Government National Mortgage Association I, 6.500%, 8/15/32 | 13,632 |
| 23,554 | Government National Mortgage Association I, 6.500%, 8/15/32 | 24,049 |
| 2,718 | Government National Mortgage Association I, 6.500%, 8/15/32 | 2,771 |
| 18,549 | Government National Mortgage Association I, 6.500%, 9/15/32 | 18,911 |
| 8,669 | Government National Mortgage Association I, 6.500%, 9/15/32 | 8,838 |
| 26,144 | Government National Mortgage Association I, 6.500%, 9/15/32 | 26,654 |
| 12,969 | Government National Mortgage Association I, 6.500%, 10/15/32 | 13,222 |
| 17,153 | Government National Mortgage Association I, 6.500%, 11/15/32 | 17,546 |
| 89,374 | Government National Mortgage Association I, 6.500%, 12/15/32 | 91,275 |
| 98,267 | Government National Mortgage Association I, 6.500%, 1/15/33 | 101,460 |
| 993 | Government National Mortgage Association I, 6.500%, 1/15/33 | 1,012 |
| 14,227 | Government National Mortgage Association I, 6.500%, 5/15/33 | 14,505 |
| 622 | Government National Mortgage Association I, 6.500%, 10/15/33 | 634 |
| 42,819 | Government National Mortgage Association I, 6.500%, 6/15/34 | 43,655 |
| 10,267 | Government National Mortgage Association I, 6.500%, 4/15/35 | 10,468 |
| 3,625 | Government National Mortgage Association I, 6.500%, 6/15/35 | 3,805 |
| 13,883 | Government National Mortgage Association I, 6.500%, 7/15/35 | 14,442 |
The accompanying notes are an integral part of these financial statements.
Pioneer Bond Fund | Annual Report | 6/30/2379
Schedule of Investments | 6/30/23 (continued)
Principal
Amount
USD ($) | | | | | | Value |
| | U.S. Government and Agency Obligations —
(continued) | |
| 50,541 | Government National Mortgage Association I, 6.500%, 7/15/35 | $ 51,527 |
| 30 | Government National Mortgage Association I, 7.000%, 8/15/23 | 30 |
| 2,507 | Government National Mortgage Association I, 7.000%, 9/15/24 | 2,503 |
| 561 | Government National Mortgage Association I, 7.000%, 7/15/25 | 560 |
| 1,089 | Government National Mortgage Association I, 7.000%, 11/15/26 | 1,091 |
| 2,575 | Government National Mortgage Association I, 7.000%, 6/15/27 | 2,593 |
| 3,826 | Government National Mortgage Association I, 7.000%, 1/15/28 | 3,831 |
| 2,556 | Government National Mortgage Association I, 7.000%, 4/15/28 | 2,534 |
| 4,395 | Government National Mortgage Association I, 7.000%, 7/15/28 | 4,405 |
| 328 | Government National Mortgage Association I, 7.000%, 8/15/28 | 332 |
| 3,643 | Government National Mortgage Association I, 7.000%, 11/15/28 | 3,719 |
| 12,193 | Government National Mortgage Association I, 7.000%, 11/15/28 | 12,397 |
| 12,990 | Government National Mortgage Association I, 7.000%, 4/15/29 | 12,888 |
| 10,026 | Government National Mortgage Association I, 7.000%, 4/15/29 | 9,999 |
| 13,777 | Government National Mortgage Association I, 7.000%, 5/15/29 | 13,658 |
| 2,599 | Government National Mortgage Association I, 7.000%, 7/15/29 | 2,597 |
| 24,462 | Government National Mortgage Association I, 7.000%, 11/15/29 | 24,574 |
| 9,490 | Government National Mortgage Association I, 7.000%, 12/15/30 | 9,765 |
| 1,156 | Government National Mortgage Association I, 7.000%, 12/15/30 | 1,145 |
| 29,019 | Government National Mortgage Association I, 7.000%, 1/15/31 | 28,731 |
| 7,906 | Government National Mortgage Association I, 7.000%, 6/15/31 | 8,222 |
| 994 | Government National Mortgage Association I, 7.000%, 7/15/31 | 1,030 |
The accompanying notes are an integral part of these financial statements.
80Pioneer Bond Fund | Annual Report | 6/30/23
Principal
Amount
USD ($) | | | | | | Value |
| | U.S. Government and Agency Obligations —
(continued) | |
| 47,872 | Government National Mortgage Association I, 7.000%, 8/15/31 | $ 49,484 |
| 6,552 | Government National Mortgage Association I, 7.000%, 9/15/31 | 6,504 |
| 6,184 | Government National Mortgage Association I, 7.000%, 9/15/31 | 6,134 |
| 5,631 | Government National Mortgage Association I, 7.000%, 11/15/31 | 5,590 |
| 26,457 | Government National Mortgage Association I, 7.000%, 3/15/32 | 26,689 |
| 18,138 | Government National Mortgage Association I, 7.000%, 4/15/32 | 18,267 |
| 35,872 | Government National Mortgage Association I, 7.000%, 5/15/32 | 37,427 |
| 485 | Government National Mortgage Association I, 7.500%, 10/15/23 | 484 |
| 187 | Government National Mortgage Association I, 7.500%, 6/15/24 | 187 |
| 2,170 | Government National Mortgage Association I, 7.500%, 8/15/25 | 2,167 |
| 572 | Government National Mortgage Association I, 7.500%, 9/15/25 | 572 |
| 2,016 | Government National Mortgage Association I, 7.500%, 2/15/27 | 2,012 |
| 7,186 | Government National Mortgage Association I, 7.500%, 3/15/27 | 7,273 |
| 15,322 | Government National Mortgage Association I, 7.500%, 10/15/27 | 15,445 |
| 7,833 | Government National Mortgage Association I, 7.500%, 6/15/29 | 7,929 |
| 3,113 | Government National Mortgage Association I, 7.500%, 8/15/29 | 3,109 |
| 5,076 | Government National Mortgage Association I, 7.500%, 9/15/29 | 5,069 |
| 10,876 | Government National Mortgage Association I, 7.500%, 2/15/31 | 10,878 |
| 9,806 | Government National Mortgage Association I, 7.500%, 2/15/31 | 9,793 |
| 4,069 | Government National Mortgage Association I, 7.500%, 3/15/31 | 4,067 |
| 5,783 | Government National Mortgage Association I, 7.500%, 12/15/31 | 5,785 |
| 1,436 | Government National Mortgage Association I, 7.750%, 2/15/30 | 1,434 |
The accompanying notes are an integral part of these financial statements.
Pioneer Bond Fund | Annual Report | 6/30/2381
Schedule of Investments | 6/30/23 (continued)
Principal
Amount
USD ($) | | | | | | Value |
| | U.S. Government and Agency Obligations —
(continued) | |
| 18,072,065 | Government National Mortgage Association II, 3.000%, 5/20/52 | $ 16,160,778 |
| 113,545 | Government National Mortgage Association II, 3.500%, 3/20/45 | 102,595 |
| 225,438 | Government National Mortgage Association II, 3.500%, 4/20/45 | 211,191 |
| 436,750 | Government National Mortgage Association II, 3.500%, 4/20/45 | 409,155 |
| 165,025 | Government National Mortgage Association II, 3.500%, 4/20/45 | 154,600 |
| 524,153 | Government National Mortgage Association II, 3.500%, 3/20/46 | 491,039 |
| 15,433,561 | Government National Mortgage Association II, 3.500%, 9/20/52 | 14,242,598 |
| 9,801,028 | Government National Mortgage Association II, 3.500%, 11/20/52 | 9,044,719 |
| 1,709,634 | Government National Mortgage Association II, 4.000%, 7/20/44 | 1,659,955 |
| 67,751 | Government National Mortgage Association II, 4.000%, 9/20/44 | 65,812 |
| 412,730 | Government National Mortgage Association II, 4.000%, 10/20/44 | 400,104 |
| 1,240,435 | Government National Mortgage Association II, 4.000%, 10/20/46 | 1,192,939 |
| 742,611 | Government National Mortgage Association II, 4.000%, 2/20/48 | 706,735 |
| 1,000,838 | Government National Mortgage Association II, 4.000%, 4/20/48 | 952,484 |
| 9,454,698 | Government National Mortgage Association II, 4.000%, 9/20/52 | 8,945,548 |
| 16,935 | Government National Mortgage Association II, 4.500%, 12/20/34 | 16,817 |
| 88,236 | Government National Mortgage Association II, 4.500%, 1/20/35 | 87,621 |
| 13,574 | Government National Mortgage Association II, 4.500%, 3/20/35 | 13,480 |
| 330,793 | Government National Mortgage Association II, 4.500%, 9/20/41 | 328,484 |
| 1,191,997 | Government National Mortgage Association II, 4.500%, 9/20/44 | 1,181,904 |
| 441,611 | Government National Mortgage Association II, 4.500%, 10/20/44 | 437,709 |
| 867,903 | Government National Mortgage Association II, 4.500%, 11/20/44 | 860,242 |
The accompanying notes are an integral part of these financial statements.
82Pioneer Bond Fund | Annual Report | 6/30/23
Principal
Amount
USD ($) | | | | | | Value |
| | U.S. Government and Agency Obligations —
(continued) | |
| 957,210 | Government National Mortgage Association II, 4.500%, 2/20/48 | $ 937,738 |
| 9,428,561 | Government National Mortgage Association II, 4.500%, 9/20/52 | 9,103,418 |
| 5,865,197 | Government National Mortgage Association II, 4.500%, 10/20/52 | 5,662,938 |
| 16,682,741 | Government National Mortgage Association II, 5.000%, 12/20/52 | 16,409,801 |
| 59,054 | Government National Mortgage Association II, 5.500%, 3/20/34 | 60,388 |
| 47,502 | Government National Mortgage Association II, 5.500%, 4/20/34 | 48,691 |
| 35,220 | Government National Mortgage Association II, 5.500%, 10/20/37 | 35,106 |
| 4,911,522 | Government National Mortgage Association II, 5.500%, 12/20/52 | 4,891,456 |
| 49,371 | Government National Mortgage Association II, 5.750%, 6/20/33 | 49,435 |
| 12,902 | Government National Mortgage Association II, 5.900%, 1/20/28 | 12,962 |
| 22,538 | Government National Mortgage Association II, 5.900%, 7/20/28 | 22,478 |
| 5,550 | Government National Mortgage Association II, 6.000%, 10/20/31 | 5,730 |
| 27,023 | Government National Mortgage Association II, 6.000%, 1/20/33 | 27,739 |
| 30,428 | Government National Mortgage Association II, 6.000%, 10/20/33 | 31,831 |
| 18,309 | Government National Mortgage Association II, 6.000%, 6/20/34 | 19,157 |
| 45,394 | Government National Mortgage Association II, 6.450%, 1/20/33 | 45,457 |
| 214 | Government National Mortgage Association II, 6.500%, 1/20/24 | 213 |
| 10,318 | Government National Mortgage Association II, 6.500%, 8/20/28 | 10,499 |
| 500 | Government National Mortgage Association II, 6.500%, 2/20/29 | 510 |
| 194 | Government National Mortgage Association II, 6.500%, 3/20/29 | 196 |
| 6,577 | Government National Mortgage Association II, 6.500%, 4/20/29 | 6,725 |
| 3,637 | Government National Mortgage Association II, 6.500%, 4/20/31 | 3,773 |
The accompanying notes are an integral part of these financial statements.
Pioneer Bond Fund | Annual Report | 6/30/2383
Schedule of Investments | 6/30/23 (continued)
Principal
Amount
USD ($) | | | | | | Value |
| | U.S. Government and Agency Obligations —
(continued) | |
| 2,727 | Government National Mortgage Association II, 6.500%, 6/20/31 | $ 2,829 |
| 12,931 | Government National Mortgage Association II, 6.500%, 10/20/32 | 13,201 |
| 16,072 | Government National Mortgage Association II, 6.500%, 3/20/34 | 16,433 |
| 1,243 | Government National Mortgage Association II, 7.000%, 5/20/26 | 1,243 |
| 5,015 | Government National Mortgage Association II, 7.000%, 8/20/27 | 5,079 |
| 4,457 | Government National Mortgage Association II, 7.000%, 6/20/28 | 4,487 |
| 19,682 | Government National Mortgage Association II, 7.000%, 11/20/28 | 19,812 |
| 17,764 | Government National Mortgage Association II, 7.000%, 1/20/29 | 18,067 |
| 1,639 | Government National Mortgage Association II, 7.000%, 2/20/29 | 1,660 |
| 596 | Government National Mortgage Association II, 7.000%, 12/20/30 | 602 |
| 3,128 | Government National Mortgage Association II, 7.000%, 1/20/31 | 3,228 |
| 1,725 | Government National Mortgage Association II, 7.000%, 3/20/31 | 1,762 |
| 10,494 | Government National Mortgage Association II, 7.000%, 7/20/31 | 10,913 |
| 3,451 | Government National Mortgage Association II, 7.000%, 11/20/31 | 3,530 |
| 3,629 | Government National Mortgage Association II, 7.500%, 5/20/30 | 3,749 |
| 976 | Government National Mortgage Association II, 7.500%, 6/20/30 | 997 |
| 890 | Government National Mortgage Association II, 7.500%, 7/20/30 | 897 |
| 3,889 | Government National Mortgage Association II, 7.500%, 8/20/30 | 4,020 |
| 1,723 | Government National Mortgage Association II, 7.500%, 12/20/30 | 1,774 |
| 3 | Government National Mortgage Association II, 8.000%, 5/20/25 | 3 |
| 308 | Government National Mortgage Association II, 9.000%, 11/20/24 | 308 |
| 180,000,000 | U.S. Treasury Bonds, 2.250%, 2/15/52 | 130,078,125 |
| 180,000,000 | U.S. Treasury Bonds, 2.875%, 5/15/52 | 149,167,969 |
The accompanying notes are an integral part of these financial statements.
84Pioneer Bond Fund | Annual Report | 6/30/23
Principal
Amount
USD ($) | | | | | | Value |
| | U.S. Government and Agency Obligations —
(continued) | |
| 73,375,000 | U.S. Treasury Bonds, 3.625%, 2/15/53 | $ 70,417,070 |
| 56,214,840 | U.S. Treasury Inflation Indexed Notes, 0.125%, 7/15/24 | 54,529,493 |
| 87,490,000 | U.S. Treasury Notes, 3.500%, 2/15/33 | 85,220,728 |
| 100,000,000 | U.S. Treasury Notes, 3.625%, 4/30/28 | 97,171,875 |
| | Total U.S. Government and Agency Obligations
(Cost $1,716,351,005) | $1,658,809,113 |
|
|
| | SHORT TERM INVESTMENTS — 12.1% of Net
Assets | |
| | Repurchase Agreements — 2.0% | |
| 90,000,000 | Bank of America, 5.06%, dated 6/30/23, to be purchased on 7/3/23 for $90,037,950, collateralized by $91,800,002 U.S. Treasury Note, 0.625%, 11/30/27 | $ 90,000,000 |
| | | | | | | $ 90,000,000 |
|
|
| Shares | | | | | | |
| | Open-End Fund — 10.1% | |
| 451,529,655(l) | Dreyfus Government Cash Management,
Institutional Shares, 5.00% | $ 451,529,655 |
| | | | | | | $ 451,529,655 |
|
|
| | TOTAL SHORT TERM INVESTMENTS
(Cost $541,529,655) | $541,529,655 |
|
|
| | TOTAL INVESTMENTS IN UNAFFILIATED ISSUERS — 103.1%
(Cost $4,984,318,866) | $4,615,493,960 |
| | OTHER ASSETS AND LIABILITIES — (3.1)% | $ (137,717,512) |
| | net assets — 100.0% | $4,477,776,448 |
| | | | | | | |
| (TBA) | “To Be Announced” Securities. |
| bps | Basis Points. |
| CMT | Constant Maturity Treasury Index. |
| FREMF | Freddie Mac Multifamily Fixed-Rate Mortgage Loans. |
| FRESB | Freddie Mac Multifamily Small Balance Certificates. |
| ICE | Intercontinental Exchange. |
| LIBOR | London Interbank Offered Rate. |
| REIT | Real Estate Investment Trust. |
| REMICs | Real Estate Mortgage Investment Conduits. |
The accompanying notes are an integral part of these financial statements.
Pioneer Bond Fund | Annual Report | 6/30/2385
Schedule of Investments | 6/30/23 (continued)
| SOFR | Secured Overnight Financing Rate. |
| SOFR30A | Secured Overnight Financing Rate 30 Day Average. |
| (144A) | The resale of such security is exempt from registration under Rule 144A of the Securities Act of 1933. Such securities may be resold normally to qualified institutional buyers. At June 30, 2023, the value of these securities amounted to $1,423,150,898, or 31.8% of net assets. |
| (a) | Floating rate note. Coupon rate, reference index and spread shown at June 30, 2023. |
| (b) | The interest rate is subject to change periodically. The interest rate and/or reference index and spread shown at June 30, 2023. |
| (c) | Security represents the interest-only portion payments on a pool of underlying mortgages or mortgage-backed securities. |
| (d) | Debt obligation initially issued at one coupon which converts to a higher coupon at a specific date. The rate shown is the rate at June 30, 2023. |
| (e) | Security issued with a zero coupon. Income is recognized through accretion of discount. |
| (f) | Security is perpetual in nature and has no stated maturity date. |
| (g) | Securities purchased on a when-issued basis. Rates do not take effect until settlement date. |
| (h) | Consists of Revenue Bonds unless otherwise indicated. |
| (i) | Non-income producing security. |
| (j) | Issued as participation notes. |
| (k) | Issued as preference shares. |
| (l) | Rate periodically changes. Rate disclosed is the 7-day yield at June 30, 2023. |
| * | Senior secured floating rate loan interests in which the Fund invests generally pay interest at rates that are periodically re-determined by reference to a base lending rate plus a premium. These base lending rates are generally (i) the lending rate offered by one or more major European banks, such as LIBOR or SOFR, (ii) the prime rate offered by one or more major United States banks, (iii) the rate of a certificate of deposit or (iv) other base lending rates used by commercial lenders. The interest rate shown is the rate accruing at June 30, 2023. |
| † | Amount rounds to less than 0.1%. |
| + | Security is valued using significant unobservable inputs (Level 3). |
| # | Securities are restricted as to resale. |
| Restricted Securities | Acquisition date | Cost | Value |
| Ailsa Re 2022 | 6/30/2022 | $1,208,550 | $ 1,294,465 |
| Alamo Re | 4/12/2023 | 1,000,000 | 980,200 |
| Alturas Re 2019-3 | 6/26/2019 | 24,550 | 2,308 |
| Alturas Re 2020-3 | 8/3/2020 | — | — |
| Alturas Re 2021-2 | 2/16/2021 | 206,902 | — |
| Alturas Re 2021-3 | 8/16/2021 | 50,285 | 27,052 |
| Alturas Re 2022-2 | 1/18/2022 | 1,619,816 | 1,586,671 |
| Aquila Re I | 5/10/2023 | 850,000 | 846,175 |
| Atlas Capital | 5/17/2023 | 2,000,000 | 2,016,000 |
| Ballybunion Re 2020 | 12/31/2019 | 548,977 | 903,793 |
The accompanying notes are an integral part of these financial statements.
86Pioneer Bond Fund | Annual Report | 6/30/23
| Restricted Securities | Acquisition date | Cost | Value |
| Ballybunion Re 2021-3 | 8/4/2021 | $ 47,291 | $ 50,308 |
| Ballybunion Re 2022 | 3/9/2022 | 2,797 | 33,163 |
| Ballybunion Re 2022-2 | 8/5/2022 | 3,000,000 | 3,046,530 |
| Ballybunion Re 2022-3 | 8/5/2022 | 4,000,000 | 4,138,433 |
| Ballybunion Re 2023 | 3/20/2023 | 3,500,000 | 3,598,917 |
| Bantry Re 2021 | 1/11/2021 | 81,427 | 10,000 |
| Bantry Re 2022 | 2/2/2022 | 309,442 | 487,494 |
| Bantry Re 2023 | 1/12/2023 | 6,000,000 | 6,510,000 |
| Berwick Re 2019-1 | 12/31/2018 | 870,105 | 1,161,437 |
| Berwick Re 2020-1 | 9/24/2020 | — | 300 |
| Berwick Re 2022 | 12/28/2021 | 280,613 | 286,913 |
| Berwick Re 2023 | 2/1/2023 | 4,500,000 | 4,837,500 |
| Bonanza Re | 3/11/2022 | 250,000 | 210,300 |
| Bonanza Re | 1/6/2023 | 300,000 | 297,030 |
| Caelus Re V | 4/27/2017 | 100,000 | 80,000 |
| Cape Lookout Re | 4/14/2023 | 1,100,000 | 1,108,800 |
| Carnoustie Re 2020 | 7/16/2020 | 50,471 | 230,656 |
| Clarendon Re 2023 | 3/20/2023 | 916,657 | 982,780 |
| Commonwealth Re | 6/15/2022 | 1,000,000 | 986,600 |
| Denning Re 2022 | 7/11/2022 | 1,709,447 | 1,810,917 |
| Easton Re Pte | 7/19/2022 | 246,396 | 247,225 |
| Eden Re II | 12/16/2019 | 210,000 | 94,290 |
| Eden Re II | 12/23/2019 | 528,889 | 229,120 |
| Eden Re II | 1/25/2021 | 624,097 | 352,116 |
| Eden Re II | 1/21/2022 | 899,364 | 626,361 |
| Eden Re II | 1/17/2023 | 3,600,000 | 3,668,040 |
| FloodSmart Re | 2/16/2021 | 1,250,000 | 1,172,375 |
| FloodSmart Re | 2/14/2022 | 2,000,000 | 1,890,600 |
| Formby Re 2018 | 7/9/2018 | 4,661 | 48,036 |
| Four Lakes Re | 12/15/2021 | 500,000 | 470,900 |
| Four Lakes Re | 12/22/2022 | 3,000,000 | 3,031,800 |
| Gamboge Re | 4/24/2023 | 4,859,847 | 5,153,453 |
| Gateway Re | 2/3/2023 | 700,000 | 723,100 |
| Gateway Re II | 4/13/2023 | 250,000 | 247,400 |
| Gleneagles Re 2021 | 1/13/2021 | 22,875 | 125 |
| Gleneagles Re 2022 | 1/18/2022 | 578,843 | 617,905 |
| Gullane Re 2018 | 3/26/2018 | — | 100,036 |
| Gullane Re 2023 | 1/20/2023 | 6,381,951 | 6,894,316 |
| Harambee Re 2018 | 12/19/2017 | 42,461 | — |
| Harambee Re 2019 | 12/20/2018 | — | 8,500 |
| Harambee Re 2020 | 2/27/2020 | — | 56,800 |
| Herbie Re | 10/19/2020 | 500,000 | 483,050 |
| Integrity Re | 5/9/2022 | 750,000 | 675,000 |
| Integrity Re | 3/23/2023 | 1,500,000 | 1,483,200 |
| International Bank for Reconstruction & Development | 2/28/2020 | 250,000 | 248,925 |
| Isosceles Re 2022 | 8/11/2022 | 1,871,288 | 1,998,000 |
| Kilimanjaro III Re | 6/15/2022 | 1,000,000 | 985,100 |
| Lightning Re | 3/20/2023 | 1,000,000 | 1,028,000 |
| Limestone Re 2019-2B | 6/20/2018 | 1,101 | — |
| Limestone Re 2020-1 | 12/15/2016 | — | — |
The accompanying notes are an integral part of these financial statements.
Pioneer Bond Fund | Annual Report | 6/30/2387
Schedule of Investments | 6/30/23 (continued)
| Restricted Securities | Acquisition date | Cost | Value |
| Limestone Re 2020-1 | 12/27/2019 | $ — | $ — |
| Lion Rock Re 2020 | 3/27/2020 | — | — |
| Lion Rock Re 2021 | 3/1/2021 | 214,229 | 104,650 |
| Locke Tavern Re | 3/23/2023 | 1,000,000 | 1,004,700 |
| Long Point Re IV | 5/13/2022 | 3,500,000 | 3,473,750 |
| Lorenz Re 2019 | 6/26/2019 | 562,125 | 33,224 |
| Matterhorn Re | 1/29/2020 | 1,249,422 | 1,025,000 |
| Matterhorn Re | 12/15/2021 | 250,000 | 223,200 |
| Matterhorn Re | 3/10/2022 | 2,000,000 | 1,896,800 |
| Matterhorn Re | 3/10/2022 | 1,000,000 | 949,900 |
| Merion Re 2018-2 | 12/28/2017 | — | 489,888 |
| Merion Re 2021-2 | 12/28/2020 | 2,448,846 | 1,768,500 |
| Merion Re 2022-2 | 3/1/2022 | 6,551,154 | 6,211,224 |
| Merion Re 2023-1 | 1/11/2023 | 441,808 | 482,230 |
| Mona Lisa Re | 12/30/2022 | 1,000,000 | 1,056,000 |
| Mystic Re IV | 12/16/2022 | 3,400,000 | 3,363,280 |
| Northshore Re II | 6/22/2022 | 750,000 | 751,200 |
| Oakmont Re 2020 | 12/3/2020 | — | — |
| Oakmont Re 2022 | 5/9/2022 | 1,035,197 | 1,415,275 |
| Old Head Re 2022 | 1/6/2022 | 188,288 | 125,000 |
| Old Head Re 2023 | 1/11/2023 | 168,991 | 215,361 |
| Pangaea Re 2022-3 | 6/15/2022 | 2,750,000 | 2,970,693 |
| Pangaea Re 2023-1 | 1/23/2023 | 4,750,000 | 5,106,250 |
| Phoenician Re | 12/1/2021 | 1,000,000 | 979,100 |
| Phoenix 3 Re 2023-3 | 12/21/2020 | 1,120,701 | 1,325,000 |
| Pine Valley Re 2023 | 1/24/2023 | 893,730 | 47,560 |
| Porthcawl Re 2023 | 1/23/2023 | 197,811 | 229,890 |
| Portsalon Re 2022 | 7/15/2022 | 404,317 | 458,460 |
| Queen Street 2023 Re | 5/12/2023 | 3,000,000 | 3,006,900 |
| Residential Re | 11/22/2022 | 1,750,000 | 1,740,900 |
| RosaPenna Re 2022 | 8/26/2022 | 2,000,000 | 2,121,000 |
| Sakura Re | 12/22/2022 | 750,000 | 799,575 |
| Sanders Re II | 11/23/2021 | 2,754,375 | 2,609,200 |
| Sanders Re III | 11/30/2022 | 1,000,000 | 1,023,800 |
| Sector Re V | 4/23/2019 | 408,998 | 302,700 |
| Sector Re V | 5/1/2019 | 1,914 | 46,222 |
| Sector Re V | 12/4/2019 | 3,349 | 344,260 |
| Sector Re V | 1/1/2020 | 2,646 | 172,128 |
| Sector Re V | 12/6/2021 | 10,000 | 57,495 |
| Sector Re V | 1/5/2022 | 84,000 | 482,958 |
| Sector Re V | 12/30/2022 | 4,605,987 | 4,930,709 |
| Sussex Re 2020-1 | 1/21/2020 | — | 4,693 |
| Sussex Re 2021-1 | 1/26/2021 | 30,870 | 41,000 |
| Thopas Re 2019 | 12/21/2018 | — | 9,900 |
| Thopas Re 2020 | 12/30/2019 | — | — |
| Thopas Re 2021 | 12/30/2020 | — | 112,700 |
| Thopas Re 2022 | 2/15/2022 | — | — |
| Thopas Re 2023 | 2/15/2023 | 4,256,392 | 4,620,313 |
| Torricelli Re 2021 | 7/2/2021 | — | 133,614 |
| Torricelli Re 2022 | 7/26/2022 | 4,500,000 | 4,990,257 |
| Ursa Re | 4/12/2023 | 750,000 | 755,400 |
The accompanying notes are an integral part of these financial statements.
88Pioneer Bond Fund | Annual Report | 6/30/23
| Restricted Securities | Acquisition date | Cost | Value |
| Veraison Re | 12/14/2022 | $ 500,000 | $ 526,950 |
| Viribus Re 2018 | 12/22/2017 | 21,118 | — |
| Viribus Re 2019 | 12/27/2018 | — | 25,915 |
| Viribus Re 2020 | 3/12/2020 | 421,904 | 142,815 |
| Viribus Re 2022 | 4/18/2022 | — | 147,600 |
| Viribus Re 2023 | 2/2/2023 | 2,000,000 | 2,320,600 |
| Vitality Re XI | 1/31/2020 | 998,828 | 986,500 |
| Vitality Re XIII | 1/4/2023 | 2,157,219 | 2,201,625 |
| Vitality Re XIV | 1/25/2023 | 3,250,000 | 3,327,675 |
| Vitality Re XIV | 1/25/2023 | 750,000 | 749,700 |
| Walton Health Re 2019 | 7/18/2019 | 106,623 | 184,811 |
| Walton Health Re 2022 | 7/13/2022 | 1,405,866 | 1,761,599 |
| Woburn Re 2018 | 3/20/2018 | 491,225 | 35,837 |
| Woburn Re 2019 | 1/30/2019 | 689,864 | 861,848 |
| Total Restricted Securities | | | $147,343,849 |
| % of Net assets | | | 3.3% |
FUTURES CONTRACTS
FIXED INCOME INDEX FUTURES CONTRACTS
Number of
Contracts
Long | Description | Expiration
Date | Notional
Amount | Market
Value | Unrealized
Appreciation
(Depreciation) |
| 1,953 | U.S. 2 Year Note (CBT) | 9/29/23 | $ 402,403,403 | $ 397,130,344 | $ (5,273,059) |
| 4,904 | U.S. 5 Year Note (CBT) | 9/29/23 | 533,908,383 | 525,187,750 | (8,720,633) |
| 1,942 | U.S. Long Bond (CBT) | 9/20/23 | 246,450,074 | 246,451,938 | 1,864 |
| 80 | U.S. Ultra Bond (CBT) | 9/20/23 | 10,810,218 | 10,897,500 | 87,282 |
| | | | $1,193,572,078 | $1,179,667,532 | $(13,904,546) |
The accompanying notes are an integral part of these financial statements.
Pioneer Bond Fund | Annual Report | 6/30/2389
Schedule of Investments | 6/30/23 (continued)
Number of
Contracts
Short | Description | Expiration
Date | Notional
Amount | Market
Value | Unrealized
Appreciation
(Depreciation) |
| 48 | U.S. 10 Year Note (CBT) | 9/20/23 | $ (5,483,269) | $ (5,388,750) | $ 94,519 |
| 549 | U.S. 10 Year Ultra Bond (CBT) | 9/20/23 | (65,420,115) | (65,022,188) | 397,927 |
| | | | $ (70,903,384) | $ (70,410,938) | $ 492,446 |
| TOTAL FUTURES CONTRACTS | $1,122,668,694 | $1,109,256,594 | $(13,412,100) |
SWAP CONTRACTS
CENTRALLY CLEARED CREDIT DEFAULT SWAP CONTRACTS – BUY PROTECTION
Notional
Amount ($)(1) | Reference
Obligation/Index | Pay/
Receive(2) | Annual
Fixed Rate | Expiration
Date | Premiums
(Received) | Unrealized
(Depreciation) | Market
Value |
| 426,650,000 | Markit CDX North America High Yield Index Series 40 | Pay | 5.00% | 6/20/28 | $(5,594,689) | $(6,956,747) | $(12,551,436) |
TOTAL CENTRALLY CLEARED CREDIT DEFAULT
SWAP CONTRACTS – BUY PROTECTION | $ (5,594,689) | $ (6,956,747) | $ (12,551,436) |
| TOTAL SWAP CONTRACTS | | $ (5,594,689) | $ (6,956,747) | $ (12,551,436) |
| | |
| (1) | The notional amount is the maximum amount that a seller of credit protection would be obligated to pay upon occurrence of a credit event. |
| (2) | Pays quarterly. |
Purchases and sales of securities (excluding short-term investments) for the year ended June 30, 2023 were as follows:
| | Purchases | Sales |
| Long-Term U.S. Government Securities | $ 591,769,462 | $ — |
| Other Long-Term Securities | $1,829,922,655 | $2,198,420,140 |
The accompanying notes are an integral part of these financial statements.
90Pioneer Bond Fund | Annual Report | 6/30/23
At June 30, 2023, the net unrealized depreciation on investments based on cost for federal tax purposes of $4,970,294,982 was as follows:
| Aggregate gross unrealized appreciation for all investments in which there is an excess of value over tax cost | $ 40,175,804 |
| Aggregate gross unrealized depreciation for all investments in which there is an excess of tax cost over value | (420,940,362) |
| Net unrealized depreciation | $(380,764,558) |
Various inputs are used in determining the value of the Fund's investments. These inputs are summarized in the three broad levels below.
| Level 1 | – | unadjusted quoted prices in active markets for identical securities. |
| Level 2 | – | other significant observable inputs (including quoted prices for similar securities, interest rates, prepayment speeds, credit risks, etc.). See Notes to Financial Statements — Note 1A. |
| Level 3 | – | significant unobservable inputs (including the Adviser's own assumptions in determining fair value of investments). See Notes to Financial Statements — Note 1A. |
The following is a summary of the inputs used as of June 30, 2023, in valuing the Fund's investments:
| | Level 1 | Level 2 | Level 3 | Total |
| Senior Secured Floating Rate Loan Interests | $ — | $ 15,921,216 | $ — | $ 15,921,216 |
| Asset Backed Securities | — | 283,663,188 | — | 283,663,188 |
| Collateralized Mortgage Obligations | — | 417,405,962 | — | 417,405,962 |
| Commercial Mortgage-Backed Securities | — | 209,227,225 | — | 209,227,225 |
| Corporate Bonds | — | 1,313,300,815 | — | 1,313,300,815 |
| Convertible Preferred Stock | 25,936,128 | — | — | 25,936,128 |
| Municipal Bonds | — | 2,356,809 | — | 2,356,809 |
| Insurance-Linked Securities | | | | |
| Collateralized Reinsurance | | | | |
| Multiperil – Massachusetts | — | — | 3,563,842 | 3,563,842 |
| Multiperil – U.S. | — | — | 16,924,597 | 16,924,597 |
| Multiperil – Worldwide | — | — | 4,029,231 | 4,029,231 |
| Windstorm – Florida | — | — | 2,046,036 | 2,046,036 |
| Windstorm – U.S. Regional | — | — | 1,415,275 | 1,415,275 |
| Reinsurance Sidecars | | | | |
| Multiperil – U.S. | — | — | 295,956 | 295,956 |
| Multiperil – Worldwide | — | — | 67,405,977 | 67,405,977 |
| All Other Insurance-Linked Securities | — | 51,662,935 | — | 51,662,935 |
The accompanying notes are an integral part of these financial statements.
Pioneer Bond Fund | Annual Report | 6/30/2391
Schedule of Investments | 6/30/23 (continued)
| | Level 1 | Level 2 | Level 3 | Total |
| U.S. Government and Agency Obligations | $ — | $1,658,809,113 | $ — | $1,658,809,113 |
| Repurchase Agreements | — | 90,000,000 | — | 90,000,000 |
| Open-End Fund | 451,529,655 | — | — | 451,529,655 |
| Total Investments in Securities | $ 477,465,783 | $ 4,042,347,263 | $ 95,680,914 | $ 4,615,493,960 |
| Other Financial Instruments | | | | |
| Net unrealized depreciation on futures contracts | $ (13,412,100) | $ — | $ — | $ (13,412,100) |
| Swap contracts, at value | — | (12,551,436) | — | (12,551,436) |
| Total Other Financial Instruments | $ (13,412,100) | $ (12,551,436) | $ — | $ (25,963,536) |
The following is a reconciliation of assets valued using significant unobservable inputs (Level 3):
| | Insurance-
Linked
Securities |
| Balance as of 6/30/22 | $102,083,340 |
| Realized gain (loss)(1) | (6,242,857 ) |
| Changed in unrealized appreciation (depreciation)(2) | 5,000,858 |
| Return of capital | (42,551,319 ) |
| Purchases | 75,219,778 |
| Sales | (37,828,886 ) |
| Transfers in to Level 3* | — |
| Transfers out of Level 3* | — |
| Balance as of 6/30/23 | $ 95,680,914 |
| (1) | Realized gain (loss) on these securities is included in the realized gain (loss) from investments on the Statement of Operations. |
| (2) | Unrealized appreciation (depreciation) on these securities is included in the change in unrealized appreciation (depreciation) from investments on the Statement of Operations. |
| * | Transfers are calculated on the beginning of period values. During the year ended June 30, 2023, there were no transfers in or out of Level 3. |
| Net change in unrealized appreciation (depreciation) of Level 3 investments still held and considered Level 3 at June 30, 2023: | $3,371,327 |
The accompanying notes are an integral part of these financial statements.
92Pioneer Bond Fund | Annual Report | 6/30/23
Statement of Assets and Liabilities | 6/30/23
| ASSETS: | |
| Investments in unaffiliated issuers, at value (cost $4,984,318,866) | $4,615,493,960 |
| Cash | 3,094,118 |
| Foreign currencies, at value (cost $18) | 18 |
| Futures collateral | 19,416,674 |
| Swaps collateral | 33,437,167 |
| Collateral due from broker for TBA Securities | 140,000 |
| Receivables — | |
| Investment securities sold | 255,173,087 |
| Fund shares sold | 12,775,124 |
| Interest | 28,999,513 |
| Other assets | 640,524 |
| Total assets | $ 4,969,170,185 |
| LIABILITIES: | |
| Payables — | |
| Investment securities purchased | $ 444,588,172 |
| Fund shares repurchased | 28,175,686 |
| Distributions | 1,626,405 |
| Variation margin for centrally cleared swap contracts | 2,965,860 |
| Swap contracts, at value (net premiums received $5,594,689) | 12,551,436 |
| Management fees | 106,584 |
| Administrative expenses | 128,362 |
| Distribution fees | 19,138 |
| Accrued expenses | 1,232,094 |
| Total liabilities | $ 491,393,737 |
| NET ASSETS: | |
| Paid-in capital | $5,290,878,563 |
| Distributable earnings (loss) | (813,102,115) |
| Net assets | $4,477,776,448 |
| NET ASSET VALUE PER SHARE: | |
| No par value (unlimited number of shares authorized) | |
| Class A (based on $544,279,323/66,247,554 shares) | $ 8.22 |
| Class C (based on $16,617,030/2,047,014 shares) | $ 8.12 |
| Class K (based on $1,487,533,731/181,269,001 shares) | $ 8.21 |
| Class R (based on $161,550,370/19,488,987 shares) | $ 8.29 |
| Class Y (based on $2,267,795,994/278,885,831 shares) | $ 8.13 |
| MAXIMUM OFFERING PRICE PER SHARE: | |
| Class A (based on $8.22 net asset value per share/100%-4.50% maximum sales charge) | $ 8.61 |
The accompanying notes are an integral part of these financial statements.
Pioneer Bond Fund | Annual Report | 6/30/23 93
Statement of Operations FOR THE YEAR ENDED 6/30/23
| INVESTMENT INCOME: | | |
| Interest from unaffiliated issuers (net of foreign taxes withheld $29,588) | $ 183,896,888 | |
| Dividends from unaffiliated issuers | 16,668,205 | |
| Total Investment Income | | $ 200,565,093 |
| EXPENSES: | | |
| Management fees | $ 12,640,802 | |
| Administrative expenses | 1,205,594 | |
| Transfer agent fees | | |
| Class A | 1,178,797 | |
| Class C | 19,840 | |
| Class K | 3,666 | |
| Class R | 410,088 | |
| Class Y | 2,382,882 | |
| Distribution fees | | |
| Class A | 1,408,340 | |
| Class C | 183,464 | |
| Class R | 818,168 | |
| Shareowner communications expense | 288,751 | |
| Custodian fees | 26,592 | |
| Registration fees | 193,453 | |
| Professional fees | 399,924 | |
| Printing expense | 59,228 | |
| Officers' and Trustees' fees | 284,995 | |
| Insurance expense | 46,833 | |
| Miscellaneous | 584,677 | |
| Total expenses | | $ 22,136,094 |
| Net investment income | | $ 178,428,999 |
| REALIZED AND UNREALIZED GAIN (LOSS) ON INVESTMENTS: | | |
| Net realized gain (loss) on: | | |
| Investments in unaffiliated issuers | $(150,487,434) | |
| Futures contracts | (54,018,571) | |
| Swap contracts | (37,178,351) | |
| Other assets and liabilities denominated in foreign currencies | 59 | $ (241,684,297) |
| Change in net unrealized appreciation (depreciation) on: | | |
| Investments in unaffiliated issuers | $ 24,829,823 | |
| Futures contracts | (5,979,750) | |
| Swap contracts | (26,959,034) | $ (8,108,961) |
| Net realized and unrealized gain (loss) on investments | | $(249,793,258) |
| Net decrease in net assets resulting from operations | | $ (71,364,259) |
The accompanying notes are an integral part of these financial statements.
94Pioneer Bond Fund | Annual Report | 6/30/23
Statements of Changes in Net Assets
| | Year
Ended
6/30/23 | Year
Ended
6/30/22 |
| FROM OPERATIONS: | | |
| Net investment income (loss) | $ 178,428,999 | $ 129,945,711 |
| Net realized gain (loss) on investments | (241,684,297) | (153,118,689) |
| Change in net unrealized appreciation (depreciation) on investments | (8,108,961) | (569,696,578) |
| Net decrease in net assets resulting from operations | $ (71,364,259) | $ (592,869,556) |
| DISTRIBUTIONS TO SHAREOWNERS: | | |
| Class A ($0.23 and $0.51 per share, respectively) | $ (15,674,765) | $ (39,380,638) |
| Class C ($0.18 and $0.45 per share, respectively) | (391,598) | (1,358,899) |
| Class K ($0.27 and $0.56 per share, respectively) | (48,224,361) | (116,418,664) |
| Class R ($0.21 and $0.49 per share, respectively) | (4,114,149) | (9,594,836) |
| Class Y ($0.26 and $0.55 per share, respectively) | (67,735,045) | (151,168,110) |
| Total distributions to shareowners | $ (136,139,918) | $ (317,921,147) |
| FROM FUND SHARE TRANSACTIONS: | | |
| Net proceeds from sales of shares | $ 1,583,055,341 | $ 1,803,039,268 |
| Reinvestment of distributions | 119,408,212 | 277,106,443 |
| Cost of shares repurchased | (1,608,071,894) | (2,000,598,487) |
| In-kind redemptions | — | (435,749,235) |
| Net increase (decrease) in net assets resulting from Fund share transactions | $ 94,391,659 | $ (356,202,011) |
| Net decrease in net assets | $ (113,112,518) | $(1,266,992,714) |
| NET ASSETS: | | |
| Beginning of year | $ 4,590,888,966 | $ 5,857,881,680 |
| End of year | $ 4,477,776,448 | $ 4,590,888,966 |
The accompanying notes are an integral part of these financial statements.
Pioneer Bond Fund | Annual Report | 6/30/2395
Statements of Changes in Net Assets (continued)
| | Year
Ended
6/30/23
Shares | Year
Ended
6/30/23
Amount | Year
Ended
6/30/22
Shares | Year
Ended
6/30/22
Amount |
| Class A | | | | |
| Shares sold | 15,947,548 | $ 132,250,419 | 13,578,207 | $ 129,550,585 |
| Reinvestment of distributions | 1,513,896 | 12,545,029 | 3,140,666 | 30,387,955 |
| Less shares repurchased | (23,950,304) | (199,879,949) | (26,002,339) | (249,150,989) |
| Net decrease | (6,488,860) | $ (55,084,501) | (9,283,466) | $ (89,212,449) |
| Class C | | | | |
| Shares sold | 457,791 | $ 3,744,549 | 331,094 | $ 3,176,654 |
| Reinvestment of distributions | 44,524 | 364,538 | 133,978 | 1,284,871 |
| Less shares repurchased | (967,892) | (7,928,683) | (1,472,085) | (13,993,199) |
| Net decrease | (465,577) | $ (3,819,596) | (1,007,013) | $ (9,531,674) |
| Class K | | | | |
| Shares sold | 58,655,203 | $ 487,163,148 | 90,802,425 | $ 873,907,041 |
| Reinvestment of distributions | 4,969,389 | 41,138,139 | 10,478,293 | 101,133,283 |
| Less shares repurchased | (61,630,199) | (513,351,156) | (68,418,693) | (645,495,421) |
| In-kind redemptions | — | — | (49,292,900) | (435,749,235) |
Net increase
(decrease) | 1,994,393 | $ 14,950,131 | (16,430,875) | $ (106,204,332) |
| Class R | | | | |
| Shares sold | 1,724,615 | $ 14,468,928 | 2,274,287 | $ 22,373,070 |
| Reinvestment of distributions | 491,464 | 4,108,735 | 978,082 | 9,557,049 |
| Less shares repurchased | (2,556,061) | (21,413,512) | (4,158,866) | (40,951,362) |
| Net decrease | (339,982) | $ (2,835,849) | (906,497) | $ (9,021,243) |
| Class Y | | | | |
| Shares sold | 114,806,859 | $ 945,428,297 | 82,500,622 | $ 774,031,918 |
| Reinvestment of distributions | 7,468,433 | 61,251,771 | 14,083,841 | 134,743,285 |
| Less shares repurchased | (105,348,040) | (865,498,594) | (112,980,605) | (1,051,007,516) |
Net increase
(decrease) | 16,927,252 | $ 141,181,474 | (16,396,142) | $ (142,232,313) |
The accompanying notes are an integral part of these financial statements.
96Pioneer Bond Fund | Annual Report | 6/30/23
| | Year
Ended
6/30/23 | Year
Ended
6/30/22 | Year
Ended
6/30/21 | Year
Ended
6/30/20 | Year
Ended
6/30/19 |
| Class A | | | | | |
| Net asset value, beginning of period | $ 8.60 | $ 10.14 | $ 9.98 | $ 9.79 | $ 9.45 |
| Increase (decrease) from investment operations: | | | | | |
| Net investment income (loss) (a) | $ 0.31 | $ 0.19 | $ 0.23 | $ 0.25 | $ 0.27 |
| Net realized and unrealized gain (loss) on investments | (0.46) | (1.22) | 0.38 | 0.23 | 0.37 |
| Net increase (decrease) from investment operations | $ (0.15) | $ (1.03) | $ 0.61 | $ 0.48 | $ 0.64 |
| Distributions to shareowners: | | | | | |
| Net investment income | $ (0.23) | $ (0.16) | $ (0.27) | $ (0.29) | $ (0.30) |
| Net realized gain | — | (0.35) | (0.18) | — | — |
| Total distributions | $ (0.23) | $ (0.51) | $ (0.45) | $ (0.29) | $ (0.30) |
| Net increase (decrease) in net asset value | $ (0.38) | $ (1.54) | $ 0.16 | $ 0.19 | $ 0.34 |
| Net asset value, end of period | $ 8.22 | $ 8.60 | $ 10.14 | $ 9.98 | $ 9.79 |
| Total return (b) | (1.70)% | (10.66)% | 6.26% | 5.01% | 6.93% |
| Ratio of net expenses to average net assets | 0.83% | 0.79% | 0.82% | 0.82% | 0.85% |
| Ratio of net investment income (loss) to average net assets | 3.76% | 2.02% | 2.26% | 2.58% | 2.88% |
| Portfolio turnover rate | 58% | 72% | 59% | 71% | 52% |
| Net assets, end of period (in thousands) | $544,279 | $625,834 | $831,595 | $960,460 | $979,874 |
| Ratios with no waiver of fees and assumption of expenses by the Adviser and no reduction for fees paid indirectly: | | | | | |
| Total expenses to average net assets | 0.83% | 0.79% | 0.82% | 0.82% | 0.87% |
| Net investment income (loss) to average net assets | 3.76% | 2.02% | 2.26% | 2.58% | 2.86% |
| (a) | The per-share data presented above is based on the average shares outstanding for the period presented. |
| (b) | Assumes initial investment at net asset value at the beginning of each period, reinvestment of all distributions, the complete redemption of the investment at net asset value at the end of each period and no sales charges. Total return would be reduced if sales charges were taken into account. |
The accompanying notes are an integral part of these financial statements.
Pioneer Bond Fund | Annual Report | 6/30/2397
Financial Highlights (continued)
| | Year
Ended
6/30/23 | Year
Ended
6/30/22 | Year
Ended
6/30/21 | Year
Ended
6/30/20 | Year
Ended
6/30/19 |
| Class C | | | | | |
| Net asset value, beginning of period | $ 8.51 | $ 10.03 | $ 9.87 | $ 9.68 | $ 9.35 |
| Increase (decrease) from investment operations: | | | | | |
| Net investment income (loss) (a) | $ 0.25 | $ 0.13 | $ 0.17 | $ 0.19 | $ 0.21 |
| Net realized and unrealized gain (loss) on investments | (0.46) | (1.20) | 0.38 | 0.23 | 0.35 |
| Net increase (decrease) from investment operations | $ (0.21) | $ (1.07) | $ 0.55 | $ 0.42 | $ 0.56 |
| Distributions to shareowners: | | | | | |
| Net investment income | $ (0.18) | $ (0.10) | $ (0.21) | $ (0.23) | $ (0.23) |
| Net realized gain | — | (0.35) | (0.18) | — | — |
| Total distributions | $ (0.18) | $ (0.45) | $ (0.39) | $ (0.23) | $ (0.23) |
| Net increase (decrease) in net asset value | $ (0.39) | $ (1.52) | $ 0.16 | $ 0.19 | $ 0.33 |
| Net asset value, end of period | $ 8.12 | $ 8.51 | $ 10.03 | $ 9.87 | $ 9.68 |
| Total return (b) | (2.49)% | (11.16)% | 5.63% | 4.38% | 6.10% |
| Ratio of net expenses to average net assets | 1.49% | 1.43% | 1.43% | 1.45% | 1.52% |
| Ratio of net investment income (loss) to average net assets | 3.09% | 1.36% | 1.65% | 1.96% | 2.21% |
| Portfolio turnover rate | 58% | 72% | 59% | 71% | 52% |
| Net assets, end of period (in thousands) | $16,617 | $21,371 | $35,295 | $59,026 | $62,447 |
| (a) | The per-share data presented above is based on the average shares outstanding for the period presented. |
| (b) | Assumes initial investment at net asset value at the beginning of each period, reinvestment of all distributions, the complete redemption of the investment at net asset value at the end of each period and no sales charges. Total return would be reduced if sales charges were taken into account. |
The accompanying notes are an integral part of these financial statements.
98Pioneer Bond Fund | Annual Report | 6/30/23
| | Year
Ended
6/30/23 | Year
Ended
6/30/22 | Year
Ended
6/30/21 | Year
Ended
6/30/20 | Year
Ended
6/30/19 |
| Class K | | | | | |
| Net asset value, beginning of period | $ 8.60 | $ 10.13 | $ 9.98 | $ 9.78 | $ 9.45 |
| Increase (decrease) from investment operations: | | | | | |
| Net investment income (loss) (a) | $ 0.35 | $ 0.24 | $ 0.28 | $ 0.30 | $ 0.32 |
| Net realized and unrealized gain (loss) on investments | (0.47) | (1.21) | 0.37 | 0.24 | 0.35 |
| Net increase (decrease) from investment operations | $ (0.12) | $ (0.97) | $ 0.65 | $ 0.54 | $ 0.67 |
| Distributions to shareowners: | | | | | |
| Net investment income | $ (0.27) | $ (0.21) | $ (0.32) | $ (0.34) | $ (0.34) |
| Net realized gain | — | (0.35) | (0.18) | — | — |
| Total distributions | $ (0.27) | $ (0.56) | $ (0.50) | $ (0.34) | $ (0.34) |
| Net increase (decrease) in net asset value | $ (0.39) | $ (1.53) | $ 0.15 | $ 0.20 | $ 0.33 |
| Net asset value, end of period | $ 8.21 | $ 8.60 | $ 10.13 | $ 9.98 | $ 9.78 |
| Total return (b) | (1.34)% | (10.12)% | 6.66% | 5.65% | 7.28% |
| Ratio of net expenses to average net assets | 0.36% | 0.33% | 0.34% | 0.34% | 0.37% |
| Ratio of net investment income (loss) to average net assets | 4.25% | 2.46% | 2.73% | 3.08% | 3.37% |
| Portfolio turnover rate | 58% | 72%(c) | 59% | 71% | 52% |
| Net assets, end of period (in thousands) | $1,487,534 | $1,540,983 | $1,983,399 | $1,918,556 | $1,273,821 |
| (a) | The per-share data presented above is based on the average shares outstanding for the period presented. |
| (b) | Assumes initial investment at net asset value at the beginning of each period, reinvestment of all distributions and the complete redemption of the investment at net asset value at the end of each period. |
| (c) | Portfolio turnover excludes the value of portfolio securities received or delivered as a result of in-kind fund share transactions. |
The accompanying notes are an integral part of these financial statements.
Pioneer Bond Fund | Annual Report | 6/30/2399
Financial Highlights (continued)
| | Year
Ended
6/30/23 | Year
Ended
6/30/22 | Year
Ended
6/30/21 | Year
Ended
6/30/20 | Year
Ended
6/30/19 |
| Class R | | | | | |
| Net asset value, beginning of period | $ 8.68 | $ 10.23 | $ 10.07 | $ 9.88 | $ 9.54 |
| Increase (decrease) from investment operations: | | | | | |
| Net investment income (loss) (a) | $ 0.29 | $ 0.17 | $ 0.20 | $ 0.23 | $ 0.25 |
| Net realized and unrealized gain (loss) on investments | (0.47) | (1.23) | 0.39 | 0.23 | 0.37 |
| Net increase (decrease) from investment operations | $ (0.18) | $ (1.06) | $ 0.59 | $ 0.46 | $ 0.62 |
| Distributions to shareowners: | | | | | |
| Net investment income | $ (0.21) | $ (0.14) | $ (0.25) | $ (0.27) | $ (0.28) |
| Net realized gain | — | (0.35) | (0.18) | — | — |
| Total distributions | $ (0.21) | $ (0.49) | $ (0.43) | $ (0.27) | $ (0.28) |
| Net increase (decrease) in net asset value | $ (0.39) | $ (1.55) | $ 0.16 | $ 0.19 | $ 0.34 |
| Net asset value, end of period | $ 8.29 | $ 8.68 | $ 10.23 | $ 10.07 | $ 9.88 |
| Total return (b) | (2.05)% | (10.88)% | 5.97% | 4.76% | 6.62% |
| Ratio of net expenses to average net assets | 1.11% | 1.07% | 1.08% | 1.08% | 1.10% |
| Ratio of net investment income (loss) to average net assets | 3.50% | 1.73% | 1.99% | 2.33% | 2.64% |
| Portfolio turnover rate | 58% | 72% | 59% | 71% | 52% |
| Net assets, end of period (in thousands) | $161,550 | $172,125 | $212,127 | $191,311 | $198,457 |
| Ratios with no waiver of fees and assumption of expenses by the Adviser and no reduction for fees paid indirectly: | | | | | |
| Total expenses to average net assets | 1.11% | 1.07% | 1.08% | 1.08% | 1.12% |
| Net investment income (loss) to average net assets | 3.50% | 1.73% | 1.99% | 2.33% | 2.62% |
| (a) | The per-share data presented above is based on the average shares outstanding for the period presented. |
| (b) | Assumes initial investment at net asset value at the beginning of each period, reinvestment of all distributions and the complete redemption of the investment at net asset value at the end of each period. |
The accompanying notes are an integral part of these financial statements.
100Pioneer Bond Fund | Annual Report | 6/30/23
| | Year
Ended
6/30/23 | Year
Ended
6/30/22 | Year
Ended
6/30/21 | Year
Ended
6/30/20 | Year
Ended
6/30/19 |
| Class Y | | | | | |
| Net asset value, beginning of period | $ 8.51 | $ 10.04 | $ 9.89 | $ 9.70 | $ 9.36 |
| Increase (decrease) from investment operations: | | | | | |
| Net investment income (loss) (a) | $ 0.34 | $ 0.22 | $ 0.26 | $ 0.29 | $ 0.31 |
| Net realized and unrealized gain (loss) on investments | (0.46) | (1.20) | 0.38 | 0.23 | 0.36 |
| Net increase (decrease) from investment operations | $ (0.12) | $ (0.98) | $ 0.64 | $ 0.52 | $ 0.67 |
| Distributions to shareowners: | | | | | |
| Net investment income | $ (0.26) | $ (0.20) | $ (0.31) | $ (0.33) | $ (0.33) |
| Net realized gain | — | (0.35) | (0.18) | — | — |
| Total distributions | $ (0.26) | $ (0.55) | $ (0.49) | $ (0.33) | $ (0.33) |
| Net increase (decrease) in net asset value | $ (0.38) | $ (1.53) | $ 0.15 | $ 0.19 | $ 0.34 |
| Net asset value, end of period | $ 8.13 | $ 8.51 | $ 10.04 | $ 9.89 | $ 9.70 |
| Total return (b) | (1.39)% | (10.34)% | 6.58% | 5.44% | 7.30% |
| Ratio of net expenses to average net assets | 0.47% | 0.44% | 0.45% | 0.45% | 0.49% |
| Ratio of net investment income (loss) to average net assets | 4.13% | 2.36% | 2.62% | 2.96% | 3.26% |
| Portfolio turnover rate | 58% | 72%(c) | 59% | 71% | 52% |
| Net assets, end of period (in thousands) | $2,267,796 | $2,230,576 | $2,795,466 | $2,847,487 | $3,053,763 |
| (a) | The per-share data presented above is based on the average shares outstanding for the period presented. |
| (b) | Assumes initial investment at net asset value at the beginning of each period, reinvestment of all distributions and the complete redemption of the investment at net asset value at the end of each period. |
| (c) | Portfolio turnover excludes the value of portfolio securities received or delivered as a result of in-kind fund share transactions. |
The accompanying notes are an integral part of these financial statements.
Pioneer Bond Fund | Annual Report | 6/30/23101
Notes to Financial Statements | 6/30/23
1. Organization and Significant Accounting Policies
Pioneer Bond Fund (the “Fund”) is a Delaware statutory trust. The Fund is registered under the Investment Company Act of 1940, as amended (the "1940 Act") as a diversified, open-end management investment company. The investment objective of the Fund is to seek current income and total return.
The Fund offers five classes of shares designated as Class A, Class C, Class K, Class R and Class Y shares. Each class of shares represents an interest in the same portfolio of investments of the Fund and has identical rights (based on relative net asset values) to assets and liquidation proceeds. Share classes can bear different rates of class-specific fees and expenses, such as transfer agent and distribution fees. Differences in class-specific fees and expenses will result in differences in net investment income and, therefore, the payment of different dividends from net investment income earned by each class. The Amended and Restated Declaration of Trust of the Fund gives the Board of Trustees the flexibility to specify either per-share voting or dollar-weighted voting when submitting matters for shareowner approval. Under per-share voting, each share of a class of the Fund is entitled to one vote. Under dollar-weighted voting, a shareowner’s voting power is determined not by the number of shares owned, but by the dollar value of the shares on the record date. Each share class has exclusive voting rights with respect to matters affecting only that class, including with respect to the distribution plan for that class. There is no distribution plan for Class K or Class Y shares.
Amundi Asset Management US, Inc., an indirect, wholly owned subsidiary of Amundi and Amundi’s wholly owned subsidiary, Amundi USA, Inc., serves as the Fund’s investment adviser (the “Adviser”). Amundi Distributor US, Inc., an affiliate of the Adviser, serves as the Fund’s distributor (the “Distributor”).
In March 2020, FASB issued an Accounting Standard Update, ASU 2020-04, Reference Rate Reform (Topic 848) — Facilitation of the Effects of Reference Rate Reform on Financial Reporting (“ASU 2020-04”), which provides optional, temporary relief with respect to the financial reporting of contracts subject to certain types of modifications due to the planned discontinuation of the London Interbank Offered Rate (“LIBOR”) and other LIBOR-based reference rates at the end of 2021. The temporary relief provided by ASU 2020-04 is effective for certain reference rate-related contract modifications that occur during the period from March 12, 2020 through December 31, 2023. Management is evaluating the impact of ASU
102Pioneer Bond Fund | Annual Report | 6/30/23
2020-04 on the Fund's investments, derivatives, debt and other contracts, if applicable, that will undergo reference rate-related modifications as a result of the reference rate reform.
The Fund is required to comply with Rule 18f-4 under the 1940 Act, which governs the use of derivatives by registered investment companies. Rule 18f-4 permits funds to enter into derivatives transactions (as defined in Rule 18f-4) and certain other transactions notwithstanding the restrictions on the issuance of “senior securities” under Section 18 of the 1940 Act. In accordance with Rule 18f-4, the Fund has established and maintains a comprehensive derivatives risk management program, has appointed a derivatives risk manager and complies with a relative or absolute limit on fund leverage risk calculated based on value-at-risk ("VaR").
The Fund is an investment company and follows investment company accounting and reporting guidance under U.S. Generally Accepted Accounting Principles (“U.S. GAAP”). U.S. GAAP requires the management of the Fund to make estimates and assumptions that affect the reported amounts of assets and liabilities, the disclosure of contingent assets and liabilities at the date of the financial statements, and the reported amounts of income, expenses and gain or loss on investments during the reporting period. Actual results could differ from those estimates.
The following is a summary of significant accounting policies followed by the Fund in the preparation of its financial statements:
| A. | Security Valuation |
| | The net asset value of the Fund is computed once daily, on each day the New York Stock Exchange (“NYSE”) is open, as of the close of regular trading on the NYSE. |
| | Fixed-income securities are valued by using prices supplied by independent pricing services, which consider such factors as market prices, market events, quotations from one or more brokers, Treasury spreads, yields, maturities and ratings, or may use a pricing matrix or other fair value methods or techniques to provide an estimated value of the security or instrument. A pricing matrix is a means of valuing a debt security on the basis of current market prices for other debt securities, historical trading patterns in the market for fixed-income securities and/or other factors. Non-U.S. debt securities that are listed on an exchange will be valued at the bid price obtained from an independent third party pricing service. When independent third party pricing services are unable to supply prices, or when prices or market quotations |
Pioneer Bond Fund | Annual Report | 6/30/23103
| | are considered to be unreliable, the value of that security may be determined using quotations from one or more broker-dealers. |
| | Loan interests are valued at the mean between the last available bid and asked prices from one or more brokers or dealers as obtained from Loan Pricing Corporation, an independent third party pricing service. If price information is not available from Loan Pricing Corporation, or if the price information is deemed to be unreliable, price information will be obtained from an alternative loan interest pricing service. If no reliable price quotes are available from either the primary or alternative pricing service, broker quotes will be solicited. |
| | Event-linked bonds are valued at the bid price obtained from an independent third party pricing service. Other insurance-linked securities (including reinsurance sidecars, collateralized reinsurance and industry loss warranties) may be valued at the bid price obtained from an independent pricing service, or through a third party using a pricing matrix, insurance valuation models, or other fair value methods or techniques to provide an estimated value of the instrument. |
| | Equity securities that have traded on an exchange are valued by using the last sale price on the principal exchange where they are traded. Equity securities that have not traded on the date of valuation, or securities for which sale prices are not available, generally are valued using the mean between the last bid and asked prices or, if both last bid and asked prices are not available, at the last quoted bid price. Last sale and bid and asked prices are provided by independent third party pricing services. In the case of equity securities not traded on an exchange, prices are typically determined by independent third party pricing services using a variety of techniques and methods. |
| | The value of foreign securities is translated into U.S. dollars based on foreign currency exchange rate quotations supplied by a third party pricing source. Trading in non-U.S. equity securities is substantially completed each day at various times prior to the close of the NYSE. The values of such securities used in computing the net asset value of the Fund's shares are determined as of such times. The Adviser may use a fair value model developed by an independent pricing service to value non-U.S. equity securities. |
| | Futures contracts are generally valued at the closing settlement price established by the exchange on which they are traded. |
| | Swap contracts, including interest rate swaps, caps and floors (other than centrally cleared swap contracts), are valued at the dealer quotations obtained from reputable International Swap Dealers |
104Pioneer Bond Fund | Annual Report | 6/30/23
| | Association members. Centrally cleared swaps are valued at the daily settlement price provided by the central clearing counterparty. |
| | Repurchase agreements are valued at par. Cash may include overnight time deposits at approved financial institutions. |
| | Shares of open-end registered investment companies (including money market mutual funds) are valued at such funds’ net asset value. |
| | Securities or loan interests for which independent pricing services or broker-dealers are unable to supply prices or for which market prices and/or quotations are not readily available or are considered to be unreliable are valued by a fair valuation team comprised of certain personnel of the Adviser. The Adviser is designated as the valuation designee for the Fund pursuant to Rule 2a-5 under the 1940 Act. The Adviser’s fair valuation team is responsible for monitoring developments that may impact fair valued securities. |
| | Inputs used when applying fair value methods to value a security may include credit ratings, the financial condition of the company, current market conditions and comparable securities. The Adviser may use fair value methods if it is determined that a significant event has occurred after the close of the exchange or market on which the security trades and prior to the determination of the Fund's net asset value. Examples of a significant event might include political or economic news, corporate restructurings, natural disasters, terrorist activity or trading halts. Thus, the valuation of the Fund's securities may differ significantly from exchange prices, and such differences could be material. |
| B. | Investment Income and Transactions |
| | Dividend income is recorded on the ex-dividend date, except that certain dividends from foreign securities where the ex-dividend date may have passed are recorded as soon as the Fund becomes aware of the ex-dividend data in the exercise of reasonable diligence. |
| | Interest income, including interest on income-bearing cash accounts, is recorded on the accrual basis. Dividend and interest income are reported net of unrecoverable foreign taxes withheld at the applicable country rates and net of income accrued on defaulted securities. |
| | Interest and dividend income payable by delivery of additional shares is reclassified as PIK (payment-in-kind) income upon receipt and is included in interest and dividend income, respectively. |
Pioneer Bond Fund | Annual Report | 6/30/23105
| | Principal amounts of mortgage-backed securities are adjusted for monthly paydowns. Premiums and discounts related to certain mortgage-backed securities are amortized or accreted in proportion to the monthly paydowns. All discounts/premiums on purchase prices of debt securities are accreted/amortized for financial reporting purposes over the life of the respective securities, and such accretion/amortization is included in interest income. |
| | Security transactions are recorded as of trade date. Gains and losses on sales of investments are calculated on the identified cost method for both financial reporting and federal income tax purposes. |
| C. | Foreign Currency Translation |
| | The books and records of the Fund are maintained in U.S. dollars. Amounts denominated in foreign currencies are translated into U.S. dollars using current exchange rates. |
| | Net realized gains and losses on foreign currency transactions, if any, represent, among other things, the net realized gains and losses on foreign currency exchange contracts, disposition of foreign currencies and the difference between the amount of income accrued and the U.S. dollars actually received. Further, the effects of changes in foreign currency exchange rates on investments are not segregated on the Statement of Operations from the effects of changes in the market prices of those securities, but are included with the net realized and unrealized gain or loss on investments. |
| D. | Federal Income Taxes |
| | It is the Fund's policy to comply with the requirements of the Internal Revenue Code applicable to regulated investment companies and to distribute all of its net taxable income and net realized capital gains, if any, to its shareowners. Therefore, no provision for federal income taxes is required. As of June 30, 2023, the Fund did not accrue any interest or penalties with respect to uncertain tax positions, which, if applicable, would be recorded as an income tax expense on the Statement of Operations. Tax returns filed within the prior three years remain subject to examination by federal and state tax authorities. |
| | The amount and character of income and capital gain distributions to shareowners are determined in accordance with federal income tax rules, which may differ from U.S. GAAP. Distributions in excess of net investment income or net realized gains are temporary over distributions for financial statement purposes resulting from differences in the recognition or classification of income or distributions for financial |
106Pioneer Bond Fund | Annual Report | 6/30/23
| | statement and tax purposes. Capital accounts within the financial statements are adjusted for permanent book/tax differences to reflect tax character, but are not adjusted for temporary differences. |
| | At June 30, 2023, the Fund reclassified $28,042,829 to increase distributable earnings and $28,042,829 to decrease paid-in capital to reflect permanent book/tax differences. These adjustments have no impact on net assets or the results of operations. |
| | At June 30, 2023, the Fund was permitted to carry forward indefinitely $220,381,197 of short-term losses and $217,380,096 of long-term losses. |
| | The tax character of distributions paid during the years ended June 30, 2023 and June 30, 2022, was as follows: |
| | 2023 | 2022 |
| Distributions paid from: | | |
| Ordinary income | $136,139,918 | $196,324,519 |
| Long-term capital gains | — | 122,147,148 |
| Total | $136,139,918 | $318,471,667 |
The following shows the components of distributable earnings (losses) on a federal income tax basis at June 30, 2023:
| | 2023 |
| Distributable earnings/(losses): | |
| Undistributed ordinary income | $ 7,050,141 |
| Capital loss carryforward | (437,761,293) |
| Other book/tax temporary differences | (1,626,405) |
| Net unrealized depreciation | (380,764,558) |
| Total | $(813,102,115) |
The difference between book basis and tax basis unrealized depreciation is primarily attributable to the mark to market on futures contracts and credit default swaps, the tax deferral of losses on wash sales, realization for tax purposes of unrealized gains on investments in passive foreign investment companies and the book/tax differences in the adjustments relating to insurance-linked securities, and premium and amortization.
| E. | Fund Shares |
| | The Fund records sales and repurchases of its shares as of trade date. The Distributor earned $19,178 in underwriting commissions on the sale of Class A shares during the year ended June 30, 2023. |
Pioneer Bond Fund | Annual Report | 6/30/23107
| F. | Class Allocations |
| | Income, common expenses and realized and unrealized gains and losses are calculated at the Fund level and allocated daily to each class of shares based on its respective percentage of adjusted net assets at the beginning of the day. |
| | Distribution fees are calculated based on the average daily net asset value attributable to Class A, Class C and Class R shares of the Fund, respectively (see Note 5). Class K and Class Y shares do not pay distribution fees. All expenses and fees paid to the Fund's transfer agent for its services are allocated among the classes of shares based on the number of accounts in each class and the ratable allocation of related out-of-pocket expenses (see Note 4). |
| | The Fund declares as daily dividends substantially all of its net investment income. All dividends are paid on a monthly basis. Short-term capital gain distributions, if any, may be declared with the daily dividends. Distributions to shareowners are recorded as of the ex-dividend date. Distributions paid by the Fund with respect to each class of shares are calculated in the same manner and at the same time, except that net investment income dividends to Class A, Class C and Class Y shares can reflect different transfer agent and distribution expense rates. |
| G. | Risks |
| | The value of securities held by the Fund may go up or down, sometimes rapidly or unpredictably, due to general market conditions, such as real or perceived adverse economic, political or regulatory conditions, recessions, the spread of infectious illness or other public health issues, inflation, changes in interest rates, armed conflict including Russia's military invasion of Ukraine, sanctions against Russia, other nations or individuals or companies and possible countermeasures, lack of liquidity in the bond markets or adverse investor sentiment. In the past several years, financial markets have experienced increased volatility, depressed valuations, decreased liquidity and heightened uncertainty. These conditions may continue, recur, worsen or spread. Inflation and interest rates have increased and may rise further. These circumstances could adversely affect the value and liquidity of the Fund's investments and negatively impact the Fund's performance. |
| | The long-term impact of the COVID-19 pandemic and its subsequent variants on economies, markets, industries and individual issuers, are not known. Some sectors of the economy and individual issuers have experienced or may experience particularly large losses. Periods of |
108Pioneer Bond Fund | Annual Report | 6/30/23
| | extreme volatility in the financial markets, reduced liquidity of many instruments, increased government debt, inflation, and disruptions to supply chains, consumer demand and employee availability, may continue for some time. Following Russia's invasion of Ukraine, Russian securities lost all, or nearly all, their market value. Other securities or markets could be similarly affected by past or future political, geopolitical or other events or conditions. |
| | Governments and central banks, including the U.S. Federal Reserve, have taken extraordinary and unprecedented actions to support local and global economies and the financial markets. These actions have resulted in significant expansion of public debt, including in the U.S. The consequences of high public debt, including its future impact on the economy and securities markets, may not be known for some time. |
| | The U.S. and other countries are periodically involved in disputes over trade and other matters, which may result in tariffs, investment restrictions and adverse impacts on affected companies and securities. For example, the U.S. has imposed tariffs and other trade barriers on Chinese exports, has restricted sales of certain categories of goods to China, and has established barriers to investments in China. Trade disputes may adversely affect the economies of the U.S. and its trading partners, as well as companies directly or indirectly affected and financial markets generally. If the political climate between the U.S. and China does not improve or continues to deteriorate, if China were to attempt unification of Taiwan by force, or if other geopolitical conflicts develop or get worse, economies, markets and individual securities may be severely affected both regionally and globally, and the value of the Fund's assets may go down. |
| | At times, the Fund’s investments may represent industries or industry sectors that are interrelated or have common risks, making the Fund more susceptible to any economic, political, or regulatory developments or other risks affecting those industries and sectors. |
| | The Fund’s investments in foreign markets and countries with limited developing markets may subject the Fund to a greater degree of risk than investments in a developed market. These risks include disruptive political or economic conditions, military conflicts and sanctions, terrorism, sustained economic downturns, financial instability, less liquid trading markets, extreme price volatility, currency risks, reduction of government or central bank support, inadequate accounting standards, tariffs, tax disputes or other tax burdens, nationalization or expropriation of assets and the imposition of adverse governmental laws, arbitrary application of laws and regulations or lack |
Pioneer Bond Fund | Annual Report | 6/30/23109
| | of rule of law and investment and repatriation restrictions. Lack of information and less market regulation also may affect the value of these securities. Withholding and other non-U.S. taxes may decrease the Fund’s return. Non-U.S. issuers may be located in parts of the world that have historically been prone to natural disasters. Investing in depositary receipts is subject to many of the same risks as investing directly in non-U.S. issuers. Depositary receipts may involve higher expenses and may trade at a discount (or premium) to the underlying security. |
| | Russia launched a large-scale invasion of Ukraine on February 24, 2022. In response to the military action by Russia, various countries, including the U.S., the United Kingdom, and European Union issued broad-ranging economic sanctions against Russia and Belarus and certain companies and individuals. Since then, Russian securities have lost all, or nearly all, their market value, and many other issuers, securities and markets have been adversely affected. The United States and other countries may impose sanctions on other countries, companies and individuals in light of Russia’s military invasion. The extent and duration of the military action or future escalation of such hostilities, the extent and impact of existing and future sanctions, market disruptions and volatility, and the result of any diplomatic negotiations cannot be predicted. These and any related events could have a significant impact on the value and liquidity of certain Fund investments, on Fund performance and the value of an investment in the Fund, particularly with respect to securities and commodities, such as oil, natural gas and food commodities, as well as other sectors with exposure to Russian issuers or issuers in other countries affected by the invasion, and are likely to have collateral impacts on market sectors globally. |
| | The Fund may invest in REIT securities, the value of which can fall for a variety of reasons, such as declines in rental income, fluctuating interest rates, poor property management, environmental liabilities, uninsured damage, increased competition, or changes in real estate tax laws. |
| | Normally, the Fund invests at least 80% of its net assets (plus the amount of borrowings, if any, for investment purposes) in debt securities issued or guaranteed by the U.S. government, its agencies and instrumentalities, investment grade debt securities (including convertible debt) of corporate or other issuers and cash, cash equivalents and other short-term holdings. |
| | The market prices of the Fund's fixed income securities may fluctuate significantly when interest rates change. The value of your investment |
110Pioneer Bond Fund | Annual Report | 6/30/23
| | will generally go down when interest rates rise. A rise in rates tends to have a greater impact on the prices of longer term or duration securities. For example, if interest rates increase by 1%, the value of a Fund's portfolio with a portfolio duration of ten years would be expected to decrease by 10%, all other things being equal. In recent years interest rates and credit spreads in the U.S. have been at historic lows. The U.S. Federal Reserve has raised certain interest rates, and interest rates may continue to go up. A general rise in interest rates could adversely affect the price and liquidity of fixed income securities. The maturity of a security may be significantly longer than its effective duration. A security's maturity and other features may be more relevant than its effective duration in determining the security's sensitivity to other factors affecting the issuer or markets generally, such as changes in credit quality or in the yield premium that the market may establish for certain types of securities (sometimes called "credit spread"). In general, the longer its maturity the more a security may be susceptible to these factors. When the credit spread for a fixed income security goes up, or "widens," the value of the security will generally go down. |
| | If an issuer or guarantor of a security held by the Fund or a counterparty to a financial contract with the Fund defaults on its obligation to pay principal and/or interest, has its credit rating downgraded or is perceived to be less creditworthy, or the credit quality or value of any underlying assets declines, the value of your investment will typically decline. Changes in actual or perceived creditworthiness may occur quickly. The Fund could be delayed or hindered in its enforcement of rights against an issuer, guarantor or counterparty. |
| | The Fund may invests at least 80% of its total asset in below-investment-grade (high-yield) debt securities. Some of these high-yield securities may be convertible into equity securities of the issuer. Debt securities rated below investment-grade are commonly referred to as “junk bonds” and are considered speculative with respect to the issuer’s capacity to pay interest and repay principal. These securities involve greater risk of loss, are subject to greater price volatility, and may be less liquid and more difficult to value, especially during periods of economic uncertainty or change, than higher rated debt securities. |
| | The Fund may invest in mortgage-related and asset-backed securities. The value of mortgage-related and asset-backed securities will be influenced by factors affecting the assets underlying such securities. As a result, during periods of declining asset value, difficult or frozen credit markets, swings in interest rates, or deteriorating economic conditions, mortgage-related and asset-backed securities may decline in value, face valuation difficulties, become more volatile and/or become illiquid. |
Pioneer Bond Fund | Annual Report | 6/30/23111
| | Mortgage-backed securities tend to be more sensitive to changes in interest rate than other types of debt securities. These securities are also subject to prepayment and extension risks. Some of these securities may receive little or no collateral protection from the underlying assets and are thus subject to the risk of default. The risk of such defaults is generally higher in the case of mortgage-backed investments offered by non-governmental issuers and those that include so-called "sub-prime" mortgages. The structure of some of these securities may be complex and there may be less available information than for other types of debt securities. Upon the occurrence of certain triggering events or defaults, the Fund may become the holder of underlying assets at a time when those assets may be difficult to sell or may be sold only at a loss. |
| | The Fund may invest in credit risk transfer securities. Credit risk transfer securities are unguaranteed and unsecured debt securities issued by government sponsored enterprises and therefore are not directly linked to or backed by the underlying mortgage loans. As a result, in the event that a government sponsored enterprise fails to pay principal or interest on its credit risk transfer securities or goes through a bankruptcy, insolvency or similar proceeding, holders of such credit risk transfer securities have no direct recourse to the underlying mortgage loans and will generally receive recovery on par with other unsecured note holders in such a scenario. The risks associated with an investment in credit risk transfer securities are different than the risks associated with an investment in mortgage-backed securities issued by Fannie Mae and Freddie Mac, or other government sponsored enterprise or issued by a private issuer, because some or all of the mortgage default or credit risk associated with the un erlying mortgage loans is transferred to investors. As a result, investors in these securities could lose some or all of their investment in these securities if the underlying mortgage loans default. |
| | The Fund's investments, payment obligations and financing terms may be based on floating rates, such as LIBOR (London Interbank Offered Rate) or SOFR (Secured Overnight Financing Rate). ICE Benchmark Administration, the administrator of LIBOR, has ceased publication of most LIBOR settings on a representative basis. Actions by regulators have resulted in the establishment of alternative reference rates to LIBOR in most major currencies. In the U.S., a common benchmark replacement is based on the SOFR published by the Federal Reserve Bank of New York, including certain spread adjustments and benchmark replacement conforming changes, although other benchmark replacements (without or without spread adjustments) may be used in certain transactions. The impact of the transition from LIBOR on the |
112Pioneer Bond Fund | Annual Report | 6/30/23
| | Fund's transactions and financial markets generally cannot yet be determined. The transition away from LIBOR may lead to increased volatility and illiquidity in markets for instruments that have relied on LIBOR and may adversely affect the Fund's performance. |
| | With the increased use of technologies such as the Internet to conduct business, the Fund is susceptible to operational, information security and related risks. While the Fund’s Adviser has established business continuity plans in the event of, and risk management systems to prevent, limit or mitigate, such cyber-attacks, there are inherent limitations in such plans and systems, including the possibility that certain risks have not been identified. Furthermore, the Fund cannot control the cybersecurity plans and systems put in place by service providers to the Fund such as the Fund’s custodian and accounting agent, and the Fund’s transfer agent. In addition, many beneficial owners of Fund shares hold them through accounts at broker-dealers, retirement platforms and other financial market participants over which neither the Fund nor the Adviser exercises control. Each of these may in turn rely on service providers to them, which are also subject to the risk of cyber-attacks. Cybersecurity failures or breaches at the Adviser or the Fund’s service providers or intermediaries have the ability to cause disruptions and impact business operations, potentially resulting in financial losses, interference with the Fund’s ability to calculate its net asset value, impediments to trading, the inability of Fund shareowners to effect share purchases, redemptions or exchanges or receive distributions, loss of or unauthorized access to private shareowner information and violations of applicable privacy and other laws, regulatory fines, penalties, reputational damage, or additional compliance costs. Such costs and losses may not be covered under any insurance. In addition, maintaining vigilance against cyber-attacks may involve substantial costs over time, and system enhancements may themselves be subject to cyber-attacks. |
| | The Fund’s prospectus contains unaudited information regarding the Fund’s principal risks. Please refer to that document when considering the Fund’s principal risks. |
| H. | Restricted Securities |
| | Restricted Securities are subject to legal or contractual restrictions on resale. Restricted securities generally are resold in transactions exempt from registration under the Securities Act of 1933. Private placement securities are generally considered to be restricted except for those securities traded between qualified institutional investors under the provisions of Rule 144A of the Securities Act of 1933. |
Pioneer Bond Fund | Annual Report | 6/30/23113
| | Disposal of restricted investments may involve negotiations and expenses, and prompt sale at an acceptable price may be difficult to achieve. Restricted investments held by the Fund at June 30, 2023 are listed in the Schedule of Investments. |
| I. | Insurance-Linked Securities (“ILS”) |
| | The Fund invests in ILS. The Fund could lose a portion or all of the principal it has invested in an ILS, and the right to additional interest or dividend payments with respect to the security, upon the occurrence of one or more trigger events, as defined within the terms of an insurance-linked security. Trigger events, generally, are hurricanes, earthquakes, or other natural events of a specific size or magnitude that occur in a designated geographic region during a specified time period, and/or that involve losses or other metrics that exceed a specific amount. There is no way to accurately predict whether a trigger event will occur, and accordingly, ILS carry significant risk. The Fund is entitled to receive principal, and interest and/or dividend payments so long as no trigger event occurs of the description and magnitude specified by the instrument. In addition to the specified trigger events, ILS may expose the Fund to other risks, including but not limited to issuer (credit) default, adverse regulatory or jurisdictional interpretations and adverse tax consequences. |
| | The Fund’s investments in ILS may include event-linked bonds. ILS also may include special purpose vehicles (“SPVs”) or similar instruments structured to comprise a portion of a reinsurer’s catastrophe-oriented business, known as quota share instruments (sometimes referred to as reinsurance sidecars), or to provide reinsurance relating to specific risks to insurance or reinsurance companies through a collateralized instrument, known as collateralized reinsurance. Structured reinsurance investments also may include industry loss warranties (“ILWs”). A traditional ILW takes the form of a bilateral reinsurance contract, but there are also products that take the form of derivatives, collateralized structures, or exchange-traded instruments. |
| J. | Repurchase Agreements |
| | Repurchase agreements are arrangements under which the Fund purchases securities from a broker-dealer or a bank, called the counterparty, upon the agreement of the counterparty to repurchase the securities from the Fund at a later date, and at a specific price, which is typically higher than the purchase price paid by the Fund. The securities purchased serve as the Fund's collateral for the obligation of the counterparty to repurchase the securities. The value of the collateral, |
114Pioneer Bond Fund | Annual Report | 6/30/23
| | including accrued interest, is required to be equal to or in excess of the repurchase price. The collateral for all repurchase agreements is held in safekeeping in the customer-only account of the Fund's custodian or a sub-custodian of the Fund. The Adviser is responsible for determining that the value of the collateral remains at least equal to the repurchase price. In the event of a default by the counterparty, the Fund is entitled to sell the securities, but the Fund may not be able to sell them for the price at which they were purchased, thus causing a loss to the Fund. Additionally, if the counterparty becomes insolvent, there is some risk that the Fund will not have a right to the securities, or the immediate right to sell the securities. |
| | Open repurchase agreements at June 30, 2023 are disclosed in the Schedule of Investments. |
| K. | Futures Contracts |
| | The Fund may enter into futures transactions in order to attempt to hedge against changes in interest rates, securities prices and currency exchange rates or to seek to increase total return. Futures contracts are types of derivatives. |
| | Subsequent payments for futures contracts ("variation margin") are paid or received by the Fund, depending on the daily fluctuation in the value of the contracts, and are recorded by the Fund as unrealized appreciation or depreciation. Cash received from or paid to the broker related to previous margin movement is held in a segregated account at the broker and is recorded as either "Due from broker for futures" or "Due to broker for futures" on the Statement of Assets and Liabilities. When the contract is closed, the Fund realizes a gain or loss equal to the difference between the opening and closing value of the contract as well as any fluctuation in foreign currency exchange rates where applicable. Futures contracts are subject to market risk, interest rate risk and currency exchange rate risk. Changes in value of the contracts may not directly correlate to the changes in value of the underlying securities. With futures, there is reduced counterparty credit risk to the Fund since futures are exchange-traded and the exchange's clearinghouse, as counterparty to all exchange-traded futures, guarantees the futures against default. |
| | The average notional values of futures contracts long position and futures contracts short position during the year ended June 30, 2023 were $1,024,759,818 and $272,626,499, respectively. Open futures contracts outstanding at June 30, 2023 are listed in the Schedule of Investments. |
Pioneer Bond Fund | Annual Report | 6/30/23115
| L. | Credit Default Swap Contracts |
| | A credit default swap is a contract between a buyer of protection and a seller of protection against a pre-defined credit event or an underlying reference obligation, which may be a single security or a basket or index of securities. The Fund may buy or sell credit default swap contracts to seek to increase the Fund's income, or to attempt to hedge the risk of default on portfolio securities. A credit default swap index is used to hedge risk or take a position on a basket of credit entities or indices. |
| | As a seller of protection, the Fund would be required to pay the notional (or other agreed-upon) value of the referenced debt obligation to the counterparty in the event of a default by a U.S. or foreign corporate issuer of a debt obligation, which would likely result in a loss to the Fund. In return, the Fund would receive from the counterparty a periodic stream of payments during the term of the contract, provided that no event of default occurred. The maximum exposure of loss to the seller would be the notional value of the credit default swaps outstanding. If no default occurs, the Fund would keep the stream of payments and would have no payment obligation. The Fund may also buy credit default swap contracts in order to hedge against the risk of default of debt securities, in which case the Fund would function as the counterparty referenced above. |
| | As a buyer of protection, the Fund makes an upfront or periodic payment to the protection seller in exchange for the right to receive a contingent payment. An upfront payment made by the Fund, as the protection buyer, is recorded within the "Swap contracts, at value" line item on the Statement of Assets and Liabilities. Periodic payments received or paid by the Fund are recorded as realized gains or losses on the Statement of Operations. |
| | Credit default swap contracts are marked-to-market daily using valuations supplied by independent sources, and the change in value, if any, is recorded within the "Swap contracts, at value" line item on the Statement of Assets and Liabilities. Payments received or made as a result of a credit event or upon termination of the contract are recognized, net of the appropriate amount of the upfront payment, as realized gains or losses on the Statement of Operations. |
| | Credit default swap contracts involving the sale of protection may involve greater risks than if the Fund had invested in the referenced debt instrument directly. Credit default swap contracts are subject to general market risk, liquidity risk, counterparty risk and credit risk. If the Fund is a protection buyer and no credit event occurs, it will lose its investment. If the Fund is a protection seller and a credit event occurs, |
116Pioneer Bond Fund | Annual Report | 6/30/23
| | the value of the referenced debt instrument received by the Fund, together with the periodic payments received, may be less than the amount the Fund pays to the protection buyer, resulting in a loss to the Fund. In addition, obligations under sell protection credit default swaps may be partially offset by net amounts received from settlement of buy protection credit default swaps entered into by the Fund for the same reference obligation with the same counterparty. |
| | The Fund may invest in credit default swap index products ("CDX"). A CDX is a swap on an index of credit default swaps. CDXs allow an investor to manage credit risk or take a position on a basket of credit entities (such as credit default swaps or commercial mortgage-backed securities) in a more efficient manner than transacting in a single-name credit default swap. If a credit event occurs in one of the underlying companies, the protection is paid out via the delivery of the defaulted bond by the buyer of protection in return for a payment of notional value of the defaulted bond by the seller of protection or it may be settled through a cash settlement between the two parties. The underlying company is then removed from the index. If the Fund holds a long position in a CDX, the Fund would indirectly bear its proportionate share of any expenses paid by a CDX. A fund holding a long position in CDXs typically receives income from principal or interest paid on the underlying securities. By investing in CDXs, the Fund could be exposed to liquidity risk, counterparty risk, credit risk of the issuers of the underlying loan obligations and of the CDX markets, and operational risks. If there is a default by the CDX counterparty, the Fund will have contractual remedies pursuant to the agreements related to the transaction. CDXs also bear the risk that the Fund will not be able to meet its obligation to the counterparty. |
| | Certain swap contracts that are cleared through a central clearinghouse are referred to as centrally cleared swaps. All payments made or received by the Fund are pursuant to a centrally cleared swap contract with the central clearing party rather than the original counterparty. Upon entering into a centrally cleared swap contract, the Fund is required to make an initial margin deposit, either in cash or in securities. The daily change in value on open centrally cleared contracts is recorded as "Variation margin for centrally cleared swap contracts" on the Statement of Assets and Liabilities. Cash received from or paid to the broker related to previous margin movement is held in a segregated account at the broker and is recorded as either "Due from broker for swaps" or "Due to broker for swaps" on the Statement of Assets and Liabilities. The |
Pioneer Bond Fund | Annual Report | 6/30/23117
| | amount of cash deposited with a broker as collateral at June 30, 2023 is recorded as "Swaps collateral" on the Statement of Assets and Liabilities. |
| | The average notional value of credit default swap contracts buy protection open during the year ended June 30, 2023 was $509,334,280. Open credit default swap contracts at June 30, 2023 are listed in the Schedule of Investments. |
2. Management Agreement
The Adviser manages the Fund’s portfolio. Management fees payable under the Fund’s Investment Management Agreement with the Adviser are calculated daily and paid monthly at the annual rate of 0.40% of the Fund’s average daily net assets up to $500 million, 0.35% of the next $500 million of the Fund’s average daily net assets, 0.30% of the next $1 billion of the Fund’s average daily net assets, 0.25% of the next $8 billion of the Fund’s average daily net assets, and 0.225% of the Fund’s average daily net assets over $10 billion. For the year ended June 30, 2023, the effective management fee (excluding waivers and/or assumption of expenses) was equivalent to 0.29% of the Fund’s average daily net assets.
In addition, under the management and administration agreements, certain other services and costs, including accounting, regulatory reporting and insurance premiums, are paid by the Fund as administrative reimbursements.
3. Compensation of Officers and Trustees
The Fund pays an annual fee to its Trustees. The Adviser reimburses the Fund for fees paid to the Interested Trustees. Except for the chief compliance officer, the Fund does not pay any salary or other compensation to its officers. The Fund pays a portion of the chief compliance officer's compensation for his services as the Fund's chief compliance officer. Amundi US pays the remaining portion of the chief compliance officer's compensation. For the year ended June 30, 2023, the Fund paid $284,995 in Officers' and Trustees' compensation, which is reflected on the Statement of Operations as Officers' and Trustees' fees. At June 30, 2023, on its Statement of Assets and Liabilities, the Fund did not have a payable for Trustees' fees and had a payable for administrative expenses of $128,362, which includes the payable for Officers' compensation.
4. Transfer Agent
BNY Mellon Investment Servicing (US) Inc. serves as the transfer agent to the Fund at negotiated rates. Transfer agent fees and payables shown on the Statement of Operations and the Statement of Assets and Liabilities,
118Pioneer Bond Fund | Annual Report | 6/30/23
respectively, include sub-transfer agent expenses incurred through the Fund’s omnibus relationship contracts.
In addition, the Fund reimbursed the transfer agent for out-of-pocket expenses incurred by the transfer agent related to shareowner communications activities such as proxy and statement mailings, and outgoing phone calls. For the year ended June 30, 2023, such out-of-pocket expenses by class of shares were as follows:
| Shareowner Communications: | |
| Class A | $ 79,706 |
| Class C | 4,350 |
| Class K | 80,860 |
| Class R | 4,530 |
| Class Y | 119,305 |
| Total | $288,751 |
5. Distribution and Service Plans
The Fund has adopted a distribution plan (the “Plan”) pursuant to Rule 12b-1 under the 1940 Act with respect to its Class A, Class C and Class R shares. Pursuant to the Plan, the Fund pays the Distributor 0.25% of the Fund's average daily net assets attributable to Class A shares as compensation for personal services and/or account maintenance services or distribution services with regard to Class A shares. Pursuant to the Plan, the Fund also pays the Distributor 1.00% of the average daily net assets attributable to Class C shares. The fee for Class C shares consists of a 0.25% service fee and a 0.75% distribution fee paid as compensation for personal services and/or account maintenance services or distribution services with regard to Class C shares. Pursuant to the Plan, the Fund further pays the Distributor 0.50% of the average daily net assets attributable to Class R shares for distribution services.
The Fund also has adopted a separate service plan for Class R shares (the “Service Plan”). The Service Plan authorizes the Fund to pay securities dealers, plan administrators or other service organizations that agree to provide certain services to retirement plans or plan participants holding shares of the Fund a service fee of up to 0.25% of the Fund’s average daily net assets attributable to Class R shares held by such plans.
In addition, redemptions of Class A and Class C shares may be subject to a contingent deferred sales charge (“CDSC”). A CDSC of 1.00% may be imposed on redemptions of certain net asset value purchases of Class A shares within 12 months of purchase. Redemptions of Class C shares within 12 months of purchase are subject to a CDSC of 1.00% based on the lower of cost or market value of shares being redeemed. Shares purchased as part of an exchange remain subject to any CDSC that applied to the original
Pioneer Bond Fund | Annual Report | 6/30/23119
purchase of those shares. There is no CDSC for Class K, Class R or Class Y shares. Proceeds from the CDSCs are paid to the Distributor. For the year ended June 30, 2023, CDSCs in the amount of $8,725 were paid to the Distributor.
6. Line of Credit Facility
The Fund, along with certain other funds in the Pioneer Family of Funds, participates in a committed, unsecured revolving line of credit (“credit facility”). Borrowings are used solely for temporary or emergency purposes. The Fund may borrow up to the lesser of the amount available under the credit facility or the limits set for borrowing by the Fund’s prospectus and the 1940 Act. The Fund participates in a credit facility in the amount of $380 million. Under such credit facility, depending on the type of loan, interest on borrowings is payable at the Secured Overnight Financing Rate ("SOFR") plus a credit spread. The Fund also pays both an upfront fee and an annual commitment fee to participate in the credit facility. The upfront fee in the amount of 0.15% of the total credit facility and the commitment fee in the amount of 0.30% of the daily unused portion of each lender's commitment are allocated among participating funds based on an allocation schedule set forth in the credit agreement. For the year ended June 30, 2023, the Fund had no borrowings under the credit facility.
7. Additional Disclosures about Derivative Instruments and Hedging Activities
The Fund’s use of derivatives may enhance or mitigate the Fund’s exposure to the following risks:
Interest rate risk relates to the fluctuations in the value of interest-bearing securities due to changes in the prevailing levels of market interest rates.
Credit risk relates to the ability of the issuer of a financial instrument to make further principal or interest payments on an obligation or commitment that it has to the Fund.
Foreign exchange rate risk relates to fluctuations in the value of an asset or liability due to changes in currency exchange rates.
Equity risk relates to the fluctuations in the value of financial instruments as a result of changes in market prices (other than those arising from interest rate risk or foreign exchange rate risk), whether caused by factors specific to an individual investment, its issuer, or all factors affecting all instruments traded in a market or market segment.
120Pioneer Bond Fund | Annual Report | 6/30/23
Commodity risk relates to the risk that the value of a commodity or commodity index will fluctuate based on increases or decreases in the commodities market and factors specific to a particular industry or commodity.
The fair value of open derivative instruments (not considered to be hedging instruments for accounting disclosure purposes) by risk exposure at June 30, 2023, was as follows:
Statement of Assets
and Liabilities | Interest
Rate Risk | Credit
Risk | Foreign
Exchange
Rate Risk | Equity
Risk | Commodity
Risk |
| Liabilities | | | | | |
| Net unrealized depreciation on futures contracts* | $13,412,100 | $ — | $ — | $ — | $ — |
| Swap contracts at value | — | 12,551,436 | — | — | — |
| Total Value | $13,412,100 | $12,551,436 | $— | $— | $— |
| | |
| * | Includes cumulative unrealized appreciation (depreciation) of futures contracts as reported in the Schedule of Investments. Only net variation margin is reported within the assets and/or liabilities on the Statement of Assets and Liabilities. |
The effect of derivative instruments (not considered to be hedging instruments for accounting disclosure purposes) on the Statement of Operations by risk exposure at June 30, 2023 was as follows:
| Statement of Operations | Interest
Rate Risk | Credit
Risk | Foreign
Exchange
Rate Risk | Equity
Risk | Commodity
Risk |
| Net Realized Gain (Loss) on | | | | | |
| Futures contracts | $ (54,018,571) | $ — | $ — | $ — | $ — |
| Swap contracts | — | (37,178,351) | — | — | — |
| Total Value | $(54,018,571) | $(37,178,351) | $— | $— | $— |
| Change in Net Unrealized Appreciation (Depreciation) on | | | | | |
| Futures contracts | $ (5,979,750) | $ — | $ — | $ — | $ — |
| Swap contracts | — | (26,959,034) | — | — | — |
| Total Value | $ (5,979,750) | $ (26,959,034) | $— | $— | $— |
8. In-Kind Redemption
In accordance with the procedures adopted by the Board of Trustees of the Fund, the Fund may distribute portfolio securities rather than cash as payment for a redemption of Fund shares (“in-kind redemption”). For financial reporting purposes, the Fund recognizes gains and losses on in-kind redemptions to the extent the value of the distributed securities on the date of redemption exceeds the cost of those securities. Gains and losses realized on in-kind redemptions are not recognized for tax purposes and are reclassified from undistributed realized gain/(loss) to paid-in capital.
Pioneer Bond Fund | Annual Report | 6/30/23121
During the year ended June 30, 2023, the Fund did not record any redemptions in-kind. For the year ended June 30, 2022, the Fund recorded a redemption in-kind of portfolio securities and cash that was valued at $435,749,235. The redeeming shareholder received a pro-rata share of the securities held by the Fund in the in-kind redemption. The distribution of such securities generated a realized gain of $24,092,752 for the Fund.
122Pioneer Bond Fund | Annual Report | 6/30/23
Report of Independent Registered Public Accounting Firm
To the Board of Trustees and Shareholders of
Pioneer Bond Fund:
Opinion on the Financial Statements
We have audited the accompanying statement of assets and liabilities of Pioneer Bond Fund (the “Fund”), including the schedule of investments, as of June 30, 2023, and the related statement of operations for the year then ended, the statements of changes in net assets for each of the two years in the period then ended, the financial highlights for each of the five years in the period then ended and the related notes (collectively referred to as the “financial statements”). In our opinion, the financial statements present fairly, in all material respects, the financial position of the Fund at June 30, 2023, the results of its operations for the year then ended, the changes in its net assets for each of the two years in the period then ended, and its financial highlights for each of the five years in the period then ended in conformity with U.S. generally accepted accounting principles.
Basis for Opinion
These financial statements are the responsibility of the Fund’s management. Our responsibility is to express an opinion on the Fund’s financial statements based on our audits. We are a public accounting firm registered with the Public Company Accounting Oversight Board (United States) ("PCAOB") and are required to be independent with respect to the Fund in accordance with the U.S. federal securities laws and the applicable rules and regulations of the Securities and Exchange Commission and the PCAOB.
We conducted our audits in accordance with the standards of the PCAOB. Those standards require that we plan and perform the audit to obtain reasonable assurance about whether the financial statements are free of material misstatement, whether due to error or fraud. The Fund is not required to have, nor were we engaged to perform, an audit of the Fund’s internal control over financial reporting. As part of our audits, we are required to obtain an understanding of internal control over financial reporting, but not for the purpose of expressing an opinion on the effectiveness of the Fund’s internal control over financial reporting. Accordingly, we express no such opinion.
Our audits included performing procedures to assess the risks of material misstatement of the financial statements, whether due to error or fraud, and performing procedures that respond to those risks. Such procedures
Pioneer Bond Fund | Annual Report | 6/30/23123
included examining, on a test basis, evidence regarding the amounts and disclosures in the financial statements. Our procedures included confirmation of securities owned as of June 30, 2023, by correspondence with the custodian, brokers and others; when replies were not received from brokers and others, we performed other auditing procedures. Our audits also included evaluating the accounting principles used and significant estimates made by management, as well as evaluating the overall presentation of the financial statements. We believe that our audits provide a reasonable basis for our opinion.
We have served as the auditor of one or more investment companies in the Pioneer family of funds since 2017.
Boston, Massachusetts
August 28, 2023
124Pioneer Bond Fund | Annual Report | 6/30/23
Additional Information (unaudited)
Qualified interest income is exempt from nonresident alien (NRA) tax withholding. The percentage of the Fund’s ordinary income distributions derived from qualified interest income was 77.28%.
Pioneer Bond Fund | Annual Report | 6/30/23125
Statement Regarding Liquidity Risk Management Program
As required by law, the Fund has adopted and implemented a liquidity risk management program (the “Program”) that is designed to assess and manage liquidity risk. Liquidity risk is the risk that the Fund could not meet requests to redeem its shares without significant dilution of remaining investors’ interests in the Fund. The Fund’s Board of Trustees designated a liquidity risk management committee (the “Committee”) consisting of employees of Amundi Asset Management US, Inc. (the “Adviser”) to administer the Program.
The Committee provided the Board of Trustees with a report that addressed the operation of the Program and assessed its adequacy and effectiveness of implementation (the “Report”). The Report covered the period from January 1, 2022 through December 31, 2022 (the “Reporting Period”).
The Report confirmed that, throughout the Reporting Period, the Committee had monitored the Fund’s portfolio liquidity and liquidity risk on an ongoing basis, as described in the Program and in Board reporting throughout the Reporting Period.
The Report discussed the Committee’s annual review of the Program, which addressed, among other things, the following elements of the Program:
The Committee reviewed the Fund’s investment strategy and liquidity of portfolio investments during both normal and reasonably foreseeable stressed conditions. The Committee noted that the Fund’s investment strategy continues to be appropriate for an open-end fund, taking into account, among other things, whether and to what extent the Fund held less liquid and illiquid assets and the extent to which any such investments affected the Fund’s ability to meet redemption requests. In managing and reviewing the Fund’s liquidity risk, the Committee also considered the extent to which the Fund’s investment strategy involves a relatively concentrated portfolio or large positions in particular issuers, the extent to which the Fund uses borrowing for investment purposes, and the extent to which the Fund uses derivatives (including for hedging purposes). The Committee also reviewed the Fund’s short-term and long-term cash flow projections during both normal and reasonably foreseeable stressed conditions. In assessing the Fund’s cash flow projections, the Committee considered, among other factors, historical net redemption activity, redemption policies, ownership concentration, distribution channels, and the degree of certainty associated with the Fund’s short-term and long-term cash flow projections. The Committee also considered the Fund’s holdings of cash and cash equivalents, as well as borrowing arrangements
126Pioneer Bond Fund | Annual Report | 6/30/23
and other funding sources, including, if applicable, the Fund’s participation in a credit facility, as components of the Fund’s ability to meet redemption requests. The Fund has adopted an in-kind redemption policy which may be utilized to meet larger redemption requests.
The Committee reviewed the Program’s liquidity classification methodology for categorizing the Fund’s investments into one of four liquidity buckets. In reviewing the Fund’s investments, the Committee considered, among other factors, whether trading varying portions of a position in a particular portfolio investment or asset class in sizes the Fund would reasonably anticipate trading, would be reasonably expected to significantly affect liquidity.
The Committee performed an analysis to determine whether the Fund is required to maintain a Highly Liquid Investment Minimum, and determined that no such minimum is required because the Fund primarily holds highly liquid investments.
The Report stated that the Committee concluded the Program operates adequately and effectively, in all material respects, to assess and manage the Fund’s liquidity risk throughout the Reporting Period.
Pioneer Bond Fund | Annual Report | 6/30/23 127
Trustees, Officers and Service Providers
Investment Adviser and Administrator
Amundi Asset Management US, Inc.
Custodian and Sub-Administrator
The Bank of New York Mellon Corporation
Independent Registered Public Accounting Firm
Ernst & Young LLP
Principal Underwriter
Amundi Distributor US, Inc.
Legal Counsel
Morgan, Lewis & Bockius LLP
Transfer Agent
BNY Mellon Investment Servicing (US) Inc.
Proxy Voting Policies and Procedures of the Fund are available without charge, upon request, by calling our toll free number (1-800-225-6292). Information regarding how the Fund voted proxies relating to portfolio securities during the most recent 12-month period ended June 30 is publicly available to shareowners at www.amundi.com/us. This information is also available on the Securities and Exchange Commission’s web site at www.sec.gov.
Trustees and Officers
The Fund's Trustees and officers are listed below, together with their principal occupations and other directorships they have held during at least the past five years. Trustees who are interested persons of the Fund within the meaning of the 1940 Act are referred to as Interested Trustees. Trustees who are not interested persons of the Fund are referred to as Independent Trustees. Each of the Trustees serves as a Trustee of each of the 51 U.S. registered investment portfolios for which Amundi US serves as investment adviser (the “Pioneer Funds”). The address for all Trustees and all officers of the Fund is 60 State Street, Boston, Massachusetts 02109.
The Statement of Additional Information of the Fund includes additional information about the Trustees and is available, without charge, upon request, by calling 1-800-225-6292.
128Pioneer Bond Fund | Annual Report | 6/30/23
Name, Age and Position
Held With the Fund | Term of Office and
Length of Service | Principal Occupation(s) During At Least The Past Five Years | Other Directorships Held by Trustee
During At Least The Past Five Years |
Thomas J. Perna (72)
Chairman of the Board
and Trustee | Trustee since 2006.
Serves until a successor
trustee is elected or
earlier retirement
or removal. | Private investor (2004 – 2008 and 2013 – present); Chairman (2008 – 2013) and Chief Executive Officer (2008 – 2012), Quadriserv, Inc.
(technology products for securities lending industry); and Senior
Executive Vice President, The Bank of New York (financial and securities services) (1986 – 2004) | Director, Broadridge Financial
Solutions, Inc. (investor
communications and securities
processing provider for financial
services industry) (2009 – present);
Director, Quadriserv, Inc. (2005 –
2013); and Commissioner, New
Jersey State Civil Service
Commission (2011 – 2015) |
John E. Baumgardner,
Jr. (72)*
Trustee | Trustee since 2019.
Serves until a successor
trustee is elected or
earlier retirement
or removal. | Of Counsel (2019 – present), Partner (1983-2018), Sullivan & Cromwell LLP (law firm). | Chairman, The Lakeville Journal
Company, LLC, (privately-held
community newspaper group)
(2015-present) |
Diane Durnin (66)
Trustee | Trustee since 2019.
Serves until a successor
trustee is elected or
earlier retirement
or removal. | Managing Director - Head of Product Strategy and Development, BNY Mellon Investment Management (investment management firm) (2012-2018); Vice Chairman – The Dreyfus Corporation (2005 – 2018): Executive Vice President Head of Product, BNY Mellon Investment Management (2007-2012); Executive Director- Product Strategy, Mellon Asset Management (2005-2007); Executive Vice President Head of Products, Marketing and Client Service, Dreyfus Corporation (investment management firm) (2000-2005); Senior Vice President Strategic Product and Business Development, Dreyfus Corporation (1994-2000) | None |
| * Mr. Baumgardner is Of Counsel to Sullivan & Cromwell LLP, which acts as counsel to the Independent Trustees of each Pioneer Fund. |
Pioneer Bond Fund | Annual Report | 6/30/23129
Independent Trustees (continued)
Name, Age and Position
Held With the Fund | Term of Office and
Length of Service | Principal Occupation(s) During At Least The Past Five Years | Other Directorships Held by Trustee
During At Least The Past Five Years |
Benjamin M. Friedman (78)
Trustee | Trustee since 2008.
Serves until a successor
trustee is elected or
earlier retirement
or removal. | William Joseph Maier Professor of Political Economy, Harvard University (1972 – present) | Trustee, Mellon Institutional Funds
Investment Trust and Mellon
Institutional Funds Master Portfolio
(oversaw 17 portfolios in fund
complex) (1989 - 2008) |
130Pioneer Bond Fund | Annual Report | 6/30/23
Name, Age and Position
Held With the Fund | Term of Office and
Length of Service | Principal Occupation(s) During At Least The Past Five Years | Other Directorships Held by Trustee
During At Least The Past Five Years |
Craig C. MacKay (60)
Trustee | Trustee since 2021.
Serves until a successor
trustee is elected or
earlier retirement
or removal. | Partner, England & Company, LLC (advisory firm) (2012 – present); Group Head – Leveraged Finance Distribution, Oppenheimer & Company (investment bank) (2006 – 2012); Group Head – Private Finance & High Yield Capital Markets Origination, SunTrust Robinson Humphrey (investment bank) (2003 – 2006); and Founder and Chief Executive Officer, HNY Associates, LLC (investment bank) (1996 – 2003) | Director, Equitable Holdings, Inc.
(financial services holding company)
(2022 – present); Board Member of
Carver Bancorp,
Inc. (holding company) and Carver
Federal Savings Bank, NA (2017 –
present); Advisory Council Member,
MasterShares ETF (2016 – 2017);
Advisory Council Member, The Deal
(financial market information
publisher) (2015 – 2016); Board
Co-Chairman and Chief Executive
Officer, Danis Transportation
Company (privately-owned
commercial carrier) (2000 – 2003);
Board Member and Chief Financial
Officer, Customer Access Resources
(privately-owned teleservices
company) (1998 – 2000); Board
Member, Federation of Protestant
Welfare Agencies (human services
agency) (1993 – present); and
Board Treasurer, Harlem Dowling
Westside Center (foster care
agency) (1999 – 2018) |
Pioneer Bond Fund | Annual Report | 6/30/23131
Independent Trustees (continued)
Name, Age and Position
Held With the Fund | Term of Office and
Length of Service | Principal Occupation(s) During At Least The Past Five Years | Other Directorships Held by Trustee
During At Least The Past Five Years |
Lorraine H. Monchak (67)
Trustee | Trustee since 2017.
(Advisory Trustee from
2014 - 2017). Serves
until a successor trustee
is elected or earlier
retirement or removal. | Chief Investment Officer, 1199 SEIU Funds (healthcare workers union pension funds) (2001 – present); Vice President – International Investments Group, American International Group, Inc. (insurance company) (1993 – 2001); Vice President – Corporate Finance and Treasury Group, Citibank, N.A. (1980 – 1986 and 1990 – 1993); Vice President – Asset/Liability Management Group, Federal Farm Funding Corporation (government-sponsored issuer of debt securities) (1988 – 1990); Mortgage Strategies Group, Shearson Lehman Hutton, Inc. (investment bank) (1987 – 1988); Mortgage Strategies Group, Drexel Burnham Lambert, Ltd. (investment bank) (1986 – 1987) | None |
Marguerite A. Piret (75)
Trustee | Trustee since 1996.
Serves until a successor
trustee is elected or
earlier retirement
or removal. | Chief Financial Officer, American Ag Energy, Inc. (controlled environment and agriculture company) (2016 – present); President
and Chief Executive Officer, Metric Financial Inc. (formerly known as
Newbury Piret Company) (investment banking firm) (1981 – 2019) | Director of New America High
Income Fund, Inc. (closed-end
investment company) (2004 –
present); and Member, Board of
Governors, Investment Company
Institute (2000 – 2006) |
Fred J. Ricciardi (76)
Trustee | Trustee since 2014.
Serves until a successor
trustee is elected or
earlier retirement
or removal. | Private investor (2020 – present); Consultant (investment company services) (2012 – 2020); Executive Vice President, BNY Mellon (financial and investment company services) (1969 – 2012); Director, BNY International Financing Corp. (financial services) (2002 – 2012); Director, Mellon Overseas Investment Corp. (financial services) (2009 – 2012); Director, Financial Models (technology) (2005-2007); Director, BNY Hamilton Funds, Ireland (offshore investment companies) (2004-2007); Chairman/Director, AIB/BNY Securities Services, Ltd., Ireland (financial services) (1999-2006); Chairman, BNY Alternative Investment Services, Inc. (financial services) (2005-2007) | None |
132Pioneer Bond Fund | Annual Report | 6/30/23
Name, Age and Position
Held With the Fund | Term of Office and
Length of Service | Principal Occupation(s) During At Least The Past Five Years | Other Directorships Held by Trustee
During At Least The Past Five Years |
Lisa M. Jones (61)**
Trustee, President and Chief
Executive Officer | Trustee since 2017. Serves
until a successor trustee is
elected or earlier retirement
or removal | Director, CEO and President of Amundi US, Inc. (investment management firm) (since September 2014); Director, CEO and President of Amundi Asset Management US, Inc. (since September 2014); Director, CEO and President of Amundi Distributor US, Inc. (since September 2014); Director, CEO and President of Amundi Asset Management US, Inc. (since September 2014); Chair, Amundi US, Inc., Amundi Distributor US, Inc. and Amundi Asset Management US, Inc. (September 2014 – 2018); Managing Director, Morgan Stanley Investment Management (investment management firm) (2010 – 2013); Director of Institutional Business, CEO of International, Eaton Vance Management (investment management firm) (2005 – 2010); Director of Amundi Holdings US, Inc. (since 2017) | Director of Clearwater Analytics (provider of
web-based investment accounting
software for reporting and
reconciliation services)
(September 2022 – present) |
Kenneth J. Taubes (65)**
Trustee | Trustee since 2014. Serves
until a successor trustee is
elected or earlier retirement
or removal | Director and Executive Vice President (since 2008) and Chief Investment Officer, U.S. (since 2010) of Amundi US, Inc. (investment management firm); Director and Executive Vice President and Chief Investment Officer, U.S. of Amundi US (since 2008); Executive Vice President and Chief Investment Officer, U.S. of Amundi Asset Management US, Inc. (since 2009); Portfolio Manager of Amundi US (since 1999); Director of Amundi Holdings US, Inc. (since 2017) | None |
| ** Ms. Jones and Mr. Taubes are Interested Trustees because they are officers or directors of the Fund’s investment adviser and certain of its affiliates. |
Pioneer Bond Fund | Annual Report | 6/30/23133
Name, Age and Position
Held With the Fund | Term of Office and
Length of Service | Principal Occupation(s) During At Least The Past Five Years | Other Directorships Held by Officer
During At Least The Past Five Years |
Christopher J. Kelley (58)
Secretary and Chief
Legal Officer | Since 2010. Serves at
the discretion of
the Board | Vice President and Associate General Counsel of Amundi US since January 2008; Secretary and Chief Legal Officer of all of the Pioneer Funds since June 2010; Assistant Secretary of all of the Pioneer Funds from September 2003 to May 2010; Vice President and Senior Counsel of Amundi US from July 2002 to December 2007 | None |
Thomas Reyes (60)
Assistant Secretary | Since 2010. Serves at
the discretion of
the Board | Assistant General Counsel of Amundi US since May 2013 and Assistant Secretary of all the Pioneer Funds since June 2010; Counsel of Amundi US from June 2007 to May 2013 | None |
Heather L. Melito-Dezan (46)
Assistant Secretary | Since 2022. Serves at
the discretion of
the Board | Director - Trustee and Board Relationships of Amundi US since September 2019; Assistant Secretary of Amundi US, Inc. since July 2020: Assistant Secretary of Amundi Asset Management US, Inc. since July 2020: Assistant Secretary of Amundi Distributor US, Inc. since July 2020; Assistant Secretary of all the Pioneer Funds since September 2022; Private practice from 2017 – 2019. | None |
Anthony J. Koenig, Jr. (59)
Treasurer and
Chief Financial and
Accounting Officer | Since 2021. Serves at
the discretion of
the Board | Managing Director, Chief Operations Officer and Fund Treasurer of Amundi US since May 2021; Treasurer of all of the Pioneer Funds since May 2021; Assistant Treasurer of all of the Pioneer Funds from January 2021 to May 2021; and Chief of Staff, US Investment Management of Amundi US from May 2008 to January 2021 | None |
Luis I. Presutti (58)
Assistant Treasurer | Since 2000. Serves at
the discretion of
the Board | Director – Fund Treasury of Amundi US since 1999; and Assistant Treasurer of all of the Pioneer Funds since 1999 | None |
Gary Sullivan (65)
Assistant Treasurer | Since 2002. Serves at
the discretion of
the Board | Senior Manager – Fund Treasury of Amundi US since 2012; and Assistant Treasurer of all of the Pioneer Funds since 2002 | None |
134Pioneer Bond Fund | Annual Report | 6/30/23
Name, Age and Position
Held With the Fund | Term of Office and
Length of Service | Principal Occupation(s) During At Least The Past Five Years | Other Directorships Held by Officer
During At Least The Past Five Years |
Antonio Furtado (41)
Assistant Treasurer | Since 2020. Serves at
the discretion of
the Board | Fund Oversight Manager – Fund Treasury of Amundi US since 2020; Assistant Treasurer of all of the Pioneer Funds since 2020; and Senior Fund Treasury Analyst from 2012 - 2020 | None |
Michael Melnick (52)
Assistant Treasurer | Since 2021. Serves at
the discretion of
the Board | Vice President - Deputy Fund Treasurer of Amundi US since May 2021; Assistant Treasurer of all of the Pioneer Funds since July 2021; Director of Regulatory Reporting of Amundi US from 2001 – 2021; and Director of Tax of Amundi US from 2000 - 2001 | None |
John Malone (52)
Chief Compliance Officer | Since 2018. Serves at
the discretion of
the Board | Managing Director, Chief Compliance Officer of Amundi US Asset Management; Amundi Asset Management US, Inc.; and the Pioneer Funds since September 2018; Chief Compliance Officer of Amundi Distributor US, Inc. since January 2014. | None |
Brandon Austin (51)
Anti-Money
Laundering Officer | Since 2022. Serves at
the discretion of
the Board | Director, Financial Security – Amundi Asset Management; Anti-Money Laundering Officer of all the Pioneer Funds since March 2022 Director of Financial Security of Amundi US since July 2021; Vice President, Head of BSA, AML and OFAC, Deputy Compliance Manager, Crédit Agricole Indosuez Wealth Management (investment management firm) (2013 – 2021) | None |
Pioneer Bond Fund | Annual Report | 6/30/23135
How to Contact Amundi
We are pleased to offer a variety of convenient ways for you to contact us for assistance or information.
Call us for:
Account Information, including existing accounts,
new accounts, prospectuses, applications
and service forms
1-800-225-6292
FactFoneSM for automated fund yields, prices,
account information and transactions
1-800-225-4321
| Retirement plans information | 1-800-622-0176 |
Write to us:
Amundi
P.O. Box 534427
Pittsburgh, PA 15253-4427
| Our toll-free fax | 1-800-225-4240 |
| Our internet e-mail address | us.askamundi@amundi.com
(for general questions about Amundi only) |
Visit our web site: www.amundi.com/us
This report must be preceded or accompanied by a prospectus.
The Fund files a complete schedule of portfolio holdings with the Securities and Exchange Commission for the first and third quarters of each fiscal year as an exhibit to its reports on Form N-PORT. Shareholders may view the filed Form N-PORT by visiting the Commission’s web site at https://www.sec.gov.
Amundi Asset Management US, Inc.
60 State Street
Boston, MA 02109
www.amundi.com/us
Securities offered through Amundi Distributor US, Inc.
60 State Street, Boston, MA 02109
Underwriter of Pioneer Mutual Funds, Member SIPC
© 2023 Amundi Asset Management US, Inc. 19398-17-0823
ITEM 2. CODE OF ETHICS.
(a) Disclose whether, as of the end of the period covered by the report, the registrant has adopted a code of ethics that applies to the registrant’s principal executive officer, principal financial officer, principal accounting officer or controller, or persons performing similar functions, regardless of whether these individuals are employed by the registrant or a third party. If the registrant has not adopted such a code of ethics, explain why it has not done so.
The registrant has adopted, as of the end of the period covered by this report, a code of ethics that applies to the registrant’s principal executive officer, principal financial officer, principal accounting officer and controller.
(b) For purposes of this Item, the term “code of ethics” means written standards that are reasonably designed to deter wrongdoing and to promote:
(1) Honest and ethical conduct, including the ethical handling of actual or apparent conflicts of interest between personal and professional relationships;
(2) Full, fair, accurate, timely, and understandable disclosure in reports and documents that a registrant files with, or submits to, the Commission and in other public communications made by the registrant;
(3) Compliance with applicable governmental laws, rules, and regulations;
(4) The prompt internal reporting of violations of the code to an appropriate person or persons identified in the code; and
(5) Accountability for adherence to the code.
(c) The registrant must briefly describe the nature of any amendment, during the period covered by the report, to a provision of its code of ethics that applies to the registrant’s principal executive officer, principal financial officer, principal accounting officer or controller, or persons performing similar functions, regardless of whether these individuals are employed by the registrant or a third party, and that relates to any element of the code of ethics definition enumerated in paragraph (b) of this Item. The registrant must file a copy of any such amendment as an exhibit pursuant to Item 10(a), unless the registrant has elected to satisfy paragraph (f) of this Item by posting its code of ethics on its website pursuant to paragraph (f)(2) of this Item, or by undertaking to provide its code of ethics to any person without charge, upon request, pursuant to paragraph (f)(3) of this Item.
The registrant has made no amendments to the code of ethics during the period covered by this report.
(d) If the registrant has, during the period covered by the report, granted a waiver, including an implicit waiver, from a provision of the code of ethics to the registrant’s principal executive officer, principal financial officer, principal accounting officer or controller, or persons performing similar functions, regardless of whether these individuals are employed by the registrant or a third party, that relates to one or more of the items set forth in paragraph (b) of this Item, the registrant must briefly describe the nature of the waiver, the name of the person to whom the waiver was granted, and the date of the waiver.
Not applicable.
(e) If the registrant intends to satisfy the disclosure requirement under paragraph (c) or (d) of this Item regarding an amendment to, or a waiver from, a provision of its code of ethics that applies to the registrant’s principal executive officer, principal financial officer, principal accounting officer or controller, or persons performing similar functions and that relates to any element of the code of ethics definition enumerated in paragraph (b) of this Item by posting such information on its Internet website, disclose the registrant’s Internet address and such intention.
Not applicable.
(f) The registrant must:
(1) File with the Commission, pursuant to Item 12(a)(1), a copy of its code of ethics that applies to the registrant’s principal executive officer, principal financial officer, principal accounting officer or controller, or persons performing similar functions, as an exhibit to its annual report on this Form N-CSR (see attachment);
(2) Post the text of such code of ethics on its Internet website and disclose, in its most recent report on this Form N-CSR, its Internet address and the fact that it has posted such code of ethics on its Internet website; or
(3) Undertake in its most recent report on this Form N-CSR to provide to any person without charge, upon request, a copy of such code of ethics and explain the manner in which such request may be made. See Item 10(2)
ITEM 3. AUDIT COMMITTEE FINANCIAL EXPERT.
(a) (1) Disclose that the registrant’s Board of Trustees has determined that the registrant either:
(i) Has at least one audit committee financial expert serving on its audit committee; or
(ii) Does not have an audit committee financial expert serving on its audit committee.
The registrant’s Board of Trustees has determined that the registrant has at least one audit committee financial expert.
(2) If the registrant provides the disclosure required by paragraph (a)(1)(i) of this Item, it must disclose the name of the audit committee financial expert and whether that person is “independent.” In order to be considered “independent” for purposes of this Item, a member of an audit committee may not, other than in his or her capacity as a member of the audit committee, the Board of Trustees, or any other board committee:
(i) Accept directly or indirectly any consulting, advisory, or other compensatory fee from the issuer; or
(ii) Be an “interested person” of the investment company as defined in Section 2(a)(19) of the Act (15 U.S.C. 80a-2(a)(19)).
Mr. Fred J. Ricciardi, an independent Trustee, is such an audit committee financial expert.
(3) If the registrant provides the disclosure required by paragraph (a)(1) (ii) of this Item, it must explain why it does not have an audit committee financial expert.
Not applicable.
ITEM 4. PRINCIPAL ACCOUNTANT FEES AND SERVICES.
(a) Disclose, under the caption AUDIT FEES, the aggregate fees billed for each of the last two fiscal years for professional services rendered by the principal accountant for the audit of the registrant’s annual financial statements or services that are normally provided by the accountant in connection with statutory and regulatory filings or engagements for those fiscal years.
The audit fees for the Fund were $75,130 payable to Ernst & Young LLP for the year ended June 30, 2023 and $72,240 for the year ended June 30, 2022.
(b) Disclose, under the caption AUDIT-RELATED FEES, the aggregate fees billed in each of the last two fiscal years for assurance and related services by the principal accountant that are reasonably related to the performance of the audit of the registrant’s financial statements and are not reported under paragraph (a) of this Item. Registrants shall describe the nature of the services comprising the fees disclosed under this category.
The audit-related services fees for the Fund were $23,506 payable to Ernst & Young LLP for the year ended June 30, 2023 and $8,764 for the year ended June 30, 2022.
(c) Disclose, under the caption TAX FEES, the aggregate fees billed in each of the last two fiscal years for professional services rendered by the principal accountant for tax compliance, tax advice, and tax planning. Registrants shall describe the nature of the services comprising the fees disclosed under this category.
The Fund paid aggregate non-audit fees to Ernst & Young LLP for tax services of $25,159 and $24,191 during the fiscal years ended June 30, 2023 and 2022, respectively.
(d) Disclose, under the caption ALL OTHER FEES, the aggregate fees billed in each of the last two fiscal years for products and services provided by the principal accountant, other than the services reported in paragraphs (a) through (c) of this Item. Registrants shall describe the nature of the services comprising the fees disclosed under this category.
There were no audit-related services in 2023 or 2022.
(e) (1) Disclose the audit committee’s pre-approval policies and procedures described in paragraph (c)(7) of Rule 2-01 of Regulation S-X.
PIONEER FUNDS
APPROVAL OF AUDIT, AUDIT-RELATED, TAX AND OTHER SERVICES
PROVIDED BY THE INDEPENDENT AUDITOR
SECTION I—POLICY PURPOSE AND APPLICABILITY
The Pioneer Funds recognize the importance of maintaining the independence of their outside auditors. Maintaining independence is a shared responsibility involving Amundi Asset Management US, Inc., the audit committee and the independent auditors.
The Funds recognize that a Fund’s independent auditors: 1) possess knowledge of the Funds, 2) are able to incorporate certain services into the scope of the audit, thereby avoiding redundant work, cost and disruption of Fund personnel and processes, and 3) have expertise that has value to the Funds. As a result, there are situations where it is desirable to use the Fund’s independent auditors for services in addition to the annual audit and where the potential for conflicts of interests are minimal. Consequently, this policy, which is intended to comply with Rule 210.2-01(C)(7), sets forth guidelines and procedures to be followed by the Funds when retaining the independent audit firm to perform audit, audit-related tax and other services under those circumstances, while also maintaining independence.
Approval of a service in accordance with this policy for a Fund shall also constitute approval for any other Fund whose pre-approval is required pursuant to Rule 210.2-01(c)(7)(ii).
In addition to the procedures set forth in this policy, any non-audit services that may be provided consistently with Rule 210.2-01 may be approved by the Audit Committee itself and any pre-approval that may be waived in accordance with Rule 210.2-01(c)(7)(i)(C) is hereby waived.
Selection of a Fund’s independent auditors and their compensation shall be determined by the Audit Committee and shall not be subject to this policy.
| | | | |
SECTION II—POLICY |
SERVICE CATEGORY | | SERVICE CATEGORY DESCRIPTION | | SPECIFIC PRE-APPROVED SERVICE
SUBCATEGORIES |
| I. AUDIT SERVICES | | Services that are directly related to performing the independent audit of the Funds | | • Accounting research assistance • SEC consultation, registration statements, and reporting • Tax accrual related matters • Implementation of new accounting standards • Compliance letters (e.g. rating agency letters) • Regulatory reviews and assistance regarding financial matters • Semi-annual reviews (if requested) • Comfort letters for closed end offerings |
| II. AUDIT-RELATED SERVICES | | Services which are not prohibited under Rule 210.2-01(C)(4) (the “Rule”) and are related extensions of the audit services support the audit, or use the knowledge/expertise gained from the audit procedures as a foundation to complete the project. In most cases, if the Audit-Related Services are not performed by the Audit firm, the scope of the Audit Services would likely increase. The Services are typically well-defined and governed by accounting professional standards (AICPA, SEC, etc.) | | • AICPA attest and agreed-upon procedures • Technology control assessments • Financial reporting control assessments • Enterprise security architecture assessment |
| | |
AUDIT COMMITTEE APPROVAL POLICY | | AUDIT COMMITTEE REPORTING POLICY |
• “One-time” pre-approval for the audit period for all pre-approved specific service subcategories. Approval of the independent auditors as auditors for a Fund shall constitute pre approval for these services. | | • A summary of all such services and related fees reported at each regularly scheduled Audit Committee meeting. |
| |
• “One-time” pre-approval for the fund fiscal year within a specified dollar limit for all pre-approved specific service subcategories | | • A summary of all such services and related fees (including comparison to specified dollar limits) reported quarterly. |
| | |
• Specific approval is needed to exceed the pre-approved dollar limit for these services (see general Audit Committee approval policy below for details on obtaining specific approvals) • Specific approval is needed to use the Fund’s auditors for Audit-Related Services not denoted as “pre-approved”, or to add a specific service subcategory as “pre-approved” | | |
SECTION III—POLICY DETAIL, CONTINUED
| | | | |
SERVICE CATEGORY | | SERVICE CATEGORY DESCRIPTION | | SPECIFIC PRE-APPROVED
SERVICE SUBCATEGORIES |
| III. TAX SERVICES | | Services which are not prohibited by the Rule, if an officer of the Fund determines that using the Fund’s auditor to provide these services creates significant synergy in the form of efficiency, minimized disruption, or the ability to maintain a desired level of confidentiality. | | • Tax planning and support • Tax controversy assistance • Tax compliance, tax returns, excise tax returns and support • Tax opinions |
| | |
AUDIT COMMITTEE APPROVAL POLICY | | AUDIT COMMITTEE REPORTING POLICY |
• “One-time” pre-approval for the fund fiscal year within a specified dollar limit | | • A summary of all such services and related fees (including comparison to specified dollar limits) reported quarterly. |
| |
• Specific approval is needed to exceed the pre-approved dollar limits for these services (see general Audit Committee approval policy below for details on obtaining specific approvals) | | |
| |
• Specific approval is needed to use the Fund’s auditors for tax services not denoted as pre-approved, or to add a specific service subcategory as “pre-approved” | | |
SECTION III—POLICY DETAIL, CONTINUED
| | | | |
SERVICE CATEGORY | | SERVICE CATEGORY DESCRIPTION | | SPECIFIC PRE-APPROVED
SERVICE SUBCATEGORIES |
| | |
IV. OTHER SERVICES A. SYNERGISTIC, UNIQUE QUALIFICATIONS | | Services which are not prohibited by the Rule, if an officer of the Fund determines that using the Fund’s auditor to provide these services creates significant synergy in the form of efficiency, minimized disruption, the ability to maintain a desired level of confidentiality, or where the Fund’s auditors posses unique or superior qualifications to provide these services, resulting in superior value and results for the Fund. | | • Business Risk Management support • Other control and regulatory compliance projects |
| | |
AUDIT COMMITTEE APPROVAL POLICY | | AUDIT COMMITTEE REPORTING POLICY |
• “One-time” pre-approval for the fund fiscal year within a specified dollar limit • Specific approval is needed to exceed the pre-approved dollar limits for these services (see general Audit Committee approval policy below for details on obtaining specific approvals) • Specific approval is needed to use the Fund’s auditors for “Synergistic” or “Unique Qualifications” Other Services not denoted as pre-approved to the left, or to add a specific service subcategory as “pre-approved” | | • A summary of all such services and related fees (including comparison to specified dollar limits) reported quarterly. |
SECTION III—POLICY DETAIL, CONTINUED
| | | | |
SERVICE CATEGORY | | SERVICE CATEGORY DESCRIPTION | | SPECIFIC PROHIBITED SERVICE SUBCATEGORIES |
| PROHIBITED SERVICES | | Services which result in the auditors losing independence status under the Rule. | | 1. Bookkeeping or other services related to the accounting records or financial statements of the audit client* 2. Financial information systems design and implementation* 3. Appraisal or valuation services, fairness* opinions, or contribution-in-kind reports 4. Actuarial services (i.e., setting actuarial reserves versus actuarial audit work)* 5. Internal audit outsourcing services* 6. Management functions or human resources 7. Broker or dealer, investment advisor, or investment banking services 8. Legal services and expert services unrelated to the audit 9. Any other service that the Public Company Accounting Oversight Board determines, by regulation, is impermissible |
| | |
AUDIT COMMITTEE APPROVAL POLICY | | AUDIT COMMITTEE REPORTING POLICY |
• These services are not to be performed with the exception of the(*) services that may be permitted if they would not be subject to audit procedures at the audit client (as defined in rule 2-01(f)(4)) level the firm providing the service. | | • A summary of all services and related fees reported at each regularly scheduled Audit Committee meeting will serve as continual confirmation that has not provided any restricted services. |
GENERAL AUDIT COMMITTEE APPROVAL POLICY:
| | • | | For all projects, the officers of the Funds and the Fund’s auditors will each make an assessment to determine that any proposed projects will not impair independence. |
| | • | | Potential services will be classified into the four non-restricted service categories and the “Approval of Audit, Audit-Related, Tax and Other Services” Policy above will be applied. Any services outside the specific pre-approved service subcategories set forth above must be specifically approved by the Audit Committee. |
| | • | | At least quarterly, the Audit Committee shall review a report summarizing the services by service category, including fees, provided by the Audit firm as set forth in the above policy. |
(2) Disclose the percentage of services described in each of paragraphs (b) through (d) of this Item that were approved by the audit committee pursuant to paragraph (c)(7)(i)(C) of Rule 2-01 of Regulation S-X.
Non-Audit Services
Beginning with non-audit service contracts entered into on or after May 6, 2003, the effective date of the new SEC pre-approval rules, the Fund’s audit committee is required to pre-approve services to affiliates defined by SEC rules to the extent that the services are determined to have a direct impact on the operations or financial reporting of the Fund. For the years ended June 30, 2023 and 2022, there were no services provided to an affiliate that required the Fund’s audit committee pre-approval.
(f) If greater than 50 percent, disclose the percentage of hours expended on the principal accountants engagement to audit the registrant’s financial statements for the most recent fiscal year that were attributed to work performed by persons other than the principal accountant’s full-time, permanent employees.
N/A
(g) Disclose the aggregate non-audit fees billed by the registrants accountant for services rendered to the registrant, and rendered to the registrants investment adviser (not including any sub-adviser whose role is primarily portfolio management and is subcontracted with or overseen by another investment adviser), and any entity controlling, controlled by, or under common control with the adviser that provides ongoing services to the registrant for each of the last two fiscal years of the registrant.
The Fund paid aggregate non-audit fees to Ernst & Young LLP for tax services of $25,159 and $24,191 during the fiscal years ended June 30, 2023 and 2022, respectively.
(h) Disclose whether the registrants audit committee of the Board of Trustees has considered whether the provision of non-audit services that were rendered to the registrants investment adviser (not including any subadviser whose role is primarily portfolio management and is subcontracted with or overseen by another investment adviser), and any entity controlling, controlled by, or under common control with the investment adviser that provides ongoing services to the registrant that were not pre-approved pursuant to paragraph (c)(7)(ii) of Rule 2-01 of Regulation S-X is compatible with maintaining the principal accountant’s independence.
The Fund’s audit committee of the Board of Trustees has considered whether the provision of non-audit services that were rendered to the Affiliates (as defined) that were not pre- approved pursuant to paragraph (c)(7)(ii) of Rule 2-01 of Regulation S-X is compatible with maintaining the principal accountant’s independence.
ITEM 5. AUDIT COMMITTEE OF LISTED REGISTRANTS
(a) If the registrant is a listed issuer as defined in Rule 10A-3 under the Exchange Act (17 CFR 240.10A-3), state whether or not the registrant has a separately-designated standing audit committee established in accordance with Section 3(a)(58)(A) of the Exchange Act (15 U.S.C. 78c(a)(58)(A)). If the registrant has such a committee, however designated, identify each committee member. If the entire board of directors is acting as the registrant’s audit committee as specified in Section 3(a)(58)(B) of the Exchange Act (15 U.S.C. 78c(a)(58)(B)), so state.
N/A
(b) If applicable, provide the disclosure required by Rule 10A-3(d) under the Exchange Act (17 CFR 240.10A-3(d)) regarding an exemption from the listing standards for audit committees.
N/A
ITEM 6. SCHEDULE OF INVESTMENTS.
File Schedule of Investments in securities of unaffiliated issuers as of the close of the reporting period as set forth in 210.1212 of Regulation S-X [17 CFR 210.12-12], unless the schedule is included as part of the report to shareholders filed under Item 1 of this Form.
Included in Item 1
ITEM 7. DISCLOSURE OF PROXY VOTING POLICIES AND PROCEDURES FOR CLOSED-END MANAGEMENT INVESTMENT COMPANIES.
A closed-end management investment company that is filing an annual report on this Form N-CSR must, unless it invests exclusively in non-voting securities, describe the policies and procedures that it uses to determine how to vote proxies relating to portfolio securities, including the procedures that the company uses when a vote presents a conflict between the interests of its shareholders, on the one hand, and those of the company’s investment adviser; principal underwriter; or any affiliated person (as defined in Section 2(a)(3) of the Investment Company Act of 1940 (15 U.S.C. 80a-2(a)(3)) and the rules thereunder) of the company, its investment adviser, or its principal underwriter, on the other. Include any policies and procedures of the company’s investment adviser, or any other third party, that the company uses, or that are used on the company’s behalf, to determine how to vote proxies relating to portfolio securities.
Not applicable to open-end management investment companies.
ITEM 8. PORTFOLIO MANAGERS OF CLOSED-END MANAGEMENT INVESTMENT COMPANIES.
(a) If the registrant is a closed-end management investment company that is filing an annual report on this Form N-CSR, provide the following information:
(1) State the name, title, and length of service of the person or persons employed by or associated with the registrant or an investment adviser of the registrant who are primarily responsible for the day-to-day management of the registrant’s portfolio (“Portfolio Manager”). Also state each Portfolio Manager’s business experience during the past 5 years.
Not applicable to open-end management investment companies.
ITEM 9. PURCHASES OF EQUITY SECURITIES BY CLOSED-END MANAGEMENT INVESTMENT COMPANY AND AFFILIATED PURCHASERS.
(a) If the registrant is a closed-end management investment company, in the following tabular format, provide the information specified in paragraph (b) of this Item with respect to any purchase made by or on behalf of the registrant or any affiliated purchaser, as defined in Rule 10b-18(a)(3) under the Exchange Act (17 CFR 240.10b-18(a)(3)), of shares or other units of any class of the registrant’s equity securities that is registered by the registrant pursuant to Section 12 of the Exchange Act (15 U.S.C. 781).
Not applicable to open-end management investment companies.
ITEM 10. SUBMISSION OF MATTERS TO A VOTE OF SECURITY HOLDERS.
Describe any material changes to the procedures by which shareholders may recommend nominees to the registrant’s board of directors, where those changes were implemented after the registrant last provided disclosure in response to the requirements of Item 407(c)(2)(iv) of Regulation S-R(17 CFR 229.407)(as required by Item 22(b)(15)) of Schedule 14A (17 CFR 240.14a-101), or this Item.
There have been no material changes to the procedures by which the shareholders may recommend nominees to the registrant’s board of directors since the registrant last provided disclosure in response to the requirements of Item 407(c)(2)(iv) of Regulation S-R of Schedule 14(A) in its definitive proxy statement, or this item.
ITEM 11. CONTROLS AND PROCEDURES.
(a) Disclose the conclusions of the registrant’s principal executive and principal financials officers, or persons performing similar functions, regarding the effectiveness of the registrant’s disclosure controls and procedures (as defined in Rule 30a-3(c) under the Act (17 CFR 270.30a-3(c))) as of a date within 90 days of the filing date of the report that includes the disclosure required by this paragraph, based on the evaluation of these controls and procedures required by Rule 30a-3(b) under the Act (17 CFR 270.30(a)-3(b) and Rules 13a-15(b) or 15d-15(b) under the Exchange Act (17 CFR 240.13a-15(b) or 240.15d-15(b)).
The registrant’s principal executive officer and principal financial officer have concluded that the registrant’s disclosure controls and procedures are effective based on the evaluation of these controls and procedures as of a date within 90 days of the filing date of this report.
(b) Disclose any change in the registrant’s internal control over financial reporting (as defined in Rule 30a-3(d) under the Act (17CFR 270.30a-3(d)) that occurred during the period covered by this report that has materially affected, or is reasonably likely to materially affect, the registrant’s internal control over financial reporting.
There were no significant changes in the registrant’s internal control over financial reporting that occurred during the period covered by this report that have materially affected, or are reasonably likely to materially affect, the registrant’s internal control over financial reporting.
Item 12. Disclosure of Securities Lending Activities for Closed-End Management Investment Companies.
(a) If the registrant is a closed-end management investment company, provide the following dollar amounts of income and compensation related to the securities lending activities of the registrant during its most recent fiscal year:
N/A
(1) Gross income from securities lending activities;
N/A
(2) All fees and/or compensation for each of the following securities lending activities and related services: any share of revenue generated by the securities lending program paid to the securities lending agent(s) (revenue split); fees paid for cash collateral management services (including fees deducted from a pooled cash collateral reinvestment vehicle) that are not included in the revenue split; administrative fees that are not included in the revenue split; fees for indemnification that are not included in the revenue split; rebates paid to borrowers; and any other fees relating to the securities lending program that are not included in the revenue split, including a description of those other fees;
N/A
(3) The aggregate fees/compensation disclosed pursuant to paragraph (2); and
N/A
(4) Net income from securities lending activities (i.e., the dollar amount in paragraph (1) minus the dollar amount in paragraph (3)).
If a fee for a service is included in the revenue split, state that the fee is included in the revenue split.
N/A
(b) If the registrant is a closed-end management investment company, describe the services provided to the registrant by the securities lending agent in the registrants most recent fiscal year.
N/A
ITEM 13. EXHIBITS.
(a) File the exhibits listed below as part of this Form. Letter or number the exhibits in the sequence indicated.
(1) Any code of ethics, or amendment thereto, that is the subject of the disclosure required by Item 2, to the extent that the registrant intends to satisfy the Item 2 requirements through filing of an exhibit.
(2) A separate certification for each principal executive officer and principal financial officer of the registrant as required by Rule 30a-2(a) under the Act (17 CFR 270.30a-2(a)) , exactly as set forth below: Filed herewith.
(b) Certifications pursuant to Rule 30a-2(b) under the 1940 Act and Section 906 of the Sarbanes-Oxley Act of 2002 are attached hereto.
SIGNATURES
[See General Instruction F]
Pursuant to the requirements of the Securities Exchange Act of 1934 and the Investment Company Act of 1940, the registrant has duly caused this report to be signed on its behalf by the undersigned, thereunto duly authorized.
(Registrant) Pioneer Bond Fund
By (Signature and Title)* /s/ Lisa M. Jones
Lisa M. Jones, President and Chief Executive Officer
Date September 5, 2023
Pursuant to the requirements of the Securities Exchange Act of 1934 and the Investment Company Act of 1940, this report has been signed below by the following persons on behalf of the registrant and in the capacities and on the dates indicated.
By (Signature and Title)* /s/ Lisa M. Jones
Lisa M. Jones, President and Chief Executive Officer
Date September 5, 2023
By (Signature and Title)* /s/ Anthony J. Koenig, Jr.
Anthony J. Koenig, Jr., Managing Director, Chief Operations Officer & Treasurer of the Funds
Date September 5, 2023
| * | Print the name and title of each signing officer under his or her signature. |