UNITED STATES
SECURITIES AND EXCHANGE COMMISSION
Washington, D.C. 20549
FORM N-CSR
CERTIFIED SHAREHOLDER REPORT OF REGISTERED
MANAGEMENT INVESTMENT COMPANIES
Investment Company Act file number 811-02864
Pioneer Bond Fund
(Exact name of registrant as specified in charter)
60 State Street, Boston, MA 02109
(Address of principal executive offices) (ZIP code)
Terrence J. Cullen, Amundi Asset Management, Inc.,
60 State Street, Boston, MA 02109
(Name and address of agent for service)
Registrant’s telephone number, including area code: (617) 742-7825
Date of fiscal year end: June 30, 2021
Date of reporting period: July 1, 2020 through June 30, 2021
Form N-CSR is to be used by management investment companies to file reports with the Commission not later than 10 days after the transmission to stockholders of any report that is required to be transmitted to stockholders under Rule 30e-1 under the Investment Company Act of 1940 (17 CFR 270.30e-1). The Commission may use the information provided on Form N-CSR in its regulatory, disclosure review, inspection, and policymaking roles.
A registrant is required to disclose the information specified by Form N-CSR, and the Commission will make this information public. A registrant is not required to respond to the collection of information contained in Form N-CSR unless the Form displays a currently valid Office of Management and Budget (“OMB”) control number. Please direct comments concerning the accuracy of the information collection burden estimate and any suggestions for reducing the burden to Secretary, Securities and Exchange Commission, 450 Fifth Street, NW, Washington, DC 20549-0609. The OMB has reviewed this collection of information under the clearance requirements of 44 U.S.C. ss. 3507.
Pioneer Bond Fund
Annual Report | June 30, 2021
| A: PIOBX | C: PCYBX | K: PBFKX | R: PBFRX | Y: PICYX |
Paper copies of the Fund’s shareholder reports may no longer be sent by mail, unless you specifically request paper copies of the reports from the Fund or from your financial intermediary, such as a broker-dealer, bank or insurance company. Instead, the reports will be made available on the Fund’s website, and you will be notified by mail each time a report is posted and provided with a website link to access the report.
You may elect to receive all future reports in paper free of charge. If you invest directly with the Fund, you can inform the Fund that you wish to continue receiving paper copies of your shareholder reports by calling 1-800-225-6292. If you invest through a financial intermediary, you can contact your financial intermediary to request that you continue to receive paper copies of your shareholder reports. Your election to receive reports in paper will apply to all funds held in your account if you invest through your financial intermediary or all funds held within the Pioneer Fund complex if you invest directly.
visit us: www.amundi.com/us
| 2 | |
| 4 | |
| 11 | |
| 12 | |
| 13 | |
| 18 | |
| 20 | |
| 86 | |
| 95 | |
| 112 | |
| Additional Information | 114 |
| 115 | |
| 117 |
Pioneer Bond Fund | Annual Report | 6/30/21 1
With the first half of 2021 now behind us, we have seen some better news on the COVID-19 pandemic front. In the US, widespread distribution of the COVID-19 vaccines approved for emergency use late last year, and a general decline in more severe virus cases and related hospitalizations, have had a positive effect on overall market sentiment, even as the emergence of highly infectious variants of the virus in certain areas has led to increased volatility.
While there may finally be a light visible at the end of the pandemic tunnel, the long-term impact on the global economy from COVID-19, while currently unknown, is likely to be considerable. It is clear that several industries have already felt greater effects than others, and the markets, which do not thrive on uncertainty, have been volatile.
With that said, so far during 2021, we have seen investments typically associated with a higher degree of risk, such as equities and high-yield bonds, outperform investments regarded as less risky, such as government debt. In addition, cyclical stocks, or stocks of companies with greater exposure to the ebbs and flows of the economic cycle, have rallied this year after slumping during the height of the pandemic, as investors have appeared to embrace the potential for a more widespread reopening of the economy in the coming months. Additional fiscal stimulus from the US government in recent months has also helped provide some market momentum.
Despite the strong rebound from the March 2020 lows and positive market performance so far this year, several factors that could lead to increased volatility and weaker performance bear watching. These include: public-health issues such as potential surges in COVID-19 cases, particularly as “variants” of the virus have continued to arise; macroeconomic concerns (inflation, energy prices, sluggish employment figures); and changes to the US government’s fiscal policies, particularly the possibility of higher income and capital gains tax rates on both individuals and businesses.
After leaving our offices in March of 2020 due to COVID-19, we have re-opened our US locations and have invited our employees to slowly return to the office. I am proud of the careful planning that has taken place. Our business has continued to operate without any disruption and we all look forward to regaining a bit of normalcy after 15 months of remote working.
2 Pioneer Bond Fund | Annual Report | 6/30/21
Since 1928, Amundi US’s investment process has been built on a foundation of fundamental research and active management, principles which have guided our investment decisions for more than 90 years. We believe active management – that is, making active investment decisions – can help mitigate the risks during periods of market volatility.
At Amundi US, active management begins with our own fundamental, bottom-up research process. Our team of dedicated research analysts and portfolio managers analyzes each security under consideration, communicating directly with the management teams of the companies issuing the securities and working together to identify those securities that best meet our investment criteria for our family of funds. Our risk management approach begins with each and every security, as we strive to carefully understand the potential opportunity, while considering potential risk factors.
Today, as investors, we have many options. It is our view that active management can serve shareholders well, not only when markets are thriving, but also during periods of market stress.
As you consider your long-term investment goals, we encourage you to work with your financial professional to develop an investment plan that paves the way for you to pursue both your short-term and long-term goals.
We greatly appreciate the trust you have placed in us and look forward to continuing to serve you in the future.
Sincerely,

Lisa M. Jones
Head of the Americas, President and CEO of US
Amundi Asset Management US, Inc.
August 2021
Head of the Americas, President and CEO of US
Amundi Asset Management US, Inc.
August 2021
Any information in this shareowner report regarding market or economic trends or the factors influencing the Fund’s historical or future performance are statements of opinion as of the date of this report. Past performance is no guarantee of future results.
Pioneer Bond Fund | Annual Report | 6/30/21 3
In the following interview, Brad Komenda discusses the factors that affected the performance of Pioneer Bond Fund during the 12-month period ended June 30, 2021. Mr. Komenda, Senior Vice President, Deputy Director of Investment Grade Corporates, and a portfolio manager at Amundi Asset Management US, Inc. (Amundi US), is responsible for the daily management of the Fund, along with Kenneth J. Taubes, Executive Vice President and Chief Investment Officer, US, and a portfolio manager at Amundi US, and Timothy Rowe, Managing Director, Director of Multisector Fixed Income, and a portfolio manager at Amundi US.
Q How did the Fund perform during the 12-month period ended June 30, 2021?
A Pioneer Bond Fund’s Class A shares returned 6.26% at net asset value during the 12-month period ended June 30, 2021, while the Fund’s benchmark, the Bloomberg Barclays US Aggregate Bond Index, returned -0.33%. During the same 12-month period, the average return of the 587 mutual funds in Morningstar’s Intermediate Core-Plus Bond Funds Category was 3.06%.
Q How would you describe the investment environment in the fixed-income markets during the 12-month period?
A After simmering throughout the summer of 2020, macroeconomic uncertainty bubbled over during September, weighing on investor sentiment and the performance of so-called “riskier” assets. During that time, the markets had focused on heightened risks revolving around three key areas: the continuing COVID-19 pandemic, the need for additional fiscal stimulus, and political risks, particularly the US elections. After enacting two stimulus packages earlier in the year, another US government COVID-19 relief bill that had passed in the House of Representatives failed to gain ground towards passage in the US Senate. A partisan dispute over when to appoint Supreme Court Justice Ginsburg’s replacement further hardened both parties’ negotiating positions and lowered the odds of broad fiscal support prior to the November election. At the same time, a notable uptick in European COVID-19 cases reignited fears that the US remained at risk for a “second wave” of cases and a new round of potentially harmful economic lockdowns. Finally, concerns mounted over the potential for a protracted dispute over the presidential election results.
4 Pioneer Bond Fund | Annual Report | 6/30/21
In December, the confirmation of November’s US election results helped reduce uncertainty and boosted market sentiment. That same month, the US economic outlook received two “shots in the arm,” as a pair of COVID-19 vaccines received emergency-use authorization, and Congress finally reached agreement on a $900 billion COVID-19 relief package. Investors elected to focus attention on those positive developments and looked beyond a surge in COVID-19 cases and data suggesting a slowing in the rate of economic recovery. In response, riskier assets rallied and Treasury yields drifted higher into the end of the 2020 calendar year.
The first quarter of 2021 saw strong equity-market returns, notably higher US Treasury yields, and increased inflation expectations, driven by investors’ optimism for an improving global economic growth outlook. Contributing to the optimistic view was the Democratic Party’s gaining control of both houses of Congress in early January, which gave rise to a new $1.9 trillion US fiscal stimulus package and, later, a proposed $3 billion-plus infrastructure bill. In addition, the continued distribution of COVID-19 vaccines in the US as well as a general decline in severe virus cases, coupled with the ongoing reopening of the economy, helped boost market sentiment over the first three months of the calendar year.
As the period progressed, the continued highly dovish posture on monetary policy from the US Federal Reserve (Fed) lent further support to the markets, as the US central bank expressed its intention to remain “on the sidelines” with regard to major policy changes until at least 2023. The Fed based its projection on the view that near-term increases in inflation above the usual 2% target could be transitory, and not structural. The Fed also messaged that it would look at average inflation over time, rather than focusing on isolated upticks in prices and thus feeling compelled to raise rates in response.
However, the “reflation trade” wobbled during June as market participants navigated growing apprehension over COVID-19 variants and a somewhat “hawkish” Fed Open Market Committee (FOMC) meeting. Investors in the Treasury market reacted to the updated Fed “dot plot” displaying FOMC member forecasts for the federal funds rate, which pointed to a median year-end 2023 target of 0.625%, or 50 basis points (bps) higher than March’s forecast. The Treasury yield curve twisted around the intermediate portion, with short-end yields rising and long-end yields falling, while longer-term inflation expectations moved lower. The movement suggested investors’ doubts regarding the Fed’s long-term commitment to its current average inflation-targeting framework. (The Fed’s “dot” plot/projection is a quarterly chart summarizing the outlook for the federal funds rate for each of the FOMC’s members. A basis point is equal to 1/100th of a percentage point.)
Pioneer Bond Fund | Annual Report | 6/30/21 5
For the 12-month period ended June 30, 2021, the investment-grade corporate bond market posted a positive return of 3.30%, while high-yield corporate bonds (below investment grade) returned 15.37% (as measured by the Bloomberg Barclays US Corporate Bond Index and Bloomberg Barclays US Corporate High Yield Index, respectively). Returns for securitized assets were essentially flat for the 12-month period, while returns for longer-term Treasuries finished well into negative territory.
Q What factors had the largest effects on the Fund’s performance relative to the Bloomberg Barclays US Aggregate Bond Index during the 12-month period?
A Asset allocations were the primary drivers of the Fund’s outperformance relative to its benchmark for the 12-month period, while security selection results also contributed meaningfully to positive relative returns. In addition, the portfolio’s yield-curve positioning was a modest contributor to positive benchmark-relative performance over the period.
Among the leading positive contributors to the Fund’s relative performance during the period was off-benchmark positioning within high-yield corporate bonds. Entering the 12-month period, we had viewed the high-yield market in general as having avoided some of the excesses witnessed during past cycles. As investors’ sentiment towards riskier assets continued to improve with the help of strong policy support from the Fed and the US government, we took advantage of what we believed were still-attractive relative valuations, and increased the Fund’s exposure to the high-yield sector in a meaningful way. The stance benefited the Fund’s relative performance for the 12-month period as high-yield corporates notably outpaced the returns of their investment-grade counterparts.
Another off-benchmark allocation, to non-agency mortgage-backed securities (MBS), proved beneficial to the Fund’s benchmark-relative returns for the period. Within the Fund’s non-agency MBS allocation, exposure to credit-risk-transfer securities (CRTs) led positive contributions to relative performance for the 12-month period, as CRTs benefited from very strong home-price appreciation. (CRTs are investments that transfer a portion of the risk associated with credit losses within pools of conventional residential mortgage loans from the government-sponsored entities, or GSEs, Fannie Mae and Freddie Mac, to the private sector.)
The Fund’s positioning with respect to investment-grade corporate bonds also contributed notably to positive benchmark-relative performance, highlighted by an overweight to, and security selection within the
6 Pioneer Bond Fund | Annual Report | 6/30/21
industrials sector. In the aftermath of the market’s liquidity crisis driven by the onset of the pandemic during the first quarter of 2020, we took the opportunity to add portfolio exposure to what we believed were high-quality industrial names with longer maturities, at discounted prices. The Fund’s relative returns benefited from the positioning as credit-market sentiment continued to firm over the course of the period. In addition, an overweight to and selection results within financials aided relative performance, most notably the Fund’s exposures to subordinated bank debt.
We have preferred to maintain the portfolio’s allocation to securitized asset classes in lieu of credit exposures within its non-benchmark positioning, and we have preferred agency pass-through MBS over Treasuries, given historically low interest rates. Those decisions worked out well and contributed positively to the Fund’s relative returns over the past fiscal year, as Treasury yields drifted higher in the fourth quarter of 2020 and in the first quarter of 2021. Within securitized assets, allocations to commercial MBS (CMBS) and asset-backed securities (ABS) boosted the Fund’s performance for the full 12-month period as market participants eventually sought out investments in sectors that had lagged the initial recovery of riskier assets. Positioning with respect to agency MBS was another positive contributor to the Fund’s benchmark-relative performance, as we were able to identify opportunities created by the Fed’s broad-based purchases within the asset class, which were part of its efforts to bolster the markets in response to the pandemic-related crisis in the spring of 2020.
Finally, the portfolio’s positioning with respect to interest rates contributed positively to the Fund’s relative returns over the period. Most notably, the Fund had a short-duration stance compared with the Bloomberg Barclays US Aggregate Bond Index entering 2021, given very low Treasury yields at the time. The positioning proved beneficial as yields moved higher for securities with longer maturities over the first quarter of 2021. (Duration is a measure of the sensitivity of the price, or the value of principal, of a fixed-income investment to a change in interest rates, expressed as a number of years.)
During a 12-month period that saw the Fund outperform its benchmark by a wide margin, there were no material detractors from relative returns within the portfolio.
Pioneer Bond Fund | Annual Report | 6/30/21 7
Q Did the Fund have any investments in derivative securities during the 12-month period ended June 30, 2021? If so, did the derivatives have any material impact on performance?
A Yes, we invested the Fund in Treasury futures and credit-default swaps. We have typically invested in Treasury futures as part of our duration-management strategy for the portfolio. We believe the use of Treasury futures has allowed us to express our views on duration and yield-curve positioning in the most efficient manner. We typically have invested in credit-default swaps to either gain or reduce the Fund’s exposure to corporate bonds very quickly, as cash-bond transactions take a little more time to settle and have a higher liquidity cost.
The use of derivatives has allowed the Fund to benefit from the performance of the targeted asset classes, while retaining a better liquidity profile, which in turn may help to reduce risk. Treasury futures generally have not had an impact on the Fund’s performance, as we have used them primarily for hedging purposes. The use of credit-default swaps had no material impact on the Fund’s performance over the 12-month period.
Q What factors affected the Fund’s yield, or distributions* to shareholders, during the 12-month period?
A Overall, the Fund’s monthly distribution rate decreased for the full 12-month period. While the general rise in Treasury yields helped support the yield, tightening credit spreads had a negative effect as the period progressed, as the market began looking beyond COVID-19 and spread levels became more reflective of investors’ expectations of future economic stability. (Credit spreads are commonly defined as the differences in yield between Treasuries and other types of fixed-income securities with similar maturities.) The tightening of spreads, while reducing the Fund’s yield, had a positive effect on overall performance, due to capital appreciation.
Q What is your investment outlook heading into the Fund’s new fiscal year, and how is the portfolio positioned?
A The COVID-19 situation has remained a key driver of global economic activity, both positive and negative, and, in turn, the performance of financial markets. Though the spread of the highly contagious “Delta” variant of the virus has been driving an increase in COVID-19 infections (particularly in those regions with lower vaccination rates), in our view, the spread of the variant may not derail the economic recovery already
* Distributions are not guaranteed.
8 Pioneer Bond Fund | Annual Report | 6/30/21
underway in major developed economies where vaccination rates have been relatively high. While the vaccines apparently have not provided 100 percent protection against infection, “breakthrough” infections in vaccinated individuals have so far been less severe and resulted in fewer hospitalizations and deaths. It is important to keep this point in mind as the world transitions from fighting COVID-19 to living with COVID-19.
In his June post-FOMC meeting press conference, Fed Chair Powell reported that the committee has begun to talk about tapering its monthly purchases of Treasuries and agency MBS. Logically, some market participants have become worried about a repeat of the 2013 “taper tantrum,” if an official taper plan becomes reality (possibly late this year). However, Fed officials, having learned from 2013, have been offering investors plenty of guidance and a good sense of their eventual policy game plan. While we still think it likely that the ultimate announcement of tapering could precipitate some financial market volatility (as did the June FOMC meeting), unlike eight years ago, we believe any such episode could be relatively short lived.
The portfolio’s current positioning has continued to balance a positive outlook for economic growth and accommodative financial conditions against credit spreads that, in our view, have been offering much-lower-than-average compensation for the risk assumed in most sectors. One exception is agency MBS, where recent spread-widening has resulted in relatively attractive spread levels compared to Treasuries and credit-sensitive spread sectors, in our opinion.
We have continued to take steps aimed at reducing the Fund’s overall risk exposures, and have become increasingly selective with regard to sub-sector and issuer exposures.
Please refer to the Schedule of Investments on pages 20–85 for a full listing of Fund securities.
All investments are subject to risk, including the possible loss of principal. In the past several years, financial markets have experienced increased volatility and heightened uncertainty. The market prices of securities may go up or down, sometimes rapidly or unpredictably, due to general market conditions, such as real or perceived adverse economic, political, or regulatory conditions, recessions, inflation, changes in interest or currency rates, lack of liquidity in the bond markets, the spread of infectious illness or other public health issues or adverse investor sentiment. These conditions may continue, recur, worsen or spread.
Pioneer Bond Fund | Annual Report | 6/30/21 9
When interest rates rise, the prices of fixed-income securities in the Fund will generally fall. Conversely, when interest rates fall, the prices of fixed-income securities in the Fund will generally rise.
Investments in the Fund are subject to possible loss due to the financial failure of the issuers of the underlying securities and their inability to meet their debt obligations.
Prepayment risk is the chance that an issuer may exercise its right to prepay its security, if falling interest rates prompt the issuer to do so. Forced to reinvest the unanticipated proceeds at lower interest rates, the Fund would experience a decline in income and lose the opportunity for additional price appreciation.
Investments in high-yield or lower-rated securities are subject to greater-than-average price volatility, illiquidity and possibility of default.
The securities issued by U.S. Government-sponsored entities (i.e., Fannie Mae, Freddie Mac) are neither guaranteed nor issued by the U.S. Government.
The Fund may invest in mortgage-backed securities, which during times of fluctuating interest rates may increase or decrease more than other fixed-income securities. Mortgage-backed securities are also subject to pre-payments.
At times, the Fund’s investments may represent industries or industry sectors that are interrelated or have common risks, making the Fund more susceptible to any economic, political, or regulatory developments or other risks affecting those industries and sectors.
These risks may increase share price volatility.
Before investing, consider the product’s investment objectives, risks, charges and expenses. Contact your financial professional or Amundi Asset Management US, Inc., for a prospectus or summary prospectus containing this information. Read it carefully.
Any information in this shareholder report regarding market or economic trends or the factors influencing the Fund’s historical or future performance are statements of opinion as of the date of this report. Past performance is no guarantee of future results.
10 Pioneer Bond Fund | Annual Report | 6/30/21
Portfolio Diversification
(As a percentage of total investments)*
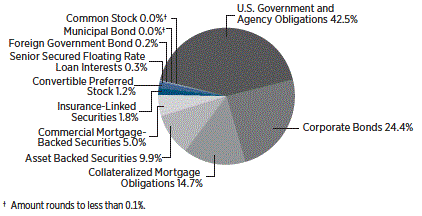
| 10 Largest Holdings | ||
(As a percentage of total investments)* | ||
| 1. | U.S. Treasury Bills, 8/5/21 | 2.96% |
| 2. | U.S. Treasury Bills, 7/1/21 | 2.88 |
| 3. | Fannie Mae, 2.5%, 7/1/51 (TBA) | 2.80 |
| 4. | Fannie Mae, 4.5%, 7/1/51 (TBA) | 2.68 |
| 5. | U.S. Treasury Bills, 7/27/21 | 2.16 |
| 6. | U.S. Treasury Bills, 8/12/21 | 2.16 |
| 7. | U.S. Treasury Bills, 8/26/21 | 2.16 |
| 8. | U.S. Treasury Bills, 7/15/21 | 2.02 |
| 9. | U.S. Treasury Bills, 8/3/21 | 1.94 |
| 10. | U.S. Treasury Bills, 8/17/21 | 1.36 |
* Excludes temporary cash investments and all derivative contracts except for options purchased. The Fund is actively managed, and current holdings may be different. The holdings listed should not be considered recommendations to buy or sell any securities. |
Pioneer Bond Fund | Annual Report | 6/30/21 11
Net Asset Value per Share
| Class | 6/30/21 | 6/30/20 |
A | $10.14 | $9.98 |
C | $10.03 | $9.87 |
K | $10.13 | $9.98 |
R | $10.23 | $10.07 |
Y | $10.04 | $9.89 |
Distributions per Share: 7/1/20–6/30/21
| Net Investment | Short-Term | Long-Term | |
| Class | Income | Capital Gains | Capital Gains |
A | $0.2736 | $0.0663 | $0.1164 |
C | $0.2072 | $0.0663 | $0.1164 |
K | $0.3222 | $0.0663 | $0.1164 |
R | $0.2509 | $0.0663 | $0.1164 |
Y | $0.3081 | $0.0663 | $0.1164 |
Index Definition
The Bloomberg Barclays U.S. Aggregate Bond Index is an unmanaged measure of the US bond market. Index returns are calculated monthly, assume reinvestment of dividends and, unlike Fund returns, do not reflect any fees, expenses or sales charges. It is not possible to invest directly in an index.
The index defined here pertains to the “Value of $10,000 Investment” and “Value of $5 Million Investment” charts on pages 13–17.
| 12 | Pioneer Bond Fund | Annual Report | 6/30/21 |
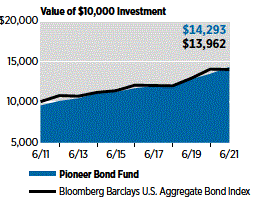
Investment Returns
The mountain chart on the right shows the change in value of a $10,000 investment made in Class A shares of Pioneer Bond Fund at public offering price during the periods shown, compared to that of the Bloomberg Barclays U.S. Aggregate Bond Index.
Average Annual Total Returns
(As of June 30, 2021)
| Bloomberg | |||
| Net | Public | Barclays U.S. | |
| Asset | Offering | Aggregate | |
| Value | Price | Bond | |
| Period | (NAV) | (POP) | Index |
10 years | 4.11% | 3.64% | 3.39% |
5 years | 4.13 | 3.18 | 3.03 |
1 year | 6.26 | 1.48 | -0.33 |
| Expense Ratio |
(Per prospectus dated November 1, 2020) |
| Gross |
0.82% |
Call 1-800-225-6292 or visit www.amundi.com/us for the most recent month-end performance results. Current performance may be lower or higher than the performance data quoted.
The performance data quoted represents past performance, which is no guarantee of future results. Investment return and principal value will fluctuate, and shares, when redeemed, may be worth more or less than their original cost.
NAV results represent the percent change in net asset value per share. NAV returns would have been lower had sales charges been reflected. POP returns reflect deduction of maximum 4.50% sales charge. All results are historical and assume the reinvestment of dividends and capital gains. Other share classes are available for which performance and expenses will differ.
Performance results reflect any applicable expense waivers in effect during the periods shown. Without such waivers Fund performance would be lower. Waivers may not be in effect for all funds. Certain fee waivers are contractual through a specified period. Otherwise, fee waivers can be rescinded at any time. See the prospectus and financial statements for more information.
The performance table and graph do not reflect the deduction of fees and taxes that a shareowner would pay on Fund distributions or the redemption of Fund shares.
Please refer to the financial highlights for a more current expense ratio.
Pioneer Bond Fund | Annual Report | 6/30/21 13
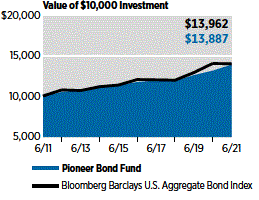
Performance Update | 6/30/21 | Class C Shares |
Investment Returns
The mountain chart on the right shows the change in value of a $10,000 investment made in Class C shares of Pioneer Bond Fund during the periods shown, compared to that of the Bloomberg Barclays U.S. Aggregate Bond Index.
Average Annual Total Returns
(As of June 30, 2021)
| Bloomberg | |||
| Barclays U.S. | |||
| Aggregate | |||
| If | If | Bond | |
| Period | Held | Redeemed Index | |
10 years | 3.34% | 3.34% | 3.39% |
5 years | 3.41 | 3.41 | 3.03 |
1 year | 5.63 | 5.63 | -0.33 |
| Expense Ratio |
(Per prospectus dated November 1, 2020) |
| Gross |
1.45% |
Call 1-800-225-6292 or visit www.amundi.com/us for the most recent month-end performance results. Current performance may be lower or higher than the performance data quoted.
The performance data quoted represents past performance, which is no guarantee of future results. Investment return and principal value will fluctuate, and shares, when redeemed, may be worth more or less than their original cost.
Class C shares held for less than one year are also subject to a 1% contingent deferred sales charge (CDSC). If you paid a 1% sales charge, your returns would be lower than those shown above. “If Held” results represent the percent change in net asset value per share. NAV returns would have been lower had sales charges been reflected. All results are historical and assume the reinvestment of dividends and capital gains. Other share classes are available for which performance and expenses will differ.
Performance results reflect any applicable expense waivers in effect during the periods shown. Without such waivers Fund performance would be lower. Waivers may not be in effect for all funds. Certain fee waivers are contractual through a specified period. Otherwise, fee waivers can be rescinded at any time. See the prospectus and financial statements for more information.
The performance table and graph do not reflect the deduction of fees and taxes that a shareowner would pay on Fund distributions or the redemption of Fund shares.
Please refer to the financial highlights for a more current expense ratio.
14 Pioneer Bond Fund | Annual Report | 6/30/21
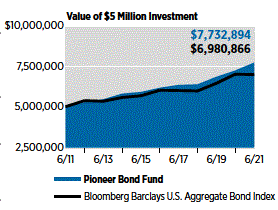
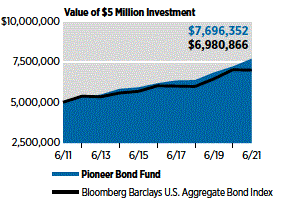
Performance Update | 6/30/21 | Class K Shares |
Investment Returns
The mountain chart on the right shows the change in value of a $5 million investment made in Class K shares of Pioneer Bond Fund during the periods shown, compared to that of the Bloomberg Barclays U.S. Aggregate Bond Index.
Average Annual Total Returns
(As of June 30, 2021)
| Bloomberg | ||
| Net | Barclays U.S. | |
| Asset | Aggregate | |
| Value | Bond | |
| Period | (NAV) | Index |
10 years | 4.46% | 3.39% |
5 years | 4.57 | 3.03 |
1 year | 6.66 | -0.33 |
| Expense Ratio |
(Per prospectus dated November 1, 2020) |
| Gross |
0.34% |
Call 1-800-225-6292 or visit www.amundi.com/us for the most recent month-end performance results. Current performance may be lower or higher than the performance data quoted.
The performance data quoted represents past performance, which is no guarantee of future results. Investment return and principal value will fluctuate, and shares, when redeemed, may be worth more or less than their original cost.
The performance shown for Class K shares for the period prior to the commencement of operations of Class K shares on December 20, 2012, is the net asset value performance of the Fund’s Class A shares, which has not been restated to reflect any differences in expenses, including Rule 12b-1 fees applicable to Class A shares. Since fees for Class A shares generally are higher than those of Class K shares, the performance of Class K shares prior to their inception would have been higher than the performance shown. Class K shares are not subject to sales charges and are available for limited groups of eligible investors, including institutional investors. All results are historical and assume the reinvestment of dividends and capital gains.
Performance results reflect any applicable expense waivers in effect during the periods shown. Without such waivers Fund performance would be lower. Waivers may not be in effect for all funds. Certain fee waivers are contractual through a specified period. Otherwise, fee waivers can be rescinded at any time. See the prospectus and financial statements for more information.
The performance table and graph do not reflect the deduction of fees and taxes that a shareowner would pay on Fund distributions or the redemption of Fund shares.
Please refer to the financial highlights for a more current expense ratio.
Pioneer Bond Fund | Annual Report | 6/30/21 15
Performance Update | 6/30/21 | Class R Shares |
Investment Returns
The mountain chart on the right shows the change in value of a $10,000 investment made in Class R shares of Pioneer Bond Fund during the periods shown, compared to that of the Bloomberg Barclays U.S. Aggregate Bond Index.
Average Annual Total Returns
(As of June 30, 2021)
| Bloomberg | ||
| Net | Barclays U.S. | |
| Asset | Aggregate | |
| Value | Bond | |
| Period | (NAV) | Index |
10 years | 3.81% | 3.39% |
5 years | 3.87 | 3.03 |
1 year | 5.97 | -0.33 |

| Expense Ratio |
(Per prospectus dated November 1, 2020) |
| Gross |
1.08% |
Call 1-800-225-6292 or visit www.amundi.com/us for the most recent month-end performance results. Current performance may be lower or higher than the performance data quoted.
The performance data quoted represents past performance, which is no guarantee of future results. Investment return and principal value will fluctuate, and shares, when redeemed, may be worth more or less than their original cost.
Class R shares are not subject to sales charges and are available for limited groups of eligible investors, including institutional investors. All results are historical and assume the reinvestment of dividends and capital gains. Other share classes are available for which performance and expenses will differ.
Performance results reflect any applicable expense waivers in effect during the periods shown. Without such waivers Fund performance would be lower. Waivers may not be in effect for all funds. Certain fee waivers are contractual through a specified period. Otherwise, fee waivers can be rescinded at any time. See the prospectus and financial statements for more information.
The performance table and graph do not reflect the deduction of fees and taxes that a shareowner would pay on Fund distributions or the redemption of Fund shares.
Please refer to the financial highlights for a more current expense ratio.
16 Pioneer Bond Fund | Annual Report | 6/30/21
Performance Update | 6/30/21 | Class Y Shares |
Investment Returns
The mountain chart on the right shows the change in value of a $5 million investment made in Class Y shares of Pioneer Bond Fund during the periods shown, compared to that of the Bloomberg Barclays U.S. Aggregate Bond Index.
Average Annual Total Returns
(As of June 30, 2021)
| Bloomberg | ||
| Net | Barclays U.S. | |
| Asset | Aggregate | |
| Value | Bond | |
| Period | (NAV) | Index |
10 years | 4.41% | 3.39% |
5 years | 4.47 | 3.03 |
1 year | 6.58 | -0.33 |
| Expense Ratio |
(Per prospectus dated November 1, 2020) |
| Gross |
0.45% |
Call 1-800-225-6292 or visit www.amundi.com/us for the most recent month-end performance results. Current performance may be lower or higher than the performance data quoted.
The performance data quoted represents past performance, which is no guarantee of future results. Investment return and principal value will fluctuate, and shares, when redeemed, may be worth more or less than their original cost.
Class Y shares are not subject to sales charges and are available for limited groups of eligible investors, including institutional investors. All results are historical and assume the reinvestment of dividends and capital gains. Other share classes are available for which performance and expenses will differ.
Performance results reflect any applicable expense waivers in effect during the periods shown. Without such waivers Fund performance would be lower. Waivers may not be in effect for all funds. Certain fee waivers are contractual through a specified period. Otherwise, fee waivers can be rescinded at any time. See the prospectus and financial statements for more information.
The performance table and graph do not reflect the deduction of fees and taxes that a shareowner would pay on Fund distributions or the redemption of Fund shares.
Please refer to the financial highlights for a more current expense ratio.
Pioneer Bond Fund | Annual Report | 6/30/21 17
As a shareowner in the Fund, you incur two types of costs:
(1) ongoing costs, including management fees, distribution and/or service (12b-1) fees, and other Fund expenses; and
(2) transaction costs, including sales charges (loads) on purchase payments.
This example is intended to help you understand your ongoing expenses (in dollars) of investing in the Fund and to compare these costs with the ongoing costs of investing in other mutual funds. The example is based on an investment of $1,000 at the beginning of the Fund’s latest six-month period and held throughout the six months.
Using the Tables
Actual Expenses
The first table below provides information about actual account values and actual expenses. You may use the information in this table, together with the amount you invested, to estimate the expenses that you paid over the period as follows:
(1) Divide your account value by $1,000
Example: an $8,600 account value ÷ $1,000 = 8.6
(2) Multiply the result in (1) above by the corresponding share class’s number in the third row under the heading entitled “Expenses Paid During Period” to estimate the expenses you paid on your account during this period.
Expenses Paid on a $1,000 Investment in Pioneer Bond Fund
Based on actual returns from January 1, 2021 through June 30, 2021.
| Share Class | A | C | K | R | Y |
Beginning | $1,000.00 | $1,000.00 | $1,000.00 | $1,000.00 | $1,000.00 |
Account Value | |||||
on 1/1/21 | |||||
Ending Account | $1,062.60 | $1,056.30 | $1,066.60 | $1,059.70 | $1,065.80 |
Value (after | |||||
expenses) | |||||
on 6/30/21 | |||||
Expenses Paid | $4.07 | $7.09 | $1.69 | $5.36 | $2.24 |
During Period* |
* Expenses are equal to the Fund’s annualized expense ratio of 0.82%, 1.43%, 0.34%, 1.08%, and 0.45% |
| for Class A, Class C, Class K, Class R and Class Y shares, respectively, multiplied by the average |
| account value over the period, multiplied by 181/365 (to reflect the one-half year period). |
18 Pioneer Bond Fund | Annual Report | 6/30/21
Hypothetical Example for Comparison Purposes
The table below provides information about hypothetical account values and hypothetical expenses based on the Fund’s actual expense ratio and an assumed rate of return of 5% per year before expenses, which is not the Fund’s actual return. The hypothetical account values and expenses may not be used to estimate the actual ending account balance or expenses you paid for the period. You may use this information to compare the ongoing costs of investing in the Fund and other funds. To do so, compare this 5% hypothetical example with the 5% hypothetical examples that appear in the shareholder reports of the other funds.
Please note that the expenses shown in the tables are meant to highlight your ongoing costs only and do not reflect any transaction costs, such as sales charges (loads) that are charged at the time of the transaction. Therefore, the table below is useful in comparing ongoing costs only and will not help you determine the relative total costs of owning different funds. In addition, if these transaction costs were included, your costs would have been higher.
Expenses Paid on a $1,000 Investment in Pioneer Bond Fund
Based on a hypothetical 5% per year return before expenses, reflecting the period from January 1, 2021 through June 30, 2021.
| Share Class | A | C | K | R | Y |
Beginning | $1,000.00 | $1,000.00 | $1,000.00 | $1,000.00 | $1,000.00 |
Account Value | |||||
on 1/1/21 | |||||
Ending Account | $1,020.73 | $1,017.70 | $1,023.11 | $1,019.44 | $1,022.56 |
Value (after | |||||
expenses) | |||||
on 6/30/21 | |||||
Expenses Paid | $4.11 | $7.15 | $1.71 | $5.41 | $2.26 |
During Period* |
* Expenses are equal to the Fund’s annualized expense ratio of 0.82%, 1.43%, 0.34%, 1.08%, and 0.45% for Class A, Class C, Class K, Class R and Class Y shares, respectively, multiplied by the average account value over the period, multiplied by 181/365 (to reflect the one-half year period).
Pioneer Bond Fund | Annual Report | 6/30/21 19
| Shares | Value | ||
| UNAFFILIATED ISSUERS — 118.9% | |||
| COMMON STOCK — 0.0%† of Net Assets | |||
| Auto Components — 0.0%† | |||
| 593 | Lear Corp. | $ 103,941 | |
| Total Auto Components | $ 103,941 | ||
| TOTAL COMMON STOCK | |||
(Cost $69,268) | $ 103,941 | ||
| CONVERTIBLE PREFERRED STOCK — 1.4% of | |||
| Net Assets | |||
| Banks — 1.4% | |||
| 52,347(a) | Wells Fargo & Co., 7.5% | $ 79,892,515 | |
| Total Banks | $ 79,892,515 | ||
| TOTAL CONVERTIBLE PREFERRED STOCK | |||
(Cost $73,444,276) | $ 79,892,515 | ||
| Principal | |||
| Amount | |||
| USD ($) | |||
| ASSET BACKED SECURITIES — 11.7% of Net Assets | |||
| 462,119(b) | 321 Henderson Receivables LLC, Series 2005-1A, | ||
| Class A1, 0.331% (1 Month USD LIBOR + 23 bps), | |||
| 11/15/40 (144A) | $ 455,397 | ||
| 500,000 | 321 Henderson Receivables III LLC, Series 2008-1A, | ||
| Class B, 8.37%, 1/15/46 (144A) | 601,192 | ||
| 8,857,809 | A10 Bridge Asset Financing LLC, Series 2019-B, Class A1, | ||
| 3.085%, 8/15/40 (144A) | 8,922,272 | ||
| 2,000,000(b) | ABPCI Direct Lending Fund CLO X LP, Series 2020-10A, | ||
| Class A1A, 2.138% (3 Month USD LIBOR + | |||
| 195 bps), 1/20/32 (144A) | 2,004,410 | ||
| 4,000,000 | American Credit Acceptance Receivables Trust, Series | ||
| 2019-2, Class E, 4.29%, 6/12/25 (144A) | 4,195,184 | ||
| 800,000 | Amur Equipment Finance Receivables V LLC, Series | ||
| 2018-1A, Class C, 3.74%, 4/22/24 (144A) | 801,107 | ||
| 1,249,999 | Amur Equipment Finance Receivables V LLC, Series | ||
| 2018-1A, Class D, 3.98%, 4/22/24 (144A) | 1,251,744 | ||
| 1,675,000 | Amur Equipment Finance Receivables VI LLC, Series | ||
| 2018-2A, Class C, 4.27%, 1/20/23 (144A) | 1,722,448 | ||
| 5,784,000 | Amur Equipment Finance Receivables VI LLC, Series | ||
| 2018-2A, Class D, 4.45%, 6/20/23 (144A) | 5,910,772 | ||
| 3,833,000 | Amur Equipment Finance Receivables VII LLC, Series | ||
| 2019-1A, Class B, 2.8%, 3/20/25 (144A) | 3,940,703 | ||
| 2,676,000 | Amur Equipment Finance Receivables VII LLC, Series | ||
| 2019-1A, Class E, 4.47%, 3/20/25 (144A) | 2,690,651 | ||
| 5,900,000 | Aqua Finance Trust, Series 2019-A, Class C, 4.01%, | ||
| 7/16/40 (144A) | 6,222,741 | ||
| 2,300,000 | Aqua Finance Trust, Series 2020-AA, Class C, 3.97%, | ||
| 7/17/46 (144A) | 2,417,048 | ||
| 7,000,000 | Arivo Acceptance Auto Loan Receivables Trust, Series | ||
| 2019-1, Class B, 3.37%, 6/15/25 (144A) | 7,166,218 | ||
| 3,000,000(b) | ASSURANT CLO, Ltd., Series 2018-3A, Class E, 6.338% | ||
| (3 Month USD LIBOR + 615 bps), 10/20/31 (144A) | 2,887,842 |
The accompanying notes are an integral part of these financial statements.
20 Pioneer Bond Fund | Annual Report | 6/30/21
| Principal | |||
| Amount | |||
| USD ($) | Value | ||
| ASSET BACKED SECURITIES — (continued) | |||
| 1,250,000(b) | ASSURANT CLO, Ltd., Series 2019-5A, Class D, 4.384% | ||
(3 Month USD LIBOR + 420 bps), 1/15/33 (144A) | $ 1,256,000 | ||
| 2,000,000 | Avid Automobile Receivables Trust, Series 2019-1, | ||
Class C, 3.14%, 7/15/26 (144A) | 2,056,796 | ||
| 8,750,000(b) | Battalion CLO XV, Ltd., Series 2020-15A, Class D, 3.44% | ||
(3 Month USD LIBOR + 325 bps), 1/17/33 (144A) | 8,771,735 | ||
| 238,668 | BCC Funding XIV LLC, Series 2018-1A, Class B, 3.39%, | ||
8/21/23 (144A) | 239,168 | ||
| 1,300,000 | BCC Funding XVII LLC, Series 2020-1, Class C, 2.5%, | ||
9/22/25 (144A) | 1,302,811 | ||
| 2,000,000(b) | Benefit Street Partners CLO XIX, Ltd., Series 2019-19A, | ||
Class E, 7.204% (3 Month USD LIBOR + | |||
702 bps), 1/15/33 (144A) | 1,999,908 | ||
| 10,500,000 | Blackbird Capital Aircraft, Series 2021-1A, Class A, | ||
2.443%, 7/15/46 (144A) | 10,560,732 | ||
| 465,505 | BXG Receivables Note Trust, Series 2015-A, Class A, | ||
2.88%, 5/2/30 (144A) | 466,249 | ||
| 2,750,000(b) | Carlyle US CLO, Ltd., Series 2019-4A, Class C, 4.184% | ||
(3 Month USD LIBOR + 400 bps), 1/15/33 (144A) | 2,761,379 | ||
| 7,716,562(c) | Cascade MH Asset Trust, Series 2019-MH1, Class A, 4.0%, | ||
11/25/44 (144A) | 8,073,161 | ||
| 8,600,000 | CIG Auto Receivables Trust, Series 2019-1A, Class B, | ||
3.59%, 8/15/24 (144A) | 8,746,956 | ||
| 530,357(b) | Commonbond Student Loan Trust, Series 2017-BGS, | ||
Class A2, 0.742% (1 Month USD LIBOR + | |||
65 bps), 9/25/42 (144A) | 526,152 | ||
| 1,732,517 | Conn’s Receivables Funding LLC, Series 2019-B, Class B, | ||
3.62%, 6/17/24 (144A) | 1,738,904 | ||
| 7,600,000 | Continental Credit Card ABS LLC, Series 2019-1A, | ||
Class A, 3.83%, 8/15/26 (144A) | 7,745,181 | ||
| 3,000,000 | CoreVest American Finance Trust, Series 2017-1, Class C, | ||
3.756%, 10/15/49 (144A) | 3,043,650 | ||
| 2,400,000 | DataBank Issuer, Series 2021-1A, Class B, 2.65%, | ||
2/27/51 (144A) | 2,427,762 | ||
| 925,745 | Diamond Resorts Owner Trust, Series 2019-1A, Class B, | ||
3.53%, 2/20/32 (144A) | 956,300 | ||
| 9,183,750 | Domino’s Pizza Master Issuer LLC, Series 2019-1A, | ||
Class A2, 3.668%, 10/25/49 (144A) | 9,936,175 | ||
| 102,584(b) | DRB Prime Student Loan Trust, Series 2016-B, Class A1, | ||
1.892% (1 Month USD LIBOR + 180 bps), 6/25/40 (144A) | 102,835 | ||
| 2,400,000 | Drive Auto Receivables Trust, Series 2020-2, Class C, | ||
2.28%, 8/17/26 | 2,462,632 | ||
| 1,650,000 | Drive Auto Receivables Trust, Series 2020-2, Class D, | ||
3.05%, 5/15/28 | 1,716,928 | ||
| 4,200,000(b) | Dryden 78 CLO, Ltd., Series 2020-78A, Class E, 6.79% (3 | ||
Month USD LIBOR + 660 bps), 4/17/33 (144A) | 4,210,017 | ||
| 1,800,000 | Elm Trust, Series 2020-3A, Class A2, 2.954%, | ||
8/20/29 (144A) | 1,804,354 |
The accompanying notes are an integral part of these financial statements.
Pioneer Bond Fund | Annual Report | 6/30/21 21
Schedule of Investments | 6/30/21 (continued)
| Principal | |||
| Amount | |||
| USD ($) | Value | ||
| ASSET BACKED SECURITIES — (continued) | |||
| 4,000,000 | ExteNet LLC, Series 2019-1A, Class C, 5.219%, | ||
7/26/49 (144A) | $ 4,160,295 | ||
| 6,000,000 | Fair Square Issuance Trust, Series 2020-AA, Class C, | ||
5.4%, 9/20/24 (144A) | 6,088,241 | ||
| 563,848 | FCI Funding LLC, Series 2019-1A, Class A, 3.63%, | ||
2/18/31 (144A) | 570,776 | ||
| 693,966 | FCI Funding LLC, Series 2019-1A, Class B, 0.0%, | ||
2/18/31 (144A) | 699,167 | ||
| 2,650,000(c) | Finance of America HECM Buyout, Series 2021-HB1, | ||
Class M2, 2.084%, 2/25/31 (144A) | 2,638,206 | ||
| 8,761,133 | Finance of America Structured Securities Trust, Series | ||
2019-A, Class JR2, 0.0%, 3/25/69 | 9,552,308 | ||
| 9,613,817 | Finance of America Structured Securities Trust, Series | ||
2019-JR3, Class JR2, 2.0%, 9/25/69 | 10,255,767 | ||
| 9,890,695 | Finance of America Structured Securities Trust, Series | ||
2021-JR1, 0.0%, 4/25/51 | 9,814,160 | ||
| 4,500,000(b) | First Eagle BSL CLO, Ltd., Series 2019-1A, Class C, | ||
4.538% (3 Month USD LIBOR + 435 bps), 1/20/33 (144A) | 4,510,444 | ||
| 1,000,000(b) | First Eagle BSL CLO, Ltd., Series 2019-1A, Class D, | ||
7.888% (3 Month USD LIBOR + 770 bps), 1/20/33 (144A) | 994,352 | ||
| 1,000,000(b) | Fort Washington CLO, Series 2019-1A, Class E, 7.438% | ||
(3 Month USD LIBOR + 725 bps), 10/20/32 (144A) | 1,000,858 | ||
| 3,750,000 | Foundation Finance Trust, Series 2019-1A, Class B, | ||
4.22%, 11/15/34 (144A) | 4,010,198 | ||
| 5,967,842 | Foundation Finance Trust, Series 2021-1A, Class A, | ||
1.27%, 5/15/41 (144A) | 5,975,217 | ||
| 4,200,000 | Four Seas LP, Series 2017-1A, Class A2, 5.927%, | ||
8/28/27 (144A) | 3,717,423 | ||
| 1,750,000 | Foursight Capital Automobile Receivables Trust, Series | ||
2019-1, Class D, 3.27%, 6/16/25 (144A) | 1,807,346 | ||
| 4,390,000(b) | Goldentree Loan Management US CLO 6, Ltd., Series | ||
2019-6A, Class D, 4.038% (3 Month USD LIBOR + | |||
385 bps), 1/20/33 (144A) | 4,418,970 | ||
| 4,215,788 | Hardee’s Funding LLC, Series 2018-1A, Class A2II, | ||
4.959%, 6/20/48 (144A) | 4,470,758 | ||
| 5,000,000(b) | Harriman Park CLO LTD, Series 2020-1A, Class DR, 0.0% | ||
(3 Month USD LIBOR + 310 bps), 4/20/34 (144A) | 4,999,945 | ||
| 831,891 | HIN Timeshare Trust, Series 2020-A, Class D, 5.5%, | ||
10/9/39 (144A) | 866,193 | ||
| 4,152,000 | HOA Funding LLC, Series 2014-1A, Class A2, 4.846%, | ||
8/20/44 (144A) | 4,128,209 | ||
| 3,417,251 | Home Partners of America Trust, Series 2019-1, Class D, | ||
3.406%, 9/17/39 (144A) | 3,425,882 | ||
| 4,816,346 | Home Partners of America Trust, Series 2019-2, Class E, | ||
3.32%, 10/19/39 (144A) | 4,781,427 | ||
| 5,250,000 | Horizon Funding LLC, Series 2019-1A, Class A1, 4.21%, | ||
9/15/27 (144A) | 5,314,050 | ||
| 666,243 | Icon Brand Holdings LLC, Series 2012-1A, Class A, | ||
4.229%, 1/25/43 (144A) | 282,682 |
The accompanying notes are an integral part of these financial statements.
22 Pioneer Bond Fund | Annual Report | 6/30/21
| Principal | |||
| Amount | |||
| USD ($) | Value | ||
| ASSET BACKED SECURITIES — (continued) | |||
| 183,300 | Icon Brand Holdings LLC, Series 2013-1A, Class A2, | ||
4.352%, 1/25/43 (144A) | $ 77,909 | ||
| 3,650,000(b) | Invitation Homes Trust, Series 2018-SFR1, Class C, | ||
1.332% (1 Month USD LIBOR + 125 bps), 3/17/37 (144A) | 3,655,722 | ||
| 4,729,060(b) | Invitation Homes Trust, Series 2018-SFR2, Class D, | ||
1.523% (1 Month USD LIBOR + 145 bps), 6/17/37 (144A) | 4,738,096 | ||
| 4,786,089(b) | Invitation Homes Trust, Series 2018-SFR3, Class D, | ||
1.732% (1 Month USD LIBOR + 165 bps), 7/17/37 (144A) | 4,790,704 | ||
| 230,783 | JG Wentworth XXII LLC, Series 2010-3A, Class A, 3.82%, | ||
12/15/48 (144A) | 243,012 | ||
| 3,528,577 | JG Wentworth XLI LLC, Series 2018-1A, Class A, 3.74%, | ||
10/17/72 (144A) | 3,933,600 | ||
| 5,783,026 | JG Wentworth XLIII LLC, Series 2019-1A, Class A, 3.82%, | ||
8/17/71 (144A) | 6,486,512 | ||
| 3,200,000(b) | Kayne CLO 7, Ltd., Series 2020-7A, Class E, 6.69% | ||
(3 Month USD LIBOR + 650 bps), 4/17/33 (144A) | 3,210,160 | ||
| 2,100,000 | LL ABS Trust, Series 2019-1A, Class B, 3.52%, | ||
3/15/27 (144A) | 2,119,994 | ||
| 5,128,757(b) | M360 LLC, Series 2019-CRE2, Class A, 1.524% (1 Month | ||
USD LIBOR + 140 bps), 9/15/34 (144A) | 5,131,708 | ||
| 4,850,000(b) | Madison Park Funding XXII, Ltd., Series 2016-22A, | ||
Class ER, 6.884% (3 Month USD LIBOR + 670 bps), | |||
1/15/33 (144A) | 4,840,271 | ||
| 3,750,000(b) | Madison Park Funding XXXVI, Ltd., Series 2019-36A, | ||
Class D, 3.934% (3 Month USD LIBOR + 375 bps), | |||
1/15/33 (144A) | 3,759,499 | ||
| 4,400,000(b) | Madison Park Funding XXXVI, Ltd., Series 2019-36A, | ||
Class E, 7.434% (3 Month USD LIBOR + 725 bps), | |||
1/15/33 (144A) | 4,404,110 | ||
| 5,950,000 | Marlette Funding Trust, Series 2019-2A, Class C, 4.11%, | ||
7/16/29 (144A) | 6,083,287 | ||
| 1,143,950 | Marlin Receivables LLC, Series 2018-1A, Class C, 3.7%, | ||
6/20/23 (144A) | 1,145,041 | ||
| 7,550,000 | Mercury Financial Credit Card Master Trust, Series | ||
2021-1A, Class A, 1.54%, 3/20/26 (144A) | 7,572,289 | ||
| 3,203,703(c) | Mill City Mortgage Loan Trust, Series 2017-3, Class B2, | ||
3.25%, 1/25/61 (144A) | 3,289,958 | ||
| 2,795,782(c) | Mill City Mortgage Loan Trust, Series 2018-2, Class B1, | ||
3.75%, 5/25/58 (144A) | 2,896,059 | ||
| 9,467,816(c) | Mill City Mortgage Loan Trust, Series 2018-3, Class M3, | ||
3.25%, 8/25/58 (144A) | 9,854,544 | ||
| 3,332,000(c) | Mill City Mortgage Trust, Series 2015-1, Class B3, | ||
3.639%, 6/25/56 (144A) | 3,603,093 | ||
| 2,608,038 | Mosaic Solar Loan Trust, Series 2019-2A, Class A, 2.88%, | ||
9/20/40 (144A) | 2,738,050 | ||
| 1,443,418 | Mosaic Solar Loan Trust, Series 2019-2A, Class C, 4.35%, | ||
9/20/40 (144A) | 1,446,327 | ||
| 1,176,894 | Mosaic Solar Loan Trust, Series 2020-1A, Class A, 2.1%, | ||
4/20/46 (144A) | 1,199,541 |
The accompanying notes are an integral part of these financial statements.
Pioneer Bond Fund | Annual Report | 6/30/21 23
Schedule of Investments | 6/30/21 (continued)
| Principal | |||
| Amount | |||
| USD ($) | Value | ||
| ASSET BACKED SECURITIES — (continued) | |||
| 844,514 | MVW LLC, Series 2020-1A, Class C, 4.21%, | ||
10/20/37 (144A) | $ 894,421 | ||
| 5,550,000 | Nelnet Student Loan Trust, Series 2021-A, Class B1, | ||
2.85%, 4/20/62 (144A) | 5,665,549 | ||
| 2,850,000(b) | Newark BSL CLO 1, Ltd., Series 2016-1A, Class CR, 3.181% | ||
(3 Month USD LIBOR + 300 bps), 12/21/29 (144A) | 2,850,302 | ||
| 1,954,865(b) | Newtek Small Business Loan Trust, Series 2017-1, | ||
Class A, 2.092% (1 Month USD LIBOR + 200 bps), | |||
2/25/43 (144A) | 1,944,957 | ||
| 1,500,000 | NMEF Funding LLC, Series 2019-A, Class B, 3.06%, | ||
8/17/26 (144A) | 1,521,361 | ||
| 3,000,000 | NMEF Funding LLC, Series 2019-A, Class C, 3.3%, | ||
8/17/26 (144A) | 3,066,991 | ||
| 3,000,000 | NMEF Funding LLC, Series 2019-A, Class D, 4.39%, | ||
8/17/26 (144A) | 3,064,956 | ||
| 2,300,000 | NMEF Funding LLC, Series 2021-A, Class C, 2.58%, | ||
12/15/27 (144A) | 2,295,156 | ||
| 2,700,000 | Oportun Funding XIV LLC, Series 2021-A, Class C, 3.44%, | ||
3/8/28 (144A) | 2,695,612 | ||
| 3,716,805 | Orange Lake Timeshare Trust, Series 2019-A, Class D, | ||
4.93%, 4/9/38 (144A) | 3,837,609 | ||
| 2,842,376 | Oxford Finance Funding LLC, Series 2019-1A, Class B, | ||
5.438%, 2/15/27 (144A) | 2,934,653 | ||
| 4,000,000(b) | Palmer Square Loan Funding, Ltd., Series 2020-1A, | ||
Class B, 2.055% (3 Month USD LIBOR + | |||
190 bps), 2/20/28 (144A) | 4,001,104 | ||
| 4,000,000(b) | Palmer Square Loan Funding, Ltd., Series 2020-1A, | ||
Class D, 5.005% (3 Month USD LIBOR + | |||
485 bps), 2/20/28 (144A) | 3,896,412 | ||
| 5,500,000 | Perimeter Master Note Business Trust, Series 2019-2A, | ||
Class B, 5.21%, 5/15/24 (144A) | 5,667,128 | ||
| 5,000,000 | PG Receivables Finance, Series 2020-1, Class A1, 3.968%, | ||
7/20/25 (144A) | 5,022,656 | ||
| 2,350,000 | PG Receivables Finance, Series 2020-1, Class B, 4.705%, | ||
7/20/25 (144A) | 2,360,648 | ||
| 3,250,000 | Progress Residential Trust, Series 2018-SFR2, Class E, | ||
4.656%, 8/17/35 (144A) | 3,268,061 | ||
| 5,810,000 | Progress Residential Trust, Series 2018-SFR3, Class E, | ||
4.873%, 10/17/35 (144A) | 5,877,671 | ||
| 8,370,000 | Progress Residential Trust, Series 2019-SFR2, Class E, | ||
4.142%, 5/17/36 (144A) | 8,544,928 | ||
| 8,500,000(b) | Race Point VIII CLO, Ltd., Series 2013-8A, Class CR2, | ||
2.205% (3 Month USD LIBOR + 205 bps), 2/20/30 (144A) | 8,502,099 | ||
| 4,000,000(b) | Race Point VIII CLO, Ltd., Series 2013-8A, Class DR2, | ||
3.655% (3 Month USD LIBOR + 350 bps), 2/20/30 (144A) | 4,001,160 | ||
| 8,000,000 | Republic Finance Issuance Trust, Series 2019-A, Class A, | ||
3.43%, 11/22/27 (144A) | 8,085,172 | ||
| 3,404,000 | SCF Equipment Leasing LLC, Series 2019-2A, Class A2, | ||
2.47%, 4/20/26 (144A) | 3,484,443 |
The accompanying notes are an integral part of these financial statements.
24 Pioneer Bond Fund | Annual Report | 6/30/21
| Principal | |||
| Amount | |||
| USD ($) | Value | ||
| ASSET BACKED SECURITIES — (continued) | |||
| 7,400,000 | SCF Equipment Leasing LLC, Series 2019-1A, Class C, | ||
3.92%, 11/20/26 (144A) | $ 7,434,050 | ||
| 4,600,000 | SCF Equipment Leasing LLC, Series 2019-2A, Class C, | ||
3.11%, 6/21/27 (144A) | 4,813,585 | ||
| 4,734,784(c) | Sequoia Mortgage Trust, Series 2021-3, Class B1, 2.664%, | ||
5/25/51 (144A) | 4,670,333 | ||
| 5,000,000(b) | Signal Peak CLO 2 LLC, Series 2015-1A, Class DR2, 3.038% | ||
(3 Month USD LIBOR + 285 bps), 4/20/29 (144A) | 4,943,595 | ||
| 1,162,000 | Small Business Lending Trust, Series 2019-A, Class B, | ||
3.42%, 7/15/26 (144A) | 1,157,620 | ||
| 4,000,000(b) | Sound Point CLO XXV, Ltd., Series 2019-4A, Class D, | ||
4.294% (3 Month USD LIBOR + 411 bps), 1/15/33 | |||
(144A) | 4,017,876 | ||
| 4,100,000(b) | Sound Point CLO XXV, Ltd., Series 2019-4A, Class E, | ||
7.804% (3 Month USD LIBOR + 762 bps), 1/15/33 (144A) | 4,116,355 | ||
| 2,750,000(b) | Sound Point CLO XXVIII, Ltd., Series 2020-3A, Class D, | ||
3.905% (3 Month USD LIBOR + 365 bps), 1/25/32 (144A) | 2,755,687 | ||
| 9,203,907 | SpringCastle America Funding LLC, Series 2020-AA, | ||
Class A, 1.97%, 9/25/37 (144A) | 9,294,855 | ||
| 8,750,000(b) | Symphony CLO XXII, Ltd., Series 2020-22A, Class C, 2.34% | ||
(3 Month USD LIBOR + 215 bps), 4/18/33 (144A) | 8,699,434 | ||
| 1,422,532 | Tidewater Auto Receivables Trust, Series 2018-AA, | ||
Class C, 3.84%, 11/15/24 (144A) | 1,431,464 | ||
| 1,078,000 | Tidewater Auto Receivables Trust, Series 2018-AA, | ||
Class D, 4.3%, 11/15/24 (144A) | 1,090,701 | ||
| 5,000,000(c) | Towd Point Mortgage Trust, Series 2015-2, Class 1B3, | ||
3.434%, 11/25/60 (144A) | 5,187,827 | ||
| 6,000,000(c) | Towd Point Mortgage Trust, Series 2015-6, Class B1, | ||
3.859%, 4/25/55 (144A) | 6,366,199 | ||
| 9,700,000(c) | Towd Point Mortgage Trust, Series 2016-1, Class B1, | ||
3.725%, 2/25/55 (144A) | 10,005,292 | ||
| 7,000,000(c) | Towd Point Mortgage Trust, Series 2016-3, Class B1, | ||
4.094%, 4/25/56 (144A) | 7,476,509 | ||
| 12,080,000(c) | Towd Point Mortgage Trust, Series 2017-1, Class B2, | ||
3.819%, 10/25/56 (144A) | 12,856,772 | ||
| 12,925,000(c) | Towd Point Mortgage Trust, Series 2017-2, Class B2, | ||
4.091%, 4/25/57 (144A) | 13,730,853 | ||
| 8,720,000(c) | Towd Point Mortgage Trust, Series 2017-4, Class B1, | ||
3.472%, 6/25/57 (144A) | 9,461,040 | ||
| 3,200,000(c) | Towd Point Mortgage Trust, Series 2017-6, Class M2, | ||
3.25%, 10/25/57 (144A) | 3,364,787 | ||
| 5,161,000(c) | Towd Point Mortgage Trust, Series 2018-1, Class B1, | ||
3.798%, 1/25/58 (144A) | 5,545,338 | ||
| 10,996,835(c) | Towd Point Mortgage Trust, Series 2018-3, Class M1, | ||
3.875%, 5/25/58 (144A) | 11,715,672 | ||
| 11,185,000(c) | Towd Point Mortgage Trust, Series 2018-3, Class M2, | ||
3.875%, 5/25/58 (144A) | 11,871,172 | ||
| 1,746,620(c) | Towd Point Mortgage Trust, Series 2018-SJ1, Class XA, | ||
5.0%, 10/25/58 (144A) | 1,782,983 |
The accompanying notes are an integral part of these financial statements.
Pioneer Bond Fund | Annual Report | 6/30/21 25
Schedule of Investments | 6/30/21 (continued)
| Principal | |||
| Amount | |||
| USD ($) | Value | ||
| ASSET BACKED SECURITIES — (continued) | |||
| 19,600,000(c) | Towd Point Mortgage Trust, Series 2019-4, Class M2B, | ||
3.25%, 10/25/59 (144A) | $ 20,427,383 | ||
| 20,380,000(b) | Towd Point Mortgage Trust, Series 2019-HY2, Class M2, | ||
1.992% (1 Month USD LIBOR + 190 bps), 5/25/58 (144A) | 21,052,061 | ||
| 812,255(c) | Towd Point Mortgage Trust, Series 2019-HY2, Class XA, | ||
5.0%, 5/25/58 (144A) | 811,377 | ||
| 10,000,000(c) | Towd Point Mortgage Trust, Series 2019-3, Class M2D, | ||
3.25%, 2/25/59 (144A) | 10,365,062 | ||
| 8,500,000(c) | Towd Point Mortgage Trust, Series 2019-3, Class M2E, | ||
3.0%, 2/25/59 (144A) | 8,706,949 | ||
| 2,000,000(b) | Towd Point Mortgage Trust, Series 2019-HY2, Class B1, | ||
2.342% (1 Month USD LIBOR + 225 bps), 5/25/58 (144A) | 2,061,841 | ||
| 8,500,000 | Tricon American Homes Trust, Series 2017-SFR2, Class B, | ||
3.275%, 1/17/36 (144A) | 8,693,228 | ||
| 9,404,736 | Tricon American Homes Trust, Series 2019-SFR1, Class A, | ||
2.75%, 3/17/38 (144A) | 9,812,836 | ||
| 5,650,000 | Tricon American Homes Trust, Series 2020-SFR2, Class E1, | ||
2.73%, 11/17/39 (144A) | 5,616,958 | ||
| 1,050,000(b) | Trinitas CLO VI, Ltd., Series 2017-6A, Class DR4, 0.0% | ||
(3 Month USD LIBOR + 425 bps), 1/25/34 (144A) | 1,050,456 | ||
| 7,907 | United States Small Business Administration, | ||
6.14%, 1/1/22 | 7,982 | ||
| 89,163 | United States Small Business Administration, Series | ||
2005-20B, Class 1, 4.625%, 2/1/25 | 93,195 | ||
| 72,499 | United States Small Business Administration, Series | ||
2005-20E, Class 1, 4.84%, 5/1/25 | 76,382 | ||
| 131,624 | United States Small Business Administration, Series | ||
2008-20D, Class 1, 5.37%, 4/1/28 | 143,602 | ||
| 142,529 | United States Small Business Administration, Series | ||
2008-20H, Class 1, 6.02%, 8/1/28 | 157,662 | ||
| 85,867 | United States Small Business Administration, Series | ||
2008-20J, Class 1, 5.63%, 10/1/28 | 94,662 | ||
| 74,182 | United States Small Business Administration, Series | ||
2008-20L, Class 1, 6.22%, 12/1/28 | 83,172 | ||
| 32,037 | United States Small Business Administration, Series | ||
2009-20A, Class 1, 5.72%, 1/1/29 | 35,516 | ||
| 81,919 | United States Small Business Administration, Series | ||
2009-20I, Class 1, 4.2%, 9/1/29 | 89,002 | ||
| 4,000,000 | Upstart Securitization Trust, Series 2020-1, Class C, | ||
4.899%, 4/22/30 (144A) | 4,148,110 | ||
| 1,312,017 | US Auto Funding LLC, Series 2019-1A, Class B, 3.99%, | ||
12/15/22 (144A) | 1,321,156 | ||
| 910,887 | Welk Resorts LLC, Series 2017-AA, Class B, 3.41%, | ||
6/15/33 (144A) | 914,551 | ||
| 1,563,212 | Welk Resorts LLC, Series 2019-AA, Class C, 3.34%, | ||
6/15/38 (144A) | 1,601,716 | ||
| 750,291 | Welk Resorts LLC, Series 2019-AA, Class D, 4.03%, | ||
6/15/38 (144A) | 772,662 |
The accompanying notes are an integral part of these financial statements.
26 Pioneer Bond Fund | Annual Report | 6/30/21
| Principal | |||
| Amount | |||
| USD ($) | Value | ||
| ASSET BACKED SECURITIES — (continued) | |||
| 2,394,630 | Westgate Resorts LLC, Series 2018-1A, Class C, 4.1%, | ||
| 12/20/31 (144A) | $ 2,421,620 | ||
| 4,472,420 | Westgate Resorts LLC, Series 2020-1A, Class C, 6.213%, | ||
| 3/20/34 (144A) | 4,720,057 | ||
| 3,220,000 | Westlake Automobile Receivables Trust, Series 2020-2A, | ||
| Class D, 2.76%, 1/15/26 (144A) | 3,331,977 | ||
| 1,800,000(b) | Whitebox Clo II Ltd., Series 2020-2A, Class E, 8.026% | ||
| (3 Month USD LIBOR + 785 bps), 10/24/31 (144A) | 1,796,918 | ||
| 1,500,000(b) | Woodmont Trust, Series 2020-7A, Class A1A, 2.084% | ||
| (3 Month USD LIBOR + 190 bps), 1/15/32 (144A) | 1,512,550 | ||
| 225,713 | WRG Debt Funding II LLC, Series 2017-1, Class A, 4.458%, | ||
| 3/15/26 (144A) | 225,748 | ||
| 6,400,000(b) | York Clo-4, Ltd., Series 2016-2A, Class CR, 2.338% (3 | ||
Month USD LIBOR + 215 bps), 4/20/32 (144A) | 6,400,352 | ||
| TOTAL ASSET BACKED SECURITIES | |||
(Cost $669,242,225) | $ 685,617,665 | ||
| COLLATERALIZED MORTGAGE OBLIGATIONS — | |||
| 17.1% of Net Assets | |||
| 3,837,460(c) | Ajax Mortgage Loan Trust, Series 2021-A, Class A1, | ||
| 1.065%, 9/25/65 (144A) | $ 3,834,132 | ||
| 2,800,000 | American Homes 4 Rent Trust, Series 2014-SFR3, Class C, | ||
| 4.596%, 12/17/36 (144A) | 3,007,819 | ||
| 700,000 | American Homes 4 Rent Trust, Series 2014-SFR3, Class D, | ||
| 5.04%, 12/17/36 (144A) | 754,947 | ||
| 1,300,000 | American Homes 4 Rent Trust, Series 2015-SFR1, Class C, | ||
| 4.11%, 4/17/52 (144A) | 1,386,737 | ||
| 2,320,000(c) | Angel Oak Mortgage Trust I LLC, Series 2019-1, Class M1, | ||
| 4.5%, 11/25/48 (144A) | 2,347,669 | ||
| 6,700,000(c) | Angel Oak Mortgage Trust I LLC, Series 2019-2, Class M1, | ||
| 4.065%, 3/25/49 (144A) | 6,786,670 | ||
| 2,404,466(b) | Bellemeade Re, Ltd., Series 2018-1A, Class M1B, 1.692% | ||
| (1 Month USD LIBOR + 160 bps), 4/25/28 (144A) | 2,406,014 | ||
| 3,667,248(b) | Bellemeade Re, Ltd., Series 2018-3A, Class M1B, 1.942% | ||
| (1 Month USD LIBOR + 185 bps), 10/25/28 (144A) | 3,676,940 | ||
| 7,640,000(b) | Bellemeade Re, Ltd., Series 2018-3A, Class M2, 2.842% | ||
| (1 Month USD LIBOR + 275 bps), 10/25/28 (144A) | 7,697,203 | ||
| 4,530,000(b) | Bellemeade Re, Ltd., Series 2019-1A, Class M1B, 1.842% | ||
| (1 Month USD LIBOR + 175 bps), 3/25/29 (144A) | 4,529,999 | ||
| 4,060,000(b) | Bellemeade Re, Ltd., Series 2019-1A, Class M2, 2.792% | ||
| (1 Month USD LIBOR + 270 bps), 3/25/29 (144A) | 4,067,656 | ||
| 6,170,000(b) | Bellemeade Re, Ltd., Series 2020-3A, Class M1C, 3.792% | ||
| (1 Month USD LIBOR + 370 bps), 10/25/30 (144A) | 6,446,484 | ||
| 5,350,000(b) | Bellemeade Re, Ltd., Series 2020-3A, Class M2, 4.942% | ||
| (1 Month USD LIBOR + 485 bps), 10/25/30 (144A) | 5,630,068 | ||
| 6,650,000(b) | Bellemeade Re, Ltd., Series 2020-4A, Class M2B, 3.692% | ||
| (1 Month USD LIBOR + 360 bps), 6/25/30 (144A) | 6,732,723 | ||
| 5,589,754(c) | Brean Asset Backed Securities Trust, Series 2021-RM1, | ||
| Class A, 1.4%, 10/25/63 (144A) | 5,337,276 |
The accompanying notes are an integral part of these financial statements.
Pioneer Bond Fund | Annual Report | 6/30/21 27
Schedule of Investments | 6/30/21 (continued)
| Principal | |||
| Amount | |||
| USD ($) | Value | ||
| COLLATERALIZED MORTGAGE | |||
| OBLIGATIONS — (continued) | |||
| 1,950,000(c) | Bunker Hill Loan Depositary Trust, Series 2020-1, | ||
Class A2, 2.6%, 2/25/55 (144A) | $ 1,980,399 | ||
| 3,250,000(c) | Bunker Hill Loan Depositary Trust, Series 2020-1, | ||
Class A3, 3.253%, 2/25/55 (144A) | 3,326,817 | ||
| 2,651,019(c) | Cascade Funding Mortgage Trust, Series 2018-RM2, | ||
Class A, 4.0%, 10/25/68 (144A) | 2,761,883 | ||
| 3,325,841(c) | Cascade Funding Mortgage Trust, Series 2018-RM2, | ||
Class C, 4.0%, 10/25/68 (144A) | 3,400,400 | ||
| 3,800,000(c) | Cascade Funding Mortgage Trust, Series 2021-HB6, | ||
Class M3, 3.735%, 6/25/36 (144A) | 3,800,000 | ||
| 4,113,000 | Cascade MH Asset Trust, Series 2021-MH1, Class M1, | ||
2.992%, 2/25/46 (144A) | 4,232,051 | ||
| 2,076,000 | Cascade MH Asset Trust, Series 2021-MH1, Class M2, | ||
3.693%, 2/25/46 (144A) | 2,175,266 | ||
| 3,800,000(c) | CFMT LLC, Series 2021-HB5, Class M3, 2.91%, | ||
2/25/31 (144A) | 3,786,759 | ||
| 2,291,729(c) | Chase Mortgage Finance Corp., Series 2016-SH1, | ||
Class M3, 3.75%, 4/25/45 (144A) | 2,321,588 | ||
| 2,307,678(c) | Chase Mortgage Finance Corp., Series 2016-SH2, | ||
Class M4, 3.708%, 12/25/45 (144A) | 2,331,717 | ||
| 3,910,795(b) | Chase Mortgage Reference Notes, Series 2020-CL1, | ||
Class M1, 2.342% (1 Month USD LIBOR + | |||
225 bps), 10/25/57 (144A) | 3,996,587 | ||
| 1,954,383(c) | CIM Trust, Series 2019-J2, Class B4, 3.825%, | ||
10/25/49 (144A) | 1,958,730 | ||
| 7,514,000(c) | CIM Trust, Series 2019-R5, Class M3, 3.5%, | ||
9/25/59 (144A) | 7,908,185 | ||
| 5,170,000(c) | CIM Trust, Series 2020-R2, Class M3, 3.0%, | ||
10/25/59 (144A) | 5,236,330 | ||
| 5,936,281(c) | CIM Trust, Series 2021-J1, Class B1, 2.675%, | ||
3/25/51 (144A) | 5,983,415 | ||
| 2,484,000(c) | CIM Trust, Series 2021-J3, Class B2, 2.624%, | ||
6/25/51 (144A) | 2,390,621 | ||
| 7,131,000(c) | Citigroup Mortgage Loan Trust, Series 2018-RP3, | ||
Class M3, 3.25%, 3/25/61 (144A) | 7,331,144 | ||
| 3,311,000(c) | Citigroup Mortgage Loan Trust, Series 2021-INV1, | ||
Class B1W, 2.71%, 5/25/2051 (144A) | 3,341,587 | ||
| 2,400,000(d) | Colony American Finance, Ltd., Series 2016-2, Class D, | ||
5.028%, 11/15/48 (144A) | 2,447,852 | ||
| 6,216,723(b) | Connecticut Avenue Securities Trust, Series 2019-R01, | ||
Class 2M2, 2.542% (1 Month USD LIBOR + | |||
245 bps), 7/25/31 (144A) | 6,250,462 | ||
| 1,446,634(b) | Connecticut Avenue Securities Trust, Series 2019-R03, | ||
Class 1M2, 2.242% (1 Month USD LIBOR + | |||
215 bps), 9/25/31 (144A) | 1,456,941 | ||
| 4,348,338(b) | Connecticut Avenue Securities Trust, Series 2019-R06, | ||
Class 2M2, 2.192% (1 Month USD LIBOR + | |||
210 bps), 9/25/39 (144A) | 4,368,951 |
The accompanying notes are an integral part of these financial statements.
28 Pioneer Bond Fund | Annual Report | 6/30/21
| Principal | |||
| Amount | |||
| USD ($) | Value | ||
| COLLATERALIZED MORTGAGE | |||
| OBLIGATIONS — (continued) | |||
| 5,653,651(b) | Connecticut Avenue Securities Trust, Series 2019-R07, | ||
| Class 1M2, 2.192% (1 Month USD LIBOR + 210 bps), | |||
10/25/39 (144A) | $ 5,677,006 | ||
| 1,094,196(c) | CSMC Trust, Series 2013-IVR3, Class B4, 3.386%, | ||
5/25/43 (144A) | 1,096,705 | ||
| 2,490,163(c) | CSMC Trust, Series 2021-RPL2, Class M1, 2.75%, | ||
1/25/60 (144A) | 2,648,141 | ||
| 2,350,000(c) | CSMC Trust, Series 2021-RPL2, Class M2, 3.25%, | ||
1/25/60 (144A) | 2,528,845 | ||
| 1,450,000(c) | Deephaven Residential Mortgage Trust, Series 2020-2, | ||
Class M1, 4.112%, 5/25/65 (144A) | 1,501,150 | ||
| 1,882,384(b) | Eagle Re, Ltd., Series 2018-1, Class M1, 1.792% (1 Month | ||
USD LIBOR + 170 bps), 11/25/28 (144A) | 1,883,649 | ||
| 6,677,369(b) | Eagle Re, Ltd., Series 2019-1, Class M1B, 1.892% | ||
(1 Month USD LIBOR + 180 bps), 4/25/29 (144A) | 6,699,403 | ||
| 3,410,000(b) | Eagle Re, Ltd., Series 2020-2, Class M1C, 4.592% | ||
(1 Month USD LIBOR + 450 bps), 10/25/30 (144A) | 3,464,588 | ||
| 7,280,000(b) | Eagle Re, Ltd., Series 2020-2, Class M2, 5.692% (1 Month | ||
USD LIBOR + 560 bps), 10/25/30 (144A) | 7,459,994 | ||
| 794,553(b) | Fannie Mae Connecticut Avenue Securities, Series | ||
| 2018-C04, Class 2M2, 2.642% (1 Month USD LIBOR + | |||
255 bps), 12/25/30 | 808,727 | ||
| 294,386(c) | Fannie Mae Grantor Trust, Series 2004-T2, Class 2A, | ||
3.612%, 7/25/43 | 308,430 | ||
| 7,967,708(b)(e) | Federal Home Loan Mortgage Corp. REMICS, Series 4091, | ||
Class SH, 6.477% (1 Month USD LIBOR + | |||
655 bps), 8/15/42 | 1,666,080 | ||
| 111,029 | Federal National Mortgage Association REMICS, Series | ||
2009-36, Class HX, 4.5%, 6/25/29 | 116,860 | ||
| 445,376 | Federal National Mortgage Association REMICS, Series | ||
2013-128, Class DV, 3.0%, 6/25/23 | 448,799 | ||
| 2,312,730 | Finance of America Structured Securities Trust, Series | ||
2018-A, Class JR2, 1.646%, 12/26/68 (144A) | 2,496,995 | ||
| 10,981,329 | Finance of America Structured Securities Trust, Series | ||
2019-JR2, 0.0%, 6/25/69 (144A) | 11,895,168 | ||
| 11,484,187 | Finance of America Structured Securities Trust, Series | ||
2019-JR4, Class JR2, 2.0%, 11/25/69 (144A) | 12,045,087 | ||
| 7,041,890 | Finance of America Structured Securities Trust, Series | ||
2020-JR2, Class JR2, 0.0%, 5/25/50 (144A) | 7,460,380 | ||
| 4,987,659(c) | Flagstar Mortgage Trust, Series 2021-3INV, Class A16, | ||
2.5%, 6/25/51 (144A) | 5,051,540 | ||
| 6,613,433(c) | Flagstar Mortgage Trust, Series 2019-1INV, Class B4, | ||
4.577%, 10/25/49 (144A) | 6,898,369 | ||
| 8,578,773(c) | Flagstar Mortgage Trust, Series 2021-3INV, Class A2, | ||
2.5%, 6/25/51 (144A) | 8,747,672 | ||
| 212,080,000(c)(e) | Flagstar Mortgage Trust, Series 2021-4, Class AX1, | ||
0.222%, 6/1/51 (144A) | 1,988,250 | ||
The accompanying notes are an integral part of these financial statements.
Pioneer Bond Fund | Annual Report | 6/30/21 29
Schedule of Investments | 6/30/21 (continued)
| Principal | |||
| Amount | |||
| USD ($) | Value | ||
| COLLATERALIZED MORTGAGE | |||
| OBLIGATIONS — (continued) | |||
| 8,720,000(b) | Freddie Mac Stacr Remic Trust, Series 2020-DNA3, | ||
Class B1, 5.192% (1 Month USD LIBOR + 510 bps), | |||
6/25/50 (144A) | $ 9,129,709 | ||
| 8,960,000(b) | Freddie Mac Stacr Remic Trust, Series 2020-DNA4, | ||
Class B1, 6.092% (1 Month USD LIBOR + 600 bps), | |||
8/25/50 (144A) | 9,598,800 | ||
| 2,195,509(b) | Freddie Mac Stacr Remic Trust, Series 2020-DNA4, | ||
| Class M2, 3.842% (1 Month USD LIBOR + 375 bps), | |||
8/25/50 (144A) | 2,219,153 | ||
| 6,090,000(b) | Freddie Mac Stacr Remic Trust, Series 2020-DNA5, | ||
Class B1, 4.818% (SOFR30A + 480 bps), | |||
10/25/50 (144A) | 6,465,874 | ||
| 7,020,000(b) | Freddie Mac Stacr Remic Trust, Series 2020-DNA5, | ||
Class M2, 2.818% (SOFR30A + 280 bps), | |||
10/25/50 (144A) | 7,125,014 | ||
| 3,400,000(b) | Freddie Mac Stacr Remic Trust, Series 2020-DNA6, | ||
Class B2, 5.668% (SOFR30A + 565 bps), | |||
12/25/50 (144A) | 3,536,058 | ||
| 4,290,000(b) | Freddie Mac Stacr Remic Trust, Series 2020-HQA4, | ||
Class B1, 5.342% (1 Month USD LIBOR + 525 bps), | |||
9/25/50 (144A) | 4,528,912 | ||
| 5,300,000(b) | Freddie Mac Stacr Remic Trust, Series 2021-DNA1, | ||
Class B1, 2.668% (SOFR30A + 265 bps), | |||
1/25/51 (144A) | 5,250,671 | ||
| 9,820,000(b) | Freddie Mac Stacr Remic Trust, Series 2021-DNA1, | ||
Class B2, 4.768% (SOFR30A + 475 bps), | |||
1/25/51 (144A) | 10,067,304 | ||
| 4,860,000(b) | Freddie Mac Stacr Remic Trust, Series 2021-HQA1, | ||
Class B2, 5.018% (SOFR30A + 500 bps), | |||
8/25/33 (144A) | 4,908,630 | ||
| 9,880,000(b) | Freddie Mac Stacr Trust, Series 2018-HQA2, Class M2, | ||
2.392% (1 Month USD LIBOR + 230 bps), | |||
10/25/48 (144A) | 9,969,256 | ||
| 6,940,000(b) | Freddie Mac Stacr Trust, Series 2019-HRP1, Class M3, | ||
2.342% (1 Month USD LIBOR + 225 bps), | |||
2/25/49 (144A) | 6,928,475 | ||
| 950,000(b) | Freddie Mac STACR Trust, Series 2019-DNA4, Class B1, | ||
2.792% (1 Month USD LIBOR + 270 bps), | |||
10/25/49 (144A) | 952,867 | ||
| 11,465,925(b) | Freddie Mac Structured Agency Credit Risk Debt Notes, | ||
| Series 2017-DNA2, Class M2, 3.542% (1 Month USD | |||
LIBOR + 345 bps), 10/25/29 | 11,978,682 | ||
| 5,000,000(b) | Freddie Mac Structured Agency Credit Risk Debt Notes, | ||
Series 2020-HQA5, Class B2, 7.418% (SOFR30A + | |||
740 bps), 11/25/50 (144A) | 5,839,955 | ||
| 3,900,907(c) | FWD Securitization Trust, Series 2019-INV1, Class A1, | ||
2.81%, 6/25/49 (144A) | 3,988,110 |
The accompanying notes are an integral part of these financial statements.
30 Pioneer Bond Fund | Annual Report | 6/30/21
| Principal | |||
| Amount | |||
| USD ($) | Value | ||
| COLLATERALIZED MORTGAGE | |||
| OBLIGATIONS — (continued) | |||
| 2,150,000(c) | FWD Securitization Trust, Series 2019-INV1, Class M1, | ||
3.48%, 6/25/49 (144A) | $ 2,187,112 | ||
| 1,800,000(c) | FWD Securitization Trust, Series 2020-INV1, Class M1, | ||
2.85%, 1/25/50 (144A) | 1,816,269 | ||
| 447,436 | Government National Mortgage Association, Series | ||
2005-61, Class UZ, 5.25%, 8/16/35 | 462,573 | ||
| 162,487 | Government National Mortgage Association, Series | ||
2012-130, Class PA, 3.0%, 4/20/41 | 165,665 | ||
| 486,006 | Government National Mortgage Association, Series | ||
2013-169, Class TE, 3.25%, 4/16/27 | 515,969 | ||
| 25,307,529(e) | Government National Mortgage Association, Series | ||
2019-159, Class CI, 3.5%, 12/20/49 | 3,343,084 | ||
| 22,450,715(b)(e) | Government National Mortgage Association, Series | ||
2020-9, Class SA, 3.257% (1 Month USD LIBOR + | |||
335 bps), 1/20/50 | 1,767,953 | ||
| 447,067(c) | GS Mortgage-Backed Securities Trust, Series 2020-NQM1, | ||
Class A3, 2.352%, 9/27/60 (144A) | 453,374 | ||
| 3,183,819(c) | GS Mortgage-Backed Securities Trust, Series 2020-PJ1, | ||
Class B1, 3.696%, 5/25/50 (144A) | 3,307,717 | ||
| 4,425,908(c) | GS Mortgage-Backed Securities Trust, Series 2021-PJ1, | ||
Class A4, 2.5%, 6/25/51 (144A) | 4,471,663 | ||
| 5,299,098(c) | GS Mortgage-Backed Securities Trust, Series 2021-PJ2, | ||
Class A4, 2.5%, 7/25/51 (144A) | 5,350,436 | ||
| 16,812,356(c) | GS Mortgage-Backed Securities Trust, Series 2021-PJ4, | ||
Class A4, 2.5%, 9/25/51 (144A) | 16,943,711 | ||
| 6,548,000(c) | GS Mortgage-Backed Securities Trust, Series 2021-RPL1, | ||
Class M1, 2.25%, 12/25/60 (144A) | 6,429,628 | ||
| 750,000(b) | Home Partners of America Trust, Series 2017-1, Class B, | ||
1.432% (1 Month USD LIBOR + 135 bps), 7/17/34 (144A) | 750,765 | ||
| 671,773(b) | Home Re, Ltd., Series 2018-1, Class M1, 1.692% (1 Month | ||
USD LIBOR + 160 bps), 10/25/28 (144A) | 672,003 | ||
| 1,942,129(b) | Home Re, Ltd., Series 2019-1, Class M1, 1.742% (1 Month | ||
USD LIBOR + 165 bps), 5/25/29 (144A) | 1,943,478 | ||
| 4,640,000(b) | Home Re, Ltd., Series 2020-1, Class M1C, 4.242% (1 Month | ||
USD LIBOR + 415 bps), 10/25/30 (144A) | 4,709,597 | ||
| 4,580,000(b) | Home Re, Ltd., Series 2020-1, Class M2, 5.342% (1 Month | ||
USD LIBOR + 525 bps), 10/25/30 (144A) | 4,685,622 | ||
| 4,350,000(c) | Homeward Opportunities Fund I Trust, Series 2020-2, | ||
Class A3, 3.196%, 5/25/65 (144A) | 4,484,927 | ||
| 2,380,000(c) | Homeward Opportunities Fund I Trust, Series 2020-2, | ||
Class M1, 3.897%, 5/25/65 (144A) | 2,479,585 | ||
| 78,555,000(c)(e) | Hundred Acre Wood Trust, Series 2021-INV1, Class AX1, | ||
0.24%, 7/25/51 (144A) | 824,710 | ||
| 15,150,000 | IMS Ecuadorian Mortgage Trust, Series 2021-1, Class GA, | ||
3.4%, 8/18/43 (144A) | 15,737,062 | ||
| 14,468,523(c) | JP Morgan Mortgage Trust, Series 2020-LTV1, Class B1A, | ||
3.377%, 6/25/50 (144A) | 15,103,585 |
The accompanying notes are an integral part of these financial statements.
Pioneer Bond Fund | Annual Report | 6/30/21 31
Schedule of Investments | 6/30/21 (continued)
| Principal | |||
| Amount | |||
| USD ($) | Value | ||
| COLLATERALIZED MORTGAGE | |||
| OBLIGATIONS — (continued) | |||
| 17,433,497(c) | JP Morgan Mortgage Trust, Series 2020-LTV1, Class B2A, | ||
3.627%, 6/25/50 (144A) | $ 18,325,769 | ||
| 16,455,285(c) | JP Morgan Mortgage Trust, Series 2021-3, Class A3, 2.5%, | ||
7/1/51 (144A) | 16,748,814 | ||
| 15,227,204(c) | JP Morgan Mortgage Trust, Series 2021-4, Class A3, 2.5%, | ||
8/25/51 (144A) | 15,498,827 | ||
| 7,064,408(c) | JP Morgan Mortgage Trust, Series 2021-6, Class A15, | ||
2.5%, 10/25/51 (144A) | 7,165,980 | ||
| 16,066,622(c) | JP Morgan Mortgage Trust, Series 2021-6, Class A3, 2.5%, | ||
10/25/51 (144A) | 16,353,219 | ||
| 7,770,967(c) | JP Morgan Mortgage Trust, Series 2021-6, Class B1, | ||
2.861%, 10/25/51 (144A) | 7,897,068 | ||
| 15,683,687(c) | JP Morgan Mortgage Trust, Series 2021-7, Class A3, 2.5%, | ||
11/25/51 (144A) | 15,963,452 | ||
| 9,957,896(c) | JP Morgan Mortgage Trust, Series 2021-7, Class A15, | ||
2.5%, 11/25/51 (144A) | 10,041,921 | ||
| 7,535,885(c) | JP Morgan Mortgage Trust, Series 2021-7, Class B1, | ||
2.82%, 11/25/51 (144A) | 7,694,949 | ||
| 6,288,222(c) | JP Morgan Mortgage Trust, Series 2021-7, Class B2, | ||
2.82%, 11/25/51 (144A) | 6,346,926 | ||
| 15,700,000(c) | JP Morgan Mortgage Trust, Series 2021-8, Class A3, 2.5%, | ||
12/25/51 (144A) | 15,945,312 | ||
| 10,000,000(c) | JP Morgan Mortgage Trust, Series 2021-8, Class A15, | ||
2.5%, 12/25/51 (144A) | 10,087,500 | ||
| 127,500,000(c)(e) | JP Morgan Mortgage Trust, Series 2021-8, Class AX1, | ||
0.144%, 12/25/51 (144A) | 752,046 | ||
| 10,261,000(c) | JP Morgan Mortgage Trust, Series 2021-8, Class B2, | ||
2.869%, 12/25/51 (144A) | 10,432,552 | ||
| 9,442,417(c) | JP Mortgage Trust, Series 2021-INV1, Class A5A, 2.5%, | ||
10/25/51 (144A) | 9,560,447 | ||
| 6,825,900(c) | JP Mortgage Trust, Series 2021-INV1, Class B1, 3.036%, | ||
10/25/51 (144A) | 7,070,834 | ||
| 3,766,771(c) | JP Mortgage Trust, Series 2021-INV1, Class B2, 3.036%, | ||
10/25/51 (144A) | 3,856,304 | ||
| 7,231,382(b) | JPMorgan Chase Bank NA, Series 2021-CL1, Class M2, | ||
1.568% (SOFR30A + 155 bps), 3/25/51 (144A) | 7,238,846 | ||
| 1,473,826 | La Hipotecaria El Salvadorian Mortgage Trust, Series | ||
2016-1A, Class A, 3.358%, 1/15/46 (144A) | 1,590,811 | ||
| 580,963(b) | La Hipotecaria Panamanian Mortgage Trust, Series | ||
2010-1GA, Class A, 2.75% (Panamanian Mortgage | |||
Reference Rate + -300 bps), 9/8/39 (144A) | 600,933 | ||
| 2,197,432(b) | La Hipotecaria Panamanian Mortgage Trust, Series | ||
| 2014-1A, Class A1, 3.508% (Panamanian Mortgage | |||
Reference Rate + -224 bps), 11/24/42 (144A) | 2,326,531 | ||
| 7,328,889(b) | LSTAR Securities Investment, Ltd., Series 2019-3, | ||
Class A1, 2.592% (1 Month USD LIBOR + | |||
250 bps), 4/1/24 (144A) | 7,292,299 |
The accompanying notes are an integral part of these financial statements.
32 Pioneer Bond Fund | Annual Report | 6/30/21
| Principal | |||
| Amount | |||
| USD ($) | Value | ||
| COLLATERALIZED MORTGAGE | |||
| OBLIGATIONS — (continued) | |||
| 7,138,000(c) | MFA Trust, Series 2021-RPL1, Class M1, 2.423%, | ||
7/25/60 (144A) | $ 7,165,832 | ||
| 385,185(c) | MFA Trust, Series 2020-NQM1, Class A3, 2.3%, | ||
8/25/49 (144A) | 390,646 | ||
| 9,550,000(c) | MFA Trust, Series 2021-RPL1, Class A2, 2.072%, | ||
7/25/60 (144A) | 9,545,254 | ||
| 7,800,000(c) | Mill City Mortgage Loan Trust, Series 2019-GS1, | ||
Class M3, 3.25%, 7/25/59 (144A) | 8,076,260 | ||
| 8,060,674(c) | Morgan Stanley Residential Mortgage Loan Trust, Series | ||
2020-1, Class B1, 3.06%, 12/25/50 (144A) | 8,354,846 | ||
| 8,746,000(c) | Morgan Stanley Residential Mortgage Loan Trust 2014-1, | ||
Series 2021-3, Class A9, 2.5%, 6/25/51 (144A) | 8,811,595 | ||
| 5,889,537(c) | New Residential Mortgage Loan Trust, Series 2019-NQM4, | ||
Class A1, 2.492%, 9/25/59 (144A) | 5,947,493 | ||
| 10,950,000(c) | New Residential Mortgage Loan Trust, Series 2019-RPL2, | ||
Class M2, 3.75%, 2/25/59 (144A) | 11,812,595 | ||
| 25,700,000(c) | New Residential Mortgage Loan Trust, Series 2020-RPL1, | ||
Class B1, 3.898%, 11/25/59 (144A) | 26,296,769 | ||
| 8,500,000(c) | New Residential Mortgage Loan Trust, Series 2020-RPL1, | ||
Class M2, 3.5%, 11/25/59 (144A) | 9,026,710 | ||
| 2,457,000(b) | Oaktown Re II, Ltd., Series 2018-1A, Class M2, 2.942% | ||
(1 Month USD LIBOR + 285 bps), 7/25/28 (144A) | 2,484,714 | ||
| 4,330,000(b) | Oaktown Re V, Ltd., Series 2020-2A, Class M1B, 3.692% | ||
(1 Month USD LIBOR + 360 bps), 10/25/30 (144A) | 4,405,778 | ||
| 3,550,000(b) | Oaktown Re V, Ltd., Series 2020-2A, Class M2, 5.342% | ||
(1 Month USD LIBOR + 525 bps), 10/25/30 (144A) | 3,740,118 | ||
| 248,357(c) | OBX Trust, Series 2018-EXP1, Class 1A6, 4.5%, | ||
4/25/48 (144A) | 249,026 | ||
| 10,887,912(c) | OBX Trust, Series 2021-J1, Class A19, 2.5%, | ||
5/25/51 (144A) | 10,963,452 | ||
| 5,561,938(c) | Oceanview Mortgage Trust, Series 2021-1, Class B1, | ||
2.738%, 5/25/51 (144A) | 5,623,872 | ||
| 4,853,000 | Oceanview Mortgage Trust, Series 2021-1, Class B1, | ||
3.247%, 6/25/51 (144A) | 5,109,055 | ||
| 8,898,000 | Oceanview Mortgage Trust, Series 2021-1, Class B2, | ||
3.247%, 6/25/51 (144A) | 9,246,851 | ||
| 7,563,570(c) | PRMI Securitization Trust, Series 2021-1, Class B1, | ||
2.482%, 4/25/51 (144A) | 7,467,721 | ||
| 3,099,122(c) | PRMI Securitization Trust, Series 2021-1, Class B2, | ||
2.482%, 4/25/51 (144A) | 3,001,838 | ||
| 4,311,521(c) | Provident Funding Mortgage Trust, Series 2020-1, | ||
Class B1, 3.287%, 2/25/50 (144A) | 4,462,661 | ||
| 5,538,952(c) | Provident Funding Mortgage Trust, Series 2021-1, | ||
Class A5, 2.5%, 4/25/51 (144A) | 5,627,232 | ||
| 3,568,023(c) | Provident Funding Mortgage Trust, Series 2021-1, | ||
Class B1, 2.389%, 4/25/51 (144A) | 3,510,484 | ||
| 15,000,000(c) | Provident Funding Mortgage Trust, Series 2021-2, | ||
Class A9, 2.25%, 4/25/51 (144A) | 14,924,614 |
The accompanying notes are an integral part of these financial statements.
Pioneer Bond Fund | Annual Report | 6/30/21 33
Schedule of Investments | 6/30/21 (continued)
| Principal | |||
| Amount | |||
| USD ($) | Value | ||
| COLLATERALIZED MORTGAGE | |||
| OBLIGATIONS — (continued) | |||
| 3,929,000(c) | Provident Funding Mortgage Trust, Series 2021-2, | ||
Class B1, 2.36%, 4/25/51 (144A) | $ 3,832,690 | ||
| 213,139(b) | Radnor Re, Ltd., Series 2018-1, Class M1, 1.492% | ||
(1 Month USD LIBOR + 140 bps), 3/25/28 (144A) | 213,185 | ||
| 7,125,977(b) | Radnor Re, Ltd., Series 2019-1, Class M1B, 2.042% | ||
(1 Month USD LIBOR + 195 bps), 2/25/29 (144A) | 7,145,192 | ||
| 3,437,000(b) | Radnor Re, Ltd., Series 2019-1, Class M2, 3.292% | ||
(1 Month USD LIBOR + 320 bps), 2/25/29 (144A) | 3,485,914 | ||
| 12,000,000(b) | Radnor Re, Ltd., Series 2020-1, Class M1C, 1.842% | ||
(1 Month USD LIBOR + 175 bps), 1/25/30 (144A) | 11,730,520 | ||
| 2,574 | RALI Trust, Series 2003-QS14, Class A1, 5.0%, 7/25/18 | 2,316 | |
| 6,110,000(c) | RCKT Mortgage Trust, Series 2021-2, Class B1A, 2.567%, | ||
6/25/51 (144A) | 6,093,271 | ||
| 5,373,685(c) | RCKT Mortgage Trust, Series 2021-1, Class B2A, 2.728%, | ||
3/25/51 (144A) | 5,416,544 | ||
| 4,350,000(c) | RCKT Mortgage Trust, Series 2021-2, Class B2A, 2.567%, | ||
6/25/51 (144A) | 4,272,318 | ||
| 1,250,000(c) | RMF Buyout Issuance Trust, Series 2020-1, Class M3, | ||
2.964%, 2/25/30 (144A) | 1,244,921 | ||
| 1,590,000(c) | RMF Buyout Issuance Trust, Series 2020-1, Class M4, | ||
4.191%, 2/25/30 (144A) | 1,532,037 | ||
| 4,860,357(c) | RMF Proprietary Issuance Trust, Series 2019-1, Class A, | ||
2.75%, 10/25/63 (144A) | 4,843,825 | ||
| 19,499,997(c) | Saluda Grade Alternative Mortgage Trust, Series | ||
2021-FIG2, Class A2, 3.5%, 10/25/51 (144A) | 19,506,091 | ||
| 1,013,141(c) | Sequoia Mortgage Trust, Series 2012-6, Class B3, | ||
3.719%, 12/25/42 | 1,023,410 | ||
| 915,241(c) | Sequoia Mortgage Trust, Series 2018-CH3, Class A1, 4.5%, | ||
8/25/48 (144A) | 937,132 | ||
| 4,254,148(c) | Sequoia Mortgage Trust, Series 2021-2, Class B1, 2.557%, | ||
4/25/51 (144A) | 4,290,364 | ||
| 2,725,937(c) | Sequoia Mortgage Trust, Series 2021-3, Class B2, 2.664%, | ||
5/25/51 (144A) | 2,668,914 | ||
| 1,670,418(c) | Sequoia Mortgage Trust, Series 2021-4, Class A1, 2.5%, | ||
6/25/51 (144A) | 1,693,909 | ||
| 2,976,922(c) | Sequoia Mortgage Trust, Series 2021-1, Class B2, 2.674%, | ||
3/25/51 (144A) | 2,983,812 | ||
| 3,636,899(c) | Sequoia Mortgage Trust, Series 2021-2, Class B2, 2.557%, | ||
4/25/51 (144A) | 3,613,698 | ||
| 1,732,472(c) | Sequoia Mortgage Trust, Series 2021-2, Class B3, 2.557%, | ||
4/25/51 (144A) | 1,696,112 | ||
| 11,220,000(b) | STACR Trust, Series 2018-HRP2, Class B1, 4.292% | ||
(1 Month USD LIBOR + 420 bps), 2/25/47 (144A) | 11,846,720 | ||
| 3,135,000(b) | STACR Trust, Series 2018-HRP2, Class M3, 2.492% | ||
(1 Month USD LIBOR + 240 bps), 2/25/47 (144A) | 3,192,834 | ||
| 1,250,000(c) | Towd Point Mortgage Trust, Series 2019-4, Class M1, | ||
3.5%, 10/25/59 (144A) | 1,328,721 |
The accompanying notes are an integral part of these financial statements.
34 Pioneer Bond Fund | Annual Report | 6/30/21
| Principal | |||
| Amount | |||
| USD ($) | Value | ||
| COLLATERALIZED MORTGAGE | |||
| OBLIGATIONS — (continued) | |||
| 12,743,999(c) | Towd Point Mortgage Trust, Series 2021-R1, Class A1, | ||
| 2.918%, 11/30/60 (144A) | $ 13,004,894 | ||
| 4,390,000(b) | Triangle Re, Ltd., Series 2020-1, Class M1C, 4.592% | ||
| (1 Month USD LIBOR + 450 bps), 10/25/30 (144A) | 4,477,801 | ||
| 3,080,000(b) | Triangle Re, Ltd., Series 2020-1, Class M2, 5.692% | ||
| (1 Month USD LIBOR + 560 bps), 10/25/30 (144A) | 3,118,502 | ||
| 14,070,000(b) | Triangle Re, Ltd., Series 2021-1, Class M1C, 3.492% | ||
| (1 Month USD LIBOR + 340 bps), 8/25/33 (144A) | 14,104,844 | ||
| 15,000,000(c) | UWM Mortgage Trust, Series 2021-1, Class A3, 2.5%, | ||
| 6/25/51 (144A) | 15,239,070 | ||
| 39,502 | Vendee Mortgage Trust, Series 2008-1, Class GD, | ||
| 5.25%, 1/15/32 | 40,081 | ||
| 970,000(c) | Verus Securitization Trust, Series 2020-INV1, Class M1, | ||
| 5.5%, 3/25/60 (144A) | 1,031,019 | ||
| 10,543,088(c) | Visio Trust, Series 2019-2, Class A1, 2.722%, | ||
| 11/25/54 (144A) | 10,823,357 | ||
| 20,260,000(c) | Vista Point Securitization Trust, Series 2020-1, | ||
Class A3, 3.201%, 3/25/65 (144A) | 20,806,738 | ||
| TOTAL COLLATERALIZED MORTGAGE OBLIGATIONS | |||
(Cost $994,042,317) | $ 1,003,693,330 | ||
| COMMERCIAL MORTGAGE-BACKED SECURITIES — | |||
| 6.3% of Net Assets | |||
| 11,600,000(b) | Austin Fairmont Hotel Trust, Series 2019-FAIR, Class A, | ||
| 1.123% (1 Month USD LIBOR + 105 bps), 9/15/32 (144A) | $ 11,607,263 | ||
| 7,460,000 | BANK, Series 2017-BNK5, Class AS, 3.624%, 6/15/60 | 8,164,747 | |
| 10,350,000 | BANK, Series 2017-BNK7, Class AS, 3.748%, 9/15/60 | 11,423,097 | |
| 3,112,716(d)(e) | Bayview Commercial Asset Trust, Series 2007-2A, | ||
| Class IO, 0.0%, 7/25/37 (144A) | — | ||
| 6,200,000(b) | Beast Mortgage Trust, Series 2021-1818, Class A, 1.3% | ||
| (1 Month USD LIBOR + 105 bps), 3/15/36 (144A) | 6,213,565 | ||
| 2,950,000(c) | Benchmark Mortgage Trust, Series 2020-B20, Class C, | ||
| 3.386%, 10/15/53 | 3,085,461 | ||
| 4,200,000 | Benchmark Mortgage Trust, Series 2018-B5, Class A3, | ||
| 3.944%, 7/15/51 | 4,785,317 | ||
| 8,000,000 | Benchmark Mortgage Trust, Series 2018-B8, Class A4, | ||
| 3.963%, 1/15/52 | 9,006,346 | ||
| 1,500,000 | Benchmark Mortgage Trust, Series 2020-B21, Class AS, | ||
| 2.254%, 12/17/53 | 1,506,813 | ||
| 2,850,000(c) | Benchmark Mortgage Trust, Series 2020-IG3, Class B, | ||
| 3.388%, 9/15/48 (144A) | 3,005,764 | ||
| 3,300,000 | Benchmark Mortgage Trust, Series 2021-B27, Class A5, | ||
| 2.39%, 7/15/54 | 3,399,385 | ||
| 4,700,000(b) | BTH-13 Mortgage Backed Securities Trust, Series 2018-13, | ||
| Class A, 2.59% (1 Month USD LIBOR + | |||
| 250 bps), 8/18/21 (144A) | 4,695,897 |
The accompanying notes are an integral part of these financial statements. |
Pioneer Bond Fund | Annual Report | 6/30/21 35
Schedule of Investments | 6/30/21 (continued)
| Principal | |||
| Amount | |||
| USD ($) | Value | ||
| COMMERCIAL MORTGAGE-BACKED | |||
| SECURITIES — (continued) | |||
| 6,599,321(b) | BX Commercial Mortgage Trust, Series 2020-BXLP, | ||
Class D, 1.323% (1 Month USD LIBOR + 125 bps), | |||
12/15/36 (144A) | $ 6,599,319 | ||
| 3,200,000(c) | BX Commercial Mortgage Trust, Series 2020-VIV3, | ||
Class B, 3.662%, 3/9/44 (144A) | 3,478,472 | ||
| 18,960,000 | BX Trust, Series 2019-OC11, Class A, 3.202%, | ||
12/9/41 (144A) | 20,445,063 | ||
| 4,346,000 | Cantor Commercial Real Estate Lending, Series 2019-CF1, | ||
Class D, 3.0%, 5/15/52 (144A) | 4,102,361 | ||
| 4,000,000 | CFCRE Commercial Mortgage Trust, Series 2016-C3, | ||
Class A2, 3.597%, 1/10/48 | 4,356,019 | ||
| 4,194,385(b) | CHC Commercial Mortgage Trust, Series 2019-CHC, | ||
Class D, 2.123% (1 Month USD LIBOR + 205 bps), | |||
6/15/34 (144A) | 4,104,849 | ||
| 3,400,000(c) | Citigroup Commercial Mortgage Trust, Series 2014-GC19, | ||
Class B, 4.805%, 3/10/47 | 3,681,300 | ||
| 6,000,000(c) | Citigroup Commercial Mortgage Trust, Series 2014-GC25, | ||
Class B, 4.345%, 10/10/47 | 6,476,901 | ||
| 6,052,000(c) | Citigroup Commercial Mortgage Trust, Series 2015-GC33, | ||
Class B, 4.726%, 9/10/58 | 6,654,073 | ||
| 4,621,000 | Citigroup Commercial Mortgage Trust, Series 2016-P5, | ||
Class D, 3.0%, 10/10/49 (144A) | 3,754,897 | ||
| 4,000,000 | Citigroup Commercial Mortgage Trust, Series 2017-C4, | ||
Class A4, 3.471%, 10/12/50 | 4,401,858 | ||
| 3,000,000(c) | Citigroup Commercial Mortgage Trust, Series 2018-B2, | ||
Class AS, 4.179%, 3/10/51 | 3,345,268 | ||
| 7,700,000 | Citigroup Commercial Mortgage Trust, Series 2019-SMRT, | ||
Class A, 4.149%, 1/10/36 (144A) | 8,269,022 | ||
| 3,931,962(b) | Cold Storage Trust, Series 2020-ICE5, Class D, 2.173% | ||
(1 Month USD LIBOR + 210 bps), 11/15/37 (144A) | 3,946,752 | ||
| 2,933,640 | COMM Mortgage Trust, Series 2012-CR3, Class A3, | ||
2.822%, 10/15/45 | 2,981,182 | ||
| 6,301,980 | COMM Mortgage Trust, Series 2014-UBS3, Class A3, | ||
3.546%, 6/10/47 | 6,690,853 | ||
| 4,100,000 | COMM Mortgage Trust, Series 2014-UBS4, Class A4, | ||
3.42%, 8/10/47 | 4,318,357 | ||
| 6,280,114 | COMM Mortgage Trust, Series 2015-CR26, Class A3, | ||
3.359%, 10/10/48 | 6,722,469 | ||
| 4,500,000(c) | COMM Mortgage Trust, Series 2015-DC1, Class B, | ||
4.035%, 2/10/48 | 4,819,791 | ||
| 1,500,000(c) | COMM Mortgage Trust, Series 2018-COR3, Class B, | ||
4.665%, 5/10/51 | 1,691,759 | ||
| 8,375,000(b) | Credit Suisse Mortgage Capital Certificates, Series | ||
| 2019-ICE4, Class E, 2.223% (1 Month USD LIBOR + | |||
215 bps), 5/15/36 (144A) | 8,390,769 | ||
| 2,000,000(c) | CSAIL Commercial Mortgage Trust, Series 2016-C6, | ||
Class D, 5.1%, 1/15/49 (144A) | 1,778,369 | ||
The accompanying notes are an integral part of these financial statements.
36 Pioneer Bond Fund | Annual Report | 6/30/21
| Principal | |||
| Amount | |||
| USD ($) | Value | ||
| COMMERCIAL MORTGAGE-BACKED | |||
| SECURITIES — (continued) | |||
| 1,255,800(b) | Freddie Mac Multifamily Structured Credit Risk, Series | ||
2021-MN1, Class M1, 2.018% (SOFR30A + | |||
200 bps), 1/25/51 (144A) | $ 1,264,679 | ||
| 902,511(b) | FREMF Mortgage Trust, Series 2014-KF05, Class B, 4.086% | ||
(1 Month USD LIBOR + 400 bps), 9/25/22 (144A) | 904,679 | ||
| 2,623,000(c) | FREMF Mortgage Trust, Series 2017-K66, Class B, 4.173%, | ||
7/25/27 (144A) | 2,922,279 | ||
| 2,500,000(c) | FREMF Mortgage Trust, Series 2017-KW03, Class B, | ||
4.199%, 7/25/27 (144A) | 2,656,908 | ||
| 5,000,000(c) | FREMF Mortgage Trust, Series 2019-K88, Class C, 4.526%, | ||
2/25/52 (144A) | 5,539,304 | ||
| 4,421,147(b) | FREMF Mortgage Trust, Series 2019-KF64, Class B, 2.386% | ||
(1 Month USD LIBOR + 230 bps), 6/25/26 (144A) | 4,441,949 | ||
| 4,148,048(c) | FREMF Mortgage Trust, Series 2019-KJ24, Class B, 7.6%, | ||
10/25/27 (144A) | 3,588,752 | ||
| 5,000,000(b) | FREMF Mortgage Trust, Series 2019-KS12, Class C, | ||
6.986% (1 Month USD LIBOR + 690 bps), 8/25/29 | 4,068,160 | ||
| 9,000,000(f) | FREMF Mortgage Trust, Series 2021-KG05, Class C, 0.0%, | ||
1/25/31 (144A) | 4,280,239 | ||
| 110,999,571(e) | FREMF Mortgage Trust, Series 2021-KG05, Class X2A, | ||
0.1%, 1/25/31 (144A) | 835,982 | ||
| 9,000,000(e) | FREMF Mortgage Trust, Series 2021-KG05, Class X2B, | ||
0.1%, 1/25/31 (144A) | 64,000 | ||
| 5,171,933(c) | FRESB Mortgage Trust, Series 2018-SB52, Class A7F, | ||
3.39%, 6/25/25 | 5,465,294 | ||
| 20,839,615(c)(e) | Government National Mortgage Association, Series | ||
2017-21, Class IO, 0.702%, 10/16/58 | 1,071,677 | ||
| 6,500,000 | GS Mortgage Securities Trust, Series 2015-GC28, | ||
Class A5, 3.396%, 2/10/48 | 7,002,258 | ||
| 8,951,000 | ILPT Trust, Series 2019-SURF, Class A, 4.145%, | ||
2/11/41 (144A) | 10,267,379 | ||
| 4,597,183 | JP Morgan Chase Commercial Mortgage Securities Trust, | ||
Series 2016-JP2, Class A4, 2.822%, 8/15/49 | 4,869,984 | ||
| 5,925,000(c) | JP Morgan Chase Commercial Mortgage Securities Trust, | ||
Series 2018-BCON, Class C, 3.881%, 1/5/31 (144A) | 6,044,854 | ||
| 6,700,000 | JP Morgan Chase Commercial Mortgage Securities Trust, | ||
Series 2018-WPT, Class AFX, 4.248%, 7/5/33 (144A) | 7,058,140 | ||
| 3,450,000(c) | JPMDB Commercial Mortgage Securities Trust, Series | ||
2016-C2, Class B, 3.99%, 6/15/49 | 3,593,439 | ||
| 6,650,000 | JPMDB Commercial Mortgage Securities Trust, Series | ||
2016-C4, Class A3, 3.141%, 12/15/49 | 7,203,646 | ||
| 2,000,000(c) | JPMDB Commercial Mortgage Securities Trust, Series | ||
2016-C4, Class D, 3.2%, 12/15/49 (144A) | 1,786,924 | ||
| 7,640,000 | JPMDB Commercial Mortgage Securities Trust, Series | ||
2018-C8, Class A4, 4.211%, 6/15/51 | 8,771,748 | ||
| 45,714,000(c)(e) | JPMDB Commercial Mortgage Securities Trust, Series | ||
2018-C8, Class XB, 0.192%, 6/15/51 | 424,249 |
The accompanying notes are an integral part of these financial statements.
Pioneer Bond Fund | Annual Report | 6/30/21 37
Schedule of Investments | 6/30/21 (continued)
| Principal | |||
| Amount | |||
| USD ($) | Value | ||
| COMMERCIAL MORTGAGE-BACKED | |||
| SECURITIES — (continued) | |||
| 7,150,000 | Key Commercial Mortgage Securities Trust, Series | ||
| 2019-S2, Class A3, 3.469%, 6/15/52 (144A) | $ 7,565,288 | ||
| 2,863,500(c) | Morgan Stanley Bank of America Merrill Lynch Trust, | ||
| Series 2015-C21, Class C, 4.279%, 3/15/48 | 2,849,072 | ||
| 6,900,000(c) | Morgan Stanley Capital I Trust, Series 2018-MP, Class A, | ||
| 4.419%, 7/11/40 (144A) | 7,800,645 | ||
| 3,502,182(b) | Multifamily Connecticut Avenue Securities Trust, Series | ||
| 2019-01, Class M7, 1.792% (1 Month USD LIBOR + | |||
| 170 bps), 10/15/49 (144A) | 3,499,461 | ||
| 3,780,000 | Palisades Center Trust, Series 2016-PLSD, Class A, | ||
| 2.713%, 4/13/33 (144A) | 3,525,999 | ||
| 594,982 | ReadyCap Commercial Mortgage Trust, Series 2019-6, | ||
| Class A, 2.833%, 10/25/52 (144A) | 605,196 | ||
| 17,700,000 | SLG Office Trust, Series 2021-OVA, Class E, 2.851%, | ||
| 7/15/41 (144A) | 17,345,696 | ||
| 1,774,000(c) | UBS Commercial Mortgage Trust, Series 2018-C9, Class C, | ||
| 5.045%, 3/15/51 | 1,970,507 | ||
| 3,810,000 | Wells Fargo Commercial Mortgage Trust, Series | ||
| 2015-NXS3, Class A4, 3.617%, 9/15/57 | 4,171,311 | ||
| 7,800,955 | Wells Fargo Commercial Mortgage Trust, Series | ||
| 2016-C32, Class A3, 3.294%, 1/15/59 | 8,382,697 | ||
| 10,000,000 | Wells Fargo Commercial Mortgage Trust, Series | ||
| 2016-LC24, Class A3, 2.684%, 10/15/49 | 10,517,425 | ||
| 10,050,000(c) | Wells Fargo Commercial Mortgage Trust, Series | ||
| 2018-C43, Class A4, 4.012%, 3/15/51 | 11,419,765 | ||
| 3,045,000 | Wells Fargo Commercial Mortgage Trust, Series | ||
| 2019-C51, Class A4, 3.311%, 6/15/52 | 3,347,644 | ||
| 1,750,000(c) | WFRBS Commercial Mortgage Trust, Series 2014-C25, | ||
Class D, 3.803%, 11/15/47 (144A) | 1,607,473 | ||
| TOTAL COMMERCIAL MORTGAGE-BACKED SECURITIES | |||
(Cost $356,968,837) | $ 366,638,060 | ||
| CORPORATE BONDS — 28.9% of Net Assets | |||
| Advertising — 0.3% | |||
| 12,966,000 | Interpublic Group of Cos., Inc., 4.75%, 3/30/30 | $ 15,321,691 | |
| Total Advertising | $ 15,321,691 | ||
| Aerospace & Defense — 1.1% | |||
| 21,700,000 | Boeing Co., 3.75%, 2/1/50 | $ 22,380,898 | |
| 14,425,000 | Boeing Co., 3.9%, 5/1/49 | 15,201,521 | |
| 7,910,000 | Raytheon Technologies Corp., 4.125%, 11/16/28 | 9,108,629 | |
| 19,575,000 | Teledyne Technologies, Inc., 2.25%, 4/1/28 | 19,948,099 | |
| Total Aerospace & Defense | $ 66,639,147 | ||
The accompanying notes are an integral part of these financial statements.
38 Pioneer Bond Fund | Annual Report | 6/30/21
| Principal | |||
| Amount | |||
| USD ($) | Value | ||
| Airlines — 0.9% | |||
| 6,035,112 | Air Canada 2017-1 Class AA Pass Through Trust, 3.3%, | ||
1/15/30 (144A) | $ 6,110,370 | ||
| 12,006,230 | Alaska Airlines Pass Through Trust, Series 2020-1 | ||
Class A, 4.8%, 8/15/27 (144A) | 13,289,803 | ||
| 1,685,000 | American Airlines, Inc./AAdvantage Loyalty IP, Ltd., 5.5%, | ||
4/20/26 (144A) | 1,783,994 | ||
| 1,410,000 | American Airlines, Inc./AAdvantage Loyalty IP, Ltd., 5.75%, | ||
4/20/29 (144A) | 1,522,222 | ||
| 5,683,778 | British Airways 2019-1 Class A Pass Through Trust, | ||
3.35%, 6/15/29 (144A) | 5,692,212 | ||
| 4,811,060 | British Airways 2019-1 Class AA Pass Through Trust, | ||
3.3%, 12/15/32 (144A) | 4,897,968 | ||
| 1,635,802 | British Airways 2020-1 Class A Pass Through Trust, | ||
4.25%, 11/15/32 (144A) | 1,761,857 | ||
| 2,180,569 | British Airways 2020-1 Class B Pass Through Trust, | ||
8.375%, 11/15/28 (144A) | 2,521,628 | ||
| 2,715,000 | Delta Air Lines, Inc./SkyMiles IP, Ltd., 4.75%, 10/20/28 | ||
(144A) | 3,020,185 | ||
| 4,871,717 | JetBlue 2019-1 Class AA Pass Through Trust, 2.75%, | ||
5/15/32 | 5,007,400 | ||
| 1,883,297 | JetBlue 2020-1 Class A Pass Through Trust, 4.0%, | ||
11/15/32 | 2,077,909 | ||
| 2,906,648 | United Airlines 2020-1 Class B Pass Through Trust, | ||
4.875%, 1/15/26 | 3,082,516 | ||
| 1,440,000 | United Airlines, Inc., 4.375%, 4/15/26 (144A) | 1,490,400 | |
| 1,440,000 | United Airlines, Inc., 4.625%, 4/15/29 (144A) | 1,490,400 | |
| Total Airlines | $ 53,748,864 | ||
| Auto Manufacturers — 0.8% | |||
| 6,700,000 | Ford Motor Credit Co. LLC, 3.625%, 6/17/31 | $ 6,829,846 | |
| 6,885,000 | Ford Motor Credit Co. LLC, 5.584%, 3/18/24 | 7,540,452 | |
| 8,597,000 | General Motors Financial Co., Inc., 4.0%, 1/15/25 | 9,368,611 | |
| 7,044,000 | General Motors Financial Co., Inc., 6.6%, 4/1/36 | 9,681,361 | |
| 12,300,000 | Hyundai Capital Services, Inc., 3.0%, 8/29/22 (144A) | 12,612,360 | |
| Total Auto Manufacturers | $ 46,032,630 | ||
| Auto Parts & Equipment — 0.1% | |||
| 3,130,000 | Dana, Inc., 4.25%, 9/1/30 | $ 3,219,988 | |
| 3,615,000 | Lear Corp., 3.5%, 5/30/30 | 3,888,029 | |
| Total Auto Parts & Equipment | $ 7,108,017 | ||
| Banks — 3.9% | |||
| 16,040,000(c) | AIB Group Plc, 4.263% (3 Month USD LIBOR + | ||
187 bps), 4/10/25 (144A) | $ 17,280,720 | ||
| 10,258,000 | Banco Santander Chile, 2.7%, 1/10/25 (144A) | 10,708,429 | |
| 3,955,000 | Banco Santander Mexico SA Institucion de Banca Multiple | ||
Grupo Financiero Santand, 5.375%, 4/17/25 (144A) | 4,487,501 | ||
| 3,000,000 | Banco Santander SA, 2.749%, 12/3/30 | 2,975,497 |
The accompanying notes are an integral part of these financial statements.
Pioneer Bond Fund | Annual Report | 6/30/21 39
Schedule of Investments | 6/30/21 (continued)
| Principal | |||
| Amount | |||
| USD ($) | Value | ||
| Banks — (continued) | |||
| 20,595,000(c) | Bank of America Corp., 2.884% (3 Month USD LIBOR + | ||
119 bps), 10/22/30 | $ 21,716,272 | ||
| 1,150,000 | Bank of America Corp., 4.2%, 8/26/24 | 1,260,866 | |
| 3,860,000 | BPCE SA, 4.875%, 4/1/26 (144A) | 4,379,259 | |
| 2,295,000(a)(c) | Credit Suisse Group AG, 5.25% (5 Year CMT Index + | ||
489 bps) (144A) | 2,426,962 | ||
| 565,000(a)(c) | Credit Suisse Group AG, 6.375% (5 Year CMT Index + | ||
482 bps) (144A) | 628,918 | ||
| 11,725,000(a)(c) | Credit Suisse Group AG, 7.125% (5 Year USD Swap | ||
Rate + 511 bps) | 12,237,969 | ||
| 5,337,000 | Danske Bank AS, 5.375%, 1/12/24 (144A) | 5,918,335 | |
| 7,891,000(c) | Goldman Sachs Group, Inc., 3.272% (3 Month USD | ||
LIBOR + 120 bps), 9/29/25 | 8,442,649 | ||
| 6,335,000(c) | Goldman Sachs Group, Inc., 4.223% (3 Month USD | ||
LIBOR + 130 bps), 5/1/29 | 7,230,911 | ||
| 1,305,000 | HSBC Bank Plc, 7.65%, 5/1/25 | 1,577,413 | |
| 1,300,000(a)(c) | ING Groep NV, 5.75% (5 Year CMT Index + 434 bps) | 1,439,880 | |
| 5,617,000 | Intesa Sanpaolo S.p.A., 4.7%, 9/23/49 (144A) | 6,577,892 | |
| 900,000 | Intesa Sanpaolo S.p.A., 4.198%, 6/1/32 (144A) | 924,867 | |
| 8,675,000 | Lloyds Banking Group Plc, 4.65%, 3/24/26 | 9,825,562 | |
| 10,745,000(c) | Macquarie Group Ltd., 2.691% (SOFRRATE + | ||
144 bps), 6/23/32 (144A) | 10,785,777 | ||
| 10,505,000(a)(c) | Natwest Group Plc, 8.625% (5 Year USD Swap | ||
Rate + 760 bps) | 10,591,666 | ||
| 5,315,000(a)(c) | Societe Generale SA, 4.75% (5 Year CMT Index + | ||
393 bps) (144A) | 5,507,669 | ||
| 4,960,000(a)(c) | Societe Generale SA, 5.375% (5 Year CMT Index + | ||
451 bps) (144A) | 5,251,400 | ||
| 9,051,000(a)(c) | Societe Generale SA, 7.375% (5 Year USD Swap Rate + | ||
624 bps) (144A) | 9,130,649 | ||
| 11,891,000 | Sumitomo Mitsui Financial Group, Inc., 3.202%, 9/17/29 | 12,666,528 | |
| 10,350,000 | UBS AG, 7.625%, 8/17/22 | 11,133,660 | |
| 11,650,000(a)(c) | UBS Group AG, 7.0% (5 Year USD Swap Rate + | ||
434 bps) (144A) | 12,829,563 | ||
| 21,025,000(c) | UniCredit S.p.A., 2.569% (1 Year CMT Index + | ||
230 bps), 9/22/26 (144A) | 21,324,258 | ||
| 8,153,000(c) | UniCredit S.p.A., 7.296% (5 Year USD 1100 Run ICE | ||
Swap Rate + 491 bps), 4/2/34 (144A) | 9,802,515 | ||
| Total Banks | $ 229,063,587 | ||
| Beverages — 0.7% | |||
| 25,000,000 | Anheuser-Busch InBev Worldwide, Inc., 5.55%, 1/23/49 | $ 34,497,407 | |
| 4,758,000 | Bacardi, Ltd., 5.3%, 5/15/48 (144A) | 6,207,322 | |
| Total Beverages | $ 40,704,729 |
The accompanying notes are an integral part of these financial statements.
40 Pioneer Bond Fund | Annual Report | 6/30/21
| Principal | |||
| Amount | |||
| USD ($) | Value | ||
| Building Materials — 0.2% | |||
| 5,728,000 | Carrier Global Corp., 2.722%, 2/15/30 | $ 5,944,315 | |
| 4,100,000 | Standard Industries, Inc., 4.375%, 7/15/30 (144A) | 4,228,125 | |
| 400,000 | Summit Materials LLC/Summit Materials Finance Corp., | ||
5.25%, 1/15/29 (144A) | 424,972 | ||
| Total Building Materials | $ 10,597,412 | ||
| Chemicals — 0.5% | |||
| 2,470,000 | Ingevity Corp., 3.875%, 11/1/28 (144A) | $ 2,451,475 | |
| 3,493,000 | NOVA Chemicals Corp., 5.25%, 6/1/27 (144A) | 3,764,755 | |
| 968,000 | OCI NV, 4.625%, 10/15/25 (144A) | 1,009,445 | |
| 2,482,000 | OCI NV, 5.25%, 11/1/24 (144A) | 2,558,197 | |
| 10,491,000 | Olin Corp., 5.0%, 2/1/30 | 11,186,029 | |
| 900,000 | Olin Corp., 5.625%, 8/1/29 | 995,788 | |
| 5,820,000 | Tronox, Inc., 4.625%, 3/15/29 (144A) | 5,885,359 | |
| Total Chemicals | $ 27,851,048 | ||
| Commercial Services — 0.6% | |||
| 3,971,000 | Allied Universal Holdco LLC/Allied Universal Finance | ||
Corp., 6.625%, 7/15/26 (144A) | $ 4,210,173 | ||
| 1,230,000 | Allied Universal Holdco LLC/Allied Universal Finance | ||
Corp./Atlas Luxco 4 Sarl, 4.625%, 6/1/28 (144A) | 1,234,440 | ||
| 2,115,000 | Allied Universal Holdco LLC/Allied Universal Finance | ||
Corp./Atlas Luxco 4 Sarl, 4.625%, 6/1/28 (144A) | 2,116,656 | ||
| 3,355,000 | CoreLogic, Inc., 4.5%, 5/1/28 (144A) | 3,325,644 | |
| 4,375,000 | Element Fleet Management Corp., 1.6%, 4/6/24 (144A) | 4,446,488 | |
| 3,950,000 | ERAC USA Finance LLC, 3.3%, 12/1/26 (144A) | 4,307,199 | |
| 1,300,000 | ERAC USA Finance LLC, 3.8%, 11/1/25 (144A) | 1,435,381 | |
| 5,455,000 | Garda World Security Corp., 4.625%, 2/15/27 (144A) | 5,482,275 | |
| 5,870,000 | Prime Security Services Borrower LLC/Prime | ||
Finance, Inc., 6.25%, 1/15/28 (144A) | 6,244,213 | ||
| Total Commercial Services | $ 32,802,469 | ||
| Cosmetics/Personal Care — 0.1% | |||
| 3,825,000 | Edgewell Personal Care Co., 5.5%, 6/1/28 (144A) | $ 4,054,500 | |
| Total Cosmetics/Personal Care | $ 4,054,500 | ||
| Diversified Financial Services — 1.0% | |||
| 6,795,000 | Air Lease Corp., 3.125%, 12/1/30 | $ 6,910,485 | |
| 10,150,000 | Alliance Data Systems Corp., 7.0%, 1/15/26 (144A) | 10,873,188 | |
| 985,000 | Avolon Holdings Funding, Ltd., 3.95%, 7/1/24 (144A) | 1,050,666 | |
| 4,885,000 | Capital One Financial Corp., 3.3%, 10/30/24 | 5,261,736 | |
| 9,675,000 | Capital One Financial Corp., 3.75%, 4/24/24 | 10,453,032 | |
| 8,520,000(a)(c) | Capital One Financial Corp., 3.95% (5 Year CMT | ||
Index + 316 bps) | 8,701,050 | ||
| 5,200,000 | Capital One Financial Corp., 4.25%, 4/30/25 | 5,796,001 |
The accompanying notes are an integral part of these financial statements.
Pioneer Bond Fund | Annual Report | 6/30/21 41
Schedule of Investments | 6/30/21 (continued)
| Principal | |||
| Amount | |||
| USD ($) | Value | ||
| Diversified Financial Services — (continued) | |||
| 1,810,000 | Nationstar Mortgage Holdings, Inc., 5.125%, | ||
12/15/30 (144A) | $ 1,800,950 | ||
| 700,000 | Nationstar Mortgage Holdings, Inc., 6.0%, 1/15/27 (144A) | 725,396 | |
| 4,380,000 | OneMain Finance Corp., 3.5%, 1/15/27 | 4,412,850 | |
| 3,460,000 | United Wholesale Mortgage LLC, 5.5%, 4/15/29 (144A) | 3,459,204 | |
| Total Diversified Financial Services | $ 59,444,558 | ||
| Electric — 2.1% | |||
| 2,695,000 | Adani Electricity Mumbai, Ltd., 3.949%, 2/12/30 (144A) | $ 2,687,507 | |
| 5,181,435 | Adani Renewable Energy RJ, Ltd./Kodangal Solar | ||
Parks Pvt, Ltd./Wardha Solar Maharash, 4.625%, | |||
10/15/39 (144A) | 5,257,084 | ||
| 5,535,200 | Adani Transmission, Ltd., 4.25%, 5/21/36 (144A) | 5,637,345 | |
| 8,905,000 | AES Corp., 2.45%, 1/15/31 (144A) | 8,820,770 | |
| 3,220,000 | AES Corp., 3.95%, 7/15/30 (144A) | 3,521,070 | |
| 4,027,000(d) | Dominion Energy, Inc., 3.071%, 8/15/24 | 4,269,227 | |
| 4,170,000(c) | Enel S.p.A., 8.75% (5 Year USD Swap Rate + | ||
588 bps), 9/24/73 (144A) | 4,847,625 | ||
| 4,655,000 | Iberdrola International BV, 6.75%, 7/15/36 | 7,050,796 | |
| 10,270,000 | NextEra Energy Capital Holdings, Inc., 3.55%, 5/1/27 | 11,339,411 | |
| 9,635,000 | NRG Energy, Inc., 2.45%, 12/2/27 (144A) | 9,704,607 | |
| 1,255,000 | Pattern Energy Operations LP/Pattern Energy | ||
Operations, Inc., 4.5%, 8/15/28 (144A) | 1,299,176 | ||
| 7,485,000 | Puget Energy, Inc., 2.379%, 6/15/28 (144A) | 7,568,158 | |
| 7,830,000 | Puget Energy, Inc., 4.1%, 6/15/30 | 8,771,805 | |
| 478,592 | San Diego Gas & Electric Co., 1.914%, 2/1/22 | 480,346 | |
| 9,720,000 | Sempra Energy, 3.4%, 2/1/28 | 10,688,792 | |
| 3,602,000 | Talen Energy Supply LLC, 6.625%, 1/15/28 (144A) | 3,295,830 | |
| 3,865,000 | Talen Energy Supply LLC, 7.625%, 6/1/28 (144A) | 3,616,519 | |
| 19,115,000 | Vistra Operations Co. LLC, 3.7%, 1/30/27 (144A) | 20,432,328 | |
| 5,950,000 | Vistra Operations Co. LLC, 4.375%, 5/1/29 (144A) | 5,979,750 | |
| Total Electric | $ 125,268,146 | ||
| Electronics — 0.0%† | |||
| 2,055,000 | Atkore, Inc., 4.25%, 6/1/31 (144A) | $ 2,081,304 | |
| Total Electronics | $ 2,081,304 | ||
| Energy-Alternate Sources — 0.0%† | |||
| 260,808 | Alta Wind Holdings LLC, 7.0%, 6/30/35 (144A) | $ 295,907 | |
| 975,000 | Atlantica Sustainable Infrastructure PLC, 4.125%, | ||
6/15/28 (144A) | 993,330 | ||
| Total Energy-Alternate Sources | $ 1,289,237 | ||
| Engineering & Construction — 0.1% | |||
| 4,494,000 | Dycom Industries, Inc., 4.5%, 4/15/29 (144A) | $ 4,532,918 | |
| Total Engineering & Construction | $ 4,532,918 |
The accompanying notes are an integral part of these financial statements.
42 Pioneer Bond Fund | Annual Report | 6/30/21
| Principal | |||
| Amount | |||
| USD ($) | Value | ||
| Entertainment — 0.2% | |||
| 970,000 | Boyne USA, Inc., 4.75%, 5/15/29 (144A) | $ 1,000,778 | |
| 905,000 | International Game Technology Plc, 4.125%, | ||
4/15/26 (144A) | 942,331 | ||
| 3,751,000 | International Game Technology Plc, 6.5%, 2/15/25 (144A) | 4,205,809 | |
| 600,000 | Resorts World Las Vegas LLC/RWLV Capital, Inc., | ||
4.625%, 4/16/29 (144A) | 622,373 | ||
| 2,900,000 | Resorts World Las Vegas LLC/RWLV Capital, Inc., | ||
4.625%, 4/6/31 (144A) | 3,005,708 | ||
| Total Entertainment | $ 9,776,999 | ||
| Environmental Control — 0.1% | |||
| 5,910,000 | Covanta Holding Corp., 5.0%, 9/1/30 | $ 6,205,500 | |
| 2,320,000 | Covanta Holding Corp., 6.0%, 1/1/27 | 2,412,800 | |
| Total Environmental Control | $ 8,618,300 | ||
| Food — 0.4% | |||
| 2,525,000 | Albertsons Cos., Inc./Safeway, Inc./New Albertsons | ||
LP/Albertsons LLC, 4.875%, 2/15/30 (144A) | $ 2,692,938 | ||
| 1,930,000 | Bimbo Bakeries USA, Inc., 4.0%, 5/17/51 (144A) | 2,074,041 | |
| 6,740,000 | Minerva Luxembourg SA, 4.375%, 3/18/31 (144A) | 6,696,190 | |
| 1,960,000 | Pilgrim’s Pride Corp., 5.875%, 9/30/27 (144A) | 2,087,400 | |
| 2,500,000 | Smithfield Foods, Inc., 2.65%, 10/3/21 (144A) | 2,512,162 | |
| 6,465,000 | Smithfield Foods, Inc., 3.0%, 10/15/30 (144A) | 6,525,125 | |
| 728,000 | Smithfield Foods, Inc., 5.2%, 4/1/29 (144A) | 848,182 | |
| Total Food | $ 23,436,038 | ||
| Forest Products & Paper — 0.2% | |||
| 7,457,000 | International Paper Co., 7.3%, 11/15/39 | $ 11,545,732 | |
| 2,728,000 | Inversiones CMPC SA, 3.85%, 1/13/30 (144A) | 2,905,320 | |
| Total Forest Products & Paper | $ 14,451,052 | ||
| Gas — 0.1% | |||
| 3,060,000 | Boston Gas Co., 3.15%, 8/1/27 (144A) | $ 3,282,256 | |
| 1,719,742 | Nakilat, Inc., 6.267%, 12/31/33 (144A) | 2,113,477 | |
| Total Gas | $ 5,395,733 | ||
| Hand/Machine Tools — 0.1% | |||
| 3,879,000 | Kennametal, Inc., 2.8%, 3/1/31 | $ 3,906,425 | |
| Total Hand/Machine Tools | $ 3,906,425 | ||
| Healthcare-Products — 0.6% | |||
| 12,725,000 | Boston Scientific Corp., 2.65%, 6/1/30 | $ 13,175,346 | |
| 6,810,000 | Edwards Lifesciences Corp., 4.3%, 6/15/28 | 7,902,478 | |
| 15,920,000 | Smith & Nephew Plc, 2.032%, 10/14/30 | 15,588,793 | |
| Total Healthcare-Products | $ 36,666,617 |
The accompanying notes are an integral part of these financial statements.
Pioneer Bond Fund | Annual Report | 6/30/21 43
Schedule of Investments | 6/30/21 (continued)
| Principal | |||
| Amount | |||
| USD ($) | Value | ||
| Healthcare-Services — 0.4% | |||
| 16,810,000 | Fresenius Medical Care US Finance III, Inc., 2.375%, | ||
2/16/31 (144A) | $ 16,419,011 | ||
| 7,485,000 | Laboratory Corp. of America Holdings, 2.7%, 6/1/31 | 7,635,880 | |
| Total Healthcare-Services | $ 24,054,891 | ||
| Insurance — 1.2% | |||
| 5,695,000 | Arthur J Gallagher & Co., 2.5%, 5/20/31 | $ 5,758,347 | |
| 2,335,000 | AXA SA, 8.6%, 12/15/30 | 3,551,810 | |
| 2,960,000(c) | Farmers Exchange Capital III, 5.454% (3 Month USD | ||
LIBOR + 345 bps), 10/15/54 (144A) | 3,709,202 | ||
| 9,710,000(c) | Farmers Insurance Exchange, 4.747% (3 Month USD | ||
LIBOR + 323 bps), 11/1/57 (144A) | 10,950,992 | ||
| 18,482,000 | Liberty Mutual Insurance Co., 7.697%, 10/15/97 (144A) | 28,756,260 | |
| 15,460,000 | Nationwide Mutual Insurance Co., 4.35%, 4/30/50 (144A) | 17,337,957 | |
| 690,000 | Teachers Insurance & Annuity Association of America, | ||
6.85%, 12/16/39 (144A) | 1,047,129 | ||
| Total Insurance | $ 71,111,697 | ||
| Internet — 0.4% | |||
| 2,400,000 | ANGI Group LLC, 3.875%, 8/15/28 (144A) | $ 2,385,000 | |
| 15,750,000 | Expedia Group, Inc., 3.25%, 2/15/30 | 16,467,907 | |
| 4,125,000 | Expedia Group, Inc., 3.8%, 2/15/28 | 4,489,761 | |
| Total Internet | $ 23,342,668 | ||
| Lodging — 0.6% | |||
| 2,780,000 | Genting New York LLC/GENNY Capital, Inc., 3.3%, | ||
2/15/26 (144A) | $ 2,807,423 | ||
| 4,985,000 | Hilton Domestic Operating Co., Inc., 3.75%, | ||
5/1/29 (144A) | 5,023,385 | ||
| 16,130,000 | Marriott International, Inc., 3.5%, 10/15/32 | 17,156,218 | |
| 3,100,000 | Marriott International, Inc., 4.625%, 6/15/30 | 3,573,793 | |
| 1,325,000 | Marriott International, Inc., 5.75%, 5/1/25 | 1,529,950 | |
| 4,300,000 | Sands China Ltd., 4.375%, 6/18/30 | 4,649,031 | |
| Total Lodging | $ 34,739,800 | ||
| Machinery-Construction & Mining — 0.1% | |||
| 5,615,000 | Weir Group Plc, 2.2%, 5/13/26 (144A) | $ 5,640,390 | |
| Total Machinery-Construction & Mining | $ 5,640,390 | ||
| Media — 0.6% | |||
| 1,185,000 | CCO Holdings LLC/CCO Holdings Capital Corp., 4.5%, | ||
6/1/33 (144A) | $ 1,212,563 | ||
| 8,500,000 | CCO Holdings LLC/CCO Holdings Capital Corp., 4.75%, | ||
3/1/30 (144A) | 8,978,125 | ||
| 7,745,000 | Comcast Corp., 4.15%, 10/15/28 | 8,979,324 | |
| 5,800,000 | CSC Holdings LLC, 4.625%, 12/1/30 (144A) | 5,690,438 | |
| 2,325,000 | CSC Holdings LLC, 5.0%, 11/15/31 (144A) | 2,336,160 |
The accompanying notes are an integral part of these financial statements.
44 Pioneer Bond Fund | Annual Report | 6/30/21
| Principal | |||
| Amount | |||
| USD ($) | Value | ||
| Media — (continued) | |||
| 1,040,000 | Diamond Sports Group LLC/Diamond Sports Finance | ||
Co., 6.625%, 8/15/27 (144A) | $ 509,600 | ||
| 1,990,000 | News Corp., 3.875%, 5/15/29 (144A) | 2,009,900 | |
| 6,105,000 | Sirius XM Radio, Inc., 4.0%, 7/15/28 (144A) | 6,294,621 | |
| 400,000 | Summer BC Bidco B LLC, 5.5%, 10/31/26 (144A) | 406,820 | |
| Total Media | $ 36,417,551 | ||
| Mining — 0.5% | |||
| 2,400,000 | Alcoa Nederland Holding BV, 4.125%, 3/31/29 (144A) | $ 2,499,108 | |
| 6,420,000 | Anglo American Capital Plc, 2.25%, 3/17/28 (144A) | 6,496,611 | |
| 3,240,000 | AngloGold Ashanti Holdings Plc, 3.75%, 10/1/30 | 3,339,727 | |
| 12,198,000 | FMG Resources August 2006 Pty Ltd., 4.375%, | ||
4/1/31 (144A) | 13,021,365 | ||
| 1,565,000 | Kaiser Aluminum Corp., 4.5%, 6/1/31 (144A) | 1,604,970 | |
| Total Mining | $ 26,961,781 | ||
| Miscellaneous Manufacturers — 0.0%† | |||
| 1,910,000 | Hillenbrand, Inc., 3.75%, 3/1/31 | $ 1,893,889 | |
| Total Miscellaneous Manufacturers | $ 1,893,889 | ||
| Multi-National — 0.5% | |||
| 11,165,000 | Africa Finance Corp., 4.375%, 4/17/26 (144A) | $ 12,151,539 | |
| 6,065,000 | African Export-Import Bank, 3.994%, 9/21/29 (144A) | 6,385,390 | |
| 7,150,000 | Banque Ouest Africaine de Developpement, 4.7%, | ||
10/22/31 (144A) | 7,727,720 | ||
| 2,230,000 | Banque Ouest Africaine de Developpement, 5.0%, | ||
7/27/27 (144A) | 2,480,813 | ||
| Total Multi-National | $ 28,745,462 | ||
| Oil & Gas — 1.5% | |||
| 19,020,000 | Cenovus Energy, Inc., 6.75%, 11/15/39 | $ 25,836,399 | |
| 1,705,000 | EQT Corp., 3.125%, 5/15/26 (144A) | 1,742,868 | |
| 1,775,000 | EQT Corp., 3.625%, 5/15/31 (144A) | 1,850,438 | |
| 1,850,000 | Hilcorp Energy I LP/Hilcorp Finance Co., 6.0%, | ||
2/1/31 (144A) | 1,959,335 | ||
| 2,810,000 | Lundin Energy Finance BV, 2.0%, 7/15/26 (144A) | 2,817,038 | |
| 20,680,000 | Lundin Energy Finance BV, 3.1%, 7/15/31 (144A) | 20,913,341 | |
| 5,000,000 | MEG Energy Corp., 7.125%, 2/1/27 (144A) | 5,326,625 | |
| 1,745,000 | PBF Holding Co. LLC/PBF Finance Corp., 9.25%, | ||
5/15/25 (144A) | 1,757,896 | ||
| 6,065,000 | Petroleos Mexicanos, 5.35%, 2/12/28 | 5,964,624 | |
| 3,835,000 | Phillips 66, 2.15%, 12/15/30 | 3,774,387 | |
| 3,625,000 | Valero Energy Corp., 2.15%, 9/15/27 | 3,684,375 | |
| 8,468,000 | Valero Energy Corp., 6.625%, 6/15/37 | 11,616,855 | |
| Total Oil & Gas | $ 87,244,181 |
The accompanying notes are an integral part of these financial statements.
Pioneer Bond Fund | Annual Report | 6/30/21 45
Schedule of Investments | 6/30/21 (continued)
| Principal | |||
| Amount | |||
| USD ($) | Value | ||
| Oil & Gas Services — 0.1% | |||
| 2,250,000 | Halliburton Co., 7.6%, 8/15/96 (144A) | $ 2,903,417 | |
| Total Oil & Gas Services | $ 2,903,417 | ||
| Packaging & Containers — 0.1% | |||
| 3,910,000 | TriMas Corp., 4.125%, 4/15/29 (144A) | $ 3,958,093 | |
| Total Packaging & Containers | $ 3,958,093 | ||
| Pharmaceuticals — 1.0% | |||
| 5,265,000 | Bausch Health Americas, Inc., 9.25%, 4/1/26 (144A) | $ 5,726,741 | |
| 4,900,000 | Bayer US Finance II LLC, 4.25%, 12/15/25 (144A) | 5,460,658 | |
| 6,225,000 | Cigna Corp., 4.375%, 10/15/28 | 7,245,900 | |
| 352,502 | CVS Pass-Through Trust, 5.298%, 1/11/27 (144A) | 386,631 | |
| 2,253,222 | CVS Pass-Through Trust, 5.773%, 1/10/33 (144A) | 2,672,096 | |
| 1,578,781 | CVS Pass-Through Trust, 5.926%, 1/10/34 (144A) | 1,910,365 | |
| 2,624,021 | CVS Pass-Through Trust, 6.036%, 12/10/28 | 3,073,188 | |
| 4,133,498 | CVS Pass-Through Trust, 8.353%, 7/10/31 (144A) | 5,420,398 | |
| 3,600,000 | Jazz Securities, DAC, 4.375%, 1/15/29 (144A) | 3,732,480 | |
| 3,710,000 | Organon & Co./Organon Foreign Debt Co.-Issuer BV, | ||
4.125%, 4/30/28 (144A) | 3,783,458 | ||
| 11,586,000 | Teva Pharmaceutical Finance Netherlands III BV, | ||
3.15%, 10/1/26 | 11,021,182 | ||
| 4,000,000 | Teva Pharmaceutical Finance Netherlands III BV, | ||
6.75%, 3/1/28 | 4,380,000 | ||
| 5,175,000 | Teva Pharmaceutical Finance Netherlands III BV, | ||
7.125%, 1/31/25 | 5,705,438 | ||
| Total Pharmaceuticals | $ 60,518,535 | ||
| Pipelines — 3.0% | |||
| 3,450,000 | DCP Midstream Operating LP, 5.375%, 7/15/25 | $ 3,842,265 | |
| 4,025,000 | DCP Midstream Operating LP, 5.6%, 4/1/44 | 4,427,500 | |
| 3,190,000 | Enable Midstream Partners LP, 4.15%, 9/15/29 | 3,496,020 | |
| 14,441,000 | Enable Midstream Partners LP, 4.95%, 5/15/28 | 16,547,205 | |
| 10,550,000 | Enbridge, Inc., 3.7%, 7/15/27 | 11,641,959 | |
| 6,730,000 | Energy Transfer LP, 5.35%, 5/15/45 | 7,789,852 | |
| 4,085,000 | Energy Transfer LP, 6.0%, 6/15/48 | 5,166,786 | |
| 786,000 | Energy Transfer LP, 6.1%, 2/15/42 | 977,610 | |
| 1,125,000 | Energy Transfer LP, 6.125%, 12/15/45 | 1,434,455 | |
| 4,207,000 | Energy Transfer LP, 6.5%, 2/1/42 | 5,464,441 | |
| 11,045,000(a)(c) | Energy Transfer LP, 7.125% (5 Year CMT Index + 531 bps) | 11,403,963 | |
| 510,000 | EnLink Midstream LLC, 5.375%, 6/1/29 | 532,246 | |
| 8,316,000 | EnLink Midstream Partners LP, 5.45%, 6/1/47 | 7,380,450 | |
| 4,299,000 | EnLink Midstream Partners LP, 5.6%, 4/1/44 | 3,890,595 | |
| 4,680,000 | Hess Midstream Operations LP, 5.125%, 6/15/28 (144A) | 4,908,150 | |
| 11,489,000 | Midwest Connector Capital Co. LLC, 4.625%, | ||
4/1/29 (144A) | 12,221,953 | ||
| 9,940,000 | MPLX LP, 4.25%, 12/1/27 | 11,270,964 | |
| 3,875,000 | MPLX LP, 4.875%, 12/1/24 | 4,336,676 |
The accompanying notes are an integral part of these financial statements.
46 Pioneer Bond Fund | Annual Report | 6/30/21
| Principal | |||
| Amount | |||
| USD ($) | Value | ||
| Pipelines — (continued) | |||
| 3,045,000 | MPLX LP, 4.875%, 6/1/25 | $ 3,438,276 | |
| 6,920,000 | MPLX LP, 5.5%, 2/15/49 | 8,962,957 | |
| 6,860,000 | NGPL PipeCo LLC, 3.25%, 7/15/31 (144A) | 7,078,118 | |
| 12,125,000 | Phillips 66 Partners LP, 3.75%, 3/1/28 | 13,276,758 | |
| 10,675,000 | Sabine Pass Liquefaction LLC, 5.0%, 3/15/27 | 12,332,379 | |
| 8,870,000 | Texas Eastern Transmission LP, 3.5%, 1/15/28 (144A) | 9,654,628 | |
| 2,475,000 | Williams Cos., Inc., 7.75%, 6/15/31 | 3,441,520 | |
| Total Pipelines | $ 174,917,726 | ||
| REITs — 2.1% | |||
| 5,995,000 | Alexandria Real Estate Equities, Inc., 1.875%, 2/1/33 | $ 5,675,003 | |
| 2,555,000 | Alexandria Real Estate Equities, Inc., 4.3%, 1/15/26 | 2,864,619 | |
| 5,715,000 | Corporate Office Properties LP, 2.75%, 4/15/31 | 5,756,024 | |
| 1,480,000 | Essex Portfolio LP, 3.625%, 5/1/27 | 1,634,627 | |
| 6,000,000 | HAT Holdings I LLC/HAT Holdings II LLC, 3.375%, | ||
6/15/26 (144A) | 6,045,000 | ||
| 5,105,000 | Healthcare Realty Trust, Inc., 2.05%, 3/15/31 | 4,940,587 | |
| 4,461,000 | Healthcare Realty Trust, Inc., 2.4%, 3/15/30 | 4,488,711 | |
| 11,631,000 | Healthcare Trust of America Holdings LP, 3.1%, 2/15/30 | 12,365,351 | |
| 4,675,000 | Healthcare Trust of America Holdings LP, 3.75%, 7/1/27 | 5,197,591 | |
| 3,160,000 | Highwoods Realty LP, 2.6%, 2/1/31 | 3,178,676 | |
| 3,390,000 | Highwoods Realty LP, 3.625%, 1/15/23 | 3,504,419 | |
| 7,105,000 | Highwoods Realty LP, 4.125%, 3/15/28 | 7,965,028 | |
| 6,291,000 | Iron Mountain, Inc., 4.5%, 2/15/31 (144A) | 6,369,638 | |
| 8,700,000 | iStar, Inc., 4.25%, 8/1/25 | 8,950,125 | |
| 3,475,000 | iStar, Inc., 4.75%, 10/1/24 | 3,657,437 | |
| 515,000 | iStar, Inc., 5.5%, 2/15/26 | 539,462 | |
| 5,320,000 | Lexington Realty Trust, 2.7%, 9/15/30 | 5,413,580 | |
| 4,020,000 | MPT Operating Partnership LP/MPT Finance Corp., | ||
3.5%, 3/15/31 | 4,060,160 | ||
| 9,833,000 | MPT Operating Partnership LP/MPT Finance Corp., | ||
4.625%, 8/1/29 | 10,525,833 | ||
| 6,975,000 | SBA Tower Trust, 3.869%, 10/8/24 (144A) | 7,329,223 | |
| 1,520,000 | UDR, Inc., 2.95%, 9/1/26 | 1,624,333 | |
| 5,300,000 | UDR, Inc., 4.4%, 1/26/29 | 6,141,205 | |
| 7,124,000 | Uniti Group LP/Uniti Fiber Holdings, Inc./CSL Capital LLC, | ||
7.875%, 2/15/25 (144A) | 7,613,775 | ||
| Total REITs | $ 125,840,407 | ||
| Retail — 0.3% | |||
| 9,870,000 | 7-Eleven, Inc., 1.8%, 2/10/31 (144A) | $ 9,446,170 | |
| 4,115,000 | AutoNation, Inc., 4.75%, 6/1/30 | 4,871,600 | |
| 2,420,000 | Beacon Roofing Supply, Inc., 4.125%, 5/15/29 (144A) | 2,413,817 | |
| Total Retail | $ 16,731,587 |
The accompanying notes are an integral part of these financial statements.
Pioneer Bond Fund | Annual Report | 6/30/21 47
Schedule of Investments | 6/30/21 (continued)
| Principal | |||
| Amount | |||
| USD ($) | Value | ||
| Semiconductors — 0.5% | |||
| 4,748,000 | Broadcom, Inc., 4.11%, 9/15/28 | $ 5,345,616 | |
| 3,225,000 | Broadcom, Inc., 4.3%, 11/15/32 | 3,676,855 | |
| 15,388,000 | Broadcom, Inc., 5.0%, 4/15/30 | 18,188,546 | |
| 3,925,000 | Skyworks Solutions, Inc., 3.0%, 6/1/31 | 4,022,582 | |
| Total Semiconductors | $ 31,233,599 | ||
| Software — 0.6% | |||
| 20,040,000 | Broadridge Financial Solutions, Inc., 2.6%, 5/1/31 | $ 20,428,918 | |
| 15,690,000 | Citrix Systems, Inc., 3.3%, 3/1/30 | 16,523,502 | |
| Total Software | $ 36,952,420 | ||
| Telecommunications — 0.9% | |||
| 1,945,000 | Altice France SA, 5.125%, 7/15/29 (144A) | $ 1,954,530 | |
| 8,264,000 | Altice France SA, 5.5%, 1/15/28 (144A) | 8,575,553 | |
| 3,950,000 | Level 3 Financing, Inc., 4.625%, 9/15/27 (144A) | 4,099,784 | |
| 1,260,000 | Lumen Technologies, Inc., 4.0%, 2/15/27 (144A) | 1,285,200 | |
| 10,275,000 | Motorola Solutions, Inc., 2.3%, 11/15/30 | 10,101,809 | |
| 3,700,000 | Plantronics, Inc., 4.75%, 3/1/29 (144A) | 3,673,101 | |
| 4,600,000 | T-Mobile USA, Inc., 2.55%, 2/15/31 | 4,647,702 | |
| 5,605,000 | T-Mobile USA, Inc., 3.375%, 4/15/29 (144A) | 5,784,324 | |
| 11,205,000 | T-Mobile USA, Inc., 3.5%, 4/15/31 (144A) | 11,592,581 | |
| Total Telecommunications | $ 51,714,584 | ||
| Trucking & Leasing — 0.3% | |||
| 7,615,000 | Penske Truck Leasing Co. LP/PTL Finance Corp., 1.7%, | ||
| 6/15/26 (144A) | $ 7,658,770 | ||
| 4,183,000 | Penske Truck Leasing Co. LP/PTL Finance Corp., 3.35%, | ||
| 11/1/29 (144A) | 4,468,763 | ||
| 4,615,000 | Penske Truck Leasing Co. LP/PTL Finance Corp., 4.2%, | ||
| 4/1/27 (144A) | 5,190,159 | ||
| Total Trucking & Leasing | $ 17,317,692 | ||
| Water — 0.1% | |||
| 3,340,000 | Essential Utilities, Inc., 3.566%, 5/1/29 | $ 3,700,441 | |
| Total Water | $ 3,700,441 | ||
| TOTAL CORPORATE BONDS | |||
(Cost $1,598,863,481) | $ 1,694,732,232 | ||
| FOREIGN GOVERNMENT BOND — 0.2% | |||
| of Net Assets | |||
| Mexico — 0.2% | |||
| 13,425,000 | Mexico Government International Bond, 4.6%, 2/10/48 | $ 14,401,534 | |
| Total Mexico | $ 14,401,534 | ||
| TOTAL FOREIGN GOVERNMENT BOND | |||
(Cost $12,396,094) | $ 14,401,534 |
The accompanying notes are an integral part of these financial statements.
48 Pioneer Bond Fund | Annual Report | 6/30/21
| Principal | |||
| Amount | |||
| USD ($) | Value | ||
| INSURANCE-LINKED SECURITIES — 2.1% | |||
| of Net Assets# | |||
| Event Linked Bonds — 0.2% | |||
| Earthquakes – Mexico — 0.0%† | |||
| 250,000(b) | International Bank for Reconstruction & Development, | ||
3.539% (3 Month USD LIBOR + 350 bps), 3/13/24 (144A) | $ 253,600 | ||
| Health – U.S. — 0.1% | |||
| 2,500,000(b) | Vitality Re X, 1.791% (3 Month U.S. Treasury Bill + | ||
175 bps), 1/10/23 (144A) | $ 2,451,300 | ||
| Inland Flood – U.S. — 0.0%† | |||
| 250,000(b) | FloodSmart Re, 11.871% (1 Month U.S. Treasury Bill + | ||
| 1,183 bps), 3/7/22 (144A) | $ 243,400 | ||
| 750,000(b) | FloodSmart Re, 15.121% (3 Month U.S. Treasury Bill + | ||
| 1,508 bps), 2/27/23 (144A) | 743,475 | ||
| 1,250,000(b) | FloodSmart Re, 13.041% (3 Month U.S. Treasury Bill + | ||
| 1,300 bps), 3/1/24 (144A) | 1,240,000 | ||
| $ 2,226,875 | |||
| Multiperil – U.S. — 0.1% | |||
| 2,000,000(b) | Bowline Re, Series 2018-1, 4.801% (3 Month U.S. Treasury | ||
| Bill + 476 bps), 5/23/22 (144A) | $ 2,009,400 | ||
| 100,000(b) | Caelus Re V, 0.541% (1 Month U.S. Treasury Bill + | ||
| 50 bps), 6/5/24 (144A) | 50,000 | ||
| 500,000(b) | Herbie Re, 9.041% (3 Month U.S. Treasury Bill + | ||
| 900 bps), 1/8/25 (144A) | 523,950 | ||
| $ 2,583,350 | |||
| Multiperil – U.S. Regional — 0.0%† | |||
| 1,250,000(b) | Matterhorn Re, 5.041% (3 Month U.S. Treasury Bill + | ||
500 bps), 1/8/24 (144A) | $ 1,218,500 | ||
| Pandemic – U.S. — 0.0%† | |||
| 1,000,000(b) | Vitality Re XI, 1.841% (3 Month U.S. Treasury Bill + | ||
| 180 bps), 1/9/24 (144A) | $ 975,000 | ||
| Total Event Linked Bonds | $ 9,708,625 |
| Face | |||
| Amount | |||
| USD ($) | |||
| Collateralized Reinsurance — 0.4% | |||
| Multiperil – Massachusetts — 0.1% | |||
| 3,000,000+(g)(h) | Denning Re, 7/31/24 | $ 3,024,808 | |
| Multiperil – U.S. — 0.2% | |||
| 8,000,000+(g)(h) | Ballybunion Re, 2/28/22 | $ 8,360,445 | |
| 2,250,000+(g)(h) | Ballybunion Re 2020-3, 7/31/24 | 2,326,597 | |
| 600,000+(g) | Dingle Re 2019, 2/1/22 | 12,315 | |
| 750,000+(g)(h) | Dingle Re 2020, 12/31/21 | 775,869 |
The accompanying notes are an integral part of these financial statements.
Pioneer Bond Fund | Annual Report | 6/30/21 49
Schedule of Investments | 6/30/21 (continued)
| Face | |||
| Amount | |||
| USD ($) | Value | ||
| Multiperil – U.S. — (continued) | |||
| 2,000,000+(g)(h) | Port Royal Re 2019, 5/31/22 | $ 2,058,200 | |
| $ 13,533,426 | |||
| Multiperil – U.S. Regional — 0.0%† | |||
| 2,500,000+(g)(h) | Ailsa Re 2019, 6/30/22 | $ 2,673,058 | |
| Multiperil – Worldwide — 0.1% | |||
| 167,000+(g) | Limestone Re, 3/1/23 (144A) | $ 99,165 | |
| 28,000+(g) | Limestone Re 2016-1, 8/31/21 | 1,575 | |
| 82,000+(g) | Limestone Re 2016-1, 8/31/21 | 4,612 | |
| 20,000+(g) | Limestone Re 2019, 9/9/22 | — | |
| 480,000+(g)(h) | Limestone Re 2020-1, 3/1/24 (144A) | 111,936 | |
| 1,420,000+(g)(h) | Limestone Re 2020-1, 3/1/24 (144A) | 331,144 | |
| 1,333,000+(g)(h) | Limestone Re 2020-2, 10/1/24 | 1,456,302 | |
| 250,000+(g)(h) | Merion Re 2021-1, 12/31/24 | 229,191 | |
| 400,000+(g)(h) | Old Head Re 2021, 12/31/24 | 352,451 | |
| 1,000,000+(g) | Pine Valley Re 2021, 12/31/24 | 964,840 | |
| 3,600,000+(g)(h) | Resilience Re, 10/6/21 | — | |
| 567,400+(g)(h) | Seminole Re 2018, 1/31/22 | 14,019 | |
| 553,333+(g)(h) | Walton Health Re 2018, 6/15/22 | 173,816 | |
| 350,000+(g)(h) | Walton Health Re 2019, 6/30/22 | 294,118 | |
| $ 4,033,169 | |||
| Windstorm – Florida — 0.0%† | |||
| 3,250,000+(g) | Cedar Re 2020, 6/30/24 | $ 97,545 | |
| 1,500,000+(g)(h) | Formby Re 2018, 2/28/22 | 208,790 | |
| $ 306,335 | |||
| Windstorm – U.S. Regional — 0.0%† | |||
| 1,000,000+(g)(h) | Oakmont Re 2017, 4/30/22 | $ 29,400 | |
| 2,500,000+(g)(h) | Oakmont Re 2020, 4/30/24 | 2,018,848 | |
| $ 2,048,248 | |||
| Total Collateralized Reinsurance | $ 25,619,044 | ||
| Reinsurance Sidecars — 1.5% | |||
| Multiperil – U.S. — 0.1% | |||
| 4,500,000+(g)(h) | Carnoustie Re 2017, 11/30/21 | $ 593,100 | |
| 2,000,000+(g)(h) | Carnoustie Re 2020, 12/31/23 | 271,200 | |
| 1,853,719+(g)(h) | Carnoustie Re 2021, 12/31/24 | 1,917,248 | |
| 1,300,000+(g)(h) | Castle Stuart Re 2018, 12/1/21 | 11,310 | |
| 2,000,000+(h)(i) | Harambee Re 2018, 12/31/21 | 5,600 | |
| 5,000,000+(i) | Harambee Re 2019, 12/31/22 | 25,500 | |
| 4,000,000+(h)(i) | Harambee Re 2020, 12/31/23 | 256,800 | |
| $ 3,080,758 |
The accompanying notes are an integral part of these financial statements.
50 Pioneer Bond Fund | Annual Report | 6/30/21
| Face | |||
| Amount | |||
| USD ($) | Value | ||
| Multiperil – Worldwide — 1.4% | |||
| 34,018+(i) | Alturas Re 2019-2, 3/10/22 | $ 46,710 | |
| 2,200+(g) | Alturas Re 2019-2, 3/10/23 (144A) | 5,991 | |
| 24,550+(g) | Alturas Re 2019-3, 9/12/23 | 19,876 | |
| 285,668+(g)(h) | Alturas Re 2020-1A, 3/10/23 | 115,638 | |
| 363,577+(g)(h) | Alturas Re 2020-1B, 3/10/23 (144A) | 147,176 | |
| 540,698+(i) | Alturas Re 2020-2, 3/10/23 | 649,919 | |
| 225,450+(h)(i) | Alturas Re 2020-3, 9/30/24 | 228,223 | |
| 3,959,302+(h)(i) | Alturas Re 2021-2, 12/31/24 | 3,961,678 | |
| 2,000,000+(g)(h) | Bantry Re 2016, 3/31/22 | 161,200 | |
| 1,500,000+(g)(h) | Bantry Re 2017, 3/31/22 | 87,662 | |
| 2,000,000+(g)(h) | Bantry Re 2018, 12/31/21 | 22,800 | |
| 5,000,000+(g)(h) | Bantry Re 2019, 12/31/22 | 169,818 | |
| 4,776,758+(g)(h) | Bantry Re 2020, 12/31/23 | 698,362 | |
| 5,000,000+(g)(h) | Bantry Re 2021, 12/31/24 | 5,338,700 | |
| 10,192,268+(g)(h) | Berwick Re 2018-1, 12/31/21 | 979,295 | |
| 7,281,734+(g)(h) | Berwick Re 2019-1, 12/31/22 | 870,167 | |
| 3,000,000+(g) | Berwick Re 2020-1, 12/31/23 | 300 | |
| 4,000,000+(g)(h) | Berwick Re 2021-1, 12/31/24 | 4,321,718 | |
| 185,850+(g) | Eden Re II, 3/22/22 (144A) | 51,306 | |
| 6,000+(g) | Eden Re II, 3/22/23 (144A) | 32,172 | |
| 59,061+(g) | Eden Re II, 3/22/23 (144A) | 311,238 | |
| 210,000+(g)(h) | Eden Re II, 3/22/24 (144A) | 222,537 | |
| 640,000+(g)(h) | Eden Re II, 3/22/24 (144A) | 694,336 | |
| 125,000+(g) | Eden Re II, 3/22/22 (144A) | 32,328 | |
| 7,500,000+(g)(h) | Eden Re II, Series B, 3/21/25 (144A) | 7,335,750 | |
| 1,000,000+(g)(h) | Gleneagles Re 2018, 12/31/21 | 118,300 | |
| 886,832+(g)(h) | Gleneagles Re 2019, 12/31/22 | 19,818 | |
| 1,250,000+(g)(h) | Gleneagles Re 2020, 12/31/23 | 177,250 | |
| 1,250,000+(g)(h) | Gleneagles Re 2021, 12/31/24 | 1,310,177 | |
| 2,118,314+(g)(h) | Gullane Re 2018, 12/31/21 | 361,093 | |
| 6,000,000+(g)(h) | Gullane Re 2021, 12/31/24 | 6,394,297 | |
| 2,000+(g) | Limestone Re 2018, 3/1/22 | — | |
| 500,000+(i) | Lion Rock Re 2019, 1/31/22 | 2,650 | |
| 500,000+(g) | Lion Rock Re 2020, 1/31/22 | — | |
| 500,000+(g)(h) | Lion Rock Re 2021, 12/31/24 | 564,500 | |
| 5,000,000+(h)(i) | Lorenz Re 2018, 7/1/22 | 25,500 | |
| 2,993,180+(h)(i) | Lorenz Re 2019, 6/30/22 | 328,352 | |
| 2,019,510+(h)(i) | Lorenz Re 2020, 6/30/23 | 2,033,849 | |
| 2,480,490+(h)(i) | Lorenz Re 2020, 6/30/23 | 2,498,102 | |
| 7,000,000+(g)(h) | Merion Re 2018-2, 12/31/21 | 1,158,500 | |
| 9,000,000+(g)(h) | Merion Re 2021-2, 12/31/24 | 9,336,489 | |
| 3,000,000+(g) | Pangaea Re 2016-2, 11/30/21 | 5,350 | |
| 3,800,000+(g)(h) | Pangaea Re 2018-1, 12/31/21 | 80,007 | |
| 6,500,000+(g)(h) | Pangaea Re 2018-3, 7/1/22 | 134,832 |
The accompanying notes are an integral part of these financial statements.
Pioneer Bond Fund | Annual Report | 6/30/21 51
Schedule of Investments | 6/30/21 (continued)
| Face | |||
| Amount | |||
| USD ($) | Value | ||
| Multiperil – Worldwide — (continued) | |||
| 4,017,011+(g)(h) | Pangaea Re 2019-1, 2/1/23 | $ 83,704 | |
| 4,779,537+(g)(h) | Pangaea Re 2019-3, 7/1/23 | 171,924 | |
| 3,974,837+(g) | Pangaea Re 2020-1, 2/1/24 | 84,354 | |
| 5,000,000+(g)(h) | Pangaea Re 2020-1, 12/31/24 | 5,211,804 | |
| 5,000,000+(g)(h) | Pangaea Re 2020-3, 7/1/24 | 5,499,678 | |
| 1,250,000+(h)(j) | Phoenix One Re, 1/4/27 | 1,271,625 | |
| 1,260,000+(g)(h) | Sector Re V, 12/1/23 (144A) | 264,023 | |
| 99,999+(g)(h) | Sector Re V, 12/1/24 (144A) | 270,501 | |
| 959+(g)(h) | Sector Re V, 3/1/25 (144A) | 197,044 | |
| 3,490+(g)(h) | Sector Re V, 3/1/25 (144A) | 87,627 | |
| 1,500,000+(g)(h) | Sector Re V, 12/1/25 (144A) | 1,533,635 | |
| 2,699,987+(g)(h) | Sector Re V, 12/1/25 (144A) | 2,760,530 | |
| 533+(g)(h) | Sector Re V, 3/1/25 (144A) | 109,514 | |
| 240,014+(g)(h) | Sector Re V, Series 8, Class D, 12/1/23 (144A) | 56,851 | |
| 600,000+(g)(h) | Sector Re V, Series 9, Class A, 3/1/24 (144A) | 371,246 | |
| 200,000+(g)(h) | Sector Re V, Series 9, Class C, 12/1/24 (144A) | 541,008 | |
| 1,914+(g) | Sector Re V, Series 9, Class G, 3/1/24 (144A) | 32,873 | |
| 1,737,984+(g)(h) | St. Andrews Re 2017-4, 6/1/22 | 171,018 | |
| 3,609,700+(g) | Sussex Re 2020-1, 12/31/22 | 181,568 | |
| 1,250,000+(g)(h) | Sussex Re 2021-1, 12/31/24 | 1,246,250 | |
| 500,000+(h)(i) | Thopas Re 2018, 12/31/21 | 2,500 | |
| 3,000,000+(h)(i) | Thopas Re 2019, 12/31/22 | 135,300 | |
| 6,000,000+(i) | Thopas Re 2020, 12/31/23 | 51,600 | |
| 7,000,000+(h)(i) | Thopas Re 2021, 12/31/24 | 7,233,100 | |
| 2,000,000+(g)(h) | Versutus Re 2018, 12/31/21 | — | |
| 1,765,095+(g) | Versutus Re 2019-A, 12/31/21 | 45,186 | |
| 1,734,905+(g) | Versutus Re 2019-B, 12/31/21 | 42,332 | |
| 1,000,000+(h)(i) | Viribus Re 2018, 12/31/21 | — | |
| 3,650,000+(h)(i) | Viribus Re 2019, 12/31/22 | 152,205 | |
| 4,139,570+(h)(i) | Viribus Re 2020, 12/31/23 | 30,633 | |
| 3,717,666+(h)(i) | Viribus Re 2021, 12/31/24 | 3,743,318 | |
| 1,623,326+(g)(h) | Woburn Re 2018, 12/31/21 | 119,152 | |
| 4,979,452+(g)(h) | Woburn Re 2019, 12/31/22 | 1,472,424 | |
| $ 84,228,493 | |||
| Total Reinsurance Sidecars | $ 87,309,251 | ||
| TOTAL INSURANCE-LINKED SECURITIES | |||
(Cost $120,615,303) | $ 122,636,920 |
The accompanying notes are an integral part of these financial statements.
52 Pioneer Bond Fund | Annual Report | 6/30/21
| Principal | ||||
| Amount | ||||
| USD ($) | Value | |||
| MUNICIPAL BOND — 0.0%† of Net Assets(j) | ||||
| Municipal General — 0.0%† | ||||
| 2,335,000 | Virginia Commonwealth Transportation Board, | |||
| Transportation Capital Projects, 4.0%, 5/15/32 | $ 2,545,127 | |||
| Total Municipal General | $ 2,545,127 | |||
| TOTAL MUNICIPAL BOND | ||||
(Cost $2,453,151) | $ 2,545,127 | |||
| SENIOR SECURED FLOATING RATE LOAN | ||||
| INTERESTS — 0.4% of Net Assets*(b) | ||||
| Automobile — 0.0%† | ||||
| 714,713 | Navistar, Inc., Tranche B Term Loan, 3.6% (LIBOR + | |||
| 350 bps), 11/6/24 | $ 715,905 | |||
| Total Automobile | $ 715,905 | |||
| Computers & Electronics — 0.0%† | ||||
| 1,024,981 | Energy Acquisition LP (aka Electrical Components | |||
| International), First Lien Initial Term Loan, | ||||
| 4.368% (LIBOR + 425 bps), 6/26/25 | $ 1,014,731 | |||
| Total Computers & Electronics | $ 1,014,731 | |||
| Diversified & Conglomerate Service — 0.0%† | ||||
| 1,053,250 | Team Health Holdings, Inc., Initial Term Loan, 3.75% | |||
| (LIBOR + 275 bps), 2/6/24 | $ 1,025,038 | |||
| Total Diversified & Conglomerate Service | $ 1,025,038 | |||
| Electronics — 0.1% | ||||
| 4,847,969 | Scientific Games International, Inc., Initial Term B-5 | |||
| Loan, 2.854% (LIBOR + 275 bps), 8/14/24 | $ 4,819,182 | |||
| Total Electronics | $ 4,819,182 | |||
| Forest Products — 0.1% | ||||
| 4,365,000 | Schweitzer-Mauduit International, Inc., Term Loan B, | |||
| 4.5% (LIBOR + 375 bps), 2/9/28 | $ 4,315,894 | |||
| Total Forest Products | $ 4,315,894 | |||
| Healthcare, Education & Childcare — 0.1% | ||||
| 548,913 | Alliance HealthCare Services, Inc., First Lien Initial Term | |||
| Loan, 5.5% (LIBOR + 450 bps), 10/24/23 | $ 546,855 | |||
| 1,074,840 | KUEHG Corp. (fka KC MergerSub, Inc.) (aka KinderCare), Term | |||
| B-3 Loan, 4.75% (LIBOR + 375 bps), 2/21/25 | 1,060,509 | |||
| Total Healthcare, Education & Childcare | $ 1,607,364 | |||
| Hotel, Gaming & Leisure — 0.0%† | ||||
| 1,394,219 | 1011778 B.C. Unlimited Liability Co. (New Red Finance, | |||
Inc.) (aka Burger King/Tim Hortons), Term B-4 Loan, | ||||
| 1.854% (LIBOR + 175 bps), 11/19/26 | $ 1,376,792 | |||
| Total Hotel, Gaming & Leisure | $ 1,376,792 | |||
The accompanying notes are an integral part of these financial statements.
Pioneer Bond Fund | Annual Report | 6/30/21 53
Schedule of Investments | 6/30/21 (continued)
| Principal | |||
| Amount | |||
| USD ($) | Value | ||
| Insurance — 0.0%† | |||
| 363,509(k) | MPH Acquisition Holdings LLC, Initial Term Loan | ||
| (LIBOR + 275 bps), 6/7/23 | $ 362,878 | ||
| 818,125 | USI, Inc. (fka Compass Investors, Inc.), 2017 New Term | ||
| Loan, 3.147% (LIBOR + 300 bps), 5/16/24 | 811,697 | ||
| Total Insurance | $ 1,174,575 | ||
| Leasing — 0.1% | |||
| 623,971 | Avolon TLB Borrower 1 (US) LLC, Term B-4 Loan, 2.25% | ||
| (LIBOR + 150 bps), 2/12/27 | $ 617,483 | ||
| 2,660,625 | IBC Capital I, Ltd. (aka Goodpack, Ltd.), First Lien | ||
| Tranche B-1 Term Loan, 3.875% (LIBOR + | |||
| 375 bps), 9/11/23 | 2,643,166 | ||
| Total Leasing | $ 3,260,649 | ||
| Leisure & Entertainment — 0.0%† | |||
| 190,787 | Fitness International LLC, Term B Loan, 4.25% (LIBOR + | ||
| 325 bps), 4/18/25 | $ 182,917 | ||
| Total Leisure & Entertainment | $ 182,917 | ||
| Retail — 0.0%† | |||
| 524,300 | Staples, Inc., 2019 Refinancing New Term B-2 Loan, | ||
| 4.676% (LIBOR + 450 bps), 9/12/24 | $ 517,746 | ||
| Total Retail | $ 517,746 | ||
| Telecommunications — 0.0%† | |||
| 809,587 | Level 3 Financing, Inc., Tranche B 2027 Term Loan, | ||
| 1.854% (LIBOR + 175 bps), 3/1/27 | $ 798,961 | ||
| Total Telecommunications | $ 798,961 | ||
| Utilities — 0.0%† | |||
| 885,791 | Eastern Power LLC (Eastern Covert Midco LLC) (aka | ||
| TPF II LC LLC), Term Loan, 4.75% (LIBOR + | |||
| 375 bps), 10/2/25 | $ 793,257 | ||
| Total Utilities | $ 793,257 | ||
| TOTAL SENIOR SECURED FLOATING RATE | |||
| LOAN INTERESTS | |||
(Cost $21,776,879) | $ 21,603,011 | ||
| U.S. GOVERNMENT AND AGENCY OBLIGATIONS — | |||
| 50.4% of Net Assets | |||
| 54,000,000 | Fannie Mae, 1.5%, 8/1/51 (TBA) | $ 54,607,986 | |
| 37,000,000 | Fannie Mae, 2.0%, 7/1/36 (TBA) | 38,175,372 | |
| 30,000,000 | Fannie Mae, 2.0%, 7/1/50 (TBA) | 30,331,641 | |
| 33,000,000 | Fannie Mae, 2.0%, 8/1/51 (TBA) | 33,299,062 | |
| 635,690 | Fannie Mae, 2.5%, 7/1/30 | 669,192 | |
| 711,814 | Fannie Mae, 2.5%, 7/1/30 | 748,188 | |
| 1,089,720 | Fannie Mae, 2.5%, 7/1/30 | 1,146,104 | |
| 137,654 | Fannie Mae, 2.5%, 12/1/42 | 143,733 | |
| 152,320 | Fannie Mae, 2.5%, 12/1/42 | 159,008 |
The accompanying notes are an integral part of these financial statements.
54 Pioneer Bond Fund | Annual Report | 6/30/21
| Principal | |||
| Amount | |||
| USD ($) | Value | ||
| U.S. GOVERNMENT AND AGENCY | |||
| OBLIGATIONS — (continued) | |||
| 131,722 | Fannie Mae, 2.5%, 1/1/43 | $ 137,668 | |
| 53,059 | Fannie Mae, 2.5%, 2/1/43 | 55,014 | |
| 61,258 | Fannie Mae, 2.5%, 2/1/43 | 63,665 | |
| 1,480,225 | Fannie Mae, 2.5%, 2/1/43 | 1,547,049 | |
| 193,827 | Fannie Mae, 2.5%, 3/1/43 | 202,196 | |
| 86,329 | Fannie Mae, 2.5%, 4/1/43 | 89,435 | |
| 163,495 | Fannie Mae, 2.5%, 8/1/43 | 170,670 | |
| 74,600 | Fannie Mae, 2.5%, 12/1/43 | 77,388 | |
| 114,201 | Fannie Mae, 2.5%, 3/1/44 | 118,615 | |
| 96,176 | Fannie Mae, 2.5%, 4/1/45 | 99,814 | |
| 155,109 | Fannie Mae, 2.5%, 4/1/45 | 160,920 | |
| 188,596 | Fannie Mae, 2.5%, 4/1/45 | 195,901 | |
| 246,598 | Fannie Mae, 2.5%, 4/1/45 | 255,508 | |
| 263,355 | Fannie Mae, 2.5%, 4/1/45 | 273,780 | |
| 292,238 | Fannie Mae, 2.5%, 4/1/45 | 303,951 | |
| 774,882 | Fannie Mae, 2.5%, 4/1/45 | 805,979 | |
| 862,981 | Fannie Mae, 2.5%, 4/1/45 | 897,571 | |
| 30,718 | Fannie Mae, 2.5%, 5/1/45 | 31,876 | |
| 63,117 | Fannie Mae, 2.5%, 7/1/45 | 65,656 | |
| 123,364 | Fannie Mae, 2.5%, 8/1/45 | 128,329 | |
| 82,488 | Fannie Mae, 2.5%, 1/1/46 | 85,771 | |
| 188,000,000 | Fannie Mae, 2.5%, 7/1/51 (TBA) | 194,572,657 | |
| 37,000,000 | Fannie Mae, 2.5%, 8/1/51 (TBA) | 38,219,844 | |
| 1,823,469 | Fannie Mae, 3.0%, 10/1/30 | 1,930,859 | |
| 678,164 | Fannie Mae, 3.0%, 4/1/31 | 717,688 | |
| 262,272 | Fannie Mae, 3.0%, 6/1/40 | 275,153 | |
| 10,679,555 | Fannie Mae, 3.0%, 8/1/42 | 11,399,346 | |
| 2,505,941 | Fannie Mae, 3.0%, 9/1/42 | 2,671,200 | |
| 3,826,616 | Fannie Mae, 3.0%, 5/1/43 | 4,050,129 | |
| 337,232 | Fannie Mae, 3.0%, 7/1/43 | 358,644 | |
| 770,438 | Fannie Mae, 3.0%, 8/1/43 | 817,016 | |
| 2,340,649 | Fannie Mae, 3.0%, 9/1/43 | 2,484,228 | |
| 423,285 | Fannie Mae, 3.0%, 3/1/45 | 447,279 | |
| 4,201,603 | Fannie Mae, 3.0%, 6/1/45 | 4,498,782 | |
| 728,499 | Fannie Mae, 3.0%, 7/1/45 | 765,144 | |
| 1,680,662 | Fannie Mae, 3.0%, 3/1/47 | 1,772,938 | |
| 394,001 | Fannie Mae, 3.0%, 8/1/49 | 411,368 | |
| 14,500 | Fannie Mae, 3.0%, 9/1/49 | 15,154 | |
| 1,177,264 | Fannie Mae, 3.0%, 9/1/49 | 1,230,902 | |
| 1,314,498 | Fannie Mae, 3.0%, 9/1/49 | 1,377,588 | |
| 769,366 | Fannie Mae, 3.0%, 12/1/49 | 804,147 | |
| 20,656 | Fannie Mae, 3.0%, 4/1/50 | 21,568 | |
| 2,340,935 | Fannie Mae, 3.0%, 5/1/50 | 2,441,394 |
The accompanying notes are an integral part of these financial statements.
Pioneer Bond Fund | Annual Report | 6/30/21 55
Schedule of Investments | 6/30/21 (continued)
| Principal | |||
| Amount | |||
| USD ($) | Value | ||
| U.S. GOVERNMENT AND AGENCY | |||
| OBLIGATIONS — (continued) | |||
| 8,904,652 | Fannie Mae, 3.0%, 6/1/50 | $ 9,289,796 | |
| 2,627,078 | Fannie Mae, 3.0%, 7/1/50 | 2,738,162 | |
| 576,139 | Fannie Mae, 3.0%, 8/1/50 | 600,450 | |
| 56,000,000 | Fannie Mae, 3.0%, 7/1/51 (TBA) | 58,386,563 | |
| 31,000,000 | Fannie Mae, 3.0%, 8/1/51 (TBA) | 32,300,547 | |
| 1,557,358 | Fannie Mae, 3.5%, 6/1/28 | 1,682,992 | |
| 458,313 | Fannie Mae, 3.5%, 11/1/40 | 493,591 | |
| 335,177 | Fannie Mae, 3.5%, 10/1/41 | 366,118 | |
| 2,418,540 | Fannie Mae, 3.5%, 11/1/41 | 2,606,313 | |
| 277,390 | Fannie Mae, 3.5%, 6/1/42 | 301,007 | |
| 1,318,341 | Fannie Mae, 3.5%, 7/1/42 | 1,420,834 | |
| 1,448,171 | Fannie Mae, 3.5%, 8/1/42 | 1,560,548 | |
| 179,525 | Fannie Mae, 3.5%, 10/1/42 | 188,640 | |
| 138,839 | Fannie Mae, 3.5%, 11/1/42 | 151,424 | |
| 259,744 | Fannie Mae, 3.5%, 12/1/42 | 282,308 | |
| 316,859 | Fannie Mae, 3.5%, 12/1/42 | 345,563 | |
| 832,828 | Fannie Mae, 3.5%, 4/1/45 | 899,956 | |
| 2,862,010 | Fannie Mae, 3.5%, 6/1/45 | 3,079,014 | |
| 4,948,609 | Fannie Mae, 3.5%, 8/1/45 | 5,437,875 | |
| 2,415,523 | Fannie Mae, 3.5%, 9/1/45 | 2,586,045 | |
| 4,476,724 | Fannie Mae, 3.5%, 9/1/45 | 4,854,912 | |
| 687,051 | Fannie Mae, 3.5%, 10/1/45 | 740,000 | |
| 7,242,890 | Fannie Mae, 3.5%, 11/1/45 | 7,959,005 | |
| 1,747,324 | Fannie Mae, 3.5%, 5/1/46 | 1,897,213 | |
| 252,586 | Fannie Mae, 3.5%, 10/1/46 | 272,057 | |
| 2,212,812 | Fannie Mae, 3.5%, 1/1/47 | 2,351,329 | |
| 4,014,930 | Fannie Mae, 3.5%, 1/1/47 | 4,357,931 | |
| 5,291,334 | Fannie Mae, 3.5%, 1/1/47 | 5,692,165 | |
| 53,782 | Fannie Mae, 3.5%, 2/1/47 | 58,043 | |
| 159,488 | Fannie Mae, 3.5%, 7/1/47 | 171,462 | |
| 147,063 | Fannie Mae, 3.5%, 10/1/47 | 158,749 | |
| 360,106 | Fannie Mae, 3.5%, 12/1/47 | 395,626 | |
| 3,913,237 | Fannie Mae, 3.5%, 12/1/47 | 4,148,250 | |
| 70,521 | Fannie Mae, 3.5%, 2/1/49 | 74,072 | |
| 65,068 | Fannie Mae, 3.5%, 4/1/49 | 67,290 | |
| 1,095,763 | Fannie Mae, 3.5%, 5/1/49 | 1,197,208 | |
| 1,680,911 | Fannie Mae, 3.5%, 5/1/49 | 1,845,670 | |
| 43,177 | Fannie Mae, 3.5%, 7/1/49 | 46,778 | |
| 57,000,000 | Fannie Mae, 3.5%, 7/1/51 (TBA) | 60,011,426 | |
| 14,000,000 | Fannie Mae, 3.5%, 8/1/51 (TBA) | 14,748,398 | |
| 4,862 | Fannie Mae, 4.0%, 10/1/25 | 5,171 | |
| 120,055 | Fannie Mae, 4.0%, 11/1/34 | 130,810 |
The accompanying notes are an integral part of these financial statements.
56 Pioneer Bond Fund | Annual Report | 6/30/21
| Principal | |||
| Amount | |||
| USD ($) | Value | ||
| U.S. GOVERNMENT AND AGENCY | |||
| OBLIGATIONS — (continued) | |||
| 1,103,711 | Fannie Mae, 4.0%, 4/1/39 | $ 1,213,417 | |
| 3,796,934 | Fannie Mae, 4.0%, 10/1/40 | 4,234,016 | |
| 686,890 | Fannie Mae, 4.0%, 12/1/40 | 765,960 | |
| 534,402 | Fannie Mae, 4.0%, 4/1/41 | 583,958 | |
| 459,120 | Fannie Mae, 4.0%, 5/1/41 | 504,710 | |
| 543,827 | Fannie Mae, 4.0%, 10/1/41 | 592,479 | |
| 353,493 | Fannie Mae, 4.0%, 12/1/41 | 388,691 | |
| 147,817 | Fannie Mae, 4.0%, 1/1/42 | 161,012 | |
| 1,130,840 | Fannie Mae, 4.0%, 1/1/42 | 1,237,894 | |
| 935,068 | Fannie Mae, 4.0%, 2/1/42 | 1,018,697 | |
| 2,768,272 | Fannie Mae, 4.0%, 2/1/42 | 3,030,010 | |
| 312,418 | Fannie Mae, 4.0%, 4/1/42 | 343,524 | |
| 1,062,478 | Fannie Mae, 4.0%, 4/1/42 | 1,161,261 | |
| 1,686,247 | Fannie Mae, 4.0%, 5/1/42 | 1,837,213 | |
| 57,377 | Fannie Mae, 4.0%, 6/1/42 | 62,076 | |
| 148,048 | Fannie Mae, 4.0%, 6/1/42 | 160,667 | |
| 114,532 | Fannie Mae, 4.0%, 7/1/42 | 125,981 | |
| 2,960,617 | Fannie Mae, 4.0%, 8/1/42 | 3,249,074 | |
| 263,126 | Fannie Mae, 4.0%, 10/1/42 | 290,683 | |
| 697,560 | Fannie Mae, 4.0%, 10/1/42 | 767,133 | |
| 1,619,302 | Fannie Mae, 4.0%, 11/1/43 | 1,782,490 | |
| 35,966 | Fannie Mae, 4.0%, 1/1/44 | 39,176 | |
| 67,759 | Fannie Mae, 4.0%, 6/1/45 | 72,795 | |
| 294,536 | Fannie Mae, 4.0%, 7/1/45 | 323,906 | |
| 433,276 | Fannie Mae, 4.0%, 4/1/46 | 467,937 | |
| 1,918,834 | Fannie Mae, 4.0%, 7/1/46 | 2,067,573 | |
| 3,099,720 | Fannie Mae, 4.0%, 7/1/46 | 3,351,598 | |
| 1,595,450 | Fannie Mae, 4.0%, 8/1/46 | 1,720,088 | |
| 1,830,271 | Fannie Mae, 4.0%, 8/1/46 | 1,972,967 | |
| 785,631 | Fannie Mae, 4.0%, 11/1/46 | 846,835 | |
| 1,627,057 | Fannie Mae, 4.0%, 4/1/47 | 1,766,698 | |
| 2,106,586 | Fannie Mae, 4.0%, 4/1/47 | 2,277,225 | |
| 241,351 | Fannie Mae, 4.0%, 6/1/47 | 260,096 | |
| 718,951 | Fannie Mae, 4.0%, 6/1/47 | 777,236 | |
| 1,049,047 | Fannie Mae, 4.0%, 6/1/47 | 1,129,670 | |
| 1,604,017 | Fannie Mae, 4.0%, 6/1/47 | 1,726,784 | |
| 858,753 | Fannie Mae, 4.0%, 7/1/47 | 919,599 | |
| 1,257,496 | Fannie Mae, 4.0%, 7/1/47 | 1,362,300 | |
| 2,403,019 | Fannie Mae, 4.0%, 12/1/47 | 2,569,097 | |
| 287,122 | Fannie Mae, 4.0%, 11/1/48 | 315,541 | |
| 190,823 | Fannie Mae, 4.0%, 6/1/49 | 207,898 | |
| 44,000,000 | Fannie Mae, 4.0%, 7/1/51 (TBA) | 46,865,156 | |
| 78,450 | Fannie Mae, 4.5%, 10/1/35 | 86,406 |
The accompanying notes are an integral part of these financial statements.
Pioneer Bond Fund | Annual Report | 6/30/21 57
Schedule of Investments | 6/30/21 (continued)
| Principal | |||
| Amount | |||
| USD ($) | Value | ||
| U.S. GOVERNMENT AND AGENCY | |||
| OBLIGATIONS — (continued) | |||
| 229,210 | Fannie Mae, 4.5%, 8/1/40 | $ 252,613 | |
| 737,619 | Fannie Mae, 4.5%, 11/1/40 | 820,362 | |
| 286,803 | Fannie Mae, 4.5%, 2/1/41 | 320,094 | |
| 685,903 | Fannie Mae, 4.5%, 4/1/41 | 762,046 | |
| 28,917 | Fannie Mae, 4.5%, 5/1/41 | 31,925 | |
| 1,251,482 | Fannie Mae, 4.5%, 5/1/41 | 1,392,148 | |
| 1,664,442 | Fannie Mae, 4.5%, 5/1/41 | 1,858,184 | |
| 663,310 | Fannie Mae, 4.5%, 7/1/41 | 740,190 | |
| 1,814,413 | Fannie Mae, 4.5%, 1/1/42 | 2,021,922 | |
| 2,135,385 | Fannie Mae, 4.5%, 1/1/42 | 2,371,787 | |
| 1,386,718 | Fannie Mae, 4.5%, 12/1/43 | 1,530,304 | |
| 359,140 | Fannie Mae, 4.5%, 1/1/47 | 394,106 | |
| 292,090 | Fannie Mae, 4.5%, 2/1/47 | 317,232 | |
| 15,773,027 | Fannie Mae, 4.5%, 5/1/49 | 17,251,220 | |
| 164,561 | Fannie Mae, 4.5%, 6/1/49 | 177,476 | |
| 2,137,906 | Fannie Mae, 4.5%, 2/1/50 | 2,318,470 | |
| 1,879,591 | Fannie Mae, 4.5%, 4/1/50 | 2,056,236 | |
| 11,098,782 | Fannie Mae, 4.5%, 4/1/50 | 12,037,581 | |
| 173,000,000 | Fannie Mae, 4.5%, 7/1/51 (TBA) | 186,238,555 | |
| 21,000,000 | Fannie Mae, 4.5%, 8/1/51 (TBA) | 22,626,680 | |
| 454 | Fannie Mae, 5.0%, 2/1/22 | 472 | |
| 4,906 | Fannie Mae, 5.0%, 2/1/22 | 5,105 | |
| 1,397 | Fannie Mae, 5.0%, 9/1/22 | 1,454 | |
| 15,172 | Fannie Mae, 5.0%, 3/1/23 | 15,801 | |
| 45,911 | Fannie Mae, 5.0%, 5/1/23 | 47,838 | |
| 30,767 | Fannie Mae, 5.0%, 7/1/34 | 33,142 | |
| 126,068 | Fannie Mae, 5.0%, 10/1/34 | 142,654 | |
| 355,555 | Fannie Mae, 5.0%, 2/1/39 | 406,428 | |
| 220,713 | Fannie Mae, 5.0%, 6/1/40 | 251,676 | |
| 274,077 | Fannie Mae, 5.0%, 6/1/40 | 314,548 | |
| 190,926 | Fannie Mae, 5.0%, 7/1/40 | 213,478 | |
| 274,326 | Fannie Mae, 5.0%, 7/1/40 | 310,735 | |
| 418,378 | Fannie Mae, 5.0%, 7/1/40 | 479,912 | |
| 374,855 | Fannie Mae, 5.0%, 8/1/40 | 430,207 | |
| 1,244,569 | Fannie Mae, 5.0%, 2/1/41 | 1,412,499 | |
| 4,662,550 | Fannie Mae, 5.0%, 12/1/44 | 5,343,743 | |
| 403,827 | Fannie Mae, 5.0%, 6/1/49 | 442,437 | |
| 1,012,179 | Fannie Mae, 5.0%, 9/1/49 | 1,142,095 | |
| 4,646,407 | Fannie Mae, 5.0%, 9/1/49 | 5,333,171 | |
| 241,985 | Fannie Mae, 5.0%, 10/1/49 | 265,507 | |
| 6,526 | Fannie Mae, 5.5%, 6/1/33 | 7,398 | |
| 41,184 | Fannie Mae, 5.5%, 7/1/33 | 47,508 |
The accompanying notes are an integral part of these financial statements.
58 Pioneer Bond Fund | Annual Report | 6/30/21
| Principal | ||||
| Amount | ||||
| USD ($) | Value | |||
| U.S. GOVERNMENT AND AGENCY | ||||
| OBLIGATIONS — (continued) | ||||
| 255,428 | Fannie Mae, 5.5%, 7/1/34 | $ 295,950 | ||
| 9,635 | Fannie Mae, 5.5%, 10/1/35 | 11,125 | ||
| 81,764 | Fannie Mae, 5.5%, 3/1/36 | 92,897 | ||
| 66,410 | Fannie Mae, 5.5%, 5/1/36 | 75,736 | ||
| 75,112 | Fannie Mae, 5.5%, 6/1/36 | 87,064 | ||
| 30,736 | Fannie Mae, 5.72%, 11/1/28 | 31,119 | ||
| 18,634 | Fannie Mae, 5.72%, 6/1/29 | 18,713 | ||
| 10,667 | Fannie Mae, 5.9%, 11/1/27 | 10,712 | ||
| 54,226 | Fannie Mae, 5.9%, 4/1/28 | 56,269 | ||
| 375 | Fannie Mae, 6.0%, 9/1/29 | 428 | ||
| 1,294 | Fannie Mae, 6.0%, 1/1/32 | 1,472 | ||
| 6,144 | Fannie Mae, 6.0%, 2/1/32 | 7,267 | ||
| 2,521 | Fannie Mae, 6.0%, 3/1/32 | 2,985 | ||
| 1,618 | Fannie Mae, 6.0%, 8/1/32 | 1,920 | ||
| 223 | Fannie Mae, 6.0%, 9/1/32 | 265 | ||
| 19,843 | Fannie Mae, 6.0%, 10/1/32 | 23,496 | ||
| 4,842 | Fannie Mae, 6.0%, 2/1/33 | 5,438 | ||
| 33,268 | Fannie Mae, 6.0%, 3/1/33 | 39,500 | ||
| 26,777 | Fannie Mae, 6.0%, 4/1/33 | 30,084 | ||
| 48,862 | Fannie Mae, 6.0%, 7/1/33 | 54,908 | ||
| 16,375 | Fannie Mae, 6.0%, 11/1/33 | 19,426 | ||
| 55,936 | Fannie Mae, 6.0%, 8/1/34 | 64,435 | ||
| 2,041 | Fannie Mae, 6.0%, 9/1/34 | 2,380 | ||
| 12,763 | Fannie Mae, 6.0%, 9/1/34 | 14,457 | ||
| 13,899 | Fannie Mae, 6.0%, 9/1/34 | 16,500 | ||
| 40,204 | Fannie Mae, 6.0%, 9/1/34 | 45,125 | ||
| 5,570 | Fannie Mae, 6.0%, 10/1/34 | 6,614 | ||
| 5,394 | Fannie Mae, 6.0%, 11/1/34 | 6,406 | ||
| 35,157 | Fannie Mae, 6.0%, 11/1/34 | 39,508 | ||
| 1,779 | Fannie Mae, 6.0%, 2/1/35 | 2,113 | ||
| 3,671 | Fannie Mae, 6.0%, 2/1/35 | 4,359 | ||
| 78,808 | Fannie Mae, 6.0%, 4/1/35 | 90,934 | ||
| 16,361 | Fannie Mae, 6.0%, 5/1/35 | 18,411 | ||
| 74,838 | Fannie Mae, 6.0%, 10/1/35 | 83,963 | ||
| 109,015 | Fannie Mae, 6.0%, 12/1/35 | 123,867 | ||
| 9,633 | Fannie Mae, 6.0%, 12/1/37 | 11,388 | ||
| 93,973 | Fannie Mae, 6.0%, 6/1/38 | 110,961 | ||
| 21,141 | Fannie Mae, 6.0%, 7/1/38 | 23,900 | ||
| 5,023 | Fannie Mae, 6.5%, 7/1/29 | 5,629 | ||
| 513 | Fannie Mae, 6.5%, 1/1/31 | 575 | ||
| 329 | Fannie Mae, 6.5%, 4/1/31 | 369 | ||
| 2,112 | Fannie Mae, 6.5%, 5/1/31 | 2,367 | ||
| 2,369 | Fannie Mae, 6.5%, 9/1/31 | 2,654 | ||
The accompanying notes are an integral part of these financial statements.
Pioneer Bond Fund | Annual Report | 6/30/21 59
Schedule of Investments | 6/30/21 (continued)
| Principal | |||
| Amount | |||
| USD ($) | Value | ||
| U.S. GOVERNMENT AND AGENCY | |||
| OBLIGATIONS — (continued) | |||
| 2,508 | Fannie Mae, 6.5%, 9/1/31 | $ 2,810 | |
| 1,517 | Fannie Mae, 6.5%, 10/1/31 | 1,700 | |
| 62,241 | Fannie Mae, 6.5%, 12/1/31 | 69,746 | |
| 3,760 | Fannie Mae, 6.5%, 2/1/32 | 4,214 | |
| 15,608 | Fannie Mae, 6.5%, 3/1/32 | 17,490 | |
| 46,342 | Fannie Mae, 6.5%, 7/1/32 | 51,930 | |
| 57,247 | Fannie Mae, 6.5%, 10/1/32 | 64,150 | |
| 11,693 | Fannie Mae, 6.5%, 7/1/34 | 13,103 | |
| 53,357 | Fannie Mae, 6.5%, 11/1/37 | 63,766 | |
| 13,965 | Fannie Mae, 6.5%, 11/1/47 | 15,104 | |
| 146 | Fannie Mae, 7.0%, 12/1/30 | 146 | |
| 3,657 | Fannie Mae, 7.0%, 12/1/30 | 4,033 | |
| 3,422 | Fannie Mae, 7.0%, 4/1/31 | 3,975 | |
| 4,344 | Fannie Mae, 7.0%, 9/1/31 | 5,120 | |
| 12,526 | Fannie Mae, 7.0%, 12/1/31 | 12,914 | |
| 9,072 | Fannie Mae, 7.0%, 1/1/32 | 10,759 | |
| 1,116,470 | Federal Home Loan Mortgage Corp., 3.0%, 10/1/29 | 1,180,991 | |
| 713,283 | Federal Home Loan Mortgage Corp., 3.0%, 9/1/42 | 760,631 | |
| 3,833,633 | Federal Home Loan Mortgage Corp., 3.0%, 11/1/42 | 4,088,300 | |
| 500,809 | Federal Home Loan Mortgage Corp., 3.0%, 2/1/43 | 536,554 | |
| 1,256,708 | Federal Home Loan Mortgage Corp., 3.0%, 2/1/43 | 1,346,448 | |
| 1,481,467 | Federal Home Loan Mortgage Corp., 3.0%, 5/1/43 | 1,579,741 | |
| 3,250,777 | Federal Home Loan Mortgage Corp., 3.0%, 6/1/46 | 3,466,215 | |
| 843,415 | Federal Home Loan Mortgage Corp., 3.0%, 12/1/46 | 897,738 | |
| 1,074,620 | Federal Home Loan Mortgage Corp., 3.0%, 12/1/46 | 1,136,646 | |
| 3,754,202 | Federal Home Loan Mortgage Corp., 3.0%, 2/1/47 | 3,962,489 | |
| 626,224 | Federal Home Loan Mortgage Corp., 3.0%, 3/1/47 | 658,945 | |
| 565,597 | Federal Home Loan Mortgage Corp., 3.5%, 4/1/42 | 608,400 | |
| 1,492,398 | Federal Home Loan Mortgage Corp., 3.5%, 8/1/43 | 1,617,909 | |
| 266,983 | Federal Home Loan Mortgage Corp., 3.5%, 9/1/44 | 289,525 | |
| 3,672,827 | Federal Home Loan Mortgage Corp., 3.5%, 6/1/45 | 3,989,026 | |
| 114,106 | Federal Home Loan Mortgage Corp., 3.5%, 7/1/45 | 124,040 | |
| 3,221,709 | Federal Home Loan Mortgage Corp., 3.5%, 10/1/45 | 3,499,086 | |
| 3,205,774 | Federal Home Loan Mortgage Corp., 3.5%, 11/1/45 | 3,449,904 | |
| 3,630,276 | Federal Home Loan Mortgage Corp., 3.5%, 7/1/46 | 3,973,397 | |
| 4,530,413 | Federal Home Loan Mortgage Corp., 3.5%, 8/1/46 | 4,897,065 | |
| 4,834,685 | Federal Home Loan Mortgage Corp., 3.5%, 8/1/46 | 5,250,951 | |
| 5,216,946 | Federal Home Loan Mortgage Corp., 3.5%, 8/1/46 | 5,638,734 | |
| 6,294,484 | Federal Home Loan Mortgage Corp., 3.5%, 12/1/46 | 6,836,590 | |
| 757,301 | Federal Home Loan Mortgage Corp., 3.5%, 1/1/47 | 817,450 | |
| 347,290 | Federal Home Loan Mortgage Corp., 3.5%, 6/1/47 | 374,643 | |
| 5,524,345 | Federal Home Loan Mortgage Corp., 4.0%, 11/1/41 | 6,162,099 | |
| 90,040 | Federal Home Loan Mortgage Corp., 4.0%, 6/1/42 | 98,131 |
The accompanying notes are an integral part of these financial statements.
60 Pioneer Bond Fund | Annual Report | 6/30/21
| Principal | |||
| Amount | |||
| USD ($) | Value | ||
| U.S. GOVERNMENT AND AGENCY | |||
| OBLIGATIONS — (continued) | |||
| 42,596 | Federal Home Loan Mortgage Corp., 4.0%, 7/1/42 | $ 46,429 | |
| 1,798,547 | Federal Home Loan Mortgage Corp., 4.0%, 10/1/42 | 1,960,214 | |
| 28,998 | Federal Home Loan Mortgage Corp., 4.0%, 11/1/42 | 31,606 | |
| 214,001 | Federal Home Loan Mortgage Corp., 4.0%, 5/1/46 | 230,305 | |
| 432,658 | Federal Home Loan Mortgage Corp., 4.0%, 5/1/46 | 470,120 | |
| 1,613,122 | Federal Home Loan Mortgage Corp., 4.0%, 6/1/46 | 1,739,653 | |
| 2,122,589 | Federal Home Loan Mortgage Corp., 4.0%, 7/1/46 | 2,289,934 | |
| 1,537,589 | Federal Home Loan Mortgage Corp., 4.0%, 8/1/46 | 1,659,190 | |
| 53,253 | Federal Home Loan Mortgage Corp., 4.0%, 10/1/46 | 56,726 | |
| 585,466 | Federal Home Loan Mortgage Corp., 4.0%, 3/1/47 | 627,871 | |
| 1,043,227 | Federal Home Loan Mortgage Corp., 4.0%, 4/1/47 | 1,135,098 | |
| 1,390,063 | Federal Home Loan Mortgage Corp., 4.0%, 4/1/47 | 1,512,308 | |
| 2,628,745 | Federal Home Loan Mortgage Corp., 4.0%, 4/1/47 | 2,826,509 | |
| 2,675,818 | Federal Home Loan Mortgage Corp., 4.0%, 4/1/47 | 2,894,021 | |
| 3,011,327 | Federal Home Loan Mortgage Corp., 4.0%, 4/1/47 | 3,235,302 | |
| 2,615,471 | Federal Home Loan Mortgage Corp., 4.0%, 5/1/47 | 2,806,475 | |
| 465,328 | Federal Home Loan Mortgage Corp., 4.0%, 6/1/47 | 500,632 | |
| 676,246 | Federal Home Loan Mortgage Corp., 4.0%, 7/1/47 | 727,034 | |
| 2,227,433 | Federal Home Loan Mortgage Corp., 4.0%, 10/1/47 | 2,381,686 | |
| 407,444 | Federal Home Loan Mortgage Corp., 4.0%, 5/1/49 | 433,961 | |
| 1,133,435 | Federal Home Loan Mortgage Corp., 4.5%, 11/1/40 | 1,261,355 | |
| 685,734 | Federal Home Loan Mortgage Corp., 4.5%, 3/1/42 | 756,802 | |
| 73,498 | Federal Home Loan Mortgage Corp., 4.5%, 11/1/43 | 81,854 | |
| 495,769 | Federal Home Loan Mortgage Corp., 4.5%, 6/1/49 | 535,944 | |
| 436,224 | Federal Home Loan Mortgage Corp., 4.5%, 7/1/49 | 469,862 | |
| 3,055,609 | Federal Home Loan Mortgage Corp., 4.5%, 7/1/49 | 3,303,057 | |
| 1,884,417 | Federal Home Loan Mortgage Corp., 4.5%, 8/1/49 | 2,037,570 | |
| 35 | Federal Home Loan Mortgage Corp., 5.0%, 12/1/21 | 36 | |
| 5,367 | Federal Home Loan Mortgage Corp., 5.0%, 11/1/34 | 6,161 | |
| 49,904 | Federal Home Loan Mortgage Corp., 5.0%, 6/1/35 | 54,834 | |
| 143,889 | Federal Home Loan Mortgage Corp., 5.0%, 9/1/38 | 165,060 | |
| 139,632 | Federal Home Loan Mortgage Corp., 5.0%, 10/1/38 | 160,167 | |
| 1,213 | Federal Home Loan Mortgage Corp., 5.0%, 5/1/39 | 1,393 | |
| 2,714 | Federal Home Loan Mortgage Corp., 5.0%, 12/1/39 | 3,117 | |
| 1,954,892 | Federal Home Loan Mortgage Corp., 5.0%, 9/1/49 | 2,141,016 | |
| 630,940 | Federal Home Loan Mortgage Corp., 5.0%, 10/1/49 | 692,305 | |
| 4,677,257 | Federal Home Loan Mortgage Corp., 5.0%, 10/1/49 | 5,130,077 | |
| 7,844,564 | Federal Home Loan Mortgage Corp., 5.0%, 12/1/49 | 8,598,955 | |
| 89,781 | Federal Home Loan Mortgage Corp., 5.5%, 9/1/33 | 103,696 | |
| 5,038 | Federal Home Loan Mortgage Corp., 5.5%, 1/1/34 | 5,823 | |
| 4,350 | Federal Home Loan Mortgage Corp., 5.5%, 11/1/34 | 4,849 | |
| 44,624 | Federal Home Loan Mortgage Corp., 5.5%, 11/1/34 | 51,765 | |
| 50,398 | Federal Home Loan Mortgage Corp., 5.5%, 8/1/35 | 56,600 |
The accompanying notes are an integral part of these financial statements.
Pioneer Bond Fund | Annual Report | 6/30/21 61
Schedule of Investments | 6/30/21 (continued)
| Principal | |||
| Amount | |||
| USD ($) | Value | ||
| U.S. GOVERNMENT AND AGENCY | |||
| OBLIGATIONS — (continued) | |||
| 16,498 | Federal Home Loan Mortgage Corp., 5.5%, 11/1/35 | $ 19,139 | |
| 502,314 | Federal Home Loan Mortgage Corp., 5.5%, 6/1/41 | 583,764 | |
| 13,571 | Federal Home Loan Mortgage Corp., 6.0%, 1/1/33 | 15,234 | |
| 36,407 | Federal Home Loan Mortgage Corp., 6.0%, 1/1/33 | 41,400 | |
| 1,473 | Federal Home Loan Mortgage Corp., 6.0%, 2/1/33 | 1,664 | |
| 20,644 | Federal Home Loan Mortgage Corp., 6.0%, 2/1/33 | 24,413 | |
| 9,010 | Federal Home Loan Mortgage Corp., 6.0%, 3/1/33 | 10,115 | |
| 65,192 | Federal Home Loan Mortgage Corp., 6.0%, 3/1/33 | 77,438 | |
| 48,788 | Federal Home Loan Mortgage Corp., 6.0%, 9/1/33 | 57,957 | |
| 5,763 | Federal Home Loan Mortgage Corp., 6.0%, 11/1/33 | 6,609 | |
| 20,513 | Federal Home Loan Mortgage Corp., 6.0%, 11/1/33 | 23,509 | |
| 7,497 | Federal Home Loan Mortgage Corp., 6.0%, 12/1/33 | 8,416 | |
| 34,427 | Federal Home Loan Mortgage Corp., 6.0%, 12/1/33 | 38,659 | |
| 13,575 | Federal Home Loan Mortgage Corp., 6.0%, 1/1/34 | 16,126 | |
| 29,961 | Federal Home Loan Mortgage Corp., 6.0%, 1/1/34 | 33,924 | |
| 28,751 | Federal Home Loan Mortgage Corp., 6.0%, 5/1/34 | 32,282 | |
| 189,260 | Federal Home Loan Mortgage Corp., 6.0%, 5/1/34 | 224,829 | |
| 13,490 | Federal Home Loan Mortgage Corp., 6.0%, 4/1/35 | 15,154 | |
| 40,839 | Federal Home Loan Mortgage Corp., 6.0%, 6/1/35 | 45,861 | |
| 43,781 | Federal Home Loan Mortgage Corp., 6.0%, 4/1/36 | 49,525 | |
| 4,889 | Federal Home Loan Mortgage Corp., 6.0%, 7/1/36 | 5,809 | |
| 28,634 | Federal Home Loan Mortgage Corp., 6.0%, 7/1/36 | 32,192 | |
| 12,206 | Federal Home Loan Mortgage Corp., 6.0%, 12/1/36 | 13,994 | |
| 26,456 | Federal Home Loan Mortgage Corp., 6.0%, 1/1/38 | 31,329 | |
| 40,893 | Federal Home Loan Mortgage Corp., 6.0%, 7/1/38 | 47,079 | |
| 190 | Federal Home Loan Mortgage Corp., 6.5%, 11/1/30 | 212 | |
| 270 | Federal Home Loan Mortgage Corp., 6.5%, 3/1/31 | 303 | |
| 1,025 | Federal Home Loan Mortgage Corp., 6.5%, 3/1/31 | 1,150 | |
| 3,381 | Federal Home Loan Mortgage Corp., 6.5%, 5/1/31 | 3,846 | |
| 4,128 | Federal Home Loan Mortgage Corp., 6.5%, 5/1/31 | 4,627 | |
| 295 | Federal Home Loan Mortgage Corp., 6.5%, 8/1/31 | 337 | |
| 3,141 | Federal Home Loan Mortgage Corp., 6.5%, 8/1/31 | 3,522 | |
| 5,523 | Federal Home Loan Mortgage Corp., 6.5%, 7/1/32 | 6,378 | |
| 57 | Federal Home Loan Mortgage Corp., 6.5%, 1/1/33 | 64 | |
| 15,953 | Federal Home Loan Mortgage Corp., 6.5%, 10/1/33 | 18,749 | |
| 2,814 | Federal Home Loan Mortgage Corp., 7.0%, 8/1/22 | 2,834 | |
| 8,067 | Federal Home Loan Mortgage Corp., 7.0%, 9/1/22 | 8,126 | |
| 1,350 | Federal Home Loan Mortgage Corp., 7.0%, 11/1/30 | 1,551 | |
| 70,880 | Federal Home Loan Mortgage Corp., 7.0%, 10/1/46 | 73,741 | |
| 45,000,000 | Federal National Mortgage Association, 4.0%, | ||
8/1/51 (TBA) | 47,968,945 | ||
| 198,292 | Freddie Mac Pool, 3.0%, 2/1/38 | 206,734 | |
| 69,940 | Freddie Mac Pool, 3.0%, 10/1/48 | 73,042 |
The accompanying notes are an integral part of these financial statements.
62 Pioneer Bond Fund | Annual Report | 6/30/21
| Principal | |||
| Amount | |||
| USD ($) | Value | ||
| U.S. GOVERNMENT AND AGENCY | |||
| OBLIGATIONS — (continued) | |||
| 541,746 | Freddie Mac Pool, 3.0%, 10/1/49 | $ 565,295 | |
| 323,128 | Freddie Mac Pool, 3.0%, 11/1/49 | 339,609 | |
| 25,353 | Freddie Mac Pool, 3.0%, 4/1/50 | 26,486 | |
| 109,372 | Freddie Mac Pool, 3.0%, 9/1/50 | 114,091 | |
| 518,363 | Freddie Mac Pool, 4.5%, 11/1/48 | 559,756 | |
| 13,500,000 | Government National Mortgage Association, 2.0%, | ||
7/1/51 (TBA) | 13,760,508 | ||
| 90,000,000 | Government National Mortgage Association, 2.5%, | ||
7/1/51 (TBA) | 93,160,547 | ||
| 8,000,000 | Government National Mortgage Association, 2.5%, | ||
8/1/51 (TBA) | 8,266,250 | ||
| 3,000,000 | Government National Mortgage Association, 4.5%, | ||
12/30/99 (TBA) | 3,196,875 | ||
| 42,000,000 | Government National Mortgage Association, 3.0%, | ||
8/1/51 (TBA) | 43,801,406 | ||
| 3,740,532 | Government National Mortgage Association I, | ||
3.5%, 11/15/41 | 4,022,316 | ||
| 2,600,668 | Government National Mortgage Association I, | ||
3.5%, 7/15/42 | 2,777,662 | ||
| 450,587 | Government National Mortgage Association I, | ||
3.5%, 10/15/42 | 480,613 | ||
| 594,421 | Government National Mortgage Association I, | ||
3.5%, 1/15/44 | 659,757 | ||
| 2,986,019 | Government National Mortgage Association I, | ||
3.5%, 1/15/45 | 3,184,779 | ||
| 1,067,250 | Government National Mortgage Association I, | ||
3.5%, 8/15/46 | 1,131,927 | ||
| 6,762 | Government National Mortgage Association I, | ||
4.0%, 5/15/39 | 7,255 | ||
| 1,498 | Government National Mortgage Association I, | ||
4.0%, 6/15/39 | 1,649 | ||
| 2,079 | Government National Mortgage Association I, | ||
4.0%, 8/15/40 | 2,276 | ||
| 140,411 | Government National Mortgage Association I, | ||
4.0%, 8/15/40 | 150,873 | ||
| 2,802 | Government National Mortgage Association I, | ||
4.0%, 9/15/40 | 3,109 | ||
| 2,751 | Government National Mortgage Association I, | ||
4.0%, 10/15/40 | 3,037 | ||
| 5,519 | Government National Mortgage Association I, | ||
4.0%, 11/15/40 | 5,918 | ||
| 9,696 | Government National Mortgage Association I, | ||
4.0%, 11/15/40 | 10,522 | ||
| 24,392 | Government National Mortgage Association I, | ||
4.0%, 11/15/40 | 26,740 | ||
| 9,352 | Government National Mortgage Association I, | ||
4.0%, 1/15/41 | 10,374 |
The accompanying notes are an integral part of these financial statements.
Pioneer Bond Fund | Annual Report | 6/30/21 63
Schedule of Investments | 6/30/21 (continued)
| Principal | |||
| Amount | |||
| USD ($) | Value | ||
| U.S. GOVERNMENT AND AGENCY | |||
| OBLIGATIONS — (continued) | |||
| 29,233 | Government National Mortgage Association I, | ||
4.0%, 1/15/41 | $ 32,101 | ||
| 4,412 | Government National Mortgage Association I, | ||
4.0%, 2/15/41 | 4,894 | ||
| 25,121 | Government National Mortgage Association I, | ||
4.0%, 6/15/41 | 27,201 | ||
| 57,836 | Government National Mortgage Association I, | ||
4.0%, 7/15/41 | 64,050 | ||
| 138,832 | Government National Mortgage Association I, | ||
4.0%, 9/15/41 | 152,456 | ||
| 4,790 | Government National Mortgage Association I, | ||
4.0%, 10/15/41 | 5,224 | ||
| 5,010 | Government National Mortgage Association I, | ||
4.0%, 10/15/41 | 5,368 | ||
| 1,518 | Government National Mortgage Association I, | ||
4.0%, 11/15/41 | 1,628 | ||
| 2,325 | Government National Mortgage Association I, | ||
4.0%, 11/15/41 | 2,536 | ||
| 2,321 | Government National Mortgage Association I, | ||
4.0%, 12/15/41 | 2,575 | ||
| 14,168 | Government National Mortgage Association I, | ||
4.0%, 2/15/42 | 15,708 | ||
| 385,075 | Government National Mortgage Association I, | ||
4.0%, 8/15/43 | 422,158 | ||
| 8,292 | Government National Mortgage Association I, | ||
4.0%, 11/15/43 | 8,897 | ||
| 4,566 | Government National Mortgage Association I, | ||
4.0%, 3/15/44 | 5,043 | ||
| 39,725 | Government National Mortgage Association I, | ||
4.0%, 3/15/44 | 43,039 | ||
| 245,203 | Government National Mortgage Association I, | ||
4.0%, 3/15/44 | 270,649 | ||
| 1,288,156 | Government National Mortgage Association I, | ||
4.0%, 3/15/44 | 1,414,630 | ||
| 3,106 | Government National Mortgage Association I, | ||
4.0%, 4/15/44 | 3,332 | ||
| 7,851 | Government National Mortgage Association I, | ||
4.0%, 4/15/44 | 8,607 | ||
| 882,112 | Government National Mortgage Association I, | ||
4.0%, 4/15/44 | 968,718 | ||
| 167,828 | Government National Mortgage Association I, | ||
4.0%, 8/15/44 | 184,308 | ||
| 30,318 | Government National Mortgage Association I, | ||
4.0%, 9/15/44 | 33,589 | ||
| 60,465 | Government National Mortgage Association I, | ||
4.0%, 9/15/44 | 64,937 | ||
| 90,416 | Government National Mortgage Association I, | ||
4.0%, 9/15/44 | 97,998 |
The accompanying notes are an integral part of these financial statements.
64 Pioneer Bond Fund | Annual Report | 6/30/21
| Principal | |||
| Amount | |||
| USD ($) | Value | ||
| U.S. GOVERNMENT AND AGENCY | |||
| OBLIGATIONS — (continued) | |||
| 282,106 | Government National Mortgage Association I, | ||
4.0%, 9/15/44 | $ 311,508 | ||
| 847,656 | Government National Mortgage Association I, | ||
4.0%, 9/15/44 | 940,382 | ||
| 31,525 | Government National Mortgage Association I, | ||
4.0%, 10/15/44 | 33,872 | ||
| 193,753 | Government National Mortgage Association I, | ||
4.0%, 11/15/44 | 213,561 | ||
| 837,053 | Government National Mortgage Association I, | ||
4.0%, 12/15/44 | 923,755 | ||
| 244,761 | Government National Mortgage Association I, | ||
4.0%, 1/15/45 | 271,512 | ||
| 394,241 | Government National Mortgage Association I, | ||
4.0%, 1/15/45 | 422,628 | ||
| 761,781 | Government National Mortgage Association I, | ||
4.0%, 1/15/45 | 831,760 | ||
| 509,283 | Government National Mortgage Association I, | ||
4.0%, 2/15/45 | 549,932 | ||
| 646,267 | Government National Mortgage Association I, | ||
4.0%, 2/15/45 | 700,674 | ||
| 27,503 | Government National Mortgage Association I, | ||
4.0%, 3/15/45 | 29,494 | ||
| 1,075,308 | Government National Mortgage Association I, | ||
4.0%, 3/15/45 | 1,172,804 | ||
| 1,125,808 | Government National Mortgage Association I, | ||
4.0%, 4/15/45 | 1,234,251 | ||
| 902,582 | Government National Mortgage Association I, | ||
4.0%, 5/15/45 | 998,842 | ||
| 1,880,651 | Government National Mortgage Association I, | ||
4.0%, 6/15/45 | 2,074,744 | ||
| 275,141 | Government National Mortgage Association I, | ||
4.0%, 7/15/45 | 303,559 | ||
| 318,021 | Government National Mortgage Association I, | ||
4.0%, 8/15/45 | 351,824 | ||
| 47,681 | Government National Mortgage Association I, | ||
4.5%, 6/15/25 | 49,960 | ||
| 24,640 | Government National Mortgage Association I, | ||
4.5%, 7/15/33 | 27,626 | ||
| 84,886 | Government National Mortgage Association I, | ||
4.5%, 9/15/33 | 95,408 | ||
| 74,640 | Government National Mortgage Association I, | ||
4.5%, 10/15/33 | 82,807 | ||
| 97,926 | Government National Mortgage Association I, | ||
4.5%, 10/15/33 | 110,568 | ||
| 8,225 | Government National Mortgage Association I, | ||
4.5%, 2/15/34 | 9,131 | ||
| 13,533 | Government National Mortgage Association I, | ||
4.5%, 3/15/35 | 15,015 |
The accompanying notes are an integral part of these financial statements.
Pioneer Bond Fund | Annual Report | 6/30/21 65
Schedule of Investments | 6/30/21 (continued)
| Principal | ||||
| Amount | ||||
| USD ($) | Value | |||
| U.S. GOVERNMENT AND AGENCY | ||||
| OBLIGATIONS — (continued) | ||||
| 19,778 | Government National Mortgage Association I, | |||
| 4.5%, 3/15/35 | $ 21,920 | |||
| 79,684 | Government National Mortgage Association I, | |||
| 4.5%, 4/15/35 | 89,508 | |||
| 35,690 | Government National Mortgage Association I, | |||
| 4.5%, 10/15/35 | 40,156 | |||
| 42,631 | Government National Mortgage Association I, | |||
| 4.5%, 4/15/38 | 47,323 | |||
| 497,462 | Government National Mortgage Association I, | |||
| 4.5%, 12/15/39 | 558,920 | |||
| 178,595 | Government National Mortgage Association I, | |||
| 4.5%, 1/15/40 | 203,019 | |||
| 76,744 | Government National Mortgage Association I, | |||
| 4.5%, 9/15/40 | 86,097 | |||
| 377,115 | Government National Mortgage Association I, | |||
4.5%, 10/15/40 | 425,844 | |||
| 177,408 | Government National Mortgage Association I, | |||
| 4.5%, 4/15/41 | 198,129 | |||
| 360,245 | Government National Mortgage Association I, | |||
| 4.5%, 5/15/41 | 404,158 | |||
| 225,033 | Government National Mortgage Association I, | |||
| 4.5%, 6/15/41 | 253,350 | |||
| 156,252 | Government National Mortgage Association I, | |||
| 4.5%, 7/15/41 | 176,487 | |||
| 153,453 | Government National Mortgage Association I, | |||
| 4.5%, 8/15/41 | 173,314 | |||
| 28,570 | Government National Mortgage Association I, | |||
| 5.0%, 7/15/33 | 32,496 | |||
| 32,971 | Government National Mortgage Association I, | |||
| 5.0%, 9/15/33 | 38,172 | |||
| 34,118 | Government National Mortgage Association I, | |||
| 5.0%, 4/15/34 | 39,461 | |||
| 220,069 | Government National Mortgage Association I, | |||
| 5.0%, 4/15/35 | 255,749 | |||
| 78,868 | Government National Mortgage Association I, | |||
| 5.0%, 7/15/40 | 91,269 | |||
| 35,380 | Government National Mortgage Association I, | |||
| 5.5%, 1/15/29 | 39,510 | |||
| 5,106 | Government National Mortgage Association I, | |||
| 5.5%, 6/15/33 | 5,757 | |||
| 27,327 | Government National Mortgage Association I, | |||
| 5.5%, 7/15/33 | 31,837 | |||
| 29,340 | Government National Mortgage Association I, | |||
| 5.5%, 7/15/33 | 34,042 | |||
| 8,835 | Government National Mortgage Association I, | |||
| 5.5%, 8/15/33 | 10,293 | |||
| 14,731 | Government National Mortgage Association I, | |||
| 5.5%, 8/15/33 | 17,090 | |||
The accompanying notes are an integral part of these financial statements.
66 Pioneer Bond Fund | Annual Report | 6/30/21
| Principal | ||||
| Amount | ||||
| USD ($) | Value | |||
| U.S. GOVERNMENT AND AGENCY | ||||
| OBLIGATIONS — (continued) | ||||
| 37,949 | Government National Mortgage Association I, | |||
5.5%, 8/15/33 | $ 42,608 | |||
| 23,083 | Government National Mortgage Association I, | |||
5.5%, 9/15/33 | 25,798 | |||
| 27,878 | Government National Mortgage Association I, | |||
5.5%, 9/15/33 | 31,213 | |||
| 25,391 | Government National Mortgage Association I, | |||
5.5%, 10/15/33 | 28,484 | |||
| 28,415 | Government National Mortgage Association I, | |||
5.5%, 10/15/33 | 33,119 | |||
| 136,724 | Government National Mortgage Association I, | |||
5.5%, 7/15/34 | 159,306 | |||
| 19,198 | Government National Mortgage Association I, | |||
5.5%, 10/15/34 | 21,763 | |||
| 210,105 | Government National Mortgage Association I, | |||
5.5%, 11/15/34 | 245,848 | |||
| 73,005 | Government National Mortgage Association I, | |||
5.5%, 1/15/35 | 84,785 | |||
| 11,626 | Government National Mortgage Association I, | |||
5.5%, 2/15/35 | 13,149 | |||
| 32,732 | Government National Mortgage Association I, | |||
5.5%, 2/15/35 | 36,586 | |||
| 26,689 | Government National Mortgage Association I, | |||
5.5%, 6/15/35 | 29,818 | |||
| 182,314 | Government National Mortgage Association I, | |||
5.5%, 7/15/35 | 212,884 | |||
| 20,775 | Government National Mortgage Association I, | |||
5.5%, 10/15/35 | 23,830 | |||
| 55,349 | Government National Mortgage Association I, | |||
5.5%, 10/15/35 | 63,786 | |||
| 17,407 | Government National Mortgage Association I, | |||
5.5%, 2/15/37 | 20,467 | |||
| 37,942 | Government National Mortgage Association I, | |||
6.0%, 12/15/23 | 39,992 | |||
| 2,891 | Government National Mortgage Association I, | |||
6.0%, 1/15/24 | 3,234 | |||
| 15,556 | Government National Mortgage Association I, | |||
6.0%, 4/15/28 | 17,856 | |||
| 80,466 | Government National Mortgage Association I, | |||
6.0%, 9/15/28 | 91,583 | |||
| 3,462 | Government National Mortgage Association I, | |||
6.0%, 10/15/28 | 3,891 | |||
| 25,964 | Government National Mortgage Association I, | |||
6.0%, 2/15/29 | 29,190 | |||
| 27,870 | Government National Mortgage Association I, | |||
6.0%, 2/15/29 | 32,278 | |||
| 9,380 | Government National Mortgage Association I, | |||
6.0%, 11/15/31 | 10,965 | |||
The accompanying notes are an integral part of these financial statements.
Pioneer Bond Fund | Annual Report | 6/30/21 67
Schedule of Investments | 6/30/21 (continued)
| Principal | ||||
| Amount | ||||
| USD ($) | Value | |||
| U.S. GOVERNMENT AND AGENCY | ||||
| OBLIGATIONS — (continued) | ||||
| 705 | Government National Mortgage Association I, | |||
6.0%, 3/15/32 | $ 825 | |||
| 2,776 | Government National Mortgage Association I, | |||
6.0%, 8/15/32 | 3,302 | |||
| 18,259 | Government National Mortgage Association I, | |||
6.0%, 9/15/32 | 20,486 | |||
| 61,264 | Government National Mortgage Association I, | |||
6.0%, 9/15/32 | 68,694 | |||
| 73,799 | Government National Mortgage Association I, | |||
6.0%, 9/15/32 | 82,743 | |||
| 5,206 | Government National Mortgage Association I, | |||
6.0%, 10/15/32 | 5,836 | |||
| 15,731 | Government National Mortgage Association I, | |||
6.0%, 10/15/32 | 17,817 | |||
| 3,450 | Government National Mortgage Association I, | |||
6.0%, 11/15/32 | 3,873 | |||
| 5,112 | Government National Mortgage Association I, | |||
6.0%, 11/15/32 | 5,739 | |||
| 6,362 | Government National Mortgage Association I, | |||
6.0%, 12/15/32 | 7,175 | |||
| 6,575 | Government National Mortgage Association I, | |||
6.0%, 12/15/32 | 7,536 | |||
| 30,509 | Government National Mortgage Association I, | |||
6.0%, 12/15/32 | 34,179 | |||
| 36,758 | Government National Mortgage Association I, | |||
6.0%, 12/15/32 | 41,299 | |||
| 87,426 | Government National Mortgage Association I, | |||
6.0%, 12/15/32 | 98,020 | |||
| 124,958 | Government National Mortgage Association I, | |||
6.0%, 12/15/32 | 140,200 | |||
| 157,308 | Government National Mortgage Association I, | |||
6.0%, 12/15/32 | 177,306 | |||
| 16,393 | Government National Mortgage Association I, | |||
6.0%, 1/15/33 | 18,435 | |||
| 73,160 | Government National Mortgage Association I, | |||
6.0%, 1/15/33 | 87,066 | |||
| 13,238 | Government National Mortgage Association I, | |||
6.0%, 2/15/33 | 15,757 | |||
| 44,133 | Government National Mortgage Association I, | |||
6.0%, 2/15/33 | 49,552 | |||
| 46,312 | Government National Mortgage Association I, | |||
6.0%, 2/15/33 | 53,781 | |||
| 68,485 | Government National Mortgage Association I, | |||
6.0%, 2/15/33 | 78,494 | |||
| 12,755 | Government National Mortgage Association I, | |||
6.0%, 3/15/33 | 14,285 | |||
| 22,341 | Government National Mortgage Association I, | |||
6.0%, 3/15/33 | 25,386 | |||
The accompanying notes are an integral part of these financial statements.
68 Pioneer Bond Fund | Annual Report | 6/30/21
| Principal | ||||
| Amount | ||||
| USD ($) | Value | |||
| U.S. GOVERNMENT AND AGENCY | ||||
| OBLIGATIONS — (continued) | ||||
| 42,395 | Government National Mortgage Association I, | |||
6.0%, 3/15/33 | $ 47,663 | |||
| 52,068 | Government National Mortgage Association I, | |||
6.0%, 3/15/33 | 61,976 | |||
| 52,732 | Government National Mortgage Association I, | |||
6.0%, 3/15/33 | 62,728 | |||
| 71,214 | Government National Mortgage Association I, | |||
6.0%, 3/15/33 | 84,018 | |||
| 104,423 | Government National Mortgage Association I, | |||
6.0%, 3/15/33 | 124,192 | |||
| 223,332 | Government National Mortgage Association I, | |||
6.0%, 3/15/33 | 264,294 | |||
| 5,205 | Government National Mortgage Association I, | |||
6.0%, 4/15/33 | 5,837 | |||
| 9,336 | Government National Mortgage Association I, | |||
6.0%, 4/15/33 | 10,463 | |||
| 23,512 | Government National Mortgage Association I, | |||
6.0%, 4/15/33 | 26,442 | |||
| 49,677 | Government National Mortgage Association I, | |||
6.0%, 5/15/33 | 55,872 | |||
| 5,208 | Government National Mortgage Association I, | |||
6.0%, 6/15/33 | 6,190 | |||
| 2,232 | Government National Mortgage Association I, | |||
6.0%, 9/15/33 | 2,503 | |||
| 6,357 | Government National Mortgage Association I, | |||
6.0%, 9/15/33 | 7,127 | |||
| 29,770 | Government National Mortgage Association I, | |||
6.0%, 9/15/33 | 35,425 | |||
| 19,297 | Government National Mortgage Association I, | |||
6.0%, 10/15/33 | 22,110 | |||
| 40,491 | Government National Mortgage Association I, | |||
6.0%, 11/15/33 | 45,411 | |||
| 96,300 | Government National Mortgage Association I, | |||
6.0%, 3/15/34 | 111,815 | |||
| 22,176 | Government National Mortgage Association I, | |||
6.0%, 6/15/34 | 26,180 | |||
| 15,071 | Government National Mortgage Association I, | |||
6.0%, 8/15/34 | 17,760 | |||
| 38,887 | Government National Mortgage Association I, | |||
6.0%, 8/15/34 | 43,605 | |||
| 7,566 | Government National Mortgage Association I, | |||
6.0%, 9/15/34 | 8,564 | |||
| 32,516 | Government National Mortgage Association I, | |||
6.0%, 9/15/34 | 36,510 | |||
| 64,311 | Government National Mortgage Association I, | |||
6.0%, 9/15/34 | 76,260 | |||
| 38,455 | Government National Mortgage Association I, | |||
6.0%, 10/15/34 | 43,379 | |||
The accompanying notes are an integral part of these financial statements.
Pioneer Bond Fund | Annual Report | 6/30/21 69
Schedule of Investments | 6/30/21 (continued)
| Principal | ||||
| Amount | ||||
| USD ($) | Value | |||
| U.S. GOVERNMENT AND AGENCY | ||||
| OBLIGATIONS — (continued) | ||||
| 41,520 | Government National Mortgage Association I, | |||
6.0%, 10/15/34 | $ 46,623 | |||
| 86,264 | Government National Mortgage Association I, | |||
6.0%, 10/15/34 | 96,823 | |||
| 62,686 | Government National Mortgage Association I, | |||
6.0%, 11/15/34 | 71,836 | |||
| 330,193 | Government National Mortgage Association I, | |||
6.0%, 9/15/35 | 388,566 | |||
| 99,623 | Government National Mortgage Association I, | |||
6.0%, 8/15/36 | 118,532 | |||
| 48,349 | Government National Mortgage Association I, | |||
6.0%, 10/15/36 | 56,488 | |||
| 18,842 | Government National Mortgage Association I, | |||
6.0%, 11/15/37 | 22,403 | |||
| 12,566 | Government National Mortgage Association I, | |||
6.0%, 8/15/38 | 14,141 | |||
| 4,903 | Government National Mortgage Association I, | |||
6.5%, 10/15/24 | 5,195 | |||
| 4,685 | Government National Mortgage Association I, | |||
6.5%, 4/15/28 | 5,225 | |||
| 25,318 | Government National Mortgage Association I, | |||
6.5%, 4/15/28 | 28,235 | |||
| 3,895 | Government National Mortgage Association I, | |||
6.5%, 6/15/28 | 4,426 | |||
| 2,968 | Government National Mortgage Association I, | |||
6.5%, 8/15/28 | 3,311 | |||
| 1,748 | Government National Mortgage Association I, | |||
6.5%, 10/15/28 | 1,950 | |||
| 5,506 | Government National Mortgage Association I, | |||
6.5%, 10/15/28 | 6,141 | |||
| 15,676 | Government National Mortgage Association I, | |||
6.5%, 1/15/29 | 17,483 | |||
| 742 | Government National Mortgage Association I, | |||
6.5%, 2/15/29 | 828 | |||
| 3,232 | Government National Mortgage Association I, | |||
6.5%, 2/15/29 | 3,604 | |||
| 5,632 | Government National Mortgage Association I, | |||
6.5%, 2/15/29 | 6,281 | |||
| 1,973 | Government National Mortgage Association I, | |||
6.5%, 3/15/29 | 2,200 | |||
| 2,112 | Government National Mortgage Association I, | |||
6.5%, 3/15/29 | 2,355 | |||
| 5,084 | Government National Mortgage Association I, | |||
6.5%, 3/15/29 | 5,670 | |||
| 11,856 | Government National Mortgage Association I, | |||
6.5%, 3/15/29 | 13,222 | |||
| 32,338 | Government National Mortgage Association I, | |||
6.5%, 3/15/29 | 36,065 | |||
The accompanying notes are an integral part of these financial statements.
70 Pioneer Bond Fund | Annual Report | 6/30/21
| Principal | ||||
| Amount | ||||
| USD ($) | Value | |||
| U.S. GOVERNMENT AND AGENCY | ||||
| OBLIGATIONS — (continued) | ||||
| 817 | Government National Mortgage Association I, | |||
6.5%, 5/15/29 | $ 911 | |||
| 828 | Government National Mortgage Association I, | |||
6.5%, 5/15/29 | 923 | |||
| 24,980 | Government National Mortgage Association I, | |||
6.5%, 5/15/29 | 28,591 | |||
| 23,603 | Government National Mortgage Association I, | |||
6.5%, 4/15/31 | 26,690 | |||
| 6,650 | Government National Mortgage Association I, | |||
6.5%, 5/15/31 | 7,770 | |||
| 6,939 | Government National Mortgage Association I, | |||
6.5%, 5/15/31 | 8,119 | |||
| 30,694 | Government National Mortgage Association I, | |||
6.5%, 5/15/31 | 34,325 | |||
| 4,058 | Government National Mortgage Association I, | |||
6.5%, 6/15/31 | 4,547 | |||
| 10,431 | Government National Mortgage Association I, | |||
6.5%, 7/15/31 | 11,633 | |||
| 21,808 | Government National Mortgage Association I, | |||
6.5%, 8/15/31 | 24,493 | |||
| 8,980 | Government National Mortgage Association I, | |||
6.5%, 9/15/31 | 10,015 | |||
| 3,527 | Government National Mortgage Association I, | |||
6.5%, 10/15/31 | 3,933 | |||
| 3,539 | Government National Mortgage Association I, | |||
6.5%, 10/15/31 | 3,947 | |||
| 35,924 | Government National Mortgage Association I, | |||
6.5%, 10/15/31 | 40,064 | |||
| 2,332 | Government National Mortgage Association I, | |||
6.5%, 11/15/31 | 2,600 | |||
| 35,310 | Government National Mortgage Association I, | |||
6.5%, 11/15/31 | 39,379 | |||
| 11,898 | Government National Mortgage Association I, | |||
6.5%, 1/15/32 | 13,269 | |||
| 52,965 | Government National Mortgage Association I, | |||
6.5%, 1/15/32 | 60,610 | |||
| 2,573 | Government National Mortgage Association I, | |||
6.5%, 2/15/32 | 2,870 | |||
| 8,811 | Government National Mortgage Association I, | |||
6.5%, 2/15/32 | 10,079 | |||
| 9,331 | Government National Mortgage Association I, | |||
6.5%, 2/15/32 | 10,899 | |||
| 14,784 | Government National Mortgage Association I, | |||
6.5%, 2/15/32 | 17,312 | |||
| 16,242 | Government National Mortgage Association I, | |||
6.5%, 2/15/32 | 18,113 | |||
| 8,052 | Government National Mortgage Association I, | |||
6.5%, 3/15/32 | 8,980 | |||
The accompanying notes are an integral part of these financial statements.
Pioneer Bond Fund | Annual Report | 6/30/21 71
Schedule of Investments | 6/30/21 (continued)
| Principal | ||||
| Amount | ||||
| USD ($) | Value | |||
| U.S. GOVERNMENT AND AGENCY | ||||
| OBLIGATIONS — (continued) | ||||
| 44,656 | Government National Mortgage Association I, | |||
6.5%, 3/15/32 | $ 49,802 | |||
| 175 | Government National Mortgage Association I, | |||
6.5%, 4/15/32 | 195 | |||
| 5,616 | Government National Mortgage Association I, | |||
6.5%, 4/15/32 | 6,328 | |||
| 7,428 | Government National Mortgage Association I, | |||
6.5%, 4/15/32 | 8,358 | |||
| 21,576 | Government National Mortgage Association I, | |||
6.5%, 4/15/32 | 25,220 | |||
| 2,423 | Government National Mortgage Association I, | |||
6.5%, 5/15/32 | 2,702 | |||
| 2,559 | Government National Mortgage Association I, | |||
6.5%, 5/15/32 | 2,854 | |||
| 3,052 | Government National Mortgage Association I, | |||
6.5%, 5/15/32 | 3,404 | |||
| 4,797 | Government National Mortgage Association I, | |||
6.5%, 5/15/32 | 5,599 | |||
| 7,834 | Government National Mortgage Association I, | |||
6.5%, 6/15/32 | 8,851 | |||
| 8,347 | Government National Mortgage Association I, | |||
6.5%, 6/15/32 | 9,309 | |||
| 7,209 | Government National Mortgage Association I, | |||
6.5%, 7/15/32 | 8,040 | |||
| 8,082 | Government National Mortgage Association I, | |||
6.5%, 7/15/32 | 9,070 | |||
| 72,545 | Government National Mortgage Association I, | |||
6.5%, 7/15/32 | 85,925 | |||
| 3,118 | Government National Mortgage Association I, | |||
6.5%, 8/15/32 | 3,536 | |||
| 17,009 | Government National Mortgage Association I, | |||
6.5%, 8/15/32 | 19,744 | |||
| 27,384 | Government National Mortgage Association I, | |||
6.5%, 8/15/32 | 30,838 | |||
| 11,181 | Government National Mortgage Association I, | |||
6.5%, 9/15/32 | 12,915 | |||
| 29,956 | Government National Mortgage Association I, | |||
6.5%, 9/15/32 | 33,890 | |||
| 30,044 | Government National Mortgage Association I, | |||
6.5%, 9/15/32 | 33,507 | |||
| 16,140 | Government National Mortgage Association I, | |||
6.5%, 10/15/32 | 18,000 | |||
| 25,058 | Government National Mortgage Association I, | |||
6.5%, 11/15/32 | 29,556 | |||
| 149,666 | Government National Mortgage Association I, | |||
6.5%, 12/15/32 | 175,555 | |||
| 1,627 | Government National Mortgage Association I, | |||
6.5%, 1/15/33 | 1,892 | |||
The accompanying notes are an integral part of these financial statements.
72 Pioneer Bond Fund | Annual Report | 6/30/21
| Principal | ||||
| Amount | ||||
| USD ($) | Value | |||
| U.S. GOVERNMENT AND AGENCY | ||||
| OBLIGATIONS — (continued) | ||||
| 161,700 | Government National Mortgage Association I, | |||
6.5%, 1/15/33 | $ 190,564 | |||
| 16,477 | Government National Mortgage Association I, | |||
6.5%, 5/15/33 | 18,376 | |||
| 1,290 | Government National Mortgage Association I, | |||
6.5%, 10/15/33 | 1,455 | |||
| 94,071 | Government National Mortgage Association I, | |||
6.5%, 6/15/34 | 106,715 | |||
| 33,637 | Government National Mortgage Association I, | |||
6.5%, 4/15/35 | 37,513 | |||
| 5,490 | Government National Mortgage Association I, | |||
6.5%, 6/15/35 | 6,122 | |||
| 15,474 | Government National Mortgage Association I, | |||
6.5%, 7/15/35 | 17,258 | |||
| 55,569 | Government National Mortgage Association I, | |||
6.5%, 7/15/35 | 61,973 | |||
| 4,608 | Government National Mortgage Association I, | |||
7.0%, 8/15/23 | 4,795 | |||
| 15,787 | Government National Mortgage Association I, | |||
7.0%, 9/15/24 | 16,786 | |||
| 5,193 | Government National Mortgage Association I, | |||
7.0%, 7/15/25 | 5,469 | |||
| 2,727 | Government National Mortgage Association I, | |||
7.0%, 11/15/26 | 3,001 | |||
| 6,348 | Government National Mortgage Association I, | |||
7.0%, 6/15/27 | 7,027 | |||
| 7,314 | Government National Mortgage Association I, | |||
7.0%, 1/15/28 | 8,045 | |||
| 6,492 | Government National Mortgage Association I, | |||
7.0%, 2/15/28 | 6,757 | |||
| 3,511 | Government National Mortgage Association I, | |||
7.0%, 4/15/28 | 3,525 | |||
| 7,434 | Government National Mortgage Association I, | |||
7.0%, 7/15/28 | 8,211 | |||
| 560 | Government National Mortgage Association I, | |||
7.0%, 8/15/28 | 622 | |||
| 6,898 | Government National Mortgage Association I, | |||
7.0%, 11/15/28 | 7,967 | |||
| 20,796 | Government National Mortgage Association I, | |||
7.0%, 11/15/28 | 23,866 | |||
| 16,079 | Government National Mortgage Association I, | |||
7.0%, 4/15/29 | 17,492 | |||
| 16,619 | Government National Mortgage Association I, | |||
7.0%, 4/15/29 | 17,161 | |||
| 17,306 | Government National Mortgage Association I, | |||
7.0%, 5/15/29 | 17,623 | |||
| 4,436 | Government National Mortgage Association I, | |||
7.0%, 7/15/29 | 4,871 | |||
The accompanying notes are an integral part of these financial statements.
Pioneer Bond Fund | Annual Report | 6/30/21 73
Schedule of Investments | 6/30/21 (continued)
| Principal | ||||
| Amount | ||||
| USD ($) | Value | |||
| U.S. GOVERNMENT AND AGENCY | ||||
| OBLIGATIONS — (continued) | ||||
| 32,366 | Government National Mortgage Association I, | |||
7.0%, 11/15/29 | $ 35,864 | |||
| 626 | Government National Mortgage Association I, | |||
7.0%, 12/15/30 | 628 | |||
| 1,478 | Government National Mortgage Association I, | |||
7.0%, 12/15/30 | 1,501 | |||
| 15,697 | Government National Mortgage Association I, | |||
7.0%, 12/15/30 | 18,237 | |||
| 30,344 | Government National Mortgage Association I, | |||
7.0%, 12/15/30 | 30,779 | |||
| 34,304 | Government National Mortgage Association I, | |||
7.0%, 1/15/31 | 34,722 | |||
| 4,249 | Government National Mortgage Association I, | |||
7.0%, 3/15/31 | 4,364 | |||
| 12,293 | Government National Mortgage Association I, | |||
7.0%, 6/15/31 | 14,580 | |||
| 1,503 | Government National Mortgage Association I, | |||
7.0%, 7/15/31 | 1,767 | |||
| 74,592 | Government National Mortgage Association I, | |||
7.0%, 8/15/31 | 88,556 | |||
| 8,323 | Government National Mortgage Association I, | |||
7.0%, 9/15/31 | 8,699 | |||
| 17,872 | Government National Mortgage Association I, | |||
7.0%, 9/15/31 | 20,083 | |||
| 6,593 | Government National Mortgage Association I, | |||
7.0%, 11/15/31 | 6,903 | |||
| 35,607 | Government National Mortgage Association I, | |||
7.0%, 3/15/32 | 40,166 | |||
| 29,134 | Government National Mortgage Association I, | |||
7.0%, 4/15/32 | 32,869 | |||
| 43,938 | Government National Mortgage Association I, | |||
7.0%, 5/15/32 | 53,043 | |||
| 1,026 | Government National Mortgage Association I, | |||
7.5%, 3/15/23 | 1,036 | |||
| 9,030 | Government National Mortgage Association I, | |||
7.5%, 10/15/23 | 9,469 | |||
| 681 | Government National Mortgage Association I, | |||
7.5%, 6/15/24 | 690 | |||
| 5,188 | Government National Mortgage Association I, | |||
7.5%, 8/15/25 | 5,210 | |||
| 1,505 | Government National Mortgage Association I, | |||
7.5%, 9/15/25 | 1,617 | |||
| 3,597 | Government National Mortgage Association I, | |||
7.5%, 2/15/27 | 3,664 | |||
| 14,523 | Government National Mortgage Association I, | |||
7.5%, 3/15/27 | 16,501 | |||
| 23,979 | Government National Mortgage Association I, | |||
7.5%, 10/15/27 | 26,562 | |||
The accompanying notes are an integral part of these financial statements.
74 Pioneer Bond Fund | Annual Report | 6/30/21
| Principal | |||
| Amount | |||
| USD ($) | Value | ||
| U.S. GOVERNMENT AND AGENCY | |||
| OBLIGATIONS — (continued) | |||
| 10,926 | Government National Mortgage Association I, | ||
7.5%, 6/15/29 | $ 12,185 | ||
| 2,079 | Government National Mortgage Association I, | ||
7.5%, 8/15/29 | 2,108 | ||
| 5,998 | Government National Mortgage Association I, | ||
7.5%, 8/15/29 | 6,024 | ||
| 10,235 | Government National Mortgage Association I, | ||
7.5%, 9/15/29 | 10,279 | ||
| 11,547 | Government National Mortgage Association I, | ||
7.5%, 2/15/31 | 11,663 | ||
| 12,783 | Government National Mortgage Association I, | ||
7.5%, 2/15/31 | 13,233 | ||
| 5,508 | Government National Mortgage Association I, | ||
7.5%, 3/15/31 | 5,688 | ||
| 16,892 | Government National Mortgage Association I, | ||
7.5%, 12/15/31 | 17,603 | ||
| 1,735 | Government National Mortgage Association I, | ||
7.75%, 2/15/30 | 1,758 | ||
| 369 | Government National Mortgage Association I, | ||
9.0%, 6/15/22 | 373 | ||
| 15,500,000 | Government National Mortgage Association II, | ||
2.0%, 8/1/51 (TBA) | 15,770,645 | ||
| 250,215 | Government National Mortgage Association II, | ||
3.5%, 3/20/45 | 265,445 | ||
| 294,843 | Government National Mortgage Association II, | ||
3.5%, 4/20/45 | 315,665 | ||
| 376,417 | Government National Mortgage Association II, | ||
3.5%, 4/20/45 | 400,915 | ||
| 712,076 | Government National Mortgage Association II, | ||
3.5%, 4/20/45 | 765,158 | ||
| 897,860 | Government National Mortgage Association II, | ||
3.5%, 3/20/46 | 972,731 | ||
| 3,051,102 | Government National Mortgage Association II, | ||
4.0%, 7/20/44 | 3,336,069 | ||
| 109,601 | Government National Mortgage Association II, | ||
4.0%, 9/20/44 | 119,767 | ||
| 736,266 | Government National Mortgage Association II, | ||
4.0%, 10/20/44 | 803,236 | ||
| 2,448,762 | Government National Mortgage Association II, | ||
4.0%, 10/20/46 | 2,645,779 | ||
| 1,180,315 | Government National Mortgage Association II, | ||
4.0%, 2/20/48 | 1,293,226 | ||
| 1,459,207 | Government National Mortgage Association II, | ||
4.0%, 4/20/48 | 1,598,806 | ||
| 29,365 | Government National Mortgage Association II, | ||
4.5%, 12/20/34 | 32,468 | ||
| 130,669 | Government National Mortgage Association II, | ||
4.5%, 1/20/35 | 144,576 |
The accompanying notes are an integral part of these financial statements.
Pioneer Bond Fund | Annual Report | 6/30/21 75
Schedule of Investments | 6/30/21 (continued)
| Principal | |||
| Amount | |||
| USD ($) | Value | ||
| U.S. GOVERNMENT AND AGENCY | |||
| OBLIGATIONS — (continued) | |||
| 21,020 | Government National Mortgage Association II, | ||
4.5%, 3/20/35 | $ 23,243 | ||
| 536,464 | Government National Mortgage Association II, | ||
4.5%, 9/20/41 | 593,302 | ||
| 1,892,589 | Government National Mortgage Association II, | ||
4.5%, 9/20/44 | 2,035,726 | ||
| 750,066 | Government National Mortgage Association II, | ||
4.5%, 10/20/44 | 829,391 | ||
| 1,577,256 | Government National Mortgage Association II, | ||
4.5%, 11/20/44 | 1,744,227 | ||
| 2,303,573 | Government National Mortgage Association II, | ||
4.5%, 2/20/48 | 2,455,755 | ||
| 89,120 | Government National Mortgage Association II, | ||
5.5%, 3/20/34 | 104,348 | ||
| 73,395 | Government National Mortgage Association II, | ||
5.5%, 4/20/34 | 85,946 | ||
| 40,513 | Government National Mortgage Association II, | ||
5.5%, 10/20/37 | 44,886 | ||
| 58,195 | Government National Mortgage Association II, | ||
5.75%, 6/20/33 | 64,455 | ||
| 17,884 | Government National Mortgage Association II, | ||
5.9%, 1/20/28 | 19,808 | ||
| 31,676 | Government National Mortgage Association II, | ||
5.9%, 7/20/28 | 34,852 | ||
| 8,695 | Government National Mortgage Association II, | ||
6.0%, 10/20/31 | 9,853 | ||
| 42,098 | Government National Mortgage Association II, | ||
6.0%, 1/20/33 | 49,325 | ||
| 45,697 | Government National Mortgage Association II, | ||
6.0%, 10/20/33 | 53,546 | ||
| 26,863 | Government National Mortgage Association II, | ||
6.0%, 6/20/34 | 31,467 | ||
| 65,001 | Government National Mortgage Association II, | ||
6.45%, 1/20/33 | 71,434 | ||
| 3,590 | Government National Mortgage Association II, | ||
6.5%, 1/20/24 | 3,733 | ||
| 18,172 | Government National Mortgage Association II, | ||
6.5%, 8/20/28 | 20,539 | ||
| 886 | Government National Mortgage Association II, | ||
6.5%, 2/20/29 | 1,014 | ||
| 324 | Government National Mortgage Association II, | ||
6.5%, 3/20/29 | 369 | ||
| 10,944 | Government National Mortgage Association II, | ||
6.5%, 4/20/29 | 12,414 | ||
| 5,884 | Government National Mortgage Association II, | ||
6.5%, 4/20/31 | 6,850 | ||
| 4,166 | Government National Mortgage Association II, | ||
6.5%, 6/20/31 | 4,875 |
The accompanying notes are an integral part of these financial statements.
76 Pioneer Bond Fund | Annual Report | 6/30/21
| Principal | |||
| Amount | |||
| USD ($) | Value | ||
| U.S. GOVERNMENT AND AGENCY | |||
| OBLIGATIONS — (continued) | |||
| 20,248 | Government National Mortgage Association II, | ||
6.5%, 10/20/32 | $ 24,119 | ||
| 28,305 | Government National Mortgage Association II, | ||
6.5%, 3/20/34 | 33,874 | ||
| 2,635 | Government National Mortgage Association II, | ||
7.0%, 5/20/26 | 2,857 | ||
| 8,748 | Government National Mortgage Association II, | ||
7.0%, 8/20/27 | 9,877 | ||
| 8,809 | Government National Mortgage Association II, | ||
7.0%, 6/20/28 | 10,014 | ||
| 31,100 | Government National Mortgage Association II, | ||
7.0%, 11/20/28 | 35,426 | ||
| 33,710 | Government National Mortgage Association II, | ||
7.0%, 1/20/29 | 38,383 | ||
| 2,977 | Government National Mortgage Association II, | ||
7.0%, 2/20/29 | 3,361 | ||
| 887 | Government National Mortgage Association II, | ||
7.0%, 12/20/30 | 1,026 | ||
| 4,795 | Government National Mortgage Association II, | ||
7.0%, 1/20/31 | 5,640 | ||
| 2,482 | Government National Mortgage Association II, | ||
7.0%, 3/20/31 | 2,932 | ||
| 14,875 | Government National Mortgage Association II, | ||
7.0%, 7/20/31 | 17,666 | ||
| 5,489 | Government National Mortgage Association II, | ||
7.0%, 11/20/31 | 6,517 | ||
| 5,668 | Government National Mortgage Association II, | ||
7.5%, 5/20/30 | 6,685 | ||
| 1,753 | Government National Mortgage Association II, | ||
7.5%, 6/20/30 | 2,055 | ||
| 2,477 | Government National Mortgage Association II, | ||
7.5%, 7/20/30 | 2,840 | ||
| 5,209 | Government National Mortgage Association II, | ||
7.5%, 8/20/30 | 6,253 | ||
| 2,922 | Government National Mortgage Association II, | ||
7.5%, 12/20/30 | 3,517 | ||
| 6 | Government National Mortgage Association II, | ||
8.0%, 5/20/25 | 6 | ||
| 359 | Government National Mortgage Association II, | ||
9.0%, 3/20/22 | 360 | ||
| 1,117 | Government National Mortgage Association II, | ||
9.0%, 11/20/24 | 1,122 | ||
| 200,000,000(f) | U.S. Treasury Bills, 7/1/21 | 200,000,000 | |
| 140,000,000(f) | U.S. Treasury Bills, 7/15/21 | 139,997,686 | |
| 150,000,000(f) | U.S. Treasury Bills, 7/27/21 | 149,995,666 | |
| 135,000,000(f) | U.S. Treasury Bills, 8/3/21 | 134,994,258 |
The accompanying notes are an integral part of these financial statements.
Pioneer Bond Fund | Annual Report | 6/30/21 77
Schedule of Investments | 6/30/21 (continued)
| Principal | |||
| Amount | |||
| USD ($) | Value | ||
| U.S. GOVERNMENT AND AGENCY | |||
| OBLIGATIONS — (continued) | |||
| 205,476,400(f) | U.S. Treasury Bills, 8/5/21 | $ 205,467,610 | |
| 150,000,000(f) | U.S. Treasury Bills, 8/12/21 | 149,990,812 | |
| 94,523,600(f) | U.S. Treasury Bills, 8/17/21 | 94,517,923 | |
| 150,000,000(f) | U.S. Treasury Bills, 8/26/21 | 149,990,083 | |
| 58,111,453 | U.S. Treasury Inflation Indexed Bonds, 0.125%, 2/15/51 | 63,945,298 | |
| 18,024,320 | U.S. Treasury Inflation Indexed Bonds, 0.25%, 2/15/50 | 20,435,073 | |
| 34,354,740 | U.S. Treasury Inflation Indexed Bonds, 1.0%, 2/15/48 | 45,878,787 | |
| 54,289,267 | U.S. Treasury Inflation Indexed Bonds, 1.0%, 2/15/49 | 73,198,614 | |
| 44,400,000 | U.S. Treasury Notes, 0.125%, 10/31/22 | 44,379,187 | |
| 31,428,700 | U.S. Treasury Notes, 0.625%, 8/15/30 | 29,303,580 | |
| TOTAL U.S. GOVERNMENT AND AGENCY OBLIGATIONS | |||
(Cost $2,906,669,626) | $ 2,952,044,769 | ||
| TEMPORARY CASH INVESTMENTS — 0.4% | |||
| of Net Assets | |||
| REPURCHASE AGREEMENTS — 0.4% | |||
| 5,390,000 | $5,390,000 RBC Capital Markets LLC, 0.1%, dated | ||
| 06/30/21 plus accrued interest on 7/1/21 | |||
| collateralized by following: | |||
$4,514,883 Freddie Mac Giant, 2-2.5%, 11/1/50-5/1/51. | |||
| $982,925 Federal National Mortgage Association, | |||
| 2.2%, 4/1/35. | $ 5,390,000 | ||
| 5,390,000 | $5,390,000 ScotiaBank, 0.1%, dated 06/30/2021 | ||
| plus accrued interest on 7/1/21 collateralized | |||
| by the following: | |||
| $565 Freddie Mac Giant 2.5%, 8/1/47 | |||
| $83,110 Federal National Mortgage Association, 4%, 1/1/41 | |||
| $5,414,146 U.S. Treasury Bills, 0.0%, 7/8/21. | 5,390,000 | ||
| 6,695,000 | $6,695,000 TD Securities USA LLC, 0.1%, dated 6/30/21 | ||
| plus accrued interest on 7/1/21 collateralized by | |||
$6,829,010 Federal Agricultural Mortgage Corporation, | |||
| 0.2%, 2/12/24. | 6,695,000 | ||
| 6,695,000 | $6,695,000 TD Securities USA LLC, 0.1%, dated 6/30/21 | ||
| plus accrued interest on 7/1/21 collateralized by | |||
| $6,828,910 U.S. Treasury Bond, 1.9%, 2/15/41. | 6,695,000 | ||
| $ 24,170,000 | |||
| TOTAL TEMPORARY CASH INVESTMENTS | |||
(Cost $24,170,000) | $ 24,170,000 | ||
| TOTAL INVESTMENTS IN UNAFFILIATED ISSUERS — 118.9% | |||
(Cost $6,780,711,457) | $ 6,968,079,104 | ||
| OTHER ASSETS AND LIABILITIES — (18.9)% | $(1,110,197,424) | ||
| NET ASSETS — 100.0% | $ 5,857,881,680 |
bps | Basis Points. |
CMT | Constant Maturity Treasury Index. |
FREMF | Freddie Mac Multifamily Fixed-Rate Mortgage Loans. |
The accompanying notes are an integral part of these financial statements.
78 Pioneer Bond Fund | Annual Report | 6/30/21
FRESB | Freddie Mac Multifamily Small Balance Certificates. |
ICE | Intercontinental Exchange. |
LIBOR | London Interbank Offered Rate. |
REIT | Real Estate Investment Trust. |
REMICS | Real Estate Mortgage Investment Conduits. |
SOFRRATE | Secured Overnight Financing Rate. |
(144A) | Security is exempt from registration under Rule 144A of the Securities Act of 1933. Such |
securities may be resold normally to qualified institutional buyers in a transaction exempt | |
from registration. At June 30, 2021, the value of these securities amounted to | |
$2,612,493,201, or 44.6% of net assets. | |
(TBA) | “To Be Announced” Securities. |
† | Amount rounds to less than 0.1%. |
* | Senior secured floating rate loan interests in which the Fund invests generally pay |
interest at rates that are periodically redetermined by reference to a base lending rate | |
plus a premium. These base lending rates are generally (i) the lending rate offered by one | |
or more major European banks, such as LIBOR, (ii) the prime rate offered by one or more | |
major United States banks, (iii) the rate of a certificate of deposit or (iv) other base | |
lending rates used by commercial lenders. The interest rate shown is the rate accruing at | |
June 30, 2021. | |
+ | Security that used significant unobservable inputs to determine its value. |
(a) | Security is perpetual in nature and has no stated maturity date. |
(b) | Floating rate note. Coupon rate, reference index and spread shown at June 30, 2021. |
(c) | The interest rate is subject to change periodically. The interest rate and/or reference |
index and spread shown at June 30, 2021. | |
(d) | Debt obligation initially issued at one coupon which converts to a higher coupon at a |
specific date. The rate shown is the rate at June 30, 2021. | |
(e) | Security represents the interest-only portion payments on a pool of underlying |
mortgages or mortgage-backed securities. | |
(f) | Security issued with a zero coupon. Income is recognized through accretion of discount. |
(g) | Issued as participation notes. |
(h) | Non-income producing security. |
(i) | Issued as preference shares. |
(j) | Consists of Revenue Bonds unless otherwise indicated. |
(k) | This term loan will settle after June 30, 2021, at which time the interest rate will be |
determined. | |
# | Securities are restricted as to resale. |
| Restricted Securities | Acquisition date | Cost | Value |
| Ailsa Re 2019 | 6/4/2019 | $ 2,500,000 | $ 2,673,058 |
| Alturas Re 2019-2 | 12/19/2018 | 34,018 | 46,710 |
| Alturas Re 2019-2 | 12/20/2018 | 2,200 | 5,991 |
| Alturas Re 2019-3 | 6/26/2019 | 24,550 | 19,876 |
| Alturas Re 2020-1A | 12/27/2019 | 285,668 | 115,638 |
| Alturas Re 2020-1B | 1/1/2020 | 363,577 | 147,176 |
| Alturas Re 2020-2 | 1/1/2020 | 540,698 | 649,919 |
| Alturas Re 2020-3 | 8/3/2020 | 225,450 | 228,223 |
| Alturas Re 2021-2 | 2/16/2021 | 3,959,302 | 3,961,678 |
| Ballybunion Re | 12/31/2019 | 8,021,543 | 8,360,445 |
The accompanying notes are an integral part of these financial statements.
Pioneer Bond Fund | Annual Report | 6/30/21 79
Schedule of Investments | 6/30/21 (continued)
| Restricted Securities | Acquisition date | Cost | Value |
| Ballybunion Re 2020-3 | 1/21/2021 | $ 2,254,957 | $ 2,326,597 |
| Bantry Re 2016 | 2/6/2019 | 161,200 | 161,200 |
| Bantry Re 2017 | 2/6/2019 | 87,696 | 87,662 |
| Bantry Re 2018 | 2/6/2019 | 22,757 | 22,800 |
| Bantry Re 2019 | 2/1/2019 | — | 169,818 |
| Bantry Re 2020 | 2/4/2020 | 265,461 | 698,362 |
| Bantry Re 2021 | 1/11/2021 | 5,000,000 | 5,338,700 |
| Berwick Re 2018-1 | 1/10/2018 | 1,680,676 | 979,295 |
| Berwick Re 2019-1 | 12/31/2018 | 870,105 | 870,167 |
| Berwick Re 2020-1 | 9/24/2020 | — | 300 |
| Berwick Re 2021-1 | 12/28/2020 | 4,000,000 | 4,321,718 |
| Bowline Re | 5/10/2018 | 2,000,000 | 2,009,400 |
| Caelus Re V | 4/27/2017 | 100,000 | 50,000 |
| Carnoustie Re 2017 | 1/3/2017 | 1,069,907 | 593,100 |
| Carnoustie Re 2020 | 7/16/2020 | 91,015 | 271,200 |
| Carnoustie Re 2021 | 1/25/2021 | 1,853,719 | 1,917,248 |
| Castle Stuart Re 2018 | 12/20/2017 | 272,877 | 11,310 |
| Cedar Re 2020 | 7/31/2020 | — | 97,545 |
| Denning Re | 11/9/2020 | 2,937,355 | 3,024,808 |
| Dingle Re 2019 | 3/4/2019 | — | 12,315 |
| Dingle Re 2020 | 2/13/2020 | 698,625 | 775,869 |
| Eden Re II | 1/22/2019 | 6,926 | 311,238 |
| Eden Re II | 12/14/2018 | 1,728 | 32,172 |
| Eden Re II | 12/23/2019 | 640,000 | 694,336 |
| Eden Re II | 1/23/2018 | 4,295 | 51,306 |
| Eden Re II | 12/16/2019 | 210,000 | 222,537 |
| Eden Re II | 12/15/2017 | 7,470 | 32,328 |
| Eden Re II, Series B | 1/25/2021 | 7,500,000 | 7,335,750 |
| FloodSmart Re | 4/10/2019 | 250,000 | 243,400 |
| FloodSmart Re, Ltd. | 2/9/2021 | 759,375 | 743,475 |
| FloodSmart Re,Ltd. | 2/16/2021 | 1,250,000 | 1,240,000 |
| Formby Re 2018 | 7/9/2018 | 165,490 | 208,790 |
| Gleneagles Re 2018 | 12/27/2017 | 80,273 | 118,300 |
| Gleneagles Re 2019 | 12/31/2018 | — | 19,818 |
| Gleneagles Re 2020 | 6/16/2020 | 62,160 | 177,250 |
| Gleneagles Re 2021 | 1/13/2021 | 1,250,000 | 1,310,177 |
| Gullane Re 2018 | 3/26/2018 | 218,740 | 361,093 |
| Gullane Re 2021 | 1/13/2021 | 6,000,000 | 6,394,297 |
| Harambee Re 2018 | 12/19/2017 | 100,817 | 5,600 |
| Harambee Re 2019 | 12/20/2018 | — | 25,500 |
| Harambee Re 2020 | 2/27/2020 | 105,737 | 256,800 |
| Herbie Re | 10/19/2020 | 500,000 | 523,950 |
| International Bank for Reconstruction & | |||
Development | 2/28/2020 | 250,000 | 253,600 |
| Limestone Re | 6/20/2018 | 1,101 | 99,165 |
| Limestone Re 2016-1 | 12/15/2016 | 6,765 | 4,612 |
| Limestone Re 2016-1 | 12/15/2016 | 2,310 | 1,575 |
| Limestone Re 2018 | 6/20/2018 | 2,000 | — |
| Limestone Re 2019 | 12/15/2016 | 11,622 | — |
| Limestone Re 2020-1 | 12/27/2019 | 167,779 | 331,144 |
| Limestone Re 2020-1 | 12/15/2016 | 56,714 | 111,936 |
| Limestone Re 2020-2 | 6/20/2018 | 1,333,000 | 1,456,302 |
| Lion Rock Re 2019 | 12/17/2018 | — | 2,650 |
| Lion Rock Re 2020 | 3/27/2020 | — | — |
| Lion Rock Re 2021 | 3/1/2021 | 500,000 | 564,500 |
| Lorenz Re 2018 | 6/26/2018 | 1,073,350 | 25,500 |
The accompanying notes are an integral part of these financial statements.
80 Pioneer Bond Fund | Annual Report | 6/30/21
| Restricted Securities | Acquisition date | Cost | Value |
| Lorenz Re 2019 | 6/26/2019 | $ 949,681 | $ 328,352 |
| Lorenz Re 2020 | 8/11/2020 | 2,480,490 | 2,498,102 |
| Lorenz Re 2020 | 8/12/2020 | 2,019,510 | 2,033,849 |
| Matterhorn Re | 1/29/2020 | 1,247,394 | 1,218,500 |
| Merion Re 2018-2 | 12/28/2017 | 288,065 | 1,158,500 |
| Merion Re 2021-1 | 1/8/2021 | 216,019 | 229,191 |
| Merion Re 2021-2 | 12/28/2020 | 9,000,000 | 9,336,489 |
| Oakmont Re 2017 | 5/10/2017 | — | 29,400 |
| Oakmont Re 2020 | 12/3/2020 | 1,709,677 | 2,018,848 |
| Old Head Re 2021 | 1/11/2021 | 303,709 | 352,451 |
| Pangaea Re 2016-2 | 5/31/2016 | — | 5,350 |
| Pangaea Re 2018-1 | 12/26/2017 | 543,427 | 80,007 |
| Pangaea Re 2018-3 | 5/31/2018 | 1,565,597 | 134,832 |
| Pangaea Re 2019-1 | 1/9/2019 | 42,174 | 83,704 |
| Pangaea Re 2019-3 | 7/25/2019 | 143,386 | 171,924 |
| Pangaea Re 2020-1 | 1/21/2020 | — | 84,354 |
| Pangaea Re 2020-1 | 1/19/2021 | 5,000,000 | 5,211,804 |
| Pangaea Re 2020-3 | 9/2/2020 | 5,000,000 | 5,499,678 |
| Phoenix One Re | 12/21/2020 | 1,250,000 | 1,271,625 |
| Pine Valley Re 2021 | 12/30/2020 | 938,692 | 964,840 |
| Port Royal Re 2019 | 5/20/2019 | 1,841,312 | 2,058,200 |
| Resilience Re | 4/13/2017 | 11,762 | — |
| Sector Re V | 1/1/2020 | 99,999 | 270,501 |
| Sector Re V | 12/4/2018 | 426,885 | 264,023 |
| Sector Re V | 4/29/2020 | 959 | 197,044 |
| Sector Re V | 4/29/2020 | 3,490 | 87,627 |
| Sector Re V | 12/4/2020 | 1,500,000 | 1,533,635 |
| Sector Re V | 12/21/2020 | 2,699,987 | 2,760,530 |
| Sector Re V, Ltd. | 4/24/2020 | 533 | 109,514 |
| Sector Re V, Series 8, Class D | 12/14/2018 | 87,872 | 56,851 |
| Sector Re V, Series 9, Class A | 4/23/2019 | 600,000 | 371,246 |
| Sector Re V, Series 9, Class C | 12/4/2019 | 200,000 | 541,008 |
| Sector Re V, Series 9, Class G | 5/1/2019 | 1,914 | 32,873 |
| Seminole Re 2018 | 1/2/2018 | 4,931 | 14,019 |
| St. Andrews Re 2017-4 | 3/31/2017 | — | 171,018 |
| Sussex Re 2020-1 | 1/21/2020 | — | 181,568 |
| Sussex Re 2021-1 | 1/26/2021 | 1,250,000 | 1,246,250 |
| Thopas Re 2018 | 12/12/2017 | 65,404 | 2,500 |
| Thopas Re 2019 | 12/21/2018 | 113,674 | 135,300 |
| Thopas Re 2020 | 12/30/2019 | — | 51,600 |
| Thopas Re 2021 | 12/30/2020 | 7,000,000 | 7,233,100 |
| Versutus Re 2018 | 1/31/2018 | 1,319 | — |
| Versutus Re 2019-A | 1/28/2019 | — | 45,186 |
| Versutus Re 2019-B | 12/24/2018 | — | 42,332 |
| Viribus Re 2018 | 12/22/2017 | 78,899 | — |
| Viribus Re 2019 | 12/27/2018 | — | 152,205 |
| Viribus Re 2020 | 3/12/2020 | 421,904 | 30,633 |
| Viribus Re 2021 | 2/1/2021 | 3,717,666 | 3,743,318 |
| Vitality Re X | 2/3/2020 | 2,498,483 | 2,451,300 |
| Vitality Re XI | 1/31/2020 | 994,496 | 975,000 |
| Walton Health Re 2018 | 6/25/2018 | 364,726 | 173,816 |
| Walton Health Re 2019 | 7/18/2019 | 215,947 | 294,118 |
The accompanying notes are an integral part of these financial statements.
Pioneer Bond Fund | Annual Report | 6/30/21 81
Schedule of Investments | 6/30/21 (continued)
| Restricted Securities | Acquisition date | Cost | Value |
| Woburn Re 2018 | 3/20/2018 | $ 574,482 | $ 119,152 |
Woburn Re 2019 | 1/30/2019 | 1,299,830 | 1,472,424 |
| Total Restricted Securities | $122,636,920 | ||
| % of Net assets | 2.1% |
FUTURES CONTRACTS
FIXED INCOME INDEX FUTURES CONTRACTS
| Number of | Unrealized | ||||
| Contracts | Expiration | Notional | Appreciation | ||
| Long | Description | Date | Amount | Market Value | (Depreciation) |
| 1,062 | U.S. 2 Year | 9/30/21 | $ 234,341,742 | $ 233,980,171 | $ (361,571) |
Note (CBT) | |||||
| 4,128 | U.S. 5 Year | 9/30/21 | 510,699,516 | 509,517,752 | (1,181,764) |
Note (CBT) | |||||
| 1,291 | U.S. Ultra | 9/21/21 | 239,130,602 | 248,759,563 | 9,628,961 |
Bond (CBT) | |||||
| $ 984,171,860 | $ 992,257,486 | $ 8,085,626 | |||
| Number of | |||||
| Contracts | Expiration | Notional | Unrealized | ||
| Short | Description | Date | Amount | Market Value | (Depreciation) |
| 1,987 | U.S. 10 Year | ||||
Note (CBT) | 9/21/21 | $ (261,910,344) | $ (263,277,500) | $(1,367,156) | |
| 2,045 | U.S. 10 Year | ||||
Ultra | 9/21/21 | (296,179,929) | (301,030,390) | (4,850,461) | |
37 | U.S. Long | ||||
Bond (CBT) | 9/21/21 | (5,772,000) | (5,947,750) | (175,750) | |
| $ (563,862,273) | $ (570,255,640) | $(6,393,367) | |||
| TOTAL FUTURES CONTRACTS | $ 420,309,587 | $ 422,001,846 | $ 1,692,259 | ||
SWAP CONTRACT
CENTRALLY CLEARED CREDIT DEFAULT SWAP CONTRACT – BUY PROTECTION
| Notional | Reference | Pay/ | Annual Fixed | Expiration | Premiums | Unrealized | Market |
Amount ($)(1) | Obligation/Index | Receive(2) | Rate | Date | (Received) | (Depreciation) | Value |
79,790,000 | Markit CDX North | ||||||
America High Yield | |||||||
Series 34 | Receive | 5.00% | 6/20/26 | $(7,857,178) | $(344,339) | $(8,201,517) | |
| TOTAL CENTRALLY CLEARED CREDIT | |||||||
| DEFAULT SWAP CONTRACT – BUY PROTECTION | $(7,857,178) | $(344,339) | $(8,201,517) | ||||
| TOTAL SWAP CONTRACT | $(7,857,178) | $(344,339) | $(8,201,517) | ||||
(1) | The notional amount is the maximum amount that a seller of credit protection would be obligated |
to pay upon occurrence of a credit event. | |
(2) | Receives Quarterly. |
The accompanying notes are an integral part of these financial statements.
82 Pioneer Bond Fund | Annual Report | 6/30/21
Principal amounts are denominated in U.S. dollars (“USD”) unless otherwise noted.
Purchases and sales of securities (excluding temporary cash investments) for the year ended June 30, 2021 were as follows:
| Purchases | Sales | |
Long-Term U.S. Government Securities | $ 644,406,109 | $ 850,837,706 |
Other Long-Term Securities | $2,330,303,699 | $3,065,220,394 |
The Fund is permitted to engage in purchase and sale transactions (“cross trades”) with certain funds and accounts for which Amundi Asset Management US, Inc. (the “Adviser”) serves as the Fund’s investment adviser, as set forth in Rule 17a-7 under the Investment Company Act of 1940, pursuant to procedures adopted by the Board of Trustees. Under these procedures, cross trades are effected at current market prices. During the year ended June 30, 2021, the Fund engaged in purchases of $109,488 and sales of $20,520,365 pursuant to these procedures, which resulted in a net realized gain/(loss) of $252,474.
At June 30, 2021, the net unrealized appreciation on investments based on cost for federal tax purposes of $6,787,191,247 was as follows:
| Aggregate gross unrealized appreciation for all investments in which | |
| there is an excess of value over tax cost | $230,299,169 |
| Aggregate gross unrealized depreciation for all investments in which | |
| there is an excess of tax cost over value | (55,920,570) |
| Net unrealized appreciation | $174,378,599 |
Various inputs are used in determining the value of the Fund’s investments. These inputs are summarized in the three broad levels below.
Level 1 – unadjusted quoted prices in active markets for identical securities.
Level 2 – other significant observable inputs (including quoted prices for similar securities, interest rates, prepayment speeds, credit risks, etc.). See Notes to Financial Statements — Note 1A.
Level 3 – significant unobservable inputs (including the Fund’s own assumptions in determining fair value of investments). See Notes to Financial Statements — Note 1A.
The accompanying notes are an integral part of these financial statements.
Pioneer Bond Fund | Annual Report | 6/30/21 83
Schedule of Investments | 6/30/21 (continued)
The following is a summary of the inputs used as of June 30, 2021, in valuing the Fund’s investments:
| Level 1 | Level 2 | Level 3 | Total | |||||||||||||
Common Stock | $ | 103,941 | $ | — | $ | — | $ | 103,941 | ||||||||
Convertible Preferred Stock | 79,892,515 | — | — | 79,892,515 | ||||||||||||
Asset Backed Securities | — | 685,617,665 | — | 685,617,665 | ||||||||||||
Collateralized Mortgage | ||||||||||||||||
| Obligations | — | 1,003,693,330 | — | 1,003,693,330 | ||||||||||||
Commercial Mortgage-Backed | ||||||||||||||||
| Securities | — | 366,638,060 | — | 366,638,060 | ||||||||||||
Corporate Bonds | — | 1,694,732,232 | — | 1,694,732,232 | ||||||||||||
Foreign Government Bond | — | 14,401,534 | — | 14,401,534 | ||||||||||||
Insurance-Linked Securities | ||||||||||||||||
| Collateralized Reinsurance | ||||||||||||||||
| Multiperil - Massachusetts | — | — | 3,024,808 | 3,024,808 | ||||||||||||
| Multiperil - U.S. | — | — | 13,533,426 | 13,533,426 | ||||||||||||
| Multiperil - U.S. Regional | — | — | 2,673,058 | 2,673,058 | ||||||||||||
| Multiperil - Worldwide | — | — | 4,033,169 | 4,033,169 | ||||||||||||
| Windstorm - Florida | — | — | 306,335 | 306,335 | ||||||||||||
| Windstorm - U.S. Regional | — | — | 2,048,248 | 2,048,248 | ||||||||||||
| Reinsurance Sidecars | ||||||||||||||||
| Multiperil - U.S. | — | — | 3,080,758 | 3,080,758 | ||||||||||||
| Multiperil - Worldwide | — | — | 84,228,493 | 84,228,493 | ||||||||||||
| All Other Insurance-Linked | ||||||||||||||||
| Securities | — | 9,708,625 | — | 9,708,625 | ||||||||||||
Municipal Bond | — | 2,545,127 | — | 2,545,127 | ||||||||||||
Senior Secured Floating Rate | ||||||||||||||||
| Loan Interests | — | 21,603,011 | — | 21,603,011 | ||||||||||||
U.S. Government and | ||||||||||||||||
| Agency Obligations | — | 2,952,044,769 | — | 2,952,044,769 | ||||||||||||
Repurchase Agreements | — | 24,170,000 | — | 24,170,000 | ||||||||||||
| Total Investments | ||||||||||||||||
| in Securities | $ | 79,996,456 | $ | 6,775,154,353 | $ | 112,928,295 | $ | 6,968,079,104 | ||||||||
| Other Financial Instruments | ||||||||||||||||
Net unrealized appreciation | ||||||||||||||||
| on futures contracts | $ | 1,692,259 | $ | — | $ | — | $ | 1,692,259 | ||||||||
Swap contracts, at value | — | (8,201,517 | ) | — | (8,201,517 | ) | ||||||||||
| Total Other | ||||||||||||||||
| Financial Instruments | $ | 1,692,259 | $ | (8,201,517 | ) | $ | — | $ | (6,509,258 | ) | ||||||
The accompanying notes are an integral part of these financial statements.
84 Pioneer Bond Fund | Annual Report | 6/30/21
The following is a reconciliation of assets valued using significant unobservable inputs (Level 3):
| Insurance- | ||||
| Linked | ||||
| Securities | ||||
Balance as of 6/30/20 | $ | 125,880,061 | ||
Realized gain (loss)(1) | (687,246 | ) | ||
Changed in unrealized appreciation (depreciation)(2) | 2,131,968 | |||
Accrued discounts/premiums | 63,072 | |||
Purchases | 89,541,634 | |||
Sales | (104,001,194 | ) | ||
Transfers in to Level 3* | — | |||
Transfers out of Level 3* | — | |||
| Balance as of 6/30/21 | $ | 112,928,295 | ||
(1) | Realized gain (loss) on these securities is included in the realized gain (loss) from investments on |
the Statement of Operations. | |
(2) | Unrealized appreciation (depreciation) on these securities is included in the change in unrealized |
appreciation (depreciation) from investments on the Statement of Operations. | |
* | Transfers are calculated on the beginning of period values. For the year ended June 30, 2021, |
there were no transfers in or out of Level 3. |
Net change in unrealized appreciation (depreciation) of Level 3 investments still held and considered Level 3 at June 30, 2021: $3,031,266
The accompanying notes are an integral part of these financial statements.
Pioneer Bond Fund | Annual Report | 6/30/21 85
| ASSETS: | ||||
| Investments in unaffiliated issuers, at value (cost $6,780,711,457) | $ | 6,968,079,104 | ||
| Cash | 52,810,532 | |||
| Foreign currencies, at value (cost $3,135,730) | 3,031,948 | |||
| Futures collateral | 1,741,389 | |||
| Swaps collateral | 4,232,809 | |||
| Due from broker for futures | 6,961,043 | |||
| Due from broker for swaps | 8,252,431 | |||
| Variation margin for futures contracts | 253,611 | |||
| Net unrealized appreciation on futures contracts | 1,692,259 | |||
| Receivables — | ||||
| Investment securities sold | 207,823,665 | |||
| Fund shares sold | 15,118,982 | |||
| Interest | 25,010,859 | |||
| Other assets | 57,158 | |||
| Total assets | $ | 7,295,065,790 | ||
| LIABILITIES: | ||||
| Payables — | ||||
| Investment securities purchased | $ | 1,415,217,334 | ||
| Fund shares repurchased | 10,246,542 | |||
| Distributions | 1,586,203 | |||
| Trustees’ fees | 7,666 | |||
| Variation margin for centrally cleared swap contracts | 14,581 | |||
| Swap contracts, at value (net premiums received $7,857,178) | 8,201,517 | |||
| Due to affiliates | 280,525 | |||
| Accrued expenses | 1,629,742 | |||
| Total liabilities | $ | 1,437,184,110 | ||
| NET ASSETS: | ||||
| Paid-in capital | $ | 5,604,231,151 | ||
| Distributable earnings | 253,650,529 | |||
| Net assets | $ | 5,857,881,680 | ||
| NET ASSET VALUE PER SHARE: | ||||
No par value (unlimited number of shares authorized) | ||||
| Class A (based on $831,594,918/82,019,880 shares) | $ | 10.14 | ||
| Class C (based on $35,294,813/3,519,604 shares) | $ | 10.03 | ||
| Class K (based on $1,983,399,487/195,705,483 shares) | $ | 10.13 | ||
| Class R (based on $212,126,708/20,735,466 shares) | $ | 10.23 | ||
| Class Y (based on $2,795,465,754/278,354,721 shares) | $ | 10.04 | ||
| MAXIMUM OFFERING PRICE PER SHARE: | ||||
| Class A (based on $10.14 net asset value per share/100%-4.50% | ||||
| maximum sales charge) | $ | 10.62 | ||
The accompanying notes are an integral part of these financial statements.
86 Pioneer Bond Fund | Annual Report | 6/30/21
Statement of Operations
FOR THE YEAR ENDED 6/30/21
| INVESTMENT INCOME: | ||||||||
| Interest from unaffiliated issuers | $ | 171,043,095 | ||||||
| Dividends from unaffiliated issuers | 9,341,117 | |||||||
| Total investment income | $ | 180,384,212 | ||||||
| EXPENSES: | ||||||||
| Management fees | $ | 16,424,806 | ||||||
| Administrative expense | 1,532,753 | |||||||
| Transfer agent fees | ||||||||
| Class A | 1,972,065 | |||||||
| Class C | 37,773 | |||||||
| Class K | 9,447 | |||||||
| Class R | 481,152 | |||||||
| Class Y | 3,118,804 | |||||||
| Distribution fees | ||||||||
| Class A | 2,251,700 | |||||||
| Class C | 465,760 | |||||||
| Class R | 1,007,920 | |||||||
| Shareowner communications expense | 256,810 | |||||||
| Custodian fees | 242,378 | |||||||
| Registration fees | 189,059 | |||||||
| Professional fees | 364,770 | |||||||
| Printing expense | 127,156 | |||||||
| Pricing fees | 223,046 | |||||||
| Trustees’ fees | 316,816 | |||||||
| Insurance expense | 15,576 | |||||||
| Miscellaneous | 285,208 | |||||||
| Total expenses | $ | 29,322,999 | ||||||
| Net investment income | $ | 151,061,213 | ||||||
| REALIZED AND UNREALIZED GAIN (LOSS) ON INVESTMENTS: | ||||||||
| Net realized gain (loss) on: | ||||||||
| Investments in unaffiliated issuers | $ | 184,385,589 | ||||||
| Short sales | 1,645,126 | |||||||
| Futures contracts | (2,596,757 | ) | ||||||
| Swap contracts | (3,625,908 | ) | ||||||
| Other assets and liabilities denominated in | ||||||||
| foreign currencies | 226,710 | $ | 180,034,760 | |||||
| Change in net unrealized appreciation (depreciation) on: | ||||||||
| Investments in unaffiliated issuers | $ | 40,640,716 | ||||||
| Futures contracts | 4,932,373 | |||||||
| Swap contracts | 346,775 | |||||||
| Other assets and liabilities denominated in | ||||||||
| foreign currencies | (97,680 | ) | $ | 45,822,184 | ||||
| Net realized and unrealized gain (loss) on investments | $ | 225,856,944 | ||||||
| Net increase in net assets resulting from operations | $ | 376,918,157 | ||||||
The accompanying notes are an integral part of these financial statements.
Pioneer Bond Fund | Annual Report | 6/30/21 87
Statements of Changes in Net Assets
| Year | Year | |||||||
| Ended | Ended | |||||||
| 6/30/21 | 6/30/20 | |||||||
| FROM OPERATIONS: | ||||||||
Net investment income (loss) | $ | 151,061,213 | $ | 171,716,097 | ||||
Net realized gain (loss) on investments | 180,034,760 | 73,398,398 | ||||||
Change in net unrealized appreciation (depreciation) | ||||||||
| on investments | 45,822,184 | 27,628,053 | ||||||
| Net increase in net assets resulting from operations | $ | 376,918,157 | $ | 272,742,548 | ||||
| DISTRIBUTIONS TO SHAREOWNERS: | ||||||||
| Class A ($0.45 and $0.29 per share, respectively) | $ | (40,455,616 | ) | $ | (28,975,607 | ) | ||
| Class C ($0.39 and $0.23 per share, respectively) | (1,898,838 | ) | (1,426,447 | ) | ||||
| Class K ($0.50 and $0.34 per share, respectively) | (95,007,203 | ) | (50,627,893 | ) | ||||
| Class R ($0.43 and $0.27 per share, respectively) | (8,452,428 | ) | (5,307,852 | ) | ||||
| Class Y ($0.49 and $0.33 per share, respectively) | (136,183,899 | ) | (108,795,291 | ) | ||||
| Total distributions to shareowners | $ | (281,997,984 | ) | $ | (195,133,090 | ) | ||
| FROM FUND SHARE TRANSACTIONS: | ||||||||
Net proceeds from sales of shares | $ | 1,863,845,956 | $ | 2,780,827,993 | ||||
Reinvestment of distributions | 239,263,665 | 163,438,445 | ||||||
Cost of shares repurchased | (2,316,988,069 | ) | (2,613,398,210 | ) | ||||
| Net increase (decrease) in net assets resulting from | ||||||||
| Fund share transactions | $ | (213,878,448 | ) | $ | 330,868,228 | |||
| Net increase (decrease) in net assets | $ | (118,958,275 | ) | $ | 408,477,686 | |||
| NET ASSETS: | ||||||||
Beginning of year | $ | 5,976,839,955 | $ | 5,568,362,269 | ||||
End of year | $ | 5,857,881,680 | $ | 5,976,839,955 | ||||
The accompanying notes are an integral part of these financial statements.
88 Pioneer Bond Fund | Annual Report | 6/30/21
| Year Ended | Year Ended | Year Ended | Year Ended | |||||||||||||
| 6/30/21 | 6/30/21 | 6/30/20 | 6/30/20 | |||||||||||||
| Shares | Amount | Shares | Amount | |||||||||||||
| Class A | ||||||||||||||||
Shares sold | 24,788,446 | $ | 251,589,494 | 34,453,803 | $ | 338,973,168 | ||||||||||
Reinvestment of | ||||||||||||||||
| distributions | 3,042,384 | 30,881,683 | 2,127,543 | 20,938,829 | ||||||||||||
Less shares repurchased | (42,016,210 | ) | (426,624,016 | ) | (40,472,927 | ) | (393,857,571 | ) | ||||||||
| Net decrease | (14,185,380 | ) | $ | (144,152,839 | ) | (3,891,581 | ) | $ | (33,945,574 | ) | ||||||
| Class C | ||||||||||||||||
Shares sold | 1,152,401 | $ | 11,587,167 | 1,996,732 | $ | 19,406,186 | ||||||||||
Reinvestment of | ||||||||||||||||
| distributions | 173,791 | 1,745,314 | 112,645 | 1,096,894 | ||||||||||||
Less shares repurchased | (3,784,019 | ) | (37,960,275 | ) | (2,579,843 | ) | (24,910,537 | ) | ||||||||
| Net decrease | (2,457,827 | ) | $ | (24,627,794 | ) | (470,466 | ) | $ | (4,407,457 | ) | ||||||
| Class K | ||||||||||||||||
Shares sold | 68,751,584 | $ | 696,010,514 | 106,555,145 | $ | 1,037,516,414 | ||||||||||
Reinvestment of | ||||||||||||||||
| distributions | 7,976,053 | 80,906,765 | 4,127,539 | 40,585,237 | ||||||||||||
Less shares repurchased | (73,297,035 | ) | (742,978,320 | ) | (48,593,281 | ) | (468,632,844 | ) | ||||||||
| Net increase | 3,430,602 | $ | 33,938,959 | 62,089,403 | $ | 609,468,807 | ||||||||||
| Class R | ||||||||||||||||
Shares sold | 3,952,351 | $ | 40,359,908 | 3,572,364 | $ | 35,493,689 | ||||||||||
Reinvestment of | ||||||||||||||||
| distributions | 822,200 | 8,422,204 | 525,926 | 5,223,629 | ||||||||||||
Less shares repurchased | (3,034,420 | ) | (31,058,255 | ) | (5,191,358 | ) | (51,042,756 | ) | ||||||||
| Net increase (decrease) | 1,740,131 | $ | 17,723,857 | (1,093,068 | ) | $ | (10,325,438 | ) | ||||||||
| Class Y | ||||||||||||||||
Shares sold | 86,070,510 | $ | 864,298,873 | 138,403,623 | $ | 1,349,438,536 | ||||||||||
Reinvestment of | ||||||||||||||||
| distributions | 11,667,498 | 117,307,699 | 9,804,550 | 95,593,856 | ||||||||||||
Less shares repurchased | (107,311,880 | ) | (1,078,367,203 | ) | (175,101,360 | ) | (1,674,954,502 | ) | ||||||||
| Net decrease | (9,573,872 | ) | $ | (96,760,631 | ) | (26,893,187 | ) | $ | (229,922,110 | ) | ||||||
The accompanying notes are an integral part of these financial statements.
Pioneer Bond Fund | Annual Report | 6/30/21 89
Financial Highlights
| Year | Year | Year | Year | Year | ||||||||||||||||
| Ended | Ended | Ended | Ended | Ended | ||||||||||||||||
| 6/30/21 | 6/30/20 | 6/30/19 | 6/30/18 | 6/30/17 | ||||||||||||||||
| Class A | ||||||||||||||||||||
Net asset value, beginning of period | $ | 9.98 | $ | 9.79 | $ | 9.45 | $ | 9.71 | $ | 9.76 | ||||||||||
Increase (decrease) from investment operations: | ||||||||||||||||||||
| Net investment income (loss) (a) | $ | 0.23 | $ | 0.25 | $ | 0.27 | $ | 0.26 | $ | 0.25 | ||||||||||
| Net realized and unrealized gain (loss) on investments | 0.38 | 0.23 | 0.37 | (0.24 | ) | (0.01 | ) | |||||||||||||
| Net increase (decrease) from investment operations | $ | 0.61 | $ | 0.48 | $ | 0.64 | $ | 0.02 | $ | 0.24 | ||||||||||
Distributions to shareowners: | ||||||||||||||||||||
| Net investment income | $ | (0.27 | ) | $ | (0.29 | ) | $ | (0.30 | ) | $ | (0.28 | ) | $ | (0.29 | ) | |||||
| Net realized gain | (0.18 | ) | — | — | — | — | ||||||||||||||
| Total distributions | $ | (0.45 | ) | $ | (0.29 | ) | $ | (0.30 | ) | $ | (0.28 | ) | $ | (0.29 | ) | |||||
| Net increase (decrease) in net asset value | $ | 0.16 | $ | 0.19 | $ | 0.34 | $ | (0.26 | ) | $ | (0.05 | ) | ||||||||
Net asset value, end of period | $ | 10.14 | $ | 9.98 | $ | 9.79 | $ | 9.45 | $ | 9.71 | ||||||||||
| Total return (b) | 6.26 | % | 5.01 | % | 6.93 | % | 0.14 | % | 2.48 | % | ||||||||||
Ratio of net expenses to average net assets | 0.82 | % | 0.82 | % | 0.85 | % | 0.85 | % | 0.85 | % | ||||||||||
Ratio of net investment income (loss) to average net assets | 2.26 | % | 2.58 | % | 2.88 | % | 2.71 | % | 2.60 | % | ||||||||||
Portfolio turnover rate | 59 | % | 71 | % | 52 | % | 45 | % | 44 | % | ||||||||||
Net assets, end of period (in thousands) | $ | 831,595 | $ | 960,460 | $ | 979,874 | $ | 1,081,121 | $ | 1,156,940 | ||||||||||
Ratios with no waiver of fees and assumption of expenses by | ||||||||||||||||||||
| the Adviser and no reduction for fees paid indirectly: | ||||||||||||||||||||
| Total expenses to average net assets | 0.82 | % | 0.82 | % | 0.87 | % | 0.96 | % | 0.99 | % | ||||||||||
| Net investment income (loss) to average net assets | 2.26 | % | 2.58 | % | 2.86 | % | 2.60 | % | 2.46 | % | ||||||||||
(a) | The per-share data presented above is based on the average shares outstanding for the period presented. |
(b) | Assumes initial investment at net asset value at the beginning of each period, reinvestment of all distributions, the complete redemption of the investment at net asset value at the end of each period and no sales charges. Total return would be reduced if sales charges were taken into account. |
The accompanying notes are an integral part of these financial statements.
90 Pioneer Bond Fund | Annual Report | 6/30/21
| Year | Year | Year | Year | Year | ||||||||||||||||
| Ended | Ended | Ended | Ended | Ended | ||||||||||||||||
| 6/30/21 | 6/30/20 | 6/30/19 | 6/30/18 | 6/30/17 | ||||||||||||||||
| Class C | ||||||||||||||||||||
Net asset value, beginning of period | $ | 9.87 | $ | 9.68 | $ | 9.35 | $ | 9.60 | $ | 9.66 | ||||||||||
Increase (decrease) from investment operations: | ||||||||||||||||||||
| Net investment income (loss) (a) | $ | 0.17 | $ | 0.19 | $ | 0.21 | $ | 0.19 | $ | 0.18 | ||||||||||
| Net realized and unrealized gain (loss) on investments | 0.38 | 0.23 | 0.35 | (0.24 | ) | (0.03 | ) | |||||||||||||
| Net increase (decrease) from investment operations | $ | 0.55 | $ | 0.42 | $ | 0.56 | $ | (0.05 | ) | $ | 0.15 | |||||||||
Distributions to shareowners: | ||||||||||||||||||||
| Net investment income | $ | (0.21 | ) | $ | (0.23 | ) | $ | (0.23 | ) | $ | (0.20 | ) | $ | (0.21 | ) | |||||
| Net realized gain | (0.18 | ) | — | — | — | — | ||||||||||||||
| Total distributions | $ | (0.39 | ) | $ | (0.23 | ) | $ | (0.23 | ) | $ | (0.20 | ) | $ | (0.21 | ) | |||||
| Net increase (decrease) in net asset value | $ | 0.16 | $ | 0.19 | $ | 0.33 | $ | (0.25 | ) | $ | (0.06 | ) | ||||||||
Net asset value, end of period | $ | 10.03 | $ | 9.87 | $ | 9.68 | $ | 9.35 | $ | 9.60 | ||||||||||
| Total return (b) | 5.63 | % | 4.38 | % | 6.10 | % | (0.52 | )% | 1.62 | % | ||||||||||
Ratio of net expenses to average net assets | 1.43 | % | 1.45 | % | 1.52 | % | 1.60 | % | 1.59 | % | ||||||||||
Ratio of net investment income (loss) to average net assets | 1.65 | % | 1.96 | % | 2.21 | % | 1.96 | % | 1.84 | % | ||||||||||
Portfolio turnover rate | 59 | % | 71 | % | 52 | % | 45 | % | 44 | % | ||||||||||
Net assets, end of period (in thousands) | $ | 35,295 | $ | 59,026 | $ | 62,447 | $ | 79,308 | $ | 96,547 | ||||||||||
(a) | The per-share data presented above is based on the average shares outstanding for the period presented. |
(b) | Assumes initial investment at net asset value at the beginning of each period, reinvestment of all distributions, the complete redemption of the investment at net asset value at the end of each period and no sales charges. Total return would be reduced if sales charges were taken into account. |
Pioneer Bond Fund | Annual Report | 6/30/21 91
The accompanying notes are an integral part of these financial statements.Financial Highlights (continued)
Year | Year | Year | Year | Year | ||||||||||||||||
| Ended | Ended | Ended | Ended | Ended | ||||||||||||||||
| 6/30/21 | 6/30/20 | 6/30/19 | 6/30/18 | 6/30/17 | ||||||||||||||||
| Class K | ||||||||||||||||||||
Net asset value, beginning of period | $ | 9.98 | $ | 9.78 | $ | 9.45 | $ | 9.71 | $ | 9.76 | ||||||||||
| Increase (decrease) from investment operations: | ||||||||||||||||||||
| Net investment income (loss) (a) | $ | 0.28 | $ | 0.30 | $ | 0.32 | $ | 0.30 | $ | 0.29 | ||||||||||
| Net realized and unrealized gain (loss) on investments | 0.37 | 0.24 | 0.35 | (0.25 | ) | (0.01 | ) | |||||||||||||
| Net increase (decrease) from investment operations | $ | 0.65 | $ | 0.54 | $ | 0.67 | $ | 0.05 | $ | 0.28 | ||||||||||
| Distributions to shareowners: | ||||||||||||||||||||
| Net investment income | $ | (0.32 | ) | $ | (0.34 | ) | $ | (0.34 | ) | $ | (0.31 | ) | $ | (0.33 | ) | |||||
| Net realized gain | (0.18 | ) | — | — | — | — | ||||||||||||||
| Total distributions | $ | (0.50 | ) | $ | (0.34 | ) | $ | (0.34 | ) | $ | (0.31 | ) | $ | (0.33 | ) | |||||
| Net increase (decrease) in net asset value | $ | 0.15 | $ | 0.20 | $ | 0.33 | $ | (0.26 | ) | $ | (0.05 | ) | ||||||||
| Net asset value, end of period | $ | 10.13 | $ | 9.98 | $ | 9.78 | $ | 9.45 | $ | 9.71 | ||||||||||
| Total return (b) | 6.66 | % | 5.65 | % | 7.28 | % | 0.54 | % | 2.87 | % | ||||||||||
| Ratio of net expenses to average net assets | 0.34 | % | 0.34 | % | 0.37 | % | 0.46 | % | 0.47 | % | ||||||||||
| Ratio of net investment income (loss) to average net assets | 2.73 | % | 3.08 | % | 3.37 | % | 3.11 | % | 3.01 | % | ||||||||||
Portfolio turnover rate | 59 | % | 71 | % | 52 | % | 45 | % | 44 | % | ||||||||||
Net assets, end of period (in thousands) | $ | 1,983,399 | $ | 1,918,556 | $ | 1,273,821 | $ | 939,272 | $ | 726,063 | ||||||||||
(a) | The per-share data presented above is based on the average shares outstanding for the period presented. |
(b) | Assumes initial investment at net asset value at the beginning of each period, reinvestment of all distributions and the complete redemption of the investment at net asset value at the end of each period. |
The accompanying notes are an integral part of these financial statements.
92 Pioneer Bond Fund | Annual Report | 6/30/21
Year | Year | Year | �� | Year | Year | |||||||||||||||
| Ended | Ended | Ended | Ended | Ended | ||||||||||||||||
| 6/30/21 | 6/30/20 | 6/30/19 | 6/30/18 | 6/30/17 | ||||||||||||||||
| Class R | ||||||||||||||||||||
Net asset value, beginning of period | $ | 10.07 | $ | 9.88 | $ | 9.54 | $ | 9.80 | $ | 9.85 | ||||||||||
Increase (decrease) from investment operations: | ||||||||||||||||||||
| Net investment income (loss) (a) | $ | 0.20 | $ | 0.23 | $ | 0.25 | $ | 0.24 | $ | 0.23 | ||||||||||
| Net realized and unrealized gain (loss) on investments | 0.39 | 0.23 | 0.37 | (0.25 | ) | (0.01 | ) | |||||||||||||
| Net increase (decrease) from investment operations | $ | 0.59 | $ | 0.46 | $ | 0.62 | $ | (0.01 | ) | $ | 0.22 | |||||||||
Distributions to shareowners: | ||||||||||||||||||||
| Net investment income | $ | (0.25 | ) | $ | (0.27 | ) | $ | (0.28 | ) | $ | (0.25 | ) | $ | (0.27 | ) | |||||
| Net realized gain | (0.18 | ) | — | — | — | — | ||||||||||||||
| Total distributions | $ | (0.43 | ) | $ | (0.27 | ) | $ | (0.28 | ) | $ | (0.25 | ) | $ | (0.27 | ) | |||||
| Net increase (decrease) in net asset value | $ | 0.16 | $ | 0.19 | $ | 0.34 | $ | (0.26 | ) | $ | (0.05 | ) | ||||||||
Net asset value, end of period | $ | 10.23 | $ | 10.07 | $ | 9.88 | $ | 9.54 | $ | 9.80 | ||||||||||
| Total return (b) | 5.97 | % | 4.76 | % | 6.62 | % | (0.08 | )% | 2.23 | % | ||||||||||
Ratio of net expenses to average net assets | 1.08 | % | 1.08 | % | 1.10 | % | 1.10 | % | 1.10 | % | ||||||||||
Ratio of net investment income (loss) to average net assets | 1.99 | % | 2.33 | % | 2.64 | % | 2.46 | % | 2.35 | % | ||||||||||
Portfolio turnover rate | 59 | % | 71 | % | 52 | % | 45 | % | 44 | % | ||||||||||
Net assets, end of period (in thousands) | $ | 212,127 | $ | 191,311 | $ | 198,457 | $ | 179,729 | $ | 178,770 | ||||||||||
Ratios with no waiver of fees and assumption of expenses by | ||||||||||||||||||||
| the Adviser and no reduction for fees paid indirectly: | ||||||||||||||||||||
| Total expenses to average net assets | 1.08 | % | 1.08 | % | 1.12 | % | 1.21 | % | 1.24 | % | ||||||||||
| Net investment income (loss) to average net assets | 1.99 | % | 2.33 | % | 2.62 | % | 2.35 | % | 2.21 | % | ||||||||||
(a) | The per-share data presented above is based on the average shares outstanding for the period presented. |
(b) | Assumes initial investment at net asset value at the beginning of each period, reinvestment of all distributions and the complete redemption of the investment at net asset value. |
Pioneer Bond Fund | Annual Report | 6/30/21 93
The accompanying notes are an integral part of these financial statements.Financial Highlights (continued)
Year | Year | Year | Year | Year | ||||||||||||||||
| Ended | Ended | Ended | Ended | Ended | ||||||||||||||||
| 6/30/21 | 6/30/20 | 6/30/19 | 6/30/18 | 6/30/17 | ||||||||||||||||
| Class Y | ||||||||||||||||||||
Net asset value, beginning of period | $ | 9.89 | $ | 9.70 | $ | 9.36 | $ | 9.62 | $ | 9.67 | ||||||||||
Increase (decrease) from investment operations: | ||||||||||||||||||||
| Net investment income (loss) (a) | $ | 0.26 | $ | 0.29 | $ | 0.31 | $ | 0.28 | $ | 0.28 | ||||||||||
| Net realized and unrealized gain (loss) on investments | 0.38 | 0.23 | 0.36 | (0.24 | ) | (0.02 | ) | |||||||||||||
| Net increase (decrease) from investment operations | $ | 0.64 | $ | 0.52 | $ | 0.67 | $ | 0.04 | $ | 0.26 | ||||||||||
Distributions to shareowners: | ||||||||||||||||||||
| Net investment income | $ | (0.31 | ) | $ | (0.33 | ) | $ | (0.33 | ) | $ | (0.30 | ) | $ | (0.31 | ) | |||||
| Net realized gain | (0.18 | ) | — | — | — | — | ||||||||||||||
| Total distributions | $ | (0.49 | ) | $ | (0.33 | ) | $ | (0.33 | ) | $ | (0.30 | ) | $ | (0.31 | ) | |||||
| Net increase (decrease) in net asset value | $ | 0.15 | $ | 0.19 | $ | 0.34 | $ | (0.26 | ) | $ | (0.05 | ) | ||||||||
Net asset value, end of period | $ | 10.04 | $ | 9.89 | $ | 9.70 | $ | 9.36 | $ | 9.62 | ||||||||||
| Total return (b) | 6.58 | % | 5.44 | % | 7.30 | % | 0.40 | % | 2.76 | % | ||||||||||
Ratio of net expenses to average net assets | 0.45 | % | 0.45 | % | 0.49 | % | 0.58 | % | 0.58 | % | ||||||||||
Ratio of net investment income (loss) to average net assets | 2.62 | % | 2.96 | % | 3.26 | % | 2.98 | % | 2.87 | % | ||||||||||
Portfolio turnover rate | 59 | % | 71 | % | 52 | % | 45 | % | 44 | % | ||||||||||
Net assets, end of period (in thousands) | $ | 2,795,466 | $ | 2,847,487 | $ | 3,053,763 | $ | 2,708,766 | $ | 2,558,262 | ||||||||||
Ratios with no waiver of fees and assumption of expenses by | ||||||||||||||||||||
| the Adviser and no reduction for fees paid indirectly: | ||||||||||||||||||||
| Total expenses to average net assets | 0.45 | % | 0.45 | % | 0.49 | % | 0.58 | % | 0.59 | % | ||||||||||
| Net investment income (loss) to average net assets | 2.62 | % | 2.96 | % | 3.26 | % | 2.98 | % | 2.86 | % | ||||||||||
(a) | The per-share data presented above is based on the average shares outstanding for the period presented. |
(b) | Assumes initial investment at net asset value at the beginning of each period, reinvestment of all distributions and the complete redemption of the investment at net asset value at the end of each period. |
The accompanying notes are an integral part of these financial statements.
94 Pioneer Bond Fund | Annual Report | 6/30/21
1. Organization and Significant Accounting Policies
Pioneer Bond Fund (the “Fund”) is a Delaware statutory trust. The Fund is registered under the Investment Company Act of 1940 as a diversified, open-end management investment company. The investment objective of the Fund is to seek current income consistent with preservation of capital.
The Fund offers five classes of shares designated as Class A, Class C, Class K, Class R and Class Y shares. Each class of shares represents an interest in the same portfolio of investments of the Fund and has identical rights (based on relative net asset values) to assets and liquidation proceeds. Share classes can bear different rates of class-specific fees and expenses such as transfer agent and distribution fees. Differences in class-specific fees and expenses will result in differences in net investment income and, therefore, the payment of different dividends from net investment income earned by each class. The Amended and Restated Declaration of Trust of the Fund gives the Board of Trustees the flexibility to specify either per-share voting or dollar-weighted voting when submitting matters for shareowner approval. Under per-share voting, each share of a class of the Fund is entitled to one vote. Under dollar-weighted voting, a shareowner’s voting power is determined not by the number of shares owned, but by the dollar value of the shares on the record date. Each share class has exclusive voting rights with respect to matters affecting only that class, including with respect to the distribution plan for that class. There is no distribution plan for Class K or Class Y shares.
Amundi Asset Management US, Inc., an indirect, wholly owned subsidiary of Amundi and Amundi’s wholly owned subsidiary, Amundi USA, Inc., serves as the Fund’s investment adviser (the “Adviser”). Prior to January 1, 2021, the Adviser was named Amundi Pioneer Asset Management, Inc. Amundi Distributor US, Inc., an affiliate of Amundi Asset Management US, Inc., serves as the Fund’s distributor (the “Distributor”).
In August 2018, the Financial Accounting Standards Board (FASB) issued Accounting Standards Update 2018-13 “Disclosure Framework - Changes to the Disclosure Requirements for Fair Value Measurement” (“ASU 2018-13”) which modifies disclosure requirements for fair value measurements, principally for Level 3 securities and transfers between levels of the fair value hierarchy. ASU 2018-13 is effective for fiscal years beginning after December 15, 2019 and for interim periods within those fiscal years. The Fund has adopted ASU 2018-13 for the year ended June 30, 2021. The impact to the Fund’s adoption was limited to changes in the Fund’s disclosures regarding fair value, primarily those disclosures related to transfers between
Pioneer Bond Fund | Annual Report | 6/30/21 95
levels of the fair value hierarchy and disclosure of the range and weighted average used to develop significant unobservable inputs for Level 3 fair value investments, when applicable.
In March 2020, FASB issued an Accounting Standard Update, ASU 2020-04, Reference Rate Reform (Topic 848) — Facilitation of the Effects of Reference Rate Reform on Financial Reporting (“ASU 2020-04”), which provides optional, temporary relief with respect to the financial reporting of contracts subject to certain types of modifications due to the planned discontinuation of the London Interbank Offered Rate (“LIBOR”) and other LIBOR-based reference rates at the end of 2021. The temporary relief provided by ASU 2020-04 is effective for certain reference rate-related contract modifications that occur during the period from March 12, 2020 through December 31, 2022. Management is evaluating the impact of ASU 2020-04 on the Fund’s investments, derivatives, debt and other contracts, if applicable, that will undergo reference rate-related modifications as a result of the reference rate reform.
The Fund is an investment company and follows investment company accounting and reporting guidance under U.S. Generally Accepted Accounting Principles (“U.S. GAAP”). U.S. GAAP requires the management of the Fund to make estimates and assumptions that affect the reported amounts of assets and liabilities, the disclosure of contingent assets and liabilities at the date of the financial statements, and the reported amounts of income, expenses and gain or loss on investments during the reporting period. Actual results could differ from those estimates.
The following is a summary of significant accounting policies followed by the Fund in the preparation of its financial statements:
A. Security Valuation
The net asset value of the Fund is computed once daily, on each day the New York Stock Exchange (“NYSE”) is open, as of the close of regular trading on the NYSE.
Fixed-income securities are valued by using prices supplied by independent pricing services, which consider such factors as market prices, market events, quotations from one or more brokers, Treasury spreads, yields, maturities and ratings, or may use a pricing matrix or other fair value methods or techniques to provide an estimated value of the security or instrument. A pricing matrix is a means of valuing a debt security on the basis of current market prices for other debt securities, historical trading patterns in the market for fixed-income securities and/or other factors. Non-U.S. debt securities that are listed on an exchange will be valued at the bid price obtained from an independent third party pricing service.
96 Pioneer Bond Fund | Annual Report | 6/30/21
When independent third party pricing services are unable to supply prices, or when prices or market quotations are considered to be unreliable, the value of that security may be determined using quotations from one or more broker-dealers.
Loan interests are valued in accordance with guidelines established by the Board of Trustees at the mean between the last available bid and asked prices from one or more brokers or dealers as obtained from Loan Pricing Corporation, an independent third party pricing service. If price information is not available from Loan Pricing Corporation, or if the price information is deemed to be unreliable, price information will be obtained from an alternative loan interest pricing service. If no reliable price quotes are available from either the primary or alternative pricing service, broker quotes will be solicited.
Equity securities that have traded on an exchange are valued by using the last sale price on the principal exchange where they are traded. Equity securities that have not traded on the date of valuation, or securities for which sale prices are not available, generally are valued using the mean between the last bid and asked prices or, if both last bid and asked prices are not available, at the last quoted bid price. Last sale and bid and asked prices are provided by independent third party pricing services. In the case of equity securities not traded on an exchange, prices are typically determined by independent third party pricing services using a variety of techniques and methods.
The value of foreign securities is translated into U.S. dollars based on foreign currency exchange rate quotations supplied by a third party pricing source. Trading in non-U.S. equity securities is substantially completed each day at various times prior to the close of the NYSE. The values of such securities used in computing the net asset value of the Fund’s shares are determined as of such times. The Fund may use a fair value model developed by an independent pricing service to value non-U.S. equity securities.
Event-linked bonds are valued at the bid price obtained from an independent third party pricing service. Other insurance-linked securities (including reinsurance sidecars, collateralized reinsurance and industry loss warranties) may be valued at the bid price obtained from an independent pricing service, or through a third party using a pricing matrix, insurance industry valuation models, or other fair value methods or techniques to provide an estimated value of the instrument.
Futures contracts are generally valued at the closing settlement price established by the exchange on which they are traded.
Pioneer Bond Fund | Annual Report | 6/30/21 97
Swap contracts, including interest rate swaps, caps and floors (other than centrally cleared swap contracts), are valued at the dealer quotations obtained from reputable International Swap Dealers Association members. Centrally cleared swaps are valued at the daily settlement price provided by the central clearing counterparty.
Repurchase agreements are valued at par. Cash may include overnight time deposits at approved financial institutions.
Securities or loan interests for which independent pricing services or broker-dealers are unable to supply prices or for which market prices and/or quotations are not readily available or are considered to be unreliable are valued by a fair valuation team comprised of certain personnel of the Adviser pursuant to procedures adopted by the Fund’s Board of Trustees. The Adviser’s fair valuation team uses fair value methods approved by the Valuation Committee of the Board of Trustees. The Adviser’s fair valuation team is responsible for monitoring developments that may impact fair valued securities and for discussing and assessing fair values on an ongoing basis, and at least quarterly, with the Valuation Committee of the Board of Trustees.
Inputs used when applying fair value methods to value a security may include credit ratings, the financial condition of the company, current market conditions and comparable securities. The Fund may use fair value methods if it is determined that a significant event has occurred after the close of the exchange or market on which the security trades and prior to the determination of the Fund’s net asset value. Examples of a significant event might include political or economic news, corporate restructurings, natural disasters, terrorist activity or trading halts. Thus, the valuation of the Fund’s securities may differ significantly from exchange prices, and such differences could be material.
At June 30, 2021, no securities were valued using fair value methods (other than securities valued using prices supplied by independent pricing services, broker-dealers or using a third party insurance industry pricing model).
B. Investment Income and Transactions
Dividend income is recorded on the ex-dividend date, except that certain dividends from foreign securities where the ex-dividend date may have passed are recorded as soon as the Fund becomes aware of the ex-dividend data in the exercise of reasonable diligence.
Interest income, including interest on income-bearing cash accounts, is recorded on the accrual basis. Dividend and interest income are reported net of unrecoverable foreign taxes withheld at the applicable country rates and net of income accrued on defaulted securities.
98 Pioneer Bond Fund | Annual Report | 6/30/21
Interest and dividend income payable by delivery of additional shares is reclassified as PIK (payment-in-kind) income upon receipt and is included in interest and dividend income, respectively.
Principal amounts of mortgage-backed securities are adjusted for monthly paydowns. Premiums and discounts related to certain mortgage-backed securities are amortized or accreted in proportion to the monthly paydowns. All discounts/premiums on purchase prices of debt securities are accreted/amortized for financial reporting purposes over the life of the respective securities, and such accretion/amortization is included in interest income.
Security transactions are recorded as of trade date. Gains and losses on sales of investments are calculated on the identified cost method for both financial reporting and federal income tax purposes.
C. Foreign Currency Translation
The books and records of the Fund are maintained in U.S. dollars. Amounts denominated in foreign currencies are translated into U.S. dollars using current exchange rates.
Net realized gains and losses on foreign currency transactions, if any, represent, among other things, the net realized gains and losses on foreign currency exchange contracts, disposition of foreign currencies and the difference between the amount of income accrued and the U.S. dollars actually received. Further, the effects of changes in foreign currency exchange rates on investments are not segregated on the Statement of Operations from the effects of changes in the market prices of those securities, but are included with the net realized and unrealized gain or loss on investments.
D. Federal Income Taxes
It is the Fund’s policy to comply with the requirements of the Internal Revenue Code applicable to regulated investment companies and to distribute all of its net taxable income and net realized capital gains, if any, to its shareowners. Therefore, no provision for federal income taxes is required. As of June 30, 2021, the Fund did not accrue any interest or penalties with respect to uncertain tax positions, which, if applicable, would be recorded as an income tax expense on the Statement of Operations. Tax returns filed within the prior three years remain subject to examination by federal and state tax authorities.
The amount and character of income and capital gain distributions to shareowners are determined in accordance with federal income tax rules, which may differ from U.S. GAAP. Distributions in excess of net investment income or net realized gains are temporary over distributions for financial
Pioneer Bond Fund | Annual Report | 6/30/21 99
statement purposes resulting from differences in the recognition or classification of income or distributions for financial statement and tax purposes. Capital accounts within the financial statements are adjusted for permanent book/tax differences to reflect tax character, but are not adjusted for temporary differences.
A portion of the dividend income recorded by the Fund is from distributions by publicly traded Real Estate Investment Trusts (“REITs”), and such distributions for tax purposes may also consist of capital gains and return of capital. The actual return of capital and capital gains portions of such distributions will be determined by formal notifications from the REITs subsequent to the calendar year-end. Distributions received from the REITs that are determined to be a return of capital are recorded by the Fund as a reduction of the cost basis of the securities held and those determined to be capital gain are reflected as such on the Statement of Operations.
At June 30, 2021, the Fund reclassified $2,161,313 to increase distributable earnings and $2,161,313 to decrease paid-in capital to reflect permanent book/tax differences. These adjustments have no impact on net assets or the results of operations.
The tax character of distributions paid during the years ended June 30, 2021 and June 30, 2020, were as follows:
| 2021 | 2020 | |||||||
| Distributions paid from: | ||||||||
| Ordinary income | $ | 215,050,752 | $ | 195,133,090 | ||||
| Long-term capital gain | 66,947,232 | — | ||||||
| Total | $ | 281,997,984 | $ | 195,133,090 | ||||
The following shows the components of distributable earnings (losses) on a federal income tax basis at June 30, 2021:
| 2021 | ||||
| Distributable earnings: | ||||
| Undistributed ordinary income | $ | 16,612,034 | ||
| Undistributed long term capital gain | 64,349,880 | |||
| Current year dividends payable | (1,586,203 | ) | ||
| Net unrealized appreciation | 174,274,818 | |||
| Total | $ | 253,650,529 | ||
The difference between book basis and tax basis net unrealized appreciation is attributable to the tax deferral of losses on wash sales, adjustments relating to catastrophe bonds, swaps, the tax treatment of premium and amortization and the mark to market of futures contracts.
100 Pioneer Bond Fund | Annual Report | 6/30/21
E. Fund Shares
The Fund records sales and repurchases of its shares as of trade date. The Distributor earned $37,633 in underwriting commissions on the sale of Class A shares during the year ended June 30, 2021.
F. Class Allocations
Income, common expenses and realized and unrealized gains and losses are calculated at the Fund level and allocated daily to each class of shares based on its respective percentage of adjusted net assets at the beginning of the day.
Distribution fees are calculated based on the average daily net asset value attributable to Class A, Class C, and Class R shares of the Fund, respectively (see Note 5). Class K and Class Y shares do not pay distribution fees. All expenses and fees paid to the Fund’s transfer agent for its services are allocated among the classes of shares based on the number of accounts in each class and the ratable allocation of related out-of-pocket expenses (see Note 4).
The Fund declares as daily dividends substantially all of its net investment income. All dividends are paid on a monthly basis. Short-term capital gain distributions, if any, may be declared with the daily dividends. Distributions to shareowners are recorded as of the ex-dividend date. Distributions paid by the Fund with respect to each class of shares are calculated in the same manner and at the same time, except that net investment income dividends to Class A, Class C, Class K, Class R and Class Y shares can reflect different transfer agent and distribution expense rates.
G. Risks
The value of securities held by the Fund may go up or down, sometimes rapidly or unpredictably, due to general market conditions, such as real or perceived adverse economic, political or regulatory conditions, recessions, the spread of infectious illness or other public health issues, inflation, changes in interest rates, lack of liquidity in the bond markets or adverse investor sentiment. In the past several years, financial markets have experienced increased volatility, depressed valuations, decreased liquidity and heightened uncertainty. These conditions may continue, recur, worsen or spread. A general rise in interest rates could adversely affect the price and liquidity of fixed-income securities and could also result in increased redemptions from the Fund.
At times, the Fund’s investments may represent industries or industry sectors that are interrelated or have common risks, making the Fund more susceptible to any economic, political, or regulatory developments or other risks affecting those industries and sectors. The Fund’s investments in foreign markets and countries with limited developing markets may subject
Pioneer Bond Fund | Annual Report | 6/30/21 101
the Fund to a greater degree of risk than investments in a developed market. These risks include disruptive political or economic conditions and the imposition of adverse governmental laws or currency exchange restrictions.
The Fund may invest in REIT securities, the value of which can fall for a variety of reasons, such as declines in rental income, fluctuating interest rates, poor property management, environmental liabilities, uninsured damage, increased competition, or changes in real estate tax laws.
The Fund invests in below-investment-grade (high-yield) debt securities and preferred stocks. Some of these high-yield securities may be convertible into equity securities of the issuer. Debt securities rated below-investment-grade are commonly referred to as “junk bonds” and are considered speculative. These securities involve greater risk of loss, are subject to greater price volatility, and are less liquid, especially during periods of economic uncertainty or change, than higher rated debt securities.
The Fund’s investments, payment obligations and financing terms may be based on floating rates, such as LIBOR (London Interbank Offered Rate). Plans are underway to phase out the use of LIBOR. The UK Financial Conduct Authority (“FCA”) and LIBOR’s administrator, ICE Benchmark Administration (“IBA”), have announced that most LIBOR rates will no longer be published after the end of 2021 and a majority of U.S. dollar LIBOR rates will no longer be published after June 30, 2023. It is possible that the FCA may compel the IBA to publish a subset of LIBOR settings after these dates on a “synthetic” basis, but any such publications would be considered non-representative of the underlying markets. Actions by regulators have resulted in the establishment of alternative reference rates to LIBOR in most major currencies. Based on the recommendations of the New York Federal Reserve’s Alternative Reference Rate Committee (comprised of major derivative market participants and their regulators), the U.S. Federal Reserve began publishing a Secured Overnight Funding Rate (“SOFR”) that is intended to replace U.S. Dollar LIBOR. Proposals for alternative reference rates for other currencies have also been announced or have already begun publication, such as SONIA in the United Kingdom. Markets are slowly developing in response to these new rates, and transition planning is at a relatively early stage. Neither the effect of the transition process nor its ultimate success is known. The transition process may lead to increased volatility and illiquidity in markets that currently rely on LIBOR to determine interest rates. The effect of any changes to — or discontinuation of — LIBOR on the portfolio will vary depending on, among other things, provisions in individual contracts and whether, how, and when industry participants develop and adopt new reference rates and alternative reference rates for both legacy and new products and
102 Pioneer Bond Fund | Annual Report | 6/30/21
instruments. Because the usefulness of LIBOR as a benchmark may deteriorate during the transition period, these effects could materialize prior to the end of 2021.
With the increased use of technologies such as the Internet to conduct business, the Fund is susceptible to operational, information security and related risks. While the Fund’s Adviser has established business continuity plans in the event of, and risk management systems to prevent, limit or mitigate, such cyber-attacks, there are inherent limitations in such plans and systems, including the possibility that certain risks have not been identified. Furthermore, the Fund cannot control the cybersecurity plans and systems put in place by service providers to the Fund such as Brown Brothers Harriman & Co., the Fund’s custodian and accounting agent, and DST Asset Manager Solutions, Inc., the Fund’s transfer agent. In addition, many beneficial owners of Fund shares hold them through accounts at broker-dealers, retirement platforms and other financial market participants over which neither the Fund nor the Adviser exercises control. Each of these may in turn rely on service providers to them, which are also subject to the risk of cyber-attacks. Cybersecurity failures or breaches at the Adviser or the Fund’s service providers or intermediaries have the ability to cause disruptions and impact business operations, potentially resulting in financial losses, interference with the Fund’s ability to calculate its net asset value, impediments to trading, the inability of Fund shareowners to effect share purchases, redemptions or exchanges or receive distributions, loss of or unauthorized access to private shareowner information and violations of applicable privacy and other laws, regulatory fines, penalties, reputational damage, or additional compliance costs. Such costs and losses may not be covered under any insurance. In addition, maintaining vigilance against cyber-attacks may involve substantial costs over time, and system enhancements may themselves be subject to cyber-attacks.
COVID-19
The respiratory illness COVID-19 caused by a novel coronavirus has resulted in a global pandemic and major disruption to economies and markets around the world, including the United States. Global financial markets have experienced extreme volatility and severe losses, and trading in many instruments has been disrupted. Liquidity for many instruments has been greatly reduced for periods of time. Some interest rates are very low and in some cases yields are negative. Some sectors of the economy and individual issuers have experienced particularly large losses. These circumstances may continue for an extended period of time, and may continue to affect adversely the value and liquidity of the Fund’s investments. The ultimate economic fallout from the pandemic, and the long-term impact on economies, markets, industries and individual issuers, are not known.
Pioneer Bond Fund | Annual Report | 6/30/21 103
Governments and central banks, including the Federal Reserve in the U.S., have taken extraordinary and unprecedented actions to support local and global economies and the financial markets. These actions have resulted in significant expansion of public debt, including in the U.S. The impact of these measures will not be known for some time. The consequences of high public debt, including its future impact on the economy and securities markets, likewise may not be known for some time.
The Fund’s prospectus contains unaudited information regarding the Fund’s principal risks. Please refer to that document when considering the Fund’s principal risks.
H. Restricted Securities
Restricted Securities are subject to legal or contractual restrictions on resale. Restricted securities generally are resold in transactions exempt from registration under the Securities Act of 1933. Private placement securities are generally considered to be restricted except for those securities traded between qualified institutional investors under the provisions of Rule 144A of the Securities Act of 1933.
Disposal of restricted investments may involve negotiations and expenses, and prompt sale at an acceptable price may be difficult to achieve. Restricted investments held by the Fund at June 30, 2021 are listed in the Schedule of Investments.
I. Insurance-Linked Securities (“ILS”)
The Fund invests in ILS. The Fund could lose a portion or all of the principal it has invested in an ILS, and the right to additional interest or dividend payments with respect to the security, upon the occurrence of one or more trigger events, as defined within the terms of an insurance-linked security. Trigger events, generally, are hurricanes, earthquakes, or other natural events of a specific size or magnitude that occur in a designated geographic region during a specified time period, and/or that involve losses or other metrics that exceed a specific amount. There is no way to accurately predict whether a trigger event will occur, and accordingly, ILS carry significant risk. The Fund is entitled to receive principal, and interest and/or dividend payments so long as no trigger event occurs of the description and magnitude specified by the instrument. In addition to the specified trigger events, ILS may expose the Fund to other risks, including but not limited to issuer (credit) default, adverse regulatory or jurisdictional interpretations and adverse tax consequences.
The Fund’s investments in ILS may include event-linked bonds. ILS also may include special purpose vehicles (“SPVs”) or similar instruments structured to comprise a portion of a reinsurer’s catastrophe-oriented
104 Pioneer Bond Fund | Annual Report | 6/30/21
business, known as quota share instruments (sometimes referred to as reinsurance sidecars), or to provide reinsurance relating to specific risks to insurance or reinsurance companies through a collateralized instrument, known as collateralized reinsurance. Structured reinsurance investments also may include industry loss warranties (“ILWs”). A traditional ILW takes the form of a bilateral reinsurance contract, but there are also products that take the form of derivatives, collateralized structures, or exchange-traded instruments.
Where the ILS are based on the performance of underlying reinsurance contracts, the Fund has limited transparency into the individual underlying contracts, and therefore must rely upon the risk assessment and sound underwriting practices of the issuer. Accordingly, it may be more difficult for the Adviser to fully evaluate the underlying risk profile of the Fund’s structured reinsurance investments, and therefore the Fund’s assets are placed at greater risk of loss than if the Adviser had more complete information. Structured reinsurance instruments generally will be considered illiquid securities by the Fund. These securities may be difficult to purchase, sell or unwind. Illiquid securities also may be difficult to value. If the Fund is forced to sell an illiquid asset, the Fund may be forced to sell at a loss.
J. Repurchase Agreements
Repurchase agreements are arrangements under which the Fund purchases securities from a broker-dealer or a bank, called the counterparty, upon the agreement of the counterparty to repurchase the securities from the Fund at a later date, and at a specific price, which is typically higher than the purchase price paid by the Fund. The securities purchased serve as the Fund’s collateral for the obligation of the counterparty to repurchase the securities. The value of the collateral, including accrued interest, is required to be equal to or in excess of the repurchase price. The collateral for all repurchase agreements is held in safekeeping in the customer-only account of the Fund’s custodian or a sub-custodian of the Fund. The Adviser is responsible for determining that the value of the collateral remains at least equal to the repurchase price. In the event of a default by the counterparty, the Fund is entitled to sell the securities, but the Fund may not be able to sell them for the price at which they were purchased, thus causing a loss to the Fund. Additionally, if the counterparty becomes insolvent, there is some risk that the Fund will not have a right to the securities, or the immediate right to sell the securities.
Open repurchase agreements at June 30, 2021, are disclosed in the Schedule of Investments.
Pioneer Bond Fund | Annual Report | 6/30/21 105
K. Futures Contracts
The Fund may enter into futures transactions in order to attempt to hedge against changes in interest rates, securities prices and currency exchange rates or to seek to increase total return. Futures contracts are types of derivatives. All futures contracts entered into by the Fund are traded on a futures exchange. Upon entering into a futures contract, the Fund is required to deposit with a broker an amount of cash or securities equal to the minimum “initial margin” requirements of the associated futures exchange. The amount of cash deposited with the broker as collateral at June 30, 2021, is recorded as “Futures collateral” on the Statement of Assets and Liabilities.
Subsequent payments for futures contracts (“variation margin”) are paid or received by the Fund, depending on the daily fluctuation in the value of the contracts, and are recorded by the Fund as unrealized appreciation or depreciation. Cash received from or paid to the broker related to previous margin movement is held in a segregated account at the broker and is recorded as either “Due from broker for futures” or “Due to broker for futures” on the Statement of Assets and Liabilities. When the contract is closed, the Fund realizes a gain or loss equal to the difference between the opening and closing value of the contract as well as any fluctuation in foreign currency exchange rates where applicable. Futures contracts are subject to market risk, interest rate risk and currency exchange rate risk. Changes in value of the contracts may not directly correlate to the changes in value of the underlying securities. With futures, there is reduced counterparty credit risk to the Fund since futures are exchange-traded and the exchange’s clearinghouse, as counterparty to all exchange-traded futures, guarantees the futures against default.
The average market value of futures contracts open during the year ended June 30, 2021, was $304,016,104. Open futures contracts outstanding at June 30, 2021, are listed in the Schedule of Investments.
L. Credit Default Swap Contracts
A credit default swap is a contract between a buyer of protection and a seller of protection against a pre-defined credit event or an underlying reference obligation, which may be a single security or a basket or index of securities. The Fund may buy or sell credit default swap contracts to seek to increase the Fund’s income, or to attempt to hedge the risk of default on portfolio securities. A credit default swap index is used to hedge risk or take a position on a basket of credit entities or indices.
As a seller of protection, the Fund would be required to pay the notional (or other agreed-upon) value of the referenced debt obligation to the counterparty in the event of a default by a U.S. or foreign corporate issuer of a debt obligation, which would likely result in a loss to the Fund. In
106 Pioneer Bond Fund | Annual Report | 6/30/21
return, the Fund would receive from the counterparty a periodic stream of payments during the term of the contract, provided that no event of default occurred. The maximum exposure of loss to the seller would be the notional value of the credit default swaps outstanding. If no default occurs, the Fund would keep the stream of payments and would have no payment obligation. The Fund may also buy credit default swap contracts in order to hedge against the risk of default of debt securities, in which case the Fund would function as the counterparty referenced above.
As a buyer of protection, the Fund makes an upfront or periodic payment to the protection seller in exchange for the right to receive a contingent payment. An upfront payment made by the Fund, as the protection buyer, is recorded within the “Swap contracts, at value” line item on the Statement of Assets and Liabilities. Periodic payments received or paid by the Fund are recorded as realized gains or losses on the Statement of Operations.
Credit default swap contracts are marked-to-market daily using valuations supplied by independent sources, and the change in value, if any, is recorded within the “Swap contracts, at value” line item on the Statement of Assets and Liabilities. Payments received or made as a result of a credit event or upon termination of the contract are recognized, net of the appropriate amount of the upfront payment, as realized gains or losses on the Statement of Operations.
Credit default swap contracts involving the sale of protection may involve greater risks than if the Fund had invested in the referenced debt instrument directly. Credit default swap contracts are subject to general market risk, liquidity risk, counterparty risk and credit risk. If the Fund is a protection buyer and no credit event occurs, it will lose its investment. If the Fund is a protection seller and a credit event occurs, the value of the referenced debt instrument received by the Fund, together with the periodic payments received, may be less than the amount the Fund pays to the protection buyer, resulting in a loss to the Fund. In addition, obligations under sell protection credit default swaps may be partially offset by net amounts received from settlement of buy protection credit default swaps entered into by the Fund for the same reference obligation with the same counterparty.
Certain swap contracts that are cleared through a central clearinghouse are referred to as centrally cleared swaps. All payments made or received by the Fund are pursuant to a centrally cleared swap contract with the central clearing party rather than the original counterparty. Upon entering into a centrally cleared swap contract, the Fund is required to make an initial margin deposit, either in cash or in securities. The daily change in value on open centrally cleared contracts is recorded as “Variation margin for centrally cleared swap contracts” on the Statement of Assets and
Pioneer Bond Fund | Annual Report | 6/30/21 107
Liabilities. Cash received from or paid to the broker related to previous margin movement is held in a segregated account at the broker and is recorded as either “Due from broker for swaps” or “Due to broker for swaps” on the Statement of Assets and Liabilities. The amount of cash deposited with a broker as collateral at June 30, 2021, is recorded as “Swaps collateral” on the Statement of Assets and Liabilities.
The average market value of credit default swap contracts open during the year ended June 30, 2021, was $(4,751,103). Open credit default swap contracts at June 30, 2021, are listed in the Schedule of Investments.
2. Management Agreement
The Adviser manages the Fund’s portfolio. Management fees are calculated daily and paid monthly at the annual rate of 0.40% of the Fund’s average daily net assets up to $500 million, 0.35% of the next $500 million of the Fund’s average daily net assets, 0.30% of the next $1 billion of the Fund’s average daily net assets, 0.25% of the next $8 billion of the Fund’s average daily net assets, and 0.225% of the Fund’s average daily net assets over $10 billion. The fee is accrued daily and paid monthly. For the year ended June 30, 2021, the effective management fee was equivalent to 0.28% of the Fund’s average daily net assets.
The Adviser has contractually agreed to limit ordinary operating expenses (ordinary operating expenses means all fund expenses other than extraordinary expenses, such as litigation, taxes, brokerage commissions and acquired fund fees and expenses) to the extent required to reduce Fund expenses to 0.85%, 1.10% and 0.50% of the average daily net assets attributable to Class A, Class R and Class Y shares, respectively. These expense limitations are in effect through November 1, 2021. There can be no assurance that the Adviser will extend the expense limitation agreement for a class of shares beyond the date referred to above. Fees waived and expenses reimbursed during the year ended June 30, 2021 are reflected on the Statement of Operations.
In addition, under the management and administration agreements, certain other services and costs, including accounting, regulatory reporting and insurance premiums, are paid by the Fund as administrative reimbursements. Included in “Due to affiliates” reflected on the Statement of Assets and Liabilities is $232,883 in management fees, administrative costs and certain other reimbursements payable to the Adviser at June 30, 2021.
3. Compensation of Trustees and Officers
The Fund pays an annual fee to its Trustees. The Adviser reimburses the Fund for fees paid to the Interested Trustees. The Fund does not pay any salary or other compensation to its officers. For the year ended June 30, 2021, the Fund paid $316,816 in Trustees’ compensation, which is reflected
108 Pioneer Bond Fund | Annual Report | 6/30/21
on the Statement of Operations as Trustees’ fees. At June 30, 2021, the Fund had a payable for Trustees’ fees on its Statement of Assets and Liabilities of $7,666.
4. Transfer Agent
DST Asset Manager Solutions, Inc. serves as the transfer agent to the Fund at negotiated rates. Transfer agent fees and payables shown on the Statement of Operations and the Statement of Assets and Liabilities, respectively, include sub-transfer agent expenses incurred through the Fund’s omnibus relationship contracts.
In addition, the Fund reimbursed the transfer agent for out-of-pocket expenses incurred by the transfer agent related to shareowner communications activities such as proxy and statement mailings, and outgoing phone calls. For the year ended June 30, 2021, such out-of-pocket expenses by class of shares were as follows:
| Shareowner Communications: | ||||
Class A | $ | 103,647 | ||
Class C | 7,227 | |||
Class K | 50,799 | |||
Class R | 3,899 | |||
Class Y | 91,238 | |||
| Total | $ | 256,810 | ||
5. Distribution and Service Plans
The Fund has adopted a distribution plan (the “Plan”) pursuant to Rule 12b-1 of the Investment Company Act of 1940 with respect to its Class A, Class C and Class R shares. Pursuant to the Plan, the Fund pays the Distributor 0.25% of the average daily net assets attributable to Class A shares as compensation for personal services and/or account maintenance services or distribution services with regard to Class A shares. Pursuant to the Plan, the Fund also pays the Distributor 1.00% of the average daily net assets attributable to Class C shares. The fee for Class C shares consists of a 0.25% service fee and a 0.75% distribution fee paid as compensation for personal services and/or account maintenance services or distribution services with regard to Class C shares. Pursuant to the Plan, the Fund also pays the Distributor 0.50% of the average daily net assets attributable to Class R shares for distribution services. Included in “Due to affiliates” reflected on the Statement of Assets and Liabilities is $47,642 in distribution fees payable to the Distributor at June 30, 2021.
The Fund also has adopted a separate service plan for Class R shares (the “Service Plan”). The Service Plan authorizes the Fund to pay securities dealers, plan administrators or other service organizations that agree to
Pioneer Bond Fund | Annual Report | 6/30/21 109
provide certain services to retirement plans or plan participants holding shares of the Fund a service fee of up to 0.25% of the Fund’s average daily net assets attributable to Class R shares held by such plans.
In addition, redemptions of Class A and Class C shares may be subject to a contingent deferred sales charge (“CDSC”). A CDSC of 1.00% may be imposed on redemptions of certain net asset value purchases of Class A shares within 12 months of purchase. Redemptions of Class C shares within 12 months of purchase are subject to a CDSC of 1.00%, based on the lower of cost or market value of shares being redeemed. Shares purchased as part of an exchange remain subject to any CDSC that applied to the original purchase of those shares. There is no CDSC for Class K, Class R or Class Y shares. Proceeds from the CDSCs are paid to the Distributor. For the year ended June 30, 2021, CDSCs in the amount of $7,295 were paid to the Distributor.
6. Line of Credit Facility
The Fund, along with certain other funds in the Pioneer Family of Funds, participates in a committed, unsecured revolving line of credit (“credit facility”). Borrowings are used solely for temporary or emergency purposes. The Fund may borrow up to the lesser of the amount available under the credit facility or the limits set for borrowing by the Fund’s prospectus and the 1940 Act. Effective February 4, 2021, the Fund participates in a facility in the amount of $450 million. Prior to February 4, 2021, the Fund participated in a facility in the amount of $300 million. Under such facility, depending on the type of loan, interest on borrowings is payable at the London Interbank Offered Rate (“LIBOR”) plus a credit spread. The Fund also pays both an upfront fee and an annual commitment fee to participate in a credit facility. The upfront fee in the amount of 0.10% of the total credit facility and the commitment fee in the amount of 0.25% of the daily unused portion of each lender’s commitment are allocated among participating funds based on an allocation schedule set forth in the credit agreement. For the year ended June 30, 2021, the Fund had no borrowings under the credit facility.
7. Additional Disclosures about Derivative Instruments and Hedging Activities
The Fund’s use of derivatives may enhance or mitigate the Fund’s exposure to the following risks:
Interest rate risk relates to the fluctuations in the value of interest-bearing securities due to changes in the prevailing levels of market interest rates.
Credit risk relates to the ability of the issuer of a financial instrument to make further principal or interest payments on an obligation or commitment that it has to the Fund.
110 Pioneer Bond Fund | Annual Report | 6/30/21
Foreign exchange rate risk relates to fluctuations in the value of an asset or liability due to changes in currency exchange rates.
Equity risk relates to the fluctuations in the value of financial instruments as a result of changes in market prices (other than those arising from interest rate risk or foreign exchange rate risk), whether caused by factors specific to an individual investment, its issuer, or all factors affecting all instruments traded in a market or market segment.
Commodity risk relates to the risk that the value of a commodity or commodity index will fluctuate based on increases or decreases in the commodities market and factors specific to a particular industry or commodity.
The fair value of open derivative instruments (not considered to be hedging instruments for accounting disclosure purposes) by risk exposure at June 30, 2021, was as follows:
| Foreign | ||||||||||||||||||||
| Statement of Assets | Interest | Credit | Exchange | Equity | Commodity | |||||||||||||||
| and Liabilities | Rate Risk | Risk | Rate Risk | Risk | Risk | |||||||||||||||
| Assets: | ||||||||||||||||||||
| Net unrealized | ||||||||||||||||||||
| appreciation on | ||||||||||||||||||||
| futures contracts | $ | 1,692,259 | $ | — | $ | — | $ | — | $ | — | ||||||||||
| Total Value | $ | 1,692,259 | $ | — | $ | — | $ | — | $ | — | ||||||||||
| Liabilities: | ||||||||||||||||||||
| Swap contracts, at value | $ | — | $ | 8,201,517 | $ | — | $ | — | $ | — | ||||||||||
| Total Value | $ | — | $ | 8,201,517 | $ | — | $ | — | $ | — | ||||||||||
The effect of derivative instruments (not considered to be hedging instruments for accounting disclosure purposes) on the Statement of Operations by risk exposure at June 30, 2021, was as follows:
| Foreign | ||||||||||||||||||||
| Statement of | Interest | Credit | Exchange | Equity | Commodity | |||||||||||||||
| Operations | Rate Risk | Risk | Rate Risk | Risk | Risk | |||||||||||||||
| Net realized gain | ||||||||||||||||||||
| (loss) on: | ||||||||||||||||||||
| Futures contracts | $ | (2,596,757 | ) | $ | — | $ | — | $ | — | $ | — | |||||||||
| Swap contracts | — | (3,625,908 | ) | — | — | — | ||||||||||||||
| Total Value | $ | (2,596,757 | ) | $ | (3,625,908 | ) | $ | — | $ | — | $ | — | ||||||||
| Change in net | ||||||||||||||||||||
| unrealized appreciation | ||||||||||||||||||||
| (depreciation) on: | ||||||||||||||||||||
| Futures contracts | $ | 4,932,373 | $ | — | $ | — | $ | — | $ | — | ||||||||||
| Swap contracts | — | 346,775 | — | — | — | |||||||||||||||
| Total Value | $ | 4,932,373 | $ | 346,775 | $ | — | $ | — | $ | — | ||||||||||
Pioneer Bond Fund | Annual Report | 6/30/21 111
To the Board of Trustees and the Shareholders of Pioneer Bond Fund:
Opinion on the Financial Statements
We have audited the accompanying statement of assets and liabilities of Pioneer Bond Fund (the “Fund”), including the schedule of investments, as of June 30, 2021, and the related statements of operations for the year then ended, the statements of changes in net assets for each of the two years in the period then ended, the financial highlights for each of the five years in the period then ended and the related notes (collectively referred to as the “financial statements”). In our opinion, the financial statements present fairly, in all material respects, the financial position of Pioneer Bond Fund at June 30, 2021, the results of its operations for the year then ended, the changes in its net assets for each of the two years in the period then ended, and its financial highlights for each of the five years in the period then ended in conformity with U.S. generally accepted accounting principles.
Basis for Opinion
These financial statements are the responsibility of the Fund’s management. Our responsibility is to express an opinion on the Fund’s financial statements based on our audits. We are a public accounting firm registered with the Public Company Accounting Oversight Board (United States) (“PCAOB”) and are required to be independent with respect to the Fund in accordance with the U.S. federal securities laws and the applicable rules and regulations of the Securities and Exchange Commission and the PCAOB.
We conducted our audits in accordance with the standards of the PCAOB. Those standards require that we plan and perform the audit to obtain reasonable assurance about whether the financial statements are free of material misstatement, whether due to error or fraud. The Fund is not required to have, nor were we engaged to perform, an audit of the Fund’s internal control over financial reporting. As part of our audits, we are required to obtain an understanding of internal control over financial reporting, but not for the purpose of expressing an opinion on the effectiveness of the Fund’s internal control over financial reporting. Accordingly, we express no such opinion.
112 Pioneer Bond Fund | Annual Report | 6/30/21
Our audits included performing procedures to assess the risks of material misstatement of the financial statements, whether due to error or fraud, and performing procedures that respond to those risks. Such procedures included examining, on a test basis, evidence regarding the amounts and disclosures in the financial statements. Our procedures included confirmation of securities owned as of June 30, 2021, by correspondence with the custodian and brokers or by other appropriate auditing procedures where replies from brokers were not received. Our audits also included evaluating the accounting principles used and significant estimates made by management, as well as evaluating the overall presentation of the financial statements. We believe that our audits provide a reasonable basis for our opinion.

We have served as the auditor of one or more investment companies in the Pioneer family of funds since 2017.
Boston, Massachusetts
August 26, 2021
August 26, 2021
Pioneer Bond Fund | Annual Report | 6/30/21 113
Qualified interest income is exempt from nonresident alien (NRA) tax withholding. The percentage of the Fund’s ordinary income distributions derived from qualified interest income was 63.70%.
114 Pioneer Bond Fund | Annual Report | 6/30/21
As required by law, the Fund has adopted and implemented a liquidity risk management program (the “Program”) that is designed to assess and manage liquidity risk. Liquidity risk is the risk that the Fund could not meet requests to redeem its shares without significant dilution of remaining investors’ interests in the Fund. The Fund’s Board of Trustees designated a liquidity risk management committee (the “Committee”) consisting of employees of Amundi Asset Management US, Inc. (the “Adviser”) to administer the Program.
The Committee provided the Board of Trustees with a report that addressed the operation of the Program and assessed its adequacy and effectiveness of implementation (the “Report”). The Report covered the period from January 1, 2020 through December 31, 2020 (the “Reporting Period”).
The Report confirmed that, throughout the Reporting Period, the Committee had monitored the Fund’s portfolio liquidity and liquidity risk on an ongoing basis, as described in the Program and in Board reporting throughout the Reporting Period.
The Report discussed the Committee’s annual review of the Program, which addressed, among other things, the following elements of the Program:
The Committee reviewed the Fund’s investment strategy and liquidity of portfolio investments during both normal and reasonably foreseeable stressed conditions. The Committee noted that the Fund’s investment strategy continues to be appropriate for an open-end fund, taking into account, among other things, whether and to what extent the Fund held less liquid and illiquid assets and the extent to which any such investments affected the Fund’s ability to meet redemption requests. In managing and reviewing the Fund’s liquidity risk, the Committee also considered the extent to which the Fund’s investment strategy involves a relatively concentrated portfolio or large positions in particular issuers, the extent to which the Fund uses borrowing for investment purposes, and the extent to which the Fund uses derivatives (including for hedging purposes). The Committee also reviewed the Fund’s short-term and long-term cash flow projections during both normal and reasonably foreseeable stressed conditions. In assessing the Fund’s cash flow projections, the Committee considered, among other factors, historical net redemption activity, redemption policies, ownership concentration, distribution channels, and the degree of certainty associated with the Fund’s short-term and long-term cash flow projections. The Committee also considered the Fund’s
Pioneer Bond Fund | Annual Report | 6/30/21 115
holdings of cash and cash equivalents, as well as borrowing arrangements and other funding sources, including, if applicable, the Fund’s participation in a credit facility, as components of the Fund’s ability to meet redemption requests. The Fund has adopted an in-kind redemption policy which may be utilized to meet larger redemption requests.
The Committee reviewed the Program’s liquidity classification methodology for categorizing the Fund’s investments into one of four liquidity buckets. In reviewing the Fund’s investments, the Committee considered, among other factors, whether trading varying portions of a position in a particular portfolio investment or asset class in sizes the Fund would reasonably anticipate trading, would be reasonably expected to significantly affect liquidity.
The Committee performed an analysis to determine whether the Fund is required to maintain a Highly Liquid Investment Minimum, and determined that no such minimum is required because the Fund primarily holds highly liquid investments.
The Report stated that the Committee concluded the Program operates adequately and effectively, in all material respects, to assess and manage the Fund’s liquidity risk throughout the Reporting Period.
116 Pioneer Bond Fund | Annual Report | 6/30/21
Trustees, Officers and Service Providers
Investment Adviser and Administrator
Amundi Asset Management US, Inc.
Investment Adviser and Administrator
Amundi Asset Management US, Inc.
Custodian and Sub-Administrator
Brown Brothers Harriman & Co.
Brown Brothers Harriman & Co.
Independent Registered Public Accounting Firm
Ernst & Young LLP
Ernst & Young LLP
Principal Underwriter
Amundi Distributor US, Inc.
Legal Counsel
Morgan, Lewis & Bockius LLP
Transfer Agent
DST Asset Manager Solutions, Inc.
Amundi Distributor US, Inc.
Legal Counsel
Morgan, Lewis & Bockius LLP
Transfer Agent
DST Asset Manager Solutions, Inc.
Proxy Voting Policies and Procedures of the Fund are available without charge, upon request, by calling our toll free number (1-800-225-6292). Information regarding how the Fund voted proxies relating to portfolio securities during the most recent 12-month period ended June 30 is publicly available to shareowners at www.amundi.com/us. This information is also available on the Securities and Exchange Commission’s web site at www.sec.gov.
Trustees and Officers
The Fund’s Trustees and officers are listed below, together with their principal occupations and other directorships they have held during at least the past five years. Trustees who are interested persons of the Fund within the meaning of the 1940 Act are referred to as Interested Trustees. Trustees who are not interested persons of the Fund are referred to as Independent Trustees. Each of the Trustees serves as a Trustee of each of the 45 U.S. registered investment portfolios for which Amundi US serves as investment adviser (the “Pioneer Funds”). The address for all Trustees and all officers of the Fund is 60 State Street, Boston, Massachusetts 02109.
The Statement of Additional Information of the Fund includes additional information about the Trustees and is available, without charge, upon request, by calling 1-800-225-6292.
Pioneer Bond Fund | Annual Report | 6/30/21 117
Independent Trustees
| Name, Age and Position | Term of Office and | Principal Occupation(s) During At Least | Other Directorships Held by Trustee |
| Held With the Fund | Length of Service | The Past Five Years | During At Least The Past Five Years |
| Thomas J. Perna (70) | Trustee since 2006. | Private investor (2004 – 2008 and 2013 – present); Chairman (2008 – 2013) | Director, Broadridge Financial |
Chairman of the Board | Serves until a successor | and Chief Executive Officer (2008 – 2012), Quadriserv, Inc. (technology | Solutions, Inc. (investor |
and Trustee | trustee is elected | products for securities lending industry); and Senior Executive Vice | communications and securities |
or earlier retirement | President, The Bank of New York (financial and securities services) | processing provider for financial | |
or removal. | (1986 – 2004) | services industry) (2009 – present); | |
Director, Quadriserv, Inc. (2005 – | |||
2013); and Commissioner, New | |||
Jersey State Civil Service | |||
Commission (2011 – 2015) | |||
| John E. Baumgardner, | Trustee since 2019. | Of Counsel (2019 – present), Partner (1983-2018), Sullivan & | Chairman, The Lakeville Journal |
| Jr. (70) | Serves until a successor | Cromwell LLP (law firm). | Company, LLC, (privately-held |
Trustee | trustee is elected | community newspaper group) | |
or removal. | (2015-present) | ||
| Diane Durnin (64) | Trustee since 2019. | Managing Director - Head of Product Strategy and Development, BNY | None |
Trustee | Serves until a successor | Mellon Investment Management (investment management firm) | |
trustee is elected | (2012-2018); Vice Chairman – The Dreyfus Corporation (2005 – 2018): | ||
or earlier retirement | Executive Vice President Head of Product, BNY Mellon Investment | ||
or removal. | Management (2007-2012); Executive Director- Product Strategy, Mellon | ||
Asset Management (2005-2007); Executive Vice President Head of Products, | |||
Marketing and Client Service, Dreyfus Corporation (investment management | |||
firm) (2000-2005); and Senior Vice President Strategic Product and Business | |||
Development, Dreyfus Corporation (1994-2000) |
118 Pioneer Bond Fund | Annual Report | 6/30/21
Independent Trustees (continued)
Name, Age and Position Held With the Fund | Term of Office and Length of Service | Principal Occupation(s) During At Least The Past Five Years | Other Directorships Held by Trustee During At Least The Past Five Years |
| Benjamin M. Friedman (76) | Trustee since 2008. | William Joseph Maier Professor of Political Economy, Harvard University | Trustee, Mellon Institutional Funds |
Trustee | Serves until a successor | (1972 – present) | Investment Trust and Mellon |
trustee is elected | Institutional Funds Master Portfolio | ||
or earlier retirement | (oversaw 17 portfolios in fund | ||
or removal. | complex) (1989 - 2008) | ||
| Craig C. MacKay (58) | Trustee since 2021. | Partner, England & Company, LLC (advisory firm) (2012 – present); Group | Board Member of Carver Bancorp, |
Trustee | Serves until a successor | Head – Leveraged Finance Distribution, Oppenheimer & Company | Inc. (holding company) and Carver |
trustee is elected | (investment bank) (2006 – 2012); Group Head – Private Finance & High | Federal Savings Bank, NA (2017 – | |
or earlier retirement | Yield Capital Markets Origination, SunTrust Robinson Humphrey | present); Advisory Council Member, | |
or removal. | (investment bank) (2003 – 2006); and Founder and Chief Executive Officer, | MasterShares ETF (2016 – 2017); | |
HNY Associates, LLC (investment bank) (1996 – 2003) | Advisory Council Member, The Deal | ||
(financial market information | |||
publisher) (2015 – 2016); Board | |||
Co-Chairman and Chief Executive | |||
Officer, Danis Transportation | |||
Company (privately-owned | |||
commercial carrier) (2000 – 2003); | |||
Board Member and Chief Financial | |||
Officer, Customer Access esources | |||
(privately-owned teleservices | |||
company) (1998 – 2000); Board | |||
Member, Federation of Protestant | |||
Welfare Agencies (human services | |||
agency) (1993 – present); and | |||
Board Treasurer, Harlem Dowling | |||
Westside Center (foster care | |||
agency) (1999 – 2018) |
Pioneer Bond Fund | Annual Report | 6/30/21 119
Name, Age and Position Held With the Fund | Term of Office and Length of Service | Principal Occupation(s) During At Least The Past Five Years | Other Directorships Held by TrusteeDuring At Least The Past Five Years |
| Lorraine H. Monchak (65) | Trustee since 2017. | Chief Investment Officer, 1199 SEIU Funds (healthcare workers union | None |
Trustee | (Advisory Trustee | pension funds) (2001 – present); Vice President – International | |
from 2014 - 2017). | Investments Group, American International Group, Inc. (insurance company) | ||
Serves until a successor | (1993 – 2001); Vice President – Corporate Finance and Treasury Group, | ||
trustee is elected | Citibank, N.A. (1980 – 1986 and 1990 – 1993); Vice President – Asset/Liability | ||
or earlier retirement | Management Group, Federal Farm Funding Corporation (government- | ||
or removal. | sponsored issuer of debt securities) (1988 – 1990); Mortgage Strategies | ||
Group, Shearson Lehman Hutton, Inc. (investment bank) (1987 – 1988); and | |||
Mortgage Strategies Group, Drexel Burnham Lambert, Ltd. (investment | |||
bank) (1986 – 1987) | |||
| Marguerite A. Piret (73) | Trustee since 1996. | Chief Financial Officer, American Ag Energy, Inc. (controlled environment | Director of New America High |
Trustee | Serves until a successor | and agriculture company) (2016 – present); and President and Chief | Income Fund, Inc. (closed-end |
trustee is elected | Executive Officer, Metric Financial Inc. (formerly known as Newbury Piret | investment company) (2004 – | |
or earlier retirement | Company) (investment banking firm) (1981 – 2019) | present); and Member, Board of | |
or removal. | Governors, Investment Company | ||
Institute (2000 – 2006) | |||
| Fred J. Ricciardi (74) | Trustee since 2014. | Private investor (2020 – present); Consultant (investment company | None |
Trustee | Serves until a successor | services) (2012 – 2020); Executive Vice President, BNY Mellon (financial and | |
trustee is elected | investment company services) (1969 – 2012); Director, BNY International | ||
or earlier retirement | Financing Corp. (financial services) (2002 – 2012); Director, Mellon | ||
or removal. | Overseas Investment Corp. (financial services) (2009 – 2012); Director, | ||
Financial Models (technology) (2005-2007); Director, BNY Hamilton | |||
Funds, Ireland (offshore investment companies) (2004-2007); Chairman/ | |||
Director, AIB/BNY Securities Services, Ltd., Ireland (financial services) | |||
(1999-2006); and Chairman, BNY Alternative Investment Services, Inc. | |||
(financial services) (2005-2007) |
120 Pioneer Bond Fund | Annual Report | 6/30/21
Interested Trustees
Name, Age and Position Held With the Fund | Term of Office and Length of Service | Principal Occupation(s) During At Least The Past Five Years | Other Directorships Held by Trustee During At Least The Past Five Years |
| Lisa M. Jones (59)* | Trustee since 2017. | Director, CEO and President of Amundi US, Inc. (investment management | None |
Trustee, President and | Serves until a successor | firm) (since September 2014); Director, CEO and President of Amundi Asset | |
Chief Executive Officer | trustee is elected or | Management US, Inc. (since September 2014); Director, CEO and President | |
earlier retirement | of Amundi Distributor US, Inc. (since September 2014); Director, CEO and | ||
or removal | President of Amundi Asset Management US, Inc. (since September 2014); | ||
Chair, Amundi US, Inc., Amundi Distributor US, Inc. and Amundi Asset | |||
Management US, Inc. (September 2014 – 2018); Managing Director, Morgan | |||
Stanley Investment Management (investment management firm) | |||
(2010 – 2013); Director of Institutional Business, CEO of International, | |||
Eaton Vance Management (investment management firm) (2005 – 2010); | |||
| and Director of Amundi Holdings US, Inc. (since 2017) | |||
| Kenneth J. Taubes (63)* | Trustee since 2014. | Director and Executive Vice President (since 2008) and Chief Investment | None |
Trustee | Serves until a successor | Officer, U.S. (since 2010) of Amundi US, Inc. (investment management firm); | |
trustee is elected or | Director and Executive Vice President and Chief Investment Officer, U.S. of | ||
earlier retirement | Amundi US (since 2008); Executive Vice President and Chief Investment | ||
or removal | Officer, U.S. of Amundi Asset Management US, Inc. (since 2009); Portfolio | ||
Manager of Amundi US (since 1999); and Director of Amundi Holdings US, | |||
Inc. (since 2017) | |||
* Ms. Jones and Mr. Taubes are Interested Trustees because they are officers or directors of the Fund’s investment adviser and certain of its affiliates. | |||
Pioneer Bond Fund | Annual Report | 6/30/21 121
Fund Officers
Name, Age and Position Held With the Fund | Term of Office and Length of Service | Principal Occupation(s) During At Least The Past Five Years | Other Directorships Held by Officer During At Least The Past Five Years |
| Christopher J. Kelley (56) | Since 2010. Serves at | Vice President and Associate General Counsel of Amundi US since | None |
Secretary and Chief | the discretion of | January 2008; Secretary and Chief Legal Officer of all of the Pioneer Funds | |
Legal Officer | the Board | since June 2010; Assistant Secretary of all of the Pioneer Funds from | |
September 2003 to May 2010; Vice President and Senior Counsel of | |||
Amundi US from July 2002 to December 2007 | |||
| Thomas Reyes (58) | Since 2010. Serves at | Assistant General Counsel of Amundi US since May 2013 and Assistant | None |
Assistant Secretary | the discretion of | Secretary of all the Pioneer Funds since June 2010; and Counsel of | |
the Board | Amundi US from June 2007 to May 2013 | ||
| Anthony J. Koenig, Jr. (57) | Since 2021. Serves at | Senior Vice President – Fund Treasury of Amundi US; Treasurer of all of | None |
Treasurer and Chief | the discretion of | the Pioneer Funds since May 2021; Assistant Treasurer of all of the Pioneer | |
Financial and | the Board | Funds from January 2021 to May 2021; and Chief of Staff, US Investment | |
Accounting Officer | Management of Amundi US from May 2008 to January 2021 | ||
| Luis I. Presutti (56) | Since 2000. Serves at | Director – Fund Treasury of Amundi US since 1999; and Assistant | None |
Assistant Treasurer | the discretion of | Treasurer of all of the Pioneer Funds since 1999 | |
the Board | |||
| Gary Sullivan (63) | Since 2002. Serves at | Senior Manager – Fund Treasury of Amundi US since 2012; and Assistant | None |
Assistant Treasurer | the discretion of | Treasurer of all of the Pioneer Funds since 2002 | |
the Board | |||
| Antonio Furtado (39) | Since 2020. Serves at | Fund Oversight Manager – Fund Treasury of Amundi US since 2020; | None |
Assistant Treasurer | the discretion of | Assistant Treasurer of all of the Pioneer Funds since 2020; and Senior | |
the Board | Fund Treasury Analyst from 2012 - 2020 | ||
| Michael Melnick (50) | Since July 2021. Serves | Vice President - Deputy Fund Treasurer of Amundi US since May 2021; | None |
Assistant Treasurer | at the discretion of | Assistant Treasurer of all of the Pioneer Funds since July 2021; Director | |
the Board | of Regulatory Reporting of Amundi US from 2001 – 2021; and Director of | ||
Tax of Amundi US from 2000 to 2001 |
122 Pioneer Bond Fund | Annual Report | 6/30/21
Fund Officers (continued)
Name, Age and Position Held With the Fund | Term of Office and Length of Service | Principal Occupation(s) During At Least The Past Five Years | Other Directorships Held by Officer During At Least The Past Five Years |
| John Malone (50) | Since 2018. Serves at | Managing Director, Chief Compliance Officer of Amundi US Asset | None |
Chief Compliance Officer | the discretion of | Management; Amundi Asset Management US, Inc.; and the Pioneer Funds | |
the Board | since September 2018; and Chief Compliance Officer of Amundi | ||
Distributor US, Inc. since January 2014. | |||
| Kelly O’Donnell (50) | Since 2006. Serves at | Vice President – Amundi Asset Management; and Anti-Money Laundering | None |
Anti-Money | the discretion of | Officer of all the Pioneer Funds since 2006 | |
Laundering Officer | the Board |
Pioneer Bond Fund | Annual Report | 6/30/21 123
This page was intentionally left blank.
124 Pioneer Bond Fund | Annual Report | 6/30/21
How to Contact Amundi
We are pleased to offer a variety of convenient ways for you to contact us for assistance or information.
Call us for:
Account Information, including existing accounts, new accounts, prospectuses, applications and service forms | 1-800-225-6292 |
FactFoneSM for automated fund yields, prices, | |
account information and transactions | 1-800-225-4321 |
| Retirement plans information | 1-800-622-0176 |
Write to us:
Amundi
P.O. Box 219427
Kansas City, MO 64121-9427
Amundi
P.O. Box 219427
Kansas City, MO 64121-9427
| Our toll-free fax | 1-800-225-4240 |
| Our internet e-mail address | us.askamundi@amundi.com/us |
(for general questions about Amundi only) | |
Visit our web site: www.amundi.com/us.
This report must be preceded or accompanied by a prospectus.
The Fund files a complete schedule of portfolio holdings with the Securities and Exchange Commission for the first and third quarters of each fiscal year as an exhibit to its reports on Form N-PORT. Shareholders may view the filed Form N-PORT by visiting the Commission’s web site at https://www.sec.gov.

Amundi Asset Management US, Inc.
60 State Street
Boston, MA 02109
www.amundi.com/us
60 State Street
Boston, MA 02109
www.amundi.com/us
Securities offered through Amundi Distributor US, Inc.,
60 State Street, Boston, MA 02109
Underwriter of Pioneer Mutual Funds, Member SIPC
© 2021 Amundi Asset Management US, Inc. 19398-15-0821
60 State Street, Boston, MA 02109
Underwriter of Pioneer Mutual Funds, Member SIPC
© 2021 Amundi Asset Management US, Inc. 19398-15-0821
ITEM 2. CODE OF ETHICS.
GENERAL AUDIT COMMITTEE APPROVAL POLICY:
(a) Disclose whether, as of the end of the period covered by the report, the registrant has adopted a code of ethics that applies to the registrant’s principal executive officer, principal financial officer, principal accounting officer or controller, or persons performing similar functions, regardless of whether these individuals are employed by the registrant or a third party. If the registrant has not adopted such a code of ethics, explain why it has not done so.
The registrant has adopted, as of the end of the period covered by this report, a code of ethics that applies to the registrant’s principal executive officer, principal financial officer, principal accounting officer and controller.
(b) For purposes of this Item, the term “code of ethics” means written standards that are reasonably designed to deter wrongdoing and to promote:
(1) Honest and ethical conduct, including the ethical handling of actual or apparent conflicts of interest between personal and professional relationships;
(2) Full, fair, accurate, timely, and understandable disclosure in reports and documents that a registrant files with, or submits to, the Commission and in other public communications made by the registrant;
(3) Compliance with applicable governmental laws, rules, and regulations;
(4) The prompt internal reporting of violations of the code to an appropriate person or persons identified in the code; and
(5) Accountability for adherence to the code.
(c) The registrant must briefly describe the nature of any amendment, during the period covered by the report, to a provision of its code of ethics that applies to the registrant’s principal executive officer, principal financial officer, principal accounting officer or controller, or persons performing similar functions, regardless of whether these individuals are employed by the registrant or a third party, and that relates to any element of the code of ethics definition enumerated in paragraph (b) of this Item. The registrant must file a copy of any such amendment as an exhibit pursuant to Item 10(a), unless the registrant has elected to satisfy paragraph (f) of this Item by posting its code of ethics on its website pursuant to paragraph (f)(2) of this Item, or by undertaking to provide its code of ethics to any person without charge, upon request, pursuant to paragraph (f)(3) of this Item.
The registrant has made no amendments to the code of ethics during the period covered by this report.
(d) If the registrant has, during the period covered by the report, granted a waiver, including an implicit waiver, from a provision of the code of ethics to the registrant’s principal executive officer, principal financial officer, principal accounting officer or controller, or persons performing similar functions, regardless of whether these individuals are employed by the registrant or a third party, that relates to one or more of the items set forth in paragraph (b) of this Item, the registrant must briefly describe the nature of the waiver, the name of the person to whom the waiver was granted, and the date of the waiver.
Not applicable.
(e) If the registrant intends to satisfy the disclosure requirement under paragraph (c) or (d) of this Item regarding an amendment to, or a waiver from, a provision of its code of ethics that applies to the registrant’s principal executive officer, principal financial officer, principal accounting officer or controller, or persons performing similar functions and that relates to any element of the code of ethics definition
enumerated in paragraph (b) of this Item by posting such information on its Internet website, disclose the registrant’s Internet address and such intention.
Not applicable.
(f) The registrant must:
(1) File with the Commission, pursuant to Item 12(a)(1), a copy of its code of ethics that applies to the registrant’s principal executive officer, principal financial officer, principal accounting officer or controller, or persons performing similar functions, as an exhibit to its annual report on this Form N-CSR (see attachment);
(2) Post the text of such code of ethics on its Internet website and disclose, in its most recent report on this Form N-CSR, its Internet address and the fact that it has posted such code of ethics on its Internet website; or
(3) Undertake in its most recent report on this Form N-CSR to provide to any person without charge, upon request, a copy of such code of ethics and explain the manner in which such request may be made. See Item 10(2)
ITEM 3. AUDIT COMMITTEE FINANCIAL EXPERT.
(a) (1) Disclose that the registrant’s board of trustees has determined that the registrant either:
(i) Has at least one audit committee financial expert serving on its audit committee; or
(ii) Does not have an audit committee financial expert serving on its audit committee.
The registrant’s Board of Trustees has determined that the registrant has at least one audit committee financial expert.
(2) If the registrant provides the disclosure required by paragraph (a)(1)(i) of this Item, it must disclose the name of the audit committee financial expert and whether that person is “independent.” In order to be considered “independent” for purposes of this Item, a member of an audit committee may not, other than in his or her capacity as a member of the audit committee, the board of trustees, or any other board committee:
(i) Accept directly or indirectly any consulting, advisory, or other compensatory fee from the issuer; or
(ii) Be an “interested person” of the investment company as defined in Section 2(a)(19) of the Act (15 U.S.C. 80a-2(a)(19)).
Mr. Fred J. Ricciardi, an independent trustee, is such an audit committee financial expert.
(3) If the registrant provides the disclosure required by paragraph (a)(1) (ii) of this Item, it must explain why it does not have an audit committee financial expert.
Not applicable.
ITEM 4. PRINCIPAL ACCOUNTANT FEES AND SERVICES.
(a) Disclose, under the caption AUDIT FEES, the aggregate fees billed for each of the last two fiscal years for professional services rendered by the principal accountant for the audit of the registrant’s annual financial statements or services that are normally provided by the accountant in connection with statutory and regulatory filings or engagements for those fiscal years.
The audit fees for the Fund were $67,200 payable to Ernst & Young LLP for the year ended June 30, 2021 and $60,000 for the year ended June 30, 2020.
(b) Disclose, under the caption AUDIT-RELATED FEES, the aggregate fees billed in each of the last two fiscal years for assurance and related services by the principal accountant that are reasonably related to the performance of the audit of the registrant’s financial statements and are not reported under paragraph (a) of this Item. Registrants shall describe the nature of the services comprising the fees disclosed under this category.
There were no audit-related services in 2021 or 2020.
(c) Disclose, under the caption TAX FEES, the aggregate fees billed in each of the last two fiscal years for professional services rendered by the principal accountant for tax compliance, tax advice, and tax planning. Registrants shall describe the nature of the services comprising the fees disclosed under this category.
The Fund paid aggregate non-audit fees to Ernst & Young LLP for tax services of $22,504 and $17,197 during the fiscal years ended June 30, 2021 and 2020, respectively.
(d) Disclose, under the caption ALL OTHER FEES, the aggregate fees billed in each of the last two fiscal years for products and services provided by the principal accountant, other than the services reported in paragraphs (a) through (c) of this Item. Registrants shall describe the nature of the services comprising the fees disclosed under this category.
There were no other fees in 2021 or 2020.
(e) (1) Disclose the audit committee’s pre-approval policies and procedures described in paragraph (c)(7) of Rule 2-01 of Regulation S-X.
PIONEER FUNDS
APPROVAL OF AUDIT, AUDIT-RELATED, TAX AND OTHER SERVICES
PROVIDED BY THE INDEPENDENT AUDITOR
SECTION I - POLICY PURPOSE AND APPLICABILITY
The Pioneer Funds recognize the importance of maintaining the independence of their outside auditors. Maintaining independence is a shared responsibility involving Amundi Asset Management US, Inc., the audit committee and the independent auditors.
The Funds recognize that a Fund’s independent auditors: 1) possess knowledge of the Funds, 2) are able to incorporate certain services into the scope of the audit, thereby avoiding redundant work, cost and disruption of Fund personnel and processes, and 3) have expertise that has value to the Funds. As a result, there are situations where it is desirable to use the Fund’s independent auditors for services in addition to the annual audit and where the potential for conflicts of interests are minimal. Consequently, this policy, which is intended to comply with Rule 210.2-01(C)(7), sets forth guidelines and procedures to be followed by the Funds when retaining the independent audit firm to perform audit, audit-related tax and other services under those circumstances, while also maintaining independence.
Approval of a service in accordance with this policy for a Fund shall also constitute approval for any other Fund whose pre-approval is required pursuant to Rule 210.2-01(c)(7)(ii).
In addition to the procedures set forth in this policy, any non-audit services that may be provided consistently with Rule 210.2-01 may be approved by the Audit Committee itself and any pre-approval that may be waived in accordance with Rule 210.2-01(c)(7)(i)(C) is hereby waived.
Selection of a Fund’s independent auditors and their compensation shall be determined by the Audit Committee and shall not be subject to this policy.
| SECTION II - POLICY | ||
SERVICE CATEGORY | SERVICE CATEGORY DESCRIPTION | SPECIFIC PRE-APPROVED SERVICE SUBCATEGORIES |
I. AUDIT SERVICES | Services that are directly | o Accounting research assistance |
related to performing the | o SEC consultation, registration | |
independent audit of the Funds | statements, and reporting | |
o Tax accrual related matters | ||
o Implementation of new accounting standards | ||
o Compliance letters (e.g. rating agency letters) | ||
o Regulatory reviews and assistance | ||
regarding financial matters | ||
o Semi-annual reviews (if requested) | ||
o Comfort letters for closed end offerings | ||
II. AUDIT-RELATED | Services which are not | o AICPA attest and agreed-upon procedures |
SERVICES | prohibited under Rule | o Technology control assessments |
210.2-01(C)(4) (the “Rule”) | o Financial reporting control assessments | |
and are related extensions of | o Enterprise security architecture | |
the audit services support the | assessment | |
audit, or use the knowledge/expertise | ||
gained from the audit procedures as a | ||
foundation to complete the project. | ||
In most cases, if the Audit-Related | ||
Services are not performed by the | ||
Audit firm, the scope of the Audit | ||
Services would likely increase. | ||
The Services are typically well-defined | ||
and governed by accounting | ||
professional standards (AICPA, | ||
SEC, etc.) | ||
AUDIT COMMITTEE APPROVAL POLICY | AUDIT COMMITTEE REPORTING POLICY | |
| o “One-time” pre-approval | o A summary of all such | |
| for the audit period for all | services and related fees | |
| pre-approved specific service | reported at each regularly | |
| subcategories. Approval of the | scheduled Audit Committee | |
| independent auditors as | meeting. | |
| auditors for a Fund shall | ||
| constitute pre approval for | ||
| these services. | ||
| o “One-time” pre-approval | o A summary of all such | |
| for the fund fiscal year within | services and related fees | |
| a specified dollar limit | (including comparison to | |
| for all pre-approved | specified dollar limits) | |
| specific service subcategories | reported quarterly. | |
| o Specific approval is | |
| needed to exceed the | |
| pre-approved dollar limit for | |
| these services (see general | |
| Audit Committee approval policy | |
| below for details on obtaining | |
| specific approvals) | |
| o Specific approval is | |
| needed to use the Fund’s | |
| auditors for Audit-Related | |
| Services not denoted as | |
| “pre-approved”, or | |
| to add a specific service | |
| subcategory as “pre-approved” | |
SECTION III - POLICY DETAIL, CONTINUED
SERVICE CATEGORY | SERVICE CATEGORY DESCRIPTION | SPECIFIC PRE-APPROVED SERVICE |
SUBCATEGORIES | ||
III. TAX SERVICES | Services which are not | o Tax planning and support |
| prohibited by the Rule, | o Tax controversy assistance | |
| if an officer of the Fund | o Tax compliance, tax returns, excise | |
| determines that using the | tax returns and support | |
| Fund’s auditor to provide | o Tax opinions | |
| these services creates | ||
| significant synergy in | ||
| the form of efficiency, | ||
| minimized disruption, or | ||
| the ability to maintain a | ||
| desired level of | ||
| confidentiality. | ||
| AUDIT COMMITTEE APPROVAL POLICY | AUDIT COMMITTEE REPORTING POLICY |
o “One-time” pre-approval | o A summary of |
for the fund fiscal year | all such services and |
within a specified dollar limit | related fees |
(including comparison | |
to specified dollar | |
limits) reported | |
quarterly. | |
o Specific approval is | |
| needed to exceed the | |
| pre-approved dollar limits for | |
| these services (see general | |
| Audit Committee approval policy | |
| below for details on obtaining | |
| specific approvals) | |
o Specific approval is | |
| needed to use the Fund’s | |
| auditors for tax services not | |
| denoted as pre-approved, or to | |
| add a specific service subcategory as | |
| “pre-approved” | |
SECTION III - POLICY DETAIL, CONTINUED
SERVICE CATEGORY | SERVICE CATEGORY DESCRIPTION | SPECIFIC PRE-APPROVED SERVICE |
SUBCATEGORIES | ||
IV. OTHER SERVICES | Services which are not | o Business Risk Management support |
| prohibited by the Rule, | o Other control and regulatory | |
A. SYNERGISTIC, | if an officer of the Fund | compliance projects |
UNIQUE QUALIFICATIONS | determines that using the | |
| Fund’s auditor to provide | ||
| these services creates | ||
| significant synergy in | ||
| the form of efficiency, | ||
| minimized disruption, | ||
| the ability to maintain a | ||
| desired level of | ||
| confidentiality, or where | ||
| the Fund’s auditors | ||
| posses unique or superior | ||
| qualifications to provide | ||
| these services, resulting | ||
| in superior value and | ||
| results for the Fund. | ||
AUDIT COMMITTEE APPROVAL POLICY | AUDIT COMMITTEE REPORTING POLICY |
o “One-time” pre-approval | o A summary of |
| for the fund fiscal year within | all such services and |
| a specified dollar limit | related fees |
(including comparison | |
to specified dollar | |
limits) reported | |
quarterly. | |
o Specific approval is | |
| needed to exceed the | |
| pre-approved dollar limits for | |
| these services (see general | |
| Audit Committee approval policy | |
| below for details on obtaining | |
| specific approvals) | |
o Specific approval is | |
| needed to use the Fund’s | |
| auditors for “Synergistic” or | |
| “Unique Qualifications” Other | |
| Services not denoted as | |
| pre-approved to the left, or to | |
| add a specific service | |
| subcategory as “pre-approved” | |
SECTION III - POLICY DETAIL, CONTINUED
SERVICE CATEGORY | SERVICE CATEGORY DESCRIPTION | SPECIFIC PROHIBITED SERVICE |
SUBCATEGORIES | ||
PROHIBITED SERVICES | Services which result | 1. Bookkeeping or other services |
| in the auditors losing | related to the accounting records or | |
| independence status | financial statements of the audit | |
| under the Rule. | client* | |
2. Financial information systems design | ||
| and implementation* | ||
3. Appraisal or valuation services, | ||
| fairness* opinions, or | ||
| contribution-in-kind reports | ||
4. Actuarial services (i.e., setting | ||
| actuarial reserves versus actuarial | ||
| audit work)* | ||
5. Internal audit outsourcing services* | ||
6. Management functions or human | ||
| resources | ||
7. Broker or dealer, investment | ||
| advisor, or investment banking services | ||
8. Legal services and expert services | ||
| unrelated to the audit | ||
9. Any other service that the Public | ||
| Company Accounting Oversight Board | ||
| determines, by regulation, is | ||
| impermissible | ||
AUDIT COMMITTEE APPROVAL POLICY | AUDIT COMMITTEE REPORTING POLICY |
o These services are not to be | o A summary of all |
| performed with the exception of the(*) | services and related |
| services that may be permitted | fees reported at each |
| if they would not be subject to audit | regularly scheduled |
| procedures at the audit client (as | Audit Committee meeting |
| defined in rule 2-01(f)(4)) level | will serve as continual |
| the firm providing the service. | confirmation that has |
not provided any | |
restricted services. |
GENERAL AUDIT COMMITTEE APPROVAL POLICY:
o For all projects, the officers of the Funds and the Fund’s auditors will each make an assessment to determine that any proposed projects will not impair independence.
o Potential services will be classified into the four non-restricted service categories and the “Approval of Audit, Audit-Related, Tax and Other Services” Policy above will be applied. Any services outside the specific pre-approved service subcategories set forth above must be specifically approved by the Audit Committee.
o At least quarterly, the Audit Committee shall review a report summarizing the services by service category, including fees, provided by the Audit firm as set forth in the above policy.
(2) Disclose the percentage of services described in each of paragraphs (b) through (d) of this Item that were approved by the audit committee pursuant to paragraph (c)(7)(i)(C) of Rule 2-01 of Regulation S-X.
Non-Audit Services
Beginning with non-audit service contracts entered into on or after May 6, 2003, the effective date of the new SEC pre-approval rules, the Fund’s audit committee is required to pre-approve services to affiliates defined by SEC rules to the extent that the services are determined to have a direct impact on the operations or financial reporting of the Fund. For the years ended June 30 2021 and 2020, there were no services provided to an affiliate that required the Fund’s audit committee pre-approval.
(f) If greater than 50 percent, disclose the percentage of hours expended on the principal accountants engagement to audit the registrant’s financial statements for the most recent fiscal year that were attributed to work performed by persons other than the principal accountant’s full-time, permanent employees.
N/A
(g) Disclose the aggregate non-audit fees billed by the registrants accountant for services rendered to the registrant, and rendered to the registrants investment adviser (not including any sub-adviser whose role is primarily portfolio management and is subcontracted with or overseen by another investment adviser), and any entity controlling, controlled by, or under common control with the adviser that provides ongoing services to the registrant for each of the last two fiscal years of the registrant.
The Fund paid aggregate non-audit fees to Ernst & Young LLP for tax services of $22,504 and $17,197 during the fiscal years ended June 30, 2021 and 2020, respectively.
(h) Disclose whether the registrants audit committee of the board of trustees has considered whether the provision of non-audit services that were rendered to the registrants investment adviser (not including any subadviser whose role is primarily portfolio management and is subcontracted with or overseen by another investment adviser), and any entity controlling, controlled by, or under common control with the investment adviser that provides ongoing services to the registrant that were not pre-approved pursuant to paragraph (c)(7)(ii) of Rule 2-01 of Regulation S-X is compatible with maintaining the principal accountant’s independence.
The Fund’s audit committee of the Board of Trustees has considered whether the provision of non-audit services that were rendered to the Affiliates (as defined) that were not pre- approved pursuant to paragraph (c)(7)(ii) of Rule 2-01 of Regulation S-X is compatible with maintaining the principal accountant’s independence.
ITEM 5. AUDIT COMMITTEE OF LISTED REGISTRANTS
(a) If the registrant is a listed issuer as defined in Rule 10A-3 under the Exchange Act (17 CFR 240.10A-3), state whether or not the registrant has a separately-designated standing audit committee established in accordance with Section 3(a)(58)(A) of the Exchange Act (15 U.S.C. 78c(a)(58)(A)). If the registrant has such a committee, however designated, identify each committee member. If the entire board of directors is acting as the registrant’s audit committee as specified in Section 3(a)(58)(B) of the Exchange Act (15 U.S.C. 78c(a)(58)(B)), so state.
N/A
(b) If applicable, provide the disclosure required by Rule 10A-3(d) under the Exchange Act (17 CFR 240.10A-3(d)) regarding an exemption from the listing standards for audit committees.
N/A
ITEM 6. SCHEDULE OF INVESTMENTS.
File Schedule of Investments in securities of unaffiliated issuers as of the close of the reporting period as set forth in 210.1212 of Regulation S-X [17 CFR 210.12-12], unless the schedule is included as part of the report to shareholders filed under Item 1 of this Form.
Included in Item 1
ITEM 7. DISCLOSURE OF PROXY VOTING POLICIES AND PROCEDURES FOR CLOSED-END MANAGEMENT INVESTMENT COMPANIES.
A closed-end management investment company that is filing an annual report on this Form N-CSR must, unless it invests exclusively in non-voting securities, describe the policies and procedures that it uses to determine how to vote proxies relating to portfolio securities, including the procedures that the company uses when a vote presents a conflict between the interests of its shareholders, on the one hand, and those of the company’s investment adviser; principal underwriter; or any affiliated person (as defined in Section 2(a)(3) of the Investment Company Act of 1940 (15 U.S.C. 80a-2(a)(3)) and the rules thereunder) of the company, its investment adviser, or its principal underwriter, on the other. Include any policies and procedures of the company’s investment adviser, or any other third party, that the company uses, or that are used on the company’s behalf, to determine how to vote proxies relating to portfolio securities.
Not applicable to open-end management investment companies.
ITEM 8. PORTFOLIO MANAGERS OF CLOSED-END MANAGEMENT INVESTMENT COMPANIES.
(a) If the registrant is a closed-end management investment company that is filing an annual report on this Form N-CSR, provide the following information:
(1) State the name, title, and length of service of the person or persons employed by or associated with the registrant or an investment adviser of the registrant who are primarily responsible for the day-to-day management of the registrant’s portfolio (“Portfolio Manager”). Also state each Portfolio Manager’s business experience during the past 5 years.
Not applicable to open-end management investment companies.
ITEM 9. PURCHASES OF EQUITY SECURITIES BY CLOSED-END MANAGEMENT INVESTMENT COMPANY AND AFFILIATED PURCHASERS.
(a) If the registrant is a closed-end management investment company, in the following tabular format, provide the information specified in paragraph (b) of this Item with respect to any purchase made by or on behalf of the registrant or any affiliated purchaser, as defined in Rule 10b-18(a)(3) under the Exchange Act (17 CFR 240.10b-18(a)(3)), of shares or other units of any class of the registrant’s equity securities that is registered by the registrant pursuant to Section 12 of the Exchange Act (15 U.S.C. 781).
Not applicable to open-end management investment companies.
ITEM 10. SUBMISSION OF MATTERS TO A VOTE OF SECURITY HOLDERS.
Describe any material changes to the procedures by which shareholders may recommend nominees to the registrant’s board of directors, where those changes were implemented after the registrant last provided disclosure in response to the requirements of Item 407(c)(2)(iv) of Regulation S-R(17 CFR 229.407)(as required by Item 22(b)(15)) of Schedule 14A (17 CFR 240.14a-101), or this Item.
There have been no material changes to the procedures by which the shareholders may recommend nominees to the registrant’s board of directors since the registrant last provided disclosure in response to the requirements of Item 407(c)(2)(iv) of Regulation S-R of Schedule 14(A) in its definitive proxy statement, or this item.
ITEM 11. CONTROLS AND PROCEDURES.
(a) Disclose the conclusions of the registrant’s principal executive and principal financials officers, or persons performing similar functions, regarding the effectiveness of the registrant’s disclosure controls and procedures (as defined in Rule 30a-3(c) under the Act (17 CFR 270.30a-3(c))) as of a date within 90 days of the filing date of the report that includes the disclosure required by this paragraph, based on the evaluation of these controls and procedures required by Rule 30a-3(b) under the Act (17 CFR 270.30(a)-3(b) and Rules 13a-15(b) or 15d-15(b) under the Exchange Act (17 CFR 240.13a-15(b) or 240.15d-15(b)).
The registrant’s principal executive officer and principal financial officer have concluded that the registrant’s disclosure controls and procedures are effective based on the evaluation of these controls and procedures as of a date within 90 days of the filing date of this report.
(b) Disclose any change in the registrant’s internal control over financial reporting (as defined in Rule 30a-3(d) under the Act (17CFR 270.30a-3(d)) that occured during the second fiscal quarter of the period covered by this report that has materially affected, or is reasonably likely to materially affect, the registrant’s internal control over financial reporting.
There were no significant changes in the registrant’s internal control over financial reporting that occurred during the second fiscal quarter of the period covered by this report that have materially affected, or are reasonably likely to materially affect, the registrant’s internal control over financial reporting.
Item 12. Disclosure of Securities Lending Activities for Closed-End Management Investment Companies.
(a) If the registrant is a closed-end management investment company, provide the following dollar amounts of income and compensation related to the securities lending activities of the registrant during its most recent fiscal year:
N/A
(1) Gross income from securities lending activities;
N/A
(2) All fees and/or compensation for each of the following securities lending activities and related services: any share of revenue generated by the securities lending program paid to the securities lending agent(s) (revenue split); fees paid for cash collateral management services (including fees deducted from a pooled cash collateral reinvestment vehicle) that are not included in the revenue split; administrative fees that are not included in the revenue split; fees for indemnification that are not included in the revenue split; rebates paid to borrowers; and any other fees relating to the securities lending program that are not included in the revenue split, including a description of those other fees;
N/A
(3) The aggregate fees/compensation disclosed pursuant to paragraph (2); and
N/A
(4) Net income from securities lending activities (i.e., the dollar amount in paragraph (1) minus the dollar amount in paragraph (3)).
If a fee for a service is included in the revenue split, state that the fee is included in the revenue split.
N/A
(b) If the registrant is a closed-end management investment company, describe the services provided to the registrant by the securities lending agent in the registrants most recent fiscal year.
N/A
ITEM 13. EXHIBITS.
(a) File the exhibits listed below as part of this Form. Letter or number the exhibits in the sequence indicated.
SIGNATURES
[See General Instruction F]
Pursuant to the requirements of the Securities Exchange Act of 1934 and the Investment Company Act of 1940, the registrant has duly caused this report to be signed on its behalf by the undersigned, thereunto duly authorized.
(Registrant) Pioneer Bond Fund
By (Signature and Title)* /s/ Lisa M. Jones
Lisa M. Jones, President and Chief Executive Officer
Date September 1, 2021
Pursuant to the requirements of the Securities Exchange Act of 1934 and the Investment Company Act of 1940, this report has been signed below by the following persons on behalf of the registrant and in the capacities and on the dates indicated.
By (Signature and Title)* /s/ Lisa M. Jones
Lisa M. Jones, President and Chief Executive Officer
Date September 1, 2021
By (Signature and Title)* /s/ Anthony J. Koenig, Jr.
Anthony J. Koenig, Jr., Treasurer and Chief Financial and Accounting Officer
Date September 1, 2021
* Print the name and title of each signing officer under his or her signature.