Beginning on January 1, 2021, as permitted by regulations adopted by the Commission, paper copies of the Fund’s shareholder reports will no longer be sent by mail, unless you specifically request paper copies of the reports from your financial intermediary or, if you invest directly through the Fund’s transfer agent, U.S. Bancorp Fund Services, LLC (the “Transfer Agent”), from the Transfer Agent. Instead, the reports will be made available on a website, and you will be notified by mail each time a report is posted and provided with a website link to access the report.
If you already elected to receive shareholder reports electronically, you will not be affected by this change and you need not take any action. You may elect to receive shareholder reports and other communications electronically by contacting your financial intermediary.
You may elect to receive all future reports in paper free of charge by contacting your financial intermediary or, if you invest directly through the Transfer Agent, by contacting the Transfer Agent at (855) 609-3680. Your election to receive reports in paper will apply to all funds held in your account if you invest through a financial intermediary or all funds within the fund complex if you invest directly through the Transfer Agent.
Semi-Annual Report
February 28, 2019
| | INVESTMENT PRODUCTS: NOT FDIC INSURED • NO BANK GUARANTEE • MAY LOSE VALUE | |
Semi-Annual Report • February 28, 2019
| Fund Objectives | The Fund seeks to achieve above average long-term capital appreciation. Current income is a secondary objective. The Fund invests primarily in common stocks and securities convertible into or exchangeable for common stock such as convertible preferred stock or convertible debt securities.
|
| What’s Inside | Letter from the Chairperson | 1 |
| | | |
| | Manager Overview | 1 |
| | | |
| | Fund at a Glance | 4 |
| | | |
| | Fund Expenses | 5 |
| | | |
| | Schedule of Investments | 6 |
| | | |
| | Statement of Assets & Liabilities | 8 |
| | | |
| | Statement of Operations | 9 |
| | | |
| | Statements of Changes in Net Assets | 10 |
| | | |
| | Financial Highlights | 11 |
| | | |
| | Notes to Financial Statements | 12 |
| | | |
| | Additional Information | 19 |
| | | |
| | Important Tax Information | 21 |
| | |
Letter from the
| Dear Shareholder, |
| Chairperson | |
| We are pleased to provide the semi-annual report of the Barrett Opportunity Fund, Inc.1 (the “Fund”) for the six-month period ended February 28th, 2019. |
| | |
| | The management team at Barrett Asset Management, LLC has prepared the enclosed Manager’s Overview, which includes a brief market overview, as well as a performance review. I urge you to read it as well as the accompanying financial statements. A detailed summary of the Fund’s performance and other pertinent information are also included in this report. I am sure you will find this report informative and useful. |
| | |
| | On behalf of the Directors and the Officers of the Fund, I thank you for your ongoing confidence in the Fund and its investment policies. |
| | |
| | Sincerely, |
| | |
| |  |
| | |
| | David H. Kochman |
| | |
| | Chairperson |
| | March 28, 2019 |
| | 1 | The Fund was formerly known as the Salomon Brothers Opportunity Fund Inc. The Fund name, investment manager and certain investment policies were changed effective December 1, 2006. |
Manager Overview | Market Overview |
| | As the calendar turned to 2019, the stock market reversed the negative trend of the previous quarter and rallied sharply for the first two months of the New Year. While December 2018 was the worst December since 1931, January 2019 was the best January the markets have experienced since 1987. |
| | |
| | Investors appear to be unsure of what to make of slowing global growth. On the one hand, a slowing global economy means slower earnings growth. On the other hand, it means lower interest rates. The rally in January and February suggested investors thought lower interest rates, particularly on intermediate bonds, and the Federal Reserve policy of pausing further hikes, were more important than slowdowns in global growth and earnings over the next year. Just six months ago it appeared that intermediate bond yields were heading to the mid-three percent range or higher. By the end of February, it appeared the mid-two percent range was more probable. With stock yields at nearly two percent combined with the likelihood of further dividend increases, stocks were once again competitive with bond yields that were just one half of a percent higher. |
| | We anticipate continued volatility going forward as investors try to calibrate the magnitude of any economic decline. If Europe, particularly Germany, continues to weaken due primarily to China’s slowdown, the earnings outlook may worsen and unsettle stock investors. Domestically, economic growth will prove to be very important in order to offset global weakness. It is clear that some of the most cyclical areas of the U.S. economy, such as auto and home sales, have peaked. Nonetheless, the U.S. consumer appears to be in sound financial shape. |
| | |
| | In brief, we do not expect a major correction in stock prices unless the global slowdown turns into a recession. With the nearly 12% gain in stock prices in the first two months of 2019, it would be surprising to see similar gains through the remainder of the year. |
| | |
| | Portfolio and Performance Review |
| | |
| | During the six month period ending February 28, 2019, the Fund declined -3.94% for the quarter compared to a -2.41% loss for the Lipper Large Cap Value Fund Index and a -3.04% loss for the S&P 500 Index. During the same period, the best performing sectors of the S&P 500 Index were Utilities, Real Estate and Consumer Staples. The worst performing sectors in the market were Energy, Materials and Consumer Discretionary. Financial Services and Industrials continue to have the largest sector weightings in the Fund. |
| | |
| | The highest contributing sectors to the Fund’s performance during the period were Health Care, Consumer Staples and Financials. The Industrials and Consumer Discretionary sectors were the largest detractors to the Fund’s performance. On an individual company basis, Bank of New York Mellon Corp., Thermo Fisher Scientific and Abbott Laboratories were the greatest contributors to the Fund’s quarterly performance. The worst performing stocks were Rayonier Inc., Koninklijke Philips and General Dynamics Corp. |
| | |
| | During the six month period, the Fund benefited from Brookfield Asset Management’s acquisition of Forest City. It was completed in December and was an all-cash deal. In addition, we exited our positions in Chubb and Intel. With the proceeds from these sales, we increased our positions in Apple, Berkshire Hathaway and Microsoft and started new positions in Thermo Fisher Scientific and Walt Disney. As a result of the trades, the concentration of the top five holdings has declined from 56% in August, to 52% of the Fund’s total assets in February. |
| | |
| | Thank you for your continued interest in the Fund. |
| | |
| | Sincerely, |
| |  |  |
| | Robert Milnamow | E. Wells Beck, CFA |
| | Portfolio Manager | Portfolio Manager |
| | Earnings growth is not representative of the Fund’s future performance. |
| | |
| | Past performance is not a guarantee of future results. |
| | |
| | The outlook, views, and opinions presented are those of the Adviser as of February 28, 2019. These are not intended to be a forecast of future events, a guarantee of future results, or investment advice. |
| | |
| | Must be preceded or accompanied by a prospectus. |
| | |
| | Mutual fund investing involves risk. Principal loss is possible. The Fund is non-diversified, which means that it can invest a higher percentage of its assets in any one issuer. Investing in a non-diversified fund may entail greater risks than is normally associated with more widely diversified funds. Small- and Medium- capitalization companies tend to have limited liquidity and greater price volatility than large-capitalization companies. Investing in foreign securities is subject to certain risks not associated with domestic investing, such as currency fluctuations and changes in political and economic conditions. These risks are magnified in emerging or developing markets. Some securities held by the fund may be illiquid and can be difficult to value and sell. |
| | |
| | The Lipper Large-Cap Value Funds Index includes funds that, by portfolio practice, invest at least 75% of their equity assets in companies with market capitalizations (on a three year weighted basis) above Lipper’s U.S. Diversified Equity large-cap floor. The S&P 500® Index is a capitalization weighted index of five hundred large capitalization stocks, which is designed to measure broad domestic securities markets. |
| | |
| | Investors cannot invest directly in an index. |
| | |
| | Fund holdings and sector allocations are subject to change and should not be considered a recommendation to buy or sell any security. For a complete list of portfolio holdings, please refer to the Schedule of Investments provided in this report. |
| | |
| | The Barrett Opportunity Fund is distributed by Quasar Distributors, LLC. |
Fund at a Glance (Unaudited)
Top Ten Holdings - as of 2/28/2019
(As a percentage of Total Investments)
| | Bank of New York Mellon Corp. | 14.9% | |
| | General Dynamics Corp. | 14.5% | |
| | Royal Dutch Shell PLC – Class A – ADR | 10.9% | |
| | Koninklijke Philips Electronics | | |
| | NV – NY Registered Shares – ADR | 7.9% | |
| | Automatic Data Processing, Inc. | 4.0% | |
| | 3M Co. | 3.6% | |
| | Microsoft Corp. | 3.4% | |
| | Alphabet, Inc. – Class C | 3.4% | |
| | Berkshire Hathaway, Inc. – Class B | 3.0% | |
| | Murphy Oil Corp. | 3.0% | |
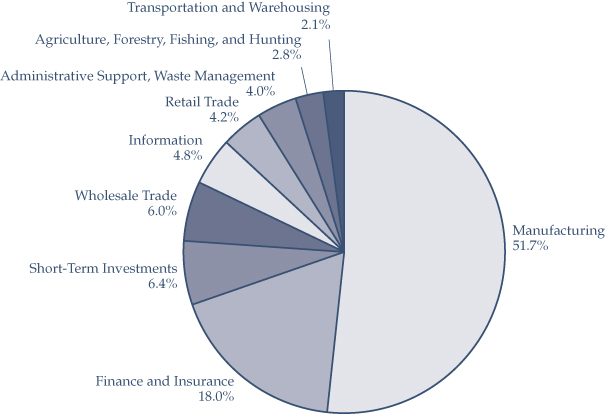
Sector Weightings - as of 2/28/2019
(As a percentage of Total Investments)
Fund Expenses (Unaudited)
Example
As a shareholder of the Fund, you may incur two types of costs: (1) transaction costs and (2) ongoing costs, including management fees and other Fund expenses. This example is intended to help you understand your ongoing costs (in dollars) of investing in the Fund and to compare these costs with the ongoing costs of investing in other mutual funds.
This example is based on an investment of $1,000 invested on September 1, 2018 and held for the six months ended February 28, 2019.
Actual Expenses
The row of the table below titled “Actual Barrett Opportunity Fund, Inc. Expenses” provides information about actual account values and actual expenses. You may use the information provided in this table, together with the amount you invested, to estimate the expenses that you paid over the period. To estimate the expenses you paid on your account, divide your ending account value by $1,000 (for example, an $8,600 ending account value divided by $1,000 = 8.6), then multiply the result by the number under the heading entitled “Expenses Paid During the Period.”
Hypothetical Example for Comparison Purposes
The row of the table below titled “Hypothetical Expenses” provides information about hypothetical account values and hypothetical expenses based on the actual expense ratio and an assumed rate of return of 5.00% per year before expenses, which is not the Fund’s actual return. The hypothetical account values and expenses may not be used to estimate the actual ending account balance or expenses you paid for the period. You may use the information provided in this table to compare the ongoing costs of investing in the Fund and other funds. To do so, compare the 5.00% hypothetical example relating to the Fund with the 5.00% hypothetical examples that appear in the shareholder reports of the other funds.
Please note that the expenses shown in the table below are meant to highlight your ongoing costs only and do not reflect any transactional costs. Therefore, the table is useful in comparing ongoing costs only, and will not help you determine the relative total costs of owning different funds. In addition, if these transaction costs were included, your costs would have been higher.
| | | | Expenses Paid |
| | Beginning | Ending | During the Period* |
| | Account | Account | September 1, 2018 to |
| | Value | Value | February 28, 2019 |
| Actual Barrett Opportunity Fund, Inc. Expenses | $1,000.00 | $ 960.60 | $5.74 |
| Hypothetical Expenses | | | |
| (5% return per year before expenses) | $1,000.00 | $1,018.94 | $5.91 |
| * | Expenses are equal to the Fund’s annualized six-month expense ratio of 1.18%, multiplied by the average account value over the period, multiplied by 181/365 (to reflect the one-half year period). |
Schedule of Investments
February 28, 2019 (Unaudited)
| Shares | | | | Value | |
| | | COMMON STOCKS - 89.74% | | | |
| | | | | | |
| | | Beverage and | | | |
| | | Tobacco Product | | | |
| | | Manufacturing - 2.00% | | | |
| | 10,000 | | PepsiCo., Inc. | | $ | 1,156,400 | |
| | | | | | | | |
| | | | Broadcasting | | | | |
| | | | (except Internet) - 1.36% | | | | |
| | 7,000 | | The Walt Disney Company | | | 789,880 | |
| | | | | | | | |
| | | | Building Material and | | | | |
| | | | Garden Equipment and | | | | |
| | | | Supplies Dealers - 1.28% | | | | |
| | 4,000 | | The Home Depot, Inc. | | | 740,560 | |
| | | | | | | | |
| | | | Chemical | | | | |
| | | | Manufacturing - 5.55% | | | | |
| | 12,000 | | Abbott Laboratories | | | 931,440 | |
| | 12,000 | | AbbVie, Inc. | | | 950,880 | |
| | 5,000 | | Johnson & Johnson | | | 683,200 | |
| | 15,000 | | Pfizer, Inc. | | | 650,250 | |
| | | | | | | 3,215,770 | |
| | | | Computer and | | | | |
| | | | Electronic Product | | | | |
| | | | Manufacturing - 12.35% | | | | |
| | 9,500 | | Apple, Inc. | | | 1,644,925 | |
| | 115,710 | | Koninklijke Philips Electronics | | | | |
| | | | NV - NY Registered | | | | |
| | | | Shares - ADR | | | 4,594,844 | |
| | 3,500 | | Thermo Fisher Scientific, Inc. | | | 908,495 | |
| | | | | | | 7,148,264 | |
| | | | Couriers and | | | | |
| | | | Messengers - 1.14% | | | | |
| | 6,000 | | United Parcel Service, | | | | |
| | | | Inc. - Class B | | | 661,200 | |
| | | | | | | | |
| | | | Credit Intermediation and | | | | |
| | | | Related Activities - 14.91% | | | | |
| | 164,471 | | The Bank of New York | | | | |
| | | | Mellon Corp. | | | 8,631,438 | |
| | | | | | | | |
| | | | Data Processing, Hosting | | | | |
| | | | and Related Services - 3.96% | | | | |
| | 15,000 | | Automatic Data | | | | |
| | | | Processing, Inc. | | | 2,295,450 | |
| | | | | | | | |
| | | | Insurance Carriers and | | | | |
| | | | Related Activities - 3.04% | | | | |
| | 8,750 | | Berkshire Hathaway, | | | | |
| | | | Inc. - Class B (a) | | | 1,761,375 | |
| | | | | | | | |
| | | | Merchant Wholesalers, | | | | |
| | | | Durable Goods - 2.45% | | | | |
| | 70,000 | | Jefferies Financial Group, Inc. | | | 1,418,900 | |
| | | | | | | | |
| | | | Miscellaneous | | | | |
| | | | Manufacturing - 3.58% | | | | |
| | 10,000 | | 3M Co. | | | 2,073,900 | |
| | | | | | | | |
| | | | Motor Vehicle and | | | | |
| | | | Parts Dealers - 2.93% | | | | |
| | 21,825 | | Murphy USA, Inc. (a) | | | 1,697,331 | |
| | | | | | | | |
| | | | Other Information | | | | |
| | | | Services - 3.38% | | | | |
| | 1,750 | | Alphabet, Inc. - Class C (a) | | | 1,959,860 | |
| | | | | | | | |
| | | | Petroleum and Coal Products | | | | |
| | | | Manufacturing - 13.89% | | | | |
| | 60,600 | | Murphy Oil Corp. | | | 1,751,340 | |
| | 101,100 | | Royal Dutch Shell PLC - | | | | |
| | | | Class A - ADR | | | 6,289,431 | |
| | | | | | | 8,040,771 | |
| | | | Publishing Industries | | | | |
| | | | (except Internet) - 3.39% | | | | |
| | 17,500 | | Microsoft Corp. | | | 1,960,525 | |
The accompanying notes are an integral part of these financial statements.
Schedule of Investments (continued)
February 28, 2019 (Unaudited)
| Shares | | | | Value | |
| | | COMMON STOCKS | | | |
| | | (continued) | | | |
| | | | | | |
| | | Transportation Equipment | | | |
| | | Manufacturing - 14.53% | | | |
| | 49,400 | | General Dynamics Corp. | | $ | 8,408,868 | |
| | | | Total Common Stocks | | | | |
| | | | (Cost $12,760,249) | | | 51,960,492 | |
| | | | | | | | |
| | | | REAL ESTATE INVESTMENT | | | | |
| | | | TRUSTS (REITS) - 3.78% | | | | |
| | | | | | | | |
| | | | Real Estate - 3.78% | | | | |
| | 24,854 | | Alexander & Baldwin, Inc. | | | 569,902 | |
| | 54,985 | | Rayonier, Inc. | | | 1,620,408 | |
| | | | Total Real Estate Investment | | | | |
| | | | Trusts (Cost $537,858) | | | 2,190,310 | |
| | | | | | | | |
| | | | SHORT-TERM | | | | |
| | | | INVESTMENTS - 6.44% | | | | |
| | | | | | | | |
| | | | Money Market Funds - 6.44% | | | | |
| | 3,729,558 | | Fidelity Institutional Money | | | | |
| | | | Market Fund - Government | | | | |
| | | | Portfolio - Class I, 2.28% (b) | | | 3,729,558 | |
| | | | Total Short-Term Investments | | | | |
| | | | (Cost $3,729,558) | | | 3,729,558 | |
| | | | Total Investments | | | | |
| | | | (Cost $17,027,665) - 99.96% | | | 57,880,360 | |
| | | | Other Assets in Excess | | | | |
| | | | of Liabilities - 0.04% | | | 21,241 | |
| | | | Total Net Assets - 100.00% | | $ | 57,901,601 | |
Percentages stated are a percentage of net assets.
ADR - American Depository Receipt
| (a) | Non-income producing security. |
| (b) | Rate shown is the 7-day effective yield as of February 28, 2019. |
Schedule Of Written Options
| Number of | | | | | |
| Contracts | | | | Value | |
| | | Call Options | | | |
| | 100 | | Bank of New York Mellon Corp. | | | |
| | | | Expiration: January 2020, | | | |
| | | | Exercise Price: $55.00 | | $ | 34,000 | |
| | 50 | | General Dynamics Corp. | | | | |
| | | | Expiration: January 2020, | | | | |
| | | | Exercise Price: $190.00 | | | 28,250 | |
| | | | Total Options Written | | | | |
| | | | (Premiums | | | | |
| | | | Received $76,378) | | $ | 62,250 | |
The accompanying notes are an integral part of these financial statements.
Statement of Assets & Liabilities
February 28, 2019 (Unaudited)
| ASSETS: | | | |
| Investments, at value (cost $17,027,665) | | $ | 57,880,360 | |
| Dividends and interest receivable | | | 149,899 | |
| Other assets | | | 13,567 | |
| Total Assets | | | 58,043,826 | |
| LIABILITIES: | | | | |
| Written options, at value (premium received $76,378) | | | 62,250 | |
| Payable to Adviser | | | 30,978 | |
| Payable to Directors | | | 6,368 | |
| Payable for fund shares redeemed | | | 41 | |
| Accrued audit expense | | | 8,870 | |
| Accrued printing and mailing expense | | | 12,533 | |
| Other accrued expenses | | | 21,185 | |
| Total Liabilities | | | 142,225 | |
| | | | | |
| NET ASSETS | | $ | 57,901,601 | |
| | | | | |
| NET ASSETS CONSIST OF: | | | | |
| Capital stock | | $ | 11,879,278 | |
| Total distributable earnings | | | 46,022,323 | |
| Total Net Assets | | $ | 57,901,601 | |
| | | | | |
| Shares outstanding | | | 2,262,390 | |
| Net asset value, offering price and redemption price | | | | |
| per share (15,000,000 shares authorized, $0.01 par value) | | $ | 25.59 | |
The accompanying notes are an integral part of these financial statements.
Statement of Operations
Period Ended February 28, 2019 (Unaudited)
| INVESTMENT INCOME: | | | |
| Dividend income* | | $ | 636,370 | |
| Interest income | | | 31,392 | |
| Total investment income | | | 667,762 | |
| | | | | |
| EXPENSES: | | | | |
| Investment advisory fees (see Note 2) | | | 206,740 | |
| Administration fees | | | 24,507 | |
| Directors’ fees and expenses | | | 20,272 | |
| Legal fees | | | 19,631 | |
| Federal and state registration fees | | | 15,299 | |
| Transfer agent fees and expenses | | | 14,851 | |
| Fund accounting fees | | | 14,365 | |
| Audit fees | | | 8,869 | |
| Reports to shareholders | | | 5,159 | |
| Custody fees | | | 2,668 | |
| Other | | | 16,922 | |
| Net expenses | | | 349,283 | |
| Net investment income | | | 318,479 | |
| | | | | |
| REALIZED AND UNREALIZED GAIN (LOSS) ON INVESTMENTS: | | | | |
| Net realized gain on: | | | | |
| Investments | | | 4,991,806 | |
| Total net realized gain | | | 4,991,806 | |
| Net change in unrealized appreciation (depreciation) on: | | | | |
| Investments | | | (8,140,198 | ) |
| Written options | | | 14,128 | |
| Total net change in unrealized depreciation | | | (8,126,070 | ) |
| Net realized and unrealized loss on investments | | | (3,134,264 | ) |
| NET DECREASE IN NET ASSETS RESULTING FROM OPERATIONS | | $ | (2,815,785 | ) |
| * | Net of $28,510 of foreign taxes withheld. |
The accompanying notes are an integral part of these financial statements.
Statements of Changes in Net Assets
| | | Period Ended | | | | |
| | | February 28, 2019 | | | Year Ended | |
| | | (Unaudited) | | | August 31, 2018 | |
| OPERATIONS: | | | | | | |
| Net investment income | | $ | 318,479 | | | $ | 797,659 | |
| Net realized gain on: | | | | | | | | |
| Investments | | | 4,991,806 | | | | 7,078,765 | |
| Written options | | | — | | | | 26,847 | |
| Change in net unrealized appreciation (depreciation) on: | | | | | | | | |
| Investments | | | (8,140,198 | ) | | | (1,720,218 | ) |
| Written options | | | 14,128 | | | | 79,350 | |
| Net increase (decrease) in net assets resulting from operations | | | (2,815,785 | ) | | | 6,262,403 | |
| | | | | | | | | |
| DIVIDENDS AND DISTRIBUTIONS TO SHAREHOLDERS: | | | | | | | | |
| Net dividends and distributions* | | | (7,624,961 | ) | | | (3,801,048 | ) |
| Total distributions | | | (7,624,961 | ) | | | (3,801,048 | ) |
| | | | | | | | | |
| CAPITAL SHARE TRANSACTIONS: | | | | | | | | |
| Shares sold | | | 1,050 | | | | 456,183 | |
| Shares issued in reinvestment of dividends | | | 4,405,220 | | | | 2,098,429 | |
| Shares redeemed | | | (844,028 | ) | | | (3,011,911 | ) |
| Net increase (decrease) in net assets | | | | | | | | |
| from capital share transactions | | | 3,562,242 | | | | (457,299 | ) |
| TOTAL INCREASE (DECREASE) IN NET ASSETS | | | (6,878,504 | ) | | | 2,004,056 | |
| | | | | | | | | |
| NET ASSETS: | | | | | | | | |
| Beginning of period | | | 64,780,105 | | | | 62,776,049 | |
| End of period (including accumulated undistributed net | | | | | | | | |
| investment income of $178,569 and $378,335, respectively) | | $ | 57,901,601 | | | $ | 64,780,105 | |
| * | Includes net investment income distributions and net realized gains on investments of $752,989 and $3,048,059, respectively, for year ended August 31, 2018. |
The accompanying notes are an integral part of these financial statements.
Financial Highlights
| | | Period Ended | | | | | | | | | | | | | | | | |
| | | February 28, | | | Year Ended August 31, | |
| | | 2019 | | | 2018 | | | 2017 | | | 2016 | | | 2015 | | | 2014 | |
| | | (Unaudited) | | | | | | | | | | | | | | | | |
| Per Share Data: | | | | | | | | | | | | | | | | | | |
| Net asset value, | | | | | | | | | | | | | | | | | | |
| beginning of year | | $ | 30.75 | | | $ | 29.62 | | | $ | 31.14 | | | $ | 31.52 | | | $ | 36.34 | | | $ | 33.53 | |
| | | | | | | | | | | | | | | | | | | | | | | | | |
| Income (loss) from | | | | | | | | | | | | | | | | | | | | | | | | |
| investment operations: | | | | | | | | | | | | | | | | | | | | | | | | |
| Net investment income | | | 0.15 | | | | 0.38 | | | | 0.23 | | | | 0.33 | | | | 0.29 | | | | 0.38 | |
| Net realized and unrealized | | | | | | | | | | | | | | | | | | | | | | | | |
| gain (loss) on investments | | | (1.66 | ) | | | 2.56 | | | | 5.31 | | | | 2.57 | | | | (1.40 | ) | | | 5.38 | |
| Total from | | | | | | | | | | | | | | | | | | | | | | | | |
| investment operations | | | (1.51 | ) | | | 2.94 | | | | 5.54 | | | | 2.90 | | | | (1.11 | ) | | | 5.76 | |
| | | | | | | | | | | | | | | | | | | | | | | | | |
| Less distributions: | | | | | | | | | | | | | | | | | | | | | | | | |
| Net investment income | | | (0.25 | ) | | | (0.36 | ) | | | (0.33 | ) | | | (0.28 | ) | | | (0.41 | ) | | | (0.30 | ) |
| Net realized gain | | | | | | | | | | | | | | | | | | | | | | | | |
| on investments | | | (3.40 | ) | | | (1.45 | ) | | | (6.73 | ) | | | (3.00 | ) | | | (3.30 | ) | | | (2.65 | ) |
| Total distributions | | | (3.65 | ) | | | (1.81 | ) | | | (7.06 | ) | | | (3.28 | ) | | | (3.71 | ) | | | (2.95 | ) |
| | | | | | | | | | | | | | | | | | | | | | | | | |
| Net asset value, end of year | | $ | 25.59 | | | $ | 30.75 | | | $ | 29.62 | | | $ | 31.14 | | | $ | 31.52 | | | $ | 36.34 | |
| | | | | | | | | | | | | | | | | | | | | | | | | |
| Total return | | | (3.94 | )%1 | | | 10.15 | % | | | 20.49 | % | | | 10.45 | % | | | (3.27 | )% | | | 18.06 | % |
| | | | | | | | | | | | | | | | | | | | | | | | | |
| Supplemental data and ratios: | | | | | | | | | | | | | | | | | | | | | | | | |
| Net assets, end | | | | | | | | | | | | | | | | | | | | | | | | |
| of year (millions) | | $ | 58 | | | $ | 65 | | | $ | 63 | | | $ | 60 | | | $ | 59 | | | $ | 68 | |
| Ratio of net expenses | | | | | | | | | | | | | | | | | | | | | | | | |
| to average net assets | | | 1.18 | %2 | | | 1.13 | % | | | 1.22 | % | | | 1.27 | % | | | 1.17 | % | | | 1.16 | % |
| Ratio of net investment income | | | | | | | | | | | | | | | | | | | | | | | | |
| to average net assets | | | 1.08 | %2 | | | 1.23 | % | | | 0.78 | % | | | 1.11 | % | | | 0.84 | % | | | 1.07 | % |
| Portfolio turnover rate | | | 6 | %1 | | | 4 | % | | | 1 | % | | | 6 | % | | | 2 | % | | | 1 | % |
| 1 | Not annualized for the six months ended February 28, 2019. |
| 2 | Annualized for the six months ended February 28, 2019. |
The accompanying notes are an integral part of these financial statements.
Notes to Financial Statements (Unaudited)
| 1. | ORGANIZATION AND SIGNIFICANT ACCOUNTING POLICIES | Barrett Opportunity Fund, Inc. (the “Fund”), a Maryland corporation organized in 1978, is registered as a non-diversified, open-end management investment company under the Investment Company Act of 1940, as amended (the “1940” Act). The Fund is an investment company and accordingly follows the investment company accounting and reporting guidance of the Financial Accounting Standards Board (“FASB”) Accounting Codification Topic 946 “Financial Services – Investment Companies.” The Fund’s investment objective is to achieve above average long-term capital appreciation. Current income is a secondary objective. |
|
|
|
|
| |
| In August 2018, FASB issued ASU 2018-13, Fair Value Measurement (Topic 820): Disclosure Framework – Changes to the Disclosure Requirements for Fair Value Measurement (“ASU 2018-13”). The primary focus of ASU 2018-13 is to improve the effectiveness of the disclosure requirements for fair value measurements. The changes affect all companies that are required to include fair value measurement disclosures. In general, the amendments in ASU 2018-13 are effective for all entities for fiscal years and interim periods within those fiscal years, beginning after December 15, 2019. An entity is permitted to early adopt the removed or modified disclosures upon the issuance of ASU 2018-13 and may delay adoption of the additional disclosures, which are required for public companies only, until their effective date. The Fund has early adopted this standard effective February 28, 2019, and the changes are incorporated into the financial statements. |
| | | |
| | | The following are significant accounting policies consistently followed by the Fund and are in conformity with generally accepted accounting principles in the United States of America (“GAAP”). |
| | | |
| | | (a) Investment Valuation |
| | | Equity securities, including common stocks and REITs, for which market quotations are available are valued at the last reported sales price or official closing price on the primary market or exchange on which they trade. |
| | | |
| | | Redeemable securities issued by open-end, registered investment companies, including money market funds, are valued at the net asset value (“NAV”) of such companies for purchase and / or redemption orders placed on that day. |
| | | |
| | | Exchange traded options, including options written, are valued at the composite price, using the National Best Bid and Offer quotes (“NBBO”). NBBO consists of the highest bid price and lowest ask price across any of the exchanges on which an option is quoted, thus providing a view across the entire U.S. options marketplace. Specifically, composite pricing looks at the last trades on the exchanges where the options are traded. If there are no trades for the option on a given business day, composite option pricing calculates the mean of the highest bid price and lowest ask price across the exchanges where the option is traded. |
| | | When prices are not readily available, or are determined not to reflect fair value, such as, when the value of a security has been significantly affected by events after the close of the exchange or market on which the security is principally traded, but before the Fund calculates its net asset value, the Fund values these securities at fair value as determined in accordance with procedures approved by the Fund’s Board of Directors. |
| | | |
| | | The Fund uses valuation techniques to measure fair value that are consistent with the market approach and/or income approach, depending on the type of the security and the particular circumstance. The market approach uses prices and other relevant information generated by market transactions involving identical or comparable securities. The income approach uses valuation techniques to discount estimated future cash flows to present value. |
| | | |
| | | Financial Accounting Standards Board (“FASB”) Accounting Standards Codification, “Fair Value Measurements and Disclosures” Topic 820 (“ASC Topic 820”), establishes a single definition of fair value, creates a three-tier hierarchy as a framework for measuring fair value based on inputs used to value the Fund’s investments, and requires additional disclosure about fair value. The hierarchy of inputs is summarized below: |
| | | • Level 1 – | quoted prices in active markets for identical investments as of the measurement date |
| | | | |
| | | • Level 2 – | other significant observable inputs (including quoted prices for similar investments, interest rates, prepayment speeds, credit risk, etc.) |
| | | | |
| | | • Level 3 – | significant unobservable inputs (including the Fund’s own assumptions in determining the fair value of investments) |
| | | Inputs refer broadly to the assumptions that market participants use to make valuation decisions, including assumptions about risk. Inputs may include price information, volatility statistics, specific and broad credit data, liquidity statistics, and other factors. A financial instrument’s level within the fair value hierarchy is based on the lowest level of input that is significant to the fair value measurement. However, the determination of what constitutes “observable” requires significant judgment by the Fund. The Fund considers observable data to be that market data which is readily available, regularly distributed or updated, reliable and verifiable, not proprietary, and provided by independent sources that are actively involved in the relevant market. The categorization of a financial instrument within the hierarchy is based upon the pricing transparency of the instrument and does not necessarily correspond to the Fund’s perceived risk of that instrument. |
| | | |
| | | Investments whose values are based on quoted market prices in active markets include listed equities, including common stocks and REITs, and certain money market securities, and are classified within Level 1. Instruments that trade in markets that are not considered to be active, but are valued based on quoted |
| | | market prices, dealer quotations or alternative pricing sources supported by observable inputs, are classified within Level 2. Investments classified within Level 3 have significant unobservable inputs, as they trade infrequently or not at all. |
| | | |
| | | The following is a summary of the inputs used in valuing the Fund’s assets carried at fair value as of the period ended February 28, 2019. The inputs and methodologies used to value securities may not be an indication of the risk associated with investing in these securities. |
| | | | | | | Other | | | | | | | |
| | | | | | | Significant | | | Significant | | | | |
| | | | Quoted | | | Observable | | | Unobservable | | | | |
| | | | Prices | | | Inputs | | | Inputs | | | | |
| | Description | | (Level 1) | | | (Level 2) | | | (Level 3) | | | Total | |
| | Assets | | | | | | | | | | | | |
| | Common Stocks | | $ | 51,960,492 | | | $ | — | | | $ | — | | | $ | 51,960,492 | |
| | REITs | | | 2,190,310 | | | | — | | | | — | | | | 2,190,310 | |
| | Money Market Funds | | | 3,729,558 | | | | — | | | | — | | | | 3,729,558 | |
| | Total Investments | | | | | | | | | | | | | | | | |
| | in Securities | | $ | 57,880,360 | | | $ | — | | | $ | — | | | $ | 57,880,360 | |
| | | | | | | | | | | | | | | | | | |
| | Liabilities | | | | | | | | | | | | | | | | |
| | Written Options | | $ | (34,000 | ) | | $ | (28,250 | ) | | $ | — | | | $ | (62,250 | ) |
| | | The Fund did not hold any Level 3 securities during the year. |
| | | |
| | | Derivative Instruments |
| | | The Fund may invest in derivative instruments. The use of derivatives included written options. |
| | | |
| | | Statement of Assets & Liabilities – Values of derivative instruments as of February 28, 2019: |
| | | | Liability Derivatives |
| | | Derivatives not | Statement of | |
| | | accounted for as | Assets and | |
| | | hedging instruments | Liabilities Location | Value |
| | | Equity Contracts – | Options written, | |
| | | Options | at value | $62,250 |
| | | The effect of derivative instruments on the Statement of Operations for the fiscal period ended February 28, 2019: |
| | | Derivatives not | |
| | | accounted for as | on Derivatives Transactions |
| | | hedging instruments | Written Options |
| | | Equity Contracts | $ — |
| | | Derivatives not | Change in Net Unrealized Appreciation |
| | | accounted for as | on Derivatives Recognized in Income |
| | | hedging instruments | Written Options |
| | | Equity Contracts | $14,128 |
| | | The Fund is not subject to any Master Netting Agreements; therefore, the Fund was not required to offset any assets or liabilities. |
| | | |
| | | (b) Options |
| | | GAAP requires enhanced disclosures about the Fund’s derivative activities, including how such activities are accounted for and their effect on the Fund’s financial position and results of operations. |
| | | |
| | | The Fund is subject to equity price risk in the normal course of pursuing its investment objective. The Fund enters into written call options to hedge against changes in the value of equities. The Fund’s option component of the overall investment strategy is often referred to as a “buy-write” strategy (also called a “covered call” strategy), in which the Adviser (as defined below) writes (sells) a call option contract while at the same time owning an equivalent number of shares of the underlying stock to generate moderate current income. The writing of call options is intended to reduce the volatility of the portfolio and to earn premium income. Written call options expose the Fund to minimal counterparty credit risk since they are exchange traded and the exchange’s clearing house guarantees the options against default. |
| | | |
| | | As the writer of a call option, the Fund has the obligation to sell the security at the exercise price during the exercise period in the event the option is exercised. |
| | | |
| | | When the Fund writes an option, an amount equal to the premium received by the Fund is recorded as a liability and is subsequently adjusted to the current fair value of the option written. Premiums received from writing options that expire unexercised are treated by the Fund on the expiration date as realized gains from options written. The difference between the premium and the amount paid on effecting a closing purchase transaction, including brokerage commissions, is also treated as a realized gain, or, if the premium is less than the amount paid for the closing purchase transaction, as a realized loss. If a call option is exercised, the premium is added to the proceeds from the sale of the underlying security or currency in determining whether the Fund has realized a gain or a loss. The Fund as writer of an option bears the market risk of an unfavorable change in the price of the security underlying the written option. The average notional amount for written options during the period ended February 28, 2019, was $196,557. |
| | | |
| | | (c) Security Transactions and Investment Income |
| | | Security transactions are accounted for on a trade date basis. Interest income, adjusted for amortization of premium and accretion of discount, is recorded on the accrual basis. Dividend income is recorded on the ex-dividend date. Under applicable tax laws, a withholding tax may be imposed on interest, dividends, and |
| | | capital gains at various rates and withholding taxes on foreign dividends have been provided for in accordance with the Fund’s understanding of the applicable country’s tax rules and rates. The cost of investments sold is determined by use of the specific identification method for computing the gain/loss on the transaction. It is the Fund’s policy to recognize a loss on a worthless security once it is determined beyond a reasonable doubt that there is no possibility of future worth. Proceeds from bankruptcy settlements will generally be recognized as a realized gain if the security is no longer held and as a return of capital if the security is still held. |
| | | |
| | | (d) Distributions to Shareholders |
| | | The Fund will distribute any net investment income and any net realized long- or short-term capital gains at least annually. Distributions from net realized gains for book purposes may include short-term capital gains. All short-term capital gains are included in ordinary income for tax purposes. Distributions to shareholders are recorded on the ex-dividend date. The Fund may also pay a special distribution at the end of the calendar year to comply with federal tax requirements. |
| | | |
| | | (e) REIT Distributions |
| | | The character of distributions received from REITs held by the Fund is generally comprised of net investment income, capital gains, and return of capital. It is the policy of the Fund to estimate the character of distributions received from underlying REITs based on historical data provided by the REITs. After each calendar year end, REITs report the actual tax character of these distributions. Differences between the estimated and actual amounts reported by the REITs are reflected in the Fund’s records in the year in which they are reported by the REITs by adjusted related investment cost basis, capital gains and income, as necessary. |
| | | |
| | | (f) Federal Income Taxes |
| | | It is the Fund’s policy to comply with the federal income and excise tax requirements of subchapter M of the Internal Revenue Code of 1986, as amended (the “Code”), necessary to qualify as a regulated investment company. Accordingly, the Fund intends to distribute its taxable income and net realized gains, if any, to shareholders in accordance with timing requirements imposed by the Code. Therefore, no federal income tax provision is provided in the Fund’s financial statements. |
| | | |
| | | As of and during the year ended August 31, 2018, the Fund did not have a liability of any unrecognized tax benefits. The Fund recognizes interest and penalties, if any, related to uncertain tax benefits as income tax expense in the Statement of Operations. During the year, the Fund did not incur any interest or penalties. The Fund is not subject to examination by U.S. taxing authorities for tax periods prior to 2015. |
| | | |
| | | (g) Use of Estimates |
| | | The preparation of financial statements in conformity with GAAP requires management to make estimates and assumptions that affect the reported amounts of assets and liabilities and disclosure of contingent assets and |
| | | liabilities as the date of the financial statements and the reported amounts of revenues and expenses during the reporting period. Actual results could differ from those estimates. |
| | | |
| | | (h) Indemnification |
| | | In the normal course of business, the Fund enters into contracts that contain general indemnification clauses. The Fund’s maximum exposure under these agreements is unknown, as this would involve future claims against the Fund that have not yet occurred. Based on experience, the Fund expects the risk of loss to be remote. |
| | | |
| | | (i) Beneficial Ownership |
| | | The beneficial ownership, either directly or indirectly, of more than 25% of the voting securities of a fund creates a presumption of control of the fund, under Section 2(a)(9) of the 1940 Act. At February 28, 2019 John B. Gaguine had control of 29.73% of the outstanding shares of the Fund. |
| | | |
| 2. | INVESTMENT ADVISER | The Fund has an Investment Advisory Agreement with Barrett Asset Management, LLC (“Barrett Asset Management” or the “Adviser”). Under the Investment Advisory Agreement, the Fund pays an advisory fee, calculated daily and paid monthly, in accordance with the following breakpoint schedule: |
|
| | WITH AFFILIATES | Average Daily Net Assets | Annual Rate |
| | First $1 billion
| 0.700% |
| | Next $1 billion
| 0.675% |
| | Next $3 billion
| 0.650% |
| | | Next $5 billion
| 0.625% |
| | | Over $10 billion | 0.600% |
| | | For the period ended February 28, 2019, the advisory fee totaled $206,740. |
| | | |
| | | The officers of the Fund are also officers and employees of Barrett Asset Management and do not receive compensation from the Fund. |
| | | |
| 3. | INVESTMENTS | During the period ended February 28, 2019, the aggregate cost of purchases and proceeds from sales of investments (excluding short-term investments) were as follows: |
| | | Purchases | Sales |
| | | $3,688,997 | $3,636,037 |
| 4. | CAPITAL SHARES | At February 28, 2019, the Fund had 15,000,000 shares of capital stock authorized with a par value of $0.01 per share. Transactions in shares of the Fund were as follows: |
| | | | Period Ended | | | Year Ended | |
| | | | February 28, 2019 | | | August 31, 2018 | |
| | Shares sold | | | 38 | | | | 14,687 | |
| | Shares issued on reinvestment | | | 186,110 | | | | 70,464 | |
| | Shares redeemed | | | (30,227 | ) | | | (98,234 | ) |
| | Net increase (decrease) | | | 155,921 | | | | (13,083 | ) |
| 5. | INCOME TAX | The tax character of distributions paid during the fiscal years ended August 31 |
| | INFORMATION | were as follows: |
| | AND | | | | 2018 | | | | 2017 | |
| | DISTRIBUTIONS | Distributions Paid From: | | | | | | | | |
| | TO | Ordinary income | | $ | 1,058,532 | | | $ | 658,337 | |
| | SHAREHOLDERS | Long-term capital gain | | | 2,742,516 | | | | 12,751,125 | |
| | | Total Distributions Paid | | $ | 3,801,048 | | | $ | 13,409,462 | |
| | | The Funds designated as long-term capital gain dividend, pursuant to Internal Revenue Code Section 852(b)(3), to reduce the earnings and profits of the Fund related to net capital gain to zero for the tax year ended August 31, 2018. |
| | | |
| | | The Fund utilized earnings and profits distributed to shareholders on redemptions of shares as part of the dividend paid deduction. |
| | | |
| | | As of August 31, 2018, the components of accumulated earnings (losses) for income tax purposes were as follows: |
| | Tax cost of Investments | | $ | 15,718,485 | |
| | Unrealized Appreciation | | | 49,155,381 | |
| | Unrealized Depreciation | | | (162,488 | ) |
| | Net unrealized appreciation (depreciation) | | | 48,992,893 | |
| | Undistributed operating income | | | 431,260 | |
| | Undistributed long-term gains | | | 7,064,291 | |
| | Distributable earnings | | | 7,495,551 | |
| | Other accumulated gain/(loss) | | | (25,375 | ) |
| | Total accumulated gain/(loss) | | $ | 56,463,069 | |
| | | Additionally, U.S. generally accepted accounting principles require that certain components of net assets relating to permanent differences be reclassified between financial and tax reporting. These reclassifications have no effect on net assets or net asset value per share. For the year ended August 31, 2018, the following table shows the reclassifications made: |
| | | Undistributed Net | Accumulated Net | Paid-In |
| | | Investment Income/(Loss) | Realized Gain/(Loss) | Capital |
| | | $ — | $ — | $ — |
Additional Information (Unaudited)
1. INFORMATION ABOUT DIRECTORS AND OFFICERS
The business and affairs of the Fund are conducted by management under the supervision and subject to the direction of its Board of Directors. The business address of each Director is c/o Barrett Asset Management, LLC, the Fund’s investment manager (“Barrett Asset Management”), 90 Park Avenue, 34th Floor, New York, New York, 10016. Information pertaining to the Directors and officers of the Fund is set forth below.
The Statement of Additional Information includes additional information about the Directors and is available, without charge, upon request by calling the Fund at 1-877-363-6333.
| | | | | Number of | |
| | | | | Portfolios | |
| | | | | in Fund | Other Board |
| | Position(s) | Term of Office* | | Complex | Memberships |
| Name, Address | Held with | and Length of | Principal Occupation(s) | Overseen | Held by |
and Birth Year | Fund | Time Served** | During Past 5 Years | by Director | Director |
INDEPENDENT DIRECTORS†: | | | |
| Barry Handel, CPA | Director | Since 2005 | Partner, Shalik, Morris & | 1 | None |
| Birth Year: 1951 | | | Company, LLP | | |
| | | | (accounting firm) | | |
| | | | | | |
David H. Kochman(1) | Director | Since 2011 | Member, Harris Beach PLLC | 1 | None |
| Birth Year: 1959 | Chairperson | Since 2017 | (law firm) | | |
| | | | | | |
Rosalind A. Kochman(2) | Director | Since 1990 | Retired (since 2002); formerly, | 1 | None |
| Birth Year: 1937 | | | Chief Executive Officer, | | |
| | | | Brooklyn Eye Surgery Center, | | |
| | | | and Administrator, Kochman, | | |
| | | | Lebowitz & Mogil, MDs | | |
| | | | | | |
| William Morris, Jr., CPA | Director | Since 2005 | President, William | 1 | None |
| Birth Year: 1948 | | | Morris & Associates P.C. | | |
| | | | (accounting firm) | | |
| (1) | | Mr. Kochman is Ms. Kochman’s son. |
| (2) | | Ms. Kochman is Mr. Kochman’s mother. |
† | | Directors who are not “interested persons” of the Fund within the meaning of Section 2(a)(19) of the 1940 Act. |
| | | | | Number of | |
| | | | | Portfolios | |
| | | | | in Fund | Other Board |
| | Position(s) | Term of Office* | | Complex | Memberships |
| Name, Address | Held with | and Length of | Principal Occupation(s) | Overseen | Held by |
and Birth Year | Fund | Time Served** | During Past 5 Years | by Director | Director |
| OFFICERS: | | | | | |
| Peter H. Shriver, CFA | President | Since 2006 | Chief Executive Officer | N/A | N/A |
| Barrett Asset Management | and Chief | | of Barrett Asset | | |
| 90 Park Avenue | Executive | | Management (since 2011); | | |
| New York, NY 10016 | Officer | | President of Barrett Asset | | |
| Birth Year: 1952 | | | Management (2011-2014) | | |
| | | | | | |
| E. Wells Beck, CFA | Vice | Since 2010 | Managing Director and | N/A | N/A |
| Barrett Asset Management | President | | Director of Research, Barrett | | |
| 90 Park Avenue | and | | Asset Management | | |
| New York, NY 10016 | Investment | | (since 2011) | | |
| Birth Year: 1968 | Officer | | | | |
| | | | | | |
| Robert J. Milnamow | Vice | Since 2014 | President and Chief | N/A | N/A |
| Barrett Asset Management | President | | Investment Officer of | | |
| 90 Park Avenue | and Chief | | Barrett Asset Management | | |
| New York, NY 10016 | Investment | | (since 2011); Executive Vice | | |
| Birth Year: 1950 | Officer | | President, Barrett Asset | | |
| | | | Management (2006-2014) | | |
| | | | | | |
| Madeleine Morreale | Chief | Since 2011 | Chief Compliance Officer, | N/A | N/A |
| Barrett Asset Management | Compliance | | Barrett Asset Management | | |
| 90 Park Avenue | Officer | | (2011-Present) | | |
| New York, NY 10016 | and | | | | |
| Birth Year: 1956 | Anti-Money | | | | |
| | Laundering | | | | |
| | Officer | | | | |
| | | | | | |
| John G. Youngman | Chief | Since 2011 | Managing Director, | N/A | N/A |
| Barrett Asset Management | Financial | | Barrett Asset Management | | |
| 90 Park Avenue | Officer | | (2011-Present) | | |
| New York, NY 10016 | and | | | | |
| Birth Year: 1968 | Treasurer | | | | |
| * | Directors and officers serve until their respective successor has been duly elected and qualified or until their earlier death, resignation, retirement or removal. |
| ** | Indicates the earliest year in which the Director became a board member or the officer took such office. |
2. IMPORTANT TAX INFORMATION
For the fiscal year ended August 31, 2018, certain dividends paid by the Funds may be subject to a maximum tax rate of 23.8%, as provided for by the Jobs and Growth Tax Relief Reconciliation Act of 2003.
The percentage of dividends declared from ordinary income designated as qualified dividend income was as follows:
| Barrett Opportunity Fund | 100.00% | |
For corporate shareholders, the percent of ordinary income distributions qualifying for the corporate dividends received deduction for the fiscal year ended August 31, 2018, was as follows:
| Barrett Opportunity Fund | 99.79% | |
The Percentage of taxable ordinary income distributions that are designated as short-term capital gain distributions under Internal Revenue Section 871(k)(2)(C) for each Fund were as follows (unaudited):
| Barrett Opportunity Fund | 28.91% | |
The Fund files its complete schedule of portfolio holdings with the Securities and Exchange Commission (“SEC”) for the first and third quarters of each fiscal year on Form N-Q. The Fund’s Forms N-Q are available on the SEC’s website at www.sec.gov. The Fund’s Forms N-Q may be reviewed and copied at the SEC’s Public Reference Room in Washington, D.C., and information on the operation of the Public Reference Room may be obtained by calling 1-800-SEC-0330. To obtain information on Form N-Q from the Fund, shareholders can call the Fund at 1-877-363-6333.
Information on how the Fund voted proxies relating to portfolio securities during the prior 12-month period ended June 30th of each year and a description of the policies and procedures that the Fund uses to determine how to vote proxies related to portfolio transactions are available (1) without charge, upon request, by calling the Fund at 1-877-363-6333 and (2) on the SEC’s website at www.sec.gov.
BARRETT OPPORTUNITY FUND, INC.c/o U.S. Bank Global Fund Services
615 E. Michigan Street
Milwaukee, WI 53202
DIRECTORS
Barry Handel, CPA
David H. Kochman, Chairperson
Rosalind A. Kochman
William Morris, Jr., CPA
INVESTMENT MANAGER
Barrett Asset Management, LLC
90 Park Avenue
New York, NY 10016
ADMINISTRATOR, FUND ACCOUNTANT & TRANSFER AGENT
U.S. Bank Global Fund Services
615 East Michigan Street
Milwaukee, WI 53202
DISTRIBUTOR
Quasar Distributors, LLC
777 East Wisconsin Avenue, 6th Floor
Milwaukee, WI 53202
CUSTODIAN
U.S. Bank, N.A.
Custody Operations
1555 River Center Drive, Suite 302
Milwaukee, WI 53212
LEGAL COUNSEL
Simpson Thacher & Bartlett LLP
425 Lexington Avenue
New York, NY 10017
INDEPENDENT REGISTERED PUBLIC ACCOUNTING FIRM
Cohen & Company, Ltd.
1350 Euclid Avenue, Suite 800
Cleveland, OH 44115
This report is transmitted to the shareholders of Barrett Opportunity Fund, Inc. for their information. This is not a prospectus, circular or representation intended for use in the purchase of shares of the Fund or any securities mentioned in this report.
This report must be preceded or accompanied by a free prospectus. Investors should consider the Fund’s investment objective, risks, charges and expenses carefully before investing. The prospectus contains this and other important information about the Fund. Please read the prospectus carefully before investing.
Item 2. Code of Ethics.
Not applicable for semi-annual reports.
Item 3. Audit Committee Financial Expert.
Not applicable for semi-annual reports.
Item 4. Principal Accountant Fees and Services.
Not applicable for semi-annual reports.
Item 5. Audit Committee of Listed Registrants.
Not applicable to registrants who are not listed issuers (as defined in Rule 10A-3 under the Securities Exchange Act of 1934).
Item 6. Investments.
Schedule of Investments is included as part of the report to shareholders filed under Item 1 of this Form.
Item 7. Disclosure of Proxy Voting Policies and Procedures for Closed-End Management Investment Companies.
Not applicable to open-end investment companies.
Item 8. Portfolio Managers of Closed-End Management Investment Companies.
Not applicable to open-end investment companies.
Item 9. Purchases of Equity Securities by Closed‑End Management Investment Company and Affiliated Purchasers.
Not applicable to open-end investment companies.
Item 10. Submission of Matters to a Vote of Security Holders.
Not Applicable.
Item 11. Controls and Procedures.
| (a) | The Registrant’s President and Treasurer have reviewed the Registrant's disclosure controls and procedures (as defined in Rule 30a-3(c) under the Investment Company Act of 1940 (the “Act”)) as of a date within 90 days of the filing of this report, as required by Rule 30a-3(b) under the Act and Rules 13a-15(b) or 15d‑15(b) under the Securities Exchange Act of 1934. Based on their review, such officers have concluded that the disclosure controls and procedures are effective in ensuring that information required to be disclosed in this report is appropriately recorded, processed, summarized and reported and made known to them by others within the Registrant and by the Registrant’s service provider. |
| (b) | There were no changes in the Registrant's internal control over financial reporting (as defined in Rule 30a-3(d) under the Act) that occurred during the second fiscal quarter of the period covered by this report that has materially affected, or is reasonably likely to materially affect, the Registrant's internal control over financial reporting. |
Item 12. Disclosure of Securities Lending Activities for Closed-End Management Investment Companies
Not applicable to open-end investment companies.
Item 13. Exhibits.
| (a) | (1) Any code of ethics or amendment thereto, that is the subject of the disclosure required by Item 2, to the extent that the registrant intends to satisfy Item 2 requirements through filing an exhibit. Not applicable. |
(2) A separate certification for each principal executive and principal financial officer pursuant to Section 302 of the Sarbanes-Oxley Act of 2002. Filed herewith.
(3) Any written solicitation to purchase securities under Rule 23c‑1 under the Act sent or given during the period covered by the report by or on behalf of the registrant to 10 or more persons. Not applicable to open-end investment companies.
| (b) | Certifications pursuant to Section 906 of the Sarbanes‑Oxley Act of 2002. Furnished herewith. |
SIGNATURES
Pursuant to the requirements of the Securities Exchange Act of 1934 and the Investment Company Act of 1940, the registrant has duly caused this report to be signed on its behalf by the undersigned, thereunto duly authorized.
(Registrant) Barrett Opportunity Fund, Inc.
By (Signature and Title)* /s/Peter Shriver
Peter Shriver, President
Date April 28, 2019
Pursuant to the requirements of the Securities Exchange Act of 1934 and the Investment Company Act of 1940, this report has been signed below by the following persons on behalf of the registrant and in the capacities and on the dates indicated.
By (Signature and Title)* /s/Peter Shriver
Peter Shriver, President
Date April 28, 2019
By (Signature and Title)* /s/John G. Youngman
John G. Youngman, Treasurer
Date April 29, 2019
* Print the name and title of each signing officer under his or her signature.