Fund (Class) | Cost of a $10,000 investment | Cost paid as a percentage of a $10,000 investment |
Janus Henderson Absolute Return Income Opportunities Fund (Class A Shares/JUCAX) | $98 | 0.95% |
AVERAGE ANNUAL TOTAL RETURN | 1 Year | 5 Year | 10 Year |
Janus Henderson Absolute Return Income Opportunities Fund (Class A Shares/JUCAX) at NAV | 6.28% | 2.31)% | 1.34% |
Janus Henderson Absolute Return Income Opportunities Fund (Class A Shares/JUCAX) at Maximum Offering Price - 4.75% | 1.26% | 1.30)% | 0.84% |
Bloomberg U.S. Aggregate Bond Index | 2.63% | (0.23)% | 1.35% |
FTSE 3-Month U.S. Treasury Bill Index | 5.64% | 2.22)% | 1.53% |
Net assets | $52M% |
Number of portfolio holdings | $118% |
Total investment advisory fee paid | $0.0M% |
Portfolio turnover rate | $61% |
Weighted average maturity | 3.3 Years |
Effective duration | 1.3 Years |
Corporate Bonds | 79.1 |
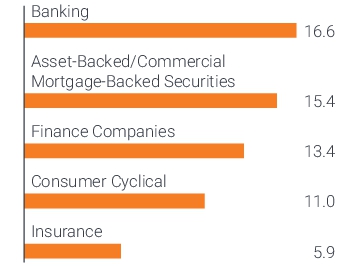
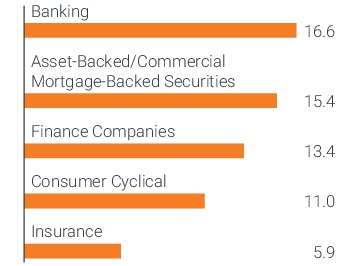
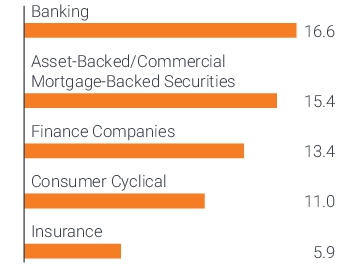
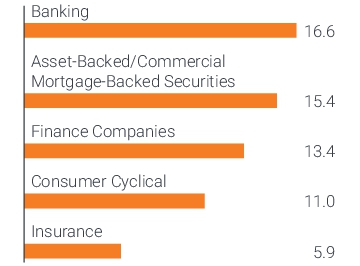
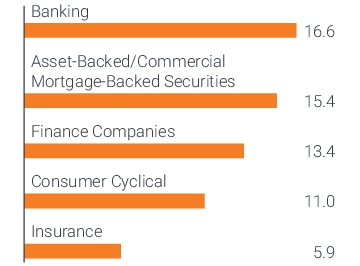
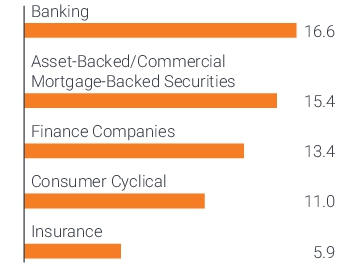
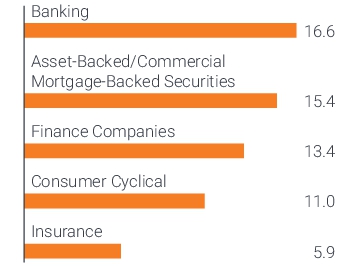
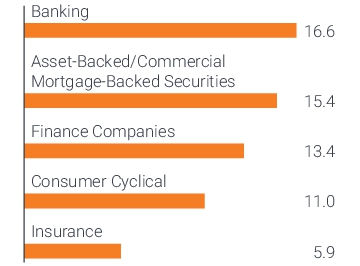
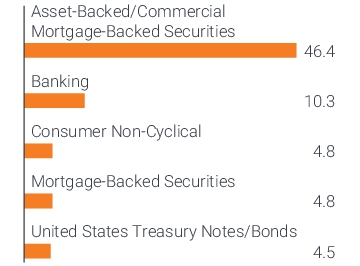
Asset-Backed/Commercial Mortgage-Backed Securities | 15.4 |
Investment Companies | 2.4 |
Commercial Paper | 1.6 |
Other | 1.5 |
A | 23.1 |
AA | 1.9 |
AAA | 6.1 |
BB+ | 1.1 |
BBB | 44.9 |
BBB- | 3.2 |
Ba1 | 11.0 |
Ba2 | 4.9 |
Ba3 | 3.4 |
Other | 0.4 |
- Prospectus
- Financial information
- Fund holdings
Fund (Class) | Cost of a $10,000 investment | Cost paid as a percentage of a $10,000 investment |
Janus Henderson Absolute Return Income Opportunities Fund (Class C Shares/JUCCX) | $174 | 1.69% |
AVERAGE ANNUAL TOTAL RETURN | 1 Year | 5 Year | 10 Year |
Janus Henderson Absolute Return Income Opportunities Fund (Class C Shares/JUCCX) at NAV | 5.50%* | 1.57)% | 0.60% |
Janus Henderson Absolute Return Income Opportunities Fund (Class C Shares/JUCCX) with Contingent Deferred Sales Charge | 4.50%* | 1.57)% | 0.60% |
Bloomberg U.S. Aggregate Bond Index | 2.63%* | (0.23)% | 1.35% |
FTSE 3-Month U.S. Treasury Bill Index | 5.64%* | 2.22)% | 1.53% |
* | Returns include a 1% contingent deferred sales charge on Shares redeemed within 12 months of purchase. |
Net assets | $52M% |
Number of portfolio holdings | $118% |
Total investment advisory fee paid | $0.0M% |
Portfolio turnover rate | $61% |
Weighted average maturity | 3.3 Years |
Effective duration | 1.3 Years |
Corporate Bonds | 79.1 |
Asset-Backed/Commercial Mortgage-Backed Securities | 15.4 |
Investment Companies | 2.4 |
Commercial Paper | 1.6 |
Other | 1.5 |
A | 23.1 |
AA | 1.9 |
AAA | 6.1 |
BB+ | 1.1 |
BBB | 44.9 |
BBB- | 3.2 |
Ba1 | 11.0 |
Ba2 | 4.9 |
Ba3 | 3.4 |
Other | 0.4 |
- Prospectus
- Financial information
- Fund holdings
Fund (Class) | Cost of a $10,000 investment | Cost paid as a percentage of a $10,000 investment |
Janus Henderson Absolute Return Income Opportunities Fund (Class D Shares/JUCDX) | $78 | 0.76% |
AVERAGE ANNUAL TOTAL RETURN | 1 Year | 5 Year | 10 Year |
Janus Henderson Absolute Return Income Opportunities Fund (Class D Shares/JUCDX) | 6.48% | 2.47)% | 1.46% |
Bloomberg U.S. Aggregate Bond Index | 2.63% | (0.23)% | 1.35% |
FTSE 3-Month U.S. Treasury Bill Index | 5.64% | 2.22)% | 1.53% |
Net assets | $52M% |
Number of portfolio holdings | $118% |
Total investment advisory fee paid | $0.0M% |
Portfolio turnover rate | $61% |
Weighted average maturity | 3.3 Years |
Effective duration | 1.3 Years |
Corporate Bonds | 79.1 |
Asset-Backed/Commercial Mortgage-Backed Securities | 15.4 |
Investment Companies | 2.4 |
Commercial Paper | 1.6 |
Other | 1.5 |
A | 23.1 |
AA | 1.9 |
AAA | 6.1 |
BB+ | 1.1 |
BBB | 44.9 |
BBB- | 3.2 |
Ba1 | 11.0 |
Ba2 | 4.9 |
Ba3 | 3.4 |
Other | 0.4 |
- Prospectus
- Financial information
- Fund holdings
Fund (Class) | Cost of a $10,000 investment | Cost paid as a percentage of a $10,000 investment |
Janus Henderson Absolute Return Income Opportunities Fund (Class I Shares/JUCIX) | $75 | 0.73% |
AVERAGE ANNUAL TOTAL RETURN | 1 Year | 5 Year | 10 Year |
Janus Henderson Absolute Return Income Opportunities Fund (Class I Shares/JUCIX) | 6.51% | 2.54)% | 1.58% |
Bloomberg U.S. Aggregate Bond Index | 2.63% | (0.23)% | 1.35% |
FTSE 3-Month U.S. Treasury Bill Index | 5.64% | 2.22)% | 1.53% |
Net assets | $52M% |
Number of portfolio holdings | $118% |
Total investment advisory fee paid | $0.0M% |
Portfolio turnover rate | $61% |
Weighted average maturity | 3.3 Years |
Effective duration | 1.3 Years |
Corporate Bonds | 79.1 |
Asset-Backed/Commercial Mortgage-Backed Securities | 15.4 |
Investment Companies | 2.4 |
Commercial Paper | 1.6 |
Other | 1.5 |
A | 23.1 |
AA | 1.9 |
AAA | 6.1 |
BB+ | 1.1 |
BBB | 44.9 |
BBB- | 3.2 |
Ba1 | 11.0 |
Ba2 | 4.9 |
Ba3 | 3.4 |
Other | 0.4 |
- Prospectus
- Financial information
- Fund holdings
Fund (Class) | Cost of a $10,000 investment | Cost paid as a percentage of a $10,000 investment |
Janus Henderson Absolute Return Income Opportunities Fund (Class N Shares/JUCNX) | $65 | 0.63% |
AVERAGE ANNUAL TOTAL RETURN | 1 Year | 5 Year | 10 Year |
Janus Henderson Absolute Return Income Opportunities Fund (Class N Shares/JUCNX) | 6.49% | 2.59)% | 1.62% |
Bloomberg U.S. Aggregate Bond Index | 2.63% | (0.23)% | 1.35% |
FTSE 3-Month U.S. Treasury Bill Index | 5.64% | 2.22)% | 1.53% |
Net assets | $52M% |
Number of portfolio holdings | $118% |
Total investment advisory fee paid | $0.0M% |
Portfolio turnover rate | $61% |
Weighted average maturity | 3.3 Years |
Effective duration | 1.3 Years |
Corporate Bonds | 79.1 |
Asset-Backed/Commercial Mortgage-Backed Securities | 15.4 |
Investment Companies | 2.4 |
Commercial Paper | 1.6 |
Other | 1.5 |
A | 23.1 |
AA | 1.9 |
AAA | 6.1 |
BB+ | 1.1 |
BBB | 44.9 |
BBB- | 3.2 |
Ba1 | 11.0 |
Ba2 | 4.9 |
Ba3 | 3.4 |
Other | 0.4 |
- Prospectus
- Financial information
- Fund holdings
Fund (Class) | Cost of a $10,000 investment | Cost paid as a percentage of a $10,000 investment |
Janus Henderson Absolute Return Income Opportunities Fund (Class R Shares/JUCRX) | $141 | 1.37% |
AVERAGE ANNUAL TOTAL RETURN | 1 Year | 5 Year | 10 Year |
Janus Henderson Absolute Return Income Opportunities Fund (Class R Shares/JUCRX) | 5.83% | 1.84)% | 0.89% |
Bloomberg U.S. Aggregate Bond Index | 2.63% | (0.23)% | 1.35% |
FTSE 3-Month U.S. Treasury Bill Index | 5.64% | 2.22)% | 1.53% |
Net assets | $52M% |
Number of portfolio holdings | $118% |
Total investment advisory fee paid | $0.0M% |
Portfolio turnover rate | $61% |
Weighted average maturity | 3.3 Years |
Effective duration | 1.3 Years |
Corporate Bonds | 79.1 |
Asset-Backed/Commercial Mortgage-Backed Securities | 15.4 |
Investment Companies | 2.4 |
Commercial Paper | 1.6 |
Other | 1.5 |
A | 23.1 |
AA | 1.9 |
AAA | 6.1 |
BB+ | 1.1 |
BBB | 44.9 |
BBB- | 3.2 |
Ba1 | 11.0 |
Ba2 | 4.9 |
Ba3 | 3.4 |
Other | 0.4 |
- Prospectus
- Financial information
- Fund holdings
Fund (Class) | Cost of a $10,000 investment | Cost paid as a percentage of a $10,000 investment |
Janus Henderson Absolute Return Income Opportunities Fund (Class S Shares/JUCSX) | $115 | 1.12% |
AVERAGE ANNUAL TOTAL RETURN | 1 Year | 5 Year | 10 Year |
Janus Henderson Absolute Return Income Opportunities Fund (Class S Shares/JUCSX) | 6.09% | 2.09)% | 1.12% |
Bloomberg U.S. Aggregate Bond Index | 2.63% | (0.23)% | 1.35% |
FTSE 3-Month U.S. Treasury Bill Index | 5.64% | 2.22)% | 1.53% |
Net assets | $52M% |
Number of portfolio holdings | $118% |
Total investment advisory fee paid | $0.0M% |
Portfolio turnover rate | $61% |
Weighted average maturity | 3.3 Years |
Effective duration | 1.3 Years |
Corporate Bonds | 79.1 |
Asset-Backed/Commercial Mortgage-Backed Securities | 15.4 |
Investment Companies | 2.4 |
Commercial Paper | 1.6 |
Other | 1.5 |
A | 23.1 |
AA | 1.9 |
AAA | 6.1 |
BB+ | 1.1 |
BBB | 44.9 |
BBB- | 3.2 |
Ba1 | 11.0 |
Ba2 | 4.9 |
Ba3 | 3.4 |
Other | 0.4 |
- Prospectus
- Financial information
- Fund holdings
Fund (Class) | Cost of a $10,000 investment | Cost paid as a percentage of a $10,000 investment |
Janus Henderson Absolute Return Income Opportunities Fund (Class T Shares/JUCTX) | $89 | 0.86% |
AVERAGE ANNUAL TOTAL RETURN | 1 Year | 5 Year | 10 Year |
Janus Henderson Absolute Return Income Opportunities Fund (Class T Shares/JUCTX) | 6.37% | 2.39)% | 1.40% |
Bloomberg U.S. Aggregate Bond Index | 2.63% | (0.23)% | 1.35% |
FTSE 3-Month U.S. Treasury Bill Index | 5.64% | 2.22)% | 1.53% |
Net assets | $52M% |
Number of portfolio holdings | $118% |
Total investment advisory fee paid | $0.0M% |
Portfolio turnover rate | $61% |
Weighted average maturity | 3.3 Years |
Effective duration | 1.3 Years |
Corporate Bonds | 79.1 |
Asset-Backed/Commercial Mortgage-Backed Securities | 15.4 |
Investment Companies | 2.4 |
Commercial Paper | 1.6 |
Other | 1.5 |
A | 23.1 |
AA | 1.9 |
AAA | 6.1 |
BB+ | 1.1 |
BBB | 44.9 |
BBB- | 3.2 |
Ba1 | 11.0 |
Ba2 | 4.9 |
Ba3 | 3.4 |
Other | 0.4 |
- Prospectus
- Financial information
- Fund holdings
Fund (Class) | Cost of a $10,000 investment | Cost paid as a percentage of a $10,000 investment |
Janus Henderson Adaptive Risk Managed U.S. Equity Fund (Class A Shares/JRSAX) | $92 | 0.85% |
AVERAGE ANNUAL TOTAL RETURN | 1 Year | 5 Year | 10 Year |
Janus Henderson Adaptive Risk Managed U.S. Equity Fund (Class A Shares/JRSAX) at NAV | 17.44% | 9.61% | 9.17% |
Janus Henderson Adaptive Risk Managed U.S. Equity Fund (Class A Shares/JRSAX) at Maximum Offering Price - 5.75% | 10.73% | 8.33% | 8.53% |
Russell 1000® Index | 23.88% | 14.61% | 12.51% |
S&P 500® Minimum Volatility Index | 16.54% | 10.53% | 11.09% |
Net assets | $613M% |
Number of portfolio holdings | $118% |
Total investment advisory fee paid | $2.7M% |
Portfolio turnover rate | $250% |
Apple Inc | 7.6 |
Microsoft Corp | 7.3 |
Alphabet Inc - Class A | 4.5 |
NVIDIA Corp | 4.3 |
Eli Lilly & Co | 3.0 |
Common Stocks | 100.1) |
Investment Companies | 0.1) |
Other | (0.2) |
- Prospectus
- Financial information
- Fund holdings
Fund (Class) | Cost of a $10,000 investment | Cost paid as a percentage of a $10,000 investment |
Janus Henderson Adaptive Risk Managed U.S. Equity Fund (Class C Shares/JRSCX) | $170 | 1.57% |
AVERAGE ANNUAL TOTAL RETURN | 1 Year | 5 Year | 10 Year |
Janus Henderson Adaptive Risk Managed U.S. Equity Fund (Class C Shares/JRSCX) at NAV | 16.55%* | 8.90% | 8.46% |
Janus Henderson Adaptive Risk Managed U.S. Equity Fund (Class C Shares/JRSCX) with Contingent Deferred Sales Charge | 15.55%* | 8.90% | 8.46% |
Russell 1000® Index | 23.88%* | 14.61% | 12.51% |
S&P 500® Minimum Volatility Index | 16.54%* | 10.53% | 11.09% |
* | Returns include a 1% contingent deferred sales charge on Shares redeemed within 12 months of purchase. |
Net assets | $613M% |
Number of portfolio holdings | $118% |
Total investment advisory fee paid | $2.7M% |
Portfolio turnover rate | $250% |
Apple Inc | 7.6 |
Microsoft Corp | 7.3 |
Alphabet Inc - Class A | 4.5 |
NVIDIA Corp | 4.3 |
Eli Lilly & Co | 3.0 |
Common Stocks | 100.1) |
Investment Companies | 0.1) |
Other | (0.2) |
- Prospectus
- Financial information
- Fund holdings
Fund (Class) | Cost of a $10,000 investment | Cost paid as a percentage of a $10,000 investment |
Janus Henderson Adaptive Risk Managed U.S. Equity Fund (Class D Shares/JRSDX) | $71 | 0.65% |
AVERAGE ANNUAL TOTAL RETURN | 1 Year | 5 Year | 10 Year |
Janus Henderson Adaptive Risk Managed U.S. Equity Fund (Class D Shares/JRSDX) | 17.78% | 9.85% | 9.39% |
Russell 1000® Index | 23.88% | 14.61% | 12.51% |
S&P 500® Minimum Volatility Index | 16.54% | 10.53% | 11.09% |
Net assets | $613M% |
Number of portfolio holdings | $118% |
Total investment advisory fee paid | $2.7M% |
Portfolio turnover rate | $250% |
Apple Inc | 7.6 |
Microsoft Corp | 7.3 |
Alphabet Inc - Class A | 4.5 |
NVIDIA Corp | 4.3 |
Eli Lilly & Co | 3.0 |
Common Stocks | 100.1) |
Investment Companies | 0.1) |
Other | (0.2) |
- Prospectus
- Financial information
- Fund holdings
Fund (Class) | Cost of a $10,000 investment | Cost paid as a percentage of a $10,000 investment |
Janus Henderson Adaptive Risk Managed U.S. Equity Fund (Class I Shares/JRSIX) | $65 | 0.60% |
AVERAGE ANNUAL TOTAL RETURN | 1 Year | 5 Year | 10 Year |
Janus Henderson Adaptive Risk Managed U.S. Equity Fund (Class I Shares/JRSIX) | 17.71% | 9.87% | 9.46% |
Russell 1000® Index | 23.88% | 14.61% | 12.51% |
S&P 500® Minimum Volatility Index | 16.54% | 10.53% | 11.09% |
Net assets | $613M% |
Number of portfolio holdings | $118% |
Total investment advisory fee paid | $2.7M% |
Portfolio turnover rate | $250% |
Apple Inc | 7.6 |
Microsoft Corp | 7.3 |
Alphabet Inc - Class A | 4.5 |
NVIDIA Corp | 4.3 |
Eli Lilly & Co | 3.0 |
Common Stocks | 100.1) |
Investment Companies | 0.1) |
Other | (0.2) |
- Prospectus
- Financial information
- Fund holdings
Fund (Class) | Cost of a $10,000 investment | Cost paid as a percentage of a $10,000 investment |
Janus Henderson Adaptive Risk Managed U.S. Equity Fund (Class N Shares/JRSNX) | $57 | 0.52% |
AVERAGE ANNUAL TOTAL RETURN | 1 Year | 5 Year | 10 Year |
Janus Henderson Adaptive Risk Managed U.S. Equity Fund (Class N Shares/JRSNX) | 17.90% | 10.00% | 9.58% |
Russell 1000® Index | 23.88% | 14.61% | 12.51% |
S&P 500® Minimum Volatility Index | 16.54% | 10.53% | 11.09% |
Net assets | $613M% |
Number of portfolio holdings | $118% |
Total investment advisory fee paid | $2.7M% |
Portfolio turnover rate | $250% |
Apple Inc | 7.6 |
Microsoft Corp | 7.3 |
Alphabet Inc - Class A | 4.5 |
NVIDIA Corp | 4.3 |
Eli Lilly & Co | 3.0 |
Common Stocks | 100.1) |
Investment Companies | 0.1) |
Other | (0.2) |
- Prospectus
- Financial information
- Fund holdings
Fund (Class) | Cost of a $10,000 investment | Cost paid as a percentage of a $10,000 investment |
Janus Henderson Adaptive Risk Managed U.S. Equity Fund (Class S Shares/JRSSX) | $110 | 1.01% |
AVERAGE ANNUAL TOTAL RETURN | 1 Year | 5 Year | 10 Year |
Janus Henderson Adaptive Risk Managed U.S. Equity Fund (Class S Shares/JRSSX) | 17.32% | 9.45% | 9.04% |
Russell 1000® Index | 23.88% | 14.61% | 12.51% |
S&P 500® Minimum Volatility Index | 16.54% | 10.53% | 11.09% |
Net assets | $613M% |
Number of portfolio holdings | $118% |
Total investment advisory fee paid | $2.7M% |
Portfolio turnover rate | $250% |
Apple Inc | 7.6 |
Microsoft Corp | 7.3 |
Alphabet Inc - Class A | 4.5 |
NVIDIA Corp | 4.3 |
Eli Lilly & Co | 3.0 |
Common Stocks | 100.1) |
Investment Companies | 0.1) |
Other | (0.2) |
- Prospectus
- Financial information
- Fund holdings
Fund (Class) | Cost of a $10,000 investment | Cost paid as a percentage of a $10,000 investment |
Janus Henderson Adaptive Risk Managed U.S. Equity Fund (Class T Shares/JRSTX) | $82 | 0.75% |
AVERAGE ANNUAL TOTAL RETURN | 1 Year | 5 Year | 10 Year |
Janus Henderson Adaptive Risk Managed U.S. Equity Fund (Class T Shares/JRSTX) | 17.60% | 9.76% | 9.31% |
Russell 1000® Index | 23.88% | 14.61% | 12.51% |
S&P 500® Minimum Volatility Index | 16.54% | 10.53% | 11.09% |
Net assets | $613M% |
Number of portfolio holdings | $118% |
Total investment advisory fee paid | $2.7M% |
Portfolio turnover rate | $250% |
Apple Inc | 7.6 |
Microsoft Corp | 7.3 |
Alphabet Inc - Class A | 4.5 |
NVIDIA Corp | 4.3 |
Eli Lilly & Co | 3.0 |
Common Stocks | 100.1) |
Investment Companies | 0.1) |
Other | (0.2) |
- Prospectus
- Financial information
- Fund holdings
Fund (Class) | Cost of a $10,000 investment | Cost paid as a percentage of a $10,000 investment |
Janus Henderson Developed World Bond Fund (Class A Shares/HFAAX) | $81 | 0.80% |
AVERAGE ANNUAL TOTAL RETURN | 1 Year | 5 Year | 10 Year |
Janus Henderson Developed World Bond Fund (Class A Shares/HFAAX) at NAV | 2.98)% | (0.87)% | 1.69)% |
Janus Henderson Developed World Bond Fund (Class A Shares/HFAAX) at Maximum Offering Price - 4.75% | (1.95)% | (1.82)% | 1.20)% |
Bloomberg Global Aggregate Bond Index | 0.93)% | (2.02)% | (0.42)% |
Bloomberg Global Aggregate Credit Index (USD Hedged) | 5.76)% | 0.61)% | 2.37)% |
Net assets | $1,095M% |
Number of portfolio holdings | $198% |
Total investment advisory fee paid | $5.4M% |
Portfolio turnover rate | $29% |
Weighted average maturity | 6.6 Years |
Effective duration | 8.7 Years |
Corporate Bonds | 54.9 |
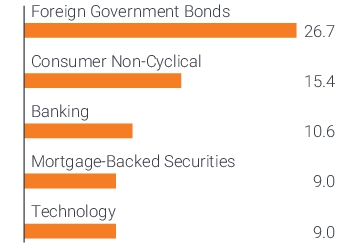
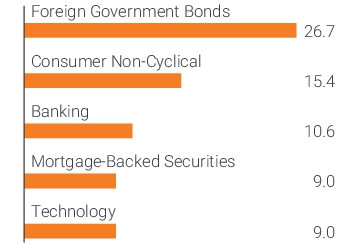
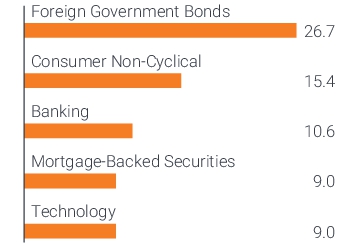
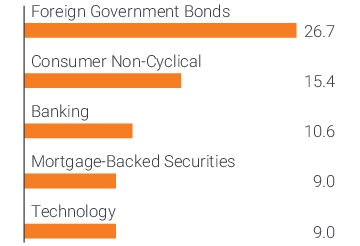
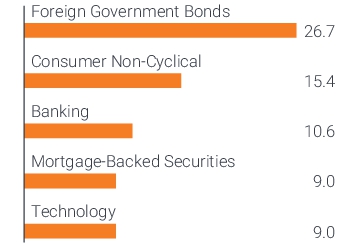
Foreign Government Bonds | 26.7 |
Mortgage-Backed Securities | 9.0 |
United States Treasury Notes/Bonds | 3.8 |
Investment Companies | 3.3 |
Asset-Backed/Commercial Mortgage-Backed Securities | 0.6 |
Investments Purchased with Cash Collateral from Securities Lending | 0.0 |
Other | 1.7 |
AAA | 9.6 |
AA | 17.5 |
A | 14.3 |
BBB | 26.4 |
BB | 5.1 |
B | 1.1 |
Not Rated | 21.7 |
Other | 4.3 |
- Prospectus
- Financial information
- Fund holdings
Fund (Class) | Cost of a $10,000 investment | Cost paid as a percentage of a $10,000 investment |
Janus Henderson Developed World Bond Fund (Class C Shares/HFACX) | $155 | 1.53% |
AVERAGE ANNUAL TOTAL RETURN | 1 Year | 5 Year | 10 Year |
Janus Henderson Developed World Bond Fund (Class C Shares/HFACX) at NAV | 2.24%* | (1.60)% | 0.94)% |
Janus Henderson Developed World Bond Fund (Class C Shares/HFACX) with Contingent Deferred Sales Charge | 1.24%* | (1.60)% | 0.94)% |
Bloomberg Global Aggregate Bond Index | 0.93%* | (2.02)% | (0.42)% |
Bloomberg Global Aggregate Credit Index (USD Hedged) | 5.76%* | 0.61)% | 2.37)% |
* | Returns include a 1% contingent deferred sales charge on Shares redeemed within 12 months of purchase. |
Net assets | $1,095M% |
Number of portfolio holdings | $198% |
Total investment advisory fee paid | $5.4M% |
Portfolio turnover rate | $29% |
Weighted average maturity | 6.6 Years |
Effective duration | 8.7 Years |
Corporate Bonds | 54.9 |
Foreign Government Bonds | 26.7 |
Mortgage-Backed Securities | 9.0 |
United States Treasury Notes/Bonds | 3.8 |
Investment Companies | 3.3 |
Asset-Backed/Commercial Mortgage-Backed Securities | 0.6 |
Investments Purchased with Cash Collateral from Securities Lending | 0.0 |
Other | 1.7 |
AAA | 9.6 |
AA | 17.5 |
A | 14.3 |
BBB | 26.4 |
BB | 5.1 |
B | 1.1 |
Not Rated | 21.7 |
Other | 4.3 |
- Prospectus
- Financial information
- Fund holdings
Fund (Class) | Cost of a $10,000 investment | Cost paid as a percentage of a $10,000 investment |
Janus Henderson Developed World Bond Fund (Class D Shares/HFADX) | $70 | 0.69% |
AVERAGE ANNUAL TOTAL RETURN | 1 Year | 5 Year | 10 Year |
Janus Henderson Developed World Bond Fund (Class D Shares/HFADX) | 3.11% | (0.75)% | 1.79)% |
Bloomberg Global Aggregate Bond Index | 0.93% | (2.02)% | (0.42)% |
Bloomberg Global Aggregate Credit Index (USD Hedged) | 5.76% | 0.61)% | 2.37)% |
Net assets | $1,095M% |
Number of portfolio holdings | $198% |
Total investment advisory fee paid | $5.4M% |
Portfolio turnover rate | $29% |
Weighted average maturity | 6.6 Years |
Effective duration | 8.7 Years |
Corporate Bonds | 54.9 |
Foreign Government Bonds | 26.7 |
Mortgage-Backed Securities | 9.0 |
United States Treasury Notes/Bonds | 3.8 |
Investment Companies | 3.3 |
Asset-Backed/Commercial Mortgage-Backed Securities | 0.6 |
Investments Purchased with Cash Collateral from Securities Lending | 0.0 |
Other | 1.7 |
AAA | 9.6 |
AA | 17.5 |
A | 14.3 |
BBB | 26.4 |
BB | 5.1 |
B | 1.1 |
Not Rated | 21.7 |
Other | 4.3 |
- Prospectus
- Financial information
- Fund holdings
Fund (Class) | Cost of a $10,000 investment | Cost paid as a percentage of a $10,000 investment |
Janus Henderson Developed World Bond Fund (Class I Shares/HFAIX) | $59 | 0.58% |
AVERAGE ANNUAL TOTAL RETURN | 1 Year | 5 Year | 10 Year |
Janus Henderson Developed World Bond Fund (Class I Shares/HFAIX) | 3.10% | (0.65)% | 1.93)% |
Bloomberg Global Aggregate Bond Index | 0.93% | (2.02)% | (0.42)% |
Bloomberg Global Aggregate Credit Index (USD Hedged) | 5.76% | 0.61)% | 2.37)% |
Net assets | $1,095M% |
Number of portfolio holdings | $198% |
Total investment advisory fee paid | $5.4M% |
Portfolio turnover rate | $29% |
Weighted average maturity | 6.6 Years |
Effective duration | 8.7 Years |
Corporate Bonds | 54.9 |
Foreign Government Bonds | 26.7 |
Mortgage-Backed Securities | 9.0 |
United States Treasury Notes/Bonds | 3.8 |
Investment Companies | 3.3 |
Asset-Backed/Commercial Mortgage-Backed Securities | 0.6 |
Investments Purchased with Cash Collateral from Securities Lending | 0.0 |
Other | 1.7 |
AAA | 9.6 |
AA | 17.5 |
A | 14.3 |
BBB | 26.4 |
BB | 5.1 |
B | 1.1 |
Not Rated | 21.7 |
Other | 4.3 |
- Prospectus
- Financial information
- Fund holdings
Fund (Class) | Cost of a $10,000 investment | Cost paid as a percentage of a $10,000 investment |
Janus Henderson Developed World Bond Fund (Class N Shares/HFARX) | $59 | 0.58% |
AVERAGE ANNUAL TOTAL RETURN | 1 Year | 5 Year | 10 Year |
Janus Henderson Developed World Bond Fund (Class N Shares/HFARX) | 3.24% | (0.63)% | 1.93)% |
Bloomberg Global Aggregate Bond Index | 0.93% | (2.02)% | (0.42)% |
Bloomberg Global Aggregate Credit Index (USD Hedged) | 5.76% | 0.61)% | 2.37)% |
Net assets | $1,095M% |
Number of portfolio holdings | $198% |
Total investment advisory fee paid | $5.4M% |
Portfolio turnover rate | $29% |
Weighted average maturity | 6.6 Years |
Effective duration | 8.7 Years |
Corporate Bonds | 54.9 |
Foreign Government Bonds | 26.7 |
Mortgage-Backed Securities | 9.0 |
United States Treasury Notes/Bonds | 3.8 |
Investment Companies | 3.3 |
Asset-Backed/Commercial Mortgage-Backed Securities | 0.6 |
Investments Purchased with Cash Collateral from Securities Lending | 0.0 |
Other | 1.7 |
AAA | 9.6 |
AA | 17.5 |
A | 14.3 |
BBB | 26.4 |
BB | 5.1 |
B | 1.1 |
Not Rated | 21.7 |
Other | 4.3 |
- Prospectus
- Financial information
- Fund holdings
Fund (Class) | Cost of a $10,000 investment | Cost paid as a percentage of a $10,000 investment |
Janus Henderson Developed World Bond Fund (Class S Shares/HFASX) | $106 | 1.05% |
AVERAGE ANNUAL TOTAL RETURN | 1 Year | 5 Year | 10 Year |
Janus Henderson Developed World Bond Fund (Class S Shares/HFASX) | 2.70% | (1.09)% | 1.53)% |
Bloomberg Global Aggregate Bond Index | 0.93% | (2.02)% | (0.42)% |
Bloomberg Global Aggregate Credit Index (USD Hedged) | 5.76% | 0.61)% | 2.37)% |
Net assets | $1,095M% |
Number of portfolio holdings | $198% |
Total investment advisory fee paid | $5.4M% |
Portfolio turnover rate | $29% |
Weighted average maturity | 6.6 Years |
Effective duration | 8.7 Years |
Corporate Bonds | 54.9 |
Foreign Government Bonds | 26.7 |
Mortgage-Backed Securities | 9.0 |
United States Treasury Notes/Bonds | 3.8 |
Investment Companies | 3.3 |
Asset-Backed/Commercial Mortgage-Backed Securities | 0.6 |
Investments Purchased with Cash Collateral from Securities Lending | 0.0 |
Other | 1.7 |
AAA | 9.6 |
AA | 17.5 |
A | 14.3 |
BBB | 26.4 |
BB | 5.1 |
B | 1.1 |
Not Rated | 21.7 |
Other | 4.3 |
- Prospectus
- Financial information
- Fund holdings
Fund (Class) | Cost of a $10,000 investment | Cost paid as a percentage of a $10,000 investment |
Janus Henderson Developed World Bond Fund (Class T Shares/HFATX) | $82 | 0.81% |
AVERAGE ANNUAL TOTAL RETURN | 1 Year | 5 Year | 10 Year |
Janus Henderson Developed World Bond Fund (Class T Shares/HFATX) | 2.84% | (0.87)% | 1.71)% |
Bloomberg Global Aggregate Bond Index | 0.93% | (2.02)% | (0.42)% |
Bloomberg Global Aggregate Credit Index (USD Hedged) | 5.76% | 0.61)% | 2.37)% |
Net assets | $1,095M% |
Number of portfolio holdings | $198% |
Total investment advisory fee paid | $5.4M% |
Portfolio turnover rate | $29% |
Weighted average maturity | 6.6 Years |
Effective duration | 8.7 Years |
Corporate Bonds | 54.9 |
Foreign Government Bonds | 26.7 |
Mortgage-Backed Securities | 9.0 |
United States Treasury Notes/Bonds | 3.8 |
Investment Companies | 3.3 |
Asset-Backed/Commercial Mortgage-Backed Securities | 0.6 |
Investments Purchased with Cash Collateral from Securities Lending | 0.0 |
Other | 1.7 |
AAA | 9.6 |
AA | 17.5 |
A | 14.3 |
BBB | 26.4 |
BB | 5.1 |
B | 1.1 |
Not Rated | 21.7 |
Other | 4.3 |
- Prospectus
- Financial information
- Fund holdings
Fund (Class) | Cost of a $10,000 investment | Cost paid as a percentage of a $10,000 investment |
Janus Henderson Flexible Bond Fund (Class A Shares/JDFAX) | $71 | 0.70% |
AVERAGE ANNUAL TOTAL RETURN | 1 Year | 5 Year | 10 Year |
Janus Henderson Flexible Bond Fund (Class A Shares/JDFAX) at NAV | 3.57)% | 0.39)% | 1.27% |
Janus Henderson Flexible Bond Fund (Class A Shares/JDFAX) at Maximum Offering Price - 4.75% | (1.31)% | (0.58)% | 0.78% |
Bloomberg U.S. Aggregate Bond Index | 2.63)% | (0.23)% | 1.35% |
Net assets | $2,605M% |
Number of portfolio holdings | $639% |
Total investment advisory fee paid | $9.7M% |
Portfolio turnover rate | $170% |
Weighted average maturity | 6.5 Years |
Effective duration | 6.4 Years |
Corporate Bonds | 36.2) |
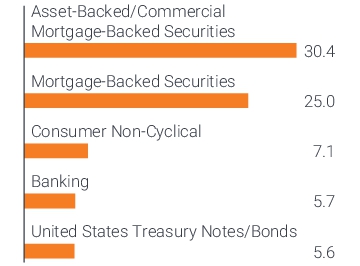
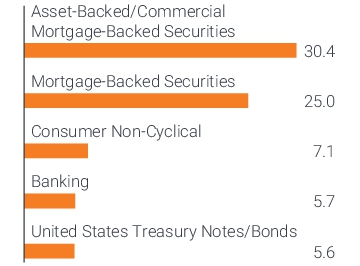
Asset-Backed/Commercial Mortgage-Backed Securities | 30.4) |
Mortgage-Backed Securities | 25.0) |
United States Treasury Notes/Bonds | 5.6) |
Investment Companies | 4.8) |
Bank Loans and Mezzanine Loans | 1.9) |
Investments Purchased with Cash Collateral from Securities Lending | 0.7) |
Other | (4.6) |
AAA | 2.0) |
AA | 31.6) |
A | 9.2) |
BBB | 23.6) |
BB | 7.7) |
B | 0.9) |
Not Rated | 25.2) |
Other | (0.2) |
- Prospectus
- Financial information
- Fund holdings
Fund (Class) | Cost of a $10,000 investment | Cost paid as a percentage of a $10,000 investment |
Janus Henderson Flexible Bond Fund (Class C Shares/JFICX) | $145 | 1.43% |
AVERAGE ANNUAL TOTAL RETURN | 1 Year | 5 Year | 10 Year |
Janus Henderson Flexible Bond Fund (Class C Shares/JFICX) at NAV | 2.83%* | (0.28)% | 0.60% |
Janus Henderson Flexible Bond Fund (Class C Shares/JFICX) with Contingent Deferred Sales Charge | 1.84%* | (0.28)% | 0.60% |
Bloomberg U.S. Aggregate Bond Index | 2.63%* | (0.23)% | 1.35% |
* | Returns include a 1% contingent deferred sales charge on Shares redeemed within 12 months of purchase. |
Net assets | $2,605M% |
Number of portfolio holdings | $639% |
Total investment advisory fee paid | $9.7M% |
Portfolio turnover rate | $170% |
Weighted average maturity | 6.5 Years |
Effective duration | 6.4 Years |
Corporate Bonds | 36.2) |
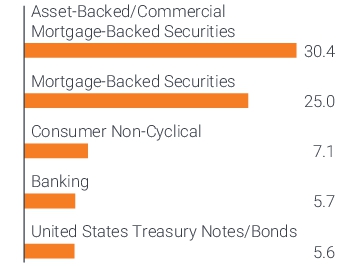
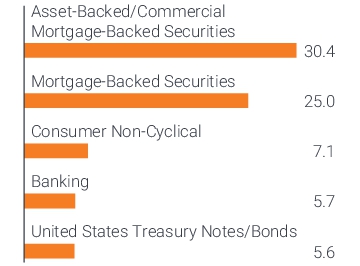
Asset-Backed/Commercial Mortgage-Backed Securities | 30.4) |
Mortgage-Backed Securities | 25.0) |
United States Treasury Notes/Bonds | 5.6) |
Investment Companies | 4.8) |
Bank Loans and Mezzanine Loans | 1.9) |
Investments Purchased with Cash Collateral from Securities Lending | 0.7) |
Other | (4.6) |
AAA | 2.0) |
AA | 31.6) |
A | 9.2) |
BBB | 23.6) |
BB | 7.7) |
B | 0.9) |
Not Rated | 25.2) |
Other | (0.2) |
- Prospectus
- Financial information
- Fund holdings
Fund (Class) | Cost of a $10,000 investment | Cost paid as a percentage of a $10,000 investment |
Janus Henderson Flexible Bond Fund (Class D Shares/JANFX) | $57 | 0.56% |
AVERAGE ANNUAL TOTAL RETURN | 1 Year | 5 Year | 10 Year |
Janus Henderson Flexible Bond Fund (Class D Shares/JANFX) | 3.71% | 0.60)% | 1.50% |
Bloomberg U.S. Aggregate Bond Index | 2.63% | (0.23)% | 1.35% |
Net assets | $2,605M% |
Number of portfolio holdings | $639% |
Total investment advisory fee paid | $9.7M% |
Portfolio turnover rate | $170% |
Weighted average maturity | 6.5 Years |
Effective duration | 6.4 Years |
Corporate Bonds | 36.2) |
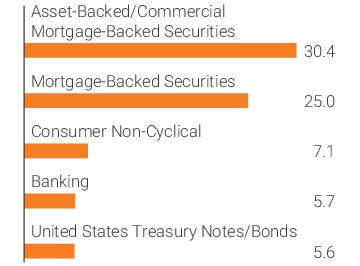
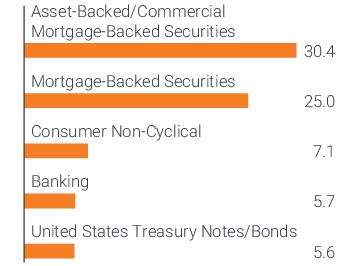
Asset-Backed/Commercial Mortgage-Backed Securities | 30.4) |
Mortgage-Backed Securities | 25.0) |
United States Treasury Notes/Bonds | 5.6) |
Investment Companies | 4.8) |
Bank Loans and Mezzanine Loans | 1.9) |
Investments Purchased with Cash Collateral from Securities Lending | 0.7) |
Other | (4.6) |
AAA | 2.0) |
AA | 31.6) |
A | 9.2) |
BBB | 23.6) |
BB | 7.7) |
B | 0.9) |
Not Rated | 25.2) |
Other | (0.2) |
- Prospectus
- Financial information
- Fund holdings
Fund (Class) | Cost of a $10,000 investment | Cost paid as a percentage of a $10,000 investment |
Janus Henderson Flexible Bond Fund (Class I Shares/JFLEX) | $46 | 0.45% |
AVERAGE ANNUAL TOTAL RETURN | 1 Year | 5 Year | 10 Year |
Janus Henderson Flexible Bond Fund (Class I Shares/JFLEX) | 3.83% | 0.69)% | 1.58% |
Bloomberg U.S. Aggregate Bond Index | 2.63% | (0.23)% | 1.35% |
Net assets | $2,605M% |
Number of portfolio holdings | $639% |
Total investment advisory fee paid | $9.7M% |
Portfolio turnover rate | $170% |
Weighted average maturity | 6.5 Years |
Effective duration | 6.4 Years |
Corporate Bonds | 36.2) |
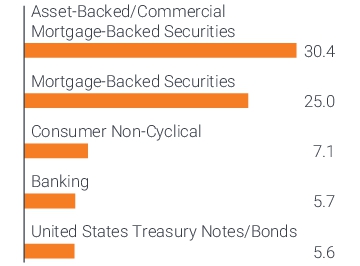
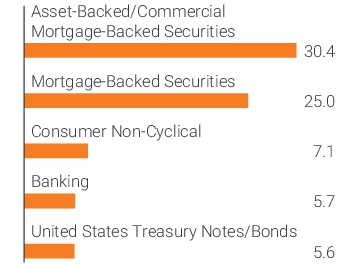
Asset-Backed/Commercial Mortgage-Backed Securities | 30.4) |
Mortgage-Backed Securities | 25.0) |
United States Treasury Notes/Bonds | 5.6) |
Investment Companies | 4.8) |
Bank Loans and Mezzanine Loans | 1.9) |
Investments Purchased with Cash Collateral from Securities Lending | 0.7) |
Other | (4.6) |
AAA | 2.0) |
AA | 31.6) |
A | 9.2) |
BBB | 23.6) |
BB | 7.7) |
B | 0.9) |
Not Rated | 25.2) |
Other | (0.2) |
- Prospectus
- Financial information
- Fund holdings
Fund (Class) | Cost of a $10,000 investment | Cost paid as a percentage of a $10,000 investment |
Janus Henderson Flexible Bond Fund (Class N Shares/JDFNX) | $46 | 0.45% |
AVERAGE ANNUAL TOTAL RETURN | 1 Year | 5 Year | 10 Year |
Janus Henderson Flexible Bond Fund (Class N Shares/JDFNX) | 3.84% | 0.73)% | 1.65% |
Bloomberg U.S. Aggregate Bond Index | 2.63% | (0.23)% | 1.35% |
Net assets | $2,605M% |
Number of portfolio holdings | $639% |
Total investment advisory fee paid | $9.7M% |
Portfolio turnover rate | $170% |
Weighted average maturity | 6.5 Years |
Effective duration | 6.4 Years |
Corporate Bonds | 36.2) |
Asset-Backed/Commercial Mortgage-Backed Securities | 30.4) |
Mortgage-Backed Securities | 25.0) |
United States Treasury Notes/Bonds | 5.6) |
Investment Companies | 4.8) |
Bank Loans and Mezzanine Loans | 1.9) |
Investments Purchased with Cash Collateral from Securities Lending | 0.7) |
Other | (4.6) |
AAA | 2.0) |
AA | 31.6) |
A | 9.2) |
BBB | 23.6) |
BB | 7.7) |
B | 0.9) |
Not Rated | 25.2) |
Other | (0.2) |
- Prospectus
- Financial information
- Fund holdings
Fund (Class) | Cost of a $10,000 investment | Cost paid as a percentage of a $10,000 investment |
Janus Henderson Flexible Bond Fund (Class R Shares/JDFRX) | $121 | 1.19% |
AVERAGE ANNUAL TOTAL RETURN | 1 Year | 5 Year | 10 Year |
Janus Henderson Flexible Bond Fund (Class R Shares/JDFRX) | 3.06% | (0.01)% | 0.89% |
Bloomberg U.S. Aggregate Bond Index | 2.63% | (0.23)% | 1.35% |
Net assets | $2,605M% |
Number of portfolio holdings | $639% |
Total investment advisory fee paid | $9.7M% |
Portfolio turnover rate | $170% |
Weighted average maturity | 6.5 Years |
Effective duration | 6.4 Years |
Corporate Bonds | 36.2) |
Asset-Backed/Commercial Mortgage-Backed Securities | 30.4) |
Mortgage-Backed Securities | 25.0) |
United States Treasury Notes/Bonds | 5.6) |
Investment Companies | 4.8) |
Bank Loans and Mezzanine Loans | 1.9) |
Investments Purchased with Cash Collateral from Securities Lending | 0.7) |
Other | (4.6) |
AAA | 2.0) |
AA | 31.6) |
A | 9.2) |
BBB | 23.6) |
BB | 7.7) |
B | 0.9) |
Not Rated | 25.2) |
Other | (0.2) |
- Prospectus
- Financial information
- Fund holdings
Fund (Class) | Cost of a $10,000 investment | Cost paid as a percentage of a $10,000 investment |
Janus Henderson Flexible Bond Fund (Class S Shares/JADFX) | $97 | 0.95% |
AVERAGE ANNUAL TOTAL RETURN | 1 Year | 5 Year | 10 Year |
Janus Henderson Flexible Bond Fund (Class S Shares/JADFX) | 3.32% | 0.23)% | 1.14% |
Bloomberg U.S. Aggregate Bond Index | 2.63% | (0.23)% | 1.35% |
Net assets | $2,605M% |
Number of portfolio holdings | $639% |
Total investment advisory fee paid | $9.7M% |
Portfolio turnover rate | $170% |
Weighted average maturity | 6.5 Years |
Effective duration | 6.4 Years |
Corporate Bonds | 36.2) |
Asset-Backed/Commercial Mortgage-Backed Securities | 30.4) |
Mortgage-Backed Securities | 25.0) |
United States Treasury Notes/Bonds | 5.6) |
Investment Companies | 4.8) |
Bank Loans and Mezzanine Loans | 1.9) |
Investments Purchased with Cash Collateral from Securities Lending | 0.7) |
Other | (4.6) |
AAA | 2.0) |
AA | 31.6) |
A | 9.2) |
BBB | 23.6) |
BB | 7.7) |
B | 0.9) |
Not Rated | 25.2) |
Other | (0.2) |
- Prospectus
- Financial information
- Fund holdings
Fund (Class) | Cost of a $10,000 investment | Cost paid as a percentage of a $10,000 investment |
Janus Henderson Flexible Bond Fund (Class T Shares/JAFIX) | $69 | 0.68% |
AVERAGE ANNUAL TOTAL RETURN | 1 Year | 5 Year | 10 Year |
Janus Henderson Flexible Bond Fund (Class T Shares/JAFIX) | 3.59% | 0.49)% | 1.41% |
Bloomberg U.S. Aggregate Bond Index | 2.63% | (0.23)% | 1.35% |
Net assets | $2,605M% |
Number of portfolio holdings | $639% |
Total investment advisory fee paid | $9.7M% |
Portfolio turnover rate | $170% |
Weighted average maturity | 6.5 Years |
Effective duration | 6.4 Years |
Corporate Bonds | 36.2) |
Asset-Backed/Commercial Mortgage-Backed Securities | 30.4) |
Mortgage-Backed Securities | 25.0) |
United States Treasury Notes/Bonds | 5.6) |
Investment Companies | 4.8) |
Bank Loans and Mezzanine Loans | 1.9) |
Investments Purchased with Cash Collateral from Securities Lending | 0.7) |
Other | (4.6) |
AAA | 2.0) |
AA | 31.6) |
A | 9.2) |
BBB | 23.6) |
BB | 7.7) |
B | 0.9) |
Not Rated | 25.2) |
Other | (0.2) |
- Prospectus
- Financial information
- Fund holdings
Fund (Class) | Cost of a $10,000 investment | Cost paid as a percentage of a $10,000 investment |
Janus Henderson Global Allocation Fund – Conservative (Class A Shares/JCAAX) | $50 | 0.48% |
AVERAGE ANNUAL TOTAL RETURN | 1 Year | 5 Year | 10 Year |
Janus Henderson Global Allocation Fund – Conservative (Class A Shares/JCAAX) at NAV | 7.51% | 2.61)% | 2.61)% |
Janus Henderson Global Allocation Fund – Conservative (Class A Shares/JCAAX) at Maximum Offering Price - 5.75% | 1.30% | 1.41)% | 2.00)% |
Bloomberg Global Aggregate Bond Index | 0.93% | (2.02)% | (0.42)% |
Global Conservative Allocation Index | 8.05% | 3.14)% | 3.23)% |
Net assets | $135M% |
Number of portfolio holdings | $19% |
Total investment advisory fee paid | $0.0M% |
Portfolio turnover rate | $111% |
Fixed Income Funds | 36.5) |
Equity Funds | 31.6) |
Exchange-Traded Funds (ETFs) | 30.7) |
Money Markets | 1.2) |
Other | (0.0) |
Janus Henderson Developed World Bond Fund - Class N Shares | 20.5 |
Janus Henderson Flexible Bond Fund - Class N Shares | 14.9 |
Janus Henderson Overseas Fund - Class N Shares | 13.7 |
iShares Core International Aggregate Bond | 9.6 |
iShares JP Morgan USD Emerging Markets Bond | 8.3 |
- Prospectus
- Financial information
- Fund holdings
Fund (Class) | Cost of a $10,000 investment | Cost paid as a percentage of a $10,000 investment |
Janus Henderson Global Allocation Fund – Conservative (Class C Shares/JCACX) | $125 | 1.21% |
AVERAGE ANNUAL TOTAL RETURN | 1 Year | 5 Year | 10 Year |
Janus Henderson Global Allocation Fund – Conservative (Class C Shares/JCACX) at NAV | 6.66%* | 1.90)% | 1.96)% |
Janus Henderson Global Allocation Fund – Conservative (Class C Shares/JCACX) with Contingent Deferred Sales Charge | 5.66%* | 1.90)% | 1.96)% |
Bloomberg Global Aggregate Bond Index | 0.93%* | (2.02)% | (0.42)% |
Global Conservative Allocation Index | 8.05%* | 3.14)% | 3.23)% |
* | Returns include a 1% contingent deferred sales charge on Shares redeemed within 12 months of purchase. |
Net assets | $135M% |
Number of portfolio holdings | $19% |
Total investment advisory fee paid | $0.0M% |
Portfolio turnover rate | $111% |
Fixed Income Funds | 36.5) |
Equity Funds | 31.6) |
Exchange-Traded Funds (ETFs) | 30.7) |
Money Markets | 1.2) |
Other | (0.0) |
Janus Henderson Developed World Bond Fund - Class N Shares | 20.5 |
Janus Henderson Flexible Bond Fund - Class N Shares | 14.9 |
Janus Henderson Overseas Fund - Class N Shares | 13.7 |
iShares Core International Aggregate Bond | 9.6 |
iShares JP Morgan USD Emerging Markets Bond | 8.3 |
- Prospectus
- Financial information
- Fund holdings
Fund (Class) | Cost of a $10,000 investment | Cost paid as a percentage of a $10,000 investment |
Janus Henderson Global Allocation Fund – Conservative (Class D Shares/JMSCX) | $28 | 0.27% |
AVERAGE ANNUAL TOTAL RETURN | 1 Year | 5 Year | 10 Year |
Janus Henderson Global Allocation Fund – Conservative (Class D Shares/JMSCX) | 7.77% | 2.84)% | 2.83)% |
Bloomberg Global Aggregate Bond Index | 0.93% | (2.02)% | (0.42)% |
Global Conservative Allocation Index | 8.05% | 3.14)% | 3.23)% |
Net assets | $135M% |
Number of portfolio holdings | $19% |
Total investment advisory fee paid | $0.0M% |
Portfolio turnover rate | $111% |
Fixed Income Funds | 36.5) |
Equity Funds | 31.6) |
Exchange-Traded Funds (ETFs) | 30.7) |
Money Markets | 1.2) |
Other | (0.0) |
Janus Henderson Developed World Bond Fund - Class N Shares | 20.5 |
Janus Henderson Flexible Bond Fund - Class N Shares | 14.9 |
Janus Henderson Overseas Fund - Class N Shares | 13.7 |
iShares Core International Aggregate Bond | 9.6 |
iShares JP Morgan USD Emerging Markets Bond | 8.3 |
- Prospectus
- Financial information
- Fund holdings
Fund (Class) | Cost of a $10,000 investment | Cost paid as a percentage of a $10,000 investment |
Janus Henderson Global Allocation Fund – Conservative (Class I Shares/JCAIX) | $26 | 0.25% |
AVERAGE ANNUAL TOTAL RETURN | 1 Year | 5 Year | 10 Year |
Janus Henderson Global Allocation Fund – Conservative (Class I Shares/JCAIX) | 7.73% | 2.87)% | 2.87)% |
Bloomberg Global Aggregate Bond Index | 0.93% | (2.02)% | (0.42)% |
Global Conservative Allocation Index | 8.05% | 3.14)% | 3.23)% |
Net assets | $135M% |
Number of portfolio holdings | $19% |
Total investment advisory fee paid | $0.0M% |
Portfolio turnover rate | $111% |
Fixed Income Funds | 36.5) |
Equity Funds | 31.6) |
Exchange-Traded Funds (ETFs) | 30.7) |
Money Markets | 1.2) |
Other | (0.0) |
Janus Henderson Developed World Bond Fund - Class N Shares | 20.5 |
Janus Henderson Flexible Bond Fund - Class N Shares | 14.9 |
Janus Henderson Overseas Fund - Class N Shares | 13.7 |
iShares Core International Aggregate Bond | 9.6 |
iShares JP Morgan USD Emerging Markets Bond | 8.3 |
- Prospectus
- Financial information
- Fund holdings
Fund (Class) | Cost of a $10,000 investment | Cost paid as a percentage of a $10,000 investment |
Janus Henderson Global Allocation Fund – Conservative (Class S Shares/JCASX) | $67 | 0.65% |
AVERAGE ANNUAL TOTAL RETURN | 1 Year | 5 Year | 10 Year |
Janus Henderson Global Allocation Fund – Conservative (Class S Shares/JCASX) | 7.33% | 2.43)% | 2.44)% |
Bloomberg Global Aggregate Bond Index | 0.93% | (2.02)% | (0.42)% |
Global Conservative Allocation Index | 8.05% | 3.14)% | 3.23)% |
Net assets | $135M% |
Number of portfolio holdings | $19% |
Total investment advisory fee paid | $0.0M% |
Portfolio turnover rate | $111% |
Fixed Income Funds | 36.5) |
Equity Funds | 31.6) |
Exchange-Traded Funds (ETFs) | 30.7) |
Money Markets | 1.2) |
Other | (0.0) |
Janus Henderson Developed World Bond Fund - Class N Shares | 20.5 |
Janus Henderson Flexible Bond Fund - Class N Shares | 14.9 |
Janus Henderson Overseas Fund - Class N Shares | 13.7 |
iShares Core International Aggregate Bond | 9.6 |
iShares JP Morgan USD Emerging Markets Bond | 8.3 |
- Prospectus
- Financial information
- Fund holdings
Fund (Class) | Cost of a $10,000 investment | Cost paid as a percentage of a $10,000 investment |
Janus Henderson Global Allocation Fund – Conservative (Class T Shares/JSPCX) | $35 | 0.34% |
AVERAGE ANNUAL TOTAL RETURN | 1 Year | 5 Year | 10 Year |
Janus Henderson Global Allocation Fund – Conservative (Class T Shares/JSPCX) | 7.65% | 2.76)% | 2.74)% |
Bloomberg Global Aggregate Bond Index | 0.93% | (2.02)% | (0.42)% |
Global Conservative Allocation Index | 8.05% | 3.14)% | 3.23)% |
Net assets | $135M% |
Number of portfolio holdings | $19% |
Total investment advisory fee paid | $0.0M% |
Portfolio turnover rate | $111% |
Fixed Income Funds | 36.5) |
Equity Funds | 31.6) |
Exchange-Traded Funds (ETFs) | 30.7) |
Money Markets | 1.2) |
Other | (0.0) |
Janus Henderson Developed World Bond Fund - Class N Shares | 20.5 |
Janus Henderson Flexible Bond Fund - Class N Shares | 14.9 |
Janus Henderson Overseas Fund - Class N Shares | 13.7 |
iShares Core International Aggregate Bond | 9.6 |
iShares JP Morgan USD Emerging Markets Bond | 8.3 |
- Prospectus
- Financial information
- Fund holdings
Fund (Class) | Cost of a $10,000 investment | Cost paid as a percentage of a $10,000 investment |
Janus Henderson Global Allocation Fund – Growth (Class A Shares/JGCAX) | $49 | 0.46% |
AVERAGE ANNUAL TOTAL RETURN | 1 Year | 5 Year | 10 Year |
Janus Henderson Global Allocation Fund – Growth (Class A Shares/JGCAX) at NAV | 12.46% | 5.84% | 4.97% |
Janus Henderson Global Allocation Fund – Growth (Class A Shares/JGCAX) at Maximum Offering Price - 5.75% | 6.01% | 4.59% | 4.35% |
MSCI All Country World IndexSM | 19.38% | 10.76% | 8.43% |
Global Growth Allocation Index | 15.51% | 8.24% | 6.74% |
Net assets | $233M% |
Number of portfolio holdings | $19% |
Total investment advisory fee paid | $0.1M% |
Portfolio turnover rate | $100% |
Equity Funds | 60.0) |
Exchange-Traded Funds (ETFs) | 28.9) |
Fixed Income Funds | 9.6) |
Money Markets | 1.5) |
Other | (0.0) |
Janus Henderson Overseas Fund - Class N Shares | 26.0 |
Vanguard FTSE Emerging Markets | 14.2 |
Janus Henderson Growth and Income Fund - Class N Shares | 9.8 |
Janus Henderson Enterprise Fund - Class N Shares | 8.9 |
Janus Henderson Research Fund - Class N Shares | 7.9 |
- Prospectus
- Financial information
- Fund holdings
Fund (Class) | Cost of a $10,000 investment | Cost paid as a percentage of a $10,000 investment |
Janus Henderson Global Allocation Fund – Growth (Class C Shares/JGCCX) | $126 | 1.19% |
AVERAGE ANNUAL TOTAL RETURN | 1 Year | 5 Year | 10 Year |
Janus Henderson Global Allocation Fund – Growth (Class C Shares/JGCCX) at NAV | 11.58%* | 5.07% | 4.26% |
Janus Henderson Global Allocation Fund – Growth (Class C Shares/JGCCX) with Contingent Deferred Sales Charge | 10.58%* | 5.07% | 4.26% |
MSCI All Country World IndexSM | 19.38%* | 10.76% | 8.43% |
Global Growth Allocation Index | 15.51%* | 8.24% | 6.74% |
* | Returns include a 1% contingent deferred sales charge on Shares redeemed within 12 months of purchase. |
Net assets | $233M% |
Number of portfolio holdings | $19% |
Total investment advisory fee paid | $0.1M% |
Portfolio turnover rate | $100% |
Equity Funds | 60.0) |
Exchange-Traded Funds (ETFs) | 28.9) |
Fixed Income Funds | 9.6) |
Money Markets | 1.5) |
Other | (0.0) |
Janus Henderson Overseas Fund - Class N Shares | 26.0 |
Vanguard FTSE Emerging Markets | 14.2 |
Janus Henderson Growth and Income Fund - Class N Shares | 9.8 |
Janus Henderson Enterprise Fund - Class N Shares | 8.9 |
Janus Henderson Research Fund - Class N Shares | 7.9 |
- Prospectus
- Financial information
- Fund holdings
Fund (Class) | Cost of a $10,000 investment | Cost paid as a percentage of a $10,000 investment |
Janus Henderson Global Allocation Fund – Growth (Class D Shares/JNSGX) | $29 | 0.27% |
AVERAGE ANNUAL TOTAL RETURN | 1 Year | 5 Year | 10 Year |
Janus Henderson Global Allocation Fund – Growth (Class D Shares/JNSGX) | 12.60% | 6.02% | 5.15% |
MSCI All Country World IndexSM | 19.38% | 10.76% | 8.43% |
Global Growth Allocation Index | 15.51% | 8.24% | 6.74% |
Net assets | $233M% |
Number of portfolio holdings | $19% |
Total investment advisory fee paid | $0.1M% |
Portfolio turnover rate | $100% |
Equity Funds | 60.0) |
Exchange-Traded Funds (ETFs) | 28.9) |
Fixed Income Funds | 9.6) |
Money Markets | 1.5) |
Other | (0.0) |
Janus Henderson Overseas Fund - Class N Shares | 26.0 |
Vanguard FTSE Emerging Markets | 14.2 |
Janus Henderson Growth and Income Fund - Class N Shares | 9.8 |
Janus Henderson Enterprise Fund - Class N Shares | 8.9 |
Janus Henderson Research Fund - Class N Shares | 7.9 |
- Prospectus
- Financial information
- Fund holdings
Fund (Class) | Cost of a $10,000 investment | Cost paid as a percentage of a $10,000 investment |
Janus Henderson Global Allocation Fund – Growth (Class I Shares/JGCIX) | $24 | 0.23% |
AVERAGE ANNUAL TOTAL RETURN | 1 Year | 5 Year | 10 Year |
Janus Henderson Global Allocation Fund – Growth (Class I Shares/JGCIX) | 12.63% | 6.08% | 5.22% |
MSCI All Country World IndexSM | 19.38% | 10.76% | 8.43% |
Global Growth Allocation Index | 15.51% | 8.24% | 6.74% |
Net assets | $233M% |
Number of portfolio holdings | $19% |
Total investment advisory fee paid | $0.1M% |
Portfolio turnover rate | $100% |
Equity Funds | 60.0) |
Exchange-Traded Funds (ETFs) | 28.9) |
Fixed Income Funds | 9.6) |
Money Markets | 1.5) |
Other | (0.0) |
Janus Henderson Overseas Fund - Class N Shares | 26.0 |
Vanguard FTSE Emerging Markets | 14.2 |
Janus Henderson Growth and Income Fund - Class N Shares | 9.8 |
Janus Henderson Enterprise Fund - Class N Shares | 8.9 |
Janus Henderson Research Fund - Class N Shares | 7.9 |
- Prospectus
- Financial information
- Fund holdings
Fund (Class) | Cost of a $10,000 investment | Cost paid as a percentage of a $10,000 investment |
Janus Henderson Global Allocation Fund – Growth (Class S Shares/JGCSX) | $67 | 0.63% |
AVERAGE ANNUAL TOTAL RETURN | 1 Year | 5 Year | 10 Year |
Janus Henderson Global Allocation Fund – Growth (Class S Shares/JGCSX) | 12.17% | 5.64% | 4.79% |
MSCI All Country World IndexSM | 19.38% | 10.76% | 8.43% |
Global Growth Allocation Index | 15.51% | 8.24% | 6.74% |
Net assets | $233M% |
Number of portfolio holdings | $19% |
Total investment advisory fee paid | $0.1M% |
Portfolio turnover rate | $100% |
Equity Funds | 60.0) |
Exchange-Traded Funds (ETFs) | 28.9) |
Fixed Income Funds | 9.6) |
Money Markets | 1.5) |
Other | (0.0) |
Janus Henderson Overseas Fund - Class N Shares | 26.0 |
Vanguard FTSE Emerging Markets | 14.2 |
Janus Henderson Growth and Income Fund - Class N Shares | 9.8 |
Janus Henderson Enterprise Fund - Class N Shares | 8.9 |
Janus Henderson Research Fund - Class N Shares | 7.9 |
- Prospectus
- Financial information
- Fund holdings
Fund (Class) | Cost of a $10,000 investment | Cost paid as a percentage of a $10,000 investment |
Janus Henderson Global Allocation Fund – Growth (Class T Shares/JSPGX) | $36 | 0.34% |
AVERAGE ANNUAL TOTAL RETURN | 1 Year | 5 Year | 10 Year |
Janus Henderson Global Allocation Fund – Growth (Class T Shares/JSPGX) | 12.52% | 5.94% | 5.09% |
MSCI All Country World IndexSM | 19.38% | 10.76% | 8.43% |
Global Growth Allocation Index | 15.51% | 8.24% | 6.74% |
Net assets | $233M% |
Number of portfolio holdings | $19% |
Total investment advisory fee paid | $0.1M% |
Portfolio turnover rate | $100% |
Equity Funds | 60.0) |
Exchange-Traded Funds (ETFs) | 28.9) |
Fixed Income Funds | 9.6) |
Money Markets | 1.5) |
Other | (0.0) |
Janus Henderson Overseas Fund - Class N Shares | 26.0 |
Vanguard FTSE Emerging Markets | 14.2 |
Janus Henderson Growth and Income Fund - Class N Shares | 9.8 |
Janus Henderson Enterprise Fund - Class N Shares | 8.9 |
Janus Henderson Research Fund - Class N Shares | 7.9 |
- Prospectus
- Financial information
- Fund holdings
Fund (Class) | Cost of a $10,000 investment | Cost paid as a percentage of a $10,000 investment |
Janus Henderson Global Allocation Fund – Moderate (Class A Shares/JMOAX) | $45 | 0.43% |
AVERAGE ANNUAL TOTAL RETURN | 1 Year | 5 Year | 10 Year |
Janus Henderson Global Allocation Fund – Moderate (Class A Shares/JMOAX) at NAV | 9.98% | 4.29% | 3.80% |
Janus Henderson Global Allocation Fund – Moderate (Class A Shares/JMOAX) at Maximum Offering Price - 5.75% | 3.64% | 3.05% | 3.19% |
MSCI All Country World IndexSM | 19.38% | 10.76% | 8.43% |
Global Moderate Allocation Index | 11.73% | 5.70% | 5.01% |
Net assets | $190M% |
Number of portfolio holdings | $19% |
Total investment advisory fee paid | $0.0M% |
Portfolio turnover rate | $104% |
Equity Funds | 46.0) |
Exchange-Traded Funds (ETFs) | 29.9) |
Fixed Income Funds | 23.2) |
Money Markets | 0.9) |
Other | (0.0) |
Janus Henderson Overseas Fund - Class N Shares | 19.9 |
Janus Henderson Developed World Bond Fund - Class N Shares | 13.1 |
Vanguard FTSE Emerging Markets | 10.9 |
Janus Henderson Flexible Bond Fund - Class N Shares | 9.5 |
Janus Henderson Growth and Income Fund - Class N Shares | 7.5 |
- Prospectus
- Financial information
- Fund holdings
Fund (Class) | Cost of a $10,000 investment | Cost paid as a percentage of a $10,000 investment |
Janus Henderson Global Allocation Fund – Moderate (Class C Shares/JMOCX) | $119 | 1.14% |
AVERAGE ANNUAL TOTAL RETURN | 1 Year | 5 Year | 10 Year |
Janus Henderson Global Allocation Fund – Moderate (Class C Shares/JMOCX) at NAV | 9.15%* | 3.54% | 3.10% |
Janus Henderson Global Allocation Fund – Moderate (Class C Shares/JMOCX) with Contingent Deferred Sales Charge | 8.15%* | 3.54% | 3.10% |
MSCI All Country World IndexSM | 19.38%* | 10.76% | 8.43% |
Global Moderate Allocation Index | 11.73%* | 5.70% | 5.01% |
* | Returns include a 1% contingent deferred sales charge on Shares redeemed within 12 months of purchase. |
Net assets | $190M% |
Number of portfolio holdings | $19% |
Total investment advisory fee paid | $0.0M% |
Portfolio turnover rate | $104% |
Equity Funds | 46.0) |
Exchange-Traded Funds (ETFs) | 29.9) |
Fixed Income Funds | 23.2) |
Money Markets | 0.9) |
Other | (0.0) |
Janus Henderson Overseas Fund - Class N Shares | 19.9 |
Janus Henderson Developed World Bond Fund - Class N Shares | 13.1 |
Vanguard FTSE Emerging Markets | 10.9 |
Janus Henderson Flexible Bond Fund - Class N Shares | 9.5 |
Janus Henderson Growth and Income Fund - Class N Shares | 7.5 |
- Prospectus
- Financial information
- Fund holdings
Fund (Class) | Cost of a $10,000 investment | Cost paid as a percentage of a $10,000 investment |
Janus Henderson Global Allocation Fund – Moderate (Class D Shares/JNSMX) | $26 | 0.25% |
AVERAGE ANNUAL TOTAL RETURN | 1 Year | 5 Year | 10 Year |
Janus Henderson Global Allocation Fund – Moderate (Class D Shares/JNSMX) | 10.19% | 4.48% | 3.99% |
MSCI All Country World IndexSM | 19.38% | 10.76% | 8.43% |
Global Moderate Allocation Index | 11.73% | 5.70% | 5.01% |
Net assets | $190M% |
Number of portfolio holdings | $19% |
Total investment advisory fee paid | $0.0M% |
Portfolio turnover rate | $104% |
Equity Funds | 46.0) |
Exchange-Traded Funds (ETFs) | 29.9) |
Fixed Income Funds | 23.2) |
Money Markets | 0.9) |
Other | (0.0) |
Janus Henderson Overseas Fund - Class N Shares | 19.9 |
Janus Henderson Developed World Bond Fund - Class N Shares | 13.1 |
Vanguard FTSE Emerging Markets | 10.9 |
Janus Henderson Flexible Bond Fund - Class N Shares | 9.5 |
Janus Henderson Growth and Income Fund - Class N Shares | 7.5 |
- Prospectus
- Financial information
- Fund holdings
Fund (Class) | Cost of a $10,000 investment | Cost paid as a percentage of a $10,000 investment |
Janus Henderson Global Allocation Fund – Moderate (Class I Shares/JMOIX) | $23 | 0.22% |
AVERAGE ANNUAL TOTAL RETURN | 1 Year | 5 Year | 10 Year |
Janus Henderson Global Allocation Fund – Moderate (Class I Shares/JMOIX) | 10.21% | 4.51% | 4.03% |
MSCI All Country World IndexSM | 19.38% | 10.76% | 8.43% |
Global Moderate Allocation Index | 11.73% | 5.70% | 5.01% |
Net assets | $190M% |
Number of portfolio holdings | $19% |
Total investment advisory fee paid | $0.0M% |
Portfolio turnover rate | $104% |
Equity Funds | 46.0) |
Exchange-Traded Funds (ETFs) | 29.9) |
Fixed Income Funds | 23.2) |
Money Markets | 0.9) |
Other | (0.0) |
Janus Henderson Overseas Fund - Class N Shares | 19.9 |
Janus Henderson Developed World Bond Fund - Class N Shares | 13.1 |
Vanguard FTSE Emerging Markets | 10.9 |
Janus Henderson Flexible Bond Fund - Class N Shares | 9.5 |
Janus Henderson Growth and Income Fund - Class N Shares | 7.5 |
- Prospectus
- Financial information
- Fund holdings
Fund (Class) | Cost of a $10,000 investment | Cost paid as a percentage of a $10,000 investment |
Janus Henderson Global Allocation Fund – Moderate (Class S Shares/JMOSX) | $65 | 0.62% |
AVERAGE ANNUAL TOTAL RETURN | 1 Year | 5 Year | 10 Year |
Janus Henderson Global Allocation Fund – Moderate (Class S Shares/JMOSX) | 9.80% | 4.08% | 3.61% |
MSCI All Country World IndexSM | 19.38% | 10.76% | 8.43% |
Global Moderate Allocation Index | 11.73% | 5.70% | 5.01% |
Net assets | $190M% |
Number of portfolio holdings | $19% |
Total investment advisory fee paid | $0.0M% |
Portfolio turnover rate | $104% |
Equity Funds | 46.0) |
Exchange-Traded Funds (ETFs) | 29.9) |
Fixed Income Funds | 23.2) |
Money Markets | 0.9) |
Other | (0.0) |
Janus Henderson Overseas Fund - Class N Shares | 19.9 |
Janus Henderson Developed World Bond Fund - Class N Shares | 13.1 |
Vanguard FTSE Emerging Markets | 10.9 |
Janus Henderson Flexible Bond Fund - Class N Shares | 9.5 |
Janus Henderson Growth and Income Fund - Class N Shares | 7.5 |
- Prospectus
- Financial information
- Fund holdings
Fund (Class) | Cost of a $10,000 investment | Cost paid as a percentage of a $10,000 investment |
Janus Henderson Global Allocation Fund – Moderate (Class T Shares/JSPMX) | $35 | 0.33% |
AVERAGE ANNUAL TOTAL RETURN | 1 Year | 5 Year | 10 Year |
Janus Henderson Global Allocation Fund – Moderate (Class T Shares/JSPMX) | 10.13% | 4.40% | 3.92% |
MSCI All Country World IndexSM | 19.38% | 10.76% | 8.43% |
Global Moderate Allocation Index | 11.73% | 5.70% | 5.01% |
Net assets | $190M% |
Number of portfolio holdings | $19% |
Total investment advisory fee paid | $0.0M% |
Portfolio turnover rate | $104% |
Equity Funds | 46.0) |
Exchange-Traded Funds (ETFs) | 29.9) |
Fixed Income Funds | 23.2) |
Money Markets | 0.9) |
Other | (0.0) |
Janus Henderson Overseas Fund - Class N Shares | 19.9 |
Janus Henderson Developed World Bond Fund - Class N Shares | 13.1 |
Vanguard FTSE Emerging Markets | 10.9 |
Janus Henderson Flexible Bond Fund - Class N Shares | 9.5 |
Janus Henderson Growth and Income Fund - Class N Shares | 7.5 |
- Prospectus
- Financial information
- Fund holdings
Fund (Class) | Cost of a $10,000 investment | Cost paid as a percentage of a $10,000 investment |
Janus Henderson Government Money Market Fund (Class D Shares/JGVXX) | $58 | 0.57% |
AVERAGE ANNUAL TOTAL RETURN | 1 Year | 5 Year | 10 Year |
Janus Henderson Government Money Market Fund (Class D Shares/JGVXX) | 4.88% | 1.80% | 1.15% |
Net assets | $390M |
Number of portfolio holdings | $51 |
Total investment advisory fee paid | $0.8M |
Repurchase Agreements | 36.6 |
U.S. Government Agency Notes | 32.1 |
U.S. Treasury Debt | 16.3 |
Variable Rate Demand Notes | 15.0 |
Other | 0.0 |
- Prospectus
- Financial information
- Fund holdings
Fund (Class) | Cost of a $10,000 investment | Cost paid as a percentage of a $10,000 investment |
Janus Henderson Government Money Market Fund (Class T Shares/JAGXX) | $60 | 0.59% |
AVERAGE ANNUAL TOTAL RETURN | 1 Year | 5 Year | 10 Year |
Janus Henderson Government Money Market Fund (Class T Shares/JAGXX) | 4.86% | 1.79% | 1.14% |
Net assets | $390M |
Number of portfolio holdings | $51 |
Total investment advisory fee paid | $0.8M |
Repurchase Agreements | 36.6 |
U.S. Government Agency Notes | 32.1 |
U.S. Treasury Debt | 16.3 |
Variable Rate Demand Notes | 15.0 |
Other | 0.0 |
- Prospectus
- Financial information
- Fund holdings
Fund (Class) | Cost of a $10,000 investment | Cost paid as a percentage of a $10,000 investment |
Janus Henderson High-Yield Fund (Class A Shares/JHYAX) | $98 | 0.94% |
AVERAGE ANNUAL TOTAL RETURN | 1 Year | 5 Year | 10 Year |
Janus Henderson High-Yield Fund (Class A Shares/JHYAX) at NAV | 9.34% | 2.54)% | 3.09% |
Janus Henderson High-Yield Fund (Class A Shares/JHYAX) at Maximum Offering Price - 4.75% | 4.17% | 1.54)% | 2.59% |
Bloomberg U.S. Aggregate Bond Index | 2.63% | (0.23)% | 1.35% |
Bloomberg U.S. Corporate High-Yield Bond Index | 10.44% | 3.92)% | 4.31% |
Net assets | $705M% |
Number of portfolio holdings | $155% |
Total investment advisory fee paid | $4.4M% |
Portfolio turnover rate | $87% |
Weighted average maturity | 5.1 Years |
Effective duration | 3.2 Years |
Corporate Bonds | 85.9) |
Bank Loans and Mezzanine Loans | 4.1) |
Asset-Backed/Commercial Mortgage-Backed Securities | 3.5) |
Investment Companies | 3.4) |
Common Stocks | 1.9) |
Investments Purchased with Cash Collateral from Securities Lending | 1.7) |
Preferred Stocks | 0.4) |
Convertible Preferred Stocks | 0.3) |
Other | (1.2) |
AA | 7.6 |
BBB | 1.0 |
BB | 34.0 |
B | 39.2 |
CCC | 7.7 |
Not Rated | 5.6 |
Other | 4.9 |
- Prospectus
- Financial information
- Fund holdings
Fund (Class) | Cost of a $10,000 investment | Cost paid as a percentage of a $10,000 investment |
Janus Henderson High-Yield Fund (Class C Shares/JDHCX) | $165 | 1.58% |
AVERAGE ANNUAL TOTAL RETURN | 1 Year | 5 Year | 10 Year |
Janus Henderson High-Yield Fund (Class C Shares/JDHCX) at NAV | 8.64%* | 1.83)% | 2.39% |
Janus Henderson High-Yield Fund (Class C Shares/JDHCX) with Contingent Deferred Sales Charge | 7.64%* | 1.83)% | 2.39% |
Bloomberg U.S. Aggregate Bond Index | 2.63%* | (0.23)% | 1.35% |
Bloomberg U.S. Corporate High-Yield Bond Index | 10.44%* | 3.92)% | 4.31% |
* | Returns include a 1% contingent deferred sales charge on Shares redeemed within 12 months of purchase. |
Net assets | $705M% |
Number of portfolio holdings | $155% |
Total investment advisory fee paid | $4.4M% |
Portfolio turnover rate | $87% |
Weighted average maturity | 5.1 Years |
Effective duration | 3.2 Years |
Corporate Bonds | 85.9) |
Bank Loans and Mezzanine Loans | 4.1) |
Asset-Backed/Commercial Mortgage-Backed Securities | 3.5) |
Investment Companies | 3.4) |
Common Stocks | 1.9) |
Investments Purchased with Cash Collateral from Securities Lending | 1.7) |
Preferred Stocks | 0.4) |
Convertible Preferred Stocks | 0.3) |
Other | (1.2) |
AA | 7.6 |
BBB | 1.0 |
BB | 34.0 |
B | 39.2 |
CCC | 7.7 |
Not Rated | 5.6 |
Other | 4.9 |
- Prospectus
- Financial information
- Fund holdings
Fund (Class) | Cost of a $10,000 investment | Cost paid as a percentage of a $10,000 investment |
Janus Henderson High-Yield Fund (Class D Shares/JNHYX) | $80 | 0.76% |
AVERAGE ANNUAL TOTAL RETURN | 1 Year | 5 Year | 10 Year |
Janus Henderson High-Yield Fund (Class D Shares/JNHYX) | 9.54% | 2.75)% | 3.31% |
Bloomberg U.S. Aggregate Bond Index | 2.63% | (0.23)% | 1.35% |
Bloomberg U.S. Corporate High-Yield Bond Index | 10.44% | 3.92)% | 4.31% |
Net assets | $705M% |
Number of portfolio holdings | $155% |
Total investment advisory fee paid | $4.4M% |
Portfolio turnover rate | $87% |
Weighted average maturity | 5.1 Years |
Effective duration | 3.2 Years |
Corporate Bonds | 85.9) |
Bank Loans and Mezzanine Loans | 4.1) |
Asset-Backed/Commercial Mortgage-Backed Securities | 3.5) |
Investment Companies | 3.4) |
Common Stocks | 1.9) |
Investments Purchased with Cash Collateral from Securities Lending | 1.7) |
Preferred Stocks | 0.4) |
Convertible Preferred Stocks | 0.3) |
Other | (1.2) |
AA | 7.6 |
BBB | 1.0 |
BB | 34.0 |
B | 39.2 |
CCC | 7.7 |
Not Rated | 5.6 |
Other | 4.9 |
- Prospectus
- Financial information
- Fund holdings
Fund (Class) | Cost of a $10,000 investment | Cost paid as a percentage of a $10,000 investment |
Janus Henderson High-Yield Fund (Class I Shares/JHYFX) | $78 | 0.74% |
AVERAGE ANNUAL TOTAL RETURN | 1 Year | 5 Year | 10 Year |
Janus Henderson High-Yield Fund (Class I Shares/JHYFX) | 9.56% | 2.79)% | 3.36% |
Bloomberg U.S. Aggregate Bond Index | 2.63% | (0.23)% | 1.35% |
Bloomberg U.S. Corporate High-Yield Bond Index | 10.44% | 3.92)% | 4.31% |
Net assets | $705M% |
Number of portfolio holdings | $155% |
Total investment advisory fee paid | $4.4M% |
Portfolio turnover rate | $87% |
Weighted average maturity | 5.1 Years |
Effective duration | 3.2 Years |
Corporate Bonds | 85.9) |
Bank Loans and Mezzanine Loans | 4.1) |
Asset-Backed/Commercial Mortgage-Backed Securities | 3.5) |
Investment Companies | 3.4) |
Common Stocks | 1.9) |
Investments Purchased with Cash Collateral from Securities Lending | 1.7) |
Preferred Stocks | 0.4) |
Convertible Preferred Stocks | 0.3) |
Other | (1.2) |
AA | 7.6 |
BBB | 1.0 |
BB | 34.0 |
B | 39.2 |
CCC | 7.7 |
Not Rated | 5.6 |
Other | 4.9 |
- Prospectus
- Financial information
- Fund holdings
Fund (Class) | Cost of a $10,000 investment | Cost paid as a percentage of a $10,000 investment |
Janus Henderson High-Yield Fund (Class N Shares/JHYNX) | $66 | 0.63% |
AVERAGE ANNUAL TOTAL RETURN | 1 Year | 5 Year | 10 Year |
Janus Henderson High-Yield Fund (Class N Shares/JHYNX) | 9.68% | 2.89)% | 3.46% |
Bloomberg U.S. Aggregate Bond Index | 2.63% | (0.23)% | 1.35% |
Bloomberg U.S. Corporate High-Yield Bond Index | 10.44% | 3.92)% | 4.31% |
Net assets | $705M% |
Number of portfolio holdings | $155% |
Total investment advisory fee paid | $4.4M% |
Portfolio turnover rate | $87% |
Weighted average maturity | 5.1 Years |
Effective duration | 3.2 Years |
Corporate Bonds | 85.9) |
Bank Loans and Mezzanine Loans | 4.1) |
Asset-Backed/Commercial Mortgage-Backed Securities | 3.5) |
Investment Companies | 3.4) |
Common Stocks | 1.9) |
Investments Purchased with Cash Collateral from Securities Lending | 1.7) |
Preferred Stocks | 0.4) |
Convertible Preferred Stocks | 0.3) |
Other | (1.2) |
AA | 7.6 |
BBB | 1.0 |
BB | 34.0 |
B | 39.2 |
CCC | 7.7 |
Not Rated | 5.6 |
Other | 4.9 |
- Prospectus
- Financial information
- Fund holdings
Fund (Class) | Cost of a $10,000 investment | Cost paid as a percentage of a $10,000 investment |
Janus Henderson High-Yield Fund (Class R Shares/JHYRX) | $143 | 1.37% |
AVERAGE ANNUAL TOTAL RETURN | 1 Year | 5 Year | 10 Year |
Janus Henderson High-Yield Fund (Class R Shares/JHYRX) | 8.87% | 2.10)% | 2.65% |
Bloomberg U.S. Aggregate Bond Index | 2.63% | (0.23)% | 1.35% |
Bloomberg U.S. Corporate High-Yield Bond Index | 10.44% | 3.92)% | 4.31% |
Net assets | $705M% |
Number of portfolio holdings | $155% |
Total investment advisory fee paid | $4.4M% |
Portfolio turnover rate | $87% |
Weighted average maturity | 5.1 Years |
Effective duration | 3.2 Years |
Corporate Bonds | 85.9) |
Bank Loans and Mezzanine Loans | 4.1) |
Asset-Backed/Commercial Mortgage-Backed Securities | 3.5) |
Investment Companies | 3.4) |
Common Stocks | 1.9) |
Investments Purchased with Cash Collateral from Securities Lending | 1.7) |
Preferred Stocks | 0.4) |
Convertible Preferred Stocks | 0.3) |
Other | (1.2) |
AA | 7.6 |
BBB | 1.0 |
BB | 34.0 |
B | 39.2 |
CCC | 7.7 |
Not Rated | 5.6 |
Other | 4.9 |
- Prospectus
- Financial information
- Fund holdings
Fund (Class) | Cost of a $10,000 investment | Cost paid as a percentage of a $10,000 investment |
Janus Henderson High-Yield Fund (Class S Shares/JDHYX) | $118 | 1.13% |
AVERAGE ANNUAL TOTAL RETURN | 1 Year | 5 Year | 10 Year |
Janus Henderson High-Yield Fund (Class S Shares/JDHYX) | 9.14% | 2.37)% | 2.92% |
Bloomberg U.S. Aggregate Bond Index | 2.63% | (0.23)% | 1.35% |
Bloomberg U.S. Corporate High-Yield Bond Index | 10.44% | 3.92)% | 4.31% |
Net assets | $705M% |
Number of portfolio holdings | $155% |
Total investment advisory fee paid | $4.4M% |
Portfolio turnover rate | $87% |
Weighted average maturity | 5.1 Years |
Effective duration | 3.2 Years |
Corporate Bonds | 85.9) |
Bank Loans and Mezzanine Loans | 4.1) |
Asset-Backed/Commercial Mortgage-Backed Securities | 3.5) |
Investment Companies | 3.4) |
Common Stocks | 1.9) |
Investments Purchased with Cash Collateral from Securities Lending | 1.7) |
Preferred Stocks | 0.4) |
Convertible Preferred Stocks | 0.3) |
Other | (1.2) |
AA | 7.6 |
BBB | 1.0 |
BB | 34.0 |
B | 39.2 |
CCC | 7.7 |
Not Rated | 5.6 |
Other | 4.9 |
- Prospectus
- Financial information
- Fund holdings
Fund (Class) | Cost of a $10,000 investment | Cost paid as a percentage of a $10,000 investment |
Janus Henderson High-Yield Fund (Class T Shares/JAHYX) | $90 | 0.86% |
AVERAGE ANNUAL TOTAL RETURN | 1 Year | 5 Year | 10 Year |
Janus Henderson High-Yield Fund (Class T Shares/JAHYX) | 9.43% | 2.65)% | 3.22% |
Bloomberg U.S. Aggregate Bond Index | 2.63% | (0.23)% | 1.35% |
Bloomberg U.S. Corporate High-Yield Bond Index | 10.44% | 3.92)% | 4.31% |
Net assets | $705M% |
Number of portfolio holdings | $155% |
Total investment advisory fee paid | $4.4M% |
Portfolio turnover rate | $87% |
Weighted average maturity | 5.1 Years |
Effective duration | 3.2 Years |
Corporate Bonds | 85.9) |
Bank Loans and Mezzanine Loans | 4.1) |
Asset-Backed/Commercial Mortgage-Backed Securities | 3.5) |
Investment Companies | 3.4) |
Common Stocks | 1.9) |
Investments Purchased with Cash Collateral from Securities Lending | 1.7) |
Preferred Stocks | 0.4) |
Convertible Preferred Stocks | 0.3) |
Other | (1.2) |
AA | 7.6 |
BBB | 1.0 |
BB | 34.0 |
B | 39.2 |
CCC | 7.7 |
Not Rated | 5.6 |
Other | 4.9 |
- Prospectus
- Financial information
- Fund holdings
Fund (Class) | Cost of a $10,000 investment | Cost paid as a percentage of a $10,000 investment |
Janus Henderson Mid Cap Value Fund (Class A Shares/JDPAX) | $111 | 1.04% |
AVERAGE ANNUAL TOTAL RETURN | 1 Year | 5 Year | 10 Year |
Janus Henderson Mid Cap Value Fund (Class A Shares/JDPAX) at NAV | 13.65% | 7.35% | 6.80% |
Janus Henderson Mid Cap Value Fund (Class A Shares/JDPAX) at Maximum Offering Price - 5.75% | 7.10% | 6.08% | 6.17% |
Russell 3000® Index | 23.13% | 14.14% | 12.15% |
Russell Midcap® Value Index | 11.98% | 8.49% | 7.60% |
Net assets | $2,010M% |
Number of portfolio holdings | $72% |
Total investment advisory fee paid | $12.2M% |
Portfolio turnover rate | $37% |
Casey's General Stores Inc | 3.0 |
Entergy Corp | 2.5 |
Alliant Energy Corp | 2.4 |
Freeport-McMoRan Inc | 2.4 |
Marathon Oil Corp | 2.3 |
Common Stocks | 98.3 |
Repurchase Agreements | 1.6 |
Other | 0.1 |
- Prospectus
- Financial information
- Fund holdings
Fund (Class) | Cost of a $10,000 investment | Cost paid as a percentage of a $10,000 investment |
Janus Henderson Mid Cap Value Fund (Class C Shares/JMVCX) | $180 | 1.69% |
AVERAGE ANNUAL TOTAL RETURN | 1 Year | 5 Year | 10 Year |
Janus Henderson Mid Cap Value Fund (Class C Shares/JMVCX) at NAV | 12.81%* | 6.64% | 6.15% |
Janus Henderson Mid Cap Value Fund (Class C Shares/JMVCX) with Contingent Deferred Sales Charge | 11.81%* | 6.64% | 6.15% |
Russell 3000® Index | 23.13%* | 14.14% | 12.15% |
Russell Midcap® Value Index | 11.98%* | 8.49% | 7.60% |
* | Returns include a 1% contingent deferred sales charge on Shares redeemed within 12 months of purchase. |
Net assets | $2,010M% |
Number of portfolio holdings | $72% |
Total investment advisory fee paid | $12.2M% |
Portfolio turnover rate | $37% |
Casey's General Stores Inc | 3.0 |
Entergy Corp | 2.5 |
Alliant Energy Corp | 2.4 |
Freeport-McMoRan Inc | 2.4 |
Marathon Oil Corp | 2.3 |
Common Stocks | 98.3 |
Repurchase Agreements | 1.6 |
Other | 0.1 |
- Prospectus
- Financial information
- Fund holdings
Fund (Class) | Cost of a $10,000 investment | Cost paid as a percentage of a $10,000 investment |
Janus Henderson Mid Cap Value Fund (Class D Shares/JNMCX) | $83 | 0.78% |
AVERAGE ANNUAL TOTAL RETURN | 1 Year | 5 Year | 10 Year |
Janus Henderson Mid Cap Value Fund (Class D Shares/JNMCX) | 13.87% | 7.65% | 7.11% |
Russell 3000® Index | 23.13% | 14.14% | 12.15% |
Russell Midcap® Value Index | 11.98% | 8.49% | 7.60% |
Net assets | $2,010M% |
Number of portfolio holdings | $72% |
Total investment advisory fee paid | $12.2M% |
Portfolio turnover rate | $37% |
Casey's General Stores Inc | 3.0 |
Entergy Corp | 2.5 |
Alliant Energy Corp | 2.4 |
Freeport-McMoRan Inc | 2.4 |
Marathon Oil Corp | 2.3 |
Common Stocks | 98.3 |
Repurchase Agreements | 1.6 |
Other | 0.1 |
- Prospectus
- Financial information
- Fund holdings
Fund (Class) | Cost of a $10,000 investment | Cost paid as a percentage of a $10,000 investment |
Janus Henderson Mid Cap Value Fund (Class I Shares/JMVAX) | $79 | 0.74% |
AVERAGE ANNUAL TOTAL RETURN | 1 Year | 5 Year | 10 Year |
Janus Henderson Mid Cap Value Fund (Class I Shares/JMVAX) | 13.94% | 7.70% | 7.15% |
Russell 3000® Index | 23.13% | 14.14% | 12.15% |
Russell Midcap® Value Index | 11.98% | 8.49% | 7.60% |
Net assets | $2,010M% |
Number of portfolio holdings | $72% |
Total investment advisory fee paid | $12.2M% |
Portfolio turnover rate | $37% |
Casey's General Stores Inc | 3.0 |
Entergy Corp | 2.5 |
Alliant Energy Corp | 2.4 |
Freeport-McMoRan Inc | 2.4 |
Marathon Oil Corp | 2.3 |
Common Stocks | 98.3 |
Repurchase Agreements | 1.6 |
Other | 0.1 |
- Prospectus
- Financial information
- Fund holdings
Fund (Class) | Cost of a $10,000 investment | Cost paid as a percentage of a $10,000 investment |
Janus Henderson Mid Cap Value Fund (Class N Shares/JDPNX) | $70 | 0.65% |
AVERAGE ANNUAL TOTAL RETURN | 1 Year | 5 Year | 10 Year |
Janus Henderson Mid Cap Value Fund (Class N Shares/JDPNX) | 14.09% | 7.80% | 7.26% |
Russell 3000® Index | 23.13% | 14.14% | 12.15% |
Russell Midcap® Value Index | 11.98% | 8.49% | 7.60% |
Net assets | $2,010M% |
Number of portfolio holdings | $72% |
Total investment advisory fee paid | $12.2M% |
Portfolio turnover rate | $37% |
Casey's General Stores Inc | 3.0 |
Entergy Corp | 2.5 |
Alliant Energy Corp | 2.4 |
Freeport-McMoRan Inc | 2.4 |
Marathon Oil Corp | 2.3 |
Common Stocks | 98.3 |
Repurchase Agreements | 1.6 |
Other | 0.1 |
- Prospectus
- Financial information
- Fund holdings
Fund (Class) | Cost of a $10,000 investment | Cost paid as a percentage of a $10,000 investment |
Janus Henderson Mid Cap Value Fund (Class R Shares/JDPRX) | $148 | 1.39% |
AVERAGE ANNUAL TOTAL RETURN | 1 Year | 5 Year | 10 Year |
Janus Henderson Mid Cap Value Fund (Class R Shares/JDPRX) | 13.23% | 6.99% | 6.46% |
Russell 3000® Index | 23.13% | 14.14% | 12.15% |
Russell Midcap® Value Index | 11.98% | 8.49% | 7.60% |
Net assets | $2,010M% |
Number of portfolio holdings | $72% |
Total investment advisory fee paid | $12.2M% |
Portfolio turnover rate | $37% |
Casey's General Stores Inc | 3.0 |
Entergy Corp | 2.5 |
Alliant Energy Corp | 2.4 |
Freeport-McMoRan Inc | 2.4 |
Marathon Oil Corp | 2.3 |
Common Stocks | 98.3 |
Repurchase Agreements | 1.6 |
Other | 0.1 |
- Prospectus
- Financial information
- Fund holdings
Fund (Class) | Cost of a $10,000 investment | Cost paid as a percentage of a $10,000 investment |
Janus Henderson Mid Cap Value Fund (Class S Shares/JMVIX) | $122 | 1.14% |
AVERAGE ANNUAL TOTAL RETURN | 1 Year | 5 Year | 10 Year |
Janus Henderson Mid Cap Value Fund (Class S Shares/JMVIX) | 13.50% | 7.26% | 6.73% |
Russell 3000® Index | 23.13% | 14.14% | 12.15% |
Russell Midcap® Value Index | 11.98% | 8.49% | 7.60% |
Net assets | $2,010M% |
Number of portfolio holdings | $72% |
Total investment advisory fee paid | $12.2M% |
Portfolio turnover rate | $37% |
Casey's General Stores Inc | 3.0 |
Entergy Corp | 2.5 |
Alliant Energy Corp | 2.4 |
Freeport-McMoRan Inc | 2.4 |
Marathon Oil Corp | 2.3 |
Common Stocks | 98.3 |
Repurchase Agreements | 1.6 |
Other | 0.1 |
- Prospectus
- Financial information
- Fund holdings
Fund (Class) | Cost of a $10,000 investment | Cost paid as a percentage of a $10,000 investment |
Janus Henderson Mid Cap Value Fund (Class T Shares/JMCVX) | $94 | 0.88% |
AVERAGE ANNUAL TOTAL RETURN | 1 Year | 5 Year | 10 Year |
Janus Henderson Mid Cap Value Fund (Class T Shares/JMCVX) | 13.76% | 7.54% | 7.01% |
Russell 3000® Index | 23.13% | 14.14% | 12.15% |
Russell Midcap® Value Index | 11.98% | 8.49% | 7.60% |
Net assets | $2,010M% |
Number of portfolio holdings | $72% |
Total investment advisory fee paid | $12.2M% |
Portfolio turnover rate | $37% |
Casey's General Stores Inc | 3.0 |
Entergy Corp | 2.5 |
Alliant Energy Corp | 2.4 |
Freeport-McMoRan Inc | 2.4 |
Marathon Oil Corp | 2.3 |
Common Stocks | 98.3 |
Repurchase Agreements | 1.6 |
Other | 0.1 |
- Prospectus
- Financial information
- Fund holdings
Fund (Class) | Cost of a $10,000 investment | Cost paid as a percentage of a $10,000 investment |
Janus Henderson Money Market Fund (Class D Shares/JNMXX) | $57 | 0.56% |
AVERAGE ANNUAL TOTAL RETURN | 1 Year | 5 Year | 10 Year |
Janus Henderson Money Market Fund (Class D Shares/JNMXX) | 4.94% | 1.85% | 1.21% |
Net assets | $1,114M |
Number of portfolio holdings | $70 |
Total investment advisory fee paid | $2.2M |
Repurchase Agreements | 35.3 |
Commercial Paper | 32.2 |
Variable Rate Demand Notes | 16.1 |
U.S. Government Agency Notes | 5.4 |
Certificates of Deposit | 5.1 |
U.S. Treasury Debt | 4.4 |
Time Deposits | 1.3 |
Other | 0.2 |
- Prospectus
- Financial information
- Fund holdings
Fund (Class) | Cost of a $10,000 investment | Cost paid as a percentage of a $10,000 investment |
Janus Henderson Money Market Fund (Class T Shares/JAMXX) | $59 | 0.58% |
AVERAGE ANNUAL TOTAL RETURN | 1 Year | 5 Year | 10 Year |
Janus Henderson Money Market Fund (Class T Shares/JAMXX) | 4.92% | 1.84% | 1.19% |
Net assets | $1,114M |
Number of portfolio holdings | $70 |
Total investment advisory fee paid | $2.2M |
Repurchase Agreements | 35.3 |
Commercial Paper | 32.2 |
Variable Rate Demand Notes | 16.1 |
U.S. Government Agency Notes | 5.4 |
Certificates of Deposit | 5.1 |
U.S. Treasury Debt | 4.4 |
Time Deposits | 1.3 |
Other | 0.2 |
- Prospectus
- Financial information
- Fund holdings
Fund (Class) | Cost of a $10,000 investment | Cost paid as a percentage of a $10,000 investment |
Janus Henderson Multi-Sector Income Fund (Class A Shares/JMUAX) | $95 | 0.91% |
AVERAGE ANNUAL TOTAL RETURN | 1 Year | 5 Year | 10 Year |
Janus Henderson Multi-Sector Income Fund (Class A Shares/JMUAX) at NAV | 8.03% | 2.21)% | 3.31% |
Janus Henderson Multi-Sector Income Fund (Class A Shares/JMUAX) at Maximum Offering Price - 4.75% | 2.91% | 1.23)% | 2.81% |
Bloomberg U.S. Aggregate Bond Index | 2.63% | (0.23)% | 1.35% |
Net assets | $4,128M% |
Number of portfolio holdings | $707% |
Total investment advisory fee paid | $19.1M% |
Portfolio turnover rate | $58% |
Weighted average maturity | 5.4 Years |
Effective duration | 4.0 Years |
Asset-Backed/Commercial Mortgage-Backed Securities | 55.7) |
Corporate Bonds | 23.3) |
Mortgage-Backed Securities | 22.9) |
Bank Loans and Mezzanine Loans | 10.7) |
Investment Companies | 3.6) |
Foreign Government Bonds | 3.2) |
Investments Purchased with Cash Collateral from Securities Lending | 0.4) |
Common Stocks | 0.4) |
Promissory Notes | 0.2) |
Private Preferred Equity | 0.1) |
Convertible Preferred Stocks | 0.0) |
Preferred Stocks | 0.0) |
Other | (20.5) |
AAA | 2.8) |
AA | 23.9) |
A | 2.8) |
BBB | 11.7) |
BB | 14.1) |
B | 13.0) |
CCC | 1.2) |
D | 0.0) |
Not Rated | 48.1) |
Other | (17.6) |
- Prospectus
- Financial information
- Fund holdings
Fund (Class) | Cost of a $10,000 investment | Cost paid as a percentage of a $10,000 investment |
Janus Henderson Multi-Sector Income Fund (Class C Shares/JMUCX) | $172 | 1.66% |
AVERAGE ANNUAL TOTAL RETURN | 1 Year | 5 Year | 10 Year |
Janus Henderson Multi-Sector Income Fund (Class C Shares/JMUCX) at NAV | 7.22%* | 1.45)% | 2.55% |
Janus Henderson Multi-Sector Income Fund (Class C Shares/JMUCX) with Contingent Deferred Sales Charge | 6.22%* | 1.45)% | 2.55% |
Bloomberg U.S. Aggregate Bond Index | 2.63%* | (0.23)% | 1.35% |
* | Returns include a 1% contingent deferred sales charge on Shares redeemed within 12 months of purchase. |
Net assets | $4,128M% |
Number of portfolio holdings | $707% |
Total investment advisory fee paid | $19.1M% |
Portfolio turnover rate | $58% |
Weighted average maturity | 5.4 Years |
Effective duration | 4.0 Years |
Asset-Backed/Commercial Mortgage-Backed Securities | 55.7) |
Corporate Bonds | 23.3) |
Mortgage-Backed Securities | 22.9) |
Bank Loans and Mezzanine Loans | 10.7) |
Investment Companies | 3.6) |
Foreign Government Bonds | 3.2) |
Investments Purchased with Cash Collateral from Securities Lending | 0.4) |
Common Stocks | 0.4) |
Promissory Notes | 0.2) |
Private Preferred Equity | 0.1) |
Convertible Preferred Stocks | 0.0) |
Preferred Stocks | 0.0) |
Other | (20.5) |
AAA | 2.8) |
AA | 23.9) |
A | 2.8) |
BBB | 11.7) |
BB | 14.1) |
B | 13.0) |
CCC | 1.2) |
D | 0.0) |
Not Rated | 48.1) |
Other | (17.6) |
- Prospectus
- Financial information
- Fund holdings
Fund (Class) | Cost of a $10,000 investment | Cost paid as a percentage of a $10,000 investment |
Janus Henderson Multi-Sector Income Fund (Class D Shares/JMUDX) | $77 | 0.74% |
AVERAGE ANNUAL TOTAL RETURN | 1 Year | 5 Year | 10 Year |
Janus Henderson Multi-Sector Income Fund (Class D Shares/JMUDX) | 8.21% | 2.38)% | 3.48% |
Bloomberg U.S. Aggregate Bond Index | 2.63% | (0.23)% | 1.35% |
Net assets | $4,128M% |
Number of portfolio holdings | $707% |
Total investment advisory fee paid | $19.1M% |
Portfolio turnover rate | $58% |
Weighted average maturity | 5.4 Years |
Effective duration | 4.0 Years |
Asset-Backed/Commercial Mortgage-Backed Securities | 55.7) |
Corporate Bonds | 23.3) |
Mortgage-Backed Securities | 22.9) |
Bank Loans and Mezzanine Loans | 10.7) |
Investment Companies | 3.6) |
Foreign Government Bonds | 3.2) |
Investments Purchased with Cash Collateral from Securities Lending | 0.4) |
Common Stocks | 0.4) |
Promissory Notes | 0.2) |
Private Preferred Equity | 0.1) |
Convertible Preferred Stocks | 0.0) |
Preferred Stocks | 0.0) |
Other | (20.5) |
AAA | 2.8) |
AA | 23.9) |
A | 2.8) |
BBB | 11.7) |
BB | 14.1) |
B | 13.0) |
CCC | 1.2) |
D | 0.0) |
Not Rated | 48.1) |
Other | (17.6) |
- Prospectus
- Financial information
- Fund holdings
Fund (Class) | Cost of a $10,000 investment | Cost paid as a percentage of a $10,000 investment |
Janus Henderson Multi-Sector Income Fund (Class I Shares/JMUIX) | $73 | 0.70% |
AVERAGE ANNUAL TOTAL RETURN | 1 Year | 5 Year | 10 Year |
Janus Henderson Multi-Sector Income Fund (Class I Shares/JMUIX) | 8.26% | 2.43)% | 3.56% |
Bloomberg U.S. Aggregate Bond Index | 2.63% | (0.23)% | 1.35% |
Net assets | $4,128M% |
Number of portfolio holdings | $707% |
Total investment advisory fee paid | $19.1M% |
Portfolio turnover rate | $58% |
Weighted average maturity | 5.4 Years |
Effective duration | 4.0 Years |
Asset-Backed/Commercial Mortgage-Backed Securities | 55.7) |
Corporate Bonds | 23.3) |
Mortgage-Backed Securities | 22.9) |
Bank Loans and Mezzanine Loans | 10.7) |
Investment Companies | 3.6) |
Foreign Government Bonds | 3.2) |
Investments Purchased with Cash Collateral from Securities Lending | 0.4) |
Common Stocks | 0.4) |
Promissory Notes | 0.2) |
Private Preferred Equity | 0.1) |
Convertible Preferred Stocks | 0.0) |
Preferred Stocks | 0.0) |
Other | (20.5) |
AAA | 2.8) |
AA | 23.9) |
A | 2.8) |
BBB | 11.7) |
BB | 14.1) |
B | 13.0) |
CCC | 1.2) |
D | 0.0) |
Not Rated | 48.1) |
Other | (17.6) |
- Prospectus
- Financial information
- Fund holdings
Fund (Class) | Cost of a $10,000 investment | Cost paid as a percentage of a $10,000 investment |
Janus Henderson Multi-Sector Income Fund (Class N Shares/JMTNX) | $63 | 0.60% |
AVERAGE ANNUAL TOTAL RETURN | 1 Year | 5 Year | 10 Year |
Janus Henderson Multi-Sector Income Fund (Class N Shares/JMTNX) | 8.36% | 2.52)% | 3.62% |
Bloomberg U.S. Aggregate Bond Index | 2.63% | (0.23)% | 1.35% |
Net assets | $4,128M% |
Number of portfolio holdings | $707% |
Total investment advisory fee paid | $19.1M% |
Portfolio turnover rate | $58% |
Weighted average maturity | 5.4 Years |
Effective duration | 4.0 Years |
Asset-Backed/Commercial Mortgage-Backed Securities | 55.7) |
Corporate Bonds | 23.3) |
Mortgage-Backed Securities | 22.9) |
Bank Loans and Mezzanine Loans | 10.7) |
Investment Companies | 3.6) |
Foreign Government Bonds | 3.2) |
Investments Purchased with Cash Collateral from Securities Lending | 0.4) |
Common Stocks | 0.4) |
Promissory Notes | 0.2) |
Private Preferred Equity | 0.1) |
Convertible Preferred Stocks | 0.0) |
Preferred Stocks | 0.0) |
Other | (20.5) |
AAA | 2.8) |
AA | 23.9) |
A | 2.8) |
BBB | 11.7) |
BB | 14.1) |
B | 13.0) |
CCC | 1.2) |
D | 0.0) |
Not Rated | 48.1) |
Other | (17.6) |
- Prospectus
- Financial information
- Fund holdings
Fund (Class) | Cost of a $10,000 investment | Cost paid as a percentage of a $10,000 investment |
Janus Henderson Multi-Sector Income Fund (Class S Shares/JMUSX) | $118 | 1.14% |
AVERAGE ANNUAL TOTAL RETURN | 1 Year | 5 Year | 10 Year |
Janus Henderson Multi-Sector Income Fund (Class S Shares/JMUSX) | 7.79% | 2.04)% | 3.23% |
Bloomberg U.S. Aggregate Bond Index | 2.63% | (0.23)% | 1.35% |
Net assets | $4,128M% |
Number of portfolio holdings | $707% |
Total investment advisory fee paid | $19.1M% |
Portfolio turnover rate | $58% |
Weighted average maturity | 5.4 Years |
Effective duration | 4.0 Years |
Asset-Backed/Commercial Mortgage-Backed Securities | 55.7) |
Corporate Bonds | 23.3) |
Mortgage-Backed Securities | 22.9) |
Bank Loans and Mezzanine Loans | 10.7) |
Investment Companies | 3.6) |
Foreign Government Bonds | 3.2) |
Investments Purchased with Cash Collateral from Securities Lending | 0.4) |
Common Stocks | 0.4) |
Promissory Notes | 0.2) |
Private Preferred Equity | 0.1) |
Convertible Preferred Stocks | 0.0) |
Preferred Stocks | 0.0) |
Other | (20.5) |
AAA | 2.8) |
AA | 23.9) |
A | 2.8) |
BBB | 11.7) |
BB | 14.1) |
B | 13.0) |
CCC | 1.2) |
D | 0.0) |
Not Rated | 48.1) |
Other | (17.6) |
- Prospectus
- Financial information
- Fund holdings
Fund (Class) | Cost of a $10,000 investment | Cost paid as a percentage of a $10,000 investment |
Janus Henderson Multi-Sector Income Fund (Class T Shares/JMUTX) | $86 | 0.83% |
AVERAGE ANNUAL TOTAL RETURN | 1 Year | 5 Year | 10 Year |
Janus Henderson Multi-Sector Income Fund (Class T Shares/JMUTX) | 8.11% | 2.29)% | 3.39% |
Bloomberg U.S. Aggregate Bond Index | 2.63% | (0.23)% | 1.35% |
Net assets | $4,128M% |
Number of portfolio holdings | $707% |
Total investment advisory fee paid | $19.1M% |
Portfolio turnover rate | $58% |
Weighted average maturity | 5.4 Years |
Effective duration | 4.0 Years |
Asset-Backed/Commercial Mortgage-Backed Securities | 55.7) |
Corporate Bonds | 23.3) |
Mortgage-Backed Securities | 22.9) |
Bank Loans and Mezzanine Loans | 10.7) |
Investment Companies | 3.6) |
Foreign Government Bonds | 3.2) |
Investments Purchased with Cash Collateral from Securities Lending | 0.4) |
Common Stocks | 0.4) |
Promissory Notes | 0.2) |
Private Preferred Equity | 0.1) |
Convertible Preferred Stocks | 0.0) |
Preferred Stocks | 0.0) |
Other | (20.5) |
AAA | 2.8) |
AA | 23.9) |
A | 2.8) |
BBB | 11.7) |
BB | 14.1) |
B | 13.0) |
CCC | 1.2) |
D | 0.0) |
Not Rated | 48.1) |
Other | (17.6) |
- Prospectus
- Financial information
- Fund holdings
Fund (Class) | Cost of a $10,000 investment | Cost paid as a percentage of a $10,000 investment |
Janus Henderson Responsible International Dividend Fund (Class A Shares/HDAVX) | $126 | 1.16% |
AVERAGE ANNUAL TOTAL RETURN | 1 Year | 5 Year | 10 Year |
Janus Henderson Responsible International Dividend Fund (Class A Shares/HDAVX) at NAV | 16.97% | 8.27% | 5.89% |
Janus Henderson Responsible International Dividend Fund (Class A Shares/HDAVX) at Maximum Offering Price - 5.75% | 10.26% | 6.99% | 5.35% |
MSCI World ex-USA Index SM | 11.22% | 6.55% | 4.27% |
Net assets | $142M% |
Number of portfolio holdings | $45% |
Total investment advisory fee paid | $0.7M% |
Portfolio turnover rate | $32% |
Taiwan Semiconductor Manufacturing Co Ltd (ADR) | 4.3 |
RELX PLC | 3.8 |
Unilever PLC | 3.3 |
Samsung Electronics Co Ltd | 3.2 |
Novo Nordisk A/S - Class B | 3.1 |
Common Stocks | 90.9 |
Investment Companies | 4.2 |
Preferred Stocks | 3.2 |
Other | 1.7 |
- Prospectus
- Financial information
- Fund holdings
Fund (Class) | Cost of a $10,000 investment | Cost paid as a percentage of a $10,000 investment |
Janus Henderson Responsible International Dividend Fund (Class C Shares/HDCVX) | $200 | 1.85% |
AVERAGE ANNUAL TOTAL RETURN | 1 Year | 5 Year | 10 Year |
Janus Henderson Responsible International Dividend Fund (Class C Shares/HDCVX) at NAV | 16.16%* | 7.46% | 5.09% |
Janus Henderson Responsible International Dividend Fund (Class C Shares/HDCVX) with Contingent Deferred Sales Charge | 15.16%* | 7.46% | 5.09% |
MSCI World ex-USA Index SM | 11.22%* | 6.55% | 4.27% |
* | Returns include a 1% contingent deferred sales charge on Shares redeemed within 12 months of purchase. |
Net assets | $142M% |
Number of portfolio holdings | $45% |
Total investment advisory fee paid | $0.7M% |
Portfolio turnover rate | $32% |
Taiwan Semiconductor Manufacturing Co Ltd (ADR) | 4.3 |
RELX PLC | 3.8 |
Unilever PLC | 3.3 |
Samsung Electronics Co Ltd | 3.2 |
Novo Nordisk A/S - Class B | 3.1 |
Common Stocks | 90.9 |
Investment Companies | 4.2 |
Preferred Stocks | 3.2 |
Other | 1.7 |
- Prospectus
- Financial information
- Fund holdings
Fund (Class) | Cost of a $10,000 investment | Cost paid as a percentage of a $10,000 investment |
Janus Henderson Responsible International Dividend Fund (Class D Shares/HDDVX) | $106 | 0.98% |
AVERAGE ANNUAL TOTAL RETURN | 1 Year | 5 Year | 10 Year |
Janus Henderson Responsible International Dividend Fund (Class D Shares/HDDVX) | 17.15% | 8.44% | 6.05% |
MSCI World ex-USA Index SM | 11.22% | 6.55% | 4.27% |
Net assets | $142M% |
Number of portfolio holdings | $45% |
Total investment advisory fee paid | $0.7M% |
Portfolio turnover rate | $32% |
Taiwan Semiconductor Manufacturing Co Ltd (ADR) | 4.3 |
RELX PLC | 3.8 |
Unilever PLC | 3.3 |
Samsung Electronics Co Ltd | 3.2 |
Novo Nordisk A/S - Class B | 3.1 |
Common Stocks | 90.9 |
Investment Companies | 4.2 |
Preferred Stocks | 3.2 |
Other | 1.7 |
- Prospectus
- Financial information
- Fund holdings
Fund (Class) | Cost of a $10,000 investment | Cost paid as a percentage of a $10,000 investment |
Janus Henderson Responsible International Dividend Fund (Class I Shares/HDIVX) | $101 | 0.93% |
AVERAGE ANNUAL TOTAL RETURN | 1 Year | 5 Year | 10 Year |
Janus Henderson Responsible International Dividend Fund (Class I Shares/HDIVX) | 17.25% | 8.49% | 6.13% |
MSCI World ex-USA Index SM | 11.22% | 6.55% | 4.27% |
Net assets | $142M% |
Number of portfolio holdings | $45% |
Total investment advisory fee paid | $0.7M% |
Portfolio turnover rate | $32% |
Taiwan Semiconductor Manufacturing Co Ltd (ADR) | 4.3 |
RELX PLC | 3.8 |
Unilever PLC | 3.3 |
Samsung Electronics Co Ltd | 3.2 |
Novo Nordisk A/S - Class B | 3.1 |
Common Stocks | 90.9 |
Investment Companies | 4.2 |
Preferred Stocks | 3.2 |
Other | 1.7 |
- Prospectus
- Financial information
- Fund holdings
Fund (Class) | Cost of a $10,000 investment | Cost paid as a percentage of a $10,000 investment |
Janus Henderson Responsible International Dividend Fund (Class N Shares/HDRVX) | $91 | 0.84% |
AVERAGE ANNUAL TOTAL RETURN | 1 Year | 5 Year | 10 Year |
Janus Henderson Responsible International Dividend Fund (Class N Shares/HDRVX) | 17.31% | 8.58% | 6.15% |
MSCI World ex-USA Index SM | 11.22% | 6.55% | 4.27% |
Net assets | $142M% |
Number of portfolio holdings | $45% |
Total investment advisory fee paid | $0.7M% |
Portfolio turnover rate | $32% |
Taiwan Semiconductor Manufacturing Co Ltd (ADR) | 4.3 |
RELX PLC | 3.8 |
Unilever PLC | 3.3 |
Samsung Electronics Co Ltd | 3.2 |
Novo Nordisk A/S - Class B | 3.1 |
Common Stocks | 90.9 |
Investment Companies | 4.2 |
Preferred Stocks | 3.2 |
Other | 1.7 |
- Prospectus
- Financial information
- Fund holdings
Fund (Class) | Cost of a $10,000 investment | Cost paid as a percentage of a $10,000 investment |
Janus Henderson Responsible International Dividend Fund (Class S Shares/HDQVX) | $116 | 1.07% |
AVERAGE ANNUAL TOTAL RETURN | 1 Year | 5 Year | 10 Year |
Janus Henderson Responsible International Dividend Fund (Class S Shares/HDQVX) | 17.06% | 8.43% | 5.91% |
MSCI World ex-USA Index SM | 11.22% | 6.55% | 4.27% |
Net assets | $142M% |
Number of portfolio holdings | $45% |
Total investment advisory fee paid | $0.7M% |
Portfolio turnover rate | $32% |
Taiwan Semiconductor Manufacturing Co Ltd (ADR) | 4.3 |
RELX PLC | 3.8 |
Unilever PLC | 3.3 |
Samsung Electronics Co Ltd | 3.2 |
Novo Nordisk A/S - Class B | 3.1 |
Common Stocks | 90.9 |
Investment Companies | 4.2 |
Preferred Stocks | 3.2 |
Other | 1.7 |
- Prospectus
- Financial information
- Fund holdings
Fund (Class) | Cost of a $10,000 investment | Cost paid as a percentage of a $10,000 investment |
Janus Henderson Responsible International Dividend Fund (Class T Shares/HDTVX) | $118 | 1.09% |
AVERAGE ANNUAL TOTAL RETURN | 1 Year | 5 Year | 10 Year |
Janus Henderson Responsible International Dividend Fund (Class T Shares/HDTVX) | 17.01% | 8.31% | 5.94% |
MSCI World ex-USA Index SM | 11.22% | 6.55% | 4.27% |
Net assets | $142M% |
Number of portfolio holdings | $45% |
Total investment advisory fee paid | $0.7M% |
Portfolio turnover rate | $32% |
Taiwan Semiconductor Manufacturing Co Ltd (ADR) | 4.3 |
RELX PLC | 3.8 |
Unilever PLC | 3.3 |
Samsung Electronics Co Ltd | 3.2 |
Novo Nordisk A/S - Class B | 3.1 |
Common Stocks | 90.9 |
Investment Companies | 4.2 |
Preferred Stocks | 3.2 |
Other | 1.7 |
- Prospectus
- Financial information
- Fund holdings
Fund (Class) | Cost of a $10,000 investment | Cost paid as a percentage of a $10,000 investment |
Janus Henderson Short Duration Flexible Bond Fund (Class A Shares/JSHAX) | $72 | 0.70% |
AVERAGE ANNUAL TOTAL RETURN | 1 Year | 5 Year | 10 Year |
Janus Henderson Short Duration Flexible Bond Fund (Class A Shares/JSHAX) at NAV | 6.16% | 1.34)% | 1.27% |
Janus Henderson Short Duration Flexible Bond Fund (Class A Shares/JSHAX) at Maximum Offering Price - 2.50% | 3.58% | 0.81)% | 1.01% |
Bloomberg U.S. Aggregate Bond Index | 2.63% | (0.23)% | 1.35% |
Bloomberg 1-3 Year U.S. Government/Credit Index | 4.87% | 1.25)% | 1.35% |
Net assets | $709M% |
Number of portfolio holdings | $392% |
Total investment advisory fee paid | $2.2M% |
Portfolio turnover rate | $105% |
Weighted average maturity | 3.4 Years |
Effective duration | 2.0 Years |
Asset-Backed/Commercial Mortgage-Backed Securities | 46.4) |
Corporate Bonds | 40.1) |
Mortgage-Backed Securities | 4.8) |
United States Treasury Notes/Bonds | 4.5) |
Investment Companies | 3.0) |
Bank Loans and Mezzanine Loans | 2.6) |
Investments Purchased with Cash Collateral from Securities Lending | 0.5) |
Other | (1.9) |
AAA | 2.9 |
AA | 10.7 |
A | 13.1 |
BBB | 26.4 |
BB | 6.6 |
B | 1.0 |
Not Rated | 38.6 |
Other | 0.7 |
- Prospectus
- Financial information
- Fund holdings
Fund (Class) | Cost of a $10,000 investment | Cost paid as a percentage of a $10,000 investment |
Janus Henderson Short Duration Flexible Bond Fund (Class C Shares/JSHCX) | $145 | 1.41% |
AVERAGE ANNUAL TOTAL RETURN | 1 Year | 5 Year | 10 Year |
Janus Henderson Short Duration Flexible Bond Fund (Class C Shares/JSHCX) at NAV | 5.79%* | 0.73)% | 0.56% |
Janus Henderson Short Duration Flexible Bond Fund (Class C Shares/JSHCX) with Contingent Deferred Sales Charge | 4.79%* | 0.73)% | 0.56% |
Bloomberg U.S. Aggregate Bond Index | 2.63%* | (0.23)% | 1.35% |
Bloomberg 1-3 Year U.S. Government/Credit Index | 4.87%* | 1.25)% | 1.35% |
* | Returns include a 1% contingent deferred sales charge on Shares redeemed within 12 months of purchase. |
Net assets | $709M% |
Number of portfolio holdings | $392% |
Total investment advisory fee paid | $2.2M% |
Portfolio turnover rate | $105% |
Weighted average maturity | 3.4 Years |
Effective duration | 2.0 Years |
Asset-Backed/Commercial Mortgage-Backed Securities | 46.4) |
Corporate Bonds | 40.1) |
Mortgage-Backed Securities | 4.8) |
United States Treasury Notes/Bonds | 4.5) |
Investment Companies | 3.0) |
Bank Loans and Mezzanine Loans | 2.6) |
Investments Purchased with Cash Collateral from Securities Lending | 0.5) |
Other | (1.9) |
AAA | 2.9 |
AA | 10.7 |
A | 13.1 |
BBB | 26.4 |
BB | 6.6 |
B | 1.0 |
Not Rated | 38.6 |
Other | 0.7 |
- Prospectus
- Financial information
- Fund holdings
Fund (Class) | Cost of a $10,000 investment | Cost paid as a percentage of a $10,000 investment |
Janus Henderson Short Duration Flexible Bond Fund (Class D Shares/JNSTX) | $54 | 0.52% |
AVERAGE ANNUAL TOTAL RETURN | 1 Year | 5 Year | 10 Year |
Janus Henderson Short Duration Flexible Bond Fund (Class D Shares/JNSTX) | 6.35% | 1.51)% | 1.41% |
Bloomberg U.S. Aggregate Bond Index | 2.63% | (0.23)% | 1.35% |
Bloomberg 1-3 Year U.S. Government/Credit Index | 4.87% | 1.25)% | 1.35% |
Net assets | $709M% |
Number of portfolio holdings | $392% |
Total investment advisory fee paid | $2.2M% |
Portfolio turnover rate | $105% |
Weighted average maturity | 3.4 Years |
Effective duration | 2.0 Years |
Asset-Backed/Commercial Mortgage-Backed Securities | 46.4) |
Corporate Bonds | 40.1) |
Mortgage-Backed Securities | 4.8) |
United States Treasury Notes/Bonds | 4.5) |
Investment Companies | 3.0) |
Bank Loans and Mezzanine Loans | 2.6) |
Investments Purchased with Cash Collateral from Securities Lending | 0.5) |
Other | (1.9) |
AAA | 2.9 |
AA | 10.7 |
A | 13.1 |
BBB | 26.4 |
BB | 6.6 |
B | 1.0 |
Not Rated | 38.6 |
Other | 0.7 |
- Prospectus
- Financial information
- Fund holdings
Fund (Class) | Cost of a $10,000 investment | Cost paid as a percentage of a $10,000 investment |
Janus Henderson Short Duration Flexible Bond Fund (Class I Shares/JSHIX) | $46 | 0.45% |
AVERAGE ANNUAL TOTAL RETURN | 1 Year | 5 Year | 10 Year |
Janus Henderson Short Duration Flexible Bond Fund (Class I Shares/JSHIX) | 6.42% | 1.56)% | 1.50% |
Bloomberg U.S. Aggregate Bond Index | 2.63% | (0.23)% | 1.35% |
Bloomberg 1-3 Year U.S. Government/Credit Index | 4.87% | 1.25)% | 1.35% |
Net assets | $709M% |
Number of portfolio holdings | $392% |
Total investment advisory fee paid | $2.2M% |
Portfolio turnover rate | $105% |
Weighted average maturity | 3.4 Years |
Effective duration | 2.0 Years |
Asset-Backed/Commercial Mortgage-Backed Securities | 46.4) |
Corporate Bonds | 40.1) |
Mortgage-Backed Securities | 4.8) |
United States Treasury Notes/Bonds | 4.5) |
Investment Companies | 3.0) |
Bank Loans and Mezzanine Loans | 2.6) |
Investments Purchased with Cash Collateral from Securities Lending | 0.5) |
Other | (1.9) |
AAA | 2.9 |
AA | 10.7 |
A | 13.1 |
BBB | 26.4 |
BB | 6.6 |
B | 1.0 |
Not Rated | 38.6 |
Other | 0.7 |
- Prospectus
- Financial information
- Fund holdings
Fund (Class) | Cost of a $10,000 investment | Cost paid as a percentage of a $10,000 investment |
Janus Henderson Short Duration Flexible Bond Fund (Class N Shares/JSHNX) | $40 | 0.39% |
AVERAGE ANNUAL TOTAL RETURN | 1 Year | 5 Year | 10 Year |
Janus Henderson Short Duration Flexible Bond Fund (Class N Shares/JSHNX) | 6.49% | 1.57)% | 1.50% |
Bloomberg U.S. Aggregate Bond Index | 2.63% | (0.23)% | 1.35% |
Bloomberg 1-3 Year U.S. Government/Credit Index | 4.87% | 1.25)% | 1.35% |
Net assets | $709M% |
Number of portfolio holdings | $392% |
Total investment advisory fee paid | $2.2M% |
Portfolio turnover rate | $105% |
Weighted average maturity | 3.4 Years |
Effective duration | 2.0 Years |
Asset-Backed/Commercial Mortgage-Backed Securities | 46.4) |
Corporate Bonds | 40.1) |
Mortgage-Backed Securities | 4.8) |
United States Treasury Notes/Bonds | 4.5) |
Investment Companies | 3.0) |
Bank Loans and Mezzanine Loans | 2.6) |
Investments Purchased with Cash Collateral from Securities Lending | 0.5) |
Other | (1.9) |
AAA | 2.9 |
AA | 10.7 |
A | 13.1 |
BBB | 26.4 |
BB | 6.6 |
B | 1.0 |
Not Rated | 38.6 |
Other | 0.7 |
- Prospectus
- Financial information
- Fund holdings
Fund (Class) | Cost of a $10,000 investment | Cost paid as a percentage of a $10,000 investment |
Janus Henderson Short Duration Flexible Bond Fund (Class S Shares/JSHSX) | $91 | 0.88% |
AVERAGE ANNUAL TOTAL RETURN | 1 Year | 5 Year | 10 Year |
Janus Henderson Short Duration Flexible Bond Fund (Class S Shares/JSHSX) | 6.35% | 1.22)% | 1.10% |
Bloomberg U.S. Aggregate Bond Index | 2.63% | (0.23)% | 1.35% |
Bloomberg 1-3 Year U.S. Government/Credit Index | 4.87% | 1.25)% | 1.35% |
Net assets | $709M% |
Number of portfolio holdings | $392% |
Total investment advisory fee paid | $2.2M% |
Portfolio turnover rate | $105% |
Weighted average maturity | 3.4 Years |
Effective duration | 2.0 Years |
Asset-Backed/Commercial Mortgage-Backed Securities | 46.4) |
Corporate Bonds | 40.1) |
Mortgage-Backed Securities | 4.8) |
United States Treasury Notes/Bonds | 4.5) |
Investment Companies | 3.0) |
Bank Loans and Mezzanine Loans | 2.6) |
Investments Purchased with Cash Collateral from Securities Lending | 0.5) |
Other | (1.9) |
AAA | 2.9 |
AA | 10.7 |
A | 13.1 |
BBB | 26.4 |
BB | 6.6 |
B | 1.0 |
Not Rated | 38.6 |
Other | 0.7 |
- Prospectus
- Financial information
- Fund holdings
Fund (Class) | Cost of a $10,000 investment | Cost paid as a percentage of a $10,000 investment |
Janus Henderson Short Duration Flexible Bond Fund (Class T Shares/JASBX) | $65 | 0.63% |
AVERAGE ANNUAL TOTAL RETURN | 1 Year | 5 Year | 10 Year |
Janus Henderson Short Duration Flexible Bond Fund (Class T Shares/JASBX) | 6.23% | 1.40)% | 1.30% |
Bloomberg U.S. Aggregate Bond Index | 2.63% | (0.23)% | 1.35% |
Bloomberg 1-3 Year U.S. Government/Credit Index | 4.87% | 1.25)% | 1.35% |
Net assets | $709M% |
Number of portfolio holdings | $392% |
Total investment advisory fee paid | $2.2M% |
Portfolio turnover rate | $105% |
Weighted average maturity | 3.4 Years |
Effective duration | 2.0 Years |
Asset-Backed/Commercial Mortgage-Backed Securities | 46.4) |
Corporate Bonds | 40.1) |
Mortgage-Backed Securities | 4.8) |
United States Treasury Notes/Bonds | 4.5) |
Investment Companies | 3.0) |
Bank Loans and Mezzanine Loans | 2.6) |
Investments Purchased with Cash Collateral from Securities Lending | 0.5) |
Other | (1.9) |
AAA | 2.9 |
AA | 10.7 |
A | 13.1 |
BBB | 26.4 |
BB | 6.6 |
B | 1.0 |
Not Rated | 38.6 |
Other | 0.7 |
- Prospectus
- Financial information
- Fund holdings
Fund (Class) | Cost of a $10,000 investment | Cost paid as a percentage of a $10,000 investment |
Janus Henderson Small Cap Value Fund (Class A Shares/JDSAX) | $130 | 1.22% |
AVERAGE ANNUAL TOTAL RETURN | 1 Year | 5 Year | 10 Year |
Janus Henderson Small Cap Value Fund (Class A Shares/JDSAX) at NAV | 12.57% | 5.13% | 6.14% |
Janus Henderson Small Cap Value Fund (Class A Shares/JDSAX) at Maximum Offering Price - 5.75% | 6.08% | 3.89% | 5.51% |
Russell 3000® Index | 23.13% | 14.14% | 12.15% |
Russell 2000® Value Index | 10.90% | 7.07% | 6.23% |
Net assets | $2,391M% |
Number of portfolio holdings | $88% |
Total investment advisory fee paid | $17.0M% |
Portfolio turnover rate | $36% |
Oasis Petroleum Inc | 3.0 |
Piper Jaffray Cos | 2.5 |
Kirby Corp | 2.4 |
Ameris Bancorp | 2.3 |
STAG Industrial Inc | 2.2 |
Common Stocks | 97.7) |
Repurchase Agreements | 1.5) |
Investment Companies | 0.6) |
Investments Purchased with Cash Collateral from Securities Lending | 0.3) |
Other | (0.1) |
- Prospectus
- Financial information
- Fund holdings
Fund (Class) | Cost of a $10,000 investment | Cost paid as a percentage of a $10,000 investment |
Janus Henderson Small Cap Value Fund (Class C Shares/JCSCX) | $191 | 1.80% |
AVERAGE ANNUAL TOTAL RETURN | 1 Year | 5 Year | 10 Year |
Janus Henderson Small Cap Value Fund (Class C Shares/JCSCX) at NAV | 11.96%* | 4.47% | 5.50% |
Janus Henderson Small Cap Value Fund (Class C Shares/JCSCX) with Contingent Deferred Sales Charge | 10.96%* | 4.47% | 5.50% |
Russell 3000® Index | 23.13%* | 14.14% | 12.15% |
Russell 2000® Value Index | 10.90%* | 7.07% | 6.23% |
* | Returns include a 1% contingent deferred sales charge on Shares redeemed within 12 months of purchase. |
Net assets | $2,391M% |
Number of portfolio holdings | $88% |
Total investment advisory fee paid | $17.0M% |
Portfolio turnover rate | $36% |
Oasis Petroleum Inc | 3.0 |
Piper Jaffray Cos | 2.5 |
Kirby Corp | 2.4 |
Ameris Bancorp | 2.3 |
STAG Industrial Inc | 2.2 |
Common Stocks | 97.7) |
Repurchase Agreements | 1.5) |
Investment Companies | 0.6) |
Investments Purchased with Cash Collateral from Securities Lending | 0.3) |
Other | (0.1) |
- Prospectus
- Financial information
- Fund holdings
Fund (Class) | Cost of a $10,000 investment | Cost paid as a percentage of a $10,000 investment |
Janus Henderson Small Cap Value Fund (Class D Shares/JNPSX) | $96 | 0.90% |
AVERAGE ANNUAL TOTAL RETURN | 1 Year | 5 Year | 10 Year |
Janus Henderson Small Cap Value Fund (Class D Shares/JNPSX) | 12.96% | 5.45% | 6.46% |
Russell 3000® Index | 23.13% | 14.14% | 12.15% |
Russell 2000® Value Index | 10.90% | 7.07% | 6.23% |
Net assets | $2,391M% |
Number of portfolio holdings | $88% |
Total investment advisory fee paid | $17.0M% |
Portfolio turnover rate | $36% |
Oasis Petroleum Inc | 3.0 |
Piper Jaffray Cos | 2.5 |
Kirby Corp | 2.4 |
Ameris Bancorp | 2.3 |
STAG Industrial Inc | 2.2 |
Common Stocks | 97.7) |
Repurchase Agreements | 1.5) |
Investment Companies | 0.6) |
Investments Purchased with Cash Collateral from Securities Lending | 0.3) |
Other | (0.1) |
- Prospectus
- Financial information
- Fund holdings
Fund (Class) | Cost of a $10,000 investment | Cost paid as a percentage of a $10,000 investment |
Janus Henderson Small Cap Value Fund (Class I Shares/JSCOX) | $95 | 0.89% |
AVERAGE ANNUAL TOTAL RETURN | 1 Year | 5 Year | 10 Year |
Janus Henderson Small Cap Value Fund (Class I Shares/JSCOX) | 12.96% | 5.46% | 6.49% |
Russell 3000® Index | 23.13% | 14.14% | 12.15% |
Russell 2000® Value Index | 10.90% | 7.07% | 6.23% |
Net assets | $2,391M% |
Number of portfolio holdings | $88% |
Total investment advisory fee paid | $17.0M% |
Portfolio turnover rate | $36% |
Oasis Petroleum Inc | 3.0 |
Piper Jaffray Cos | 2.5 |
Kirby Corp | 2.4 |
Ameris Bancorp | 2.3 |
STAG Industrial Inc | 2.2 |
Common Stocks | 97.7) |
Repurchase Agreements | 1.5) |
Investment Companies | 0.6) |
Investments Purchased with Cash Collateral from Securities Lending | 0.3) |
Other | (0.1) |
- Prospectus
- Financial information
- Fund holdings
Fund (Class) | Cost of a $10,000 investment | Cost paid as a percentage of a $10,000 investment |
Janus Henderson Small Cap Value Fund (Class L Shares/JSIVX) | $80 | 0.75% |
AVERAGE ANNUAL TOTAL RETURN | 1 Year | 5 Year | 10 Year |
Janus Henderson Small Cap Value Fund (Class L Shares/JSIVX) | 13.14% | 5.60% | 6.60% |
Russell 3000® Index | 23.13% | 14.14% | 12.15% |
Russell 2000® Value Index | 10.90% | 7.07% | 6.23% |
Net assets | $2,391M% |
Number of portfolio holdings | $88% |
Total investment advisory fee paid | $17.0M% |
Portfolio turnover rate | $36% |
Oasis Petroleum Inc | 3.0 |
Piper Jaffray Cos | 2.5 |
Kirby Corp | 2.4 |
Ameris Bancorp | 2.3 |
STAG Industrial Inc | 2.2 |
Common Stocks | 97.7) |
Repurchase Agreements | 1.5) |
Investment Companies | 0.6) |
Investments Purchased with Cash Collateral from Securities Lending | 0.3) |
Other | (0.1) |
- Prospectus
- Financial information
- Fund holdings
Fund (Class) | Cost of a $10,000 investment | Cost paid as a percentage of a $10,000 investment |
Janus Henderson Small Cap Value Fund (Class N Shares/JDSNX) | $78 | 0.73% |
AVERAGE ANNUAL TOTAL RETURN | 1 Year | 5 Year | 10 Year |
Janus Henderson Small Cap Value Fund (Class N Shares/JDSNX) | 13.12% | 5.61% | 6.63% |
Russell 3000® Index | 23.13% | 14.14% | 12.15% |
Russell 2000® Value Index | 10.90% | 7.07% | 6.23% |
Net assets | $2,391M% |
Number of portfolio holdings | $88% |
Total investment advisory fee paid | $17.0M% |
Portfolio turnover rate | $36% |
Oasis Petroleum Inc | 3.0 |
Piper Jaffray Cos | 2.5 |
Kirby Corp | 2.4 |
Ameris Bancorp | 2.3 |
STAG Industrial Inc | 2.2 |
Common Stocks | 97.7) |
Repurchase Agreements | 1.5) |
Investment Companies | 0.6) |
Investments Purchased with Cash Collateral from Securities Lending | 0.3) |
Other | (0.1) |
- Prospectus
- Financial information
- Fund holdings
Fund (Class) | Cost of a $10,000 investment | Cost paid as a percentage of a $10,000 investment |
Janus Henderson Small Cap Value Fund (Class R Shares/JDSRX) | $158 | 1.49% |
AVERAGE ANNUAL TOTAL RETURN | 1 Year | 5 Year | 10 Year |
Janus Henderson Small Cap Value Fund (Class R Shares/JDSRX) | 12.28% | 4.82% | 5.83% |
Russell 3000® Index | 23.13% | 14.14% | 12.15% |
Russell 2000® Value Index | 10.90% | 7.07% | 6.23% |
Net assets | $2,391M% |
Number of portfolio holdings | $88% |
Total investment advisory fee paid | $17.0M% |
Portfolio turnover rate | $36% |
Oasis Petroleum Inc | 3.0 |
Piper Jaffray Cos | 2.5 |
Kirby Corp | 2.4 |
Ameris Bancorp | 2.3 |
STAG Industrial Inc | 2.2 |
Common Stocks | 97.7) |
Repurchase Agreements | 1.5) |
Investment Companies | 0.6) |
Investments Purchased with Cash Collateral from Securities Lending | 0.3) |
Other | (0.1) |
- Prospectus
- Financial information
- Fund holdings
Fund (Class) | Cost of a $10,000 investment | Cost paid as a percentage of a $10,000 investment |
Janus Henderson Small Cap Value Fund (Class S Shares/JISCX) | $133 | 1.25% |
AVERAGE ANNUAL TOTAL RETURN | 1 Year | 5 Year | 10 Year |
Janus Henderson Small Cap Value Fund (Class S Shares/JISCX) | 12.57% | 5.08% | 6.09% |
Russell 3000® Index | 23.13% | 14.14% | 12.15% |
Russell 2000® Value Index | 10.90% | 7.07% | 6.23% |
Net assets | $2,391M% |
Number of portfolio holdings | $88% |
Total investment advisory fee paid | $17.0M% |
Portfolio turnover rate | $36% |
Oasis Petroleum Inc | 3.0 |
Piper Jaffray Cos | 2.5 |
Kirby Corp | 2.4 |
Ameris Bancorp | 2.3 |
STAG Industrial Inc | 2.2 |
Common Stocks | 97.7) |
Repurchase Agreements | 1.5) |
Investment Companies | 0.6) |
Investments Purchased with Cash Collateral from Securities Lending | 0.3) |
Other | (0.1) |
- Prospectus
- Financial information
- Fund holdings
Fund (Class) | Cost of a $10,000 investment | Cost paid as a percentage of a $10,000 investment |
Janus Henderson Small Cap Value Fund (Class T Shares/JSCVX) | $104 | 0.98% |
AVERAGE ANNUAL TOTAL RETURN | 1 Year | 5 Year | 10 Year |
Janus Henderson Small Cap Value Fund (Class T Shares/JSCVX) | 12.87% | 5.35% | 6.37% |
Russell 3000® Index | 23.13% | 14.14% | 12.15% |
Russell 2000® Value Index | 10.90% | 7.07% | 6.23% |
Net assets | $2,391M% |
Number of portfolio holdings | $88% |
Total investment advisory fee paid | $17.0M% |
Portfolio turnover rate | $36% |
Oasis Petroleum Inc | 3.0 |
Piper Jaffray Cos | 2.5 |
Kirby Corp | 2.4 |
Ameris Bancorp | 2.3 |
STAG Industrial Inc | 2.2 |
Common Stocks | 97.7) |
Repurchase Agreements | 1.5) |
Investment Companies | 0.6) |
Investments Purchased with Cash Collateral from Securities Lending | 0.3) |
Other | (0.1) |
- Prospectus
- Financial information
- Fund holdings
Fund (Class) | Cost of a $10,000 investment | Cost paid as a percentage of a $10,000 investment |
Janus Henderson Small-Mid Cap Value Fund (Class A Shares/JVSAX) | $126 | 1.15% |
AVERAGE ANNUAL TOTAL RETURN | 1 Year | 5 Year | 10 Year |
Janus Henderson Small-Mid Cap Value Fund (Class A Shares/JVSAX) at NAV | 18.99% | 6.93% | 7.58% |
Janus Henderson Small-Mid Cap Value Fund (Class A Shares/JVSAX) at Maximum Offering Price - 5.75% | 12.15% | 5.68% | 6.95% |
Russell 3000® Index | 23.13% | 14.14% | 12.15% |
Russell 2500™ Value Index | 11.24% | 8.01% | 6.77% |
Net assets | $95M% |
Number of portfolio holdings | $51% |
Total investment advisory fee paid | $0.5M% |
Portfolio turnover rate | $63% |
Axis Capital Holdings Ltd | 3.0 |
Globus Medical Inc | 2.9 |
Lamar Advertising Co | 2.8 |
Casey's General Stores Inc | 2.8 |
Eastern Bankshares Inc | 2.6 |
Common Stocks | 98.9) |
Repurchase Agreements | 1.2) |
Other | (0.1) |
- Prospectus
- Financial information
- Fund holdings
Fund (Class) | Cost of a $10,000 investment | Cost paid as a percentage of a $10,000 investment |
Janus Henderson Small-Mid Cap Value Fund (Class C Shares/JVSCX) | $195 | 1.79% |
AVERAGE ANNUAL TOTAL RETURN | 1 Year | 5 Year | 10 Year |
Janus Henderson Small-Mid Cap Value Fund (Class C Shares/JVSCX) at NAV | 18.28%* | 6.15% | 6.76% |
Janus Henderson Small-Mid Cap Value Fund (Class C Shares/JVSCX) with Contingent Deferred Sales Charge | 17.28%* | 6.15% | 6.76% |
Russell 3000® Index | 23.13%* | 14.14% | 12.15% |
Russell 2500™ Value Index | 11.24%* | 8.01% | 6.77% |
* | Returns include a 1% contingent deferred sales charge on Shares redeemed within 12 months of purchase. |
Net assets | $95M% |
Number of portfolio holdings | $51% |
Total investment advisory fee paid | $0.5M% |
Portfolio turnover rate | $63% |
Axis Capital Holdings Ltd | 3.0 |
Globus Medical Inc | 2.9 |
Lamar Advertising Co | 2.8 |
Casey's General Stores Inc | 2.8 |
Eastern Bankshares Inc | 2.6 |
Common Stocks | 98.9) |
Repurchase Agreements | 1.2) |
Other | (0.1) |
- Prospectus
- Financial information
- Fund holdings
Fund (Class) | Cost of a $10,000 investment | Cost paid as a percentage of a $10,000 investment |
Janus Henderson Small-Mid Cap Value Fund (Class D Shares/JSVDX) | $100 | 0.91% |
AVERAGE ANNUAL TOTAL RETURN | 1 Year | 5 Year | 10 Year |
Janus Henderson Small-Mid Cap Value Fund (Class D Shares/JSVDX) | 19.34% | 7.17% | 7.81% |
Russell 3000® Index | 23.13% | 14.14% | 12.15% |
Russell 2500™ Value Index | 11.24% | 8.01% | 6.77% |
Net assets | $95M% |
Number of portfolio holdings | $51% |
Total investment advisory fee paid | $0.5M% |
Portfolio turnover rate | $63% |
Axis Capital Holdings Ltd | 3.0 |
Globus Medical Inc | 2.9 |
Lamar Advertising Co | 2.8 |
Casey's General Stores Inc | 2.8 |
Eastern Bankshares Inc | 2.6 |
Common Stocks | 98.9) |
Repurchase Agreements | 1.2) |
Other | (0.1) |
- Prospectus
- Financial information
- Fund holdings
Fund (Class) | Cost of a $10,000 investment | Cost paid as a percentage of a $10,000 investment |
Janus Henderson Small-Mid Cap Value Fund (Class I Shares/JVSIX) | $94 | 0.86% |
AVERAGE ANNUAL TOTAL RETURN | 1 Year | 5 Year | 10 Year |
Janus Henderson Small-Mid Cap Value Fund (Class I Shares/JVSIX) | 19.32% | 7.19% | 7.85% |
Russell 3000® Index | 23.13% | 14.14% | 12.15% |
Russell 2500™ Value Index | 11.24% | 8.01% | 6.77% |
Net assets | $95M% |
Number of portfolio holdings | $51% |
Total investment advisory fee paid | $0.5M% |
Portfolio turnover rate | $63% |
Axis Capital Holdings Ltd | 3.0 |
Globus Medical Inc | 2.9 |
Lamar Advertising Co | 2.8 |
Casey's General Stores Inc | 2.8 |
Eastern Bankshares Inc | 2.6 |
Common Stocks | 98.9) |
Repurchase Agreements | 1.2) |
Other | (0.1) |
- Prospectus
- Financial information
- Fund holdings
Fund (Class) | Cost of a $10,000 investment | Cost paid as a percentage of a $10,000 investment |
Janus Henderson Small-Mid Cap Value Fund (Class N Shares/JVSNX) | $84 | 0.77% |
AVERAGE ANNUAL TOTAL RETURN | 1 Year | 5 Year | 10 Year |
Janus Henderson Small-Mid Cap Value Fund (Class N Shares/JVSNX) | 19.42% | 7.30% | 7.90% |
Russell 3000® Index | 23.13% | 14.14% | 12.15% |
Russell 2500™ Value Index | 11.24% | 8.01% | 6.77% |
Net assets | $95M% |
Number of portfolio holdings | $51% |
Total investment advisory fee paid | $0.5M% |
Portfolio turnover rate | $63% |
Axis Capital Holdings Ltd | 3.0 |
Globus Medical Inc | 2.9 |
Lamar Advertising Co | 2.8 |
Casey's General Stores Inc | 2.8 |
Eastern Bankshares Inc | 2.6 |
Common Stocks | 98.9) |
Repurchase Agreements | 1.2) |
Other | (0.1) |
- Prospectus
- Financial information
- Fund holdings
Fund (Class) | Cost of a $10,000 investment | Cost paid as a percentage of a $10,000 investment |
Janus Henderson Small-Mid Cap Value Fund (Class S Shares/JSVSX) | $122 | 1.11% |
AVERAGE ANNUAL TOTAL RETURN | 1 Year | 5 Year | 10 Year |
Janus Henderson Small-Mid Cap Value Fund (Class S Shares/JSVSX) | 19.04% | 6.85% | 7.55% |
Russell 3000® Index | 23.13% | 14.14% | 12.15% |
Russell 2500™ Value Index | 11.24% | 8.01% | 6.77% |
Net assets | $95M% |
Number of portfolio holdings | $51% |
Total investment advisory fee paid | $0.5M% |
Portfolio turnover rate | $63% |
Axis Capital Holdings Ltd | 3.0 |
Globus Medical Inc | 2.9 |
Lamar Advertising Co | 2.8 |
Casey's General Stores Inc | 2.8 |
Eastern Bankshares Inc | 2.6 |
Common Stocks | 98.9) |
Repurchase Agreements | 1.2) |
Other | (0.1) |
- Prospectus
- Financial information
- Fund holdings
Fund (Class) | Cost of a $10,000 investment | Cost paid as a percentage of a $10,000 investment |
Janus Henderson Small-Mid Cap Value Fund (Class T Shares/JSVTX) | $112 | 1.02% |
AVERAGE ANNUAL TOTAL RETURN | 1 Year | 5 Year | 10 Year |
Janus Henderson Small-Mid Cap Value Fund (Class T Shares/JSVTX) | 19.20% | 7.04% | 7.70% |
Russell 3000® Index | 23.13% | 14.14% | 12.15% |
Russell 2500™ Value Index | 11.24% | 8.01% | 6.77% |
Net assets | $95M% |
Number of portfolio holdings | $51% |
Total investment advisory fee paid | $0.5M% |
Portfolio turnover rate | $63% |
Axis Capital Holdings Ltd | 3.0 |
Globus Medical Inc | 2.9 |
Lamar Advertising Co | 2.8 |
Casey's General Stores Inc | 2.8 |
Eastern Bankshares Inc | 2.6 |
Common Stocks | 98.9) |
Repurchase Agreements | 1.2) |
Other | (0.1) |
- Prospectus
- Financial information
- Fund holdings
Item 2 - Code of Ethics
Code of Ethics
(a) As of the end of the period covered by this report, the Registrant has adopted a code of ethics (the “Fund Code of Ethics for Principal Executive Officer and Senior Financial Officers”) that applies to the Registrant’s Principal Executive Officer and Principal Financial Officer; the Registrant’s Principal Financial Officer also serves as the Principal Accounting Officer.
(c) There was no amendment to the Registrant’s code of ethics described in Item 2(a) above during the period covered by the report.
(d) There was no waiver granted, either actual or implicit, from a provision to the Registrant’s code of ethics described in Item 2(a) above during the period covered by the report.
(e) Not applicable.
(f)(3) The Registrant hereby undertakes to provide any person, without charge, upon request, a copy of the code of ethics. To request a copy of the code of ethics, contact the Registrant at 1-877-335-2687, and ask for a copy of the Fund Code of Ethics for Principal Executive Officer and Senior Financial Officers.
Item 3 - Audit Committee Financial Expert
The Registrant's Board of Trustees has determined that the following members of the Board's Audit Committee are "audit committee financial experts," as defined in Item 3 to Form N-CSR: Gary A. Poliner, Diane A. Wallace, and Cheryl D. Alston who are each "independent" under the standards set forth in Item 3 to Form N-CSR.
Item 4 - Principal Accountant Fees and Services
Janus Investment Fund (the "Trust"), a Massachusetts business trust registered under the Investment Company Act of 1940, as amended, as an open-end investment company, offers 36 funds which include multiple series of shares with differing investment objectives and policies. The funds comprising the Trust have differing fiscal year ends (June 30 and September 30). This Form N-CSR relates to funds with June 30 fiscal year ends (the "Funds").
(a) Audit Fees
The aggregate fees billed for each of the last two fiscal years for professional services rendered by the principal accountant for the audit of the Funds' annual financial statements or services that are normally provided by the accountant in connection with statutory and regulatory filings or engagements for those fiscal years were $786,228 in the fiscal year ended 2024 and $878,359 in the fiscal year ended 2023.
(b) Audit-Related Fees
The aggregate fees billed in each of the last two fiscal years for assurance and related services by the principal accountant that are reasonably related to the performance of the audit of the Funds' financial statements and are not reported under paragraph (a) of this Item were $0 in the fiscal year ended 2024 and $0 in the fiscal year ended 2023.
(c) Tax Fees
The aggregate fees billed in each of the last two fiscal years for professional services rendered by the principal accountant for tax compliance, tax advice, and tax planning were $182,869 in the fiscal year ended 2024 and $175,839 in the fiscal year ended 2023.
The nature of the services comprising the fees disclosed under this category includes tax compliance, tax planning, tax advice, and corporate actions review.
(d) All Other Fees
The aggregate fees billed in each of the last two fiscal years for products and services provided by the principal accountant, other than the services reported in paragraphs (a) through (c) of this Item were $0 in the fiscal year ended 2024 and $0 in the fiscal year ended 2023.
(e) (1) The Registrant's Audit Committee Charter requires the Registrant's Audit Committee to pre-approve any engagement of the principal accountant (i) to provide audit or non-audit services to the Registrant or (ii) to provide non-audit services to the Registrant's investment adviser or any entity controlling, controlled by, or under common control with the investment adviser that provides ongoing services to the Registrant, if the engagement relates directly to the operations and financial reporting of the Registrant, except for those non-audit services that were subject to the pre-approval exception under Rule 2-01 of Regulation S-X. The Chairman of the Audit Committee or, if the Chairman is unavailable, another member of the Audit Committee who is an independent Trustee, may grant the pre-approval. All such delegated pre-approvals must be presented to the Audit Committee no later than the next Audit Committee meeting.
(2) No services described in paragraphs (b) through (d) of this Item were approved by the Registrant’s audit committee pursuant to paragraph (c)(7)(i)(C) of Rule 2-01 of Regulation S-X.
(f) Not applicable as less than 50%
(g) The aggregate non-audit fees billed by the Registrant's accountant for services rendered to the Registrant, and rendered to the Registrant's investment adviser (not including any sub-adviser whose role is primarily portfolio management and is subcontracted with or overseen by another investment adviser), and any entity controlling, controlled by, or under common control with the adviser that provides ongoing services to the Registrant for each of the last two fiscal years of the Registrant were $182,869 in the fiscal year ended 2024 and $175,839 in the fiscal year ended 2023.
(h) The Registrant's audit committee of the board of trustees has considered whether the provision of non-audit services that were rendered to the Registrant's investment adviser (not including any subadviser whose role is primarily portfolio management and is subcontracted with or overseen by another investment adviser), and any entity controlling, controlled by, or under common control with the investment adviser that provides ongoing services to the Registrant that were not pre-approved pursuant to paragraph (c)(7)(ii) of Rule 2-01 of Regulation S-X is compatible with maintaining the principal accountant's independence.
(i) Not applicable.
(j) Not applicable.
Item 5 - Audit Committee of Listed Registrants
Not applicable.
Item 6 - Investments
(a) Schedule of Investments is contained in the Reports to Shareholders included under Item 7 of this Form N-CSR.
(b) Not applicable.
Item 7 - Financial Statements and Financial Highlights for Open-Ended Management Investment Companies
June 30, 2024
Schedule of Investments
June 30, 2024
Shares or Principal Amounts | Value | ||
Asset-Backed/Commercial Mortgage-Backed Securities – 15.4% | |||
Ally Bank Auto Credit-Linked Notes 2024-A B, 5.8270%, 5/17/32ž | $250,000 | $249,940 | |
Bayview Opportunity Master Fund VII 2024-CAR1 C, US 30 Day Average SOFR + 1.5000%, 6.8354%, 12/26/31ž,‡ | 538,290 | 538,287 | |
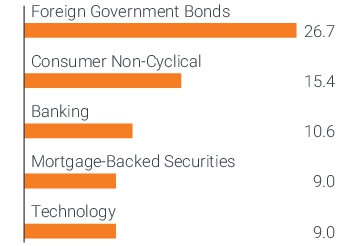
BX Commercial Mortgage Trust 2024-VLT4 A, CME Term SOFR 1 Month + 1.4914%, 6.8114%, 7/16/29ž,‡ | 400,000 | 398,602 | |
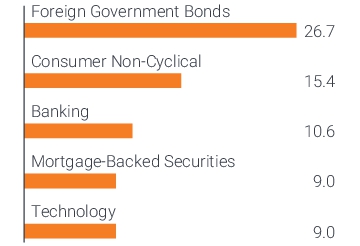
CENT Trust 2023-CITY A, CME Term SOFR 1 Month + 2.6200%, 7.9488%, 9/15/38ž,‡ | 300,000 | 301,315 | |
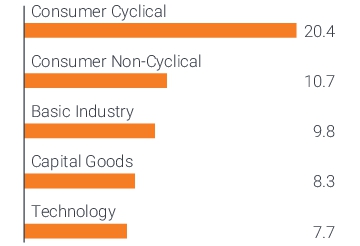
Connecticut Avenue Securities Trust 2021-R01 1M2, US 30 Day Average SOFR + 1.5500%, 6.8854%, 10/25/41ž,‡ | 154,153 | 154,664 | |
Connecticut Avenue Securities Trust 2021-R02 2M2, US 30 Day Average SOFR + 2.0000%, 7.3354%, 11/25/41ž,‡ | 550,000 | 553,360 | |
Connecticut Avenue Securities Trust 2022-R01 1M1, US 30 Day Average SOFR + 1.0000%, 6.3354%, 12/25/41ž,‡ | 117,284 | 117,284 | |
Connecticut Avenue Securities Trust 2022-R05 2M1, US 30 Day Average SOFR + 1.9000%, 7.2354%, 4/25/42ž,‡ | 47,577 | 47,971 | |
Connecticut Avenue Securities Trust 2022-R08 1M1, US 30 Day Average SOFR + 2.5500%, 7.8854%, 7/25/42ž,‡ | 63,839 | 65,649 | |
Connecticut Avenue Securities Trust 2022-R09 2M1, US 30 Day Average SOFR + 2.5000%, 7.8350%, 9/25/42ž,‡ | 220,714 | 224,947 | |
Connecticut Avenue Securities Trust 2023-R01 1M1, US 30 Day Average SOFR + 2.4000%, 7.7350%, 12/25/42ž,‡ | 281,632 | 289,727 | |
Connecticut Avenue Securities Trust 2023-R03 2M1, US 30 Day Average SOFR + 2.5000%, 7.8354%, 4/27/43ž,‡ | 127,977 | 130,326 | |
Connecticut Avenue Securities Trust 2023-R04 1M1, US 30 Day Average SOFR + 2.3000%, 7.6350%, 5/25/43ž,‡ | 168,441 | 172,671 | |
Connecticut Avenue Securities Trust 2023-R06 1M1, US 30 Day Average SOFR + 1.7000%, 7.0354%, 7/27/43ž,‡ | 152,616 | 153,655 | |
Connecticut Avenue Securities Trust 2024-R02 1M1, US 30 Day Average SOFR + 1.1000%, 6.4354%, 2/25/44ž,‡ | 49,153 | 49,199 | |
Connecticut Avenue Securities Trust 2024-R03 2M2, US 30 Day Average SOFR + 1.9500%, 7.2850%, 3/25/44ž,‡ | 804,000 | 808,146 | |
Connecticut Avenue Securities Trust 2024-R04 1M2, US 30 Day Average SOFR + 1.6500%, 6.9737%, 5/25/44ž,‡ | 203,137 | 203,694 | |
Freddie Mac Structured Agency Credit Risk Debt Notes 2021-DNA7 M1, US 30 Day Average SOFR + 0.8500%, 6.1854%, 11/25/41ž,‡ | 18,616 | 18,590 | |
Freddie Mac Structured Agency Credit Risk Debt Notes 2022-DNA6 M1A, US 30 Day Average SOFR + 2.1500%, 7.4854%, 9/25/42ž,‡ | 67,902 | 68,689 | |
Freddie Mac Structured Agency Credit Risk Debt Notes 2022-HQA3 M1A, US 30 Day Average SOFR + 2.3000%, 7.6354%, 8/25/42ž,‡ | 103,538 | 105,988 | |
Freddie Mac Structured Agency Credit Risk Debt Notes 2023-DNA1 M1A, US 30 Day Average SOFR + 2.1000%, 7.4354%, 3/25/43ž,‡ | 185,258 | 188,535 | |
Freddie Mac Structured Agency Credit Risk Debt Notes 2023-DNA2 M1A, US 30 Day Average SOFR + 2.1000%, 7.4350%, 4/27/43ž,‡ | 50,304 | 51,250 | |
Freddie Mac Structured Agency Credit Risk Debt Notes 2023-HQA1 M1A, US 30 Day Average SOFR + 2.0000%, 7.3354%, 5/25/43ž,‡ | 110,962 | 112,226 | |
Freddie Mac Structured Agency Credit Risk Debt Notes 2023-HQA2 M1A, US 30 Day Average SOFR + 2.0000%, 7.3354%, 6/25/43ž,‡ | 350,629 | 352,947 | |
Freddie Mac Structured Agency Credit Risk Debt Notes 2023-HQA3 M1, US 30 Day Average SOFR + 1.8500%, 7.1854%, 11/25/43ž,‡ | 88,357 | 89,541 | |
Freddie Mac Structured Agency Credit Risk Debt Notes 2024-DNA1 M1, US 30 Day Average SOFR + 1.3500%, 6.6854%, 2/25/44ž,‡ | 135,627 | 136,122 | |
Freddie Mac Structured Agency Credit Risk Debt Notes 2024-HQA1 M1, US 30 Day Average SOFR + 1.2500%, 6.5854%, 3/25/44ž,‡ | 63,422 | 63,471 | |
Liberty Funding Pty Ltd 2024-1A A, 30 Day Australian Bank Bill Rate + 1.2000%, 5.4990%, 5/25/32‡ | 500,000 | AUD | 333,449 |
Now Trust 2024-1 A, 30 Day Australian Bank Bill Rate + 1.4000%, 5.6944%, 6/14/32‡ | 400,000 | AUD | 266,758 |
NRTH PARK Mortgage Trust 2024-PARK A, CME Term SOFR 1 Month + 1.6413%, 6.9701%, 3/15/41ž,‡ | 600,000 | 598,017 | |
Subway Funding LLC 2024-1A A2I, 6.0280%, 7/30/54ž | 270,000 | 272,779 |
Schedule of Investments
June 30, 2024
Shares or Principal Amounts | Value | ||
Asset-Backed/Commercial Mortgage-Backed Securities – (continued) | |||
Taco Bell Funding LLC 2018-1A A2II, 4.9400%, 11/25/48ž | $262,560 | $254,917 | |
The Huntington National Bank 2024-1 B1, 6.1530%, 5/20/32ž | 250,000 | 250,020 | |
UK Logistics 2024-1A B, SONIA Interest Rate Benchmark + 2.5500%, 0%, 5/17/34ž,‡ | 330,000 | GBP | 416,890 |
Total Asset-Backed/Commercial Mortgage-Backed Securities (cost $7,992,534) | 8,039,626 | ||
Corporate Bonds – 79.1% | |||
Banking – 16.6% | |||
Australia & New Zealand Banking Group Ltd, 90 Day Australian Bank Bill Rate + 2.0000%, 6.3564%, 7/26/29‡ | 1,800,000 | AUD | 1,201,416 |
Australian Central Credit Union Ltd, 90 Day Australian Bank Bill Rate + 2.4000%, 6.7539%, 9/16/31‡ | 200,000 | AUD | 131,657 |
Commonwealth Bank of Australia, 90 Day Australian Bank Bill Rate + 1.3200%, 5.6529%, 8/20/31‡ | 1,500,000 | AUD | 1,001,187 |
Danske Bank A/S, US Treasury Yield Curve Rate 1 Year + 0.9500%, 5.4270%, 3/1/28ž,‡ | 500,000 | 500,314 | |
ING Groep NV, SOFR + 1.5600%, 6.0830%, 9/11/27‡ | 600,000 | 606,659 | |
Lloyds Banking Group PLC, US Treasury Yield Curve Rate 1 Year + 1.4800%, 5.9850%, 8/7/27‡ | 300,000 | 301,776 | |
Lloyds Banking Group PLC, 90 Day Australian Bank Bill Rate + 1.6800%, 6.0233%, 3/6/30‡ | 130,000 | AUD | 87,035 |
Macquarie Bank Ltd, 90 Day Australian Bank Bill Rate + 1.5500%, 5.9039%, 6/17/31‡ | 1,700,000 | AUD | 1,138,284 |
Macquarie Bank Ltd, 90 Day Australian Bank Bill Rate + 1.9500%, 6.2875%, 3/1/34‡ | 290,000 | AUD | 194,700 |
National Australia Bank Ltd, 90 Day Australian Bank Bill Rate + 2.0200%, 6.3600%, 11/18/31‡ | 2,300,000 | AUD | 1,558,606 |
Teachers Mutual Bank Ltd, 90 Day Australian Bank Bill Rate + 1.3000%, 0%, 6/21/27‡ | 370,000 | AUD | 246,586 |
Westpac Banking Corp, 90 Day Australian Bank Bill Rate + 1.9800%, 6.3149%, 8/27/29‡ | 1,400,000 | AUD | 935,179 |
Westpac Banking Corp, 90 Day Australian Bank Bill Rate + 1.8800%, 6.2255%, 4/3/34‡ | 1,200,000 | AUD | 808,542 |
8,711,941 | |||
Basic Industry – 0.7% | |||
Celanese US Holdings LLC, 6.1650%, 7/15/27 | 275,000 | 279,102 | |
Novelis Corp, 3.2500%, 11/15/26ž | 77,000 | 72,457 | |
351,559 | |||
Brokerage – 1.7% | |||
LPL Holdings Inc, 5.7000%, 5/20/27 | 250,000 | 250,989 | |
LPL Holdings Inc, 4.6250%, 11/15/27ž | 670,000 | 648,309 | |
899,298 | |||
Capital Goods – 4.5% | |||
Ashtead Capital Inc, 1.5000%, 8/12/26ž | 625,000 | 569,701 | |
CNH Industrial Capital Australia Pty Ltd, 5.4000%, 5/17/27 | 800,000 | AUD | 531,521 |
Regal Rexnord Corp, 6.0500%, 2/15/26 | 950,000 | 952,328 | |
Trinity Industries Inc, 7.7500%, 7/15/28ž | 300,000 | 310,561 | |
2,364,111 | |||
Consumer Cyclical – 11.0% | |||
Ford Motor Credit Co LLC, 2.3000%, 2/10/25 | 520,000 | 508,424 | |
Ford Motor Credit Co LLC, 5.8000%, 3/5/27 | 375,000 | 375,008 | |
Ford Motor Credit Co LLC, 7.3500%, 11/4/27 | 500,000 | 520,997 | |
General Motors Financial Co Inc, 1.5500%, 9/2/25 | 40,000 | AUD | 25,389 |
General Motors Financial Co Inc, 5.4000%, 4/6/26 | 255,000 | 254,420 | |
General Motors Financial Co Inc, 5.1500%, 8/15/26 | 110,000 | GBP | 137,836 |
Hyundai Capital America, 5.5000%, 3/30/26ž | 950,000 | 948,998 | |
LKQ Corp, 5.7500%, 6/15/28 | 600,000 | 605,652 | |
VICI Properties LP / Vici Note Co Inc, 4.6250%, 6/15/25ž | 966,000 | 953,371 | |
VICI Properties LP / Vici Note Co Inc, 4.5000%, 9/1/26ž | 150,000 | 145,765 | |
Volkswagen Financial Services NV, 6.5000%, 9/18/27 | 1,000,000 | GBP | 1,304,066 |
5,779,926 |
Schedule of Investments
June 30, 2024
Shares or Principal Amounts | Value | ||
Corporate Bonds – (continued) | |||
Consumer Non-Cyclical – 4.8% | |||
Icon Investments Six DAC, 5.8090%, 5/8/27 | $265,000 | $267,655 | |
Solventum Corp, 5.4500%, 2/25/27ž | 545,000 | 544,468 | |
Solventum Corp, 5.4000%, 3/1/29ž | 275,000 | 274,161 | |
Teva Pharmaceutical Finance Netherlands III BV, 3.1500%, 10/1/26 | 700,000 | 656,976 | |
Universal Health Services Inc, 1.6500%, 9/1/26 | 825,000 | 758,766 | |
2,502,026 | |||
Electric – 4.8% | |||
Algonquin Power & Utilities Corp, 5.3650%, 6/15/26Ç | 165,000 | 164,201 | |
Liberty Utilities Co, 5.5770%, 1/31/29ž | 605,000 | 607,523 | |
NRG Energy Inc, 2.4500%, 12/2/27ž | 553,000 | 499,064 | |
Vistra Operations Co LLC, 3.5500%, 7/15/24ž | 222,000 | 221,743 | |
Vistra Operations Co LLC, 5.1250%, 5/13/25ž | 1,045,000 | 1,038,703 | |
2,531,234 | |||
Energy – 4.1% | |||
Antero Resources Corp, 8.3750%, 7/15/26ž | 600,000 | 619,803 | |
Columbia Pipelines Holding Company LLC, 6.0550%, 8/15/26ž | 125,000 | 125,996 | |
EQM Midstream Partners LP, 6.5000%, 7/1/27ž | 511,000 | 516,486 | |
Hess Midstream Operations LP, 5.6250%, 2/15/26ž | 550,000 | 545,854 | |
Hess Midstream Operations LP, 6.5000%, 6/1/29ž | 89,000 | 90,225 | |
Occidental Petroleum Corp, 3.4000%, 4/15/26 | 275,000 | 263,958 | |
2,162,322 | |||
Finance Companies – 13.4% | |||
AerCap Ireland Capital DAC / AerCap Global Aviation Trust, 1.6500%, 10/29/24 | 200,000 | 197,290 | |
AerCap Ireland Capital DAC / AerCap Global Aviation Trust, 1.7500%, 1/30/26 | 350,000 | 329,693 | |
AerCap Ireland Capital DAC / AerCap Global Aviation Trust, 2.4500%, 10/29/26 | 425,000 | 396,454 | |
AerCap Ireland Capital DAC / AerCap Global Aviation Trust, 6.1000%, 1/15/27 | 200,000 | 202,934 | |
Air Lease Corp, 1.8750%, 8/15/26 | 450,000 | 417,289 | |
Air Lease Corp, 2.1000%, 9/1/28 | 360,000 | 316,112 | |
Aviation Capital Group LLC, 1.9500%, 1/30/26ž | 1,000,000 | 940,978 | |
Aviation Capital Group LLC, 1.9500%, 9/20/26ž | 200,000 | 184,322 | |
Blackstone Private Credit Fund, 3.2500%, 3/15/27 | 290,000 | 267,728 | |
Blue Owl Credit Income Corp, 5.5000%, 3/21/25 | 775,000 | 770,954 | |
Heartland Australia Group Pty Ltd, 90 Day Australian Bank Bill Rate + 2.0000%, 6.3468%, 7/9/24‡ | 2,500,000 | AUD | 1,666,462 |
Macquarie Airfinance Holdings Ltd, 8.3750%, 5/1/28ž | 135,000 | 142,286 | |
Macquarie Airfinance Holdings Ltd, 8.1250%, 3/30/29ž | 260,000 | 274,871 | |
OneMain Finance Corp, 7.1250%, 3/15/26 | 215,000 | 218,473 | |
Rocket Mortgage LLC / Rocket Mortgage Co-Issuer Inc, 2.8750%, 10/15/26ž | 750,000 | 700,415 | |
7,026,261 | |||
Financial Institutions – 3.9% | |||
GGAM Finance Ltd, 7.7500%, 5/15/26ž | 300,000 | 306,127 | |
GGAM Finance Ltd, 8.0000%, 6/15/28ž | 183,000 | 192,744 | |
Liberty Financial Pty Ltd, 90 Day Australian Bank Bill Rate + 2.4500%, 6.8039%, 3/17/25‡ | 610,000 | AUD | 408,028 |
Liberty Financial Pty Ltd, 90 Day Australian Bank Bill Rate + 3.8000%, 8.1539%, 3/16/28‡ | 800,000 | AUD | 553,579 |
QIC Finance Shopping Center Fund Pty Ltd, 90 Day Australian Bank Bill Rate + 1.2700%, 5.6176%, 8/15/25‡ | 880,000 | AUD | 586,101 |
2,046,579 | |||
Industrial – 1.4% | |||
Downer Group Finance Pty Ltd, 3.7000%, 4/29/26 | 1,100,000 | AUD | 706,856 |
Insurance – 5.9% | |||
Athene Global Funding, 5.6840%, 2/23/26ž | 160,000 | 160,363 | |
Athene Global Funding, 1.6080%, 6/29/26ž | 1,022,000 | 946,236 | |
Centene Corp, 4.2500%, 12/15/27 | 700,000 | 668,350 | |
Insurance Australia Group Ltd, 90 Day Australian Bank Bill Rate + 2.3500%, 6.6948%, 6/15/45‡ | 620,000 | AUD | 416,348 |
Schedule of Investments
June 30, 2024
Shares or Principal Amounts | Value | ||
Corporate Bonds – (continued) | |||
Insurance – (continued) | |||
Suncorp Group Ltd, 90 Day Australian Bank Bill Rate + 2.3000%, 6.6375%, 6/1/37‡ | 850,000 | AUD | $576,727 |
Suncorp Group Ltd, 90 Day Australian Bank Bill Rate + 2.6500%, 6.9875%, 12/1/38‡ | 500,000 | AUD | 343,421 |
3,111,445 | |||
Real Estate Investment Trusts (REITs) – 2.5% | |||
Vicinity Centres Trust, 4.0000%, 4/26/27 | 2,020,000 | AUD | 1,295,875 |
Technology – 3.8% | |||
CoStar Group Inc, 2.8000%, 7/15/30ž | $200,000 | 169,123 | |
Gartner Inc, 4.5000%, 7/1/28ž | 280,000 | 269,856 | |
MSCI Inc, 4.0000%, 11/15/29ž | 615,000 | 574,617 | |
Qorvo Inc, 1.7500%, 12/15/24 | 750,000 | 734,099 | |
SK Hynix Inc, 5.5000%, 1/16/27ž | 235,000 | 234,337 | |
1,982,032 | |||
Total Corporate Bonds (cost $42,552,294) | 41,471,465 | ||
Investment Companies – 2.4% | |||
Exchange-Traded Funds (ETFs) – 2.4% | |||
Janus Henderson AAA CLO£ (cost $1,239,780) | 25,100 | 1,277,088 | |
Commercial Paper – 1.6% | |||
Global Payments Inc, 0%, 7/1/24◊ | 600,000 | 599,701 | |
Southern California Edison Co, 0%, 7/1/24±,◊ | 250,000 | 249,883 | |
Total Commercial Paper (cost $849,588) | 849,584 | ||
Total Investments (total cost $52,634,196) – 98.5% | 51,637,763 | ||
Cash, Receivables and Other Assets, net of Liabilities – 1.5% | 766,753 | ||
Net Assets – 100% | $52,404,516 |
Summary of Investments by Country - (Long Positions) (unaudited) | ||
Country | Value | % of Investment Securities |
United States | $29,852,127 | 57.8 % |
Australia | 13,234,820 | 25.6 |
United Kingdom | 1,792,559 | 3.5 |
New Zealand | 1,666,462 | 3.2 |
Ireland | 1,625,242 | 3.1 |
Germany | 1,304,066 | 2.5 |
Israel | 656,976 | 1.3 |
Netherlands | 606,659 | 1.2 |
Denmark | 500,314 | 1.0 |
South Korea | 234,337 | 0.5 |
Canada | 164,201 | 0.3 |
Total | $51,637,763 | 100.0 % |
Schedule of Investments
June 30, 2024
Schedule of Affiliated Investments - (% of Net Assets) | ||||||||
Affiliate | Affiliated Investments, at Value at 6/30/23 | Purchases | Sales Proceeds | Realized Gain/(Loss) | Change in Unrealized Appreciation/ Depreciation | Affiliated Investments, at Value at 6/30/24 | Ending Shares | Dividend Income |
Investment Companies - 2.4% | ||||||||
Exchange-Traded Funds (ETFs) - 2.4% | ||||||||
Janus Henderson AAA CLO | ||||||||
$1,251,235 | $- | $- | $- | $25,853 | $1,277,088 | 25,100 | $81,175 |
Schedule of Forward Foreign Currency Exchange Contracts | ||||
Counterparty/ Foreign Currency | Settlement Date | Foreign Currency Amount (Sold)/ Purchased | USD Currency Amount (Sold)/ Purchased | Market Value and Unrealized Appreciation/ (Depreciation) |
Citibank, National Association: | ||||
Australian Dollar | 7/26/24 | 700,000 | $(465,843) | $1,335 |
HSBC Securities (USA), Inc.: | ||||
New Zealand Dollar | 7/26/24 | (267,000) | 158,323 | (4,252) |
JPMorgan Chase Bank, National Association: | ||||
Australian Dollar | 7/26/24 | (21,600,000) | 14,069,644 | (346,117) |
British Pound | 7/26/24 | (1,224,000) | 1,526,331 | (20,912) |
(367,029) | ||||
Morgan Stanley & Co. International PLC: | ||||
Australian Dollar | 7/26/24 | (2,060,000) | 1,367,902 | (6,935) |
British Pound | 7/26/24 | (330,000) | 415,712 | (1,437) |
(8,372) | ||||
Total | $(378,318) |
Schedule of Futures | ||||
Description | Number of Contracts | Expiration Date | Notional Amount | Value and Unrealized Appreciation/(Depreciation) |
Futures Long: | ||||
2-Year Canadian Bond | 75 | 9/27/24 | $5,668,178 | $27,641 |
3-Month SOFR | 33 | 3/18/26 | 7,922,475 | 28,306 |
Euro-Schatz | 95 | 9/10/24 | 10,752,452 | 29,540 |
Total - Futures Long | 85,487 | |||
Futures Short: | ||||
2 Year US Treasury Note | 36 | 10/3/24 | (7,351,875) | (25,175) |
3-Month SOFR | 33 | 3/17/27 | (7,943,925) | (25,855) |
3-Year Australian Bond | 30 | 9/16/24 | (2,109,867) | 6,148 |
5 Year US Treasury Note | 17 | 10/3/24 | (1,811,828) | (15,937) |
Euro-Bund | 5 | 9/10/24 | (704,694) | (2,609) |
Total - Futures Short | (63,428) | |||
Total | $22,059 |
Schedule of Investments
June 30, 2024
Schedule of Centrally Cleared Interest Rate Swaps | ||||||||
Payments made by Fund | Payments received by Fund | Payment Frequency | Maturity Date | Notional Amount | Premiums Paid/ (Received) | Unrealized Appreciation/ (Depreciation) | Value | |
NDBB3M | 5.615% Fixed Rate | Quarterly | 7/13/25 | 863,400 | NZD | $- | $8,390 | $8,390 |
NDBB3M | 5.3775% Fixed Rate | Quarterly | 7/19/25 | 863,400 | NZD | - | 6,763 | 6,763 |
NDBB3M | 5.44% Fixed Rate | Quarterly | 7/27/25 | 1,650,000 | NZD | - | 13,724 | 13,724 |
NDBB3M | 5.51% Fixed Rate | Quarterly | 8/16/25 | 820,000 | NZD | - | 7,641 | 7,641 |
NDBB3M | 5.3125% Fixed Rate | Quarterly | 11/9/25 | 1,600,000 | NZD | - | 581 | 581 |
4.533% Fixed Rate | BBSW3M | Quarterly | 11/8/25 | 1,487,500 | AUD | - | (1,760) | (1,760) |
NDBB3M | 5.12% Fixed Rate | Quarterly | 4/22/26 | 1,930,000 | NZD | - | 461 | 461 |
4.495% Fixed Rate | NDBB3M | Quarterly | 5/21/34 | 273,000 | NZD | - | 263 | 263 |
NDBB3M | 4.9275% Fixed Rate | Quarterly | 5/21/26 | 1,134,000 | NZD | - | (1,492) | (1,492) |
Total | $0 | $34,571 | $34,571 |
Fair Value of Derivative Instruments (not accounted for as hedging instruments) as of June 30, 2024 | |||
Currency Contracts | Interest Rate Contracts | Total | |
Asset Derivatives: | |||
Forward foreign currency exchange contracts | $1,335 | $- | $1,335 |
*Futures contracts | 91,635 | $91,635 | |
*Swaps - centrally cleared | 37,823 | $37,823 | |
Total Asset Derivatives | $1,335 | $129,458 | $130,793 |
Liability Derivatives: | |||
Forward foreign currency exchange contracts | $379,653 | $- | $379,653 |
*Futures contracts | 69,576 | $69,576 | |
*Swaps - centrally cleared | 3,252 | $3,252 | |
Total Liability Derivatives | $379,653 | $72,828 | $452,481 |
* | The fair value presented includes net cumulative unrealized appreciation (depreciation) on futures contracts and centrally cleared swaps. In the Statement of Assets and Liabilities, only current day's variation margin is reported in receivables or payables and the net cumulative unrealized appreciation (depreciation) is included in total distributable earnings (loss). |
Schedule of Investments
June 30, 2024
The effect of Derivative Instruments (not accounted for as hedging instruments) on the Statement of Operations for the year ended June 30, 2024 | ||||
Amount of Realized Gain/(Loss) Recognized on Derivatives | ||||
Derivative | Credit Contracts | Currency Contracts | Interest Rate Contracts | Total |
Purchased swaption contracts | $(82,566) | $- | $- | $(82,566) |
Futures contracts | - | - | (119,226) | $(119,226) |
Forward foreign currency exchange contracts | - | 475,059 | - | $475,059 |
Swap contracts | - | - | (53,481) | $(53,481) |
Written swaption contracts | 42,337 | - | - | $42,337 |
Total | $(40,229) | $475,059 | $(172,707) | $262,123 |
Amount of Change in Unrealized Appreciation/Depreciation Recognized on Derivatives | |||
Derivative | Currency Contracts | Interest Rate Contracts | Total |
Futures contracts | $- | $21,919 | $21,919 |
Forward foreign currency exchange contracts | (209,144) | - | $(209,144) |
Swap contracts | - | 34,571 | $34,571 |
Total | $(209,144) | $56,490 | $(152,654) |
Average Ending Monthly Value of Derivative Instruments During the Year Ended June 30, 2024 | |
Forward foreign currency exchange contracts: | |
Average amounts purchased - in USD | $1,272,130 |
Average amounts sold - in USD | 21,698,909 |
Futures contracts: | |
Average notional amount of contracts - long | 12,509,826 |
Average notional amount of contracts - short | 9,477,709 |
Interest rate swaps: | |
Average notional amount - pay fixed rate/receive floating rate | 1,530,462 |
Average notional amount - receive fixed rate/pay floating rate | 6,030,738 |
Swaptions: | |
Average value of swaption contracts purchased | 12,114 |
Average value of swaption contracts written | 5,927 |
Offsetting of Financial Assets and Derivative Assets | ||||
Counterparty | Gross Amounts of Recognized Assets | Offsetting Asset or Liability(a) | Collateral Pledged(b) | Net Amount |
Citibank, National Association | $1,335 | $— | $— | $1,335 |
Schedule of Investments
June 30, 2024
Offsetting of Financial Liabilities and Derivative Liabilities | ||||
Counterparty | Gross Amounts of Recognized Liabilities | Offsetting Asset or Liability | Collateral Pledged | Net Amount |
HSBC Securities (USA), Inc. | $4,252 | $— | $— | $4,252 |
JPMorgan Chase Bank, National Association | 367,029 | — | — | 367,029 |
Morgan Stanley & Co. International PLC | 8,372 | — | — | 8,372 |
Total | $379,653 | $— | $— | $379,653 |
(a) | Represents the amount of assets or liabilities that could be offset with the same counterparty under master netting or similar agreements that management elects not to offset on the Statement of Assets and Liabilities. |
(b) | Collateral pledged is limited to the net outstanding amount due to/from an individual counterparty. The actual collateral amounts pledged may exceed these amounts and may fluctuate in value. |
Notes to Schedule of Investments and Other Information
LLC | Limited Liability Company |
LP | Limited Partnership |
PLC | Public Limited Company |
SOFR | Secured Overnight Financing Rate |
SONIA | Sterling Overnight Interbank Average Rate |
ž | Securities sold under Rule 144A of the Securities Act of 1933, as amended, are subject to legal and/or contractual restrictions on resale and may not be publicly sold without registration under the 1933 Act. Unless otherwise noted, these securities have been determined to be liquid under guidelines established by the Board of Trustees. The total value of 144A securities as of the year ended June 30, 2024 is $21,769,196, which represents 41.5% of net assets. |
± | Securities sold under Section 4(2) of the Securities Act of 1933, as amended, are subject to legal and/or contractual restrictions on resale and may not be publicly sold without registration under the 1933 Act. Unless otherwise noted, these securities have been determined to be liquid under guidelines established by the Board of Trustees. The total value of 4(2) securities as of the year ended June 30, 2024 is $249,883, which represents 0.5% of net assets. |
‡ | Variable or floating rate security. Rate shown is the current rate as of June 30, 2024. Certain variable rate securities are not based on a published reference rate and spread; they are determined by the issuer or agent and current market conditions. Reference rate is as of reset date and may vary by security, which may not indicate a reference rate and/or spread in their description. |
Ç | Step bond. The coupon rate will increase or decrease periodically based upon a predetermined schedule. The rate shown reflects the current rate. |
◊ | Zero coupon bond. |
£ | The Fund may invest in certain securities that are considered affiliated companies. As defined by the Investment Company Act of 1940, as amended, an affiliated company is one in which the Fund owns 5% or more of the outstanding voting securities, or a company which is under common ownership or control. |
Notes to Schedule of Investments and Other Information
Valuation Inputs Summary | |||
Level 1 - Quoted Prices | Level 2 - Other Significant Observable Inputs | Level 3 - Significant Unobservable Inputs | |
Assets | |||
Investments In Securities: | |||
Asset-Backed/Commercial Mortgage-Backed Securities | $- | $8,039,626 | $- |
Corporate Bonds | - | 41,471,465 | - |
Investment Companies | 1,277,088 | - | - |
Commercial Paper | - | 849,584 | - |
Total Investments in Securities | $1,277,088 | $50,360,675 | $- |
Other Financial Instruments(a): | |||
Forward Foreign Currency Exchange Contracts | - | 1,335 | - |
Futures Contracts | 91,635 | - | - |
Centrally Cleared Swaps | - | 37,823 | - |
Total Assets | $1,368,723 | $50,399,833 | $- |
Liabilities | |||
Other Financial Instruments(a): | |||
Forward Foreign Currency Exchange Contracts | $- | $379,653 | $- |
Futures Contracts | 69,576 | - | - |
Centrally Cleared Swaps | - | 3,252 | - |
Total Liabilities | $69,576 | $382,905 | $- |
(a) | Other financial instruments may include forward foreign currency exchange contracts, futures, written options, written swaptions, and swap contracts. Forward foreign currency exchange contracts, futures contracts, and swap contracts are reported at their unrealized appreciation/(depreciation) at measurement date, which represents the change in the contract's value from trade date. Written options and written swaptions are reported at their market value at measurement date. |
Statement of Assets and Liabilities
June 30, 2024
Assets: | |
Unaffiliated investments, at value (cost $51,394,416) | $50,360,675 |
Affiliated investments, at value (cost $1,239,780) | 1,277,088 |
Cash | 188,806 |
Deposits with brokers for centrally cleared derivatives | 27,458 |
Deposits with brokers for futures | 290,000 |
Forward foreign currency exchange contracts | 1,335 |
Cash denominated in foreign currency (cost $426,336) | 426,336 |
Variation margin receivable on futures contracts | 9,223 |
Trustees' deferred compensation | 1,441 |
Receivables: | |
Interest | 516,162 |
Fund shares sold | 240,840 |
Due from adviser | 31,349 |
Other assets | 185 |
Total Assets | 53,370,898 |
Liabilities: | |
Forward foreign currency exchange contracts | 379,653 |
Variation margin payable on futures contracts | 8,757 |
Variation margin payable on centrally cleared swaps | 2,098 |
Payables: | |
Fund shares repurchased | 357,144 |
Professional fees | 99,058 |
Advisory fees | 27,924 |
Dividends | 10,455 |
Transfer agent fees and expenses | 7,566 |
12b-1 Distribution and shareholder servicing fees | 4,696 |
Investments purchased | 1,993 |
Custodian fees | 1,667 |
Trustees' deferred compensation fees | 1,441 |
Trustees' fees and expenses | 299 |
Affiliated fund administration fees payable | 106 |
Accrued expenses and other payables | 63,525 |
Total Liabilities | 966,382 |
Commitments and contingent liabilities (Note 4) | |
Net Assets | $52,404,516 |
Statement of Assets and Liabilities
June 30, 2024
Net Assets Consist of: | |
Capital (par value and paid-in surplus) | $233,694,839 |
Total distributable earnings (loss) | (181,290,323) |
Total Net Assets | $52,404,516 |
Net Assets - Class A Shares | $8,470,674 |
Shares Outstanding, $0.01 Par Value (unlimited shares authorized) | 956,595 |
Net Asset Value Per Share(1) | $8.86 |
Maximum Offering Price Per Share(2) | $9.30 |
Net Assets - Class C Shares | $3,311,868 |
Shares Outstanding, $0.01 Par Value (unlimited shares authorized) | 374,322 |
Net Asset Value Per Share(1) | $8.85 |
Net Assets - Class D Shares | $17,952,179 |
Shares Outstanding, $0.01 Par Value (unlimited shares authorized) | 2,026,843 |
Net Asset Value Per Share | $8.86 |
Net Assets - Class I Shares | $15,207,872 |
Shares Outstanding, $0.01 Par Value (unlimited shares authorized) | 1,717,954 |
Net Asset Value Per Share | $8.85 |
Net Assets - Class N Shares | $543,962 |
Shares Outstanding, $0.01 Par Value (unlimited shares authorized) | 61,443 |
Net Asset Value Per Share | $8.85 |
Net Assets - Class R Shares | $365,215 |
Shares Outstanding, $0.01 Par Value (unlimited shares authorized) | 41,217 |
Net Asset Value Per Share | $8.86 |
Net Assets - Class S Shares | $315,610 |
Shares Outstanding, $0.01 Par Value (unlimited shares authorized) | 35,619 |
Net Asset Value Per Share | $8.86 |
Net Assets - Class T Shares | $6,237,136 |
Shares Outstanding, $0.01 Par Value (unlimited shares authorized) | 704,913 |
Net Asset Value Per Share | $8.85 |
(1) | Redemption price per share may be reduced for any applicable contingent deferred sales charge. |
(2) | Maximum offering price is computed at 100/95.25 of net asset value. |
Statement of Operations
For the year ended June 30, 2024
Investment Income: | |
Interest | $2,704,347 |
Dividends from affiliates | 81,175 |
Other income | 47,240 |
Total Investment Income | 2,832,762 |
Expenses: | |
Advisory fees | 355,515 |
12b-1 Distribution and shareholder servicing fees: | |
Class A Shares | 21,855 |
Class C Shares | 37,365 |
Class R Shares | 2,016 |
Class S Shares | 844 |
Transfer agent administrative fees and expenses: | |
Class D Shares | 20,338 |
Class R Shares | 1,008 |
Class S Shares | 844 |
Class T Shares | 15,568 |
Transfer agent networking and omnibus fees: | |
Class A Shares | 5,945 |
Class C Shares | 2,646 |
Class I Shares | 16,076 |
Other transfer agent fees and expenses: | |
Class A Shares | 623 |
Class C Shares | 226 |
Class D Shares | 3,276 |
Class I Shares | 1,084 |
Class N Shares | 39 |
Class R Shares | 15 |
Class S Shares | 13 |
Class T Shares | 215 |
Registration fees | 127,076 |
Professional fees | 79,813 |
Non-affiliated fund administration fees | 41,282 |
Pricing valuation fees | 38,465 |
Accounting systems fees | 29,467 |
Shareholder reports expense | 12,143 |
Custodian fees | 11,995 |
Affiliated fund administration fees | 1,367 |
Trustees' fees and expenses | 1,154 |
Other expenses | 32,839 |
Total Expenses | 861,112 |
Less: Excess Expense Reimbursement and Waivers | (388,399) |
Net Expenses | 472,713 |
Net Investment Income/(Loss) | 2,360,049 |
Statement of Operations
For the year ended June 30, 2024
Net Realized Gain/(Loss) on Investments: | |
Investments and foreign currency transactions | $(1,227,511) |
Purchased swaption contracts | (82,566) |
Forward foreign currency exchange contracts | 475,059 |
Futures contracts | (119,226) |
Swap contracts | (53,481) |
Written swaption contracts | 42,337 |
Total Net Realized Gain/(Loss) on Investments | (965,388) |
Change in Unrealized Net Appreciation/Depreciation: | |
Investments, foreign currency translations and Trustees' deferred compensation | 2,137,105 |
Investments in affiliates | 25,853 |
Forward foreign currency exchange contracts | (209,144) |
Futures contracts | 21,919 |
Swap contracts | 34,571 |
Total Change in Unrealized Net Appreciation/Depreciation | 2,010,304 |
Net Increase/(Decrease) in Net Assets Resulting from Operations | $3,404,965 |
Statements of Changes in Net Assets
Year ended June 30, 2024 | Year ended June 30, 2023 | |
Operations: | ||
Net investment income/(loss) | $2,360,049 | $1,703,396 |
Net realized gain/(loss) on investments | (965,388) | (174,583) |
Change in unrealized net appreciation/depreciation | 2,010,304 | 1,162,975 |
Net Increase/(Decrease) in Net Assets Resulting from Operations | 3,404,965 | 2,691,788 |
Dividends and Distributions to Shareholders: | ||
Class A Shares | (365,026) | (258,322) |
Class C Shares | (128,655) | (125,496) |
Class D Shares | (780,757) | (530,490) |
Class I Shares | (734,973) | (623,910) |
Class N Shares | (28,045) | (19,901) |
Class R Shares | (15,103) | (10,494) |
Class S Shares | (13,493) | (7,979) |
Class T Shares | (266,008) | (197,250) |
Net Decrease from Dividends and Distributions to Shareholders | (2,332,060) | (1,773,842) |
Capital Share Transactions: | ||
Class A Shares | (802,082) | (345,144) |
Class C Shares | (1,027,048) | (3,696,669) |
Class D Shares | (296,888) | 1,287,597 |
Class I Shares | (4,039,858) | (9,334,736) |
Class N Shares | (231,751) | 148,444 |
Class R Shares | (71,516) | (51,699) |
Class S Shares | (9,347) | 135,022 |
Class T Shares | (245,891) | (1,492,987) |
Net Increase/(Decrease) from Capital Share Transactions | (6,724,381) | (13,350,172) |
Net Increase/(Decrease) in Net Assets | (5,651,476) | (12,432,226) |
Net Assets: | ||
Beginning of period | 58,055,992 | 70,488,218 |
End of period | $52,404,516 | $58,055,992 |
Financial Highlights
Class A Shares | |||||
For a share outstanding during the year ended June 30 | 2024 | 2023 | 2022 | 2021 | 2020 |
Net Asset Value, Beginning of Period | $8.69 | $8.56 | $9.02 | $9.01 | $8.93 |
Income/(Loss) from Investment Operations: | |||||
Net investment income/(loss)(1) | 0.37 | 0.23 | 0.09 | 0.10 | 0.17 |
Net realized and unrealized gain/(loss) | 0.17 | 0.14 | (0.44) | 0.02 | 0.15 |
Total from Investment Operations | 0.54 | 0.37 | (0.35) | 0.12 | 0.32 |
Less Dividends and Distributions: | |||||
Dividends (from net investment income) | (0.37) | (0.24) | (0.11) | (0.11) | (0.24) |
Total Dividends and Distributions | (0.37) | (0.24) | (0.11) | (0.11) | (0.24) |
Net Asset Value, End of Period | $8.86 | $8.69 | $8.56 | $9.02 | $9.01 |
Total Return* | 6.28% | 4.39% | (3.86)% | 1.38% | 3.64% |
Net Assets, End of Period (in thousands) | $8,471 | $9,102 | $9,312 | $15,300 | $16,158 |
Ratios to Average Net Assets**: | |||||
Ratio of Gross Expenses | 1.63% | 1.51% | 1.35% | 1.26% | 1.24% |
Ratio of Net Expenses (After Waivers and Expense Offsets) | 0.95% | 0.96% | 0.95% | 0.95% | 0.98% |
Ratio of Net Investment Income/(Loss) | 4.21% | 2.68% | 1.06% | 1.16% | 1.87% |
Portfolio Turnover Rate | 61% | 56% | 69% | 47% | 11% |
* | Total return includes adjustments in accordance with generally accepted accounting principles required at the year or period end and are not annualized for periods of less than one full year. Returns shown exclude any applicable sales charges. |
** | Annualized for periods of less than one full year. |
(1) | Per share amounts are calculated based on average shares outstanding during the year or period. |
Financial Highlights
Class C Shares | |||||
For a share outstanding during the year ended June 30 | 2024 | 2023 | 2022 | 2021 | 2020 |
Net Asset Value, Beginning of Period | $8.68 | $8.56 | $9.01 | $9.01 | $8.92 |
Income/(Loss) from Investment Operations: | |||||
Net investment income/(loss)(1) | 0.30 | 0.16 | 0.03 | 0.04 | 0.10 |
Net realized and unrealized gain/(loss) | 0.17 | 0.14 | (0.43) | 0.01 | 0.17 |
Total from Investment Operations | 0.47 | 0.30 | (0.40) | 0.05 | 0.27 |
Less Dividends and Distributions: | |||||
Dividends (from net investment income) | (0.30) | (0.18) | (0.05) | (0.05) | (0.18) |
Total Dividends and Distributions | (0.30) | (0.18) | (0.05) | (0.05) | (0.18) |
Net Asset Value, End of Period | $8.85 | $8.68 | $8.56 | $9.01 | $9.01 |
Total Return* | 5.50% | 3.55% | (4.48)% | 0.56% | 3.03% |
Net Assets, End of Period (in thousands) | $3,312 | $4,264 | $7,870 | $8,407 | $14,388 |
Ratios to Average Net Assets**: | |||||
Ratio of Gross Expenses | 2.41% | 2.19% | 2.12% | 1.96% | 1.96% |
Ratio of Net Expenses (After Waivers and Expense Offsets) | 1.69% | 1.64% | 1.70% | 1.64% | 1.68% |
Ratio of Net Investment Income/(Loss) | 3.45% | 1.89% | 0.32% | 0.48% | 1.12% |
Portfolio Turnover Rate | 61% | 56% | 69% | 47% | 11% |
* | Total return includes adjustments in accordance with generally accepted accounting principles required at the year or period end and are not annualized for periods of less than one full year. Returns shown exclude any applicable sales charges. |
** | Annualized for periods of less than one full year. |
(1) | Per share amounts are calculated based on average shares outstanding during the year or period. |
Financial Highlights
Class D Shares | |||||
For a share outstanding during the year ended June 30 | 2024 | 2023 | 2022 | 2021 | 2020 |
Net Asset Value, Beginning of Period | $8.69 | $8.57 | $9.02 | $9.01 | $8.94 |
Income/(Loss) from Investment Operations: | |||||
Net investment income/(loss)(1) | 0.39 | 0.25 | 0.11 | 0.12 | 0.16 |
Net realized and unrealized gain/(loss) | 0.16 | 0.13 | (0.43) | 0.02 | 0.17 |
Total from Investment Operations | 0.55 | 0.38 | (0.32) | 0.14 | 0.33 |
Less Dividends and Distributions: | |||||
Dividends (from net investment income) | (0.38) | (0.26) | (0.13) | (0.13) | (0.26) |
Total Dividends and Distributions | (0.38) | (0.26) | (0.13) | (0.13) | (0.26) |
Net Asset Value, End of Period | $8.86 | $8.69 | $8.57 | $9.02 | $9.01 |
Total Return* | 6.48% | 4.47% | (3.57)% | 1.57% | 3.69% |
Net Assets, End of Period (in thousands) | $17,952 | $17,901 | $16,350 | $15,929 | $19,646 |
Ratios to Average Net Assets**: | |||||
Ratio of Gross Expenses | 1.47% | 1.33% | 1.17% | 1.09% | 1.17% |
Ratio of Net Expenses (After Waivers and Expense Offsets) | 0.76% | 0.77% | 0.77% | 0.77% | 0.80% |
Ratio of Net Investment Income/(Loss) | 4.41% | 2.89% | 1.25% | 1.34% | 1.84% |
Portfolio Turnover Rate | 61% | 56% | 69% | 47% | 11% |
* | Total return includes adjustments in accordance with generally accepted accounting principles required at the year or period end and are not annualized for periods of less than one full year. |
** | Annualized for periods of less than one full year. |
(1) | Per share amounts are calculated based on average shares outstanding during the year or period. |
Financial Highlights
Class I Shares | |||||
For a share outstanding during the year ended June 30 | 2024 | 2023 | 2022 | 2021 | 2020 |
Net Asset Value, Beginning of Period | $8.68 | $8.56 | $9.00 | $9.00 | $8.92 |
Income/(Loss) from Investment Operations: | |||||
Net investment income/(loss)(1) | 0.39 | 0.25 | 0.12 | 0.13 | 0.19 |
Net realized and unrealized gain/(loss) | 0.16 | 0.13 | (0.42) | 0.01 | 0.15 |
Total from Investment Operations | 0.55 | 0.38 | (0.30) | 0.14 | 0.34 |
Less Dividends and Distributions: | |||||
Dividends (from net investment income) | (0.38) | (0.26) | (0.14) | (0.14) | (0.26) |
Total Dividends and Distributions | (0.38) | (0.26) | (0.14) | (0.14) | (0.26) |
Net Asset Value, End of Period | $8.85 | $8.68 | $8.56 | $9.00 | $9.00 |
Total Return* | 6.51% | 4.51% | (3.42)% | 1.51% | 3.88% |
Net Assets, End of Period (in thousands) | $15,208 | $18,919 | $27,937 | $33,808 | $36,831 |
Ratios to Average Net Assets**: | |||||
Ratio of Gross Expenses | 1.39% | 1.25% | 1.09% | 1.01% | 1.00% |
Ratio of Net Expenses (After Waivers and Expense Offsets) | 0.73% | 0.73% | 0.71% | 0.71% | 0.73% |
Ratio of Net Investment Income/(Loss) | 4.41% | 2.85% | 1.30% | 1.40% | 2.09% |
Portfolio Turnover Rate | 61% | 56% | 69% | 47% | 11% |
* | Total return includes adjustments in accordance with generally accepted accounting principles required at the year or period end and are not annualized for periods of less than one full year. |
** | Annualized for periods of less than one full year. |
(1) | Per share amounts are calculated based on average shares outstanding during the year or period. |
Financial Highlights
Class N Shares | |||||
For a share outstanding during the year ended June 30 | 2024 | 2023 | 2022 | 2021 | 2020 |
Net Asset Value, Beginning of Period | $8.69 | $8.56 | $9.01 | $9.01 | $8.93 |
Income/(Loss) from Investment Operations: | |||||
Net investment income/(loss)(1) | 0.40 | 0.26 | 0.12 | 0.13 | 0.19 |
Net realized and unrealized gain/(loss) | 0.15 | 0.14 | (0.43) | 0.01 | 0.16 |
Total from Investment Operations | 0.55 | 0.40 | (0.31) | 0.14 | 0.35 |
Less Dividends and Distributions: | |||||
Dividends (from net investment income) | (0.39) | (0.27) | (0.14) | (0.14) | (0.27) |
Total Dividends and Distributions | (0.39) | (0.27) | (0.14) | (0.14) | (0.27) |
Net Asset Value, End of Period | $8.85 | $8.69 | $8.56 | $9.01 | $9.01 |
Total Return* | 6.49% | 4.73% | (3.50)% | 1.58% | 3.94% |
Net Assets, End of Period (in thousands) | $544 | $761 | $604 | $1,803 | $2,534 |
Ratios to Average Net Assets**: | |||||
Ratio of Gross Expenses | 1.74% | 1.64% | 1.30% | 1.06% | 1.06% |
Ratio of Net Expenses (After Waivers and Expense Offsets) | 0.63% | 0.64% | 0.64% | 0.64% | 0.67% |
Ratio of Net Investment Income/(Loss) | 4.49% | 3.03% | 1.35% | 1.47% | 2.10% |
Portfolio Turnover Rate | 61% | 56% | 69% | 47% | 11% |
* | Total return includes adjustments in accordance with generally accepted accounting principles required at the year or period end and are not annualized for periods of less than one full year. |
** | Annualized for periods of less than one full year. |
(1) | Per share amounts are calculated based on average shares outstanding during the year or period. |
Financial Highlights
Class R Shares | |||||
For a share outstanding during the year ended June 30 | 2024 | 2023 | 2022 | 2021 | 2020 |
Net Asset Value, Beginning of Period | $8.69 | $8.57 | $9.02 | $9.02 | $8.94 |
Income/(Loss) from Investment Operations: | |||||
Net investment income/(loss)(1) | 0.33 | 0.19 | 0.06 | 0.07 | 0.13 |
Net realized and unrealized gain/(loss) | 0.17 | 0.13 | (0.43) | — (2) | 0.15 |
Total from Investment Operations | 0.50 | 0.32 | (0.37) | 0.07 | 0.28 |
Less Dividends and Distributions: | |||||
Dividends (from net investment income) | (0.33) | (0.20) | (0.08) | (0.07) | (0.20) |
Total Dividends and Distributions | (0.33) | (0.20) | (0.08) | (0.07) | (0.20) |
Net Asset Value, End of Period | $8.86 | $8.69 | $8.57 | $9.02 | $9.02 |
Total Return* | 5.83% | 3.82% | (4.15)% | 0.83% | 3.17% |
Net Assets, End of Period (in thousands) | $365 | $429 | $474 | $516 | $654 |
Ratios to Average Net Assets**: | |||||
Ratio of Gross Expenses | 2.76% | 2.58% | 2.33% | 2.20% | 2.04% |
Ratio of Net Expenses (After Waivers and Expense Offsets) | 1.37% | 1.39% | 1.37% | 1.39% | 1.42% |
Ratio of Net Investment Income/(Loss) | 3.77% | 2.24% | 0.65% | 0.73% | 1.40% |
Portfolio Turnover Rate | 61% | 56% | 69% | 47% | 11% |
* | Total return includes adjustments in accordance with generally accepted accounting principles required at the year or period end and are not annualized for periods of less than one full year. |
** | Annualized for periods of less than one full year. |
(1) | Per share amounts are calculated based on average shares outstanding during the year or period. |
(2) | Less than $0.005 on a per share basis. |
Financial Highlights
Class S Shares | |||||
For a share outstanding during the year ended June 30 | 2024 | 2023 | 2022 | 2021 | 2020 |
Net Asset Value, Beginning of Period | $8.69 | $8.57 | $9.02 | $9.02 | $8.94 |
Income/(Loss) from Investment Operations: | |||||
Net investment income/(loss)(1) | 0.35 | 0.23 | 0.08 | 0.09 | 0.15 |
Net realized and unrealized gain/(loss) | 0.17 | 0.12 | (0.43) | 0.01 | 0.15 |
Total from Investment Operations | 0.52 | 0.35 | (0.35) | 0.10 | 0.30 |
Less Dividends and Distributions: | |||||
Dividends (from net investment income) | (0.35) | (0.23) | (0.10) | (0.10) | (0.22) |
Total Dividends and Distributions | (0.35) | (0.23) | (0.10) | (0.10) | (0.22) |
Net Asset Value, End of Period | $8.86 | $8.69 | $8.57 | $9.02 | $9.02 |
Total Return* | 6.09% | 4.08% | (3.93)% | 1.08% | 3.44% |
Net Assets, End of Period (in thousands) | $316 | $318 | $178 | $230 | $153 |
Ratios to Average Net Assets**: | |||||
Ratio of Gross Expenses | 2.66% | 2.73% | 3.10% | 3.07% | 3.45% |
Ratio of Net Expenses (After Waivers and Expense Offsets) | 1.12% | 1.14% | 1.14% | 1.14% | 1.16% |
Ratio of Net Investment Income/(Loss) | 4.02% | 2.63% | 0.88% | 0.96% | 1.62% |
Portfolio Turnover Rate | 61% | 56% | 69% | 47% | 11% |
* | Total return includes adjustments in accordance with generally accepted accounting principles required at the year or period end and are not annualized for periods of less than one full year. |
** | Annualized for periods of less than one full year. |
(1) | Per share amounts are calculated based on average shares outstanding during the year or period. |
Financial Highlights
Class T Shares | |||||
For a share outstanding during the year ended June 30 | 2024 | 2023 | 2022 | 2021 | 2020 |
Net Asset Value, Beginning of Period | $8.68 | $8.56 | $9.01 | $9.01 | $8.92 |
Income/(Loss) from Investment Operations: | |||||
Net investment income/(loss)(1) | 0.38 | 0.24 | 0.10 | 0.11 | 0.17 |
Net realized and unrealized gain/(loss) | 0.16 | 0.13 | (0.43) | 0.01 | 0.17 |
Total from Investment Operations | 0.54 | 0.37 | (0.33) | 0.12 | 0.34 |
Less Dividends and Distributions: | |||||
Dividends (from net investment income) | (0.37) | (0.25) | (0.12) | (0.12) | (0.25) |
Total Dividends and Distributions | (0.37) | (0.25) | (0.12) | (0.12) | (0.25) |
Net Asset Value, End of Period | $8.85 | $8.68 | $8.56 | $9.01 | $9.01 |
Total Return* | 6.37% | 4.37% | (3.68)% | 1.36% | 3.82% |
Net Assets, End of Period (in thousands) | $6,237 | $6,361 | $7,763 | $11,109 | $15,003 |
Ratios to Average Net Assets**: | |||||
Ratio of Gross Expenses | 1.57% | 1.44% | 1.29% | 1.20% | 1.20% |
Ratio of Net Expenses (After Waivers and Expense Offsets) | 0.86% | 0.87% | 0.87% | 0.86% | 0.91% |
Ratio of Net Investment Income/(Loss) | 4.30% | 2.73% | 1.14% | 1.25% | 1.92% |
Portfolio Turnover Rate | 61% | 56% | 69% | 47% | 11% |
* | Total return includes adjustments in accordance with generally accepted accounting principles required at the year or period end and are not annualized for periods of less than one full year. |
** | Annualized for periods of less than one full year. |
(1) | Per share amounts are calculated based on average shares outstanding during the year or period. |
Notes to Financial Statements
Average Daily Net Assets of the Fund | Contractual Investment Advisory Fee (%) |
First $1 Billion | 0.65 |
Next $2 Billion | 0.62 |
Over $3 Billion | 0.60 |
Notes to Financial Statements
Average Daily Net Assets of Class D Shares of the Janus Henderson funds | Administrative Services Fee |
Under $40 billion | 0.12% |
$40 billion — $49.9 billion | 0.10% |
Over $49.9 billion | 0.08% |
Notes to Financial Statements
Undistributed Ordinary Income | Undistributed Long-Term Gains | Accumulated Capital Losses | Loss Deferrals | Other Book to Tax Differences | Net Tax Appreciation/ (Depreciation) |
$- | $- | $(179,641,297) | $(687,158) | $66,921 | $(1,028,789) |
Capital Loss Carryover Schedule | ||
For the year ended June 30, 2024 | ||
No Expiration | ||
Short-Term | Long-Term | Accumulated Capital Losses |
$(80,289,788) | $(99,351,509) | $(179,641,297) |
Notes to Financial Statements
Federal Tax Cost | Unrealized Appreciation | Unrealized (Depreciation) | Net Tax Appreciation/ (Depreciation) |
$52,666,552 | $245,487 | $(1,274,276) | $(1,028,789) |
Federal Tax Cost | Unrealized Appreciation | Unrealized (Depreciation) | Net Tax Appreciation/ (Depreciation) |
$(390,049) | $68,361 | $- | $68,361 |
For the year ended June 30, 2024 | |||
Distributions | |||
From Ordinary Income | From Long-Term Capital Gains | Tax Return of Capital | Net Investment Loss |
$2,332,060 | $- | $- | $- |
For the year ended June 30, 2023 | |||
Distributions | |||
From Ordinary Income | From Long-Term Capital Gains | Tax Return of Capital | Net Investment Loss |
$1,773,842 | $- | $- | $- |
Notes to Financial Statements
Year ended June 30, 2024 | Year ended June 30, 2023 | |||
Shares | Amount | Shares | Amount | |
Class A Shares: | ||||
Shares sold | 90,204 | $790,225 | 333,404 | $2,871,867 |
Reinvested dividends and distributions | 33,868 | 297,835 | 24,233 | 209,431 |
Shares repurchased | (215,389) | (1,890,142) | (397,097) | (3,426,442) |
Net Increase/(Decrease) | (91,317) | $(802,082) | (39,460) | $(345,144) |
Class C Shares: | ||||
Shares sold | 13,084 | $114,329 | 114,185 | $978,391 |
Reinvested dividends and distributions | 14,644 | 128,652 | 14,439 | 124,590 |
Shares repurchased | (144,740) | (1,270,029) | (557,089) | (4,799,650) |
Net Increase/(Decrease) | (117,012) | $(1,027,048) | (428,465) | $(3,696,669) |
Class D Shares: | ||||
Shares sold | 420,582 | $3,686,493 | 705,306 | $6,062,753 |
Reinvested dividends and distributions | 83,875 | 737,799 | 58,863 | 508,862 |
Shares repurchased | (538,106) | (4,721,180) | (612,385) | (5,284,018) |
Net Increase/(Decrease) | (33,649) | $(296,888) | 151,784 | $1,287,597 |
Class I Shares: | ||||
Shares sold | 209,645 | $1,834,495 | 615,493 | $5,326,273 |
Reinvested dividends and distributions | 81,603 | 717,105 | 70,884 | 611,891 |
Shares repurchased | (752,083) | (6,591,458) | (1,772,814) | (15,272,900) |
Net Increase/(Decrease) | (460,835) | $(4,039,858) | (1,086,437) | $(9,334,736) |
Class N Shares: | ||||
Shares sold | 21,275 | $187,252 | 33,562 | $290,396 |
Reinvested dividends and distributions | 3,190 | 28,036 | 2,299 | 19,866 |
Shares repurchased | (50,672) | (447,039) | (18,723) | (161,818) |
Net Increase/(Decrease) | (26,207) | $(231,751) | 17,138 | $148,444 |
Class R Shares: | ||||
Shares sold | 2,411 | $21,278 | 1,837 | $15,871 |
Reinvested dividends and distributions | 1,717 | 15,103 | 1,213 | 10,494 |
Shares repurchased | (12,252) | (107,897) | (9,054) | (78,064) |
Net Increase/(Decrease) | (8,124) | $(71,516) | (6,004) | $(51,699) |
Class S Shares: | ||||
Shares sold | 12,385 | $108,382 | 32,269 | $276,901 |
Reinvested dividends and distributions | 1,533 | 13,493 | 922 | 7,979 |
Shares repurchased | (14,931) | (131,222) | (17,333) | (149,858) |
Net Increase/(Decrease) | (1,013) | $(9,347) | 15,858 | $135,022 |
Class T Shares: | ||||
Shares sold | 77,518 | $677,484 | 56,810 | $491,678 |
Reinvested dividends and distributions | 30,015 | 263,753 | 22,672 | 195,678 |
Shares repurchased | (135,559) | (1,187,128) | (253,745) | (2,180,343) |
Net Increase/(Decrease) | (28,026) | $(245,891) | (174,263) | $(1,492,987) |
Purchases of Securities | Proceeds from Sales of Securities | Purchases of Long- Term U.S. Government Obligations | Proceeds from Sales of Long-Term U.S. Government Obligations |
$30,768,145 | $34,778,313 | $- | $- |
Notes to Financial Statements
Report of Independent Registered Public Accounting Firm
August 22, 2024
Designation Requirements (unaudited)
Section 163(j) Interest Dividend | 100% |
Additional Information (unaudited)
June 30, 2024
Schedule of Investments
June 30, 2024
Shares | Value | ||
Common Stocks – 100.1% | |||
Aerospace & Defense – 2.3% | |||
General Dynamics Corp | 13,527 | $3,924,724 | |
L3Harris Technologies Inc | 8,588 | 1,928,693 | |
Lockheed Martin Corp | 6,255 | 2,921,710 | |
Raytheon Technologies Corp | 51,153 | 5,135,250 | |
13,910,377 | |||
Automobiles – 1.9% | |||
Ferrari NV | 7,032 | 2,871,658 | |
Tesla Inc* | 44,682 | 8,841,674 | |
11,713,332 | |||
Banks – 1.7% | |||
JPMorgan Chase & Co | 50,906 | 10,296,248 | |
Beverages – 2.6% | |||
Coca-Cola Co | 184,308 | 11,731,204 | |
Constellation Brands Inc - Class A | 7,127 | 1,833,635 | |
PepsiCo Inc | 15,043 | 2,481,042 | |
16,045,881 | |||
Biotechnology – 1.3% | |||
AbbVie Inc | 12,417 | 2,129,764 | |
Amgen Inc | 11,638 | 3,636,293 | |
Regeneron Pharmaceuticals Inc* | 1,961 | 2,061,070 | |
7,827,127 | |||
Building Products – 0.9% | |||
Johnson Controls International PLC | 28,808 | 1,914,868 | |
Trane Technologies PLC | 10,329 | 3,397,518 | |
5,312,386 | |||
Capital Markets – 3.5% | |||
BlackRock Inc | 5,612 | 4,418,440 | |
Cboe Global Markets Inc | 14,017 | 2,383,731 | |
Goldman Sachs Group Inc | 10,715 | 4,846,609 | |
Intercontinental Exchange Inc | 29,237 | 4,002,253 | |
Moody's Corp | 9,411 | 3,961,372 | |
S&P Global Inc | 4,508 | 2,010,568 | |
21,622,973 | |||
Chemicals – 2.1% | |||
Ecolab Inc | 15,856 | 3,773,728 | |
Linde PLC | 15,398 | 6,756,796 | |
LyondellBasell Industries NV | 23,512 | 2,249,158 | |
12,779,682 | |||
Commercial Services & Supplies – 1.0% | |||
Cintas Corp | 6,433 | 4,504,773 | |
Republic Services Inc | 10,031 | 1,949,424 | |
6,454,197 | |||
Communications Equipment – 0.6% | |||
Motorola Solutions Inc | 10,236 | 3,951,608 | |
Diversified Financial Services – 5.5% | |||
Berkshire Hathaway Inc* | 33,640 | 13,684,752 | |
Fiserv Inc* | 18,948 | 2,824,010 | |
Mastercard Inc - Class A | 20,635 | 9,103,336 | |
Visa Inc | 30,510 | 8,007,960 | |
33,620,058 | |||
Diversified Telecommunication Services – 0.9% | |||
Verizon Communications Inc | 130,789 | 5,393,738 | |
Electric Utilities – 0.5% | |||
Edison International | 45,802 | 3,289,042 | |
Electrical Equipment – 1.1% | |||
Eaton Corp PLC | 11,014 | 3,453,440 | |
Emerson Electric Co | 29,495 | 3,249,169 | |
6,702,609 | |||
Electronic Equipment, Instruments & Components – 1.2% | |||
Amphenol Corp | 61,176 | 4,121,427 |
Schedule of Investments
June 30, 2024
Shares | Value | ||
Common Stocks – (continued) | |||
Electronic Equipment, Instruments & Components – (continued) | |||
CDW Corp/DE | 5,776 | $1,292,900 | |
TE Connectivity Ltd | 12,816 | 1,927,911 | |
7,342,238 | |||
Entertainment – 1.7% | |||
Walt Disney Co | 105,018 | 10,427,237 | |
Food & Staples Retailing – 2.4% | |||
Costco Wholesale Corp | 9,477 | 8,055,355 | |
Walmart Inc | 98,726 | 6,684,738 | |
14,740,093 | |||
Food Products – 1.2% | |||
Campbell Soup Co | 59,125 | 2,671,858 | |
Kellanova | 50,013 | 2,884,750 | |
Mondelez International Inc | 31,293 | 2,047,814 | |
7,604,422 | |||
Health Care Equipment & Supplies – 1.4% | |||
Abbott Laboratories | 18,468 | 1,919,010 | |
Becton Dickinson and Co | 8,018 | 1,873,887 | |
Boston Scientific Corp* | 26,242 | 2,020,896 | |
Stryker Corp | 8,152 | 2,773,718 | |
8,587,511 | |||
Health Care Providers & Services – 2.0% | |||
AmerisourceBergen Corp | 8,098 | 1,824,479 | |
Labcorp Holdings Inc | 5,742 | 1,168,555 | |
McKesson Corp | 3,406 | 1,989,240 | |
Quest Diagnostics Inc | 21,572 | 2,952,775 | |
UnitedHealth Group Inc | 8,718 | 4,439,729 | |
12,374,778 | |||
Hotels, Restaurants & Leisure – 5.1% | |||
Booking Holdings Inc | 897 | 3,553,465 | |
Chipotle Mexican Grill Inc* | 51,650 | 3,235,873 | |
Domino's Pizza Inc | 6,115 | 3,157,358 | |
Hilton Worldwide Holdings Inc | 13,301 | 2,902,278 | |
McDonald's Corp | 42,042 | 10,713,983 | |
Starbucks Corp | 18,582 | 1,446,609 | |
Texas Roadhouse Inc | 17,475 | 3,000,632 | |
Yum! Brands Inc | 24,521 | 3,248,052 | |
31,258,250 | |||
Household Durables – 0.4% | |||
Toll Brothers Inc | 22,632 | 2,606,754 | |
Household Products – 1.9% | |||
Church & Dwight Co Inc | 22,051 | 2,286,248 | |
Colgate-Palmolive Co | 42,694 | 4,143,026 | |
Procter & Gamble Co | 30,272 | 4,992,458 | |
11,421,732 | |||
Industrial Conglomerates – 0.8% | |||
Honeywell International Inc | 22,658 | 4,838,389 | |
Industrial Real Estate Investment Trusts (REITs) – 0.3% | |||
Prologis Inc | 18,349 | 2,060,776 | |
Information Technology Services – 1.0% | |||
GoDaddy Inc* | 14,042 | 1,961,808 | |
International Business Machines Corp | 16,492 | 2,852,291 | |
VeriSign Inc* | 7,895 | 1,403,731 | |
6,217,830 | |||
Insurance – 2.5% | |||
Allstate Corp | 655 | 104,577 | |
Aon PLC - Class A | 2,389 | 701,363 | |
Arthur J Gallagher & Co | 19,845 | 5,146,007 | |
Chubb Ltd | 16,816 | 4,289,425 |
Schedule of Investments
June 30, 2024
Shares | Value | ||
Common Stocks – (continued) | |||
Insurance – (continued) | |||
Hartford Financial Services Group Inc | 18,247 | $1,834,553 | |
Prudential Financial Inc | 25,987 | 3,045,417 | |
15,121,342 | |||
Interactive Media & Services – 6.2% | |||
Alphabet Inc - Class A | 152,198 | 27,722,865 | |
Meta Platforms Inc - Class A | 19,913 | 10,040,533 | |
37,763,398 | |||
Machinery – 2.1% | |||
Cummins Inc | 10,931 | 3,027,122 | |
Otis Worldwide Corp | 11,986 | 1,153,772 | |
Parker-Hannifin Corp | 5,272 | 2,666,630 | |
Wabtec Corp | 20,194 | 3,191,662 | |
Xylem Inc/NY | 22,699 | 3,078,666 | |
13,117,852 | |||
Multiline Retail – 2.5% | |||
Amazon.com Inc* | 78,793 | 15,226,747 | |
Multi-Utilities – 0.3% | |||
Public Service Enterprise Group Inc | 22,979 | 1,693,552 | |
Oil, Gas & Consumable Fuels – 1.0% | |||
Chevron Corp | 21,240 | 3,322,361 | |
ONEOK Inc | 31,680 | 2,583,504 | |
5,905,865 | |||
Pharmaceuticals – 5.3% | |||
Eli Lilly & Co | 19,964 | 18,075,006 | |
Johnson & Johnson | 85,753 | 12,533,659 | |
Merck & Co Inc | 16,099 | 1,993,056 | |
32,601,721 | |||
Professional Services – 1.2% | |||
Jacobs Solutions Inc | 13,290 | 1,856,746 | |
Paychex Inc | 15,261 | 1,809,344 | |
Verisk Analytics Inc | 14,210 | 3,830,306 | |
7,496,396 | |||
Real Estate Management & Development – 0.3% | |||
CBRE Group Inc* | 21,696 | 1,933,331 | |
Residential Real Estate Investment Trusts (REITs) – 0.3% | |||
AvalonBay Communities Inc | 491 | 101,583 | |
Mid-America Apartment Communities Inc | 13,912 | 1,983,990 | |
2,085,573 | |||
Retail Real Estate Investment Trusts (REITs) – 0.5% | |||
Simon Property Group Inc | 19,959 | 3,029,776 | |
Road & Rail – 0.5% | |||
Ryder System Inc | 24,753 | 3,066,402 | |
Semiconductor & Semiconductor Equipment – 6.9% | |||
Broadcom Inc | 7,635 | 12,258,221 | |
NVIDIA Corp | 211,128 | 26,082,753 | |
Qualcomm Inc | 19,848 | 3,953,325 | |
42,294,299 | |||
Software – 13.6% | |||
Check Point Software Technologies Ltd* | 11,682 | 1,927,530 | |
Intuit Inc | 17,010 | 11,179,142 | |
Microsoft Corp | 99,537 | 44,488,062 | |
Oracle Corp | 41,262 | 5,826,195 | |
Palo Alto Networks Inc* | 10,914 | 3,699,955 | |
Salesforce.com Inc | 45,853 | 11,788,806 | |
Synopsys Inc* | 7,081 | 4,213,620 | |
83,123,310 | |||
Specialized Real Estate Investment Trusts (REITs) – 1.0% | |||
American Tower Corp | 10,525 | 2,045,849 |
Schedule of Investments
June 30, 2024
Shares | Value | ||
Common Stocks – (continued) | |||
Specialized Real Estate Investment Trusts (REITs) – (continued) | |||
Iron Mountain Inc | 23,819 | $2,134,659 | |
Public Storage | 6,992 | 2,011,249 | |
6,191,757 | |||
Specialty Retail – 1.2% | |||
AutoZone Inc* | 852 | 2,525,413 | |
TJX Cos Inc | 42,770 | 4,708,977 | |
7,234,390 | |||
Technology Hardware, Storage & Peripherals – 8.2% | |||
Apple Inc | 222,691 | 46,903,179 | |
NetApp Inc | 26,993 | 3,476,698 | |
50,379,877 | |||
Trading Companies & Distributors – 0.5% | |||
AerCap Holdings NV | 32,818 | 3,058,638 | |
Wireless Telecommunication Services – 0.7% | |||
T-Mobile US Inc | 24,029 | 4,233,429 | |
Total Common Stocks (cost $497,492,263) | 613,956,923 | ||
Investment Companies – 0.1% | |||
Money Markets – 0.1% | |||
Janus Henderson Cash Liquidity Fund LLC, 5.3419%ºº,£ (cost $344,765) | 344,696 | 344,765 | |
Total Investments (total cost $497,837,028) – 100.2% | 614,301,688 | ||
Liabilities, net of Cash, Receivables and Other Assets – (0.2)% | (982,735) | ||
Net Assets – 100% | $613,318,953 |
Summary of Investments by Country - (Long Positions) (unaudited) | ||
Country | Value | % of Investment Securities |
United States | $606,443,862 | 98.7 % |
Netherlands | 3,058,638 | 0.5 |
Italy | 2,871,658 | 0.5 |
Israel | 1,927,530 | 0.3 |
Total | $614,301,688 | 100.0 % |
Schedule of Affiliated Investments - (% of Net Assets) | ||||||||
Affiliate | Affiliated Investments, at Value at 6/30/23 | Purchases | Sales Proceeds | Realized Gain/(Loss) | Change in Unrealized Appreciation/ Depreciation | Affiliated Investments, at Value at 6/30/24 | Ending Shares | Dividend Income |
Investment Companies - 0.1% | ||||||||
Money Markets - 0.1% | ||||||||
Janus Henderson Cash Liquidity Fund LLC, 5.3419%ºº | ||||||||
$- | $37,433,771 | $(37,088,905) | $(101) | $- | $344,765 | 344,696 | $26,824 | |
Investments Purchased with Cash Collateral from Securities Lending - N/A | ||||||||
Investment Companies - N/A | ||||||||
Janus Henderson Cash Collateral Fund LLC, 5.2795%ºº | ||||||||
3,762,210 | 106,732,747 | (110,494,957) | - | - | - | - | 6,218 ∆ | |
Total Affiliated Investments - 0.1% | ||||||||
$3,762,210 | $144,166,518 | $(147,583,862) | $(101) | $- | $344,765 | 344,696 | $33,042 |
Notes to Schedule of Investments and Other Information
LLC | Limited Liability Company |
PLC | Public Limited Company |
* | Non-income producing security. |
ºº | Rate shown is the 7-day yield as of June 30, 2024. |
£ | The Fund may invest in certain securities that are considered affiliated companies. As defined by the Investment Company Act of 1940, as amended, an affiliated company is one in which the Fund owns 5% or more of the outstanding voting securities, or a company which is under common ownership or control. |
∆ | Net of income paid to the securities lending agent and rebates paid to the borrowing counterparties. |
Valuation Inputs Summary | |||
Level 1 - Quoted Prices | Level 2 - Other Significant Observable Inputs | Level 3 - Significant Unobservable Inputs | |
Assets | |||
Investments In Securities: | |||
Common Stocks | $613,956,923 | $- | $- |
Investment Companies | - | 344,765 | - |
Total Assets | $613,956,923 | $344,765 | $- |
Statement of Assets and Liabilities
June 30, 2024
Assets: | |
Unaffiliated investments, at value (cost $497,492,263) | $613,956,923 |
Affiliated investments, at value (cost $344,765) | 344,765 |
Cash | 1,869 |
Trustees' deferred compensation | 16,908 |
Receivables: | |
Dividends | 178,292 |
Fund shares sold | 46,724 |
Foreign tax reclaims | 25,511 |
Dividends from affiliates | 3,846 |
Other assets | 2,274 |
Total Assets | 614,577,112 |
Liabilities: | |
Payables: | |
Fund shares repurchased | 774,494 |
Advisory fees | 247,537 |
Transfer agent fees and expenses | 79,583 |
Professional fees | 53,105 |
Trustees' deferred compensation fees | 16,908 |
12b-1 Distribution and shareholder servicing fees | 16,064 |
Trustees' fees and expenses | 3,333 |
Affiliated fund administration fees payable | 1,275 |
Custodian fees | 1,002 |
Accrued expenses and other payables | 64,858 |
Total Liabilities | 1,258,159 |
Commitments and contingent liabilities (Note 3) | |
Net Assets | $613,318,953 |
Statement of Assets and Liabilities
June 30, 2024
Net Assets Consist of: | |
Capital (par value and paid-in surplus) | $478,105,630 |
Total distributable earnings (loss) | 135,213,323 |
Total Net Assets | $613,318,953 |
Net Assets - Class A Shares | $22,473,947 |
Shares Outstanding, $0.01 Par Value (unlimited shares authorized) | 2,004,714 |
Net Asset Value Per Share(1) | $11.21 |
Maximum Offering Price Per Share(2) | $11.89 |
Net Assets - Class C Shares | $7,884,476 |
Shares Outstanding, $0.01 Par Value (unlimited shares authorized) | 743,607 |
Net Asset Value Per Share(1) | $10.60 |
Net Assets - Class D Shares | $342,984,832 |
Shares Outstanding, $0.01 Par Value (unlimited shares authorized) | 31,297,044 |
Net Asset Value Per Share | $10.96 |
Net Assets - Class I Shares | $73,171,768 |
Shares Outstanding, $0.01 Par Value (unlimited shares authorized) | 6,520,075 |
Net Asset Value Per Share | $11.22 |
Net Assets - Class N Shares | $33,010,664 |
Shares Outstanding, $0.01 Par Value (unlimited shares authorized) | 2,963,120 |
Net Asset Value Per Share | $11.14 |
Net Assets - Class S Shares | $23,899,284 |
Shares Outstanding, $0.01 Par Value (unlimited shares authorized) | 2,141,105 |
Net Asset Value Per Share | $11.16 |
Net Assets - Class T Shares | $109,893,982 |
Shares Outstanding, $0.01 Par Value (unlimited shares authorized) | 10,027,666 |
Net Asset Value Per Share | $10.96 |
(1) | Redemption price per share may be reduced for any applicable contingent deferred sales charge. |
(2) | Maximum offering price is computed at 100/94.25 of net asset value. |
Statement of Operations
For the year ended June 30, 2024
Investment Income: | |
Dividends | $9,664,367 |
Dividends from affiliates | 26,824 |
Affiliated securities lending income, net | 6,218 |
Unaffiliated securities lending income, net | 2,113 |
Other income | 1,944 |
Foreign tax withheld | (75,479) |
Total Investment Income | 9,625,987 |
Expenses: | |
Advisory fees | 3,002,179 |
12b-1 Distribution and shareholder servicing fees: | |
Class A Shares | 49,221 |
Class C Shares | 93,762 |
Class S Shares | 55,890 |
Transfer agent administrative fees and expenses: | |
Class D Shares | 363,710 |
Class S Shares | 55,885 |
Class T Shares | 277,082 |
Transfer agent networking and omnibus fees: | |
Class A Shares | 13,788 |
Class C Shares | 6,920 |
Class I Shares | 61,794 |
Other transfer agent fees and expenses: | |
Class A Shares | 1,059 |
Class C Shares | 428 |
Class D Shares | 46,219 |
Class I Shares | 3,493 |
Class N Shares | 1,683 |
Class S Shares | 307 |
Class T Shares | 1,445 |
Registration fees | 114,011 |
Shareholder reports expense | 63,404 |
Professional fees | 62,739 |
Custodian fees | 25,927 |
Affiliated fund administration fees | 15,011 |
Trustees' fees and expenses | 12,883 |
Other expenses | 114,941 |
Total Expenses | 4,443,781 |
Less: Excess Expense Reimbursement and Waivers | (292,919) |
Net Expenses | 4,150,862 |
Net Investment Income/(Loss) | 5,475,125 |
Net Realized Gain/(Loss) on Investments: | |
Investments and foreign currency transactions | 20,305,548 |
Investments in affiliates | (101) |
Total Net Realized Gain/(Loss) on Investments | 20,305,447 |
Change in Unrealized Net Appreciation/Depreciation: | |
Investments, foreign currency translations and Trustees' deferred compensation | 72,270,316 |
Total Change in Unrealized Net Appreciation/Depreciation | 72,270,316 |
Net Increase/(Decrease) in Net Assets Resulting from Operations | $98,050,888 |
Statements of Changes in Net Assets
Year ended June 30, 2024 | Year ended June 30, 2023 | |
Operations: | ||
Net investment income/(loss) | $5,475,125 | $12,937,418 |
Net realized gain/(loss) on investments | 20,305,447 | 31,700,403 |
Change in unrealized net appreciation/depreciation | 72,270,316 | 38,711,499 |
Net Increase/(Decrease) in Net Assets Resulting from Operations | 98,050,888 | 83,349,320 |
Dividends and Distributions to Shareholders: | ||
Class A Shares | (670,683) | (425,208) |
Class C Shares | (341,406) | (245,765) |
Class D Shares | (11,808,938) | (8,210,926) |
Class I Shares | (2,807,900) | (2,284,312) |
Class N Shares | (1,646,357) | (1,173,586) |
Class S Shares | (774,163) | (481,720) |
Class T Shares | (4,148,003) | (3,044,047) |
Net Decrease from Dividends and Distributions to Shareholders | (22,197,450) | (15,865,564) |
Capital Share Transactions: | ||
Class A Shares | 322,967 | (3,566,889) |
Class C Shares | (5,422,587) | (4,111,376) |
Class D Shares | (23,413,953) | (16,111,668) |
Class I Shares | (21,337,807) | (38,714,488) |
Class N Shares | (16,170,510) | (3,154,543) |
Class S Shares | (1,653,791) | (2,755,856) |
Class T Shares | (22,517,085) | (23,273,508) |
Net Increase/(Decrease) from Capital Share Transactions | (90,192,766) | (91,688,328) |
Net Increase/(Decrease) in Net Assets | (14,339,328) | (24,204,572) |
Net Assets: | ||
Beginning of period | 627,658,281 | 651,862,853 |
End of period | $613,318,953 | $627,658,281 |
Financial Highlights
Class A Shares | |||||
For a share outstanding during the year ended June 30 | 2024 | 2023 | 2022 | 2021 | 2020 |
Net Asset Value, Beginning of Period | $9.90 | $8.88 | $12.76 | $11.38 | $11.37 |
Income/(Loss) from Investment Operations: | |||||
Net investment income/(loss)(1) | 0.07 | 0.17 | 0.05 | 0.05 | 0.12 |
Net realized and unrealized gain/(loss) | 1.60 | 1.06 | (0.77) | 2.82 | 0.24 |
Total from Investment Operations | 1.67 | 1.23 | (0.72) | 2.87 | 0.36 |
Less Dividends and Distributions: | |||||
Dividends (from net investment income) | (0.04) | (0.15) | (0.03) | (0.13) | (0.06) |
Distributions (from capital gains) | (0.32) | (0.06) | (3.13) | (1.36) | (0.29) |
Total Dividends and Distributions | (0.36) | (0.21) | (3.16) | (1.49) | (0.35) |
Net Asset Value, End of Period | $11.21 | $9.90 | $8.88 | $12.76 | $11.38 |
Total Return* | 17.44% | 14.18% | (9.55)% | 26.48% | 3.14% |
Net Assets, End of Period (in thousands) | $22,474 | $19,507 | $21,015 | $26,218 | $27,092 |
Ratios to Average Net Assets**: | |||||
Ratio of Gross Expenses | 0.89% | 0.93% | 0.92% | 0.94% | 0.94% |
Ratio of Net Expenses (After Waivers and Expense Offsets) | 0.85% | 0.88% | 0.92% | 0.94% | 0.94% |
Ratio of Net Investment Income/(Loss) | 0.73% | 1.88% | 0.44% | 0.43% | 1.08% |
Portfolio Turnover Rate | 250% | 313% | 152% | 190% | 102% |
* | Total return includes adjustments in accordance with generally accepted accounting principles required at the year or period end and are not annualized for periods of less than one full year. Returns shown exclude any applicable sales charges. |
** | Annualized for periods of less than one full year. |
(1) | Per share amounts are calculated based on average shares outstanding during the year or period. |
Financial Highlights
Class C Shares | |||||
For a share outstanding during the year ended June 30 | 2024 | 2023 | 2022 | 2021 | 2020 |
Net Asset Value, Beginning of Period | $9.41 | $8.45 | $12.32 | $11.02 | $11.04 |
Income/(Loss) from Investment Operations: | |||||
Net investment income/(loss)(1) | 0.01 | 0.12 | (0.01) | (0.02) | 0.05 |
Net realized and unrealized gain/(loss) | 1.50 | 1.00 | (0.73) | 2.72 | 0.22 |
Total from Investment Operations | 1.51 | 1.12 | (0.74) | 2.70 | 0.27 |
Less Dividends and Distributions: | |||||
Dividends (from net investment income) | — | (0.10) | — | (0.04) | — |
Distributions (from capital gains) | (0.32) | (0.06) | (3.13) | (1.36) | (0.29) |
Total Dividends and Distributions | (0.32) | (0.16) | (3.13) | (1.40) | (0.29) |
Net Asset Value, End of Period | $10.60 | $9.41 | $8.45 | $12.32 | $11.02 |
Total Return* | 16.55% | 13.47% | (10.05)% | 25.71% | 2.41% |
Net Assets, End of Period (in thousands) | $7,884 | $12,312 | $14,997 | $21,286 | $24,089 |
Ratios to Average Net Assets**: | |||||
Ratio of Gross Expenses | 1.62% | 1.51% | 1.48% | 1.58% | 1.58% |
Ratio of Net Expenses (After Waivers and Expense Offsets) | 1.57% | 1.46% | 1.48% | 1.58% | 1.58% |
Ratio of Net Investment Income/(Loss) | 0.07% | 1.33% | (0.12)% | (0.21)% | 0.44% |
Portfolio Turnover Rate | 250% | 313% | 152% | 190% | 102% |
* | Total return includes adjustments in accordance with generally accepted accounting principles required at the year or period end and are not annualized for periods of less than one full year. Returns shown exclude any applicable sales charges. |
** | Annualized for periods of less than one full year. |
(1) | Per share amounts are calculated based on average shares outstanding during the year or period. |
Financial Highlights
Class D Shares | |||||
For a share outstanding during the year ended June 30 | 2024 | 2023 | 2022 | 2021 | 2020 |
Net Asset Value, Beginning of Period | $9.67 | $8.69 | $12.56 | $11.23 | $11.22 |
Income/(Loss) from Investment Operations: | |||||
Net investment income/(loss)(1) | 0.09 | 0.19 | 0.08 | 0.08 | 0.15 |
Net realized and unrealized gain/(loss) | 1.57 | 1.03 | (0.76) | 2.77 | 0.24 |
Total from Investment Operations | 1.66 | 1.22 | (0.68) | 2.85 | 0.39 |
Less Dividends and Distributions: | |||||
Dividends (from net investment income) | (0.05) | (0.18) | (0.06) | (0.16) | (0.09) |
Distributions (from capital gains) | (0.32) | (0.06) | (3.13) | (1.36) | (0.29) |
Total Dividends and Distributions | (0.37) | (0.24) | (3.19) | (1.52) | (0.38) |
Net Asset Value, End of Period | $10.96 | $9.67 | $8.69 | $12.56 | $11.23 |
Total Return* | 17.78% | 14.36% | (9.35)% | 26.71% | 3.41% |
Net Assets, End of Period (in thousands) | $342,985 | $325,264 | $307,311 | $361,567 | $315,423 |
Ratios to Average Net Assets**: | |||||
Ratio of Gross Expenses | 0.70% | 0.72% | 0.68% | 0.68% | 0.69% |
Ratio of Net Expenses (After Waivers and Expense Offsets) | 0.65% | 0.67% | 0.68% | 0.68% | 0.69% |
Ratio of Net Investment Income/(Loss) | 0.94% | 2.09% | 0.69% | 0.66% | 1.33% |
Portfolio Turnover Rate | 250% | 313% | 152% | 190% | 102% |
* | Total return includes adjustments in accordance with generally accepted accounting principles required at the year or period end and are not annualized for periods of less than one full year. |
** | Annualized for periods of less than one full year. |
(1) | Per share amounts are calculated based on average shares outstanding during the year or period. |
Financial Highlights
Class I Shares | |||||
For a share outstanding during the year ended June 30 | 2024 | 2023 | 2022 | 2021 | 2020 |
Net Asset Value, Beginning of Period | $9.90 | $8.87 | $12.75 | $11.37 | $11.36 |
Income/(Loss) from Investment Operations: | |||||
Net investment income/(loss)(1) | 0.10 | 0.20 | 0.08 | 0.08 | 0.15 |
Net realized and unrealized gain/(loss) | 1.60 | 1.06 | (0.77) | 2.81 | 0.24 |
Total from Investment Operations | 1.70 | 1.26 | (0.69) | 2.89 | 0.39 |
Less Dividends and Distributions: | |||||
Dividends (from net investment income) | (0.06) | (0.17) | (0.06) | (0.15) | (0.09) |
Distributions (from capital gains) | (0.32) | (0.06) | (3.13) | (1.36) | (0.29) |
Total Dividends and Distributions | (0.38) | (0.23) | (3.19) | (1.51) | (0.38) |
Net Asset Value, End of Period | $11.22 | $9.90 | $8.87 | $12.75 | $11.37 |
Total Return* | 17.71% | 14.48% | (9.31)% | 26.75% | 3.37% |
Net Assets, End of Period (in thousands) | $73,172 | $85,473 | $114,646 | $468,596 | $428,888 |
Ratios to Average Net Assets**: | |||||
Ratio of Gross Expenses | 0.64% | 0.66% | 0.72% | 0.73% | 0.69% |
Ratio of Net Expenses (After Waivers and Expense Offsets) | 0.60% | 0.62% | 0.68% | 0.69% | 0.69% |
Ratio of Net Investment Income/(Loss) | 1.01% | 2.19% | 0.66% | 0.66% | 1.33% |
Portfolio Turnover Rate | 250% | 313% | 152% | 190% | 102% |
* | Total return includes adjustments in accordance with generally accepted accounting principles required at the year or period end and are not annualized for periods of less than one full year. |
** | Annualized for periods of less than one full year. |
(1) | Per share amounts are calculated based on average shares outstanding during the year or period. |
Financial Highlights
Class N Shares | |||||
For a share outstanding during the year ended June 30 | 2024 | 2023 | 2022 | 2021 | 2020 |
Net Asset Value, Beginning of Period | $9.82 | $8.82 | $12.70 | $11.34 | $11.33 |
Income/(Loss) from Investment Operations: | |||||
Net investment income/(loss)(1) | 0.11 | 0.21 | 0.09 | 0.10 | 0.17 |
Net realized and unrealized gain/(loss) | 1.59 | 1.04 | (0.76) | 2.79 | 0.23 |
Total from Investment Operations | 1.70 | 1.25 | (0.67) | 2.89 | 0.40 |
Less Dividends and Distributions: | |||||
Dividends (from net investment income) | (0.06) | (0.19) | (0.08) | (0.17) | (0.10) |
Distributions (from capital gains) | (0.32) | (0.06) | (3.13) | (1.36) | (0.29) |
Total Dividends and Distributions | (0.38) | (0.25) | (3.21) | (1.53) | (0.39) |
Net Asset Value, End of Period | $11.14 | $9.82 | $8.82 | $12.70 | $11.34 |
Total Return* | 17.90% | 14.54% | (9.21)% | 26.89% | 3.53% |
Net Assets, End of Period (in thousands) | $33,011 | $43,369 | $41,864 | $54,635 | $46,912 |
Ratios to Average Net Assets**: | |||||
Ratio of Gross Expenses | 0.56% | 0.58% | 0.55% | 0.55% | 0.55% |
Ratio of Net Expenses (After Waivers and Expense Offsets) | 0.52% | 0.53% | 0.55% | 0.55% | 0.55% |
Ratio of Net Investment Income/(Loss) | 1.07% | 2.24% | 0.82% | 0.78% | 1.47% |
Portfolio Turnover Rate | 250% | 313% | 152% | 190% | 102% |
* | Total return includes adjustments in accordance with generally accepted accounting principles required at the year or period end and are not annualized for periods of less than one full year. |
** | Annualized for periods of less than one full year. |
(1) | Per share amounts are calculated based on average shares outstanding during the year or period. |
Financial Highlights
Class S Shares | |||||
For a share outstanding during the year ended June 30 | 2024 | 2023 | 2022 | 2021 | 2020 |
Net Asset Value, Beginning of Period | $9.86 | $8.85 | $12.73 | $11.36 | $11.35 |
Income/(Loss) from Investment Operations: | |||||
Net investment income/(loss)(1) | 0.06 | 0.16 | 0.04 | 0.04 | 0.11 |
Net realized and unrealized gain/(loss) | 1.60 | 1.05 | (0.78) | 2.80 | 0.24 |
Total from Investment Operations | 1.66 | 1.21 | (0.74) | 2.84 | 0.35 |
Less Dividends and Distributions: | |||||
Dividends (from net investment income) | (0.04) | (0.14) | (0.01) | (0.11) | (0.05) |
Distributions (from capital gains) | (0.32) | (0.06) | (3.13) | (1.36) | (0.29) |
Total Dividends and Distributions | (0.36) | (0.20) | (3.14) | (1.47) | (0.34) |
Net Asset Value, End of Period | $11.16 | $9.86 | $8.85 | $12.73 | $11.36 |
Total Return* | 17.32% | 13.96% | (9.69)% | 26.29% | 3.02% |
Net Assets, End of Period (in thousands) | $23,899 | $22,700 | $22,961 | $28,736 | $26,404 |
Ratios to Average Net Assets**: | |||||
Ratio of Gross Expenses | 1.07% | 1.09% | 1.05% | 1.05% | 1.05% |
Ratio of Net Expenses (After Waivers and Expense Offsets) | 1.01% | 1.03% | 1.04% | 1.04% | 1.05% |
Ratio of Net Investment Income/(Loss) | 0.57% | 1.72% | 0.32% | 0.30% | 0.97% |
Portfolio Turnover Rate | 250% | 313% | 152% | 190% | 102% |
* | Total return includes adjustments in accordance with generally accepted accounting principles required at the year or period end and are not annualized for periods of less than one full year. |
** | Annualized for periods of less than one full year. |
(1) | Per share amounts are calculated based on average shares outstanding during the year or period. |
Financial Highlights
Class T Shares | |||||
For a share outstanding during the year ended June 30 | 2024 | 2023 | 2022 | 2021 | 2020 |
Net Asset Value, Beginning of Period | $9.68 | $8.69 | $12.56 | $11.22 | $11.21 |
Income/(Loss) from Investment Operations: | |||||
Net investment income/(loss)(1) | 0.08 | 0.18 | 0.06 | 0.07 | 0.14 |
Net realized and unrealized gain/(loss) | 1.57 | 1.04 | (0.75) | 2.77 | 0.24 |
Total from Investment Operations | 1.65 | 1.22 | (0.69) | 2.84 | 0.38 |
Less Dividends and Distributions: | |||||
Dividends (from net investment income) | (0.05) | (0.17) | (0.05) | (0.14) | (0.08) |
Distributions (from capital gains) | (0.32) | (0.06) | (3.13) | (1.36) | (0.29) |
Total Dividends and Distributions | (0.37) | (0.23) | (3.18) | (1.50) | (0.37) |
Net Asset Value, End of Period | $10.96 | $9.68 | $8.69 | $12.56 | $11.22 |
Total Return* | 17.60% | 14.32% | (9.49)% | 26.70% | 3.32% |
Net Assets, End of Period (in thousands) | $109,894 | $119,032 | $129,070 | $186,208 | $207,700 |
Ratios to Average Net Assets**: | |||||
Ratio of Gross Expenses | 0.81% | 0.82% | 0.79% | 0.79% | 0.79% |
Ratio of Net Expenses (After Waivers and Expense Offsets) | 0.75% | 0.77% | 0.78% | 0.78% | 0.79% |
Ratio of Net Investment Income/(Loss) | 0.85% | 2.01% | 0.57% | 0.58% | 1.23% |
Portfolio Turnover Rate | 250% | 313% | 152% | 190% | 102% |
* | Total return includes adjustments in accordance with generally accepted accounting principles required at the year or period end and are not annualized for periods of less than one full year. |
** | Annualized for periods of less than one full year. |
(1) | Per share amounts are calculated based on average shares outstanding during the year or period. |
Notes to Financial Statements
Average Daily Net Assets of Class D Shares of the Janus Henderson funds | Administrative Services Fee |
Under $40 billion | 0.12% |
$40 billion — $49.9 billion | 0.10% |
Over $49.9 billion | 0.08% |
Notes to Financial Statements
Class | % of Class Owned | % of Fund Owned |
Class A Shares | - % | - % |
Class C Shares | - | - |
Class D Shares | - | - |
Class I Shares | - | - |
Class N Shares | 71 | 4 |
Class S Shares | - | - |
Class T Shares | - | - |
Undistributed Ordinary Income | Undistributed Long-Term Gains | Accumulated Capital Losses | Loss Deferrals | Other Book to Tax Differences | Net Tax Appreciation/ (Depreciation) |
$12,169,861 | $7,332,752 | $- | $- | $(16,417) | $115,727,127 |
Notes to Financial Statements
Federal Tax Cost | Unrealized Appreciation | Unrealized (Depreciation) | Net Tax Appreciation/ (Depreciation) |
$498,574,561 | $117,019,149 | $(1,292,022) | $115,727,127 |
For the year ended June 30, 2024 | |||
Distributions | |||
From Ordinary Income | From Long-Term Capital Gains | Tax Return of Capital | Net Investment Loss |
$3,197,243 | $19,000,207 | $- | $- |
For the year ended June 30, 2023 | |||
Distributions | |||
From Ordinary Income | From Long-Term Capital Gains | Tax Return of Capital | Net Investment Loss |
$11,723,797 | $4,141,767 | $- | $- |
Notes to Financial Statements
Year ended June 30, 2024 | Year ended June 30, 2023 | |||
Shares | Amount | Shares | Amount | |
Class A Shares: | ||||
Shares sold | 514,818 | $5,145,183 | 265,528 | $2,451,013 |
Reinvested dividends and distributions | 51,737 | 501,334 | 33,776 | 300,944 |
Shares repurchased | (532,786) | (5,323,550) | (695,367) | (6,318,846) |
Net Increase/(Decrease) | 33,769 | $322,967 | (396,063) | $(3,566,889) |
Class C Shares: | ||||
Shares sold | 25,976 | $254,149 | 60,126 | $538,189 |
Reinvested dividends and distributions | 36,232 | 333,337 | 27,908 | 237,218 |
Shares repurchased | (627,500) | (6,010,073) | (554,950) | (4,886,783) |
Net Increase/(Decrease) | (565,292) | $(5,422,587) | (466,916) | $(4,111,376) |
Class D Shares: | ||||
Shares sold | 830,980 | $8,306,209 | 824,885 | $7,459,993 |
Reinvested dividends and distributions | 1,226,149 | 11,599,372 | 927,842 | 8,072,230 |
Shares repurchased | (4,379,956) | (43,319,534) | (3,494,548) | (31,643,891) |
Net Increase/(Decrease) | (2,322,827) | $(23,413,953) | (1,741,821) | $(16,111,668) |
Class I Shares: | ||||
Shares sold | 409,579 | $4,074,308 | 467,337 | $4,304,801 |
Reinvested dividends and distributions | 216,804 | 2,098,667 | 199,608 | 1,776,511 |
Shares repurchased | (2,742,691) | (27,510,782) | (4,958,114) | (44,795,800) |
Net Increase/(Decrease) | (2,116,308) | $(21,337,807) | (4,291,169) | $(38,714,488) |
Class N Shares: | ||||
Shares sold | 478,474 | $4,796,700 | 256,915 | $2,347,154 |
Reinvested dividends and distributions | 168,464 | 1,618,940 | 132,810 | 1,172,709 |
Shares repurchased | (2,098,695) | (22,586,150) | (720,991) | (6,674,406) |
Net Increase/(Decrease) | (1,451,757) | $(16,170,510) | (331,266) | $(3,154,543) |
Class S Shares: | ||||
Shares sold | 90,358 | $904,363 | 82,009 | $759,953 |
Reinvested dividends and distributions | 80,120 | 773,161 | 54,123 | 481,151 |
Shares repurchased | (330,550) | (3,331,315) | (429,005) | (3,996,960) |
Net Increase/(Decrease) | (160,072) | $(1,653,791) | (292,873) | $(2,755,856) |
Class T Shares: | ||||
Shares sold | 824,230 | $8,133,064 | 658,330 | $5,960,211 |
Reinvested dividends and distributions | 424,938 | 4,019,914 | 340,436 | 2,965,201 |
Shares repurchased | (3,518,457) | (34,670,063) | (3,551,793) | (32,198,920) |
Net Increase/(Decrease) | (2,269,289) | $(22,517,085) | (2,553,027) | $(23,273,508) |
Purchases of Securities | Proceeds from Sales of Securities | Purchases of Long- Term U.S. Government Obligations | Proceeds from Sales of Long-Term U.S. Government Obligations |
$1,508,123,039 | $1,613,097,469 | $- | $- |
Report of Independent Registered Public Accounting Firm
August 22, 2024
Designation Requirements (unaudited)
Capital Gain Distributions | $19,671,668 |
Dividends Received Deduction Percentage | 76% |
Qualified Dividend Income Percentage | 64% |
Additional Information (unaudited)
June 30, 2024
Schedule of Investments
June 30, 2024
Shares or Principal Amounts | Value | ||
Asset-Backed/Commercial Mortgage-Backed Securities – 0.6% | |||
Tesco Property Finance 3 PLC, 5.7440%, 4/13/40 (cost $7,823,159) | 4,704,591 | GBP | $5,921,200 |
Corporate Bonds – 54.9% | |||
Banking – 10.6% | |||
Cooperatieve Rabobank UA, 3.7500%, 7/21/26 | $4,022,000 | 3,871,596 | |
Cooperatieve Rabobank UA, EURIBOR 3 Month + 0.5200%, 0.3750%, 12/1/27‡ | 3,900,000 | EUR | 3,861,408 |
Cooperatieve Rabobank UA/Australia, 4.2500%, 5/12/26 | 2,000,000 | AUD | 1,314,096 |
Deutsche Bank AG, EURIBOR 3 Month + 1.5000%, 4.1250%, 4/4/30‡ | 8,400,000 | EUR | 8,942,769 |
Deutsche Bank AG / New York, 5.4140%, 5/10/29 | 3,640,000 | 3,634,565 | |
ING Groep NV, EURIBOR 3 Month + 0.7000%, 0.3750%, 9/29/28‡ | 3,700,000 | EUR | 3,563,395 |
JPMorgan Chase & Co, SOFR + 1.3200%, 4.0800%, 4/26/26‡ | 3,710,000 | 3,660,683 | |
Lloyds Banking Group PLC, US Treasury Yield Curve Rate 1 Year + 1.7500%, 4.7160%, 8/11/26‡ | 4,720,000 | 4,665,716 | |
Lloyds Banking Group PLC, 4.2500%, 11/22/27 | 2,190,000 | AUD | 1,397,258 |
Lloyds Banking Group PLC, UK Govt Bonds 5 Year Note Generic Bid Yield + 3.1000%, 6.6250%, 6/2/33‡ | 2,268,000 | GBP | 2,901,280 |
Lloyds Banking Group PLC, UK Govt Bonds 5 Year Note Generic Bid Yield + 2.4000%, 2.7070%, 12/3/35‡ | 8,508,000 | GBP | 8,749,368 |
Morgan Stanley, SOFR + 1.7300%, 5.1230%, 2/1/29‡ | 1,564,000 | 1,557,817 | |
Morgan Stanley, SONIA Interest Rate Benchmark + 2.2520%, 5.7890%, 11/18/33‡ | 4,700,000 | 6,111,544 | |
Nationwide Building Society, 4.0000%, 9/14/26ž | 2,803,000 | 2,693,531 | |
Nationwide Building Society, ICE SWAP Rate GBP SONIA 1 Year + 2.2130%, 6.1780%, 12/7/27‡ | 4,920,000 | GBP | 6,312,201 |
Nationwide Building Society, 10.2500%‡,μ | 8,500 | GBP | 1,401,984 |
Natwest Group PLC, 6.6250%, 6/22/26 | 3,584,000 | GBP | 4,646,480 |
Natwest Group PLC, US Treasury Yield Curve Rate 1 Year + 2.8500%, 7.4720%, 11/10/26‡ | 11,405,000 | 11,654,974 | |
Natwest Group PLC, US Treasury Yield Curve Rate 1 Year + 1.3500%, 5.8470%, 3/2/27‡ | 2,650,000 | 2,656,194 | |
Santander UK Group Holdings PLC, SOFR + 2.7490%, 6.8330%, 11/21/26‡ | 11,438,000 | 11,590,577 | |
Santander UK Group Holdings PLC, GBP SWAP 1YR + 2.8660%, 7.0980%, 11/16/27‡ | 2,682,000 | GBP | 3,487,007 |
UBS Group AG, US Treasury Yield Curve Rate 1 Year + 1.6000%, 4.4900%, 8/5/25ž,‡ | 9,375,000 | 9,360,228 | |
UBS Group AG, EURIBOR ICE SWAP Rate + 1.7500%, 4.1250%, 6/9/33‡ | 2,790,000 | EUR | 3,013,844 |
UBS Group AG, 5.9590%, 1/12/34ž | 3,370,000 | 3,420,703 | |
UBS Group AG, US Treasury Yield Curve Rate 5 Year + 4.7450%, 9.2500%ž,‡,μ | 1,268,000 | 1,364,245 | |
115,833,463 | |||
Brokerage – 1.1% | |||
Intercontinental Exchange Inc, 1.8500%, 9/15/32 | 7,797,000 | 6,043,711 | |
LSEGA Financing PLC, 1.3750%, 4/6/26ž | 2,500,000 | 2,331,929 | |
Nasdaq Inc, 5.3500%, 6/28/28 | 1,240,000 | 1,251,259 | |
Nasdaq Inc, 4.5000%, 2/15/32 | 1,100,000 | EUR | 1,231,104 |
Nasdaq Inc, 5.5500%, 2/15/34 | 854,000 | 855,157 | |
11,713,160 | |||
Capital Goods – 0.4% | |||
TransDigm Inc, 6.3750%, 3/1/29ž | 4,600,000 | 4,623,198 | |
Communications – 6.1% | |||
American Tower Corp, 3.6000%, 1/15/28 | 7,580,000 | 7,152,483 | |
Crown Castle International Corp, 3.6500%, 9/1/27 | 1,883,000 | 1,789,423 | |
Crown Castle International Corp, 3.8000%, 2/15/28 | 1,990,000 | 1,885,381 | |
Crown Castle International Corp, 2.2500%, 1/15/31 | 4,508,000 | 3,707,438 | |
Deutsche Telekom International Finance BV, 1.5000%, 4/3/28 | 2,800,000 | EUR | 2,818,985 |
Netflix Inc, 5.8750%, 11/15/28 | 8,155,000 | 8,402,248 | |
Netflix Inc, 3.8750%, 11/15/29 | 1,320,000 | EUR | 1,431,233 |
Netflix Inc, 3.6250%, 6/15/30 | 2,680,000 | EUR | 2,861,445 |
Netflix Inc, 4.8750%, 6/15/30ž | 962,000 | 946,873 | |
Orange SA, 1.0000%, 5/12/25 | 4,100,000 | EUR | 4,292,210 |
Orange SA, 1.3750%, 1/16/30 | 5,500,000 | EUR | 5,297,853 |
T-Mobile USA Inc, 2.2500%, 2/15/26 | 7,500,000 | 7,121,898 |
Schedule of Investments
June 30, 2024
Shares or Principal Amounts | Value | ||
Corporate Bonds – (continued) | |||
Communications – (continued) | |||
T-Mobile USA Inc, 4.7500%, 2/1/28 | $933,000 | $918,755 | |
T-Mobile USA Inc, 2.6250%, 2/15/29 | 1,794,000 | 1,606,838 | |
T-Mobile USA Inc, 3.8750%, 4/15/30 | 9,017,000 | 8,429,332 | |
Verizon Communications Inc, 4.5000%, 8/17/27 | 5,970,000 | AUD | 3,892,696 |
Verizon Communications Inc, 2.3500%, 3/23/28 | 3,420,000 | AUD | 2,051,975 |
Virgin Media Secured Finance PLC, 4.1250%, 8/15/30ž | 2,500,000 | GBP | 2,622,599 |
67,229,665 | |||
Consumer Cyclical – 7.9% | |||
Booking Holdings Inc, 4.0000%, 11/15/26 | 10,358,000 | EUR | 11,238,831 |
Booking Holdings Inc, 3.5500%, 3/15/28 | 1,116,000 | 1,061,175 | |
Booking Holdings Inc, 3.5000%, 3/1/29 | 2,280,000 | EUR | 2,445,507 |
Compass Group PLC, 2.0000%, 7/3/29 | 5,100,000 | GBP | 5,708,210 |
Experian Finance PLC, 4.2500%, 2/1/29ž | 6,600,000 | 6,350,179 | |
Experian Finance PLC, 2.7500%, 3/8/30ž | 7,341,000 | 6,493,133 | |
Experian Finance PLC, 3.2500%, 4/7/32 | 830,000 | GBP | 940,595 |
Levi Strauss & Co, 3.5000%, 3/1/31ž | 8,000,000 | 6,920,565 | |
Service Corp International/US, 4.6250%, 12/15/27 | 6,882,000 | 6,658,517 | |
Service Corp International/US, 5.1250%, 6/1/29 | 1,325,000 | 1,287,462 | |
Service Corp International/US, 3.3750%, 8/15/30 | 10,354,000 | 9,011,044 | |
Service Corp International/US, 4.0000%, 5/15/31 | 6,752,000 | 6,013,168 | |
Sodexo SA, 1.7500%, 6/26/28 | 6,400,000 | GBP | 7,167,903 |
Verisure Holding AB, 5.5000%, 5/15/30ž | 4,500,000 | EUR | 4,895,039 |
Walmart Inc, 4.8750%, 9/21/29 | 8,500,000 | EUR | 9,838,003 |
86,029,331 | |||
Consumer Non-Cyclical – 15.4% | |||
Abbott Ireland Financing DAC, 1.5000%, 9/27/26 | 2,650,000 | EUR | 2,727,513 |
AbbVie Inc, 4.8000%, 3/15/27 | 5,150,000 | 5,126,891 | |
AbbVie Inc, 4.8000%, 3/15/29 | 2,610,000 | 2,599,912 | |
Amgen Inc, 5.2500%, 3/2/30 | 1,754,000 | 1,766,867 | |
Amgen Inc, 5.2500%, 3/2/33 | 5,041,000 | 5,026,309 | |
Anheuser-Busch InBev SA/NV, 3.4500%, 9/22/31 | 2,150,000 | EUR | 2,296,510 |
Anheuser-Busch InBev Worldwide Inc, 4.1000%, 9/6/27 | 2,840,000 | AUD | 1,846,053 |
Anheuser-Busch InBev Worldwide Inc, 3.5000%, 6/1/30 | 3,680,000 | 3,418,788 | |
AstraZeneca Finance LLC, 4.8000%, 2/26/27 | 3,768,000 | 3,746,282 | |
AstraZeneca Finance LLC, 4.8500%, 2/26/29 | 1,664,000 | 1,660,667 | |
Avantor Funding Inc, 3.8750%, 7/15/28 | 2,365,000 | EUR | 2,465,969 |
Avantor Funding Inc, 3.8750%, 7/15/28ž | 4,590,000 | EUR | 4,785,960 |
Bacardi Ltd, 4.4500%, 5/15/25ž | 3,873,000 | 3,826,610 | |
Bacardi Ltd, 4.7000%, 5/15/28ž | 4,806,000 | 4,672,890 | |
Bristol-Myers Squibb Co, 4.9000%, 2/22/27 | 2,532,000 | 2,524,730 | |
Coca-Cola Co, 2.1250%, 9/6/29 | 5,330,000 | 4,692,313 | |
Coty Inc, 4.5000%, 5/15/27ž | 1,240,000 | EUR | 1,337,752 |
Diageo Capital PLC, 1.3750%, 9/29/25 | 5,000,000 | 4,759,508 | |
Diageo Capital PLC, 2.0000%, 4/29/30 | 1,709,000 | 1,456,707 | |
Diageo Finance PLC, 1.7500%, 10/12/26 | 6,600,000 | GBP | 7,807,119 |
Elanco Animal Health Inc, 6.6500%, 8/28/28 | 1,640,000 | 1,662,417 | |
GE HealthCare Technologies Inc, 5.6000%, 11/15/25 | 2,600,000 | 2,600,872 | |
HCA Inc, 5.2500%, 6/15/26 | 1,585,000 | 1,577,919 | |
HCA Inc, 4.1250%, 6/15/29 | 4,675,000 | 4,426,799 | |
HCA Inc, 3.6250%, 3/15/32 | 2,847,000 | 2,507,817 | |
Heineken NV, 3.5000%, 1/29/28ž | 2,320,000 | 2,210,942 | |
IQVIA Inc, 5.0000%, 5/15/27ž | 5,207,000 | 5,080,492 | |
Keurig Dr Pepper Inc, 5.1000%, 3/15/27# | 2,800,000 | 2,800,763 | |
Keurig Dr Pepper Inc, 3.2000%, 5/1/30 | 929,000 | 837,300 | |
Kimberly-Clark Corp, 3.1000%, 3/26/30 | 1,737,000 | 1,588,609 | |
Lonza Finance International NV, 3.8750%, 4/24/36 | 1,810,000 | EUR | 1,910,978 |
Medline Borrower LP / Medline Co-Issuer Inc, 6.2500%, 4/1/29ž | 2,610,000 | 2,639,540 | |
Molson Coors Beverage Co, 3.8000%, 6/15/32 | 3,180,000 | EUR | 3,418,728 |
Nestle Finance International Ltd, 1.5000%, 4/1/30 | 10,000,000 | EUR | 9,794,262 |
Schedule of Investments
June 30, 2024
Shares or Principal Amounts | Value | ||
Corporate Bonds – (continued) | |||
Consumer Non-Cyclical – (continued) | |||
Novartis Finance SA, 0%, 9/23/28 | 10,000,000 | EUR | $9,384,503 |
Novo Nordisk Finance Netherlands BV, 0.7500%, 3/31/25 | 7,786,000 | EUR | 8,158,109 |
PepsiCo Inc, 2.6250%, 7/29/29 | $2,695,000 | 2,437,080 | |
PepsiCo Inc, 1.1250%, 3/18/31 | 5,000,000 | EUR | 4,673,202 |
Smith & Nephew PLC, 5.1500%, 3/20/27 | 1,458,000 | 1,453,142 | |
Solventum Corp, 5.4500%, 2/25/27ž | 4,498,000 | 4,493,612 | |
Solventum Corp, 5.4000%, 3/1/29ž | 4,060,000 | 4,047,611 | |
Tesco Corporate Treasury Services, 0.3750%, 7/27/29 | 3,000,000 | EUR | 2,741,736 |
Tesco Corporate Treasury Services, 2.7500%, 4/27/30 | 3,200,000 | GBP | 3,589,098 |
Tesco Corporate Treasury Services, 5.1250%, 5/22/34 | 1,740,000 | GBP | 2,125,257 |
Tesco PLC, 6.1500%, 11/15/37ž | 2,001,000 | 2,004,537 | |
Unilever PLC, 1.5000%, 7/22/26 | 2,350,000 | GBP | 2,784,209 |
Zoetis Inc, 5.4000%, 11/14/25 | 3,466,000 | 3,463,427 | |
Zoetis Inc, 3.9000%, 8/20/28 | 2,450,000 | 2,338,781 | |
Zoetis Inc, 2.0000%, 5/15/30 | 4,547,000 | 3,829,742 | |
169,126,834 | |||
Government Guarantee – 1.7% | |||
Electricite de France SA, 5.5000%, 1/25/35 | 1,900,000 | GBP | 2,310,600 |
Kreditanstalt fuer Wiederaufbau, 3.2000%, 9/11/26 | 11,843,000 | AUD | 7,671,646 |
Kreditanstalt fuer Wiederaufbau, 3.2000%, 3/15/28 | 13,660,000 | AUD | 8,688,785 |
18,671,031 | |||
Insurance – 2.7% | |||
Anthem Inc, 2.2500%, 5/15/30 | 2,905,000 | 2,489,111 | |
Aon North America Inc, 5.1250%, 3/1/27 | 2,405,000 | 2,400,822 | |
Aon North America Inc, 5.1500%, 3/1/29# | 1,108,000 | 1,104,910 | |
Aviva PLC, UK Govt Bonds 5 Year Note Generic Bid Yield + 4.7000%, 4.0000%, 6/3/55‡ | 2,320,000 | GBP | 2,381,706 |
Berkshire Hathaway Inc, 0%, 3/12/25 | 4,430,000 | EUR | 4,623,617 |
BUPA Finance PLC, 4.1250%, 6/14/35 | 1,826,000 | GBP | 1,881,851 |
BUPA Finance PLC, UK Govt Bonds 5 Year Note Generic Bid Yield + 3.1700%, 4.0000%‡,μ | 4,705,000 | GBP | 4,311,331 |
Centene Corp, 3.0000%, 10/15/30 | 3,876,000 | 3,314,247 | |
Centene Corp, 2.6250%, 8/1/31 | 7,558,000 | 6,206,763 | |
Scottish Widows Ltd, 7.0000%, 6/16/43 | 612,000 | GBP | 817,461 |
29,531,819 | |||
Technology – 9.0% | |||
Apple Inc, 2.5130%, 8/19/24 | 5,080,000 | CAD | 3,702,506 |
ASML Holding NV, 1.3750%, 7/7/26 | 5,846,000 | EUR | 6,031,900 |
Atlassian Corp, 5.2500%, 5/15/29 | 1,683,000 | 1,683,074 | |
Atlassian Corp, 5.5000%, 5/15/34 | 2,446,000 | 2,423,610 | |
CrowdStrike Holdings Inc, 3.0000%, 2/15/29 | 5,781,000 | 5,212,415 | |
DELL International LLC / EMC Corp, 6.0200%, 6/15/26 | 745,000 | 752,795 | |
Fiserv Inc, 5.4500%, 3/2/28 | 2,556,000 | 2,578,904 | |
Fiserv Inc, 1.6250%, 7/1/30 | 1,770,000 | EUR | 1,680,276 |
Gartner Inc, 3.7500%, 10/1/30ž | 4,237,000 | 3,799,909 | |
Microsoft Corp, 2.5250%, 6/1/50 | 25,197,000 | 15,926,407 | |
MSCI Inc, 4.0000%, 11/15/29ž | 2,026,000 | 1,892,965 | |
MSCI Inc, 3.6250%, 9/1/30ž,# | 2,483,000 | 2,229,247 | |
NVIDIA Corp, 3.2000%, 9/16/26 | 1,627,000 | 1,572,830 | |
Oracle Corp, 2.6500%, 7/15/26 | 3,467,000 | 3,285,721 | |
Oracle Corp, 2.9500%, 4/1/30 | 6,440,000 | 5,727,393 | |
Oracle Corp, 4.9000%, 2/6/33 | 2,473,000 | 2,398,891 | |
RELX Finance BV, 3.3750%, 3/20/33 | 1,830,000 | EUR | 1,922,480 |
Sage Group PLC/The, 2.8750%, 2/8/34 | 6,875,000 | GBP | 7,065,862 |
Salesforce.com Inc, 3.7000%, 4/11/28 | 2,252,000 | 2,170,874 | |
Salesforce.com Inc, 1.9500%, 7/15/31 | 6,764,000 | 5,550,619 | |
SAP SE, 1.7500%, 2/22/27 | 1,127,000 | EUR | 1,175,812 |
VMware Inc, 1.4000%, 8/15/26 | 2,245,000 | 2,067,146 | |
VMware Inc, 3.9000%, 8/21/27 | 4,698,000 | 4,507,505 |
Schedule of Investments
June 30, 2024
Shares or Principal Amounts | Value | ||
Corporate Bonds – (continued) | |||
Technology – (continued) | |||
VMware Inc, 4.7000%, 5/15/30 | $7,315,000 | $7,076,615 | |
Workday Inc, 3.8000%, 4/1/32 | 7,100,000 | 6,379,598 | |
98,815,354 | |||
Total Corporate Bonds (cost $641,856,429) | 601,573,855 | ||
Foreign Government Bonds – 26.7% | |||
Australia Government Bond, 3.2500%, 4/21/29 | 39,267,000 | AUD | 25,246,181 |
Australia Government Bond, 2.7500%, 5/21/41 | 46,294,000 | AUD | 24,263,410 |
Australia Government Bond, 1.7500%, 6/21/51 | 12,500,000 | AUD | 4,612,275 |
Canadian Government Bond, 1.5000%, 6/1/31 | 25,399,000 | CAD | 16,314,109 |
Canadian Government Bond, 3.0000%, 6/1/34 | 27,750,000 | CAD | 19,436,361 |
European Union, 3.0000%, 12/4/34 | 10,912,978 | EUR | 11,520,654 |
Federal Republic of Germany Bond, 2.2000%, 2/15/34 | 11,300,000 | EUR | 11,812,849 |
Federal Republic of Germany Bond, 0%, 8/15/50 | 13,555,087 | EUR | 7,344,027 |
Federal Republic of Germany Bond, 1.8000%, 8/15/53 | 7,292,122 | EUR | 6,444,940 |
Japan Government Five Year Bond, 0.0050%, 6/20/27 | 2,500,000,000 | JPY | 15,365,823 |
Kingdom of Sweden Government Bond, 1.0000%, 11/12/26 | 140,100,000 | SEK | 12,799,964 |
Kingdom of Sweden Government Bond, 0.7500%, 11/12/29 | 64,165,000 | SEK | 5,664,539 |
Kingdom of Sweden Government Bond, 0.1250%, 5/12/31 | 277,085,000 | SEK | 22,806,048 |
Kingdom of the Netherlands Government Bond, 0.7500%, 7/15/28ž | 24,244,519 | EUR | 24,058,534 |
Kingdom of the Netherlands Government Bond, 0.5000%, 7/15/32ž | 22,642,116 | EUR | 20,359,357 |
New Zealand Government Bond, 3.0000%, 4/20/29 | 20,000,000 | NZD | 11,379,581 |
New Zealand Government Bond, 1.5000%, 5/15/31 | 33,000,000 | NZD | 16,487,642 |
New Zealand Government Bond, 3.5000%, 4/14/33 | 15,961,000 | NZD | 8,919,951 |
United Kingdom Gilt, 3.2500%, 1/31/33 | 12,600,000 | GBP | 14,924,343 |
United Kingdom Gilt, 4.5000%, 9/7/34 | 9,935,481 | GBP | 12,854,029 |
Total Foreign Government Bonds (cost $326,776,454) | 292,614,617 | ||
Mortgage-Backed Securities – 9.0% | |||
Fannie Mae Pool: | |||
3.5000%, 5/1/49 | 5,951,119 | 5,330,546 | |
3.0000%, 9/1/50 | 8,091,899 | 6,903,485 | |
3.5000%, 2/1/51 | 1,724,579 | 1,544,743 | |
3.0000%, 1/1/52 | 2,181,414 | 1,882,577 | |
3.0000%, 4/1/52 | 20,722,157 | 17,813,991 | |
3.0000%, 6/1/52 | 9,590,878 | 8,221,205 | |
3.0000%, 7/1/52 | 7,520,784 | 6,451,769 | |
3.5000%, 8/1/52 | 3,444,815 | 3,087,063 | |
3.5000%, 9/1/52 | 6,934,518 | 6,209,733 | |
3.5000%, 9/1/52 | 2,150,929 | 1,920,805 | |
4.5000%, 9/1/52 | 2,061,060 | 1,968,131 | |
5.0000%, 10/1/53 | 2,558,403 | 2,485,693 | |
5.0000%, 3/1/54 | 1,688,019 | 1,641,112 | |
65,460,853 | |||
Freddie Mac Pool: | |||
3.0000%, 11/1/51 | 9,578,807 | 8,246,102 | |
3.0000%, 5/1/52 | 10,378,148 | 8,936,106 | |
3.0000%, 5/1/52 | 3,733,897 | 3,224,127 | |
3.0000%, 6/1/52 | 1,446,602 | 1,239,862 | |
4.0000%, 8/1/52 | 1,862,943 | 1,728,441 | |
5.0000%, 4/1/54 | 8,448,768 | 8,214,330 | |
5.0000%, 4/1/54 | 1,917,763 | 1,858,290 | |
33,447,258 | |||
Total Mortgage-Backed Securities (cost $103,739,879) | 98,908,111 | ||
United States Treasury Notes/Bonds – 3.8% | |||
4.6250%, 4/30/29 | 18,615,900 | 18,829,692 | |
3.2500%, 6/30/29 | 11,943,200 | 11,346,506 | |
4.0000%, 2/15/34 | 11,626,600 | 11,285,069 | |
Total United States Treasury Notes/Bonds (cost $41,121,505) | 41,461,267 |
Schedule of Investments
June 30, 2024
Shares or Principal Amounts | Value | ||
Investment Companies – 3.3% | |||
Money Markets – 3.3% | |||
Janus Henderson Cash Liquidity Fund LLC, 5.3419%ºº,£ (cost $36,078,390) | 36,071,176 | $36,078,390 | |
Investments Purchased with Cash Collateral from Securities Lending – 0% | |||
Investment Companies – 0% | |||
Janus Henderson Cash Collateral Fund LLC, 5.2795%ºº,£ | 98,874 | 98,874 | |
Time Deposits – 0% | |||
Royal Bank of Canada, 5.3100%, 7/1/24 | $24,719 | 24,719 | |
Total Investments Purchased with Cash Collateral from Securities Lending (cost $123,593) | 123,593 | ||
Total Investments (total cost $1,157,519,409) – 98.3% | 1,076,681,033 | ||
Cash, Receivables and Other Assets, net of Liabilities – 1.7% | 18,311,099 | ||
Net Assets – 100% | $1,094,992,132 |
Summary of Investments by Country - (Long Positions) (unaudited) | ||
Country | Value | % of Investment Securities |
United States | $508,610,083 | 47.2 % |
United Kingdom | 172,811,740 | 16.1 |
Netherlands | 65,271,228 | 6.1 |
Germany | 58,534,378 | 5.4 |
Australia | 54,121,866 | 5.0 |
Sweden | 46,165,590 | 4.3 |
New Zealand | 36,787,174 | 3.4 |
Canada | 35,750,470 | 3.3 |
Switzerland | 28,454,501 | 2.6 |
France | 19,068,566 | 1.8 |
Japan | 15,365,823 | 1.4 |
Supranational | 11,520,654 | 1.1 |
Bermuda | 8,499,500 | 0.8 |
Denmark | 8,158,109 | 0.8 |
Belgium | 7,561,351 | 0.7 |
Total | $1,076,681,033 | 100.0 % |
Schedule of Affiliated Investments - (% of Net Assets) | ||||||||
Affiliate | Affiliated Investments, at Value at 6/30/23 | Purchases | Sales Proceeds | Realized Gain/(Loss) | Change in Unrealized Appreciation/ Depreciation | Affiliated Investments, at Value at 6/30/24 | Ending Shares | Dividend Income |
Investment Companies - 3.3% | ||||||||
Money Markets - 3.3% | ||||||||
Janus Henderson Cash Liquidity Fund LLC, 5.3419%ºº | ||||||||
$74,365,513 | $755,943,099 | $(794,230,166) | $1,003 | $(1,059) | $36,078,390 | 36,071,176 | $1,652,632 | |
Investments Purchased with Cash Collateral from Securities Lending - 0% | ||||||||
Investment Companies - 0% | ||||||||
Janus Henderson Cash Collateral Fund LLC, 5.2795%ºº | ||||||||
2,763,468 | 22,475,716 | (25,140,310) | - | - | 98,874 | 98,874 | 16,857 ∆ | |
Total Affiliated Investments - 3.3% | ||||||||
$77,128,981 | $778,418,815 | $(819,370,476) | $1,003 | $(1,059) | $36,177,264 | 36,170,050 | $1,669,489 |
Schedule of Investments
June 30, 2024
Schedule of Forward Foreign Currency Exchange Contracts | ||||
Counterparty/ Foreign Currency | Settlement Date | Foreign Currency Amount (Sold)/ Purchased | USD Currency Amount (Sold)/ Purchased | Market Value and Unrealized Appreciation/ (Depreciation) |
BNP Paribas: | ||||
Australian Dollar | 7/31/24 | 62,538,236 | $(41,016,410) | $727,510 |
Australian Dollar | 7/31/24 | 1,791,666 | (1,197,716) | (1,789) |
Australian Dollar | 7/31/24 | (66,979,382) | 43,448,615 | (1,259,745) |
Australian Dollar | 8/28/24 | 6,564,074 | (4,363,183) | 21,578 |
Australian Dollar | 8/28/24 | 5,450,555 | (3,654,075) | (13,139) |
Australian Dollar | 8/28/24 | (85,295,123) | 56,618,122 | (358,487) |
Australian Dollar | 9/25/24 | 9,040,863 | (6,024,743) | 17,887 |
Australian Dollar | 9/25/24 | (57,392,961) | 38,380,291 | 20,629 |
Australian Dollar | 9/25/24 | (1,392,112) | 927,965 | (2,479) |
British Pound | 7/31/24 | 38,305,227 | (47,975,868) | 447,075 |
British Pound | 7/31/24 | 1,367,820 | (1,737,741) | (8,634) |
British Pound | 7/31/24 | (9,140,066) | 11,597,646 | 43,375 |
British Pound | 7/31/24 | (38,137,865) | 47,597,083 | (614,293) |
British Pound | 8/28/24 | 22,675,797 | (28,878,530) | (205,839) |
British Pound | 8/28/24 | (71,594,170) | 91,194,763 | 666,636 |
British Pound | 9/25/24 | 779,081 | (984,141) | 1,146 |
British Pound | 9/25/24 | 610,203 | (773,959) | (2,249) |
British Pound | 9/25/24 | (43,568,324) | 55,388,994 | 289,034 |
Canadian Dollar | 7/31/24 | 3,332,366 | (2,445,102) | (7,103) |
Canadian Dollar | 7/31/24 | 1,486,177 | (1,084,409) | 2,895 |
Canadian Dollar | 7/31/24 | (2,130,912) | 1,561,342 | 2,341 |
Canadian Dollar | 7/31/24 | (12,972,062) | 9,448,162 | (42,356) |
Canadian Dollar | 8/28/24 | 6,314,152 | (4,611,138) | 11,570 |
Canadian Dollar | 8/28/24 | 1,200,600 | (882,312) | (3,330) |
Canadian Dollar | 8/28/24 | (5,820,264) | 4,263,826 | 2,703 |
Canadian Dollar | 8/28/24 | (16,082,910) | 11,765,777 | (8,820) |
Canadian Dollar | 9/25/24 | 30,160 | (22,086) | 8 |
Canadian Dollar | 9/25/24 | (155,440) | 114,019 | 145 |
Canadian Dollar | 9/25/24 | (33,811,006) | 24,713,392 | (55,981) |
Euro | 7/31/24 | 46,297,686 | (50,002,451) | (350,013) |
Euro | 7/31/24 | 8,673,419 | (9,300,683) | 1,215 |
Euro | 7/31/24 | (119,636,076) | 128,700,519 | 395,563 |
Euro | 7/31/24 | (5,573,832) | 5,972,124 | (5,589) |
Euro | 8/28/24 | 17,683,499 | (19,206,530) | (214,682) |
Euro | 8/28/24 | (79,923,090) | 86,917,967 | 1,081,610 |
Euro | 8/28/24 | (3,115,930) | 3,344,858 | (1,611) |
Euro | 9/25/24 | (70,330,440) | 75,757,863 | 134,991 |
Euro | 9/25/24 | 34,914 | (37,446) | 95 |
Euro | 9/25/24 | 32,248 | (34,730) | (56) |
Euro | 9/25/24 | (81,433) | 87,366 | (195) |
Japanese Yen | 7/31/24 | (833,315,753) | 5,483,633 | 277,305 |
Japanese Yen | 8/28/24 | (833,315,753) | 5,389,959 | 160,090 |
Japanese Yen | 9/25/24 | (833,315,753) | 5,339,123 | 89,915 |
New Zealand Dollar | 7/31/24 | 42,980,663 | (25,944,472) | 226,216 |
New Zealand Dollar | 7/31/24 | 362,815 | (221,986) | (1,071) |
New Zealand Dollar | 7/31/24 | (59,390,992) | 35,218,649 | (944,198) |
New Zealand Dollar | 8/28/24 | (42,222,637) | 25,856,487 | 147,501 |
New Zealand Dollar | 9/25/24 | (2,362,507) | 1,448,349 | 9,892 |
Schedule of Investments
June 30, 2024
Counterparty/ Foreign Currency | Settlement Date | Foreign Currency Amount (Sold)/ Purchased | USD Currency Amount (Sold)/ Purchased | Market Value and Unrealized Appreciation/ (Depreciation) |
Swedish Krona | 7/31/24 | 427,806 | $(39,689) | $759 |
Swedish Krona | 7/31/24 | (275,998,573) | 25,424,427 | (670,597) |
Swedish Krona | 8/28/24 | (140,755,235) | 13,192,525 | (137,214) |
Swedish Krona | 9/25/24 | 134,519,911 | (12,879,688) | (123,280) |
Swedish Krona | 9/25/24 | (140,755,235) | 13,529,359 | 181,662 |
Swiss Franc | 7/31/24 | 23,194,957 | (25,789,568) | 134,701 |
Swiss Franc | 7/31/24 | 1,211,047 | (1,364,943) | (11,394) |
Swiss Franc | 7/31/24 | (24,406,004) | 27,153,670 | (124,148) |
Swiss Franc | 8/28/24 | 22,877,516 | (25,940,521) | (275,386) |
Swiss Franc | 8/28/24 | (22,074,885) | 24,953,270 | 188,566 |
Swiss Franc | 8/28/24 | 76,375 | (84,785) | 896 |
Swiss Franc | 8/28/24 | (879,006) | 971,171 | (14,941) |
Total | $(173,110) |
Schedule of Futures | ||||
Description | Number of Contracts | Expiration Date | Notional Amount | Value and Unrealized Appreciation/(Depreciation) |
Futures Long: | ||||
10-Year Australian Bond | 1,463 | 9/16/24 | $110,806,015 | $56,473 |
10-Year Canadian Bond | 1,160 | 9/27/24 | 101,821,186 | 817,184 |
5 Year US Treasury Note | 1,979 | 10/3/24 | 210,918,109 | (472,939) |
Euro-Bund | 269 | 9/10/24 | 37,912,558 | 638,557 |
Long Gilt | 895 | 9/30/24 | 110,370,513 | 481,625 |
Total | $1,520,900 |
Fair Value of Derivative Instruments (not accounted for as hedging instruments) as of June 30, 2024 | |||
Currency Contracts | Interest Rate Contracts | Total | |
Asset Derivatives: | |||
Forward foreign currency exchange contracts | $5,285,509 | $- | $5,285,509 |
*Futures contracts | 1,993,839 | $1,993,839 | |
Total Asset Derivatives | $5,285,509 | $1,993,839 | $7,279,348 |
Liability Derivatives: | |||
Forward foreign currency exchange contracts | $5,458,619 | $- | $5,458,619 |
*Futures contracts | 472,939 | $472,939 | |
Total Liability Derivatives | $5,458,619 | $472,939 | $5,931,558 |
* | The fair value presented includes net cumulative unrealized appreciation (depreciation) on futures contracts and centrally cleared swaps. In the Statement of Assets and Liabilities, only current day's variation margin is reported in receivables or payables and the net cumulative unrealized appreciation (depreciation) is included in total distributable earnings (loss). |
Schedule of Investments
June 30, 2024
The effect of Derivative Instruments (not accounted for as hedging instruments) on the Statement of Operations for the year ended June 30, 2024 | ||||
Amount of Realized Gain/(Loss) Recognized on Derivatives | ||||
Derivative | Credit Contracts | Currency Contracts | Interest Rate Contracts | Total |
Futures contracts | $- | $- | $(42,685,382) | $(42,685,382) |
Forward foreign currency exchange contracts | - | 20,389,838 | - | $20,389,838 |
Swap contracts | (1,725,087) | - | - | $(1,725,087) |
Total | $(1,725,087) | $20,389,838 | $(42,685,382) | $(24,020,631) |
Amount of Change in Unrealized Appreciation/Depreciation Recognized on Derivatives | ||||
Derivative | Credit Contracts | Currency Contracts | Interest Rate Contracts | Total |
Futures contracts | $- | $- | $15,931,085 | $15,931,085 |
Forward foreign currency exchange contracts | - | (570,192) | - | $(570,192) |
Swap contracts | 1,763,794 | - | - | $1,763,794 |
Total | $1,763,794 | $(570,192) | $15,931,085 | $17,124,687 |
Average Ending Monthly Value of Derivative Instruments During the Year Ended June 30, 2024 | |
Credit default swaps: | |
Average notional amount - buy protection | $24,400,000 |
Forward foreign currency exchange contracts: | |
Average amounts purchased - in USD | 130,771,834 |
Average amounts sold - in USD | 919,644,262 |
Futures contracts: | |
Average notional amount of contracts - long | 784,516,963 |
Offsetting of Financial Assets and Derivative Assets | ||||
Counterparty | Gross Amounts of Recognized Assets | Offsetting Asset or Liability(a) | Collateral Pledged(b) | Net Amount |
BNP Paribas | $5,285,509 | $(5,285,509) | $— | $— |
JPMorgan Chase Bank, National Association | 119,128 | — | (119,128) | — |
Total | $5,404,637 | $(5,285,509) | $(119,128) | $— |
Schedule of Investments
June 30, 2024
Offsetting of Financial Liabilities and Derivative Liabilities | ||||
Counterparty | Gross Amounts of Recognized Liabilities | Offsetting Asset or Liability | Collateral Pledged | Net Amount |
BNP Paribas | $5,458,619 | $(5,285,509) | $— | $173,110 |
(a) | Represents the amount of assets or liabilities that could be offset with the same counterparty under master netting or similar agreements that management elects not to offset on the Statement of Assets and Liabilities. |
(b) | Collateral pledged is limited to the net outstanding amount due to/from an individual counterparty. The actual collateral amounts pledged may exceed these amounts and may fluctuate in value. |
Notes to Schedule of Investments and Other Information
EURIBOR | Euro Interbank Offered Rate |
ICE | Intercontinental Exchange |
LLC | Limited Liability Company |
LP | Limited Partnership |
PLC | Public Limited Company |
SOFR | Secured Overnight Financing Rate |
SONIA | Sterling Overnight Interbank Average Rate |
ž | Securities sold under Rule 144A of the Securities Act of 1933, as amended, are subject to legal and/or contractual restrictions on resale and may not be publicly sold without registration under the 1933 Act. Unless otherwise noted, these securities have been determined to be liquid under guidelines established by the Board of Trustees. The total value of 144A securities as of the year ended June 30, 2024 is $139,462,180, which represents 12.7% of net assets. |
‡ | Variable or floating rate security. Rate shown is the current rate as of June 30, 2024. Certain variable rate securities are not based on a published reference rate and spread; they are determined by the issuer or agent and current market conditions. Reference rate is as of reset date and may vary by security, which may not indicate a reference rate and/or spread in their description. |
ºº | Rate shown is the 7-day yield as of June 30, 2024. |
# | Loaned security; a portion of the security is on loan at June 30, 2024. |
μ | Perpetual security. Perpetual securities have no stated maturity date, but they may be called/redeemed by the issuer. The date indicated, if any, represents the next call date. |
£ | The Fund may invest in certain securities that are considered affiliated companies. As defined by the Investment Company Act of 1940, as amended, an affiliated company is one in which the Fund owns 5% or more of the outstanding voting securities, or a company which is under common ownership or control. |
∆ | Net of income paid to the securities lending agent and rebates paid to the borrowing counterparties. |
Notes to Schedule of Investments and Other Information
Valuation Inputs Summary | |||
Level 1 - Quoted Prices | Level 2 - Other Significant Observable Inputs | Level 3 - Significant Unobservable Inputs | |
Assets | |||
Investments In Securities: | |||
Asset-Backed/Commercial Mortgage-Backed Securities | $- | $5,921,200 | $- |
Corporate Bonds | - | 601,573,855 | - |
Foreign Government Bonds | - | 292,614,617 | - |
Mortgage-Backed Securities | - | 98,908,111 | - |
United States Treasury Notes/Bonds | - | 41,461,267 | - |
Investment Companies | - | 36,078,390 | - |
Investments Purchased with Cash Collateral from Securities Lending | - | 123,593 | - |
Total Investments in Securities | $- | $1,076,681,033 | $- |
Other Financial Instruments(a): | |||
Forward Foreign Currency Exchange Contracts | - | 5,285,509 | - |
Futures Contracts | 1,993,839 | - | - |
Total Assets | $1,993,839 | $1,081,966,542 | $- |
Liabilities | |||
Other Financial Instruments(a): | |||
Forward Foreign Currency Exchange Contracts | $- | $5,458,619 | $- |
Futures Contracts | 472,939 | - | - |
Total Liabilities | $472,939 | $5,458,619 | $- |
(a) | Other financial instruments may include forward foreign currency exchange contracts, futures, written options, written swaptions, and swap contracts. Forward foreign currency exchange contracts, futures contracts, and swap contracts are reported at their unrealized appreciation/(depreciation) at measurement date, which represents the change in the contract's value from trade date. Written options and written swaptions are reported at their market value at measurement date. |
Statement of Assets and Liabilities
June 30, 2024
Assets: | |
Unaffiliated investments, at value (cost $1,121,342,145)(1) | $1,040,503,769 |
Affiliated investments, at value (cost $36,177,264) | 36,177,264 |
Deposits with brokers for futures | 12,392,214 |
Forward foreign currency exchange contracts | 5,285,509 |
Cash denominated in foreign currency (cost $1,321,425) | 1,321,425 |
Variation margin receivable on futures contracts | 885,998 |
Trustees' deferred compensation | 30,140 |
Receivables: | |
Interest | 9,323,587 |
Fund shares sold | 816,402 |
Investments sold | 653,460 |
Foreign tax reclaims | 168,981 |
Dividends from affiliates | 116,046 |
Other assets | 103,374 |
Total Assets | 1,107,778,169 |
Liabilities: | |
Collateral for securities loaned (Note 3) | 123,593 |
Forward foreign currency exchange contracts | 5,458,619 |
Variation margin payable on futures contracts | 1,086,730 |
Payables: | |
Fund shares repurchased | 3,289,329 |
Investments purchased | 1,808,810 |
Advisory fees | 334,172 |
Transfer agent fees and expenses | 197,892 |
Dividends | 156,709 |
Professional fees | 83,051 |
Trustees' deferred compensation fees | 30,140 |
12b-1 Distribution and shareholder servicing fees | 17,927 |
Custodian fees | 17,380 |
Trustees' fees and expenses | 7,410 |
Affiliated fund administration fees payable | 2,355 |
Accrued expenses and other payables | 171,920 |
Total Liabilities | 12,786,037 |
Commitments and contingent liabilities (Note 4) | |
Net Assets | $1,094,992,132 |
Statement of Assets and Liabilities
June 30, 2024
Net Assets Consist of: | |
Capital (par value and paid-in surplus) | $1,633,358,035 |
Total distributable earnings (loss) | (538,365,903) |
Total Net Assets | $1,094,992,132 |
Net Assets - Class A Shares | $43,893,397 |
Shares Outstanding, $0.01 Par Value (unlimited shares authorized) | 5,793,135 |
Net Asset Value Per Share(2) | $7.58 |
Maximum Offering Price Per Share(3) | $7.96 |
Net Assets - Class C Shares | $10,531,631 |
Shares Outstanding, $0.01 Par Value (unlimited shares authorized) | 1,400,674 |
Net Asset Value Per Share(2) | $7.52 |
Net Assets - Class D Shares | $29,135,204 |
Shares Outstanding, $0.01 Par Value (unlimited shares authorized) | 3,848,592 |
Net Asset Value Per Share | $7.57 |
Net Assets - Class I Shares | $822,179,009 |
Shares Outstanding, $0.01 Par Value (unlimited shares authorized) | 108,978,398 |
Net Asset Value Per Share | $7.54 |
Net Assets - Class N Shares | $167,126,806 |
Shares Outstanding, $0.01 Par Value (unlimited shares authorized) | 22,146,794 |
Net Asset Value Per Share | $7.55 |
Net Assets - Class S Shares | $183,820 |
Shares Outstanding, $0.01 Par Value (unlimited shares authorized) | 24,294 |
Net Asset Value Per Share | $7.57 |
Net Assets - Class T Shares | $21,942,265 |
Shares Outstanding, $0.01 Par Value (unlimited shares authorized) | 2,900,518 |
Net Asset Value Per Share | $7.56 |
(1) | Includes $119,128 of securities on loan. See Note 3 in Notes to Financial Statements. |
(2) | Redemption price per share may be reduced for any applicable contingent deferred sales charge. |
(3) | Maximum offering price is computed at 100/95.25 of net asset value. |
Statement of Operations
For the year ended June 30, 2024
Investment Income: | |
Interest | $41,991,437 |
Dividends from affiliates | 1,652,632 |
Affiliated securities lending income, net | 16,857 |
Unaffiliated securities lending income, net | 4,159 |
Other income | 835,091 |
Foreign tax withheld | (123,663) |
Total Investment Income | 44,376,513 |
Expenses: | |
Advisory fees | 7,234,301 |
12b-1 Distribution and shareholder servicing fees: | |
Class A Shares | 117,127 |
Class C Shares | 126,241 |
Class S Shares | 704 |
Transfer agent administrative fees and expenses: | |
Class D Shares | 30,200 |
Class S Shares | 729 |
Class T Shares | 72,914 |
Transfer agent networking and omnibus fees: | |
Class A Shares | 99,473 |
Class C Shares | 11,803 |
Class I Shares | 1,358,410 |
Other transfer agent fees and expenses: | |
Class A Shares | 2,991 |
Class C Shares | 652 |
Class D Shares | 5,475 |
Class I Shares | 56,742 |
Class N Shares | 7,939 |
Class S Shares | 25 |
Class T Shares | 2,929 |
Registration fees | 163,756 |
Shareholder reports expense | 158,406 |
Professional fees | 100,702 |
Custodian fees | 99,909 |
Affiliated fund administration fees | 33,692 |
Trustees' fees and expenses | 28,259 |
Other expenses | 250,437 |
Total Expenses | 9,963,816 |
Less: Excess Expense Reimbursement and Waivers | (1,794,572) |
Net Expenses | 8,169,244 |
Net Investment Income/(Loss) | 36,207,269 |
Statement of Operations
For the year ended June 30, 2024
Net Realized Gain/(Loss) on Investments: | |
Investments and foreign currency transactions | $(52,215,072) |
Investments in affiliates | 1,003 |
Forward foreign currency exchange contracts | 20,389,838 |
Futures contracts | (42,685,382) |
Swap contracts | (1,725,087) |
Total Net Realized Gain/(Loss) on Investments | (76,234,700) |
Change in Unrealized Net Appreciation/Depreciation: | |
Investments, foreign currency translations and Trustees' deferred compensation | 61,829,810 |
Investments in affiliates | (1,059) |
Forward foreign currency exchange contracts | (570,192) |
Futures contracts | 15,931,085 |
Swap contracts | 1,763,794 |
Total Change in Unrealized Net Appreciation/Depreciation | 78,953,438 |
Net Increase/(Decrease) in Net Assets Resulting from Operations | $38,926,007 |
Statements of Changes in Net Assets
Year ended June 30, 2024 | Year ended June 30, 2023 | |
Operations: | ||
Net investment income/(loss) | $36,207,269 | $37,200,008 |
Net realized gain/(loss) on investments | (76,234,700) | (273,606,662) |
Change in unrealized net appreciation/depreciation | 78,953,438 | 147,973,329 |
Net Increase/(Decrease) in Net Assets Resulting from Operations | 38,926,007 | (88,433,325) |
Dividends and Distributions to Shareholders: | ||
Class A Shares | — | (5,830,159) |
Class C Shares | — | (1,613,123) |
Class D Shares | — | (2,333,968) |
Class I Shares | — | (126,880,529) |
Class N Shares | — | (10,020,418) |
Class S Shares | — | (42,120) |
Class T Shares | — | (4,513,172) |
Total Dividends and Distributions to Shareholders | — | (151,233,489) |
Return of Capital on Dividends and Distributions: | ||
Class A Shares | (1,275,732) | — |
Class C Shares | (233,021) | — |
Class D Shares | (722,357) | — |
Class I Shares | (29,223,966) | — |
Class N Shares | (4,406,806) | — |
Class S Shares | (6,223) | — |
Class T Shares | (714,336) | — |
Total Return of Capital on Dividends and Distributions | (36,582,441) | — |
Net Decrease from Dividends and Distributions to Shareholders | (36,582,441) | (151,233,489) |
Capital Share Transactions: | ||
Class A Shares | (18,864,651) | (10,105,427) |
Class C Shares | (6,537,898) | (7,083,837) |
Class D Shares | 2,876,419 | (35,365) |
Class I Shares | (443,501,866) | (428,407,048) |
Class N Shares | 42,200,371 | 13,180,626 |
Class S Shares | (279,838) | (50,447) |
Class T Shares | (14,956,733) | (30,673,057) |
Net Increase/(Decrease) from Capital Share Transactions | (439,064,196) | (463,174,555) |
Net Increase/(Decrease) in Net Assets | (436,720,630) | (702,841,369) |
Net Assets: | ||
Beginning of period | 1,531,712,762 | 2,234,554,131 |
End of period | $1,094,992,132 | $1,531,712,762 |
Financial Highlights
Class A Shares | |||||
For a share outstanding during the year ended June 30 | 2024 | 2023 | 2022 | 2021 | 2020 |
Net Asset Value, Beginning of Period | $7.55 | $8.60 | $9.93 | $9.94 | $9.69 |
Income/(Loss) from Investment Operations: | |||||
Net investment income/(loss)(1) | 0.19 | 0.15 | 0.12 | 0.17 | 0.14 |
Net realized and unrealized gain/(loss) | 0.03 | (0.51) | (1.33) | 0.26 | 0.44 |
Total from Investment Operations | 0.22 | (0.36) | (1.21) | 0.43 | 0.58 |
Less Dividends and Distributions: | |||||
Dividends (from net investment income) | — | (0.69) | (0.12) | (0.44) | (0.30) |
Distributions (from capital gains) | — | — | — | — | (0.03) |
Return of capital | (0.19) | — | — | — | — |
Total Dividends and Distributions | (0.19) | (0.69) | (0.12) | (0.44) | (0.33) |
Net Asset Value, End of Period | $7.58 | $7.55 | $8.60 | $9.93 | $9.94 |
Total Return* | 2.98% | (4.20)% | (12.28)% | 4.30% | 6.07% |
Net Assets, End of Period (in thousands) | $43,893 | $62,774 | $81,662 | $116,629 | $59,079 |
Ratios to Average Net Assets**: | |||||
Ratio of Gross Expenses | 1.02% | 1.00% | 0.93% | 0.92% | 0.94% |
Ratio of Net Expenses (After Waivers and Expense Offsets) | 0.80% | 0.80% | 0.83% | 0.83% | 0.90% |
Ratio of Net Investment Income/(Loss) | 2.46% | 1.90% | 1.25% | 1.69% | 1.45% |
Portfolio Turnover Rate | 29% | 60% | 86% | 37% | 88% |
* | Total return includes adjustments in accordance with generally accepted accounting principles required at the year or period end and are not annualized for periods of less than one full year. Returns shown exclude any applicable sales charges. |
** | Annualized for periods of less than one full year. |
(1) | Per share amounts are calculated based on average shares outstanding during the year or period. |
Financial Highlights
Class C Shares | |||||
For a share outstanding during the year ended June 30 | 2024 | 2023 | 2022 | 2021 | 2020 |
Net Asset Value, Beginning of Period | $7.49 | $8.54 | $9.85 | $9.87 | $9.63 |
Income/(Loss) from Investment Operations: | |||||
Net investment income/(loss)(1) | 0.13 | 0.09 | 0.05 | 0.10 | 0.07 |
Net realized and unrealized gain/(loss) | 0.04 | (0.51) | (1.31) | 0.24 | 0.43 |
Total from Investment Operations | 0.17 | (0.42) | (1.26) | 0.34 | 0.50 |
Less Dividends and Distributions: | |||||
Dividends (from net investment income) | — | (0.63) | (0.05) | (0.36) | (0.23) |
Distributions (from capital gains) | — | — | — | — | (0.03) |
Return of capital | (0.14) | — | — | — | — |
Total Dividends and Distributions | (0.14) | (0.63) | (0.05) | (0.36) | (0.26) |
Net Asset Value, End of Period | $7.52 | $7.49 | $8.54 | $9.85 | $9.87 |
Total Return* | 2.24% | (4.94)% | (12.83)% | 3.47% | 5.26% |
Net Assets, End of Period (in thousands) | $10,532 | $17,016 | $26,901 | $36,918 | $37,641 |
Ratios to Average Net Assets**: | |||||
Ratio of Gross Expenses | 1.66% | 1.64% | 1.59% | 1.60% | 1.64% |
Ratio of Net Expenses (After Waivers and Expense Offsets) | 1.53% | 1.55% | 1.54% | 1.55% | 1.62% |
Ratio of Net Investment Income/(Loss) | 1.73% | 1.11% | 0.54% | 0.99% | 0.74% |
Portfolio Turnover Rate | 29% | 60% | 86% | 37% | 88% |
* | Total return includes adjustments in accordance with generally accepted accounting principles required at the year or period end and are not annualized for periods of less than one full year. Returns shown exclude any applicable sales charges. |
** | Annualized for periods of less than one full year. |
(1) | Per share amounts are calculated based on average shares outstanding during the year or period. |
Financial Highlights
Class D Shares | |||||
For a share outstanding during the year ended June 30 | 2024 | 2023 | 2022 | 2021 | 2020 |
Net Asset Value, Beginning of Period | $7.54 | $8.60 | $9.92 | $9.93 | $9.69 |
Income/(Loss) from Investment Operations: | |||||
Net investment income/(loss)(1) | 0.20 | 0.16 | 0.13 | 0.19 | 0.16 |
Net realized and unrealized gain/(loss) | 0.03 | (0.52) | (1.31) | 0.25 | 0.43 |
Total from Investment Operations | 0.23 | (0.36) | (1.18) | 0.44 | 0.59 |
Less Dividends and Distributions: | |||||
Dividends (from net investment income) | — | (0.70) | (0.14) | (0.45) | (0.32) |
Distributions (from capital gains) | — | — | — | — | (0.03) |
Return of capital | (0.20) | — | — | — | — |
Total Dividends and Distributions | (0.20) | (0.70) | (0.14) | (0.45) | (0.35) |
Net Asset Value, End of Period | $7.57 | $7.54 | $8.60 | $9.92 | $9.93 |
Total Return* | 3.11% | (4.21)% | (12.06)% | 4.43% | 6.17% |
Net Assets, End of Period (in thousands) | $29,135 | $26,217 | $29,812 | $39,211 | $30,219 |
Ratios to Average Net Assets**: | |||||
Ratio of Gross Expenses | 0.78% | 0.75% | 0.69% | 0.70% | 0.75% |
Ratio of Net Expenses (After Waivers and Expense Offsets) | 0.69% | 0.69% | 0.68% | 0.69% | 0.73% |
Ratio of Net Investment Income/(Loss) | 2.61% | 2.03% | 1.40% | 1.86% | 1.65% |
Portfolio Turnover Rate | 29% | 60% | 86% | 37% | 88% |
* | Total return includes adjustments in accordance with generally accepted accounting principles required at the year or period end and are not annualized for periods of less than one full year. |
** | Annualized for periods of less than one full year. |
(1) | Per share amounts are calculated based on average shares outstanding during the year or period. |
Financial Highlights
Class I Shares | |||||
For a share outstanding during the year ended June 30 | 2024 | 2023 | 2022 | 2021 | 2020 |
Net Asset Value, Beginning of Period | $7.52 | $8.57 | $9.89 | $9.91 | $9.66 |
Income/(Loss) from Investment Operations: | |||||
Net investment income/(loss)(1) | 0.20 | 0.17 | 0.14 | 0.19 | 0.17 |
Net realized and unrealized gain/(loss) | 0.03 | (0.51) | (1.31) | 0.25 | 0.43 |
Total from Investment Operations | 0.23 | (0.34) | (1.17) | 0.44 | 0.60 |
Less Dividends and Distributions: | |||||
Dividends (from net investment income) | — | (0.71) | (0.15) | (0.46) | (0.32) |
Distributions (from capital gains) | — | — | — | — | (0.03) |
Return of capital | (0.21) | — | — | — | — |
Total Dividends and Distributions | (0.21) | (0.71) | (0.15) | (0.46) | (0.35) |
Net Asset Value, End of Period | $7.54 | $7.52 | $8.57 | $9.89 | $9.91 |
Total Return* | 3.10% | (3.98)% | (12.01)% | 4.46% | 6.36% |
Net Assets, End of Period (in thousands) | $822,179 | $1,263,864 | $1,894,294 | $2,151,534 | $1,348,740 |
Ratios to Average Net Assets**: | |||||
Ratio of Gross Expenses | 0.72% | 0.69% | 0.64% | 0.65% | 0.68% |
Ratio of Net Expenses (After Waivers and Expense Offsets) | 0.58% | 0.58% | 0.58% | 0.58% | 0.65% |
Ratio of Net Investment Income/(Loss) | 2.69% | 2.07% | 1.52% | 1.94% | 1.71% |
Portfolio Turnover Rate | 29% | 60% | 86% | 37% | 88% |
* | Total return includes adjustments in accordance with generally accepted accounting principles required at the year or period end and are not annualized for periods of less than one full year. |
** | Annualized for periods of less than one full year. |
(1) | Per share amounts are calculated based on average shares outstanding during the year or period. |
Financial Highlights
Class N Shares | |||||
For a share outstanding during the year ended June 30 | 2024 | 2023 | 2022 | 2021 | 2020 |
Net Asset Value, Beginning of Period | $7.52 | $8.57 | $9.90 | $9.91 | $9.67 |
Income/(Loss) from Investment Operations: | |||||
Net investment income/(loss)(1) | 0.21 | 0.17 | 0.15 | 0.19 | 0.18 |
Net realized and unrealized gain/(loss) | 0.03 | (0.51) | (1.33) | 0.26 | 0.42 |
Total from Investment Operations | 0.24 | (0.34) | (1.18) | 0.45 | 0.60 |
Less Dividends and Distributions: | |||||
Dividends (from net investment income) | — | (0.71) | (0.15) | (0.46) | (0.33) |
Distributions (from capital gains) | — | — | — | — | (0.03) |
Return of capital | (0.21) | — | — | — | — |
Total Dividends and Distributions | (0.21) | (0.71) | (0.15) | (0.46) | (0.36) |
Net Asset Value, End of Period | $7.55 | $7.52 | $8.57 | $9.90 | $9.91 |
Total Return* | 3.24% | (4.00)% | (12.06)% | 4.58% | 6.32% |
Net Assets, End of Period (in thousands) | $167,127 | $124,577 | $126,445 | $69,800 | $31,829 |
Ratios to Average Net Assets**: | |||||
Ratio of Gross Expenses | 0.61% | 0.59% | 0.55% | 0.56% | 0.61% |
Ratio of Net Expenses (After Waivers and Expense Offsets) | 0.58% | 0.58% | 0.55% | 0.56% | 0.59% |
Ratio of Net Investment Income/(Loss) | 2.77% | 2.16% | 1.59% | 1.94% | 1.82% |
Portfolio Turnover Rate | 29% | 60% | 86% | 37% | 88% |
* | Total return includes adjustments in accordance with generally accepted accounting principles required at the year or period end and are not annualized for periods of less than one full year. |
** | Annualized for periods of less than one full year. |
(1) | Per share amounts are calculated based on average shares outstanding during the year or period. |
Financial Highlights
Class S Shares | |||||
For a share outstanding during the year ended June 30 | 2024 | 2023 | 2022 | 2021 | 2020 |
Net Asset Value, Beginning of Period | $7.54 | $8.59 | $9.91 | $9.93 | $9.69 |
Income/(Loss) from Investment Operations: | |||||
Net investment income/(loss)(1) | 0.17 | 0.14 | 0.10 | 0.15 | 0.13 |
Net realized and unrealized gain/(loss) | 0.03 | (0.51) | (1.32) | 0.25 | 0.42 |
Total from Investment Operations | 0.20 | (0.37) | (1.22) | 0.40 | 0.55 |
Less Dividends and Distributions: | |||||
Dividends (from net investment income) | — | (0.68) | (0.10) | (0.42) | (0.28) |
Distributions (from capital gains) | — | — | — | — | (0.03) |
Return of capital | (0.17) | — | — | — | — |
Total Dividends and Distributions | (0.17) | (0.68) | (0.10) | (0.42) | (0.31) |
Net Asset Value, End of Period | $7.57 | $7.54 | $8.59 | $9.91 | $9.93 |
Total Return* | 2.70% | (4.42)% | (12.38)% | 3.99% | 5.83% |
Net Assets, End of Period (in thousands) | $184 | $470 | $585 | $527 | $224 |
Ratios to Average Net Assets**: | |||||
Ratio of Gross Expenses | 2.10% | 1.64% | 1.50% | 1.62% | 2.55% |
Ratio of Net Expenses (After Waivers and Expense Offsets) | 1.05% | 1.04% | 1.03% | 1.02% | 1.06% |
Ratio of Net Investment Income/(Loss) | 2.17% | 1.67% | 1.06% | 1.50% | 1.31% |
Portfolio Turnover Rate | 29% | 60% | 86% | 37% | 88% |
* | Total return includes adjustments in accordance with generally accepted accounting principles required at the year or period end and are not annualized for periods of less than one full year. |
** | Annualized for periods of less than one full year. |
(1) | Per share amounts are calculated based on average shares outstanding during the year or period. |
Financial Highlights
Class T Shares | |||||
For a share outstanding during the year ended June 30 | 2024 | 2023 | 2022 | 2021 | 2020 |
Net Asset Value, Beginning of Period | $7.54 | $8.59 | $9.91 | $9.93 | $9.68 |
Income/(Loss) from Investment Operations: | |||||
Net investment income/(loss)(1) | 0.18 | 0.15 | 0.13 | 0.17 | 0.15 |
Net realized and unrealized gain/(loss) | 0.03 | (0.51) | (1.32) | 0.25 | 0.44 |
Total from Investment Operations | 0.21 | (0.36) | (1.19) | 0.42 | 0.59 |
Less Dividends and Distributions: | |||||
Dividends (from net investment income) | — | (0.69) | (0.13) | (0.44) | (0.31) |
Distributions (from capital gains) | — | — | — | — | (0.03) |
Return of capital | (0.19) | — | — | — | — |
Total Dividends and Distributions | (0.19) | (0.69) | (0.13) | (0.44) | (0.34) |
Net Asset Value, End of Period | $7.56 | $7.54 | $8.59 | $9.91 | $9.93 |
Total Return* | 2.84% | (4.22)% | (12.17)% | 4.23% | 6.17% |
Net Assets, End of Period (in thousands) | $21,942 | $36,795 | $74,856 | $118,467 | $100,323 |
Ratios to Average Net Assets**: | |||||
Ratio of Gross Expenses | 0.86% | 0.83% | 0.78% | 0.81% | 0.84% |
Ratio of Net Expenses (After Waivers and Expense Offsets) | 0.81% | 0.82% | 0.77% | 0.79% | 0.83% |
Ratio of Net Investment Income/(Loss) | 2.44% | 1.81% | 1.31% | 1.74% | 1.52% |
Portfolio Turnover Rate | 29% | 60% | 86% | 37% | 88% |
* | Total return includes adjustments in accordance with generally accepted accounting principles required at the year or period end and are not annualized for periods of less than one full year. |
** | Annualized for periods of less than one full year. |
(1) | Per share amounts are calculated based on average shares outstanding during the year or period. |
Notes to Financial Statements
Average Daily Net Assets of the Fund | Contractual Investment Advisory Fee (%) |
First $1 Billion | 0.55 |
Next $500 Million | 0.50 |
Above $1.5 Billion | 0.45 |
Notes to Financial Statements
Average Daily Net Assets of Class D Shares of the Janus Henderson funds | Administrative Services Fee |
Under $40 billion | 0.12% |
$40 billion — $49.9 billion | 0.10% |
Over $49.9 billion | 0.08% |
Notes to Financial Statements
Class | % of Class Owned | % of Fund Owned |
Class A Shares | - % | - % |
Class C Shares | - | - |
Class D Shares | - | - |
Class I Shares | - | - |
Class N Shares | 39 | 6 |
Class S Shares | - | - |
Class T Shares | - | - |
Undistributed Ordinary Income | Undistributed Long-Term Gains | Accumulated Capital Losses | Loss Deferrals | Other Book to Tax Differences | Net Tax Appreciation/ (Depreciation) |
$- | $- | $(425,903,569) | $(30,713,444) | $942,571 | $(82,691,461) |
Notes to Financial Statements
Capital Loss Carryover Schedule | ||
For the year ended June 30, 2024 | ||
No Expiration | ||
Short-Term | Long-Term | Accumulated Capital Losses |
$(229,391,799) | $(196,511,770) | $(425,903,569) |
Federal Tax Cost | Unrealized Appreciation | Unrealized (Depreciation) | Net Tax Appreciation/ (Depreciation) |
$1,159,372,494 | $5,444,462 | $(88,135,923) | $(82,691,461) |
Federal Tax Cost | Unrealized Appreciation | Unrealized (Depreciation) | Net Tax Appreciation/ (Depreciation) |
$474,133 | $873,657 | $- | $873,657 |
For the year ended June 30, 2024 | |||
Distributions | |||
From Ordinary Income | From Long-Term Capital Gains | Tax Return of Capital | Net Investment Loss |
$- | $- | $36,582,441 | $25,998,702 |
For the year ended June 30, 2023 | |||
Distributions | |||
From Ordinary Income | From Long-Term Capital Gains | Tax Return of Capital | Net Investment Loss |
$151,233,489 | $- | $- | $- |
Notes to Financial Statements
Year ended June 30, 2024 | Year ended June 30, 2023 | |||
Shares | Amount | Shares | Amount | |
Class A Shares: | ||||
Shares sold | 1,040,379 | $7,835,548 | 1,825,554 | $14,740,687 |
Reinvested dividends and distributions | 145,712 | 1,099,241 | 652,142 | 5,051,901 |
Shares repurchased | (3,707,847) | (27,799,440) | (3,656,662) | (29,898,015) |
Net Increase/(Decrease) | (2,521,756) | $(18,864,651) | (1,178,966) | $(10,105,427) |
Class C Shares: | ||||
Shares sold | 286,424 | $2,143,791 | 215,007 | $1,727,806 |
Reinvested dividends and distributions | 29,610 | 221,872 | 195,316 | 1,497,608 |
Shares repurchased | (1,186,396) | (8,903,561) | (1,288,629) | (10,309,251) |
Net Increase/(Decrease) | (870,362) | $(6,537,898) | (878,306) | $(7,083,837) |
Class D Shares: | ||||
Shares sold | 1,743,845 | $13,191,171 | 477,478 | $3,798,154 |
Reinvested dividends and distributions | 92,387 | 697,459 | 286,006 | 2,216,282 |
Shares repurchased | (1,462,915) | (11,012,211) | (756,072) | (6,049,801) |
Net Increase/(Decrease) | 373,317 | $2,876,419 | 7,412 | $(35,365) |
Class I Shares: | ||||
Shares sold | 43,046,418 | $323,972,067 | 95,536,255 | $778,007,707 |
Reinvested dividends and distributions | 3,642,548 | 27,385,493 | 15,329,937 | 118,519,077 |
Shares repurchased | (105,813,392) | (794,859,426) | (163,752,700) | (1,324,933,832) |
Net Increase/(Decrease) | (59,124,426) | $(443,501,866) | (52,886,508) | $(428,407,048) |
Class N Shares: | ||||
Shares sold | 18,704,920 | $141,558,018 | 6,992,628 | $55,766,678 |
Reinvested dividends and distributions | 570,043 | 4,291,342 | 1,243,015 | 9,607,045 |
Shares repurchased | (13,690,769) | (103,648,989) | (6,420,382) | (52,193,097) |
Net Increase/(Decrease) | 5,584,194 | $42,200,371 | 1,815,261 | $13,180,626 |
Class S Shares: | ||||
Shares sold | 2,118 | $15,925 | 2,505 | $20,204 |
Reinvested dividends and distributions | 826 | 6,223 | 5,451 | 42,120 |
Shares repurchased | (40,964) | (301,986) | (13,706) | (112,771) |
Net Increase/(Decrease) | (38,020) | $(279,838) | (5,750) | $(50,447) |
Class T Shares: | ||||
Shares sold | 535,916 | $4,035,380 | 1,829,763 | $14,844,807 |
Reinvested dividends and distributions | 88,769 | 668,669 | 559,121 | 4,332,015 |
Shares repurchased | (2,605,196) | (19,660,782) | (6,221,943) | (49,849,879) |
Net Increase/(Decrease) | (1,980,511) | $(14,956,733) | (3,833,059) | $(30,673,057) |
Purchases of Securities | Proceeds from Sales of Securities | Purchases of Long- Term U.S. Government Obligations | Proceeds from Sales of Long-Term U.S. Government Obligations |
$295,137,658 | $749,387,894 | $80,673,596 | $39,793,454 |
Report of Independent Registered Public Accounting Firm
August 22, 2024
Designation Requirements (unaudited)
Return of Capital Distributions | $36,582,441 |
Additional Information (unaudited)
Schedule of Investments
June 30, 2024
Shares or Principal Amounts | Value | ||
Asset-Backed/Commercial Mortgage-Backed Securities – 30.4% | |||
208 Park Avenue Mortgage Trust 2017-280P, CME Term SOFR 1 Month + 1.1800%, 6.5070%, 9/15/34ž,‡ | $4,050,930 | $3,867,061 | |
A&D Mortgage Trust 2023-NQM2 A1, 6.1320%, 5/25/68ž,Ç | 4,417,648 | 4,385,226 | |
ACC Auto Trust 2022-A A, 4.5800%, 7/15/26ž | 168,929 | 168,743 | |
Aimco 2020-11A AR, CME Term SOFR 3 Month + 1.3916%, 6.7087%, 10/17/34ž,‡ | 1,763,000 | 1,764,469 | |
Angel Oak Mortgage Trust I LLC 2019-5, 2.5930%, 10/25/49ž,‡ | 336,297 | 325,854 | |
Angel Oak Mortgage Trust I LLC 2019-6, Refinitiv USD IBOR Consumer Cash Fallbacks 1 Year + 0.9500%, 2.6200%, 11/25/59ž,‡ | 328,842 | 316,703 | |
Angel Oak Mortgage Trust I LLC 2020-2, Refinitiv USD IBOR Consumer Cash Fallbacks 1 Year + 2.2000%, 2.5310%, 1/26/65ž,‡ | 1,180,341 | 1,075,972 | |
Angel Oak Mortgage Trust I LLC 2020-3, Refinitiv USD IBOR Consumer Cash Fallbacks 1 Year + 1.0000%, 2.4100%, 4/25/65ž,‡ | 864,104 | 791,961 | |
Angel Oak Mortgage Trust I LLC 2024-3 A1, 4.8000%, 11/26/68ž,Ç | 1,211,055 | 1,172,991 | |
Angel Oak Mortgage Trust I LLC 2024-5 A1, 4.9500%, 7/25/68ž,Ç | 6,803,396 | 6,603,384 | |
Angel Oak Mortgage Trust I LLC 2024-6 A1, 4.6500%, 11/25/67ž,Ç | 4,659,000 | 4,493,332 | |
Aqua Finance Trust 2021-A A, 1.5400%, 7/17/46ž | 1,371,303 | 1,234,477 | |
ARES CLO Ltd 2016-39A AR3, CME Term SOFR 3 Month + 1.4200%, 6.7498%, 7/20/37ž,‡ | 5,206,062 | 5,218,343 | |
ARES CLO Ltd 2021-60A A, CME Term SOFR 3 Month + 1.3816%, 6.7085%, 7/18/34ž,‡ | 1,486,000 | 1,488,446 | |
Arivo Acceptance Auto Loan Receivables 2022-1A A, 3.9300%, 5/15/28ž | 710,405 | 701,350 | |
Babson CLO Ltd 2018-3A A1, CME Term SOFR 3 Month + 1.2116%, 6.5362%, 7/20/29ž,‡ | 387,758 | 387,740 | |
Babson CLO Ltd 2019-3A A1R, CME Term SOFR 3 Month + 1.3316%, 6.6562%, 4/21/31ž,‡ | 6,351,000 | 6,356,360 | |
Ballyrock Ltd 2020-14A A1AR, CME Term SOFR 3 Month + 1.3800%, 0%, 7/20/37ž,‡ | 8,303,920 | 8,303,920 | |
Ballyrock Ltd 2020-14A A1BR, CME Term SOFR 3 Month + 1.5800%, 0%, 7/20/37ž,‡ | 1,159,727 | 1,159,727 | |
BAMLL Commercial Mortgage Securities Trust 2024-FRR2 E, 1.2731%, 7/27/50ž,‡ | 1,774,000 | 1,237,886 | |
BAMLL Commercial Mortgage Securities Trust 2024-FRR3 C, 0.6638%, 1/27/50ž,‡ | 2,013,267 | 1,692,552 | |
BAMLL Commercial Mortgage Securities Trust 2024-FRR3 D, 0.5906%, 1/27/50ž,‡ | 1,647,399 | 1,342,843 | |
BAMLL Commercial Mortgage Securities Trust 2024-FRR3 E, 0.5069%, 1/27/50ž,‡ | 2,396,255 | 1,900,316 | |
Barclays Commercial Mortgage Securities LLC 2015-SRCH, 4.1970%, 8/10/35ž | 9,721,000 | 8,991,716 | |
Benefit Street Partners CLO Ltd 2018-15A A1R, CME Term SOFR 3 Month + 1.3900%, 0%, 7/15/37ž,‡ | 5,023,000 | 5,023,000 | |
BPR Trust 2022-OANA A, CME Term SOFR 1 Month + 1.8980%, 7.2268%, 4/15/37ž,‡ | 7,374,000 | 7,376,560 | |
BPR Trust 2023-BRK2 A, 7.1465%, 10/5/38ž,‡ | 6,286,000 | 6,517,660 | |
Brean Asset Backed Securities Trust 2024-RM8 A1, 4.5000%, 5/25/64ž | 4,546,702 | 4,244,570 | |
BX Commercial Mortgage Trust 2019-MMP C, CME Term SOFR 1 Month + 1.4940%, 6.8230%, 8/15/36ž,‡ | 1,454,720 | 1,423,994 | |
BX Commercial Mortgage Trust 2019-OC11, 3.6050%, 12/9/41ž | 2,160,000 | 1,922,002 | |
BX Commercial Mortgage Trust 2019-OC11, 3.8560%, 12/9/41ž | 4,295,000 | 3,816,499 | |
BX Commercial Mortgage Trust 2020-VKNG A, CME Term SOFR 1 Month + 1.0445%, 6.3735%, 10/15/37ž,‡ | 1,012,642 | 1,006,946 | |
BX Commercial Mortgage Trust 2021-LBA AJV, CME Term SOFR 1 Month + 0.9145%, 6.2435%, 2/15/36ž,‡ | 5,348,000 | 5,283,338 | |
BX Commercial Mortgage Trust 2021-LBA AV, CME Term SOFR 1 Month + 0.9145%, 6.2435%, 2/15/36ž,‡ | 4,808,914 | 4,747,902 | |
BX Commercial Mortgage Trust 2021-VINO A, CME Term SOFR 1 Month + 0.7668%, 6.0958%, 5/15/38ž,‡ | 1,061,961 | 1,048,418 | |
BX Commercial Mortgage Trust 2021-VOLT B, CME Term SOFR 1 Month + 1.0645%, 6.3933%, 9/15/36ž,‡ | 6,188,000 | 6,097,470 |
Schedule of Investments
June 30, 2024
Shares or Principal Amounts | Value | ||
Asset-Backed/Commercial Mortgage-Backed Securities – (continued) | |||
BX Commercial Mortgage Trust 2021-VOLT D, CME Term SOFR 1 Month + 1.7645%, 7.0933%, 9/15/36ž,‡ | $6,499,000 | $6,417,137 | |
BX Commercial Mortgage Trust 2022-FOX2 A2, CME Term SOFR 1 Month + 0.7492%, 6.0780%, 4/15/39ž,‡ | 5,005,535 | 4,925,782 | |
BX Commercial Mortgage Trust 2023-VLT3 A, CME Term SOFR 1 Month + 1.9400%, 7.2688%, 11/15/28ž,‡ | 5,526,864 | 5,485,463 | |
BX Commercial Mortgage Trust 2023-VLT3 B, CME Term SOFR 1 Month + 2.6890%, 8.0178%, 11/15/28ž,‡ | 4,740,391 | 4,669,369 | |
BX Commercial Mortgage Trust 2024-VLT4 A, CME Term SOFR 1 Month + 1.4914%, 6.8114%, 7/16/29ž,‡ | 6,380,507 | 6,358,215 | |
CBAM CLO Management 2019-11RA A1, CME Term SOFR 3 Month + 1.4416%, 6.7662%, 1/22/35ž,‡ | 7,300,000 | 7,302,840 | |
CBAM CLO Management 2019-11RA B, CME Term SOFR 3 Month + 2.0116%, 7.3362%, 1/22/35ž,‡ | 2,775,193 | 2,777,816 | |
Cedar Funding Ltd 2019-11A A1R, CME Term SOFR 3 Month + 1.3116%, 6.6545%, 5/31/32ž,‡ | 5,305,000 | 5,306,602 | |
CENT Trust 2023-CITY A, CME Term SOFR 1 Month + 2.6200%, 7.9488%, 9/15/38ž,‡ | 6,425,000 | 6,453,156 | |
CF Hippolyta Issuer LLC 2021-1A A1, 1.5300%, 3/15/61ž | 7,105,112 | 6,500,285 | |
CF Hippolyta Issuer LLC 2021-1A B1, 1.9800%, 3/15/61ž | 2,608,695 | 2,331,673 | |
CF Hippolyta Issuer LLC 2022-1A A1, 5.9700%, 8/15/62ž | 5,421,195 | 5,345,940 | |
CF Hippolyta Issuer LLC 2022-1A A2, 6.1100%, 8/15/62ž | 15,903,775 | 15,542,574 | |
Chase Auto Credit Linked Notes 2021-2 B, 0.8890%, 12/26/28ž | 403,573 | 399,030 | |
Chase Mortgage Finance Corp 2021-CL1 M1, US 30 Day Average SOFR + 1.2000%, 6.5354%, 2/25/50ž,‡ | 2,865,000 | 2,764,388 | |
CIFC Funding Ltd 2014-5A A1R3, CME Term SOFR 3 Month + 1.3800%, 0%, 7/17/37ž,‡ | 9,129,000 | 9,129,000 | |
CIFC Funding Ltd 2021-4A A, CME Term SOFR 3 Month + 1.3116%, 6.6402%, 7/15/33ž,‡ | 5,567,595 | 5,574,181 | |
CIFC Funding Ltd 2021-7A B, CME Term SOFR 3 Month + 1.8616%, 7.1880%, 1/23/35ž,‡ | 2,232,376 | 2,234,599 | |
CIM Trust 2021-NR1 A1, 5.5690%, 7/25/55ž,Ç | 1,838,261 | 1,812,934 | |
CIM Trust 2021-NR4 A1, 2.8160%, 10/25/61ž,Ç | 1,084,021 | 1,054,395 | |
Cold Storage Trust 2020-ICE5 A, CME Term SOFR 1 Month + 1.0145%, 6.3415%, 11/15/37ž,‡ | 10,993,766 | 10,958,960 | |
Cold Storage Trust 2020-ICE5 B, CME Term SOFR 1 Month + 1.4145%, 6.7415%, 11/15/37ž,‡ | 4,888,412 | 4,869,211 | |
Cold Storage Trust 2020-ICE5 C, CME Term SOFR 1 Month + 1.7645%, 7.0915%, 11/15/37ž,‡ | 4,906,106 | 4,892,632 | |
COLT Funding LLC 2020-3, Refinitiv USD IBOR Consumer Cash Fallbacks 1 Year + 1.2000%, 1.5060%, 4/27/65ž,‡ | 259,937 | 246,772 | |
COMM Mortgage Trust 2024-WCL1 A, CME Term SOFR 1 Month + 1.8410%, 7.1410%, 6/17/41ž,‡ | 6,351,784 | 6,321,322 | |
Connecticut Avenue Securities Trust 2021-R02 2M2, US 30 Day Average SOFR + 2.0000%, 7.3354%, 11/25/41ž,‡ | 8,533,255 | 8,585,381 | |
Connecticut Avenue Securities Trust 2021-R03 1M1, US 30 Day Average SOFR + 0.8500%, 6.1854%, 12/25/41ž,‡ | 1,498,207 | 1,496,334 | |
Connecticut Avenue Securities Trust 2021-R03 1M2, US 30 Day Average SOFR + 1.6500%, 6.9854%, 12/25/41ž,‡ | 3,943,000 | 3,965,019 | |
Connecticut Avenue Securities Trust 2022-R01 1B1, US 30 Day Average SOFR + 3.1500%, 8.4854%, 12/25/41ž,‡ | 6,109,000 | 6,276,848 | |
Connecticut Avenue Securities Trust 2022-R03 1M1, US 30 Day Average SOFR + 2.1000%, 7.4354%, 3/25/42ž,‡ | 2,758,771 | 2,800,686 | |
Connecticut Avenue Securities Trust 2022-R05 2M1, US 30 Day Average SOFR + 1.9000%, 7.2354%, 4/25/42ž,‡ | 382,779 | 385,947 | |
Connecticut Avenue Securities Trust 2023-R03 2M1, US 30 Day Average SOFR + 2.5000%, 7.8354%, 4/27/43ž,‡ | 3,118,799 | 3,176,042 | |
Connecticut Avenue Securities Trust 2023-R06 1M1, US 30 Day Average SOFR + 1.7000%, 7.0354%, 7/27/43ž,‡ | 3,419,747 | 3,443,024 |
Schedule of Investments
June 30, 2024
Shares or Principal Amounts | Value | ||
Asset-Backed/Commercial Mortgage-Backed Securities – (continued) | |||
Connecticut Avenue Securities Trust 2023-R07 2M1, US 30 Day Average SOFR + 1.9500%, 7.2850%, 9/25/43ž,‡ | $1,542,063 | $1,553,879 | |
Connecticut Avenue Securities Trust 2023-R08 1M1, US 30 Day Average SOFR + 1.5000%, 6.8354%, 10/26/43ž,‡ | 3,034,644 | 3,052,398 | |
Connecticut Avenue Securities Trust 2024-R01 1M1, US 30 Day Average SOFR + 1.0500%, 6.3854%, 1/25/44ž,‡ | 2,751,508 | 2,751,505 | |
Connecticut Avenue Securities Trust 2024-R03 2M1, US 30 Day Average SOFR + 1.1500%, 6.4850%, 3/25/44ž,‡ | 1,670,760 | 1,670,758 | |
Connecticut Avenue Securities Trust 2024-R04 1M1, US 30 Day Average SOFR + 1.1000%, 6.4237%, 5/25/44ž,‡ | 2,568,480 | 2,568,477 | |
CP EF Asset Securitization I LLC 2002-1A A, 5.9600%, 4/15/30ž | 888,412 | 887,098 | |
CPF IV LLC / CP EF Asset Securitization LLC 2023-1A A, 7.4800%, 3/15/32ž | 2,637,368 | 2,663,907 | |
CRB Securitization Trust 2023-1 A, 6.9600%, 10/20/33ž | 989,903 | 995,708 | |
CyrusOne Data Centers Issuer I LLC 2023-2A A2, 5.5600%, 11/20/48ž | 6,288,000 | 6,146,920 | |
CyrusOne Data Centers Issuer I LLC 2024-1A A2, 4.7600%, 3/22/49ž | 2,520,871 | 2,374,021 | |
CyrusOne Data Centers Issuer I LLC 2024-3A A2, 4.6500%, 5/20/49ž | 7,528,000 | 6,817,804 | |
DATA Mortgage Trust 2024-CTR2 A, 5.4756%, 5/10/46ž,‡ | 887,107 | 870,857 | |
DC Commercial Mortgage Trust 2023-DC A, 6.3143%, 9/12/40ž | 5,277,000 | 5,413,654 | |
DC Commercial Mortgage Trust 2023-DC B, 6.8043%, 9/12/40ž | 5,000,717 | 5,103,112 | |
Diamond Infrastructure Funding LLC 2021-1A A, 1.7600%, 4/15/49ž | 7,083,000 | 6,390,433 | |
Elmwood CLO VI Ltd 2020-3A ARR, CME Term SOFR 3 Month + 1.3800%, 0%, 7/20/37ž,‡ | 10,125,000 | 10,125,000 | |
Elmwood CLO VIII Ltd 2019-2A AR, CME Term SOFR 3 Month + 1.4116%, 6.7362%, 4/20/34ž,‡ | 2,239,000 | 2,242,934 | |
Exeter Automobile Receivables Trust 2021-1A D, 1.0800%, 11/16/26 | 2,295,957 | 2,241,327 | |
Fannie Mae REMICS, 3.0000%, 5/25/48 | 4,154,707 | 3,696,677 | |
Fannie Mae REMICS, 3.0000%, 11/25/49 | 5,435,073 | 4,756,078 | |
FIGRE Trust 2024-HE1 A, 6.1650%, 3/25/54ž,‡ | 3,057,388 | 3,049,620 | |
FIGRE Trust 2024-HE2 A, 6.3800%, 5/25/54ž,‡ | 2,647,687 | 2,655,601 | |
Flagstar Mortgage Trust 2021-13IN A2, 3.0000%, 12/30/51ž,‡ | 8,093,422 | 6,798,908 | |
Freddie Mac - SLST 2020-2 M1, 4.7500%, 9/25/60ž,‡ | 1,290,280 | 1,249,029 | |
Freddie Mac Structured Agency Credit Risk Debt Notes 2021-DNA6 M1, US 30 Day Average SOFR + 0.8000%, 6.1354%, 10/25/41ž,‡ | 1,455,707 | 1,454,809 | |
Freddie Mac Structured Agency Credit Risk Debt Notes 2021-HQA3 M2, US 30 Day Average SOFR + 2.1000%, 7.4354%, 9/25/41ž,‡ | 1,319,182 | 1,326,635 | |
Freddie Mac Structured Agency Credit Risk Debt Notes 2021-HQA4 M2, US 30 Day Average SOFR + 2.3500%, 7.6854%, 12/25/41ž,‡ | 7,413,000 | 7,499,310 | |
Freddie Mac Structured Agency Credit Risk Debt Notes 2022-HQA1 M1A, US 30 Day Average SOFR + 2.1000%, 7.4354%, 3/25/42ž,‡ | 5,687,416 | 5,738,574 | |
Freddie Mac Structured Agency Credit Risk Debt Notes 2023-DNA2 M1A, US 30 Day Average SOFR + 2.1000%, 7.4350%, 4/27/43ž,‡ | 1,746,845 | 1,779,684 | |
Freddie Mac Structured Agency Credit Risk Debt Notes 2023-HQA2 M1A, US 30 Day Average SOFR + 2.0000%, 7.3354%, 6/25/43ž,‡ | 406,097 | 408,783 | |
Freddie Mac Structured Agency Credit Risk Debt Notes 2023-HQA3 M1, US 30 Day Average SOFR + 1.8500%, 7.1854%, 11/25/43ž,‡ | 2,797,749 | 2,835,271 | |
Freddie Mac Structured Agency Credit Risk Debt Notes 2024-DNA2 M1, US 30 Day Average SOFR + 1.2000%, 6.5354%, 5/25/44ž,‡ | 3,678,854 | 3,685,006 | |
FREMF Mortgage Trust 2017-K729 D, 0%, 11/25/49ž,◊ | 2,852,700 | 2,727,902 | |
FREMF Mortgage Trust 2017-K729 X2A, 0.1000%, 11/25/49ž,¤ | 21,366,586 | 3,628 | |
FREMF Mortgage Trust 2017-K729 X2B, 0.1000%, 11/25/49ž,¤ | 7,178,264 | 2,019 | |
GCAT 2022-INV1 A1, 3.0000%, 12/25/51ž,‡ | 13,903,450 | 11,534,474 | |
GCAT 2023-INV1 A1, 6.0000%, 8/25/53ž,‡ | 6,441,936 | 6,396,010 | |
GCAT 2024-INV1 2A2, 6.5000%, 1/25/54ž,‡ | 6,488,266 | 6,515,529 | |
Gracie Point International Funding 2024-1A A, US 90 Day Average SOFR + 1.7000%, 7.0496%, 3/1/28ž,‡ | 1,985,000 | 1,992,782 | |
Great Wolf Trust 2024-WLF2 A, CME Term SOFR 1 Month + 1.6912%, 7.0201%, 5/15/41ž,‡ | 7,775,000 | 7,763,367 | |
Highbridge Loan Management Ltd 2021-16A B, CME Term SOFR 3 Month + 1.9616%, 7.2880%, 1/23/35ž,‡ | 2,113,425 | 2,113,425 | |
Homeward Opportunities Fund I Trust 2024-RTL1 A1, 7.1200%, 7/25/29ž | 6,504,000 | 6,502,000 |
Schedule of Investments
June 30, 2024
Shares or Principal Amounts | Value | ||
Asset-Backed/Commercial Mortgage-Backed Securities – (continued) | |||
Hudson's Bay Simon JV Trust 2015-HB10 A10, 4.1545%, 8/5/34ž | $1,475,000 | $1,392,874 | |
Hudson's Bay Simon JV Trust 2015-HB7 A7, 3.9141%, 8/5/34ž | 1,307,130 | 1,281,599 | |
Imerial Fund LLC 2023-NQM1 A1, 5.9410%, 2/25/68ž,Ç | 3,019,741 | 2,993,429 | |
JP Morgan Chase Commercial Mortgage Sec Trust 2020-ACE A, 3.2865%, 1/10/37ž | 6,185,000 | 6,076,989 | |
JP Morgan Chase Commercial Mortgage Sec Trust 2020-ACE B, 3.6401%, 1/10/37ž | 4,370,000 | 4,258,341 | |
LAD Auto Receivables Trust 2021-1A A, 1.3000%, 8/17/26ž | 138,179 | 137,741 | |
LAD Auto Receivables Trust 2022-1A A, 5.2100%, 6/15/27ž | 1,852,220 | 1,845,761 | |
LBA Trust 2024-BOLT A, CME Term SOFR 1 Month + 1.5911%, 6.8911%, 6/15/26ž,‡ | 5,125,301 | 5,099,526 | |
Lendbuzz Securitization Trust 2021-1A A, 4.2200%, 5/17/27ž | 2,076,681 | 2,042,201 | |
Lendbuzz Securitization Trust 2023-1A A2, 6.9200%, 8/15/28ž | 1,736,465 | 1,746,775 | |
LHOME Mortgage Trust 2024-RTL2 A1, 7.1280%, 3/25/29ž,Ç | 1,668,736 | 1,680,782 | |
LHOME Mortgage Trust 2024-RTL3 A1, 6.9000%, 5/25/29ž | 2,098,285 | 2,099,767 | |
Life Financial Services Trust 2021-BMR A, CME Term SOFR 1 Month + 0.8145%, 6.1435%, 3/15/38ž,‡ | 11,607,895 | 11,398,803 | |
Life Financial Services Trust 2021-BMR C, CME Term SOFR 1 Month + 1.2145%, 6.5435%, 3/15/38ž,‡ | 6,486,620 | 6,311,915 | |
Life Financial Services Trust 2022-BMR2 A1, CME Term SOFR 1 Month + 1.2952%, 6.6241%, 5/16/39ž,‡ | 6,610,000 | 6,503,207 | |
M&T Equipment Notes 2023-1A A2, 6.0900%, 7/15/30ž | 2,028,575 | 2,029,329 | |
M&T Equipment Notes 2023-1A A3, 5.7400%, 7/15/30ž | 1,594,000 | 1,594,105 | |
Madison Park Funding Ltd 2019-35A A1R, CME Term SOFR 3 Month + 1.2516%, 6.5762%, 4/20/32ž,‡ | 7,174,000 | 7,181,239 | |
Marlette Funding Trust 2023-2A B, 6.5400%, 6/15/33ž | 1,710,000 | 1,719,532 | |
MED Trust 2021-MDLN E, CME Term SOFR 1 Month + 3.2645%, 8.5935%, 11/15/38ž,‡ | 8,277,275 | 8,271,766 | |
Mello Mortgage Capital Acceptance Trust 2021-INV2 A11, US 30 Day Average SOFR + 0.9500%, 5.0000%, 8/25/51ž,‡ | 4,060,844 | 3,782,745 | |
Mello Mortgage Capital Acceptance Trust 2021-INV3 A11, US 30 Day Average SOFR + 0.9500%, 5.0000%, 10/25/51ž,‡ | 5,092,724 | 4,744,587 | |
Mello Mortgage Capital Acceptance Trust 2022-INV1 A2, 3.0000%, 3/25/52ž,‡ | 4,780,626 | 4,036,011 | |
Mello Mortgage Capital Acceptance Trust 2024-SD1 A1, 4.0000%, 4/25/54ž,Ç | 2,389,416 | 2,268,664 | |
Mercury Financial Credit Card Master Trust 2023-1A A, 8.0400%, 9/20/27ž | 4,532,000 | 4,563,298 | |
MHC Commercial Mortgage Trust 2021-MHC A, CME Term SOFR 1 Month + 0.9154%, 6.2444%, 4/15/38ž,‡ | 8,794,244 | 8,717,882 | |
MHC Commercial Mortgage Trust 2021-MHC C, CME Term SOFR 1 Month + 1.4654%, 6.7944%, 4/15/38ž,‡ | 4,964,334 | 4,912,371 | |
NCMF Trust 2022-MFP A, CME Term SOFR 1 Month + 1.7420%, 7.0588%, 3/15/39ž,‡ | 3,015,000 | 2,986,862 | |
New Residential Mortgage Loan Trust 2018-2, Refinitiv USD IBOR Consumer Cash Fallbacks 6 Months + 0.6800%, 4.5000%, 2/25/58ž,‡ | 1,708,101 | 1,634,720 | |
NRTH PARK Mortgage Trust 2024-PARK A, CME Term SOFR 1 Month + 1.6413%, 6.9701%, 3/15/41ž,‡ | 9,402,000 | 9,370,928 | |
NRZ Excess Spread Collateralized Notes 2020-PLS1 A, 3.8440%, 12/25/25ž | 808,364 | 780,813 | |
NRZ Excess Spread Collateralized Notes 2021-FHT1 A, 3.1040%, 7/25/26ž | 1,937,768 | 1,826,988 | |
Oak Street Investment Grade Net Lease Fund 2020-1A A1, 1.8500%, 11/20/50ž | 4,514,676 | 4,228,826 | |
Oceanview Mortgage Trust 2021-4 A11, US 30 Day Average SOFR + 0.8500%, 5.0000%, 10/25/51ž,‡ | 5,574,859 | 5,154,538 | |
Oceanview Mortgage Trust 2021-5 AF, US 30 Day Average SOFR + 0.8500%, 5.0000%, 11/25/51ž,‡ | 5,313,183 | 4,930,103 | |
Oceanview Mortgage Trust 2022-1 A1, 3.0000%, 12/25/51ž,‡ | 2,780,142 | 2,336,812 | |
Oceanview Mortgage Trust 2022-2 A1, 3.0000%, 12/25/51ž,‡ | 8,235,183 | 6,954,959 | |
Onslow Bay Financial LLC 2022-INV1 A1, 3.0000%, 12/25/51ž,‡ | 10,914,293 | 9,059,807 | |
Onslow Bay Financial LLC 2022-INV1 A18, 3.0000%, 12/25/51ž,‡ | 4,628,022 | 3,782,675 | |
OPEN Trust 2023-AIR A, CME Term SOFR 1 Month + 3.0891%, 8.4179%, 10/15/28ž,‡ | 3,728,978 | 3,774,080 | |
OPEN Trust 2023-AIR C, CME Term SOFR 1 Month + 5.2359%, 10.5648%, 10/15/28ž,‡ | 1,399,443 | 1,402,403 |
Schedule of Investments
June 30, 2024
Shares or Principal Amounts | Value | ||
Asset-Backed/Commercial Mortgage-Backed Securities – (continued) | |||
Pagaya AI Debt Selection Trust 2022-1 A, 2.0300%, 10/15/29ž | $252,023 | $250,703 | |
Pretium Mortgage Credit Partners LLC 2023-RN1 A1, 8.2321%, 9/25/53ž,Ç | 6,719,896 | 6,822,412 | |
PRP Advisors LLC 2020-4 A1, 5.6100%, 10/25/25ž,Ç | 2,614,584 | 2,604,147 | |
PRP Advisors LLC 2021-10 A1, 2.4870%, 10/25/26ž,Ç | 4,625,219 | 4,496,164 | |
PRP Advisors LLC 2021-9 A1, 2.3630%, 10/25/26ž,Ç | 8,729,164 | 8,475,703 | |
PRP Advisors LLC 2021-RPL2 A1, 1.4550%, 10/25/51ž,‡ | 5,572,888 | 4,942,243 | |
PRP Advisors LLC 2022-2 A1, 5.0000%, 3/25/27ž,Ç | 6,584,189 | 6,480,297 | |
PRP Advisors LLC 2024-RCF2 A1, 3.7500%, 3/25/54ž,Ç | 1,596,402 | 1,514,486 | |
Rad CLO Ltd 2023-21A A, CME Term SOFR 3 Month + 1.5900%, 6.9136%, 1/25/33ž,‡ | 3,917,677 | 3,943,487 | |
Regatta Funding 2018-1A AR, CME Term SOFR 3 Month + 1.4000%, 0%, 7/17/37ž,‡ | 9,143,014 | 9,143,014 | |
Regatta XXIII Funding Ltd 2021-4A B, CME Term SOFR 3 Month + 1.9616%, 7.2862%, 1/22/35ž,‡ | 2,192,711 | 2,195,200 | |
RR Ltd 2022-21A A1AR, CME Term SOFR 3 Month + 1.4000%, 0%, 7/15/39ž,‡ | 5,215,918 | 5,215,918 | |
Saluda Grade Alternative Mortgage Trust 2023-FIG3 A, 7.0670%, 8/25/53ž,‡ | 8,078,195 | 8,430,095 | |
Saluda Grade Alternative Mortgage Trust 2023-FIG4 A, 6.7180%, 11/25/53ž,‡ | 4,250,750 | 4,378,893 | |
Saluda Grade Alternative Mortgage Trust 2024-CES1 A1, 6.3060%, 3/25/54ž,‡ | 2,800,464 | 2,793,248 | |
Saluda Grade Alternative Mortgage Trust 2024-FIG5 A, 6.2550%, 4/25/54ž,‡ | 3,001,715 | 3,049,267 | |
Saluda Grade Alternative Mortgage Trust 2024-RTL5 A1, 7.7620%, 4/25/30ž,Ç | 4,628,000 | 4,665,717 | |
Saluda Grade Alternative Mortgage Trust 2024-RTL6 A1, 7.4390%, 7/25/30ž,‡ | 5,238,000 | 5,237,906 | |
Santander Bank Auto Credit-Linked Notes 2021-1A B, 1.8330%, 12/15/31ž | 246,324 | 243,617 | |
Santander Bank Auto Credit-Linked Notes 2022-A B, 5.2810%, 5/15/32ž | 1,839,437 | 1,829,772 | |
Sequoia Mortgage Trust 2013-5, 2.5000%, 5/25/43ž,‡ | 496,366 | 425,817 | |
Sequoia Mortgage Trust 2020-2, 3.5000%, 3/25/50ž,‡ | 400,861 | 343,076 | |
Signal Peak CLO LLC 2022-12A A1, 7.1207%, 7/10/28ž,‡ | 9,142,000 | 9,485,583 | |
SMRT 2022-MINI A, CME Term SOFR 1 Month + 1.0000%, 6.3290%, 1/15/39ž,‡ | 3,548,000 | 3,503,838 | |
Sound Point CLO Ltd 2019-1A AR, CME Term SOFR 3 Month + 1.3416%, 6.6662%, 1/20/32ž,‡ | 6,462,000 | 6,465,011 | |
SREIT Trust 2021-MFP A, CME Term SOFR 1 Month + 0.8453%, 6.1741%, 11/15/38ž,‡ | 780,800 | 774,580 | |
Stack Infrastructure Issuer LLC 2024-1A A2, 5.9000%, 3/25/49ž | 3,155,000 | 3,117,779 | |
Taco Bell Funding LLC 2021-1A A23, 2.5420%, 8/25/51ž | 2,430,523 | 1,991,242 | |
THE 2023-MIC Trust 2023-MIC A, 8.7315%, 12/5/38ž,‡ | 4,402,712 | 4,735,446 | |
TYSN 2023-CRNR Mortgage Trust 2023-CRNR A, 6.7991%, 12/10/33ž,‡ | 6,674,443 | 6,886,475 | |
UNIFY Auto Receivables Trust 2021-1A A4, 0.9800%, 7/15/26ž | 854,490 | 848,965 | |
United Wholesale Mortgage LLC 2021-INV1 A9, US 30 Day Average SOFR + 0.9000%, 5.0000%, 8/25/51ž,‡ | 4,842,811 | 4,500,407 | |
Upstart Securitization Trust 2022-1 A, 3.1200%, 3/20/32ž | 790,295 | 786,322 | |
Upstart Securitization Trust 2022-2 A, 4.3700%, 5/20/32ž | 33,074 | 33,039 | |
Vantage Data Centers LLC 2020-1A A2, 1.6450%, 9/15/45ž | 6,324,000 | 5,991,795 | |
Vantage Data Centers LLC 2020-2A A2, 1.9920%, 9/15/45ž | 4,083,000 | 3,603,319 | |
VASA Trust 2021-VASA A, CME Term SOFR 1 Month + 1.0145%, 6.3435%, 7/15/39ž,‡ | 3,768,000 | 3,497,739 | |
VCAT Asset Securitization LLC 2021-NPL1 A1, 5.2891%, 12/26/50ž,Ç | 358,500 | 355,946 | |
VMC Finance LLC 2021-HT1 A, CME Term SOFR 1 Month + 1.7645%, 7.0964%, 1/19/37ž,‡ | 2,331,897 | 2,285,214 | |
WB Commercial Mortgage Trust 2024-HQ A, 6.1344%, 3/15/40ž,‡ | 4,389,000 | 4,377,499 | |
Wells Fargo Commercial Mortgage Trust 2021-SAVE A, CME Term SOFR 1 Month + 1.2645%, 6.5935%, 2/15/40ž,‡ | 1,200,838 | 1,191,909 | |
Wendy's Funding LLC 2021-1A A2II, 2.7750%, 6/15/51ž | 2,430,814 | 2,032,914 | |
Westgate Resorts 2022-1A A, 1.7880%, 8/20/36ž | 1,041,080 | 997,877 | |
Woodward Capital Management 2021-3 A21, US 30 Day Average SOFR + 0.8000%, 5.0000%, 7/25/51ž,‡ | 3,845,546 | 3,558,500 | |
Woodward Capital Management 2023-CES1 A1A, 6.5150%, 6/25/43ž,‡ | 3,398,178 | 3,412,863 | |
Woodward Capital Management 2023-CES2 A1A, 6.8080%, 9/25/43ž,‡ | 5,198,159 | 5,251,989 | |
Woodward Capital Management 2023-CES3 A1A, 7.1130%, 11/25/43ž,‡ | 9,085,432 | 9,203,732 | |
Woodward Capital Management 2024-CES1 A1A, 6.0250%, 2/25/44ž,‡ | 3,723,407 | 3,709,410 |
Schedule of Investments
June 30, 2024
Shares or Principal Amounts | Value | ||
Asset-Backed/Commercial Mortgage-Backed Securities – (continued) | |||
Woodward Capital Management 2024-CES2 A1A, 6.1410%, 4/25/44ž,‡ | $11,693,404 | $11,843,865 | |
Woodward Capital Management 2024-CES3 A1A, 6.5910%, 5/25/44ž,‡ | 3,798,283 | 3,830,385 | |
Total Asset-Backed/Commercial Mortgage-Backed Securities (cost $807,999,874) | 792,318,779 | ||
Bank Loans and Mezzanine Loans – 1.9% | |||
Capital Goods – 0.1% | |||
EMRLD Borrower LP, CME Term SOFR 1 Month + 2.50000%, 7.8291%, 6/18/31ƒ,‡ | 3,911,156 | 3,906,267 | |
Consumer Non-Cyclical – 0.3% | |||
Concentra Health Services Inc, CME Term SOFR 1 Month + 2.25000%, 7.5887%, 6/26/31ƒ,‡ | 1,625,000 | 1,629,063 | |
Medline Borrower LP, CME Term SOFR 1 Month + 2.25000%, 7.5779%, 10/23/28ƒ,‡ | 6,323,000 | 6,323,000 | |
7,952,063 | |||
Industrial – 0.6% | |||
AECOM Technology, CME Term SOFR 1 Month + 1.8750%, 7.2189%, 4/17/31‡ | 6,410,000 | 6,443,396 | |
APi Group DE Inc, CME Term SOFR 1 Month + 2.0000%, 7.3439%, 12/18/28‡ | 8,691,065 | 8,680,983 | |
15,124,379 | |||
Technology – 0.4% | |||
SS&C Technologies Inc, CME Term SOFR 1 Month + 2.0000%, 7.3439%, 5/9/31‡ | 10,910,665 | 11,020,911 | |
Transportation – 0.5% | |||
Genesee & Wyoming Inc, CME Term SOFR 3 Month + 2.0000%, 7.3346%, 4/10/31ƒ,‡ | 12,734,386 | 12,716,812 | |
Total Bank Loans and Mezzanine Loans (cost $50,584,857) | 50,720,432 | ||
Corporate Bonds – 36.2% | |||
Banking – 5.7% | |||
Bank of America Corp, SOFR + 1.8400%, 5.8720%, 9/15/34‡ | 5,001,000 | 5,144,504 | |
Bank of America Corp, CME Term SOFR 3 Month + 3.9666%, 6.2500%‡,μ | 8,517,000 | 8,481,671 | |
Bank of New York Mellon Corp/The, SOFR + 1.8450%, 6.4740%, 10/25/34‡ | 6,616,000 | 7,135,337 | |
Bank of Montreal, US Treasury Yield Curve Rate 5 Year + 1.4000%, 3.0880%, 1/10/37‡ | 5,173,000 | 4,233,162 | |
BNP Paribas SA, SOFR + 1.2280%, 2.5910%, 1/20/28ž,‡ | 4,430,000 | 4,117,981 | |
BNP Paribas SA, SOFR + 1.5200%, 5.1760%, 1/9/30ž,‡ | 4,407,000 | 4,360,841 | |
Capital One Financial Corp, SOFR + 2.6400%, 6.3120%, 6/8/29‡ | 3,040,000 | 3,110,478 | |
Capital One Financial Corp, SOFR + 1.9050%, 5.7000%, 2/1/30‡,# | 1,489,000 | 1,496,082 | |
Capital One Financial Corp, SOFR + 3.0700%, 7.6240%, 10/30/31‡ | 6,014,000 | 6,620,636 | |
Citigroup Inc, CME Term SOFR 3 Month + 4.1666%, 5.9500%‡,μ | 4,099,000 | 4,072,217 | |
Citigroup Inc, CME Term SOFR 3 Month + 3.6846%, 9.0070%‡,μ | 916,000 | 913,689 | |
Discover Financial Services, SOFR + 3.3700%, 7.9640%, 11/2/34‡ | 7,753,000 | 8,721,298 | |
Fifth Third Bancorp, SOFR + 2.3400%, 6.3390%, 7/27/29‡ | 4,463,000 | 4,574,969 | |
Fifth Third Bancorp, SOFR + 1.8400%, 5.6310%, 1/29/32‡ | 1,687,000 | 1,672,309 | |
JPMorgan Chase & Co, SOFR + 1.4500%, 5.2990%, 7/24/29‡ | 9,544,000 | 9,576,028 | |
JPMorgan Chase & Co, SOFR + 1.5700%, 6.0870%, 10/23/29‡ | 6,113,000 | 6,316,077 | |
JPMorgan Chase & Co, SOFR + 1.3100%, 5.0120%, 1/23/30‡ | 2,967,000 | 2,944,245 | |
JPMorgan Chase & Co, SOFR + 1.8100%, 6.2540%, 10/23/34‡ | 3,572,000 | 3,788,495 | |
JPMorgan Chase & Co, CME Term SOFR 3 Month + 3.3800%, 5.0000%‡,μ | 3,293,000 | 3,283,581 | |
Morgan Stanley, SOFR + 1.5900%, 5.1640%, 4/20/29‡ | 6,520,000 | 6,498,840 | |
Morgan Stanley, SOFR + 1.2900%, 2.9430%, 1/21/33‡ | 5,212,000 | 4,429,779 | |
Morgan Stanley, SOFR + 1.8800%, 5.4240%, 7/21/34‡ | 4,393,000 | 4,370,872 | |
PNC Financial Services Group Inc/The, SOFR + 2.2840%, 6.8750%, 10/20/34‡ | 6,946,000 | 7,570,218 | |
Sumitomo Mitsui Financial Group Inc, 5.8520%, 7/13/30 | 2,568,000 | 2,636,128 | |
Truist Financial Corp, SOFR + 1.6200%, 5.4350%, 1/24/30‡ | 2,666,000 | 2,659,056 | |
Truist Financial Corp, SOFR + 1.9220%, 5.7110%, 1/24/35‡ | 2,196,000 | 2,186,414 | |
UBS Group AG, US Treasury Yield Curve Rate 1 Year + 1.5200%, 5.4280%, 2/8/30ž,‡ | 5,065,000 | 5,054,943 | |
UBS Group AG, 5.6990%, 2/8/35ž | 4,275,000 | 4,270,640 | |
US Bancorp, SOFR + 1.5600%, 5.3840%, 1/23/30‡ | 5,725,000 | 5,740,338 | |
US Bancorp, SOFR + 1.8600%, 5.6780%, 1/23/35‡ | 4,101,000 | 4,116,729 | |
Wells Fargo & Co, SOFR + 1.5000%, 5.1980%, 1/23/30‡ | 8,122,000 | 8,087,898 | |
148,185,455 |
Schedule of Investments
June 30, 2024
Shares or Principal Amounts | Value | ||
Corporate Bonds – (continued) | |||
Basic Industry – 1.1% | |||
Celanese US Holdings LLC, 6.3500%, 11/15/28 | $2,939,000 | $3,019,766 | |
Celanese US Holdings LLC, 6.3300%, 7/15/29 | 2,911,000 | 2,993,943 | |
Celanese US Holdings LLC, 6.5500%, 11/15/30 | 4,636,000 | 4,844,588 | |
Graphic Packaging International LLC, 6.3750%, 7/15/32ž,# | 13,074,000 | 13,057,622 | |
Novelis Corp, 3.2500%, 11/15/26ž | 3,692,000 | 3,474,188 | |
27,390,107 | |||
Brokerage – 1.6% | |||
Blue Owl Finance LLC, 6.2500%, 4/18/34ž | 10,395,000 | 10,422,444 | |
Intercontinental Exchange Inc, 5.2500%, 6/15/31 | 3,008,000 | 3,024,978 | |
Jane Street Group / JSG Finance Inc, 7.1250%, 4/30/31ž | 11,249,000 | 11,535,559 | |
LPL Holdings Inc, 6.0000%, 5/20/34 | 5,185,000 | 5,177,219 | |
Nasdaq Inc, 5.3500%, 6/28/28 | 1,472,000 | 1,485,365 | |
Nasdaq Inc, 5.5500%, 2/15/34 | 9,845,000 | 9,858,340 | |
41,503,905 | |||
Capital Goods – 3.2% | |||
BAE Systems PLC, 5.1250%, 3/26/29ž | 2,597,000 | 2,585,436 | |
BAE Systems PLC, 5.2500%, 3/26/31ž | 974,000 | 971,392 | |
Berry Global Inc, 5.8000%, 6/15/31ž | 8,973,000 | 8,959,889 | |
Berry Global Inc, 5.6500%, 1/15/34ž | 7,910,000 | 7,725,763 | |
Boeing Co/The, 6.2980%, 5/1/29ž | 2,101,000 | 2,130,541 | |
Boeing Co/The, 6.3880%, 5/1/31ž | 5,260,000 | 5,354,979 | |
Boeing Co/The, 6.5280%, 5/1/34ž | 5,064,000 | 5,185,027 | |
Boeing Co/The, 6.8580%, 5/1/54ž | 2,218,000 | 2,276,049 | |
Boeing Co/The, 7.0080%, 5/1/64ž | 1,078,000 | 1,103,732 | |
Bombardier Inc, 7.0000%, 6/1/32ž | 9,123,000 | 9,249,728 | |
EMRLD Borrower LP / Emerald Co-Issuer Inc, 6.7500%, 7/15/31ž | 5,925,000 | 5,999,062 | |
L3Harris Technologies Inc, 5.4000%, 7/31/33 | 5,184,000 | 5,167,651 | |
Regal Rexnord Corp, 6.0500%, 4/15/28# | 4,838,000 | 4,896,122 | |
RTX Corp, 5.7500%, 1/15/29 | 2,726,000 | 2,798,958 | |
TransDigm Inc, 6.6250%, 3/1/32ž | 6,157,000 | 6,218,936 | |
Trinity Industries Inc, 7.7500%, 7/15/28ž | 9,988,000 | 10,339,623 | |
WESCO Distribution Inc, 6.3750%, 3/15/29ž | 3,245,000 | 3,256,724 | |
84,219,612 | |||
Communications – 0.8% | |||
Charter Communications Operating LLC / Charter Communications Operating Capital, 6.6500%, 2/1/34 | 12,400,000 | 12,525,760 | |
T-Mobile USA Inc, 4.8500%, 1/15/29 | 4,260,000 | 4,207,089 | |
T-Mobile USA Inc, 5.1500%, 4/15/34 | 3,645,000 | 3,582,539 | |
20,315,388 | |||
Consumer Cyclical – 3.5% | |||
CBRE Services Inc, 5.9500%, 8/15/34 | 15,178,000 | 15,365,531 | |
CBRE Services Inc, 5.5000%, 4/1/29 | 3,468,000 | 3,486,006 | |
Choice Hotels International Inc, 5.8500%, 8/1/34 | 11,140,000 | 10,979,676 | |
Ford Motor Credit Co LLC, 5.8000%, 3/8/29 | 5,589,000 | 5,569,369 | |
Ford Motor Credit Co LLC, 6.1250%, 3/8/34 | 3,891,000 | 3,848,620 | |
Ford Motor Credit Co LLC, 7.3500%, 3/6/30 | 1,551,000 | 1,641,415 | |
Ford Motor Credit Co LLC, 7.2000%, 6/10/30 | 1,525,000 | 1,604,169 | |
Ford Motor Credit Co LLC, 7.1220%, 11/7/33 | 3,132,000 | 3,309,510 | |
General Motors Financial Co Inc, 5.7500%, 2/8/31 | 3,729,000 | 3,738,950 | |
General Motors Financial Co Inc, 5.9500%, 4/4/34 | 4,869,000 | 4,873,159 | |
GLP Capital LP / GLP Financing II Inc, 5.3000%, 1/15/29 | 603,000 | 594,120 | |
GLP Capital LP / GLP Financing II Inc, 6.7500%, 12/1/33 | 4,234,000 | 4,448,545 | |
Home Depot Inc/The, 4.7500%, 6/25/29 | 2,388,000 | 2,374,094 | |
Home Depot Inc/The, 4.8500%, 6/25/31 | 2,953,000 | 2,929,818 | |
Home Depot Inc/The, 4.9500%, 6/25/34 | 2,363,000 | 2,338,369 | |
LKQ Corp, 5.7500%, 6/15/28 | 6,722,000 | 6,785,322 | |
LKQ Corp, 6.2500%, 6/15/33# | 6,323,000 | 6,489,700 |
Schedule of Investments
June 30, 2024
Shares or Principal Amounts | Value | ||
Corporate Bonds – (continued) | |||
Consumer Cyclical – (continued) | |||
Royal Caribbean Cruises Ltd, 6.2500%, 3/15/32ž | $4,954,000 | $4,995,619 | |
ZF North America Capital Inc, 6.7500%, 4/23/30ž | 5,116,000 | 5,210,344 | |
90,582,336 | |||
Consumer Non-Cyclical – 6.8% | |||
AbbVie Inc, 4.8000%, 3/15/29 | 4,590,000 | 4,572,258 | |
AbbVie Inc, 4.9500%, 3/15/31 | 3,970,000 | 3,959,674 | |
Albertsons Cos Inc / Safeway Inc / New Albertsons LP / Albertsons LLC, 6.5000%, 2/15/28ž | 4,458,000 | 4,479,136 | |
Concentra Escrow Issuer Corporation, 6.8750%, 7/15/32ž | 4,999,000 | 5,064,788 | |
Hasbro Inc, 6.0500%, 5/14/34 | 15,194,000 | 15,169,742 | |
HCA Inc, 5.2000%, 6/1/28 | 3,494,000 | 3,480,163 | |
HCA Inc, 5.4500%, 4/1/31 | 2,925,000 | 2,922,899 | |
HCA Inc, 3.6250%, 3/15/32 | 7,371,000 | 6,492,842 | |
HCA Inc, 5.6000%, 4/1/34 | 4,691,000 | 4,662,715 | |
Heartland Dental LLC / Heartland Dental Finance Corp, 10.5000%, 4/30/28ž | 7,269,000 | 7,715,753 | |
Illumina Inc, 5.7500%, 12/13/27 | 8,548,000 | 8,626,808 | |
IQVIA Inc, 6.2500%, 2/1/29 | 6,329,000 | 6,504,889 | |
JBS USA LUX SA / JBS USA Food Co / JBS USA Finance Inc, 5.5000%, 1/15/30 | 9,007,000 | 8,869,739 | |
JBS USA LUX SA / JBS USA Food Co / JBS USA Finance Inc, 3.6250%, 1/15/32 | 3,897,000 | 3,364,195 | |
Mattel Inc, 3.7500%, 4/1/29ž | 11,690,000 | 10,780,921 | |
Nestle Capital Corp, 4.7500%, 3/12/31ž | 8,819,000 | 8,707,538 | |
Organon & Co / Organon Foreign Debt Co-Issuer BV, 6.7500%, 5/15/34ž | 4,521,000 | 4,514,741 | |
Organon & Co / Organon Foreign Debt Co-Issuer BV, 7.8750%, 5/15/34ž | 3,444,000 | 3,538,722 | |
Polaris Inc, 6.9500%, 3/15/29 | 5,766,000 | 6,031,021 | |
Smith & Nephew PLC, 5.4000%, 3/20/34 | 4,083,000 | 4,019,792 | |
Solventum Corp, 5.4000%, 3/1/29ž | 5,668,000 | 5,650,704 | |
Solventum Corp, 5.4500%, 3/13/31ž | 8,688,000 | 8,578,896 | |
Solventum Corp, 5.6000%, 3/23/34ž | 10,931,000 | 10,736,153 | |
Solventum Corp, 6.0000%, 5/15/64ž | 4,009,000 | 3,802,505 | |
Sysco Corp, 5.7500%, 1/17/29 | 4,104,000 | 4,201,750 | |
Tyson Foods Inc, 5.7000%, 3/15/34 | 7,175,000 | 7,147,294 | |
Universal Health Services Inc, 2.6500%, 10/15/30 | 4,553,000 | 3,887,106 | |
Universal Health Services Inc, 2.6500%, 1/15/32 | 10,445,000 | 8,521,477 | |
176,004,221 | |||
Electric – 2.5% | |||
American Electric Power Co Inc, 5.6250%, 3/1/33 | 6,736,000 | 6,711,185 | |
Duke Energy Corp, 4.3000%, 3/15/28 | 4,804,000 | 4,660,625 | |
Exelon Corp, 5.4500%, 3/15/34 | 4,987,000 | 4,951,532 | |
Georgia Power Co, 4.6500%, 5/16/28 | 3,459,000 | 3,405,566 | |
Georgia Power Co, 4.9500%, 5/17/33 | 5,466,000 | 5,329,413 | |
Georgia Power Co, 5.2500%, 3/15/34 | 4,073,000 | 4,060,145 | |
Liberty Utilities Co, 5.8690%, 1/31/34ž | 4,882,000 | 4,885,216 | |
National Grid PLC, 5.6020%, 6/12/28 | 2,487,000 | 2,511,217 | |
National Grid PLC, 5.8090%, 6/12/33 | 5,218,000 | 5,243,112 | |
Southern California Edison Co, 5.8500%, 11/1/27 | 6,094,000 | 6,212,616 | |
Southern Co, 5.7000%, 3/15/34 | 4,241,000 | 4,311,770 | |
Xcel Energy Inc, 5.4500%, 8/15/33 | 13,440,000 | 13,203,853 | |
65,486,250 | |||
Energy – 2.8% | |||
Cheniere Energy Inc, 5.6500%, 4/15/34ž | 6,008,000 | 6,012,746 | |
Columbia Pipelines Operating Company LLC, 5.9270%, 8/15/30ž | 1,590,000 | 1,624,114 | |
Columbia Pipelines Operating Company LLC, 6.0360%, 11/15/33ž | 3,823,000 | 3,906,790 | |
DT Midstream Inc, 4.1250%, 6/15/29ž | 7,456,000 | 6,888,196 | |
DT Midstream Inc, 4.3750%, 6/15/31ž | 4,330,000 | 3,943,866 | |
DT Midstream Inc, 4.3000%, 4/15/32ž | 2,510,000 | 2,269,082 | |
EQM Midstream Partners LP, 6.3750%, 4/1/29ž | 8,964,000 | 9,054,599 | |
EQT Corp, 5.7000%, 4/1/28 | 2,135,000 | 2,155,784 |
Schedule of Investments
June 30, 2024
Shares or Principal Amounts | Value | ||
Corporate Bonds – (continued) | |||
Energy – (continued) | |||
Hess Midstream Operations LP, 5.1250%, 6/15/28ž | $3,041,000 | $2,944,465 | |
Hess Midstream Operations LP, 6.5000%, 6/1/29ž | 7,886,000 | 7,994,530 | |
Occidental Petroleum Corp, 8.8750%, 7/15/30 | 3,013,000 | 3,469,765 | |
Occidental Petroleum Corp, 6.6250%, 9/1/30 | 2,150,000 | 2,254,750 | |
Occidental Petroleum Corp, 6.1250%, 1/1/31 | 3,770,000 | 3,858,708 | |
Sunoco LP, 7.0000%, 5/1/29ž | 6,084,000 | 6,235,389 | |
Sunoco LP, 7.2500%, 5/1/32ž | 3,428,000 | 3,545,783 | |
Viper Energy Partners LP, 7.3750%, 11/1/31ž | 6,183,000 | 6,403,659 | |
72,562,226 | |||
Finance Companies – 0.7% | |||
Blackstone Private Credit Fund, 7.3000%, 11/27/28ž | 4,159,000 | 4,309,696 | |
Blackstone Secured Lending Fund, 5.8750%, 11/15/27 | 6,264,000 | 6,218,482 | |
Blue Owl Credit Income Corp, 7.7500%, 9/16/27 | 4,462,000 | 4,584,720 | |
Blue Owl Credit Income Corp, 7.9500%, 6/13/28 | 2,886,000 | 2,984,074 | |
OWL Rock Core Income Corp, 4.7000%, 2/8/27 | 743,000 | 707,024 | |
18,803,996 | |||
Government Guarantee – 0.1% | |||
Electricite de France SA, 5.7000%, 5/23/28ž | 2,832,000 | 2,860,570 | |
Insurance – 3.2% | |||
Aon North America Inc, 5.3000%, 3/1/31 | 6,324,000 | 6,305,621 | |
Aon North America Inc, 5.4500%, 3/1/34 | 12,335,000 | 12,280,822 | |
Arthur J Gallagher & Co, 6.5000%, 2/15/34 | 2,912,000 | 3,081,317 | |
Arthur J Gallagher & Co, 5.4500%, 7/15/34 | 5,602,000 | 5,556,149 | |
Centene Corp, 4.2500%, 12/15/27 | 16,614,000 | 16,002,320 | |
Centene Corp, 2.4500%, 7/15/28# | 7,054,000 | 6,262,751 | |
Centene Corp, 3.0000%, 10/15/30 | 5,571,000 | 4,763,589 | |
Health Care Service Corp, 5.2000%, 6/15/29ž | 3,916,000 | 3,899,124 | |
Health Care Service Corp, 5.4500%, 6/15/34ž | 8,831,000 | 8,727,675 | |
Health Care Service Corp, 5.8750%, 6/15/54ž | 7,260,000 | 7,143,405 | |
Humana Inc, 5.3750%, 4/15/31 | 5,756,000 | 5,725,438 | |
Humana Inc, 5.8750%, 3/1/33 | 1,492,000 | 1,517,719 | |
Humana Inc, 5.9500%, 3/15/34 | 2,488,000 | 2,543,356 | |
83,809,286 | |||
Real Estate Investment Trusts (REITs) – 0.4% | |||
American Tower Trust I, 5.4900%, 3/15/28ž | 10,515,000 | 10,545,893 | |
Technology – 3.8% | |||
Cadence Design Systems Inc, 4.3750%, 10/15/24 | 18,064,000 | 17,978,649 | |
Constellation Software Inc/Canada, 5.1580%, 2/16/29ž | 1,766,000 | 1,765,368 | |
Constellation Software Inc/Canada, 5.4610%, 2/16/34ž | 5,134,000 | 5,134,630 | |
CoStar Group Inc, 2.8000%, 7/15/30ž | 5,441,000 | 4,600,998 | |
Equinix Europe 2 Financing Corporation LLC, 5.5000%, 6/15/34 | 5,747,000 | 5,737,662 | |
Foundry JV Holdco LLC, 5.9000%, 1/25/30ž | 2,144,000 | 2,174,632 | |
Foundry JV Holdco LLC, 6.1500%, 1/25/32ž,# | 6,242,000 | 6,362,873 | |
Foundry JV Holdco LLC, 5.8750%, 1/25/34ž | 15,431,000 | 15,299,061 | |
Leidos Inc, 2.3000%, 2/15/31 | 1,276,000 | 1,051,314 | |
Marvell Technology Inc, 4.8750%, 6/22/28 | 6,709,000 | 6,610,815 | |
Marvell Technology Inc, 5.7500%, 2/15/29 | 5,585,000 | 5,702,042 | |
MSCI Inc, 4.0000%, 11/15/29ž | 12,297,000 | 11,489,530 | |
Trimble Inc, 4.9000%, 6/15/28 | 2,415,000 | 2,382,828 | |
Trimble Inc, 6.1000%, 3/15/33 | 1,136,000 | 1,176,337 | |
Zebra Technologies Corp, 6.5000%, 6/1/32ž | 12,649,000 | 12,791,423 | |
100,258,162 | |||
Total Corporate Bonds (cost $942,366,293) | 942,527,407 | ||
Mortgage-Backed Securities – 25.0% | |||
Fannie Mae: | |||
3.0000%, TBA, 30 Year Maturity | 7,080,129 | 6,021,501 | |
5.0000%, TBA, 30 Year Maturity | 3,541,000 | 3,421,512 | |
6.0000%, TBA, 30 Year Maturity | 2,094,634 | 2,100,143 | |
11,543,156 |
Schedule of Investments
June 30, 2024
Shares or Principal Amounts | Value | ||
Mortgage-Backed Securities – (continued) | |||
Fannie Mae Pool: | |||
3.0000%, 10/1/34 | $18,327 | $17,107 | |
2.5000%, 11/1/34 | 1,693,016 | 1,543,792 | |
3.0000%, 11/1/34 | 106,946 | 99,847 | |
3.0000%, 12/1/34 | 101,417 | 94,676 | |
2.5000%, 12/1/36 | 2,449,774 | 2,231,865 | |
6.0000%, 2/1/37 | 590,091 | 610,602 | |
4.5000%, 11/1/42 | 601,360 | 583,502 | |
3.0000%, 1/1/43 | 122,778 | 108,923 | |
3.0000%, 2/1/43 | 199,422 | 176,199 | |
5.0000%, 7/1/44 | 3,069,528 | 3,036,241 | |
4.5000%, 10/1/44 | 1,373,798 | 1,332,734 | |
4.5000%, 3/1/45 | 2,135,967 | 2,072,119 | |
4.0000%, 5/1/45 | 198,644 | 185,804 | |
4.5000%, 6/1/45 | 1,070,332 | 1,035,249 | |
3.0000%, 2/1/48 | 287,302 | 252,404 | |
5.0000%, 5/1/48 | 491,872 | 482,342 | |
4.0000%, 11/1/48 | 1,532,264 | 1,423,294 | |
4.0000%, 12/1/48 | 238,676 | 221,702 | |
4.0000%, 2/1/49 | 906,895 | 842,399 | |
4.0000%, 3/1/49 | 323,827 | 300,797 | |
4.0000%, 6/1/49 | 334,018 | 309,842 | |
4.0000%, 6/1/49 | 194,518 | 180,439 | |
4.5000%, 6/1/49 | 85,374 | 81,637 | |
3.0000%, 8/1/49 | 1,430,425 | 1,218,909 | |
3.0000%, 8/1/49 | 338,984 | 288,858 | |
4.5000%, 8/1/49 | 132,665 | 126,859 | |
3.0000%, 9/1/49 | 204,075 | 179,312 | |
3.0000%, 9/1/49 | 11,582 | 9,992 | |
4.0000%, 9/1/49 | 966,315 | 896,455 | |
4.5000%, 1/1/50 | 176,119 | 168,399 | |
4.0000%, 3/1/50 | 2,536,979 | 2,356,556 | |
4.0000%, 4/1/50 | 677,268 | 626,995 | |
3.0000%, 7/1/50 | 6,683,142 | 5,753,785 | |
2.5000%, 8/1/50 | 745,901 | 625,288 | |
4.0000%, 8/1/50 | 565,381 | 523,414 | |
3.0000%, 9/1/50 | 910,537 | 783,355 | |
4.0000%, 9/1/50 | 5,319,546 | 4,934,524 | |
4.5000%, 10/1/50 | 3,115,397 | 2,981,523 | |
4.5000%, 12/1/50 | 4,391,241 | 4,198,757 | |
4.0000%, 1/1/51 | 853,798 | 792,002 | |
4.0000%, 3/1/51 | 14,539,740 | 13,487,373 | |
4.0000%, 3/1/51 | 250,706 | 232,560 | |
4.0000%, 3/1/51 | 126,138 | 117,168 | |
2.0000%, 7/1/51 | 16,106,617 | 12,650,417 | |
4.0000%, 10/1/51 | 13,165,640 | 12,212,727 | |
4.0000%, 10/1/51 | 1,832,482 | 1,699,849 | |
3.0000%, 12/1/51 | 166,401 | 143,313 | |
2.5000%, 1/1/52 | 4,723,064 | 3,924,038 | |
3.5000%, 1/1/52 | 1,744,797 | 1,571,542 | |
2.5000%, 2/1/52 | 22,626,824 | 18,784,932 | |
2.5000%, 2/1/52 | 17,232,319 | 14,268,374 | |
2.5000%, 2/1/52 | 7,739,965 | 6,376,273 | |
3.5000%, 2/1/52 | 4,574,438 | 4,119,853 | |
2.5000%, 3/1/52 | 9,681,305 | 8,037,480 | |
2.5000%, 3/1/52 | 9,565,754 | 7,925,490 | |
2.5000%, 3/1/52 | 7,205,933 | 5,955,370 | |
2.5000%, 3/1/52 | 3,592,273 | 2,987,659 | |
2.5000%, 3/1/52 | 797,511 | 660,759 | |
2.5000%, 3/1/52 | 720,441 | 596,905 |
Schedule of Investments
June 30, 2024
Shares or Principal Amounts | Value | ||
Mortgage-Backed Securities – (continued) | |||
Fannie Mae Pool – (continued) | |||
2.5000%, 3/1/52 | $688,460 | $571,564 | |
2.5000%, 3/1/52 | 275,852 | 228,980 | |
3.0000%, 3/1/52 | 3,691,490 | 3,179,550 | |
3.0000%, 4/1/52 | 2,249,078 | 1,941,154 | |
3.0000%, 4/1/52 | 1,915,912 | 1,649,472 | |
3.0000%, 4/1/52 | 15,827 | 13,606 | |
3.5000%, 4/1/52 | 2,672,555 | 2,400,786 | |
3.5000%, 4/1/52 | 1,841,686 | 1,654,691 | |
3.5000%, 4/1/52 | 1,429,643 | 1,286,228 | |
3.5000%, 4/1/52 | 848,243 | 761,986 | |
3.5000%, 4/1/52 | 489,369 | 440,314 | |
3.5000%, 4/1/52 | 452,020 | 406,676 | |
4.5000%, 4/1/52 | 389,821 | 368,032 | |
4.5000%, 4/1/52 | 329,924 | 311,483 | |
4.5000%, 4/1/52 | 189,135 | 178,533 | |
4.5000%, 4/1/52 | 171,800 | 162,170 | |
4.5000%, 4/1/52 | 150,132 | 141,717 | |
4.5000%, 4/1/52 | 96,679 | 91,263 | |
2.5000%, 5/1/52 | 15,893,086 | 13,156,704 | |
3.5000%, 5/1/52 | 1,354,231 | 1,216,416 | |
4.0000%, 5/1/52 | 1,147,979 | 1,066,338 | |
4.5000%, 5/1/52 | 523,583 | 494,236 | |
3.0000%, 6/1/52 | 4,825,158 | 4,137,940 | |
3.5000%, 6/1/52 | 8,080,097 | 7,257,816 | |
3.5000%, 6/1/52 | 4,505,542 | 4,056,047 | |
3.0000%, 7/1/52 | 3,583,451 | 3,074,094 | |
3.5000%, 7/1/52 | 1,172,055 | 1,052,780 | |
3.5000%, 7/1/52 | 386,154 | 347,600 | |
4.5000%, 7/1/52 | 2,122,641 | 2,008,647 | |
3.5000%, 8/1/52 | 753,904 | 677,124 | |
5.0000%, 10/1/52 | 1,647,497 | 1,601,782 | |
5.0000%, 10/1/52 | 724,805 | 704,693 | |
5.0000%, 1/1/53 | 1,129,196 | 1,097,863 | |
5.0000%, 1/1/53 | 366,571 | 356,400 | |
5.0000%, 2/1/53 | 444,638 | 432,292 | |
5.0000%, 3/1/53 | 267,217 | 259,623 | |
5.5000%, 3/1/53 | 394,662 | 392,383 | |
5.0000%, 4/1/53 | 518,116 | 503,391 | |
5.5000%, 4/1/53 | 189,010 | 187,893 | |
5.0000%, 5/1/53 | 263,942 | 256,441 | |
5.5000%, 5/1/53 | 349,190 | 347,101 | |
5.5000%, 5/1/53 | 181,759 | 180,672 | |
5.0000%, 6/1/53 | 935,690 | 918,599 | |
5.0000%, 6/1/53 | 379,517 | 368,731 | |
5.0000%, 6/1/53 | 320,913 | 311,793 | |
5.5000%, 6/1/53 | 9,463,477 | 9,418,976 | |
5.5000%, 6/1/53 | 149,791 | 149,052 | |
4.5000%, 7/1/53 | 2,101,957 | 2,007,207 | |
5.0000%, 7/1/53 | 3,315,042 | 3,249,101 | |
5.0000%, 7/1/53 | 732,731 | 719,781 | |
5.5000%, 7/1/53 | 14,196,397 | 13,999,536 | |
5.5000%, 7/1/53 | 429,904 | 427,273 | |
5.5000%, 7/1/53 | 258,730 | 257,413 | |
4.5000%, 8/1/53 | 1,348,769 | 1,287,971 | |
5.0000%, 8/1/53 | 4,771,375 | 4,679,809 | |
5.0000%, 8/1/53 | 323,483 | 314,501 | |
5.0000%, 9/1/53 | 1,080,502 | 1,059,009 | |
5.5000%, 9/1/53 | 7,628,676 | 7,589,251 | |
5.5000%, 11/1/53 | 2,255,820 | 2,265,586 |
Schedule of Investments
June 30, 2024
Shares or Principal Amounts | Value | ||
Mortgage-Backed Securities – (continued) | |||
Fannie Mae Pool – (continued) | |||
5.0000%, 12/1/53 | $391,988 | $384,465 | |
6.0000%, 1/1/54 | 2,230,164 | 2,286,002 | |
5.5000%, 3/1/54 | 4,060,515 | 4,076,986 | |
6.0000%, 3/1/54 | 1,855,150 | 1,896,850 | |
6.0000%, 4/1/54 | 4,507,254 | 4,589,855 | |
6.0000%, 5/1/54 | 6,916,714 | 7,008,925 | |
3.5000%, 8/1/56 | 15,990,879 | 14,072,448 | |
3.0000%, 2/1/57 | 9,168,913 | 7,712,166 | |
3.0000%, 6/1/57 | 33,654 | 28,267 | |
2.5000%, 3/1/62 | 15,886,642 | 12,561,903 | |
323,736,518 | |||
Freddie Mac Gold Pool: | |||
4.0000%, 9/1/48 | 450,545 | 418,951 | |
Freddie Mac Pool: | |||
3.0000%, 5/1/31 | 6,043,391 | 5,741,105 | |
3.0000%, 9/1/32 | 212,686 | 200,259 | |
3.0000%, 10/1/32 | 256,265 | 240,920 | |
3.0000%, 1/1/33 | 144,303 | 135,735 | |
2.5000%, 12/1/33 | 5,172,981 | 4,821,614 | |
3.0000%, 10/1/34 | 46,083 | 43,019 | |
3.0000%, 10/1/34 | 22,577 | 21,074 | |
2.5000%, 11/1/34 | 1,814,634 | 1,654,691 | |
2.5000%, 11/1/34 | 617,196 | 562,796 | |
2.5000%, 6/1/37 | 6,913,816 | 6,267,534 | |
6.0000%, 4/1/40 | 968,590 | 1,002,385 | |
4.5000%, 5/1/44 | 937,307 | 906,585 | |
3.0000%, 1/1/46 | 83,143 | 73,691 | |
4.0000%, 2/1/46 | 2,641,156 | 2,466,700 | |
4.0000%, 3/1/47 | 6,532 | 6,100 | |
4.5000%, 7/1/48 | 663,427 | 634,919 | |
5.0000%, 9/1/48 | 115,708 | 113,361 | |
4.0000%, 11/1/48 | 138,263 | 128,431 | |
4.0000%, 12/1/48 | 1,640,854 | 1,524,203 | |
4.5000%, 6/1/49 | 109,964 | 104,938 | |
4.0000%, 7/1/49 | 1,298,959 | 1,205,050 | |
4.5000%, 7/1/49 | 883,018 | 842,661 | |
4.5000%, 7/1/49 | 140,182 | 134,047 | |
3.0000%, 8/1/49 | 440,537 | 375,395 | |
4.5000%, 8/1/49 | 785,095 | 749,214 | |
3.0000%, 12/1/49 | 616,574 | 531,960 | |
3.0000%, 12/1/49 | 299,683 | 258,557 | |
4.5000%, 1/1/50 | 544,412 | 519,531 | |
4.5000%, 1/1/50 | 152,111 | 145,444 | |
4.0000%, 3/1/50 | 1,610,845 | 1,496,286 | |
2.5000%, 8/1/50 | 380,976 | 319,489 | |
2.5000%, 8/1/50 | 147,303 | 123,483 | |
2.5000%, 9/1/50 | 692,104 | 579,976 | |
4.5000%, 9/1/50 | 4,802,937 | 4,596,546 | |
4.0000%, 10/1/50 | 337,002 | 312,610 | |
4.5000%, 10/1/50 | 2,570,291 | 2,457,626 | |
4.0000%, 11/1/50 | 2,833,611 | 2,628,518 | |
2.5000%, 8/1/51 | 13,117,823 | 10,830,954 | |
2.5000%, 9/1/51 | 9,152,180 | 7,579,239 | |
2.5000%, 10/1/51 | 11,585,618 | 9,578,561 | |
2.5000%, 11/1/51 | 5,930,204 | 4,936,126 | |
2.5000%, 1/1/52 | 1,421,202 | 1,182,387 | |
2.5000%, 1/1/52 | 910,493 | 757,215 | |
2.5000%, 2/1/52 | 2,172,185 | 1,803,362 | |
2.5000%, 2/1/52 | 1,104,209 | 908,824 |
Schedule of Investments
June 30, 2024
Shares or Principal Amounts | Value | ||
Mortgage-Backed Securities – (continued) | |||
Freddie Mac Pool – (continued) | |||
3.0000%, 2/1/52 | $1,016,767 | $876,153 | |
3.0000%, 2/1/52 | 683,378 | 590,344 | |
2.5000%, 3/1/52 | 9,246,096 | 7,632,887 | |
2.5000%, 3/1/52 | 356,697 | 295,533 | |
3.0000%, 3/1/52 | 1,244,668 | 1,074,740 | |
4.5000%, 3/1/52 | 81,190 | 76,652 | |
3.5000%, 4/1/52 | 1,837,752 | 1,655,267 | |
3.5000%, 4/1/52 | 982,552 | 882,637 | |
3.5000%, 4/1/52 | 977,305 | 877,924 | |
3.5000%, 4/1/52 | 304,827 | 274,248 | |
3.5000%, 4/1/52 | 278,956 | 250,993 | |
2.5000%, 5/1/52 | 12,398,781 | 10,141,593 | |
2.5000%, 5/1/52 | 3,884,729 | 3,214,155 | |
3.0000%, 6/1/52 | 11,181,732 | 9,659,472 | |
5.5000%, 9/1/52 | 2,084,793 | 2,076,187 | |
5.0000%, 10/1/52 | 3,242,008 | 3,152,048 | |
5.0000%, 10/1/52 | 99,925 | 97,152 | |
5.5000%, 10/1/52 | 125,403 | 125,076 | |
5.0000%, 1/1/53 | 211,025 | 205,170 | |
5.0000%, 1/1/53 | 183,310 | 178,223 | |
5.0000%, 3/1/53 | 773,458 | 751,476 | |
5.0000%, 3/1/53 | 743,912 | 722,770 | |
5.0000%, 4/1/53 | 927,242 | 898,510 | |
5.0000%, 5/1/53 | 1,912,964 | 1,858,597 | |
5.0000%, 5/1/53 | 1,061,187 | 1,031,028 | |
5.0000%, 5/1/53 | 206,704 | 200,829 | |
5.5000%, 5/1/53 | 1,765,059 | 1,752,447 | |
5.5000%, 5/1/53 | 782,409 | 777,729 | |
5.0000%, 6/1/53 | 1,442,359 | 1,401,367 | |
5.0000%, 6/1/53 | 717,701 | 693,262 | |
5.0000%, 6/1/53 | 712,103 | 687,834 | |
5.0000%, 6/1/53 | 567,412 | 548,091 | |
5.0000%, 6/1/53 | 269,456 | 260,272 | |
5.5000%, 6/1/53 | 1,794,485 | 1,783,750 | |
5.5000%, 6/1/53 | 685,287 | 675,742 | |
5.5000%, 6/1/53 | 565,269 | 557,396 | |
5.5000%, 6/1/53 | 542,623 | 535,065 | |
5.5000%, 6/1/53 | 438,117 | 432,000 | |
5.0000%, 7/1/53 | 1,255,656 | 1,230,679 | |
5.0000%, 7/1/53 | 886,010 | 869,827 | |
5.5000%, 7/1/53 | 1,933,360 | 1,921,528 | |
5.5000%, 7/1/53 | 1,335,832 | 1,317,225 | |
5.5000%, 7/1/53 | 1,243,866 | 1,236,254 | |
5.0000%, 8/1/53 | 12,714,631 | 12,470,627 | |
5.0000%, 9/1/53 | 258,642 | 253,287 | |
5.5000%, 9/1/53 | 1,604,904 | 1,610,875 | |
6.0000%, 9/1/53 | 12,493,664 | 12,659,450 | |
6.0000%, 9/1/53 | 3,772,534 | 3,859,216 | |
6.0000%, 10/1/53 | 6,948,681 | 6,994,282 | |
6.5000%, 11/1/53 | 4,960,319 | 5,106,814 | |
5.5000%, 4/1/54 | 1,085,284 | 1,089,687 | |
6.0000%, 4/1/54 | 5,024,113 | 5,091,093 | |
196,118,584 | |||
Ginnie Mae: | |||
2.5000%, TBA, 30 Year Maturity | 20,180,765 | 16,963,366 | |
4.0000%, TBA, 30 Year Maturity | 11,354,740 | 10,493,319 | |
4.5000%, TBA, 30 Year Maturity | 9,618,566 | 9,141,947 | |
5.0000%, TBA, 30 Year Maturity | 4,526,907 | 4,407,590 | |
41,006,222 |
Schedule of Investments
June 30, 2024
Shares or Principal Amounts | Value | ||
Mortgage-Backed Securities – (continued) | |||
Ginnie Mae I Pool: | |||
4.0000%, 8/15/47 | $424,439 | $397,601 | |
4.0000%, 11/15/47 | 379,330 | 353,311 | |
4.0000%, 12/15/47 | 1,183,158 | 1,102,005 | |
1,852,917 | |||
Ginnie Mae II Pool: | |||
3.0000%, 11/20/46 | 9,779,077 | 8,640,038 | |
4.0000%, 8/20/47 | 287,671 | 269,682 | |
4.0000%, 8/20/47 | 109,888 | 103,016 | |
4.5000%, 2/20/48 | 1,292,528 | 1,243,955 | |
4.0000%, 5/20/48 | 5,454,581 | 5,098,558 | |
4.5000%, 5/20/48 | 479,249 | 461,200 | |
4.0000%, 6/20/48 | 1,541,661 | 1,441,036 | |
5.0000%, 8/20/48 | 1,476,322 | 1,457,880 | |
3.5000%, 5/20/49 | 12,909,861 | 11,680,711 | |
2.5000%, 3/20/51 | 12,346,352 | 10,396,530 | |
3.0000%, 4/20/51 | 4,328,987 | 3,777,513 | |
3.0000%, 7/20/51 | 6,556,537 | 5,718,258 | |
3.0000%, 8/20/51 | 18,801,045 | 16,394,357 | |
2.5000%, 1/20/52 | 12,953,043 | 10,703,796 | |
77,386,530 | |||
Total Mortgage-Backed Securities (cost $683,519,772) | 652,062,878 | ||
United States Treasury Notes/Bonds – 5.6% | |||
4.5000%, 5/31/29 | 21,185,000 | 21,328,992 | |
4.6250%, 5/31/31 | 7,254,000 | 7,371,877 | |
4.3750%, 5/15/34 | 98,802,400 | 98,833,276 | |
4.6250%, 5/15/44# | 8,081,000 | 8,065,848 | |
4.2500%, 2/15/54 | 9,689,600 | 9,226,316 | |
Total United States Treasury Notes/Bonds (cost $143,535,987) | 144,826,309 | ||
Investment Companies – 4.8% | |||
Money Markets – 4.8% | |||
Janus Henderson Cash Liquidity Fund LLC, 5.3419%ºº,£ (cost $124,589,756) | 124,573,732 | 124,598,646 | |
Investments Purchased with Cash Collateral from Securities Lending – 0.7% | |||
Investment Companies – 0.6% | |||
Janus Henderson Cash Collateral Fund LLC, 5.2795%ºº,£ | 14,302,614 | 14,302,614 | |
Time Deposits – 0.1% | �� | ||
Royal Bank of Canada, 5.3100%, 7/1/24 | $3,575,654 | 3,575,654 | |
Total Investments Purchased with Cash Collateral from Securities Lending (cost $17,878,268) | 17,878,268 | ||
Total Investments (total cost $2,770,474,807) – 104.6% | 2,724,932,719 | ||
Liabilities, net of Cash, Receivables and Other Assets – (4.6)% | (120,147,909) | ||
Net Assets – 100% | $2,604,784,810 |
Summary of Investments by Country - (Long Positions) (unaudited) | ||
Country | Value | % of Investment Securities |
United States | $2,660,707,435 | 97.6 % |
Canada | 20,382,888 | 0.8 |
United Kingdom | 15,330,949 | 0.6 |
France | 11,339,392 | 0.4 |
Switzerland | 9,325,583 | 0.3 |
Germany | 5,210,344 | 0.2 |
Japan | 2,636,128 | 0.1 |
Total | $2,724,932,719 | 100.0 % |
Schedule of Investments
June 30, 2024
Schedule of Affiliated Investments - (% of Net Assets) | ||||||||
Affiliate | Affiliated Investments, at Value at 6/30/23 | Purchases | Sales Proceeds | Realized Gain/(Loss) | Change in Unrealized Appreciation/ Depreciation | Affiliated Investments, at Value at 6/30/24 | Ending Shares | Dividend Income |
Investment Companies - 4.8% | ||||||||
Money Markets - 4.8% | ||||||||
Janus Henderson Cash Liquidity Fund LLC, 5.3419%ºº | ||||||||
$251,620,828 | $1,368,437,971 | $(1,495,459,827) | $15,942 | $(16,268) | $124,598,646 | 124,573,732 | $10,317,783 | |
Investments Purchased with Cash Collateral from Securities Lending - 0.6% | ||||||||
Investment Companies - 0.6% | ||||||||
Janus Henderson Cash Collateral Fund LLC, 5.2795%ºº | ||||||||
678,968 | 359,472,750 | (345,849,104) | - | - | 14,302,614 | 14,302,614 | 274,432 ∆ | |
Total Affiliated Investments - 5.4% | ||||||||
$252,299,796 | $1,727,910,721 | $(1,841,308,931) | $15,942 | $(16,268) | $138,901,260 | 138,876,346 | $10,592,215 |
Schedule of Futures | ||||
Description | Number of Contracts | Expiration Date | Notional Amount | Value and Unrealized Appreciation/(Depreciation) |
Futures Long: | ||||
2 Year US Treasury Note | 1,767 | 10/3/24 | $360,854,531 | $1,180,764 |
5 Year US Treasury Note | 4,980 | 10/3/24 | 530,759,063 | 4,098,516 |
Ultra Long Term US Treasury Bond | 820 | 9/30/24 | 102,781,875 | 3,378,215 |
US Treasury Long Bond | 2,283 | 9/30/24 | 270,107,438 | 7,846,232 |
Total - Futures Long | 16,503,727 | |||
Futures Short: | ||||
10 Year US Treasury Note | 270 | 9/30/24 | (29,695,781) | (379,387) |
Ultra 10-Year Treasury Note | 2,209 | 9/30/24 | (250,790,531) | (4,764,643) |
Total - Futures Short | (5,144,030) | |||
Total | $11,359,697 |
Fair Value of Derivative Instruments (not accounted for as hedging instruments) as of June 30, 2024 | |
Interest Rate Contracts | |
Asset Derivatives: | |
*Futures contracts | $16,503,727 |
Liability Derivatives: | |
*Futures contracts | $5,144,030 |
* | The fair value presented includes net cumulative unrealized appreciation (depreciation) on futures contracts and centrally cleared swaps. In the Statement of Assets and Liabilities, only current day's variation margin is reported in receivables or payables and the net cumulative unrealized appreciation (depreciation) is included in total distributable earnings (loss). |
Schedule of Investments
June 30, 2024
The effect of Derivative Instruments (not accounted for as hedging instruments) on the Statement of Operations for the year ended June 30, 2024 | |||
Amount of Realized Gain/(Loss) Recognized on Derivatives | |||
Derivative | Credit Contracts | Interest Rate Contracts | Total |
Futures contracts | $- | $(42,223,969) | $(42,223,969) |
Swap contracts | (185,250) | - | $(185,250) |
Total | $(185,250) | $(42,223,969) | $(42,409,219) |
Amount of Change in Unrealized Appreciation/Depreciation Recognized on Derivatives | |
Derivative | Interest Rate Contracts |
Futures contracts | $26,852,822 |
Average Ending Monthly Value of Derivative Instruments During the Year Ended June 30, 2024 | |
Futures contracts: | |
Average notional amount of contracts - long | $1,368,452,028 |
Average notional amount of contracts - short | 196,695,237 |
Offsetting of Financial Assets and Derivative Assets | ||||
Counterparty | Gross Amounts of Recognized Assets | Offsetting Asset or Liability(a) | Collateral Pledged(b) | Net Amount |
JPMorgan Chase Bank, National Association | $17,195,268 | $— | $(17,195,268) | $— |
(a) | Represents the amount of assets or liabilities that could be offset with the same counterparty under master netting or similar agreements that management elects not to offset on the Statement of Assets and Liabilities. |
(b) | Collateral pledged is limited to the net outstanding amount due to/from an individual counterparty. The actual collateral amounts pledged may exceed these amounts and may fluctuate in value. |
Notes to Schedule of Investments and Other Information
IBOR | Interbank Offered Rate |
LLC | Limited Liability Company |
LP | Limited Partnership |
PLC | Public Limited Company |
SOFR | Secured Overnight Financing Rate |
TBA | (To Be Announced) Securities are purchased/sold on a forward commitment basis with an approximate principal amount and no defined maturity date. The actual principal and maturity date will be determined upon settlement when specific mortgage pools are assigned. |
ž | Securities sold under Rule 144A of the Securities Act of 1933, as amended, are subject to legal and/or contractual restrictions on resale and may not be publicly sold without registration under the 1933 Act. Unless otherwise noted, these securities have been determined to be liquid under guidelines established by the Board of Trustees. The total value of 144A securities as of the year ended June 30, 2024 is $1,155,864,929, which represents 44.4% of net assets. |
ƒ | All or a portion of this position is not funded, or has been purchased on a delayed delivery or when-issued basis. If applicable, interest rates will be determined and interest will begin to accrue at a future date. See Notes to Financial Statements. |
‡ | Variable or floating rate security. Rate shown is the current rate as of June 30, 2024. Certain variable rate securities are not based on a published reference rate and spread; they are determined by the issuer or agent and current market conditions. Reference rate is as of reset date and may vary by security, which may not indicate a reference rate and/or spread in their description. |
ºº | Rate shown is the 7-day yield as of June 30, 2024. |
# | Loaned security; a portion of the security is on loan at June 30, 2024. |
μ | Perpetual security. Perpetual securities have no stated maturity date, but they may be called/redeemed by the issuer. The date indicated, if any, represents the next call date. |
Ç | Step bond. The coupon rate will increase or decrease periodically based upon a predetermined schedule. The rate shown reflects the current rate. |
◊ | Zero coupon bond. |
¤ | Interest only security. An interest only security represents the interest only portion of a pool of underlying mortgages or mortgage-backed securities which are separated and sold individually from the principal portion of the securities. Principal amount shown represents the par value on which interest payments are based. |
£ | The Fund may invest in certain securities that are considered affiliated companies. As defined by the Investment Company Act of 1940, as amended, an affiliated company is one in which the Fund owns 5% or more of the outstanding voting securities, or a company which is under common ownership or control. |
∆ | Net of income paid to the securities lending agent and rebates paid to the borrowing counterparties. |
Notes to Schedule of Investments and Other Information
Valuation Inputs Summary | |||
Level 1 - Quoted Prices | Level 2 - Other Significant Observable Inputs | Level 3 - Significant Unobservable Inputs | |
Assets | |||
Investments In Securities: | |||
Asset-Backed/Commercial Mortgage-Backed Securities | $- | $792,318,779 | $- |
Bank Loans and Mezzanine Loans | - | 50,720,432 | - |
Corporate Bonds | - | 942,527,407 | - |
Mortgage-Backed Securities | - | 652,062,878 | - |
United States Treasury Notes/Bonds | - | 144,826,309 | - |
Investment Companies | - | 124,598,646 | - |
Investments Purchased with Cash Collateral from Securities Lending | - | 17,878,268 | - |
Total Investments in Securities | $- | $2,724,932,719 | $- |
Other Financial Instruments(a): | |||
Futures Contracts | 16,503,727 | - | - |
Total Assets | $16,503,727 | $2,724,932,719 | $- |
Liabilities | |||
Other Financial Instruments(a): | |||
Futures Contracts | $5,144,030 | $- | $- |
(a) | Other financial instruments may include forward foreign currency exchange contracts, futures, written options, written swaptions, and swap contracts. Forward foreign currency exchange contracts, futures contracts, and swap contracts are reported at their unrealized appreciation/(depreciation) at measurement date, which represents the change in the contract's value from trade date. Written options and written swaptions are reported at their market value at measurement date. |
Statement of Assets and Liabilities
June 30, 2024
Assets: | |
Unaffiliated investments, at value (cost $2,631,582,437)(1) | $2,586,031,459 |
Affiliated investments, at value (cost $138,892,370) | 138,901,260 |
Cash | 63,112 |
Collateral for To Be Announced transactions | 190,000 |
Deposits with brokers for futures | 17,300,000 |
Variation margin receivable on futures contracts | 1,141,748 |
Trustees' deferred compensation | 71,509 |
Receivables: | |
Investments sold | 32,393,762 |
Interest | 19,080,908 |
TBA investments sold | 4,581,507 |
Fund shares sold | 2,994,524 |
Dividends from affiliates | 467,289 |
Other assets | 114,296 |
Total Assets | 2,803,331,374 |
Liabilities: | |
Collateral for securities loaned (Note 3) | 17,878,268 |
Variation margin payable on futures contracts | 4,227,228 |
Payables: | |
Investments purchased | 111,014,232 |
TBA investments purchased | 57,659,027 |
Fund shares repurchased | 5,269,555 |
Dividends | 1,094,848 |
Advisory fees | 698,508 |
Transfer agent fees and expenses | 285,369 |
Professional fees | 84,956 |
Trustees' deferred compensation fees | 71,509 |
12b-1 Distribution and shareholder servicing fees | 45,827 |
Trustees' fees and expenses | 14,496 |
Affiliated fund administration fees payable | 5,337 |
Custodian fees | 1,897 |
Accrued expenses and other payables | 195,507 |
Total Liabilities | 198,546,564 |
Commitments and contingent liabilities (Note 4) | |
Net Assets | $2,604,784,810 |
Statement of Assets and Liabilities
June 30, 2024
Net Assets Consist of: | |
Capital (par value and paid-in surplus) | $3,223,610,342 |
Total distributable earnings (loss) | (618,825,532) |
Total Net Assets | $2,604,784,810 |
Net Assets - Class A Shares | $101,054,730 |
Shares Outstanding, $0.01 Par Value (unlimited shares authorized) | 10,974,382 |
Net Asset Value Per Share(2) | $9.21 |
Maximum Offering Price Per Share(3) | $9.67 |
Net Assets - Class C Shares | $19,527,723 |
Shares Outstanding, $0.01 Par Value (unlimited shares authorized) | 2,119,953 |
Net Asset Value Per Share(2) | $9.21 |
Net Assets - Class D Shares | $412,080,600 |
Shares Outstanding, $0.01 Par Value (unlimited shares authorized) | 44,739,473 |
Net Asset Value Per Share | $9.21 |
Net Assets - Class I Shares | $1,240,733,770 |
Shares Outstanding, $0.01 Par Value (unlimited shares authorized) | 134,679,378 |
Net Asset Value Per Share | $9.21 |
Net Assets - Class N Shares | $526,371,496 |
Shares Outstanding, $0.01 Par Value (unlimited shares authorized) | 57,189,483 |
Net Asset Value Per Share | $9.20 |
Net Assets - Class R Shares | $14,254,090 |
Shares Outstanding, $0.01 Par Value (unlimited shares authorized) | 1,547,170 |
Net Asset Value Per Share | $9.21 |
Net Assets - Class S Shares | $15,403,305 |
Shares Outstanding, $0.01 Par Value (unlimited shares authorized) | 1,672,232 |
Net Asset Value Per Share | $9.21 |
Net Assets - Class T Shares | $275,359,096 |
Shares Outstanding, $0.01 Par Value (unlimited shares authorized) | 29,900,117 |
Net Asset Value Per Share | $9.21 |
(1) | Includes $17,195,268 of securities on loan. See Note 3 in Notes to Financial Statements. |
(2) | Redemption price per share may be reduced for any applicable contingent deferred sales charge. |
(3) | Maximum offering price is computed at 100/95.25 of net asset value. |
Statement of Operations
For the year ended June 30, 2024
Investment Income: | |
Interest | $126,709,277 |
Dividends from affiliates | 10,317,783 |
Affiliated securities lending income, net | 274,432 |
Unaffiliated securities lending income, net | 71,228 |
Other income | 770,515 |
Total Investment Income | 138,143,235 |
Expenses: | |
Advisory fees | 11,004,115 |
12b-1 Distribution and shareholder servicing fees: | |
Class A Shares | 258,795 |
Class C Shares | 230,388 |
Class R Shares | 76,995 |
Class S Shares | 35,590 |
Transfer agent administrative fees and expenses: | |
Class D Shares | 475,043 |
Class R Shares | 38,808 |
Class S Shares | 35,586 |
Class T Shares | 753,602 |
Transfer agent networking and omnibus fees: | |
Class A Shares | 189,228 |
Class C Shares | 17,044 |
Class I Shares | 1,088,755 |
Other transfer agent fees and expenses: | |
Class A Shares | 5,436 |
Class C Shares | 993 |
Class D Shares | 77,615 |
Class I Shares | 60,481 |
Class N Shares | 18,092 |
Class R Shares | 475 |
Class S Shares | 313 |
Class T Shares | 3,957 |
Shareholder reports expense | 216,956 |
Registration fees | 169,787 |
Professional fees | 104,736 |
Affiliated fund administration fees | 66,911 |
Trustees' fees and expenses | 57,050 |
Custodian fees | 55,387 |
Other expenses | 278,456 |
Total Expenses | 15,320,594 |
Less: Excess Expense Reimbursement and Waivers | (1,317,809) |
Net Expenses | 14,002,785 |
Net Investment Income/(Loss) | 124,140,450 |
Net Realized Gain/(Loss) on Investments: | |
Investments | (93,531,397) |
Investments in affiliates | 15,942 |
Futures contracts | (42,223,969) |
Swap contracts | (185,250) |
Total Net Realized Gain/(Loss) on Investments | (135,924,674) |
Change in Unrealized Net Appreciation/Depreciation: | |
Investments and Trustees' deferred compensation | 78,380,543 |
Investments in affiliates | (16,268) |
Futures contracts | 26,852,822 |
Total Change in Unrealized Net Appreciation/Depreciation | 105,217,097 |
Net Increase/(Decrease) in Net Assets Resulting from Operations | $93,432,873 |
Statements of Changes in Net Assets
Year ended June 30, 2024 | Year ended June 30, 2023 | |
Operations: | ||
Net investment income/(loss) | $124,140,450 | $100,730,416 |
Net realized gain/(loss) on investments | (135,924,674) | (243,097,908) |
Change in unrealized net appreciation/depreciation | 105,217,097 | 97,008,000 |
Net Increase/(Decrease) in Net Assets Resulting from Operations | 93,432,873 | (45,359,492) |
Dividends and Distributions to Shareholders: | ||
Class A Shares | (4,665,824) | (3,658,551) |
Class C Shares | (883,554) | (869,717) |
Class D Shares | (19,359,312) | (15,693,299) |
Class I Shares | (63,346,853) | (50,800,690) |
Class N Shares | (22,304,784) | (16,123,613) |
Class R Shares | (621,298) | (508,784) |
Class S Shares | (607,502) | (439,859) |
Class T Shares | (13,615,380) | (12,017,415) |
Total Dividends and Distributions to Shareholders | (125,404,507) | (100,111,928) |
Return of Capital on Dividends and Distributions: | ||
Class A Shares | — | (75,544) |
Class C Shares | — | (23,801) |
Class D Shares | — | (312,644) |
Class I Shares | — | (974,821) |
Class N Shares | — | (309,806) |
Class R Shares | — | (12,473) |
Class S Shares | — | (9,845) |
Class T Shares | — | (247,782) |
Total Return of Capital on Dividends and Distributions | — | (1,966,716) |
Net Decrease from Dividends and Distributions to Shareholders | (125,404,507) | (102,078,644) |
Capital Share Transactions: | ||
Class A Shares | (10,326,342) | 4,030,249 |
Class C Shares | (8,639,104) | (13,764,677) |
Class D Shares | (25,870,927) | (31,617,091) |
Class I Shares | (230,719,019) | 35,370,063 |
Class N Shares | 49,063,821 | (44,483,585) |
Class R Shares | (3,202,639) | (1,560,405) |
Class S Shares | 1,040,680 | 205,450 |
Class T Shares | (68,926,362) | (16,923,475) |
Net Increase/(Decrease) from Capital Share Transactions | (297,579,892) | (68,743,471) |
Net Increase/(Decrease) in Net Assets | (329,551,526) | (216,181,607) |
Net Assets: | ||
Beginning of period | 2,934,336,336 | 3,150,517,943 |
End of period | $2,604,784,810 | $2,934,336,336 |
Financial Highlights
Class A Shares | |||||
For a share outstanding during the year ended June 30 | 2024 | 2023 | 2022 | 2021 | 2020 |
Net Asset Value, Beginning of Period | $9.30 | $9.76 | $11.16 | $11.14 | $10.39 |
Income/(Loss) from Investment Operations: | |||||
Net investment income/(loss)(1) | 0.41 | 0.31 | 0.17 | 0.20 | 0.25 |
Net realized and unrealized gain/(loss) | (0.09) | (0.46) | (1.38) | 0.04 | 0.76 |
Total from Investment Operations | 0.32 | (0.15) | (1.21) | 0.24 | 1.01 |
Less Dividends and Distributions: | |||||
Dividends (from net investment income) | (0.41) | (0.31) | (0.19) | (0.22) | (0.26) |
Return of capital | — | — (2) | — | — | — |
Total Dividends and Distributions | (0.41) | (0.31) | (0.19) | (0.22) | (0.26) |
Net Asset Value, End of Period | $9.21 | $9.30 | $9.76 | $11.16 | $11.14 |
Total Return* | 3.57% | (1.50)% | (11.00)% | 2.19% | 9.90% |
Net Assets, End of Period (in thousands) | $101,055 | $112,400 | $113,840 | $144,886 | $118,862 |
Ratios to Average Net Assets**: | |||||
Ratio of Gross Expenses | 0.88% | 0.89% | 0.85% | 0.86% | 0.92% |
Ratio of Net Expenses (After Waivers and Expense Offsets) | 0.70% | 0.71% | 0.76% | 0.86% | 0.88% |
Ratio of Net Investment Income/(Loss) | 4.43% | 3.26% | 1.59% | 1.74% | 2.30% |
Portfolio Turnover Rate(3) | 170% | 195% | 158% | 132% | 175% |
* | Total return includes adjustments in accordance with generally accepted accounting principles required at the year or period end and are not annualized for periods of less than one full year. Returns shown exclude any applicable sales charges. |
** | Annualized for periods of less than one full year. |
(1) | Per share amounts are calculated based on average shares outstanding during the year or period. |
(2) | Less than $0.005 on a per share basis. |
(3) | Portfolio Turnover Rate excludes TBA (to be announced) purchase and sales commitments. |
Financial Highlights
Class C Shares | |||||
For a share outstanding during the year ended June 30 | 2024 | 2023 | 2022 | 2021 | 2020 |
Net Asset Value, Beginning of Period | $9.30 | $9.76 | $11.16 | $11.14 | $10.39 |
Income/(Loss) from Investment Operations: | |||||
Net investment income/(loss)(1) | 0.34 | 0.24 | 0.09 | 0.13 | 0.18 |
Net realized and unrealized gain/(loss) | (0.08) | (0.46) | (1.38) | 0.05 | 0.77 |
Total from Investment Operations | 0.26 | (0.22) | (1.29) | 0.18 | 0.95 |
Less Dividends and Distributions: | |||||
Dividends (from net investment income) | (0.35) | (0.24) | (0.11) | (0.16) | (0.20) |
Return of capital | — | — (2) | — | — | — |
Total Dividends and Distributions | (0.35) | (0.24) | (0.11) | (0.16) | (0.20) |
Net Asset Value, End of Period | $9.21 | $9.30 | $9.76 | $11.16 | $11.14 |
Total Return* | 2.83% | (2.21)% | (11.62)% | 1.60% | 9.23% |
Net Assets, End of Period (in thousands) | $19,528 | $28,509 | $44,112 | $74,867 | $122,908 |
Ratios to Average Net Assets**: | |||||
Ratio of Gross Expenses | 1.50% | 1.51% | 1.49% | 1.44% | 1.50% |
Ratio of Net Expenses (After Waivers and Expense Offsets) | 1.43% | 1.43% | 1.45% | 1.44% | 1.50% |
Ratio of Net Investment Income/(Loss) | 3.68% | 2.47% | 0.88% | 1.17% | 1.67% |
Portfolio Turnover Rate(3) | 170% | 195% | 158% | 132% | 175% |
* | Total return includes adjustments in accordance with generally accepted accounting principles required at the year or period end and are not annualized for periods of less than one full year. Returns shown exclude any applicable sales charges. |
** | Annualized for periods of less than one full year. |
(1) | Per share amounts are calculated based on average shares outstanding during the year or period. |
(2) | Less than $0.005 on a per share basis. |
(3) | Portfolio Turnover Rate excludes TBA (to be announced) purchase and sales commitments. |
Financial Highlights
Class D Shares | |||||
For a share outstanding during the year ended June 30 | 2024 | 2023 | 2022 | 2021 | 2020 |
Net Asset Value, Beginning of Period | $9.30 | $9.76 | $11.16 | $11.14 | $10.39 |
Income/(Loss) from Investment Operations: | |||||
Net investment income/(loss)(1) | 0.42 | 0.32 | 0.19 | 0.23 | 0.28 |
Net realized and unrealized gain/(loss) | (0.09) | (0.45) | (1.38) | 0.05 | 0.77 |
Total from Investment Operations | 0.33 | (0.13) | (1.19) | 0.28 | 1.05 |
Less Dividends and Distributions: | |||||
Dividends (from net investment income) | (0.42) | (0.33) | (0.21) | (0.26) | (0.30) |
Return of capital | — | — (2) | — | — | — |
Total Dividends and Distributions | (0.42) | (0.33) | (0.21) | (0.26) | (0.30) |
Net Asset Value, End of Period | $9.21 | $9.30 | $9.76 | $11.16 | $11.14 |
Total Return* | 3.71% | (1.37)% | (10.83)% | 2.49% | 10.22% |
Net Assets, End of Period (in thousands) | $412,081 | $442,271 | $496,739 | $639,286 | $641,920 |
Ratios to Average Net Assets**: | |||||
Ratio of Gross Expenses | 0.59% | 0.59% | 0.57% | 0.57% | 0.59% |
Ratio of Net Expenses (After Waivers and Expense Offsets) | 0.56% | 0.57% | 0.57% | 0.57% | 0.59% |
Ratio of Net Investment Income/(Loss) | 4.57% | 3.38% | 1.78% | 2.03% | 2.58% |
Portfolio Turnover Rate(3) | 170% | 195% | 158% | 132% | 175% |
* | Total return includes adjustments in accordance with generally accepted accounting principles required at the year or period end and are not annualized for periods of less than one full year. |
** | Annualized for periods of less than one full year. |
(1) | Per share amounts are calculated based on average shares outstanding during the year or period. |
(2) | Less than $0.005 on a per share basis. |
(3) | Portfolio Turnover Rate excludes TBA (to be announced) purchase and sales commitments. |
Financial Highlights
Class I Shares | |||||
For a share outstanding during the year ended June 30 | 2024 | 2023 | 2022 | 2021 | 2020 |
Net Asset Value, Beginning of Period | $9.30 | $9.76 | $11.16 | $11.14 | $10.39 |
Income/(Loss) from Investment Operations: | |||||
Net investment income/(loss)(1) | 0.43 | 0.33 | 0.20 | 0.24 | 0.28 |
Net realized and unrealized gain/(loss) | (0.09) | (0.45) | (1.38) | 0.04 | 0.77 |
Total from Investment Operations | 0.34 | (0.12) | (1.18) | 0.28 | 1.05 |
Less Dividends and Distributions: | |||||
Dividends (from net investment income) | (0.43) | (0.34) | (0.22) | (0.26) | (0.30) |
Return of capital | — | — (2) | — | — | — |
Total Dividends and Distributions | (0.43) | (0.34) | (0.22) | (0.26) | (0.30) |
Net Asset Value, End of Period | $9.21 | $9.30 | $9.76 | $11.16 | $11.14 |
Total Return* | 3.83% | (1.25)% | (10.75)% | 2.56% | 10.31% |
Net Assets, End of Period (in thousands) | $1,240,734 | $1,489,875 | $1,527,891 | $1,967,268 | $1,746,376 |
Ratios to Average Net Assets**: | |||||
Ratio of Gross Expenses | 0.53% | 0.53% | 0.51% | 0.50% | 0.51% |
Ratio of Net Expenses (After Waivers and Expense Offsets) | 0.45% | 0.46% | 0.47% | 0.50% | 0.51% |
Ratio of Net Investment Income/(Loss) | 4.67% | 3.51% | 1.87% | 2.10% | 2.67% |
Portfolio Turnover Rate(3) | 170% | 195% | 158% | 132% | 175% |
* | Total return includes adjustments in accordance with generally accepted accounting principles required at the year or period end and are not annualized for periods of less than one full year. |
** | Annualized for periods of less than one full year. |
(1) | Per share amounts are calculated based on average shares outstanding during the year or period. |
(2) | Less than $0.005 on a per share basis. |
(3) | Portfolio Turnover Rate excludes TBA (to be announced) purchase and sales commitments. |
Financial Highlights
Class N Shares | |||||
For a share outstanding during the year ended June 30 | 2024 | 2023 | 2022 | 2021 | 2020 |
Net Asset Value, Beginning of Period | $9.29 | $9.76 | $11.15 | $11.14 | $10.38 |
Income/(Loss) from Investment Operations: | |||||
Net investment income/(loss)(1) | 0.43 | 0.33 | 0.21 | 0.24 | 0.29 |
Net realized and unrealized gain/(loss) | (0.09) | (0.46) | (1.38) | 0.04 | 0.78 |
Total from Investment Operations | 0.34 | (0.13) | (1.17) | 0.28 | 1.07 |
Less Dividends and Distributions: | |||||
Dividends (from net investment income) | (0.43) | (0.34) | (0.22) | (0.27) | (0.31) |
Return of capital | — | — (2) | — | — | — |
Total Dividends and Distributions | (0.43) | (0.34) | (0.22) | (0.27) | (0.31) |
Net Asset Value, End of Period | $9.20 | $9.29 | $9.76 | $11.15 | $11.14 |
Total Return* | 3.84% | (1.35)% | (10.63)% | 2.54% | 10.49% |
Net Assets, End of Period (in thousands) | $526,371 | $481,188 | $549,639 | $487,997 | $539,154 |
Ratios to Average Net Assets**: | |||||
Ratio of Gross Expenses | 0.45% | 0.45% | 0.43% | 0.43% | 0.44% |
Ratio of Net Expenses (After Waivers and Expense Offsets) | 0.45% | 0.45% | 0.43% | 0.43% | 0.44% |
Ratio of Net Investment Income/(Loss) | 4.70% | 3.51% | 1.94% | 2.18% | 2.74% |
Portfolio Turnover Rate(3) | 170% | 195% | 158% | 132% | 175% |
* | Total return includes adjustments in accordance with generally accepted accounting principles required at the year or period end and are not annualized for periods of less than one full year. |
** | Annualized for periods of less than one full year. |
(1) | Per share amounts are calculated based on average shares outstanding during the year or period. |
(2) | Less than $0.005 on a per share basis. |
(3) | Portfolio Turnover Rate excludes TBA (to be announced) purchase and sales commitments. |
Financial Highlights
Class R Shares | |||||
For a share outstanding during the year ended June 30 | 2024 | 2023 | 2022 | 2021 | 2020 |
Net Asset Value, Beginning of Period | $9.30 | $9.76 | $11.16 | $11.15 | $10.39 |
Income/(Loss) from Investment Operations: | |||||
Net investment income/(loss)(1) | 0.36 | 0.26 | 0.12 | 0.16 | 0.21 |
Net realized and unrealized gain/(loss) | (0.08) | (0.45) | (1.38) | 0.04 | 0.78 |
Total from Investment Operations | 0.28 | (0.19) | (1.26) | 0.20 | 0.99 |
Less Dividends and Distributions: | |||||
Dividends (from net investment income) | (0.37) | (0.27) | (0.14) | (0.19) | (0.23) |
Return of capital | — | — (2) | — | — | — |
Total Dividends and Distributions | (0.37) | (0.27) | (0.14) | (0.19) | (0.23) |
Net Asset Value, End of Period | $9.21 | $9.30 | $9.76 | $11.16 | $11.15 |
Total Return* | 3.06% | (1.98)% | (11.38)% | 1.80% | 9.65% |
Net Assets, End of Period (in thousands) | $14,254 | $17,622 | $20,102 | $25,664 | $24,453 |
Ratios to Average Net Assets**: | |||||
Ratio of Gross Expenses | 1.20% | 1.21% | 1.18% | 1.16% | 1.20% |
Ratio of Net Expenses (After Waivers and Expense Offsets) | 1.19% | 1.20% | 1.18% | 1.16% | 1.20% |
Ratio of Net Investment Income/(Loss) | 3.93% | 2.75% | 1.16% | 1.45% | 1.98% |
Portfolio Turnover Rate(3) | 170% | 195% | 158% | 132% | 175% |
* | Total return includes adjustments in accordance with generally accepted accounting principles required at the year or period end and are not annualized for periods of less than one full year. |
** | Annualized for periods of less than one full year. |
(1) | Per share amounts are calculated based on average shares outstanding during the year or period. |
(2) | Less than $0.005 on a per share basis. |
(3) | Portfolio Turnover Rate excludes TBA (to be announced) purchase and sales commitments. |
Financial Highlights
Class S Shares | |||||
For a share outstanding during the year ended June 30 | 2024 | 2023 | 2022 | 2021 | 2020 |
Net Asset Value, Beginning of Period | $9.30 | $9.76 | $11.16 | $11.14 | $10.39 |
Income/(Loss) from Investment Operations: | |||||
Net investment income/(loss)(1) | 0.38 | 0.29 | 0.15 | 0.19 | 0.24 |
Net realized and unrealized gain/(loss) | (0.08) | (0.46) | (1.38) | 0.04 | 0.77 |
Total from Investment Operations | 0.30 | (0.17) | (1.23) | 0.23 | 1.01 |
Less Dividends and Distributions: | |||||
Dividends (from net investment income) | (0.39) | (0.29) | (0.17) | (0.21) | (0.26) |
Return of capital | — | — (2) | — | — | — |
Total Dividends and Distributions | (0.39) | (0.29) | (0.17) | (0.21) | (0.26) |
Net Asset Value, End of Period | $9.21 | $9.30 | $9.76 | $11.16 | $11.14 |
Total Return* | 3.32% | (1.74)% | (11.17)% | 2.11% | 9.83% |
Net Assets, End of Period (in thousands) | $15,403 | $14,489 | $15,002 | $19,114 | $18,630 |
Ratios to Average Net Assets**: | |||||
Ratio of Gross Expenses | 0.96% | 0.97% | 0.95% | 0.94% | 0.95% |
Ratio of Net Expenses (After Waivers and Expense Offsets) | 0.95% | 0.95% | 0.94% | 0.94% | 0.95% |
Ratio of Net Investment Income/(Loss) | 4.20% | 3.01% | 1.41% | 1.66% | 2.24% |
Portfolio Turnover Rate(3) | 170% | 195% | 158% | 132% | 175% |
* | Total return includes adjustments in accordance with generally accepted accounting principles required at the year or period end and are not annualized for periods of less than one full year. |
** | Annualized for periods of less than one full year. |
(1) | Per share amounts are calculated based on average shares outstanding during the year or period. |
(2) | Less than $0.005 on a per share basis. |
(3) | Portfolio Turnover Rate excludes TBA (to be announced) purchase and sales commitments. |
Financial Highlights
Class T Shares | |||||
For a share outstanding during the year ended June 30 | 2024 | 2023 | 2022 | 2021 | 2020 |
Net Asset Value, Beginning of Period | $9.30 | $9.76 | $11.16 | $11.14 | $10.39 |
Income/(Loss) from Investment Operations: | |||||
Net investment income/(loss)(1) | 0.41 | 0.31 | 0.18 | 0.22 | 0.27 |
Net realized and unrealized gain/(loss) | (0.09) | (0.45) | (1.38) | 0.04 | 0.77 |
Total from Investment Operations | 0.32 | (0.14) | (1.20) | 0.26 | 1.04 |
Less Dividends and Distributions: | |||||
Dividends (from net investment income) | (0.41) | (0.32) | (0.20) | (0.24) | (0.29) |
Return of capital | — | — (2) | — | — | — |
Total Dividends and Distributions | (0.41) | (0.32) | (0.20) | (0.24) | (0.29) |
Net Asset Value, End of Period | $9.21 | $9.30 | $9.76 | $11.16 | $11.14 |
Total Return* | 3.59% | (1.48)% | (10.93)% | 2.39% | 10.12% |
Net Assets, End of Period (in thousands) | $275,359 | $347,983 | $383,193 | $547,371 | $597,879 |
Ratios to Average Net Assets**: | |||||
Ratio of Gross Expenses | 0.69% | 0.70% | 0.68% | 0.68% | 0.69% |
Ratio of Net Expenses (After Waivers and Expense Offsets) | 0.68% | 0.69% | 0.67% | 0.67% | 0.68% |
Ratio of Net Investment Income/(Loss) | 4.44% | 3.27% | 1.67% | 1.94% | 2.49% |
Portfolio Turnover Rate(3) | 170% | 195% | 158% | 132% | 175% |
* | Total return includes adjustments in accordance with generally accepted accounting principles required at the year or period end and are not annualized for periods of less than one full year. |
** | Annualized for periods of less than one full year. |
(1) | Per share amounts are calculated based on average shares outstanding during the year or period. |
(2) | Less than $0.005 on a per share basis. |
(3) | Portfolio Turnover Rate excludes TBA (to be announced) purchase and sales commitments. |
Notes to Financial Statements
Average Daily Net Assets of the Fund | Contractual Investment Advisory Fee (%) |
First $300 Million | 0.50 |
Over $300 Million | 0.40 |
Notes to Financial Statements
Average Daily Net Assets of Class D Shares of the Janus Henderson funds | Administrative Services Fee |
Under $40 billion | 0.12% |
$40 billion — $49.9 billion | 0.10% |
Over $49.9 billion | 0.08% |
Notes to Financial Statements
Undistributed Ordinary Income | Undistributed Long-Term Gains | Accumulated Capital Losses | Loss Deferrals | Other Book to Tax Differences | Net Tax Appreciation/ (Depreciation) |
$2,598,429 | $- | $(577,444,536) | $- | $(46,511) | $(43,932,914) |
Capital Loss Carryover Schedule | ||
For the year ended June 30, 2024 | ||
No Expiration | ||
Short-Term | Long-Term | Accumulated Capital Losses |
$(359,399,525) | $(218,045,011) | $(577,444,536) |
Federal Tax Cost | Unrealized Appreciation | Unrealized (Depreciation) | Net Tax Appreciation/ (Depreciation) |
$2,768,865,633 | $17,608,299 | $(61,541,213) | $(43,932,914) |
Federal Tax Cost | Unrealized Appreciation | Unrealized (Depreciation) | Net Tax Appreciation/ (Depreciation) |
$11,359,697 | $- | $- | $- |
Notes to Financial Statements
For the year ended June 30, 2024 | |||
Distributions | |||
From Ordinary Income | From Long-Term Capital Gains | Tax Return of Capital | Net Investment Loss |
$125,404,507 | $- | $- | $- |
For the year ended June 30, 2023 | |||
Distributions | |||
From Ordinary Income | From Long-Term Capital Gains | Tax Return of Capital | Net Investment Loss |
$100,111,928 | $- | $1,966,716 | $- |
Notes to Financial Statements
Year ended June 30, 2024 | Year ended June 30, 2023 | |||
Shares | Amount | Shares | Amount | |
Class A Shares: | ||||
Shares sold | 2,180,833 | $19,955,277 | 3,639,114 | $34,392,871 |
Reinvested dividends and distributions | 367,217 | 3,362,536 | 283,598 | 2,676,284 |
Shares repurchased | (3,664,893) | (33,644,155) | (3,497,255) | (33,038,906) |
Net Increase/(Decrease) | (1,116,843) | $(10,326,342) | 425,457 | $4,030,249 |
Class C Shares: | ||||
Shares sold | 314,555 | $2,896,318 | 628,916 | $5,915,263 |
Reinvested dividends and distributions | 91,226 | 835,170 | 88,943 | 839,879 |
Shares repurchased | (1,351,548) | (12,370,592) | (2,171,740) | (20,519,819) |
Net Increase/(Decrease) | (945,767) | $(8,639,104) | (1,453,881) | $(13,764,677) |
Class D Shares: | ||||
Shares sold | 3,277,784 | $30,094,255 | 1,931,504 | $18,330,177 |
Reinvested dividends and distributions | 1,969,330 | 18,039,072 | 1,585,804 | 14,975,373 |
Shares repurchased | (8,070,207) | (74,004,254) | (6,843,426) | (64,922,641) |
Net Increase/(Decrease) | (2,823,093) | $(25,870,927) | (3,326,118) | $(31,617,091) |
Class I Shares: | ||||
Shares sold | 34,110,321 | $313,275,224 | 61,228,049 | $580,131,750 |
Reinvested dividends and distributions | 5,993,730 | 54,905,147 | 4,664,635 | 44,044,317 |
Shares repurchased | (65,622,533) | (598,899,390) | (62,200,366) | (588,806,004) |
Net Increase/(Decrease) | (25,518,482) | $(230,719,019) | 3,692,318 | $35,370,063 |
Class N Shares: | ||||
Shares sold | 16,973,727 | $155,259,947 | 13,258,201 | $125,587,876 |
Reinvested dividends and distributions | 2,166,830 | 19,838,147 | 1,522,259 | 14,371,001 |
Shares repurchased | (13,733,680) | (126,034,273) | (19,330,656) | (184,442,462) |
Net Increase/(Decrease) | 5,406,877 | $49,063,821 | (4,550,196) | $(44,483,585) |
Class R Shares: | ||||
Shares sold | 223,479 | $2,042,943 | 236,065 | $2,246,676 |
Reinvested dividends and distributions | 66,792 | 611,888 | 54,563 | 515,067 |
Shares repurchased | (637,822) | (5,857,470) | (455,039) | (4,322,148) |
Net Increase/(Decrease) | (347,551) | $(3,202,639) | (164,411) | $(1,560,405) |
Class S Shares: | ||||
Shares sold | 420,136 | $3,854,351 | 379,086 | $3,601,384 |
Reinvested dividends and distributions | 66,193 | 606,561 | 47,513 | 448,580 |
Shares repurchased | (372,136) | (3,420,232) | (405,291) | (3,844,514) |
Net Increase/(Decrease) | 114,193 | $1,040,680 | 21,308 | $205,450 |
Class T Shares: | ||||
Shares sold | 2,950,609 | $27,118,884 | 5,938,312 | $56,606,163 |
Reinvested dividends and distributions | 1,464,100 | 13,405,531 | 1,282,679 | 12,109,110 |
Shares repurchased | (11,943,064) | (109,450,777) | (9,057,167) | (85,638,748) |
Net Increase/(Decrease) | (7,528,355) | $(68,926,362) | (1,836,176) | $(16,923,475) |
Purchases of Securities | Proceeds from Sales of Securities | Purchases of Long- Term U.S. Government Obligations | Proceeds from Sales of Long-Term U.S. Government Obligations |
$1,943,365,453 | $1,562,370,123 | $2,315,872,544 | $2,812,942,333 |
Notes to Financial Statements
Report of Independent Registered Public Accounting Firm
August 22, 2024
Designation Requirements (unaudited)
Section 163(j) Interest Dividend | 96% |
Additional Information (unaudited)
June 30, 2024
Schedule of Investments
June 30, 2024
Shares | Value | ||
Investment Companies – 100.0% | |||
Equity Funds – 31.6% | |||
Janus Henderson Adaptive Risk Managed U.S. Equity Fund - Class N Shares£ | 332,194 | $3,701,019 | |
Janus Henderson Enterprise Fund - Class N Shares£ | 45,212 | 6,341,881 | |
Janus Henderson Growth and Income Fund - Class N Shares£ | 93,494 | 6,969,933 | |
Janus Henderson Overseas Fund - Class N Shares£ | 391,697 | 18,499,851 | |
Janus Henderson Research Fund - Class N Shares*,£ | 68,928 | 5,669,934 | |
Janus Henderson Small-Mid Cap Value Fund - Class N Shares£ | 23,546 | 376,979 | |
Janus Henderson Triton Fund - Class N Shares£ | 4,911 | 135,240 | |
Janus Henderson U.S. Dividend Income Fund - Class N Shares£ | 90,732 | 997,159 | |
42,691,996 | |||
Exchange-Traded Funds (ETFs) – 30.7% | |||
iShares Core International Aggregate Bond | 259,501 | 12,954,290 | |
iShares JP Morgan USD Emerging Markets Bond | 126,216 | 11,167,592 | |
iShares Russell 2000 Value | 18,054 | 2,749,624 | |
Janus Henderson Small Cap Growth Alpha£ | 15,036 | 888,026 | |
Vanguard FTSE Emerging Markets | 232,726 | 10,184,090 | |
Vanguard Value | 21,626 | 3,469,026 | |
41,412,648 | |||
Fixed Income Funds – 36.5% | |||
Janus Henderson Developed World Bond Fund - Class N Shares£ | 3,672,402 | 27,726,621 | |
Janus Henderson Flexible Bond Fund - Class N Shares£ | 2,192,198 | 20,168,197 | |
Janus Henderson High-Yield Fund - Class N Shares£ | 123,288 | 891,373 | |
Janus Henderson Short Duration Flexible Bond Fund - Class N Shares£ | 164,459 | 465,419 | |
49,251,610 | |||
Money Markets – 1.2% | |||
Janus Henderson Cash Liquidity Fund LLC, 5.3419%ºº,£ | 1,691,283 | 1,691,622 | |
Total Investments (total cost $131,733,995) – 100.0% | 135,047,876 | ||
Liabilities, net of Cash, Receivables and Other Assets – (0)% | (19,320) | ||
Net Assets – 100% | $135,028,556 |
Schedule of Investments
June 30, 2024
Schedule of Affiliated Investments - (% of Net Assets) | |||||||||
Affiliate | Affiliated Investments, at Value at 6/30/23 | Purchases | Sales Proceeds | Realized Gain/(Loss) | Change in Unrealized Appreciation/ Depreciation | Affiliated Investments, at Value at 6/30/24 | Ending Shares | Dividend Income | Capital Gain Distributions from Underlying Funds |
Investment Companies - 70.0% | |||||||||
Equity Funds - 31.6% | |||||||||
Janus Henderson Adaptive Global Allocation Fund - Class N Shares | |||||||||
$8,294,827 | $524,216 | $(8,833,606) | $132,105 | $(117,542) | $- | - | $698,720 | $138,800 | |
Janus Henderson Adaptive Risk Managed U.S. Equity Fund - Class N Shares | |||||||||
5,555,857 | 346,370 | (2,854,262) | 637,529 | 15,525 | 3,701,019 | 332,194 | 31,966 | 162,909 | |
Janus Henderson Asia Equity Fund - Class N Shares | |||||||||
2,039,935 | 72,579 | (2,235,429) | (29,970) | 152,885 | - | - | 912 | - | |
Janus Henderson Contrarian Fund - Class N Shares | |||||||||
3,523,700 | 299,220 | (3,926,502) | 983,914 | (880,332) | - | - | 20,030 | 196,183 | |
Janus Henderson Emerging Markets Fund - Class N Shares | |||||||||
5,623,909 | 151,566 | (5,984,558) | (356,255) | 565,338 | - | - | 32,692 | - | |
Janus Henderson Enterprise Fund - Class N Shares | |||||||||
2,580,433 | 4,312,486 | (673,925) | 2,508 | 120,379 | 6,341,881 | 45,212 | - | 218,762 | |
Janus Henderson European Focus Fund - Class N Shares | |||||||||
1,515,164 | 1,211,777 | (3,106,683) | 553,649 | (173,907) | - | - | 64,290 | - | |
Janus Henderson Forty Fund - Class N Shares | |||||||||
2,649,937 | 1,288,448 | (4,582,535) | 1,193,827 | (549,677) | - | - | 11,764 | 263,599 | |
Janus Henderson Global Equity Income Fund - Class N Shares | |||||||||
2,379,943 | 2,036,377 | (4,680,105) | (14,536) | 278,321 | - | - | 201,794 | - | |
Janus Henderson Global Real Estate Fund - Class N Shares | |||||||||
2,178,313 | 91,754 | (2,263,601) | 257,453 | (263,919) | - | - | 43,835 | - | |
Janus Henderson Global Research Fund - Class N Shares | |||||||||
1,751,768 | 953,397 | (3,171,212) | 605,126 | (139,079) | - | - | 23,756 | 96,672 | |
Janus Henderson Global Select Fund - Class N Shares | |||||||||
3,667,947 | 317,840 | (4,446,920) | 975,650 | (514,517) | - | - | 42,180 | 192,425 | |
Janus Henderson Growth and Income Fund - Class N Shares | |||||||||
2,295,680 | 6,285,599 | (1,902,462) | 104,089 | 187,027 | 6,969,933 | 93,494 | 59,028 | 305,857 | |
Janus Henderson Overseas Fund - Class N Shares | |||||||||
7,214,738 | 13,665,675 | (2,977,391) | 804,353 | (207,524) | 18,499,851 | 391,697 | 79,304 | - | |
Janus Henderson Research Fund - Class N Shares* | |||||||||
- | 5,720,008 | (92,071) | (123) | 42,120 | 5,669,934 | 68,928 | - | - | |
Janus Henderson Small-Mid Cap Value Fund - Class N Shares | |||||||||
3,537,057 | 120,146 | (3,765,518) | 392,797 | 92,497 | 376,979 | 23,546 | 32,284 | - | |
Janus Henderson Triton Fund - Class N Shares | |||||||||
1,907,549 | 660,442 | (2,433,830) | 569,335 | (568,256) | 135,240 | 4,911 | - | 147,075 | |
Janus Henderson U.S. Dividend Income Fund - Class N Shares | |||||||||
3,300,923 | 178,423 | (2,731,901) | 227,407 | 22,307 | 997,159 | 90,732 | 63,241 | - | |
Total Equity Funds - 31.6% | |||||||||
$60,017,680 | $38,236,323 | $(60,662,511) | $7,038,858 | $(1,938,354) | $42,691,996 | 1,050,714 | $1,405,796 | $1,722,282 | |
Exchange-Traded Funds (ETFs) - 0.7% | |||||||||
Janus Henderson AAA CLO | |||||||||
3,497,775 | 2,189,483 | (5,766,354) | 116,179 | (37,083) | - | - | 276,957 | - | |
Janus Henderson Small Cap Growth Alpha | |||||||||
- | 883,786 | (13,301) | 99 | 17,442 | 888,026 | 15,036 | 770 | - | |
Total Exchange-Traded Funds (ETFs) - 0.7% | |||||||||
$3,497,775 | $3,073,269 | $(5,779,655) | $116,278 | $(19,641) | $888,026 | 15,036 | $277,727 | $- |
Schedule of Investments
June 30, 2024
Affiliate | Affiliated Investments, at Value at 6/30/23 | Purchases | Sales Proceeds | Realized Gain/(Loss) | Change in Unrealized Appreciation/ Depreciation | Affiliated Investments, at Value at 6/30/24 | Ending Shares | Dividend Income | Capital Gain Distributions from Underlying Funds |
Investment Companies - (continued) | |||||||||
Fixed Income Funds - 36.5% | |||||||||
Janus Henderson Developed World Bond Fund - Class N Shares | |||||||||
$- | $47,768,594 | $(20,040,942) | $103,400 | $(104,431) | $27,726,621 | 3,672,402 | $530,751 | $- | |
Janus Henderson Flexible Bond Fund - Class N Shares | |||||||||
21,068,546 | 8,438,468 | (9,067,997) | (328,566) | 57,746 | 20,168,197 | 2,192,198 | 762,221 | - | |
Janus Henderson Global Bond Fund - Class N Shares | |||||||||
54,378,698 | 1,369,593 | (56,394,782) | (9,405,879) | 10,052,370 | - | - | (398,286) þ | - | |
Janus Henderson High-Yield Fund - Class N Shares | |||||||||
1,204,049 | 645,818 | (1,001,550) | (129,122) | 172,178 | 891,373 | 123,288 | 101,124 | - | |
Janus Henderson Multi-Sector Income Fund - Class N Shares | |||||||||
744,737 | 3,799,171 | (4,598,930) | 63,092 | (8,070) | - | - | 165,458 | - | |
Janus Henderson Short Duration Flexible Bond Fund - Class N Shares | |||||||||
6,602,049 | 2,299,373 | (8,472,179) | (214,855) | 251,031 | 465,419 | 164,459 | 172,485 | - | |
Total Fixed Income Funds - 36.5% | |||||||||
$83,998,079 | $64,321,017 | $(99,576,380) | $(9,911,930) | $10,420,824 | $49,251,610 | 6,152,347 | $1,333,753 | $- | |
Money Markets - 1.2% | |||||||||
Janus Henderson Cash Liquidity Fund LLC, 5.3419%ºº | |||||||||
213,812 | 6,786,306 | (5,308,493) | (3) | - | 1,691,622 | 1,691,283 | 61,759 | - | |
Total Affiliated Investments - 70.0% | |||||||||
$147,727,346 | $112,416,915 | $(171,327,039) | $(2,756,797) | $8,462,829 | $94,523,254 | 8,909,380 | $3,079,035 | $1,722,282 |
Notes to Schedule of Investments and Other Information
LLC | Limited Liability Company |
* | Non-income producing security. |
ºº | Rate shown is the 7-day yield as of June 30, 2024. |
£ | The Fund may invest in certain securities that are considered affiliated companies. As defined by the Investment Company Act of 1940, as amended, an affiliated company is one in which the Fund owns 5% or more of the outstanding voting securities, or a company which is under common ownership or control. |
þ | During the Fund’s current reporting period, a portion of the prior year distributions it received from this underlying fund was determined to be return of capital distributions. The negative amount disclosed was originally recorded as income in the Fund’s prior fiscal year and has been reclassified as a return of capital in the current reporting period. |
Valuation Inputs Summary | |||
Level 1 - Quoted Prices | Level 2 - Other Significant Observable Inputs | Level 3 - Significant Unobservable Inputs | |
Assets | |||
Investments In Securities: | |||
Investment Companies | |||
Equity Funds | $42,691,996 | $- | $- |
Exchange-Traded Funds (ETFs) | 41,412,648 | - | - |
Fixed Income Funds | 49,251,610 | - | - |
Money Markets | - | 1,691,622 | - |
Total Assets | $133,356,254 | $1,691,622 | $- |
Statement of Assets and Liabilities
June 30, 2024
Assets: | |
Unaffiliated investments, at value (cost $38,437,618) | $40,524,622 |
Affiliated investments, at value (cost $93,296,377) | 94,523,254 |
Trustees' deferred compensation | 3,718 |
Receivables: | |
Dividends | 211,414 |
Fund shares sold | 115,537 |
Investments sold | 34,345 |
Due from adviser | 11,408 |
Dividends from affiliates | 6,663 |
Other assets | 200 |
Total Assets | 135,431,161 |
Liabilities: | |
Payables: | |
Investments purchased | 186,442 |
Fund shares repurchased | 126,812 |
Professional fees | 41,695 |
Transfer agent fees and expenses | 17,696 |
Advisory fees | 5,556 |
Trustees' deferred compensation fees | 3,718 |
12b-1 Distribution and shareholder servicing fees | 2,958 |
Custodian fees | 1,090 |
Trustees' fees and expenses | 757 |
Accrued expenses and other payables | 15,881 |
Total Liabilities | 402,605 |
Commitments and contingent liabilities (Note 3) | |
Net Assets | $135,028,556 |
Net Assets Consist of: | |
Capital (par value and paid-in surplus) | $137,900,126 |
Total distributable earnings (loss) | (2,871,570) |
Total Net Assets | $135,028,556 |
Net Assets - Class A Shares | $5,648,023 |
Shares Outstanding, $0.01 Par Value (unlimited shares authorized) | 495,226 |
Net Asset Value Per Share(1) | $11.40 |
Maximum Offering Price Per Share(2) | $12.10 |
Net Assets - Class C Shares | $2,171,093 |
Shares Outstanding, $0.01 Par Value (unlimited shares authorized) | 195,912 |
Net Asset Value Per Share(1) | $11.08 |
Net Assets - Class D Shares | $117,135,957 |
Shares Outstanding, $0.01 Par Value (unlimited shares authorized) | 10,197,654 |
Net Asset Value Per Share | $11.49 |
Net Assets - Class I Shares | $1,847,651 |
Shares Outstanding, $0.01 Par Value (unlimited shares authorized) | 160,762 |
Net Asset Value Per Share | $11.49 |
Net Assets - Class S Shares | $57,843 |
Shares Outstanding, $0.01 Par Value (unlimited shares authorized) | 5,072 |
Net Asset Value Per Share | $11.40 |
Net Assets - Class T Shares | $8,167,989 |
Shares Outstanding, $0.01 Par Value (unlimited shares authorized) | 712,918 |
Net Asset Value Per Share | $11.46 |
(1) | Redemption price per share may be reduced for any applicable contingent deferred sales charge. |
(2) | Maximum offering price is computed at 100/94.25 of net asset value. |
Statement of Operations
For the year ended June 30, 2024
Investment Income: | |
Dividends from affiliates | $3,079,035 |
Dividends | 24,209 |
Other income | 442 |
Total Investment Income | 3,103,686 |
Expenses: | |
Advisory fees | 68,558 |
12b-1 Distribution and shareholder servicing fees: | |
Class A Shares | 14,756 |
Class C Shares | 25,218 |
Class S Shares | 140 |
Transfer agent administrative fees and expenses: | |
Class D Shares | 134,063 |
Class S Shares | 140 |
Class T Shares | 23,254 |
Transfer agent networking and omnibus fees: | |
Class A Shares | 4,989 |
Class C Shares | 2,267 |
Class I Shares | 1,850 |
Other transfer agent fees and expenses: | |
Class A Shares | 358 |
Class C Shares | 133 |
Class D Shares | 17,476 |
Class I Shares | 122 |
Class S Shares | 9 |
Class T Shares | 198 |
Registration fees | 87,603 |
Professional fees | 47,460 |
Shareholder reports expense | 27,348 |
Custodian fees | 11,113 |
Trustees' fees and expenses | 2,912 |
Other expenses | 15,352 |
Total Expenses | 485,319 |
Less: Excess Expense Reimbursement and Waivers | (72,147) |
Net Expenses | 413,172 |
Net Investment Income/(Loss) | 2,690,514 |
Net Realized Gain/(Loss) on Investments: | |
Investments | 1,392 |
Investments in affiliates | (2,756,797) |
Capital gain distributions from underlying funds | 1,722,282 |
Total Net Realized Gain/(Loss) on Investments | (1,033,123) |
Change in Unrealized Net Appreciation/Depreciation: | |
Investments and Trustees' deferred compensation | (174,470) |
Investments in affiliates | 8,462,829 |
Total Change in Unrealized Net Appreciation/Depreciation | 8,288,359 |
Net Increase/(Decrease) in Net Assets Resulting from Operations | $9,945,750 |
Statements of Changes in Net Assets
Year ended June 30, 2024 | Year ended June 30, 2023 | |
Operations: | ||
Net investment income/(loss) | $2,690,514 | $2,320,670 |
Net realized gain/(loss) on investments | (1,033,123) | (5,755,237) |
Change in unrealized net appreciation/depreciation | 8,288,359 | 10,277,849 |
Net Increase/(Decrease) in Net Assets Resulting from Operations | 9,945,750 | 6,843,282 |
Dividends and Distributions to Shareholders: | ||
Class A Shares | (90,046) | (131,557) |
Class C Shares | (24,374) | (74,669) |
Class D Shares | (1,981,569) | (2,866,502) |
Class I Shares | (26,674) | (59,077) |
Class S Shares | (879) | (988) |
Class T Shares | (156,405) | (236,186) |
Net Decrease from Dividends and Distributions to Shareholders | (2,279,947) | (3,368,979) |
Capital Share Transactions: | ||
Class A Shares | (1,187,876) | (868,840) |
Class C Shares | (1,410,006) | (2,712,685) |
Class D Shares | (14,606,730) | (7,317,963) |
Class I Shares | (91,666) | (866,985) |
Class S Shares | (591) | (42,971) |
Class T Shares | (2,995,590) | (1,930,543) |
Net Increase/(Decrease) from Capital Share Transactions | (20,292,459) | (13,739,987) |
Net Increase/(Decrease) in Net Assets | (12,626,656) | (10,265,684) |
Net Assets: | ||
Beginning of period | 147,655,212 | 157,920,896 |
End of period | $135,028,556 | $147,655,212 |
Financial Highlights
Class A Shares | |||||
For a share outstanding during the year ended June 30 | 2024 | 2023 | 2022 | 2021 | 2020 |
Net Asset Value, Beginning of Period | $10.77 | $10.52 | $13.99 | $12.28 | $12.53 |
Income/(Loss) from Investment Operations: | |||||
Net investment income/(loss)(1) | 0.19 | 0.14 | 0.39 | 0.25 | 0.14 |
Net realized and unrealized gain/(loss) | 0.61 | 0.33 | (2.57) | 2.07 | 0.19 |
Total from Investment Operations | 0.80 | 0.47 | (2.18) | 2.32 | 0.33 |
Less Dividends and Distributions: | |||||
Dividends (from net investment income) | (0.17) | (0.04) | (0.41) | (0.26) | (0.13) |
Distributions (from capital gains) | — | (0.18) | (0.88) | (0.35) | (0.45) |
Total Dividends and Distributions | (0.17) | (0.22) | (1.29) | (0.61) | (0.58) |
Net Asset Value, End of Period | $11.40 | $10.77 | $10.52 | $13.99 | $12.28 |
Total Return* | 7.51% | 4.54% | (17.15)% | 19.10% | 2.58% |
Net Assets, End of Period (in thousands) | $5,648 | $6,511 | $7,213 | $8,650 | $4,030 |
Ratios to Average Net Assets**: | |||||
Ratio of Gross Expenses(2) | 0.51% | 0.51% | 0.47% | 0.47% | 0.47% |
Ratio of Net Expenses (After Waivers and Expense Offsets)(2) | 0.48% | 0.48% | 0.47% | 0.47% | 0.47% |
Ratio of Net Investment Income/(Loss)(2) | 1.78% | 1.36% | 3.03% | 1.84% | 1.13% |
Portfolio Turnover Rate | 111% | 41% | 43% | 34% | 57% |
* | Total return includes adjustments in accordance with generally accepted accounting principles required at the year or period end and are not annualized for periods of less than one full year. Returns shown exclude any applicable sales charges. |
** | Annualized for periods of less than one full year. |
(1) | Per share amounts are calculated based on average shares outstanding during the year or period. |
(2) | Ratios do not include indirect expenses of the underlying funds and/or investment companies in which the Fund invests. |
Financial Highlights
Class C Shares | |||||
For a share outstanding during the year ended June 30 | 2024 | 2023 | 2022 | 2021 | 2020 |
Net Asset Value, Beginning of Period | $10.49 | $10.28 | $13.67 | $12.01 | $12.26 |
Income/(Loss) from Investment Operations: | |||||
Net investment income/(loss)(1) | 0.11 | 0.08 | 0.29 | 0.18 | 0.05 |
Net realized and unrealized gain/(loss) | 0.59 | 0.31 | (2.50) | 1.98 | 0.18 |
Total from Investment Operations | 0.70 | 0.39 | (2.21) | 2.16 | 0.23 |
Less Dividends and Distributions: | |||||
Dividends (from net investment income) | (0.11) | — | (0.30) | (0.15) | (0.03) |
Distributions (from capital gains) | — | (0.18) | (0.88) | (0.35) | (0.45) |
Total Dividends and Distributions | (0.11) | (0.18) | (1.18) | (0.50) | (0.48) |
Net Asset Value, End of Period | $11.08 | $10.49 | $10.28 | $13.67 | $12.01 |
Total Return* | 6.66% | 3.88% | (17.65)% | 18.20% | 1.85% |
Net Assets, End of Period (in thousands) | $2,171 | $3,461 | $6,096 | $9,356 | $10,655 |
Ratios to Average Net Assets**: | |||||
Ratio of Gross Expenses(2) | 1.24% | 1.18% | 1.18% | 1.15% | 1.18% |
Ratio of Net Expenses (After Waivers and Expense Offsets)(2) | 1.21% | 1.15% | 1.18% | 1.15% | 1.18% |
Ratio of Net Investment Income/(Loss)(2) | 1.08% | 0.76% | 2.31% | 1.38% | 0.41% |
Portfolio Turnover Rate | 111% | 41% | 43% | 34% | 57% |
* | Total return includes adjustments in accordance with generally accepted accounting principles required at the year or period end and are not annualized for periods of less than one full year. Returns shown exclude any applicable sales charges. |
** | Annualized for periods of less than one full year. |
(1) | Per share amounts are calculated based on average shares outstanding during the year or period. |
(2) | Ratios do not include indirect expenses of the underlying funds and/or investment companies in which the Fund invests. |
Financial Highlights
Class D Shares | |||||
For a share outstanding during the year ended June 30 | 2024 | 2023 | 2022 | 2021 | 2020 |
Net Asset Value, Beginning of Period | $10.84 | $10.59 | $14.06 | $12.34 | $12.59 |
Income/(Loss) from Investment Operations: | |||||
Net investment income/(loss)(1) | 0.22 | 0.17 | 0.41 | 0.30 | 0.16 |
Net realized and unrealized gain/(loss) | 0.62 | 0.32 | (2.57) | 2.05 | 0.20 |
Total from Investment Operations | 0.84 | 0.49 | (2.16) | 2.35 | 0.36 |
Less Dividends and Distributions: | |||||
Dividends (from net investment income) | (0.19) | (0.06) | (0.43) | (0.28) | (0.16) |
Distributions (from capital gains) | — | (0.18) | (0.88) | (0.35) | (0.45) |
Total Dividends and Distributions | (0.19) | (0.24) | (1.31) | (0.63) | (0.61) |
Net Asset Value, End of Period | $11.49 | $10.84 | $10.59 | $14.06 | $12.34 |
Total Return* | 7.77% | 4.78% | (16.91)% | 19.27% | 2.77% |
Net Assets, End of Period (in thousands) | $117,136 | $125,119 | $129,498 | $174,449 | $147,682 |
Ratios to Average Net Assets**: | |||||
Ratio of Gross Expenses(2) | 0.32% | 0.31% | 0.27% | 0.28% | 0.28% |
Ratio of Net Expenses (After Waivers and Expense Offsets)(2) | 0.27% | 0.27% | 0.27% | 0.27% | 0.27% |
Ratio of Net Investment Income/(Loss)(2) | 1.98% | 1.57% | 3.22% | 2.20% | 1.32% |
Portfolio Turnover Rate | 111% | 41% | 43% | 34% | 57% |
* | Total return includes adjustments in accordance with generally accepted accounting principles required at the year or period end and are not annualized for periods of less than one full year. |
** | Annualized for periods of less than one full year. |
(1) | Per share amounts are calculated based on average shares outstanding during the year or period. |
(2) | Ratios do not include indirect expenses of the underlying funds and/or investment companies in which the Fund invests. |
Financial Highlights
Class I Shares | |||||
For a share outstanding during the year ended June 30 | 2024 | 2023 | 2022 | 2021 | 2020 |
Net Asset Value, Beginning of Period | $10.84 | $10.59 | $14.07 | $12.34 | $12.58 |
Income/(Loss) from Investment Operations: | |||||
Net investment income/(loss)(1) | 0.21 | 0.17 | 0.42 | 0.29 | 0.17 |
Net realized and unrealized gain/(loss) | 0.62 | 0.33 | (2.58) | 2.07 | 0.20 |
Total from Investment Operations | 0.83 | 0.50 | (2.16) | 2.36 | 0.37 |
Less Dividends and Distributions: | |||||
Dividends (from net investment income) | (0.18) | (0.07) | (0.44) | (0.28) | (0.16) |
Distributions (from capital gains) | — | (0.18) | (0.88) | (0.35) | (0.45) |
Total Dividends and Distributions | (0.18) | (0.25) | (1.32) | (0.63) | (0.61) |
Net Asset Value, End of Period | $11.49 | $10.84 | $10.59 | $14.07 | $12.34 |
Total Return* | 7.73% | 4.80% | (16.92)% | 19.39% | 2.89% |
Net Assets, End of Period (in thousands) | $1,848 | $1,842 | $2,645 | $3,830 | $3,381 |
Ratios to Average Net Assets**: | |||||
Ratio of Gross Expenses(2) | 0.29% | 0.28% | 0.24% | 0.22% | 0.21% |
Ratio of Net Expenses (After Waivers and Expense Offsets)(2) | 0.25% | 0.25% | 0.24% | 0.22% | 0.21% |
Ratio of Net Investment Income/(Loss)(2) | 1.93% | 1.56% | 3.27% | 2.16% | 1.37% |
Portfolio Turnover Rate | 111% | 41% | 43% | 34% | 57% |
* | Total return includes adjustments in accordance with generally accepted accounting principles required at the year or period end and are not annualized for periods of less than one full year. |
** | Annualized for periods of less than one full year. |
(1) | Per share amounts are calculated based on average shares outstanding during the year or period. |
(2) | Ratios do not include indirect expenses of the underlying funds and/or investment companies in which the Fund invests. |
Financial Highlights
Class S Shares | |||||
For a share outstanding during the year ended June 30 | 2024 | 2023 | 2022 | 2021 | 2020 |
Net Asset Value, Beginning of Period | $10.79 | $10.52 | $13.97 | $12.25 | $12.45 |
Income/(Loss) from Investment Operations: | |||||
Net investment income/(loss)(1) | 0.18 | 0.13 | 0.36 | 0.25 | 0.11 |
Net realized and unrealized gain/(loss) | 0.60 | 0.32 | (2.55) | 2.02 | 0.20 |
Total from Investment Operations | 0.78 | 0.45 | (2.19) | 2.27 | 0.31 |
Less Dividends and Distributions: | |||||
Dividends (from net investment income) | (0.17) | — | (0.38) | (0.20) | (0.06) |
Distributions (from capital gains) | — | (0.18) | (0.88) | (0.35) | (0.45) |
Total Dividends and Distributions | (0.17) | (0.18) | (1.26) | (0.55) | (0.51) |
Net Asset Value, End of Period | $11.40 | $10.79 | $10.52 | $13.97 | $12.25 |
Total Return* | 7.24% | 4.36% | (17.19)% | 18.70% | 2.43% |
Net Assets, End of Period (in thousands) | $58 | $55 | $96 | $108 | $126 |
Ratios to Average Net Assets**: | |||||
Ratio of Gross Expenses(2) | 0.68% | 0.69% | 0.65% | 0.65% | 0.63% |
Ratio of Net Expenses (After Waivers and Expense Offsets)(2) | 0.65% | 0.66% | 0.65% | 0.65% | 0.63% |
Ratio of Net Investment Income/(Loss)(2) | 1.61% | 1.19% | 2.83% | 1.88% | 0.90% |
Portfolio Turnover Rate | 111% | 41% | 43% | 34% | 57% |
* | Total return includes adjustments in accordance with generally accepted accounting principles required at the year or period end and are not annualized for periods of less than one full year. |
** | Annualized for periods of less than one full year. |
(1) | Per share amounts are calculated based on average shares outstanding during the year or period. |
(2) | Ratios do not include indirect expenses of the underlying funds and/or investment companies in which the Fund invests. |
Financial Highlights
Class T Shares | |||||
For a share outstanding during the year ended June 30 | 2024 | 2023 | 2022 | 2021 | 2020 |
Net Asset Value, Beginning of Period | $10.82 | $10.56 | $14.03 | $12.32 | $12.56 |
Income/(Loss) from Investment Operations: | |||||
Net investment income/(loss)(1) | 0.21 | 0.16 | 0.41 | 0.29 | 0.16 |
Net realized and unrealized gain/(loss) | 0.61 | 0.33 | (2.58) | 2.04 | 0.20 |
Total from Investment Operations | 0.82 | 0.49 | (2.17) | 2.33 | 0.36 |
Less Dividends and Distributions: | |||||
Dividends (from net investment income) | (0.18) | (0.05) | (0.42) | (0.27) | (0.15) |
Distributions (from capital gains) | — | (0.18) | (0.88) | (0.35) | (0.45) |
Total Dividends and Distributions | (0.18) | (0.23) | (1.30) | (0.62) | (0.60) |
Net Asset Value, End of Period | $11.46 | $10.82 | $10.56 | $14.03 | $12.32 |
Total Return* | 7.65% | 4.76% | (17.02)% | 19.12% | 2.78% |
Net Assets, End of Period (in thousands) | $8,168 | $10,666 | $12,373 | $16,283 | $15,174 |
Ratios to Average Net Assets**: | |||||
Ratio of Gross Expenses(2) | 0.42% | 0.42% | 0.39% | 0.39% | 0.38% |
Ratio of Net Expenses (After Waivers and Expense Offsets)(2) | 0.34% | 0.35% | 0.36% | 0.35% | 0.36% |
Ratio of Net Investment Income/(Loss)(2) | 1.96% | 1.51% | 3.22% | 2.14% | 1.27% |
Portfolio Turnover Rate | 111% | 41% | 43% | 34% | 57% |
* | Total return includes adjustments in accordance with generally accepted accounting principles required at the year or period end and are not annualized for periods of less than one full year. |
** | Annualized for periods of less than one full year. |
(1) | Per share amounts are calculated based on average shares outstanding during the year or period. |
(2) | Ratios do not include indirect expenses of the underlying funds and/or investment companies in which the Fund invests. |
Notes to Financial Statements
Average Daily Net Assets of Class D Shares of the Janus Henderson funds | Administrative Services Fee |
Under $40 billion | 0.12% |
$40 billion — $49.9 billion | 0.10% |
Over $49.9 billion | 0.08% |
Notes to Financial Statements
Undistributed Ordinary Income | Undistributed Long-Term Gains | Accumulated Capital Losses | Loss Deferrals | Other Book to Tax Differences | Net Tax Appreciation/ (Depreciation) |
$2,638,515 | $- | $(7,961,170) | $- | $(2,563) | $2,453,648 |
Capital Loss Carryover Schedule | ||
For the year ended June 30, 2024 | ||
No Expiration | ||
Short-Term | Long-Term | Accumulated Capital Losses |
$(1,571,859) | $(6,389,311) | $(7,961,170) |
Federal Tax Cost | Unrealized Appreciation | Unrealized (Depreciation) | Net Tax Appreciation/ (Depreciation) |
$132,594,228 | $4,000,185 | $(1,546,537) | $2,453,648 |
For the year ended June 30, 2024 | |||
Distributions | |||
From Ordinary Income | From Long-Term Capital Gains | Tax Return of Capital | Net Investment Loss |
$2,279,947 | $- | $- | $- |
Notes to Financial Statements
For the year ended June 30, 2023 | |||
Distributions | |||
From Ordinary Income | From Long-Term Capital Gains | Tax Return of Capital | Net Investment Loss |
$834,110 | $2,534,869 | $- | $- |
Year ended June 30, 2024 | Year ended June 30, 2023 | |||
Shares | Amount | Shares | Amount | |
Class A Shares: | ||||
Shares sold | 42,053 | $454,098 | 76,211 | $808,674 |
Reinvested dividends and distributions | 7,151 | 79,449 | 11,370 | 117,336 |
Shares repurchased | (158,331) | (1,721,423) | (168,774) | (1,794,850) |
Net Increase/(Decrease) | (109,127) | $(1,187,876) | (81,193) | $(868,840) |
Class C Shares: | ||||
Shares sold | 481 | $5,200 | 53,348 | $542,580 |
Reinvested dividends and distributions | 2,228 | 24,131 | 7,366 | 74,253 |
Shares repurchased | (136,908) | (1,439,337) | (323,680) | (3,329,518) |
Net Increase/(Decrease) | (134,199) | $(1,410,006) | (262,966) | $(2,712,685) |
Class D Shares: | ||||
Shares sold | 564,016 | $6,215,314 | 606,807 | $6,472,180 |
Reinvested dividends and distributions | 175,584 | 1,963,026 | 274,054 | 2,844,684 |
Shares repurchased | (2,084,793) | (22,785,070) | (1,567,497) | (16,634,827) |
Net Increase/(Decrease) | (1,345,193) | $(14,606,730) | (686,636) | $(7,317,963) |
Class I Shares: | ||||
Shares sold | 61,986 | $680,383 | 93,951 | $997,758 |
Reinvested dividends and distributions | 2,367 | 26,465 | 5,670 | 58,799 |
Shares repurchased | (73,572) | (798,514) | (179,492) | (1,923,542) |
Net Increase/(Decrease) | (9,219) | $(91,666) | (79,871) | $(866,985) |
Class S Shares: | ||||
Shares sold | 309 | $3,375 | 522 | $5,494 |
Reinvested dividends and distributions | 79 | 879 | 95 | 988 |
Shares repurchased | (433) | (4,845) | (4,623) | (49,453) |
Net Increase/(Decrease) | (45) | $(591) | (4,006) | $(42,971) |
Class T Shares: | ||||
Shares sold | 246,651 | $2,669,704 | 234,302 | $2,489,430 |
Reinvested dividends and distributions | 13,830 | 154,199 | 22,539 | 233,507 |
Shares repurchased | (533,741) | (5,819,493) | (442,216) | (4,653,480) |
Net Increase/(Decrease) | (273,260) | $(2,995,590) | (185,375) | $(1,930,543) |
Purchases of Securities | Proceeds from Sales of Securities | Purchases of Long- Term U.S. Government Obligations | Proceeds from Sales of Long-Term U.S. Government Obligations |
$153,727,393 | $170,796,272 | $- | $- |
Report of Independent Registered Public Accounting Firm
August 22, 2024
Designation Requirements (unaudited)
Foreign Taxes Paid | $52,570 |
Foreign Source Income | $135,518 |
Dividends Received Deduction Percentage | 11% |
Qualified Dividend Income Percentage | 25% |
Additional Information (unaudited)
June 30, 2024
Schedule of Investments
June 30, 2024
Shares | Value | ||
Investment Companies – 100.0% | |||
Equity Funds – 60.0% | |||
Janus Henderson Adaptive Risk Managed U.S. Equity Fund - Class N Shares£ | 1,089,682 | $12,142,610 | |
Janus Henderson Enterprise Fund - Class N Shares£ | 147,863 | 20,741,233 | |
Janus Henderson Growth and Income Fund - Class N Shares£ | 305,546 | 22,778,352 | |
Janus Henderson Overseas Fund - Class N Shares£ | 1,281,997 | 60,548,620 | |
Janus Henderson Research Fund - Class N Shares*,£ | 224,720 | 18,485,383 | |
Janus Henderson Small-Mid Cap Value Fund - Class N Shares£ | 77,997 | 1,248,808 | |
Janus Henderson Triton Fund - Class N Shares£ | 16,869 | 464,600 | |
Janus Henderson U.S. Dividend Income Fund - Class N Shares£ | 307,535 | 3,379,965 | |
139,789,571 | |||
Exchange-Traded Funds (ETFs) – 28.9% | |||
iShares Core International Aggregate Bond | 117,679 | 5,874,534 | |
iShares JP Morgan USD Emerging Markets Bond | 58,023 | 5,133,875 | |
iShares Russell 2000 Value | 58,576 | 8,921,127 | |
Janus Henderson Small Cap Growth Alpha£ | 46,910 | 2,770,504 | |
Vanguard FTSE Emerging Markets | 752,995 | 32,951,061 | |
Vanguard Value | 72,043 | 11,556,418 | |
67,207,519 | |||
Fixed Income Funds – 9.6% | |||
Janus Henderson Developed World Bond Fund - Class N Shares£ | 1,666,171 | 12,579,565 | |
Janus Henderson Flexible Bond Fund - Class N Shares£ | 996,342 | 9,166,308 | |
Janus Henderson High-Yield Fund - Class N Shares£ | 54,636 | 394,990 | |
Janus Henderson Short Duration Flexible Bond Fund - Class N Shares£ | 74,866 | 211,870 | |
22,352,733 | |||
Money Markets – 1.5% | |||
Janus Henderson Cash Liquidity Fund LLC, 5.3419%ºº,£ | 3,559,671 | 3,560,383 | |
Total Investments (total cost $216,871,867) – 100.0% | 232,910,206 | ||
Liabilities, net of Cash, Receivables and Other Assets – (0)% | (11,366) | ||
Net Assets – 100% | $232,898,840 |
Schedule of Investments
June 30, 2024
Schedule of Affiliated Investments - (% of Net Assets) | |||||||||
Affiliate | Affiliated Investments, at Value at 6/30/23 | Purchases | Sales Proceeds | Realized Gain/(Loss) | Change in Unrealized Appreciation/ Depreciation | Affiliated Investments, at Value at 6/30/24 | Ending Shares | Dividend Income | Capital Gain Distributions from Underlying Funds |
Investment Companies - 72.3% | |||||||||
Equity Funds - 60.0% | |||||||||
Janus Henderson Adaptive Global Allocation Fund - Class N Shares | |||||||||
$12,443,914 | $853,964 | $(13,316,527) | $91,507 | $(72,858) | $- | - | $1,155,574 | $233,846 | |
Janus Henderson Adaptive Risk Managed U.S. Equity Fund - Class N Shares | |||||||||
17,762,545 | 2,450,904 | (10,590,278) | 806,888 | 1,712,551 | 12,142,610 | 1,089,682 | 112,582 | 573,763 | |
Janus Henderson Asia Equity Fund - Class N Shares | |||||||||
6,574,368 | 100,210 | (7,085,655) | (110,503) | 521,580 | - | - | 2,945 | - | |
Janus Henderson Contrarian Fund - Class N Shares | |||||||||
11,934,681 | 992,213 | (13,410,875) | 4,308,102 | (3,824,121) | - | - | 74,578 | 730,460 | |
Janus Henderson Emerging Markets Fund - Class N Shares | |||||||||
18,554,793 | 543,047 | (19,835,590) | (1,382,519) | 2,120,269 | - | - | 110,395 | - | |
Janus Henderson Enterprise Fund - Class N Shares | |||||||||
9,119,303 | 12,719,668 | (1,473,314) | 4,809 | 370,767 | 20,741,233 | 147,863 | - | 647,756 | |
Janus Henderson European Focus Fund - Class N Shares | |||||||||
4,876,866 | 3,734,684 | (9,915,073) | 1,865,591 | (562,068) | - | - | 214,788 | - | |
Janus Henderson Forty Fund - Class N Shares | |||||||||
9,481,531 | 3,169,875 | (15,009,434) | 4,137,849 | (1,779,821) | - | - | 39,939 | 894,941 | |
Janus Henderson Global Equity Income Fund - Class N Shares | |||||||||
8,892,937 | 6,450,907 | (16,323,037) | (94,107) | 1,073,300 | - | - | 721,095 | - | |
Janus Henderson Global Real Estate Fund - Class N Shares | |||||||||
6,903,772 | 238,803 | (7,131,022) | 812,918 | (824,471) | - | - | 146,150 | - | |
Janus Henderson Global Research Fund - Class N Shares | |||||||||
6,288,233 | 2,242,066 | (10,137,093) | 2,226,599 | (619,805) | - | - | 79,171 | 322,178 | |
Janus Henderson Global Select Fund - Class N Shares | |||||||||
10,170,853 | 945,198 | (12,682,247) | 3,670,793 | (2,104,597) | - | - | 140,990 | 643,199 | |
Janus Henderson Growth and Income Fund - Class N Shares | |||||||||
9,300,603 | 16,343,875 | (3,849,115) | 170,326 | 812,663 | 22,778,352 | 305,546 | 197,786 | 1,005,391 | |
Janus Henderson Overseas Fund - Class N Shares | |||||||||
19,492,007 | 44,384,903 | (5,054,323) | 300,459 | 1,425,574 | 60,548,620 | 1,281,997 | 264,205 | - | |
Janus Henderson Research Fund - Class N Shares* | |||||||||
- | 18,869,042 | (413,630) | (1,200) | 31,171 | 18,485,383 | 224,720 | - | - | |
Janus Henderson Small-Mid Cap Value Fund - Class N Shares | |||||||||
11,258,174 | 779,988 | (12,509,826) | 1,084,797 | 635,675 | 1,248,808 | 77,997 | 106,689 | - | |
Janus Henderson Triton Fund - Class N Shares | |||||||||
7,514,081 | 1,190,740 | (8,241,825) | 771,234 | (769,630) | 464,600 | 16,869 | - | 504,940 | |
Janus Henderson U.S. Dividend Income Fund - Class N Shares | |||||||||
8,700,249 | 393,241 | (6,414,326) | 576,514 | 124,287 | 3,379,965 | 307,535 | 180,748 | - | |
Total Equity Funds - 60.0% | |||||||||
$179,268,910 | $116,403,328 | $(173,393,190) | $19,240,057 | $(1,729,534) | $139,789,571 | 3,452,209 | $3,547,635 | $5,556,474 | |
Exchange-Traded Funds (ETFs) - 1.2% | |||||||||
Janus Henderson AAA CLO | |||||||||
1,874,908 | 648,102 | (2,560,639) | 57,507 | (19,878) | - | - | 129,515 | - | |
Janus Henderson Small Cap Growth Alpha | |||||||||
- | 2,773,352 | (57,597) | 333 | 54,416 | 2,770,504 | 46,910 | 2,401 | - | |
Total Exchange-Traded Funds (ETFs) - 1.2% | |||||||||
$1,874,908 | $3,421,454 | $(2,618,236) | $57,840 | $34,538 | $2,770,504 | 46,910 | $131,916 | $- |
Schedule of Investments
June 30, 2024
Affiliate | Affiliated Investments, at Value at 6/30/23 | Purchases | Sales Proceeds | Realized Gain/(Loss) | Change in Unrealized Appreciation/ Depreciation | Affiliated Investments, at Value at 6/30/24 | Ending Shares | Dividend Income | Capital Gain Distributions from Underlying Funds |
Investment Companies - (continued) | |||||||||
Fixed Income Funds - 9.6% | |||||||||
Janus Henderson Developed World Bond Fund - Class N Shares | |||||||||
$- | $21,810,149 | $(9,236,068) | $53,403 | $(47,919) | $12,579,565 | 1,666,171 | $242,471 | $- | |
Janus Henderson Flexible Bond Fund - Class N Shares | |||||||||
12,673,083 | 4,192,377 | (7,524,536) | (306,134) | 131,518 | 9,166,308 | 996,342 | 354,660 | - | |
Janus Henderson Global Bond Fund - Class N Shares | |||||||||
27,664,133 | 479,555 | (28,292,966) | (3,217,668) | 3,366,946 | - | - | (140,990) þ | - | |
Janus Henderson High-Yield Fund - Class N Shares | |||||||||
813,130 | 162,129 | (601,321) | (95,985) | 117,037 | 394,990 | 54,636 | 55,000 | - | |
Janus Henderson Multi-Sector Income Fund - Class N Shares | |||||||||
401,077 | 2,258,347 | (2,689,683) | 34,559 | (4,300) | - | - | 91,740 | - | |
Janus Henderson Short Duration Flexible Bond Fund - Class N Shares | |||||||||
3,543,268 | 1,134,761 | (4,482,292) | (84,549) | 100,682 | 211,870 | 74,866 | 83,777 | - | |
Total Fixed Income Funds - 9.6% | |||||||||
$45,094,691 | $30,037,318 | $(52,826,866) | $(3,616,374) | $3,663,964 | $22,352,733 | 2,792,015 | $686,658 | $- | |
Money Markets - 1.5% | |||||||||
Janus Henderson Cash Liquidity Fund LLC, 5.3419%ºº | |||||||||
154,030 | 8,223,806 | (4,817,453) | - | - | 3,560,383 | 3,559,671 | 35,727 | - | |
Total Affiliated Investments - 72.3% | |||||||||
$226,392,539 | $158,085,906 | $(233,655,745) | $15,681,523 | $1,968,968 | $168,473,191 | 9,850,805 | $4,401,936 | $5,556,474 |
Notes to Schedule of Investments and Other Information
LLC | Limited Liability Company |
* | Non-income producing security. |
ºº | Rate shown is the 7-day yield as of June 30, 2024. |
£ | The Fund may invest in certain securities that are considered affiliated companies. As defined by the Investment Company Act of 1940, as amended, an affiliated company is one in which the Fund owns 5% or more of the outstanding voting securities, or a company which is under common ownership or control. |
þ | During the Fund’s current reporting period, a portion of the prior year distributions it received from this underlying fund was determined to be return of capital distributions. The negative amount disclosed was originally recorded as income in the Fund’s prior fiscal year and has been reclassified as a return of capital in the current reporting period. |
Valuation Inputs Summary | |||
Level 1 - Quoted Prices | Level 2 - Other Significant Observable Inputs | Level 3 - Significant Unobservable Inputs | |
Assets | |||
Investments In Securities: | |||
Investment Companies | |||
Equity Funds | $139,789,571 | $- | $- |
Exchange-Traded Funds (ETFs) | 67,207,519 | - | - |
Fixed Income Funds | 22,352,733 | - | - |
Money Markets | - | 3,560,383 | - |
Total Assets | $229,349,823 | $3,560,383 | $- |
Statement of Assets and Liabilities
June 30, 2024
Assets: | |
Unaffiliated investments, at value (cost $64,625,946) | $64,437,015 |
Affiliated investments, at value (cost $152,245,921) | 168,473,191 |
Trustees' deferred compensation | 6,415 |
Receivables: | |
Dividends | 233,681 |
Investments sold | 99,349 |
Fund shares sold | 34,211 |
Dividends from affiliates | 10,884 |
Other assets | 369 |
Total Assets | 233,295,115 |
Liabilities: | |
Payables: | |
Investments purchased | 157,492 |
Fund shares repurchased | 131,634 |
Professional fees | 41,757 |
Transfer agent fees and expenses | 31,518 |
Trustees' deferred compensation fees | 6,415 |
Advisory fees | 4,304 |
12b-1 Distribution and shareholder servicing fees | 3,204 |
Trustees' fees and expenses | 1,255 |
Custodian fees | 1,118 |
Accrued expenses and other payables | 17,578 |
Total Liabilities | 396,275 |
Commitments and contingent liabilities (Note 3) | |
Net Assets | $232,898,840 |
Net Assets Consist of: | |
Capital (par value and paid-in surplus) | $202,988,995 |
Total distributable earnings (loss) | 29,909,845 |
Total Net Assets | $232,898,840 |
Net Assets - Class A Shares | $6,632,741 |
Shares Outstanding, $0.01 Par Value (unlimited shares authorized) | 491,766 |
Net Asset Value Per Share(1) | $13.49 |
Maximum Offering Price Per Share(2) | $14.31 |
Net Assets - Class C Shares | $1,819,556 |
Shares Outstanding, $0.01 Par Value (unlimited shares authorized) | 138,240 |
Net Asset Value Per Share(1) | $13.16 |
Net Assets - Class D Shares | $197,176,871 |
Shares Outstanding, $0.01 Par Value (unlimited shares authorized) | 14,452,057 |
Net Asset Value Per Share | $13.64 |
Net Assets - Class I Shares | $13,397,337 |
Shares Outstanding, $0.01 Par Value (unlimited shares authorized) | 982,698 |
Net Asset Value Per Share | $13.63 |
Net Assets - Class S Shares | $1,556,828 |
Shares Outstanding, $0.01 Par Value (unlimited shares authorized) | 116,314 |
Net Asset Value Per Share | $13.38 |
Net Assets - Class T Shares | $12,315,507 |
Shares Outstanding, $0.01 Par Value (unlimited shares authorized) | 904,145 |
Net Asset Value Per Share | $13.62 |
(1) | Redemption price per share may be reduced for any applicable contingent deferred sales charge. |
(2) | Maximum offering price is computed at 100/94.25 of net asset value. |
Statement of Operations
For the year ended June 30, 2024
Investment Income: | |
Dividends from affiliates | $4,401,936 |
Dividends | 73,460 |
Other income | 727 |
Total Investment Income | 4,476,123 |
Expenses: | |
Advisory fees | 111,484 |
12b-1 Distribution and shareholder servicing fees: | |
Class A Shares | 15,329 |
Class C Shares | 20,704 |
Class S Shares | 3,062 |
Transfer agent administrative fees and expenses: | |
Class D Shares | 214,615 |
Class S Shares | 3,063 |
Class T Shares | 30,625 |
Transfer agent networking and omnibus fees: | |
Class A Shares | 4,497 |
Class C Shares | 1,902 |
Class I Shares | 12,528 |
Other transfer agent fees and expenses: | |
Class A Shares | 364 |
Class C Shares | 113 |
Class D Shares | 35,281 |
Class I Shares | 693 |
Class S Shares | 46 |
Class T Shares | 250 |
Registration fees | 85,322 |
Professional fees | 48,321 |
Shareholder reports expense | 43,428 |
Custodian fees | 10,494 |
Trustees' fees and expenses | 4,833 |
Other expenses | 16,512 |
Total Expenses | 663,466 |
Less: Excess Expense Reimbursement and Waivers | (15,247) |
Net Expenses | 648,219 |
Net Investment Income/(Loss) | 3,827,904 |
Net Realized Gain/(Loss) on Investments: | |
Investments | 2,997 |
Investments in affiliates | 15,681,523 |
Capital gain distributions from underlying funds | 5,556,474 |
Total Net Realized Gain/(Loss) on Investments | 21,240,994 |
Change in Unrealized Net Appreciation/Depreciation: | |
Investments and Trustees' deferred compensation | (188,932) |
Investments in affiliates | 1,968,968 |
Total Change in Unrealized Net Appreciation/Depreciation | 1,780,036 |
Net Increase/(Decrease) in Net Assets Resulting from Operations | $26,848,934 |
Statements of Changes in Net Assets
Year ended June 30, 2024 | Year ended June 30, 2023 | |
Operations: | ||
Net investment income/(loss) | $3,827,904 | $2,835,132 |
Net realized gain/(loss) on investments | 21,240,994 | (5,692,960) |
Change in unrealized net appreciation/depreciation | 1,780,036 | 24,451,761 |
Net Increase/(Decrease) in Net Assets Resulting from Operations | 26,848,934 | 21,593,933 |
Dividends and Distributions to Shareholders: | ||
Class A Shares | (78,984) | (230,518) |
Class C Shares | (12,756) | (86,622) |
Class D Shares | (2,757,150) | (8,037,482) |
Class I Shares | (186,334) | (588,717) |
Class S Shares | (11,693) | (54,407) |
Class T Shares | (162,020) | (545,358) |
Net Decrease from Dividends and Distributions to Shareholders | (3,208,937) | (9,543,104) |
Capital Share Transactions: | ||
Class A Shares | (90,193) | 623,306 |
Class C Shares | (770,250) | (768,807) |
Class D Shares | (13,346,724) | (1,068,279) |
Class I Shares | (1,646,568) | 1,481,819 |
Class S Shares | 384,562 | (154,959) |
Class T Shares | (1,580,660) | (1,440,925) |
Net Increase/(Decrease) from Capital Share Transactions | (17,049,833) | (1,327,845) |
Net Increase/(Decrease) in Net Assets | 6,590,164 | 10,722,984 |
Net Assets: | ||
Beginning of period | 226,308,676 | 215,585,692 |
End of period | $232,898,840 | $226,308,676 |
Financial Highlights
Class A Shares | |||||
For a share outstanding during the year ended June 30 | 2024 | 2023 | 2022 | 2021 | 2020 |
Net Asset Value, Beginning of Period | $12.15 | $11.54 | $16.53 | $12.93 | $14.05 |
Income/(Loss) from Investment Operations: | |||||
Net investment income/(loss)(1) | 0.19 | 0.13 | 0.48 | 0.18 | 0.17 |
Net realized and unrealized gain/(loss) | 1.31 | 0.99 | (3.08) | 4.12 | (0.32) |
Total from Investment Operations | 1.50 | 1.12 | (2.60) | 4.30 | (0.15) |
Less Dividends and Distributions: | |||||
Dividends (from net investment income) | (0.16) | (0.10) | (0.50) | (0.18) | (0.17) |
Distributions (from capital gains) | — | (0.41) | (1.89) | (0.52) | (0.80) |
Total Dividends and Distributions | (0.16) | (0.51) | (2.39) | (0.70) | (0.97) |
Net Asset Value, End of Period | $13.49 | $12.15 | $11.54 | $16.53 | $12.93 |
Total Return* | 12.46% | 10.03% | (18.53)% | 33.72% | (1.48)% |
Net Assets, End of Period (in thousands) | $6,633 | $6,073 | $5,148 | $6,003 | $4,381 |
Ratios to Average Net Assets**: | |||||
Ratio of Gross Expenses(2) | 0.46% | 0.48% | 0.45% | 0.46% | 0.46% |
Ratio of Net Expenses (After Waivers and Expense Offsets)(2) | 0.46% | 0.48% | 0.45% | 0.46% | 0.46% |
Ratio of Net Investment Income/(Loss)(2) | 1.54% | 1.11% | 3.28% | 1.17% | 1.29% |
Portfolio Turnover Rate | 100% | 35% | 32% | 50% | 49% |
* | Total return includes adjustments in accordance with generally accepted accounting principles required at the year or period end and are not annualized for periods of less than one full year. Returns shown exclude any applicable sales charges. |
** | Annualized for periods of less than one full year. |
(1) | Per share amounts are calculated based on average shares outstanding during the year or period. |
(2) | Ratios do not include indirect expenses of the underlying funds and/or investment companies in which the Fund invests. |
Financial Highlights
Class C Shares | |||||
For a share outstanding during the year ended June 30 | 2024 | 2023 | 2022 | 2021 | 2020 |
Net Asset Value, Beginning of Period | $11.86 | $11.25 | $16.16 | $12.65 | $13.76 |
Income/(Loss) from Investment Operations: | |||||
Net investment income/(loss)(1) | 0.10 | 0.05 | 0.37 | 0.09 | 0.07 |
Net realized and unrealized gain/(loss) | 1.27 | 0.97 | (3.01) | 4.00 | (0.32) |
Total from Investment Operations | 1.37 | 1.02 | (2.64) | 4.09 | (0.25) |
Less Dividends and Distributions: | |||||
Dividends (from net investment income) | (0.07) | — | (0.38) | (0.06) | (0.06) |
Distributions (from capital gains) | — | (0.41) | (1.89) | (0.52) | (0.80) |
Total Dividends and Distributions | (0.07) | (0.41) | (2.27) | (0.58) | (0.86) |
Net Asset Value, End of Period | $13.16 | $11.86 | $11.25 | $16.16 | $12.65 |
Total Return* | 11.58% | 9.31% | (19.11)% | 32.77% | (2.23)% |
Net Assets, End of Period (in thousands) | $1,820 | $2,373 | $3,031 | $4,096 | $4,497 |
Ratios to Average Net Assets**: | |||||
Ratio of Gross Expenses(2) | 1.19% | 1.14% | 1.16% | 1.14% | 1.18% |
Ratio of Net Expenses (After Waivers and Expense Offsets)(2) | 1.19% | 1.14% | 1.16% | 1.14% | 1.18% |
Ratio of Net Investment Income/(Loss)(2) | 0.83% | 0.40% | 2.60% | 0.64% | 0.55% |
Portfolio Turnover Rate | 100% | 35% | 32% | 50% | 49% |
* | Total return includes adjustments in accordance with generally accepted accounting principles required at the year or period end and are not annualized for periods of less than one full year. Returns shown exclude any applicable sales charges. |
** | Annualized for periods of less than one full year. |
(1) | Per share amounts are calculated based on average shares outstanding during the year or period. |
(2) | Ratios do not include indirect expenses of the underlying funds and/or investment companies in which the Fund invests. |
Financial Highlights
Class D Shares | |||||
For a share outstanding during the year ended June 30 | 2024 | 2023 | 2022 | 2021 | 2020 |
Net Asset Value, Beginning of Period | $12.29 | $11.66 | $16.68 | $13.04 | $14.17 |
Income/(Loss) from Investment Operations: | |||||
Net investment income/(loss)(1) | 0.22 | 0.16 | 0.51 | 0.22 | 0.20 |
Net realized and unrealized gain/(loss) | 1.32 | 1.00 | (3.12) | 4.15 | (0.33) |
Total from Investment Operations | 1.54 | 1.16 | (2.61) | 4.37 | (0.13) |
Less Dividends and Distributions: | |||||
Dividends (from net investment income) | (0.19) | (0.12) | (0.52) | (0.21) | (0.20) |
Distributions (from capital gains) | — | (0.41) | (1.89) | (0.52) | (0.80) |
Total Dividends and Distributions | (0.19) | (0.53) | (2.41) | (0.73) | (1.00) |
Net Asset Value, End of Period | $13.64 | $12.29 | $11.66 | $16.68 | $13.04 |
Total Return* | 12.60% | 10.31% | (18.41)% | 34.01% | (1.37)% |
Net Assets, End of Period (in thousands) | $197,177 | $190,497 | $181,527 | $233,735 | $187,295 |
Ratios to Average Net Assets**: | |||||
Ratio of Gross Expenses(2) | 0.28% | 0.29% | 0.26% | 0.27% | 0.28% |
Ratio of Net Expenses (After Waivers and Expense Offsets)(2) | 0.27% | 0.28% | 0.26% | 0.27% | 0.28% |
Ratio of Net Investment Income/(Loss)(2) | 1.73% | 1.31% | 3.45% | 1.45% | 1.46% |
Portfolio Turnover Rate | 100% | 35% | 32% | 50% | 49% |
* | Total return includes adjustments in accordance with generally accepted accounting principles required at the year or period end and are not annualized for periods of less than one full year. |
** | Annualized for periods of less than one full year. |
(1) | Per share amounts are calculated based on average shares outstanding during the year or period. |
(2) | Ratios do not include indirect expenses of the underlying funds and/or investment companies in which the Fund invests. |
Financial Highlights
Class I Shares | |||||
For a share outstanding during the year ended June 30 | 2024 | 2023 | 2022 | 2021 | 2020 |
Net Asset Value, Beginning of Period | $12.28 | $11.65 | $16.68 | $13.04 | $14.16 |
Income/(Loss) from Investment Operations: | |||||
Net investment income/(loss)(1) | 0.22 | 0.16 | 0.54 | 0.23 | 0.22 |
Net realized and unrealized gain/(loss) | 1.32 | 1.01 | (3.14) | 4.14 | (0.33) |
Total from Investment Operations | 1.54 | 1.17 | (2.60) | 4.37 | (0.11) |
Less Dividends and Distributions: | |||||
Dividends (from net investment income) | (0.19) | (0.13) | (0.54) | (0.21) | (0.21) |
Distributions (from capital gains) | — | (0.41) | (1.89) | (0.52) | (0.80) |
Total Dividends and Distributions | (0.19) | (0.54) | (2.43) | (0.73) | (1.01) |
Net Asset Value, End of Period | $13.63 | $12.28 | $11.65 | $16.68 | $13.04 |
Total Return* | 12.63% | 10.40% | (18.42)% | 34.07% | (1.24)% |
Net Assets, End of Period (in thousands) | $13,397 | $13,700 | $11,359 | $14,799 | $11,548 |
Ratios to Average Net Assets**: | |||||
Ratio of Gross Expenses(2) | 0.23% | 0.23% | 0.21% | 0.21% | 0.22% |
Ratio of Net Expenses (After Waivers and Expense Offsets)(2) | 0.23% | 0.23% | 0.21% | 0.21% | 0.22% |
Ratio of Net Investment Income/(Loss)(2) | 1.74% | 1.37% | 3.65% | 1.49% | 1.59% |
Portfolio Turnover Rate | 100% | 35% | 32% | 50% | 49% |
* | Total return includes adjustments in accordance with generally accepted accounting principles required at the year or period end and are not annualized for periods of less than one full year. |
** | Annualized for periods of less than one full year. |
(1) | Per share amounts are calculated based on average shares outstanding during the year or period. |
(2) | Ratios do not include indirect expenses of the underlying funds and/or investment companies in which the Fund invests. |
Financial Highlights
Class S Shares | |||||
For a share outstanding during the year ended June 30 | 2024 | 2023 | 2022 | 2021 | 2020 |
Net Asset Value, Beginning of Period | $12.06 | $11.45 | $16.43 | $12.85 | $13.96 |
Income/(Loss) from Investment Operations: | |||||
Net investment income/(loss)(1) | 0.16 | 0.12 | 0.48 | 0.16 | 0.18 |
Net realized and unrealized gain/(loss) | 1.30 | 0.99 | (3.09) | 4.08 | (0.35) |
Total from Investment Operations | 1.46 | 1.11 | (2.61) | 4.24 | (0.17) |
Less Dividends and Distributions: | |||||
Dividends (from net investment income) | (0.14) | (0.09) | (0.48) | (0.14) | (0.14) |
Distributions (from capital gains) | — | (0.41) | (1.89) | (0.52) | (0.80) |
Total Dividends and Distributions | (0.14) | (0.50) | (2.37) | (0.66) | (0.94) |
Net Asset Value, End of Period | $13.38 | $12.06 | $11.45 | $16.43 | $12.85 |
Total Return* | 12.17% | 9.97% | (18.71)% | 33.45% | (1.67)% |
Net Assets, End of Period (in thousands) | $1,557 | $1,031 | $1,134 | $1,408 | $1,539 |
Ratios to Average Net Assets**: | |||||
Ratio of Gross Expenses(2) | 0.63% | 0.64% | 0.62% | 0.62% | 0.62% |
Ratio of Net Expenses (After Waivers and Expense Offsets)(2) | 0.63% | 0.64% | 0.62% | 0.62% | 0.62% |
Ratio of Net Investment Income/(Loss)(2) | 1.27% | 1.06% | 3.31% | 1.05% | 1.30% |
Portfolio Turnover Rate | 100% | 35% | 32% | 50% | 49% |
* | Total return includes adjustments in accordance with generally accepted accounting principles required at the year or period end and are not annualized for periods of less than one full year. |
** | Annualized for periods of less than one full year. |
(1) | Per share amounts are calculated based on average shares outstanding during the year or period. |
(2) | Ratios do not include indirect expenses of the underlying funds and/or investment companies in which the Fund invests. |
Financial Highlights
Class T Shares | |||||
For a share outstanding during the year ended June 30 | 2024 | 2023 | 2022 | 2021 | 2020 |
Net Asset Value, Beginning of Period | $12.27 | $11.64 | $16.65 | $13.02 | $14.14 |
Income/(Loss) from Investment Operations: | |||||
Net investment income/(loss)(1) | 0.21 | 0.15 | 0.49 | 0.21 | 0.19 |
Net realized and unrealized gain/(loss) | 1.31 | 1.00 | (3.10) | 4.14 | (0.32) |
Total from Investment Operations | 1.52 | 1.15 | (2.61) | 4.35 | (0.13) |
Less Dividends and Distributions: | |||||
Dividends (from net investment income) | (0.17) | (0.11) | (0.51) | (0.20) | (0.19) |
Distributions (from capital gains) | — | (0.41) | (1.89) | (0.52) | (0.80) |
Total Dividends and Distributions | (0.17) | (0.52) | (2.40) | (0.72) | (0.99) |
Net Asset Value, End of Period | $13.62 | $12.27 | $11.64 | $16.65 | $13.02 |
Total Return* | 12.52% | 10.22% | (18.45)% | 33.88% | (1.37)% |
Net Assets, End of Period (in thousands) | $12,316 | $12,635 | $13,387 | $16,385 | $13,330 |
Ratios to Average Net Assets**: | |||||
Ratio of Gross Expenses(2) | 0.38% | 0.39% | 0.36% | 0.37% | 0.37% |
Ratio of Net Expenses (After Waivers and Expense Offsets)(2) | 0.34% | 0.35% | 0.34% | 0.34% | 0.35% |
Ratio of Net Investment Income/(Loss)(2) | 1.65% | 1.24% | 3.34% | 1.37% | 1.43% |
Portfolio Turnover Rate | 100% | 35% | 32% | 50% | 49% |
* | Total return includes adjustments in accordance with generally accepted accounting principles required at the year or period end and are not annualized for periods of less than one full year. |
** | Annualized for periods of less than one full year. |
(1) | Per share amounts are calculated based on average shares outstanding during the year or period. |
(2) | Ratios do not include indirect expenses of the underlying funds and/or investment companies in which the Fund invests. |
Notes to Financial Statements
Average Daily Net Assets of Class D Shares of the Janus Henderson funds | Administrative Services Fee |
Under $40 billion | 0.12% |
$40 billion — $49.9 billion | 0.10% |
Over $49.9 billion | 0.08% |
Notes to Financial Statements
Undistributed Ordinary Income | Undistributed Long-Term Gains | Accumulated Capital Losses | Loss Deferrals | Other Book to Tax Differences | Net Tax Appreciation/ (Depreciation) |
$1,552,766 | $14,094,076 | $- | $- | $(5,334) | $14,268,337 |
Federal Tax Cost | Unrealized Appreciation | Unrealized (Depreciation) | Net Tax Appreciation/ (Depreciation) |
$218,641,869 | $15,149,404 | $(881,067) | $14,268,337 |
For the year ended June 30, 2024 | |||
Distributions | |||
From Ordinary Income | From Long-Term Capital Gains | Tax Return of Capital | Net Investment Loss |
$3,208,937 | $- | $- | $- |
For the year ended June 30, 2023 | |||
Distributions | |||
From Ordinary Income | From Long-Term Capital Gains | Tax Return of Capital | Net Investment Loss |
$2,177,263 | $7,365,841 | $- | $- |
Notes to Financial Statements
Year ended June 30, 2024 | Year ended June 30, 2023 | |||
Shares | Amount | Shares | Amount | |
Class A Shares: | ||||
Shares sold | 45,166 | $576,075 | 115,901 | $1,364,485 |
Reinvested dividends and distributions | 6,096 | 76,812 | 19,817 | 223,339 |
Shares repurchased | (59,332) | (743,080) | (82,085) | (964,518) |
Net Increase/(Decrease) | (8,070) | $(90,193) | 53,633 | $623,306 |
Class C Shares: | ||||
Shares sold | 10,802 | $128,326 | 18,242 | $206,928 |
Reinvested dividends and distributions | 1,033 | 12,756 | 7,846 | 86,622 |
Shares repurchased | (73,706) | (911,332) | (95,507) | (1,062,357) |
Net Increase/(Decrease) | (61,871) | $(770,250) | (69,419) | $(768,807) |
Class D Shares: | ||||
Shares sold | 554,572 | $7,076,644 | 502,381 | $5,966,714 |
Reinvested dividends and distributions | 213,674 | 2,722,210 | 697,247 | 7,941,664 |
Shares repurchased | (1,818,994) | (23,145,578) | (1,264,469) | (14,976,657) |
Net Increase/(Decrease) | (1,050,748) | $(13,346,724) | (64,841) | $(1,068,279) |
Class I Shares: | ||||
Shares sold | 200,348 | $2,539,602 | 484,618 | $5,591,527 |
Reinvested dividends and distributions | 14,637 | 186,334 | 51,778 | 588,717 |
Shares repurchased | (348,239) | (4,372,504) | (395,189) | (4,698,425) |
Net Increase/(Decrease) | (133,254) | $(1,646,568) | 141,207 | $1,481,819 |
Class S Shares: | ||||
Shares sold | 32,531 | $403,745 | 15,078 | $179,544 |
Reinvested dividends and distributions | 934 | 11,693 | 4,862 | 54,407 |
Shares repurchased | (2,678) | (30,876) | (33,387) | (388,910) |
Net Increase/(Decrease) | 30,787 | $384,562 | (13,447) | $(154,959) |
Class T Shares: | ||||
Shares sold | 439,427 | $5,646,206 | 243,469 | $2,847,082 |
Reinvested dividends and distributions | 12,632 | 160,683 | 47,633 | 541,587 |
Shares repurchased | (577,937) | (7,387,549) | (411,256) | (4,829,594) |
Net Increase/(Decrease) | (125,878) | $(1,580,660) | (120,154) | $(1,440,925) |
Purchases of Securities | Proceeds from Sales of Securities | Purchases of Long- Term U.S. Government Obligations | Proceeds from Sales of Long-Term U.S. Government Obligations |
$224,075,234 | $234,537,942 | $- | $- |
Report of Independent Registered Public Accounting Firm
August 22, 2024
Designation Requirements (unaudited)
Capital Gain Distributions | $635,763 |
Foreign Taxes Paid | $179,104 |
Foreign Source Income | $460,186 |
Dividends Received Deduction Percentage | 26% |
Qualified Dividend Income Percentage | 62% |
Additional Information (unaudited)
June 30, 2024
Schedule of Investments
June 30, 2024
Shares | Value | ||
Investment Companies – 100.0% | |||
Equity Funds – 46.0% | |||
Janus Henderson Adaptive Risk Managed U.S. Equity Fund - Class N Shares£ | 681,842 | $7,597,558 | |
Janus Henderson Enterprise Fund - Class N Shares£ | 92,617 | 12,991,576 | |
Janus Henderson Growth and Income Fund - Class N Shares£ | 191,558 | 14,280,618 | |
Janus Henderson Overseas Fund - Class N Shares£ | 801,400 | 37,850,078 | |
Janus Henderson Research Fund - Class N Shares*,£ | 140,910 | 11,591,156 | |
Janus Henderson Small-Mid Cap Value Fund - Class N Shares£ | 48,641 | 778,776 | |
Janus Henderson Triton Fund - Class N Shares£ | 10,392 | 286,200 | |
Janus Henderson U.S. Dividend Income Fund - Class N Shares£ | 189,448 | 2,082,099 | |
87,458,061 | |||
Exchange-Traded Funds (ETFs) – 29.9% | |||
iShares Core International Aggregate Bond | 231,036 | 11,533,317 | |
iShares JP Morgan USD Emerging Markets Bond | 112,670 | 9,969,042 | |
iShares Russell 2000 Value | 36,737 | 5,595,045 | |
Janus Henderson Small Cap Growth Alpha£ | 29,708 | 1,754,555 | |
Vanguard FTSE Emerging Markets | 472,753 | 20,687,670 | |
Vanguard Value | 44,840 | 7,192,784 | |
56,732,413 | |||
Fixed Income Funds – 23.2% | |||
Janus Henderson Developed World Bond Fund - Class N Shares£ | 3,280,992 | 24,771,453 | |
Janus Henderson Flexible Bond Fund - Class N Shares£ | 1,961,796 | 18,048,468 | |
Janus Henderson High-Yield Fund - Class N Shares£ | 108,047 | 781,179 | |
Janus Henderson Short Duration Flexible Bond Fund - Class N Shares£ | 143,623 | 406,454 | |
44,007,554 | |||
Money Markets – 0.9% | |||
Janus Henderson Cash Liquidity Fund LLC, 5.3419%ºº,£ | 1,689,977 | 1,690,315 | |
Total Investments (total cost $181,155,349) – 100.0% | 189,888,343 | ||
Liabilities, net of Cash, Receivables and Other Assets – (0)% | (31,858) | ||
Net Assets – 100% | $189,856,485 |
Schedule of Investments
June 30, 2024
Schedule of Affiliated Investments - (% of Net Assets) | |||||||||
Affiliate | Affiliated Investments, at Value at 6/30/23 | Purchases | Sales Proceeds | Realized Gain/(Loss) | Change in Unrealized Appreciation/ Depreciation | Affiliated Investments, at Value at 6/30/24 | Ending Shares | Dividend Income | Capital Gain Distributions from Underlying Funds |
Investment Companies - 71.0% | |||||||||
Equity Funds - 46.0% | |||||||||
Janus Henderson Adaptive Global Allocation Fund - Class N Shares | |||||||||
$10,568,203 | $587,615 | $(11,176,036) | $309,228 | $(289,010) | $- | - | $961,103 | $192,593 | |
Janus Henderson Adaptive Risk Managed U.S. Equity Fund - Class N Shares | |||||||||
11,052,160 | 1,217,328 | (6,205,556) | 985,735 | 547,891 | 7,597,558 | 681,842 | 70,153 | 357,528 | |
Janus Henderson Asia Equity Fund - Class N Shares | |||||||||
4,080,932 | 64,224 | (4,403,796) | (88,274) | 346,914 | - | - | 1,852 | - | |
Janus Henderson Contrarian Fund - Class N Shares | |||||||||
7,313,733 | 596,163 | (8,188,125) | 2,470,432 | (2,192,203) | - | - | 44,822 | 439,017 | |
Janus Henderson Emerging Markets Fund - Class N Shares | |||||||||
11,363,068 | 248,662 | (12,067,092) | (859,412) | 1,314,774 | - | - | 68,414 | - | |
Janus Henderson Enterprise Fund - Class N Shares | |||||||||
5,506,479 | 8,092,439 | (853,551) | 10,266 | 235,943 | 12,991,576 | 92,617 | - | 419,047 | |
Janus Henderson European Focus Fund - Class N Shares | |||||||||
3,036,451 | 2,343,160 | (6,185,453) | 1,157,713 | (351,871) | - | - | 133,816 | - | |
Janus Henderson Forty Fund - Class N Shares | |||||||||
5,725,518 | 2,120,818 | (9,284,949) | 2,670,478 | (1,231,865) | - | - | 24,707 | 553,640 | |
Janus Henderson Global Equity Income Fund - Class N Shares | |||||||||
5,283,368 | 3,963,054 | (9,835,966) | (49,724) | 639,268 | - | - | 438,090 | - | |
Janus Henderson Global Real Estate Fund - Class N Shares | |||||||||
4,318,573 | 153,194 | (4,464,594) | 637,772 | (644,945) | - | - | 91,108 | - | |
Janus Henderson Global Research Fund - Class N Shares | |||||||||
3,786,506 | 1,534,569 | (6,311,995) | 1,318,013 | (327,093) | - | - | 49,273 | 200,514 | |
Janus Henderson Global Select Fund - Class N Shares | |||||||||
6,646,549 | 588,231 | (8,204,644) | 2,206,907 | (1,237,043) | - | - | 87,664 | 399,923 | |
Janus Henderson Growth and Income Fund - Class N Shares | |||||||||
5,412,270 | 11,049,657 | (2,789,517) | 158,867 | 449,341 | 14,280,618 | 191,558 | 122,365 | 630,170 | |
Janus Henderson Overseas Fund - Class N Shares | |||||||||
12,994,370 | 27,466,838 | (3,744,132) | 930,024 | 202,978 | 37,850,078 | 801,400 | 164,454 | - | |
Janus Henderson Research Fund - Class N Shares* | |||||||||
- | 11,708,671 | (159,211) | (344) | 42,040 | 11,591,156 | 140,910 | - | - | |
Janus Henderson Small-Mid Cap Value Fund - Class N Shares | |||||||||
7,145,641 | 169,782 | (7,547,788) | 593,480 | 417,661 | 778,776 | 48,641 | 64,737 | - | |
Janus Henderson Triton Fund - Class N Shares | |||||||||
4,406,443 | 776,168 | (4,900,808) | 1,080,103 | (1,075,706) | 286,200 | 10,392 | - | 311,876 | |
Janus Henderson U.S. Dividend Income Fund - Class N Shares | |||||||||
5,691,394 | 214,457 | (4,287,385) | 392,864 | 70,769 | 2,082,099 | 189,448 | 118,051 | - | |
Total Equity Funds - 46.0% | |||||||||
$114,331,658 | $72,895,030 | $(110,610,598) | $13,924,128 | $(3,082,157) | $87,458,061 | 2,156,808 | $2,440,609 | $3,504,308 | |
Exchange-Traded Funds (ETFs) - 0.9% | |||||||||
Janus Henderson AAA CLO | |||||||||
3,015,825 | 2,021,297 | (5,107,411) | 102,262 | (31,973) | - | - | 246,088 | - | |
Janus Henderson Small Cap Growth Alpha | |||||||||
- | 1,742,327 | (22,361) | 128 | 34,461 | 1,754,555 | 29,708 | 1,520 | - | |
Total Exchange-Traded Funds (ETFs) - 0.9% | |||||||||
$3,015,825 | $3,763,624 | $(5,129,772) | $102,390 | $2,488 | $1,754,555 | 29,708 | $247,608 | $- |
Schedule of Investments
June 30, 2024
Affiliate | Affiliated Investments, at Value at 6/30/23 | Purchases | Sales Proceeds | Realized Gain/(Loss) | Change in Unrealized Appreciation/ Depreciation | Affiliated Investments, at Value at 6/30/24 | Ending Shares | Dividend Income | Capital Gain Distributions from Underlying Funds |
Investment Companies - (continued) | |||||||||
Fixed Income Funds - 23.2% | |||||||||
Janus Henderson Developed World Bond Fund - Class N Shares | |||||||||
$- | $41,727,023 | $(16,955,771) | $94,452 | $(94,251) | $24,771,453 | 3,280,992 | $467,709 | $- | |
Janus Henderson Flexible Bond Fund - Class N Shares | |||||||||
18,813,049 | 7,413,911 | (7,949,382) | (296,120) | 67,010 | 18,048,468 | 1,961,796 | 671,456 | - | |
Janus Henderson Global Bond Fund - Class N Shares | |||||||||
46,390,269 | 1,107,463 | (48,020,516) | (7,461,935) | 7,984,719 | - | - | (306,766) þ | - | |
Janus Henderson High-Yield Fund - Class N Shares | |||||||||
1,116,081 | 394,496 | (766,278) | (123,157) | 160,037 | 781,179 | 108,047 | 87,622 | - | |
Janus Henderson Multi-Sector Income Fund - Class N Shares | |||||||||
644,661 | 3,132,766 | (3,824,482) | 54,037 | (6,982) | - | - | 140,499 | - | |
Janus Henderson Short Duration Flexible Bond Fund - Class N Shares | |||||||||
5,701,280 | 2,302,561 | (7,628,618) | (180,820) | 212,051 | 406,454 | 143,623 | 155,028 | - | |
Total Fixed Income Funds - 23.2% | |||||||||
$72,665,340 | $56,078,220 | $(85,145,047) | $(7,913,543) | $8,322,584 | $44,007,554 | 5,494,458 | $1,215,548 | $- | |
Money Markets - 0.9% | |||||||||
Janus Henderson Cash Liquidity Fund LLC, 5.3419%ºº | |||||||||
192,076 | 5,935,908 | (4,437,669) | - | - | 1,690,315 | 1,689,977 | 46,722 | - | |
Total Affiliated Investments - 71.0% | |||||||||
$190,204,899 | $138,672,782 | $(205,323,086) | $6,112,975 | $5,242,915 | $134,910,485 | 9,370,951 | $3,950,487 | $3,504,308 |
Notes to Schedule of Investments and Other Information
LLC | Limited Liability Company |
* | Non-income producing security. |
ºº | Rate shown is the 7-day yield as of June 30, 2024. |
£ | The Fund may invest in certain securities that are considered affiliated companies. As defined by the Investment Company Act of 1940, as amended, an affiliated company is one in which the Fund owns 5% or more of the outstanding voting securities, or a company which is under common ownership or control. |
þ | During the Fund’s current reporting period, a portion of the prior year distributions it received from this underlying fund was determined to be return of capital distributions. The negative amount disclosed was originally recorded as income in the Fund’s prior fiscal year and has been reclassified as a return of capital in the current reporting period. |
Valuation Inputs Summary | |||
Level 1 - Quoted Prices | Level 2 - Other Significant Observable Inputs | Level 3 - Significant Unobservable Inputs | |
Assets | |||
Investments In Securities: | |||
Investment Companies | |||
Equity Funds | $87,458,061 | $- | $- |
Exchange-Traded Funds (ETFs) | 56,732,413 | - | - |
Fixed Income Funds | 44,007,554 | - | - |
Money Markets | - | 1,690,315 | - |
Total Assets | $188,198,028 | $1,690,315 | $- |
Statement of Assets and Liabilities
June 30, 2024
Assets: | |
Unaffiliated investments, at value (cost $55,178,305) | $54,977,858 |
Affiliated investments, at value (cost $125,977,044) | 134,910,485 |
Trustees' deferred compensation | 5,229 |
Receivables: | |
Dividends | 246,346 |
Investments sold | 54,127 |
Fund shares sold | 19,260 |
Due from adviser | 11,603 |
Dividends from affiliates | 5,804 |
Other assets | 267 |
Total Assets | 190,230,979 |
Liabilities: | |
Payables: | |
Investments purchased | 197,588 |
Fund shares repurchased | 75,504 |
Professional fees | 41,741 |
Transfer agent fees and expenses | 24,995 |
Advisory fees | 7,817 |
Trustees' deferred compensation fees | 5,229 |
12b-1 Distribution and shareholder servicing fees | 2,525 |
Custodian fees | 1,110 |
Trustees' fees and expenses | 1,035 |
Accrued expenses and other payables | 16,950 |
Total Liabilities | 374,494 |
Commitments and contingent liabilities (Note 3) | |
Net Assets | $189,856,485 |
Net Assets Consist of: | |
Capital (par value and paid-in surplus) | $177,686,170 |
Total distributable earnings (loss) | 12,170,315 |
Total Net Assets | $189,856,485 |
Net Assets - Class A Shares | $9,236,613 |
Shares Outstanding, $0.01 Par Value (unlimited shares authorized) | 754,437 |
Net Asset Value Per Share(1) | $12.24 |
Maximum Offering Price Per Share(2) | $12.99 |
Net Assets - Class C Shares | $629,315 |
Shares Outstanding, $0.01 Par Value (unlimited shares authorized) | 52,259 |
Net Asset Value Per Share(1) | $12.04 |
Net Assets - Class D Shares | $164,482,484 |
Shares Outstanding, $0.01 Par Value (unlimited shares authorized) | 13,325,218 |
Net Asset Value Per Share | $12.34 |
Net Assets - Class I Shares | $3,446,674 |
Shares Outstanding, $0.01 Par Value (unlimited shares authorized) | 279,443 |
Net Asset Value Per Share | $12.33 |
Net Assets - Class S Shares | $538,950 |
Shares Outstanding, $0.01 Par Value (unlimited shares authorized) | 44,423 |
Net Asset Value Per Share | $12.13 |
Net Assets - Class T Shares | $11,522,449 |
Shares Outstanding, $0.01 Par Value (unlimited shares authorized) | 936,662 |
Net Asset Value Per Share | $12.30 |
(1) | Redemption price per share may be reduced for any applicable contingent deferred sales charge. |
(2) | Maximum offering price is computed at 100/94.25 of net asset value. |
Statement of Operations
For the year ended June 30, 2024
Investment Income: | |
Dividends from affiliates | $3,950,487 |
Dividends | 796,579 |
Other income | 607 |
Total Investment Income | 4,747,673 |
Expenses: | |
Advisory fees | 92,843 |
12b-1 Distribution and shareholder servicing fees: | |
Class A Shares | 22,885 |
Class C Shares | 6,468 |
Class S Shares | 1,171 |
Transfer agent administrative fees and expenses: | |
Class D Shares | 183,254 |
Class S Shares | 1,192 |
Class T Shares | 27,879 |
Transfer agent networking and omnibus fees: | |
Class A Shares | 5,099 |
Class C Shares | 682 |
Class I Shares | 3,241 |
Other transfer agent fees and expenses: | |
Class A Shares | 528 |
Class C Shares | 49 |
Class D Shares | 27,585 |
Class I Shares | 218 |
Class S Shares | 21 |
Class T Shares | 233 |
Registration fees | 88,145 |
Professional fees | 48,003 |
Shareholder reports expense | 37,213 |
Custodian fees | 10,948 |
Trustees' fees and expenses | 3,989 |
Other expenses | 15,976 |
Total Expenses | 577,622 |
Less: Excess Expense Reimbursement and Waivers | (77,918) |
Net Expenses | 499,704 |
Net Investment Income/(Loss) | 4,247,969 |
Net Realized Gain/(Loss) on Investments: | |
Investments | (748,820) |
Investments in affiliates | 6,112,975 |
Capital gain distributions from underlying funds | 3,504,308 |
Total Net Realized Gain/(Loss) on Investments | 8,868,463 |
Change in Unrealized Net Appreciation/Depreciation: | |
Investments and Trustees' deferred compensation | (200,527) |
Investments in affiliates | 5,242,915 |
Total Change in Unrealized Net Appreciation/Depreciation | 5,042,388 |
Net Increase/(Decrease) in Net Assets Resulting from Operations | $18,158,820 |
Statements of Changes in Net Assets
Year ended June 30, 2024 | Year ended June 30, 2023 | |
Operations: | ||
Net investment income/(loss) | $4,247,969 | $2,762,568 |
Net realized gain/(loss) on investments | 8,868,463 | (6,010,036) |
Change in unrealized net appreciation/depreciation | 5,042,388 | 17,173,033 |
Net Increase/(Decrease) in Net Assets Resulting from Operations | 18,158,820 | 13,925,565 |
Dividends and Distributions to Shareholders: | ||
Class A Shares | (124,694) | (242,632) |
Class C Shares | (4,668) | (20,118) |
Class D Shares | (2,504,968) | (4,624,841) |
Class I Shares | (53,937) | (122,537) |
Class S Shares | (4,883) | (26,980) |
Class T Shares | (155,379) | (324,596) |
Net Decrease from Dividends and Distributions to Shareholders | (2,848,529) | (5,361,704) |
Capital Share Transactions: | ||
Class A Shares | (951,563) | (2,434,840) |
Class C Shares | (214,694) | (653,691) |
Class D Shares | (13,120,896) | (7,638,439) |
Class I Shares | (735,120) | (767,425) |
Class S Shares | 54,307 | (664,740) |
Class T Shares | (613,919) | (2,468,613) |
Net Increase/(Decrease) from Capital Share Transactions | (15,581,885) | (14,627,748) |
Net Increase/(Decrease) in Net Assets | (271,594) | (6,063,887) |
Net Assets: | ||
Beginning of period | 190,128,079 | 196,191,966 |
End of period | $189,856,485 | $190,128,079 |
Financial Highlights
Class A Shares | |||||
For a share outstanding during the year ended June 30 | 2024 | 2023 | 2022 | 2021 | 2020 |
Net Asset Value, Beginning of Period | $11.28 | $10.79 | $14.88 | $12.29 | $12.90 |
Income/(Loss) from Investment Operations: | |||||
Net investment income/(loss)(1) | 0.24 | 0.14 | 0.43 | 0.22 | 0.16 |
Net realized and unrealized gain/(loss) | 0.88 | 0.64 | (2.77) | 2.98 | (0.06) |
Total from Investment Operations | 1.12 | 0.78 | (2.34) | 3.20 | 0.10 |
Less Dividends and Distributions: | |||||
Dividends (from net investment income) | (0.16) | (0.06) | (0.44) | (0.22) | (0.14) |
Distributions (from capital gains) | — | (0.23) | (1.31) | (0.39) | (0.57) |
Total Dividends and Distributions | (0.16) | (0.29) | (1.75) | (0.61) | (0.71) |
Net Asset Value, End of Period | $12.24 | $11.28 | $10.79 | $14.88 | $12.29 |
Total Return* | 9.98% | 7.37% | (17.84)% | 26.39% | 0.60% |
Net Assets, End of Period (in thousands) | $9,237 | $9,441 | $11,371 | $14,023 | $8,165 |
Ratios to Average Net Assets**: | |||||
Ratio of Gross Expenses(2) | 0.45% | 0.46% | 0.43% | 0.43% | 0.41% |
Ratio of Net Expenses (After Waivers and Expense Offsets)(2) | 0.43% | 0.44% | 0.43% | 0.43% | 0.41% |
Ratio of Net Investment Income/(Loss)(2) | 2.11% | 1.24% | 3.21% | 1.56% | 1.29% |
Portfolio Turnover Rate | 104% | 36% | 43% | 41% | 51% |
* | Total return includes adjustments in accordance with generally accepted accounting principles required at the year or period end and are not annualized for periods of less than one full year. Returns shown exclude any applicable sales charges. |
** | Annualized for periods of less than one full year. |
(1) | Per share amounts are calculated based on average shares outstanding during the year or period. |
(2) | Ratios do not include indirect expenses of the underlying funds and/or investment companies in which the Fund invests. |
Financial Highlights
Class C Shares | |||||
For a share outstanding during the year ended June 30 | 2024 | 2023 | 2022 | 2021 | 2020 |
Net Asset Value, Beginning of Period | $11.10 | $10.64 | $14.66 | $12.11 | $12.70 |
Income/(Loss) from Investment Operations: | |||||
Net investment income/(loss)(1) | 0.16 | 0.06 | 0.32 | 0.16 | 0.06 |
Net realized and unrealized gain/(loss) | 0.85 | 0.63 | (2.72) | 2.88 | (0.05) |
Total from Investment Operations | 1.01 | 0.69 | (2.40) | 3.04 | 0.01 |
Less Dividends and Distributions: | |||||
Dividends (from net investment income) | (0.07) | — | (0.31) | (0.10) | (0.03) |
Distributions (from capital gains) | — | (0.23) | (1.31) | (0.39) | (0.57) |
Total Dividends and Distributions | (0.07) | (0.23) | (1.62) | (0.49) | (0.60) |
Net Asset Value, End of Period | $12.04 | $11.10 | $10.64 | $14.66 | $12.11 |
Total Return* | 9.15% | 6.61% | (18.40)% | 25.39% | (0.06)% |
Net Assets, End of Period (in thousands) | $629 | $789 | $1,387 | $2,854 | $4,381 |
Ratios to Average Net Assets**: | |||||
Ratio of Gross Expenses(2) | 1.16% | 1.17% | 1.19% | 1.12% | 1.18% |
Ratio of Net Expenses (After Waivers and Expense Offsets)(2) | 1.14% | 1.15% | 1.19% | 1.11% | 1.18% |
Ratio of Net Investment Income/(Loss)(2) | 1.46% | 0.56% | 2.42% | 1.17% | 0.45% |
Portfolio Turnover Rate | 104% | 36% | 43% | 41% | 51% |
* | Total return includes adjustments in accordance with generally accepted accounting principles required at the year or period end and are not annualized for periods of less than one full year. Returns shown exclude any applicable sales charges. |
** | Annualized for periods of less than one full year. |
(1) | Per share amounts are calculated based on average shares outstanding during the year or period. |
(2) | Ratios do not include indirect expenses of the underlying funds and/or investment companies in which the Fund invests. |
Financial Highlights
Class D Shares | |||||
For a share outstanding during the year ended June 30 | 2024 | 2023 | 2022 | 2021 | 2020 |
Net Asset Value, Beginning of Period | $11.37 | $10.88 | $14.99 | $12.38 | $12.98 |
Income/(Loss) from Investment Operations: | |||||
Net investment income/(loss)(1) | 0.27 | 0.16 | 0.45 | 0.26 | 0.18 |
Net realized and unrealized gain/(loss) | 0.88 | 0.65 | (2.79) | 2.98 | (0.05) |
Total from Investment Operations | 1.15 | 0.81 | (2.34) | 3.24 | 0.13 |
Less Dividends and Distributions: | |||||
Dividends (from net investment income) | (0.18) | (0.09) | (0.46) | (0.24) | (0.16) |
Distributions (from capital gains) | — | (0.23) | (1.31) | (0.39) | (0.57) |
Total Dividends and Distributions | (0.18) | (0.32) | (1.77) | (0.63) | (0.73) |
Net Asset Value, End of Period | $12.34 | $11.37 | $10.88 | $14.99 | $12.38 |
Total Return* | 10.19% | 7.59% | (17.71)% | 26.53% | 0.84% |
Net Assets, End of Period (in thousands) | $164,482 | $164,312 | $164,692 | $213,724 | $178,202 |
Ratios to Average Net Assets**: | |||||
Ratio of Gross Expenses(2) | 0.29% | 0.30% | 0.26% | 0.27% | 0.27% |
Ratio of Net Expenses (After Waivers and Expense Offsets)(2) | 0.25% | 0.26% | 0.25% | 0.25% | 0.26% |
Ratio of Net Investment Income/(Loss)(2) | 2.30% | 1.46% | 3.35% | 1.84% | 1.40% |
Portfolio Turnover Rate | 104% | 36% | 43% | 41% | 51% |
* | Total return includes adjustments in accordance with generally accepted accounting principles required at the year or period end and are not annualized for periods of less than one full year. |
** | Annualized for periods of less than one full year. |
(1) | Per share amounts are calculated based on average shares outstanding during the year or period. |
(2) | Ratios do not include indirect expenses of the underlying funds and/or investment companies in which the Fund invests. |
Financial Highlights
Class I Shares | |||||
For a share outstanding during the year ended June 30 | 2024 | 2023 | 2022 | 2021 | 2020 |
Net Asset Value, Beginning of Period | $11.36 | $10.86 | $14.98 | $12.37 | $12.97 |
Income/(Loss) from Investment Operations: | |||||
Net investment income/(loss)(1) | 0.27 | 0.17 | 0.53 | 0.25 | 0.19 |
Net realized and unrealized gain/(loss) | 0.88 | 0.64 | (2.86) | 3.00 | (0.05) |
Total from Investment Operations | 1.15 | 0.81 | (2.33) | 3.25 | 0.14 |
Less Dividends and Distributions: | |||||
Dividends (from net investment income) | (0.18) | (0.08) | (0.48) | (0.25) | (0.17) |
Distributions (from capital gains) | — | (0.23) | (1.31) | (0.39) | (0.57) |
Total Dividends and Distributions | (0.18) | (0.31) | (1.79) | (0.64) | (0.74) |
Net Asset Value, End of Period | $12.33 | $11.36 | $10.86 | $14.98 | $12.37 |
Total Return* | 10.21% | 7.65% | (17.72)% | 26.62% | 0.88% |
Net Assets, End of Period (in thousands) | $3,447 | $3,930 | $4,528 | $6,744 | $4,551 |
Ratios to Average Net Assets**: | |||||
Ratio of Gross Expenses(2) | 0.24% | 0.23% | 0.22% | 0.21% | 0.21% |
Ratio of Net Expenses (After Waivers and Expense Offsets)(2) | 0.22% | 0.21% | 0.22% | 0.21% | 0.21% |
Ratio of Net Investment Income/(Loss)(2) | 2.30% | 1.55% | 3.87% | 1.81% | 1.47% |
Portfolio Turnover Rate | 104% | 36% | 43% | 41% | 51% |
* | Total return includes adjustments in accordance with generally accepted accounting principles required at the year or period end and are not annualized for periods of less than one full year. |
** | Annualized for periods of less than one full year. |
(1) | Per share amounts are calculated based on average shares outstanding during the year or period. |
(2) | Ratios do not include indirect expenses of the underlying funds and/or investment companies in which the Fund invests. |
Financial Highlights
Class S Shares | |||||
For a share outstanding during the year ended June 30 | 2024 | 2023 | 2022 | 2021 | 2020 |
Net Asset Value, Beginning of Period | $11.16 | $10.69 | $14.75 | $12.19 | $12.79 |
Income/(Loss) from Investment Operations: | |||||
Net investment income/(loss)(1) | 0.22 | 0.14 | 0.40 | 0.21 | 0.15 |
Net realized and unrealized gain/(loss) | 0.87 | 0.60 | (2.74) | 2.93 | (0.07) |
Total from Investment Operations | 1.09 | 0.74 | (2.34) | 3.14 | 0.08 |
Less Dividends and Distributions: | |||||
Dividends (from net investment income) | (0.12) | (0.04) | (0.41) | (0.19) | (0.11) |
Distributions (from capital gains) | — | (0.23) | (1.31) | (0.39) | (0.57) |
Total Dividends and Distributions | (0.12) | (0.27) | (1.72) | (0.58) | (0.68) |
Net Asset Value, End of Period | $12.13 | $11.16 | $10.69 | $14.75 | $12.19 |
Total Return* | 9.80% | 7.11% | (17.97)% | 26.03% | 0.47% |
Net Assets, End of Period (in thousands) | $539 | $443 | $1,066 | $1,385 | $1,247 |
Ratios to Average Net Assets**: | |||||
Ratio of Gross Expenses(2) | 0.64% | 0.65% | 0.62% | 0.62% | 0.62% |
Ratio of Net Expenses (After Waivers and Expense Offsets)(2) | 0.62% | 0.63% | 0.62% | 0.62% | 0.62% |
Ratio of Net Investment Income/(Loss)(2) | 1.91% | 1.30% | 3.03% | 1.51% | 1.17% |
Portfolio Turnover Rate | 104% | 36% | 43% | 41% | 51% |
* | Total return includes adjustments in accordance with generally accepted accounting principles required at the year or period end and are not annualized for periods of less than one full year. |
** | Annualized for periods of less than one full year. |
(1) | Per share amounts are calculated based on average shares outstanding during the year or period. |
(2) | Ratios do not include indirect expenses of the underlying funds and/or investment companies in which the Fund invests. |
Financial Highlights
Class T Shares | |||||
For a share outstanding during the year ended June 30 | 2024 | 2023 | 2022 | 2021 | 2020 |
Net Asset Value, Beginning of Period | $11.33 | $10.84 | $14.94 | $12.34 | $12.94 |
Income/(Loss) from Investment Operations: | |||||
Net investment income/(loss)(1) | 0.25 | 0.15 | 0.44 | 0.24 | 0.16 |
Net realized and unrealized gain/(loss) | 0.89 | 0.64 | (2.78) | 2.98 | (0.04) |
Total from Investment Operations | 1.14 | 0.79 | (2.34) | 3.22 | 0.12 |
Less Dividends and Distributions: | |||||
Dividends (from net investment income) | (0.17) | (0.07) | (0.45) | (0.23) | (0.15) |
Distributions (from capital gains) | — | (0.23) | (1.31) | (0.39) | (0.57) |
Total Dividends and Distributions | (0.17) | (0.30) | (1.76) | (0.62) | (0.72) |
Net Asset Value, End of Period | $12.30 | $11.33 | $10.84 | $14.94 | $12.34 |
Total Return* | 10.13% | 7.51% | (17.77)% | 26.43% | 0.76% |
Net Assets, End of Period (in thousands) | $11,522 | $11,213 | $13,148 | $16,849 | $13,981 |
Ratios to Average Net Assets**: | |||||
Ratio of Gross Expenses(2) | 0.39% | 0.40% | 0.37% | 0.37% | 0.37% |
Ratio of Net Expenses (After Waivers and Expense Offsets)(2) | 0.33% | 0.33% | 0.33% | 0.32% | 0.34% |
Ratio of Net Investment Income/(Loss)(2) | 2.17% | 1.38% | 3.27% | 1.76% | 1.29% |
Portfolio Turnover Rate | 104% | 36% | 43% | 41% | 51% |
* | Total return includes adjustments in accordance with generally accepted accounting principles required at the year or period end and are not annualized for periods of less than one full year. |
** | Annualized for periods of less than one full year. |
(1) | Per share amounts are calculated based on average shares outstanding during the year or period. |
(2) | Ratios do not include indirect expenses of the underlying funds and/or investment companies in which the Fund invests. |
Notes to Financial Statements
Average Daily Net Assets of Class D Shares of the Janus Henderson funds | Administrative Services Fee |
Under $40 billion | 0.12% |
$40 billion — $49.9 billion | 0.10% |
Over $49.9 billion | 0.08% |
Notes to Financial Statements
Undistributed Ordinary Income | Undistributed Long-Term Gains | Accumulated Capital Losses | Loss Deferrals | Other Book to Tax Differences | Net Tax Appreciation/ (Depreciation) |
$3,347,080 | $1,277,746 | $- | $- | $(3,981) | $7,549,470 |
Federal Tax Cost | Unrealized Appreciation | Unrealized (Depreciation) | Net Tax Appreciation/ (Depreciation) |
$182,338,873 | $8,913,167 | $(1,363,697) | $7,549,470 |
For the year ended June 30, 2024 | |||
Distributions | |||
From Ordinary Income | From Long-Term Capital Gains | Tax Return of Capital | Net Investment Loss |
$2,848,529 | $- | $- | $- |
For the year ended June 30, 2023 | |||
Distributions | |||
From Ordinary Income | From Long-Term Capital Gains | Tax Return of Capital | Net Investment Loss |
$1,422,861 | $3,938,843 | $- | $- |
Notes to Financial Statements
Year ended June 30, 2024 | Year ended June 30, 2023 | |||
Shares | Amount | Shares | Amount | |
Class A Shares: | ||||
Shares sold | 22,126 | $257,872 | 84,220 | $917,214 |
Reinvested dividends and distributions | 10,493 | 122,562 | 21,826 | 232,007 |
Shares repurchased | (115,090) | (1,331,997) | (322,999) | (3,584,061) |
Net Increase/(Decrease) | (82,471) | $(951,563) | (216,953) | $(2,434,840) |
Class C Shares: | ||||
Shares sold | 7,155 | $77,156 | 28,017 | $287,539 |
Reinvested dividends and distributions | 399 | 4,595 | 1,918 | 20,118 |
Shares repurchased | (26,411) | (296,445) | (89,195) | (961,348) |
Net Increase/(Decrease) | (18,857) | $(214,694) | (59,260) | $(653,691) |
Class D Shares: | ||||
Shares sold | 721,958 | $8,357,771 | 714,673 | $7,931,540 |
Reinvested dividends and distributions | 208,854 | 2,456,124 | 426,840 | 4,571,454 |
Shares repurchased | (2,053,429) | (23,934,791) | (1,824,967) | (20,141,433) |
Net Increase/(Decrease) | (1,122,617) | $(13,120,896) | (683,454) | $(7,638,439) |
Class I Shares: | ||||
Shares sold | 73,036 | $855,201 | 47,600 | $530,997 |
Reinvested dividends and distributions | 4,590 | 53,937 | 11,452 | 122,537 |
Shares repurchased | (144,076) | (1,644,258) | (129,897) | (1,420,959) |
Net Increase/(Decrease) | (66,450) | $(735,120) | (70,845) | $(767,425) |
Class S Shares: | ||||
Shares sold | 4,637 | $53,310 | 6,843 | $74,191 |
Reinvested dividends and distributions | 422 | 4,883 | 2,562 | 26,980 |
Shares repurchased | (334) | (3,886) | (69,443) | (765,911) |
Net Increase/(Decrease) | 4,725 | $54,307 | (60,038) | $(664,740) |
Class T Shares: | ||||
Shares sold | 460,923 | $5,363,030 | 273,679 | $2,984,463 |
Reinvested dividends and distributions | 13,183 | 154,633 | 30,278 | 323,070 |
Shares repurchased | (526,877) | (6,131,582) | (526,952) | (5,776,146) |
Net Increase/(Decrease) | (52,771) | $(613,919) | (222,995) | $(2,468,613) |
Purchases of Securities | Proceeds from Sales of Securities | Purchases of Long- Term U.S. Government Obligations | Proceeds from Sales of Long-Term U.S. Government Obligations |
$194,563,537 | $205,088,576 | $- | $- |
Report of Independent Registered Public Accounting Firm
August 22, 2024
Designation Requirements (unaudited)
Capital Gain Distributions | $54,254 |
Foreign Taxes Paid | $110,394 |
Foreign Source Income | $284,183 |
Dividends Received Deduction Percentage | 15% |
Qualified Dividend Income Percentage | 35% |
Additional Information (unaudited)
June 30, 2024
Schedule of Investments
June 30, 2024
Principal Amounts | Value | ||
U.S. Government Agency Notes – 32.1% | |||
Federal Home Loan Bank Discount Notes: | |||
5.1800%, 7/1/24 | $6,000,000 | $6,000,000 | |
5.2140%, 7/5/24 | 6,000,000 | 5,996,540 | |
5.2250%, 7/10/24 | 6,000,000 | 5,992,201 | |
5.2400%, 7/12/24 | 6,000,000 | 5,990,337 | |
5.2480%, 7/17/24 | 5,000,000 | 4,988,401 | |
5.2700%, 7/18/24 | 6,000,000 | 5,984,785 | |
5.2000%, 7/19/24 | 6,000,000 | 5,984,289 | |
5.2699%, 7/22/24 | 6,000,000 | 5,981,517 | |
5.2570%, 7/24/24 | 6,000,000 | 5,979,967 | |
5.2150%, 7/26/24 | 6,000,000 | 5,977,936 | |
5.1950%, 8/2/24 | 5,000,000 | 4,976,770 | |
5.2490%, 8/7/24 | 6,000,000 | 5,967,321 | |
5.2550%, 8/9/24 | 5,000,000 | 4,971,035 | |
5.2450%, 8/14/24 | 5,000,000 | 4,967,924 | |
5.2400%, 8/16/24 | 5,000,000 | 4,966,343 | |
5.2500%, 8/23/24 | 6,000,000 | 5,953,786 | |
5.2400%, 8/28/24 | 6,000,000 | 5,949,127 | |
5.2500%, 9/6/24 | 5,000,000 | 4,951,589 | |
5.2400%, 9/11/24 | 6,000,000 | 5,936,903 | |
5.2400%, 9/18/24 | 6,000,000 | 5,930,840 | |
5.2450%, 9/20/24 | 6,000,000 | 5,928,397 | |
Freddie Mac Discount Notes: | |||
5.2500%, 8/13/24 | 6,000,000 | 5,962,240 | |
Total U.S. Government Agency Notes (cost $125,338,248) | 125,338,248 | ||
U.S. Treasury Debt – 16.3% | |||
United States Treasury Bill, 5.2725%, 7/2/24 | 6,000,000 | 5,999,134 | |
United States Treasury Bill, 5.2310%, 7/25/24 | 6,000,000 | 5,979,350 | |
United States Treasury Bill, 5.1518%, 8/1/24 | 6,000,000 | 5,973,186 | |
United States Treasury Bill, 5.2460%, 8/27/24 | 6,000,000 | 5,950,366 | |
United States Treasury Bill, 5.2315%, 9/3/24 | 6,000,000 | 5,944,437 | |
United States Treasury Bill, 5.2432%, 9/5/24 | 6,000,000 | 5,942,219 | |
United States Treasury Bill, 5.2375%, 9/17/24 | 6,000,000 | 5,932,418 | |
United States Treasury Bill, 5.2245%, 10/1/24 | 6,000,000 | 5,919,774 | |
United States Treasury Bill, 5.2175%, 10/8/24 | 5,000,000 | 4,928,770 | |
United States Treasury Bill, 5.2145%, 10/15/24 | 5,000,000 | 4,921,899 | |
United States Treasury Bill, 5.1574%, 11/14/24 | 6,000,000 | 5,883,048 | |
Total U.S. Treasury Debt (cost $63,374,601) | 63,374,601 | ||
Variable Rate Demand Notes¶ – 15.0% | |||
6213 Montezuma LLC (LOC: FHLB of San Francisco), 5.4500%, 2/1/62 | 2,200,000 | 2,200,000 | |
Alberta Street Development LLC (LOC: FHLB of San Francisco), 5.4500%, 3/1/61 | 2,000,000 | 2,000,000 | |
Bryan W Kelley 2019 Irrevocable Insurance Trust (LOC: FHLB of Dallas), 5.4500%, 7/1/70 | 2,980,000 | 2,980,000 | |
Cypress Bend Real Estate Development Co LLC (LOC: FHLB of Dallas), 5.4500%, 4/1/33 | 9,000,000 | 9,000,000 | |
Irvine Inn Apartments LP (LOC: FHLB of San Francisco), 5.4500%, 2/2/60 | 4,000,000 | 4,000,000 | |
John H Smith Irrevocable Insurance Trust of 2017/The (LOC: FHLB of Dallas), 5.4500%, 2/1/41 | 5,820,000 | 5,820,000 | |
Johnson Capital Management LLC (LOC: FHLB of Indianapolis), 5.7500%, 6/3/47 | 2,845,000 | 2,845,000 | |
LML Trust (LOC: FHLB of Dallas), 5.4500%, 2/1/41 | 4,500,000 | 4,500,000 | |
Olivetree Apartments LP (LOC: FHLB of San Francisco), 5.4500%, 6/2/59 | 10,000,000 | 10,000,000 | |
Rieber Life Insurance Trust/The (LOC: FHLB of Dallas), 5.4500%, 5/1/42 | 4,000,000 | 4,000,000 | |
SIL Irrevocable Trust (LOC: FHLB of Dallas), 5.4500%, 6/1/43 | 6,150,000 | 6,150,000 | |
Ventana Housing LP (LOC: FHLB of San Francisco), 5.4500%, 6/1/60 | 5,000,000 | 5,000,000 | |
Total Variable Rate Demand Notes (cost $58,495,000) | 58,495,000 |
Schedule of Investments
June 30, 2024
Principal Amounts | Value | ||
Repurchase Agreementsë – 36.6% | |||
Goldman Sachs & Co, Joint repurchase agreement, 5.2200%, dated 6/28/24, maturing 7/1/24 to be repurchased at $35,015,225 collateralized by $35,637,901 in U.S. Government Agencies 2.9957% - 7.8051%, 4/20/46 - 7/16/54 with a value of $35,700,000 | $35,000,000 | $35,000,000 | |
HSBC Securities (USA), Inc, Joint repurchase agreement, 5.2600%, dated 6/28/24, maturing 7/1/24 to be repurchased at $10,004,383 collateralized by $19,524,279 in U.S. Treasuries 0% - 1.6250%, 7/15/25 - 11/15/50 with a value of $10,200,000 | 10,000,000 | 10,000,000 | |
ING Financial Markets LLC, Joint repurchase agreement, 5.3000%, dated 6/28/24, maturing 7/1/24 to be repurchased at $20,008,833 collateralized by $22,777,333 in U.S. Treasuries 0% - 5.3750%, 9/5/24 - 11/15/50 with a value of $20,409,013 | 20,000,000 | 20,000,000 | |
ING Financial Markets LLC, Joint repurchase agreement, 5.3100%, dated 6/28/24, maturing 7/1/24 to be repurchased at $30,013,275 collateralized by $32,463,005 in U.S. Government Agencies 1.5000% - 7.0000%, 1/1/26 - 1/1/57 with a value of $30,613,541 | 30,000,000 | 30,000,000 | |
Royal Bank of Canada, NY Branch, Joint repurchase agreement, 5.2800%, dated 6/28/24, maturing 7/1/24 to be repurchased at $5,002,200 collateralized by $5,079,155 in U.S. Treasuries 4.2500%, 3/15/27 with a value of $5,102,247 | 5,000,000 | 5,000,000 | |
Royal Bank of Canada, NY Branch, Joint repurchase agreement, 5.3000%, dated 6/28/24, maturing 7/1/24 to be repurchased at $42,518,771 collateralized by $16,126,096 in U.S. Government Agencies 4.5000% - 7.5000%, 8/1/37 - 7/20/63 and $27,270,556 in U.S. Treasuries 0.7500% - 4.6250%, 8/31/26 - 3/31/31 with a value of $43,369,152 | 42,500,000 | 42,500,000 | |
Total Repurchase Agreements (cost $142,500,000) | 142,500,000 | ||
Total Investments (total cost $389,707,849) – 100.0% | 389,707,849 | ||
Cash, Receivables and Other Assets, net of Liabilities – 0.0% | 90,760 | ||
Net Assets – 100% | $389,798,609 |
Offsetting of Financial Assets and Derivative Assets | ||||
Counterparty | Gross Amounts of Recognized Assets | Offsetting Asset or Liability(a) | Collateral Pledged(b) | Net Amount |
Goldman Sachs & Co | $35,000,000 | $— | $(35,000,000) | $— |
HSBC Securities (USA), Inc | 10,000,000 | — | (10,000,000) | — |
ING Financial Markets LLC | 50,000,000 | — | (50,000,000) | — |
Royal Bank of Canada, NY Branch | 47,500,000 | — | (47,500,000) | — |
Total | $142,500,000 | $— | $(142,500,000) | $— |
(a) | Represents the amount of assets or liabilities that could be offset with the same counterparty under master netting or similar agreements that management elects not to offset on the Statement of Assets and Liabilities. |
(b) | Collateral pledged is limited to the net outstanding amount due to/from an individual counterparty. The actual collateral amounts pledged may exceed these amounts and may fluctuate in value. |
Notes to Schedule of Investments and Other Information
LLC | Limited Liability Company |
LOC | Letter of Credit |
LP | Limited Partnership |
¶ | Variable rate demand notes are not based on a published reference rate and spread; they are determined by the issuer or remarketing agent and current market conditions. The reference rate in the security description is as of June 30, 2024. |
ë | The Fund may have elements of risk due to concentration of investments. Such concentrations may subject the Fund to additional risks. |
Valuation Inputs Summary | |||
Level 1 - Quoted Prices | Level 2 - Other Significant Observable Inputs | Level 3 - Significant Unobservable Inputs | |
Assets | |||
Investments In Securities: | |||
U.S. Government Agency Notes | $- | $125,338,248 | $- |
U.S. Treasury Debt | - | 63,374,601 | - |
Variable Rate Demand Notes | - | 58,495,000 | - |
Repurchase Agreements | - | 142,500,000 | - |
Total Assets | $- | $389,707,849 | $- |
Statement of Assets and Liabilities
June 30, 2024
Assets: | |
Investments, at value (cost $247,207,849) | $247,207,849 |
Repurchase agreements, at value (cost $142,500,000) | 142,500,000 |
Cash | 118,235 |
Trustees' deferred compensation | 10,697 |
Receivables: | |
Interest | 308,746 |
Fund shares sold | 189,383 |
Total Assets | 390,334,910 |
Liabilities: | |
Payables: | |
Fund shares repurchased | 283,385 |
Administration services fees | 115,278 |
Advisory fees | 63,984 |
Professional fees | 45,914 |
Dividends | 14,823 |
Trustees' deferred compensation fees | 10,697 |
Trustees' fees and expenses | 2,087 |
Accrued expenses and other payables | 133 |
Total Liabilities | 536,301 |
Net Assets | $389,798,609 |
Net Assets Consist of: | |
Capital (par value and paid-in surplus) | $389,801,855 |
Total distributable earnings (loss) | (3,246) |
Total Net Assets | $389,798,609 |
Net Assets - Class D Shares | $383,581,504 |
Shares Outstanding, $0.01 Par Value (unlimited shares authorized) | 383,588,843 |
Net Asset Value Per Share | $1.00 |
Net Assets - Class T Shares | $6,217,105 |
Shares Outstanding, $0.01 Par Value (unlimited shares authorized) | 6,217,346 |
Net Asset Value Per Share | $1.00 |
Statement of Operations
For the year ended June 30, 2024
Investment Income: | |
Interest | $20,527,024 |
Other income | 2,212 |
Total Investment Income | 20,529,236 |
Expenses: | |
Advisory fees | 763,877 |
Administration services fees: | |
Class D Shares | 1,352,116 |
Class T Shares | 24,133 |
Professional fees | 55,473 |
Trustees' fees and expenses | 8,093 |
Other expenses | 135 |
Total Expenses | 2,203,827 |
Net Investment Income/(Loss) | 18,325,409 |
Net Realized Gain/(Loss) on Investments: | |
Investments | 1,815 |
Total Net Realized Gain/(Loss) on Investments | 1,815 |
Net Increase/(Decrease) in Net Assets Resulting from Operations | $18,327,224 |
Statements of Changes in Net Assets
Year ended June 30, 2024 | Year ended June 30, 2023 | |
Operations: | ||
Net investment income/(loss) | $18,325,409 | $12,934,389 |
Net realized gain/(loss) on investments | 1,815 | - |
Net Increase/(Decrease) in Net Assets Resulting from Operations | 18,327,224 | 12,934,389 |
Dividends and Distributions to Shareholders: | ||
Class D Shares | (18,021,947) | (12,672,152) |
Class T Shares | (303,462) | (274,409) |
Net Decrease from Dividends and Distributions to Shareholders | (18,325,409) | (12,946,561) |
Capital Share Transactions: | ||
Class D Shares | (299,747) | (23,016,362) |
Class T Shares | (46,734) | (2,602,317) |
Net Increase/(Decrease) from Capital Share Transactions | (346,481) | (25,618,679) |
Net Increase/(Decrease) in Net Assets | (344,666) | (25,630,851) |
Net Assets: | ||
Beginning of period | 390,143,275 | 415,774,126 |
End of period | $389,798,609 | $390,143,275 |
Financial Highlights
Class D Shares | |||||
For a share outstanding during the year ended June 30 | 2024 | 2023 | 2022 | 2021 | 2020 |
Net Asset Value, Beginning of Period | $1.00 | $1.00 | $1.00 | $1.00 | $1.00 |
Income/(Loss) from Investment Operations: | |||||
Net investment income/(loss)(1) | 0.05 | 0.03 | — (2) | — (2) | 0.01 |
Net realized and unrealized gain/(loss)(2) | — | — | — | — | — |
Total from Investment Operations | 0.05 | 0.03 | — | — | 0.01 |
Less Dividends and Distributions: | |||||
Dividends (from net investment income) | (0.05) | (0.03) | — (2) | — (2) | (0.01) |
Distributions (from capital gains) | — | — (2) | — | — | — |
Total Dividends and Distributions | (0.05) | (0.03) | — | — | (0.01) |
Net Asset Value, End of Period | $1.00 | $1.00 | $1.00 | $1.00 | $1.00 |
Total Return* | 4.88% | 3.27% | 0.00% | 0.00% | 0.96% |
Net Assets, End of Period (in thousands) | $383,582 | $383,879 | $406,908 | $343,130 | $324,601 |
Ratios to Average Net Assets**: | |||||
Ratio of Gross Expenses | 0.57% | 0.58% | 0.57% | 0.57% | 0.63% |
Ratio of Net Expenses (After Waivers and Expense Offsets) | 0.57% | 0.58% | 0.25% | 0.09% | 0.49% |
Ratio of Net Investment Income/(Loss) | 4.77% | 3.20% | 0.00% (3) | 0.00% (3) | 0.84% |
* | Total return includes adjustments in accordance with generally accepted accounting principles required at the year or period end and are not annualized for periods of less than one full year. |
** | Annualized for periods of less than one full year. |
(1) | Per share amounts are calculated based on average shares outstanding during the year or period. |
(2) | Less than $0.005 on a per share basis. |
(3) | Less than 0.005%. |
Financial Highlights
Class T Shares | |||||
For a share outstanding during the year ended June 30 | 2024 | 2023 | 2022 | 2021 | 2020 |
Net Asset Value, Beginning of Period | $1.00 | $1.00 | $1.00 | $1.00 | $1.00 |
Income/(Loss) from Investment Operations: | |||||
Net investment income/(loss)(1) | 0.05 | 0.03 | — (2) | — (2) | 0.01 |
Net realized and unrealized gain/(loss)(2) | — | — | — | — | — |
Total from Investment Operations | 0.05 | 0.03 | — | — | 0.01 |
Less Dividends and Distributions: | |||||
Dividends (from net investment income) | (0.05) | (0.03) | — (2) | — (2) | (0.01) |
Distributions (from capital gains) | — | — (2) | — | — | — |
Total Dividends and Distributions | (0.05) | (0.03) | — | — | (0.01) |
Net Asset Value, End of Period | $1.00 | $1.00 | $1.00 | $1.00 | $1.00 |
Total Return* | 4.86% | 3.25% | 0.00% | 0.00% | 0.94% |
Net Assets, End of Period (in thousands) | $6,217 | $6,264 | $8,866 | $6,846 | $7,384 |
Ratios to Average Net Assets**: | |||||
Ratio of Gross Expenses | 0.59% | 0.60% | 0.59% | 0.59% | 0.66% |
Ratio of Net Expenses (After Waivers and Expense Offsets) | 0.59% | 0.60% | 0.26% | 0.09% | 0.53% |
Ratio of Net Investment Income/(Loss) | 4.75% | 3.14% | 0.00% (3) | 0.00% (3) | 0.98% |
* | Total return includes adjustments in accordance with generally accepted accounting principles required at the year or period end and are not annualized for periods of less than one full year. |
** | Annualized for periods of less than one full year. |
(1) | Per share amounts are calculated based on average shares outstanding during the year or period. |
(2) | Less than $0.005 on a per share basis. |
(3) | Less than 0.005%. |
Notes to Financial Statements
Undistributed Ordinary Income | Undistributed Long-Term Gains | Accumulated Capital Losses | Loss Deferrals | Other Book to Tax Differences | Net Tax Appreciation/ (Depreciation) |
$6,813 | $- | $- | $- | $(10,059) | $- |
For the year ended June 30, 2024 | |||
Distributions | |||
From Ordinary Income | From Long-Term Capital Gains | Tax Return of Capital | Net Investment Loss |
$18,325,409 | $- | $- | $- |
For the year ended June 30, 2023 | |||
Distributions | |||
From Ordinary Income | From Long-Term Capital Gains | Tax Return of Capital | Net Investment Loss |
$12,936,711 | $9,850 | $- | $- |
Year ended June 30, 2024 | Year ended June 30, 2023 | |||
Shares | Amount | Shares | Amount | |
Class D Shares: | ||||
Shares sold | 141,176,354 | $141,176,353 | 138,981,154 | $138,981,797 |
Reinvested dividends and distributions | 17,747,254 | 17,747,254 | 12,522,215 | 12,522,215 |
Shares repurchased | (159,223,354) | (159,223,354) | (174,520,374) | (174,520,374) |
Net Increase/(Decrease) | (299,746) | $(299,747) | (23,017,005) | $(23,016,362) |
Class T Shares: | ||||
Shares sold | 6,962,890 | $6,962,889 | 9,837,496 | $9,837,512 |
Reinvested dividends and distributions | 303,043 | 303,043 | 272,793 | 272,793 |
Shares repurchased | (7,312,666) | (7,312,666) | (12,712,622) | (12,712,622) |
Net Increase/(Decrease) | (46,733) | $(46,734) | (2,602,333) | $(2,602,317) |
Notes to Financial Statements
Report of Independent Registered Public Accounting Firm
August 22, 2024
Designation Requirements (unaudited)
Section 163(j) Interest Dividend | 100% |
Additional Information (unaudited)
Schedule of Investments
June 30, 2024
Shares or Principal Amounts | Value | ||
Asset-Backed/Commercial Mortgage-Backed Securities – 3.5% | |||
Amercian Airlines Inc / AAdvantage Loyalty IP Ltd, 5.7500%, 4/20/29ž | $2,522,791 | $2,454,345 | |
BX Commercial Mortgage Trust 2021-ARIA F, CME Term SOFR 1 Month + 2.7080%, 8.0370%, 10/15/36ž,‡ | 6,000,000 | 5,879,968 | |
JP Morgan Chase Commercial Mortgage Sec Trust 2020-ACE C, 3.8173%, 1/10/37ž,‡ | 5,000,000 | 4,847,417 | |
MED Trust 2021-MDLN F, CME Term SOFR 1 Month + 4.1145%, 9.4435%, 11/15/38ž,‡ | 5,476,378 | 5,436,873 | |
New Economy Assets Phase 1 Issuer LLC 2021-1 B1, 2.4100%, 10/20/61ž | 5,000,000 | 4,309,915 | |
VASA Trust 2021-VASA F, CME Term SOFR 1 Month + 4.0145%, 9.3435%, 7/15/39ž,‡ | 3,083,000 | 1,687,645 | |
Total Asset-Backed/Commercial Mortgage-Backed Securities (cost $24,214,477) | 24,616,163 | ||
Bank Loans and Mezzanine Loans – 4.1% | |||
Basic Industry – 0.2% | |||
Verde Purchaser LLC, CME Term SOFR 1 Month + 4.50000%, 9.8291%, 11/30/30ƒ,‡ | 1,382,872 | 1,380,452 | |
Capital Goods – 0.1% | |||
White Cap Buyer LLC, CME Term SOFR 1 Month + 3.25000%, 8.5779%, 10/19/29ƒ,‡ | 395,000 | 395,517 | |
Commercial Services – 0.3% | |||
Driven Holdings LLC, CME Term SOFR 1 Month + 3.0000%, 8.4584%, 12/17/28‡ | 2,204,102 | 2,199,858 | |
Communications – 1.2% | |||
Clear Channel International BV, 7.5000%, 8/12/27 | 3,126,734 | 3,040,749 | |
Directv Financing LLC, CME Term SOFR 1 Month + 5.0000%, 10.4584%, 8/2/27ƒ,‡ | 3,646,040 | 3,733,175 | |
Directv Financing LLC, CME Term SOFR 1 Month + 5.2500%, 10.7084%, 8/2/29‡ | 1,803,040 | 1,835,037 | |
8,608,961 | |||
Consumer Cyclical – 0.6% | |||
Caesars Entertainment Inc, CME Term SOFR 3 Month + 2.7500%, 8.0973%, 2/6/31‡ | 1,708,000 | 1,706,395 | |
Hoya Midco LLC, CME Term SOFR 1 Month + 3.25000%, 8.5779%, 2/3/29ƒ,‡ | 860,000 | 862,150 | |
Ovg Business Services LLC, CME Term SOFR 1 Month + 3.0000%, 8.3452%, 6/14/31‡ | 1,490,061 | 1,485,412 | |
4,053,957 | |||
Consumer Non-Cyclical – 0.8% | |||
Heartland Dental LLC, CME Term SOFR 1 Month + 4.5000%, 9.8439%, 4/28/28‡ | 4,950,984 | 4,969,597 | |
LifePoint Health Inc, CME Term SOFR 3 Month + 4.7500%, 10.0559%, 11/16/28‡ | 808,989 | 812,832 | |
5,782,429 | |||
Diversified Financial – 0% | |||
Osaic Holdings Inc, CME Term SOFR 1 Month + 4.0000%, 9.3439%, 8/17/28‡ | 3,218 | 3,226 | |
Technology – 0.6% | |||
Cloud Software Group Inc, CME Term SOFR 3 Month + 4.5000%, 9.8346%, 3/21/31‡ | 868,000 | 869,762 | |
Modena Buyer LLC, CME Term SOFR 1 Month + 4.50000%, 9.8240%, 4/18/31ƒ,‡ | 3,846,000 | 3,748,658 | |
4,618,420 | |||
Transportation – 0.3% | |||
AAdvantage Loyalty IP Ltd, CME Term SOFR 3 Month + 4.7500%, 10.3362%, 4/20/28‡ | 2,084,706 | 2,150,937 | |
Total Bank Loans and Mezzanine Loans (cost $29,135,361) | 29,193,757 | ||
Corporate Bonds – 85.9% | |||
Basic Industry – 9.6% | |||
Algoma Steel Inc, 9.1250%, 4/15/29ž | 2,704,000 | 2,633,020 | |
Compass Minerals International Inc, 6.7500%, 12/1/27ž | 7,869,000 | 7,519,930 | |
First Quantum Minerals Ltd, 9.3750%, 3/1/29ž | 3,420,000 | 3,573,474 | |
FMG Resources (August 2006) Pty Ltd, 4.3750%, 4/1/31ž | 7,683,000 | 6,866,517 | |
FMG Resources (August 2006) Pty Ltd, 6.1250%, 4/15/32ž | 2,706,000 | 2,675,394 |
Schedule of Investments
June 30, 2024
Shares or Principal Amounts | Value | ||
Corporate Bonds – (continued) | |||
Basic Industry – (continued) | |||
Hudbay Minerals Inc, 6.1250%, 4/1/29ž,# | $7,984,000 | $7,944,934 | |
Mineral Resources Ltd, 9.2500%, 10/1/28ž | 6,530,000 | 6,853,444 | |
Novelis Corp, 3.2500%, 11/15/26ž | 1,656,000 | 1,558,303 | |
Olympus Water US Holding Corp, 6.2500%, 10/1/29ž,# | 6,054,000 | 5,526,163 | |
Olympus Water US Holding Corp, 7.2500%, 6/15/31ž | 2,887,000 | 2,869,707 | |
Taseko Mines Ltd, 8.2500%, 5/1/30ž | 5,043,000 | 5,159,085 | |
Tronox Inc, 4.6250%, 3/15/29ž | 5,851,000 | 5,281,630 | |
Verde Purchaser LLC, 10.5000%, 11/30/30ž | 4,988,000 | 5,271,837 | |
WR Grace Holdings LLC, 5.6250%, 8/15/29ž | 3,913,000 | 3,606,594 | |
67,340,032 | |||
Brokerage – 1.4% | |||
Artec Group Inc, 10.0000%, 8/15/30ž | 3,242,000 | 3,525,960 | |
StoneX Group Inc, 7.8750%, 3/1/31ž | 5,974,000 | 6,161,387 | |
9,687,347 | |||
Capital Goods – 8.2% | |||
Alta Equipment Group Inc, 9.0000%, 6/1/29ž | 3,287,000 | 3,049,378 | |
Ardagh Metal Packaging SA, 4.0000%, 9/1/29ž,# | 2,768,000 | 2,342,435 | |
Bombardier Inc, 8.7500%, 11/15/30ž,# | 3,688,000 | 3,985,928 | |
Bombardier Inc, 7.2500%, 7/1/31ž | 3,820,000 | 3,922,070 | |
Builders FirstSource Inc, 6.3750%, 6/15/32ž | 4,101,000 | 4,106,910 | |
Husky Injection Molding Systems Ltd / Titan Co-Borrower LLC, 9.0000%, 2/15/29ž | 4,524,000 | 4,684,665 | |
MasterBrand Inc, 7.0000%, 7/15/32ž | 2,668,000 | 2,698,150 | |
Mauser Packaging Solutions Holding Co, 9.2500%, 4/15/27ž | 6,500,000 | 6,504,173 | |
Standard Industries Inc/NJ, 3.3750%, 1/15/31ž | 12,645,000 | 10,653,794 | |
Titan International Inc, 7.0000%, 4/30/28 | 3,513,000 | 3,378,396 | |
TransDigm Inc, 4.8750%, 5/1/29# | 9,852,000 | 9,228,272 | |
Velocity Vehicle Group LLC, 8.0000%, 6/1/29ž | 891,000 | 916,438 | |
White Cap Parent LLC, 8.2500% (8.25% Cash or 9% PIK), 3/15/26ž,Ø | 2,282,000 | 2,282,053 | |
57,752,662 | |||
Communications – 6.0% | |||
Cable One Inc, 4.0000%, 11/15/30ž,# | 4,774,000 | 3,563,073 | |
CCO Holdings LLC / CCO Holdings Capital Corp, 4.2500%, 2/1/31ž | 10,300,000 | 8,409,341 | |
Clear Channel Outdoor Holdings Inc, 7.8750%, 4/1/30ž | 7,158,000 | 7,204,856 | |
Connect Finco Sarl / Connect US Finco LLC, 6.7500%, 10/1/26ž | 4,367,000 | 4,214,815 | |
Frontier Communications Holdings LLC, 8.6250%, 3/15/31ž | 4,220,000 | 4,347,135 | |
Univision Communications Inc, 8.0000%, 8/15/28ž | 6,305,000 | 6,148,813 | |
Univision Communications Inc, 4.5000%, 5/1/29ž | 3,140,000 | 2,639,076 | |
Univision Communications Inc, 7.3750%, 6/30/30ž,# | 3,157,000 | 2,936,543 | |
Univision Communications Inc, 8.5000%, 7/31/31ž | 2,952,000 | 2,867,394 | |
42,331,046 | |||
Consumer Cyclical – 19.4% | |||
Allied Universal Holdco LLC, 7.8750%, 2/15/31ž | 3,577,000 | 3,586,307 | |
Allied Universal Holdco LLC / Allied Universal Finance Corp, 6.0000%, 6/1/29ž,# | 4,419,000 | 3,868,327 | |
Aston Martin Capital Holdings Ltd, 10.0000%, 3/31/29ž | 5,190,000 | 5,113,759 | |
Bath & Body Works Inc, 6.9500%, 3/1/33 | 2,783,000 | 2,708,995 | |
Beazer Homes USA Inc, 7.5000%, 3/15/31ž | 3,741,000 | 3,733,195 | |
Carnival Corp, 6.0000%, 5/1/29ž | 11,458,000 | 11,318,439 | |
EG Global Finance PLC, 12.0000%, 11/30/28ž | 3,201,000 | 3,408,034 | |
Full House Resorts Inc, 8.2500%, 2/15/28ž | 6,270,000 | 6,006,927 | |
Garda World Security Corp, 7.7500%, 2/15/28ž | 2,038,000 | 2,075,677 | |
Garda World Security Corp, 6.0000%, 6/1/29ž,# | 5,194,000 | 4,738,626 | |
Garrett Motion Holdings Inc / Garrett LX I Sarl, 7.7500%, 5/31/32ž | 2,548,000 | 2,582,199 | |
Hilton Grand Vacations Borrower Escrow LLC / Hilton Grand Vacations Borrower Esc, 4.8750%, 7/1/31ž | 1,699,000 | 1,504,057 | |
Hilton Grand Vacations Borrower Escrow LLC / Hilton Grand Vacations Borrower Esc, 6.6250%, 1/15/32ž | 1,364,000 | 1,370,386 | |
JB Poindexter & Co Inc, 8.7500%, 12/15/31ž | 6,908,000 | 7,156,626 | |
Kohl's Corp, 4.6250%, 5/1/31Ç | 7,485,000 | 6,261,408 |
Schedule of Investments
June 30, 2024
Shares or Principal Amounts | Value | ||
Corporate Bonds – (continued) | |||
Consumer Cyclical – (continued) | |||
LGI Homes Inc, 4.0000%, 7/15/29ž | $7,914,000 | $6,847,601 | |
LSF9 Atlantis Holdings LLC / Victra Finance Corp, 7.7500%, 2/15/26ž | 8,562,000 | 8,515,769 | |
Macy's Retail Holdings LLC, 5.8750%, 4/1/29ž | 4,233,000 | 4,108,093 | |
Macy's Retail Holdings LLC, 6.7000%, 7/15/34ž | 2,094,000 | 1,793,060 | |
Mavis Tire Express Services Corp, 6.5000%, 5/15/29ž,# | 5,640,000 | 5,258,101 | |
Midwest Gaming Borrower LLC, 4.8750%, 5/1/29ž | 3,514,000 | 3,273,263 | |
NCL Corporation Ltd, 7.7500%, 2/15/29ž,# | 4,573,000 | 4,754,553 | |
Penn Entertainment Inc, 4.1250%, 7/1/29ž | 8,440,000 | 7,238,696 | |
Station Casinos LLC, 4.6250%, 12/1/31ž | 7,498,000 | 6,682,991 | |
Sugarhouse HSP Gaming Prop Mezz LP / Sugarhouse HSP Gaming Finance Corp, 5.8750%, 5/15/25ž | 4,816,000 | 4,785,374 | |
Travel + Leisure Co, 4.6250%, 3/1/30ž | 2,545,000 | 2,316,091 | |
Weekley Homes LLC / Weekly Finance Corp, 4.8750%, 9/15/28ž | 5,455,000 | 5,051,662 | |
Wynn Macau Ltd, 5.6250%, 8/26/28ž | 8,166,000 | 7,658,034 | |
Wynn Macau Ltd, 5.1250%, 12/15/29ž | 2,947,000 | 2,669,396 | |
136,385,646 | |||
Consumer Non-Cyclical – 9.9% | |||
Amer Sports Co, 6.7500%, 2/16/31ž,# | 4,366,000 | 4,354,379 | |
Atlas LuxCo 4 Sarl / Allied Universal Holdco LLC / Allied Universal Finance Corp, 4.6250%, 6/1/28ž | 491,000 | 447,321 | |
BellRing Brands Inc, 7.0000%, 3/15/30ž | 4,882,000 | 5,003,015 | |
Endo Finance Holdings Inc, 8.5000%, 4/15/31ž | 3,437,000 | 3,546,905 | |
Heartland Dental LLC / Heartland Dental Finance Corp, 10.5000%, 4/30/28ž | 9,289,000 | 9,859,902 | |
HLF Financing Sarl LLC / Herbalife International Inc, 12.2500%, 4/15/29ž | 4,393,000 | 4,378,755 | |
LifePoint Health Inc, 9.8750%, 8/15/30ž | 2,164,000 | 2,307,742 | |
LifePoint Health Inc, 10.0000%, 6/1/32ž | 8,042,000 | 8,222,245 | |
Mozart Debt Merger Sub Inc, 5.2500%, 10/1/29ž | 14,135,000 | 13,514,110 | |
Organon & Co / Organon Foreign Debt Co-Issuer BV, 7.8750%, 5/15/34ž | 2,324,000 | 2,387,918 | |
Organon Finance 1 LLC, 5.1250%, 4/30/31ž | 8,800,000 | 7,904,619 | |
Star Parent Inc, 9.0000%, 10/1/30ž | 3,712,000 | 3,897,216 | |
Thor Industries Inc, 4.0000%, 10/15/29ž | 4,688,000 | 4,115,051 | |
69,939,178 | |||
Electric – 2.2% | |||
NextEra Energy Operating Partners LP, 7.2500%, 1/15/29ž,# | 2,203,000 | 2,259,110 | |
TerraForm Power Operating LLC, 4.7500%, 1/15/30ž | 6,768,000 | 6,169,040 | |
Vistra Operations Co LLC, 7.7500%, 10/15/31ž | 2,346,000 | 2,443,103 | |
Vistra Operations Co LLC, 6.8750%, 4/15/32ž | 4,516,000 | 4,584,517 | |
15,455,770 | |||
Electrical Equipment – 0.2% | |||
Bloom Energy Corp, 3.0000%, 6/1/28 | 1,357,000 | 1,312,537 | |
Energy – 7.5% | |||
Civitas Resources Inc, 8.3750%, 7/1/28ž | 3,234,000 | 3,388,679 | |
FTAI Infra Escrow Holdings LLC, 10.5000%, 6/1/27ž | 13,543,000 | 14,338,881 | |
Howard Midstream Energy Partners LLC, 7.3750%, 7/15/32ž | 7,604,000 | 7,722,279 | |
Magnolia Oil & Gas Operating LLC / Magnolia Oil & Gas Finance Corp, 6.0000%, 8/1/26ž | 5,132,000 | 5,082,171 | |
Sunoco LP / Sunoco Finance Corp, 4.5000%, 4/30/30 | 3,400,000 | 3,145,101 | |
Tallgrass Energy Partners LP / Tallgrass Energy Finance Corp, 5.5000%, 1/15/28ž | 6,249,000 | 5,978,657 | |
Tallgrass Energy Partners LP / Tallgrass Energy Finance Corp, 6.0000%, 9/1/31ž | 4,868,000 | 4,549,376 | |
Venture Global LNG Inc, 8.1250%, 6/1/28ž | 8,164,000 | 8,410,692 | |
52,615,836 | |||
Finance Companies – 3.7% | |||
goeasy Ltd, 7.6250%, 7/1/29ž | 3,286,000 | 3,351,786 | |
Nationstar Mortgage Holdings Inc, 7.1250%, 2/1/32ž | 3,558,000 | 3,578,789 | |
Navient Corp, 9.3750%, 7/25/30 | 3,856,000 | 4,054,484 | |
Navient Corp, 5.6250%, 8/1/33 | 3,248,000 | 2,592,899 | |
OneMain Finance Corp, 4.0000%, 9/15/30 | 3,998,000 | 3,431,251 |
Schedule of Investments
June 30, 2024
Shares or Principal Amounts | Value | ||
Corporate Bonds – (continued) | |||
Finance Companies – (continued) | |||
PennyMac Financial Services Inc, 5.7500%, 9/15/31ž | $7,326,000 | $6,860,206 | |
Springleaf Finance Corp, 5.3750%, 11/15/29 | 2,749,000 | 2,578,164 | |
26,447,579 | |||
Financial Institutions – 2.6% | |||
Burford Capital Global Finance LLC, 6.2500%, 4/15/28ž | 1,955,000 | 1,889,778 | |
Burford Capital Global Finance LLC, 6.8750%, 4/15/30ž | 3,808,000 | 3,739,061 | |
GGAM Finance Ltd, 8.0000%, 6/15/28ž | 7,568,000 | 7,970,966 | |
Jefferson Capital Holdings LLC, 9.5000%, 2/15/29ž | 4,919,000 | 5,070,628 | |
18,670,433 | |||
Insurance – 2.4% | |||
Broadstreet Partners Inc, 5.8750%, 4/15/29ž | 9,202,000 | 8,586,234 | |
HUB International Ltd, 5.6250%, 12/1/29ž | 2,320,000 | 2,194,025 | |
Panther Escrow Issuer LLC, 7.1250%, 6/1/31ž | 1,639,000 | 1,657,740 | |
USI Inc/NY, 7.5000%, 1/15/32ž | 4,183,000 | 4,248,439 | |
16,686,438 | |||
Real Estate Investment Trusts (REITs) – 0.8% | |||
Rithm Capital Corp, 8.0000%, 4/1/29ž | 5,876,000 | 5,703,970 | |
Technology – 7.1% | |||
Cloud Software Group Inc, 6.5000%, 3/31/29ž | 8,900,000 | 8,546,801 | |
Cloud Software Group Inc, 9.0000%, 9/30/29ž | 3,677,000 | 3,567,500 | |
Cloud Software Group Inc, 8.2500%, 6/30/32ž | 3,390,000 | 3,455,244 | |
Fortress Intermediate 3 Inc, 7.5000%, 6/1/31ž | 1,747,000 | 1,789,889 | |
McAfee Corp, 7.3750%, 2/15/30ž | 3,009,000 | 2,779,873 | |
RingCentral Inc, 8.5000%, 8/15/30ž | 6,747,000 | 7,042,019 | |
Seagate HDD Cayman, 4.1250%, 1/15/31 | 4,637,000 | 4,141,085 | |
Seagate HDD Cayman, 9.6250%, 12/1/32 | 10,099,700 | 11,520,122 | |
UKG Inc, 6.8750%, 2/1/31ž | 4,405,000 | 4,460,195 | |
Western Digital Corp, 3.1000%, 2/1/32 | 3,721,000 | 3,025,303 | |
50,328,031 | |||
Transportation – 4.9% | |||
American Airlines Inc, 7.2500%, 2/15/28ž | 6,044,000 | 6,047,935 | |
American Airlines Inc, 8.5000%, 5/15/29ž | 2,351,000 | 2,442,612 | |
Cargo Aircraft Management Inc, 4.7500%, 2/1/28ž | 12,758,000 | 11,833,564 | |
Rand Parent LLC, 8.5000%, 2/15/30ž,# | 7,519,000 | 7,612,318 | |
Watco Cos LLC / Watco Finance Corp, 6.5000%, 6/15/27ž | 6,418,000 | 6,391,831 | |
34,328,260 | |||
Total Corporate Bonds (cost $594,892,558) | 604,984,765 | ||
Common Stocks – 1.9% | |||
Capital Markets – 0.4% | |||
Marex Group PLC* | 155,343 | 3,106,860 | |
Health Care Providers & Services – 0.5% | |||
Surgery Partners Inc* | 150,528 | 3,581,061 | |
Hotels, Restaurants & Leisure – 0.2% | |||
Carnival Corp* | 66,478 | 1,244,468 | |
Semiconductor & Semiconductor Equipment – 0.8% | |||
Advanced Micro Devices Inc* | 19,364 | 3,141,035 | |
Marvell Technology Inc | 34,028 | 2,378,557 | |
5,519,592 | |||
Total Common Stocks (cost $14,605,376) | 13,451,981 | ||
Preferred Stocks – 0.4% | |||
Consumer Cyclical – 0.4% | |||
Quiksilver Inc¢ (cost $2,633,063) | 3,097,721 | 2,633,063 | |
Convertible Preferred Stocks – 0.3% | |||
Chemicals – 0.3% | |||
Albemarle Corp, 7.2500%, 3/1/27 (cost $2,130,342) | 40,302 | 1,880,491 | |
Investment Companies – 3.4% | |||
Money Markets – 3.4% | |||
Janus Henderson Cash Liquidity Fund LLC, 5.3419%ºº,£ (cost $24,224,865) | 24,220,021 | 24,224,865 |
Schedule of Investments
June 30, 2024
Shares or Principal Amounts | Value | ||
Investments Purchased with Cash Collateral from Securities Lending – 1.7% | |||
Investment Companies – 1.4% | |||
Janus Henderson Cash Collateral Fund LLC, 5.2795%ºº,£ | 10,138,314 | $10,138,314 | |
Time Deposits – 0.3% | |||
Royal Bank of Canada, 5.3100%, 7/1/24 | $1,809,729 | 1,809,729 | |
Total Investments Purchased with Cash Collateral from Securities Lending (cost $11,948,043) | 11,948,043 | ||
Total Investments (total cost $703,784,085) – 101.2% | 712,933,128 | ||
Liabilities, net of Cash, Receivables and Other Assets – (1.2)% | (8,397,202) | ||
Net Assets – 100% | $704,535,926 |
Summary of Investments by Country - (Long Positions) (unaudited) | ||
Country | Value | % of Investment Securities |
United States | $615,972,265 | 86.4 % |
Canada | 30,550,857 | 4.3 |
Australia | 16,395,355 | 2.3 |
United Kingdom | 10,729,709 | 1.5 |
Macao | 10,327,430 | 1.5 |
Ireland | 7,970,966 | 1.1 |
Peru | 7,944,934 | 1.1 |
Jersey | 5,113,759 | 0.7 |
Finland | 4,354,379 | 0.6 |
Zambia | 3,573,474 | 0.5 |
Total | $712,933,128 | 100.0 % |
Schedule of Affiliated Investments - (% of Net Assets) | ||||||||
Affiliate | Affiliated Investments, at Value at 6/30/23 | Purchases | Sales Proceeds | Realized Gain/(Loss) | Change in Unrealized Appreciation/ Depreciation | Affiliated Investments, at Value at 6/30/24 | Ending Shares | Dividend Income |
Investment Companies - 3.4% | ||||||||
Money Markets - 3.4% | ||||||||
Janus Henderson Cash Liquidity Fund LLC, 5.3419%ºº | ||||||||
$23,555,617 | $401,731,589 | $(401,062,203) | $875 | $(1,013) | $24,224,865 | 24,220,021 | $1,224,804 | |
Investments Purchased with Cash Collateral from Securities Lending - 1.4% | ||||||||
Investment Companies - 1.4% | ||||||||
Janus Henderson Cash Collateral Fund LLC, 5.2795%ºº | ||||||||
26,971,853 | 152,147,618 | (168,981,157) | - | - | 10,138,314 | 10,138,314 | 236,424 ∆ | |
Total Affiliated Investments - 4.8% | ||||||||
$50,527,470 | $553,879,207 | $(570,043,360) | $875 | $(1,013) | $34,363,179 | 34,358,335 | $1,461,228 |
Schedule of Futures | ||||
Description | Number of Contracts | Expiration Date | Notional Amount | Value and Unrealized Appreciation/(Depreciation) |
Futures Long: | ||||
2 Year US Treasury Note | 331 | 10/3/24 | $67,596,406 | $235,322 |
Schedule of Investments
June 30, 2024
Description | Number of Contracts | Expiration Date | Notional Amount | Value and Unrealized Appreciation/(Depreciation) |
Ultra Long Term US Treasury Bond | 5 | 9/30/24 | $626,719 | $23,498 |
US Treasury Long Bond | 75 | 9/30/24 | 8,873,438 | 275,588 |
Total - Futures Long | 534,408 | |||
Futures Short: | ||||
5 Year US Treasury Note | 96 | 10/3/24 | (10,231,500) | (116,421) |
Ultra 10-Year Treasury Note | 74 | 9/30/24 | (8,401,313) | (177,705) |
Total - Futures Short | (294,126) | |||
Total | $240,282 |
Fair Value of Derivative Instruments (not accounted for as hedging instruments) as of June 30, 2024 | |
Interest Rate Contracts | |
Asset Derivatives: | |
*Futures contracts | $534,408 |
Liability Derivatives: | |
*Futures contracts | $294,126 |
* | The fair value presented includes net cumulative unrealized appreciation (depreciation) on futures contracts and centrally cleared swaps. In the Statement of Assets and Liabilities, only current day's variation margin is reported in receivables or payables and the net cumulative unrealized appreciation (depreciation) is included in total distributable earnings (loss). |
The effect of Derivative Instruments (not accounted for as hedging instruments) on the Statement of Operations for the year ended June 30, 2024 | |
Amount of Realized Gain/(Loss) Recognized on Derivatives | |
Derivative | Interest Rate Contracts |
Futures contracts | $(577,131) |
Amount of Change in Unrealized Appreciation/Depreciation Recognized on Derivatives | |
Derivative | Interest Rate Contracts |
Futures contracts | $240,282 |
Average Ending Monthly Value of Derivative Instruments During the Year Ended June 30, 2024 | |
Futures contracts: | |
Average notional amount of contracts - long | $33,660,859 |
Average notional amount of contracts - short | 14,743,085 |
Schedule of Investments
June 30, 2024
Offsetting of Financial Assets and Derivative Assets | ||||
Counterparty | Gross Amounts of Recognized Assets | Offsetting Asset or Liability(a) | Collateral Pledged(b) | Net Amount |
JPMorgan Chase Bank, National Association | $11,468,696 | $— | $(11,468,696) | $— |
(a) | Represents the amount of assets or liabilities that could be offset with the same counterparty under master netting or similar agreements that management elects not to offset on the Statement of Assets and Liabilities. |
(b) | Collateral pledged is limited to the net outstanding amount due to/from an individual counterparty. The actual collateral amounts pledged may exceed these amounts and may fluctuate in value. |
Notes to Schedule of Investments and Other Information
LLC | Limited Liability Company |
LP | Limited Partnership |
PIK | Pay-in-kind (PIK) bonds give the issuer an option to make the interest payment in cash or additional securities. |
PLC | Public Limited Company |
SOFR | Secured Overnight Financing Rate |
ž | Securities sold under Rule 144A of the Securities Act of 1933, as amended, are subject to legal and/or contractual restrictions on resale and may not be publicly sold without registration under the 1933 Act. Unless otherwise noted, these securities have been determined to be liquid under guidelines established by the Board of Trustees. The total value of 144A securities as of the year ended June 30, 2024 is $572,222,911, which represents 81.2% of net assets. |
* | Non-income producing security. |
ƒ | All or a portion of this position is not funded, or has been purchased on a delayed delivery or when-issued basis. If applicable, interest rates will be determined and interest will begin to accrue at a future date. See Notes to Financial Statements. |
‡ | Variable or floating rate security. Rate shown is the current rate as of June 30, 2024. Certain variable rate securities are not based on a published reference rate and spread; they are determined by the issuer or agent and current market conditions. Reference rate is as of reset date and may vary by security, which may not indicate a reference rate and/or spread in their description. |
ºº | Rate shown is the 7-day yield as of June 30, 2024. |
# | Loaned security; a portion of the security is on loan at June 30, 2024. |
Ç | Step bond. The coupon rate will increase or decrease periodically based upon a predetermined schedule. The rate shown reflects the current rate. |
Ø | Payment-in-kind security which may pay interest/dividends in additional par/shares and/or in cash. Rates shown are the current rate and possible payment rates. |
¢ | Security is valued using significant unobservable inputs. The total value of Level 3 securities as of the year ended June 30, 2024 is $2,633,063, which represents 0.4% of net assets. |
£ | The Fund may invest in certain securities that are considered affiliated companies. As defined by the Investment Company Act of 1940, as amended, an affiliated company is one in which the Fund owns 5% or more of the outstanding voting securities, or a company which is under common ownership or control. |
∆ | Net of income paid to the securities lending agent and rebates paid to the borrowing counterparties. |
Notes to Schedule of Investments and Other Information
Valuation Inputs Summary | |||
Level 1 - Quoted Prices | Level 2 - Other Significant Observable Inputs | Level 3 - Significant Unobservable Inputs | |
Assets | |||
Investments In Securities: | |||
Asset-Backed/Commercial Mortgage-Backed Securities | $- | $24,616,163 | $- |
Bank Loans and Mezzanine Loans | - | 29,193,757 | - |
Corporate Bonds | - | 604,984,765 | - |
Common Stocks | 13,451,981 | - | - |
Preferred Stocks | - | - | 2,633,063 |
Convertible Preferred Stocks | 1,880,491 | - | - |
Investment Companies | - | 24,224,865 | - |
Investments Purchased with Cash Collateral from Securities Lending | - | 11,948,043 | - |
Total Investments in Securities | $15,332,472 | $694,967,593 | $2,633,063 |
Other Financial Instruments(a): | |||
Futures Contracts | 534,408 | - | - |
Total Assets | $15,866,880 | $694,967,593 | $2,633,063 |
Liabilities | |||
Other Financial Instruments(a): | |||
Futures Contracts | $294,126 | $- | $- |
(a) | Other financial instruments may include forward foreign currency exchange contracts, futures, written options, written swaptions, and swap contracts. Forward foreign currency exchange contracts, futures contracts, and swap contracts are reported at their unrealized appreciation/(depreciation) at measurement date, which represents the change in the contract's value from trade date. Written options and written swaptions are reported at their market value at measurement date. |
Statement of Assets and Liabilities
June 30, 2024
Assets: | |
Unaffiliated investments, at value (cost $669,420,906)(1) | $678,569,949 |
Affiliated investments, at value (cost $34,363,179) | 34,363,179 |
Cash | 148,817 |
Deposits with brokers for futures | 660,000 |
Variation margin receivable on futures contracts | 46,344 |
Trustees' deferred compensation | 19,464 |
Receivables: | |
Interest | 10,743,169 |
Investments sold | 7,127,720 |
Fund shares sold | 567,470 |
Dividends from affiliates | 94,965 |
Dividends | 16,121 |
Other assets | 104,044 |
Total Assets | 732,461,242 |
Liabilities: | |
Collateral for securities loaned (Note 3) | 11,948,043 |
Variation margin payable on futures contracts | 91,039 |
Payables: | |
Investments purchased | 8,314,353 |
Fund shares repurchased | 6,612,454 |
Dividends | 327,025 |
Advisory fees | 316,402 |
Transfer agent fees and expenses | 99,938 |
Professional fees | 70,618 |
Trustees' deferred compensation fees | 19,464 |
12b-1 Distribution and shareholder servicing fees | 9,300 |
Trustees' fees and expenses | 4,258 |
Affiliated fund administration fees payable | 1,479 |
Custodian fees | 801 |
Accrued expenses and other payables | 110,142 |
Total Liabilities | 27,925,316 |
Commitments and contingent liabilities (Note 4) | |
Net Assets | $704,535,926 |
Statement of Assets and Liabilities
June 30, 2024
Net Assets Consist of: | |
Capital (par value and paid-in surplus) | $1,017,384,867 |
Total distributable earnings (loss) | (312,848,941) |
Total Net Assets | $704,535,926 |
Net Assets - Class A Shares | $29,106,235 |
Shares Outstanding, $0.01 Par Value (unlimited shares authorized) | 4,026,293 |
Net Asset Value Per Share(2) | $7.23 |
Maximum Offering Price Per Share(3) | $7.59 |
Net Assets - Class C Shares | $2,785,991 |
Shares Outstanding, $0.01 Par Value (unlimited shares authorized) | 385,233 |
Net Asset Value Per Share(2) | $7.23 |
Net Assets - Class D Shares | $291,392,252 |
Shares Outstanding, $0.01 Par Value (unlimited shares authorized) | 40,294,330 |
Net Asset Value Per Share | $7.23 |
Net Assets - Class I Shares | $105,741,629 |
Shares Outstanding, $0.01 Par Value (unlimited shares authorized) | 14,616,701 |
Net Asset Value Per Share | $7.23 |
Net Assets - Class N Shares | $70,553,955 |
Shares Outstanding, $0.01 Par Value (unlimited shares authorized) | 9,756,483 |
Net Asset Value Per Share | $7.23 |
Net Assets - Class R Shares | $1,529,230 |
Shares Outstanding, $0.01 Par Value (unlimited shares authorized) | 211,545 |
Net Asset Value Per Share | $7.23 |
Net Assets - Class S Shares | $845,404 |
Shares Outstanding, $0.01 Par Value (unlimited shares authorized) | 116,776 |
Net Asset Value Per Share | $7.24 |
Net Assets - Class T Shares | $202,581,230 |
Shares Outstanding, $0.01 Par Value (unlimited shares authorized) | 28,014,595 |
Net Asset Value Per Share | $7.23 |
(1) | Includes $11,468,696 of securities on loan. See Note 3 in Notes to Financial Statements. |
(2) | Redemption price per share may be reduced for any applicable contingent deferred sales charge. |
(3) | Maximum offering price is computed at 100/95.25 of net asset value. |
Statement of Operations
For the year ended June 30, 2024
Investment Income: | |
Interest | $55,516,408 |
Dividends from affiliates | 1,224,804 |
Affiliated securities lending income, net | 236,424 |
Dividends | 220,237 |
Unaffiliated securities lending income, net | 56,786 |
Other income | 84,161 |
Foreign tax withheld | (7,370) |
Total Investment Income | 57,331,450 |
Expenses: | |
Advisory fees | 4,551,719 |
12b-1 Distribution and shareholder servicing fees: | |
Class A Shares | 66,205 |
Class C Shares | 30,886 |
Class R Shares | 24,588 |
Class S Shares | 3,092 |
Transfer agent administrative fees and expenses: | |
Class D Shares | 323,800 |
Class R Shares | 12,294 |
Class S Shares | 3,091 |
Class T Shares | 579,051 |
Transfer agent networking and omnibus fees: | |
Class A Shares | 15,137 |
Class C Shares | 2,159 |
Class I Shares | 139,067 |
Other transfer agent fees and expenses: | |
Class A Shares | 1,431 |
Class C Shares | 168 |
Class D Shares | 43,324 |
Class I Shares | 6,356 |
Class N Shares | 3,817 |
Class R Shares | 132 |
Class S Shares | 57 |
Class T Shares | 3,305 |
Registration fees | 156,755 |
Shareholder reports expense | 93,763 |
Professional fees | 83,894 |
Affiliated fund administration fees | 19,333 |
Trustees' fees and expenses | 16,495 |
Custodian fees | 7,373 |
Other expenses | 161,904 |
Total Expenses | 6,349,196 |
Less: Excess Expense Reimbursement and Waivers | (234,507) |
Net Expenses | 6,114,689 |
Net Investment Income/(Loss) | 51,216,761 |
Statement of Operations
For the year ended June 30, 2024
Net Realized Gain/(Loss) on Investments: | |
Investments and foreign currency transactions | $(32,484,420) |
Investments in affiliates | 875 |
Futures contracts | (577,131) |
Total Net Realized Gain/(Loss) on Investments | (33,060,676) |
Change in Unrealized Net Appreciation/Depreciation: | |
Investments, foreign currency translations and Trustees' deferred compensation | 52,752,511 |
Investments in affiliates | (1,013) |
Futures contracts | 240,282 |
Total Change in Unrealized Net Appreciation/Depreciation | 52,991,780 |
Net Increase/(Decrease) in Net Assets Resulting from Operations | $71,147,865 |
Statements of Changes in Net Assets
Year ended June 30, 2024 | Year ended June 30, 2023 | |
Operations: | ||
Net investment income/(loss) | $51,216,761 | $54,756,517 |
Net realized gain/(loss) on investments | (33,060,676) | (111,397,713) |
Change in unrealized net appreciation/depreciation | 52,991,780 | 116,786,959 |
Net Increase/(Decrease) in Net Assets Resulting from Operations | 71,147,865 | 60,145,763 |
Dividends and Distributions to Shareholders: | ||
Class A Shares | (1,715,503) | (1,386,629) |
Class C Shares | (200,072) | (251,395) |
Class D Shares | (18,899,890) | (17,165,352) |
Class I Shares | (8,617,016) | (9,540,829) |
Class N Shares | (6,217,056) | (8,447,921) |
Class R Shares | (295,176) | (360,959) |
Class S Shares | (77,683) | (87,915) |
Class T Shares | (15,156,548) | (16,647,404) |
Net Decrease from Dividends and Distributions to Shareholders | (51,178,944) | (53,888,404) |
Capital Share Transactions: | ||
Class A Shares | 7,789,222 | (4,060,462) |
Class C Shares | (1,535,171) | (1,003,230) |
Class D Shares | 682,345 | 1,921,557 |
Class I Shares | (42,018,947) | (20,613,843) |
Class N Shares | (31,416,062) | (67,136,855) |
Class R Shares | (5,724,764) | 674,281 |
Class S Shares | (444,969) | (202,744) |
Class T Shares | (70,464,761) | (18,864,030) |
Net Increase/(Decrease) from Capital Share Transactions | (143,133,107) | (109,285,326) |
Net Increase/(Decrease) in Net Assets | (123,164,186) | (103,027,967) |
Net Assets: | ||
Beginning of period | 827,700,112 | 930,728,079 |
End of period | $704,535,926 | $827,700,112 |
Financial Highlights
Class A Shares | |||||
For a share outstanding during the year ended June 30 | 2024 | 2023 | 2022 | 2021 | 2020 |
Net Asset Value, Beginning of Period | $7.05 | $6.99 | $8.64 | $7.77 | $8.34 |
Income/(Loss) from Investment Operations: | |||||
Net investment income/(loss)(1) | 0.46 | 0.42 | 0.36 | 0.39 | 0.41 |
Net realized and unrealized gain/(loss) | 0.18 | 0.06 | (1.64) | 0.88 | (0.57) |
Total from Investment Operations | 0.64 | 0.48 | (1.28) | 1.27 | (0.16) |
Less Dividends and Distributions: | |||||
Dividends (from net investment income) | (0.46) | (0.42) | (0.37) | (0.40) | (0.41) |
Total Dividends and Distributions | (0.46) | (0.42) | (0.37) | (0.40) | (0.41) |
Net Asset Value, End of Period | $7.23 | $7.05 | $6.99 | $8.64 | $7.77 |
Total Return* | 9.34% | 6.99% | (15.31)% | 16.69% | (1.95)% |
Net Assets, End of Period (in thousands) | $29,106 | $20,698 | $24,533 | $38,432 | $32,937 |
Ratios to Average Net Assets**: | |||||
Ratio of Gross Expenses | 0.97% | 1.01% | 0.98% | 0.97% | 0.98% |
Ratio of Net Expenses (After Waivers and Expense Offsets) | 0.94% | 0.98% | 0.98% | 0.97% | 0.98% |
Ratio of Net Investment Income/(Loss) | 6.45% | 5.97% | 4.41% | 4.71% | 5.09% |
Portfolio Turnover Rate | 87% | 73% | 81% | 120% | 146% |
* | Total return includes adjustments in accordance with generally accepted accounting principles required at the year or period end and are not annualized for periods of less than one full year. Returns shown exclude any applicable sales charges. |
** | Annualized for periods of less than one full year. |
(1) | Per share amounts are calculated based on average shares outstanding during the year or period. |
Financial Highlights
Class C Shares | |||||
For a share outstanding during the year ended June 30 | 2024 | 2023 | 2022 | 2021 | 2020 |
Net Asset Value, Beginning of Period | $7.05 | $6.99 | $8.63 | $7.77 | $8.34 |
Income/(Loss) from Investment Operations: | |||||
Net investment income/(loss)(1) | 0.41 | 0.37 | 0.31 | 0.34 | 0.36 |
Net realized and unrealized gain/(loss) | 0.18 | 0.06 | (1.63) | 0.86 | (0.57) |
Total from Investment Operations | 0.59 | 0.43 | (1.32) | 1.20 | (0.21) |
Less Dividends and Distributions: | |||||
Dividends (from net investment income) | (0.41) | (0.37) | (0.32) | (0.34) | (0.36) |
Total Dividends and Distributions | (0.41) | (0.37) | (0.32) | (0.34) | (0.36) |
Net Asset Value, End of Period | $7.23 | $7.05 | $6.99 | $8.63 | $7.77 |
Total Return* | 8.64% | 6.24% | (15.81)% | 15.73% | (2.64)% |
Net Assets, End of Period (in thousands) | $2,786 | $4,249 | $5,200 | $7,519 | $12,402 |
Ratios to Average Net Assets**: | |||||
Ratio of Gross Expenses | 1.69% | 1.77% | 1.71% | 1.70% | 1.69% |
Ratio of Net Expenses (After Waivers and Expense Offsets) | 1.58% | 1.70% | 1.68% | 1.69% | 1.69% |
Ratio of Net Investment Income/(Loss) | 5.76% | 5.28% | 3.71% | 4.03% | 4.37% |
Portfolio Turnover Rate | 87% | 73% | 81% | 120% | 146% |
* | Total return includes adjustments in accordance with generally accepted accounting principles required at the year or period end and are not annualized for periods of less than one full year. Returns shown exclude any applicable sales charges. |
** | Annualized for periods of less than one full year. |
(1) | Per share amounts are calculated based on average shares outstanding during the year or period. |
Financial Highlights
Class D Shares | |||||
For a share outstanding during the year ended June 30 | 2024 | 2023 | 2022 | 2021 | 2020 |
Net Asset Value, Beginning of Period | $7.05 | $6.99 | $8.64 | $7.77 | $8.34 |
Income/(Loss) from Investment Operations: | |||||
Net investment income/(loss)(1) | 0.47 | 0.44 | 0.38 | 0.41 | 0.43 |
Net realized and unrealized gain/(loss) | 0.18 | 0.05 | (1.64) | 0.88 | (0.57) |
Total from Investment Operations | 0.65 | 0.49 | (1.26) | 1.29 | (0.14) |
Less Dividends and Distributions: | |||||
Dividends (from net investment income) | (0.47) | (0.43) | (0.39) | (0.42) | (0.43) |
Total Dividends and Distributions | (0.47) | (0.43) | (0.39) | (0.42) | (0.43) |
Net Asset Value, End of Period | $7.23 | $7.05 | $6.99 | $8.64 | $7.77 |
Total Return* | 9.54% | 7.23% | (15.13)% | 16.93% | (1.73)% |
Net Assets, End of Period (in thousands) | $291,392 | $283,345 | $279,111 | $347,855 | $309,023 |
Ratios to Average Net Assets**: | |||||
Ratio of Gross Expenses | 0.79% | 0.80% | 0.76% | 0.76% | 0.77% |
Ratio of Net Expenses (After Waivers and Expense Offsets) | 0.76% | 0.77% | 0.76% | 0.76% | 0.77% |
Ratio of Net Investment Income/(Loss) | 6.62% | 6.21% | 4.64% | 4.92% | 5.31% |
Portfolio Turnover Rate | 87% | 73% | 81% | 120% | 146% |
* | Total return includes adjustments in accordance with generally accepted accounting principles required at the year or period end and are not annualized for periods of less than one full year. |
** | Annualized for periods of less than one full year. |
(1) | Per share amounts are calculated based on average shares outstanding during the year or period. |
Financial Highlights
Class I Shares | |||||
For a share outstanding during the year ended June 30 | 2024 | 2023 | 2022 | 2021 | 2020 |
Net Asset Value, Beginning of Period | $7.05 | $7.00 | $8.64 | $7.77 | $8.34 |
Income/(Loss) from Investment Operations: | |||||
Net investment income/(loss)(1) | 0.47 | 0.44 | 0.39 | 0.42 | 0.44 |
Net realized and unrealized gain/(loss) | 0.18 | 0.04 | (1.64) | 0.88 | (0.57) |
Total from Investment Operations | 0.65 | 0.48 | (1.25) | 1.30 | (0.13) |
Less Dividends and Distributions: | |||||
Dividends (from net investment income) | (0.47) | (0.43) | (0.39) | (0.43) | (0.44) |
Total Dividends and Distributions | (0.47) | (0.43) | (0.39) | (0.43) | (0.44) |
Net Asset Value, End of Period | $7.23 | $7.05 | $7.00 | $8.64 | $7.77 |
Total Return* | 9.56% | 7.10% | (14.98)% | 16.99% | (1.69)% |
Net Assets, End of Period (in thousands) | $105,742 | $144,956 | $165,462 | $264,363 | $258,255 |
Ratios to Average Net Assets**: | |||||
Ratio of Gross Expenses | 0.76% | 0.75% | 0.72% | 0.71% | 0.72% |
Ratio of Net Expenses (After Waivers and Expense Offsets) | 0.74% | 0.74% | 0.72% | 0.71% | 0.72% |
Ratio of Net Investment Income/(Loss) | 6.62% | 6.22% | 4.66% | 4.97% | 5.34% |
Portfolio Turnover Rate | 87% | 73% | 81% | 120% | 146% |
* | Total return includes adjustments in accordance with generally accepted accounting principles required at the year or period end and are not annualized for periods of less than one full year. |
** | Annualized for periods of less than one full year. |
(1) | Per share amounts are calculated based on average shares outstanding during the year or period. |
Financial Highlights
Class N Shares | |||||
For a share outstanding during the year ended June 30 | 2024 | 2023 | 2022 | 2021 | 2020 |
Net Asset Value, Beginning of Period | $7.05 | $6.99 | $8.64 | $7.77 | $8.34 |
Income/(Loss) from Investment Operations: | |||||
Net investment income/(loss)(1) | 0.48 | 0.45 | 0.39 | 0.42 | 0.44 |
Net realized and unrealized gain/(loss) | 0.18 | 0.05 | (1.64) | 0.88 | (0.57) |
Total from Investment Operations | 0.66 | 0.50 | (1.25) | 1.30 | (0.13) |
Less Dividends and Distributions: | |||||
Dividends (from net investment income) | (0.48) | (0.44) | (0.40) | (0.43) | (0.44) |
Total Dividends and Distributions | (0.48) | (0.44) | (0.40) | (0.43) | (0.44) |
Net Asset Value, End of Period | $7.23 | $7.05 | $6.99 | $8.64 | $7.77 |
Total Return* | 9.68% | 7.37% | (15.01)% | 17.09% | (1.59)% |
Net Assets, End of Period (in thousands) | $70,554 | $99,579 | $165,384 | $149,967 | $129,944 |
Ratios to Average Net Assets**: | |||||
Ratio of Gross Expenses | 0.65% | 0.65% | 0.63% | 0.62% | 0.62% |
Ratio of Net Expenses (After Waivers and Expense Offsets) | 0.63% | 0.64% | 0.63% | 0.62% | 0.62% |
Ratio of Net Investment Income/(Loss) | 6.73% | 6.27% | 4.80% | 5.05% | 5.47% |
Portfolio Turnover Rate | 87% | 73% | 81% | 120% | 146% |
* | Total return includes adjustments in accordance with generally accepted accounting principles required at the year or period end and are not annualized for periods of less than one full year. |
** | Annualized for periods of less than one full year. |
(1) | Per share amounts are calculated based on average shares outstanding during the year or period. |
Financial Highlights
Class R Shares | |||||
For a share outstanding during the year ended June 30 | 2024 | 2023 | 2022 | 2021 | 2020 |
Net Asset Value, Beginning of Period | $7.04 | $6.99 | $8.63 | $7.76 | $8.33 |
Income/(Loss) from Investment Operations: | |||||
Net investment income/(loss)(1) | 0.42 | 0.39 | 0.33 | 0.35 | 0.38 |
Net realized and unrealized gain/(loss) | 0.19 | 0.05 | (1.63) | 0.89 | (0.57) |
Total from Investment Operations | 0.61 | 0.44 | (1.30) | 1.24 | (0.19) |
Less Dividends and Distributions: | |||||
Dividends (from net investment income) | (0.42) | (0.39) | (0.34) | (0.37) | (0.38) |
Total Dividends and Distributions | (0.42) | (0.39) | (0.34) | (0.37) | (0.38) |
Net Asset Value, End of Period | $7.23 | $7.04 | $6.99 | $8.63 | $7.76 |
Total Return* | 9.03% | 6.41% | (15.56)% | 16.20% | (2.41)% |
Net Assets, End of Period (in thousands) | $1,529 | $7,071 | $6,351 | $7,788 | $1,551 |
Ratios to Average Net Assets**: | |||||
Ratio of Gross Expenses | 1.44% | 1.45% | 1.41% | 1.45% | 1.57% |
Ratio of Net Expenses (After Waivers and Expense Offsets) | 1.37% | 1.39% | 1.38% | 1.39% | 1.45% |
Ratio of Net Investment Income/(Loss) | 5.94% | 5.60% | 4.02% | 4.20% | 4.64% |
Portfolio Turnover Rate | 87% | 73% | 81% | 120% | 146% |
* | Total return includes adjustments in accordance with generally accepted accounting principles required at the year or period end and are not annualized for periods of less than one full year. |
** | Annualized for periods of less than one full year. |
(1) | Per share amounts are calculated based on average shares outstanding during the year or period. |
Financial Highlights
Class S Shares | |||||
For a share outstanding during the year ended June 30 | 2024 | 2023 | 2022 | 2021 | 2020 |
Net Asset Value, Beginning of Period | $7.06 | $7.00 | $8.65 | $7.78 | $8.35 |
Income/(Loss) from Investment Operations: | |||||
Net investment income/(loss)(1) | 0.44 | 0.41 | 0.35 | 0.38 | 0.40 |
Net realized and unrealized gain/(loss) | 0.18 | 0.06 | (1.64) | 0.88 | (0.57) |
Total from Investment Operations | 0.62 | 0.47 | (1.29) | 1.26 | (0.17) |
Less Dividends and Distributions: | |||||
Dividends (from net investment income) | (0.44) | (0.41) | (0.36) | (0.39) | (0.40) |
Total Dividends and Distributions | (0.44) | (0.41) | (0.36) | (0.39) | (0.40) |
Net Asset Value, End of Period | $7.24 | $7.06 | $7.00 | $8.65 | $7.78 |
Total Return* | 9.14% | 6.83% | (15.42)% | 16.47% | (2.14)% |
Net Assets, End of Period (in thousands) | $845 | $1,260 | $1,449 | $2,237 | $1,859 |
Ratios to Average Net Assets**: | |||||
Ratio of Gross Expenses | 1.39% | 1.35% | 1.28% | 1.27% | 1.30% |
Ratio of Net Expenses (After Waivers and Expense Offsets) | 1.13% | 1.13% | 1.13% | 1.15% | 1.19% |
Ratio of Net Investment Income/(Loss) | 6.25% | 5.83% | 4.25% | 4.53% | 4.90% |
Portfolio Turnover Rate | 87% | 73% | 81% | 120% | 146% |
* | Total return includes adjustments in accordance with generally accepted accounting principles required at the year or period end and are not annualized for periods of less than one full year. |
** | Annualized for periods of less than one full year. |
(1) | Per share amounts are calculated based on average shares outstanding during the year or period. |
Financial Highlights
Class T Shares | |||||
For a share outstanding during the year ended June 30 | 2024 | 2023 | 2022 | 2021 | 2020 |
Net Asset Value, Beginning of Period | $7.05 | $6.99 | $8.64 | $7.77 | $8.34 |
Income/(Loss) from Investment Operations: | |||||
Net investment income/(loss)(1) | 0.46 | 0.43 | 0.37 | 0.40 | 0.42 |
Net realized and unrealized gain/(loss) | 0.18 | 0.05 | (1.64) | 0.88 | (0.57) |
Total from Investment Operations | 0.64 | 0.48 | (1.27) | 1.28 | (0.15) |
Less Dividends and Distributions: | |||||
Dividends (from net investment income) | (0.46) | (0.42) | (0.38) | (0.41) | (0.42) |
Total Dividends and Distributions | (0.46) | (0.42) | (0.38) | (0.41) | (0.42) |
Net Asset Value, End of Period | $7.23 | $7.05 | $6.99 | $8.64 | $7.77 |
Total Return* | 9.43% | 7.12% | (15.21)% | 16.82% | (1.83)% |
Net Assets, End of Period (in thousands) | $202,581 | $266,544 | $283,236 | $372,314 | $349,513 |
Ratios to Average Net Assets**: | |||||
Ratio of Gross Expenses | 0.90% | 0.90% | 0.87% | 0.87% | 0.87% |
Ratio of Net Expenses (After Waivers and Expense Offsets) | 0.86% | 0.87% | 0.86% | 0.85% | 0.86% |
Ratio of Net Investment Income/(Loss) | 6.50% | 6.10% | 4.53% | 4.82% | 5.21% |
Portfolio Turnover Rate | 87% | 73% | 81% | 120% | 146% |
* | Total return includes adjustments in accordance with generally accepted accounting principles required at the year or period end and are not annualized for periods of less than one full year. |
** | Annualized for periods of less than one full year. |
(1) | Per share amounts are calculated based on average shares outstanding during the year or period. |
Notes to Financial Statements
Average Daily Net Assets of the Fund | Contractual Investment Advisory Fee (%) |
First $300 Million | 0.65 |
Over $300 Million | 0.55 |
Average Daily Net Assets of Class D Shares of the Janus Henderson funds | Administrative Services Fee |
Under $40 billion | 0.12% |
$40 billion — $49.9 billion | 0.10% |
Over $49.9 billion | 0.08% |
Notes to Financial Statements
Undistributed Ordinary Income | Undistributed Long-Term Gains | Accumulated Capital Losses | Loss Deferrals | Other Book to Tax Differences | Net Tax Appreciation/ (Depreciation) |
$74,973 | $- | $(322,098,430) | $- | $(8,880) | $9,183,396 |
Capital Loss Carryover Schedule | ||
For the year ended June 30, 2024 | ||
No Expiration | ||
Short-Term | Long-Term | Accumulated Capital Losses |
$(102,127,611) | $(219,970,819) | $(322,098,430) |
Notes to Financial Statements
Federal Tax Cost | Unrealized Appreciation | Unrealized (Depreciation) | Net Tax Appreciation/ (Depreciation) |
$703,749,732 | $16,377,699 | $(7,194,303) | $9,183,396 |
Federal Tax Cost | Unrealized Appreciation | Unrealized (Depreciation) | Net Tax Appreciation/ (Depreciation) |
$240,282 | $- | $- | $- |
For the year ended June 30, 2024 | |||
Distributions | |||
From Ordinary Income | From Long-Term Capital Gains | Tax Return of Capital | Net Investment Loss |
$51,178,944 | $- | $- | $- |
For the year ended June 30, 2023 | |||
Distributions | |||
From Ordinary Income | From Long-Term Capital Gains | Tax Return of Capital | Net Investment Loss |
$53,888,404 | $- | $- | $- |
Notes to Financial Statements
Year ended June 30, 2024 | Year ended June 30, 2023 | |||
Shares | Amount | Shares | Amount | |
Class A Shares: | ||||
Shares sold | 2,565,938 | $18,334,801 | 1,135,338 | $7,980,217 |
Reinvested dividends and distributions | 223,630 | 1,590,531 | 173,565 | 1,218,687 |
Shares repurchased | (1,700,235) | (12,136,110) | (1,881,514) | (13,259,366) |
Net Increase/(Decrease) | 1,089,333 | $7,789,222 | (572,611) | $(4,060,462) |
Class C Shares: | ||||
Shares sold | 93,842 | $673,116 | 81,372 | $574,356 |
Reinvested dividends and distributions | 26,972 | 191,127 | 33,592 | 236,205 |
Shares repurchased | (338,198) | (2,399,414) | (255,979) | (1,813,791) |
Net Increase/(Decrease) | (217,384) | $(1,535,171) | (141,015) | $(1,003,230) |
Class D Shares: | ||||
Shares sold | 3,201,465 | $22,710,801 | 2,871,686 | $20,254,591 |
Reinvested dividends and distributions | 2,303,340 | 16,351,561 | 2,114,246 | 14,863,752 |
Shares repurchased | (5,402,366) | (38,380,017) | (4,713,898) | (33,196,786) |
Net Increase/(Decrease) | 102,439 | $682,345 | 272,034 | $1,921,557 |
Class I Shares: | ||||
Shares sold | 7,001,819 | $49,731,992 | 12,148,011 | $87,074,770 |
Reinvested dividends and distributions | 1,018,199 | 7,225,593 | 1,161,912 | 8,174,225 |
Shares repurchased | (13,956,588) | (98,976,532) | (16,407,506) | (115,862,838) |
Net Increase/(Decrease) | (5,936,570) | $(42,018,947) | (3,097,583) | $(20,613,843) |
Class N Shares: | ||||
Shares sold | 1,611,391 | $11,391,968 | 4,511,701 | $31,774,790 |
Reinvested dividends and distributions | 868,968 | 6,162,130 | 1,196,622 | 8,415,423 |
Shares repurchased | (6,852,611) | (48,970,160) | (15,232,813) | (107,327,068) |
Net Increase/(Decrease) | (4,372,252) | $(31,416,062) | (9,524,490) | $(67,136,855) |
Class R Shares: | ||||
Shares sold | 252,571 | $1,780,058 | 229,273 | $1,612,535 |
Reinvested dividends and distributions | 41,879 | 295,064 | 51,315 | 360,367 |
Shares repurchased | (1,086,926) | (7,799,886) | (185,753) | (1,298,621) |
Net Increase/(Decrease) | (792,476) | $(5,724,764) | 94,835 | $674,281 |
Class S Shares: | ||||
Shares sold | 16,733 | $118,381 | 47,388 | $333,679 |
Reinvested dividends and distributions | 10,663 | 75,756 | 12,473 | 87,801 |
Shares repurchased | (89,097) | (639,106) | (88,313) | (624,224) |
Net Increase/(Decrease) | (61,701) | $(444,969) | (28,452) | $(202,744) |
Class T Shares: | ||||
Shares sold | 6,012,483 | $42,707,967 | 5,921,426 | $42,279,328 |
Reinvested dividends and distributions | 2,105,969 | 14,921,411 | 2,331,829 | 16,393,060 |
Shares repurchased | (17,914,287) | (128,094,139) | (10,944,960) | (77,536,418) |
Net Increase/(Decrease) | (9,795,835) | $(70,464,761) | (2,691,705) | $(18,864,030) |
Purchases of Securities | Proceeds from Sales of Securities | Purchases of Long- Term U.S. Government Obligations | Proceeds from Sales of Long-Term U.S. Government Obligations |
$652,525,721 | $795,472,281 | $- | $- |
Notes to Financial Statements
Report of Independent Registered Public Accounting Firm
August 22, 2024
Designation Requirements (unaudited)
Section 163(j) Interest Dividend | 99% |
Additional Information (unaudited)
Schedule of Investments
June 30, 2024
Shares or Principal Amounts | Value | ||
Common Stocks – 98.3% | |||
Aerospace & Defense – 2.9% | |||
BWX Technologies Inc | 269,662 | $25,617,890 | |
L3Harris Technologies Inc | 141,512 | 31,780,765 | |
57,398,655 | |||
Auto Components – 0.6% | |||
Aptiv PLC* | 168,124 | 11,839,292 | |
Banks – 5.3% | |||
Columbia Banking System Inc | 656,289 | 13,053,588 | |
PNC Financial Services Group Inc/The | 234,401 | 36,444,668 | |
Popular Inc | 300,253 | 26,551,373 | |
Wintrust Financial Corp | 314,886 | 31,035,164 | |
107,084,793 | |||
Building Products – 3.3% | |||
Carlisle Cos Inc | 89,062 | 36,088,813 | |
Fortune Brands Home & Security Inc | 465,855 | 30,252,624 | |
66,341,437 | |||
Capital Markets – 2.8% | |||
Jefferies Financial Group Inc | 470,398 | 23,407,005 | |
Lazard Inc | 844,440 | 32,240,719 | |
55,647,724 | |||
Chemicals – 3.1% | |||
Ashland Global Holdings Inc | 203,706 | 19,248,180 | |
Corteva Inc | 531,178 | 28,651,741 | |
Westlake Chemical Corp | 99,375 | 14,391,488 | |
62,291,409 | |||
Commercial Services & Supplies – 1.7% | |||
Waste Connections Inc | 199,124 | 34,918,385 | |
Construction Materials – 1.4% | |||
Martin Marietta Materials Inc | 52,563 | 28,478,633 | |
Containers & Packaging – 2.6% | |||
Ball Corp | 445,606 | 26,745,272 | |
Graphic Packaging Holding Co | 1,008,025 | 26,420,335 | |
53,165,607 | |||
Distributors – 1.4% | |||
LKQ Corp | 674,727 | 28,061,896 | |
Diversified Financial Services – 2.3% | |||
Fidelity National Information Services Inc | 616,605 | 46,467,353 | |
Electric Utilities – 4.9% | |||
Alliant Energy Corp | 966,397 | 49,189,607 | |
Entergy Corp | 467,897 | 50,064,979 | |
99,254,586 | |||
Electrical Equipment – 1.6% | |||
AMETEK Inc | 187,447 | 31,249,289 | |
Electronic Equipment, Instruments & Components – 5.1% | |||
Arrow Electronics Inc* | 142,744 | 17,237,766 | |
Fabrinet* | 50,523 | 12,367,525 | |
Insight Enterprises Inc* | 83,145 | 16,492,642 | |
Keysight Technologies Inc* | 181,975 | 24,885,081 | |
Vontier Corp | 807,124 | 30,832,137 | |
101,815,151 | |||
Energy Equipment & Services – 1.3% | |||
Baker Hughes Co | 740,353 | 26,038,215 | |
Food & Staples Retailing – 4.1% | |||
Casey's General Stores Inc | 158,523 | 60,486,036 | |
Target Corp | 150,776 | 22,320,879 | |
82,806,915 | |||
Food Products – 2.4% | |||
Hershey Co | 144,812 | 26,620,790 | |
Lamb Weston Holdings Inc | 251,435 | 21,140,655 | |
47,761,445 |
Schedule of Investments
June 30, 2024
Shares or Principal Amounts | Value | ||
Common Stocks – (continued) | |||
Health Care Equipment & Supplies – 3.4% | |||
Globus Medical Inc* | 659,301 | $45,155,526 | |
Teleflex Inc | 110,682 | 23,279,745 | |
68,435,271 | |||
Health Care Providers & Services – 3.5% | |||
Cardinal Health Inc | 281,152 | 27,642,865 | |
Humana Inc | 31,189 | 11,653,770 | |
Labcorp Holdings Inc | 150,122 | 30,551,328 | |
69,847,963 | |||
Household Durables – 1.8% | |||
SharkNinja Inc | 173,150 | 13,012,222 | |
Toll Brothers Inc | 205,288 | 23,645,072 | |
36,657,294 | |||
Industrial Conglomerates – 1.4% | |||
3M Co | 274,489 | 28,050,031 | |
Industrial Real Estate Investment Trusts (REITs) – 1.2% | |||
STAG Industrial Inc | 655,110 | 23,623,267 | |
Insurance – 4.4% | |||
Axis Capital Holdings Ltd | 390,757 | 27,606,982 | |
Hartford Financial Services Group Inc | 396,444 | 39,858,480 | |
RenaissanceRe Holdings Ltd | 91,140 | 20,370,701 | |
87,836,163 | |||
Life Sciences Tools & Services – 1.0% | |||
Avantor Inc* | 994,047 | 21,073,796 | |
Machinery – 2.4% | |||
Hillenbrand Inc | 617,897 | 24,728,238 | |
Lincoln Electric Holdings Inc | 124,197 | 23,428,522 | |
48,156,760 | |||
Marine – 1.3% | |||
Kirby Corp* | 213,121 | 25,516,977 | |
Media – 1.7% | |||
Fox Corp - Class B | 1,057,738 | 33,868,771 | |
Metals & Mining – 2.4% | |||
Freeport-McMoRan Inc | 1,006,084 | 48,895,682 | |
Oil, Gas & Consumable Fuels – 5.9% | |||
Chesapeake Energy Corp | 550,012 | 45,205,486 | |
HF Sinclair Corp | 516,763 | 27,564,138 | |
Marathon Oil Corp | 1,627,559 | 46,662,117 | |
119,431,741 | |||
Professional Services – 1.2% | |||
TransUnion | 334,247 | 24,787,758 | |
Real Estate Management & Development – 1.4% | |||
CBRE Group Inc* | 325,451 | 29,000,939 | |
Residential Real Estate Investment Trusts (REITs) – 1.3% | |||
Equity LifeStyle Properties Inc | 388,774 | 25,320,851 | |
Retail Real Estate Investment Trusts (REITs) – 1.8% | |||
Agree Realty Corp | 590,229 | 36,558,784 | |
Road & Rail – 2.5% | |||
Canadian Pacific Kansas City Ltd | 262,334 | 20,653,556 | |
Landstar System Inc | 155,118 | 28,616,168 | |
49,269,724 | |||
Semiconductor & Semiconductor Equipment – 3.3% | |||
Microchip Technology Inc | 326,995 | 29,920,042 | |
Teradyne Inc | 241,251 | 35,775,111 | |
65,695,153 | |||
Specialized Real Estate Investment Trusts (REITs) – 2.7% | |||
Lamar Advertising Co | 374,146 | 44,721,671 | |
PotlatchDeltic Corp | 267,730 | 10,545,885 | |
55,267,556 |
Schedule of Investments
June 30, 2024
Shares or Principal Amounts | Value | ||
Common Stocks – (continued) | |||
Specialty Retail – 4.4% | |||
AutoZone Inc* | 8,559 | $25,369,732 | |
Bath & Body Works Inc | 419,570 | 16,384,208 | |
Burlington Stores Inc* | 109,868 | 26,368,320 | |
O'Reilly Automotive Inc* | 19,233 | 20,311,202 | |
88,433,462 | |||
Trading Companies & Distributors – 2.5% | |||
GATX Corp | 203,235 | 26,900,184 | |
MSC Industrial Direct Co Inc | 289,893 | 22,991,414 | |
49,891,598 | |||
Total Common Stocks (cost $1,411,238,229) | 1,976,240,326 | ||
Repurchase Agreements – 1.6% | |||
ING Financial Markets LLC, Joint repurchase agreement, 5.3000%, dated 6/28/24, maturing 7/1/24 to be repurchased at $16,407,243 collateralized by $18,059,924 in U.S. Treasuries 0.5000% - 4.1250%, 2/15/25 - 11/15/50 with a value of $16,735,401 | $16,400,000 | 16,400,000 | |
Royal Bank of Canada, NY Branch, Joint repurchase agreement, 5.2800%, dated 6/28/24, maturing 7/1/24 to be repurchased at $15,006,600 collateralized by $15,237,465 in U.S. Treasuries 4.2500%, 3/15/27 with a value of $15,306,740 | 15,000,000 | 15,000,000 | |
Total Repurchase Agreements (cost $31,400,000) | 31,400,000 | ||
Total Investments (total cost $1,442,638,229) – 99.9% | 2,007,640,326 | ||
Cash, Receivables and Other Assets, net of Liabilities – 0.1% | 2,260,920 | ||
Net Assets – 100% | $2,009,901,246 |
Summary of Investments by Country - (Long Positions) (unaudited) | ||
Country | Value | % of Investment Securities |
United States | $1,986,986,770 | 99.0 % |
Canada | 20,653,556 | 1.0 |
Total | $2,007,640,326 | 100.0 % |
Offsetting of Financial Assets and Derivative Assets | ||||
Counterparty | Gross Amounts of Recognized Assets | Offsetting Asset or Liability(a) | Collateral Pledged(b) | Net Amount |
ING Financial Markets LLC | $16,400,000 | $— | $(16,400,000) | $— |
Royal Bank of Canada, NY Branch | 15,000,000 | — | (15,000,000) | — |
Total | $31,400,000 | $— | $(31,400,000) | $— |
(a) | Represents the amount of assets or liabilities that could be offset with the same counterparty under master netting or similar agreements that management elects not to offset on the Statement of Assets and Liabilities. |
(b) | Collateral pledged is limited to the net outstanding amount due to/from an individual counterparty. The actual collateral amounts pledged may exceed these amounts and may fluctuate in value. |
Notes to Schedule of Investments and Other Information
LLC | Limited Liability Company |
PLC | Public Limited Company |
* | Non-income producing security. |
Valuation Inputs Summary | |||
Level 1 - Quoted Prices | Level 2 - Other Significant Observable Inputs | Level 3 - Significant Unobservable Inputs | |
Assets | |||
Investments In Securities: | |||
Common Stocks | $1,976,240,326 | $- | $- |
Repurchase Agreements | - | 31,400,000 | - |
Total Assets | $1,976,240,326 | $31,400,000 | $- |
Statement of Assets and Liabilities
June 30, 2024
Assets: | |
Investments, at value (cost $1,411,238,229) | $1,976,240,326 |
Repurchase agreements, at value (cost $31,400,000) | 31,400,000 |
Cash | 95,304 |
Trustees' deferred compensation | 55,340 |
Receivables: | |
Investments sold | 2,650,856 |
Dividends | 1,313,372 |
Fund shares sold | 1,211,932 |
Interest | 13,843 |
Other assets | 9,527 |
Total Assets | 2,012,990,500 |
Liabilities: | |
Payables: | |
Advisory fees | 1,343,717 |
Fund shares repurchased | 1,145,563 |
Transfer agent fees and expenses | 303,429 |
Professional fees | 59,086 |
Trustees' deferred compensation fees | 55,340 |
12b-1 Distribution and shareholder servicing fees | 43,536 |
Trustees' fees and expenses | 11,345 |
Affiliated fund administration fees payable | 4,139 |
Custodian fees | 1,237 |
Accrued expenses and other payables | 121,862 |
Total Liabilities | 3,089,254 |
Commitments and contingent liabilities (Note 3) | |
Net Assets | $2,009,901,246 |
Statement of Assets and Liabilities
June 30, 2024
Net Assets Consist of: | |
Capital (par value and paid-in surplus) | $1,306,057,180 |
Total distributable earnings (loss) | 703,844,066 |
Total Net Assets | $2,009,901,246 |
Net Assets - Class A Shares | $56,074,709 |
Shares Outstanding, $0.01 Par Value (unlimited shares authorized) | 3,436,778 |
Net Asset Value Per Share(1) | $16.32 |
Maximum Offering Price Per Share(2) | $17.32 |
Net Assets - Class C Shares | $7,039,227 |
Shares Outstanding, $0.01 Par Value (unlimited shares authorized) | 448,808 |
Net Asset Value Per Share(1) | $15.68 |
Net Assets - Class D Shares | $705,902,436 |
Shares Outstanding, $0.01 Par Value (unlimited shares authorized) | 44,479,892 |
Net Asset Value Per Share | $15.87 |
Net Assets - Class I Shares | $193,981,141 |
Shares Outstanding, $0.01 Par Value (unlimited shares authorized) | 12,186,856 |
Net Asset Value Per Share | $15.92 |
Net Assets - Class N Shares | $188,332,629 |
Shares Outstanding, $0.01 Par Value (unlimited shares authorized) | 11,911,418 |
Net Asset Value Per Share | $15.81 |
Net Assets - Class R Shares | $34,222,153 |
Shares Outstanding, $0.01 Par Value (unlimited shares authorized) | 2,150,070 |
Net Asset Value Per Share | $15.92 |
Net Assets - Class S Shares | $58,300,741 |
Shares Outstanding, $0.01 Par Value (unlimited shares authorized) | 3,571,037 |
Net Asset Value Per Share | $16.33 |
Net Assets - Class T Shares | $766,048,210 |
Shares Outstanding, $0.01 Par Value (unlimited shares authorized) | 47,812,795 |
Net Asset Value Per Share | $16.02 |
(1) | Redemption price per share may be reduced for any applicable contingent deferred sales charge. |
(2) | Maximum offering price is computed at 100/94.25 of net asset value. |
Statement of Operations
For the year ended June 30, 2024
Investment Income: | |
Dividends | $35,514,071 |
Interest | 1,521,138 |
Other income | 6,492 |
Foreign tax withheld | (133,947) |
Total Investment Income | 36,907,754 |
Expenses: | |
Advisory fees | 12,215,849 |
12b-1 Distribution and shareholder servicing fees: | |
Class A Shares | 138,690 |
Class C Shares | 69,119 |
Class R Shares | 170,480 |
Class S Shares | 155,534 |
Transfer agent administrative fees and expenses: | |
Class D Shares | 775,899 |
Class L Shares(1) | 8,359 |
Class R Shares | 85,540 |
Class S Shares | 155,513 |
Class T Shares | 1,905,222 |
Transfer agent networking and omnibus fees: | |
Class A Shares | 79,044 |
Class C Shares | 6,125 |
Class I Shares | 197,506 |
Other transfer agent fees and expenses: | |
Class A Shares | 3,117 |
Class C Shares | 426 |
Class D Shares | 97,944 |
Class I Shares | 10,006 |
Class L Shares(1) | 88 |
Class N Shares | 7,685 |
Class R Shares | 935 |
Class S Shares | 2,125 |
Class T Shares | 9,976 |
Shareholder reports expense | 198,800 |
Registration fees | 137,624 |
Professional fees | 76,296 |
Affiliated fund administration fees | 49,712 |
Trustees' fees and expenses | 43,043 |
Custodian fees | 15,994 |
Other expenses | 159,387 |
Total Expenses | 16,776,038 |
Less: Excess Expense Reimbursement and Waivers | (86,591) |
Net Expenses | 16,689,447 |
Net Investment Income/(Loss) | 20,218,307 |
Net Realized Gain/(Loss) on Investments: | |
Investments | 202,767,914 |
Total Net Realized Gain/(Loss) on Investments | 202,767,914 |
Change in Unrealized Net Appreciation/Depreciation: | |
Investments, foreign currency translations and Trustees' deferred compensation | 36,498,344 |
Total Change in Unrealized Net Appreciation/Depreciation | 36,498,344 |
Net Increase/(Decrease) in Net Assets Resulting from Operations | $259,484,565 |
(1) | Effective May 29, 2024, Class L Shares liquidated. |
Statements of Changes in Net Assets
Year ended June 30, 2024 | Year ended June 30, 2023 | |
Operations: | ||
Net investment income/(loss) | $20,218,307 | $25,076,728 |
Net realized gain/(loss) on investments | 202,767,914 | 120,849,434 |
Change in unrealized net appreciation/depreciation | 36,498,344 | 80,841,432 |
Net Increase/(Decrease) in Net Assets Resulting from Operations | 259,484,565 | 226,767,594 |
Dividends and Distributions to Shareholders: | ||
Class A Shares | (4,753,717) | (3,376,569) |
Class C Shares | (615,241) | (449,643) |
Class D Shares | (61,083,222) | (42,385,456) |
Class I Shares | (17,906,508) | (13,114,124) |
Class L Shares(1) | (323,764) | (255,037) |
Class N Shares | (16,971,420) | (11,696,613) |
Class R Shares | (2,891,861) | (2,021,571) |
Class S Shares | (5,284,966) | (3,877,081) |
Class T Shares | (67,684,534) | (48,220,026) |
Net Decrease from Dividends and Distributions to Shareholders | (177,515,233) | (125,396,120) |
Capital Share Transactions: | ||
Class A Shares | (3,093,717) | (5,420,912) |
Class C Shares | (1,244,980) | (368,440) |
Class D Shares | (7,507,733) | (11,086,647) |
Class I Shares | (22,391,809) | (9,281,807) |
Class L Shares(1) | (4,168,510) | (565,821) |
Class N Shares | (6,429,153) | (15,139,006) |
Class R Shares | (2,325,657) | (2,967,403) |
Class S Shares | (12,848,296) | (4,943,133) |
Class T Shares | (47,283,578) | (72,795,412) |
Net Increase/(Decrease) from Capital Share Transactions | (107,293,433) | (122,568,581) |
Net Increase/(Decrease) in Net Assets | (25,324,101) | (21,197,107) |
Net Assets: | ||
Beginning of period | 2,035,225,347 | 2,056,422,454 |
End of period | $2,009,901,246 | $2,035,225,347 |
(1) | Effective May 29, 2024, Class L Shares liquidated. |
Financial Highlights
Class A Shares | |||||
For a share outstanding during the year ended June 30 | 2024 | 2023 | 2022 | 2021 | 2020 |
Net Asset Value, Beginning of Period | $15.71 | $14.97 | $18.02 | $13.29 | $15.33 |
Income/(Loss) from Investment Operations: | |||||
Net investment income/(loss)(1) | 0.13 | 0.15 | 0.13 | 0.12 | 0.13 |
Net realized and unrealized gain/(loss) | 1.87 | 1.50 | (1.17) | 4.73 | (1.82) |
Total from Investment Operations | 2.00 | 1.65 | (1.04) | 4.85 | (1.69) |
Less Dividends and Distributions: | |||||
Dividends (from net investment income) | (0.14) | (0.14) | (0.04) | (0.12) | (0.12) |
Distributions (from capital gains) | (1.25) | (0.77) | (1.97) | — | (0.23) |
Total Dividends and Distributions | (1.39) | (0.91) | (2.01) | (0.12) | (0.35) |
Net Asset Value, End of Period | $16.32 | $15.71 | $14.97 | $18.02 | $13.29 |
Total Return* | 13.65% | 11.30% | (6.84)% | 36.65% | (11.47)% |
Net Assets, End of Period (in thousands) | $56,075 | $56,731 | $59,218 | $73,118 | $59,211 |
Ratios to Average Net Assets**: | |||||
Ratio of Gross Expenses | 1.04% | 0.91% | 0.93% | 0.97% | 1.19% |
Ratio of Net Expenses (After Waivers and Expense Offsets) | 1.04% | 0.91% | 0.93% | 0.97% | 1.19% |
Ratio of Net Investment Income/(Loss) | 0.81% | 0.98% | 0.78% | 0.76% | 0.90% |
Portfolio Turnover Rate | 37% | 54% | 52% | 46% | 37% |
* | Total return includes adjustments in accordance with generally accepted accounting principles required at the year or period end and are not annualized for periods of less than one full year. Returns shown exclude any applicable sales charges. |
** | Annualized for periods of less than one full year. |
(1) | Per share amounts are calculated based on average shares outstanding during the year or period. |
Financial Highlights
Class C Shares | |||||
For a share outstanding during the year ended June 30 | 2024 | 2023 | 2022 | 2021 | 2020 |
Net Asset Value, Beginning of Period | $15.15 | $14.46 | $17.55 | $12.93 | $14.91 |
Income/(Loss) from Investment Operations: | |||||
Net investment income/(loss)(1) | 0.02 | 0.05 | 0.01 | 0.04 | 0.05 |
Net realized and unrealized gain/(loss) | 1.79 | 1.45 | (1.13) | 4.58 | (1.80) |
Total from Investment Operations | 1.81 | 1.50 | (1.12) | 4.62 | (1.75) |
Less Dividends and Distributions: | |||||
Dividends (from net investment income) | (0.03) | (0.04) | — | — (2) | — |
Distributions (from capital gains) | (1.25) | (0.77) | (1.97) | — | (0.23) |
Total Dividends and Distributions | (1.28) | (0.81) | (1.97) | — | (0.23) |
Net Asset Value, End of Period | $15.68 | $15.15 | $14.46 | $17.55 | $12.93 |
Total Return* | 12.81% | 10.65% | (7.50)% | 35.76% | (12.02)% |
Net Assets, End of Period (in thousands) | $7,039 | $7,998 | $7,974 | $10,436 | $15,768 |
Ratios to Average Net Assets**: | |||||
Ratio of Gross Expenses | 1.69% | 1.54% | 1.62% | 1.64% | 1.78% |
Ratio of Net Expenses (After Waivers and Expense Offsets) | 1.69% | 1.54% | 1.62% | 1.64% | 1.78% |
Ratio of Net Investment Income/(Loss) | 0.16% | 0.35% | 0.09% | 0.24% | 0.32% |
Portfolio Turnover Rate | 37% | 54% | 52% | 46% | 37% |
* | Total return includes adjustments in accordance with generally accepted accounting principles required at the year or period end and are not annualized for periods of less than one full year. Returns shown exclude any applicable sales charges. |
** | Annualized for periods of less than one full year. |
(1) | Per share amounts are calculated based on average shares outstanding during the year or period. |
(2) | Less than $0.005 on a per share basis. |
Financial Highlights
Class D Shares | |||||
For a share outstanding during the year ended June 30 | 2024 | 2023 | 2022 | 2021 | 2020 |
Net Asset Value, Beginning of Period | $15.33 | $14.63 | $17.67 | $13.03 | $15.04 |
Income/(Loss) from Investment Operations: | |||||
Net investment income/(loss)(1) | 0.16 | 0.19 | 0.18 | 0.17 | 0.17 |
Net realized and unrealized gain/(loss) | 1.82 | 1.47 | (1.15) | 4.64 | (1.79) |
Total from Investment Operations | 1.98 | 1.66 | (0.97) | 4.81 | (1.62) |
Less Dividends and Distributions: | |||||
Dividends (from net investment income) | (0.19) | (0.19) | (0.10) | (0.17) | (0.16) |
Distributions (from capital gains) | (1.25) | (0.77) | (1.97) | — | (0.23) |
Total Dividends and Distributions | (1.44) | (0.96) | (2.07) | (0.17) | (0.39) |
Net Asset Value, End of Period | $15.87 | $15.33 | $14.63 | $17.67 | $13.03 |
Total Return* | 13.87% | 11.65% | (6.58)% | 37.11% | (11.24)% |
Net Assets, End of Period (in thousands) | $705,902 | $685,186 | $663,819 | $752,405 | $615,270 |
Ratios to Average Net Assets**: | |||||
Ratio of Gross Expenses | 0.78% | 0.63% | 0.64% | 0.66% | 0.89% |
Ratio of Net Expenses (After Waivers and Expense Offsets) | 0.78% | 0.63% | 0.64% | 0.66% | 0.89% |
Ratio of Net Investment Income/(Loss) | 1.06% | 1.26% | 1.07% | 1.07% | 1.18% |
Portfolio Turnover Rate | 37% | 54% | 52% | 46% | 37% |
* | Total return includes adjustments in accordance with generally accepted accounting principles required at the year or period end and are not annualized for periods of less than one full year. |
** | Annualized for periods of less than one full year. |
(1) | Per share amounts are calculated based on average shares outstanding during the year or period. |
Financial Highlights
Class I Shares | |||||
For a share outstanding during the year ended June 30 | 2024 | 2023 | 2022 | 2021 | 2020 |
Net Asset Value, Beginning of Period | $15.37 | $14.66 | $17.71 | $13.06 | $15.07 |
Income/(Loss) from Investment Operations: | |||||
Net investment income/(loss)(1) | 0.17 | 0.20 | 0.19 | 0.18 | 0.18 |
Net realized and unrealized gain/(loss) | 1.82 | 1.47 | (1.16) | 4.65 | (1.79) |
Total from Investment Operations | 1.99 | 1.67 | (0.97) | 4.83 | (1.61) |
Less Dividends and Distributions: | |||||
Dividends (from net investment income) | (0.19) | (0.19) | (0.11) | (0.18) | (0.17) |
Distributions (from capital gains) | (1.25) | (0.77) | (1.97) | — | (0.23) |
Total Dividends and Distributions | (1.44) | (0.96) | (2.08) | (0.18) | (0.40) |
Net Asset Value, End of Period | $15.92 | $15.37 | $14.66 | $17.71 | $13.06 |
Total Return* | 13.94% | 11.75% | (6.60)% | 37.15% | (11.16)% |
Net Assets, End of Period (in thousands) | $193,981 | $208,187 | $207,292 | $359,761 | $310,803 |
Ratios to Average Net Assets**: | |||||
Ratio of Gross Expenses | 0.74% | 0.59% | 0.60% | 0.62% | 0.85% |
Ratio of Net Expenses (After Waivers and Expense Offsets) | 0.74% | 0.59% | 0.60% | 0.62% | 0.85% |
Ratio of Net Investment Income/(Loss) | 1.11% | 1.30% | 1.11% | 1.13% | 1.20% |
Portfolio Turnover Rate | 37% | 54% | 52% | 46% | 37% |
* | Total return includes adjustments in accordance with generally accepted accounting principles required at the year or period end and are not annualized for periods of less than one full year. |
** | Annualized for periods of less than one full year. |
(1) | Per share amounts are calculated based on average shares outstanding during the year or period. |
Financial Highlights
Class N Shares | |||||
For a share outstanding during the year ended June 30 | 2024 | 2023 | 2022 | 2021 | 2020 |
Net Asset Value, Beginning of Period | $15.27 | $14.58 | $17.62 | $12.99 | $15.00 |
Income/(Loss) from Investment Operations: | |||||
Net investment income/(loss)(1) | 0.18 | 0.21 | 0.20 | 0.19 | 0.20 |
Net realized and unrealized gain/(loss) | 1.82 | 1.46 | (1.14) | 4.63 | (1.80) |
Total from Investment Operations | 2.00 | 1.67 | (0.94) | 4.82 | (1.60) |
Less Dividends and Distributions: | |||||
Dividends (from net investment income) | (0.21) | (0.21) | (0.13) | (0.19) | (0.18) |
Distributions (from capital gains) | (1.25) | (0.77) | (1.97) | — | (0.23) |
Total Dividends and Distributions | (1.46) | (0.98) | (2.10) | (0.19) | (0.41) |
Net Asset Value, End of Period | $15.81 | $15.27 | $14.58 | $17.62 | $12.99 |
Total Return* | 14.09% | 11.78% | (6.47)% | 37.34% | (11.14)% |
Net Assets, End of Period (in thousands) | $188,333 | $187,335 | $193,017 | $506,429 | $422,894 |
Ratios to Average Net Assets**: | |||||
Ratio of Gross Expenses | 0.65% | 0.49% | 0.50% | 0.52% | 0.75% |
Ratio of Net Expenses (After Waivers and Expense Offsets) | 0.65% | 0.49% | 0.50% | 0.52% | 0.75% |
Ratio of Net Investment Income/(Loss) | 1.20% | 1.40% | 1.20% | 1.24% | 1.36% |
Portfolio Turnover Rate | 37% | 54% | 52% | 46% | 37% |
* | Total return includes adjustments in accordance with generally accepted accounting principles required at the year or period end and are not annualized for periods of less than one full year. |
** | Annualized for periods of less than one full year. |
(1) | Per share amounts are calculated based on average shares outstanding during the year or period. |
Financial Highlights
Class R Shares | |||||
For a share outstanding during the year ended June 30 | 2024 | 2023 | 2022 | 2021 | 2020 |
Net Asset Value, Beginning of Period | $15.36 | $14.65 | $17.70 | $13.04 | $15.06 |
Income/(Loss) from Investment Operations: | |||||
Net investment income/(loss)(1) | 0.07 | 0.10 | 0.08 | 0.08 | 0.09 |
Net realized and unrealized gain/(loss) | 1.83 | 1.46 | (1.16) | 4.65 | (1.82) |
Total from Investment Operations | 1.90 | 1.56 | (1.08) | 4.73 | (1.73) |
Less Dividends and Distributions: | |||||
Dividends (from net investment income) | (0.09) | (0.08) | — | (0.07) | (0.06) |
Distributions (from capital gains) | (1.25) | (0.77) | (1.97) | — | (0.23) |
Total Dividends and Distributions | (1.34) | (0.85) | (1.97) | (0.07) | (0.29) |
Net Asset Value, End of Period | $15.92 | $15.36 | $14.65 | $17.70 | $13.04 |
Total Return* | 13.23% | 10.94% | (7.20)% | 36.38% | (11.83)% |
Net Assets, End of Period (in thousands) | $34,222 | $35,107 | $36,305 | $43,893 | $38,246 |
Ratios to Average Net Assets**: | |||||
Ratio of Gross Expenses | 1.39% | 1.25% | 1.26% | 1.26% | 1.50% |
Ratio of Net Expenses (After Waivers and Expense Offsets) | 1.39% | 1.25% | 1.26% | 1.26% | 1.50% |
Ratio of Net Investment Income/(Loss) | 0.45% | 0.65% | 0.45% | 0.49% | 0.59% |
Portfolio Turnover Rate | 37% | 54% | 52% | 46% | 37% |
* | Total return includes adjustments in accordance with generally accepted accounting principles required at the year or period end and are not annualized for periods of less than one full year. |
** | Annualized for periods of less than one full year. |
(1) | Per share amounts are calculated based on average shares outstanding during the year or period. |
Financial Highlights
Class S Shares | |||||
For a share outstanding during the year ended June 30 | 2024 | 2023 | 2022 | 2021 | 2020 |
Net Asset Value, Beginning of Period | $15.72 | $14.97 | $18.03 | $13.28 | $15.33 |
Income/(Loss) from Investment Operations: | |||||
Net investment income/(loss)(1) | 0.11 | 0.14 | 0.12 | 0.11 | 0.12 |
Net realized and unrealized gain/(loss) | 1.87 | 1.50 | (1.18) | 4.74 | (1.83) |
Total from Investment Operations | 1.98 | 1.64 | (1.06) | 4.85 | (1.71) |
Less Dividends and Distributions: | |||||
Dividends (from net investment income) | (0.12) | (0.12) | (0.03) | (0.10) | (0.11) |
Distributions (from capital gains) | (1.25) | (0.77) | (1.97) | — | (0.23) |
Total Dividends and Distributions | (1.37) | (0.89) | (2.00) | (0.10) | (0.34) |
Net Asset Value, End of Period | $16.33 | $15.72 | $14.97 | $18.03 | $13.28 |
Total Return* | 13.50% | 11.26% | (6.97)% | 36.67% | (11.58)% |
Net Assets, End of Period (in thousands) | $58,301 | $68,572 | $70,035 | $97,606 | $99,159 |
Ratios to Average Net Assets**: | |||||
Ratio of Gross Expenses | 1.14% | 0.99% | 1.01% | 1.02% | 1.25% |
Ratio of Net Expenses (After Waivers and Expense Offsets) | 1.14% | 0.99% | 1.01% | 1.02% | 1.25% |
Ratio of Net Investment Income/(Loss) | 0.71% | 0.90% | 0.70% | 0.72% | 0.79% |
Portfolio Turnover Rate | 37% | 54% | 52% | 46% | 37% |
* | Total return includes adjustments in accordance with generally accepted accounting principles required at the year or period end and are not annualized for periods of less than one full year. |
** | Annualized for periods of less than one full year. |
(1) | Per share amounts are calculated based on average shares outstanding during the year or period. |
Financial Highlights
Class T Shares | |||||
For a share outstanding during the year ended June 30 | 2024 | 2023 | 2022 | 2021 | 2020 |
Net Asset Value, Beginning of Period | $15.46 | $14.74 | $17.79 | $13.12 | $15.14 |
Income/(Loss) from Investment Operations: | |||||
Net investment income/(loss)(1) | 0.15 | 0.18 | 0.16 | 0.16 | 0.16 |
Net realized and unrealized gain/(loss) | 1.83 | 1.48 | (1.16) | 4.66 | (1.80) |
Total from Investment Operations | 1.98 | 1.66 | (1.00) | 4.82 | (1.64) |
Less Dividends and Distributions: | |||||
Dividends (from net investment income) | (0.17) | (0.17) | (0.08) | (0.15) | (0.15) |
Distributions (from capital gains) | (1.25) | (0.77) | (1.97) | — | (0.23) |
Total Dividends and Distributions | (1.42) | (0.94) | (2.05) | (0.15) | (0.38) |
Net Asset Value, End of Period | $16.02 | $15.46 | $14.74 | $17.79 | $13.12 |
Total Return* | 13.76% | 11.57% | (6.72)% | 36.95% | (11.31)% |
Net Assets, End of Period (in thousands) | $766,048 | $782,095 | $814,391 | $1,010,187 | $896,622 |
Ratios to Average Net Assets**: | |||||
Ratio of Gross Expenses | 0.89% | 0.74% | 0.75% | 0.77% | 0.99% |
Ratio of Net Expenses (After Waivers and Expense Offsets) | 0.88% | 0.73% | 0.74% | 0.76% | 0.99% |
Ratio of Net Investment Income/(Loss) | 0.97% | 1.17% | 0.96% | 1.00% | 1.09% |
Portfolio Turnover Rate | 37% | 54% | 52% | 46% | 37% |
* | Total return includes adjustments in accordance with generally accepted accounting principles required at the year or period end and are not annualized for periods of less than one full year. |
** | Annualized for periods of less than one full year. |
(1) | Per share amounts are calculated based on average shares outstanding during the year or period. |
Notes to Financial Statements
Average Daily Net Assets of Class D Shares of the Janus Henderson funds | Administrative Services Fee |
Under $40 billion | 0.12% |
$40 billion — $49.9 billion | 0.10% |
Over $49.9 billion | 0.08% |
Notes to Financial Statements
Undistributed Ordinary Income | Undistributed Long-Term Gains | Accumulated Capital Losses | Loss Deferrals | Other Book to Tax Differences | Net Tax Appreciation/ (Depreciation) |
$7,719,240 | $134,506,847 | $- | $- | $(21,941) | $561,639,920 |
Federal Tax Cost | Unrealized Appreciation | Unrealized (Depreciation) | Net Tax Appreciation/ (Depreciation) |
$1,446,000,406 | $576,618,141 | $(14,978,221) | $561,639,920 |
For the year ended June 30, 2024 | |||
Distributions | |||
From Ordinary Income | From Long-Term Capital Gains | Tax Return of Capital | Net Investment Loss |
$22,033,603 | $155,481,630 | $- | $- |
For the year ended June 30, 2023 | |||
Distributions | |||
From Ordinary Income | From Long-Term Capital Gains | Tax Return of Capital | Net Investment Loss |
$23,550,606 | $101,845,514 | $- | $- |
Notes to Financial Statements
Year ended June 30, 2024 | Year ended June 30, 2023 | |||
Shares | Amount | Shares | Amount | |
Class A Shares: | ||||
Shares sold | 296,145 | $4,621,369 | 316,306 | $4,884,230 |
Reinvested dividends and distributions | 280,508 | 4,140,304 | 196,023 | 2,942,303 |
Shares repurchased | (750,697) | (11,855,390) | (858,181) | (13,247,445) |
Net Increase/(Decrease) | (174,044) | $(3,093,717) | (345,852) | $(5,420,912) |
Class C Shares: | ||||
Shares sold | 38,076 | $574,249 | 97,675 | $1,456,626 |
Reinvested dividends and distributions | 40,115 | 571,240 | 29,072 | 421,842 |
Shares repurchased | (157,416) | (2,390,469) | (150,288) | (2,246,908) |
Net Increase/(Decrease) | (79,225) | $(1,244,980) | (23,541) | $(368,440) |
Class D Shares: | ||||
Shares sold | 880,970 | $13,570,940 | 1,432,517 | $21,898,738 |
Reinvested dividends and distributions | 4,142,428 | 59,360,998 | 2,815,147 | 41,157,447 |
Shares repurchased | (5,252,101) | (80,439,671) | (4,922,699) | (74,142,832) |
Net Increase/(Decrease) | (228,703) | $(7,507,733) | (675,035) | $(11,086,647) |
Class I Shares: | ||||
Shares sold | 1,946,985 | $30,172,978 | 2,080,493 | $31,615,667 |
Reinvested dividends and distributions | 1,173,097 | 16,857,405 | 846,464 | 12,400,700 |
Shares repurchased | (4,481,485) | (69,422,192) | (3,514,919) | (53,298,174) |
Net Increase/(Decrease) | (1,361,403) | $(22,391,809) | (587,962) | $(9,281,807) |
Class L Shares:(1) | ||||
Shares sold | 178 | $2,723 | 129 | $1,986 |
Reinvested dividends and distributions | 21,410 | 320,935 | 16,638 | 253,234 |
Shares repurchased | (273,105) | (4,492,168) | (52,974) | (821,041) |
Net Increase/(Decrease) | (251,517) | $(4,168,510) | (36,207) | $(565,821) |
Class N Shares: | ||||
Shares sold | 2,105,749 | $32,042,146 | 2,552,662 | $38,423,059 |
Reinvested dividends and distributions | 1,027,729 | 14,665,689 | 716,344 | 10,429,961 |
Shares repurchased | (3,486,452) | (53,136,988) | (4,241,789) | (63,992,026) |
Net Increase/(Decrease) | (352,974) | $(6,429,153) | (972,783) | $(15,139,006) |
Class R Shares: | ||||
Shares sold | 234,349 | $3,598,068 | 316,092 | $4,805,866 |
Reinvested dividends and distributions | 200,390 | 2,889,630 | 137,432 | 2,020,246 |
Shares repurchased | (570,298) | (8,813,355) | (646,438) | (9,793,515) |
Net Increase/(Decrease) | (135,559) | $(2,325,657) | (192,914) | $(2,967,403) |
Class S Shares: | ||||
Shares sold | 413,266 | $6,516,802 | 832,331 | $12,926,292 |
Reinvested dividends and distributions | 357,805 | 5,284,782 | 258,120 | 3,876,964 |
Shares repurchased | (1,562,846) | (24,649,880) | (1,405,850) | (21,746,389) |
Net Increase/(Decrease) | (791,775) | $(12,848,296) | (315,399) | $(4,943,133) |
Class T Shares: | ||||
Shares sold | 1,881,885 | $29,125,632 | 2,212,621 | $33,902,575 |
Reinvested dividends and distributions | 4,635,599 | 67,123,473 | 3,240,578 | 47,798,527 |
Shares repurchased | (9,303,622) | (143,532,683) | (10,100,502) | (154,496,514) |
Net Increase/(Decrease) | (2,786,138) | $(47,283,578) | (4,647,303) | $(72,795,412) |
(1) | Effective May 29, 2024, Class L Shares liquidated. |
Notes to Financial Statements
Purchases of Securities | Proceeds from Sales of Securities | Purchases of Long- Term U.S. Government Obligations | Proceeds from Sales of Long-Term U.S. Government Obligations |
$736,599,137 | $1,009,243,549 | $- | $- |
Report of Independent Registered Public Accounting Firm
August 22, 2024
Designation Requirements (unaudited)
Section 163(j) Interest Dividend | 4% |
Capital Gain Distributions | $164,627,405 |
Dividends Received Deduction Percentage | 100% |
Qualified Dividend Income Percentage | 100% |
Additional Information (unaudited)
Schedule of Investments
June 30, 2024
Principal Amounts | Value | ||
Certificates of Deposit – 5.1% | |||
Commonwealth Bank of Australia, 5.7000%, 11/27/24 | $15,000,000 | $15,008,388 | |
Mizuho Bank Ltd/New York NY, 5.3500%, 7/12/24 | 15,000,000 | 14,999,701 | |
Royal Bank of Canada, 5.9100%, 8/19/24 | 15,000,000 | 15,005,165 | |
Swedbank AB, 6.0100%, 8/9/24 | 11,500,000 | 11,504,223 | |
Total Certificates of Deposit (cost $56,517,477) | 56,517,477 | ||
Commercial Paper – 32.2% | |||
ANZ New Zealand Int'l Ltd/London, 5.2000%, 7/18/24 | 12,150,000 | 12,119,848 | |
Atlantic Asset Securitization LLC, 5.3700%, 8/1/24± | 20,000,000 | 19,907,152 | |
Atlantic Asset Securitization LLC, 5.3600%, 8/7/24± | 15,000,000 | 14,917,931 | |
Australia & New Zealand Banking Group Ltd, 5.3500%, 8/29/24 | 10,000,000 | 9,912,103 | |
Australia & New Zealand Banking Group Ltd, 5.3400%, 9/6/24 | 15,000,000 | 14,850,547 | |
Australia & New Zealand Banking Group Ltd, 5.3500%, 9/18/24 | 10,000,000 | 9,882,510 | |
Bank of Montreal, 5.3700%, 7/30/24 | 15,000,000 | 14,935,079 | |
Commonwealth Bank of Australia, 5.3400%, 7/29/24 | 7,000,000 | 6,970,853 | |
Gotham Funding Corp, 5.3400%, 7/25/24± | 8,000,000 | 7,971,469 | |
Gotham Funding Corp, 5.3600%, 9/4/24± | 10,000,000 | 9,903,048 | |
Manhattan Asset Funding Co LLC, 5.3700%, 7/2/24± | 15,000,000 | 14,997,749 | |
Manhattan Asset Funding Co LLC, 5.3500%, 7/3/24± | 10,000,000 | 9,997,009 | |
Manhattan Asset Funding Co LLC, 5.3700%, 8/6/24± | 15,000,000 | 14,919,129 | |
Manhattan Asset Funding Co LLC, 5.3600%, 9/10/24± | 10,000,000 | 9,894,123 | |
Mizuho Bank Ltd/New York NY, 5.3700%, 9/3/24 | 15,000,000 | 14,856,521 | |
National Bank of Canada, 5.3000%, 7/10/24 | 15,000,000 | 14,979,961 | |
National Bank of Canada, 5.3500%, 7/22/24 | 5,000,000 | 4,984,342 | |
National Bank of Canada, 5.3800%, 7/31/24 | 15,000,000 | 14,932,446 | |
Nieuw Amsterdam Receivables Corp BV, 5.3400%, 7/12/24± | 15,000,000 | 14,975,512 | |
Skandinaviska Enskilda Banken AB, 5.3100%, 11/5/24 | 15,000,000 | 14,717,606 | |
Societe Generale SA, 5.3800%, 8/1/24 | 20,000,000 | 19,907,108 | |
Svenska Handelsbanken AB, 5.3000%, 10/8/24 | 10,000,000 | 9,853,413 | |
Swedbank AB, 5.2200%, 7/1/24 | 10,000,000 | 10,000,000 | |
Toronto-Dominion Bank/The, 5.3500%, 8/15/24 | 9,000,000 | 8,939,673 | |
Toronto-Dominion Bank/The, 5.3700%, 9/9/24 | 20,000,000 | 19,790,853 | |
Toronto-Dominion Bank/The, 5.3700%, 9/24/24 | 15,000,000 | 14,809,741 | |
Victory Receivables Corp, 5.3900%, 7/12/24 | 10,000,000 | 9,983,445 | |
Victory Receivables Corp, 5.3600%, 9/16/24 | 15,000,000 | 14,827,892 | |
Total Commercial Paper (cost $358,737,063) | 358,737,063 | ||
U.S. Government Agency Notes – 5.4% | |||
Federal Home Loan Bank Discount Notes: | |||
5.2480%, 7/17/24 | 10,000,000 | 9,976,802 | |
5.2000%, 7/19/24 | 10,000,000 | 9,973,816 | |
5.2150%, 7/26/24 | 10,000,000 | 9,963,227 | |
5.2500%, 8/2/24 | 10,000,000 | 9,953,639 | |
5.2360%, 8/21/24 | 10,000,000 | 9,926,072 | |
5.2380%, 9/20/24 | 10,000,000 | 9,882,059 | |
Total U.S. Government Agency Notes (cost $59,675,615) | 59,675,615 | ||
U.S. Treasury Debt – 4.4% | |||
United States Treasury Bill, 5.2310%, 7/25/24 | 10,000,000 | 9,965,584 | |
United States Treasury Bill, 5.2460%, 8/27/24 | 10,000,000 | 9,917,276 | |
United States Treasury Bill, 5.2315%, 9/3/24 | 10,000,000 | 9,907,395 | |
United States Treasury Bill, 5.2375%, 9/17/24 | 10,000,000 | 9,887,363 | |
United States Treasury Bill, 5.2055%, 10/1/24 | 10,000,000 | 9,867,989 | |
Total U.S. Treasury Debt (cost $49,545,607) | 49,545,607 | ||
Variable Rate Demand Notes¶ – 16.1% | |||
Alper Drive Apts LLC (LOC: The Northern Trust Co), 5.4900%, 8/1/61 | 12,600,000 | 12,600,000 | |
Bellevue 10 Apartments LLC (LOC: The Northern Trust Co), 5.4900%, 4/1/60 | 3,450,000 | 3,450,000 | |
Breckenridge Terrace LLC (LOC: Bank of America NA), 5.5400%, 5/2/39 | 14,980,000 | 14,980,000 | |
Breckenridge Terrace LLC (LOC: Bank of America NA), 5.5400%, 5/2/39 | 4,000,000 | 4,000,000 | |
Cellmark Inc (LOC: Swedbank AB, NY), 5.4500%, 6/1/38 | 10,000,000 | 10,000,000 | |
CG-USA Simi Valley LP (LOC: FHLB of San Francisco), 5.4500%, 10/1/60 | 6,900,000 | 6,900,000 | |
CLC Irrevocable Life Insurance Trust/The (LOC: FHLB of Des Moines), 5.4500%, 1/4/49 | 11,110,000 | 11,110,000 |
Schedule of Investments
June 30, 2024
Principal Amounts | Value | ||
Variable Rate Demand Notes¶ – (continued) | |||
County of Eagle CO (LOC: Bank of America NA), 5.5400%, 6/1/27 | $9,100,000 | $9,100,000 | |
County of Eagle CO (LOC: Bank of America NA), 5.5400%, 5/2/39 | 8,000,000 | 8,000,000 | |
Dorfman 2020 Family Trust (LOC: FHLB of Dallas), 5.4500%, 8/1/40 | 5,285,000 | 5,285,000 | |
Drummond Family Life Insurance LLC (LOC: FHLB of Dallas), 5.4500%, 6/1/72 | 14,575,000 | 14,575,000 | |
Encinitas Senior Living LP (LOC: FHLB of San Francisco), 5.4500%, 8/1/59 | 3,370,000 | 3,370,000 | |
Griffin-Spalding County Development Authority (LOC: Bank of America NA), 5.4500%, 8/1/28 | 3,750,000 | 3,750,000 | |
Jefferson Centerpointe LLC (LOC: FHLB of San Francisco), 5.4500%, 12/1/60 | 22,285,000 | 22,285,000 | |
Lodi LV Loca LP (LOC: FHLB of San Francisco), 5.4500%, 8/1/59 | 13,500,000 | 13,500,000 | |
Mississippi Business Finance Corp (LOC: FHLB of Dallas), 5.5100%, 12/1/42 | 8,905,000 | 8,905,000 | |
Phoenix Realty Special Account-U LP (LOC: The Northern Trust Co), 5.6400%, 4/1/25 | 1,675,000 | 1,675,000 | |
Rieber Life Insurance Trust/The (LOC: FHLB of Dallas), 5.4500%, 5/1/42 | 11,645,000 | 11,645,000 | |
Susan D Travers Heritage Trust (LOC: FHLB of Topeka), 5.4500%, 7/1/43 | 8,825,000 | 8,825,000 | |
Tenderfoot Seasonal Housing LLC (LOC: Bank of America NA), 5.5400%, 7/2/35 | 5,700,000 | 5,700,000 | |
Total Variable Rate Demand Notes (cost $179,655,000) | 179,655,000 | ||
Repurchase Agreementsë – 35.3% | |||
Goldman Sachs & Co, Joint repurchase agreement, 5.2200%, dated 6/28/24, maturing 7/1/24 to be repurchased at $95,041,325 collateralized by $96,731,445 in U.S. Government Agencies 2.9957% - 7.8051%, 4/20/46 - 7/16/54 with a value of $96,900,000 | 95,000,000 | 95,000,000 | |
HSBC Securities (USA), Inc, Joint repurchase agreement, 5.2600%, dated 6/28/24, maturing 7/1/24 to be repurchased at $35,015,342 collateralized by $68,334,975 in U.S. Treasuries 0% - 1.6250%, 7/15/25 - 11/15/50 with a value of $35,700,000 | 35,000,000 | 35,000,000 | |
ING Financial Markets LLC, Joint repurchase agreement, 5.3000%, dated 6/28/24, maturing 7/1/24 to be repurchased at $60,026,500 collateralized by $68,332,000 in U.S. Treasuries 0% - 5.3750%, 9/5/24 - 11/15/50 with a value of $61,227,038 | 60,000,000 | 60,000,000 | |
ING Financial Markets LLC, Joint repurchase agreement, 5.3100%, dated 6/28/24, maturing 7/1/24 to be repurchased at $80,035,400 collateralized by $86,568,012 in U.S. Government Agencies 1.5000% - 7.0000%, 1/1/26 - 1/1/57 with a value of $81,636,108 | 80,000,000 | 80,000,000 | |
Royal Bank of Canada, NY Branch, Joint repurchase agreement, 5.2800%, dated 6/28/24, maturing 7/1/24 to be repurchased at $10,004,400 collateralized by $10,158,310 in U.S. Treasuries 4.2500%, 3/15/27 with a value of $10,204,493 | 10,000,000 | 10,000,000 | |
Royal Bank of Canada, NY Branch, Joint repurchase agreement, 5.3000%, dated 6/28/24, maturing 7/1/24 to be repurchased at $112,949,864 collateralized by $42,838,499 in U.S. Government Agencies 4.5000% - 7.5000%, 8/1/37 - 7/20/63 and $72,443,430 in U.S. Treasuries 0.7500% - 4.6250%, 8/31/26 - 3/31/31 with a value of $115,208,877 | 112,900,000 | 112,900,000 | |
Total Repurchase Agreements (cost $392,900,000) | 392,900,000 | ||
Time Deposits – 1.3% | |||
Credit Agricole, 5.3000%, 7/1/24 (cost $15,000,000) | 15,000,000 | 15,000,000 | |
Total Investments (total cost $1,112,030,762) – 99.8% | 1,112,030,762 | ||
Cash, Receivables and Other Assets, net of Liabilities – 0.2% | 1,699,791 | ||
Net Assets – 100% | $1,113,730,553 |
Schedule of Investments
June 30, 2024
Offsetting of Financial Assets and Derivative Assets | ||||
Counterparty | Gross Amounts of Recognized Assets | Offsetting Asset or Liability(a) | Collateral Pledged(b) | Net Amount |
Goldman Sachs & Co | $95,000,000 | $— | $(95,000,000) | $— |
HSBC Securities (USA), Inc | 35,000,000 | — | (35,000,000) | — |
ING Financial Markets LLC | 140,000,000 | — | (140,000,000) | — |
Royal Bank of Canada, NY Branch | 122,900,000 | — | (122,900,000) | — |
Total | $392,900,000 | $— | $(392,900,000) | $— |
(a) | Represents the amount of assets or liabilities that could be offset with the same counterparty under master netting or similar agreements that management elects not to offset on the Statement of Assets and Liabilities. |
(b) | Collateral pledged is limited to the net outstanding amount due to/from an individual counterparty. The actual collateral amounts pledged may exceed these amounts and may fluctuate in value. |
Notes to Schedule of Investments and Other Information
LLC | Limited Liability Company |
LOC | Letter of Credit |
LP | Limited Partnership |
± | Securities sold under Section 4(2) of the Securities Act of 1933, as amended, are subject to legal and/or contractual restrictions on resale and may not be publicly sold without registration under the 1933 Act. Unless otherwise noted, these securities have been determined to be liquid under guidelines established by the Board of Trustees. The total value of 4(2) securities as of the year ended June 30, 2024 is $117,483,122, which represents 10.5% of net assets. |
¶ | Variable rate demand notes are not based on a published reference rate and spread; they are determined by the issuer or remarketing agent and current market conditions. The reference rate in the security description is as of June 30, 2024. |
ë | The Fund may have elements of risk due to concentration of investments. Such concentrations may subject the Fund to additional risks. |
Valuation Inputs Summary | |||
Level 1 - Quoted Prices | Level 2 - Other Significant Observable Inputs | Level 3 - Significant Unobservable Inputs | |
Assets | |||
Investments In Securities: | |||
Certificates of Deposit | $- | $56,517,477 | $- |
Commercial Paper | - | 358,737,063 | - |
U.S. Government Agency Notes | - | 59,675,615 | - |
U.S. Treasury Debt | - | 49,545,607 | - |
Variable Rate Demand Notes | - | 179,655,000 | - |
Repurchase Agreements | - | 392,900,000 | - |
Time Deposits | - | 15,000,000 | - |
Total Assets | $- | $1,112,030,762 | $- |
Statement of Assets and Liabilities
June 30, 2024
Assets: | |
Investments, at value (cost $719,130,762) | $719,130,762 |
Repurchase agreements, at value (cost $392,900,000) | 392,900,000 |
Cash | 203,426 |
Trustees' deferred compensation | 30,583 |
Receivables: | |
Interest | 3,198,766 |
Fund shares sold | 722,765 |
Total Assets | 1,116,186,302 |
Liabilities: | |
Payables: | |
Fund shares repurchased | 1,821,319 |
Administration services fees | 329,923 |
Advisory fees | 183,171 |
Professional fees | 47,396 |
Dividends | 36,824 |
Trustees' deferred compensation fees | 30,583 |
Trustees' fees and expenses | 6,149 |
Accrued expenses and other payables | 384 |
Total Liabilities | 2,455,749 |
Net Assets | $1,113,730,553 |
Net Assets Consist of: | |
Capital (par value and paid-in surplus) | $1,113,745,400 |
Total distributable earnings (loss) | (14,847) |
Total Net Assets | $1,113,730,553 |
Net Assets - Class D Shares | $1,100,809,073 |
Shares Outstanding, $0.01 Par Value (unlimited shares authorized) | 1,100,810,054 |
Net Asset Value Per Share | $1.00 |
Net Assets - Class T Shares | $12,921,480 |
Shares Outstanding, $0.01 Par Value (unlimited shares authorized) | 12,929,547 |
Net Asset Value Per Share | $1.00 |
Statement of Operations
For the year ended June 30, 2024
Investment Income: | |
Interest | $60,703,917 |
Other income | 3,650 |
Total Investment Income | 60,707,567 |
Expenses: | |
Advisory fees | 2,235,932 |
Administration services fees: | |
Class D Shares | 3,977,830 |
Class T Shares | 49,450 |
Professional fees | 60,128 |
Trustees' fees and expenses | 23,786 |
Other expenses | 385 |
Total Expenses | 6,347,511 |
Net Investment Income/(Loss) | 54,360,056 |
Net Realized Gain/(Loss) on Investments: | |
Investments | 3,419 |
Total Net Realized Gain/(Loss) on Investments | 3,419 |
Net Increase/(Decrease) in Net Assets Resulting from Operations | $54,363,475 |
Statements of Changes in Net Assets
Year ended June 30, 2024 | Year ended June 30, 2023 | |
Operations: | ||
Net investment income/(loss) | $54,360,056 | $38,752,612 |
Net realized gain/(loss) on investments | 3,419 | (110) |
Net Increase/(Decrease) in Net Assets Resulting from Operations | 54,363,475 | 38,752,502 |
Dividends and Distributions to Shareholders: | ||
Class D Shares | (53,729,906) | (38,304,476) |
Class T Shares | (630,150) | (471,872) |
Net Decrease from Dividends and Distributions to Shareholders | (54,360,056) | (38,776,348) |
Capital Share Transactions: | ||
Class D Shares | (31,402,525) | (61,835,136) |
Class T Shares | 10,841 | (3,027,737) |
Net Increase/(Decrease) from Capital Share Transactions | (31,391,684) | (64,862,873) |
Net Increase/(Decrease) in Net Assets | (31,388,265) | (64,886,719) |
Net Assets: | ||
Beginning of period | 1,145,118,818 | 1,210,005,537 |
End of period | $1,113,730,553 | $1,145,118,818 |
Financial Highlights
Class D Shares | |||||
For a share outstanding during the year ended June 30 | 2024 | 2023 | 2022 | 2021 | 2020 |
Net Asset Value, Beginning of Period | $1.00 | $1.00 | $1.00 | $1.00 | $1.00 |
Income/(Loss) from Investment Operations: | |||||
Net investment income/(loss)(1) | 0.05 | 0.03 | — (2) | — (2) | 0.01 |
Net realized and unrealized gain/(loss)(2) | — | — | — | — | — |
Total from Investment Operations | 0.05 | 0.03 | — | — | 0.01 |
Less Dividends and Distributions: | |||||
Dividends (from net investment income) | (0.05) | (0.03) | — (2) | — (2) | (0.01) |
Distributions (from capital gains) | — | — (2) | — | — | — |
Total Dividends and Distributions | (0.05) | (0.03) | — | — | (0.01) |
Net Asset Value, End of Period | $1.00 | $1.00 | $1.00 | $1.00 | $1.00 |
Total Return* | 4.94% | 3.36% | 0.00% | 0.00% | 1.05% |
Net Assets, End of Period (in thousands) | $1,100,809 | $1,132,208 | $1,194,067 | $1,149,942 | $1,155,176 |
Ratios to Average Net Assets**: | |||||
Ratio of Gross Expenses | 0.56% | 0.57% | 0.57% | 0.57% | 0.62% |
Ratio of Net Expenses (After Waivers and Expense Offsets) | 0.56% | 0.57% | 0.28% | 0.13% | 0.53% |
Ratio of Net Investment Income/(Loss) | 4.84% | 3.30% | 0.00% (3) | 0.00% (3) | 0.98% |
* | Total return includes adjustments in accordance with generally accepted accounting principles required at the year or period end and are not annualized for periods of less than one full year. |
** | Annualized for periods of less than one full year. |
(1) | Per share amounts are calculated based on average shares outstanding during the year or period. |
(2) | Less than $0.005 on a per share basis. |
(3) | Less than 0.005%. |
Financial Highlights
Class T Shares | |||||
For a share outstanding during the year ended June 30 | 2024 | 2023 | 2022 | 2021 | 2020 |
Net Asset Value, Beginning of Period | $1.00 | $1.00 | $1.00 | $1.00 | $1.00 |
Income/(Loss) from Investment Operations: | |||||
Net investment income/(loss)(1) | 0.05 | 0.03 | — (2) | — (2) | 0.01 |
Net realized and unrealized gain/(loss)(2) | — | — | — | — | — |
Total from Investment Operations | 0.05 | 0.03 | — | — | 0.01 |
Less Dividends and Distributions: | |||||
Dividends (from net investment income) | (0.05) | (0.03) | — (2) | — (2) | (0.01) |
Distributions (from capital gains) | — | — (2) | — | — | — |
Total Dividends and Distributions | (0.05) | (0.03) | — | — | (0.01) |
Net Asset Value, End of Period | $1.00 | $1.00 | $1.00 | $1.00 | $1.00 |
Total Return* | 4.92% | 3.34% | 0.00% | 0.00% | 1.03% |
Net Assets, End of Period (in thousands) | $12,921 | $12,911 | $15,939 | $15,795 | $13,158 |
Ratios to Average Net Assets**: | |||||
Ratio of Gross Expenses | 0.58% | 0.59% | 0.58% | 0.59% | 0.65% |
Ratio of Net Expenses (After Waivers and Expense Offsets) | 0.58% | 0.59% | 0.28% | 0.13% | 0.55% |
Ratio of Net Investment Income/(Loss) | 4.82% | 3.25% | 0.00% (3) | 0.00% (3) | 1.02% |
* | Total return includes adjustments in accordance with generally accepted accounting principles required at the year or period end and are not annualized for periods of less than one full year. |
** | Annualized for periods of less than one full year. |
(1) | Per share amounts are calculated based on average shares outstanding during the year or period. |
(2) | Less than $0.005 on a per share basis. |
(3) | Less than 0.005%. |
Notes to Financial Statements
Undistributed Ordinary Income | Undistributed Long-Term Gains | Accumulated Capital Losses | Loss Deferrals | Other Book to Tax Differences | Net Tax Appreciation/ (Depreciation) |
$11,114 | $- | $- | $- | $(25,961) | $- |
For the year ended June 30, 2024 | |||
Distributions | |||
From Ordinary Income | From Long-Term Capital Gains | Tax Return of Capital | Net Investment Loss |
$54,360,056 | $- | $- | $- |
For the year ended June 30, 2023 | |||
Distributions | |||
From Ordinary Income | From Long-Term Capital Gains | Tax Return of Capital | Net Investment Loss |
$38,758,420 | $17,928 | $- | $- |
Notes to Financial Statements
Year ended June 30, 2024 | Year ended June 30, 2023 | |||
Shares | Amount | Shares | Amount | |
Class D Shares: | ||||
Shares sold | 379,867,437 | $379,877,673 | 390,659,510 | $390,661,189 |
Reinvested dividends and distributions | 52,735,583 | 52,735,583 | 37,664,610 | 37,664,610 |
Shares repurchased | (464,015,780) | (464,015,781) | (490,160,934) | (490,160,935) |
Net Increase/(Decrease) | (31,412,760) | $(31,402,525) | (61,836,814) | $(61,835,136) |
Class T Shares: | ||||
Shares sold | 19,873,819 | $19,873,818 | 23,339,683 | $23,339,704 |
Reinvested dividends and distributions | 621,721 | 621,721 | 471,765 | 471,765 |
Shares repurchased | (20,484,698) | (20,484,698) | (26,839,205) | (26,839,206) |
Net Increase/(Decrease) | 10,842 | $10,841 | (3,027,757) | $(3,027,737) |
Report of Independent Registered Public Accounting Firm
August 22, 2024
Designation Requirements (unaudited)
Section 163(j) Interest Dividend | 100% |
Additional Information (unaudited)
June 30, 2024
Schedule of Investments
June 30, 2024
Shares or Principal Amounts | Value | ||
Asset-Backed/Commercial Mortgage-Backed Securities – 55.7% | |||
Aaset 2019-2 Trust, 6.4130%, 10/16/39ž | $4,723,808 | $1,346,267 | |
ACC Auto Trust 2021-A C, 3.7900%, 4/15/27ž | 1,633,511 | 1,631,570 | |
ACC Auto Trust 2021-A D, 6.1000%, 6/15/29ž | 3,700,000 | 3,662,048 | |
ACHV Trust 2023-1PL D, 8.4700%, 3/18/30ž | 2,750,000 | 2,803,288 | |
Affirm Asset Securitization Trust 2024-A 1E, 9.1700%, 2/15/29ž | 4,000,000 | 4,014,105 | |
AGL CLO 1 Ltd 2021-10A D, CME Term SOFR 3 Month + 3.1616%, 8.4902%, 4/17/34ž,‡ | 8,000,000 | 8,020,672 | |
Alaska Airlines 2020-1 Class A Pass Through Trust, 4.8000%, 8/15/27ž | 5,960,415 | 5,844,699 | |
Ally Bank Auto Credit-Linked Notes 2024-A E, 7.9170%, 5/17/32ž | 2,750,000 | 2,749,023 | |
Ally Bank Auto Credit-Linked Notes 2024-A G, 12.7480%, 5/17/32ž | 4,900,000 | 4,898,677 | |
Angel Oak Mortgage Trust I LLC 2024-3 A3, 4.8000%, 11/26/68ž,Ç | 4,991,949 | 4,772,464 | |
Auxilior Term Funding LLC 2023-1A E, 10.9700%, 12/15/32ž | 2,550,000 | 2,557,326 | |
Avis Budget Rental Car Funding AESOP LLC 2019-2A D, 3.0400%, 9/22/25ž | 2,500,000 | 2,479,593 | |
Avis Budget Rental Car Funding AESOP LLC 2021-1A D, 3.7100%, 8/20/27ž | 6,000,000 | 5,399,620 | |
AXIS Equipment Finance Receivables 2024-1A E, 9.6600%, 4/20/32ž | 2,875,000 | 2,879,512 | |
AXIS Equipment Finance Receivables LLC 2024-1A D, 6.5700%, 4/21/31ž | 2,875,000 | 2,832,856 | |
Bain Capital Credit CLO Ltd 2021-4A D, CME Term SOFR 3 Month + 3.3616%, 8.6862%, 10/20/34ž,‡ | 5,000,000 | 4,945,495 | |
BAMLL Commercial Mortgage Securities Trust 2024-FRR2 D, 1.2571%, 7/27/50ž,‡ | 6,330,000 | 4,706,421 | |
BAMLL Commercial Mortgage Securities Trust 2024-FRR2 E, 1.2731%, 7/27/50ž,‡ | 10,755,758 | 7,505,299 | |
BAMLL Commercial Mortgage Securities Trust 2024-FRR3 D, 0.5906%, 1/27/50ž,‡ | 2,505,000 | 2,041,898 | |
BAMLL Commercial Mortgage Securities Trust 2024-FRR3 E, 0.5069%, 1/27/50ž,‡ | 3,776,872 | 2,995,194 | |
Bayview Opportunity Master Fund VII 2024-CAR1 E, US 30 Day Average SOFR + 3.6000%, 8.9354%, 12/26/31ž,‡ | 1,570,011 | 1,569,997 | |
Bayview Opportunity Master Fund VII 2024-EDU1 C, US 30 Day Average SOFR + 1.8000%, 7.1354%, 6/25/47ž,‡ | 3,086,073 | 3,097,402 | |
Bayview Opportunity Master Fund VII 2024-EDU1 D, US 30 Day Average SOFR + 2.7500%, 8.0854%, 6/25/47ž,‡ | 1,234,429 | 1,247,839 | |
BB-UBS Trust 2012-SHOW A, 3.4302%, 11/5/36ž | 4,563,000 | 4,464,759 | |
Benefit Street Partners CLO Ltd 2016-10A CRR, CME Term SOFR 3 Month + 3.7616%, 9.0862%, 4/20/34ž,‡ | 6,750,000 | 6,768,387 | |
Blue Bridge Funding LLC 2023-1A B, 9.4800%, 11/15/30ž | 2,800,000 | 2,801,416 | |
Blue Bridge Funding LLC 2023-1A C, 9.5000%, 11/15/30ž | 2,800,000 | 2,569,577 | |
Blue Bridge Funding LLC 2023-1A D, 15.0000%, 11/15/30ž | 1,743,000 | 1,692,067 | |
BlueMountain CLO XXVI Ltd 2019-25A D2R, CME Term SOFR 3 Month + 4.4116%, 9.7402%, 7/15/36ž,‡ | 6,250,000 | 6,220,162 | |
BlueMountain CLO XXVI Ltd 2021-28A A, CME Term SOFR 3 Month + 1.5216%, 6.8502%, 4/17/34ž,‡ | 5,000,000 | 5,008,905 | |
BPR Trust 2023-BRK2 A, 7.1465%, 10/5/38ž,‡ | 13,809,000 | 14,317,908 | |
Brean Asset Backed Securities Trust 2024-RM8 A2, 4.5000%, 5/25/64ž | 12,014,881 | 10,448,946 | |
Business Jet Securities LLC 2021-1A B, 2.9180%, 4/15/36ž | 1,291,922 | 1,222,148 | |
Business Jet Securities LLC 2021-1A C, 5.0670%, 4/15/36ž | 892,875 | 869,509 | |
Business Jet Securities LLC 2022-1A C, 6.4130%, 6/15/37ž | 2,696,976 | 2,617,766 | |
Business Jet Securities LLC 2024-1A B, 6.9240%, 5/15/39ž | 1,361,247 | 1,382,072 | |
Business Jet Securities LLC 2024-1A C, 9.1320%, 5/15/39ž | 5,376,646 | 5,448,817 | |
BX Commercial Mortgage Trust 2019-MMP D, CME Term SOFR 1 Month + 1.6440%, 6.9730%, 8/15/36ž,‡ | 3,482,573 | 3,376,702 | |
BX Commercial Mortgage Trust 2019-MMP F, CME Term SOFR 1 Month + 2.8361%, 8.1531%, 8/15/36ž,‡ | 13,930,290 | 13,243,732 | |
BX Commercial Mortgage Trust 2021-ARIA E, CME Term SOFR 1 Month + 2.3590%, 7.6880%, 10/15/36ž,‡ | 10,000,000 | 9,816,287 | |
BX Commercial Mortgage Trust 2021-ARIA F, CME Term SOFR 1 Month + 2.7080%, 8.0370%, 10/15/36ž,‡ | 10,000,000 | 9,799,947 | |
BX Commercial Mortgage Trust 2021-BXMF G, CME Term SOFR 1 Month + 3.4640%, 8.7930%, 10/15/26ž,‡ | 13,859,896 | 13,137,505 |
Schedule of Investments
June 30, 2024
Shares or Principal Amounts | Value | ||
Asset-Backed/Commercial Mortgage-Backed Securities – (continued) | |||
BX Commercial Mortgage Trust 2021-SOAR G, CME Term SOFR 1 Month + 2.9145%, 8.2435%, 6/15/38ž,‡ | $6,224,838 | $6,108,663 | |
BX Commercial Mortgage Trust 2021-SOAR J, CME Term SOFR 1 Month + 3.8645%, 9.1935%, 6/15/38ž,‡ | 8,152,785 | 7,805,779 | |
BX Commercial Mortgage Trust 2021-VINO E, CME Term SOFR 1 Month + 2.0668%, 7.3958%, 5/15/38ž,‡ | 2,009,290 | 1,979,268 | |
BX Commercial Mortgage Trust 2021-VINO G, CME Term SOFR 1 Month + 4.0668%, 9.3958%, 5/15/38ž,‡ | 8,651,409 | 8,479,672 | |
BX Commercial Mortgage Trust 2021-VOLT F, CME Term SOFR 1 Month + 2.5145%, 7.8433%, 9/15/36ž,‡ | 8,440,000 | 8,325,581 | |
BX Commercial Mortgage Trust 2021-VOLT G, CME Term SOFR 1 Month + 2.9645%, 8.2933%, 9/15/36ž,‡ | 6,000,000 | 5,941,165 | |
BX Commercial Mortgage Trust 2022-FOX2 A2, CME Term SOFR 1 Month + 0.7492%, 6.0780%, 4/15/39ž,‡ | 8,007,575 | 7,879,990 | |
BX Commercial Mortgage Trust 2024-VLT4 E, CME Term SOFR 1 Month + 2.8894%, 8.2094%, 7/16/29ž,‡ | 4,000,000 | 3,982,015 | |
BX Commercial Mortgage Trust 2024-VLT4 F, CME Term SOFR 1 Month + 3.9379%, 9.2579%, 7/16/29ž,‡ | 8,250,000 | 8,177,134 | |
BX Commercial Mortgage Trust 2024-WPT B, CME Term SOFR 1 Month + 1.8908%, 7.2196%, 3/15/34ž,‡ | 9,700,000 | 9,653,875 | |
BXHPP Trust 2021-FILM B, CME Term SOFR 1 Month + 1.0145%, 6.3435%, 8/15/36ž,‡ | 12,698,000 | 12,091,543 | |
BXHPP Trust 2021-FILM E, CME Term SOFR 1 Month + 2.1145%, 7.4435%, 8/15/36ž,‡ | 2,053,000 | 1,855,581 | |
CALI Mortgage Trust 2019-101C B, 4.1580%, 3/10/39ž | 8,311,000 | 6,835,033 | |
Carlyle Global Markets Strategies 2021-11A A2R, CME Term SOFR 3 Month + 1.6100%, 0%, 7/27/37ž,‡ | 13,500,000 | 13,383,900 | |
Carlyle Global Markets Strategies 2022-2A C, CME Term SOFR 3 Month + 3.5500%, 8.8746%, 4/20/35ž,‡ | 5,000,000 | 5,013,955 | |
Carlyle Global Markets Strategies 2023-4A D, CME Term SOFR 3 Month + 4.1000%, 9.4236%, 10/27/36ž,‡ | 5,250,000 | 5,324,723 | |
CarMax Auto Owner Trust 2022-3 D, 6.2000%, 1/16/29 | 6,250,000 | 6,267,189 | |
Carvana Auto Receivables Trust 2021-N3 E, 3.1600%, 6/12/28ž | 12,890,000 | 12,175,423 | |
Carvana Auto Receivables Trust 2023-P5 N, 8.0200%, 12/10/30ž | 80,106 | 80,111 | |
Castlelake Aircraft Securitization Trust 2018-1, 6.6250%, 6/15/43ž | 3,830,196 | 1,110,765 | |
CBAM CLO Management 2021-14A A, CME Term SOFR 3 Month + 1.3616%, 6.6862%, 4/20/34ž,‡ | 60,000,000 | 60,053,700 | |
CENT Trust 2023-CITY A, CME Term SOFR 1 Month + 2.6200%, 7.9488%, 9/15/38ž,‡ | 6,529,000 | 6,557,612 | |
CF Hippolyta Issuer LLC 2020-1 B1, 2.2800%, 7/15/60ž | 918,341 | 857,468 | |
CF Hippolyta Issuer LLC 2022-1A A1, 5.9700%, 8/15/62ž | 23,189,260 | 22,867,356 | |
CF Hippolyta Issuer LLC 2022-1A A2, 6.1100%, 8/15/62ž | 21,702,067 | 21,209,177 | |
Chase Auto Credit Linked Note 2021-3 E, 2.1020%, 2/26/29ž | 327,280 | 320,063 | |
Chase Auto Credit Linked Notes 2021-1 E, 2.3650%, 9/25/28ž | 60,752 | 60,506 | |
Chase Auto Credit Linked Notes 2021-1 F, 4.2800%, 9/25/28ž | 3,337,000 | 3,320,507 | |
Chase Auto Credit Linked Notes 2021-2 G, 8.4820%, 12/26/28ž | 1,950,000 | 1,975,839 | |
Chase Mortgage Finance Corp 2021-CL1 M1, US 30 Day Average SOFR + 1.2000%, 6.5354%, 2/25/50ž,‡ | 1,383,256 | 1,334,680 | |
Chase Mortgage Finance Corp 2021-CL1 M4, US 30 Day Average SOFR + 2.6500%, 7.9854%, 2/25/50ž,‡ | 2,239,215 | 2,081,538 | |
Chase Mortgage Finance Corp 2021-CL1 M5, US 30 Day Average SOFR + 3.2500%, 8.5854%, 2/25/50ž,‡ | 895,797 | 814,942 | |
CIM Trust 2021-NR1 A1, 5.5690%, 7/25/55ž,Ç | 2,536,884 | 2,501,932 | |
Citigroup Commercial Mortgage Trust 2018-C5, 0.8260%, 6/10/51‡,¤ | 32,266,958 | 737,503 | |
Citigroup Commercial Mortgage Trust 2021-PRM2 E, CME Term SOFR 1 Month + 2.5145%, 7.8435%, 10/15/38ž,‡ | 2,000,000 | 1,956,492 | |
Citigroup Commercial Mortgage Trust 2021-PRM2 F, CME Term SOFR 1 Month + 3.8645%, 9.1935%, 10/15/38ž,‡ | 6,000,000 | 5,925,589 | |
Citigroup Commercial Mortgage Trust 2021-PRM2 G, CME Term SOFR 1 Month + 4.6145%, 9.9435%, 10/15/38ž,‡ | 6,000,000 | 5,952,441 |
Schedule of Investments
June 30, 2024
Shares or Principal Amounts | Value | ||
Asset-Backed/Commercial Mortgage-Backed Securities – (continued) | |||
Citigroup Commercial Mortgage Trust 2021-PRM2 J, CME Term SOFR 1 Month + 5.5145%, 10.8435%, 10/15/36ž,‡ | $6,000,000 | $5,864,795 | |
Coinstar Funding LLC 2017-1A A2, 5.2160%, 4/25/47ž | 12,541,050 | 11,090,264 | |
Cold Storage Trust 2020-ICE5 F, CME Term SOFR 1 Month + 3.6070%, 8.9270%, 11/16/37ž,‡ | 12,828,026 | 12,791,822 | |
Cologix Data Centers Issuer LLC 2022-1CAN A2, 4.9400%, 1/25/52ž | 5,000,000 | CAD | 3,413,078 |
COLT Funding LLC 2021-3R B1, 3.5630%, 12/25/64ž,‡ | 2,547,000 | 1,827,419 | |
COMM Mortgage Trust 2024-WCL1 A, CME Term SOFR 1 Month + 1.8410%, 7.1410%, 6/17/41ž,‡ | 15,000,000 | 14,928,063 | |
COMM Mortgage Trust 2024-WCL1 C, CME Term SOFR 1 Month + 2.8890%, 8.1890%, 6/17/41ž,‡ | 3,750,000 | 3,753,581 | |
COMM Mortgage Trust 2024-WCL1 D, CME Term SOFR 1 Month + 3.2890%, 8.5890%, 6/17/41ž,‡ | 11,250,000 | 11,100,742 | |
Commercial Mortgage Pass-through Certificate 2022-LPF2 E, CME Term SOFR 1 Month + 5.9400%, 11.2688%, 10/15/39ž,‡ | 3,827,000 | 3,807,214 | |
Commercial Mortgage Pass-through Certificates 2022-LPF2 D, CME Term SOFR 1 Month + 4.1920%, 9.5088%, 10/15/39ž,‡ | 5,000,000 | 4,815,559 | |
Connecticut Avenue Securities Trust 2019-R03 1B1, US 30 Day Average SOFR + 4.2145%, 9.5498%, 9/25/31ž,‡ | 14,024,902 | 14,846,585 | |
Connecticut Avenue Securities Trust 2019-R04 2B1, US 30 Day Average SOFR + 5.3645%, 10.6998%, 6/27/39ž,‡ | 4,358,404 | 4,629,448 | |
Connecticut Avenue Securities Trust 2019-R05, US 30 Day Average SOFR + 4.2145%, 9.5498%, 7/25/39ž,‡ | 6,907,891 | 7,201,357 | |
Connecticut Avenue Securities Trust 2021-R01 1B1, US 30 Day Average SOFR + 3.1000%, 8.4354%, 10/25/41ž,‡ | 23,737,621 | 24,430,739 | |
Connecticut Avenue Securities Trust 2021-R02 2B1, US 30 Day Average SOFR + 3.3000%, 8.6354%, 11/25/41ž,‡ | 8,750,000 | 9,051,533 | |
Connecticut Avenue Securities Trust 2021-R02 2M2, US 30 Day Average SOFR + 2.0000%, 7.3354%, 11/25/41ž,‡ | 16,305,770 | 16,405,375 | |
Connecticut Avenue Securities Trust 2021-R03 1B1, US 30 Day Average SOFR + 2.7500%, 8.0854%, 12/25/41ž,‡ | 3,442,000 | 3,500,400 | |
Connecticut Avenue Securities Trust 2022-R01 1B1, US 30 Day Average SOFR + 3.1500%, 8.4854%, 12/25/41ž,‡ | 13,477,000 | 13,847,289 | |
Connecticut Avenue Securities Trust 2022-R02 2B1, US 30 Day Average SOFR + 4.5000%, 9.8354%, 1/27/42ž,‡ | 17,053,000 | 17,902,806 | |
Connecticut Avenue Securities Trust 2023-R06 1M2, US 30 Day Average SOFR + 2.7000%, 8.0354%, 7/27/43ž,‡ | 4,061,000 | 4,218,210 | |
Connecticut Avenue Securities Trust 2024-R01 1B1, US 30 Day Average SOFR + 2.7000%, 8.0354%, 1/25/44ž,‡ | 14,329,655 | 14,519,358 | |
Connecticut Avenue Securities Trust 2024-R02 1B1, US 30 Day Average SOFR + 2.5000%, 7.8354%, 2/25/44ž,‡ | 1,939,358 | 1,974,194 | |
Connecticut Avenue Securities Trust 2024-R03 2B1, US 30 Day Average SOFR + 2.8000%, 8.1350%, 3/25/44ž,‡ | 8,290,000 | 8,337,606 | |
Connecticut Avenue Securities Trust 2024-R04 1B1, US 30 Day Average SOFR + 2.2000%, 7.5237%, 5/25/44ž,‡ | 4,590,000 | 4,596,266 | |
CPF IV LLC / CP EF Asset Securitization LLC 2023-1A B, 7.7700%, 3/15/32ž | 6,524,000 | 6,657,193 | |
CPF IV LLC / CP EF Asset Securitization LLC 2023-1A C, 7.5600%, 3/15/32ž | 5,750,000 | 5,406,145 | |
CSAIL Commercial Mortgage Trust 2021-C20 XA, 1.1162%, 3/15/54‡,¤ | 58,380,577 | 2,713,188 | |
DBGS Mortgage Trust 2018-BIOD F, CME Term SOFR 1 Month + 2.2960%, 7.6130%, 5/15/35ž,‡ | 1,917,074 | 1,890,105 | |
DC Commercial Mortgage Trust 2023-DC D, 7.3785%, 9/12/40ž,‡ | 10,000,000 | 9,928,205 | |
Diamond Infrastructure Funding LLC 2021-1A B, 2.3550%, 4/15/49ž | 4,000,000 | 3,612,281 | |
Diamond Infrastructure Funding LLC 2021-1A C, 3.4750%, 4/15/49ž | 3,420,000 | 3,080,196 | |
Diamond Issuer LLC 2021-1A C, 3.7870%, 11/20/51ž | 5,000,000 | 4,239,413 | |
Diamond Resorts Owner Trust 2021-1A D, 3.8300%, 11/21/33ž | 346,470 | 329,542 | |
DROP Mortgage Trust 2021-FILE A, CME Term SOFR 1 Month + 1.2645%, 6.5935%, 10/15/43ž,‡ | 2,650,000 | 2,530,606 | |
DROP Mortgage Trust 2021-FILE D, CME Term SOFR 1 Month + 2.8645%, 8.1935%, 10/15/43ž,‡ | 15,000,000 | 11,873,402 |
Schedule of Investments
June 30, 2024
Shares or Principal Amounts | Value | ||
Asset-Backed/Commercial Mortgage-Backed Securities – (continued) | |||
Dryden Senior Loan Fund 2016-42A A2RR, CME Term SOFR 3 Month + 1.6500%, 6.9790%, 7/15/37ž,‡ | $12,250,000 | $12,256,468 | |
Dryden Senior Loan Fund 2023-105A D, CME Term SOFR 3 Month + 5.2000%, 10.5269%, 4/18/36ž,‡ | 6,000,000 | 6,078,702 | |
ECAF I Ltd, 5.8020%, 6/15/40ž | 3,163,638 | 964,948 | |
Enva LLC 2024-A A, 7.4300%, 10/21/30ž | 5,677,000 | 5,676,872 | |
Exeter Automobile Receivables Trust 2020-2A E, 7.1900%, 9/15/27ž | 6,794,000 | 6,812,966 | |
Exeter Automobile Receivables Trust 2023-1A E, 12.0700%, 9/16/30ž | 3,000,000 | 3,297,796 | |
Exeter Automobile Receivables Trust 2024-1A E, 7.8900%, 8/15/31ž | 10,250,000 | 10,308,987 | |
Extended Stay America Trust 2021-ESH E, CME Term SOFR 1 Month + 2.9645%, 8.2935%, 7/15/38ž,‡ | 4,802,233 | 4,796,098 | |
Extended Stay America Trust 2021-ESH F, CME Term SOFR 1 Month + 3.8145%, 9.1435%, 7/15/38ž,‡ | 9,972,122 | 9,940,184 | |
ExteNet Issuer LLC, 5.2190%, 7/25/49ž | 9,090,000 | 9,058,268 | |
Fannie Mae 2020-100 BI, 2.0000%, 1/25/51¤ | 13,170,528 | 1,741,013 | |
Fannie Mae 2023-2 DI, 2.0000%, 5/25/51¤ | 71,461,590 | 9,570,465 | |
Fannie Mae REMICS, US 30 Day Average SOFR + 53.7407%, 0%, 10/25/40‡ | 588,203 | 737,124 | |
Fannie Mae REMICS, 3.0000%, 5/25/48 | 12,754 | 11,348 | |
Fannie Mae REMICS, US 30 Day Average SOFR + 5.9355%, 0.6002%, 8/25/48‡,¤ | 6,122,321 | 607,206 | |
Flagship Credit Auto Trust 2022-4 E, 12.6600%, 1/15/30ž | 5,000,000 | 5,297,082 | |
Flagship Credit Auto Trust 2023-1 E, 11.4400%, 4/15/30ž | 8,000,000 | 8,753,982 | |
Flagship Credit Auto Trust 2023-3 E, 9.7400%, 6/17/30ž | 3,250,000 | 3,436,923 | |
Flagstar Mortgage Trust 2021-13IN A17, 3.0000%, 12/30/51ž,‡ | 14,559,769 | 11,918,866 | |
Foundation Finance Trust 2023-2A D, 9.1000%, 6/15/49ž | 3,000,000 | 3,120,958 | |
Freddie Mac Multifamily Structured Credit Risk 2021-MN3 M2, US 30 Day Average SOFR + 4.0000%, 9.3354%, 11/27/51ž,‡ | 10,000,000 | 10,136,971 | |
Freddie Mac Structured Agency Credit Risk Debt Notes 2020-HQA4 B1, US 30 Day Average SOFR + 5.3645%, 10.6998%, 9/26/50ž,‡ | 7,301,902 | 8,112,329 | |
Freddie Mac Structured Agency Credit Risk Debt Notes 2020-HQA5 B1, US 30 Day Average SOFR + 4.0000%, 9.3354%, 11/25/50ž,‡ | 5,551,430 | 6,241,884 | |
Freddie Mac Structured Agency Credit Risk Debt Notes 2021-DNA1 B1, US 30 Day Average SOFR + 2.6500%, 7.9854%, 1/25/51ž,‡ | 7,550,000 | 8,001,619 | |
Freddie Mac Structured Agency Credit Risk Debt Notes 2021-DNA2 B2, US 30 Day Average SOFR + 6.0000%, 11.3354%, 8/25/33ž,‡ | 12,308,000 | 14,415,120 | |
Freddie Mac Structured Agency Credit Risk Debt Notes 2021-DNA3 B2, US 30 Day Average SOFR + 6.2500%, 11.5854%, 10/25/33ž,‡ | 20,836,000 | 24,630,363 | |
Freddie Mac Structured Agency Credit Risk Debt Notes 2021-DNA5 B1, US 30 Day Average SOFR + 3.0500%, 8.3854%, 1/25/34ž,‡ | 6,624,000 | 7,004,865 | |
Freddie Mac Structured Agency Credit Risk Debt Notes 2021-DNA6 B1, US 30 Day Average SOFR + 3.4000%, 8.7354%, 10/25/41ž,‡ | 14,440,000 | 14,958,102 | |
Freddie Mac Structured Agency Credit Risk Debt Notes 2021-DNA6 M2, US 30 Day Average SOFR + 1.5000%, 6.8354%, 10/25/41ž,‡ | 11,136,879 | 11,175,282 | |
Freddie Mac Structured Agency Credit Risk Debt Notes 2021-DNA7 B1, US 30 Day Average SOFR + 3.6500%, 8.9854%, 11/25/41ž,‡ | 29,197,208 | 30,410,130 | |
Freddie Mac Structured Agency Credit Risk Debt Notes 2021-HQA3 B1, US 30 Day Average SOFR + 3.3500%, 8.6854%, 9/25/41ž,‡ | 4,734,000 | 4,853,770 | |
Freddie Mac Structured Agency Credit Risk Debt Notes 2021-HQA3 M2, US 30 Day Average SOFR + 2.1000%, 7.4354%, 9/25/41ž,‡ | 29,152,135 | 29,316,845 | |
Freddie Mac Structured Agency Credit Risk Debt Notes 2021-HQA4 B1, US 30 Day Average SOFR + 3.7500%, 9.0854%, 12/25/41ž,‡ | 27,058,500 | 27,875,177 | |
Freddie Mac Structured Agency Credit Risk Debt Notes 2023-HQA3 M2, US 30 Day Average SOFR + 3.3500%, 8.6854%, 11/25/43ž,‡ | 7,490,866 | 7,916,323 | |
Freddiemac Strip 375 C1, 2.5000%, 1/25/51¤ | 123,786,715 | 19,027,305 | |
Freddiemac Strip 377 C1, 2.0000%, 1/25/51¤ | 30,563,238 | 3,869,639 | |
Freddiemac Strip 377 C4, 2.0000%, 1/25/51¤ | 28,431,688 | 3,762,095 | |
FREMF Mortgage Trust 2017-K729 D, 0%, 11/25/49ž,◊ | 29,422,405 | 28,135,257 | |
FREMF Mortgage Trust 2017-K729 X2A, 0.1000%, 11/25/49ž,¤ | 220,372,404 | 37,415 | |
FREMF Mortgage Trust 2017-K729 X2B, 0.1000%, 11/25/49ž,¤ | 74,013,744 | 20,815 |
Schedule of Investments
June 30, 2024
Shares or Principal Amounts | Value | ||
Asset-Backed/Commercial Mortgage-Backed Securities – (continued) | |||
FREMF Mortgage Trust 2018-KF45, US 30 Day Average SOFR + 2.0645%, 7.3888%, 3/25/25ž,‡ | $297,760 | $291,520 | |
FREMF Mortgage Trust 2018-KSW4 C, US 30 Day Average SOFR + 5.1145%, 10.4388%, 10/25/28‡ | 18,042,207 | 15,923,796 | |
FREMF Mortgage Trust 2019-KF70 C, US 30 Day Average SOFR + 6.1145%, 11.4388%, 9/25/29ž,‡ | 13,927,767 | 13,550,521 | |
FREMF Mortgage Trust 2019-KF72, US 30 Day Average SOFR + 2.2145%, 7.5388%, 11/25/26ž,‡ | 2,679,587 | 2,610,320 | |
FREMF Mortgage Trust 2021-KF98 CS, US 30 Day Average SOFR + 8.5000%, 13.8243%, 12/25/30ž,‡ | 3,698,111 | 3,661,106 | |
FS Commercial Mortgage Trust 2023-4SZN D, 9.3828%, 11/10/39ž,‡ | 4,250,000 | 4,404,692 | |
Gam Resecuritization Trust 2021-FRR2 BK74, 0%, 9/27/51ž,◊ | 11,000,000 | 7,771,280 | |
Gam Resecuritization Trust 2021-FRR2 CK74, 0%, 9/27/51ž,◊ | 18,068,494 | 12,566,872 | |
GCAT 2022-INV1 A26, 3.0000%, 12/25/51ž,‡ | 15,822,086 | 12,986,238 | |
GLS Auto Select Receivables Trust 2024-1A D, 6.4300%, 1/15/31ž | 2,000,000 | 2,009,714 | |
Government National Mortgage Association, CME Term SOFR 1 Month + 5.4355%, 0.0969%, 1/20/44‡,¤ | 311,449 | 22,082 | |
Government National Mortgage Association, CME Term SOFR 1 Month + 6.0355%, 0.7067%, 10/16/55‡,¤ | 469,097 | 31,518 | |
Government National Mortgage Association, 0.2528%, 1/16/60‡,¤ | 10,166,734 | 236,934 | |
Gracie Point International Funding 2023-1A B, US 90 Day Average SOFR + 2.6000%, 7.9493%, 9/1/26ž,‡ | 3,000,000 | 3,042,472 | |
Gracie Point International Funding 2023-1A C, US 90 Day Average SOFR + 3.1000%, 8.4493%, 9/1/26ž,‡ | 3,000,000 | 3,037,394 | |
Gracie Point International Funding 2023-2A B, US 90 Day Average SOFR + 4.0000%, 9.3493%, 3/1/27ž,‡ | 7,438,000 | 7,549,855 | |
Gracie Point International Funding 2023-2A C, US 90 Day Average SOFR + 5.4000%, 10.7493%, 3/1/27ž,‡ | 5,000,000 | 5,034,532 | |
Gracie Point International Funding 2024-1A C, US 90 Day Average SOFR + 3.5000%, 8.8496%, 3/1/28ž,‡ | 4,400,000 | 4,425,882 | |
Gracie Point International Funding 2024-1A D, US 90 Day Average SOFR + 7.1500%, 12.4996%, 3/1/28ž,‡ | 2,700,000 | 2,703,554 | |
GS Mortgage Securities Trust 2017-SLP G, 4.7443%, 10/10/32ž,‡ | 8,331,000 | 7,583,627 | |
Hertz Vehicle Financing LLC 2021-1A D, 3.9800%, 12/26/25ž | 18,100,000 | 17,850,922 | |
Hertz Vehicle Financing LLC 2021-2A D, 4.3400%, 12/27/27ž | 9,500,000 | 8,520,372 | |
Hilton Grand Vacations Trust 2022-1D D, 6.7900%, 6/20/34ž | 1,381,290 | 1,376,426 | |
Home Partners of America Trust 2021-3 F, 4.2420%, 1/17/41ž | 4,562,314 | 3,893,523 | |
Homeward Opportunities Fund I Trust 2024-RTL1 A2, 8.5700%, 7/25/29ž | 4,359,000 | 4,358,821 | |
Hotwire Funding LLC 2021-1 C, 4.4590%, 11/20/51ž | 3,000,000 | 2,642,545 | |
Hudson's Bay Simon JV Trust 2015-HB10 A10, 4.1545%, 8/5/34ž | 3,500,000 | 3,305,124 | |
Hudson's Bay Simon JV Trust 2015-HB10 B10, 4.9056%, 8/5/34ž | 2,610,923 | 2,417,671 | |
Hudson's Bay Simon JV Trust 2015-HB10 C10, 5.6286%, 8/5/34ž,‡ | 3,864,419 | 3,214,080 | |
Hudson's Bay Simon JV Trust 2015-HB7 A7, 3.9141%, 8/5/34ž | 4,713,210 | 4,621,152 | |
Hudson's Bay Simon JV Trust 2015-HB7 B7, 4.6662%, 8/5/34ž | 3,000,000 | 2,798,190 | |
Invesco CLO Ltd 2021-2A D, CME Term SOFR 3 Month + 3.1616%, 8.4902%, 7/17/34ž,‡ | 5,000,000 | 5,006,960 | |
JP Morgan Chase Commercial Mortgage Sec Trust 2020-ACE A, 3.2865%, 1/10/37ž | 13,800,000 | 13,559,006 | |
JP Morgan Chase Commercial Mortgage Sec Trust 2020-ACE C, 3.8173%, 1/10/37ž,‡ | 1,000,000 | 969,483 | |
JP Morgan Chase Commercial Mortgage Sec Trust 2022-NLP D, CME Term SOFR 1 Month + 2.1664%, 7.4952%, 4/15/37ž,‡ | 11,031,959 | 9,720,430 | |
JW Commercial Mortgage Trust 2024-MRCO C, CME Term SOFR 1 Month + 2.3901%, 7.7101%, 6/15/39ž,‡ | 5,100,000 | 5,074,539 | |
Kayne CLO 10 Ltd 2021-10A A, CME Term SOFR 3 Month + 1.4316%, 6.7580%, 4/24/34ž,‡ | 22,500,000 | 22,535,572 | |
Lendbuzz Securitization Trust 2021-1A A, 4.2200%, 5/17/27ž | 1,538,283 | 1,512,742 | |
Lendbuzz Securitization Trust 2021-1A A, 5.9900%, 12/15/28ž | 5,594,000 | 5,550,652 | |
Lendbuzz Securitization Trust 2023-2A B, 8.6900%, 6/15/29ž | 9,826,000 | 10,263,834 | |
Lendbuzz Securitization Trust 2024-1A B, 6.5800%, 9/15/29ž | 2,500,000 | 2,508,324 |
Schedule of Investments
June 30, 2024
Shares or Principal Amounts | Value | ||
Asset-Backed/Commercial Mortgage-Backed Securities – (continued) | |||
Lendbuzz Securitization Trust 2024-1A C, 7.5800%, 9/15/30ž | $4,981,000 | $5,059,836 | |
Lendbuzz Securitization Trust 2024-2A C, 7.4500%, 5/15/31ž | 2,000,000 | 2,025,937 | |
LFS LLC 2022-A B, 8.0000%, 5/15/34ž | 4,000,000 | 3,840,912 | |
LHOME Mortgage Trust 2024-RTL1 A1, 7.0170%, 1/25/29ž,Ç | 6,076,000 | 6,100,333 | |
LHOME Mortgage Trust 2024-RTL2 A1, 7.1280%, 3/25/29ž,Ç | 5,303,729 | 5,342,016 | |
LHOME Mortgage Trust 2024-RTL2 A2, 8.8970%, 3/25/29ž,Ç | 2,075,000 | 2,100,397 | |
LHOME Mortgage Trust 2024-RTL3 A2, 8.3730%, 5/25/29ž | 3,600,000 | 3,602,183 | |
Life Financial Services Trust 2021-BMR E, CME Term SOFR 1 Month + 1.8645%, 7.1815%, 3/15/38ž,‡ | 17,693,463 | 16,998,885 | |
Life Financial Services Trust 2022-BMR2 D, CME Term SOFR 1 Month + 2.5419%, 7.8708%, 5/15/39ž,‡ | 10,000,000 | 9,487,419 | |
LoanMe Trust SBL 2019-1, 13.0000%, 8/15/30ž,Ç | 4,342,153 | 1,845,415 | |
Luxury Lease Partners Auto Lease Trust 2024-4 A, 7.2920%, 7/15/30ž | 5,541,316 | 5,527,819 | |
Luxury Lease Partners Auto Lease Trust 2024-4 B, 10.4910%, 7/15/30ž | 5,100,000 | 5,071,492 | |
Madison Park Funding Ltd 2016-22A DR, CME Term SOFR 3 Month + 3.7616%, 9.0902%, 1/17/33ž,‡ | 8,500,000 | 8,515,019 | |
Madison Park Funding Ltd 2018-32A A1R, CME Term SOFR 3 Month + 1.2616%, 6.5862%, 1/22/31ž,‡ | 9,797,267 | 9,804,184 | |
Madison Park Funding Ltd 2018-32A DR, CME Term SOFR 3 Month + 3.4616%, 8.7862%, 1/22/31ž,‡ | 7,000,000 | 7,012,880 | |
Marlette Funding Trust 2023-1A D, 8.1500%, 4/15/33ž | 14,300,000 | 14,297,761 | |
Marlette Funding Trust 2023-2A D, 7.9200%, 6/15/33ž | 9,300,000 | 9,241,504 | |
Marlette Funding Trust 2023-3A D, 8.0400%, 9/15/33ž | 9,571,000 | 9,870,924 | |
Marlette Funding Trust 2023-4A B, 8.1500%, 12/15/33ž | 2,500,000 | 2,580,969 | |
MED Trust 2021-MDLN E, CME Term SOFR 1 Month + 3.2645%, 8.5935%, 11/15/38ž,‡ | 3,483,283 | 3,480,964 | |
MED Trust 2021-MDLN F, CME Term SOFR 1 Month + 4.1145%, 9.4435%, 11/15/38ž,‡ | 7,696,065 | 7,640,548 | |
MED Trust 2021-MDLN G, CME Term SOFR 1 Month + 5.3645%, 10.6935%, 11/15/38ž,‡ | 14,928,355 | 14,927,438 | |
Mercury Financial Credit Card Master Trust 2023-1A A, 8.0400%, 9/20/27ž | 8,000,000 | 8,055,249 | |
Mercury Financial Credit Card Master Trust 2024-1A C, 11.4900%, 2/20/29ž | 12,000,000 | 12,082,823 | |
MHC Commercial Mortgage Trust 2021-MHC F, CME Term SOFR 1 Month + 2.7154%, 8.0444%, 4/15/38ž,‡ | 5,117,148 | 5,062,891 | |
MHC Commercial Mortgage Trust 2021-MHC G, CME Term SOFR 1 Month + 3.3154%, 8.6444%, 4/15/38ž,‡ | 8,908,870 | 8,814,401 | |
Mission Lane Credit Card Master Trust 2023-A B, 8.1500%, 7/17/28ž | 3,000,000 | 3,029,562 | |
Mission Lane Credit Card Master Trust 2023-A C, 10.0300%, 7/17/28ž | 3,250,000 | 3,306,462 | |
Mission Lane Credit Card Master Trust 2023-B C, 9.6700%, 11/15/28ž | 4,750,000 | 4,833,422 | |
Mission Lane Credit Card Master Trust 2023-B D, 11.9700%, 11/15/28ž | 6,976,000 | 7,081,381 | |
MKT Mortgage Trust 2020-525M F, 3.0386%, 2/12/40ž,‡ | 11,900,000 | 6,117,249 | |
Morgan Stanley Capital I Trust 2019-MEAD D, 3.2830%, 11/10/36ž,‡ | 2,825,000 | 2,614,049 | |
MTN Commercial Mortgage Trust 2022-LPFL F, CME Term SOFR 1 Month + 5.2852%, 10.6052%, 3/15/39ž,‡ | 6,000,000 | 5,717,204 | |
Multifamily Connecticut Avenue Securities Trust 2019-01, US 30 Day Average SOFR + 3.3645%, 8.6998%, 10/25/49ž,‡ | 26,673,467 | 26,606,802 | |
Multifamily Connecticut Avenue Securities Trust 2020-01, US 30 Day Average SOFR + 3.8645%, 9.1998%, 3/25/50ž,‡ | 10,258,477 | 10,263,802 | |
MVW Owner Trust 2021-1WA D, 3.1700%, 1/22/41ž | 1,205,449 | 1,137,268 | |
NBC Funding LLC 2021-1 B, 4.9700%, 7/30/51ž | 3,000,000 | 2,620,174 | |
NCMF Trust 2022-MFP F, CME Term SOFR 1 Month + 4.4310%, 9.7478%, 3/15/39ž,‡ | 5,000,000 | 4,837,103 | |
NCMF Trust 2022-MFP G, CME Term SOFR 1 Month + 5.1280%, 10.4568%, 3/15/39ž,‡ | 1,220,000 | 1,182,909 | |
Neuberger Berman CLO Ltd 2023-53A D, CME Term SOFR 3 Month + 4.5000%, 9.8229%, 10/25/32ž,‡ | 5,500,000 | 5,531,916 | |
New Residential Mortgage Loan Trust 2022-SFR1 F, 4.4430%, 2/17/39ž | 10,500,000 | 9,302,357 | |
NRTH PARK Mortgage Trust 2024-PARK A, CME Term SOFR 1 Month + 1.6413%, 6.9701%, 3/15/41ž,‡ | 10,000,000 | 9,966,952 | |
NW Re-Remic Trust 2021-FRR1 BK88, 2.6549%, 12/18/51ž,‡ | 20,000,000 | 15,775,982 |
Schedule of Investments
June 30, 2024
Shares or Principal Amounts | Value | ||
Asset-Backed/Commercial Mortgage-Backed Securities – (continued) | |||
Oak Hill Credit Partners 2012-7A AR3, CME Term SOFR 3 Month + 1.3316%, 6.6574%, 2/20/34ž,‡ | $5,000,000 | $5,003,640 | |
Oak Street Investment Grade Net Lease Fund 2020-1A B1, 5.1100%, 11/20/50ž | 4,499,000 | 4,139,479 | |
Oak Street Investment Grade Net Lease Fund 2021-1A B1, 4.2300%, 1/20/51ž | 6,250,000 | 5,581,932 | |
Oasis Securitization 2022-2A B, 8.8500%, 10/15/34ž | 2,743,926 | 2,743,926 | |
Oasis Securitization 2023-1A B, 10.2500%, 2/15/35ž | 2,849,457 | 2,863,704 | |
Octagon 61 Ltd 2023-2A D, CME Term SOFR 3 Month + 5.5000%, 10.8246%, 4/21/36ž,‡ | 7,100,000 | 7,228,538 | |
Octagon Investment Partners 42 Ltd 2019-3A AR, CME Term SOFR 3 Month + 1.4016%, 6.7302%, 7/17/34ž,‡ | 10,000,000 | 10,006,470 | |
Octagon Investment Partners 58 Ltd 2022-1A D, CME Term SOFR 3 Month + 3.5500%, 8.8786%, 7/15/37ž,‡ | 7,750,000 | 7,760,230 | |
Ondeck Asset Securitization Trust LLC 2023-1A B, 8.2500%, 8/19/30ž | 6,250,000 | 6,253,124 | |
Ondeck Asset Securitization Trust LLC 2024-1A B, 7.1500%, 6/17/31ž | 6,000,000 | 6,043,968 | |
Onslow Bay Financial LLC 2024-NQM4 M1, US 30 Day Average SOFR + 2.3500%, 6.6220%, 1/25/64ž,‡ | 2,280,000 | 2,264,205 | |
OPEN Trust 2023-AIR D, CME Term SOFR 1 Month + 6.6838%, 12.0126%, 10/15/28ž,‡ | 13,542,929 | 13,566,366 | |
Pagaya AI Debt Selection Trust 2021-1 CERT, 0%, 11/15/27ž,‡,¤ | 1,846,154 | 3,692 | |
Pagaya AI Debt Selection Trust 2022-1 C, 4.8880%, 10/15/29ž | 3,679,513 | 3,440,100 | |
Pawnee Equipment Receivables 2022-1 D, 7.2300%, 7/17/28ž | 5,000,000 | 4,619,364 | |
Pawnee Equipment Receivables 2022-1 E, 9.5000%, 9/17/29ž | 5,379,000 | 3,739,303 | |
Pawnee Equipment Receivables Series 2020-1 LLC, 5.4300%, 7/15/27ž | 6,165,000 | 6,153,996 | |
Post Road Equipment Finance 2024-1A D, 6.7700%, 10/15/30ž | 1,100,000 | 1,101,708 | |
Post Road Equipment Finance 2024-1A E, 8.5000%, 12/15/31ž | 3,200,000 | 3,057,844 | |
Prestige Auto Receivables Trust 2023-1A E, 9.8800%, 5/15/30ž | 6,000,000 | 6,292,815 | |
Pretium Mortgage Credit Partners LLC 2021-RN4 A1, 2.4871%, 10/25/51ž,‡ | 14,030,923 | 13,630,614 | |
Pretium Mortgage Credit Partners LLC 2023-RN1 A1, 8.2321%, 9/25/53ž,Ç | 6,321,616 | 6,418,056 | |
Pretium Mortgage Credit Partners LLC 2023-RN2 A1, 8.1115%, 11/25/53ž,Ç | 4,181,410 | 4,240,347 | |
PRIMA Capital Ltd, 4.2500%, 12/25/50ž | 10,500,000 | 8,701,905 | |
PRIMA Capital Ltd 2021-9A C, CME Term SOFR 1 Month + 2.4645%, 7.8032%, 12/15/37ž,‡ | 8,585,545 | 8,619,938 | |
Project Silver, 6.9000%, 7/15/44ž,‡ | 898,315 | 238,098 | |
PRP Advisors LLC 2021-10 A1, 2.4870%, 10/25/26ž,Ç | 7,206,993 | 7,005,901 | |
PRP Advisors LLC 2021-9 A1, 2.3630%, 10/25/26ž,Ç | 8,657,458 | 8,406,078 | |
PRP Advisors LLC 2022-2 A1, 5.0000%, 3/25/27ž,Ç | 6,545,644 | 6,442,361 | |
Rad CLO Ltd 2023-18A D, CME Term SOFR 3 Month + 5.2500%, 10.5786%, 4/15/36ž,‡ | 6,588,000 | 6,721,967 | |
Rad CLO Ltd 2023-19A D, CME Term SOFR 3 Month + 5.7500%, 11.0746%, 4/20/35ž,‡ | 7,000,000 | 7,008,771 | |
Rad CLO Ltd 2023-21A D, CME Term SOFR 3 Month + 4.4000%, 9.7236%, 1/25/33ž,‡ | 8,000,000 | 8,023,248 | |
Raptor Aircraft Finance I LLC, 4.2130%, 8/23/44ž | 9,540,930 | 8,043,862 | |
Reach Financial LLC 2022-2A D, 9.0000%, 5/15/30ž | 8,000,000 | 8,049,057 | |
Reach Financial LLC 2024-1A C, 6.9000%, 2/18/31ž | 1,875,000 | 1,866,260 | |
ReadyCap Lending 2023-3 A, Prime Rate by Country United States + 0.0700%, 8.5700%, 4/27/48ž,‡ | 9,368,552 | 9,376,357 | |
RRX Ltd 2021-4A C, CME Term SOFR 3 Month + 3.4116%, 8.7402%, 7/17/34ž,‡ | 4,000,000 | 4,001,504 | |
Saluda Grade Alternative Mortgage Trust 2023-FIG3 C, 8.9480%, 8/25/53ž | 7,092,928 | 7,437,455 | |
Saluda Grade Alternative Mortgage Trust 2023-FIG4 C, 8.0070%, 11/25/53ž,‡ | 7,012,829 | 7,246,128 | |
Saluda Grade Alternative Mortgage Trust 2024-FIG5 C, 6.8510%, 4/25/54ž,Ç | 4,238,844 | 4,305,942 | |
Saluda Grade Alternative Mortgage Trust 2024-RTL4 A1, 7.5000%, 2/25/30ž,Ç | 10,360,000 | 10,387,196 | |
Saluda Grade Alternative Mortgage Trust 2024-RTL5 A1, 7.7620%, 4/25/30ž,Ç | 9,420,000 | 9,496,770 | |
Saluda Grade Alternative Mortgage Trust 2024-RTL6 A2, 8.6830%, 7/25/30ž,‡ | 11,300,000 | 11,299,774 | |
Sand Trust 2021-1A D, CME Term SOFR 3 Month + 3.8116%, 9.1402%, 10/16/34ž,‡ | 8,000,000 | 8,006,040 | |
Santander Bank Auto Credit-Linked Notes 2022-B E, 8.6810%, 8/16/32ž | 949,189 | 952,283 | |
Santander Bank Auto Credit-Linked Notes 2022-C E, 11.3660%, 12/15/32ž | 1,572,311 | 1,607,571 | |
Santander Bank Auto Credit-Linked Notes 2023-A E, 10.0680%, 6/15/33ž | 503,843 | 511,269 |
Schedule of Investments
June 30, 2024
Shares or Principal Amounts | Value | ||
Asset-Backed/Commercial Mortgage-Backed Securities – (continued) | |||
Santander Bank Auto Credit-Linked Notes 2023-B E, 8.4080%, 12/15/33ž | $2,500,000 | $2,501,901 | |
Santander Bank Auto Credit-Linked Notes 2023-B F, 12.2400%, 12/15/33ž | 7,000,000 | 7,136,744 | |
Santander Bank Auto Credit-Linked Notes 2023-B G, 17.1280%, 12/15/33ž | 4,500,000 | 4,820,923 | |
Santander Bank Auto Credit-Linked Notes 2024-A E, 7.7620%, 6/15/32ž | 2,500,000 | 2,494,735 | |
Santander Bank Auto Credit-Linked Notes 2024-A F, 10.1710%, 6/15/32ž | 9,027,000 | 9,024,563 | |
Santander Bank Auto Credit-Linked Notes 2024-A G, 13.0300%, 6/15/32ž | 8,750,000 | 8,747,749 | |
Santander Consumer Auto Receivables Trust 2020-BA, 4.1300%, 1/15/27ž | 1,500,000 | 1,477,830 | |
Santander Consumer Auto Receivables Trust 2021-AA E, 3.2800%, 3/15/27ž | 1,750,000 | 1,666,375 | |
SB Multifamily Repack Trust 2020-FRR2 A2, 6.7428%, 12/27/39ž,‡ | 16,966,491 | 16,215,973 | |
SBNA Auto Receivables Trust 2024-A E, 8.0000%, 4/15/32ž | 6,000,000 | 5,946,507 | |
SEB Funding LLC 2021-1A A2, 4.9690%, 1/30/52ž | 13,712,633 | 13,038,827 | |
Sierra Receivables Funding Co LLC 2020-2A D, 6.5900%, 7/20/37ž | 1,146,925 | 1,135,496 | |
Sierra Receivables Funding Co LLC 2021-1A D, 3.1700%, 11/20/37ž | 2,395,750 | 2,294,288 | |
Sierra Receivables Funding Co LLC 2022-3A C, 7.6300%, 7/20/39ž | 987,921 | 1,006,251 | |
Sierra Receivables Funding Co LLC 2023-1A C, 7.0000%, 1/20/40ž | 1,292,205 | 1,306,347 | |
Sierra Receivables Funding Co LLC 2023-3A D, 9.4400%, 9/20/40ž | 2,059,927 | 2,176,046 | |
Sierra Receivables Funding Co LLC 2024-1A D, 8.0200%, 1/20/43ž | 1,978,814 | 2,018,029 | |
Sierra Timeshare 2019-2 Receivables Funding LLC, 4.5400%, 5/20/36ž | 1,388,080 | 1,385,470 | |
Signal Peak CLO LLC 2022-12A A1, 7.1207%, 7/10/28ž,‡ | 6,723,000 | 6,975,670 | |
SMRT 2022-MINI E, CME Term SOFR 1 Month + 2.7000%, 8.0290%, 1/15/39ž,‡ | 7,000,000 | 6,662,599 | |
SMRT 2022-MINI F, CME Term SOFR 1 Month + 3.3500%, 8.6790%, 1/17/39ž,‡ | 20,073,000 | 18,990,968 | |
Sotheby's Artfi Master Trust 2024-1A D, 7.9100%, 12/22/31ž | 4,000,000 | 4,012,141 | |
Sprite Limited 2021-1 B, 5.1000%, 11/15/46ž | 3,779,303 | 3,314,668 | |
Sprite Limited 2021-1 C, 8.8350%, 11/15/46ž | 5,614,759 | 4,152,440 | |
Summit Issuer LLC 2020-1A B, 3.1790%, 12/20/50ž | 2,500,000 | 2,344,617 | |
Switch ABS Issuer LLC 2024-2A C, 10.0330%, 6/25/54ž | 15,000,000 | 14,978,860 | |
Tallman Park CLO Ltd 2021-1A D, CME Term SOFR 3 Month + 3.3616%, 8.6862%, 4/20/34ž,‡ | 4,390,000 | 4,402,573 | |
THE 2023-MIC Trust 2023-MIC A, 8.7315%, 12/5/38ž,‡ | 20,000,000 | 21,511,496 | |
The Huntington National Bank 2024-1 D, US 30 Day Average SOFR + 5.2500%, 10.5830%, 5/20/32ž,‡ | 1,000,000 | 999,976 | |
The Huntington National Bank 2024-1 E, US 30 Day Average SOFR + 8.2500%, 13.5830%, 5/20/32ž,‡ | 3,000,000 | 2,999,894 | |
Theorem Funding Trust 2022-3A A, 7.6000%, 4/15/29ž | 2,906,809 | 2,927,691 | |
Theorem Funding Trust 2022-3A B, 8.9500%, 4/15/29ž | 4,500,000 | 4,641,896 | |
Thrust Engine Leasing 2021-1A A, 4.1630%, 7/15/40ž | 8,765,343 | 8,097,512 | |
Tricolor Auto Securitization Trust 2022-1A E, 7.7900%, 8/16/27ž | 10,870,000 | 10,915,565 | |
Tricolor Auto Securitization Trust 2023-1A D, 8.5600%, 7/15/27ž | 5,750,000 | 5,856,836 | |
Tricolor Auto Securitization Trust 2024-1A C, 6.9900%, 1/18/28ž | 1,850,000 | 1,858,177 | |
Tricolor Auto Securitization Trust 2024-1A D, 8.6100%, 4/17/28ž | 3,145,000 | 3,196,241 | |
TVEST LLC 2021-A B, 0%, 9/15/33ž | 6,550,000 | 5,855,241 | |
United Auto Credit Securitization Trust 2024-1 D, 8.3000%, 11/12/29ž | 4,500,000 | 4,550,791 | |
Upland CLO Ltd 2016-1A CR, CME Term SOFR 3 Month + 3.1616%, 8.4862%, 4/21/31ž,‡ | 8,000,000 | 8,006,608 | |
Upstart Securitization Trust 2020-3 C, 6.2500%, 11/20/30ž | 4,620,398 | 4,603,131 | |
Upstart Securitization Trust 2021-1 C, 4.0600%, 3/20/31ž | 4,791,975 | 4,721,680 | |
Upstart Securitization Trust 2023-1 B, 8.3500%, 2/20/33ž | 6,235,000 | 6,296,783 | |
Upstart Securitization Trust 2023-3 B, 8.2500%, 10/20/33ž | 14,500,000 | 14,881,958 | |
US Bank National Association 2023-1 C, 9.7850%, 8/25/32ž | 2,770,488 | 2,795,065 | |
USASF Receivables LLC 2022-1A A, 3.9800%, 4/15/25ž | 861,528 | 847,172 | |
VASA Trust 2021-VASA D, CME Term SOFR 1 Month + 2.2145%, 7.5435%, 7/15/39ž,‡ | 7,000,000 | 4,770,066 | |
VASA Trust 2021-VASA F, CME Term SOFR 1 Month + 4.0145%, 9.3435%, 7/15/39ž,‡ | 5,500,000 | 3,010,719 | |
VB-S1 Issuer LLC 2020-2A B, 3.2290%, 9/15/50ž | 5,750,000 | 5,505,259 | |
VB-S1 Issuer LLC 2020-2A C, 4.4590%, 9/15/50ž | 12,000,000 | 11,465,608 | |
VB-S1 Issuer LLC 2024-1A F, 8.8710%, 5/15/54ž | 11,000,000 | 11,113,287 | |
WB Commercial Mortgage Trust 2024-HQ A, 6.1344%, 3/15/40ž,‡ | 6,194,000 | 6,177,769 | |
Wells Fargo Commercial Mortgage Trust 2021-C61 XA, 1.4841%, 11/15/54‡,¤ | 76,710,399 | 4,765,004 | |
Westgate Resorts 2022-1A D, 3.8380%, 8/20/36ž | 4,419,497 | 4,215,222 |
Schedule of Investments
June 30, 2024
Shares or Principal Amounts | Value | ||
Asset-Backed/Commercial Mortgage-Backed Securities – (continued) | |||
Westgate Resorts 2024-1A C, 7.0600%, 1/20/38ž | $4,000,000 | $3,994,849 | |
Westgate Resorts 2024-1A D, 9.2600%, 1/20/38ž | 2,000,000 | 1,997,597 | |
Westlake Automobile Receivable Trust 2021-3A E, 3.4200%, 4/15/27ž | 5,000,000 | 4,834,606 | |
Willis Engine Securitization Trust 2020-A B, 4.2120%, 3/15/45ž | 5,224,306 | 4,597,442 | |
Willis Engine Securitization Trust 2020-A C, 6.6570%, 3/15/45ž | 1,113,630 | 1,027,557 | |
Woodward Capital Management 2017-280P B, CME Term SOFR 1 Month + 1.3800%, 6.7000%, 9/15/34ž,‡ | 5,400,000 | 5,162,894 | |
Woodward Capital Management 2024-CES1 A1B, 6.3250%, 2/25/44ž,‡ | 12,038,104 | 12,007,713 | |
Worldwide Plaza Trust 2017-WWP F, 3.7154%, 11/10/36ž,‡ | 4,305,008 | 303,843 | |
Z Capital Credit Partners CLO 2018-1 Ltd, ICE LIBOR USD 3 Month + 2.4500%, 8.0393%, 1/16/31ž,‡ | 1,250,000 | 1,250,788 | |
Z Capital Credit Partners CLO 2018-1A A2 Ltd, ICE LIBOR USD 3 Month + 1.5600%, 7.1493%, 1/16/31ž,‡ | 1,541,744 | 1,542,833 | |
Total Asset-Backed/Commercial Mortgage-Backed Securities (cost $2,328,693,206) | 2,298,511,713 | ||
Bank Loans and Mezzanine Loans – 10.7% | |||
Basic Industry – 1.0% | |||
Aruba Investments Holdings LLC, CME Term SOFR 1 Month + 7.7500%, 13.1939%, 11/24/28‡ | 5,786,000 | 5,493,807 | |
CI (Maroon) Holdings LLC, CME Term SOFR 1 Month + 4.00000%, 9.3203%, 3/1/31ƒ,‡ | 5,982,000 | 6,004,432 | |
Herens US Holdco Corp, CME Term SOFR 3 Month + 3.9250%, 9.3596%, 7/3/28‡ | 14,062,531 | 13,645,942 | |
Olympus Water US Holding Corp, EURIBOR 3 Month + 3.7500%, 7.5350%, 6/20/31ƒ,‡ | 6,500,000 | EUR | 6,928,679 |
SK Neptune Husky Group Sarl, CME Term SOFR 3 Month + 10.00000%, 13.5868%, 4/30/24‡,€ | 845,584 | 507,351 | |
Spa US HoldCo Inc, CME Term SOFR 3 Month + 4.00000%, 9.5710%, 2/4/28ƒ,‡ | 3,603,899 | 3,602,097 | |
Verde Purchaser LLC, CME Term SOFR 1 Month + 4.50000%, 9.8291%, 11/30/30ƒ,‡ | 6,523,404 | 6,511,988 | |
42,694,296 | |||
Brokerage – 0.1% | |||
Aretec Group Inc, CME Term SOFR 1 Month + 4.00000%, 9.3278%, 8/9/30‡ | 3,887,804 | 3,909,747 | |
Capital Goods – 0.5% | |||
Covanta Holding Corp, CME Term SOFR 1 Month + 2.7500%, 8.0808%, 11/30/28‡ | 1,696,830 | 1,696,118 | |
Covanta Holding Corp, CME Term SOFR 1 Month + 2.7500%, 8.0808%, 11/30/28‡ | 92,723 | 92,684 | |
Standard Industries Inc, CME Term SOFR 1 Month + 2.0000%, 7.3436%, 9/22/28ƒ,‡ | 7,725,515 | 7,770,093 | |
White Cap Buyer LLC, CME Term SOFR 1 Month + 3.25000%, 8.5779%, 10/19/29ƒ,‡ | 10,152,000 | 10,165,299 | |
19,724,194 | |||
Chemicals – 0.2% | |||
SCIH Salt Holdings Inc, CME Term SOFR 3 Month + 3.5000%, 8.8295%, 3/16/27‡ | 7,974,903 | 8,000,000 | |
Commercial Services – 0.5% | |||
Driven Holdings LLC, CME Term SOFR 1 Month + 3.0000%, 8.4584%, 12/17/28‡ | 13,018,996 | 12,993,927 | |
Lernen Bidco Ltd, EURIBOR 3 Month + 4.25000%, 8.6330%, 4/25/29‡ | 5,760,000 | EUR | 6,162,450 |
19,156,377 | |||
Communications – 0.9% | |||
Banijay Group US Holding Inc, CME Term SOFR 1 Month + 3.25000%, 8.5791%, 3/1/28ƒ,‡ | 10,026,576 | 10,029,083 | |
CCI Buyer Inc, CME Term SOFR 3 Month + 4.0000%, 9.3346%, 12/17/27‡ | 9,167,291 | 9,193,828 | |
Century DE Buyer LLC, CME Term SOFR 3 Month + 4.0000%, 9.3295%, 10/30/30‡ | 5,825,400 | 5,840,000 |
Schedule of Investments
June 30, 2024
Shares or Principal Amounts | Value | ||
Bank Loans and Mezzanine Loans – (continued) | |||
Communications – (continued) | |||
Directv Financing LLC, CME Term SOFR 1 Month + 5.2500%, 10.7084%, 8/2/29ƒ,‡ | $11,298,733 | $11,428,965 | |
Lorca Co-Borrower LLC, CME Term SOFR 1 Month + 3.50000%, 8.8174%, 3/25/31ƒ,‡ | 1,891,000 | 1,893,364 | |
38,385,240 | |||
Consumer Cyclical – 1.9% | |||
1011778 BC ULC, CME Term SOFR 1 Month + 2.25000%, 7.5715%, 9/20/23‡ | 2,000,000 | 1,992,820 | |
1011778 BC ULC, CME Term SOFR 1 Month + 2.25000%, 7.5784%, 9/20/30‡ | 11,368,508 | 11,327,695 | |
Caesars Entertainment Inc, CME Term SOFR 3 Month + 2.7500%, 8.0973%, 2/6/31‡ | 18,369,960 | 18,398,689 | |
Dealer Tire Financial LLC, CME Term SOFR 1 Month + 3.7500%, 9.0939%, 12/14/27‡ | 2,876,917 | 2,875,723 | |
Entain PLC, EURIBOR 6 Month + 3.2500%, 7.0490%, 6/30/28‡ | 6,620,000 | EUR | 7,089,840 |
Entain PLC, CME Term SOFR 1 Month + 2.75000%, 8.9094%, 10/31/29‡ | 1,786,447 | 1,788,037 | |
House of HR Group BV, EURIBOR 3 Month + 5.0000%, 8.8270%, 11/3/29‡ | 8,340,000 | EUR | 8,918,070 |
Hoya Midco LLC, CME Term SOFR 1 Month + 3.25000%, 8.5779%, 2/3/29ƒ,‡ | 5,100,000 | 5,112,750 | |
Loire Finco Luxembourg, EURIBOR 1 Month + 3.2500%, 6.8960%, 4/21/27‡ | 2,660,000 | EUR | 2,826,969 |
Ovg Business Services LLC, CME Term SOFR 1 Month + 3.0000%, 8.3452%, 6/14/31ƒ,‡ | 10,281,621 | 10,249,543 | |
Piolin BidCo SA, EURIBOR 3 Month + 4.5000%, 8.2170%, 9/16/29‡ | 6,300,000 | EUR | 6,731,477 |
77,311,613 | |||
Consumer Non-Cyclical – 2.1% | |||
Financiere Mendel SASU, EURIBOR 3 Month + 3.5000%, 7.3010%, 11/8/30ƒ,‡ | 1,330,000 | EUR | 1,417,942 |
Financiere Mendel SASU, CME Term SOFR 3 Month + 4.2500%, 9.5732%, 11/12/30‡ | 2,775,000 | 2,782,631 | |
Heartland Dental LLC, CME Term SOFR 1 Month + 4.5000%, 9.8439%, 4/28/28‡ | 17,812,500 | 17,879,464 | |
LifePoint Health Inc, CME Term SOFR 3 Month + 4.7500%, 10.0559%, 11/16/28‡ | 2,554,702 | 2,566,837 | |
LifePoint Health Inc, CME Term SOFR 3 Month + 4.0000%, 9.3293%, 5/17/31‡ | 3,501,000 | 3,504,291 | |
Medline Borrower LP, EURIBOR 1 Month + 2.7500%, 7.1880%, 10/13/28ƒ,‡ | 13,000,000 | EUR | 13,909,699 |
Medline Borrower LP, CME Term SOFR 1 Month + 2.25000%, 7.5779%, 10/23/28ƒ,‡ | 7,431,000 | 7,431,000 | |
Mehilainen Yhtiot Oy, EURIBOR 3 Month + 4.00000%, 0.0765%, 8/9/28‡ | 1,280,000 | EUR | 1,370,119 |
Saratoga Food Specialties, CME Term SOFR 3 Month + 3.7500%, 9.0932%, 3/7/29‡ | 5,970,297 | 5,992,686 | |
Star Parent Inc, CME Term SOFR 3 Month + 3.75000%, 9.3094%, 9/27/30ƒ,‡ | 13,469,709 | 13,475,975 | |
Summit Behavioral Healthcare LLC, CME Term SOFR 3 Month + 4.2500%, 9.5973%, 11/24/28‡ | 7,371,810 | 7,396,358 | |
Topgolf Callaway Brands Corp, CME Term SOFR 1 Month + 3.0000%, 8.3439%, 3/15/30‡ | 8,373,697 | 8,410,820 | |
86,137,822 | |||
Diversified Financial – 0% | |||
Osaic Holdings Inc, CME Term SOFR 1 Month + 4.0000%, 9.3439%, 8/17/28‡ | 14,232 | 14,270 | |
Diversified Financial Services – 0.2% | |||
Delta 2 Lux Sarl, CME Term SOFR 3 Month + 2.2500%, 7.5846%, 1/15/30‡ | 9,100,000 | 9,113,286 | |
Luxembourg Investment Co 428 Sarl, CME Term SOFR 3 Month + 7.00000%, 10.4338%, 1/3/29‡ | 7,944,280 | 127,426 | |
9,240,712 | |||
Finance Companies – 0.2% | |||
Athena Bidco SASU, EURIBOR 3 Month + 4.0000%, 7.7220%, 4/14/31‡ | 8,390,000 | EUR | 9,010,257 |
Financial Institutions – 0.1% | |||
Chrysaor Bidco Sarl, CME Term SOFR 1 Month + 3.50000%, 8.8224%, 5/14/31ƒ,‡ | 1,608,877 | 1,613,913 | |
Chrysaor Bidco Sarl, CME Term SOFR 1 Month + 3.50000%, 8.8224%, 5/14/31ƒ,‡ | 118,985 | 119,357 | |
Mermaid Bidco Inc, CME Term SOFR 1 Month + 3.50000%, 8.5936%, 6/27/31ƒ,‡ | 3,662,000 | 3,662,000 | |
5,395,270 |
Schedule of Investments
June 30, 2024
Shares or Principal Amounts | Value | ||
Bank Loans and Mezzanine Loans – (continued) | |||
Health Care Providers & Services – 0.2% | |||
VetStrategy Canada Holdings Inc, CME Term SOFR 1 Month + 5.50000%, 10.8094%, 12/12/28‡ | $9,243,500 | $9,251,172 | |
Industrial – 0.6% | |||
Chromalloy Corp, CME Term SOFR 3 Month + 3.7500%, 9.0816%, 3/27/31‡ | 5,903,205 | 5,925,397 | |
Inspired Finco Holdings Ltd, EURIBOR 1 Month + 4.0000%, 7.6460%, 2/28/31‡ | 2,659,806 | EUR | 2,845,276 |
Inspired Finco Holdings Ltd, EURIBOR 3 Month + 4.00000%, 7.9430%, 2/28/31‡ | 4,725,113 | EUR | 5,054,598 |
Inspired Finco Holdings Ltd, EURIBOR 3 Month + 4.0000%, 7.9430%, 2/28/31ƒ,‡ | 3,375,081 | EUR | 3,610,427 |
Proampac PG Borrower LLC, CME Term SOFR 3 Month + 4.0000%, 9.5902%, 9/15/28‡ | 7,494,381 | 7,505,623 | |
24,941,321 | |||
Insurance – 0.3% | |||
Truist Insurance Holdings LLC, CME Term SOFR 3 Month + 3.2500%, 8.5846%, 5/6/31‡ | 5,000,000 | 5,004,450 | |
USI Inc/NY, CME Term SOFR 1 Month + 2.75000%, 8.0784%, 9/27/30‡ | 8,720,849 | 8,739,034 | |
13,743,484 | |||
Technology – 1.4% | |||
Ahead DB Holdings LLC, CME Term SOFR 3 Month + 4.2500%, 9.5846%, 2/1/31‡ | 6,128,000 | 6,139,521 | |
Claudius Finance Sarl, EURIBOR 3 Month + 3.5000%, 7.3910%, 7/10/28‡ | 3,250,000 | EUR | 3,476,207 |
Cloud Software Group Inc, CME Term SOFR 3 Month + 4.5000%, 9.8346%, 3/21/31‡ | 3,457,000 | 3,464,018 | |
Coherent Corp, CME Term SOFR 1 Month + 2.5000%, 7.8439%, 7/2/29‡ | 2,937,073 | 2,942,364 | |
Fortress Intermediate 3 Inc, CME Term SOFR 3 Month + 3.75000%, 9.0632%, 6/9/31ƒ,‡ | 5,807,000 | 5,807,000 | |
Gold Rush Bidco Ltd, EURIBOR 3 Month + 4.0000%, 7.8240%, 4/11/31‡ | 6,040,000 | EUR | 6,474,367 |
Modena Buyer LLC, CME Term SOFR 1 Month + 4.50000%, 9.8240%, 4/18/31ƒ,‡ | 16,047,000 | 15,640,850 | |
Rocket Software Inc, CME Term SOFR 1 Month + 4.7500%, 10.0939%, 11/28/28‡ | 13,649,564 | 13,721,850 | |
57,666,177 | |||
Transportation – 0.5% | |||
AAdvantage Loyalty IP Ltd, CME Term SOFR 3 Month + 4.7500%, 10.3362%, 4/20/28‡ | 8,376,471 | 8,642,591 | |
First Student Bidco Inc, CME Term SOFR 3 Month + 3.0000%, 8.4346%, 7/21/28‡ | 4,476,796 | 4,477,244 | |
Genesee & Wyoming Inc, CME Term SOFR 3 Month + 2.0000%, 7.3346%, 4/10/31‡ | 5,261,941 | 5,254,679 | |
18,374,514 | |||
Total Bank Loans and Mezzanine Loans (cost $449,773,251) | 442,956,466 | ||
Corporate Bonds – 23.3% | |||
Banking – 1.7% | |||
American Express Co, US Treasury Yield Curve Rate 5 Year + 2.8540%, 3.5500%‡,μ | 1,850,000 | 1,724,570 | |
Bank of America Corp, SOFR + 1.6500%, 5.4680%, 1/23/35‡ | 2,893,000 | 2,890,074 | |
Bank of New York Mellon Corp/The, SOFR + 1.6060%, 4.9670%, 4/26/34‡ | 5,144,000 | 5,018,287 | |
Bank of Montreal, US Treasury Yield Curve Rate 5 Year + 1.4000%, 3.0880%, 1/10/37‡ | 3,797,000 | 3,107,155 | |
BNP Paribas SA, US Treasury Yield Curve Rate 1 Year + 1.4500%, 5.1250%, 1/16/29ž,‡ | 4,755,000 | 4,713,904 | |
BNP Paribas SA, US Treasury Yield Curve Rate 5 Year + 4.9690%, 9.2500%ž,‡,μ | 2,928,000 | 3,104,664 | |
BPCE SA, 4.5000%, 3/15/25ž | 544,000 | 536,719 | |
Capital One Financial Corp, SOFR + 2.2600%, 6.0510%, 2/1/35‡ | 2,481,000 | 2,495,412 | |
Citigroup Inc, US Treasury Yield Curve Rate 5 Year + 3.4170%, 3.8750%‡,μ | 5,310,000 | 5,025,423 | |
Citigroup Inc, US Treasury Yield Curve Rate 5 Year + 3.5970%, 4.0000%‡,μ | 5,000,000 | 4,788,386 | |
Commonwealth Bank of Australia, 3.7840%, 3/14/32ž | 4,985,000 | 4,364,393 | |
Credit Suisse Group AG, SOFR + 3.7300%, 4.1940%, 4/1/31ž,‡ | 2,185,000 | 2,039,752 | |
Discover Financial Services, SOFR + 3.3700%, 7.9640%, 11/2/34‡ | 2,226,000 | 2,504,012 |
Schedule of Investments
June 30, 2024
Shares or Principal Amounts | Value | ||
Corporate Bonds – (continued) | |||
Banking – (continued) | |||
ING Groep NV, SOFR + 2.0900%, 6.1140%, 9/11/34‡ | $2,990,000 | $3,082,681 | |
Intesa Sanpaolo SpA, 5.7100%, 1/15/26ž | 580,000 | 574,486 | |
JPMorgan Chase & Co, SOFR + 1.1900%, 5.0400%, 1/23/28‡ | 1,892,000 | 1,881,761 | |
JPMorgan Chase & Co, SOFR + 1.0150%, 2.0690%, 6/1/29‡ | 2,955,000 | 2,628,641 | |
JPMorgan Chase & Co, US Treasury Yield Curve Rate 5 Year + 2.8500%, 3.6500%‡,μ | 1,716,000 | 1,623,095 | |
JPMorgan Chase & Co, CME Term SOFR 3 Month + 3.3800%, 5.0000%‡,μ | 1,485,000 | 1,480,753 | |
Morgan Stanley, CME Term SOFR 3 Month + 1.8896%, 4.4310%, 1/23/30‡ | 1,454,000 | 1,406,584 | |
Morgan Stanley, SOFR + 3.1200%, 3.6220%, 4/1/31‡ | 2,740,000 | 2,514,264 | |
Morgan Stanley, US Treasury Yield Curve Rate 5 Year + 2.4300%, 5.9480%, 1/19/38‡ | 1,081,000 | 1,074,702 | |
PNC Financial Services Group Inc/The, SOFR + 2.2840%, 6.8750%, 10/20/34‡ | 3,231,000 | 3,521,361 | |
Societe Generale SA, 4.2500%, 4/14/25ž | 3,623,000 | 3,561,848 | |
Societe Generale SA, 4.7500%, 11/24/25ž | 3,638,000 | 3,565,495 | |
UniCredit SpA, US Treasury Yield Curve Rate 1 Year + 2.3000%, 2.5690%, 9/22/26ž,‡ | 1,583,000 | 1,518,409 | |
US Bancorp, SOFR + 1.8600%, 5.6780%, 1/23/35‡ | 1,439,000 | 1,444,519 | |
72,191,350 | |||
Basic Industry – 1.6% | |||
Compass Minerals International Inc, 6.7500%, 12/1/27ž | 9,878,000 | 9,439,810 | |
First Quantum Minerals Ltd, 9.3750%, 3/1/29ž | 1,594,000 | 1,665,531 | |
Hudbay Minerals Inc, 4.5000%, 4/1/26ž | 6,918,000 | 6,767,296 | |
Mineral Resources Ltd, 9.2500%, 10/1/28ž | 6,885,000 | 7,226,028 | |
Neon Holdings Inc, 10.1250%, 4/1/26ž | 3,021,000 | 2,887,484 | |
Novelis Corp, 3.2500%, 11/15/26ž | 5,800,000 | 5,457,824 | |
Olympus Water US Holding Corp, 7.2500%, 6/15/31ž | 10,365,000 | 10,302,914 | |
Progroup AG, 5.3750%, 4/15/31 | 9,000,000 | EUR | 9,567,825 |
Verde Purchaser LLC, 10.5000%, 11/30/30ž | 10,453,000 | 11,047,817 | |
64,362,529 | |||
Brokerage – 0.7% | |||
Artec Group Inc, 10.0000%, 8/15/30ž | 3,966,000 | 4,313,374 | |
Blue Owl Finance LLC, 6.2500%, 4/18/34ž | 4,458,000 | 4,469,769 | |
Jane Street Group / JSG Finance Inc, 7.1250%, 4/30/31ž | 10,446,000 | 10,712,104 | |
Nasdaq Inc, 4.5000%, 2/15/32 | 6,005,000 | EUR | 6,720,709 |
Nasdaq Inc, 5.5500%, 2/15/34 | 1,352,000 | 1,353,832 | |
27,569,788 | |||
Capital Goods – 1.1% | |||
Alta Equipment Group Inc, 9.0000%, 6/1/29ž,# | 10,301,000 | 9,556,324 | |
Ardagh Metal Packaging SA, 3.0000%, 9/1/29 | 8,863,000 | EUR | 7,663,589 |
Berry Global Inc, 5.6500%, 1/15/34ž | 4,663,000 | 4,554,391 | |
Boeing Co/The, 6.3880%, 5/1/31ž | 2,801,000 | 2,851,577 | |
Bombardier Inc, 7.0000%, 6/1/32ž | 9,259,000 | 9,387,617 | |
Husky Injection Molding Systems Ltd / Titan Co-Borrower LLC, 9.0000%, 2/15/29ž | 7,169,000 | 7,423,600 | |
Regal Rexnord Corp, 6.3000%, 2/15/30 | 1,951,000 | 1,994,593 | |
Regal Rexnord Corp, 6.4000%, 4/15/33 | 1,303,000 | 1,333,210 | |
Velocity Vehicle Group LLC, 8.0000%, 6/1/29ž | 1,472,000 | 1,514,026 | |
46,278,927 | |||
Communications – 0.9% | |||
AT&T Inc, EURIBOR ICE SWAP Rate + 3.1400%, 2.8750%‡,μ | 5,300,000 | EUR | 5,562,151 |
Cable One Inc, 4.0000%, 11/15/30ž,# | 9,933,000 | 7,413,490 | |
Charter Communications Operating LLC / Charter Communications Operating Capital, 6.5500%, 6/1/34 | 8,328,000 | 8,330,769 | |
Iliad Holding SASU, 6.8750%, 4/15/31ž | 9,104,000 | EUR | 9,893,830 |
Netflix Inc, 3.6250%, 6/15/30 | 6,830,000 | EUR | 7,292,415 |
38,492,655 | |||
Consumer Cyclical – 3.8% | |||
Adler Pelzer Holding GmbH, 9.5000%, 4/1/27ž | 6,450,000 | EUR | 6,877,385 |
Aston Martin Capital Holdings Ltd, 10.0000%, 3/31/29ž | 9,452,000 | 9,313,150 |
Schedule of Investments
June 30, 2024
Shares or Principal Amounts | Value | ||
Corporate Bonds – (continued) | |||
Consumer Cyclical – (continued) | |||
Atlas LuxCo 4 Sarl / Allied Universal Holdco LLC / Allied Universal Finance Corp, 4.6250%, 6/1/28ž | $8,666,000 | $7,904,123 | |
CBRE Services Inc, 5.9500%, 8/15/34 | 5,473,000 | 5,540,621 | |
Choice Hotels International Inc, 5.8500%, 8/1/34 | 11,657,000 | 11,489,235 | |
Ford Motor Credit Co LLC, 7.3500%, 11/4/27 | 3,566,000 | 3,715,751 | |
Full House Resorts Inc, 8.2500%, 2/15/28ž | 10,378,000 | 9,942,566 | |
Garrett Motion Holdings Inc / Garrett LX I Sarl, 7.7500%, 5/31/32ž | 7,860,000 | 7,965,497 | |
General Motors Financial Co Inc, ICE LIBOR USD 3 Month + 3.5980%, 5.7500%‡,μ | 13,680,000 | 13,039,050 | |
GLP Capital LP / GLP Financing II Inc, 4.0000%, 1/15/31 | 2,207,000 | 1,978,675 | |
JB Poindexter & Co Inc, 8.7500%, 12/15/31ž | 10,060,000 | 10,422,069 | |
Kohl's Corp, 4.6250%, 5/1/31Ç | 7,649,000 | 6,398,598 | |
LGI Homes Inc, 4.0000%, 7/15/29ž | 10,940,000 | 9,465,853 | |
Lithia Motors Inc, 3.8750%, 6/1/29ž | 3,700,000 | 3,323,633 | |
Lithia Motors Inc, 4.3750%, 1/15/31ž,# | 6,689,000 | 5,954,819 | |
LSF9 Atlantis Holdings LLC / Victra Finance Corp, 7.7500%, 2/15/26ž | 8,375,000 | 8,329,779 | |
Mavis Tire Express Services Corp, 6.5000%, 5/15/29ž,# | 9,493,000 | 8,850,204 | |
NCL Corporation Ltd, 7.7500%, 2/15/29ž,# | 8,470,000 | 8,806,268 | |
Pinnacle Bidco PLC, 8.2500%, 10/11/28ž | 5,150,000 | EUR | 5,845,505 |
VICI Properties LP, 4.9500%, 2/15/30 | 3,425,000 | 3,304,235 | |
VICI Properties LP, 5.1250%, 5/15/32 | 1,327,000 | 1,264,280 | |
Wynn Macau Ltd, 5.1250%, 12/15/29ž | 5,933,000 | 5,374,117 | |
155,105,413 | |||
Consumer Non-Cyclical – 2.8% | |||
Atlas LuxCo 4 Sarl / Allied Universal Holdco LLC / Allied Universal Finance Corp, 4.6250%, 6/1/28ž | 2,787,000 | 2,539,068 | |
Cheplapharm Arzneimittel GmbH, 7.5000%, 5/15/30ž | 12,700,000 | EUR | 14,223,217 |
Hasbro Inc, 6.0500%, 5/14/34 | 9,139,000 | 9,124,409 | |
Heartland Dental LLC / Heartland Dental Finance Corp, 10.5000%, 4/30/28ž | 11,834,000 | 12,561,318 | |
HLF Financing Sarl LLC / Herbalife International Inc, 12.2500%, 4/15/29ž | 4,157,000 | 4,143,520 | |
HLF Financing Sarl LLC / Herbalife International Inc, 4.8750%, 6/1/29ž | 7,721,000 | 5,349,258 | |
JBS USA LUX SA / JBS USA Food Co / JBS USA Finance Inc, 6.7500%, 3/15/34ž | 5,726,000 | 6,070,178 | |
LifePoint Health Inc, 11.0000%, 10/15/30ž | 4,625,000 | 5,095,677 | |
LifePoint Health Inc, 10.0000%, 6/1/32ž | 6,871,000 | 7,025,000 | |
Mattel Inc, 5.4500%, 11/1/41 | 4,674,000 | 4,197,033 | |
Organon Finance 1 LLC, 5.1250%, 4/30/31ž | 17,733,000 | 15,928,705 | |
Pilgrim's Pride Corp, 6.2500%, 7/1/33 | 8,897,000 | 9,062,956 | |
Royalty Pharma PLC, 5.4000%, 9/2/34 | 7,202,000 | 7,008,639 | |
Solventum Corp, 5.6000%, 3/23/34ž | 7,777,000 | 7,638,373 | |
Universal Health Services Inc, 2.6500%, 1/15/32 | 5,334,000 | 4,351,705 | |
114,319,056 | |||
Electric – 1.4% | |||
Algonquin Power & Utilities Corp, US Treasury Yield Curve Rate 5 Year + 3.2490%, 4.7500%, 1/18/82‡ | 8,480,000 | 7,757,604 | |
American Electric Power Co Inc, US Treasury Yield Curve Rate 5 Year + 2.6750%, 3.8750%, 2/15/62‡ | 3,783,000 | 3,465,806 | |
CMS Energy Corp, US Treasury Yield Curve Rate 5 Year + 4.1160%, 4.7500%, 6/1/50‡ | 2,300,000 | 2,106,209 | |
Duquesne Light Holdings Inc, 2.5320%, 10/1/30ž | 2,108,000 | 1,773,401 | |
IPALCO Enterprises Inc, 4.2500%, 5/1/30 | 2,749,000 | 2,551,604 | |
Liberty Utilities Co, 5.8690%, 1/31/34ž | 6,845,000 | 6,849,509 | |
NRG Energy Inc, 7.0000%, 3/15/33ž | 10,205,000 | 10,772,418 | |
Vistra Operations Co LLC, 6.8750%, 4/15/32ž | 6,133,000 | 6,226,050 | |
Vistra Operations Co LLC, 6.9500%, 10/15/33ž | 8,264,000 | 8,844,843 | |
Xcel Energy Inc, 4.6000%, 6/1/32 | 3,240,000 | 3,029,581 | |
Xcel Energy Inc, 5.4500%, 8/15/33 | 5,916,000 | 5,812,053 | |
59,189,078 |
Schedule of Investments
June 30, 2024
Shares or Principal Amounts | Value | ||
Corporate Bonds – (continued) | |||
Energy – 2.3% | |||
Blue Racer Midstream LLC / Blue Racer Finance Corp, 7.2500%, 7/15/32ž | $3,119,000 | $3,206,795 | |
DT Midstream Inc, 4.1250%, 6/15/29ž | 7,432,000 | 6,866,023 | |
EnLink Midstream Partners LP, CME Term SOFR 3 Month + 4.3716%, 9.7108%‡,μ | 7,858,000 | 7,791,139 | |
FTAI Infra Escrow Holdings LLC, 10.5000%, 6/1/27ž | 13,378,000 | 14,164,185 | |
Hess Midstream Operations LP, 4.2500%, 2/15/30ž | 15,018,000 | 13,785,165 | |
Howard Midstream Energy Partners LLC, 7.3750%, 7/15/32ž | 12,671,000 | 12,868,096 | |
SM Energy Co, 5.6250%, 6/1/25 | 8,923,000 | 8,884,678 | |
Sunoco LP / Sunoco Finance Corp, 4.5000%, 4/30/30 | 8,262,000 | 7,642,595 | |
Tallgrass Energy Partners LP / Tallgrass Energy Finance Corp, 5.5000%, 1/15/28ž | 5,739,000 | 5,490,721 | |
Tallgrass Energy Partners LP / Tallgrass Energy Finance Corp, 6.0000%, 9/1/31ž | 1,155,000 | 1,079,402 | |
Venture Global LNG Inc, 9.5000%, 2/1/29ž | 6,486,666 | 7,103,525 | |
Viper Energy Partners LP, 7.3750%, 11/1/31ž | 6,090,000 | 6,307,340 | |
95,189,664 | |||
Finance Companies – 1.3% | |||
Blackstone Private Credit Fund, 6.2500%, 1/25/31ž | 5,660,000 | 5,627,492 | |
Blackstone Secured Lending Fund, 5.8750%, 11/15/27 | 3,916,000 | 3,887,544 | |
goeasy Ltd, 7.6250%, 7/1/29ž | 7,091,000 | 7,232,962 | |
Macquarie Airfinance Holdings Ltd, 6.5000%, 3/26/31ž | 9,650,000 | 9,923,230 | |
Navient Corp, 9.3750%, 7/25/30 | 8,997,000 | 9,460,111 | |
Oaktree Strategic Credit Fund, 8.4000%, 11/14/28ž | 1,905,000 | 2,013,604 | |
OWL Rock Core Income Corp, 4.7000%, 2/8/27 | 5,509,000 | 5,242,253 | |
PennyMac Financial Services Inc, 5.7500%, 9/15/31ž | 8,000,000 | 7,491,353 | |
Sixth Street Lending Partners, 6.5000%, 3/11/29ž | 3,515,000 | 3,475,010 | |
54,353,559 | |||
Financial Institutions – 0.7% | |||
Burford Capital Global Finance LLC, 6.2500%, 4/15/28ž | 4,962,000 | 4,796,460 | |
Burford Capital Global Finance LLC, 6.8750%, 4/15/30ž | 4,025,000 | 3,952,132 | |
GGAM Finance Ltd, 8.0000%, 6/15/28ž | 10,154,000 | 10,694,660 | |
Sagax AB, 1.1250%, 1/30/27 | 899,000 | EUR | 891,799 |
Sagax EURO MTN, 0.7500%, 1/26/28 | 7,196,000 | EUR | 6,840,731 |
27,175,782 | |||
Government Guarantee – 0.4% | |||
Ecopetrol SA, 8.3750%, 1/19/36 | 4,223,000 | 4,148,027 | |
Georgian Railway JSC, 4.0000%, 6/17/28 | 5,457,000 | 4,800,168 | |
Petroleos Mexicanos, 5.9500%, 1/28/31 | 10,596,000 | 8,538,944 | |
17,487,139 | |||
Independent Power and Renewable Electricity Producers – 0.2% | |||
NextEra Energy Partners LP, 2.5000%, 6/15/26ž | 10,151,000 | 9,262,820 | |
Insurance – 1.1% | |||
Aon North America Inc, 5.7500%, 3/1/54 | 4,133,000 | 4,042,302 | |
Arthur J Gallagher & Co, 6.5000%, 2/15/34 | 5,565,000 | 5,888,575 | |
Athene Global Funding, 2.6460%, 10/4/31ž | 5,897,000 | 4,845,756 | |
Broadstreet Partners Inc, 5.8750%, 4/15/29ž | 10,225,000 | 9,540,779 | |
Brown & Brown Inc, 4.9500%, 3/17/52 | 2,207,000 | 1,877,223 | |
Centene Corp, 3.3750%, 2/15/30 | 9,799,000 | 8,697,726 | |
Howden UK Refinance PLC / Howden UK Refinance 2 PLC / Howden US Refinance LLC, 7.2500%, 2/15/31ž | 4,074,000 | 4,043,544 | |
Humana Inc, 5.3750%, 4/15/31 | 7,809,000 | 7,767,538 | |
46,703,443 | |||
Mortgage Assets – 0.1% | |||
Banco La Hipotecaria SA, 4.1250%, 12/15/24ž | 5,000,000 | 4,965,087 | |
Natural Gas – 0.3% | |||
Engie SA, 5.8750%, 4/10/54ž | 1,784,000 | 1,718,207 | |
NiSource Inc, US Treasury Yield Curve Rate 5 Year + 2.4510%, 6.9500%, 11/30/54‡ | 11,335,000 | 11,387,118 | |
13,105,325 |
Schedule of Investments
June 30, 2024
Shares or Principal Amounts | Value | ||
Corporate Bonds – (continued) | |||
Real Estate Investment Trusts (REITs) – 0.5% | |||
Broadstone Net Lease LLC, 2.6000%, 9/15/31 | $5,585,000 | $4,438,320 | |
Lexington Realty Trust, 2.7000%, 9/15/30 | 2,280,000 | 1,923,639 | |
Rithm Capital Corp, 8.0000%, 4/1/29ž | 9,567,000 | 9,286,910 | |
Starwood Property Trust Inc, 7.2500%, 4/1/29ž,# | 2,893,000 | 2,924,017 | |
18,572,886 | |||
Technology – 1.9% | |||
Austin BidCo Inc, 7.1250%, 12/15/28ž | 8,552,000 | 7,869,805 | |
CA Magnum Holdings, 5.3750%, 10/31/26ž | 6,237,000 | 5,935,781 | |
Cloud Software Group Inc, 6.5000%, 3/31/29ž | 11,716,000 | 11,251,047 | |
Constellation Software Inc/Canada, 5.4610%, 2/16/34ž | 1,800,000 | 1,800,221 | |
Equinix Europe 2 Financing Corporation LLC, 5.5000%, 6/15/34 | 9,766,000 | 9,750,132 | |
Foundry JV Holdco LLC, 6.1500%, 1/25/32ž | 2,528,000 | 2,576,953 | |
Foundry JV Holdco LLC, 5.8750%, 1/25/34ž | 6,173,000 | 6,120,219 | |
Gartner Inc, 3.7500%, 10/1/30ž | 5,925,000 | 5,313,774 | |
Iron Mountain Inc, 4.5000%, 2/15/31ž | 3,754,000 | 3,388,648 | |
RingCentral Inc, 8.5000%, 8/15/30ž | 8,801,000 | 9,185,832 | |
Trimble Inc, 6.1000%, 3/15/33 | 4,883,000 | 5,056,385 | |
Western Digital Corp, 2.8500%, 2/1/29 | 9,546,000 | 8,284,211 | |
76,533,008 | |||
Transportation – 0.5% | |||
Cargo Aircraft Management Inc, 4.7500%, 2/1/28ž | 10,151,000 | 9,415,466 | |
Rand Parent LLC, 8.5000%, 2/15/30ž,# | 12,049,000 | 12,198,540 | |
21,614,006 | |||
Total Corporate Bonds (cost $957,709,403) | 962,471,515 | ||
Promissory Notes – 0.2% | |||
Development – 0.2% | |||
University of Michigan Student Housing Land Loan, 13.0000%, 3/7/25¢ (cost $6,277,953) | 6,277,953 | 6,277,953 | |
Foreign Government Bonds – 3.2% | |||
Arab Republic of Egypt Government Bond, 8.7500%, 9/30/51 | 5,208,000 | 3,912,281 | |
Commonwealth of the Bahamas Government Bond, 6.0000%, 11/21/28 | 3,391,000 | 2,962,886 | |
Dominican Republic Government Bond, 5.5000%, 2/22/29 | 10,497,000 | 10,126,166 | |
Government of Jamaica/The Bond, 8.0000%, 3/15/39 | 8,443,000 | 9,859,264 | |
Mongolia Government Bond, 5.1250%, 4/7/26 | 2,185,000 | 2,113,988 | |
Mongolia Government Bond, 3.5000%, 7/7/27 | 1,705,000 | 1,531,090 | |
Mongolia Government Bond, 4.4500%, 7/7/31 | 5,601,000 | 4,707,641 | |
Republic of Angola Government Bond, 8.0000%, 11/26/29 | 6,052,000 | 5,437,117 | |
Republic of Benin Government Bond, 4.8750%, 1/19/32 | 1,317,000 | EUR | 1,179,452 |
Republic of Benin Government Bond, 4.9500%, 1/22/35 | 2,400,000 | EUR | 2,030,239 |
Republic of Colombia Government Bond, 3.0000%, 1/30/30 | 3,510,000 | 2,867,703 | |
Republic of Colombia Government Bond, 3.1250%, 4/15/31 | 3,160,000 | 2,487,075 | |
Republic of Columbia Government Bond, 3.2500%, 4/22/32 | 6,867,000 | 5,253,124 | |
Republic of Costa Rica Government Bond, 7.1580%, 3/12/45 | 10,952,000 | 11,349,010 | |
Republic of Cote d'Ivoire Government Bond, 7.6250%, 1/30/33 | 4,330,000 | 4,200,100 | |
Republic of Georgia Government Bond, 2.7500%, 4/22/26 | 2,880,000 | 2,643,252 | |
Republic of Montenegro Government Bond, 7.2500%, 3/12/31ž | 1,790,000 | 1,795,370 | |
Republic of Mozambique Government Bond, 9.0000%, 9/15/31Ç | 2,682,000 | 2,215,893 | |
Republic of North Macedonia Government Bond, 6.9600%, 3/13/27 | 2,758,000 | EUR | 3,059,319 |
Republic of North Macedonia Government Bond, 1.6250%, 3/10/28 | 8,261,000 | EUR | 7,690,068 |
Republic of Trinidad & Tobago Government Bond, 6.4000%, 6/26/34ž | 12,919,000 | 12,809,265 | |
Republic of Turkiye Government Bond, 5.8750%, 5/21/30 | 8,045,000 | EUR | 8,625,796 |
Republic of Uzbekistan Government Bond, 7.8500%, 10/12/28ž | 5,692,000 | 5,871,127 | |
Republic of Uzbekistan Government Bond, 3.9000%, 10/19/31ž | 3,560,000 | 2,890,941 | |
Romania Government Bond, 5.2500%, 5/30/32ž | 5,520,000 | EUR | 5,760,086 |
Romania Government Bond, 2.0000%, 4/14/33 | 4,900,000 | EUR | 3,935,195 |
Romania Government Bond, 6.3750%, 1/30/34 | 4,034,000 | 4,057,026 | |
Total Foreign Government Bonds (cost $131,896,414) | 131,370,474 |
Schedule of Investments
June 30, 2024
Shares or Principal Amounts | Value | ||
Mortgage-Backed Securities – 22.9% | |||
Fannie Mae: | |||
2.5000%, TBA, 30 Year Maturity | $8,292,606 | $6,771,452 | |
3.0000%, TBA, 30 Year Maturity | 127,088,381 | 108,085,999 | |
3.5000%, TBA, 30 Year Maturity | 71,576,875 | 63,327,998 | |
4.0000%, TBA, 30 Year Maturity | 152,830,871 | 139,827,104 | |
4.5000%, TBA, 30 Year Maturity | 92,479,774 | 87,180,775 | |
5.0000%, TBA, 30 Year Maturity | 46,478,352 | 44,909,987 | |
5.5000%, TBA, 30 Year Maturity | 103,800,556 | 102,336,968 | |
6.0000%, TBA, 30 Year Maturity | 104,538,000 | 104,812,935 | |
6.5000%, TBA, 30 Year Maturity | 9,400,000 | 9,565,628 | |
666,818,846 | |||
Fannie Mae Pool: | |||
3.0000%, 10/1/34 | 112,408 | 104,924 | |
6.0000%, 2/1/37 | 536 | 554 | |
3.0000%, 9/1/42 | 903,677 | 798,442 | |
3.0000%, 1/1/43 | 1,168,972 | 1,032,843 | |
3.0000%, 2/1/43 | 470,175 | 415,422 | |
3.0000%, 2/1/43 | 32,387 | 28,577 | |
3.0000%, 3/1/43 | 1,487,558 | 1,312,574 | |
3.0000%, 3/1/43 | 421,398 | 371,829 | |
3.0000%, 5/1/43 | 345,765 | 305,092 | |
3.0000%, 5/1/43 | 1,751 | 1,545 | |
5.0000%, 7/1/44 | 4,680 | 4,629 | |
4.5000%, 10/1/44 | 3,118 | 3,025 | |
4.5000%, 3/1/45 | 4,848 | 4,703 | |
3.0000%, 7/1/45 | 1,796,408 | 1,585,094 | |
4.5000%, 2/1/46 | 6,850 | 6,646 | |
3.0000%, 9/1/46 | 841,954 | 743,907 | |
3.0000%, 11/1/46 | 298,491 | 259,650 | |
3.0000%, 1/1/47 | 44,761 | 38,937 | |
4.0000%, 5/1/47 | 731,161 | 682,234 | |
3.5000%, 1/1/48 | 2,644 | 2,393 | |
4.0000%, 1/1/48 | 10,189 | 9,507 | |
3.5000%, 3/1/48 | 2,889,318 | 2,600,085 | |
4.0000%, 3/1/48 | 3,055 | 2,848 | |
4.5000%, 12/1/48 | 456,491 | 438,784 | |
3.0000%, 9/1/49 | 331,622 | 291,381 | |
4.5000%, 12/1/50 | 4,530,490 | 4,331,903 | |
4.0000%, 10/1/51 | 24,507,049 | 22,733,260 | |
5.0000%, 6/1/53 | 7,875,995 | 7,732,133 | |
5.5000%, 6/1/53 | 9,524,123 | 9,479,336 | |
5.5000%, 6/1/53 | 150,751 | 150,007 | |
5.0000%, 7/1/53 | 26,840,258 | 26,306,364 | |
5.5000%, 7/1/53 | 432,660 | 430,012 | |
5.5000%, 7/1/53 | 260,388 | 259,063 | |
5.5000%, 9/1/53 | 14,785,435 | 14,709,025 | |
5.0000%, 12/1/53 | 498,387 | 488,822 | |
3.0000%, 2/1/57 | 4,700,797 | 3,953,939 | |
3.0000%, 6/1/57 | 20,300 | 17,051 | |
101,636,540 | |||
Freddie Mac Pool: | |||
3.0000%, 5/1/31 | 1,015,291 | 964,507 | |
3.0000%, 9/1/32 | 170,223 | 160,277 | |
3.0000%, 1/1/33 | 92,309 | 86,829 | |
3.0000%, 10/1/34 | 280,692 | 262,027 | |
3.0000%, 10/1/34 | 136,357 | 127,280 | |
6.0000%, 4/1/40 | 11,267 | 11,660 | |
3.0000%, 2/1/43 | 3,399 | 2,999 | |
3.0000%, 11/1/43 | 3,769,105 | 3,330,187 | |
4.5000%, 5/1/44 | 2,284 | 2,209 |
Schedule of Investments
June 30, 2024
Shares or Principal Amounts | Value | ||
Mortgage-Backed Securities – (continued) | |||
Freddie Mac Pool – (continued) | |||
3.5000%, 7/1/46 | $2,152 | $1,952 | |
4.0000%, 3/1/47 | 5,988 | 5,592 | |
3.5000%, 12/1/47 | 36,218 | 32,732 | |
3.5000%, 2/1/48 | 2,317 | 2,091 | |
4.0000%, 4/1/48 | 1,266 | 1,179 | |
4.5000%, 4/1/49 | 1,080,766 | 1,033,461 | |
4.0000%, 5/1/49 | 3,986,254 | 3,694,787 | |
3.5000%, 8/1/49 | 1,815,550 | 1,626,064 | |
3.0000%, 12/1/49 | 486,926 | 420,104 | |
3.0000%, 12/1/49 | 261,631 | 225,726 | |
4.5000%, 10/1/50 | 2,651,797 | 2,535,559 | |
5.5000%, 10/1/52 | 126,208 | 125,878 | |
5.0000%, 7/1/53 | 10,573,645 | 10,363,319 | |
5.5000%, 7/1/53 | 1,945,749 | 1,933,842 | |
5.5000%, 7/1/53 | 1,251,837 | 1,244,176 | |
5.0000%, 9/1/53 | 328,846 | 322,038 | |
6.0000%, 9/1/53 | 15,692,147 | 15,900,375 | |
5.0000%, 10/1/53 | 22,068,257 | 21,643,013 | |
66,059,863 | |||
Ginnie Mae: | |||
3.5000%, TBA, 30 Year Maturity | 98,660,539 | 88,612,654 | |
4.0000%, TBA, 30 Year Maturity | 16,054,402 | 14,836,444 | |
5.0000%, TBA, 30 Year Maturity | 7,343,765 | 7,150,203 | |
110,599,301 | |||
Ginnie Mae I Pool: | |||
4.5000%, 8/15/46 | 9,506 | 9,144 | |
4.0000%, 7/15/47 | 2,871 | 2,674 | |
4.0000%, 8/15/47 | 337 | 316 | |
4.0000%, 11/15/47 | 576 | 537 | |
4.0000%, 12/15/47 | 1,797 | 1,674 | |
14,345 | |||
Ginnie Mae II Pool: | |||
4.5000%, 2/20/48 | 89,543 | 86,178 | |
4.5000%, 5/20/48 | 2,080 | 2,002 | |
4.5000%, 5/20/48 | 798 | 768 | |
88,948 | |||
Total Mortgage-Backed Securities (cost $956,586,743) | 945,217,843 | ||
Common Stocks – 0.4% | |||
Health Care Providers & Services – 0.1% | |||
Surgery Partners Inc* | 172,012 | 4,092,165 | |
Professional Services – 0% | |||
Clarivate Analytics PLC* | 4,217 | 23,995 | |
Semiconductor & Semiconductor Equipment – 0.3% | |||
Advanced Micro Devices Inc* | 37,118 | 6,020,911 | |
Marvell Technology Inc | 83,936 | 5,867,126 | |
11,888,037 | |||
Total Common Stocks (cost $17,592,541) | 16,004,197 | ||
Preferred Stocks – 0% | |||
Consumer Cyclical – 0% | |||
Quiksilver Inc¢ | 12,688 | 10,785 | |
Finance Companies – 0% | |||
Castlelake Aircraft Securitization Trust 2018-1, 6/15/43‡ | 1,000,000 | 20,000 | |
Industrial – 0% | |||
Project Silver, 3/15/44ž | 1,500,000 | 138,750 | |
START Ireland, 3/15/44ž,‡ | 1,500,000 | 450,000 | |
Thunderbolt II Aircraft Lease Ltd, 9/15/38 | 10 | 157,034 | |
Thunderbolt III Aircraft Lease Ltd, 11/15/39ž,‡ | 5,000,000 | 250,000 | |
995,784 | |||
Total Preferred Stocks (cost $11,018,746) | 1,026,569 |
Schedule of Investments
June 30, 2024
Shares or Principal Amounts | Value | ||
Convertible Preferred Stocks – 0% | |||
Chemicals – 0% | |||
Albemarle Corp, 7.2500%, 3/1/27 (cost $2,093,600) | 41,872 | $1,953,748 | |
Private Preferred Equity – 0.1% | |||
Real Estate Preferred Equity – 0.1% | |||
Dawson Forest, 13.0000% (6.50% Cash or 6.50% PIK), 4/2/29Ø,¢ (cost $4,047,828) | 4,047,828 | 4,047,828 | |
Investment Companies – 3.6% | |||
Money Markets – 3.6% | |||
Janus Henderson Cash Liquidity Fund LLC, 5.3419%ºº,£ (cost $148,169,315) | 148,139,687 | 148,169,315 | |
Investments Purchased with Cash Collateral from Securities Lending – 0.4% | |||
Investment Companies – 0.3% | |||
Janus Henderson Cash Collateral Fund LLC, 5.2795%ºº,£ | 13,805,716 | 13,805,716 | |
Time Deposits – 0.1% | |||
Royal Bank of Canada, 5.3100%, 7/1/24 | $3,451,429 | 3,451,429 | |
Total Investments Purchased with Cash Collateral from Securities Lending (cost $17,257,145) | 17,257,145 | ||
Total Investments (total cost $5,031,116,145) – 120.5% | 4,975,264,766 | ||
Liabilities, net of Cash, Receivables and Other Assets – (20.5)% | (847,359,903) | ||
Net Assets – 100% | $4,127,904,863 |
Schedule of Investments
June 30, 2024
Summary of Investments by Country - (Long Positions) (unaudited) | ||
Country | Value | % of Investment Securities |
United States | $4,452,723,763 | 89.5 % |
Cayman Islands | 64,144,245 | 1.3 |
Canada | 62,693,924 | 1.3 |
United Kingdom | 55,664,243 | 1.1 |
France | 50,334,580 | 1.0 |
Germany | 30,668,427 | 0.6 |
Luxembourg | 21,689,017 | 0.4 |
Jersey | 14,845,066 | 0.3 |
Colombia | 14,755,929 | 0.3 |
Romania | 13,752,307 | 0.3 |
Trinidad and Tobago | 12,809,265 | 0.3 |
Netherlands | 12,000,751 | 0.2 |
Ireland | 11,659,608 | 0.2 |
Australia | 11,590,421 | 0.2 |
Costa Rica | 11,349,010 | 0.2 |
Macedonia The Former Yugoslav Republic Of | 10,749,387 | 0.2 |
Dominican Republic | 10,126,166 | 0.2 |
Jamaica | 9,859,264 | 0.2 |
Uzbekistan | 8,762,068 | 0.2 |
Turkey | 8,625,796 | 0.2 |
Mexico | 8,538,944 | 0.2 |
Mongolia | 8,352,719 | 0.2 |
Sweden | 7,732,530 | 0.2 |
Georgia | 7,443,420 | 0.2 |
Peru | 6,767,296 | 0.1 |
India | 5,935,781 | 0.1 |
Angola | 5,437,117 | 0.1 |
Macao | 5,374,117 | 0.1 |
Panama | 4,965,087 | 0.1 |
Cote D'Ivoire | 4,200,100 | 0.1 |
Egypt | 3,912,281 | 0.1 |
Benin | 3,209,691 | 0.1 |
Bahamas | 2,962,886 | 0.1 |
Mozambique | 2,215,893 | 0.1 |
Italy | 2,092,895 | 0.0 |
Switzerland | 2,039,752 | 0.0 |
Montenegro | 1,795,370 | 0.0 |
Zambia | 1,665,531 | 0.0 |
Finland | 1,370,119 | 0.0 |
Bermuda | 450,000 | 0.0 |
Total | $4,975,264,766 | 100.0 % |
Schedule of Investments
June 30, 2024
Schedule of Affiliated Investments - (% of Net Assets) | ||||||||
Affiliate | Affiliated Investments, at Value at 6/30/23 | Purchases | Sales Proceeds | Realized Gain/(Loss) | Change in Unrealized Appreciation/ Depreciation | Affiliated Investments, at Value at 6/30/24 | Ending Shares | Dividend Income |
Investment Companies - 3.6% | ||||||||
Money Markets - 3.6% | ||||||||
Janus Henderson Cash Liquidity Fund LLC, 5.3419%ºº | ||||||||
$136,328,921 | $1,695,831,320 | $(1,683,990,300) | $(980) | $354 | $148,169,315 | 148,139,687 | $7,019,587 | |
Investments Purchased with Cash Collateral from Securities Lending - 0.3% | ||||||||
Investment Companies - 0.3% | ||||||||
Janus Henderson Cash Collateral Fund LLC, 5.2795%ºº | ||||||||
14,706,842 | 114,686,230 | (115,587,356) | - | - | 13,805,716 | 13,805,716 | 181,750 ∆ | |
Total Affiliated Investments - 3.9% | ||||||||
$151,035,763 | $1,810,517,550 | $(1,799,577,656) | $(980) | $354 | $161,975,031 | 161,945,403 | $7,201,337 |
Schedule of Forward Foreign Currency Exchange Contracts | ||||
Counterparty/ Foreign Currency | Settlement Date | Foreign Currency Amount (Sold)/ Purchased | USD Currency Amount (Sold)/ Purchased | Market Value and Unrealized Appreciation/ (Depreciation) |
BNP Paribas: | ||||
British Pound | 8/8/24 | 5,947,973 | $(7,564,209) | $(44,617) |
British Pound | 8/8/24 | (5,947,973) | 7,548,211 | 28,619 |
Canadian Dollar | 8/8/24 | 20,583 | (15,045) | 17 |
Canadian Dollar | 8/8/24 | 20,583 | (15,117) | (55) |
Canadian Dollar | 8/8/24 | (4,853,986) | 3,569,160 | 17,223 |
Euro | 8/8/24 | 9,967,275 | (10,854,871) | (161,022) |
Euro | 8/8/24 | (180,195,846) | 196,462,705 | 3,131,278 |
Euro | 8/8/24 | 2,552,515 | (2,731,827) | 6,757 |
Total | $2,978,200 |
Schedule of Futures | ||||
Description | Number of Contracts | Expiration Date | Notional Amount | Value and Unrealized Appreciation/(Depreciation) |
Futures Long: | ||||
10 Year US Treasury Note | 2,920 | 9/30/24 | $321,154,375 | $5,482,805 |
2 Year US Treasury Note | 1,548 | 10/3/24 | 316,130,625 | 1,100,539 |
5 Year US Treasury Note | 6,990 | 10/3/24 | 744,981,094 | 6,771,765 |
Total - Futures Long | 13,355,109 | |||
Futures Short: | ||||
Ultra 10-Year Treasury Note | 1,589 | 9/30/24 | (180,401,156) | (3,815,858) |
Ultra Long Term US Treasury Bond | 80 | 9/30/24 | (10,027,500) | (378,353) |
US Treasury Long Bond | 59 | 9/30/24 | (6,980,438) | (217,937) |
Total - Futures Short | (4,412,148) | |||
Total | $8,942,961 |
Schedule of Investments
June 30, 2024
Fair Value of Derivative Instruments (not accounted for as hedging instruments) as of June 30, 2024 | |||
Currency Contracts | Interest Rate Contracts | Total | |
Asset Derivatives: | |||
Forward foreign currency exchange contracts | $3,183,894 | $- | $3,183,894 |
*Futures contracts | 13,355,109 | $13,355,109 | |
Total Asset Derivatives | $3,183,894 | $13,355,109 | $16,539,003 |
Liability Derivatives: | |||
Forward foreign currency exchange contracts | $205,694 | $- | $205,694 |
*Futures contracts | 4,412,148 | $4,412,148 | |
Total Liability Derivatives | $205,694 | $4,412,148 | $4,617,842 |
* | The fair value presented includes net cumulative unrealized appreciation (depreciation) on futures contracts and centrally cleared swaps. In the Statement of Assets and Liabilities, only current day's variation margin is reported in receivables or payables and the net cumulative unrealized appreciation (depreciation) is included in total distributable earnings (loss). |
The effect of Derivative Instruments (not accounted for as hedging instruments) on the Statement of Operations for the year ended June 30, 2024 | ||||
Amount of Realized Gain/(Loss) Recognized on Derivatives | ||||
Derivative | Credit Contracts | Currency Contracts | Interest Rate Contracts | Total |
Futures contracts | $- | $- | $(55,078,456) | $(55,078,456) |
Forward foreign currency exchange contracts | - | 2,318,297 | - | $2,318,297 |
Swap contracts | 89,457 | - | - | $89,457 |
Total | $89,457 | $2,318,297 | $(55,078,456) | $(52,670,702) |
Amount of Change in Unrealized Appreciation/Depreciation Recognized on Derivatives | |||
Derivative | Currency Contracts | Interest Rate Contracts | Total |
Futures contracts | $- | $17,265,427 | $17,265,427 |
Forward foreign currency exchange contracts | 3,028,917 | - | $3,028,917 |
Total | $3,028,917 | $17,265,427 | $20,294,344 |
Schedule of Investments
June 30, 2024
Average Ending Monthly Value of Derivative Instruments During the Year Ended June 30, 2024 | |
Credit default swaps: | |
Average notional amount - buy protection | $40,984,615 |
Forward foreign currency exchange contracts: | |
Average amounts purchased - in USD | 8,179,697 |
Average amounts sold - in USD | 130,775,287 |
Futures contracts: | |
Average notional amount of contracts - long | 1,168,215,620 |
Average notional amount of contracts - short | 405,548,575 |
Offsetting of Financial Assets and Derivative Assets | ||||
Counterparty | Gross Amounts of Recognized Assets | Offsetting Asset or Liability(a) | Collateral Pledged(b) | Net Amount |
BNP Paribas | $3,183,894 | $(205,694) | $— | $2,978,200 |
JPMorgan Chase Bank, National Association | 16,576,654 | — | (16,576,654) | — |
Total | $19,760,548 | $(205,694) | $(16,576,654) | $2,978,200 |
Offsetting of Financial Liabilities and Derivative Liabilities | ||||
Counterparty | Gross Amounts of Recognized Liabilities | Offsetting Asset or Liability(a) | Collateral Pledged(b) | Net Amount |
BNP Paribas | $205,694 | $(205,694) | $— | $— |
(a) | Represents the amount of assets or liabilities that could be offset with the same counterparty under master netting or similar agreements that management elects not to offset on the Statement of Assets and Liabilities. |
(b) | Collateral pledged is limited to the net outstanding amount due to/from an individual counterparty. The actual collateral amounts pledged may exceed these amounts and may fluctuate in value. |
Notes to Schedule of Investments and Other Information
EURIBOR | Euro Interbank Offered Rate |
ICE | Intercontinental Exchange |
LIBOR | London Interbank Offered Rate |
LLC | Limited Liability Company |
LP | Limited Partnership |
MTN | Medium Term Note |
PIK | Pay-in-kind (PIK) bonds give the issuer an option to make the interest payment in cash or additional securities. |
PLC | Public Limited Company |
SOFR | Secured Overnight Financing Rate |
TBA | (To Be Announced) Securities are purchased/sold on a forward commitment basis with an approximate principal amount and no defined maturity date. The actual principal and maturity date will be determined upon settlement when specific mortgage pools are assigned. |
ULC | Unlimited Liability Company |
ž | Securities sold under Rule 144A of the Securities Act of 1933, as amended, are subject to legal and/or contractual restrictions on resale and may not be publicly sold without registration under the 1933 Act. Unless otherwise noted, these securities have been determined to be liquid under guidelines established by the Board of Trustees. The total value of 144A securities as of the year ended June 30, 2024 is $2,880,455,383, which represents 69.8% of net assets. |
* | Non-income producing security. |
ƒ | All or a portion of this position is not funded, or has been purchased on a delayed delivery or when-issued basis. If applicable, interest rates will be determined and interest will begin to accrue at a future date. See Notes to Financial Statements. |
‡ | Variable or floating rate security. Rate shown is the current rate as of June 30, 2024. Certain variable rate securities are not based on a published reference rate and spread; they are determined by the issuer or agent and current market conditions. Reference rate is as of reset date and may vary by security, which may not indicate a reference rate and/or spread in their description. |
ºº | Rate shown is the 7-day yield as of June 30, 2024. |
# | Loaned security; a portion of the security is on loan at June 30, 2024. |
μ | Perpetual security. Perpetual securities have no stated maturity date, but they may be called/redeemed by the issuer. The date indicated, if any, represents the next call date. |
Ç | Step bond. The coupon rate will increase or decrease periodically based upon a predetermined schedule. The rate shown reflects the current rate. |
◊ | Zero coupon bond. |
¤ | Interest only security. An interest only security represents the interest only portion of a pool of underlying mortgages or mortgage-backed securities which are separated and sold individually from the principal portion of the securities. Principal amount shown represents the par value on which interest payments are based. |
Ø | Payment-in-kind security which may pay interest/dividends in additional par/shares and/or in cash. Rates shown are the current rate and possible payment rates. |
€ | Security is in default, thus not accruing interest income. The rate and maturity date shown is as of the contractual maturity date. |
¢ | Security is valued using significant unobservable inputs. The total value of Level 3 securities as of the year ended June 30, 2024 is $10,336,566, which represents 0.3% of net assets. |
£ | The Fund may invest in certain securities that are considered affiliated companies. As defined by the Investment Company Act of 1940, as amended, an affiliated company is one in which the Fund owns 5% or more of the outstanding voting securities, or a company which is under common ownership or control. |
∆ | Net of income paid to the securities lending agent and rebates paid to the borrowing counterparties. |
Notes to Schedule of Investments and Other Information
Valuation Inputs Summary | |||
Level 1 - Quoted Prices | Level 2 - Other Significant Observable Inputs | Level 3 - Significant Unobservable Inputs | |
Assets | |||
Investments In Securities: | |||
Asset-Backed/Commercial Mortgage-Backed Securities | $- | $2,298,511,713 | $- |
Bank Loans and Mezzanine Loans | - | 442,956,466 | - |
Corporate Bonds | - | 962,471,515 | - |
Promissory Notes | - | - | 6,277,953 |
Foreign Government Bonds | - | 131,370,474 | - |
Mortgage-Backed Securities | - | 945,217,843 | - |
Common Stocks | 16,004,197 | - | - |
Preferred Stocks | - | 1,015,784 | 10,785 |
Convertible Preferred Stocks | 1,953,748 | - | - |
Private Preferred Equity | - | - | 4,047,828 |
Investment Companies | - | 148,169,315 | - |
Investments Purchased with Cash Collateral from Securities Lending | - | 17,257,145 | - |
Total Investments in Securities | $17,957,945 | $4,946,970,255 | $10,336,566 |
Other Financial Instruments(a): | |||
Forward Foreign Currency Exchange Contracts | - | 3,183,894 | - |
Futures Contracts | 13,355,109 | - | - |
Total Assets | $31,313,054 | $4,950,154,149 | $10,336,566 |
Liabilities | |||
Other Financial Instruments(a): | |||
Forward Foreign Currency Exchange Contracts | $- | $205,694 | $- |
Futures Contracts | 4,412,148 | - | - |
Total Liabilities | $4,412,148 | $205,694 | $- |
(a) | Other financial instruments may include forward foreign currency exchange contracts, futures, written options, written swaptions, and swap contracts. Forward foreign currency exchange contracts, futures contracts, and swap contracts are reported at their unrealized appreciation/(depreciation) at measurement date, which represents the change in the contract's value from trade date. Written options and written swaptions are reported at their market value at measurement date. |
Statement of Assets and Liabilities
June 30, 2024
Assets: | |
Unaffiliated investments, at value (cost $4,869,141,114)(1) | $4,813,289,735 |
Affiliated investments, at value (cost $161,975,031) | 161,975,031 |
Cash | 3,391,672 |
Collateral for To Be Announced transactions | 1,000,000 |
Deposits with brokers for futures | 13,710,000 |
Forward foreign currency exchange contracts | 3,183,894 |
Cash denominated in foreign currency (cost $275,900) | 275,900 |
Variation margin receivable on futures contracts | 961,172 |
Trustees' deferred compensation | 113,119 |
Receivables: | |
Investments sold | 39,991,507 |
Interest | 32,744,490 |
Fund shares sold | 8,021,336 |
Dividends from affiliates | 557,163 |
Dividends | 39,228 |
Other assets | 539,211 |
Total Assets | 5,079,793,458 |
Liabilities: | |
Collateral for securities loaned (Note 3) | 17,257,145 |
Forward foreign currency exchange contracts | 205,694 |
Variation margin payable on futures contracts | 1,576,438 |
Payables: | |
TBA investments purchased | 782,762,835 |
Investments purchased | 135,412,342 |
Fund shares repurchased | 11,247,109 |
Advisory fees | 1,862,548 |
Dividends | 560,548 |
Transfer agent fees and expenses | 486,065 |
Trustees' deferred compensation fees | 113,119 |
Professional fees | 91,875 |
12b-1 Distribution and shareholder servicing fees | 65,712 |
Trustees' fees and expenses | 19,800 |
Affiliated fund administration fees payable | 8,392 |
Custodian fees | 4,005 |
Accrued expenses and other payables | 214,968 |
Total Liabilities | 951,888,595 |
Commitments and contingent liabilities (Note 4) | |
Net Assets | $4,127,904,863 |
Statement of Assets and Liabilities
June 30, 2024
Net Assets Consist of: | |
Capital (par value and paid-in surplus) | $4,616,588,769 |
Total distributable earnings (loss) | (488,683,906) |
Total Net Assets | $4,127,904,863 |
Net Assets - Class A Shares | $49,636,820 |
Shares Outstanding, $0.01 Par Value (unlimited shares authorized) | 5,822,251 |
Net Asset Value Per Share(2) | $8.53 |
Maximum Offering Price Per Share(3) | $8.96 |
Net Assets - Class C Shares | $67,406,980 |
Shares Outstanding, $0.01 Par Value (unlimited shares authorized) | 7,904,375 |
Net Asset Value Per Share(2) | $8.53 |
Net Assets - Class D Shares | $96,045,947 |
Shares Outstanding, $0.01 Par Value (unlimited shares authorized) | 11,262,235 |
Net Asset Value Per Share | $8.53 |
Net Assets - Class I Shares | $3,750,735,717 |
Shares Outstanding, $0.01 Par Value (unlimited shares authorized) | 439,932,695 |
Net Asset Value Per Share | $8.53 |
Net Assets - Class N Shares | $79,742,809 |
Shares Outstanding, $0.01 Par Value (unlimited shares authorized) | 9,350,533 |
Net Asset Value Per Share | $8.53 |
Net Assets - Class S Shares | $3,516,635 |
Shares Outstanding, $0.01 Par Value (unlimited shares authorized) | 412,648 |
Net Asset Value Per Share | $8.52 |
Net Assets - Class T Shares | $80,819,955 |
Shares Outstanding, $0.01 Par Value (unlimited shares authorized) | 9,480,529 |
Net Asset Value Per Share | $8.52 |
(1) | Includes $16,576,654 of securities on loan. See Note 3 in Notes to Financial Statements. |
(2) | Redemption price per share may be reduced for any applicable contingent deferred sales charge. |
(3) | Maximum offering price is computed at 100/95.25 of net asset value. |
Statement of Operations
For the year ended June 30, 2024
Investment Income: | |
Interest | $257,254,593 |
Dividends from affiliates | 7,019,587 |
Affiliated securities lending income, net | 181,750 |
Dividends | 158,005 |
Unaffiliated securities lending income, net | 48,084 |
Other income | 1,361,408 |
Foreign tax withheld | (608) |
Total Investment Income | 266,022,819 |
Expenses: | |
Advisory fees | 19,108,280 |
12b-1 Distribution and shareholder servicing fees: | |
Class A Shares | 101,997 |
Class C Shares | 581,529 |
Class S Shares | 6,775 |
Transfer agent administrative fees and expenses: | |
Class D Shares | 100,575 |
Class S Shares | 6,775 |
Class T Shares | 208,034 |
Transfer agent networking and omnibus fees: | |
Class A Shares | 24,225 |
Class C Shares | 44,899 |
Class I Shares | 3,050,593 |
Other transfer agent fees and expenses: | |
Class A Shares | 2,042 |
Class C Shares | 2,368 |
Class D Shares | 12,609 |
Class I Shares | 135,836 |
Class N Shares | 3,500 |
Class S Shares | 51 |
Class T Shares | 916 |
Registration fees | 317,388 |
Shareholder reports expense | 207,266 |
Professional fees | 131,781 |
Affiliated fund administration fees | 85,952 |
Trustees' fees and expenses | 75,506 |
Custodian fees | 64,703 |
Other expenses | 509,574 |
Total Expenses | 24,783,174 |
Less: Excess Expense Reimbursement and Waivers | (9,113) |
Net Expenses | 24,774,061 |
Net Investment Income/(Loss) | 241,248,758 |
Statement of Operations
For the year ended June 30, 2024
Net Realized Gain/(Loss) on Investments: | |
Investments and foreign currency transactions | $(71,209,389) |
Investments in affiliates | (980) |
Forward foreign currency exchange contracts | 2,318,297 |
Futures contracts | (55,078,456) |
Swap contracts | 89,457 |
Total Net Realized Gain/(Loss) on Investments | (123,881,071) |
Change in Unrealized Net Appreciation/Depreciation: | |
Investments, foreign currency translations and Trustees' deferred compensation | 144,761,964 |
Investments in affiliates | 354 |
Forward foreign currency exchange contracts | 3,028,917 |
Futures contracts | 17,265,427 |
Total Change in Unrealized Net Appreciation/Depreciation | 165,056,662 |
Net Increase/(Decrease) in Net Assets Resulting from Operations | $282,424,349 |
Statements of Changes in Net Assets
Year ended June 30, 2024 | Year ended June 30, 2023 | |
Operations: | ||
Net investment income/(loss) | $241,248,758 | $165,702,263 |
Net realized gain/(loss) on investments | (123,881,071) | (234,686,417) |
Change in unrealized net appreciation/depreciation | 165,056,662 | 138,649,078 |
Net Increase/(Decrease) in Net Assets Resulting from Operations | 282,424,349 | 69,664,924 |
Dividends and Distributions to Shareholders: | ||
Class A Shares | (2,788,599) | (2,385,795) |
Class C Shares | (3,572,548) | (2,901,630) |
Class D Shares | (6,186,408) | (5,127,265) |
Class I Shares | (217,673,174) | (144,264,596) |
Class N Shares | (5,932,537) | (4,351,757) |
Class S Shares | (179,184) | (78,993) |
Class T Shares | (5,752,310) | (6,949,103) |
Total Dividends and Distributions to Shareholders | (242,084,760) | (166,059,139) |
Return of Capital on Dividends and Distributions: | ||
Class A Shares | — | (38,203) |
Class C Shares | — | (46,463) |
Class D Shares | — | (82,101) |
Class I Shares | — | (2,310,054) |
Class N Shares | — | (69,683) |
Class S Shares | — | (1,265) |
Class T Shares | — | (111,273) |
Total Return of Capital on Dividends and Distributions | — | (2,659,042) |
Net Decrease from Dividends and Distributions to Shareholders | (242,084,760) | (168,718,181) |
Capital Share Transactions: | ||
Class A Shares | 15,037,062 | (13,711,287) |
Class C Shares | 11,436,659 | (5,080,081) |
Class D Shares | 9,302,378 | (2,303,288) |
Class I Shares | 1,164,053,770 | 111,338,742 |
Class N Shares | 4,936,786 | 7,846,063 |
Class S Shares | 1,459,152 | 867,431 |
Class T Shares | (14,811,537) | (58,394,849) |
Net Increase/(Decrease) from Capital Share Transactions | 1,191,414,270 | 40,562,731 |
Net Increase/(Decrease) in Net Assets | 1,231,753,859 | (58,490,526) |
Net Assets: | ||
Beginning of period | 2,896,151,004 | 2,954,641,530 |
End of period | $4,127,904,863 | $2,896,151,004 |
Financial Highlights
Class A Shares | |||||
For a share outstanding during the year ended June 30 | 2024 | 2023 | 2022 | 2021 | 2020 |
Net Asset Value, Beginning of Period | $8.44 | $8.73 | $10.12 | $9.47 | $9.89 |
Income/(Loss) from Investment Operations: | |||||
Net investment income/(loss)(1) | 0.57 | 0.48 | 0.33 | 0.39 | 0.40 |
Net realized and unrealized gain/(loss) | 0.09 | (0.27) | (1.33) | 0.67 | (0.34) |
Total from Investment Operations | 0.66 | 0.21 | (1.00) | 1.06 | 0.06 |
Less Dividends and Distributions: | |||||
Dividends (from net investment income) | (0.57) | (0.49) | (0.36) | (0.41) | (0.40) |
Distributions (from capital gains) | — | — | (0.03) | — | (0.05) |
Return of capital | — | (0.01) | — (2) | — | (0.03) |
Total Dividends and Distributions | (0.57) | (0.50) | (0.39) | (0.41) | (0.48) |
Net Asset Value, End of Period | $8.53 | $8.44 | $8.73 | $10.12 | $9.47 |
Total Return* | 8.15% | 2.50% | (10.18)% | 11.38% (3) | 0.61% |
Net Assets, End of Period (in thousands) | $49,637 | $34,132 | $49,566 | $67,032 | $49,168 |
Ratios to Average Net Assets**: | |||||
Ratio of Gross Expenses | 0.91% | 0.93% | 0.90% | 0.91% | 0.92% |
Ratio of Net Expenses (After Waivers and Expense Offsets) | 0.91% | 0.93% | 0.90% | 0.91% | 0.92% |
Ratio of Net Investment Income/(Loss) | 6.78% | 5.64% | 3.43% | 3.91% | 4.19% |
Portfolio Turnover Rate(4) | 58% | 62% | 75% | 119% | 188% |
* | Total return includes adjustments in accordance with generally accepted accounting principles required at the year or period end and are not annualized for periods of less than one full year. Returns shown exclude any applicable sales charges. |
** | Annualized for periods of less than one full year. |
(1) | Per share amounts are calculated based on average shares outstanding during the year or period. |
(2) | Less than $0.005 on a per share basis. |
(3) | 0.01% of the Fund’s total return consists of a voluntary reimbursement by the Adviser for realized investment losses and another 0.04% consists of a gain on an investment not meeting the investment guidelines of the Fund. Excluding these items, total return would have been 11.33%. |
(4) | Portfolio Turnover Rate excludes TBA (to be announced) purchase and sales commitments. |
Financial Highlights
Class C Shares | |||||
For a share outstanding during the year ended June 30 | 2024 | 2023 | 2022 | 2021 | 2020 |
Net Asset Value, Beginning of Period | $8.44 | $8.74 | $10.12 | $9.47 | $9.89 |
Income/(Loss) from Investment Operations: | |||||
Net investment income/(loss)(1) | 0.51 | 0.43 | 0.26 | 0.32 | 0.33 |
Net realized and unrealized gain/(loss) | 0.09 | (0.29) | (1.33) | 0.67 | (0.35) |
Total from Investment Operations | 0.60 | 0.14 | (1.07) | 0.99 | (0.02) |
Less Dividends and Distributions: | |||||
Dividends (from net investment income) | (0.51) | (0.43) | (0.28) | (0.34) | (0.33) |
Distributions (from capital gains) | — | — | (0.03) | — | (0.05) |
Return of capital | — | (0.01) | — (2) | — | (0.02) |
Total Dividends and Distributions | (0.51) | (0.44) | (0.31) | (0.34) | (0.40) |
Net Asset Value, End of Period | $8.53 | $8.44 | $8.74 | $10.12 | $9.47 |
Total Return* | 7.35% | 1.65% | (10.75)% | 10.58% (3) | (0.18)% |
Net Assets, End of Period (in thousands) | $67,407 | $55,343 | $62,504 | $71,133 | $63,574 |
Ratios to Average Net Assets**: | |||||
Ratio of Gross Expenses | 1.66% | 1.64% | 1.66% | 1.64% | 1.71% |
Ratio of Net Expenses (After Waivers and Expense Offsets) | 1.66% | 1.64% | 1.66% | 1.64% | 1.71% |
Ratio of Net Investment Income/(Loss) | 6.03% | 4.99% | 2.70% | 3.19% | 3.43% |
Portfolio Turnover Rate(4) | 58% | 62% | 75% | 119% | 188% |
* | Total return includes adjustments in accordance with generally accepted accounting principles required at the year or period end and are not annualized for periods of less than one full year. Returns shown exclude any applicable sales charges. |
** | Annualized for periods of less than one full year. |
(1) | Per share amounts are calculated based on average shares outstanding during the year or period. |
(2) | Less than $0.005 on a per share basis. |
(3) | 0.01% of the Fund’s total return consists of a voluntary reimbursement by the Adviser for realized investment losses and another 0.04% consists of a gain on an investment not meeting the investment guidelines of the Fund. Excluding these items, total return would have been 10.53%. |
(4) | Portfolio Turnover Rate excludes TBA (to be announced) purchase and sales commitments. |
Financial Highlights
Class D Shares | |||||
For a share outstanding during the year ended June 30 | 2024 | 2023 | 2022 | 2021 | 2020 |
Net Asset Value, Beginning of Period | $8.44 | $8.74 | $10.12 | $9.47 | $9.89 |
Income/(Loss) from Investment Operations: | |||||
Net investment income/(loss)(1) | 0.59 | 0.50 | 0.35 | 0.40 | 0.42 |
Net realized and unrealized gain/(loss) | 0.09 | (0.29) | (1.33) | 0.68 | (0.35) |
Total from Investment Operations | 0.68 | 0.21 | (0.98) | 1.08 | 0.07 |
Less Dividends and Distributions: | |||||
Dividends (from net investment income) | (0.59) | (0.50) | (0.37) | (0.43) | (0.41) |
Distributions (from capital gains) | — | — | (0.03) | — | (0.05) |
Return of capital | — | (0.01) | — (2) | — | (0.03) |
Total Dividends and Distributions | (0.59) | (0.51) | (0.40) | (0.43) | (0.49) |
Net Asset Value, End of Period | $8.53 | $8.44 | $8.74 | $10.12 | $9.47 |
Total Return* | 8.34% | 2.55% | (9.93)% | 11.57% (3) | 0.77% |
Net Assets, End of Period (in thousands) | $96,046 | $85,806 | $91,299 | $108,418 | $78,091 |
Ratios to Average Net Assets**: | |||||
Ratio of Gross Expenses | 0.74% | 0.76% | 0.73% | 0.74% | 0.76% |
Ratio of Net Expenses (After Waivers and Expense Offsets) | 0.74% | 0.76% | 0.73% | 0.74% | 0.76% |
Ratio of Net Investment Income/(Loss) | 6.96% | 5.88% | 3.61% | 4.07% | 4.30% |
Portfolio Turnover Rate(4) | 58% | 62% | 75% | 119% | 188% |
* | Total return includes adjustments in accordance with generally accepted accounting principles required at the year or period end and are not annualized for periods of less than one full year. |
** | Annualized for periods of less than one full year. |
(1) | Per share amounts are calculated based on average shares outstanding during the year or period. |
(2) | Less than $0.005 on a per share basis. |
(3) | 0.01% of the Fund’s total return consists of a voluntary reimbursement by the Adviser for realized investment losses and another 0.04% consists of a gain on an investment not meeting the investment guidelines of the Fund. Excluding these items, total return would have been 11.52%. |
(4) | Portfolio Turnover Rate excludes TBA (to be announced) purchase and sales commitments. |
Financial Highlights
Class I Shares | |||||
For a share outstanding during the year ended June 30 | 2024 | 2023 | 2022 | 2021 | 2020 |
Net Asset Value, Beginning of Period | $8.44 | $8.73 | $10.12 | $9.47 | $9.88 |
Income/(Loss) from Investment Operations: | |||||
Net investment income/(loss)(1) | 0.59 | 0.51 | 0.36 | 0.41 | 0.43 |
Net realized and unrealized gain/(loss) | 0.09 | (0.29) | (1.34) | 0.67 | (0.34) |
Total from Investment Operations | 0.68 | 0.22 | (0.98) | 1.08 | 0.09 |
Less Dividends and Distributions: | |||||
Dividends (from net investment income) | (0.59) | (0.50) | (0.38) | (0.43) | (0.42) |
Distributions (from capital gains) | — | — | (0.03) | — | (0.05) |
Return of capital | — | (0.01) | — (2) | — | (0.03) |
Total Dividends and Distributions | (0.59) | (0.51) | (0.41) | (0.43) | (0.50) |
Net Asset Value, End of Period | $8.53 | $8.44 | $8.73 | $10.12 | $9.47 |
Total Return* | 8.39% | 2.72% | (9.99)% | 11.63% (3) | 0.93% |
Net Assets, End of Period (in thousands) | $3,750,736 | $2,550,145 | $2,522,907 | $2,570,289 | $1,805,985 |
Ratios to Average Net Assets**: | |||||
Ratio of Gross Expenses | 0.70% | 0.72% | 0.69% | 0.69% | 0.70% |
Ratio of Net Expenses (After Waivers and Expense Offsets) | 0.70% | 0.72% | 0.69% | 0.69% | 0.70% |
Ratio of Net Investment Income/(Loss) | 7.01% | 5.95% | 3.68% | 4.13% | 4.42% |
Portfolio Turnover Rate(4) | 58% | 62% | 75% | 119% | 188% |
* | Total return includes adjustments in accordance with generally accepted accounting principles required at the year or period end and are not annualized for periods of less than one full year. |
** | Annualized for periods of less than one full year. |
(1) | Per share amounts are calculated based on average shares outstanding during the year or period. |
(2) | Less than $0.005 on a per share basis. |
(3) | 0.01% of the Fund’s total return consists of a voluntary reimbursement by the Adviser for realized investment losses and another 0.04% consists of a gain on an investment not meeting the investment guidelines of the Fund. Excluding these items, total return would have been 11.58%. |
(4) | Portfolio Turnover Rate excludes TBA (to be announced) purchase and sales commitments. |
Financial Highlights
Class N Shares | |||||
For a share outstanding during the year ended June 30 | 2024 | 2023 | 2022 | 2021 | 2020 |
Net Asset Value, Beginning of Period | $8.44 | $8.74 | $10.12 | $9.47 | $9.89 |
Income/(Loss) from Investment Operations: | |||||
Net investment income/(loss)(1) | 0.60 | 0.51 | 0.37 | 0.42 | 0.44 |
Net realized and unrealized gain/(loss) | 0.09 | (0.29) | (1.33) | 0.67 | (0.36) |
Total from Investment Operations | 0.69 | 0.22 | (0.96) | 1.09 | 0.08 |
Less Dividends and Distributions: | |||||
Dividends (from net investment income) | (0.60) | (0.51) | (0.39) | (0.44) | (0.42) |
Distributions (from capital gains) | — | — | (0.03) | — | (0.05) |
Return of capital | — | (0.01) | — (2) | — | (0.03) |
Total Dividends and Distributions | (0.60) | (0.52) | (0.42) | (0.44) | (0.50) |
Net Asset Value, End of Period | $8.53 | $8.44 | $8.74 | $10.12 | $9.47 |
Total Return* | 8.49% | 2.70% | (9.80)% | 11.73% (3) | 0.90% |
Net Assets, End of Period (in thousands) | $79,743 | $73,779 | $68,120 | $121,983 | $88,092 |
Ratios to Average Net Assets**: | |||||
Ratio of Gross Expenses | 0.60% | 0.62% | 0.59% | 0.60% | 0.63% |
Ratio of Net Expenses (After Waivers and Expense Offsets) | 0.60% | 0.62% | 0.59% | 0.60% | 0.63% |
Ratio of Net Investment Income/(Loss) | 7.09% | 6.06% | 3.73% | 4.21% | 4.68% |
Portfolio Turnover Rate(4) | 58% | 62% | 75% | 119% | 188% |
* | Total return includes adjustments in accordance with generally accepted accounting principles required at the year or period end and are not annualized for periods of less than one full year. |
** | Annualized for periods of less than one full year. |
(1) | Per share amounts are calculated based on average shares outstanding during the year or period. |
(2) | Less than $0.005 on a per share basis. |
(3) | 0.01% of the Fund’s total return consists of a voluntary reimbursement by the Adviser for realized investment losses and another 0.04% consists of a gain on an investment not meeting the investment guidelines of the Fund. Excluding these items, total return would have been 11.68%. |
(4) | Portfolio Turnover Rate excludes TBA (to be announced) purchase and sales commitments. |
Financial Highlights
Class S Shares | |||||
For a share outstanding during the year ended June 30 | 2024 | 2023 | 2022 | 2021 | 2020 |
Net Asset Value, Beginning of Period | $8.43 | $8.73 | $10.11 | $9.46 | $9.91 |
Income/(Loss) from Investment Operations: | |||||
Net investment income/(loss)(1) | 0.55 | 0.48 | 0.32 | 0.39 | 0.39 |
Net realized and unrealized gain/(loss) | 0.10 | (0.30) | (1.34) | 0.67 | (0.37) |
Total from Investment Operations | 0.65 | 0.18 | (1.02) | 1.06 | 0.02 |
Less Dividends and Distributions: | |||||
Dividends (from net investment income) | (0.56) | (0.47) | (0.33) | (0.41) | (0.39) |
Distributions (from capital gains) | — | — | (0.03) | — | (0.05) |
Return of capital | — | (0.01) | — (2) | — | (0.03) |
Total Dividends and Distributions | (0.56) | (0.48) | (0.36) | (0.41) | (0.47) |
Net Asset Value, End of Period | $8.52 | $8.43 | $8.73 | $10.11 | $9.46 |
Total Return* | 7.92% | 2.16% | (10.30)% | 11.32% (3) | 0.19% |
Net Assets, End of Period (in thousands) | $3,517 | $2,030 | $1,202 | $745 | $987 |
Ratios to Average Net Assets**: | |||||
Ratio of Gross Expenses | 1.20% | 1.34% | 1.45% | 1.33% | 1.43% |
Ratio of Net Expenses (After Waivers and Expense Offsets) | 1.14% | 1.15% | 1.15% | 0.98% | 1.03% |
Ratio of Net Investment Income/(Loss) | 6.57% | 5.66% | 3.33% | 3.88% | 4.05% |
Portfolio Turnover Rate(4) | 58% | 62% | 75% | 119% | 188% |
* | Total return includes adjustments in accordance with generally accepted accounting principles required at the year or period end and are not annualized for periods of less than one full year. |
** | Annualized for periods of less than one full year. |
(1) | Per share amounts are calculated based on average shares outstanding during the year or period. |
(2) | Less than $0.005 on a per share basis. |
(3) | 0.01% of the Fund’s total return consists of a voluntary reimbursement by the Adviser for realized investment losses and another 0.04% consists of a gain on an investment not meeting the investment guidelines of the Fund. Excluding these items, total return would have been 11.27%. |
(4) | Portfolio Turnover Rate excludes TBA (to be announced) purchase and sales commitments. |
Financial Highlights
Class T Shares | |||||
For a share outstanding during the year ended June 30 | 2024 | 2023 | 2022 | 2021 | 2020 |
Net Asset Value, Beginning of Period | $8.43 | $8.73 | $10.12 | $9.47 | $9.89 |
Income/(Loss) from Investment Operations: | |||||
Net investment income/(loss)(1) | 0.58 | 0.49 | 0.34 | 0.40 | 0.41 |
Net realized and unrealized gain/(loss) | 0.09 | (0.29) | (1.34) | 0.67 | (0.35) |
Total from Investment Operations | 0.67 | 0.20 | (1.00) | 1.07 | 0.06 |
Less Dividends and Distributions: | |||||
Dividends (from net investment income) | (0.58) | (0.49) | (0.36) | (0.42) | (0.40) |
Distributions (from capital gains) | — | — | (0.03) | — | (0.05) |
Return of capital | — | (0.01) | — (2) | — | (0.03) |
Total Dividends and Distributions | (0.58) | (0.50) | (0.39) | (0.42) | (0.48) |
Net Asset Value, End of Period | $8.52 | $8.43 | $8.73 | $10.12 | $9.47 |
Total Return* | 8.23% | 2.45% | (10.12)% | 11.47% (3) | 0.67% |
Net Assets, End of Period (in thousands) | $80,820 | $94,916 | $159,043 | $229,774 | $285,912 |
Ratios to Average Net Assets**: | |||||
Ratio of Gross Expenses | 0.84% | 0.86% | 0.84% | 0.85% | 0.86% |
Ratio of Net Expenses (After Waivers and Expense Offsets) | 0.83% | 0.85% | 0.83% | 0.83% | 0.86% |
Ratio of Net Investment Income/(Loss) | 6.86% | 5.65% | 3.50% | 4.01% | 4.27% |
Portfolio Turnover Rate(4) | 58% | 62% | 75% | 119% | 188% |
* | Total return includes adjustments in accordance with generally accepted accounting principles required at the year or period end and are not annualized for periods of less than one full year. |
** | Annualized for periods of less than one full year. |
(1) | Per share amounts are calculated based on average shares outstanding during the year or period. |
(2) | Less than $0.005 on a per share basis. |
(3) | 0.01% of the Fund’s total return consists of a voluntary reimbursement by the Adviser for realized investment losses and another 0.04% consists of a gain on an investment not meeting the investment guidelines of the Fund. Excluding these items, total return would have been 11.42%. |
(4) | Portfolio Turnover Rate excludes TBA (to be announced) purchase and sales commitments. |
Notes to Financial Statements
Average Daily Net Assets of the Fund | Contractual Investment Advisory Fee (%) |
First $200 Million | 0.60 |
Next $500 Million | 0.57 |
Over $700 Million | 0.55 |
Notes to Financial Statements
Average Daily Net Assets of Class D Shares of the Janus Henderson funds | Administrative Services Fee |
Under $40 billion | 0.12% |
$40 billion — $49.9 billion | 0.10% |
Over $49.9 billion | 0.08% |
Notes to Financial Statements
Undistributed Ordinary Income | Undistributed Long-Term Gains | Accumulated Capital Losses | Loss Deferrals | Other Book to Tax Differences | Net Tax Appreciation/ (Depreciation) |
$329,625 | $- | $(435,614,373) | $- | $267,995 | $(53,667,153) |
Capital Loss Carryover Schedule | ||
For the year ended June 30, 2024 | ||
No Expiration | ||
Short-Term | Long-Term | Accumulated Capital Losses |
$(207,531,387) | $(228,082,986) | $(435,614,373) |
Federal Tax Cost | Unrealized Appreciation | Unrealized (Depreciation) | Net Tax Appreciation/ (Depreciation) |
$5,028,931,919 | $62,398,148 | $(116,065,301) | $(53,667,153) |
Federal Tax Cost | Unrealized Appreciation | Unrealized (Depreciation) | Net Tax Appreciation/ (Depreciation) |
$11,921,162 | $- | $- | $- |
For the year ended June 30, 2024 | |||
Distributions | |||
From Ordinary Income | From Long-Term Capital Gains | Tax Return of Capital | Net Investment Loss |
$242,084,760 | $- | $- | $- |
For the year ended June 30, 2023 | |||
Distributions | |||
From Ordinary Income | From Long-Term Capital Gains | Tax Return of Capital | Net Investment Loss |
$166,059,139 | $- | $2,659,042 | $- |
Notes to Financial Statements
Year ended June 30, 2024 | Year ended June 30, 2023 | |||
Shares | Amount | Shares | Amount | |
Class A Shares: | ||||
Shares sold | 3,924,351 | $33,219,456 | 1,597,155 | $13,653,908 |
Reinvested dividends and distributions | 314,241 | 2,656,265 | 277,849 | 2,354,715 |
Shares repurchased | (2,462,827) | (20,838,659) | (3,504,055) | (29,719,910) |
Net Increase/(Decrease) | 1,775,765 | $15,037,062 | (1,629,051) | $(13,711,287) |
Class C Shares: | ||||
Shares sold | 2,560,117 | $21,696,851 | 890,839 | $7,555,783 |
Reinvested dividends and distributions | 413,481 | 3,494,441 | 344,568 | 2,919,683 |
Shares repurchased | (1,628,209) | (13,754,633) | (1,831,842) | (15,555,547) |
Net Increase/(Decrease) | 1,345,389 | $11,436,659 | (596,435) | $(5,080,081) |
Class D Shares: | ||||
Shares sold | 2,935,427 | $24,845,400 | 1,536,322 | $13,099,257 |
Reinvested dividends and distributions | 666,505 | 5,631,771 | 565,428 | 4,792,347 |
Shares repurchased | (2,508,682) | (21,174,793) | (2,384,484) | (20,194,892) |
Net Increase/(Decrease) | 1,093,250 | $9,302,378 | (282,734) | $(2,303,288) |
Class I Shares: | ||||
Shares sold | 233,783,402 | $1,973,981,632 | 153,087,255 | $1,298,871,566 |
Reinvested dividends and distributions | 25,106,019 | 212,203,583 | 16,912,083 | 143,268,553 |
Shares repurchased | (121,256,355) | (1,022,131,445) | (156,597,238) | (1,330,801,377) |
Net Increase/(Decrease) | 137,633,066 | $1,164,053,770 | 13,402,100 | $111,338,742 |
Class N Shares: | ||||
Shares sold | 4,808,393 | $40,615,062 | 3,681,449 | $31,124,939 |
Reinvested dividends and distributions | 644,599 | 5,448,190 | 456,474 | 3,865,951 |
Shares repurchased | (4,846,093) | (41,126,466) | (3,191,730) | (27,144,827) |
Net Increase/(Decrease) | 606,899 | $4,936,786 | 946,193 | $7,846,063 |
Class S Shares: | ||||
Shares sold | 238,527 | $2,019,110 | 164,764 | $1,400,868 |
Reinvested dividends and distributions | 21,128 | 178,495 | 9,470 | 80,162 |
Shares repurchased | (87,689) | (738,453) | (71,246) | (613,599) |
Net Increase/(Decrease) | 171,966 | $1,459,152 | 102,988 | $867,431 |
Class T Shares: | ||||
Shares sold | 1,853,887 | $15,731,692 | 4,138,666 | $35,370,261 |
Reinvested dividends and distributions | 678,038 | 5,725,634 | 829,823 | 7,036,060 |
Shares repurchased | (4,305,662) | (36,268,863) | (11,930,238) | (100,801,170) |
Net Increase/(Decrease) | (1,773,737) | $(14,811,537) | (6,961,749) | $(58,394,849) |
Purchases of Securities | Proceeds from Sales of Securities | Purchases of Long- Term U.S. Government Obligations | Proceeds from Sales of Long-Term U.S. Government Obligations |
$3,131,884,958 | $1,962,958,217 | $- | $- |
Report of Independent Registered Public Accounting Firm
August 22, 2024
Designation Requirements (unaudited)
Section 163(j) Interest Dividend | 95% |
Additional Information (unaudited)
June 30, 2024
Schedule of Investments
June 30, 2024
Shares | Value | ||
Common Stocks – 90.9% | |||
Auto Components – 1.0% | |||
Aptiv PLC* | 20,656 | $1,454,596 | |
Banks – 4.9% | |||
ING Groep NV | 206,589 | 3,539,344 | |
Natwest Group PLC | 867,082 | 3,400,624 | |
6,939,968 | |||
Beverages – 1.7% | |||
Coca-Cola European Partners PLC | 32,308 | 2,354,284 | |
Capital Markets – 2.6% | |||
CME Group Inc | 6,059 | 1,191,199 | |
Hong Kong Exchanges & Clearing Ltd | 76,100 | 2,424,766 | |
3,615,965 | |||
Chemicals – 1.8% | |||
Air Products & Chemicals Inc | 10,102 | 2,606,821 | |
Diversified Telecommunication Services – 4.5% | |||
Deutsche Telekom AG | 143,602 | 3,611,931 | |
TELUS Corp | 185,812 | 2,813,193 | |
6,425,124 | |||
Electrical Equipment – 3.5% | |||
nVent Electric PLC | 17,977 | 1,377,218 | |
Schneider Electric SE | 15,007 | 3,580,229 | |
4,957,447 | |||
Food Products – 2.9% | |||
Nestle SA (REG) | 40,253 | 4,109,613 | |
Health Care Equipment & Supplies – 0.9% | |||
Medtronic PLC | 16,796 | 1,322,013 | |
Household Durables – 2.3% | |||
Sony Corp | 38,200 | 3,246,333 | |
Industrial Conglomerates – 1.9% | |||
Siemens AG | 14,645 | 2,723,432 | |
Insurance – 11.0% | |||
AIA Group Ltd | 302,800 | 2,053,337 | |
AXA SA | 110,903 | 3,651,232 | |
Dai-ichi Life Holdings Inc | 108,800 | 2,921,447 | |
Swiss Re AG | 23,135 | 2,874,899 | |
Zurich Insurance Group AG | 7,817 | 4,159,419 | |
15,660,334 | |||
Machinery – 4.3% | |||
Daimler Truck Holding AG | 62,821 | 2,498,962 | |
Sandvik AB | 178,294 | 3,585,495 | |
6,084,457 | |||
Multi-Utilities – 2.5% | |||
National Grid PLC | 314,152 | 3,502,721 | |
Paper & Forest Products – 1.6% | |||
UPM-Kymmene Oyj | 64,344 | 2,243,175 | |
Personal Products – 3.3% | |||
Unilever PLC | 85,073 | 4,671,002 | |
Pharmaceuticals – 12.7% | |||
AstraZeneca PLC | 23,956 | 3,734,064 | |
GSK PLC | 73,415 | 1,414,701 | |
Merck & Co Inc | 15,521 | 1,921,500 | |
Novartis AG | 31,213 | 3,344,481 | |
Novo Nordisk A/S - Class B | 31,307 | 4,473,169 | |
Sanofi | 32,232 | 3,097,751 | |
17,985,666 | |||
Professional Services – 3.8% | |||
RELX PLC | 117,117 | 5,368,274 | |
Semiconductor & Semiconductor Equipment – 12.5% | |||
ASML Holding NV | 3,023 | 3,118,388 | |
Infineon Technologies AG | 79,805 | 2,931,409 | |
MediaTek Inc | 77,000 | 3,292,432 |
Schedule of Investments
June 30, 2024
Shares | Value | ||
Common Stocks – (continued) | |||
Semiconductor & Semiconductor Equipment – (continued) | |||
Taiwan Semiconductor Manufacturing Co Ltd (ADR) | 34,876 | $6,061,797 | |
Tokyo Electron Ltd | 10,600 | 2,328,019 | |
17,732,045 | |||
Software – 5.9% | |||
Microsoft Corp | 6,365 | 2,844,837 | |
Oracle Corp | 17,718 | 2,501,782 | |
SAP SE | 14,934 | 3,031,701 | |
8,378,320 | |||
Textiles, Apparel & Luxury Goods – 3.5% | |||
Cie Financiere Richemont SA (REG) | 21,422 | 3,343,863 | |
LVMH Moet Hennessy Louis Vuitton SE | 2,089 | 1,604,027 | |
4,947,890 | |||
Wireless Telecommunication Services – 1.8% | |||
Tele2 AB | 246,920 | 2,484,326 | |
Total Common Stocks (cost $96,338,009) | 128,813,806 | ||
Preferred Stocks – 3.2% | |||
Technology Hardware, Storage & Peripherals – 3.2% | |||
Samsung Electronics Co Ltd (cost $3,866,914) | 98,679 | 4,532,549 | |
Investment Companies – 4.2% | |||
Money Markets – 4.2% | |||
Janus Henderson Cash Liquidity Fund LLC, 5.3419%ºº,£ (cost $5,998,093) | 5,996,893 | 5,998,093 | |
Total Investments (total cost $106,203,016) – 98.3% | 139,344,448 | ||
Cash, Receivables and Other Assets, net of Liabilities – 1.7% | 2,460,524 | ||
Net Assets – 100% | $141,804,972 |
Summary of Investments by Country - (Long Positions) (unaudited) | ||
Country | Value | % of Investment Securities |
United States | $22,632,760 | 16.2 % |
Switzerland | 17,832,275 | 12.8 |
Netherlands | 16,697,008 | 12.0 |
Germany | 14,797,435 | 10.6 |
United Kingdom | 12,991,693 | 9.3 |
France | 11,933,239 | 8.6 |
Taiwan | 9,354,229 | 6.7 |
Japan | 8,495,799 | 6.1 |
Sweden | 6,069,821 | 4.4 |
South Korea | 4,532,549 | 3.3 |
Hong Kong | 4,478,103 | 3.2 |
Denmark | 4,473,169 | 3.2 |
Canada | 2,813,193 | 2.0 |
Finland | 2,243,175 | 1.6 |
Total | $139,344,448 | 100.0 % |
Schedule of Investments
June 30, 2024
Schedule of Affiliated Investments - (% of Net Assets) | ||||||||
Affiliate | Affiliated Investments, at Value at 6/30/23 | Purchases | Sales Proceeds | Realized Gain/(Loss) | Change in Unrealized Appreciation/ Depreciation | Affiliated Investments, at Value at 6/30/24 | Ending Shares | Dividend Income |
Investment Companies - 4.2% | ||||||||
Money Markets - 4.2% | ||||||||
Janus Henderson Cash Liquidity Fund LLC, 5.3419%ºº | ||||||||
$3,805,478 | $36,933,696 | $(34,740,933) | $(148) | $- | $5,998,093 | 5,996,893 | $227,907 |
Notes to Schedule of Investments and Other Information
ADR | American Depositary Receipt |
LLC | Limited Liability Company |
PLC | Public Limited Company |
REG | Registered |
* | Non-income producing security. |
ºº | Rate shown is the 7-day yield as of June 30, 2024. |
£ | The Fund may invest in certain securities that are considered affiliated companies. As defined by the Investment Company Act of 1940, as amended, an affiliated company is one in which the Fund owns 5% or more of the outstanding voting securities, or a company which is under common ownership or control. |
Valuation Inputs Summary | |||
Level 1 - Quoted Prices | Level 2 - Other Significant Observable Inputs | Level 3 - Significant Unobservable Inputs | |
Assets | |||
Investments In Securities: | |||
Common Stocks | |||
Auto Components | $1,454,596 | $- | $- |
Beverages | 2,354,284 | - | - |
Capital Markets | 1,191,199 | 2,424,766 | - |
Chemicals | 2,606,821 | - | - |
Diversified Telecommunication Services | 2,813,193 | 3,611,931 | - |
Electrical Equipment | 1,377,218 | 3,580,229 | - |
Health Care Equipment & Supplies | 1,322,013 | - | - |
Pharmaceuticals | 1,921,500 | 16,064,166 | - |
Semiconductor & Semiconductor Equipment | 6,061,797 | 11,670,248 | - |
Software | 5,346,619 | 3,031,701 | - |
All Other | - | 61,981,525 | - |
Preferred Stocks | - | 4,532,549 | - |
Investment Companies | - | 5,998,093 | - |
Total Assets | $26,449,240 | $112,895,208 | $- |
Statement of Assets and Liabilities
June 30, 2024
Assets: | |
Unaffiliated investments, at value (cost $100,204,923) | $133,346,355 |
Affiliated investments, at value (cost $5,998,093) | 5,998,093 |
Trustees' deferred compensation | 3,874 |
Receivables: | |
Investments sold | 2,322,962 |
Foreign tax reclaims | 1,046,765 |
Fund shares sold | 552,609 |
Dividends | 230,422 |
Dividends from affiliates | 15,630 |
Other assets | 9,684 |
Total Assets | 143,526,394 |
Liabilities: | |
Payables: | |
Investments purchased | 917,413 |
Fund shares repurchased | 595,128 |
Professional fees | 64,946 |
Advisory fees | 52,618 |
Dividends | 18,151 |
Transfer agent fees and expenses | 13,483 |
12b-1 Distribution and shareholder servicing fees | 12,547 |
Trustees' deferred compensation fees | 3,874 |
Custodian fees | 957 |
Trustees' fees and expenses | 701 |
Affiliated fund administration fees payable | 290 |
Accrued expenses and other payables | 41,314 |
Total Liabilities | 1,721,422 |
Commitments and contingent liabilities (Note 3) | |
Net Assets | $141,804,972 |
Statement of Assets and Liabilities
June 30, 2024
Net Assets Consist of: | |
Capital (par value and paid-in surplus) | $105,849,742 |
Total distributable earnings (loss) | 35,955,230 |
Total Net Assets | $141,804,972 |
Net Assets - Class A Shares | $38,929,371 |
Shares Outstanding, $0.01 Par Value (unlimited shares authorized) | 2,401,299 |
Net Asset Value Per Share(1) | $16.21 |
Maximum Offering Price Per Share(2) | $17.20 |
Net Assets - Class C Shares | $5,322,311 |
Shares Outstanding, $0.01 Par Value (unlimited shares authorized) | 338,450 |
Net Asset Value Per Share(1) | $15.73 |
Net Assets - Class D Shares | $20,131,262 |
Shares Outstanding, $0.01 Par Value (unlimited shares authorized) | 1,239,545 |
Net Asset Value Per Share | $16.24 |
Net Assets - Class I Shares | $53,937,217 |
Shares Outstanding, $0.01 Par Value (unlimited shares authorized) | 3,313,566 |
Net Asset Value Per Share | $16.28 |
Net Assets - Class N Shares | $15,645,444 |
Shares Outstanding, $0.01 Par Value (unlimited shares authorized) | 962,747 |
Net Asset Value Per Share | $16.25 |
Net Assets - Class S Shares | $148,583 |
Shares Outstanding, $0.01 Par Value (unlimited shares authorized) | 9,188 |
Net Asset Value Per Share | $16.17 |
Net Assets - Class T Shares | $7,690,784 |
Shares Outstanding, $0.01 Par Value (unlimited shares authorized) | 474,929 |
Net Asset Value Per Share | $16.19 |
(1) | Redemption price per share may be reduced for any applicable contingent deferred sales charge. |
(2) | Maximum offering price is computed at 100/94.25 of net asset value. |
Statement of Operations
For the year ended June 30, 2024
Investment Income: | |
Dividends | $4,167,984 |
Dividends from affiliates | 227,907 |
Other income | 108,308 |
Foreign tax withheld | (431,865) |
Total Investment Income | 4,072,334 |
Expenses: | |
Advisory fees | 919,810 |
12b-1 Distribution and shareholder servicing fees: | |
Class A Shares | 85,814 |
Class C Shares | 59,265 |
Class S Shares | 74 |
Transfer agent administrative fees and expenses: | |
Class D Shares | 19,971 |
Class S Shares | 251 |
Class T Shares | 15,241 |
Transfer agent networking and omnibus fees: | |
Class A Shares | 21,863 |
Class C Shares | 3,973 |
Class I Shares | 37,138 |
Other transfer agent fees and expenses: | |
Class A Shares | 1,967 |
Class C Shares | 322 |
Class D Shares | 4,494 |
Class I Shares | 2,265 |
Class N Shares | 603 |
Class S Shares | 7 |
Class T Shares | 118 |
Registration fees | 116,429 |
Professional fees | 91,018 |
Non-affiliated fund administration fees | 62,398 |
Shareholder reports expense | 39,564 |
Custodian fees | 11,270 |
Affiliated fund administration fees | 3,066 |
Trustees' fees and expenses | 2,678 |
Other expenses | 18,370 |
Total Expenses | 1,517,969 |
Less: Excess Expense Reimbursement and Waivers | (229,532) |
Net Expenses | 1,288,437 |
Net Investment Income/(Loss) | 2,783,897 |
Net Realized Gain/(Loss) on Investments: | |
Investments and foreign currency transactions | 5,355,980 |
Investments in affiliates | (148) |
Total Net Realized Gain/(Loss) on Investments | 5,355,832 |
Change in Unrealized Net Appreciation/Depreciation: | |
Investments, foreign currency translations and Trustees' deferred compensation | 11,870,656 |
Total Change in Unrealized Net Appreciation/Depreciation | 11,870,656 |
Net Increase/(Decrease) in Net Assets Resulting from Operations | $20,010,385 |
Statements of Changes in Net Assets
Year ended June 30, 2024 | Year ended June 30, 2023 | |
Operations: | ||
Net investment income/(loss) | $2,783,897 | $3,568,108 |
Net realized gain/(loss) on investments | 5,355,832 | (1,327,669) |
Change in unrealized net appreciation/depreciation | 11,870,656 | 16,457,332 |
Net Increase/(Decrease) in Net Assets Resulting from Operations | 20,010,385 | 18,697,771 |
Dividends and Distributions to Shareholders: | ||
Class A Shares | (1,028,215) | (1,195,350) |
Class C Shares | (142,837) | (301,901) |
Class D Shares | (551,332) | (624,019) |
Class I Shares | (1,459,478) | (1,848,604) |
Class N Shares | (446,900) | (299,549) |
Class S Shares | (3,045) | (2,524) |
Class T Shares | (192,631) | (425,938) |
Net Decrease from Dividends and Distributions to Shareholders | (3,824,438) | (4,697,885) |
Capital Share Transactions: | ||
Class A Shares | 1,211,907 | (2,285,789) |
Class C Shares | (3,003,704) | (4,111,325) |
Class D Shares | 488,044 | 811,931 |
Class I Shares | 5,825,232 | (20,129,493) |
Class N Shares | 3,377,940 | 2,829,502 |
Class S Shares | 64,724 | 2,524 |
Class T Shares | 1,510,478 | (14,219,877) |
Net Increase/(Decrease) from Capital Share Transactions | 9,474,621 | (37,102,527) |
Net Increase/(Decrease) in Net Assets | 25,660,568 | (23,102,641) |
Net Assets: | ||
Beginning of period | 116,144,404 | 139,247,045 |
End of period | $141,804,972 | $116,144,404 |
Financial Highlights
Class A Shares | |||||
For a share outstanding during the year ended June 30 | 2024 | 2023 | 2022 | 2021 | 2020 |
Net Asset Value, Beginning of Period | $14.27 | $12.66 | $14.83 | $12.31 | $13.09 |
Income/(Loss) from Investment Operations: | |||||
Net investment income/(loss)(1) | 0.31 | 0.39 | 0.45 | 0.56 | 0.36 |
Net realized and unrealized gain/(loss) | 2.07 | 1.74 | (1.95) | 2.40 | (0.72) |
Total from Investment Operations | 2.38 | 2.13 | (1.50) | 2.96 | (0.36) |
Less Dividends and Distributions: | |||||
Dividends (from net investment income) | (0.44) | (0.52) | (0.48) | (0.44) | (0.42) |
Distributions (from capital gains) | — | — | (0.19) | — | — |
Total Dividends and Distributions | (0.44) | (0.52) | (0.67) | (0.44) | (0.42) |
Net Asset Value, End of Period | $16.21 | $14.27 | $12.66 | $14.83 | $12.31 |
Total Return* | 17.06% | 17.42% | (10.49)% | 24.38% | (2.79)% |
Net Assets, End of Period (in thousands) | $38,929 | $33,195 | $31,754 | $33,270 | $25,517 |
Ratios to Average Net Assets**: | |||||
Ratio of Gross Expenses | 1.32% | 1.38% | 1.27% | 1.24% | 1.25% |
Ratio of Net Expenses (After Waivers and Expense Offsets) | 1.16% | 1.18% | 1.18% | 1.15% | 1.16% |
Ratio of Net Investment Income/(Loss) | 2.13% | 2.94% | 3.14% | 4.06% | 2.83% |
Portfolio Turnover Rate | 32% | 62% | 34% | 52% | 59% |
* | Total return includes adjustments in accordance with generally accepted accounting principles required at the year or period end and are not annualized for periods of less than one full year. Returns shown exclude any applicable sales charges. |
** | Annualized for periods of less than one full year. |
(1) | Per share amounts are calculated based on average shares outstanding during the year or period. |
Financial Highlights
Class C Shares | |||||
For a share outstanding during the year ended June 30 | 2024 | 2023 | 2022 | 2021 | 2020 |
Net Asset Value, Beginning of Period | $13.84 | $12.32 | $14.49 | $12.07 | $12.89 |
Income/(Loss) from Investment Operations: | |||||
Net investment income/(loss)(1) | 0.17 | 0.26 | 0.32 | 0.44 | 0.27 |
Net realized and unrealized gain/(loss) | 2.05 | 1.71 | (1.88) | 2.36 | (0.74) |
Total from Investment Operations | 2.22 | 1.97 | (1.56) | 2.80 | (0.47) |
Less Dividends and Distributions: | |||||
Dividends (from net investment income) | (0.33) | (0.45) | (0.42) | (0.38) | (0.35) |
Distributions (from capital gains) | — | — | (0.19) | — | — |
Total Dividends and Distributions | (0.33) | (0.45) | (0.61) | (0.38) | (0.35) |
Net Asset Value, End of Period | $15.73 | $13.84 | $12.32 | $14.49 | $12.07 |
Total Return* | 16.33% | 16.50% | (11.11)% | 23.48% | (3.68)% |
Net Assets, End of Period (in thousands) | $5,322 | $7,573 | $10,653 | $17,760 | $21,018 |
Ratios to Average Net Assets**: | |||||
Ratio of Gross Expenses | 2.04% | 2.12% | 2.01% | 1.96% | 1.98% |
Ratio of Net Expenses (After Waivers and Expense Offsets) | 1.85% | 1.92% | 1.91% | 1.87% | 1.89% |
Ratio of Net Investment Income/(Loss) | 1.20% | 2.00% | 2.27% | 3.24% | 2.15% |
Portfolio Turnover Rate | 32% | 62% | 34% | 52% | 59% |
* | Total return includes adjustments in accordance with generally accepted accounting principles required at the year or period end and are not annualized for periods of less than one full year. Returns shown exclude any applicable sales charges. |
** | Annualized for periods of less than one full year. |
(1) | Per share amounts are calculated based on average shares outstanding during the year or period. |
Financial Highlights
Class D Shares | |||||
For a share outstanding during the year ended June 30 | 2024 | 2023 | 2022 | 2021 | 2020 |
Net Asset Value, Beginning of Period | $14.29 | $12.68 | $14.84 | $12.31 | $13.09 |
Income/(Loss) from Investment Operations: | |||||
Net investment income/(loss)(1) | 0.34 | 0.41 | 0.49 | 0.60 | 0.41 |
Net realized and unrealized gain/(loss) | 2.08 | 1.74 | (1.97) | 2.38 | (0.75) |
Total from Investment Operations | 2.42 | 2.15 | (1.48) | 2.98 | (0.34) |
Less Dividends and Distributions: | |||||
Dividends (from net investment income) | (0.47) | (0.54) | (0.49) | (0.45) | (0.44) |
Distributions (from capital gains) | — | — | (0.19) | — | — |
Total Dividends and Distributions | (0.47) | (0.54) | (0.68) | (0.45) | (0.44) |
Net Asset Value, End of Period | $16.24 | $14.29 | $12.68 | $14.84 | $12.31 |
Total Return* | 17.31% | 17.55% | (10.33)% | 24.58% | (2.66)% |
Net Assets, End of Period (in thousands) | $20,131 | $17,311 | $14,580 | $11,877 | $6,861 |
Ratios to Average Net Assets**: | |||||
Ratio of Gross Expenses | 1.23% | 1.27% | 1.14% | 1.12% | 1.20% |
Ratio of Net Expenses (After Waivers and Expense Offsets) | 0.98% | 1.01% | 1.01% | 0.98% | 0.99% |
Ratio of Net Investment Income/(Loss) | 2.30% | 3.12% | 3.43% | 4.29% | 3.20% |
Portfolio Turnover Rate | 32% | 62% | 34% | 52% | 59% |
* | Total return includes adjustments in accordance with generally accepted accounting principles required at the year or period end and are not annualized for periods of less than one full year. |
** | Annualized for periods of less than one full year. |
(1) | Per share amounts are calculated based on average shares outstanding during the year or period. |
Financial Highlights
Class I Shares | |||||
For a share outstanding during the year ended June 30 | 2024 | 2023 | 2022 | 2021 | 2020 |
Net Asset Value, Beginning of Period | $14.33 | $12.71 | $14.86 | $12.32 | $13.11 |
Income/(Loss) from Investment Operations: | |||||
Net investment income/(loss)(1) | 0.36 | 0.39 | 0.48 | 0.59 | 0.41 |
Net realized and unrealized gain/(loss) | 2.06 | 1.77 | (1.94) | 2.40 | (0.76) |
Total from Investment Operations | 2.42 | 2.16 | (1.46) | 2.99 | (0.35) |
Less Dividends and Distributions: | |||||
Dividends (from net investment income) | (0.47) | (0.54) | (0.50) | (0.45) | (0.44) |
Distributions (from capital gains) | — | — | (0.19) | — | — |
Total Dividends and Distributions | (0.47) | (0.54) | (0.69) | (0.45) | (0.44) |
Net Asset Value, End of Period | $16.28 | $14.33 | $12.71 | $14.86 | $12.32 |
Total Return* | 17.33% | 17.62% | (10.23)% | 24.68% | (2.68)% |
Net Assets, End of Period (in thousands) | $53,937 | $42,376 | $55,559 | $68,416 | $74,386 |
Ratios to Average Net Assets**: | |||||
Ratio of Gross Expenses | 1.09% | 1.13% | 1.04% | 0.99% | 1.00% |
Ratio of Net Expenses (After Waivers and Expense Offsets) | 0.93% | 0.95% | 0.95% | 0.91% | 0.91% |
Ratio of Net Investment Income/(Loss) | 2.40% | 2.98% | 3.30% | 4.27% | 3.19% |
Portfolio Turnover Rate | 32% | 62% | 34% | 52% | 59% |
* | Total return includes adjustments in accordance with generally accepted accounting principles required at the year or period end and are not annualized for periods of less than one full year. |
** | Annualized for periods of less than one full year. |
(1) | Per share amounts are calculated based on average shares outstanding during the year or period. |
Financial Highlights
Class N Shares | |||||
For a share outstanding during the year ended June 30 | 2024 | 2023 | 2022 | 2021 | 2020 |
Net Asset Value, Beginning of Period | $14.31 | $12.69 | $14.83 | $12.30 | $13.08 |
Income/(Loss) from Investment Operations: | |||||
Net investment income/(loss)(1) | 0.37 | 0.47 | 0.60 | 0.61 | 0.41 |
Net realized and unrealized gain/(loss) | 2.06 | 1.70 | (2.05) | 2.38 | (0.74) |
Total from Investment Operations | 2.43 | 2.17 | (1.45) | 2.99 | (0.33) |
Less Dividends and Distributions: | |||||
Dividends (from net investment income) | (0.49) | (0.55) | (0.50) | (0.46) | (0.45) |
Distributions (from capital gains) | — | — | (0.19) | — | — |
Total Dividends and Distributions | (0.49) | (0.55) | (0.69) | (0.46) | (0.45) |
Net Asset Value, End of Period | $16.25 | $14.31 | $12.69 | $14.83 | $12.30 |
Total Return* | 17.39% | 17.73% | (10.14)% | 24.71% | (2.56)% |
Net Assets, End of Period (in thousands) | $15,645 | $10,259 | $6,384 | $688 | $477 |
Ratios to Average Net Assets**: | |||||
Ratio of Gross Expenses | 1.03% | 1.12% | 1.08% | 1.44% | 1.51% |
Ratio of Net Expenses (After Waivers and Expense Offsets) | 0.84% | 0.87% | 0.88% | 0.84% | 0.85% |
Ratio of Net Investment Income/(Loss) | 2.52% | 3.51% | 4.30% | 4.41% | 3.22% |
Portfolio Turnover Rate | 32% | 62% | 34% | 52% | 59% |
* | Total return includes adjustments in accordance with generally accepted accounting principles required at the year or period end and are not annualized for periods of less than one full year. |
** | Annualized for periods of less than one full year. |
(1) | Per share amounts are calculated based on average shares outstanding during the year or period. |
Financial Highlights
Class S Shares | |||||
For a share outstanding during the year ended June 30 | 2024 | 2023 | 2022 | 2021 | 2020 |
Net Asset Value, Beginning of Period | $14.23 | $12.63 | $14.78 | $12.27 | $13.06 |
Income/(Loss) from Investment Operations: | |||||
Net investment income/(loss)(1) | 0.40 | 0.41 | 0.48 | 0.59 | 0.39 |
Net realized and unrealized gain/(loss) | 1.99 | 1.73 | (1.94) | 2.39 | (0.75) |
Total from Investment Operations | 2.39 | 2.14 | (1.46) | 2.98 | (0.36) |
Less Dividends and Distributions: | |||||
Dividends (from net investment income) | (0.45) | (0.54) | (0.50) | (0.47) | (0.43) |
Distributions (from capital gains) | — | — | (0.19) | — | — |
Total Dividends and Distributions | (0.45) | (0.54) | (0.69) | (0.47) | (0.43) |
Net Asset Value, End of Period | $16.17 | $14.23 | $12.63 | $14.78 | $12.27 |
Total Return* | 17.23% | 17.58% | (10.27)% | 24.68% | (2.80)% |
Net Assets, End of Period (in thousands) | $149 | $68 | $58 | $65 | $52 |
Ratios to Average Net Assets**: | |||||
Ratio of Gross Expenses | 4.31% | 6.18% | 5.83% | 6.21% | 6.96% |
Ratio of Net Expenses (After Waivers and Expense Offsets) | 1.07% | 1.00% | 0.95% | 0.91% | 1.08% |
Ratio of Net Investment Income/(Loss) | 2.67% | 3.12% | 3.36% | 4.27% | 3.04% |
Portfolio Turnover Rate | 32% | 62% | 34% | 52% | 59% |
* | Total return includes adjustments in accordance with generally accepted accounting principles required at the year or period end and are not annualized for periods of less than one full year. |
** | Annualized for periods of less than one full year. |
(1) | Per share amounts are calculated based on average shares outstanding during the year or period. |
Financial Highlights
Class T Shares | |||||
For a share outstanding during the year ended June 30 | 2024 | 2023 | 2022 | 2021 | 2020 |
Net Asset Value, Beginning of Period | $14.26 | $12.65 | $14.81 | $12.29 | $13.08 |
Income/(Loss) from Investment Operations: | |||||
Net investment income/(loss)(1) | 0.34 | 0.43 | 0.46 | 0.56 | 0.41 |
Net realized and unrealized gain/(loss) | 2.04 | 1.70 | (1.95) | 2.40 | (0.77) |
Total from Investment Operations | 2.38 | 2.13 | (1.49) | 2.96 | (0.36) |
Less Dividends and Distributions: | |||||
Dividends (from net investment income) | (0.45) | (0.52) | (0.48) | (0.44) | (0.43) |
Distributions (from capital gains) | — | — | (0.19) | — | — |
Total Dividends and Distributions | (0.45) | (0.52) | (0.67) | (0.44) | (0.43) |
Net Asset Value, End of Period | $16.19 | $14.26 | $12.65 | $14.81 | $12.29 |
Total Return* | 17.09% | 17.45% | (10.41)% | 24.45% | (2.80)% |
Net Assets, End of Period (in thousands) | $7,691 | $5,363 | $20,258 | $28,439 | $26,296 |
Ratios to Average Net Assets**: | |||||
Ratio of Gross Expenses | 1.30% | 1.27% | 1.21% | 1.18% | 1.21% |
Ratio of Net Expenses (After Waivers and Expense Offsets) | 1.09% | 1.10% | 1.11% | 1.09% | 1.09% |
Ratio of Net Investment Income/(Loss) | 2.33% | 3.22% | 3.16% | 4.06% | 3.29% |
Portfolio Turnover Rate | 32% | 62% | 34% | 52% | 59% |
* | Total return includes adjustments in accordance with generally accepted accounting principles required at the year or period end and are not annualized for periods of less than one full year. |
** | Annualized for periods of less than one full year. |
(1) | Per share amounts are calculated based on average shares outstanding during the year or period. |
Notes to Financial Statements
Average Daily Net Assets of the Fund | Contractual Investment Advisory Fee (%) |
First $1 Billion | 0.75 |
Next $1 Billion | 0.65 |
Above $2 Billion | 0.55 |
Notes to Financial Statements
Average Daily Net Assets of Class D Shares of the Janus Henderson funds | Administrative Services Fee |
Under $40 billion | 0.12% |
$40 billion — $49.9 billion | 0.10% |
Over $49.9 billion | 0.08% |
Notes to Financial Statements
Class | % of Class Owned | % of Fund Owned |
Class A Shares | - % | - % |
Class C Shares | - | - |
Class D Shares | - | - |
Class I Shares | - | - |
Class N Shares | - * | - * |
Class S Shares | 54 | - * |
Class T Shares | - | - |
*Less than 0.50% |
Undistributed Ordinary Income | Undistributed Long-Term Gains | Accumulated Capital Losses | Loss Deferrals | Other Book to Tax Differences | Net Tax Appreciation/ (Depreciation) |
$498,170 | $2,660,864 | $- | $- | $5,463 | $32,790,733 |
Federal Tax Cost | Unrealized Appreciation | Unrealized (Depreciation) | Net Tax Appreciation/ (Depreciation) |
$106,553,715 | $34,475,889 | $(1,685,156) | $32,790,733 |
For the year ended June 30, 2024 | |||
Distributions | |||
From Ordinary Income | From Long-Term Capital Gains | Tax Return of Capital | Net Investment Loss |
$3,824,438 | $- | $- | $- |
Notes to Financial Statements
For the year ended June 30, 2023 | |||
Distributions | |||
From Ordinary Income | From Long-Term Capital Gains | Tax Return of Capital | Net Investment Loss |
$4,697,885 | $- | $- | $- |
Year ended June 30, 2024 | Year ended June 30, 2023 | |||
Shares | Amount | Shares | Amount | |
Class A Shares: | ||||
Shares sold | 346,993 | $5,145,096 | 422,765 | $5,619,267 |
Reinvested dividends and distributions | 68,488 | 996,551 | 91,268 | 1,153,590 |
Shares repurchased | (340,430) | (4,929,740) | (695,081) | (9,058,646) |
Net Increase/(Decrease) | 75,051 | $1,211,907 | (181,048) | $(2,285,789) |
Class C Shares: | ||||
Shares sold | 27,321 | $392,289 | 48,140 | $592,045 |
Reinvested dividends and distributions | 10,053 | 138,165 | 24,431 | 294,810 |
Shares repurchased | (245,913) | (3,534,158) | (390,147) | (4,998,180) |
Net Increase/(Decrease) | (208,539) | $(3,003,704) | (317,576) | $(4,111,325) |
Class D Shares: | ||||
Shares sold | 293,319 | $4,441,218 | 287,663 | $3,884,555 |
Reinvested dividends and distributions | 36,875 | 538,593 | 47,822 | 606,039 |
Shares repurchased | (301,659) | (4,491,767) | (274,281) | (3,678,663) |
Net Increase/(Decrease) | 28,535 | $488,044 | 61,204 | $811,931 |
Class I Shares: | ||||
Shares sold | 1,137,508 | $17,118,737 | 1,743,365 | $21,268,990 |
Reinvested dividends and distributions | 99,284 | 1,456,766 | 146,751 | 1,830,415 |
Shares repurchased | (881,026) | (12,750,271) | (3,303,997) | (43,228,898) |
Net Increase/(Decrease) | 355,766 | $5,825,232 | (1,413,881) | $(20,129,493) |
Class N Shares: | ||||
Shares sold | 605,156 | $8,645,523 | 357,128 | $4,720,695 |
Reinvested dividends and distributions | 30,476 | 446,900 | 23,217 | 299,549 |
Shares repurchased | (389,999) | (5,714,483) | (166,504) | (2,190,742) |
Net Increase/(Decrease) | 245,633 | $3,377,940 | 213,841 | $2,829,502 |
Class S Shares: | ||||
Shares sold | 4,251 | $62,527 | - | $- |
Reinvested dividends and distributions | 204 | 3,045 | 200 | 2,524 |
Shares repurchased | (53) | (848) | - | - |
Net Increase/(Decrease) | 4,402 | $64,724 | 200 | $2,524 |
Class T Shares: | ||||
Shares sold | 151,076 | $2,288,813 | 97,585 | $1,292,370 |
Reinvested dividends and distributions | 12,713 | 185,452 | 35,817 | 423,508 |
Shares repurchased | (65,075) | (963,787) | (1,358,505) | (15,935,755) |
Net Increase/(Decrease) | 98,714 | $1,510,478 | (1,225,103) | $(14,219,877) |
Notes to Financial Statements
Purchases of Securities | Proceeds from Sales of Securities | Purchases of Long- Term U.S. Government Obligations | Proceeds from Sales of Long-Term U.S. Government Obligations |
$44,177,778 | $37,753,764 | $- | $- |
Report of Independent Registered Public Accounting Firm
August 22, 2024
Designation Requirements (unaudited)
Section 163(j) Interest Dividend | 5% |
Capital Gain Distributions | $380,322 |
Foreign Taxes Paid | $339,401 |
Foreign Source Income | $3,203,225 |
Dividends Received Deduction Percentage | 10% |
Qualified Dividend Income Percentage | 100% |
Additional Information (unaudited)
June 30, 2024
Schedule of Investments
June 30, 2024
Shares or Principal Amounts | Value | ||
Asset-Backed/Commercial Mortgage-Backed Securities – 46.4% | |||
208 Park Avenue Mortgage Trust 2017-280P, CME Term SOFR 1 Month + 1.1800%, 6.5070%, 9/15/34ž,‡ | $2,890,000 | $2,758,825 | |
A&D Mortgage Trust 2023-NQM2 A1, 6.1320%, 5/25/68ž,Ç | 1,680,018 | 1,667,687 | |
ACC Auto Trust 2022-A A, 4.5800%, 7/15/26ž | 129,731 | 129,588 | |
ACHV ABS Trust 2023-4CP A, 6.8100%, 11/25/30ž | 195,175 | 195,283 | |
Affirm Asset Securitization Trust 2024-A A, 5.6100%, 2/15/29ž | 692,000 | 690,768 | |
Affirm Asset Securitization Trust 2024-X1 A, 6.2700%, 5/15/29ž | 1,671,086 | 1,673,536 | |
Ally Bank Auto Credit-Linked Notes 2024-A A2, 5.6810%, 5/17/32ž | 2,216,754 | 2,216,312 | |
Alterna Funding LLC 2024-1A A, 6.2600%, 5/16/39ž | 2,021,000 | 2,024,088 | |
AMCR ABS Trust 2023-1A A, 7.6600%, 1/21/31ž | 794,806 | 798,215 | |
Angel Oak Mortgage Trust I LLC 2019-5, 2.5930%, 10/25/49ž,‡ | 97,367 | 94,344 | |
Angel Oak Mortgage Trust I LLC 2019-6, Refinitiv USD IBOR Consumer Cash Fallbacks 1 Year + 0.9500%, 2.6200%, 11/25/59ž,‡ | 95,197 | 91,683 | |
Angel Oak Mortgage Trust I LLC 2024-3 A1, 4.8000%, 11/26/68ž,Ç | 328,371 | 318,050 | |
Angel Oak Mortgage Trust I LLC 2024-5 A1, 4.9500%, 7/25/68ž,Ç | 1,872,230 | 1,817,189 | |
Angel Oak Mortgage Trust I LLC 2024-6 A1, 4.6500%, 11/25/67ž,Ç | 1,266,000 | 1,220,983 | |
Aqua Finance Trust 2021-A A, 1.5400%, 7/17/46ž | 436,286 | 392,755 | |
ARES CLO Ltd 2021-60A A, CME Term SOFR 3 Month + 1.3816%, 6.7085%, 7/18/34ž,‡ | 491,000 | 491,808 | |
Arivo Acceptance Auto Loan Receivables 2022-1A A, 3.9300%, 5/15/28ž | 824,331 | 813,824 | |
BAMLL Commercial Mortgage Securities Trust 2024-FRR3 C, 0.6638%, 1/27/50ž,‡ | 1,450,000 | 1,219,014 | |
Blue Bridge Funding LLC 2023-1A A, 7.3700%, 11/15/30ž | 1,779,955 | 1,790,061 | |
BPR Trust 2022-OANA A, CME Term SOFR 1 Month + 1.8980%, 7.2268%, 4/15/37ž,‡ | 2,387,000 | 2,387,829 | |
BPR Trust 2023-BRK2 A, 7.1465%, 10/5/38ž,‡ | 1,788,000 | 1,853,894 | |
BX Commercial Mortgage Trust 2019-MMP C, CME Term SOFR 1 Month + 1.4940%, 6.8230%, 8/15/36ž,‡ | 2,744,267 | 2,686,303 | |
BX Commercial Mortgage Trust 2021-21M A, CME Term SOFR 1 Month + 0.8445%, 6.1735%, 10/15/36ž,‡ | 1,692,686 | 1,673,130 | |
BX Commercial Mortgage Trust 2021-LBA AJV, CME Term SOFR 1 Month + 0.9145%, 6.2435%, 2/15/36ž,‡ | 1,598,000 | 1,578,679 | |
BX Commercial Mortgage Trust 2021-LBA AV, CME Term SOFR 1 Month + 0.9145%, 6.2435%, 2/15/36ž,‡ | 1,436,901 | 1,418,671 | |
BX Commercial Mortgage Trust 2021-VOLT F, CME Term SOFR 1 Month + 2.5145%, 7.8433%, 9/15/36ž,‡ | 3,235,000 | 3,191,144 | |
BX Commercial Mortgage Trust 2022-FOX2 A2, CME Term SOFR 1 Month + 0.7492%, 6.0780%, 4/15/39ž,‡ | 1,605,519 | 1,579,938 | |
BX Commercial Mortgage Trust 2023-VLT3 A, CME Term SOFR 1 Month + 1.9400%, 7.2688%, 11/15/28ž,‡ | 1,523,750 | 1,512,336 | |
BX Commercial Mortgage Trust 2023-VLT3 B, CME Term SOFR 1 Month + 2.6890%, 8.0178%, 11/15/28ž,‡ | 1,142,633 | 1,125,514 | |
BX Commercial Mortgage Trust 2024-CNYN A, CME Term SOFR 1 Month + 1.4419%, 6.7707%, 4/15/29ž,‡ | 2,204,748 | 2,189,784 | |
BX Commercial Mortgage Trust 2024-VLT4 A, CME Term SOFR 1 Month + 1.4914%, 6.8114%, 7/16/29ž,‡ | 1,797,039 | 1,790,761 | |
CBAM CLO Management 2019-11RA A2, CME Term SOFR 3 Month + 1.7616%, 7.0862%, 1/22/35ž,‡ | 4,325,000 | 4,330,337 | |
CENT Trust 2023-CITY A, CME Term SOFR 1 Month + 2.6200%, 7.9488%, 9/15/38ž,‡ | 1,845,000 | 1,853,085 | |
CF Hippolyta Issuer LLC 2021-1A A1, 1.5300%, 3/15/61ž | 2,170,457 | 1,985,695 | |
CF Hippolyta Issuer LLC 2021-1A B1, 1.9800%, 3/15/61ž | 796,368 | 711,801 | |
CF Hippolyta Issuer LLC 2022-1A A1, 5.9700%, 8/15/62ž | 10,157,725 | 10,016,719 | |
Chase Auto Credit Linked Notes 2021-1 B, 0.8750%, 9/25/28ž | 47,354 | 47,145 | |
Chase Auto Credit Linked Notes 2021-2 B, 0.8890%, 12/26/28ž | 118,386 | 117,054 | |
Chase Mortgage Finance Corp 2020-CL1 M1, CME Term SOFR 1 Month + 2.3645%, 7.7097%, 10/25/57ž,‡ | 2,714,963 | 2,733,828 | |
CIFC Funding Ltd 2014-5A A1R3, CME Term SOFR 3 Month + 1.3800%, 0%, 7/17/37ž,‡ | 2,481,000 | 2,481,000 |
Schedule of Investments
June 30, 2024
Shares or Principal Amounts | Value | ||
Asset-Backed/Commercial Mortgage-Backed Securities – (continued) | |||
CIFC Funding Ltd 2016-1A BRR, CME Term SOFR 3 Month + 1.9616%, 7.2794%, 10/21/31ž,‡ | $1,278,000 | $1,280,175 | |
CIFC Funding Ltd 2021-7A B, CME Term SOFR 3 Month + 1.8616%, 7.1880%, 1/23/35ž,‡ | 1,432,000 | 1,433,426 | |
CIM Trust 2021-NR1 A1, 5.5690%, 7/25/55ž,Ç | 553,952 | 546,319 | |
Cold Storage Trust 2020-ICE5 A, CME Term SOFR 1 Month + 1.0145%, 6.3415%, 11/15/37ž,‡ | 3,282,205 | 3,271,814 | |
Cold Storage Trust 2020-ICE5 B, CME Term SOFR 1 Month + 1.4145%, 6.7415%, 11/15/37ž,‡ | 1,683,863 | 1,677,249 | |
Cold Storage Trust 2020-ICE5 C, CME Term SOFR 1 Month + 1.7645%, 7.0915%, 11/15/37ž,‡ | 1,690,744 | 1,686,100 | |
COLEM Mortgage Trust 2022-HLNE A, 2.5430%, 4/12/42ž,‡ | 4,914,000 | 4,321,535 | |
COMM Mortgage Trust 2024-WCL1 A, CME Term SOFR 1 Month + 1.8410%, 7.1410%, 6/17/41ž,‡ | 2,536,542 | 2,524,377 | |
Connecticut Avenue Securities Trust 2021-R02 2M1, US 30 Day Average SOFR + 0.9000%, 6.2354%, 11/25/41ž,‡ | 818,068 | 817,509 | |
Connecticut Avenue Securities Trust 2021-R02 2M2, US 30 Day Average SOFR + 2.0000%, 7.3354%, 11/25/41ž,‡ | 4,397,000 | 4,423,859 | |
Connecticut Avenue Securities Trust 2021-R03 1M2, US 30 Day Average SOFR + 1.6500%, 6.9854%, 12/25/41ž,‡ | 951,000 | 956,311 | |
Connecticut Avenue Securities Trust 2022-R01 1B1, US 30 Day Average SOFR + 3.1500%, 8.4854%, 12/25/41ž,‡ | 1,759,000 | 1,807,330 | |
Connecticut Avenue Securities Trust 2022-R01 1M2, US 30 Day Average SOFR + 1.9000%, 7.2354%, 12/25/41ž,‡ | 1,997,000 | 2,014,343 | |
Connecticut Avenue Securities Trust 2022-R03 1M1, US 30 Day Average SOFR + 2.1000%, 7.4354%, 3/25/42ž,‡ | 1,403,770 | 1,425,097 | |
Connecticut Avenue Securities Trust 2022-R04 1M1, US 30 Day Average SOFR + 2.0000%, 7.3354%, 3/25/42ž,‡ | 611,605 | 620,205 | |
Connecticut Avenue Securities Trust 2022-R05 2M1, US 30 Day Average SOFR + 1.9000%, 7.2354%, 4/25/42ž,‡ | 1,407,545 | 1,419,194 | |
Connecticut Avenue Securities Trust 2023-R01 1M1, US 30 Day Average SOFR + 2.4000%, 7.7350%, 12/25/42ž,‡ | 761,211 | 783,090 | |
Connecticut Avenue Securities Trust 2023-R03 2M1, US 30 Day Average SOFR + 2.5000%, 7.8354%, 4/27/43ž,‡ | 1,573,455 | 1,602,334 | |
Connecticut Avenue Securities Trust 2023-R06 1M1, US 30 Day Average SOFR + 1.7000%, 7.0354%, 7/27/43ž,‡ | 965,226 | 971,796 | |
Connecticut Avenue Securities Trust 2023-R07 2M1, US 30 Day Average SOFR + 1.9500%, 7.2850%, 9/25/43ž,‡ | 445,945 | 449,362 | |
Connecticut Avenue Securities Trust 2023-R08 1M1, US 30 Day Average SOFR + 1.5000%, 6.8354%, 10/26/43ž,‡ | 865,965 | 871,031 | |
Connecticut Avenue Securities Trust 2024-R01 1M1, US 30 Day Average SOFR + 1.0500%, 6.3854%, 1/25/44ž,‡ | 772,715 | 772,714 | |
Connecticut Avenue Securities Trust 2024-R03 2M1, US 30 Day Average SOFR + 1.1500%, 6.4850%, 3/25/44ž,‡ | 473,046 | 473,046 | |
Connecticut Avenue Securities Trust 2024-R04 1M1, US 30 Day Average SOFR + 1.1000%, 6.4237%, 5/25/44ž,‡ | 713,503 | 713,503 | |
CP EF Asset Securitization I LLC 2002-1A A, 5.9600%, 4/15/30ž | 893,588 | 892,267 | |
CPF IV LLC / CP EF Asset Securitization LLC 2023-1A A, 7.4800%, 3/15/32ž | 754,280 | 761,870 | |
CRB Securitization Trust 2023-1 A, 6.9600%, 10/20/33ž | 1,003,980 | 1,009,867 | |
CyrusOne Data Centers Issuer I LLC 2023-2A A2, 5.5600%, 11/20/48ž | 1,791,000 | 1,750,816 | |
CyrusOne Data Centers Issuer I LLC 2024-1A A2, 4.7600%, 3/22/49ž | 708,449 | 667,179 | |
CyrusOne Data Centers Issuer I LLC 2024-3A A2, 4.6500%, 5/20/49ž | 3,607,000 | 3,266,714 | |
DB Master Finance LLC 2017-1A A2II, 4.0300%, 11/20/47ž | 4,803,750 | 4,559,653 | |
DC Commercial Mortgage Trust 2023-DC A, 6.3143%, 9/12/40ž | 1,548,000 | 1,588,087 | |
DC Commercial Mortgage Trust 2023-DC B, 6.8043%, 9/12/40ž | 1,459,617 | 1,489,504 | |
Diamond Infrastructure Funding LLC 2021-1A A, 1.7600%, 4/15/49ž | 2,114,000 | 1,907,296 | |
Diamond Resorts Owner Trust 2021-1A A, 1.5100%, 11/21/33ž | 388,277 | 370,104 | |
DROP Mortgage Trust 2021-FILE A, CME Term SOFR 1 Month + 1.2645%, 6.5935%, 10/15/43ž,‡ | 3,929,000 | 3,751,981 |
Schedule of Investments
June 30, 2024
Shares or Principal Amounts | Value | ||
Asset-Backed/Commercial Mortgage-Backed Securities – (continued) | |||
Elmwood CLO VIII Ltd 2019-2A AR, CME Term SOFR 3 Month + 1.4116%, 6.7362%, 4/20/34ž,‡ | $740,000 | $741,300 | |
Enva LLC 2024-A A, 7.4300%, 10/21/30ž | 2,530,000 | 2,529,943 | |
Exeter Automobile Receivables Trust 2020-2A E, 7.1900%, 9/15/27ž | 2,687,000 | 2,694,501 | |
Exeter Automobile Receivables Trust 2021-1A D, 1.0800%, 11/16/26 | 684,481 | 668,195 | |
Exeter Automobile Receivables Trust 2023-5A A2, 6.2000%, 4/15/26 | 1,117,929 | 1,118,844 | |
Exeter Automobile Receivables Trust 2024-1A A2, 5.5300%, 10/15/26 | 1,550,680 | 1,549,542 | |
Extended Stay America Trust 2021-ESH E, CME Term SOFR 1 Month + 2.9645%, 8.2935%, 7/15/38ž,‡ | 3,074,700 | 3,070,772 | |
FIGRE Trust 2024-HE1 A, 6.1650%, 3/25/54ž,‡ | 868,404 | 866,198 | |
FIGRE Trust 2024-HE2 A, 6.3800%, 5/25/54ž,‡ | 691,190 | 693,256 | |
First Help Financial LLC 2024-2A A2, 5.8900%, 6/15/30ž | 998,000 | 999,819 | |
First Investors Auto Owner Trust 2022-1A A, 2.0300%, 1/15/27ž | 593,547 | 585,591 | |
Freddie Mac Structured Agency Credit Risk Debt Notes 2021-HQA2 M2, US 30 Day Average SOFR + 2.0500%, 7.3854%, 12/26/33ž,‡ | 2,480,242 | 2,526,145 | |
Freddie Mac Structured Agency Credit Risk Debt Notes 2021-HQA3 M2, US 30 Day Average SOFR + 2.1000%, 7.4354%, 9/25/41ž,‡ | 361,621 | 363,664 | |
Freddie Mac Structured Agency Credit Risk Debt Notes 2022-HQA1 M1A, US 30 Day Average SOFR + 2.1000%, 7.4354%, 3/25/42ž,‡ | 534,733 | 539,543 | |
Freddie Mac Structured Agency Credit Risk Debt Notes 2022-HQA3 M1A, US 30 Day Average SOFR + 2.3000%, 7.6354%, 8/25/42ž,‡ | 615,228 | 629,785 | |
Freddie Mac Structured Agency Credit Risk Debt Notes 2023-DNA2 M1A, US 30 Day Average SOFR + 2.1000%, 7.4350%, 4/27/43ž,‡ | 1,380,113 | 1,406,058 | |
Freddie Mac Structured Agency Credit Risk Debt Notes 2023-HQA2 M1A, US 30 Day Average SOFR + 2.0000%, 7.3354%, 6/25/43ž,‡ | 1,449,520 | 1,459,105 | |
Freddie Mac Structured Agency Credit Risk Debt Notes 2023-HQA3 M1, US 30 Day Average SOFR + 1.8500%, 7.1854%, 11/25/43ž,‡ | 799,430 | 810,151 | |
Freddie Mac Structured Agency Credit Risk Debt Notes 2024-DNA1 A1, US 30 Day Average SOFR + 1.3500%, 6.6854%, 2/25/44ž,‡ | 576,389 | 578,196 | |
Freddie Mac Structured Agency Credit Risk Debt Notes 2024-DNA2 M1, US 30 Day Average SOFR + 1.2000%, 6.5354%, 5/25/44ž,‡ | 1,027,306 | 1,029,024 | |
FREMF Mortgage Trust 2017-K729 D, 0%, 11/25/49ž,◊ | 793,579 | 758,862 | |
FREMF Mortgage Trust 2017-K729 X2A, 0.1000%, 11/25/49ž,¤ | 5,943,869 | 1,009 | |
FREMF Mortgage Trust 2017-K729 X2B, 0.1000%, 11/25/49ž,¤ | 1,996,887 | 562 | |
GCAT 2022-INV1 A1, 3.0000%, 12/25/51ž,‡ | 4,455,999 | 3,696,752 | |
GCAT 2024-INV1 2A2, 6.5000%, 1/25/54ž,‡ | 1,757,914 | 1,765,301 | |
Gracie Point International Funding 2024-1A A, US 90 Day Average SOFR + 1.7000%, 7.0496%, 3/1/28ž,‡ | 558,000 | 560,188 | |
Great Wolf Trust 2024-WLF2 A, CME Term SOFR 1 Month + 1.6912%, 7.0201%, 5/15/41ž,‡ | 2,209,000 | 2,205,695 | |
Hertz Vehicle Financing LLC 2021-1A D, 3.9800%, 12/26/25ž | 1,520,000 | 1,499,083 | |
Hilton Grand Vacations Trust 2020-AA, 2.7400%, 2/25/39ž | 1,085,178 | 1,031,807 | |
Homeward Opportunities Fund I Trust 2024-RTL1 A1, 7.1200%, 7/25/29ž | 1,792,000 | 1,791,449 | |
Hudson's Bay Simon JV Trust 2015-HB10 A10, 4.1545%, 8/5/34ž | 412,000 | 389,060 | |
Hudson's Bay Simon JV Trust 2015-HB7 A7, 3.9141%, 8/5/34ž | 372,658 | 365,379 | |
Imerial Fund LLC 2023-NQM1 A1, 5.9410%, 2/25/68ž,Ç | 856,933 | 849,466 | |
JP Morgan Chase Commercial Mortgage Sec Trust 2020-ACE A, 3.2865%, 1/10/37ž | 991,000 | 973,694 | |
JP Morgan Chase Commercial Mortgage Sec Trust 2020-ACE B, 3.6401%, 1/10/37ž | 2,560,000 | 2,494,589 | |
LAD Auto Receivables Trust 2021-1A A, 1.3000%, 8/17/26ž | 43,997 | 43,858 | |
LAD Auto Receivables Trust 2022-1A A, 5.2100%, 6/15/27ž | 1,225,726 | 1,221,451 | |
LBA Trust 2024-BOLT A, CME Term SOFR 1 Month + 1.5911%, 6.8911%, 6/15/26ž,‡ | 1,424,004 | 1,416,843 | |
Lendbuzz Securitization Trust 2021-1A A, 1.4600%, 6/15/26ž | 778,725 | 759,877 | |
Lendbuzz Securitization Trust 2021-1A A, 4.2200%, 5/17/27ž | 1,010,652 | 993,871 | |
Lendbuzz Securitization Trust 2023-1A A2, 6.9200%, 8/15/28ž | 2,009,756 | 2,021,688 | |
Lendbuzz Securitization Trust 2024-1A A2, 6.1900%, 8/15/29ž | 2,135,000 | 2,134,840 | |
LHOME Mortgage Trust 2024-RTL1 A1, 7.0170%, 1/25/29ž,Ç | 836,000 | 839,348 | |
LHOME Mortgage Trust 2024-RTL2 A1, 7.1280%, 3/25/29ž,Ç | 1,454,356 | 1,464,855 |
Schedule of Investments
June 30, 2024
Shares or Principal Amounts | Value | ||
Asset-Backed/Commercial Mortgage-Backed Securities – (continued) | |||
LHOME Mortgage Trust 2024-RTL3 A1, 6.9000%, 5/25/29ž | $586,465 | $586,879 | |
Life Financial Services Trust 2021-BMR A, CME Term SOFR 1 Month + 0.8145%, 6.1435%, 3/15/38ž,‡ | 3,554,420 | 3,490,395 | |
Life Financial Services Trust 2021-BMR C, CME Term SOFR 1 Month + 1.2145%, 6.5435%, 3/15/38ž,‡ | 1,980,685 | 1,927,339 | |
Life Financial Services Trust 2022-BMR2 A1, CME Term SOFR 1 Month + 1.2952%, 6.6241%, 5/16/39ž,‡ | 2,823,000 | 2,777,391 | |
Life Financial Services Trust 2022-BMR2 B, CME Term SOFR 1 Month + 1.7939%, 7.1228%, 5/16/39ž,‡ | 1,059,000 | 1,038,727 | |
M&T Equipment Notes 2023-1A A2, 6.0900%, 7/15/30ž | 1,508,315 | 1,508,876 | |
Marlette Funding Trust 2023-1A A, 6.0700%, 4/15/33ž | 402,441 | 402,465 | |
Marlette Funding Trust 2023-2A B, 6.5400%, 6/15/33ž | 1,275,000 | 1,282,107 | |
MED Trust 2021-MDLN E, CME Term SOFR 1 Month + 3.2645%, 8.5935%, 11/15/38ž,‡ | 2,634,357 | 2,632,604 | |
Mello Mortgage Capital Acceptance Trust 2021-INV3 A11, US 30 Day Average SOFR + 0.9500%, 5.0000%, 10/25/51ž,‡ | 1,613,856 | 1,503,534 | |
Mello Mortgage Capital Acceptance Trust 2022-INV1 A2, 3.0000%, 3/25/52ž,‡ | 1,534,972 | 1,295,890 | |
Mello Mortgage Capital Acceptance Trust 2024-SD1 A1, 4.0000%, 4/25/54ž,Ç | 700,380 | 664,985 | |
Mercury Financial Credit Card Master Trust 2023-1A A, 8.0400%, 9/20/27ž | 2,674,000 | 2,692,467 | |
MHC Commercial Mortgage Trust 2021-MHC A, CME Term SOFR 1 Month + 0.9154%, 6.2444%, 4/15/38ž,‡ | 2,670,108 | 2,646,922 | |
MHC Commercial Mortgage Trust 2021-MHC C, CME Term SOFR 1 Month + 1.4654%, 6.7944%, 4/15/38ž,‡ | 1,507,518 | 1,491,739 | |
Mission Lane Credit Card Master Trust 2023-A A, 7.2300%, 7/17/28ž | 2,136,000 | 2,145,793 | |
NCMF Trust 2022-MFP A, CME Term SOFR 1 Month + 1.7420%, 7.0588%, 3/15/39ž,‡ | 855,000 | 847,020 | |
Neuberger Berman CLO Ltd 2019-33A BR, CME Term SOFR 3 Month + 1.8616%, 7.1893%, 10/17/33ž,‡ | 3,800,000 | 3,801,877 | |
New Residential Mortgage Loan Trust 2024-RTL1 A1, 6.6640%, 3/25/39ž,Ç | 2,019,946 | 2,035,022 | |
NMEF Funding LLC 2022-A A2, 2.5800%, 10/16/28ž | 465,214 | 462,743 | |
NRTH PARK Mortgage Trust 2024-PARK A, CME Term SOFR 1 Month + 1.6413%, 6.9701%, 3/15/41ž,‡ | 2,673,000 | 2,664,166 | |
NRZ Excess Spread Collateralized Notes 2020-PLS1 A, 3.8440%, 12/25/25ž | 246,678 | 238,271 | |
NRZ Excess Spread Collateralized Notes 2021-FHT1 A, 3.1040%, 7/25/26ž | 408,408 | 385,060 | |
Oak Street Investment Grade Net Lease Fund 2020-1A A1, 1.8500%, 11/20/50ž | 1,023,585 | 958,776 | |
Oasis Securitization 2022-2A A, 6.8500%, 10/15/34ž | 687,777 | 687,660 | |
Oasis Securitization 2023-1A A, 7.0000%, 2/15/35ž | 1,827,316 | 1,823,811 | |
OCCU Auto Receivables Trust 2023-1A A3, 6.2300%, 6/15/28ž | 1,784,000 | 1,803,642 | |
Oceanview Mortgage Trust 2021-4 A11, US 30 Day Average SOFR + 0.8500%, 5.0000%, 10/25/51ž,‡ | 1,766,919 | 1,633,700 | |
Oceanview Mortgage Trust 2021-5 AF, US 30 Day Average SOFR + 0.8500%, 5.0000%, 11/25/51ž,‡ | 1,696,290 | 1,573,988 | |
Oceanview Mortgage Trust 2022-1 A1, 3.0000%, 12/25/51ž,‡ | 888,653 | 746,945 | |
Oceanview Mortgage Trust 2022-2 A1, 3.0000%, 12/25/51ž,‡ | 2,677,445 | 2,261,215 | |
OCP CLO Ltd 2015-10A BR2, CME Term SOFR 3 Month + 1.9116%, 7.2361%, 1/26/34ž,‡ | 2,686,000 | 2,686,145 | |
Octagon Investment Partners 48 Ltd 2020-3A BR, CME Term SOFR 3 Month + 1.8616%, 7.1862%, 10/20/34ž,‡ | 527,000 | 527,511 | |
Onslow Bay Financial LLC 2022-INV1 A1, 3.0000%, 12/25/51ž,‡ | 3,548,485 | 2,945,550 | |
Onslow Bay Financial LLC 2022-INV1 A18, 3.0000%, 12/25/51ž,‡ | 1,504,987 | 1,230,088 | |
Onslow Bay Financial LLC 2024-NQM4 A3, 6.3210%, 1/25/64ž,Ç | 441,703 | 440,352 | |
Pagaya AI Debt Selection Trust 2022-1 A, 2.0300%, 10/15/29ž | 81,551 | 81,124 | |
Pawnee Equipment Receivables 2021-1 A2, 1.1000%, 7/15/27ž | 499,486 | 494,785 | |
Pretium Mortgage Credit Partners LLC 2023-RN1 A1, 8.2321%, 9/25/53ž,Ç | 1,942,261 | 1,971,891 | |
PRP Advisors LLC 2021-10 A1, 2.4870%, 10/25/26ž,Ç | 1,470,740 | 1,429,703 | |
PRP Advisors LLC 2021-9 A1, 2.3630%, 10/25/26ž,Ç | 1,449,259 | 1,407,178 | |
PRP Advisors LLC 2022-2 A1, 5.0000%, 3/25/27ž,Ç | 2,157,727 | 2,123,680 | |
PRP Advisors LLC 2024-2 A1, 7.0260%, 3/25/29ž,Ç | 1,158,176 | 1,185,513 | |
PRP Advisors LLC 2024-3 A1, 6.9940%, 5/25/29ž,Ç | 2,414,334 | 2,414,385 | |
PRP Advisors LLC 2024-RCF2 A1, 3.7500%, 3/25/54ž,Ç | 673,182 | 638,639 |
Schedule of Investments
June 30, 2024
Shares or Principal Amounts | Value | ||
Asset-Backed/Commercial Mortgage-Backed Securities – (continued) | |||
Rad CLO Ltd 2023-21A C, CME Term SOFR 3 Month + 2.5500%, 7.8736%, 1/25/33ž,‡ | $2,327,710 | $2,342,170 | |
Reach Financial LLC 2021-1A B, 2.1700%, 5/15/29ž | 1,458,317 | 1,445,200 | |
Reach Financial LLC 2024-1A A, 6.3000%, 2/18/31ž | 745,906 | 747,678 | |
Regatta Funding 2018-1A AR, CME Term SOFR 3 Month + 1.4000%, 0%, 7/17/37ž,‡ | 2,519,969 | 2,519,969 | |
Saluda Grade Alternative Mortgage Trust 2023-FIG3 A, 7.0670%, 8/25/53ž,‡ | 381,741 | 398,371 | |
Saluda Grade Alternative Mortgage Trust 2023-FIG4 A, 6.7180%, 11/25/53ž,‡ | 1,201,654 | 1,237,879 | |
Saluda Grade Alternative Mortgage Trust 2024-CES1 A1, 6.3060%, 3/25/54ž,‡ | 777,534 | 775,531 | |
Saluda Grade Alternative Mortgage Trust 2024-FIG5 A, 6.2550%, 4/25/54ž,‡ | 845,610 | 859,005 | |
Saluda Grade Alternative Mortgage Trust 2024-RTL4 A1, 7.5000%, 2/25/30ž,Ç | 2,614,000 | 2,620,862 | |
Saluda Grade Alternative Mortgage Trust 2024-RTL5 A1, 7.7620%, 4/25/30ž,Ç | 1,265,000 | 1,275,309 | |
Saluda Grade Alternative Mortgage Trust 2024-RTL6 A1, 7.4390%, 7/25/30ž,‡ | 1,422,000 | 1,421,974 | |
Santander Bank Auto Credit-Linked Notes 2021-1A B, 1.8330%, 12/15/31ž | 1,060,397 | 1,048,748 | |
Santander Bank Auto Credit-Linked Notes 2021-1A C, 3.2680%, 12/15/31ž | 145,926 | 144,561 | |
Santander Bank Auto Credit-Linked Notes 2022-A B, 5.2810%, 5/15/32ž | 688,456 | 684,838 | |
Santander Bank Auto Credit-Linked Notes 2023-B A2, 5.6440%, 12/15/33ž | 1,980,372 | 1,987,529 | |
Santander Bank Auto Credit-Linked Notes 2024-A B, 5.6220%, 6/15/32ž | 2,210,000 | 2,205,130 | |
Santander Drive Auto Receivables Trust 2021-1 D, 1.1300%, 11/16/26 | 2,130,566 | 2,097,312 | |
Sierra Receivables Funding Co LLC 2021-1A A, 0.9900%, 11/20/37ž | 552,607 | 526,556 | |
Signal Peak CLO LLC 2022-12A A1, 7.1207%, 7/10/28ž,‡ | 2,616,000 | 2,714,317 | |
SMRT 2022-MINI A, CME Term SOFR 1 Month + 1.0000%, 6.3290%, 1/15/39ž,‡ | 2,805,000 | 2,770,086 | |
SoFi Professional Loan Program 2020-C Trust, 1.9500%, 2/15/46ž | 1,220,253 | 1,120,315 | |
Sound Point CLO Ltd 2019-1A AR, CME Term SOFR 3 Month + 1.3416%, 6.6662%, 1/20/32ž,‡ | 2,136,000 | 2,136,995 | |
SREIT Trust 2021-MFP A, CME Term SOFR 1 Month + 0.8453%, 6.1741%, 11/15/38ž,‡ | 3,096,408 | 3,071,739 | |
Stack Infrastructure Issuer LLC 2024-1A A2, 5.9000%, 3/25/49ž | 865,000 | 854,795 | |
THE 2023-MIC Trust 2023-MIC A, 8.7315%, 12/5/38ž,‡ | 1,278,485 | 1,375,106 | |
The Huntington National Bank 2024-1 B1, 6.1530%, 5/20/32ž | 1,847,091 | 1,847,236 | |
Theorem Funding Trust 2022-3A A, 7.6000%, 4/15/29ž | 1,008,372 | 1,015,616 | |
THL Credit Wind River CLO Ltd 2014-1A ARR, CME Term SOFR 3 Month + 1.3116%, 6.6385%, 7/18/31ž,‡ | 3,243,373 | 3,243,879 | |
Tricolor Auto Securitization Trust 2023-1A A, 6.4800%, 8/17/26ž | 390,150 | 390,330 | |
Tricolor Auto Securitization Trust 2024-1A A, 6.6100%, 10/15/27ž | 808,853 | 810,648 | |
Tricolor Auto Securitization Trust 2024-2A A, 6.3600%, 12/15/27ž | 1,209,900 | 1,210,434 | |
TTAN 2021-MHC A, CME Term SOFR 1 Month + 0.9645%, 6.2935%, 3/15/38ž,‡ | 1,297,020 | 1,289,479 | |
TYSN 2023-CRNR Mortgage Trust 2023-CRNR A, 6.7991%, 12/10/33ž,‡ | 758,943 | 783,053 | |
TYSN 2023-CRNR Mortgage Trust 2023-CRNR B, 6.7991%, 12/10/33ž,‡ | 1,530,716 | 1,508,857 | |
UNIFY Auto Receivables Trust 2021-1A A4, 0.9800%, 7/15/26ž | 657,473 | 653,221 | |
Upstart Securitization Trust 2022-1 A, 3.1200%, 3/20/32ž | 461,332 | 459,013 | |
Upstart Securitization Trust 2022-2 A, 4.3700%, 5/20/32ž | 10,919 | 10,907 | |
US Bank National Association 2023-1 B, 6.7890%, 8/25/32ž | 1,406,669 | 1,412,237 | |
USASF Receivables LLC 2021-1A C, 2.2000%, 5/15/26ž | 1,896,952 | 1,864,644 | |
Vantage Data Centers LLC 2020-1A A2, 1.6450%, 9/15/45ž | 2,652,000 | 2,512,688 | |
VASA Trust 2021-VASA A, CME Term SOFR 1 Month + 1.0145%, 6.3435%, 7/15/39ž,‡ | 1,260,000 | 1,169,626 | |
Verus Securitization Trust 2020-1, 3.6420%, 1/25/60ž,Ç | 1,950,425 | 1,873,364 | |
VMC Finance LLC 2021-HT1 A, CME Term SOFR 1 Month + 1.7645%, 7.0964%, 1/19/37ž,‡ | 741,295 | 726,455 | |
WB Commercial Mortgage Trust 2024-HQ A, 6.1344%, 3/15/40ž,‡ | 1,248,000 | 1,244,730 | |
Westgate Resorts 2022-1A A, 1.7880%, 8/20/36ž | 332,039 | 318,260 | |
Westlake Automobile Receivable Trust 2023-3A A2A, 5.9600%, 10/15/26ž | 1,737,986 | 1,739,672 | |
Westlake Automobile Receivable Trust 2023-4A A2, 6.2300%, 1/15/27ž | 2,589,857 | 2,594,219 | |
Woodward Capital Management 2021-3 A21, US 30 Day Average SOFR + 0.8000%, 5.0000%, 7/25/51ž,‡ | 1,130,339 | 1,045,967 | |
Woodward Capital Management 2023-CES1 A1A, 6.5150%, 6/25/43ž,‡ | 961,368 | 965,522 | |
Woodward Capital Management 2023-CES2 A1A, 6.8080%, 9/25/43ž,‡ | 1,473,325 | 1,488,582 | |
Woodward Capital Management 2023-CES3 A1A, 7.1130%, 11/25/43ž,‡ | 2,598,578 | 2,632,413 |
Schedule of Investments
June 30, 2024
Shares or Principal Amounts | Value | ||
Asset-Backed/Commercial Mortgage-Backed Securities – (continued) | |||
Woodward Capital Management 2024-CES1 A1A, 6.0250%, 2/25/44ž,‡ | $1,049,950 | $1,046,003 | |
Woodward Capital Management 2024-CES2 A1A, 6.1410%, 4/25/44ž,‡ | 3,310,931 | 3,353,533 | |
Woodward Capital Management 2024-CES3 A1A, 6.5910%, 5/25/44ž,‡ | 1,084,588 | 1,093,755 | |
Total Asset-Backed/Commercial Mortgage-Backed Securities (cost $333,258,833) | 328,959,747 | ||
Bank Loans and Mezzanine Loans – 2.6% | |||
Capital Goods – 0.5% | |||
EMRLD Borrower LP, CME Term SOFR 1 Month + 2.50000%, 7.8291%, 6/18/31ƒ,‡ | 3,369,659 | 3,365,447 | |
Consumer Non-Cyclical – 0.4% | |||
Concentra Health Services Inc, CME Term SOFR 1 Month + 2.25000%, 7.5887%, 6/26/31ƒ,‡ | 1,260,000 | 1,263,150 | |
Medline Borrower LP, CME Term SOFR 1 Month + 2.25000%, 7.5779%, 10/23/28ƒ,‡ | 1,763,000 | 1,763,000 | |
3,026,150 | |||
Industrial – 0.6% | |||
AECOM Technology, CME Term SOFR 1 Month + 1.8750%, 7.2189%, 4/17/31‡ | 1,846,000 | 1,855,618 | |
APi Group DE Inc, CME Term SOFR 1 Month + 2.0000%, 7.3439%, 12/18/28‡ | 2,440,137 | 2,437,306 | |
4,292,924 | |||
Technology – 0.4% | |||
SS&C Technologies Inc, CME Term SOFR 1 Month + 2.0000%, 7.3439%, 5/9/31‡ | 3,063,329 | 3,094,282 | |
Transportation – 0.7% | |||
Genesee & Wyoming Inc, CME Term SOFR 3 Month + 2.0000%, 7.3346%, 4/10/31‡ | 4,786,968 | 4,780,362 | |
Total Bank Loans and Mezzanine Loans (cost $18,524,463) | 18,559,165 | ||
Corporate Bonds – 40.1% | |||
Banking – 10.3% | |||
American Express Co, SOFR + 1.3300%, 6.3380%, 10/30/26‡ | 2,284,000 | 2,306,428 | |
American Express Co, SOFR + 1.0000%, 5.0980%, 2/16/28‡ | 1,878,000 | 1,869,632 | |
Bank of America Corp, SOFR + 1.9900%, 6.2040%, 11/10/28‡ | 2,851,000 | 2,936,040 | |
Bank of America NA, 5.5260%, 8/18/26 | 6,452,000 | 6,497,811 | |
BNP Paribas SA, SOFR + 1.5200%, 5.1760%, 1/9/30ž,‡ | 2,447,000 | 2,421,370 | |
BNP Paribas SA, USD SWAP SEMI 30/360 5YR + 5.1500%, 7.3750%ž,‡,μ | 5,148,000 | 5,135,156 | |
Capital One Financial Corp, SOFR + 1.9050%, 5.7000%, 2/1/30‡,# | 1,462,000 | 1,468,953 | |
Danske Bank A/S, US Treasury Yield Curve Rate 1 Year + 2.1000%, 6.4660%, 1/9/26ž,‡ | 6,589,000 | 6,606,742 | |
Fifth Third Bancorp, SOFR + 2.3400%, 6.3390%, 7/27/29‡ | 1,256,000 | 1,287,511 | |
ING Groep NV, SOFR + 1.5600%, 6.0830%, 9/11/27‡ | 2,448,000 | 2,475,168 | |
JPMorgan Chase & Co, SOFR + 1.3200%, 4.0800%, 4/26/26‡ | 6,763,000 | 6,673,100 | |
JPMorgan Chase & Co, SOFR + 1.1900%, 5.0400%, 1/23/28‡ | 1,557,000 | 1,548,573 | |
JPMorgan Chase & Co, SOFR + 1.4500%, 5.2990%, 7/24/29‡ | 4,909,000 | 4,925,474 | |
Morgan Stanley, SOFR + 1.5900%, 5.1640%, 4/20/29‡ | 1,918,000 | 1,911,775 | |
Morgan Stanley, SOFR + 1.6300%, 5.4490%, 7/20/29‡ | 2,175,000 | 2,188,416 | |
Morgan Stanley Bank NA, 4.7540%, 4/21/26 | 2,138,000 | 2,118,734 | |
PNC Financial Services Group Inc/The, SOFR + 1.7300%, 6.6150%, 10/20/27‡ | 5,774,000 | 5,914,256 | |
Truist Financial Corp, SOFR + 2.0500%, 6.0470%, 6/8/27‡,# | 2,484,000 | 2,501,398 | |
Truist Financial Corp, SOFR + 1.6200%, 5.4350%, 1/24/30‡ | 1,123,000 | 1,120,075 | |
UBS Group AG, US Treasury Yield Curve Rate 1 Year + 1.5200%, 5.4280%, 2/8/30ž,‡ | 2,009,000 | 2,005,011 | |
US Bancorp, SOFR + 1.5600%, 5.3840%, 1/23/30‡ | 2,970,000 | 2,977,957 | |
Wells Fargo & Co, SOFR + 1.5100%, 3.5260%, 3/24/28‡ | 3,116,000 | 2,972,189 | |
Wells Fargo & Co, SOFR + 1.5000%, 5.1980%, 1/23/30‡ | 3,382,000 | 3,367,800 | |
73,229,569 | |||
Basic Industry – 1.0% | |||
Celanese US Holdings LLC, 6.3500%, 11/15/28 | 6,012,000 | 6,177,214 | |
Novelis Corp, 3.2500%, 11/15/26ž | 1,031,000 | 970,175 | |
7,147,389 |
Schedule of Investments
June 30, 2024
Shares or Principal Amounts | Value | ||
Corporate Bonds – (continued) | |||
Brokerage – 1.6% | |||
Charles Schwab Corp, 5.8750%, 8/24/26 | $6,336,000 | $6,408,819 | |
LPL Holdings Inc, 5.7000%, 5/20/27 | 4,883,000 | 4,902,306 | |
11,311,125 | |||
Capital Goods – 4.0% | |||
Amphenol Corp, 5.0500%, 4/5/29# | 3,086,000 | 3,095,254 | |
BAE Systems PLC, 5.1250%, 3/26/29ž | 1,787,000 | 1,779,043 | |
Boeing Co/The, 6.2590%, 5/1/27ž | 2,422,000 | 2,438,373 | |
Boeing Co/The, 6.2980%, 5/1/29ž | 3,176,000 | 3,220,655 | |
Nordson Corp, 5.6000%, 9/15/28 | 3,080,000 | 3,116,856 | |
Regal Rexnord Corp, 6.0500%, 2/15/26 | 1,890,000 | 1,894,631 | |
Regal Rexnord Corp, 6.0500%, 4/15/28 | 1,518,000 | 1,536,237 | |
RTX Corp, 5.7500%, 11/8/26 | 5,001,000 | 5,054,450 | |
TransDigm Inc, 6.3750%, 3/1/29ž | 2,419,000 | 2,431,199 | |
WESCO Distribution Inc, 6.3750%, 3/15/29ž | 3,457,000 | 3,469,490 | |
28,036,188 | |||
Communications – 0.9% | |||
Charter Communications Operating LLC / Charter Communications Operating Capital, 5.0500%, 3/30/29 | 5,673,000 | 5,455,683 | |
T-Mobile USA Inc, 4.8500%, 1/15/29 | 1,317,000 | 1,300,642 | |
6,756,325 | |||
Consumer Cyclical – 2.3% | |||
CBRE Services Inc, 5.5000%, 4/1/29 | 4,875,000 | 4,900,312 | |
Ford Motor Credit Co LLC, 5.8000%, 3/8/29 | 3,531,000 | 3,518,597 | |
LKQ Corp, 5.7500%, 6/15/28 | 4,169,000 | 4,208,272 | |
Lowe's Cos Inc, 3.3500%, 4/1/27 | 916,000 | 873,941 | |
ZF North America Capital Inc, 6.7500%, 4/23/30ž | 2,532,000 | 2,578,693 | |
16,079,815 | |||
Consumer Non-Cyclical – 4.4% | |||
Albertsons Cos Inc / Safeway Inc / New Albertsons LP / Albertsons LLC, 6.5000%, 2/15/28ž | 1,938,000 | 1,947,188 | |
GE HealthCare Technologies Inc, 5.6000%, 11/15/25 | 3,053,000 | 3,054,024 | |
HCA Inc, 5.3750%, 2/1/25 | 1,308,000 | 1,303,579 | |
HCA Inc, 5.8750%, 2/15/26 | 684,000 | 684,908 | |
HCA Inc, 5.2000%, 6/1/28 | 1,262,000 | 1,257,002 | |
Heartland Dental LLC / Heartland Dental Finance Corp, 10.5000%, 4/30/28ž | 2,346,000 | 2,490,185 | |
Illumina Inc, 5.8000%, 12/12/25 | 2,951,000 | 2,954,224 | |
IQVIA Inc, 6.2500%, 2/1/29 | 1,818,000 | 1,868,524 | |
JBS USA LUX SA / JBS USA Food Co / JBS USA Finance Inc, 2.5000%, 1/15/27 | 4,222,000 | 3,928,351 | |
Mattel Inc, 3.7500%, 4/1/29ž | 3,395,000 | 3,130,986 | |
Smith & Nephew PLC, 5.1500%, 3/20/27 | 692,000 | 689,694 | |
Solventum Corp, 5.4500%, 2/25/27ž | 1,387,000 | 1,385,647 | |
Solventum Corp, 5.4000%, 3/1/29ž | 2,684,000 | 2,675,810 | |
Universal Health Services Inc, 2.6500%, 10/15/30 | 4,735,000 | 4,042,488 | |
31,412,610 | |||
Electric – 2.2% | |||
Georgia Power Co, 4.6500%, 5/16/28 | 2,005,000 | 1,974,027 | |
Liberty Utilities Co, 5.5770%, 1/31/29ž | 3,046,000 | 3,058,701 | |
National Grid PLC, 5.6020%, 6/12/28 | 1,558,000 | 1,573,171 | |
NextEra Energy Operating Partners LP, 4.2500%, 7/15/24ž | 1,229,000 | 1,227,065 | |
Southern California Edison Co, 5.8500%, 11/1/27 | 2,077,000 | 2,117,428 | |
Xcel Energy Inc, 4.0000%, 6/15/28 | 5,589,000 | 5,326,412 | |
15,276,804 | |||
Energy – 2.4% | |||
Columbia Pipelines Holding Company LLC, 6.0550%, 8/15/26ž,# | 1,572,000 | 1,584,521 | |
DT Midstream Inc, 4.1250%, 6/15/29ž | 5,499,000 | 5,080,229 | |
Hess Midstream Operations LP, 6.5000%, 6/1/29ž | 2,197,000 | 2,227,236 | |
Occidental Petroleum Corp, 8.8750%, 7/15/30 | 840,000 | 967,342 | |
Occidental Petroleum Corp, 6.6250%, 9/1/30 | 1,596,000 | 1,673,759 |
Schedule of Investments
June 30, 2024
Shares or Principal Amounts | Value | ||
Corporate Bonds – (continued) | |||
Energy – (continued) | |||
Sunoco LP, 7.0000%, 5/1/29ž | $3,543,000 | $3,631,161 | |
Targa Resources Partners LP / Targa Resources Partners Finance Corp, 6.5000%, 7/15/27 | 1,643,000 | 1,654,726 | |
16,818,974 | |||
Finance Companies – 3.9% | |||
Air Lease Corp, 0.8000%, 8/18/24 | 3,072,000 | 3,051,685 | |
Ares Capital Corp, 7.0000%, 1/15/27 | 3,793,000 | 3,856,607 | |
Avolon Holdings Funding Ltd, 4.2500%, 4/15/26ž | 2,351,000 | 2,283,499 | |
Avolon Holdings Funding Ltd, 2.1250%, 2/21/26ž | 3,354,000 | 3,152,884 | |
Blackstone Private Credit Fund, 7.3000%, 11/27/28ž | 1,829,000 | 1,895,271 | |
Blackstone Secured Lending Fund, 5.8750%, 11/15/27 | 3,753,000 | 3,725,728 | |
Castlelake Aviation Finance DAC, 5.0000%, 4/15/27ž | 2,999,000 | 2,894,078 | |
Owl Rock Capital Corp, 3.1250%, 4/13/27 | 4,908,000 | 4,490,085 | |
Sixth Street Lending Partners, 6.5000%, 3/11/29ž | 2,605,000 | 2,575,363 | |
27,925,200 | |||
Government Guarantee – 0.2% | |||
Electricite de France SA, 5.7000%, 5/23/28ž | 1,520,000 | 1,535,334 | |
Insurance – 3.3% | |||
Aon North America Inc, 5.1500%, 3/1/29 | 3,327,000 | 3,317,721 | |
Centene Corp, 4.2500%, 12/15/27 | 13,752,000 | 13,125,462 | |
Corebridge Financial Inc, 3.5000%, 4/4/25 | 2,625,000 | 2,581,311 | |
Health Care Service Corp, 5.2000%, 6/15/29ž | 4,244,000 | 4,225,710 | |
23,250,204 | |||
Professional Services – 0.7% | |||
Jacobs Engineering Group Inc, 6.3500%, 8/18/28 | 5,024,000 | 5,182,430 | |
Real Estate Investment Trusts (REITs) – 0.6% | |||
American Tower Trust I, 5.4900%, 3/15/28ž | 4,241,000 | 4,253,460 | |
Technology – 2.3% | |||
Constellation Software Inc/Canada, 5.1580%, 2/16/29ž | 2,041,000 | 2,040,270 | |
Foundry JV Holdco LLC, 5.9000%, 1/25/30ž | 6,149,000 | 6,236,854 | |
Marvell Technology Inc, 5.7500%, 2/15/29# | 4,791,000 | 4,891,402 | |
MSCI Inc, 4.0000%, 11/15/29ž | 3,430,000 | 3,204,772 | |
16,373,298 | |||
Total Corporate Bonds (cost $284,906,280) | 284,588,725 | ||
Mortgage-Backed Securities – 4.8% | |||
Fannie Mae: | |||
3.0000%, TBA, 30 Year Maturity | 4,857,000 | 4,130,777 | |
Fannie Mae Pool: | |||
4.0000%, 11/1/48 | 522,569 | 485,405 | |
4.0000%, 12/1/48 | 81,399 | 75,610 | |
4.0000%, 6/1/49 | 64,945 | 60,244 | |
4.5000%, 6/1/49 | 27,257 | 26,065 | |
4.5000%, 8/1/49 | 42,356 | 40,503 | |
4.5000%, 1/1/50 | 56,230 | 53,765 | |
4.0000%, 9/1/50 | 1,631,525 | 1,513,437 | |
4.5000%, 12/1/50 | 738,685 | 706,306 | |
4.0000%, 1/1/51 | 829,842 | 769,779 | |
4.0000%, 3/1/51 | 4,378,363 | 4,061,462 | |
4.0000%, 3/1/51 | 83,704 | 77,646 | |
4.0000%, 3/1/51 | 42,114 | 39,119 | |
4.0000%, 10/1/51 | 621,730 | 576,730 | |
3.0000%, 3/1/52 | 929,060 | 800,217 | |
3.0000%, 4/1/52 | 785,979 | 678,370 | |
3.0000%, 4/1/52 | 679,398 | 584,916 | |
3.5000%, 4/1/52 | 693,555 | 623,028 | |
3.5000%, 4/1/52 | 362,474 | 326,112 | |
3.5000%, 4/1/52 | 210,849 | 189,408 | |
3.5000%, 4/1/52 | 127,191 | 114,442 | |
3.5000%, 4/1/52 | 109,511 | 98,526 |
Schedule of Investments
June 30, 2024
Shares or Principal Amounts | Value | ||
Mortgage-Backed Securities – (continued) | |||
Fannie Mae Pool – (continued) | |||
4.5000%, 4/1/52 | $131,041 | $123,717 | |
4.5000%, 4/1/52 | 110,906 | 104,707 | |
4.5000%, 4/1/52 | 63,579 | 60,015 | |
4.5000%, 4/1/52 | 57,752 | 54,515 | |
4.5000%, 4/1/52 | 50,468 | 47,639 | |
4.5000%, 4/1/52 | 32,500 | 30,679 | |
4.5000%, 5/1/52 | 176,006 | 166,140 | |
3.0000%, 6/1/52 | 1,549,223 | 1,328,576 | |
3.5000%, 7/1/52 | 2,633,849 | 2,360,318 | |
5.0000%, 10/1/52 | 558,647 | 543,146 | |
5.0000%, 10/1/52 | 245,774 | 238,954 | |
4.5000%, 7/1/53 | 592,867 | 566,143 | |
5.0000%, 7/1/53 | 203,272 | 199,679 | |
5.5000%, 7/1/53 | 907,736 | 895,148 | |
4.5000%, 8/1/53 | 383,414 | 366,131 | |
5.0000%, 9/1/53 | 229,382 | 224,819 | |
5.5000%, 11/1/53 | 409,029 | 410,800 | |
5.0000%, 12/1/53 | 108,744 | 106,657 | |
6.0000%, 1/1/54 | 53,985 | 55,337 | |
5.5000%, 3/1/54 | 736,258 | 739,245 | |
6.0000%, 3/1/54 | 44,893 | 45,902 | |
6.0000%, 4/1/54 | 159,335 | 162,255 | |
6.0000%, 5/1/54 | 1,243,807 | 1,260,389 | |
21,992,001 | |||
Freddie Mac Pool: | |||
4.0000%, 11/1/48 | 47,154 | 43,800 | |
4.5000%, 6/1/49 | 35,109 | 33,504 | |
4.5000%, 7/1/49 | 281,925 | 269,040 | |
4.5000%, 7/1/49 | 44,757 | 42,798 | |
4.5000%, 8/1/49 | 250,660 | 239,205 | |
4.5000%, 1/1/50 | 173,816 | 165,873 | |
4.5000%, 1/1/50 | 48,565 | 46,436 | |
4.0000%, 3/1/50 | 554,497 | 515,063 | |
4.5000%, 9/1/50 | 1,612,323 | 1,543,039 | |
4.0000%, 10/1/50 | 112,517 | 104,373 | |
2.5000%, 8/1/51 | 1,119,426 | 924,273 | |
2.5000%, 2/1/52 | 94,229 | 77,555 | |
4.5000%, 3/1/52 | 27,293 | 25,767 | |
3.5000%, 4/1/52 | 81,660 | 73,468 | |
3.5000%, 4/1/52 | 77,517 | 69,747 | |
3.5000%, 7/1/52 | 1,013,837 | 908,547 | |
5.0000%, 10/1/52 | 1,099,328 | 1,068,824 | |
5.0000%, 10/1/52 | 33,883 | 32,943 | |
5.0000%, 7/1/53 | 245,794 | 241,304 | |
5.0000%, 9/1/53 | 71,751 | 70,266 | |
5.5000%, 9/1/53 | 291,003 | 292,086 | |
6.0000%, 9/1/53 | 90,972 | 93,062 | |
5.5000%, 4/1/54 | 196,785 | 197,583 | |
6.0000%, 4/1/54 | 903,468 | 915,512 | |
7,994,068 | |||
Total Mortgage-Backed Securities (cost $35,559,025) | 34,116,846 | ||
United States Treasury Notes/Bonds – 4.5% | |||
3.1250%, 8/15/25 | 4,110,000 | 4,023,786 | |
4.6250%, 6/15/27 | 4,026,000 | 4,037,638 | |
4.5000%, 5/31/29 | 23,386,300 | 23,545,251 | |
Total United States Treasury Notes/Bonds (cost $31,487,541) | 31,606,675 | ||
Investment Companies – 3.0% | |||
Money Markets – 3.0% | |||
Janus Henderson Cash Liquidity Fund LLC, 5.3419%ºº,£ (cost $20,954,641) | 20,950,451 | 20,954,642 |
Schedule of Investments
June 30, 2024
Shares or Principal Amounts | Value | ||
Investments Purchased with Cash Collateral from Securities Lending – 0.5% | |||
Investment Companies – 0.4% | |||
Janus Henderson Cash Collateral Fund LLC, 5.2795%ºº,£ | 2,897,014 | $2,897,014 | |
Time Deposits – 0.1% | |||
Royal Bank of Canada, 5.3100%, 7/1/24 | $724,254 | 724,254 | |
Total Investments Purchased with Cash Collateral from Securities Lending (cost $3,621,268) | 3,621,268 | ||
Total Investments (total cost $728,312,051) – 101.9% | 722,407,068 | ||
Liabilities, net of Cash, Receivables and Other Assets – (1.9)% | (13,429,549) | ||
Net Assets – 100% | $708,977,519 |
Summary of Investments by Country - (Long Positions) (unaudited) | ||
Country | Value | % of Investment Securities |
United States | $688,131,033 | 95.2 % |
France | 9,091,860 | 1.3 |
Denmark | 6,606,742 | 0.9 |
Ireland | 5,436,383 | 0.7 |
United Kingdom | 4,041,908 | 0.6 |
Germany | 2,578,693 | 0.4 |
Netherlands | 2,475,168 | 0.3 |
Canada | 2,040,270 | 0.3 |
Switzerland | 2,005,011 | 0.3 |
Total | $722,407,068 | 100.0 % |
Schedule of Affiliated Investments - (% of Net Assets) | ||||||||
Affiliate | Affiliated Investments, at Value at 6/30/23 | Purchases | Sales Proceeds | Realized Gain/(Loss) | Change in Unrealized Appreciation/ Depreciation | Affiliated Investments, at Value at 6/30/24 | Ending Shares | Dividend Income |
Investment Companies - 3.0% | ||||||||
Money Markets - 3.0% | ||||||||
Janus Henderson Cash Liquidity Fund LLC, 5.3419%ºº | ||||||||
$27,396,668 | $359,861,935 | $(366,303,648) | $349 | $(662) | $20,954,642 | 20,950,451 | $835,318 | |
Investments Purchased with Cash Collateral from Securities Lending - 0.4% | ||||||||
Investment Companies - 0.4% | ||||||||
Janus Henderson Cash Collateral Fund LLC, 5.2795%ºº | ||||||||
- | 19,831,413 | (16,934,399) | - | - | 2,897,014 | 2,897,014 | 4,660 ∆ | |
Total Affiliated Investments - 3.4% | ||||||||
$27,396,668 | $379,693,348 | $(383,238,047) | $349 | $(662) | $23,851,656 | 23,847,465 | $839,978 |
Schedule of Futures | ||||
Description | Number of Contracts | Expiration Date | Notional Amount | Value and Unrealized Appreciation/(Depreciation) |
Futures Long: | ||||
2 Year US Treasury Note | 1,616 | 10/3/24 | $330,017,500 | $1,148,882 |
Futures Short: | ||||
10 Year US Treasury Note | 113 | 9/30/24 | (12,428,234) | (213,257) |
Schedule of Investments
June 30, 2024
Description | Number of Contracts | Expiration Date | Notional Amount | Value and Unrealized Appreciation/(Depreciation) |
5 Year US Treasury Note | 1,103 | 10/3/24 | $(117,555,672) | $(1,228,246) |
Ultra 10-Year Treasury Note | 1 | 9/30/24 | (113,531) | (2,401) |
US Treasury Long Bond | 173 | 9/30/24 | (20,468,063) | (639,035) |
Total - Futures Short | (2,082,939) | |||
Total | $(934,057) |
Fair Value of Derivative Instruments (not accounted for as hedging instruments) as of June 30, 2024 | |
Interest Rate Contracts | |
Asset Derivatives: | |
*Futures contracts | $1,148,882 |
Liability Derivatives: | |
*Futures contracts | $2,082,939 |
* | The fair value presented includes net cumulative unrealized appreciation (depreciation) on futures contracts and centrally cleared swaps. In the Statement of Assets and Liabilities, only current day's variation margin is reported in receivables or payables and the net cumulative unrealized appreciation (depreciation) is included in total distributable earnings (loss). |
The effect of Derivative Instruments (not accounted for as hedging instruments) on the Statement of Operations for the year ended June 30, 2024 | |
Amount of Realized Gain/(Loss) Recognized on Derivatives | |
Derivative | Interest Rate Contracts |
Futures contracts | $(5,357,039) |
Amount of Change in Unrealized Appreciation/Depreciation Recognized on Derivatives | |
Derivative | Interest Rate Contracts |
Futures contracts | $3,882,172 |
Average Ending Monthly Value of Derivative Instruments During the Year Ended June 30, 2024 | |
Futures contracts: | |
Average notional amount of contracts - long | $464,447,576 |
Average notional amount of contracts - short | 113,982,554 |
Schedule of Investments
June 30, 2024
Offsetting of Financial Assets and Derivative Assets | ||||
Counterparty | Gross Amounts of Recognized Assets | Offsetting Asset or Liability(a) | Collateral Pledged(b) | Net Amount |
JPMorgan Chase Bank, National Association | $3,474,068 | $— | $(3,474,068) | $— |
(a) | Represents the amount of assets or liabilities that could be offset with the same counterparty under master netting or similar agreements that management elects not to offset on the Statement of Assets and Liabilities. |
(b) | Collateral pledged is limited to the net outstanding amount due to/from an individual counterparty. The actual collateral amounts pledged may exceed these amounts and may fluctuate in value. |
Notes to Schedule of Investments and Other Information
IBOR | Interbank Offered Rate |
LLC | Limited Liability Company |
LP | Limited Partnership |
PLC | Public Limited Company |
SOFR | Secured Overnight Financing Rate |
TBA | (To Be Announced) Securities are purchased/sold on a forward commitment basis with an approximate principal amount and no defined maturity date. The actual principal and maturity date will be determined upon settlement when specific mortgage pools are assigned. |
ž | Securities sold under Rule 144A of the Securities Act of 1933, as amended, are subject to legal and/or contractual restrictions on resale and may not be publicly sold without registration under the 1933 Act. Unless otherwise noted, these securities have been determined to be liquid under guidelines established by the Board of Trustees. The total value of 144A securities as of the year ended June 30, 2024 is $419,317,985, which represents 59.1% of net assets. |
ƒ | All or a portion of this position is not funded, or has been purchased on a delayed delivery or when-issued basis. If applicable, interest rates will be determined and interest will begin to accrue at a future date. See Notes to Financial Statements. |
‡ | Variable or floating rate security. Rate shown is the current rate as of June 30, 2024. Certain variable rate securities are not based on a published reference rate and spread; they are determined by the issuer or agent and current market conditions. Reference rate is as of reset date and may vary by security, which may not indicate a reference rate and/or spread in their description. |
ºº | Rate shown is the 7-day yield as of June 30, 2024. |
# | Loaned security; a portion of the security is on loan at June 30, 2024. |
μ | Perpetual security. Perpetual securities have no stated maturity date, but they may be called/redeemed by the issuer. The date indicated, if any, represents the next call date. |
Ç | Step bond. The coupon rate will increase or decrease periodically based upon a predetermined schedule. The rate shown reflects the current rate. |
◊ | Zero coupon bond. |
¤ | Interest only security. An interest only security represents the interest only portion of a pool of underlying mortgages or mortgage-backed securities which are separated and sold individually from the principal portion of the securities. Principal amount shown represents the par value on which interest payments are based. |
£ | The Fund may invest in certain securities that are considered affiliated companies. As defined by the Investment Company Act of 1940, as amended, an affiliated company is one in which the Fund owns 5% or more of the outstanding voting securities, or a company which is under common ownership or control. |
∆ | Net of income paid to the securities lending agent and rebates paid to the borrowing counterparties. |
Notes to Schedule of Investments and Other Information
Valuation Inputs Summary | |||
Level 1 - Quoted Prices | Level 2 - Other Significant Observable Inputs | Level 3 - Significant Unobservable Inputs | |
Assets | |||
Investments In Securities: | |||
Asset-Backed/Commercial Mortgage-Backed Securities | $- | $328,959,747 | $- |
Bank Loans and Mezzanine Loans | - | 18,559,165 | - |
Corporate Bonds | - | 284,588,725 | - |
Mortgage-Backed Securities | - | 34,116,846 | - |
United States Treasury Notes/Bonds | - | 31,606,675 | - |
Investment Companies | - | 20,954,642 | - |
Investments Purchased with Cash Collateral from Securities Lending | - | 3,621,268 | - |
Total Investments in Securities | $- | $722,407,068 | $- |
Other Financial Instruments(a): | |||
Futures Contracts | 1,148,882 | - | - |
Total Assets | $1,148,882 | $722,407,068 | $- |
Liabilities | |||
Other Financial Instruments(a): | |||
Futures Contracts | $2,082,939 | $- | $- |
(a) | Other financial instruments may include forward foreign currency exchange contracts, futures, written options, written swaptions, and swap contracts. Forward foreign currency exchange contracts, futures contracts, and swap contracts are reported at their unrealized appreciation/(depreciation) at measurement date, which represents the change in the contract's value from trade date. Written options and written swaptions are reported at their market value at measurement date. |
Statement of Assets and Liabilities
June 30, 2024
Assets: | |
Unaffiliated investments, at value (cost $704,460,396)(1) | $698,555,412 |
Affiliated investments, at value (cost $23,851,655) | 23,851,656 |
Cash | 17,796 |
Deposits with brokers for futures | 2,649,000 |
Variation margin receivable on futures contracts | 324,141 |
Trustees' deferred compensation | 19,495 |
Receivables: | |
Interest | 5,246,748 |
Fund shares sold | 219,747 |
Dividends from affiliates | 81,679 |
Other assets | 31,641 |
Total Assets | 730,997,315 |
Liabilities: | |
Collateral for securities loaned (Note 3) | 3,621,268 |
Variation margin payable on futures contracts | 37,876 |
Payables: | |
Investments purchased | 11,392,249 |
TBA investments purchased | 4,137,748 |
Fund shares repurchased | 2,255,200 |
Advisory fees | 136,085 |
Transfer agent fees and expenses | 116,538 |
Dividends | 105,882 |
Professional fees | 68,728 |
Trustees' deferred compensation fees | 19,495 |
12b-1 Distribution and shareholder servicing fees | 14,704 |
Trustees' fees and expenses | 4,093 |
Affiliated fund administration fees payable | 1,477 |
Custodian fees | 801 |
Accrued expenses and other payables | 107,652 |
Total Liabilities | 22,019,796 |
Commitments and contingent liabilities (Note 4) | |
Net Assets | $708,977,519 |
Statement of Assets and Liabilities
June 30, 2024
Net Assets Consist of: | |
Capital (par value and paid-in surplus) | $804,641,216 |
Total distributable earnings (loss) | (95,663,697) |
Total Net Assets | $708,977,519 |
Net Assets - Class A Shares | $34,090,166 |
Shares Outstanding, $0.01 Par Value (unlimited shares authorized) | 11,954,571 |
Net Asset Value Per Share(2) | $2.85 |
Maximum Offering Price Per Share(3) | $2.92 |
Net Assets - Class C Shares | $9,135,365 |
Shares Outstanding, $0.01 Par Value (unlimited shares authorized) | 3,208,940 |
Net Asset Value Per Share(2) | $2.85 |
Net Assets - Class D Shares | $141,411,052 |
Shares Outstanding, $0.01 Par Value (unlimited shares authorized) | 49,548,733 |
Net Asset Value Per Share | $2.85 |
Net Assets - Class I Shares | $317,302,060 |
Shares Outstanding, $0.01 Par Value (unlimited shares authorized) | 111,315,772 |
Net Asset Value Per Share | $2.85 |
Net Assets - Class N Shares | $11,647,073 |
Shares Outstanding, $0.01 Par Value (unlimited shares authorized) | 4,109,836 |
Net Asset Value Per Share | $2.83 |
Net Assets - Class S Shares | $328,605 |
Shares Outstanding, $0.01 Par Value (unlimited shares authorized) | 115,380 |
Net Asset Value Per Share | $2.85 |
Net Assets - Class T Shares | $195,063,198 |
Shares Outstanding, $0.01 Par Value (unlimited shares authorized) | 68,331,209 |
Net Asset Value Per Share | $2.85 |
(1) | Includes $3,474,068 of securities on loan. See Note 3 in Notes to Financial Statements. |
(2) | Redemption price per share may be reduced for any applicable contingent deferred sales charge. |
(3) | Maximum offering price is computed at 100/97.50 of net asset value. |
Statement of Operations
For the year ended June 30, 2024
Investment Income: | |
Interest | $38,682,864 |
Dividends from affiliates | 835,318 |
Affiliated securities lending income, net | 4,660 |
Unaffiliated securities lending income, net | 1,165 |
Other income | 160,094 |
Total Investment Income | 39,684,101 |
Expenses: | |
Advisory fees | 3,331,371 |
12b-1 Distribution and shareholder servicing fees: | |
Class A Shares | 96,898 |
Class C Shares | 106,984 |
Class S Shares | 865 |
Transfer agent administrative fees and expenses: | |
Class D Shares | 162,028 |
Class S Shares | 865 |
Class T Shares | 526,267 |
Transfer agent networking and omnibus fees: | |
Class A Shares | 21,616 |
Class C Shares | 7,466 |
Class I Shares | 486,836 |
Other transfer agent fees and expenses: | |
Class A Shares | 2,243 |
Class C Shares | 553 |
Class D Shares | 28,254 |
Class I Shares | 18,044 |
Class N Shares | 926 |
Class S Shares | 28 |
Class T Shares | 3,975 |
Shareholder reports expense | 121,243 |
Registration fees | 110,242 |
Professional fees | 79,112 |
Affiliated fund administration fees | 18,928 |
Custodian fees | 17,640 |
Trustees' fees and expenses | 15,721 |
Other expenses | 148,539 |
Total Expenses | 5,306,644 |
Less: Excess Expense Reimbursement and Waivers | (1,193,571) |
Net Expenses | 4,113,073 |
Net Investment Income/(Loss) | 35,571,028 |
Net Realized Gain/(Loss) on Investments: | |
Investments | (5,353,502) |
Investments in affiliates | 349 |
Futures contracts | (5,357,039) |
Total Net Realized Gain/(Loss) on Investments | (10,710,192) |
Change in Unrealized Net Appreciation/Depreciation: | |
Investments and Trustees' deferred compensation | 18,686,829 |
Investments in affiliates | (662) |
Futures contracts | 3,882,172 |
Total Change in Unrealized Net Appreciation/Depreciation | 22,568,339 |
Net Increase/(Decrease) in Net Assets Resulting from Operations | $47,429,175 |
Statements of Changes in Net Assets
Year ended June 30, 2024 | Year ended June 30, 2023 | |
Operations: | ||
Net investment income/(loss) | $35,571,028 | $26,320,722 |
Net realized gain/(loss) on investments | (10,710,192) | (36,854,228) |
Change in unrealized net appreciation/depreciation | 22,568,339 | 23,677,403 |
Net Increase/(Decrease) in Net Assets Resulting from Operations | 47,429,175 | 13,143,897 |
Dividends and Distributions to Shareholders: | ||
Class A Shares | (1,771,013) | (1,529,388) |
Class C Shares | (428,590) | (312,077) |
Class D Shares | (6,786,523) | (4,662,092) |
Class I Shares | (16,157,720) | (12,057,650) |
Class N Shares | (958,095) | (824,681) |
Class S Shares | (15,232) | (9,940) |
Class T Shares | (9,794,173) | (7,453,470) |
Net Decrease from Dividends and Distributions to Shareholders | (35,911,346) | (26,849,298) |
Capital Share Transactions: | ||
Class A Shares | (12,362,022) | (19,681,125) |
Class C Shares | (3,927,021) | (3,910,070) |
Class D Shares | (7,217,891) | (23,774,024) |
Class I Shares | (56,133,972) | (68,623,946) |
Class N Shares | (14,523,254) | (18,450,692) |
Class S Shares | (57,677) | 15,663 |
Class T Shares | (39,491,011) | (59,379,905) |
Net Increase/(Decrease) from Capital Share Transactions | (133,712,848) | (193,804,099) |
Net Increase/(Decrease) in Net Assets | (122,195,019) | (207,509,500) |
Net Assets: | ||
Beginning of period | 831,172,538 | 1,038,682,038 |
End of period | $708,977,519 | $831,172,538 |
Financial Highlights
Class A Shares | |||||
For a share outstanding during the year ended June 30 | 2024 | 2023 | 2022 | 2021 | 2020 |
Net Asset Value, Beginning of Period | $2.81 | $2.85 | $3.08 | $3.06 | $3.02 |
Income/(Loss) from Investment Operations: | |||||
Net investment income/(loss)(1) | 0.13 | 0.08 | 0.03 | 0.05 | 0.06 |
Net realized and unrealized gain/(loss) | 0.04 | (0.04) | (0.22) | 0.02 | 0.05 |
Total from Investment Operations | 0.17 | 0.04 | (0.19) | 0.07 | 0.11 |
Less Dividends and Distributions: | |||||
Dividends (from net investment income) | (0.13) | (0.08) | (0.04) | (0.05) | (0.07) |
Total Dividends and Distributions | (0.13) | (0.08) | (0.04) | (0.05) | (0.07) |
Net Asset Value, End of Period | $2.85 | $2.81 | $2.85 | $3.08 | $3.06 |
Total Return* | 6.16% | 1.39% | (6.28)% | 2.30% | 3.57% |
Net Assets, End of Period (in thousands) | $34,090 | $45,842 | $66,254 | $77,673 | $65,066 |
Ratios to Average Net Assets**: | |||||
Ratio of Gross Expenses | 0.81% | 0.83% | 0.78% | 0.78% | 0.79% |
Ratio of Net Expenses (After Waivers and Expense Offsets) | 0.70% | 0.70% | 0.71% | 0.74% | 0.74% |
Ratio of Net Investment Income/(Loss) | 4.49% | 2.68% | 1.06% | 1.51% | 2.10% |
Portfolio Turnover Rate | 105% (2) | 118% (2) | 94% (2) | 112% (2) | 121% |
* | Total return includes adjustments in accordance with generally accepted accounting principles required at the year or period end and are not annualized for periods of less than one full year. Returns shown exclude any applicable sales charges. |
** | Annualized for periods of less than one full year. |
(1) | Per share amounts are calculated based on average shares outstanding during the year or period. |
(2) | Portfolio Turnover Rate excludes TBA (to be announced) purchase and sales commitments. |
Financial Highlights
Class C Shares | |||||
For a share outstanding during the year ended June 30 | 2024 | 2023 | 2022 | 2021 | 2020 |
Net Asset Value, Beginning of Period | $2.80 | $2.84 | $3.08 | $3.05 | $3.01 |
Income/(Loss) from Investment Operations: | |||||
Net investment income/(loss)(1) | 0.11 | 0.06 | 0.01 | 0.03 | 0.04 |
Net realized and unrealized gain/(loss) | 0.05 | (0.04) | (0.23) | 0.03 | 0.04 |
Total from Investment Operations | 0.16 | 0.02 | (0.22) | 0.06 | 0.08 |
Less Dividends and Distributions: | |||||
Dividends (from net investment income) | (0.11) | (0.06) | (0.02) | (0.03) | (0.04) |
Total Dividends and Distributions | (0.11) | (0.06) | (0.02) | (0.03) | (0.04) |
Net Asset Value, End of Period | $2.85 | $2.80 | $2.84 | $3.08 | $3.05 |
Total Return* | 5.79% | 0.75% | (7.27)% | 2.04% | 2.84% |
Net Assets, End of Period (in thousands) | $9,135 | $12,886 | $16,947 | $23,656 | $27,296 |
Ratios to Average Net Assets**: | |||||
Ratio of Gross Expenses | 1.55% | 1.48% | 1.51% | 1.37% | 1.53% |
Ratio of Net Expenses (After Waivers and Expense Offsets) | 1.41% | 1.33% | 1.42% | 1.32% | 1.47% |
Ratio of Net Investment Income/(Loss) | 3.79% | 2.08% | 0.34% | 0.93% | 1.37% |
Portfolio Turnover Rate | 105% (2) | 118% (2) | 94% (2) | 112% (2) | 121% |
* | Total return includes adjustments in accordance with generally accepted accounting principles required at the year or period end and are not annualized for periods of less than one full year. Returns shown exclude any applicable sales charges. |
** | Annualized for periods of less than one full year. |
(1) | Per share amounts are calculated based on average shares outstanding during the year or period. |
(2) | Portfolio Turnover Rate excludes TBA (to be announced) purchase and sales commitments. |
Financial Highlights
Class D Shares | |||||
For a share outstanding during the year ended June 30 | 2024 | 2023 | 2022 | 2021 | 2020 |
Net Asset Value, Beginning of Period | $2.81 | $2.85 | $3.08 | $3.06 | $3.02 |
Income/(Loss) from Investment Operations: | |||||
Net investment income/(loss)(1) | 0.13 | 0.08 | 0.04 | 0.05 | 0.07 |
Net realized and unrealized gain/(loss) | 0.04 | (0.04) | (0.23) | 0.03 | 0.04 |
Total from Investment Operations | 0.17 | 0.04 | (0.19) | 0.08 | 0.11 |
Less Dividends and Distributions: | |||||
Dividends (from net investment income) | (0.13) | (0.08) | (0.04) | (0.06) | (0.07) |
Total Dividends and Distributions | (0.13) | (0.08) | (0.04) | (0.06) | (0.07) |
Net Asset Value, End of Period | $2.85 | $2.81 | $2.85 | $3.08 | $3.06 |
Total Return* | 6.35% | 1.56% | (6.12)% | 2.47% | 3.74% |
Net Assets, End of Period (in thousands) | $141,411 | $146,435 | $172,562 | $207,596 | $191,666 |
Ratios to Average Net Assets**: | |||||
Ratio of Gross Expenses | 0.66% | 0.67% | 0.63% | 0.63% | 0.64% |
Ratio of Net Expenses (After Waivers and Expense Offsets) | 0.52% | 0.53% | 0.54% | 0.57% | 0.58% |
Ratio of Net Investment Income/(Loss) | 4.71% | 2.88% | 1.23% | 1.68% | 2.25% |
Portfolio Turnover Rate | 105% (2) | 118% (2) | 94% (2) | 112% (2) | 121% |
* | Total return includes adjustments in accordance with generally accepted accounting principles required at the year or period end and are not annualized for periods of less than one full year. |
** | Annualized for periods of less than one full year. |
(1) | Per share amounts are calculated based on average shares outstanding during the year or period. |
(2) | Portfolio Turnover Rate excludes TBA (to be announced) purchase and sales commitments. |
Financial Highlights
Class I Shares | |||||
For a share outstanding during the year ended June 30 | 2024 | 2023 | 2022 | 2021 | 2020 |
Net Asset Value, Beginning of Period | $2.81 | $2.85 | $3.08 | $3.05 | $3.02 |
Income/(Loss) from Investment Operations: | |||||
Net investment income/(loss)(1) | 0.13 | 0.08 | 0.04 | 0.05 | 0.07 |
Net realized and unrealized gain/(loss) | 0.05 | (0.03) | (0.23) | 0.04 | 0.03 |
Total from Investment Operations | 0.18 | 0.05 | (0.19) | 0.09 | 0.10 |
Less Dividends and Distributions: | |||||
Dividends (from net investment income) | (0.14) | (0.09) | (0.04) | (0.06) | (0.07) |
Total Dividends and Distributions | (0.14) | (0.09) | (0.04) | (0.06) | (0.07) |
Net Asset Value, End of Period | $2.85 | $2.81 | $2.85 | $3.08 | $3.05 |
Total Return* | 6.42% | 1.63% | (6.08)% | 2.82% | 3.42% |
Net Assets, End of Period (in thousands) | $317,302 | $368,402 | $442,881 | $421,533 | $380,901 |
Ratios to Average Net Assets**: | |||||
Ratio of Gross Expenses | 0.65% | 0.66% | 0.61% | 0.60% | 0.61% |
Ratio of Net Expenses (After Waivers and Expense Offsets) | 0.45% | 0.46% | 0.49% | 0.56% | 0.56% |
Ratio of Net Investment Income/(Loss) | 4.76% | 2.94% | 1.28% | 1.69% | 2.27% |
Portfolio Turnover Rate | 105% (2) | 118% (2) | 94% (2) | 112% (2) | 121% |
* | Total return includes adjustments in accordance with generally accepted accounting principles required at the year or period end and are not annualized for periods of less than one full year. |
** | Annualized for periods of less than one full year. |
(1) | Per share amounts are calculated based on average shares outstanding during the year or period. |
(2) | Portfolio Turnover Rate excludes TBA (to be announced) purchase and sales commitments. |
Financial Highlights
Class N Shares | |||||
For a share outstanding during the year ended June 30 | 2024 | 2023 | 2022 | 2021 | 2020 |
Net Asset Value, Beginning of Period | $2.79 | $2.84 | $3.07 | $3.05 | $3.01 |
Income/(Loss) from Investment Operations: | |||||
Net investment income/(loss)(1) | 0.14 | 0.08 | 0.04 | 0.06 | 0.07 |
Net realized and unrealized gain/(loss) | 0.04 | (0.04) | (0.22) | 0.02 | 0.05 |
Total from Investment Operations | 0.18 | 0.04 | (0.18) | 0.08 | 0.12 |
Less Dividends and Distributions: | |||||
Dividends (from net investment income) | (0.14) | (0.09) | (0.05) | (0.06) | (0.08) |
Total Dividends and Distributions | (0.14) | (0.09) | (0.05) | (0.06) | (0.08) |
Net Asset Value, End of Period | $2.83 | $2.79 | $2.84 | $3.07 | $3.05 |
Total Return* | 6.49% | 1.33% | (6.03)% | 2.61% | 3.89% |
Net Assets, End of Period (in thousands) | $11,647 | $25,912 | $45,088 | $15,816 | $17,144 |
Ratios to Average Net Assets**: | |||||
Ratio of Gross Expenses | 0.52% | 0.53% | 0.50% | 0.50% | 0.49% |
Ratio of Net Expenses (After Waivers and Expense Offsets) | 0.39% | 0.40% | 0.41% | 0.44% | 0.44% |
Ratio of Net Investment Income/(Loss) | 4.78% | 2.83% | 1.39% | 1.80% | 2.34% |
Portfolio Turnover Rate | 105% (2) | 118% (2) | 94% (2) | 112% (2) | 121% |
* | Total return includes adjustments in accordance with generally accepted accounting principles required at the year or period end and are not annualized for periods of less than one full year. |
** | Annualized for periods of less than one full year. |
(1) | Per share amounts are calculated based on average shares outstanding during the year or period. |
(2) | Portfolio Turnover Rate excludes TBA (to be announced) purchase and sales commitments. |
Financial Highlights
Class S Shares | |||||
For a share outstanding during the year ended June 30 | 2024 | 2023 | 2022 | 2021 | 2020 |
Net Asset Value, Beginning of Period | $2.80 | $2.85 | $3.07 | $3.05 | $3.01 |
Income/(Loss) from Investment Operations: | |||||
Net investment income/(loss)(1) | 0.12 | 0.07 | 0.03 | 0.04 | 0.06 |
Net realized and unrealized gain/(loss) | 0.05 | (0.05) | (0.22) | 0.02 | 0.04 |
Total from Investment Operations | 0.17 | 0.02 | (0.19) | 0.06 | 0.10 |
Less Dividends and Distributions: | |||||
Dividends (from net investment income) | (0.12) | (0.07) | (0.03) | (0.04) | (0.06) |
Total Dividends and Distributions | (0.12) | (0.07) | (0.03) | (0.04) | (0.06) |
Net Asset Value, End of Period | $2.85 | $2.80 | $2.85 | $3.07 | $3.05 |
Total Return* | 6.35% | 0.84% | (6.16)% | 2.12% | 3.39% |
Net Assets, End of Period (in thousands) | $329 | $381 | $371 | $660 | $791 |
Ratios to Average Net Assets**: | |||||
Ratio of Gross Expenses | 1.86% | 1.82% | 1.46% | 1.43% | 1.26% |
Ratio of Net Expenses (After Waivers and Expense Offsets) | 0.88% | 0.88% | 0.90% | 0.92% | 0.93% |
Ratio of Net Investment Income/(Loss) | 4.33% | 2.55% | 0.87% | 1.32% | 1.88% |
Portfolio Turnover Rate | 105% (2) | 118% (2) | 94% (2) | 112% (2) | 121% |
* | Total return includes adjustments in accordance with generally accepted accounting principles required at the year or period end and are not annualized for periods of less than one full year. |
** | Annualized for periods of less than one full year. |
(1) | Per share amounts are calculated based on average shares outstanding during the year or period. |
(2) | Portfolio Turnover Rate excludes TBA (to be announced) purchase and sales commitments. |
Financial Highlights
Class T Shares | |||||
For a share outstanding during the year ended June 30 | 2024 | 2023 | 2022 | 2021 | 2020 |
Net Asset Value, Beginning of Period | $2.81 | $2.85 | $3.08 | $3.06 | $3.02 |
Income/(Loss) from Investment Operations: | |||||
Net investment income/(loss)(1) | 0.13 | 0.08 | 0.03 | 0.05 | 0.06 |
Net realized and unrealized gain/(loss) | 0.04 | (0.04) | (0.22) | 0.02 | 0.05 |
Total from Investment Operations | 0.17 | 0.04 | (0.19) | 0.07 | 0.11 |
Less Dividends and Distributions: | |||||
Dividends (from net investment income) | (0.13) | (0.08) | (0.04) | (0.05) | (0.07) |
Total Dividends and Distributions | (0.13) | (0.08) | (0.04) | (0.05) | (0.07) |
Net Asset Value, End of Period | $2.85 | $2.81 | $2.85 | $3.08 | $3.06 |
Total Return* | 6.23% | 1.45% | (6.23)% | 2.36% | 3.63% |
Net Assets, End of Period (in thousands) | $195,063 | $231,314 | $294,579 | $403,560 | $427,052 |
Ratios to Average Net Assets**: | |||||
Ratio of Gross Expenses | 0.75% | 0.77% | 0.73% | 0.73% | 0.74% |
Ratio of Net Expenses (After Waivers and Expense Offsets) | 0.63% | 0.64% | 0.65% | 0.69% | 0.69% |
Ratio of Net Investment Income/(Loss) | 4.58% | 2.75% | 1.10% | 1.56% | 2.14% |
Portfolio Turnover Rate | 105% (2) | 118% (2) | 94% (2) | 112% (2) | 121% |
* | Total return includes adjustments in accordance with generally accepted accounting principles required at the year or period end and are not annualized for periods of less than one full year. |
** | Annualized for periods of less than one full year. |
(1) | Per share amounts are calculated based on average shares outstanding during the year or period. |
(2) | Portfolio Turnover Rate excludes TBA (to be announced) purchase and sales commitments. |
Notes to Financial Statements
Average Daily Net Assets of Class D Shares of the Janus Henderson funds | Administrative Services Fee |
Under $40 billion | 0.12% |
$40 billion — $49.9 billion | 0.10% |
Over $49.9 billion | 0.08% |
Notes to Financial Statements
Undistributed Ordinary Income | Undistributed Long-Term Gains | Accumulated Capital Losses | Loss Deferrals | Other Book to Tax Differences | Net Tax Appreciation/ (Depreciation) |
$294,751 | $- | $(88,243,841) | $- | $(19,493) | $(7,695,114) |
Capital Loss Carryover Schedule | ||
For the year ended June 30, 2024 | ||
No Expiration | ||
Short-Term | Long-Term | Accumulated Capital Losses |
$(48,002,157) | $(40,241,684) | $(88,243,841) |
Notes to Financial Statements
Federal Tax Cost | Unrealized Appreciation | Unrealized (Depreciation) | Net Tax Appreciation/ (Depreciation) |
$730,102,182 | $2,874,514 | $(10,569,628) | $(7,695,114) |
Federal Tax Cost | Unrealized Appreciation | Unrealized (Depreciation) | Net Tax Appreciation/ (Depreciation) |
$(934,057) | $- | $- | $- |
For the year ended June 30, 2024 | |||
Distributions | |||
From Ordinary Income | From Long-Term Capital Gains | Tax Return of Capital | Net Investment Loss |
$35,911,346 | $- | $- | $- |
For the year ended June 30, 2023 | |||
Distributions | |||
From Ordinary Income | From Long-Term Capital Gains | Tax Return of Capital | Net Investment Loss |
$26,849,298 | $- | $- | $- |
Notes to Financial Statements
Year ended June 30, 2024 | Year ended June 30, 2023 | |||
Shares | Amount | Shares | Amount | |
Class A Shares: | ||||
Shares sold | 1,188,733 | $3,370,622 | 4,927,559 | $13,955,715 |
Reinvested dividends and distributions | 489,180 | 1,386,539 | 451,629 | 1,279,551 |
Shares repurchased | (6,045,129) | (17,119,183) | (12,302,306) | (34,916,391) |
Net Increase/(Decrease) | (4,367,216) | $(12,362,022) | (6,923,118) | $(19,681,125) |
Class C Shares: | ||||
Shares sold | 928,524 | $2,630,591 | 2,781,745 | $7,842,642 |
Reinvested dividends and distributions | 146,009 | 413,295 | 104,725 | 296,109 |
Shares repurchased | (2,462,539) | (6,970,907) | (4,246,434) | (12,048,821) |
Net Increase/(Decrease) | (1,388,006) | $(3,927,021) | (1,359,964) | $(3,910,070) |
Class D Shares: | ||||
Shares sold | 5,289,637 | $14,988,881 | 4,940,410 | $14,021,646 |
Reinvested dividends and distributions | 2,310,892 | 6,561,296 | 1,591,642 | 4,513,086 |
Shares repurchased | (10,150,454) | (28,768,068) | (14,930,024) | (42,308,756) |
Net Increase/(Decrease) | (2,549,925) | $(7,217,891) | (8,397,972) | $(23,774,024) |
Class I Shares: | ||||
Shares sold | 22,602,745 | $63,977,378 | 31,934,370 | $90,429,441 |
Reinvested dividends and distributions | 5,522,585 | 15,649,072 | 4,069,555 | 11,528,791 |
Shares repurchased | (48,049,415) | (135,760,422) | (60,224,738) | (170,582,178) |
Net Increase/(Decrease) | (19,924,085) | $(56,133,972) | (24,220,813) | $(68,623,946) |
Class N Shares: | ||||
Shares sold | 3,789,294 | $10,692,613 | 4,787,805 | $13,543,586 |
Reinvested dividends and distributions | 339,876 | 958,026 | 292,647 | 824,510 |
Shares repurchased | (9,302,988) | (26,173,893) | (11,670,942) | (32,818,788) |
Net Increase/(Decrease) | (5,173,818) | $(14,523,254) | (6,590,490) | $(18,450,692) |
Class S Shares: | ||||
Shares sold | 6,972 | $19,591 | 9,909 | $27,923 |
Reinvested dividends and distributions | 5,377 | 15,217 | 3,513 | 9,940 |
Shares repurchased | (32,901) | (92,485) | (7,824) | (22,200) |
Net Increase/(Decrease) | (20,552) | $(57,677) | 5,598 | $15,663 |
Class T Shares: | ||||
Shares sold | 5,572,497 | $15,763,874 | 3,509,789 | $9,965,967 |
Reinvested dividends and distributions | 3,418,652 | 9,703,663 | 2,604,951 | 7,386,314 |
Shares repurchased | (22,935,997) | (64,958,548) | (27,082,150) | (76,732,186) |
Net Increase/(Decrease) | (13,944,848) | $(39,491,011) | (20,967,410) | $(59,379,905) |
Purchases of Securities | Proceeds from Sales of Securities | Purchases of Long- Term U.S. Government Obligations | Proceeds from Sales of Long-Term U.S. Government Obligations |
$423,006,351 | $424,869,729 | $353,034,549 | $468,772,754 |
Report of Independent Registered Public Accounting Firm
August 22, 2024
Designation Requirements (unaudited)
Section 163(j) Interest Dividend | 97% |
Additional Information (unaudited)
Schedule of Investments
June 30, 2024
Shares or Principal Amounts | Value | ||
Common Stocks – 97.7% | |||
Aerospace & Defense – 2.3% | |||
AAR Corp* | 497,463 | $36,165,560 | |
AerSale Corp* | 2,590,034 | 17,923,035 | |
54,088,595 | |||
Auto Components – 1.3% | |||
Adient PLC* | 573,357 | 14,167,652 | |
Dorman Products Inc* | 194,446 | 17,787,920 | |
31,955,572 | |||
Banks – 16.8% | |||
Ameris Bancorp | 1,090,640 | 54,913,724 | |
Cadence Bank | 596,113 | 16,858,076 | |
Columbia Banking System Inc | 636,495 | 12,659,886 | |
Eastern Bankshares Inc | 3,161,275 | 44,194,624 | |
Enterprise Financial Services Corp | 148,631 | 6,080,494 | |
FB Financial Corp | 925,731 | 36,131,281 | |
First Busey Corp | 1,154,589 | 27,952,600 | |
Fulton Financial Corp | 2,998,147 | 50,908,536 | |
Hilltop Holdings Inc | 278,826 | 8,721,677 | |
Nicolet Bankshares Inc | 221,613 | 18,402,743 | |
OFG Bancorp | 662,757 | 24,820,250 | |
Towne Bank/Portsmouth VA | 962,109 | 26,236,712 | |
United Community Banks Inc/GA | 1,531,246 | 38,985,523 | |
Wintrust Financial Corp | 361,862 | 35,665,119 | |
402,531,245 | |||
Beverages – 1.3% | |||
Coca-Cola Consolidated Inc | 28,032 | 30,414,720 | |
Building Products – 1.4% | |||
Gibraltar Industries Inc* | 397,916 | 27,277,142 | |
Janus International Group Inc* | 547,393 | 6,913,573 | |
34,190,715 | |||
Capital Markets – 4.3% | |||
Lazard Inc | 622,572 | 23,769,799 | |
Piper Jaffray Cos | 258,790 | 59,565,694 | |
WisdomTree Investments Inc | 1,933,614 | 19,162,115 | |
102,497,608 | |||
Chemicals – 2.3% | |||
Ashland Global Holdings Inc | 238,883 | 22,572,055 | |
Innospec Inc | 258,551 | 31,954,318 | |
54,526,373 | |||
Commercial Services & Supplies – 2.4% | |||
Boyd Group Services Inc | 220,206 | 41,367,305 | |
Healthcare Services Group Inc* | 1,406,011 | 14,875,596 | |
56,242,901 | |||
Construction & Engineering – 1.2% | |||
Comfort Systems USA Inc | 98,377 | 29,918,413 | |
Construction Materials – 1.3% | |||
Eagle Materials Inc | 139,978 | 30,439,616 | |
Electrical Equipment – 2.0% | |||
Encore Wire Corp | 166,487 | 48,252,927 | |
Electronic Equipment, Instruments & Components – 4.1% | |||
Fabrinet* | 132,947 | 32,544,096 | |
Insight Enterprises Inc* | 184,698 | 36,636,695 | |
Rogers Corp* | 87,144 | 10,510,438 | |
Vishay Intertechnology Inc | 784,147 | 17,486,478 | |
97,177,707 | |||
Energy Equipment & Services – 3.0% | |||
ChampionX Corp | 702,930 | 23,344,305 | |
Oceaneering International Inc* | 1,021,167 | 24,160,811 | |
Weatherford International PLC* | 191,534 | 23,453,339 | |
70,958,455 |
Schedule of Investments
June 30, 2024
Shares or Principal Amounts | Value | ||
Common Stocks – (continued) | |||
Entertainment – 0.2% | |||
Vivid Seats Inc - Class A* | 838,762 | $4,822,882 | |
Equity Real Estate Investment Trusts (REITs) – 1.0% | |||
Broadstone Net Lease Inc | 1,512,059 | 23,996,376 | |
Food & Staples Retailing – 1.5% | |||
Casey's General Stores Inc | 91,653 | 34,971,119 | |
Food Products – 0.9% | |||
Nomad Foods Ltd | 1,358,607 | 22,389,843 | |
Gas Utilities – 1.1% | |||
Chesapeake Utilities Corp | 257,510 | 27,347,562 | |
Health Care Equipment & Supplies – 3.3% | |||
Enovis Corp* | 515,151 | 23,284,825 | |
Envista Holdings Corp* | 1,145,521 | 19,050,015 | |
Globus Medical Inc* | 543,531 | 37,226,438 | |
79,561,278 | |||
Health Care Providers & Services – 1.5% | |||
Owens & Minor Inc* | 1,805,215 | 24,370,403 | |
Progyny Inc* | 405,392 | 11,598,265 | |
35,968,668 | |||
Health Care Real Estate Investment Trusts (REITs) – 0.7% | |||
Community Healthcare Trust Inc | 716,650 | 16,762,444 | |
Household Durables – 2.5% | |||
M/I Homes Inc* | 254,214 | 31,049,698 | |
Meritage Homes Corp | 171,337 | 27,730,893 | |
58,780,591 | |||
Industrial Real Estate Investment Trusts (REITs) – 2.2% | |||
STAG Industrial Inc | 1,490,251 | 53,738,451 | |
Insurance – 5.1% | |||
Axis Capital Holdings Ltd | 745,933 | 52,700,166 | |
Hanover Insurance Group Inc | 335,145 | 42,040,589 | |
Kemper Corp | 472,148 | 28,012,541 | |
122,753,296 | |||
Life Sciences Tools & Services – 0.4% | |||
Mesa Laboratories Inc | 108,265 | 9,394,154 | |
Machinery – 2.3% | |||
Helios Technologies Inc | 573,547 | 27,386,870 | |
Hillenbrand Inc | 666,711 | 26,681,774 | |
54,068,644 | |||
Marine – 2.4% | |||
Kirby Corp* | 469,869 | 56,257,415 | |
Metals & Mining – 3.4% | |||
Commercial Metals Co | 910,837 | 50,086,926 | |
TimkenSteel Corp* | 1,539,362 | 31,202,868 | |
81,289,794 | |||
Multi-Utilities – 1.2% | |||
Black Hills Corp | 527,256 | 28,672,181 | |
Oil, Gas & Consumable Fuels – 7.3% | |||
Gulfport Energy Corp* | 218,693 | 33,022,643 | |
Magnolia Oil & Gas Corp | 1,689,862 | 42,821,103 | |
Oasis Petroleum Inc | 427,426 | 71,670,792 | |
PBF Energy Inc | 578,234 | 26,610,329 | |
174,124,867 | |||
Pharmaceuticals – 1.2% | |||
Avadel Pharmaceuticals PLC* | 641,398 | 9,018,056 | |
Pacira Pharmaceuticals Inc* | 650,482 | 18,610,290 | |
27,628,346 | |||
Real Estate Management & Development – 1.6% | |||
Cushman & Wakefield PLC* | 3,770,761 | 39,215,914 | |
Retail Real Estate Investment Trusts (REITs) – 0.9% | |||
Phillips Edison & Co Inc | 682,935 | 22,338,804 |
Schedule of Investments
June 30, 2024
Shares or Principal Amounts | Value | ||
Common Stocks – (continued) | |||
Semiconductor & Semiconductor Equipment – 2.3% | |||
Tower Semiconductor Ltd* | 765,342 | $30,085,594 | |
Ultra Clean Holdings Inc* | 501,674 | 24,582,026 | |
54,667,620 | |||
Software – 1.5% | |||
nCino Inc* | 510,901 | 16,067,836 | |
Sapiens International Corp NV | 581,635 | 19,734,876 | |
35,802,712 | |||
Specialized Real Estate Investment Trusts (REITs) – 1.7% | |||
National Storage Affiliates Trust | 531,262 | 21,898,620 | |
PotlatchDeltic Corp | 448,023 | 17,647,626 | |
39,546,246 | |||
Specialty Retail – 2.4% | |||
Academy Sports & Outdoors Inc | 689,674 | 36,725,141 | |
Boot Barn Holdings Inc* | 160,771 | 20,728,205 | |
57,453,346 | |||
Textiles, Apparel & Luxury Goods – 2.3% | |||
Steven Madden Ltd | 836,531 | 35,385,261 | |
Under Armour Inc* | 3,082,682 | 20,561,489 | |
55,946,750 | |||
Trading Companies & Distributors – 3.1% | |||
GATX Corp | 283,838 | 37,568,798 | |
H&E Equipment Services Inc | 545,795 | 24,107,765 | |
MSC Industrial Direct Co Inc | 169,119 | 13,412,828 | |
75,089,391 | |||
Total Common Stocks (cost $1,741,530,303) | 2,335,783,541 | ||
Investment Companies – 0.6% | |||
Exchange-Traded Funds (ETFs) – 0.6% | |||
SPDR S&P Biotech# (cost $14,112,282) | 169,889 | 15,750,409 | |
Repurchase Agreements – 1.5% | |||
ING Financial Markets LLC, Joint repurchase agreement, 5.3000%, dated 6/28/24, maturing 7/1/24 to be repurchased at $15,506,846 collateralized by $17,068,830 in U.S. Treasuries 0.5000% - 4.1250%, 2/15/25 - 11/15/50 with a value of $15,816,995 | $15,500,000 | 15,500,000 | |
Royal Bank of Canada, NY Branch, Joint repurchase agreement, 5.2800%, dated 6/28/24, maturing 7/1/24 to be repurchased at $20,008,800 collateralized by $20,316,620 in U.S. Treasuries 4.2500%, 3/15/27 with a value of $20,408,987 | 20,000,000 | 20,000,000 | |
Total Repurchase Agreements (cost $35,500,000) | 35,500,000 | ||
Investments Purchased with Cash Collateral from Securities Lending – 0.3% | |||
Investment Companies – 0.2% | |||
Janus Henderson Cash Collateral Fund LLC, 5.2795%ºº,£ | 5,812,571 | 5,812,571 | |
Time Deposits – 0.1% | |||
Royal Bank of Canada, 5.3100%, 7/1/24 | $1,453,143 | 1,453,143 | |
Total Investments Purchased with Cash Collateral from Securities Lending (cost $7,265,714) | 7,265,714 | ||
Total Investments (total cost $1,798,408,299) – 100.1% | 2,394,299,664 | ||
Liabilities, net of Cash, Receivables and Other Assets – (0.1)% | (3,309,760) | ||
Net Assets – 100% | $2,390,989,904 |
Schedule of Investments
June 30, 2024
Summary of Investments by Country - (Long Positions) (unaudited) | ||
Country | Value | % of Investment Securities |
United States | $2,280,722,046 | 95.3 % |
Israel | 49,820,470 | 2.1 |
Canada | 41,367,305 | 1.7 |
United Kingdom | 22,389,843 | 0.9 |
Total | $2,394,299,664 | 100.0 % |
Schedule of Affiliated Investments - (% of Net Assets) | ||||||||
Affiliate | Affiliated Investments, at Value at 6/30/23 | Purchases | Sales Proceeds | Realized Gain/(Loss) | Change in Unrealized Appreciation/ Depreciation | Affiliated Investments, at Value at 6/30/24 | Ending Shares | Dividend Income |
Common Stocks - N/A | ||||||||
Health Care Equipment & Supplies - N/A | ||||||||
Varex Imaging Corp* | ||||||||
$25,663,464 | $- | $(21,348,911) | $6,408,667 | $(10,723,220) | $- | - | $- | |
Hotels, Restaurants & Leisure - N/A | ||||||||
Century Casinos Inc* | ||||||||
14,376,470 | - | (10,950,478) | (5,168,375) | 1,742,383 | - | - | - | |
Total Common Stocks - N/A | ||||||||
$40,039,934 | $- | $(32,299,389) | $1,240,292 | $(8,980,837) | $- | - | $- | |
Investments Purchased with Cash Collateral from Securities Lending - 0.2% | ||||||||
Investment Companies - 0.2% | ||||||||
Janus Henderson Cash Collateral Fund LLC, 5.2795%ºº | ||||||||
13,164,153 | 81,224,773 | (88,576,355) | - | - | 5,812,571 | 5,812,571 | 89,295 ∆ | |
Total Affiliated Investments - 0.2% | ||||||||
$53,204,087 | $81,224,773 | $(120,875,744) | $1,240,292 | $(8,980,837) | $5,812,571 | 5,812,571 | $89,295 |
Offsetting of Financial Assets and Derivative Assets | ||||
Counterparty | Gross Amounts of Recognized Assets | Offsetting Asset or Liability(a) | Collateral Pledged(b) | Net Amount |
ING Financial Markets LLC | $15,500,000 | $— | $(15,500,000) | $— |
JPMorgan Chase Bank, National Association | 7,109,281 | — | (7,109,281) | — |
Royal Bank of Canada, NY Branch | 20,000,000 | — | (20,000,000) | — |
Total | $42,609,281 | $— | $(42,609,281) | $— |
(a) | Represents the amount of assets or liabilities that could be offset with the same counterparty under master netting or similar agreements that management elects not to offset on the Statement of Assets and Liabilities. |
(b) | Collateral pledged is limited to the net outstanding amount due to/from an individual counterparty. The actual collateral amounts pledged may exceed these amounts and may fluctuate in value. |
Notes to Schedule of Investments and Other Information
LLC | Limited Liability Company |
PLC | Public Limited Company |
SPDR | Standard & Poor's Depositary Receipt |
* | Non-income producing security. |
ºº | Rate shown is the 7-day yield as of June 30, 2024. |
# | Loaned security; a portion of the security is on loan at June 30, 2024. |
£ | The Fund may invest in certain securities that are considered affiliated companies. As defined by the Investment Company Act of 1940, as amended, an affiliated company is one in which the Fund owns 5% or more of the outstanding voting securities, or a company which is under common ownership or control. |
∆ | Net of income paid to the securities lending agent and rebates paid to the borrowing counterparties. |
Valuation Inputs Summary | |||
Level 1 - Quoted Prices | Level 2 - Other Significant Observable Inputs | Level 3 - Significant Unobservable Inputs | |
Assets | |||
Investments In Securities: | |||
Common Stocks | $2,335,783,541 | $- | $- |
Investment Companies | 15,750,409 | - | - |
Repurchase Agreements | - | 35,500,000 | - |
Investments Purchased with Cash Collateral from Securities Lending | - | 7,265,714 | - |
Total Assets | $2,351,533,950 | $42,765,714 | $- |
Statement of Assets and Liabilities
June 30, 2024
Assets: | |
Unaffiliated investments, at value (cost $1,757,095,728)(1) | $2,352,987,093 |
Affiliated investments, at value (cost $5,812,571) | 5,812,571 |
Repurchase agreements, at value (cost $35,500,000) | 35,500,000 |
Cash | 86,172 |
Trustees' deferred compensation | 65,863 |
Receivables: | |
Investments sold | 8,126,548 |
Dividends | 2,532,344 |
Fund shares sold | 1,467,831 |
Interest | 15,646 |
Other assets | 15,869 |
Total Assets | 2,406,609,937 |
Liabilities: | |
Collateral for securities loaned (Note 2) | 7,265,714 |
Payables: | |
Investments purchased | 3,330,685 |
Fund shares repurchased | 2,502,569 |
Advisory fees | 1,772,189 |
Transfer agent fees and expenses | 418,829 |
Trustees' deferred compensation fees | 65,863 |
Professional fees | 64,053 |
12b-1 Distribution and shareholder servicing fees | 40,216 |
Trustees' fees and expenses | 13,587 |
Affiliated fund administration fees payable | 4,885 |
Custodian fees | 1,699 |
Accrued expenses and other payables | 139,744 |
Total Liabilities | 15,620,033 |
Commitments and contingent liabilities (Note 3) | |
Net Assets | $2,390,989,904 |
Statement of Assets and Liabilities
June 30, 2024
Net Assets Consist of: | |
Capital (par value and paid-in surplus) | $1,647,275,489 |
Total distributable earnings (loss) | 743,714,415 |
Total Net Assets | $2,390,989,904 |
Net Assets - Class A Shares | $25,690,339 |
Shares Outstanding, $0.01 Par Value (unlimited shares authorized) | 1,047,609 |
Net Asset Value Per Share(2) | $24.52 |
Maximum Offering Price Per Share(3) | $26.02 |
Net Assets - Class C Shares | $15,075,004 |
Shares Outstanding, $0.01 Par Value (unlimited shares authorized) | 673,187 |
Net Asset Value Per Share(2) | $22.39 |
Net Assets - Class D Shares | $94,217,917 |
Shares Outstanding, $0.01 Par Value (unlimited shares authorized) | 3,897,397 |
Net Asset Value Per Share | $24.17 |
Net Assets - Class I Shares | $1,343,912,267 |
Shares Outstanding, $0.01 Par Value (unlimited shares authorized) | 55,281,752 |
Net Asset Value Per Share | $24.31 |
Net Assets - Class L Shares | $85,471,995 |
Shares Outstanding, $0.01 Par Value (unlimited shares authorized) | 3,399,189 |
Net Asset Value Per Share | $25.14 |
Net Assets - Class N Shares | $468,911,048 |
Shares Outstanding, $0.01 Par Value (unlimited shares authorized) | 19,333,757 |
Net Asset Value Per Share | $24.25 |
Net Assets - Class R Shares | $42,208,540 |
Shares Outstanding, $0.01 Par Value (unlimited shares authorized) | 1,795,944 |
Net Asset Value Per Share | $23.50 |
Net Assets - Class S Shares | $26,321,578 |
Shares Outstanding, $0.01 Par Value (unlimited shares authorized) | 1,095,491 |
Net Asset Value Per Share | $24.03 |
Net Assets - Class T Shares | $289,181,216 |
Shares Outstanding, $0.01 Par Value (unlimited shares authorized) | 11,899,609 |
Net Asset Value Per Share | $24.30 |
(1) | Includes $7,109,281 of securities on loan. See Note 2 in Notes to Financial Statements. |
(2) | Redemption price per share may be reduced for any applicable contingent deferred sales charge. |
(3) | Maximum offering price is computed at 100/94.25 of net asset value. |
Statement of Operations
For the year ended June 30, 2024
Investment Income: | |
Dividends | $39,967,598 |
Interest | 1,965,053 |
Affiliated securities lending income, net | 89,295 |
Unaffiliated securities lending income, net | 25,589 |
Other income | 8,237 |
Foreign tax withheld | (127,710) |
Total Investment Income | 41,928,062 |
Expenses: | |
Advisory fees | 17,012,110 |
12b-1 Distribution and shareholder servicing fees: | |
Class A Shares | 74,994 |
Class C Shares | 155,649 |
Class R Shares | 206,537 |
Class S Shares | 67,453 |
Transfer agent administrative fees and expenses: | |
Class D Shares | 103,056 |
Class L Shares | 160,501 |
Class R Shares | 103,265 |
Class S Shares | 67,443 |
Class T Shares | 732,523 |
Transfer agent networking and omnibus fees: | |
Class A Shares | 85,000 |
Class C Shares | 13,852 |
Class I Shares | 2,137,787 |
Other transfer agent fees and expenses: | |
Class A Shares | 1,542 |
Class C Shares | 766 |
Class D Shares | 16,786 |
Class I Shares | 68,530 |
Class L Shares | 1,810 |
Class N Shares | 21,385 |
Class R Shares | 883 |
Class S Shares | 681 |
Class T Shares | 4,913 |
Shareholder reports expense | 265,675 |
Registration fees | 180,876 |
Professional fees | 85,384 |
Affiliated fund administration fees | 60,210 |
Trustees' fees and expenses | 51,513 |
Custodian fees | 18,726 |
Other expenses | 173,355 |
Total Expenses | 21,873,205 |
Less: Excess Expense Reimbursement and Waivers | (342,490) |
Net Expenses | 21,530,715 |
Net Investment Income/(Loss) | 20,397,347 |
Net Realized Gain/(Loss) on Investments: | |
Investments and foreign currency transactions | 151,287,347 |
Investments in affiliates | 1,240,292 |
Total Net Realized Gain/(Loss) on Investments | 152,527,639 |
Change in Unrealized Net Appreciation/Depreciation: | |
Investments, foreign currency translations and Trustees' deferred compensation | 129,102,402 |
Investments in affiliates | (8,980,837) |
Total Change in Unrealized Net Appreciation/Depreciation | 120,121,565 |
Net Increase/(Decrease) in Net Assets Resulting from Operations | $293,046,551 |
Statements of Changes in Net Assets
Year ended June 30, 2024 | Year ended June 30, 2023 | |
Operations: | ||
Net investment income/(loss) | $20,397,347 | $24,326,823 |
Net realized gain/(loss) on investments | 152,527,639 | 115,126,973 |
Change in unrealized net appreciation/depreciation | 120,121,565 | 180,225,668 |
Net Increase/(Decrease) in Net Assets Resulting from Operations | 293,046,551 | 319,679,464 |
Dividends and Distributions to Shareholders: | ||
Class A Shares | (1,224,135) | (1,201,002) |
Class C Shares | (787,935) | (797,503) |
Class D Shares | (4,803,452) | (4,306,275) |
Class I Shares | (71,024,965) | (67,590,940) |
Class L Shares | (4,416,510) | (3,957,051) |
Class N Shares | (26,647,110) | (26,860,645) |
Class R Shares | (1,884,573) | (1,858,291) |
Class S Shares | (1,397,812) | (1,201,026) |
Class T Shares | (15,006,833) | (15,583,510) |
Net Decrease from Dividends and Distributions to Shareholders | (127,193,325) | (123,356,243) |
Capital Share Transactions: | ||
Class A Shares | (3,939,084) | (4,037,263) |
Class C Shares | (3,012,765) | (1,542,913) |
Class D Shares | (1,529,299) | (2,926,076) |
Class I Shares | (122,464,316) | (166,213,635) |
Class L Shares | (1,864,717) | (15,502,175) |
Class N Shares | (88,507,606) | (105,130,829) |
Class R Shares | (2,700,071) | (6,019,543) |
Class S Shares | (2,961,531) | (1,869,761) |
Class T Shares | (38,978,619) | (107,076,257) |
Net Increase/(Decrease) from Capital Share Transactions | (265,958,008) | (410,318,452) |
Net Increase/(Decrease) in Net Assets | (100,104,782) | (213,995,231) |
Net Assets: | ||
Beginning of period | 2,491,094,686 | 2,705,089,917 |
End of period | $2,390,989,904 | $2,491,094,686 |
Financial Highlights
Class A Shares | |||||
For a share outstanding during the year ended June 30 | 2024 | 2023 | 2022 | 2021 | 2020 |
Net Asset Value, Beginning of Period | $22.89 | $21.24 | $24.95 | $17.59 | $21.57 |
Income/(Loss) from Investment Operations: | |||||
Net investment income/(loss)(1) | 0.12 | 0.16 | 0.04 | 0.13 | 0.15 |
Net realized and unrealized gain/(loss) | 2.65 | 2.44 | (3.32) | 7.40 | (4.00) |
Total from Investment Operations | 2.77 | 2.60 | (3.28) | 7.53 | (3.85) |
Less Dividends and Distributions: | |||||
Dividends (from net investment income) | (0.10) | — | (0.17) | (0.17) | (0.13) |
Distributions (from capital gains) | (1.04) | (0.95) | (0.26) | — | — |
Total Dividends and Distributions | (1.14) | (0.95) | (0.43) | (0.17) | (0.13) |
Net Asset Value, End of Period | $24.52 | $22.89 | $21.24 | $24.95 | $17.59 |
Total Return* | 12.57% | 12.39% | (13.44)% | 42.99% | (17.98)% |
Net Assets, End of Period (in thousands) | $25,690 | $27,930 | $29,651 | $69,385 | $64,025 |
Ratios to Average Net Assets**: | |||||
Ratio of Gross Expenses | 1.36% | 1.11% | 1.77% | 1.76% | 1.86% |
Ratio of Net Expenses (After Waivers and Expense Offsets) | 1.22% | 0.91% | 1.05% | 1.11% | 1.39% |
Ratio of Net Investment Income/(Loss) | 0.50% | 0.73% | 0.18% | 0.59% | 0.77% |
Portfolio Turnover Rate | 36% | 44% | 44% | 53% | 59% |
* | Total return includes adjustments in accordance with generally accepted accounting principles required at the year or period end and are not annualized for periods of less than one full year. Returns shown exclude any applicable sales charges. |
** | Annualized for periods of less than one full year. |
(1) | Per share amounts are calculated based on average shares outstanding during the year or period. |
Financial Highlights
Class C Shares | |||||
For a share outstanding during the year ended June 30 | 2024 | 2023 | 2022 | 2021 | 2020 |
Net Asset Value, Beginning of Period | $21.01 | $19.71 | $23.27 | $16.41 | $20.12 |
Income/(Loss) from Investment Operations: | |||||
Net investment income/(loss)(1) | (0.01) | — (2) | (0.10) | (0.01) | 0.06 |
Net realized and unrealized gain/(loss) | 2.43 | 2.25 | (3.10) | 6.91 | (3.77) |
Total from Investment Operations | 2.42 | 2.25 | (3.20) | 6.90 | (3.71) |
Less Dividends and Distributions: | |||||
Dividends (from net investment income) | — | — | (0.10) | (0.04) | — |
Distributions (from capital gains) | (1.04) | (0.95) | (0.26) | — | — |
Total Dividends and Distributions | (1.04) | (0.95) | (0.36) | (0.04) | — |
Net Asset Value, End of Period | $22.39 | $21.01 | $19.71 | $23.27 | $16.41 |
Total Return* | 11.96% | 11.56% | (14.02)% | 42.07% | (18.44)% |
Net Assets, End of Period (in thousands) | $15,075 | $17,032 | $17,440 | $22,889 | $20,967 |
Ratios to Average Net Assets**: | |||||
Ratio of Gross Expenses | 1.80% | 1.65% | 1.69% | 1.77% | 1.92% |
Ratio of Net Expenses (After Waivers and Expense Offsets) | 1.80% | 1.65% | 1.69% | 1.77% | 1.92% |
Ratio of Net Investment Income/(Loss) | (0.06)% | (0.01)% | (0.45)% | (0.06)% | 0.30% |
Portfolio Turnover Rate | 36% | 44% | 44% | 53% | 59% |
* | Total return includes adjustments in accordance with generally accepted accounting principles required at the year or period end and are not annualized for periods of less than one full year. Returns shown exclude any applicable sales charges. |
** | Annualized for periods of less than one full year. |
(1) | Per share amounts are calculated based on average shares outstanding during the year or period. |
(2) | Less than $0.005 on a per share basis. |
Financial Highlights
Class D Shares | |||||
For a share outstanding during the year ended June 30 | 2024 | 2023 | 2022 | 2021 | 2020 |
Net Asset Value, Beginning of Period | $22.61 | $21.08 | $24.75 | $17.44 | $21.38 |
Income/(Loss) from Investment Operations: | |||||
Net investment income/(loss)(1) | 0.19 | 0.21 | 0.12 | 0.18 | 0.24 |
Net realized and unrealized gain/(loss) | 2.62 | 2.41 | (3.32) | 7.35 | (3.96) |
Total from Investment Operations | 2.81 | 2.62 | (3.20) | 7.53 | (3.72) |
Less Dividends and Distributions: | |||||
Dividends (from net investment income) | (0.21) | (0.14) | (0.21) | (0.22) | (0.22) |
Distributions (from capital gains) | (1.04) | (0.95) | (0.26) | — | — |
Total Dividends and Distributions | (1.25) | (1.09) | (0.47) | (0.22) | (0.22) |
Net Asset Value, End of Period | $24.17 | $22.61 | $21.08 | $24.75 | $17.44 |
Total Return* | 12.96% | 12.63% | (13.24)% | 43.43% | (17.65)% |
Net Assets, End of Period (in thousands) | $94,218 | $89,434 | $86,052 | $107,471 | $86,650 |
Ratios to Average Net Assets**: | |||||
Ratio of Gross Expenses | 0.90% | 0.72% | 0.75% | 0.84% | 1.01% |
Ratio of Net Expenses (After Waivers and Expense Offsets) | 0.90% | 0.72% | 0.75% | 0.84% | 1.01% |
Ratio of Net Investment Income/(Loss) | 0.83% | 0.92% | 0.49% | 0.84% | 1.20% |
Portfolio Turnover Rate | 36% | 44% | 44% | 53% | 59% |
* | Total return includes adjustments in accordance with generally accepted accounting principles required at the year or period end and are not annualized for periods of less than one full year. |
** | Annualized for periods of less than one full year. |
(1) | Per share amounts are calculated based on average shares outstanding during the year or period. |
Financial Highlights
Class I Shares | |||||
For a share outstanding during the year ended June 30 | 2024 | 2023 | 2022 | 2021 | 2020 |
Net Asset Value, Beginning of Period | $22.73 | $21.18 | $24.86 | $17.53 | $21.50 |
Income/(Loss) from Investment Operations: | |||||
Net investment income/(loss)(1) | 0.20 | 0.21 | 0.12 | 0.19 | 0.24 |
Net realized and unrealized gain/(loss) | 2.63 | 2.43 | (3.33) | 7.37 | (3.97) |
Total from Investment Operations | 2.83 | 2.64 | (3.21) | 7.56 | (3.73) |
Less Dividends and Distributions: | |||||
Dividends (from net investment income) | (0.21) | (0.14) | (0.21) | (0.23) | (0.24) |
Distributions (from capital gains) | (1.04) | (0.95) | (0.26) | — | — |
Total Dividends and Distributions | (1.25) | (1.09) | (0.47) | (0.23) | (0.24) |
Net Asset Value, End of Period | $24.31 | $22.73 | $21.18 | $24.86 | $17.53 |
Total Return* | 12.96% | 12.65% | (13.21)% | 43.36% | (17.62)% |
Net Assets, End of Period (in thousands) | $1,343,912 | $1,372,677 | $1,436,933 | $2,121,333 | $1,584,586 |
Ratios to Average Net Assets**: | |||||
Ratio of Gross Expenses | 0.90% | 0.73% | 0.74% | 0.81% | 1.01% |
Ratio of Net Expenses (After Waivers and Expense Offsets) | 0.89% | 0.72% | 0.74% | 0.81% | 1.01% |
Ratio of Net Investment Income/(Loss) | 0.84% | 0.92% | 0.50% | 0.87% | 1.19% |
Portfolio Turnover Rate | 36% | 44% | 44% | 53% | 59% |
* | Total return includes adjustments in accordance with generally accepted accounting principles required at the year or period end and are not annualized for periods of less than one full year. |
** | Annualized for periods of less than one full year. |
(1) | Per share amounts are calculated based on average shares outstanding during the year or period. |
Financial Highlights
Class L Shares | |||||
For a share outstanding during the year ended June 30 | 2024 | 2023 | 2022 | 2021 | 2020 |
Net Asset Value, Beginning of Period | $23.49 | $21.86 | $25.62 | $18.05 | $22.13 |
Income/(Loss) from Investment Operations: | |||||
Net investment income/(loss)(1) | 0.23 | 0.25 | 0.16 | 0.22 | 0.28 |
Net realized and unrealized gain/(loss) | 2.72 | 2.51 | (3.43) | 7.60 | (4.10) |
Total from Investment Operations | 2.95 | 2.76 | (3.27) | 7.82 | (3.82) |
Less Dividends and Distributions: | |||||
Dividends (from net investment income) | (0.26) | (0.18) | (0.23) | (0.25) | (0.26) |
Distributions (from capital gains) | (1.04) | (0.95) | (0.26) | — | — |
Total Dividends and Distributions | (1.30) | (1.13) | (0.49) | (0.25) | (0.26) |
Net Asset Value, End of Period | $25.14 | $23.49 | $21.86 | $25.62 | $18.05 |
Total Return* | 13.10% | 12.80% | (13.07)% | 43.60% | (17.53)% |
Net Assets, End of Period (in thousands) | $85,472 | $81,633 | $90,492 | $120,351 | $97,950 |
Ratios to Average Net Assets**: | |||||
Ratio of Gross Expenses | 0.94% | 0.77% | 0.81% | 0.88% | 1.06% |
Ratio of Net Expenses (After Waivers and Expense Offsets) | 0.75% | 0.58% | 0.62% | 0.69% | 0.87% |
Ratio of Net Investment Income/(Loss) | 0.97% | 1.06% | 0.63% | 1.00% | 1.36% |
Portfolio Turnover Rate | 36% | 44% | 44% | 53% | 59% |
* | Total return includes adjustments in accordance with generally accepted accounting principles required at the year or period end and are not annualized for periods of less than one full year. |
** | Annualized for periods of less than one full year. |
(1) | Per share amounts are calculated based on average shares outstanding during the year or period. |
Financial Highlights
Class N Shares | |||||
For a share outstanding during the year ended June 30 | 2024 | 2023 | 2022 | 2021 | 2020 |
Net Asset Value, Beginning of Period | $22.70 | $21.16 | $24.82 | $17.50 | $21.46 |
Income/(Loss) from Investment Operations: | |||||
Net investment income/(loss)(1) | 0.23 | 0.24 | 0.16 | 0.22 | 0.26 |
Net realized and unrealized gain/(loss) | 2.62 | 2.43 | (3.33) | 7.36 | (3.95) |
Total from Investment Operations | 2.85 | 2.67 | (3.17) | 7.58 | (3.69) |
Less Dividends and Distributions: | |||||
Dividends (from net investment income) | (0.26) | (0.18) | (0.23) | (0.26) | (0.27) |
Distributions (from capital gains) | (1.04) | (0.95) | (0.26) | — | — |
Total Dividends and Distributions | (1.30) | (1.13) | (0.49) | (0.26) | (0.27) |
Net Asset Value, End of Period | $24.25 | $22.70 | $21.16 | $24.82 | $17.50 |
Total Return* | 13.12% | 12.81% | (13.09)% | 43.57% | (17.48)% |
Net Assets, End of Period (in thousands) | $468,911 | $525,231 | $586,927 | $922,073 | $676,894 |
Ratios to Average Net Assets**: | |||||
Ratio of Gross Expenses | 0.73% | 0.57% | 0.60% | 0.67% | 0.86% |
Ratio of Net Expenses (After Waivers and Expense Offsets) | 0.73% | 0.57% | 0.60% | 0.67% | 0.86% |
Ratio of Net Investment Income/(Loss) | 1.00% | 1.07% | 0.65% | 1.01% | 1.31% |
Portfolio Turnover Rate | 36% | 44% | 44% | 53% | 59% |
* | Total return includes adjustments in accordance with generally accepted accounting principles required at the year or period end and are not annualized for periods of less than one full year. |
** | Annualized for periods of less than one full year. |
(1) | Per share amounts are calculated based on average shares outstanding during the year or period. |
Financial Highlights
Class R Shares | |||||
For a share outstanding during the year ended June 30 | 2024 | 2023 | 2022 | 2021 | 2020 |
Net Asset Value, Beginning of Period | $21.94 | $20.47 | $24.12 | $17.03 | $20.84 |
Income/(Loss) from Investment Operations: | |||||
Net investment income/(loss)(1) | 0.05 | 0.07 | (0.03) | 0.05 | 0.11 |
Net realized and unrealized gain/(loss) | 2.55 | 2.35 | (3.22) | 7.16 | (3.87) |
Total from Investment Operations | 2.60 | 2.42 | (3.25) | 7.21 | (3.76) |
Less Dividends and Distributions: | |||||
Dividends (from net investment income) | — | — | (0.14) | (0.12) | (0.05) |
Distributions (from capital gains) | (1.04) | (0.95) | (0.26) | — | — |
Total Dividends and Distributions | (1.04) | (0.95) | (0.40) | (0.12) | (0.05) |
Net Asset Value, End of Period | $23.50 | $21.94 | $20.47 | $24.12 | $17.03 |
Total Return* | 12.28% | 11.97% | (13.73)% | 42.49% | (18.11)% |
Net Assets, End of Period (in thousands) | $42,209 | $42,027 | $44,592 | $48,908 | $33,724 |
Ratios to Average Net Assets**: | |||||
Ratio of Gross Expenses | 1.49% | 1.33% | 1.36% | 1.42% | 1.61% |
Ratio of Net Expenses (After Waivers and Expense Offsets) | 1.49% | 1.33% | 1.36% | 1.42% | 1.61% |
Ratio of Net Investment Income/(Loss) | 0.24% | 0.32% | (0.11)% | 0.25% | 0.57% |
Portfolio Turnover Rate | 36% | 44% | 44% | 53% | 59% |
* | Total return includes adjustments in accordance with generally accepted accounting principles required at the year or period end and are not annualized for periods of less than one full year. |
** | Annualized for periods of less than one full year. |
(1) | Per share amounts are calculated based on average shares outstanding during the year or period. |
Financial Highlights
Class S Shares | |||||
For a share outstanding during the year ended June 30 | 2024 | 2023 | 2022 | 2021 | 2020 |
Net Asset Value, Beginning of Period | $22.45 | $20.91 | $24.57 | $17.32 | $21.23 |
Income/(Loss) from Investment Operations: | |||||
Net investment income/(loss)(1) | 0.11 | 0.12 | 0.03 | 0.11 | 0.17 |
Net realized and unrealized gain/(loss) | 2.61 | 2.40 | (3.28) | 7.29 | (3.95) |
Total from Investment Operations | 2.72 | 2.52 | (3.25) | 7.40 | (3.78) |
Less Dividends and Distributions: | |||||
Dividends (from net investment income) | (0.10) | (0.03) | (0.15) | (0.15) | (0.13) |
Distributions (from capital gains) | (1.04) | (0.95) | (0.26) | — | — |
Total Dividends and Distributions | (1.14) | (0.98) | (0.41) | (0.15) | (0.13) |
Net Asset Value, End of Period | $24.03 | $22.45 | $20.91 | $24.57 | $17.32 |
Total Return* | 12.57% | 12.22% | (13.49)% | 42.91% | (17.96)% |
Net Assets, End of Period (in thousands) | $26,322 | $27,150 | $26,996 | $42,715 | $43,538 |
Ratios to Average Net Assets**: | |||||
Ratio of Gross Expenses | 1.25% | 1.08% | 1.11% | 1.18% | 1.36% |
Ratio of Net Expenses (After Waivers and Expense Offsets) | 1.25% | 1.08% | 1.11% | 1.18% | 1.36% |
Ratio of Net Investment Income/(Loss) | 0.49% | 0.56% | 0.14% | 0.55% | 0.87% |
Portfolio Turnover Rate | 36% | 44% | 44% | 53% | 59% |
* | Total return includes adjustments in accordance with generally accepted accounting principles required at the year or period end and are not annualized for periods of less than one full year. |
** | Annualized for periods of less than one full year. |
(1) | Per share amounts are calculated based on average shares outstanding during the year or period. |
Financial Highlights
Class T Shares | |||||
For a share outstanding during the year ended June 30 | 2024 | 2023 | 2022 | 2021 | 2020 |
Net Asset Value, Beginning of Period | $22.70 | $21.14 | $24.82 | $17.49 | $21.44 |
Income/(Loss) from Investment Operations: | |||||
Net investment income/(loss)(1) | 0.17 | 0.19 | 0.10 | 0.17 | 0.22 |
Net realized and unrealized gain/(loss) | 2.64 | 2.42 | (3.33) | 7.36 | (3.98) |
Total from Investment Operations | 2.81 | 2.61 | (3.23) | 7.53 | (3.76) |
Less Dividends and Distributions: | |||||
Dividends (from net investment income) | (0.17) | (0.10) | (0.19) | (0.20) | (0.19) |
Distributions (from capital gains) | (1.04) | (0.95) | (0.26) | — | — |
Total Dividends and Distributions | (1.21) | (1.05) | (0.45) | (0.20) | (0.19) |
Net Asset Value, End of Period | $24.30 | $22.70 | $21.14 | $24.82 | $17.49 |
Total Return* | 12.87% | 12.51% | (13.29)% | 43.30% | (17.74)% |
Net Assets, End of Period (in thousands) | $289,181 | $307,982 | $386,007 | $574,472 | $516,634 |
Ratios to Average Net Assets**: | |||||
Ratio of Gross Expenses | 0.98% | 0.82% | 0.85% | 0.92% | 1.10% |
Ratio of Net Expenses (After Waivers and Expense Offsets) | 0.98% | 0.81% | 0.85% | 0.92% | 1.10% |
Ratio of Net Investment Income/(Loss) | 0.75% | 0.82% | 0.40% | 0.78% | 1.11% |
Portfolio Turnover Rate | 36% | 44% | 44% | 53% | 59% |
* | Total return includes adjustments in accordance with generally accepted accounting principles required at the year or period end and are not annualized for periods of less than one full year. |
** | Annualized for periods of less than one full year. |
(1) | Per share amounts are calculated based on average shares outstanding during the year or period. |
Notes to Financial Statements
Average Daily Net Assets of Class D Shares of the Janus Henderson funds | Administrative Services Fee |
Under $40 billion | 0.12% |
$40 billion — $49.9 billion | 0.10% |
Over $49.9 billion | 0.08% |
Notes to Financial Statements
Undistributed Ordinary Income | Undistributed Long-Term Gains | Accumulated Capital Losses | Loss Deferrals | Other Book to Tax Differences | Net Tax Appreciation/ (Depreciation) |
$18,426,794 | $131,649,830 | $- | $- | $(58,187) | $593,695,978 |
Federal Tax Cost | Unrealized Appreciation | Unrealized (Depreciation) | Net Tax Appreciation/ (Depreciation) |
$1,800,603,686 | $653,739,214 | $(60,043,236) | $593,695,978 |
For the year ended June 30, 2024 | |||
Distributions | |||
From Ordinary Income | From Long-Term Capital Gains | Tax Return of Capital | Net Investment Loss |
$21,166,317 | $106,027,008 | $- | $- |
For the year ended June 30, 2023 | |||
Distributions | |||
From Ordinary Income | From Long-Term Capital Gains | Tax Return of Capital | Net Investment Loss |
$15,663,347 | $107,722,896 | $- | $- |
Notes to Financial Statements
Year ended June 30, 2024 | Year ended June 30, 2023 | |||
Shares | Amount | Shares | Amount | |
Class A Shares: | ||||
Shares sold | 187,820 | $4,428,435 | 214,756 | $4,838,998 |
Reinvested dividends and distributions | 42,363 | 951,059 | 42,433 | 935,219 |
Shares repurchased | (402,818) | (9,318,578) | (433,166) | (9,811,480) |
Net Increase/(Decrease) | (172,635) | $(3,939,084) | (175,977) | $(4,037,263) |
Class C Shares: | ||||
Shares sold | 17,026 | $363,884 | 20,591 | $438,387 |
Reinvested dividends and distributions | 37,812 | 778,169 | 38,642 | 784,812 |
Shares repurchased | (192,105) | (4,154,818) | (133,580) | (2,766,112) |
Net Increase/(Decrease) | (137,267) | $(3,012,765) | (74,347) | $(1,542,913) |
Class D Shares: | ||||
Shares sold | 180,335 | $4,196,643 | 119,523 | $2,712,862 |
Reinvested dividends and distributions | 211,346 | 4,670,749 | 193,144 | 4,198,951 |
Shares repurchased | (449,520) | (10,396,691) | (439,242) | (9,837,889) |
Net Increase/(Decrease) | (57,839) | $(1,529,299) | (126,575) | $(2,926,076) |
Class I Shares: | ||||
Shares sold | 5,749,310 | $132,601,905 | 10,105,264 | $228,765,913 |
Reinvested dividends and distributions | 3,160,006 | 70,215,331 | 3,061,205 | 66,887,325 |
Shares repurchased | (14,026,137) | (325,281,552) | (20,608,044) | (461,866,873) |
Net Increase/(Decrease) | (5,116,821) | $(122,464,316) | (7,441,575) | $(166,213,635) |
Class L Shares: | ||||
Shares sold | 90,949 | $2,178,367 | 79,015 | $1,847,850 |
Reinvested dividends and distributions | 160,131 | 3,678,219 | 147,934 | 3,338,863 |
Shares repurchased | (327,799) | (7,721,303) | (891,300) | (20,688,888) |
Net Increase/(Decrease) | (76,719) | $(1,864,717) | (664,351) | $(15,502,175) |
Class N Shares: | ||||
Shares sold | 2,471,642 | $57,284,041 | 4,217,956 | $94,866,352 |
Reinvested dividends and distributions | 1,011,621 | 22,407,396 | 1,023,510 | 22,322,753 |
Shares repurchased | (7,289,174) | (168,199,043) | (9,838,568) | (222,319,934) |
Net Increase/(Decrease) | (3,805,911) | $(88,507,606) | (4,597,102) | $(105,130,829) |
Class R Shares: | ||||
Shares sold | 149,500 | $3,322,086 | 203,076 | $4,484,059 |
Reinvested dividends and distributions | 87,407 | 1,884,489 | 87,817 | 1,858,216 |
Shares repurchased | (356,601) | (7,906,646) | (553,367) | (12,361,818) |
Net Increase/(Decrease) | (119,694) | $(2,700,071) | (262,474) | $(6,019,543) |
Class S Shares: | ||||
Shares sold | 246,901 | $5,503,286 | 258,407 | $5,769,175 |
Reinvested dividends and distributions | 63,495 | 1,397,514 | 55,265 | 1,194,831 |
Shares repurchased | (424,498) | (9,862,331) | (395,421) | (8,833,767) |
Net Increase/(Decrease) | (114,102) | $(2,961,531) | (81,749) | $(1,869,761) |
Class T Shares: | ||||
Shares sold | 622,099 | $14,579,801 | 671,656 | $15,168,690 |
Reinvested dividends and distributions | 659,759 | 14,666,442 | 698,074 | 15,245,927 |
Shares repurchased | (2,949,557) | (68,224,862) | (6,065,045) | (137,490,874) |
Net Increase/(Decrease) | (1,667,699) | $(38,978,619) | (4,695,315) | $(107,076,257) |
Notes to Financial Statements
Purchases of Securities | Proceeds from Sales of Securities | Purchases of Long- Term U.S. Government Obligations | Proceeds from Sales of Long-Term U.S. Government Obligations |
$872,203,064 | $1,230,205,473 | $- | $- |
Report of Independent Registered Public Accounting Firm
August 22, 2024
Designation Requirements (unaudited)
Section 163(j) Interest Dividend | 5% |
Capital Gain Distributions | $119,953,868 |
Dividends Received Deduction Percentage | 100% |
Qualified Dividend Income Percentage | 100% |
Additional Information (unaudited)
June 30, 2024
Schedule of Investments
June 30, 2024
Shares or Principal Amounts | Value | ||
Common Stocks – 98.9% | |||
Aerospace & Defense – 1.8% | |||
BWX Technologies Inc | 17,689 | $1,680,455 | |
Banks – 13.4% | |||
Columbia Banking System Inc | 81,699 | 1,624,993 | |
Eastern Bankshares Inc | 177,100 | 2,475,858 | |
FB Financial Corp | 57,899 | 2,259,798 | |
Fulton Financial Corp | 125,815 | 2,136,339 | |
OFG Bancorp | 59,714 | 2,236,289 | |
Wintrust Financial Corp | 19,767 | 1,948,236 | |
12,681,513 | |||
Building Products – 5.2% | |||
Fortune Brands Home & Security Inc | 28,106 | 1,825,203 | |
Gibraltar Industries Inc* | 31,505 | 2,159,668 | |
Janus International Group Inc* | 73,506 | 928,381 | |
4,913,252 | |||
Capital Markets – 4.3% | |||
Lazard Inc | 57,831 | 2,207,988 | |
WisdomTree Investments Inc | 186,473 | 1,847,947 | |
4,055,935 | |||
Chemicals – 3.3% | |||
Ashland Global Holdings Inc | 17,734 | 1,675,686 | |
Innospec Inc | 11,440 | 1,413,869 | |
3,089,555 | |||
Containers & Packaging – 3.8% | |||
Ball Corp | 28,035 | 1,682,661 | |
Graphic Packaging Holding Co | 72,401 | 1,897,630 | |
3,580,291 | |||
Electric Utilities – 2.5% | |||
Alliant Energy Corp | 47,206 | 2,402,785 | |
Electronic Equipment, Instruments & Components – 8.9% | |||
Arrow Electronics Inc* | 12,106 | 1,461,920 | |
Fabrinet* | 6,648 | 1,627,364 | |
Insight Enterprises Inc* | 5,594 | 1,109,626 | |
Keysight Technologies Inc* | 13,204 | 1,805,647 | |
Vontier Corp | 62,799 | 2,398,922 | |
8,403,479 | |||
Energy Equipment & Services – 2.0% | |||
Oceaneering International Inc* | 81,474 | 1,927,675 | |
Food & Staples Retailing – 2.8% | |||
Casey's General Stores Inc | 6,892 | 2,629,712 | |
Health Care Equipment & Supplies – 5.0% | |||
Globus Medical Inc* | 40,909 | 2,801,857 | |
Teleflex Inc | 9,359 | 1,968,479 | |
4,770,336 | |||
Health Care Providers & Services – 1.7% | |||
Cardinal Health Inc | 16,907 | 1,662,296 | |
Household Durables – 1.5% | |||
Toll Brothers Inc | 12,283 | 1,414,756 | |
Insurance – 5.1% | |||
Axis Capital Holdings Ltd | 39,825 | 2,813,635 | |
Hartford Financial Services Group Inc | 20,274 | 2,038,348 | |
4,851,983 | |||
Life Sciences Tools & Services – 1.2% | |||
Avantor Inc* | 52,485 | 1,112,682 | |
Machinery – 5.5% | |||
Helios Technologies Inc | 45,727 | 2,183,464 | |
Hillenbrand Inc | 42,079 | 1,684,002 | |
Lincoln Electric Holdings Inc | 7,305 | 1,378,015 | |
5,245,481 |
Schedule of Investments
June 30, 2024
Shares or Principal Amounts | Value | ||
Common Stocks – (continued) | |||
Marine – 2.3% | |||
Kirby Corp* | 18,634 | $2,231,049 | |
Metals & Mining – 2.0% | |||
Commercial Metals Co | 33,738 | 1,855,253 | |
Oil, Gas & Consumable Fuels – 4.2% | |||
HF Sinclair Corp | 34,694 | 1,850,578 | |
Magnolia Oil & Gas Corp | 82,399 | 2,087,991 | |
3,938,569 | |||
Real Estate Management & Development – 2.2% | |||
Cushman & Wakefield PLC* | 204,378 | 2,125,531 | |
Retail Real Estate Investment Trusts (REITs) – 2.6% | |||
Agree Realty Corp | 39,375 | 2,438,887 | |
Semiconductor & Semiconductor Equipment – 4.0% | |||
Microchip Technology Inc | 17,383 | 1,590,544 | |
Tower Semiconductor Ltd* | 56,609 | 2,225,300 | |
3,815,844 | |||
Specialized Real Estate Investment Trusts (REITs) – 4.6% | |||
Lamar Advertising Co | 22,075 | 2,638,625 | |
PotlatchDeltic Corp | 43,108 | 1,698,024 | |
4,336,649 | |||
Specialty Retail – 4.5% | |||
Bath & Body Works Inc | 26,101 | 1,019,244 | |
Boot Barn Holdings Inc* | 11,529 | 1,486,434 | |
Burlington Stores Inc* | 7,325 | 1,758,000 | |
4,263,678 | |||
Textiles, Apparel & Luxury Goods – 1.4% | |||
Steven Madden Ltd | 31,699 | 1,340,868 | |
Trading Companies & Distributors – 3.1% | |||
GATX Corp | 14,123 | 1,869,320 | |
MSC Industrial Direct Co Inc | 13,037 | 1,033,965 | |
2,903,285 | |||
Total Common Stocks (cost $73,401,627) | 93,671,799 | ||
Repurchase Agreements – 1.2% | |||
ING Financial Markets LLC, Joint repurchase agreement, 5.3000%, dated 6/28/24, maturing 7/1/24 to be repurchased at $1,100,486 collateralized by $1,211,336 in U.S. Treasuries 0.5000% - 4.1250%, 2/15/25 - 11/15/50 with a value of $1,122,496 (cost $1,100,000) | $1,100,000 | 1,100,000 | |
Total Investments (total cost $74,501,627) – 100.1% | 94,771,799 | ||
Liabilities, net of Cash, Receivables and Other Assets – (0.1)% | (59,296) | ||
Net Assets – 100% | $94,712,503 |
Summary of Investments by Country - (Long Positions) (unaudited) | ||
Country | Value | % of Investment Securities |
United States | $92,546,499 | 97.7 % |
Israel | 2,225,300 | 2.3 |
Total | $94,771,799 | 100.0 % |
Schedule of Investments
June 30, 2024
Offsetting of Financial Assets and Derivative Assets | ||||
Counterparty | Gross Amounts of Recognized Assets | Offsetting Asset or Liability(a) | Collateral Pledged(b) | Net Amount |
ING Financial Markets LLC | $1,100,000 | $— | $(1,100,000) | $— |
(a) | Represents the amount of assets or liabilities that could be offset with the same counterparty under master netting or similar agreements that management elects not to offset on the Statement of Assets and Liabilities. |
(b) | Collateral pledged is limited to the net outstanding amount due to/from an individual counterparty. The actual collateral amounts pledged may exceed these amounts and may fluctuate in value. |
Notes to Schedule of Investments and Other Information
LLC | Limited Liability Company |
PLC | Public Limited Company |
* | Non-income producing security. |
Valuation Inputs Summary | |||
Level 1 - Quoted Prices | Level 2 - Other Significant Observable Inputs | Level 3 - Significant Unobservable Inputs | |
Assets | |||
Investments In Securities: | |||
Common Stocks | $93,671,799 | $- | $- |
Repurchase Agreements | - | 1,100,000 | - |
Total Assets | $93,671,799 | $1,100,000 | $- |
Statement of Assets and Liabilities
June 30, 2024
Assets: | |
Investments, at value (cost $73,401,627) | $93,671,799 |
Repurchase agreements, at value (cost $1,100,000) | 1,100,000 |
Cash | 42,634 |
Trustees' deferred compensation | 2,610 |
Receivables: | |
Fund shares sold | 192,893 |
Dividends | 74,284 |
Interest | 486 |
Other assets | 312 |
Total Assets | 95,085,018 |
Liabilities: | |
Payables: | |
Fund shares repurchased | 199,504 |
Advisory fees | 68,148 |
Professional fees | 51,762 |
Transfer agent fees and expenses | 9,798 |
Trustees' deferred compensation fees | 2,610 |
12b-1 Distribution and shareholder servicing fees | 929 |
Trustees' fees and expenses | 589 |
Custodian fees | 345 |
Affiliated fund administration fees payable | 223 |
Accrued expenses and other payables | 38,607 |
Total Liabilities | 372,515 |
Commitments and contingent liabilities (Note 3) | |
Net Assets | $94,712,503 |
Net Assets Consist of: | |
Capital (par value and paid-in surplus) | $71,860,112 |
Total distributable earnings (loss) | 22,852,391 |
Total Net Assets | $94,712,503 |
Net Assets - Class A Shares | $2,877,145 |
Shares Outstanding, $0.01 Par Value (unlimited shares authorized) | 181,066 |
Net Asset Value Per Share(1) | $15.89 |
Maximum Offering Price Per Share(2) | $16.86 |
Net Assets - Class C Shares | $354,059 |
Shares Outstanding, $0.01 Par Value (unlimited shares authorized) | 23,388 |
Net Asset Value Per Share(1) | $15.14 |
Net Assets - Class D Shares | $45,141,172 |
Shares Outstanding, $0.01 Par Value (unlimited shares authorized) | 2,819,873 |
Net Asset Value Per Share | $16.01 |
Net Assets - Class I Shares | $7,545,459 |
Shares Outstanding, $0.01 Par Value (unlimited shares authorized) | 466,303 |
Net Asset Value Per Share | $16.18 |
Net Assets - Class N Shares | $31,468,204 |
Shares Outstanding, $0.01 Par Value (unlimited shares authorized) | 1,964,958 |
Net Asset Value Per Share | $16.01 |
Net Assets - Class S Shares | $211,304 |
Shares Outstanding, $0.01 Par Value (unlimited shares authorized) | 13,411 |
Net Asset Value Per Share | $15.76 |
Net Assets - Class T Shares | $7,115,160 |
Shares Outstanding, $0.01 Par Value (unlimited shares authorized) | 444,266 |
Net Asset Value Per Share | $16.02 |
(1) | Redemption price per share may be reduced for any applicable contingent deferred sales charge. |
(2) | Maximum offering price is computed at 100/94.25 of net asset value. |
Statement of Operations
For the year ended June 30, 2024
Investment Income: | |
Dividends | $1,638,274 |
Interest | 139,468 |
Other income | 343 |
Foreign tax withheld | (6,495) |
Total Investment Income | 1,771,590 |
Expenses: | |
Advisory fees | 666,656 |
12b-1 Distribution and shareholder servicing fees: | |
Class A Shares | 6,477 |
Class C Shares | 3,261 |
Class S Shares | 340 |
Transfer agent administrative fees and expenses: | |
Class D Shares | 46,504 |
Class S Shares | 568 |
Class T Shares | 15,859 |
Transfer agent networking and omnibus fees: | |
Class A Shares | 3,215 |
Class C Shares | 349 |
Class I Shares | 6,268 |
Other transfer agent fees and expenses: | |
Class A Shares | 162 |
Class C Shares | 29 |
Class D Shares | 10,143 |
Class I Shares | 413 |
Class N Shares | 2,084 |
Class S Shares | 10 |
Class T Shares | 157 |
Registration fees | 110,767 |
Non-affiliated fund administration fees | 64,451 |
Professional fees | 57,625 |
Shareholder reports expense | 18,081 |
Affiliated fund administration fees | 2,582 |
Custodian fees | 2,385 |
Trustees' fees and expenses | 2,160 |
Other expenses | 15,861 |
Total Expenses | 1,036,407 |
Less: Excess Expense Reimbursement and Waivers | (145,665) |
Net Expenses | 890,742 |
Net Investment Income/(Loss) | 880,848 |
Net Realized Gain/(Loss) on Investments: | |
Investments | 9,801,564 |
Total Net Realized Gain/(Loss) on Investments | 9,801,564 |
Change in Unrealized Net Appreciation/Depreciation: | |
Investments and Trustees' deferred compensation | 7,678,346 |
Total Change in Unrealized Net Appreciation/Depreciation | 7,678,346 |
Net Increase/(Decrease) in Net Assets Resulting from Operations | $18,360,758 |
Statements of Changes in Net Assets
Year ended June 30, 2024 | Year ended June 30, 2023 | |
Operations: | ||
Net investment income/(loss) | $880,848 | $1,047,926 |
Net realized gain/(loss) on investments | 9,801,564 | (4,410,567) |
Change in unrealized net appreciation/depreciation | 7,678,346 | 19,496,522 |
Net Increase/(Decrease) in Net Assets Resulting from Operations | 18,360,758 | 16,133,881 |
Dividends and Distributions to Shareholders: | ||
Class A Shares | (17,876) | (6,350) |
Class C Shares | (268) | — |
Class D Shares | (360,330) | (231,444) |
Class I Shares | (63,667) | (37,979) |
Class N Shares | (471,693) | (420,035) |
Class S Shares | (1,747) | — |
Class T Shares | (48,513) | (24,323) |
Net Decrease from Dividends and Distributions to Shareholders | (964,094) | (720,131) |
Capital Share Transactions: | ||
Class A Shares | 3,585 | (266,933) |
Class C Shares | (59,675) | (144,748) |
Class D Shares | (2,620,927) | (5,423,913) |
Class I Shares | (704,308) | (2,305,216) |
Class N Shares | (22,894,802) | (17,553,577) |
Class S Shares | (58,413) | (809,610) |
Class T Shares | (145,254) | (2,245,624) |
Net Increase/(Decrease) from Capital Share Transactions | (26,479,794) | (28,749,621) |
Net Increase/(Decrease) in Net Assets | (9,083,130) | (13,335,871) |
Net Assets: | ||
Beginning of period | 103,795,633 | 117,131,504 |
End of period | $94,712,503 | $103,795,633 |
Financial Highlights
Class A Shares | |||||
For a share outstanding during the year ended June 30 | 2024 | 2023 | 2022 | 2021 | 2020 |
Net Asset Value, Beginning of Period | $13.45 | $11.72 | $13.98 | $10.17 | $13.17 |
Income/(Loss) from Investment Operations: | |||||
Net investment income/(loss)(1) | 0.08 | 0.08 | 0.06 | 0.10 | 0.10 |
Net realized and unrealized gain/(loss) | 2.46 | 1.69 | (1.93) | 3.78 | (1.71) |
Total from Investment Operations | 2.54 | 1.77 | (1.87) | 3.88 | (1.61) |
Less Dividends and Distributions: | |||||
Dividends (from net investment income) | (0.10) | (0.04) | (0.05) | (0.07) | (0.11) |
Distributions (from capital gains) | — | — | (0.34) | — | (1.28) |
Total Dividends and Distributions | (0.10) | (0.04) | (0.39) | (0.07) | (1.39) |
Net Asset Value, End of Period | $15.89 | $13.45 | $11.72 | $13.98 | $10.17 |
Total Return* | 18.99% | 15.09% | (13.78)% | 38.27% | (14.37)% |
Net Assets, End of Period (in thousands) | $2,877 | $2,424 | $2,387 | $3,279 | $3,039 |
Ratios to Average Net Assets**: | |||||
Ratio of Gross Expenses | 1.37% | 1.28% | 1.28% | 1.35% | 1.78% |
Ratio of Net Expenses (After Waivers and Expense Offsets) | 1.15% | 1.07% | 1.12% | 1.07% | 1.34% |
Ratio of Net Investment Income/(Loss) | 0.57% | 0.62% | 0.42% | 0.81% | 0.88% |
Portfolio Turnover Rate | 63% | 62% | 80% | 99% | 152% |
* | Total return includes adjustments in accordance with generally accepted accounting principles required at the year or period end and are not annualized for periods of less than one full year. Returns shown exclude any applicable sales charges. |
** | Annualized for periods of less than one full year. |
(1) | Per share amounts are calculated based on average shares outstanding during the year or period. |
Financial Highlights
Class C Shares | |||||
For a share outstanding during the year ended June 30 | 2024 | 2023 | 2022 | 2021 | 2020 |
Net Asset Value, Beginning of Period | $12.81 | $11.22 | $13.45 | $9.80 | $12.74 |
Income/(Loss) from Investment Operations: | |||||
Net investment income/(loss)(1) | (0.01) | (0.02) | (0.04) | 0.02 | 0.01 |
Net realized and unrealized gain/(loss) | 2.35 | 1.61 | (1.85) | 3.63 | (1.66) |
Total from Investment Operations | 2.34 | 1.59 | (1.89) | 3.65 | (1.65) |
Less Dividends and Distributions: | |||||
Dividends (from net investment income) | (0.01) | — | — | — | (0.01) |
Distributions (from capital gains) | — | — | (0.34) | — | (1.28) |
Total Dividends and Distributions | (0.01) | — | (0.34) | — | (1.29) |
Net Asset Value, End of Period | $15.14 | $12.81 | $11.22 | $13.45 | $9.80 |
Total Return* | 18.28% | 14.17% | (14.41)% | 37.24% | (15.04)% |
Net Assets, End of Period (in thousands) | $354 | $354 | $450 | $515 | $353 |
Ratios to Average Net Assets**: | |||||
Ratio of Gross Expenses | 2.74% | 2.72% | 2.51% | 2.70% | 3.23% |
Ratio of Net Expenses (After Waivers and Expense Offsets) | 1.79% | 1.84% | 1.84% | 1.81% | 2.14% |
Ratio of Net Investment Income/(Loss) | (0.07)% | (0.15)% | (0.33)% | 0.14% | 0.12% |
Portfolio Turnover Rate | 63% | 62% | 80% | 99% | 152% |
* | Total return includes adjustments in accordance with generally accepted accounting principles required at the year or period end and are not annualized for periods of less than one full year. Returns shown exclude any applicable sales charges. |
** | Annualized for periods of less than one full year. |
(1) | Per share amounts are calculated based on average shares outstanding during the year or period. |
Financial Highlights
Class D Shares | |||||
For a share outstanding during the year ended June 30 | 2024 | 2023 | 2022 | 2021 | 2020 |
Net Asset Value, Beginning of Period | $13.54 | $11.81 | $14.08 | $10.24 | $13.24 |
Income/(Loss) from Investment Operations: | |||||
Net investment income/(loss)(1) | 0.12 | 0.11 | 0.08 | 0.10 | 0.13 |
Net realized and unrealized gain/(loss) | 2.48 | 1.69 | (1.93) | 3.83 | (1.72) |
Total from Investment Operations | 2.60 | 1.80 | (1.85) | 3.93 | (1.59) |
Less Dividends and Distributions: | |||||
Dividends (from net investment income) | (0.13) | (0.07) | (0.08) | (0.09) | (0.13) |
Distributions (from capital gains) | — | — | (0.34) | — | (1.28) |
Total Dividends and Distributions | (0.13) | (0.07) | (0.42) | (0.09) | (1.41) |
Net Asset Value, End of Period | $16.01 | $13.54 | $11.81 | $14.08 | $10.24 |
Total Return* | 19.34% | 15.28% | (13.54)% | 38.52% | (14.20)% |
Net Assets, End of Period (in thousands) | $45,141 | $40,871 | $40,878 | $66,854 | $21,708 |
Ratios to Average Net Assets**: | |||||
Ratio of Gross Expenses | 1.05% | 0.94% | 0.95% | 1.06% | 1.51% |
Ratio of Net Expenses (After Waivers and Expense Offsets) | 0.91% | 0.83% | 0.87% | 0.89% | 1.17% |
Ratio of Net Investment Income/(Loss) | 0.81% | 0.86% | 0.62% | 0.78% | 1.06% |
Portfolio Turnover Rate | 63% | 62% | 80% | 99% | 152% |
* | Total return includes adjustments in accordance with generally accepted accounting principles required at the year or period end and are not annualized for periods of less than one full year. |
** | Annualized for periods of less than one full year. |
(1) | Per share amounts are calculated based on average shares outstanding during the year or period. |
Financial Highlights
Class I Shares | |||||
For a share outstanding during the year ended June 30 | 2024 | 2023 | 2022 | 2021 | 2020 |
Net Asset Value, Beginning of Period | $13.69 | $11.93 | $14.22 | $10.34 | $13.36 |
Income/(Loss) from Investment Operations: | |||||
Net investment income/(loss)(1) | 0.12 | 0.11 | 0.09 | 0.13 | 0.11 |
Net realized and unrealized gain/(loss) | 2.50 | 1.72 | (1.96) | 3.84 | (1.72) |
Total from Investment Operations | 2.62 | 1.83 | (1.87) | 3.97 | (1.61) |
Less Dividends and Distributions: | |||||
Dividends (from net investment income) | (0.13) | (0.07) | (0.08) | (0.09) | (0.13) |
Distributions (from capital gains) | — | — | (0.34) | — | (1.28) |
Total Dividends and Distributions | (0.13) | (0.07) | (0.42) | (0.09) | (1.41) |
Net Asset Value, End of Period | $16.18 | $13.69 | $11.93 | $14.22 | $10.34 |
Total Return* | 19.32% | 15.40% | (13.56)% | 38.58% | (14.19)% |
Net Assets, End of Period (in thousands) | $7,545 | $7,074 | $8,309 | $14,659 | $9,848 |
Ratios to Average Net Assets**: | |||||
Ratio of Gross Expenses | 1.01% | 0.90% | 0.91% | 1.10% | 1.47% |
Ratio of Net Expenses (After Waivers and Expense Offsets) | 0.86% | 0.79% | 0.82% | 0.89% | 1.13% |
Ratio of Net Investment Income/(Loss) | 0.85% | 0.88% | 0.67% | 1.02% | 0.93% |
Portfolio Turnover Rate | 63% | 62% | 80% | 99% | 152% |
* | Total return includes adjustments in accordance with generally accepted accounting principles required at the year or period end and are not annualized for periods of less than one full year. |
** | Annualized for periods of less than one full year. |
(1) | Per share amounts are calculated based on average shares outstanding during the year or period. |
Financial Highlights
Class N Shares | |||||
For a share outstanding during the year ended June 30 | 2024 | 2023 | 2022 | 2021 | 2020 |
Net Asset Value, Beginning of Period | $13.55 | $11.81 | $14.09 | $10.24 | $13.24 |
Income/(Loss) from Investment Operations: | |||||
Net investment income/(loss)(1) | 0.13 | 0.13 | 0.11 | 0.11 | 0.15 |
Net realized and unrealized gain/(loss) | 2.48 | 1.70 | (1.95) | 3.84 | (1.72) |
Total from Investment Operations | 2.61 | 1.83 | (1.84) | 3.95 | (1.57) |
Less Dividends and Distributions: | |||||
Dividends (from net investment income) | (0.15) | (0.09) | (0.10) | (0.10) | (0.15) |
Distributions (from capital gains) | — | — | (0.34) | — | (1.28) |
Total Dividends and Distributions | (0.15) | (0.09) | (0.44) | (0.10) | (1.43) |
Net Asset Value, End of Period | $16.01 | $13.55 | $11.81 | $14.09 | $10.24 |
Total Return* | 19.42% | 15.54% | (13.48)% | 38.72% | (14.09)% |
Net Assets, End of Period (in thousands) | $31,468 | $46,653 | $56,752 | $70,581 | $1,806 |
Ratios to Average Net Assets**: | |||||
Ratio of Gross Expenses | 0.88% | 0.77% | 0.80% | 0.88% | 1.48% |
Ratio of Net Expenses (After Waivers and Expense Offsets) | 0.77% | 0.69% | 0.74% | 0.76% | 1.03% |
Ratio of Net Investment Income/(Loss) | 0.93% | 1.02% | 0.79% | 0.83% | 1.24% |
Portfolio Turnover Rate | 63% | 62% | 80% | 99% | 152% |
* | Total return includes adjustments in accordance with generally accepted accounting principles required at the year or period end and are not annualized for periods of less than one full year. |
** | Annualized for periods of less than one full year. |
(1) | Per share amounts are calculated based on average shares outstanding during the year or period. |
Financial Highlights
Class S Shares | |||||
For a share outstanding during the year ended June 30 | 2024 | 2023 | 2022 | 2021 | 2020 |
Net Asset Value, Beginning of Period | $13.34 | $11.60 | $13.84 | $10.06 | $13.07 |
Income/(Loss) from Investment Operations: | |||||
Net investment income/(loss)(1) | 0.09 | 0.07 | 0.04 | 0.08 | 0.08 |
Net realized and unrealized gain/(loss) | 2.43 | 1.67 | (1.91) | 3.75 | (1.69) |
Total from Investment Operations | 2.52 | 1.74 | (1.87) | 3.83 | (1.61) |
Less Dividends and Distributions: | |||||
Dividends (from net investment income) | (0.10) | — | (0.03) | (0.05) | (0.12) |
Distributions (from capital gains) | — | — | (0.34) | — | (1.28) |
Total Dividends and Distributions | (0.10) | — | (0.37) | (0.05) | (1.40) |
Net Asset Value, End of Period | $15.76 | $13.34 | $11.60 | $13.84 | $10.06 |
Total Return* | 19.04% | 15.00% | (13.85)% | 38.16% | (14.51)% |
Net Assets, End of Period (in thousands) | $211 | $229 | $939 | $1,136 | $1,004 |
Ratios to Average Net Assets**: | |||||
Ratio of Gross Expenses | 2.58% | 1.84% | 1.54% | 1.71% | 2.16% |
Ratio of Net Expenses (After Waivers and Expense Offsets) | 1.11% | 1.13% | 1.20% | 1.23% | 1.51% |
Ratio of Net Investment Income/(Loss) | 0.62% | 0.51% | 0.31% | 0.68% | 0.71% |
Portfolio Turnover Rate | 63% | 62% | 80% | 99% | 152% |
* | Total return includes adjustments in accordance with generally accepted accounting principles required at the year or period end and are not annualized for periods of less than one full year. |
** | Annualized for periods of less than one full year. |
(1) | Per share amounts are calculated based on average shares outstanding during the year or period. |
Financial Highlights
Class T Shares | |||||
For a share outstanding during the year ended June 30 | 2024 | 2023 | 2022 | 2021 | 2020 |
Net Asset Value, Beginning of Period | $13.55 | $11.81 | $14.07 | $10.21 | $13.22 |
Income/(Loss) from Investment Operations: | |||||
Net investment income/(loss)(1) | 0.10 | 0.10 | 0.06 | 0.06 | 0.14 |
Net realized and unrealized gain/(loss) | 2.48 | 1.69 | (1.93) | 3.86 | (1.76) |
Total from Investment Operations | 2.58 | 1.79 | (1.87) | 3.92 | (1.62) |
Less Dividends and Distributions: | |||||
Dividends (from net investment income) | (0.11) | (0.05) | (0.05) | (0.06) | (0.11) |
Distributions (from capital gains) | — | — | (0.34) | — | (1.28) |
Total Dividends and Distributions | (0.11) | (0.05) | (0.39) | (0.06) | (1.39) |
Net Asset Value, End of Period | $16.02 | $13.55 | $11.81 | $14.07 | $10.21 |
Total Return* | 19.20% | 15.18% | (13.67)% | 38.50% | (14.40)% |
Net Assets, End of Period (in thousands) | $7,115 | $6,190 | $7,416 | $18,663 | $38,649 |
Ratios to Average Net Assets**: | |||||
Ratio of Gross Expenses | 1.17% | 1.06% | 1.07% | 1.18% | 1.55% |
Ratio of Net Expenses (After Waivers and Expense Offsets) | 1.02% | 0.94% | 0.99% | 1.02% | 1.27% |
Ratio of Net Investment Income/(Loss) | 0.70% | 0.74% | 0.46% | 0.49% | 1.08% |
Portfolio Turnover Rate | 63% | 62% | 80% | 99% | 152% |
* | Total return includes adjustments in accordance with generally accepted accounting principles required at the year or period end and are not annualized for periods of less than one full year. |
** | Annualized for periods of less than one full year. |
(1) | Per share amounts are calculated based on average shares outstanding during the year or period. |
Notes to Financial Statements
Average Daily Net Assets of Class D Shares of the Janus Henderson funds | Administrative Services Fee |
Under $40 billion | 0.12% |
$40 billion — $49.9 billion | 0.10% |
Over $49.9 billion | 0.08% |
Notes to Financial Statements
Class | % of Class Owned | % of Fund Owned |
Class A Shares | - % | - % |
Class C Shares | - | - |
Class D Shares | - | - |
Class I Shares | - | - |
Class N Shares | 8 | 3 |
Class S Shares | 49 | - * |
Class T Shares | - | - |
*Less than 0.50% |
Undistributed Ordinary Income | Undistributed Long-Term Gains | Accumulated Capital Losses | Loss Deferrals | Other Book to Tax Differences | Net Tax Appreciation/ (Depreciation) |
$162,884 | $2,709,331 | $- | $- | $(2,610) | $19,982,786 |
Notes to Financial Statements
Federal Tax Cost | Unrealized Appreciation | Unrealized (Depreciation) | Net Tax Appreciation/ (Depreciation) |
$74,789,013 | $21,218,721 | $(1,235,935) | $19,982,786 |
For the year ended June 30, 2024 | |||
Distributions | |||
From Ordinary Income | From Long-Term Capital Gains | Tax Return of Capital | Net Investment Loss |
$964,094 | $- | $- | $- |
For the year ended June 30, 2023 | |||
Distributions | |||
From Ordinary Income | From Long-Term Capital Gains | Tax Return of Capital | Net Investment Loss |
$720,131 | $- | $- | $- |
Notes to Financial Statements
Year ended June 30, 2024 | Year ended June 30, 2023 | |||
Shares | Amount | Shares | Amount | |
Class A Shares: | ||||
Shares sold | 16,859 | $240,911 | 12,537 | $163,797 |
Reinvested dividends and distributions | 1,307 | 17,876 | 505 | 6,350 |
Shares repurchased | (17,377) | (255,202) | (36,384) | (437,080) |
Net Increase/(Decrease) | 789 | $3,585 | (23,342) | $(266,933) |
Class C Shares: | ||||
Shares sold | 2,038 | $27,684 | 3,611 | $43,236 |
Reinvested dividends and distributions | 20 | 268 | - | - |
Shares repurchased | (6,287) | (87,627) | (16,104) | (187,984) |
Net Increase/(Decrease) | (4,229) | $(59,675) | (12,493) | $(144,748) |
Class D Shares: | ||||
Shares sold | 346,180 | $5,071,849 | 508,073 | $6,729,242 |
Reinvested dividends and distributions | 25,232 | 347,189 | 17,788 | 224,835 |
Shares repurchased | (569,146) | (8,039,965) | (970,215) | (12,377,990) |
Net Increase/(Decrease) | (197,734) | $(2,620,927) | (444,354) | $(5,423,913) |
Class I Shares: | ||||
Shares sold | 38,819 | $586,259 | 87,999 | $1,156,764 |
Reinvested dividends and distributions | 4,580 | 63,667 | 2,974 | 37,979 |
Shares repurchased | (93,882) | (1,354,234) | (270,652) | (3,499,959) |
Net Increase/(Decrease) | (50,483) | $(704,308) | (179,679) | $(2,305,216) |
Class N Shares: | ||||
Shares sold | 281,067 | $4,112,470 | 1,273,572 | $16,309,966 |
Reinvested dividends and distributions | 34,280 | 471,693 | 33,231 | 420,035 |
Shares repurchased | (1,792,831) | (27,478,965) | (2,667,885) | (34,283,578) |
Net Increase/(Decrease) | (1,477,484) | $(22,894,802) | (1,361,082) | $(17,553,577) |
Class S Shares: | ||||
Shares sold | 16 | $224 | 11,491 | $143,916 |
Reinvested dividends and distributions | 129 | 1,747 | - | - |
Shares repurchased | (3,902) | (60,384) | (75,338) | (953,526) |
Net Increase/(Decrease) | (3,757) | $(58,413) | (63,847) | $(809,610) |
Class T Shares: | ||||
Shares sold | 53,442 | $770,992 | 204,265 | $2,619,557 |
Reinvested dividends and distributions | 3,523 | 48,513 | 1,923 | 24,323 |
Shares repurchased | (69,493) | (964,759) | (377,553) | (4,889,504) |
Net Increase/(Decrease) | (12,528) | $(145,254) | (171,365) | $(2,245,624) |
Purchases of Securities | Proceeds from Sales of Securities | Purchases of Long- Term U.S. Government Obligations | Proceeds from Sales of Long-Term U.S. Government Obligations |
$63,764,278 | $88,186,580 | $- | $- |
Report of Independent Registered Public Accounting Firm
August 22, 2024
Designation Requirements (unaudited)
Section 163(j) Interest Dividend | 12% |
Capital Gain Distributions | $521,898 |
Dividends Received Deduction Percentage | 100% |
Qualified Dividend Income Percentage | 100% |
Additional Information (unaudited)
Item 12 - Disclosure of Proxy Voting Policies and Procedures for Closed-End Management Investment Companies
Not applicable.
Item 13 - Portfolio Managers of Closed-End Management Investment Companies
Not applicable.
Item 14 - Purchases of Equity Securities by Closed-End Management Investment Company and Affiliated Purchasers
Not applicable.
Item 15 - Submission of Matters to a Vote of Security Holders
There have been no material changes to the procedures by which shareholders may recommend nominees to the Registrant's Board of Trustees.
Item 16 - Controls and Procedures
(a) The Registrant's Principal Executive Officer and Principal Financial Officer have evaluated the Registrant's disclosure controls and procedures (as defined in Rule 30a-3(c) under the Investment Company Act of 1940, as amended) within 90 days of this filing and have concluded that the Registrant's disclosure controls and procedures were effective, as of that date.
(b) There have been no changes in the Registrant's internal control over financial reporting (as defined in Rule 30a-3(d) under the Investment Company Act of 1940, as amended) that occurred during period covered by this report that have materially affected, or are reasonably likely to materially affect, the Registrant's internal control over financial reporting.
Item 17 - Disclosure of Securities Lending Activities for Closed-End Management Investment Companies
(a) Not applicable.
(b) Not applicable.
Item 18. Recovery of Erroneously Awarded Compensation.
(a) Not applicable.
(b) Not applicable.
Item 19 - Exhibits
(a)(1) Not applicable because the Registrant has posted its Code of Ethics (as defined in Item 2(b) of Form N-CSR) on its website pursuant to paragraph (f)(2) of Item 2 of Form N-CSR.
(a)(2) Not applicable.
(a)(3) Separate certifications for the Registrant's Principal Executive Officer and Principal Financial Officer, as required under Rule 30a-2(a) under the Investment Company Act of 1940, as amended, are attached as Ex99CERT.
(b) A certification for the Registrant's Principal Executive Officer and Principal Financial Officer, as required by Rule 30a-2(b) under the Investment Company Act of 1940, as amended, is attached as Ex99.906CERT.