Janus Henderson Adaptive Risk Managed U.S. Equity Fund
Despite early-period volatility, equities generated positive returns over the period as investors gained greater confidence that inflation was being brought under control and that a pronounced recession could be avoided. Interest rates rose as the Federal Reserve (Fed) continued to battle inflation. The U.S. economy remained resilient, especially compared to developed market peers.
The Fund’s strategy seeks to identify a security’s attractiveness based on a ratio of upside to downside risk. These ratios are proprietary measures of expected upside-to-downside volatility and seek to optimize exposure to stocks with high attractiveness but low expected downside volatility.
The Fund is simultaneously designed to evaluate expected growth and changes in risk by monitoring changes in attractiveness over the recent period. In simple terms, this methodology seeks to create a diversified portfolio of lower-risk stocks with greater growth or upside volatility. The targeted result is a differentiated and improved return profile that effectively reduces downside volatility and captures upside/growth.
During the period, the Fund underperformed its primary (broad market equities) benchmark but outperformed its secondary (minimum volatility equities) benchmark. In keeping with its long-term characteristics, over the course of the year the Fund registered volatility considerably less than that of its primary benchmark and slightly less than that of its secondary, minimum volatility benchmark. Similarly, the strategy recorded maximum one-year drawdowns that were less than each of its benchmarks. Over the period, the Fund incrementally lowered its overweight to mid-cap stocks, relative to its primary benchmark, while at the same time reducing its underweight to large caps. From a style perspective, value and growth categories fell roughly in line with the composition of the primary benchmark.
Disagreement makes markets. When disagreement evolves into agreement, risk premiums reprice and a transition in the volatility regime can occur. It is worth identifying the epicenter of disagreements and contradictory data to better understand the root cause of market incongruencies. Today, the epicenter of disagreement is between low equity volatility – levels not seen since the pandemic – and consensus expectations for elevated recession risk.
Is low volatility masking recession dangers or is it telling us that the likelihood of economic contraction is low? Based on data we have analyzed from both the risks priced by the option market and consumer data, we believe it is the latter. Options are pricing in greater upside skew to equities, with expected tail gains – or the chance for gains that exceed what is priced in under a broad distribution of expected returns – greater than expected tail losses. This is true for both developed markets equities and also emerging markets and small caps. At the same time, equity downside risk, or expected tail losses, are well below average levels. We see similar attractiveness in fixed income, with short maturity Treasuries slightly more attractive than longer maturity
notes. This suggests that inflation risks may be managed without leading to a deep recession.
Recession is very unlikely when the consumer is strong, and earnings estimates for consumer-focused companies, as well as forecasts for consumer loan impairments, indicate a healthy consumer.
The risk to this optimistic view is policy error. Historically, monetary policy has been fraught with error. One risk is keeping the economy awash with cheap money for too long and, thus, fueling inflation, and the other is inconsistent responses on the part of central banks to rising prices.
The Fed has reached a crucial point in its battle against inflation. The cost of money is once again expensive. The question now is whether Fed Chair Jerome Powell will finish the job by keeping money expensive – or will he balk? Thus far, Mr. Powell has made it clear that he does not consider his job done.
Resilient consumer and other macro should portend that moderately expensive money over the medium term won’t derail the economy or the prospects for riskier assets. A Fed that stays the course will more likely fuel a right tail – or upside surprise – in capital markets, while a premature dovish pivot would more likely fuel a left tail event.
The path of economic growth relies heavily on the Fed not committing a policy error and, therefore, uncertainty remains elevated.
Thank you for your investment in Janus Henderson Adaptive Risk Managed U.S. Equity Fund.
There is no assurance the stated objective(s) will be met.
No investment strategy can ensure a profit or eliminate the risk of loss.
Any risk management process discussed includes an effort to monitor and manage risk which should not be confused with and does not imply low risk or the ability to control certain risk factors.
Effective January 24, 2023, the Securities and Exchange Commission (the “SEC”) adopted rule and form amendments that require mutual funds and exchange-traded funds to provide shareholders with streamlined annual and semi-annual shareholder reports that highlight key information. Other information, including financial statements, that currently appears in shareholder reports will be made available online, delivered free of charge to shareholders upon request, and filed with the SEC. The first tailored shareholder report for the Fund will be for the reporting period ending June 30, 2024. Currently, management is evaluating the impact of the rule and form amendments on the content of the Fund’s current shareholder reports.
Returns quoted are past performance and do not guarantee future results; current performance may be lower or higher. Investment returns and principal value will vary; there may be a gain or loss when shares are sold. For the most recent month-end performance call 800.668.0434 (or 800.525.3713 if you hold shares directly with Janus Henderson) or visit janushenderson.com/performance (or janushenderson.com/allfunds if you hold shares directly with Janus Henderson).
Maximum Offering Price (MOP) returns include the maximum sales charge of 5.75%. Net Asset Value (NAV) returns exclude this charge, which would have reduced returns.
CDSC returns include a 1% contingent deferred sales charge (CDSC) on Shares redeemed within 12 months of purchase. Net Asset Value (NAV) returns exclude this charge, which would have reduced returns.
For certain periods, the Fund’s performance may reflect the effects of expense waivers.
Performance may be affected by risks that include those associated with foreign and emerging markets, fixed income securities, high-yield and high-risk securities, undervalued, overlooked and smaller capitalization companies, real estate related securities including Real Estate Investment Trusts (REITs), Environmental, Social and Governance (ESG) factors, non-diversification, portfolio turnover, derivatives, short sales, initial public offerings (IPOs) and potential conflicts of interest. Each product has different risks. Please see the prospectus for more information about risks, holdings and other details.
Returns include reinvestment of all dividends and distributions and do not reflect the deduction of taxes that a shareholder would pay on Fund distributions or redemptions of Fund shares. The returns do not include adjustments in accordance with generally accepted accounting principles required at the period end for financial reporting purposes.
Class A Shares, Class C Shares, Class I Shares, and Class S Shares commenced operations on July 6, 2009, after the reorganization of each class of the predecessor fund into corresponding shares of the Fund. Performance shown for each class for periods prior to July 6, 2009, reflects the historical performance of each corresponding class of the predecessor fund prior to the reorganization, calculated using the fees and expenses of the corresponding class of the predecessor fund respectively, net of any applicable fee and expense limitations or waivers.
Class T Shares commenced operations on July 6, 2009. Performance shown for periods prior to July 6, 2009, reflects the historical performance of the predecessor fund’s Class I Shares, calculated using the fees and expenses of Class T Shares, without the effect of any fee and expense limitations or waivers.
Class N Shares commenced operations on October 28, 2014. Performance shown for periods prior to October 28, 2014, reflects the historical performance of the Fund’s Class I Shares, calculated using the fees and expenses of Class I Shares, net of any applicable fee and expense limitations or waivers.
Class D Shares commenced operations on December 22, 2014. Performance shown for periods prior to December 22, 2014, reflects the historical performance of the Fund’s Class I Shares, calculated using the fees and expenses of Class D Shares, without the effect of any applicable fee and expense limitations or waivers.
If each share class of the Fund had been available during periods prior to its commencement, the performance shown may have been different. The performance shown for periods following the Fund’s commencement of each share class reflects the fees and expenses of each respective share class, net of any applicable fee and expense limitations or waivers. Please refer to the Fund’s prospectuses for further details concerning historical performance.
Ranking is for the share class shown only; other classes may have different performance characteristics. When an expense waiver is in effect, it may have a material effect on the total return, and therefore the ranking for the period.
© 2023 Morningstar, Inc. All Rights Reserved.
There is no assurance that the investment process will consistently lead to successful investing.
See Notes to Schedule of Investments and Other Information for index definitions.
Index performance does not reflect the expenses of managing a portfolio as an index is unmanaged and not available for direct investment.
Effective June 10, 2022, the Fund changed its investment strategy. The performance shown prior to this date does not reflect the new investment strategy and is not indicative of the current portfolio.
‡ As stated in the prospectus. Net expense ratios reflect the expense waiver, if any, contractually agreed to for a two-year period commencing on June 10, 2022. This contractual waiver may be terminated or modified only at the discretion of the Portfolio's Board of Trustees. See Financial Highlights for actual expense ratios during the reporting period.
As a shareholder of the Fund, you incur two types of costs: (1) transaction costs, such as sales charges (loads) on purchase payments (applicable to Class A Shares only); and (2) ongoing costs, including management fees; 12b-1 distribution and shareholder servicing fees; transfer agent fees and expenses payable pursuant to the Transfer Agency Agreement; and other Fund expenses. This example is intended to help you understand your ongoing costs (in dollars) of investing in the Fund and to compare these costs with the ongoing costs of investing in other mutual funds. To do so, compare this 5% hypothetical example with the 5% hypothetical examples that appear in the shareholder reports of the other funds. The example is based upon an investment of $1,000 invested at the beginning of the period and held for the six-months indicated, unless noted otherwise in the table and footnotes below.
The information in the table under the heading “Actual” provides information about actual account values and actual expenses. You may use the information in these columns, together with the amount you invested, to estimate the expenses that you paid over the period. Simply divide your account value by $1,000 (for example, an $8,600 account value divided by $1,000 = 8.6), then multiply the result by the number in the appropriate column for your share class under the heading entitled “Expenses Paid During Period” to estimate the expenses you paid on your account during the period.
The information in the table under the heading “Hypothetical (5% return before expenses)” provides information about hypothetical account values and hypothetical expenses based upon the Fund’s actual expense ratio and an assumed rate of return of 5% per year before expenses, which is not the Fund’s actual return. The hypothetical account values and expenses may not be used to estimate the actual ending account balance or expenses you paid for the period. You may use this information to compare the ongoing costs of investing in the Fund and other funds. To do so, compare this 5% hypothetical example with the 5% hypothetical examples that appear in the shareholder reports of the other funds. Additionally, for an analysis of the fees associated with an investment in any share class or other similar funds, please visit www.finra.org/fundanalyzer.
Please note that the expenses shown in the table are meant to highlight your ongoing costs only and do not reflect any transaction costs. These fees are fully described in the Fund’s prospectuses. Therefore, the hypothetical examples are useful in comparing ongoing costs only, and will not help you determine the relative total costs of owning different funds. In addition, if these transaction costs were included, your costs would have been higher.
Janus Henderson Adaptive Risk Managed U.S. Equity Fund
Janus Henderson Adaptive Risk Managed U.S. Equity Fund
Janus Henderson Adaptive Risk Managed U.S. Equity Fund
Janus Henderson Adaptive Risk Managed U.S. Equity Fund
Janus Henderson Adaptive Risk Managed U.S. Equity Fund
Janus Henderson Adaptive Risk Managed U.S. Equity Fund
Janus Henderson Adaptive Risk Managed U.S. Equity Fund
Janus Henderson Adaptive Risk Managed U.S. Equity Fund
Janus Henderson Adaptive Risk Managed U.S. Equity Fund
Janus Henderson Adaptive Risk Managed U.S. Equity Fund
Janus Henderson Adaptive Risk Managed U.S. Equity Fund
Janus Henderson Adaptive Risk Managed U.S. Equity Fund
Janus Henderson Adaptive Risk Managed U.S. Equity Fund
Janus Henderson Adaptive Risk Managed U.S. Equity Fund
Janus Henderson Adaptive Risk Managed U.S. Equity Fund
Janus Henderson Adaptive Risk Managed U.S. Equity Fund
Janus Henderson Adaptive Risk Managed U.S. Equity Fund
Janus Henderson Adaptive Risk Managed U.S. Equity Fund
Janus Henderson Adaptive Risk Managed U.S. Equity Fund
Janus Henderson Adaptive Risk Managed U.S. Equity Fund
Janus Henderson Adaptive Risk Managed U.S. Equity Fund (the “Fund”) is a series of Janus Investment Fund (the “Trust”), which is organized as a Massachusetts business trust and is registered under the Investment Company Act of 1940, as amended (the “1940 Act”), as an open-end management investment company, and therefore has applied the specialized accounting and reporting guidance in Financial Accounting Standards Board (“FASB”) Accounting Standards Codification (“ASC”) Topic 946. The Trust offers 39 funds, each of which offers multiple share classes, with differing investment objectives and policies. The Fund seeks long-term growth of capital. The Fund is classified as diversified, as defined in the 1940 Act. Janus Henderson Investors US LLC is the investment adviser (the “Adviser”) to the Fund.
The Fund offers multiple classes of shares in order to meet the needs of various types of investors. Each class represents an interest in the same portfolio of investments. Certain financial intermediaries may not offer all classes of shares.
Shareholders, including individuals, accounts, as well as the Fund’s portfolio manager(s) and/or investment personnel, may from time to time own (beneficially or of record) a significant percentage of the Fund’s Shares and can be considered to “control” the Fund when that ownership exceeds 25% of the Fund’s assets (and which may differ from control as determined in accordance with United States of America generally accepted accounting principles ("US GAAP")).
Class A Shares are offered through financial intermediary platforms including, but not limited to, traditional brokerage platforms, mutual fund wrap fee programs, bank trust platforms, and retirement platforms.
Class C Shares are offered through financial intermediary platforms including, but not limited to, traditional brokerage platforms, mutual fund wrap fee programs, and bank trust platforms.
Class C Shares are closed to investments by new employer-sponsored retirement plans and existing employer-sponsored retirement plans are no longer able to make additional purchases or exchanges into Class C Shares.
The Fund currently implements an automatic conversion feature pursuant to which Class C Shares that have been held for eight years are automatically converted to Class A Shares without the imposition of any sales charge, fee or other charge. The conversion will generally occur no later than ten business days in the month following the month of the eighth anniversary of the date of purchase. Class C Shares purchased through the reinvestment of dividends and other distributions on Class C Shares will convert to Class A Shares at the same time as the original Class C Shares with respect to which they were purchased. For Class C Shares held in omnibus accounts on intermediary platforms, the Fund relies on these intermediaries to implement this conversion feature. Your financial intermediary may have separate policies and procedures as to when and how Class C Shares may be converted to Class A Shares.
Effective July 6, 2020, Class D Shares are available to new investors, subject to any closed fund policies for a Fund, as applicable. Previously, Class D Shares were only available to investors who already had a direct account with the Janus Henderson funds; immediate family members or members of the same household of an eligible individual investor; and existing beneficial owners of sole proprietorships or partnerships that hold accounts directly with the Janus Henderson funds.
Class I Shares are available through certain financial intermediary platforms including, but not limited to, mutual fund wrap fee programs, managed account programs, asset allocation programs, bank trust platforms, as well as certain retirement platforms. Class I Shares are also available to certain direct institutional investors including, but not limited to, corporations, certain retirement plans, public plans, and foundations/endowments, who established Class I Share accounts before August 4, 2017.
Class N Shares are generally available only to financial intermediaries purchasing on behalf of: 1) certain adviser-assisted, employer-sponsored retirement plans, including 401(k) plans, 457 plans, 403(b) plans, Taft-Hartley multi-employer plans, profit-sharing and money purchase pension plans, defined benefit plans and certain welfare benefit plans, such as health savings accounts, and nonqualified deferred compensation plans; and 2) retail investors purchasing in qualified or nonqualified accounts, whose accounts are held through an omnibus account at their financial intermediary, and where the financial intermediary requires no payment or reimbursement from the Fund, the Adviser, or its affiliates. Class N Shares are also available to Janus Henderson proprietary products and to certain direct institutional investors approved by Janus Henderson Distributors US LLC (the “Distributor”) including, but not limited to,
Janus Henderson Adaptive Risk Managed U.S. Equity Fund
corporations, certain retirement plans, public plans, and foundations and endowments, subject to minimum investment requirements.
Class S Shares are offered through financial intermediary platforms including, but not limited to, retirement platforms and asset allocation, mutual fund wrap, or other discretionary or nondiscretionary fee-based investment advisory programs. In addition, Class S Shares may be available through certain financial intermediaries who have an agreement with the Adviser or its affiliates to offer Class S Shares on their supermarket platforms.
Class T Shares are available through certain financial intermediary platforms including, but not limited to, mutual fund wrap fee programs, managed account programs, asset allocation programs, bank trust platforms, as well as certain retirement platforms. In addition, Class T Shares may be available through certain financial intermediaries who have an agreement with the Adviser or its affiliates to offer Class T Shares on their supermarket platforms.
The following accounting policies have been followed by the Fund and are in conformity with US GAAP.
Fund holdings are valued in accordance with policies and procedures established by the Adviser pursuant to Rule 2a-5 under the 1940 Act and approved by and subject to the oversight of the Trustees (the “Valuation Procedures”). Equity securities traded on a domestic securities exchange are generally valued at readily available market quotations, which are (i) the official close prices or (ii) last sale prices on the primary market or exchange in which the securities trade. If such price is lacking for the trading period immediately preceding the time of determination, such securities are generally valued at their current bid price. Equity securities that are traded on a foreign exchange are generally valued at the closing prices on such markets. In the event that there is no current trading volume on a particular security in such foreign exchange, the bid price from the primary exchange is generally used to value the security. Foreign securities and currencies are converted to U.S. dollars using the current spot USD dollar exchange rate in effect at the close of the New York Stock Exchange (“NYSE”). The Adviser will determine the market value of individual securities held by it by using prices provided by one or more Adviser-approved professional pricing services or, as needed, by obtaining market quotations from independent broker-dealers. Most debt securities are valued in accordance with the evaluated bid price supplied by the pricing service that is intended to reflect market value. The evaluated bid price supplied by the pricing service is an evaluation that may consider factors such as security prices, yields, maturities and ratings. Certain short-term securities maturing within 60 days or less may be evaluated and valued on an amortized cost basis provided that the amortized cost determined approximates market value. Securities for which market quotations or evaluated prices are not readily available or deemed unreliable are valued at fair value determined in good faith by the Adviser pursuant to the Valuation Procedures. Circumstances in which fair valuation may be utilized include, but are not limited to: (i) a significant event that may affect the securities of a single issuer, such as a merger, bankruptcy, or significant issuer-specific development; (ii) an event that may affect an entire market, such as a natural disaster or significant governmental action; (iii) a nonsignificant event such as a market closing early or not opening, or a security trading halt; and (iv) pricing of a nonvalued security and a restricted or nonpublic security. Special valuation considerations may apply with respect to “odd-lot” fixed-income transactions which, due to their small size, may receive evaluated prices by pricing services which reflect a large block trade and not what actually could be obtained for the odd-lot position. The value of the securities of other mutual funds held by the Fund, if any, will be calculated using the NAV of such mutual funds, and the prospectuses for such mutual funds explain the circumstances under which they use fair valuation and the effects of using fair valuation. The value of the securities of any cash management pooled investment vehicles that operate as money market funds held by the Fund, if any, will be calculated using the NAV of such funds.
FASB ASC 820, Fair Value Measurements and Disclosures (“ASC 820”), defines fair value, establishes a framework for measuring fair value, and expands disclosure requirements regarding fair value measurements. This standard emphasizes that fair value is a market-based measurement that should be determined based on the assumptions that market participants would use in pricing an asset or liability and establishes a hierarchy that prioritizes inputs to valuation techniques used to measure fair value. These inputs are summarized into three broad levels:
Level 1 – Unadjusted quoted prices in active markets the Fund has the ability to access for identical assets or liabilities.
Level 2 – Observable inputs other than unadjusted quoted prices included in Level 1 that are observable for the asset or liability either directly or indirectly. These inputs may include quoted prices for the identical instrument on
Janus Henderson Adaptive Risk Managed U.S. Equity Fund
an inactive market, prices for similar instruments, interest rates, prepayment speeds, credit risk, yield curves, default rates and similar data.
Assets or liabilities categorized as Level 2 in the hierarchy generally include: debt securities fair valued in accordance with the evaluated bid or ask prices supplied by a pricing service; securities traded on OTC markets and listed securities for which no sales are reported that are fair valued at the latest bid price (or yield equivalent thereof) obtained from one or more dealers transacting in a market for such securities or by a pricing service approved by the Fund’s Trustees; certain short-term debt securities with maturities of 60 days or less that are fair valued at amortized cost; and equity securities of foreign issuers whose fair value is determined by using systematic fair valuation models provided by independent third parties in order to adjust for stale pricing which may occur between the close of certain foreign exchanges and the close of the NYSE. Other securities that may be categorized as Level 2 in the hierarchy include, but are not limited to, preferred stocks, bank loans, swaps, investments in unregistered investment companies, options, and forward contracts.
Level 3 – Unobservable inputs for the asset or liability to the extent that relevant observable inputs are not available, representing the Fund’s own assumptions about the assumptions that a market participant would use in valuing the asset or liability, and that would be based on the best information available.
There have been no significant changes in valuation techniques used in valuing any such positions held by the Fund since the beginning of the fiscal year.
The inputs or methodology used for fair valuing securities are not necessarily an indication of the risk associated with investing in those securities. The summary of inputs used as of June 30, 2023 to fair value the Fund’s investments in securities and other financial instruments is included in the “Valuation Inputs Summary” in the Notes to Schedule of Investments and Other Information.
The Fund bears expenses incurred specifically on its behalf. Each class of shares bears a portion of general expenses, which are allocated daily to each class of shares based upon the ratio of net assets represented by each class as a percentage of total net assets. Expenses directly attributable to a specific class of shares are charged against the operations of such class.
The preparation of financial statements in conformity with US GAAP requires management to make estimates and assumptions that affect the reported amount of assets and liabilities and disclosure of contingent assets and liabilities at the date of the financial statements, and the reported amounts of income and expenses during the reporting period. Actual results could differ from those estimates.
In the normal course of business, the Fund may enter into contracts that contain provisions for indemnification of other parties against certain potential liabilities. The Fund’s maximum exposure under these arrangements is unknown, and would involve future claims that may be made against the Fund that have not yet occurred. Currently, the risk of material loss from such claims is considered remote.
Janus Henderson Adaptive Risk Managed U.S. Equity Fund
The Fund does not isolate that portion of the results of operations resulting from the effect of changes in foreign exchange rates on investments from the fluctuations arising from changes in market prices of securities held at the date of the financial statements. Net unrealized appreciation or depreciation of investments and foreign currency translations arise from changes in the value of assets and liabilities, including investments in securities held at the date of the financial statements, resulting from changes in the exchange rates and changes in market prices of securities held.
Currency gains and losses are also calculated on payables and receivables that are denominated in foreign currencies. The payables and receivables are generally related to foreign security transactions and income translations.
Foreign currency-denominated assets and forward currency contracts may involve more risks than domestic transactions, including currency risk, counterparty risk, political and economic risk, regulatory risk and equity risk. Risks may arise from unanticipated movements in the value of foreign currencies relative to the U.S. dollar.
The Fund generally declares and distributes dividends of net investment income and realized capital gains (if any) annually. The Fund may treat a portion of the amount paid to redeem shares as a distribution of investment company taxable income and realized capital gains that are reflected in the net asset value. This practice, commonly referred to as “equalization,” has no effect on the redeeming shareholder or a Fund’s total return, but may reduce the amounts that would otherwise be required to be paid as taxable dividends to the remaining shareholders. It is possible that the Internal Revenue Service (IRS) could challenge the Fund's equalization methodology or calculations, and any such challenge could result in additional tax, interest, or penalties to be paid by the Fund.
The Fund may make certain investments in real estate investment trusts (“REITs”) which pay dividends to their shareholders based upon funds available from operations. It is quite common for these dividends to exceed the REITs’ taxable earnings and profits, resulting in the excess portion of such dividends being designated as a return of capital. If the Fund distributes such amounts, such distributions could constitute a return of capital to shareholders for federal income tax purposes.
The Fund intends to continue to qualify as a regulated investment company and distribute all of its taxable income in accordance with the requirements of Subchapter M of the Internal Revenue Code. Management has analyzed the Fund’s tax positions taken for all open federal income tax years, generally a three-year period, and has concluded that no provision for federal income tax is required in the Fund’s financial statements. The Fund is not aware of any tax positions for which it is reasonably possible that the total amounts of unrecognized tax benefits will significantly change in the next twelve months.
2. Other Investments and Strategies
The value of the Fund’s portfolio may decrease if the value of one or more issuers in the Fund’s portfolio decreases. Further, regardless of how well individual companies or securities perform, the value of the Fund’s portfolio could also decrease if there are deteriorating economic or market conditions, including, but not limited to, a general decline in prices on the stock markets, a general decline in real estate markets, a decline in commodities prices, or if the market favors different types of securities than the types of securities in which the Fund invests. If the value of the Fund’s portfolio decreases, the Fund’s NAV will also decrease, which means if you sell your shares in the Fund you may lose money. Market risk may affect a single issuer, industry, economic sector, or the market as a whole. The increasing interconnectivity between global economies and financial markets increases the likelihood that events or conditions in one region or financial market may adversely impact issuers in a different country, region or financial market. Social, political, economic and other conditions and events, such as natural disasters, health emergencies (e.g., epidemics and pandemics), terrorism, conflicts, including related sanctions, and social unrest, could reduce consumer demand or economic output, result in market closures, travel restrictions and/or quarantines, and generally have a significant impact on the global economies and financial markets.
• COVID-19 Pandemic. The effects of COVID-19 have contributed to increased volatility in global financial markets and have affected and may continue to affect certain countries, regions, issuers, industries and market sectors more dramatically than others. These conditions and events could have a significant impact on the Fund and its investments,
Janus Henderson Adaptive Risk Managed U.S. Equity Fund
the Fund’s ability to meet redemption requests, and the processes and operations of the Fund’s service providers, including the Adviser.
• Russia/Ukraine Invasion. Russia launched a large-scale invasion of Ukraine on February 24, 2022. The extent and duration of the military action, resulting sanctions and resulting future market disruptions in the region are impossible to predict, but could be significant and have a severe adverse effect on the region, including significant negative impacts on the economy and the markets for certain securities and commodities, such as oil and natural gas, as well as other sectors.
The Fund may invest in exchange-traded funds (“ETFs”) to gain exposure to a particular portion of the market. ETFs are typically open-end investment companies, which may seek to track the performance of a specific index or be actively managed. ETFs are traded on a national securities exchange at market prices that may vary from the net asset value of their underlying investments. Accordingly, there may be times when an ETF trades at a premium or discount. When the Fund invests in an ETF, in addition to directly bearing the expenses associated with its own operations, it will bear a pro rata portion of the ETF's expenses. As a result, the cost of investing in the Fund may be higher than the cost of investing directly in ETFs and may be higher than other mutual funds that invest directly in stocks and bonds. ETFs also involve the risk that an active trading market for an ETF's shares may not develop or be maintained. Similarly, because the value of ETF shares depends on the demand in the market, the Fund may not be able to purchase or sell an ETF at the most optimal time, which could adversely affect the Fund’s performance. In addition, ETFs that track particular indices may be unable to match the performance of such underlying indices due to the temporary unavailability of certain index securities in the secondary market or other factors, such as discrepancies with respect to the weighting of securities. Because the Fund may invest in a broad range of ETFs, such risks may include, but are not limited to, leverage risk, foreign exposure risk, interest rate risk, emerging markets risk, and commodity-linked investments risk. The Fund is also subject to substantially the same risks as those associated with direct exposure to the securities held by the ETF.
Fund transactions involving a counterparty are subject to the risk that the counterparty or a third party will not fulfill its obligation to the Fund (“counterparty risk”). Counterparty risk may arise because of the counterparty’s financial condition (i.e., financial difficulties, bankruptcy, or insolvency), market activities and developments, or other reasons, whether foreseen or not. A counterparty’s inability to fulfill its obligation may result in significant financial loss to the Fund. The Fund may be unable to recover its investment from the counterparty or may obtain a limited recovery, and/or recovery may be delayed. The extent of the Fund’s exposure to counterparty risk with respect to financial assets and liabilities approximates its carrying value. See the "Offsetting Assets and Liabilities" section of this Note for further details.
The Fund may be exposed to counterparty risk through participation in various programs, including, but not limited to, lending its securities to third parties, cash sweep arrangements whereby the Fund’s cash balance is invested in one or more types of cash management vehicles, as well as investments in, but not limited to, repurchase agreements, debt securities, and derivatives, including various types of swaps, futures and options. The Fund intends to enter into financial transactions with counterparties that the Adviser believes to be creditworthy at the time of the transaction. There is always the risk that the Adviser’s analysis of a counterparty’s creditworthiness is incorrect or may change due to market conditions. To the extent that the Fund focuses its transactions with a limited number of counterparties, it will have greater exposure to the risks associated with one or more counterparties.
Under procedures adopted by the Trustees, the Fund may seek to earn additional income by lending securities to certain qualified broker-dealers and institutions. JPMorgan Chase Bank, National Association acts as securities lending agent and a limited purpose custodian or subcustodian to receive and disburse cash balances and cash collateral, hold short-term investments, hold collateral, and perform other custodial functions in accordance with the Non-Custodial Securities Lending Agreement. For financial reporting purposes, the Fund does not offset financial instruments’ payables and receivables and related collateral on the Statement of Assets and Liabilities. The Fund may lend fund securities in an amount equal to up to 1/3 of its total assets as determined at the time of the loan origination. There is the risk of delay in recovering a loaned security or the risk of loss in collateral rights if the borrower fails financially. In addition, the Adviser makes efforts to balance the benefits and risks from granting such loans. All loans will be continuously secured by collateral which may consist of cash, U.S. Government securities, domestic and foreign short-term debt instruments, letters of credit, time deposits, repurchase agreements, money market mutual funds or other
Janus Henderson Adaptive Risk Managed U.S. Equity Fund
money market accounts, or such other collateral as permitted by the SEC. If the Fund is unable to recover a security on loan, the Fund may use the collateral to purchase replacement securities in the market. There is a risk that the value of the collateral could decrease below the cost of the replacement security by the time the replacement investment is made, resulting in a loss to the Fund. In certain circumstances individual loan transactions could yield negative returns.
Upon receipt of cash collateral, the Adviser may invest it in affiliated or non-affiliated cash management vehicles, whether registered or unregistered entities, as permitted by the 1940 Act and rules promulgated thereunder. The Adviser currently intends to primarily invest the cash collateral in a cash management vehicle for which the Adviser serves as investment adviser, Janus Henderson Cash Collateral Fund LLC, or in time deposits. An investment in Janus Henderson Cash Collateral Fund LLC is generally subject to the same risks that shareholders experience when investing in similarly structured vehicles, such as the potential for significant fluctuations in assets as a result of the purchase and redemption activity of the securities lending program, a decline in the value of the collateral, and possible liquidity issues. Such risks may delay the return of the cash collateral and cause the Fund to violate its agreement to return the cash collateral to a borrower in a timely manner. As adviser to the Fund and Janus Henderson Cash Collateral Fund LLC, the Adviser has an inherent conflict of interest as a result of its fiduciary duties to both the Fund and Janus Henderson Cash Collateral Fund LLC. Additionally, the Adviser receives an investment advisory fee of 0.05% for managing Janus Henderson Cash Collateral Fund LLC, but it may not receive a fee for managing certain other affiliated cash management vehicles in which the Fund may invest, and therefore may have an incentive to allocate preferred investment opportunities to investment vehicles for which it is receiving a fee.
The value of the collateral must be at least 102% of the market value of the loaned securities that are denominated in U.S. dollars and 105% of the market value of the loaned securities that are not denominated in U.S. dollars. Loaned securities and related collateral are marked-to-market each business day based upon the market value of the loaned securities at the close of business, employing the most recent available pricing information. Collateral levels are then adjusted based on this mark-to-market evaluation. Additional required collateral, or excess collateral returned, is delivered on the next business day. Therefore, the value of the collateral held may be temporarily less than 102% or 105% value of the securities on loan. The cash collateral invested by the Adviser is disclosed in the Schedule of Investments (if applicable).
Income earned from the investment of the cash collateral, net of rebates paid to, or fees paid by, borrowers and less the fees paid to the lending agent are included as “Affiliated securities lending income, net” on the Statement of Operations. As of June 30, 2023, securities lending transactions accounted for as secured borrowings with an overnight and continuous contractual maturity are $4,659,324. Gross amounts of recognized liabilities for securities lending (collateral received) as of June 30, 2023 is $4,702,763, resulting in the net amount due to the counterparty of $43,439.
The Fund presents gross and net information about transactions that are either offset in the financial statements or subject to an enforceable master netting arrangement or similar agreement with a designated counterparty, regardless of whether the transactions are actually offset in the Statement of Assets and Liabilities.
The Offsetting Assets and Liabilities table located in the Schedule of Investments presents gross amounts of recognized assets and/or liabilities and the net amounts after deducting collateral that has been pledged by counterparties or has been pledged to counterparties (if applicable). For corresponding information grouped by type of instrument, see the Fund's Schedule of Investments.
3. Investment Advisory Agreements and Other Transactions with Affiliates
The Fund pays the Adviser an investment advisory fee which is calculated daily and paid monthly. The Fund’s contractual investment advisory fee rate (expressed as an annual rate) is 0.50% of its average daily net assets.
The Adviser has contractually agreed to waive 0.05% of its advisory fee through at least June 9, 2024. In addition, the Adviser has contractually agreed to waive the investment advisory fee and/or reimburse operating expenses to the extent that the Fund’s total annual fund operating expenses excluding the fees payable pursuant to a Rule 12b-1 plan, shareholder servicing fees, such as transfer agency fees (including out-of-pocket costs), administrative services fees and any networking/omnibus fees payable by any share class, brokerage commissions, interest, dividends, taxes, acquired fund fees and expenses, and extraordinary expenses, exceed the annual rate of 0.65% of the Fund’s average daily net assets for at least a one-year period commencing October 28, 2022. If applicable, amounts waived and/or
Janus Henderson Adaptive Risk Managed U.S. Equity Fund
reimbursed to the Fund by the Adviser are disclosed as “Excess Expense Reimbursement and Waivers” on the Statement of Operations.
The Adviser serves as administrator to the Fund pursuant to an administration agreement between the Adviser and the Trust. Under the administration agreement, the Adviser is authorized to perform, or cause others to perform certain administration, compliance, and accounting services to the Fund, including providing office space for the Fund, and is reimbursed by the Fund for certain of its costs in providing these services (to the extent the Adviser seeks reimbursement and such costs are not otherwise waived). In addition, employees of the Adviser and/or its affiliates may serve as officers of the Trust. The Fund pays for some or all of the salaries, fees, and expenses of the Adviser employees and Fund officers, with respect to certain specified administration functions they perform on behalf of the Fund. The Fund pays these costs based on out-of-pocket expenses incurred by the Adviser, and these costs are separate and apart from advisory fees and other expenses paid in connection with the investment advisory services the Adviser (or any subadvisor, as applicable) provides to the Fund. These amounts are disclosed as “Affiliated fund administration fees” on the Statement of Operations. In addition, some expenses related to compensation payable to the Fund’s Chief Compliance Officer and certain compliance staff, all of whom are employees of the Adviser and/or its affiliates, are shared with the Fund. Total compensation of $343,237 was paid to the Chief Compliance Officer and certain compliance staff by the Trust during the year ended June 30, 2023. The Fund's portion is reported as part of “Other expenses” on the Statement of Operations.
Janus Henderson Services US LLC (the “Transfer Agent”), a wholly-owned subsidiary of the Adviser, is the Fund’s transfer agent. The Transfer Agent provides or arranges for the provision of shareholder services including, but not limited to, recordkeeping, subaccounting, answering inquiries regarding accounts, order processing, transaction confirmations, the mailing of prospectuses and shareholder reports, and other shareholder services provided to or on behalf of shareholders. These amounts are disclosed as “Transfer agent administrative fees and expenses” on the Statement of Operations.
Class D Shares of the Fund pay the Transfer Agent an annual administrative services fee based on the average daily net assets of Class D Shares as detailed below.
During the reporting period, the administrative services fee rate was 0.12%.
The Transfer Agent receives an administrative services fee at an annual rate of up to 0.25% of the average daily net assets of the Fund’s Class S Shares and Class T Shares for providing or procuring administrative services to investors in Class S Shares and Class T Shares of the Fund. The Transfer Agent expects to use all or a significant portion of this fee to compensate retirement plan service providers, broker-dealers, bank trust departments, financial advisors, and other financial intermediaries for providing these services. The Transfer Agent may keep certain amounts retained for reimbursement of out-of-pocket costs incurred for servicing clients of Class S Shares and Class T Shares.
Shareholder Services provided by these financial intermediaries may include, but are not limited to, recordkeeping, subaccounting, order processing, providing order confirmations, periodic statements, forwarding prospectuses, shareholder reports, and other materials to existing customers, answering inquiries regarding accounts, and other administrative services. Order processing includes the submission of transactions through the National Securities Clearing Corporation (“NSCC”) or similar systems, or those processed on a manual basis with the Adviser. For all share classes, the Transfer Agent also seeks reimbursement for costs it incurs as transfer agent and for providing servicing.
Certain, but not all, intermediaries may charge administrative fees to investors in Class A Shares, Class C Shares, and Class I Shares for administrative services provided on behalf of such investors. These administrative fees are paid by the Class A Shares, Class C Shares, and Class I Shares of the Fund to the Transfer Agent, which uses such fees to reimburse intermediaries. Consistent with the Transfer Agency Agreement between the Transfer Agent and the Fund, the Transfer Agent may negotiate the level, structure, and/or terms of the administrative fees with intermediaries requiring such fees on behalf of the Fund. The Adviser and its affiliates benefit from an increase in assets that may result from such relationships. The Adviser has agreed to limit these fees up to 0.20% for Class A Shares and Class C Shares, and up to 0.15% for Class I Shares on an annual basis based on the daily net assets of each share class. Such
Janus Henderson Adaptive Risk Managed U.S. Equity Fund
limits are subject to change by the Trustees in the future. These amounts are disclosed as “Transfer agent networking and omnibus fees” on the Statement of Operations.
The Transfer Agent is not compensated for its services related to the shares, except for out-of-pocket costs, although the Transfer Agent is compensated for its services related to Fund’s Class D Shares. These amounts are disclosed as “Other transfer agent fees and expenses” on the Statement of Operations.
Under distribution and shareholder servicing plans (the “Plans”) adopted in accordance with Rule 12b-1 under the 1940 Act, the Fund pays the Trust’s distributor, the Distributor, a wholly-owned subsidiary of the Adviser, a fee for the sale and distribution and/or shareholder servicing of the shares based on the average daily net assets for each share class at an annual rate of up to 0.25% for Class A Shares, up to 1.00% for Class C Shares, and up to 0.25% for Class S Shares. Under the terms of the Plans, the Trust is authorized to make payments to the Distributor for remittance to retirement plan service providers, broker-dealers, bank trust departments, financial advisors, and other financial intermediaries, as compensation for distribution and/or shareholder services performed by such entities for their customers who are investors in the Fund. These amounts are disclosed as “12b-1 Distribution and shareholder servicing fees” on the Statement of Operations.
Class A Shares include a 5.75% upfront sales charge of the offering price of the Fund. The sales charge is allocated between the Distributor and financial intermediaries. During the year ended June 30, 2023, the Distributor retained upfront sales charges of $327.
A contingent deferred sales charge (“CDSC”) of 1.00% will be deducted with respect to Class A Shares purchased without a sales load and redeemed within 12 months of purchase, unless waived. Any applicable CDSC will be 1.00% of the lesser of the original purchase price or the value of the redemption of the Class A Shares redeemed. There were no CDSCs paid by redeeming shareholders of Class A Shares to the Distributor during the year ended June 30, 2023.
A CDSC of 1.00% will be deducted with respect to Class C Shares redeemed within 12 months of purchase, unless waived. Any applicable CDSC will be 1.00% of the lesser of the original purchase price or the value of the redemption of the Class C Shares redeemed. During the year ended June 30, 2023, redeeming shareholders of Class C Shares paid CDSCs of $1,506.
The Board of Trustees has adopted a deferred compensation plan (the “Deferred Plan”) for independent Trustees to elect to defer receipt of all or a portion of the annual compensation they are entitled to receive from the Fund. All deferred fees are credited to an account established in the name of the Trustees. The amounts credited to the account then increase or decrease, as the case may be, in accordance with the performance of one or more of the Janus Henderson funds that are selected by the Trustees. The account balance continues to fluctuate in accordance with the performance of the selected fund or funds until final payment of all amounts are credited to the account. The fluctuation of the account balance is recorded by the Fund as unrealized appreciation/(depreciation) and is included as of June 30, 2023 on the Statement of Assets and Liabilities in the asset, “Trustees’ deferred compensation,” and liability, “Trustees’ deferred compensation fees.” Additionally, the recorded unrealized appreciation/(depreciation) is included in “Total distributable earnings (loss)” on the Statement of Assets and Liabilities. Deferred compensation expenses for the year ended June 30, 2023 are included in “Trustees’ fees and expenses” on the Statement of Operations. Trustees are allowed to change their designation of mutual funds from time to time. Amounts will be deferred until distributed in accordance with the Deferred Plan. Deferred fees of $426,025 were paid by the Trust to the Trustees under the Deferred Plan during the year ended June 30, 2023.
Pursuant to the provisions of the 1940 Act and related rules, the Fund may participate in an affiliated or non-affiliated cash sweep program. In the cash sweep program, uninvested cash balances of the Fund may be used to purchase shares of affiliated or non-affiliated money market funds or cash management pooled investment vehicles that operate as money market funds. The Fund is eligible to participate in the cash sweep program (the “Investing Funds”). The Adviser has an inherent conflict of interest because of its fiduciary duties to the affiliated money market funds or cash management pooled investment vehicles and the Investing Funds. Janus Henderson Cash Liquidity Fund LLC (the “Sweep Vehicle”) is an affiliated unregistered cash management pooled investment vehicle that invests primarily in highly-rated short-term fixed-income securities. The Sweep Vehicle operates pursuant to the provisions of the 1940 Act that govern the operation of money market funds and prices its shares at NAV reflecting market-based values of its portfolio securities (i.e., a “floating” NAV) rounded to the fourth decimal place (e.g., $1.0000). The Sweep Vehicle is permitted to impose a liquidity fee (of up to 2%) on redemptions from the Sweep Vehicle or a redemption gate that temporarily suspends redemptions from the Sweep Vehicle for up to 10 business days during a 90 day period. There
Janus Henderson Adaptive Risk Managed U.S. Equity Fund
are no restrictions on the Fund's ability to withdraw investments from the Sweep Vehicle at will, and there are no unfunded capital commitments due from the Fund to the Sweep Vehicle. The Sweep Vehicle does not charge any management fee, sales charge or service fee.
Any purchases and sales, realized gains/losses and recorded dividends from affiliated investments during the year ended June 30, 2023 can be found in the “Schedules of Affiliated Investments” located in the Schedule of Investments.
As of June 30, 2023, shares of the Fund were owned by affiliates of the Adviser, and/or other funds advised by the Adviser, as indicated in the table below:
4. Federal Income Tax
The tax components of capital shown in the table below represent: (1) distribution requirements the Fund must satisfy under the income tax regulations; (2) losses or deductions the Fund may be able to offset against income and gains realized in future years; and (3) unrealized appreciation or depreciation of investments for federal income tax purposes.
Other book to tax differences primarily consist of deferred compensation. The Fund has elected to treat gains and losses on forward foreign currency contracts as capital gains and losses, if applicable. Other foreign currency gains and losses on debt instruments are treated as ordinary income for federal income tax purposes pursuant to Section 988 of the Internal Revenue Code.
The aggregate cost of investments and the composition of unrealized appreciation and depreciation of investment securities for federal income tax purposes as of June 30, 2023 are noted below. The primary differences between book and tax appreciation or depreciation of investments are wash sale loss deferrals and investments in partnerships.
Janus Henderson Adaptive Risk Managed U.S. Equity Fund
Income and capital gains distributions are determined in accordance with income tax regulations that may differ from US GAAP. The differences are due to differing treatment for items such as net short-term gains, deferral of wash sale losses, and foreign currency transactions. Certain permanent differences such as tax returns of capital and net investment losses noted below have been reclassified to capital.
Permanent book to tax basis differences may result in reclassifications between the components of net assets. These differences have no impact on the results of operations or net assets. Capital has been adjusted by $1,640,321 including $1,077,201 of long-term capital gain, for distributions in connection with Fund shares redemption (tax equalization).
Janus Henderson Adaptive Risk Managed U.S. Equity Fund
5. Capital Share Transactions
6. Purchases and Sales of Investment Securities
For the year ended June 30, 2023, the aggregate cost of purchases and proceeds from sales of investment securities (excluding any short-term securities, short-term options contracts, TBAs, and in-kind transactions, as applicable) was as follows:
Janus Henderson Adaptive Risk Managed U.S. Equity Fund
7. Subsequent Event
Management has evaluated whether any events or transactions occurred subsequent to June 30, 2023 and through the date of issuance of the Fund’s financial statements and determined that there were no material events or transactions that would require recognition or disclosure in the Fund’s financial statements.
Janus Henderson Adaptive Risk Managed U.S. Equity Fund
These financial statements are the responsibility of the Fund’s management. Our responsibility is to express an opinion on the Fund’s financial statements based on our audits. We are a public accounting firm registered with the Public Company Accounting Oversight Board (United States) (PCAOB) and are required to be independent with respect to the Fund in accordance with the U.S. federal securities laws and the applicable rules and regulations of the Securities and Exchange Commission and the PCAOB.
We conducted our audits of these financial statements in accordance with the standards of the PCAOB. Those standards require that we plan and perform the audit to obtain reasonable assurance about whether the financial statements are free of material misstatement, whether due to error or fraud.
Our audits included performing procedures to assess the risks of material misstatement of the financial statements, whether due to error or fraud, and performing procedures that respond to those risks. Such procedures included examining, on a test basis, evidence regarding the amounts and disclosures in the financial statements. Our audits also included evaluating the accounting principles used and significant estimates made by management, as well as evaluating the overall presentation of the financial statements. Our procedures included confirmation of securities owned as of June 30, 2023 by correspondence with the custodian, transfer agent and brokers; when replies were not received from brokers, we performed other auditing procedures. We believe that our audits provide a reasonable basis for our opinion.
We have served as the auditor of one or more investment companies in Janus Henderson Funds since 1990.
Janus Henderson Adaptive Risk Managed U.S. Equity Fund
A description of the policies and procedures that the Fund uses to determine how to vote proxies relating to its portfolio securities is available without charge: (i) upon request, by calling 1-800-525-1093; (ii) on the Fund’s website at janushenderson.com/proxyvoting; and (iii) on the SEC’s website at http://www.sec.gov. Additionally, information regarding the Fund’s proxy voting record for the most recent twelve-month period ended June 30 is also available, free of charge, through janushenderson.com/proxyvoting and from the SEC’s website at http://www.sec.gov.
The Fund files its complete portfolio holdings (schedule of investments) with the SEC as an exhibit to Form N-PORT within 60 days of the end of the first and third fiscal quarters, and in the annual report and semiannual report to shareholders. The Fund’s Form N-PORT filings and annual and semiannual reports: (i) are available on the SEC’s website at http://www.sec.gov; and (ii) are available without charge, upon request, by calling a Janus Henderson representative at 1-877-335-2687 (toll free) (or 1-800-525-3713 if you hold Class D shares). Portfolio holdings consisting of at least the names of the holdings are generally available on a monthly basis with a 30-day lag under Full Holdings for the Fund at janushenderson.com/info (or janushenderson.com/reports if you hold Class D Shares).
The Trustees of Janus Aspen Series, each of whom serves as an “independent” Trustee (the “Trustees”), oversee the management of each portfolio of Janus Aspen Series (each, a “VIT Portfolio,” and collectively, the “VIT Portfolios”), as well as each fund of Janus Investment Fund (each, a “Fund,” and collectively, the “Funds” and together with the VIT Portfolios, the “Janus Henderson Funds,” and each, a “Janus Henderson Fund”). As required by law, the Trustees determine annually whether to continue the investment advisory agreement for each Janus Henderson Fund.
In connection with their most recent consideration of those agreements for each Janus Henderson Fund, the Trustees received and reviewed information provided by Janus Henderson Investors US LLC (the “Adviser”) in response to requests of the Trustees and their independent legal counsel. They also received and reviewed information and analysis provided by, and in response to requests of, their independent fee consultant. Throughout their consideration of the agreements, the Trustees were advised by their independent legal counsel. The Trustees met with management to consider the agreements, and also met separately in executive session with their independent legal counsel and their independent fee consultant.
At meetings held on November 9-10, 2022 and December 13-14, 2022, the Trustees evaluated the information provided by the Adviser and the independent fee consultant, as well as other information provided by the Adviser and the independent fee consultant during the year. Following such evaluation, the Trustees determined that the overall arrangements between each Janus Henderson Fund and the Adviser were fair and reasonable in light of the nature, extent, and quality of the services provided by the Adviser and its affiliates, the fees charged for those services, and other matters that the Trustees considered relevant in the exercise of their business judgment, and unanimously approved the continuation of the investment advisory agreement for each Janus Henderson Fund for the period from February 1, 2023 through February 1, 2024, subject to earlier termination as provided for in each agreement.
In considering the continuation of those agreements, the Trustees reviewed and analyzed various factors that they determined were relevant, including the factors described below, none of which by itself was considered dispositive. However, the material factors and conclusions that formed the basis for the Trustees’ determination to approve the continuation of the agreements are discussed separately below. Also included is a summary of the independent fee consultant’s conclusions and opinions that arose during, and were included as part of, the Trustees’ consideration of the agreements. “Management fees,” as used herein, reflect actual annual advisory fees and, for the purpose of peer comparisons any administration fees (excluding out of pocket costs), net of any waivers, paid by a fund as a percentage of average net assets.
The Trustees reviewed the nature, extent, and quality of the services provided by the Adviser to the Janus Henderson Funds, taking into account the investment objective, strategies, and policies of each Janus Henderson Fund, and the knowledge the Trustees gained from their regular meetings with management on at least a quarterly basis and their ongoing review of information related to the Janus Henderson Funds. In addition, the Trustees reviewed the resources and key personnel of the Adviser, particularly noting those employees who provide investment and risk management services to the Janus Henderson Funds. The Trustees also considered other services provided to the Janus Henderson
Janus Henderson Adaptive Risk Managed U.S. Equity Fund
Funds by the Adviser, such as managing the execution of portfolio transactions and the selection of broker-dealers for those transactions. The Trustees considered the Adviser’s role as administrator to the Janus Henderson Funds, noting that the Adviser generally does not receive a fee for its services as administrator, but is reimbursed for its out-of-pocket costs. The Trustees considered the role of the Adviser in monitoring adherence to the Janus Henderson Funds’ investment restrictions, providing support services for the Trustees and Trustee committees, and overseeing communications with Janus Henderson Fund shareholders and the activities of other service providers, including monitoring compliance with various policies and procedures of the Janus Henderson Funds and with applicable securities laws and regulations.
In this regard, the independent fee consultant noted that the Adviser provides a number of different services for the Janus Henderson Funds and their shareholders, ranging from investment management services to various other servicing functions, and that, in its view, the Adviser is a capable provider of those services. The independent fee consultant also provided its belief that the Adviser has developed a number of institutional competitive advantages that should enable it to provide superior investment and service performance over the long term.
The Trustees concluded that the nature, extent, and quality of the services provided by the Adviser to each Janus Henderson Fund were appropriate and consistent with the terms of the respective advisory agreements, and that, taking into account steps taken to address those Janus Henderson Funds whose performance lagged that of their peers for certain periods, the Janus Henderson Funds were likely to benefit from the continued provision of those services. They also concluded that the Adviser had sufficient personnel, with the appropriate education and experience, to serve the Janus Henderson Funds effectively and had demonstrated its ability to attract well-qualified personnel.
The Trustees considered the performance results of each Janus Henderson Fund over various time periods. They noted that they considered Janus Henderson Fund performance data throughout the year, including periodic meetings with each Janus Henderson Fund’s portfolio manager(s), and also reviewed information comparing each Janus Henderson Fund’s performance with the performance of comparable fund peer groups identified by Broadridge Financial Solutions, Inc. (“Broadridge”), an independent data provider, and with the Janus Henderson Fund’s benchmark index. In this regard, the independent fee consultant found that the overall Janus Henderson Funds’ performance has been reasonable, noting that: (i) for the 36 months ended May 31, 2022, approximately 38% of the Janus Henderson Funds were in the top two quartiles of their Broadridge peer groups; (ii) for the 36 months ended September 30, 2022, approximately 45% of the Janus Henderson Funds were in the top two quartiles of performance as reported by Morningstar, and (iii) for the 12 months ended September 30, 2022, approximately 55% of the Janus Henderson Funds were in the top two quartiles of performance as reported by Morningstar.
The Trustees considered the performance of each Janus Henderson Fund, noting that performance may vary by share class, and noted the following with respect to the Funds:
Janus Henderson Adaptive Risk Managed U.S. Equity Fund
quartile for the 12 months ended May 31, 2022. The Trustees noted the reasons for the Fund’s underperformance, the steps the Adviser had taken or was taking to improve performance, and that the performance trend was improving.
Janus Henderson Adaptive Risk Managed U.S. Equity Fund
Janus Henderson Adaptive Risk Managed U.S. Equity Fund
U.S. Equity Funds
Janus Henderson Adaptive Risk Managed U.S. Equity Fund
31, 2022. The Trustees noted the reasons for the Fund’s underperformance, the steps the Adviser had taken or was taking to improve performance, and that the performance trend was improving.
In consideration of each Janus Henderson Fund’s performance, the Trustees concluded that, taking into account the factors relevant to performance, as well as other considerations, including steps taken to improve performance, as applicable, the Janus Henderson Fund’s performance warranted continuation of such Janus Henderson Fund’s investment advisory agreement.
The Trustees examined information regarding the fees and expenses of each Janus Henderson Fund in comparison to similar information for other comparable funds as provided by Broadridge, an independent data provider. They also reviewed an analysis of that information provided by their independent fee consultant. The independent fee consultant provided its belief that the management fees charged by the Adviser to each of the Janus Henderson Funds under the current investment advisory and administration agreements are reasonable in relation to the services provided by the Adviser. The independent fee consultant found: (1) the total expenses and management fees of the Janus Henderson Funds to be reasonable relative to other comparable mutual funds; (2) the total expenses, on average, were 6% under the average total expenses of the respective Broadridge peer group; and (3) the management fees for the Janus Henderson Funds, on average, were 5% under the average management fees for the respective Broadridge peer group. The Trustees also considered the total expenses for each share class of each Janus Henderson Fund compared to the average total expenses for its Broadridge Expense Group and to average total expenses for its Broadridge Expense Universe.
For Janus Henderson Funds with three or more years of performance history, the independent fee consultant also performed a systematic “focus list” analysis of expenses which assessed fund fees in the context of fund performance being delivered. Based on this analysis, the independent fee consultant found that the combination of service quality/performance and expenses on these individual Janus Henderson Funds was reasonable in light of performance trends, performance histories, changes in portfolio management, relative average net asset levels, and the existence of performance fees, breakpoints, and/or expense waivers on such Janus Henderson Funds.
The Trustees considered the methodology used by the Adviser in determining compensation payable to portfolio managers, the competitive environment for investment management talent, and the competitive market for mutual funds in different distribution channels.
The Trustees also reviewed management fees charged by the Adviser to comparable separate account clients and to comparable non-affiliated funds subadvised by the Adviser (for which the Adviser provides only or primarily portfolio management services). Although in most instances subadvisory and separate account fee rates for various investment strategies were lower than management fee rates for Janus Henderson Funds having a similar strategy, the Trustees considered that the Adviser noted that, under the terms of the management agreements with the Janus Henderson Funds, the Adviser performs significant additional services for the Janus Henderson Funds that it does not provide to those other clients, including administration services, oversight of the Janus Henderson Funds’ other service providers, Trustee support, regulatory compliance and numerous other services, and that, in serving the Janus Henderson Funds, the Adviser assumes many legal risks and other costs that it does not assume in servicing its other clients. Moreover, the Trustees noted that the independent fee consultant found that: (1) the management fees the Adviser charges to the Janus Henderson Funds are reasonable in relation to the management fees the Adviser charges to funds subadvised by the Adviser and to the fees the Adviser charges to its institutional separate account clients; (2) these subadvised and institutional separate accounts have different service and infrastructure needs and operate in markets very different from the retail fund market; (3) Janus Henderson mutual fund investors enjoy reasonable fees relative to the fees charged in these other markets; and (4) as part of its 2022 review, 9 of 11 Janus Henderson Funds have lower management fees than similar funds subadvised by the Adviser. The Trustees noted that for the two Janus Henderson Funds that did not, management fees for each were under the average of its 15(c) peer group.
The Trustees considered the fees for each Janus Henderson Fund for its fiscal year ended in 2021 and noted the following with regard to each Janus Henderson Fund’s total expenses, net of applicable fee waivers (the Fund’s “total expenses”) as reflected in the comparative information provided by Broadridge:
Janus Henderson Adaptive Risk Managed U.S. Equity Fund
Janus Henderson Adaptive Risk Managed U.S. Equity Fund
Trustees also noted that the Adviser has contractually agreed to limit the Fund’s expenses, although this limit did not apply because the Fund’s total expenses as shown were below the applicable fee limit.
Janus Henderson Adaptive Risk Managed U.S. Equity Fund
U.S. Equity Funds
The Trustees reviewed information on the overall profitability to the Adviser and its affiliates from their relationships with the Janus Henderson Funds, and considered profitability data of other publicly traded mutual fund advisers. The Trustees recognized that profitability comparisons among fund managers are difficult because of the variation in the type of comparative information that is publicly available, and the profitability of any fund manager is affected by numerous factors, including the organizational structure of the particular fund manager, differences in complex size, difference in product mix, difference in types of business (mutual fund, institutional and other), differences in the types of funds and other accounts it manages, possible other lines of business, the methodology for allocating expenses and the fund manager’s capital structure and cost of capital.
Janus Henderson Adaptive Risk Managed U.S. Equity Fund
Additionally, the Trustees considered the estimated profitability to the Adviser from the investment management services it provided to each Janus Henderson Fund. In their review, the Trustees considered whether the Adviser receive adequate incentives and resources to manage the Janus Henderson Funds effectively. In reviewing profitability, the Trustees noted that the estimated profitability for an individual Janus Henderson Fund is necessarily a product of the allocation methodology utilized by the Adviser to allocate its expenses as part of the estimated profitability calculation. In this regard, the Trustees noted that the independent fee consultant found as part of its 2022 review that (1) the expense allocation methodology and rationales utilized by the Adviser were reasonable and (2) no clear correlation exists between expense allocations and operating margins. The Trustees also considered that the estimated profitability for an individual Janus Henderson Fund was influenced by a number of factors, including not only the allocation methodology selected, but also the presence of fee waivers and expense caps, and whether the Janus Henderson Fund’s investment management agreement contained breakpoints or a performance fee component. The Trustees determined, after taking into account these factors, among others, that the Adviser’s estimated profitability with respect to each Janus Henderson Fund was not unreasonable in relation to the services provided, and that the variation in the range of such estimated profitability among the Janus Henderson Funds was not a material factor in the Board’s approval of the reasonableness of any Janus Henderson Fund’s investment management fees.
The Trustees concluded that the management fees payable by each Janus Henderson Fund to the Adviser were reasonable in relation to the nature, extent, and quality of the services provided, taking into account the fees charged by other advisers for managing comparable mutual funds with similar strategies, the fees the Adviser charges to other clients, and, as applicable, the impact of fund performance on management fees payable by the Janus Henderson Funds. The Trustees also concluded that each Janus Henderson Fund’s total expenses were reasonable, taking into account the size of the Janus Henderson Fund, the quality of services provided by the Adviser, the investment performance of the Janus Henderson Fund, and any expense limitations agreed to or provided by the Adviser.
The Trustees considered information about the potential for the Adviser to realize economies of scale as the assets of the Janus Henderson Funds increase. They noted that their independent fee consultant published a report to the Trustees in June 2022 which provided its research and analysis into economies of scale. They also noted that, although many Janus Henderson Funds pay advisory fees at a fixed base rate as a percentage of net assets, without any breakpoints or performance fees, their independent fee consultant concluded that 75% of these Janus Henderson Funds’ have contractual management fees (gross of waivers) below their Broadridge Expense Group averages. The Trustees also noted the following from the independent fee consultant’s report: (1) that 31% of Janus Henderson Funds had management fee breakpoints in place whereby investors pay lower management fees as fund AUM increases; (2) that 29% of Janus Henderson Funds have low flat-rate fees and performance fees where the Adviser is incentivized to invest in resources which drive Janus Henderson Fund performance; and (3) that 39% of Janus Henderson Funds have low flat-rate fees versus peers where investors pay low fixed fees when the Janus Henderson Fund is small/midsized and higher fees when the Janus Henderson Fund grows in assets. The Trustees also noted that the Janus Henderson Funds share directly in economies of scale through the significant investments made by the Adviser and its affiliates related to services provided to the Funds and the lower charges of third-party service providers that are based in part on the combined scale of all of the Janus Henderson Funds.
The Trustees also considered the independent fee consultant’s conclusion that, given the limitations of various analytical approaches to economies of scale and their conflicting results, it is difficult to analytically confirm or deny the existence of economies of scale in the Janus Henderson complex. In this regard, the independent consultant concluded that (1) to the extent there were economies of scale at the Adviser, the Adviser’s general strategy of setting fixed management fees below peers appeared to share any such economies with investors even on smaller Janus Henderson Funds which have not yet achieved those economies and (2) by setting lower fixed fees from the start on these Janus Henderson Funds, the Adviser appeared to be investing to increase the likelihood that these Janus Henderson Funds will grow to a level to achieve any economies of scale that may exist. Further, the independent fee consultant provided its belief that Janus Henderson Fund investors are well-served by the fee levels and performance fee structures in place on the Janus Henderson Funds in light of any economies of scale that may be present at the Adviser.
Based on all of the information reviewed, including the recent and past research and analysis conducted by the Trustees’ independent fee consultant, the Trustees concluded that the current fee structure of each Janus Henderson Fund was reasonable and that the current rates of fees do reflect a sharing between the Adviser and the Janus
Janus Henderson Adaptive Risk Managed U.S. Equity Fund
Henderson Fund of any economies of scale that may be present at the current asset level of the Janus Henderson Fund.
The Trustees also considered benefits that accrue to the Adviser and its affiliates from their relationships with the Janus Henderson Funds. They recognized that two affiliates of the Adviser separately serve the Janus Henderson Funds as transfer agent and distributor, respectively, and the transfer agent receives compensation directly from the non-money market Janus Henderson Funds for services provided, and that such compensation contributes to the overall profitability of the Adviser and its affiliates that results from their relationship with the Janus Henderson Funds. The Trustees also considered the Adviser’s past and proposed use of commissions paid by the Janus Henderson Funds on portfolio brokerage transactions to obtain proprietary and third-party research products and services benefiting the Janus Henderson Fund and/or other clients of the Adviser and/or the Adviser. The Trustees concluded that the Adviser’s use of these types of client commission arrangements to obtain proprietary and third-party research products and services was consistent with regulatory requirements and guidelines and was likely to benefit each Janus Henderson Fund. The Trustees also concluded that, other than the services provided by the Adviser and its affiliates pursuant to the agreements and the fees to be paid by each Janus Henderson Fund therefor, the Janus Henderson Funds and the Adviser may potentially benefit from their relationship with each other in other ways. They concluded that the Adviser and its affiliates share directly in economies of scale through the lower charges of third-party service providers that are based in part on the combined scale of the Janus Henderson Funds and other clients serviced by the Adviser and its affiliates. They also concluded that the Adviser benefits from the receipt of research products and services acquired through commissions paid on portfolio transactions of the Janus Henderson Funds and that the Janus Henderson Funds benefit from the Adviser’s receipt of those products and services as well as research products and services acquired through commissions paid by other clients of the Adviser. They further concluded that the success of any Janus Henderson Fund could attract other business to the Adviser or other Janus Henderson Funds, and that the success of the Adviser could enhance the Adviser’s ability to serve the Janus Henderson Funds.
Janus Henderson Adaptive Risk Managed U.S. Equity Fund
Rule 22e-4 under the Investment Company Act of 1940, as amended (the “Liquidity Rule”), requires open-end funds (but not money market funds) to adopt and implement a written liquidity risk management program (the “LRMP”) that is reasonably designed to assess and manage liquidity risk, which is the risk that a fund could not meet redemption requests without significant dilution of remaining investors’ interest in the fund. The Fund has implemented a LRMP, which incorporates the following elements: (i) assessment, management, and periodic review of liquidity risk; (ii) classification of portfolio holdings; (iii) the establishment and monitoring of a highly liquid investment minimum, as applicable; (iv) a 15% limitation on a Fund’s illiquid investments; (v) redemptions in-kind; and (vi) board oversight.
The Trustees of the Fund (the “Trustees”) have designated Janus Henderson Investors US LLC, the Fund’s investment adviser (the “Adviser”), as the Program Administrator for the LRMP responsible for administering the LRMP and carrying out the specific responsibilities of the LRMP. A working group comprised of various teams within the Adviser’s business is responsible for administering the LRMP and carrying out the specific responsibilities of different aspects of the LRMP (the “Liquidity Risk Working Group”). In assessing each Fund’s liquidity risk, the Liquidity Risk Working Group periodically considers, as relevant, factors including (i) the liquidity of a Fund’s portfolio investments during normal and reasonably foreseeable stressed conditions; (ii) whether a Fund’s investment strategy is appropriate for an open-end fund; (iii) the extent to which a Fund’s strategy involves a relatively concentrated portfolio or large positions in any issuer; (iv) a Fund’s use of borrowing for investment purposes; and (v) a Fund’s use of derivatives.
The Liquidity Rule requires the Trustees to review at least annually a written report provided by the Program Administrator that addresses the operation of the LRMP and assesses its adequacy and the effectiveness of its implementation, including, if applicable, the operation of the highly liquid investment minimum, and any material changes to the LRMP (the “Program Administrator Report”). At a meeting held on March 15, 2023, the Adviser provided the Program Administrator Report to the Trustees which covered the operation of the LRMP from January 1, 2022 through December 31, 2022 (the “Reporting Period”).
The Program Administrator Report discussed the operation and effectiveness of the LRMP during the Reporting Period. Among other things, the Program Administrator Report indicated that there were no material changes to the LRMP during the Reporting Period, although there were certain methodology adjustments implemented relating to a change in data provider. Additionally, the findings presented in the Program Administrator Report indicated that the LRMP operated adequately during the Reporting Period. These findings included that the Fund was able to meet redemptions during the normal course of business during the Reporting Period. The Program Administrator Report also stated that the Fund did not exceed the 15% limit on illiquid assets during the Reporting Period, that the Fund held primarily highly liquid assets, and was considered to be a primarily highly liquid fund during the Reporting Period. Also included among the Program Administrator Report’s findings was the determination that the Fund’s investment strategy remains appropriate for an open-end fund. In addition, the Adviser expressed its belief in the Program Administrator Report that the LRMP is reasonably designed and adequate to assess and manage the Fund’s liquidity risk, considering the Fund’s particular risks and circumstances, and includes policies and procedures reasonably designed to implement each required component of the Liquidity Rule.
There can be no assurance that the LRMP will achieve its objectives in the future. Please refer to your Fund’s prospectus for more information regarding the risks to which an investment in the Fund may be subject.
Janus Henderson Adaptive Risk Managed U.S. Equity Fund
The Management Commentary in this report includes valuable insight as well as statistical information to help you understand how your Fund’s performance and characteristics stack up against those of comparable indices.
If the Fund invests in foreign securities, this report may include information about country exposure. Country exposure is based primarily on the country of risk. A company may be allocated to a country based on other factors such as location of the company’s principal office, the location of the principal trading market for the company’s securities, or the country where a majority of the company’s revenues are derived.
Please keep in mind that the opinions expressed in the Management Commentary are just that: opinions. They are a reflection based on best judgment at the time this report was compiled, which was June 30, 2023. As the investing environment changes, so could opinions. These views are unique and are not necessarily shared by fellow employees or by Janus Henderson in general.
Performance overview graphs compare the performance of a hypothetical $10,000 investment in the Fund with one or more widely used market indices. When comparing the performance of the Fund with an index, keep in mind that market indices are not available for investment and do not reflect deduction of expenses.
Average annual total returns are quoted for a Fund with more than one year of performance history. Average annual total return is calculated by taking the growth or decline in value of an investment over a period of time, including reinvestment of dividends and distributions, then calculating the annual compounded percentage rate that would have produced the same result had the rate of growth been constant throughout the period. Average annual total return does not reflect the deduction of taxes that a shareholder would pay on Fund distributions or redemptions of Fund shares.
Cumulative total returns are quoted for a Fund with less than one year of performance history. Cumulative total return is the growth or decline in value of an investment over time, independent of the period of time involved. Cumulative total return does not reflect the deduction of taxes that a shareholder would pay on Fund distributions or redemptions of Fund shares.
Pursuant to federal securities rules, expense ratios shown in the performance chart reflect subsidized (if applicable) and unsubsidized ratios. The total annual fund operating expenses ratio is gross of any fee waivers, reflecting the Fund’s unsubsidized expense ratio. The net annual fund operating expenses ratio (if applicable) includes contractual waivers of the Adviser and reflects the Fund’s subsidized expense ratio. Ratios may be higher or lower than those shown in the “Financial Highlights” in this report.
Following the performance overview section is the Fund’s Schedule of Investments. This schedule reports the types of securities held in the Fund on the last day of the reporting period. Securities are usually listed by type (common stock, corporate bonds, U.S. Government obligations, etc.) and by industry classification (banking, communications, insurance, etc.). Holdings are subject to change without notice.
The value of each security is quoted as of the last day of the reporting period. The value of securities denominated in foreign currencies is converted into U.S. dollars.
If the Fund invests in foreign securities, it will also provide a summary of investments by country. This summary reports the Fund exposure to different countries by providing the percentage of securities invested in each country. The country of each security represents the country of risk. The Fund’s Schedule of Investments relies upon the industry group and country classifications published by Bloomberg and/or MSCI Inc.
Tables listing details of individual forward currency contracts, futures, written options, swaptions, and swaps follow the Fund’s Schedule of Investments (if applicable).
This statement is often referred to as the “balance sheet.” It lists the assets and liabilities of the Fund on the last day of the reporting period.
Janus Henderson Adaptive Risk Managed U.S. Equity Fund
The Fund’s assets are calculated by adding the value of the securities owned, the receivable for securities sold but not yet settled, the receivable for dividends declared but not yet received on securities owned, and the receivable for Fund shares sold to investors but not yet settled. The Fund’s liabilities include payables for securities purchased but not yet settled, Fund shares redeemed but not yet paid, and expenses owed but not yet paid. Additionally, there may be other assets and liabilities such as unrealized gain or loss on forward currency contracts.
The section entitled “Net Assets Consist of” breaks down the components of the Fund’s net assets. Because the Fund must distribute substantially all earnings, you will notice that a significant portion of net assets is shareholder capital.
The last section of this statement reports the net asset value (“NAV”) per share on the last day of the reporting period. The NAV is calculated by dividing the Fund’s net assets for each share class (assets minus liabilities) by the number of shares outstanding.
This statement details the Fund’s income, expenses, realized gains and losses on securities and currency transactions, and changes in unrealized appreciation or depreciation of Fund holdings.
The first section in this statement, entitled “Investment Income,” reports the dividends earned from securities and interest earned from interest-bearing securities in the Fund.
The next section reports the expenses incurred by the Fund, including the advisory fee paid to the investment adviser, transfer agent fees and expenses, and printing and postage for mailing statements, financial reports and prospectuses. Expense offsets and expense reimbursements, if any, are also shown.
The last section lists the amounts of realized gains or losses from investment and foreign currency transactions, and changes in unrealized appreciation or depreciation of investments and foreign currency-denominated assets and liabilities. The Fund will realize a gain (or loss) when it sells its position in a particular security. A change in unrealized gain (or loss) refers to the change in net appreciation or depreciation of the Fund during the reporting period. “Net Realized and Unrealized Gain/(Loss) on Investments” is affected both by changes in the market value of Fund holdings and by gains (or losses) realized during the reporting period.
These statements report the increase or decrease in the Fund’s net assets during the reporting period. Changes in the Fund’s net assets are attributable to investment operations, dividends and distributions to investors, and capital share transactions. This is important to investors because it shows exactly what caused the Fund’s net asset size to change during the period.
The first section summarizes the information from the Statement of Operations regarding changes in net assets due to the Fund’s investment operations. The Fund’s net assets may also change as a result of dividend and capital gains distributions to investors. If investors receive their dividends and/or distributions in cash, money is taken out of the Fund to pay the dividend and/or distribution. If investors reinvest their dividends and/or distributions, the Fund’s net assets will not be affected.
The reinvestment of dividends and distributions is included under “Capital Share Transactions.” “Capital Shares” refers to the money investors contribute to the Fund through purchases or withdrawals via redemptions. The Fund’s net assets will increase and decrease in value as investors purchase and redeem shares from the Fund.
This schedule provides a per-share breakdown of the components that affect the Fund’s NAV for current and past reporting periods as well as total return, asset size, ratios, and portfolio turnover rate.
Janus Henderson Adaptive Risk Managed U.S. Equity Fund
The Fund’s expenses may be reduced through expense offsets and expense reimbursements. The ratios shown reflect expenses before and after any such offsets and reimbursements.
The ratio of net investment income/(loss) summarizes the income earned less expenses, divided by the average net assets of the Fund during the reporting period. Do not confuse this ratio with the Fund’s yield. The net investment income ratio is not a true measure of the Fund’s yield because it does not take into account the dividends distributed to the Fund’s investors.
The next figure is the portfolio turnover rate, which measures the buying and selling activity in the Fund. Portfolio turnover is affected by market conditions, changes in the asset size of the Fund, fluctuating volume of shareholder purchase and redemption orders, the nature of the Fund’s investments, and the investment style and/or outlook of the portfolio manager(s) and/or investment personnel. A 100% rate implies that an amount equal to the value of the entire portfolio was replaced once during the fiscal year; a 50% rate means that an amount equal to the value of half the portfolio is traded in a year; and a 200% rate means that an amount equal to the value of the entire portfolio is traded every six months.
Janus Henderson Adaptive Risk Managed U.S. Equity Fund
For federal income tax purposes, the Fund designated the following for the year ended June 30, 2023:
Janus Henderson Adaptive Risk Managed U.S. Equity Fund
The following are the Trustees and officers of the Trust, together with a brief description of their principal occupations during the last five years (principal occupations for certain Trustees may include periods over five years). The Fund’s Statement of Additional Information includes additional information about the Trustees and officers and is available, without charge, by calling 1-877-335-2687.
Each Trustee has served in that capacity since he or she was originally elected or appointed. The Trustees do not serve a specified term of office. Each Trustee will hold office until the termination of the Trust or his or her earlier death, resignation, retirement, incapacity, or removal. Under the Fund’s Governance Procedures and Guidelines, the policy is for Trustees to retire no later than the end of the calendar year in which the Trustee turns 75. The Trustees review the Fund’s Governance Procedures and Guidelines from time to time and may make changes they deem appropriate. The Fund’s Nominating and Governance Committee will consider nominees for the position of Trustee recommended by shareholders. Shareholders may submit the name of a candidate for consideration by the Committee by submitting their recommendations to the Trust’s Secretary. Each Trustee is currently a Trustee of one other registered investment company advised by the Adviser: Janus Aspen Series. Collectively, these two registered investment companies consist of 49 series or funds referred to herein as the Fund Complex.
The Trust’s officers are elected annually by the Trustees for a one-year term. Certain officers also serve as officers of Janus Aspen Series. Certain officers of the Fund may also be officers and/or directors of the Adviser. Except as otherwise disclosed, Fund officers receive no compensation from the Fund, except for the Fund’s Chief Compliance Officer, as authorized by the Trustees.
Janus Henderson Adaptive Risk Managed U.S. Equity Fund
Janus Henderson Adaptive Risk Managed U.S. Equity Fund
Janus Henderson Adaptive Risk Managed U.S. Equity Fund
Janus Henderson Adaptive Risk Managed U.S. Equity Fund
Janus Henderson Adaptive Risk Managed U.S. Equity Fund
Janus Henderson Adaptive Risk Managed U.S. Equity Fund
Janus Henderson Adaptive Risk Managed U.S. Equity Fund
Janus Henderson Adaptive Risk Managed U.S. Equity Fund
Janus Henderson Adaptive Risk Managed U.S. Equity Fund
Janus Henderson Adaptive Risk Managed U.S. Equity Fund
| | | |
| | | |
| | | ANNUAL REPORT June 30, 2023 |
| | |
| | Janus Henderson Developed World Bond Fund |
| | |
| | Janus Investment Fund |
| |
| | | |
| | | HIGHLIGHTS · Portfolio management perspective · Investment strategy behind your fund · Fund performance, characteristics
and holdings |
Table of Contents
Janus Henderson Developed World Bond Fund
Janus Henderson Developed World Bond Fund (unaudited)
| | | | | | |
| | | | 
John Pattullo co-portfolio manager | 
Jenna Barnard co-portfolio manager |
| | | |
PERFORMANCE OVERVIEW
For the 12-month period ended June 30, 2023, the Janus Henderson Developed World Bond Fund Class I shares returned -3.98%. The Fund’s benchmark, the Bloomberg Global Aggregate Credit Index (USD Hedged), returned 1.36%.
INVESTMENT ENVIRONMENT
The period under review exemplifies the late-cycle phase of the business cycle, with stocks rising amid volatile financial markets, a tight labor market, and rising interest rates. Asset classes were getting pushed and pulled around, while cash on deposit was very competitive. This, of course, is how monetary policy is meant to work. Central banks reacted in a delayed and panicky way to the overstimulus of monetary and fiscal policy post-COVID. Excess fiscal stimulus was compounded by numerous supply-side bottlenecks that were further compounded by the war in Ukraine, leading to a significant inflationary problem.
The initial response to a so-called “transitory” inflation shock changed late in the summer of 2022 as the Federal Reserve (Fed) became increasingly concerned about runaway inflation and inflation expectations becoming unanchored. The remarkably robust employment markets confounded policymakers and market commentators alike. The European economies lagged as did the European Central Bank’s (ECB) policy response, which also became aggressive, albeit from a historically low starting point. Monetary policy famously has long and variable lags, and central banks generally have lacked the patience to wait for evidence that policy was having its desired effect. Inflation, unemployment, and default rates are lagging economic indicators and, so far, it mainly has been headline and core inflation that have peaked and started to fall reasonably fast – more so in America than in Europe.
PERFORMANCE DISCUSSION
Against the backdrop of this risk-on environment, the portfolio was poorly positioned, as we remained surprised at the resilience of markets compared to economic reality. Sovereign bonds, to which the portfolio has an overweight allocation, underperformed high-yield and investment-grade credit, where the portfolio maintains an underweight allocation – a wide and unusual divergence in performance at the late-cycle phase we were in.
In hindsight, we were too premature with this defensive positioning. We were surprised by the need for central banks to keep raising rates to stifle inflation and smothering employment markets, and rather counterintuitively, equities and risk performed well against this backdrop.
Portfolio activity was limited as we believed our positioning was appropriate for the deteriorating economic outlook. Broadly speaking, over the period we increased duration (a measure, in years, of a bond price’s sensitivity to changes in interest rates) to around 8.5+ years, with the bulk of duration held in the U.S., whose monetary policy we believe appears to be better progressed, and whose central bank appears to be much more coherent than its European counterparts. In addition, we materially thinned the portfolio’s high-yield and investment-grade credit books.
DERIVITAVES USAGE
The portfolio makes use of derivatives because they are generally the most efficient and liquid way to gain our desired exposures. The portfolio uses futures as a liquid and straightforward way of either reducing or increasing the portfolio’s duration. It also uses currency forwards in
Janus Henderson Developed World Bond Fund (unaudited)
an effort to hedge the portfolio’s foreign currency back to the U.S. dollar. In aggregate, these positions contributed to performance during the period.
Please see the Derivative Instruments section in the “Notes to Financial Statements” for a discussion of derivatives used by the portfolio.
OUTLOOK
Bonds are a reflexive asset class. The higher central banks hike interest rates, the bigger the potential cost of lost output and unemployment. Some commentators suggest that so far, we have seen only around one-third of the effect of the rate hikes. In our view, a recession seems inevitable, but recessions are non-linear and hard to model. It is possible Europe may be more vulnerable than the U.S. The next six months will be crucial to see how this plays out. We believe that, as of the time of writing, soon the employment markets may break and/or something else will break in the economy, and investors likely will focus less on inflation and more on the lack of growth.
Thank you for your continued investment in the Janus Henderson Developed World Bond Fund.
Important Notice – Tailored Shareholder Reports
Effective January 24, 2023, the Securities and Exchange Commission (the “SEC”) adopted rule and form amendments that require mutual funds and exchange-traded funds to provide shareholders with streamlined annual and semi-annual shareholder reports that highlight key information. Other information, including financial statements, that currently appears in shareholder reports will be made available online, delivered free of charge to shareholders upon request, and filed with the SEC. The first tailored shareholder report for the Fund will be for the reporting period ending June 30, 2024. Currently, management is evaluating the impact of the rule and form amendments on the content of the Fund’s current shareholder reports.
Janus Henderson Developed World Bond Fund (unaudited)
Fund At A Glance
June 30, 2023
| | | |
Fund Profile | | |
30-day SEC Yield* | Without
Reimbursement | With
Reimbursement |
Class A Shares NAV | 3.59% | 3.62% |
Class A Shares MOP | 3.42% | 3.44% |
Class C Shares** | 2.78% | 2.82% |
Class D Shares | 3.72% | 3.78% |
Class I Shares | 3.87% | 3.87% |
Class N Shares | 3.86% | 3.88% |
Class S Shares | 2.72% | 3.37% |
Class T Shares | 3.59% | 3.62% |
Weighted Average Maturity | 6.6 Years |
Average Effective Duration*** | 8.7 Years |
* Yield will fluctuate. | |
** Does not include the 1.00% contingent deferred sales charge. |
*** A theoretical measure of price volatility. |
| | |
Ratings† Summary - (% of Total Investments) | |
AAA | 7.2% |
AA | 10.0% |
A | 12.8% |
BBB | 24.6% |
BB | 4.3% |
B | 0.1% |
Not Rated | 34.9% |
Other | 6.1% |
† Credit ratings provided by Standard & Poor's (S&P), an independent credit rating agency. Credit ratings range from AAA (highest) to D (lowest) based on S&P's measures. Further information on S&P's rating methodology may be found at www.standardandpoors.com. Other rating agencies may rate the same securities differently. Ratings are relative and subjective and are not absolute standards of quality. Credit quality does not remove market risk and is subject to change. "Not Rated" securities are not rated by S&P, but may be rated by other rating agencies and do not necessarily indicate low quality. "Other" includes cash equivalents, equity securities, and certain derivative instruments. |
Significant Areas of Investment - (% of Net Assets)
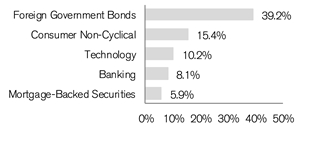
| | | | | | |
Asset Allocation - (% of Net Assets) | |
Corporate Bonds | | 48.8% | |
Foreign Government Bonds | | 39.2% | |
Mortgage-Backed Securities | | 5.9% | |
Investment Companies | | 4.8% | |
Asset-Backed/Commercial Mortgage-Backed Securities | | 0.3% | |
Investments Purchased with Cash Collateral from Securities Lending | | 0.2% | |
Other | | 0.8% |
| | | 100.0% |
Janus Henderson Developed World Bond Fund (unaudited)
Performance
| |
See important disclosures on the next page. |
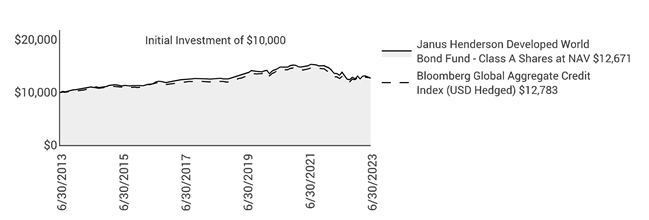
| | | | | | | | | | | |
| | | | | | | | | |
| | | | | | | | | |
Average Annual Total Return - for the periods ended June 30, 2023 | | | Prospectus Expense Ratios |
| | One
Year | Five
Year | Ten
Year | Since
Inception* | | | Total Annual Fund
Operating Expenses‡ | Net Annual Fund
Operating Expenses‡ |
Class A Shares at NAV | | -4.20% | 0.17% | 2.40% | 3.75% | | | 0.93% | 0.82% |
Class A Shares at MOP | | -8.76% | -0.81% | 1.90% | 3.49% | | | | |
Class C Shares at NAV | | -4.94% | -0.57% | 1.63% | 2.96% | | | 1.62% | 1.57% |
Class C Shares at CDSC | | -5.82% | -0.57% | 1.63% | 2.96% | | | | |
Class D Shares | | -4.21% | 0.32% | 2.48% | 3.79% | | | 0.70% | 0.69% |
Class I Shares | | -3.98% | 0.42% | 2.65% | 3.90% | | | 0.64% | 0.57% |
Class N Shares | | -4.11% | 0.45% | 2.61% | 3.86% | | | 0.55% | 0.55% |
Class S Shares | | -4.42% | 0.00% | 2.25% | 3.67% | | | 1.53% | 1.07% |
Class T Shares | | -4.22% | 0.22% | 2.43% | 3.76% | | | 0.79% | 0.79% |
Bloomberg Global Aggregate Credit Index (USD Hedged) | | 1.36% | 1.30% | 2.49% | 3.62% | | | | |
Morningstar Quartile - Class A Shares | | 4th | 3rd | 1st | 2nd | | | | |
Morningstar Ranking - based on total returns for World Bond - USD Hedged Funds | | 129/133 | 80/107 | 17/82 | 23/49 | | | | |
Returns quoted are past performance and do not guarantee future results; current performance may be lower or higher. Investment returns and principal value will vary; there may be a gain or loss when shares are sold. For the most recent month-end performance call 800.668.0434 (or 800.525.3713 if you hold shares directly with Janus Henderson) or visit janushenderson.com/performance (or janushenderson.com/allfunds if you hold shares directly with Janus Henderson).
Maximum Offering Price (MOP) returns include the maximum sales charge of 4.75%. Net Asset Value (NAV) returns exclude this charge, which would have reduced returns.
CDSC returns include a 1% contingent deferred sales charge (CDSC) on Shares redeemed within 12 months of purchase. Net Asset Value (NAV) returns exclude this charge, which would have reduced returns.
For certain periods, the Fund’s performance may reflect the effects of expense waivers.
Performance may be affected by risks that include those associated with foreign and emerging markets, fixed income securities, high-yield and high-risk securities, undervalued, overlooked and smaller capitalization companies, real estate related securities including Real Estate Investment Trusts (REITs),
Janus Henderson Developed World Bond Fund (unaudited)
Performance
Environmental, Social and Governance (ESG) factors, non-diversification, portfolio turnover, derivatives, short sales, initial public offerings (IPOs) and potential conflicts of interest. Each product has different risks. Please see the prospectus for more information about risks, holdings and other details.
Returns include reinvestment of all dividends and distributions and do not reflect the deduction of taxes that a shareholder would pay on Fund distributions or redemptions of Fund shares. The returns do not include adjustments in accordance with generally accepted accounting principles required at the period end for financial reporting purposes.
Returns of the Fund shown prior to June 5, 2017, are those for Henderson Strategic Income Fund (the “Predecessor Fund”), which merged into the Fund after the close of business on June 2, 2017. The Predecessor Fund was advised by Henderson Global Investors (North America) Inc. and subadvised by Henderson Investment Management Limited. Class A Shares, Class C Shares, Class I Shares, and Class R6 Shares of the Predecessor Fund were reorganized into Class A Shares, Class C Shares, Class I Shares, and Class N Shares, respectively, of the Fund. In connection with this reorganization, certain shareholders of the Predecessor Fund who held shares directly with the Predecessor Fund and not through an intermediary had the Class A Shares, Class C Shares, Class I Shares, and Class N Shares of the Fund received in the reorganization automatically exchanged for Class D Shares of the Fund following the reorganization. Class A Shares and Class C Shares of the Predecessor Fund commenced operations with the Predecessor Fund’s inception on September 30, 2003. Class I Shares and Class R6 Shares of the Predecessor Fund commenced operations on April 29, 2011 and November 30, 2015, respectively. Class D Shares, Class S Shares, and Class T Shares commenced operations on June 5, 2017.
Performance of Class A Shares shown for periods prior to June 5, 2017, reflects the performance of Class A Shares of the Predecessor Fund, calculated using the fees and expenses of Class A Shares of the Predecessor Fund, in effect during the periods shown, net of any applicable fee and expense limitations or waivers.
Performance of Class C Shares shown for periods prior to June 5, 2017, reflects the performance of Class C Shares of the Predecessor Fund, calculated using the fees and expenses of Class C Shares of the Predecessor Fund, in effect during the periods shown, net of any applicable fee and expense limitations or waivers.
Performance of Class D Shares shown for periods prior to June 5, 2017, reflects the performance of Class A Shares of the Predecessor Fund, calculated using the fees and expenses of Class A Shares of the Predecessor Fund (without sales charges), net of any applicable fee and expense limitations or waivers.
Performance of Class I Shares shown for periods prior to June 5, 2017, reflects the performance of Class I Shares of the Predecessor Fund, calculated using the fees and expenses of Class I Shares of the Predecessor Fund, in effect during the periods shown, net of any applicable fee and expense limitations or waivers, except that for periods prior to April 29, 2011, performance for Class I Shares reflects the performance of Class A Shares of the Predecessor Fund, calculated using the fees and expenses of Class A Shares of the Predecessor Fund (without sales charges), net of any applicable fee and expense limitations or waivers.
Performance of Class N Shares shown for periods prior to June 5, 2017, reflects the performance of Class R6 Shares of the Predecessor Fund, calculated using the fees and expenses of Class R6 Shares of the Predecessor Fund, in effect during the periods shown, net of any applicable fee and expense limitations or waivers, except that for periods prior to November 30, 2015, performance for Class N Shares reflects the performance of Class A Shares of the Predecessor Fund, calculated using the fees and expenses of Class A Shares of the Predecessor Fund (without sales charges), net of any applicable fee and expense limitations or waivers.
Performance of Class S Shares shown for periods prior to June 5, 2017, reflects the performance of Class A Shares of the Predecessor Fund, calculated using the fees and expenses of Class A Shares of the Predecessor Fund (without sales charges), net of any applicable fee and expense limitations or waivers.
Performance of Class T Shares shown for periods prior to June 5, 2017, reflects the performance of Class A Shares of the Predecessor Fund, calculated using the fees and expenses of Class A Shares of the Predecessor Fund (without sales charges), net of any applicable fee and expense limitations or waivers.
If each share class of the Fund had been available during periods prior to its commencement, the performance shown may have been different. The performance shown for periods following the Fund’s commencement of each share class reflects the fees and expenses of each respective share class, net of any applicable fee and expense limitations or waivers. Please refer to the Fund’s prospectuses for further details concerning historical performance.
Ranking is for the share class shown only; other classes may have different performance characteristics. When an expense waiver is in effect, it may have a material effect on the total return, and therefore the ranking for the period.
© 2023 Morningstar, Inc. All Rights Reserved.
There is no assurance that the investment process will consistently lead to successful investing.
See Notes to Schedule of Investments and Other Information for index definitions.
Index performance does not reflect the expenses of managing a portfolio as an index is unmanaged and not available for direct investment.
See “Useful Information About Your Fund Report.”
*The Predecessor Fund’s inception date – September 30, 2003
‡ As stated in the prospectus. Net expense ratios reflect the expense waiver, if any, contractually agreed to for at least a one-year period commencing on October 28, 2022. This contractual waiver may be terminated or modified only at the discretion of the Board of Trustees. See Financial Highlights for actual expense ratios during the reporting period.
Janus Henderson Developed World Bond Fund (unaudited)
Expense Examples
As a shareholder of the Fund, you incur two types of costs: (1) transaction costs, such as sales charges (loads) on purchase payments (applicable to Class A Shares only); and (2) ongoing costs, including management fees; 12b-1 distribution and shareholder servicing fees; transfer agent fees and expenses payable pursuant to the Transfer Agency Agreement; and other Fund expenses. This example is intended to help you understand your ongoing costs (in dollars) of investing in the Fund and to compare these costs with the ongoing costs of investing in other mutual funds. To do so, compare this 5% hypothetical example with the 5% hypothetical examples that appear in the shareholder reports of the other funds. The example is based upon an investment of $1,000 invested at the beginning of the period and held for the six-months indicated, unless noted otherwise in the table and footnotes below.
Actual Expenses
The information in the table under the heading “Actual” provides information about actual account values and actual expenses. You may use the information in these columns, together with the amount you invested, to estimate the expenses that you paid over the period. Simply divide your account value by $1,000 (for example, an $8,600 account value divided by $1,000 = 8.6), then multiply the result by the number in the appropriate column for your share class under the heading entitled “Expenses Paid During Period” to estimate the expenses you paid on your account during the period.
Hypothetical Example for Comparison Purposes
The information in the table under the heading “Hypothetical (5% return before expenses)” provides information about hypothetical account values and hypothetical expenses based upon the Fund’s actual expense ratio and an assumed rate of return of 5% per year before expenses, which is not the Fund’s actual return. The hypothetical account values and expenses may not be used to estimate the actual ending account balance or expenses you paid for the period. You may use this information to compare the ongoing costs of investing in the Fund and other funds. To do so, compare this 5% hypothetical example with the 5% hypothetical examples that appear in the shareholder reports of the other funds. Additionally, for an analysis of the fees associated with an investment in any share class or other similar funds, please visit www.finra.org/fundanalyzer.
Please note that the expenses shown in the table are meant to highlight your ongoing costs only and do not reflect any transaction costs. These fees are fully described in the Fund’s prospectuses. Therefore, the hypothetical examples are useful in comparing ongoing costs only, and will not help you determine the relative total costs of owning different funds. In addition, if these transaction costs were included, your costs would have been higher.
| | | | | | | | | | | |
| | | | | | | | |
| | | Actual | | Hypothetical
(5% return before expenses) | |
| Beginning
Account
Value
(1/1/23) | Ending
Account
Value
(6/30/23) | Expenses
Paid During
Period
(1/1/23 - 6/30/23)† | | Beginning
Account
Value
(1/1/23) | Ending
Account
Value
(6/30/23) | Expenses
Paid During
Period
(1/1/23 - 6/30/23)† | Net Annualized
Expense Ratio
(1/1/23 - 6/30/23) |
Class A Shares | $1,000.00 | $1,009.70 | $3.84 | | $1,000.00 | $1,020.98 | $3.86 | 0.77% |
Class C Shares | $1,000.00 | $1,004.70 | $7.61 | | $1,000.00 | $1,017.21 | $7.65 | 1.53% |
Class D Shares | $1,000.00 | $1,008.70 | $3.44 | | $1,000.00 | $1,021.37 | $3.46 | 0.69% |
Class I Shares | $1,000.00 | $1,010.70 | $2.94 | | $1,000.00 | $1,021.87 | $2.96 | 0.59% |
Class N Shares | $1,000.00 | $1,010.50 | $2.94 | | $1,000.00 | $1,021.87 | $2.96 | 0.59% |
Class S Shares | $1,000.00 | $1,008.30 | $5.18 | | $1,000.00 | $1,019.64 | $5.21 | 1.04% |
Class T Shares | $1,000.00 | $1,009.40 | $4.09 | | $1,000.00 | $1,020.73 | $4.11 | 0.82% |
† | Expenses Paid During Period are equal to the Net Annualized Expense Ratio multiplied by the average account value over the period, multiplied by 181/365 (to reflect the one-half year period). Expenses in the examples include the effect of applicable fee waivers and/or expense reimbursements, if any. Had such waivers and/or reimbursements not been in effect, your expenses would have been higher. Please refer to the Notes to Financial Statements or the Fund’s prospectuses for more information regarding waivers and/or reimbursements. |
Janus Henderson Developed World Bond Fund
Schedule of Investments
June 30, 2023
| | | | | | | | |
Shares or
Principal Amounts | | | Value | |
Asset-Backed/Commercial Mortgage-Backed Securities– 0.3% | | | |
| | Tesco Property Finance 3 PLC, 5.7440%, 4/13/40((cost $6,659,908) | | 3,670,407 | GBP | | $4,313,306 | |
Corporate Bonds– 48.8% | | | |
Banking – 8.1% | | | |
| | Bank of America Corp, 4.2000%, 8/26/24 | | $1,860,000 | | | 1,825,121 | |
| | Barclays Bank PLC, ICE LIBOR USD 3 Month + 1.5500%, 6.2780%‡,µ | | 3,800,000 | | | 3,679,504 | |
| | Cooperatieve Rabobank UA, 3.7500%, 7/21/26 | | 4,022,000 | | | 3,755,010 | |
| | Cooperatieve Rabobank UA/Australia, 4.2500%, 5/12/26 | | 2,000,000 | AUD | | 1,296,764 | |
| | Goldman Sachs Group Inc, 4.0000%, 5/2/24 | | 5,270,000 | AUD | | 3,465,845 | |
| | JPMorgan Chase & Co, SOFR + 1.3200%, 4.0800%, 4/26/26‡ | | 3,710,000 | | | 3,605,247 | |
| | Lloyds Banking Group PLC, 4.0000%, 3/7/25 | | 4,400,000 | AUD | | 2,823,515 | |
| | Lloyds Banking Group PLC, | | | | | | |
| | US Treasury Yield Curve Rate 1 Year + 1.7500%, 4.7160%, 8/11/26‡,# | | 7,500,000 | | | 7,286,836 | |
| | Lloyds Banking Group PLC, 4.2500%, 11/22/27 | | 2,190,000 | AUD | | 1,347,868 | |
| | Lloyds Banking Group PLC, | | | | | | |
| | UK Govt Bonds 5 Year Note Generic Bid Yield + 3.1000%, 6.6250%, 6/2/33‡ | | 3,730,000 | GBP | | 4,483,516 | |
| | Lloyds Banking Group PLC, | | | | | | |
| | UK Govt Bonds 5 Year Note Generic Bid Yield + 2.4000%, 2.7070%, 12/3/35‡ | | 8,508,000 | GBP | | 7,806,298 | |
| | Lloyds Banking Group PLC, | | | | | | |
| | US Treasury Yield Curve Rate 5 Year + 1.5000%, 3.3690%, 12/14/46‡ | | 5,510,000 | | | 3,640,864 | |
| | Morgan Stanley, SOFR + 1.7300%, 5.1230%, 2/1/29‡ | | 1,564,000 | | | 1,542,475 | |
| | Morgan Stanley, SONIA Interest Rate Benchmark + 2.2520%, 11/18/33‡ | | 4,700,000 | GBP | | 5,710,578 | |
| | Nationwide Building Society, 4.0000%, 9/14/26 (144A) | | 5,203,000 | | | 4,777,602 | |
| | Nationwide Building Society, | | | | | | |
| | ICE SWAP Rate GBP SONIA 1 Year + 2.2130%, 6.1780%, 12/7/27‡ | | 6,670,000 | GBP | | 8,195,885 | |
| | Nationwide Building Society, 10.2500%‡,µ | | 8,500 | GBP | | 1,229,530 | |
| | Natwest Group PLC, 6.6250%, 6/22/26 | | 4,902,000 | GBP | | 6,162,436 | |
| | Natwest Group PLC, | | | | | | |
| | US Treasury Yield Curve Rate 1 Year + 2.8500%, 7.4720%, 11/10/26‡ | | 13,530,000 | | | 13,837,903 | |
| | Natwest Group PLC, | | | | | | |
| | US Treasury Yield Curve Rate 1 Year + 1.3500%, 5.8470%, 3/2/27‡ | | 2,650,000 | | | 2,620,972 | |
| | Santander UK Group Holdings PLC, SOFR + 2.7490%, 6.8330%, 11/21/26‡ | | 11,438,000 | | | 11,464,004 | |
| | Santander UK Group Holdings PLC, GBP SWAP 1YR + 2.8660%, 7.0980%, 11/16/27‡ | | 4,660,000 | GBP | | 5,801,967 | |
| | UBS Group AG, | | | | | | |
| | US Treasury Yield Curve Rate 1 Year + 1.6000%, 4.4900%, 8/5/25 (144A)‡ | | 14,975,000 | | | 14,636,135 | |
| | UBS Group AG, 5.9590%, 1/12/34 (144A) | | 3,370,000 | | | 3,352,306 | |
| | | 124,348,181 | |
Brokerage – 0.9% | | | |
| | Intercontinental Exchange Inc, 1.8500%, 9/15/32 | | 7,797,000 | | | 5,976,176 | |
| | LSEGA Financing PLC, 1.3750%, 4/6/26 (144A) | | 5,000,000 | | | 4,457,840 | |
| | Nasdaq Inc, 5.3500%, 6/28/28 | | 1,240,000 | | | 1,241,789 | |
| | Nasdaq Inc, 4.5000%, 2/15/32 | | 1,100,000 | EUR | | 1,213,827 | |
| | Nasdaq Inc, 5.5500%, 2/15/34 | | 854,000 | | | 857,359 | |
| | | 13,746,991 | |
Capital Goods – 0.6% | | | |
| | Ball Corp, 4.8750%, 3/15/26 | | 1,730,000 | | | 1,682,792 | |
| | Ball Corp, 2.8750%, 8/15/30 | | 9,266,000 | | | 7,691,960 | |
| | | 9,374,752 | |
Communications – 5.8% | | | |
| | American Tower Corp, 3.6000%, 1/15/28 | | 7,580,000 | | | 6,978,823 | |
| | AT&T Inc, 4.5000%, 5/15/35 | | 3,370,000 | | | 3,098,049 | |
| | Comcast Corp, 0%, 9/14/26 | | 1,420,000 | EUR | | 1,368,791 | |
| | Crown Castle International Corp, 3.6500%, 9/1/27 | | 1,883,000 | | | 1,759,971 | |
| | Crown Castle International Corp, 3.8000%, 2/15/28 | | 1,990,000 | | | 1,854,778 | |
| | Crown Castle International Corp, 3.1000%, 11/15/29 | | 2,801,000 | | | 2,438,810 | |
| | Crown Castle International Corp, 2.2500%, 1/15/31 | | 4,508,000 | | | 3,674,202 | |
| | Deutsche Telekom International Finance BV, 1.5000%, 4/3/28 | | 2,800,000 | EUR | | 2,768,716 | |
| | Netflix Inc, 5.8750%, 11/15/28 | | 6,100,000 | | | 6,300,092 | |
| | Netflix Inc, 3.8750%, 11/15/29 | | 1,320,000 | EUR | | 1,401,820 | |
| | Netflix Inc, 3.6250%, 6/15/30 | | 2,680,000 | EUR | | 2,778,953 | |
| | |
See Notes to Schedule of Investments and Other Information and Notes to Financial Statements. |
| |
Janus Investment Fund | 7 |
Janus Henderson Developed World Bond Fund
Schedule of Investments
June 30, 2023
| | | | | | | | |
Shares or
Principal Amounts | | | Value | |
Corporate Bonds– (continued) | | | |
Communications– (continued) | | | |
| | Netflix Inc, 4.8750%, 6/15/30 (144A)# | | $962,000 | | | $946,698 | |
| | Orange SA, 1.1250%, 7/15/24 | | 2,600,000 | EUR | | 2,754,041 | |
| | Orange SA, 1.0000%, 5/12/25 | | 4,100,000 | EUR | | 4,242,794 | |
| | Orange SA, 1.3750%, 1/16/30 | | 5,500,000 | EUR | | 5,212,383 | |
| | Sky Ltd, 2.5000%, 9/15/26 | | 4,025,000 | EUR | | 4,205,629 | |
| | T-Mobile USA Inc, 3.5000%, 4/15/25 | | 9,500,000 | | | 9,133,646 | |
| | T-Mobile USA Inc, 2.2500%, 2/15/26 | | 7,500,000 | | | 6,891,415 | |
| | T-Mobile USA Inc, 4.7500%, 2/1/28 | | 933,000 | | | 906,383 | |
| | T-Mobile USA Inc, 2.6250%, 2/15/29 | | 1,794,000 | | | 1,558,139 | |
| | T-Mobile USA Inc, 3.8750%, 4/15/30 | | 9,017,000 | | | 8,307,079 | |
| | Verizon Communications Inc, 4.5000%, 8/17/27 | | 5,970,000 | AUD | | 3,848,003 | |
| | Verizon Communications Inc, 2.3500%, 3/23/28 | | 3,420,000 | AUD | | 1,972,132 | |
| | Verizon Communications Inc, 2.6500%, 5/6/30 | | 3,250,000 | AUD | | 1,768,121 | |
| | Virgin Media Secured Finance PLC, 4.1250%, 8/15/30 (144A) | | 2,500,000 | GBP | | 2,444,669 | |
| | | 88,614,137 | |
Consumer Cyclical – 5.0% | | | |
| | Booking Holdings Inc, 4.0000%, 11/15/26 | | 10,358,000 | EUR | | 11,321,572 | |
| | Booking Holdings Inc, 3.5500%, 3/15/28 | | 1,116,000 | | | 1,048,456 | |
| | Compass Group PLC, 2.0000%, 7/3/29 | | 5,100,000 | GBP | | 5,280,866 | |
| | Experian Finance PLC, 4.2500%, 2/1/29 (144A) | | 6,600,000 | | | 6,252,815 | |
| | Experian Finance PLC, 2.7500%, 3/8/30 (144A) | | 7,341,000 | | | 6,261,542 | |
| | Experian Finance PLC, 3.2500%, 4/7/32 | | 830,000 | GBP | | 876,423 | |
| | Levi Strauss & Co, 3.5000%, 3/1/31 (144A)# | | 8,000,000 | | | 6,620,000 | |
| | Service Corp International/US, 4.6250%, 12/15/27 | | 6,882,000 | | | 6,520,695 | |
| | Service Corp International/US, 5.1250%, 6/1/29 | | 1,994,000 | | | 1,878,787 | |
| | Service Corp International/US, 3.3750%, 8/15/30 | | 9,803,000 | | | 8,198,249 | |
| | Service Corp International/US, 4.0000%, 5/15/31 | | 6,752,000 | | | 5,779,915 | |
| | Sodexo SA, 1.7500%, 6/26/28 | | 6,400,000 | GBP | | 6,621,582 | |
| | Walmart Inc, 4.8750%, 9/21/29 | | 8,500,000 | EUR | | 10,009,987 | |
| | | 76,670,889 | |
Consumer Non-Cyclical – 15.4% | | | |
| | Abbott Ireland Financing DAC, 1.5000%, 9/27/26 | | 2,650,000 | EUR | | 2,702,282 | |
| | AbbVie Inc, 4.5000%, 5/14/35 | | 5,050,000 | | | 4,797,983 | |
| | Amgen Inc, 5.2500%, 3/2/30 | | 1,754,000 | | | 1,757,500 | |
| | Amgen Inc, 5.2500%, 3/2/33 | | 5,041,000 | | | 5,047,430 | |
| | Anheuser-Busch Cos LLC / Anheuser-Busch InBev Worldwide Inc, | | | | | | |
| | 4.7000%, 2/1/36 | | 3,370,000 | | | 3,277,711 | |
| | Anheuser-Busch InBev SA/NV, 2.7000%, 3/31/26 | | 13,389,000 | EUR | | 14,231,044 | |
| | Anheuser-Busch InBev Worldwide Inc, 4.1000%, 9/6/27 | | 2,840,000 | AUD | | 1,817,581 | |
| | Anheuser-Busch InBev Worldwide Inc, 3.5000%, 6/1/30 | | 3,680,000 | | | 3,421,981 | |
| | Avantor Funding Inc, 3.8750%, 7/15/28 | | 2,365,000 | EUR | | 2,359,555 | |
| | Avantor Funding Inc, 3.8750%, 7/15/28 (144A) | | 4,590,000 | EUR | | 4,579,433 | |
| | Bacardi Ltd, 4.4500%, 5/15/25 (144A) | | 3,873,000 | | | 3,769,104 | |
| | Bacardi Ltd, 4.7000%, 5/15/28 (144A) | | 4,806,000 | | | 4,646,895 | |
| | Coca-Cola Co, 3.2500%, 6/11/24 | | 4,990,000 | AUD | | 3,269,104 | |
| | Coca-Cola Co, 2.1250%, 9/6/29 | | 5,330,000 | | | 4,672,908 | |
| | Coca-Cola Co, 0.3750%, 3/15/33 | | 10,000,000 | EUR | | 8,113,081 | |
| | Diageo Capital PLC, 1.3750%, 9/29/25 | | 5,000,000 | | | 4,599,130 | |
| | Diageo Capital PLC, 2.0000%, 4/29/30 | | 1,709,000 | | | 1,440,192 | |
| | Diageo Finance PLC, 0.5000%, 6/19/24 | | 7,335,000 | EUR | | 7,737,160 | |
| | Diageo Finance PLC, 1.7500%, 10/12/26 | | 6,600,000 | GBP | | 7,364,398 | |
| | Elanco Animal Health Inc, 6.6500%, 8/28/28# | | 1,640,000 | | | 1,591,243 | |
| | GE HealthCare Technologies Inc, 5.5500%, 11/15/24 | | 18,844,000 | | | 18,736,542 | |
| | HCA Inc, 5.3750%, 2/1/25 | | 9,202,000 | | | 9,121,322 | |
| | HCA Inc, 5.2500%, 6/15/26 | | 1,585,000 | | | 1,567,676 | |
| | HCA Inc, 4.1250%, 6/15/29 | | 4,675,000 | | | 4,326,192 | |
| | HCA Inc, 3.6250%, 3/15/32 (144A) | | 2,847,000 | | | 2,471,220 | |
| | Heineken NV, 3.5000%, 1/29/28 (144A) | | 2,320,000 | | | 2,207,015 | |
| | IQVIA Inc, 5.0000%, 5/15/27 (144A) | | 5,207,000 | | | 5,008,429 | |
| | |
See Notes to Schedule of Investments and Other Information and Notes to Financial Statements. |
| |
8 | JUNE 30, 2023 |
Janus Henderson Developed World Bond Fund
Schedule of Investments
June 30, 2023
| | | | | | | | |
Shares or
Principal Amounts | | | Value | |
Corporate Bonds– (continued) | | | |
Consumer Non-Cyclical��� (continued) | | | |
| | Keurig Dr Pepper Inc, 3.4000%, 11/15/25# | | $4,762,000 | | | $4,554,253 | |
| | Keurig Dr Pepper Inc, 3.2000%, 5/1/30# | | 929,000 | | | 833,009 | |
| | Kimberly-Clark Corp, 0.6250%, 9/7/24 | | 7,353,000 | EUR | | 7,715,471 | |
| | Kimberly-Clark Corp, 3.1000%, 3/26/30 | | 1,737,000 | | | 1,584,754 | |
| | Nestle Finance International Ltd, 1.5000%, 4/1/30 | | 10,000,000 | EUR | | 9,749,588 | |
| | Nestle Holdings Inc, 3.9000%, 9/24/38 (144A) | | 13,745,000 | | | 12,320,651 | |
| | Novartis Finance SA, 0%, 9/23/28 | | 10,000,000 | EUR | | 9,177,205 | |
| | Novo Nordisk Finance Netherlands BV, 0.7500%, 3/31/25 | | 7,786,000 | EUR | | 8,046,601 | |
| | PepsiCo Inc, 2.6250%, 7/29/29 | | 2,695,000 | | | 2,427,656 | |
| | PepsiCo Inc, 1.1250%, 3/18/31 | | 5,000,000 | EUR | | 4,600,659 | |
| | PepsiCo Inc, 0.7500%, 10/14/33 | | 13,434,000 | EUR | | 11,252,424 | |
| | Tesco Corporate Treasury Services, 2.7500%, 4/27/30 | | 3,200,000 | GBP | | 3,274,253 | |
| | Tesco PLC, 6.1500%, 11/15/37 (144A) | | 2,001,000 | | | 1,984,152 | |
| | Unilever PLC, 1.5000%, 7/22/26 | | 2,350,000 | GBP | | 2,639,205 | |
| | Zoetis Inc, 5.4000%, 11/14/25 | | 15,256,000 | | | 15,302,689 | |
| | Zoetis Inc, 3.9000%, 8/20/28 | | 2,450,000 | | | 2,350,674 | |
| | Zoetis Inc, 2.0000%, 5/15/30# | | 4,547,000 | | | 3,794,262 | |
| | | 236,241,617 | |
Government Sponsored – 1.2% | | | |
| | Electricite de France SA, 5.5000%, 1/25/35 | | 1,900,000 | GBP | | 2,151,119 | |
| | Kreditanstalt fuer Wiederaufbau, 3.2000%, 9/11/26 | | 11,843,000 | AUD | | 7,572,767 | |
| | Kreditanstalt fuer Wiederaufbau, 3.2000%, 3/15/28 | | 13,660,000 | AUD | | 8,580,110 | |
| | | 18,303,996 | |
Insurance – 1.6% | | | |
| | Anthem Inc, 2.2500%, 5/15/30 | | 2,905,000 | | | 2,433,429 | |
| | Aviva PLC, | | | | | | |
| | UK Govt Bonds 5 Year Note Generic Bid Yield + 4.7000%, 4.0000%, 6/3/55‡ | | 2,320,000 | GBP | | 2,199,200 | |
| | Berkshire Hathaway Inc, 0%, 3/12/25 | | 4,430,000 | EUR | | 4,522,737 | |
| | BUPA Finance PLC, 4.1250%, 6/14/35 | | 1,826,000 | GBP | | 1,716,899 | |
| | BUPA Finance PLC, | | | | | | |
| | UK Govt Bonds 5 Year Note Generic Bid Yield + 3.1700%, 4.0000%‡,µ | | 4,705,000 | GBP | | 3,524,882 | |
| | Centene Corp, 3.0000%, 10/15/30 | | 3,876,000 | | | 3,229,859 | |
| | Centene Corp, 2.6250%, 8/1/31 | | 7,558,000 | | | 6,022,819 | |
| | Scottish Widows Ltd, 7.0000%, 6/16/43 | | 612,000 | GBP | | 745,634 | |
| | | 24,395,459 | |
Technology – 10.2% | | | |
| | Alphabet Inc, 2.0500%, 8/15/50 | | 5,947,000 | | | 3,720,252 | |
| | Apple Inc, 2.5130%, 8/19/24 | | 5,080,000 | CAD | | 3,718,571 | |
| | ASML Holding NV, 1.3750%, 7/7/26 | | 5,846,000 | EUR | | 5,968,774 | |
| | CrowdStrike Holdings Inc, 3.0000%, 2/15/29 | | 5,781,000 | | | 4,985,164 | |
| | DELL International LLC / EMC Corp, 5.8500%, 7/15/25 | | 9,055,000 | | | 9,088,066 | |
| | DELL International LLC / EMC Corp, 6.0200%, 6/15/26 | | 2,000,000 | | | 2,032,818 | |
| | Equinix Inc, 3.2000%, 11/18/29 | | 10,199,000 | | | 8,953,942 | |
| | Experian Finance PLC, 2.1250%, 9/27/24 | | 3,500,000 | GBP | | 4,225,075 | |
| | Fiserv Inc, 5.4500%, 3/2/28 | | 2,556,000 | | | 2,568,480 | |
| | Fiserv Inc, 3.5000%, 7/1/29 | | 1,095,000 | | | 999,445 | |
| | Fiserv Inc, 1.6250%, 7/1/30 | | 1,770,000 | EUR | | 1,641,206 | |
| | Gartner Inc, 3.7500%, 10/1/30 (144A) | | 4,237,000 | | | 3,690,080 | |
| | Microsoft Corp, 2.5250%, 6/1/50 | | 25,197,000 | | | 17,429,912 | |
| | MSCI Inc, 4.0000%, 11/15/29 (144A) | | 2,026,000 | | | 1,833,571 | |
| | MSCI Inc, 3.6250%, 9/1/30 (144A) | | 2,483,000 | | | 2,141,311 | |
| | NVIDIA Corp, 0.5840%, 6/14/24 | | 5,500,000 | | | 5,254,142 | |
| | NVIDIA Corp, 3.2000%, 9/16/26 | | 1,627,000 | | | 1,566,328 | |
| | Oracle Corp, 5.8000%, 11/10/25 | | 11,858,000 | | | 11,990,060 | |
| | Oracle Corp, 2.6500%, 7/15/26 | | 3,467,000 | | | 3,205,159 | |
| | Oracle Corp, 2.9500%, 4/1/30 | | 6,440,000 | | | 5,621,255 | |
| | Oracle Corp, 4.9000%, 2/6/33 | | 2,473,000 | | | 2,400,553 | |
| | Oracle Corp, 3.6000%, 4/1/50 | | 9,685,000 | | | 6,920,504 | |
| | Oracle Corp, 5.5500%, 2/6/53 | | 3,270,000 | | | 3,166,482 | |
| | |
See Notes to Schedule of Investments and Other Information and Notes to Financial Statements. |
| |
Janus Investment Fund | 9 |
Janus Henderson Developed World Bond Fund
Schedule of Investments
June 30, 2023
| | | | | | | | |
Shares or
Principal Amounts | | | Value | |
Corporate Bonds– (continued) | | | |
Technology– (continued) | | | |
| | Sage Group PLC/The, 2.8750%, 2/8/34 | | 6,875,000 | GBP | | $6,557,112 | |
| | Salesforce.com Inc, 3.7000%, 4/11/28 | | $2,252,000 | | | 2,171,706 | |
| | Salesforce.com Inc, 1.9500%, 7/15/31 | | 6,764,000 | | | 5,581,530 | |
| | SAP SE, 1.7500%, 2/22/27 | | 1,127,000 | EUR | | 1,189,983 | |
| | VMware Inc, 1.0000%, 8/15/24 | | 5,602,000 | | | 5,303,826 | |
| | VMware Inc, 4.5000%, 5/15/25 | | 4,100,000 | | | 4,015,476 | |
| | VMware Inc, 1.4000%, 8/15/26 | | 2,245,000 | | | 1,982,429 | |
| | VMware Inc, 3.9000%, 8/21/27 | | 4,698,000 | | | 4,453,824 | |
| | VMware Inc, 4.7000%, 5/15/30 | | 7,315,000 | | | 6,981,037 | |
| | Workday Inc, 3.8000%, 4/1/32 | | 4,950,000 | | | 4,456,348 | |
| | | 155,814,421 | |
Total Corporate Bonds (cost $810,764,601) | | 747,510,443 | |
Foreign Government Bonds– 39.2% | | | |
| | Australia Government Bond, 0.2500%, 11/21/25 | | 55,500,000 | AUD | | 33,758,519 | |
| | Australia Government Bond, 0.5000%, 9/21/26 | | 32,870,000 | AUD | | 19,584,060 | |
| | Australia Government Bond, 3.2500%, 4/21/29 | | 97,000,000 | AUD | | 62,199,328 | |
| | Australia Government Bond, 1.0000%, 11/21/31 | | 30,019,000 | AUD | | 15,726,514 | |
| | Australia Government Bond, 1.7500%, 11/21/32 | | 20,001,000 | AUD | | 10,963,952 | |
| | Australia Government Bond, 2.7500%, 5/21/41 | | 46,294,000 | AUD | | 24,854,251 | |
| | Australia Government Bond, 1.7500%, 6/21/51 | | 12,500,000 | AUD | | 4,840,238 | |
| | Canadian Government Bond, 1.5000%, 6/1/31 | | 25,399,000 | CAD | | 16,729,477 | |
| | Federal Republic of Germany Bond, 0%, 10/9/26 | | 41,217,258 | EUR | | 41,062,644 | |
| | Federal Republic of Germany Bond, 2.3000%, 2/15/33 | | 24,679,343 | EUR | | 26,700,706 | |
| | Federal Republic of Germany Bond, 0%, 8/15/50 | | 13,555,087 | EUR | | 7,934,246 | |
| | Japan Government Five Year Bond, 0.0050%, 6/20/27 | | 2,500,000,000 | JPY | | 17,344,920 | |
| | Kingdom of Sweden Government Bond, 2.5000%, 5/12/25 | | 47,205,000 | SEK | | 4,303,507 | |
| | Kingdom of Sweden Government Bond, 1.0000%, 11/12/26 | | 351,425,000 | SEK | | 30,466,720 | |
| | Kingdom of Sweden Government Bond, 0.1250%, 5/12/31 | | 400,000,000 | SEK | | 30,589,732 | |
| | Kingdom of the Netherlands Government Bond, 0.7500%, 7/15/28 (144A) | | 47,494,771 | EUR | | 46,931,473 | |
| | Kingdom of the Netherlands Government Bond, 0.5000%, 7/15/32 (144A) | | 29,367,912 | EUR | | 26,472,681 | |
| | New Zealand Government Bond, 0.5000%, 5/15/26 | | 60,000,000 | NZD | | 32,599,709 | |
| | New Zealand Government Bond, 3.0000%, 4/20/29 | | 20,000,000 | NZD | | 11,290,008 | |
| | New Zealand Government Bond, 1.5000%, 5/15/31 | | 33,000,000 | NZD | | 16,160,989 | |
| | Swiss Confederation Government Bond, 0.5000%, 5/27/30 | | 47,000,000 | CHF | | 50,886,797 | |
| | United Kingdom Gilt, 1.2500%, 7/22/27 | | 30,183,392 | GBP | | 33,283,022 | |
| | United Kingdom Gilt, 4.5000%, 9/7/34 | | 27,430,366 | GBP | | 35,105,770 | |
Total Foreign Government Bonds (cost $674,288,700) | | 599,789,263 | |
Mortgage-Backed Securities– 5.9% | | | |
Fannie Mae Pool: | | | |
| | 3.5000%, 5/1/49 | | 6,610,323 | | | 6,086,268 | |
| | 3.0000%, 9/1/50 | | 8,766,364 | | | 7,752,245 | |
| | 3.5000%, 2/1/51 | | 1,900,099 | | | 1,747,672 | |
| | 3.0000%, 1/1/52 | | 2,404,970 | | | 2,137,466 | |
| | 3.0000%, 4/1/52 | | 22,429,606 | | | 19,904,333 | |
| | 3.0000%, 6/1/52 | | 10,365,454 | | | 9,153,944 | |
| | 3.5000%, 8/1/52 | | 3,825,617 | | | 3,519,007 | |
| | 3.5000%, 9/1/52 | | 7,391,075 | | | 6,783,914 | |
| | 3.5000%, 9/1/52 | | 2,300,634 | | | 2,106,114 | |
| | 4.5000%, 9/1/52 | | 2,220,421 | | | 2,157,063 | |
| | | 61,348,026 | |
Freddie Mac Pool: | | | |
| | 3.0000%, 11/1/51 | | 10,555,385 | | | 9,329,348 | |
| | 3.5000%, 4/1/52 | | 4,407,687 | | | 4,061,031 | |
| | 3.0000%, 5/1/52 | | 11,172,273 | | | 9,928,855 | |
| | 3.0000%, 5/1/52 | | 4,057,186 | | | 3,610,650 | |
| | 4.0000%, 8/1/52 | | 1,980,289 | | | 1,887,533 | |
| | | 28,817,417 | |
Total Mortgage-Backed Securities (cost $92,603,058) | | 90,165,443 | |
| | |
See Notes to Schedule of Investments and Other Information and Notes to Financial Statements. |
| |
10 | JUNE 30, 2023 |
Janus Henderson Developed World Bond Fund
Schedule of Investments
June 30, 2023
| | | | | | | | |
Shares or
Principal Amounts | | | Value | |
Investment Companies– 4.8% | | | |
Money Markets – 4.8% | | | |
| | Janus Henderson Cash Liquidity Fund LLC, 5.1900%ºº,£((cost $74,364,454) | | 74,350,643 | | | $74,365,513 | |
Investments Purchased with Cash Collateral from Securities Lending– 0.2% | | | |
Investment Companies – 0.2% | | | |
| | Janus Henderson Cash Collateral Fund LLC, 4.9971%ºº,£ | | 2,763,468 | | | 2,763,468 | |
Time Deposits – 0% | | | |
| | Royal Bank of Canada, 5.0600%, 7/3/23 | | $696,927 | | | 696,927 | |
Total Investments Purchased with Cash Collateral from Securities Lending (cost $3,460,395) | | 3,460,395 | |
Total Investments (total cost $1,662,141,116) – 99.2% | | 1,519,604,363 | |
Cash, Receivables and Other Assets, net of Liabilities – 0.8% | | 12,108,399 | |
Net Assets – 100% | | $1,531,712,762 | |
| | | | | | |
Summary of Investments by Country - (Long Positions) (unaudited) |
| |
| | | | | % of | |
| | | | | Investment | |
Country | | Value | | Securities | |
United States | | $631,858,397 | | 41.6 | % |
United Kingdom | | 235,647,874 | | 15.5 | |
Australia | | 171,926,862 | | 11.3 | |
Germany | | 95,809,172 | | 6.3 | |
Netherlands | | 86,631,717 | | 5.7 | |
Switzerland | | 78,052,443 | | 5.1 | |
Sweden | | 65,359,959 | | 4.3 | |
New Zealand | | 60,050,706 | | 4.0 | |
Belgium | | 22,748,317 | | 1.5 | |
France | | 20,981,919 | | 1.4 | |
Japan | | 17,344,920 | | 1.1 | |
Canada | | 16,729,477 | | 1.1 | |
Bermuda | | 8,415,999 | | 0.6 | |
Denmark | | 8,046,601 | | 0.5 | |
| | | | | | |
| | | | | | |
Total | | $1,519,604,363 | | 100.0 | % |
| | |
See Notes to Schedule of Investments and Other Information and Notes to Financial Statements. |
| |
Janus Investment Fund | 11 |
Janus Henderson Developed World Bond Fund
Schedule of Investments
June 30, 2023
Schedules of Affiliated Investments – (% of Net Assets)
| | | | | | | | | | | |
| | Dividend Income | Realized Gain/(Loss) | Change in Unrealized Appreciation/ Depreciation | Value at 6/30/23 |
Investment Companies - 4.8% |
Money Markets - 4.8% | |
| | Janus Henderson Cash Liquidity Fund LLC, 5.1900%ºº | $ | 2,610,898 | $ | 6,720 | $ | (3,203) | $ | 74,365,513 |
Investments Purchased with Cash Collateral from Securities Lending - 0.2% |
Investment Companies - 0.2% | |
| | Janus Henderson Cash Collateral Fund LLC, 4.9971%ºº | | 12,050∆ | | - | | - | | 2,763,468 |
Total Affiliated Investments - 5.0% | $ | 2,622,948 | $ | 6,720 | $ | (3,203) | $ | 77,128,981 |
| | | | | | | | | | | |
| | Value at 6/30/22 | Purchases | Sales Proceeds | Value at 6/30/23 |
Investment Companies - 4.8% |
Money Markets - 4.8% | |
| | Janus Henderson Cash Liquidity Fund LLC, 5.1900%ºº | | 64,594,507 | | 1,416,325,925 | | (1,406,558,436) | | 74,365,513 |
Investments Purchased with Cash Collateral from Securities Lending - 0.2% |
Investment Companies - 0.2% | |
| | Janus Henderson Cash Collateral Fund LLC, 4.9971%ºº | | 4,308,311 | | 59,725,906 | | (61,270,749) | | 2,763,468 |
| | |
See Notes to Schedule of Investments and Other Information and Notes to Financial Statements. |
| |
12 | JUNE 30, 2023 |
Janus Henderson Developed World Bond Fund
Schedule of Investments
June 30, 2023
| | | | | | | |
Schedule of Forward Foreign Currency Exchange Contracts | | | | | | |
| | | | | | | | | |
Counterparty/ Foreign Currency | Settlement Date | Foreign Currency Amount (Sold)/ Purchased | | USD Currency Amount (Sold)/ Purchased | | Market Value and Unrealized Appreciation/ (Depreciation) | |
BNP Paribas: | | | | | | | | |
Australian Dollar | 7/26/23 | 3,958,130 | $ | (2,627,842) | $ | 10,304 | | |
Australian Dollar | 7/26/23 | 6,893,389 | | (4,640,179) | | (45,643) | | |
Australian Dollar | 7/26/23 | (99,127,992) | | 66,747,261 | | 677,128 | | |
Australian Dollar | 7/26/23 | (4,300,437) | | 2,848,554 | | (17,743) | | |
Australian Dollar | 8/29/23 | 14,167,321 | | (9,297,187) | | 154,500 | | |
Australian Dollar | 8/29/23 | 1,350,246 | | (924,119) | | (23,306) | | |
Australian Dollar | 8/29/23 | (7,935,469) | | 5,357,493 | | 63,367 | | |
Australian Dollar | 8/29/23 | (105,206,272) | | 68,945,997 | | (1,242,070) | | |
Australian Dollar | 9/27/23 | 1,023,603 | | (677,338) | | 6,027 | | |
Australian Dollar | 9/27/23 | 873,667 | | (592,180) | | (8,914) | | |
Australian Dollar | 9/27/23 | (144,161,004) | | 98,379,031 | | 2,136,138 | | |
British Pound | 7/26/23 | 9,048,061 | | (11,258,644) | | 232,759 | | |
British Pound | 7/26/23 | (66,708,597) | | 83,019,946 | | (1,702,665) | | |
British Pound | 8/29/23 | 1,243,176 | | (1,548,084) | | 30,757 | | |
British Pound | 8/29/23 | 2,865,830 | | (3,670,741) | | (31,121) | | |
British Pound | 8/29/23 | (5,324,049) | | 6,789,359 | | 27,786 | | |
British Pound | 8/29/23 | (67,045,543) | | 82,957,201 | | (2,191,026) | | |
British Pound | 9/27/23 | 1,065,823 | | (1,356,755) | | (3,275) | | |
British Pound | 9/27/23 | (9,292,594) | | 11,907,180 | | 106,579 | | |
British Pound | 9/27/23 | (252,850) | | 318,942 | | (2,150) | | |
Canadian Dollar | 7/26/23 | (11,508,451) | | 8,556,821 | | (134,921) | | |
Canadian Dollar | 8/29/23 | 190,493 | | (141,968) | | 1,984 | | |
Canadian Dollar | 8/29/23 | (11,508,451) | | 8,481,523 | | (215,240) | | |
Canadian Dollar | 9/27/23 | (11,508,451) | | 8,718,985 | | 18,369 | | |
Euro | 7/26/23 | 18,238,183 | | (19,693,574) | | 231,663 | | |
Euro | 7/26/23 | 200,122 | | (221,584) | | (2,949) | | |
Euro | 7/26/23 | (109,835,975) | | 120,989,781 | | 993,842 | | |
Euro | 7/26/23 | (108,981) | | 117,965 | | (1,096) | | |
Euro | 8/29/23 | 88,676 | | (95,735) | | 1,308 | | |
Euro | 8/29/23 | 86,978 | | (95,371) | | (186) | | |
Euro | 8/29/23 | (172,077) | | 188,488 | | 176 | | |
Euro | 8/29/23 | (91,655,004) | | 98,805,838 | | (1,496,901) | | |
Euro | 9/27/23 | 54,682 | | (59,911) | | 11 | | |
| | |
See Notes to Schedule of Investments and Other Information and Notes to Financial Statements. |
| |
Janus Investment Fund | 13 |
Janus Henderson Developed World Bond Fund
Schedule of Investments
June 30, 2023
| | | | | | | | | |
Counterparty/ Foreign Currency | Settlement Date | Foreign Currency Amount (Sold)/ Purchased | | USD Currency Amount (Sold)/ Purchased | | Market Value and Unrealized Appreciation/ (Depreciation) | | |
Euro | 9/27/23 | 50,074 | $ | (55,008) | $ | (135) | | |
Euro | 9/27/23 | (91,506,652) | | 100,630,865 | | 355,330 | | |
Euro | 9/27/23 | (1,146,468) | | 1,253,418 | | (2,913) | | |
Japanese Yen | 7/26/23 | (833,315,753) | | 6,276,881 | | 477,859 | | |
Japanese Yen | 8/29/23 | (833,315,753) | | 6,063,723 | | 233,504 | | |
Japanese Yen | 9/27/23 | (833,315,753) | | 5,966,708 | | 111,333 | | |
New Zealand Dollar | 7/26/23 | 300,000 | | (184,015) | | 12 | | |
New Zealand Dollar | 7/26/23 | 851,250 | | (528,856) | | (6,681) | | |
New Zealand Dollar | 7/26/23 | (47,147,078) | | 29,022,089 | | 101,050 | | |
New Zealand Dollar | 8/29/23 | (47,162,881) | | 28,691,922 | | (233,979) | | |
New Zealand Dollar | 9/27/23 | (2,362,507) | | 1,462,555 | | 13,741 | | |
Swedish Krona | 7/26/23 | 1,680,125 | | (162,721) | | (6,696) | | |
Swedish Krona | 7/26/23 | (352,105,808) | | 34,173,872 | | 1,475,438 | | |
Swedish Krona | 8/29/23 | (198,804,346) | | 18,572,050 | | 77,239 | | |
Swedish Krona | 9/27/23 | (174,652,117) | | 16,370,500 | | 100,426 | | |
Swiss Franc | 7/26/23 | (24,406,004) | | 27,506,937 | | 156,686 | | |
Swiss Franc | 8/29/23 | 152,750 | | (170,937) | | 858 | | |
Swiss Franc | 8/29/23 | (1,031,756) | | 1,151,168 | | (9,230) | | |
Swiss Franc | 9/27/23 | (24,406,004) | | 27,509,170 | | (20,252) | | |
Total | | | | | $ | 397,082 | |
Schedule of Futures
| | | | | | | | | | | | | | |
Description | | Number of Contracts | | Expiration Date | | Notional Amount | | Value and Unrealized Appreciation/(Depreciation) | |
Futures Long: | | | | | | | | | |
10 Year US Treasury Note | | 2,919 | | 9/29/23 | $ | 327,703,359 | $ | (6,213,532) | | |
10-Year Australian Bond | | 1,895 | | 9/15/23 | | 146,617,734 | | (809,119) | | |
5 Year US Treasury Note | | 2,487 | | 10/4/23 | | 266,342,156 | | (5,245,643) | | |
Long Gilt | | 389 | | 9/29/23 | | 47,073,381 | | (620,016) | | |
Ultra 10-Year Treasury Note | | 974 | | 9/29/23 | | 115,358,125 | | (1,521,875) | | |
Total | | | | | | | $ | (14,410,185) | |
| | | | | | | | | | |
Schedule of Centrally Cleared Credit Default Swaps - Buy Protection |
Reference Asset | Maturity Date | Notional Amount | | | Premiums Paid/(Received) | | Unrealized Appreciation/ (Depreciation) | | Value |
ITRAXX.FINSEN.S39.V1, Fixed Rate of 1.00%, Paid Quarterly | 6/20/28 | (29,500,000) | EUR | $ | 217,526 | $ | (441,260) | $ | (223,734) |
| | |
See Notes to Schedule of Investments and Other Information and Notes to Financial Statements. |
| |
14 | JUNE 30, 2023 |
Janus Henderson Developed World Bond Fund
Schedule of Investments
June 30, 2023
| | | | | | | | | | |
Schedule of OTC Credit Default Swaps - Buy Protection |
Counterparty/ Reference Asset | Maturity Date | Notional Amount | | | Premiums Paid/(Received) | | Unrealized Appreciation/ (Depreciation) | | Swap Contracts, at Value Asset/(Liability) |
Goldman Sachs & Co LLC:
| | | | | | | | | | |
BACR 4.375 11Sep24, Fixed Rate 1.00%, Paid Quarterly | 12/20/27 | (5,600,000) | EUR | $ | 455,024 | $ | (230,272) | $ | 224,752 |
JPMorgan Chase Bank, National Association:
| | | | | | | | | | |
ITRAXX.FINSEN.S38.V1, Fixed Rate 1.00%, Paid Quarterly | 12/20/27 | (44,200,000) | EUR | | 657,573 | | (1,092,262) | | (434,689) |
Total | | | | $ | 1,112,597 | $ | (1,322,534) | $ | (209,937) |
The following table, grouped by derivative type, provides information about the fair value and location of derivatives within the Statement of Assets and Liabilities as of June 30, 2023.
| | | | | | | | | | | | |
Fair Value of Derivative Instruments (not accounted for as hedging instruments) as of June 30, 2023 |
| | | | | | | | | | | |
| | | | | Credit
Contracts | | Currency
Contracts | | Interest Rate
Contracts | | Total |
Asset Derivatives: | | | | | | | | | |
Forward foreign currency exchange contracts | | | $ - | | $7,796,174 | | $ - | | $ 7,796,174 |
Swaps - OTC, at value | | | 224,752 | | - | | - | | $ 224,752 |
| | | | | | | | | | |
Total Asset Derivatives | | | $224,752 | | $7,796,174 | | $ - | | $ 8,020,926 |
Liability Derivatives: | | | | | | | | | |
Forward foreign currency exchange contracts | | | $ - | | $7,399,092 | | $ - | | $ 7,399,092 |
Swaps - OTC, at value | | | 434,689 | | - | | - | | $ 434,689 |
*Futures contracts | | | - | | - | | 14,410,185 | | $14,410,185 |
*Swaps - centrally cleared | | | 441,260 | | - | | - | | $ 441,260 |
| | | | | | | | | | |
Total Liability Derivatives | | | $875,949 | | $7,399,092 | | $14,410,185 | | $22,685,226 |
*The fair value presented includes net cumulative unrealized appreciation (depreciation) on futures contracts and centrally cleared swaps. In the Statement of Assets and Liabilities, only current day's variation margin is reported in receivables or payables and the net cumulative unrealized appreciation (depreciation) is included in total distributable earnings (loss). |
| | |
See Notes to Schedule of Investments and Other Information and Notes to Financial Statements. |
| |
Janus Investment Fund | 15 |
Janus Henderson Developed World Bond Fund
Schedule of Investments
June 30, 2023
The following tables provide information about the effect of derivatives and hedging activities on the Fund’s Statement of Operations for the year ended June 30, 2023.
| | | | | | | | | | | |
The effect of Derivative Instruments (not accounted for as hedging instruments) on the Statement of Operations for the year ended June 30, 2023 |
| | | | | | | | | | |
Amount of Realized Gain/(Loss) Recognized on Derivatives |
Derivative | | Credit
Contracts | | Currency
Contracts | | Interest Rate
Contracts | | Total |
Futures contracts | | $ - | | $ - | | $(69,787,635) | | $(69,787,635) |
Forward foreign currency exchange contracts | | - | | 21,797,367 | | - | | $ 21,797,367 |
Swap contracts | | (31,094) | | - | | - | | $ (31,094) |
| | | | | | | | | | | |
Total | | $ (31,094) | | $21,797,367 | | $(69,787,635) | | $(48,021,362) |
| | | | | | | | | | | |
| | | | | | | | | | | |
Amount of Change in Unrealized Appreciation/Depreciation Recognized on Derivatives |
Derivative | | Credit
Contracts | | Currency
Contracts | | Interest Rate
Contracts | | Total |
Futures contracts | | $ - | | $ - | | $ (3,236,433) | | $ (3,236,433) |
Forward foreign currency exchange contracts | | - | | (2,162,104) | | - | | $ (2,162,104) |
Swap contracts | | (1,763,794) | | - | | - | | $ (1,763,794) |
| | | | | | | | | | | |
Total | | $(1,763,794) | | $ (2,162,104) | | $ (3,236,433) | | $ (7,162,331) |
Please see the "Net Realized Gain/(Loss) on Investments" and "Change in Unrealized Net Appreciation/Depreciation" sections of the Fund’s Statement of Operations.
| | |
Average Ending Monthly Value of Derivative Instruments During the Year Ended June 30, 2023 |
| |
| |
Credit default swaps: | |
Average notional amount - buy protection | $ 33,630,769 |
Forward foreign currency exchange contracts: | |
Average amounts purchased - in USD | 332,253,643 |
Average amounts sold - in USD | 1,423,364,872 |
Futures contracts: | |
Average notional amount of contracts - long | 905,752,228 |
| | |
| |
| |
| |
| | |
See Notes to Schedule of Investments and Other Information and Notes to Financial Statements. |
| |
16 | JUNE 30, 2023 |
Janus Henderson Developed World Bond Fund
Schedule of Investments
June 30, 2023
| | | | | | | | | | |
Offsetting of Financial Assets and Derivative Assets |
| |
| | | Gross Amounts | | | | | | |
| | | of Recognized | | Offsetting Asset | | Collateral | | |
Counterparty | | Assets | | or Liability(a) | | Pledged(b) | | Net Amount |
| | | | | | | | | |
BNP Paribas | $ | 7,796,174 | $ | (7,399,092) | $ | — | $ | 397,082 |
Goldman Sachs & Co LLC | | 224,752 | | — | | — | | 224,752 |
JPMorgan Chase Bank, National Association | | 3,339,181 | | — | | (3,339,181) | | — |
| | | | | | | | | |
Total | $ | 11,360,107 | $ | (7,399,092) | $ | (3,339,181) | $ | 621,834 |
Offsetting of Financial Liabilities and Derivative Liabilities |
| |
| | | Gross Amounts | | | | | | |
| | | of Recognized | | Offsetting Asset | | Collateral | | |
Counterparty | | Liabilities | | or Liability(a) | | Pledged(b) | | Net Amount |
| | | | | | | | | |
BNP Paribas | $ | 7,399,092 | $ | (7,399,092) | $ | — | $ | — |
JPMorgan Chase Bank, National Association | | 434,689 | | — | | — | | 434,689 |
| | | | | | | | | |
Total | $ | 7,833,781 | $ | (7,399,092) | $ | — | $ | 434,689 |
(a) | Represents the amount of assets or liabilities that could be offset with the same counterparty under master netting or similar agreements that management elects not to offset on the Statement of Assets and Liabilities. |
(b) | Collateral pledged is limited to the net outstanding amount due to/from an individual counterparty. The actual collateral amounts pledged may exceed these amounts and may fluctuate in value. |
| | |
See Notes to Schedule of Investments and Other Information and Notes to Financial Statements. |
| |
Janus Investment Fund | 17 |
Janus Henderson Developed World Bond Fund
Notes to Schedule of Investments and Other Information
| | |
Bloomberg Global Aggregate Credit Index (USD Hedged) | Bloomberg Global Aggregate Credit Index (USD Hedged) measures the credit sector of the global investment grade fixed-rate bond market, including corporate, government and agency securities. |
| | |
ICE | Intercontinental Exchange |
LIBOR | London Interbank Offered Rate |
LLC | Limited Liability Company |
PLC | Public Limited Company |
SOFR | Secured Overnight Financing Rate |
SONIA | Sterling Overnight Interbank Average Rate |
| | |
144A | Securities sold under Rule 144A of the Securities Act of 1933, as amended, are subject to legal and/or contractual restrictions on resale and may not be publicly sold without registration under the 1933 Act. Unless otherwise noted, these securities have been determined to be liquid under guidelines established by the Board of Trustees. The total value of 144A securities as of the year ended June 30, 2023 is $167,805,622, which represents 11.0% of net assets. |
| | |
‡ | Variable or floating rate security. Rate shown is the current rate as of June 30, 2023. Certain variable rate securities are not based on a published reference rate and spread; they are determined by the issuer or agent and current market conditions. Reference rate is as of reset date and may vary by security, which may not indicate a reference rate and/or spread in their description. |
| | |
ºº | Rate shown is the 7-day yield as of June 30, 2023. |
| | |
# | Loaned security; a portion of the security is on loan at June 30, 2023. |
| | |
µ | Perpetual security. Perpetual securities have no stated maturity date, but they may be called/redeemed by the issuer. The date indicated, if any, represents the next call date. |
| | |
£ | The Fund may invest in certain securities that are considered affiliated companies. As defined by the Investment Company Act of 1940, as amended, an affiliated company is one in which the Fund owns 5% or more of the outstanding voting securities, or a company which is under common ownership or control. |
| | |
∆ | Net of income paid to the securities lending agent and rebates paid to the borrowing counterparties. |
Janus Henderson Developed World Bond Fund
Notes to Schedule of Investments and Other Information
| | | | | | | | | | | | | | |
The following is a summary of the inputs that were used to value the Fund’s investments in securities and other financial instruments as of June 30, 2023. See Notes to Financial Statements for more information. |
| |
Valuation Inputs Summary |
| | | | | | | |
| | | | | Level 2 - | | Level 3 - |
| | | Level 1 - | | Other Significant | | Significant |
| | | Quoted Prices | | Observable Inputs | | Unobservable Inputs |
| | | | | | | |
Assets | | | | | | |
Investments In Securities: | | | | | | |
Asset-Backed/Commercial Mortgage-Backed Securities | $ | - | $ | 4,313,306 | $ | - |
Corporate Bonds | | - | | 747,510,443 | | - |
Foreign Government Bonds | | - | | 599,789,263 | | - |
Mortgage-Backed Securities | | - | | 90,165,443 | | - |
Investment Companies | | - | | 74,365,513 | | - |
Investments Purchased with Cash Collateral from Securities Lending | | - | | 3,460,395 | | - |
Total Investments in Securities | $ | - | $ | 1,519,604,363 | $ | - |
Other Financial Instruments(a): | | | | | | |
Forward Foreign Currency Exchange Contracts | | - | | 7,796,174 | | - |
Total Assets | $ | - | $ | 1,527,400,537 | $ | - |
Liabilities | | | | | | |
Other Financial Instruments(a): | | | | | | |
OTC Swaps | $ | - | $ | 1,322,534 | $ | - |
Forward Foreign Currency Exchange Contracts | | - | | 7,399,092 | | - |
Futures Contracts | | 14,410,185 | | - | | - |
Centrally Cleared Swaps | | - | | 441,260 | | - |
Total Liabilities | $ | 14,410,185 | $ | 9,162,886 | $ | - |
| | | | | | | |
(a) | Other financial instruments may include forward foreign currency exchange contracts, futures, written options, written swaptions, and swap contracts. Forward foreign currency exchange contracts, futures contracts, and swap contracts are reported at their unrealized appreciation/(depreciation) at measurement date, which represents the change in the contract's value from trade date. Written options and written swaptions are reported at their market value at measurement date. |
Janus Henderson Developed World Bond Fund
Statement of Assets and Liabilities
June 30, 2023
| |
See footnotes at the end of the Statement. |
| | | | | | | |
| | | | | | |
Assets: | | | | |
| Unaffiliated investments, at value (cost $1,585,013,194)(1) | | $ | 1,442,475,382 | |
| Affiliated investments, at value (cost $77,127,922) | | | 77,128,981 | |
| Deposits with brokers for centrally cleared derivatives | | | 523,380 | |
| Deposits with brokers for futures | | | 20,061,655 | |
| Deposits with brokers for OTC derivatives | | | 280,000 | |
| Forward foreign currency exchange contracts | | | 7,796,174 | |
| Cash denominated in foreign currency (cost $12,953) | | | 12,953 | |
| OTC swap contracts, at value (premium paid $455,024) | | | 224,752 | |
| Variation margin receivable on futures contracts | | | 1,115,047 | |
| Trustees' deferred compensation | | | 39,216 | |
| Receivables: | | | | |
| | Interest | | | 11,199,489 | |
| | Fund shares sold | | | 2,154,703 | |
| | Dividends from affiliates | | | 378,205 | |
| | Investments sold | | | 78,105 | |
| | Foreign tax reclaims | | | 880 | |
| Other assets | | | 10,748 | |
Total Assets | | | 1,563,479,670 | |
Liabilities: | | | | |
| Collateral for securities loaned (Note 3) | | | 3,460,395 | |
| Forward foreign currency exchange contracts | | | 7,399,092 | |
| OTC swap contracts, at value (premium paid $657,573) | | | 434,689 | |
| Variation margin payable on futures contracts | | | 1,587,887 | |
| Variation margin payable on centrally cleared swaps | | | 56,244 | |
| Payables: | | | — | |
| | Fund shares repurchased | | | 17,431,820 | |
| | Advisory fees | | | 553,585 | |
| | Dividends | | | 230,762 | |
| | Transfer agent fees and expenses | | | 230,652 | |
| | Professional fees | | | 70,232 | |
| | Trustees' deferred compensation fees | | | 39,216 | |
| | Custodian fees | | | 37,817 | |
| | 12b-1 Distribution and shareholder servicing fees | | | 29,417 | |
| | Trustees' fees and expenses | | | 10,263 | |
| | Affiliated fund administration fees payable | | | 3,410 | |
| | Accrued expenses and other payables | | | 191,427 | |
Total Liabilities | | | 31,766,908 | |
Net Assets | | $ | 1,531,712,762 | |
| | |
See Notes to Financial Statements. |
| |
20 | JUNE 30, 2023 |
Janus Henderson Developed World Bond Fund
Statement of Assets and Liabilities
June 30, 2023
| | | | | | | |
| | | | | | |
| | | | | | | |
Net Assets Consist of: | | | | |
| Capital (par value and paid-in surplus) | | $ | 2,135,003,374 | |
| Total distributable earnings (loss) | | | (603,290,612) | |
Total Net Assets | | $ | 1,531,712,762 | |
Net Assets - Class A Shares | | $ | 62,773,615 | |
| Shares Outstanding, $0.01 Par Value (unlimited shares authorized) | | | 8,314,891 | |
Net Asset Value Per Share(2) | | $ | 7.55 | |
Maximum Offering Price Per Share(3) | | $ | 7.93 | |
Net Assets - Class C Shares | | $ | 17,015,682 | |
| Shares Outstanding, $0.01 Par Value (unlimited shares authorized) | | | 2,271,036 | |
Net Asset Value Per Share(2) | | $ | 7.49 | |
Net Assets - Class D Shares | | $ | 26,217,414 | |
| Shares Outstanding, $0.01 Par Value (unlimited shares authorized) | | | 3,475,275 | |
Net Asset Value Per Share | | $ | 7.54 | |
Net Assets - Class I Shares | | $ | 1,263,864,115 | |
| Shares Outstanding, $0.01 Par Value (unlimited shares authorized) | | | 168,102,824 | |
Net Asset Value Per Share | | $ | 7.52 | |
Net Assets - Class N Shares | | $ | 124,577,302 | |
| Shares Outstanding, $0.01 Par Value (unlimited shares authorized) | | | 16,562,600 | |
Net Asset Value Per Share | | $ | 7.52 | |
Net Assets - Class S Shares | | $ | 469,729 | |
| Shares Outstanding, $0.01 Par Value (unlimited shares authorized) | | | 62,314 | |
Net Asset Value Per Share | | $ | 7.54 | |
Net Assets - Class T Shares | | $ | 36,794,905 | |
| Shares Outstanding, $0.01 Par Value (unlimited shares authorized) | | | 4,881,029 | |
Net Asset Value Per Share | | $ | 7.54 | |
| |
(1) Includes $3,339,181 of securities on loan. See Note 3 in Notes to Financial Statements. (2) Redemption price per share may be reduced for any applicable contingent deferred sales charge. (3) Maximum offering price is computed at 100/95.25 of net asset value. |
| | |
See Notes to Financial Statements. |
| |
Janus Investment Fund | 21 |
Janus Henderson Developed World Bond Fund
Statement of Operations
For the year ended June 30, 2023
| | | | | | |
| | | | | |
Investment Income: |
| Interest | $ | 44,913,319 | |
| Dividends from affiliates | | 2,610,898 | |
| Affiliated securities lending income, net | | 12,050 | |
| Unaffiliated securities lending income, net | | 6,277 | |
| Other income | | 771,912 | |
Total Investment Income | | 48,314,456 | |
Expenses: | | | |
| Advisory fees | | 9,460,179 | |
| 12b-1 Distribution and shareholder servicing fees: |
| | Class A Shares | | 155,284 | |
| | Class C Shares | | 210,386 | |
| | Class S Shares | | 1,165 | |
| Transfer agent administrative fees and expenses: | | |
| | Class D Shares | | 33,024 | |
| | Class S Shares | | 1,297 | |
| | Class T Shares | | 145,448 | |
| Transfer agent networking and omnibus fees: | | | |
| | Class A Shares | | 132,395 | |
| | Class C Shares | | 17,762 | |
| | Class I Shares | | 1,666,703 | |
| Other transfer agent fees and expenses: | | | |
| | Class A Shares | | 4,930 | |
| | Class C Shares | | 1,086 | |
| | Class D Shares | | 5,199 | |
| | Class I Shares | | 84,119 | |
| | Class N Shares | | 6,260 | |
| | Class S Shares | | 28 | |
| | Class T Shares | | 3,908 | |
| Shareholder reports expense | | 208,515 | |
| Custodian fees | | 147,685 | |
| Registration fees | | 142,483 | |
| Professional fees | | 84,799 | |
| Affiliated fund administration fees | | 56,830 | |
| Trustees’ fees and expenses | | 50,006 | |
| Other expenses | | 290,195 | |
Total Expenses | | 12,909,686 | |
Less: Excess Expense Reimbursement and Waivers | | (1,795,238) | |
Net Expenses | | 11,114,448 | |
Net Investment Income/(Loss) | | 37,200,008 | |
| | | | | |
| | |
See Notes to Financial Statements. |
| |
22 | JUNE 30, 2023 |
Janus Henderson Developed World Bond Fund
Statement of Operations
For the year ended June 30, 2023
| | | | | | |
| | | | | |
Net Realized Gain/(Loss) on Investments: | |
| Investments and foreign currency transactions | $ | (225,592,020) | |
| Investments in affiliates | | 6,720 | |
| Forward foreign currency exchange contracts | | 21,797,367 | |
| Futures contracts | | (69,787,635) | |
| Swap contracts | | (31,094) | |
Total Net Realized Gain/(Loss) on Investments | (273,606,662) | |
Change in Unrealized Net Appreciation/Depreciation: |
| Investments, foreign currency translations and Trustees’ deferred compensation | | 155,138,863 | |
| Investments in affiliates | | (3,203) | |
| Forward foreign currency exchange contracts | | (2,162,104) | |
| Futures contracts | | (3,236,433) | |
| Swap contracts | | (1,763,794) | |
Total Change in Unrealized Net Appreciation/Depreciation | 147,973,329 | |
Net Increase/(Decrease) in Net Assets Resulting from Operations | $ | (88,433,325) | |
| | | | | |
| | |
See Notes to Financial Statements. |
| |
Janus Investment Fund | 23 |
Janus Henderson Developed World Bond Fund
Statements of Changes in Net Assets
| | | | | | | | | |
| | | | | | | | |
| | | Year ended
June 30, 2023 | | Year ended
June 30, 2022 | |
| | | | | | | | | |
Operations: | | | | | | |
| Net investment income/(loss) | $ | 37,200,008 | | $ | 39,493,741 | |
| Net realized gain/(loss) on investments | | (273,606,662) | | | 57,629,851 | |
| Change in unrealized net appreciation/depreciation | 147,973,329 | | | (439,128,888) | |
Net Increase/(Decrease) in Net Assets Resulting from Operations | (88,433,325) | | | (342,005,296) | |
Dividends and Distributions to Shareholders: | | | | | | |
| | Class A Shares | | (5,830,159) | | | (1,353,980) | |
| | Class C Shares | | (1,613,123) | | | (178,692) | |
| | Class D Shares | | (2,333,968) | | | (505,532) | |
| | Class I Shares | | (126,880,529) | | | (34,599,590) | |
| | Class N Shares | | (10,020,418) | | | (1,651,730) | |
| | Class S Shares | | (42,120) | | | (6,612) | |
| | Class T Shares | | (4,513,172) | | | (1,351,302) | |
Net Decrease from Dividends and Distributions to Shareholders | (151,233,489) | | | (39,647,438) | |
Capital Share Transactions: | | | | | | |
| | Class A Shares | | (10,105,427) | | | (20,275,944) | |
| | Class C Shares | | (7,083,837) | | | (5,510,550) | |
| | Class D Shares | | (35,365) | | | (4,565,825) | |
| | Class I Shares | | (428,407,048) | | | 69,051,910 | |
| | Class N Shares | | 13,180,626 | | | 74,184,313 | |
| | Class S Shares | | (50,447) | | | 150,839 | |
| | Class T Shares | | (30,673,057) | | | (29,914,527) | |
Net Increase/(Decrease) from Capital Share Transactions | (463,174,555) | | | 83,120,216 | |
Net Increase/(Decrease) in Net Assets | | (702,841,369) | | | (298,532,518) | |
Net Assets: | | | | | | |
| Beginning of period | | 2,234,554,131 | | | 2,533,086,649 | |
| End of period | $ | 1,531,712,762 | | $ | 2,234,554,131 | |
| | | | | | | | |
| | |
See Notes to Financial Statements. |
| |
24 | JUNE 30, 2023 |
Janus Henderson Developed World Bond Fund
Financial Highlights
| | | | | | | | | | | | | | | | | | | |
Class A Shares | | | | | | | | | | | | | | | |
For a share outstanding during the year ended June 30 | | 2023 | | | 2022 | | | 2021 | | | 2020 | | | 2019 | |
| Net Asset Value, Beginning of Period | | $8.60 | | | $9.93 | | | $9.94 | | | $9.69 | | | $9.35 | |
| Income/(Loss) from Investment Operations: | | | | | | | | | | | | | | | |
| | Net investment income/(loss)(1) | | 0.15 | | | 0.12 | | | 0.17 | | | 0.14 | | | 0.18 | |
| | Net realized and unrealized gain/(loss) | | (0.51) | | | (1.33) | | | 0.26 | | | 0.44 | | | 0.58 | |
| Total from Investment Operations | | (0.36) | | | (1.21) | | | 0.43 | | | 0.58 | | | 0.76 | |
| Less Dividends and Distributions: | | | | | | | | | | | | | | | |
| | Dividends (from net investment income) | | (0.69) | | | (0.12) | | | (0.44) | | | (0.30) | | | (0.42) | |
| | Distributions (from capital gains) | | — | | | — | | | — | | | (0.03) | | | — | |
| Total Dividends and Distributions | | (0.69) | | | (0.12) | | | (0.44) | | | (0.33) | | | (0.42) | |
| Net Asset Value, End of Period | | $7.55 | | | $8.60 | | | $9.93 | | | $9.94 | | | $9.69 | |
| Total Return* | | (4.20)% | | | (12.28)% | | | 4.30% | | | 6.07% | | | 8.48% | |
| Net Assets, End of Period (in thousands) | | $62,774 | | | $81,662 | | | $116,629 | | | $59,079 | | | $51,463 | |
| Average Net Assets for the Period (in thousands) | | $69,992 | | | $109,414 | | | $94,430 | | | $59,858 | | | $43,495 | |
| Ratios to Average Net Assets**: | | | | | | | | | | | | | | | |
| | Ratio of Gross Expenses | | 1.00% | | | 0.93% | | | 0.92% | | | 0.94% | | | 0.99% | |
| | Ratio of Net Expenses (After Waivers and Expense Offsets) | | 0.80% | | | 0.83% | | | 0.83% | | | 0.90% | | | 0.99% | |
| | Ratio of Net Investment Income/(Loss) | | 1.90% | | | 1.25% | | | 1.69% | | | 1.45% | | | 1.98% | |
| Portfolio Turnover Rate | | 60% | | | 86% | | | 37% | | | 88% | | | 42% | |
| | | | | | | | | | | | | | | | | | | |
| |
* Total return includes adjustments in accordance with generally accepted accounting principles required at the year or period end and are not annualized for periods of less than one full year. ** Annualized for periods of less than one full year. (1) Per share amounts are calculated based on average shares outstanding during the year or period. |
| | |
See Notes to Financial Statements. |
| |
Janus Investment Fund | 25 |
Janus Henderson Developed World Bond Fund
Financial Highlights
| | | | | | | | | | | | | | | | | | | |
Class C Shares | | | | | | | | | | | | | | | |
For a share outstanding during the year ended June 30 | | 2023 | | | 2022 | | | 2021 | | | 2020 | | | 2019 | |
| Net Asset Value, Beginning of Period | | $8.54 | | | $9.85 | | | $9.87 | | | $9.63 | | | $9.30 | |
| Income/(Loss) from Investment Operations: | | | | | | | | | | | | | | | |
| | Net investment income/(loss)(1) | | 0.09 | | | 0.05 | | | 0.10 | | | 0.07 | | | 0.12 | |
| | Net realized and unrealized gain/(loss) | | (0.51) | | | (1.31) | | | 0.24 | | | 0.43 | | | 0.57 | |
| Total from Investment Operations | | (0.42) | | | (1.26) | | | 0.34 | | | 0.50 | | | 0.69 | |
| Less Dividends and Distributions: | | | | | | | | | | | | | | | |
| | Dividends (from net investment income) | | (0.63) | | | (0.05) | | | (0.36) | | | (0.23) | | | (0.36) | |
| | Distributions (from capital gains) | | — | | | — | | | — | | | (0.03) | | | — | |
| Total Dividends and Distributions | | (0.63) | | | (0.05) | | | (0.36) | | | (0.26) | | | (0.36) | |
| Net Asset Value, End of Period | | $7.49 | | | $8.54 | | | $9.85 | | | $9.87 | | | $9.63 | |
| Total Return* | | (4.94)% | | | (12.83)% | | | 3.47% | | | 5.26% | | | 7.67% | |
| Net Assets, End of Period (in thousands) | | $17,016 | | | $26,901 | | | $36,918 | | | $37,641 | | | $37,165 | |
| Average Net Assets for the Period (in thousands) | | $21,714 | | | $34,064 | | | $38,596 | | | $37,191 | | | $36,574 | |
| Ratios to Average Net Assets**: | | | | | | | | | | | | | | | |
| | Ratio of Gross Expenses | | 1.64% | | | 1.59% | | | 1.60% | | | 1.64% | | | 1.72% | |
| | Ratio of Net Expenses (After Waivers and Expense Offsets) | | 1.55% | | | 1.54% | | | 1.55% | | | 1.62% | | | 1.72% | |
| | Ratio of Net Investment Income/(Loss) | | 1.11% | | | 0.54% | | | 0.99% | | | 0.74% | | | 1.27% | |
| Portfolio Turnover Rate | | 60% | | | 86% | | | 37% | | | 88% | | | 42% | |
| | | | | | | | | | | | | | | | | | | |
| |
* Total return includes adjustments in accordance with generally accepted accounting principles required at the year or period end and are not annualized for periods of less than one full year. ** Annualized for periods of less than one full year. (1) Per share amounts are calculated based on average shares outstanding during the year or period. |
| | |
See Notes to Financial Statements. |
| |
26 | JUNE 30, 2023 |
Janus Henderson Developed World Bond Fund
Financial Highlights
| | | | | | | | | | | | | | | | | | | |
Class D Shares | | | | | | | | | | | | | | | |
For a share outstanding during the year ended June 30 | | 2023 | | | 2022 | | | 2021 | | | 2020 | | | 2019 | |
| Net Asset Value, Beginning of Period | | $8.60 | | | $9.92 | | | $9.93 | | | $9.69 | | | $9.34 | |
| Income/(Loss) from Investment Operations: | | | | | | | | | | | | | | | |
| | Net investment income/(loss)(1) | | 0.16 | | | 0.13 | | | 0.19 | | | 0.16 | | | 0.20 | |
| | Net realized and unrealized gain/(loss) | | (0.52) | | | (1.31) | | | 0.25 | | | 0.43 | | | 0.59 | |
| Total from Investment Operations | | (0.36) | | | (1.18) | | | 0.44 | | | 0.59 | | | 0.79 | |
| Less Dividends and Distributions: | | | | | | | | | | | | | | | |
| | Dividends (from net investment income) | | (0.70) | | | (0.14) | | | (0.45) | | | (0.32) | | | (0.44) | |
| | Distributions (from capital gains) | | — | | | — | | | — | | | (0.03) | | | — | |
| Total Dividends and Distributions | | (0.70) | | | (0.14) | | | (0.45) | | | (0.35) | | | (0.44) | |
| Net Asset Value, End of Period | | $7.54 | | | $8.60 | | | $9.92 | | | $9.93 | | | $9.69 | |
| Total Return* | | (4.21)% | | | (12.06)% | | | 4.43% | | | 6.17% | | | 8.78% | |
| Net Assets, End of Period (in thousands) | | $26,217 | | | $29,812 | | | $39,211 | | | $30,219 | | | $16,056 | |
| Average Net Assets for the Period (in thousands) | | $27,936 | | | $36,141 | | | $42,506 | | | $21,662 | | | $10,281 | |
| Ratios to Average Net Assets**: | | | | | | | | | | | | | | | |
| | Ratio of Gross Expenses | | 0.75% | | | 0.69% | | | 0.70% | | | 0.75% | | | 0.86% | |
| | Ratio of Net Expenses (After Waivers and Expense Offsets) | | 0.69% | | | 0.68% | | | 0.69% | | | 0.73% | | | 0.81% | |
| | Ratio of Net Investment Income/(Loss) | | 2.03% | | | 1.40% | | | 1.86% | | | 1.65% | | | 2.13% | |
| Portfolio Turnover Rate | | 60% | | | 86% | | | 37% | | | 88% | | | 42% | |
| | | | | | | | | | | | | | | | | | | |
| |
* Total return includes adjustments in accordance with generally accepted accounting principles required at the year or period end and are not annualized for periods of less than one full year. ** Annualized for periods of less than one full year. (1) Per share amounts are calculated based on average shares outstanding during the year or period. |
| | |
See Notes to Financial Statements. |
| |
Janus Investment Fund | 27 |
Janus Henderson Developed World Bond Fund
Financial Highlights
| | | | | | | | | | | | | | | | | | | |
Class I Shares | | | | | | | | | | | | | | | |
For a share outstanding during the year ended June 30 | | 2023 | | | 2022 | | | 2021 | | | 2020 | | | 2019 | |
| Net Asset Value, Beginning of Period | | $8.57 | | | $9.89 | | | $9.91 | | | $9.66 | | | $9.32 | |
| Income/(Loss) from Investment Operations: | | | | | | | | | | | | | | | |
| | Net investment income/(loss)(1) | | 0.17 | | | 0.14 | | | 0.19 | | | 0.17 | | | 0.21 | |
| | Net realized and unrealized gain/(loss) | | (0.51) | | | (1.31) | | | 0.25 | | | 0.43 | | | 0.58 | |
| Total from Investment Operations | | (0.34) | | | (1.17) | | | 0.44 | | | 0.60 | | | 0.79 | |
| Less Dividends and Distributions: | | | | | | | | | | | | | | | |
| | Dividends (from net investment income) | | (0.71) | | | (0.15) | | | (0.46) | | | (0.32) | | | (0.45) | |
| | Distributions (from capital gains) | | — | | | — | | | — | | | (0.03) | | | — | |
| Total Dividends and Distributions | | (0.71) | | | (0.15) | | | (0.46) | | | (0.35) | | | (0.45) | |
| Net Asset Value, End of Period | | $7.52 | | | $8.57 | | | $9.89 | | | $9.91 | | | $9.66 | |
| Total Return* | | (3.98)% | | | (12.01)% | | | 4.46% | | | 6.36% | | | 8.77% | |
| Net Assets, End of Period (in thousands) | | $1,263,864 | | | $1,894,294 | | | $2,151,534 | | | $1,348,740 | | | $948,619 | |
| Average Net Assets for the Period (in thousands) | | $1,519,287 | | | $2,273,485 | | | $1,744,298 | | | $1,202,926 | | | $732,591 | |
| Ratios to Average Net Assets**: | | | | | | | | | | | | | | | |
| | Ratio of Gross Expenses | | 0.69% | | | 0.64% | | | 0.65% | | | 0.68% | | | 0.74% | |
| | Ratio of Net Expenses (After Waivers and Expense Offsets) | | 0.58% | | | 0.58% | | | 0.58% | | | 0.65% | | | 0.74% | |
| | Ratio of Net Investment Income/(Loss) | | 2.07% | | | 1.52% | | | 1.94% | | | 1.71% | | | 2.23% | |
| Portfolio Turnover Rate | | 60% | | | 86% | | | 37% | | | 88% | | | 42% | |
| | | | | | | | | | | | | | | | | | | |
| |
* Total return includes adjustments in accordance with generally accepted accounting principles required at the year or period end and are not annualized for periods of less than one full year. ** Annualized for periods of less than one full year. (1) Per share amounts are calculated based on average shares outstanding during the year or period. |
| | |
See Notes to Financial Statements. |
| |
28 | JUNE 30, 2023 |
Janus Henderson Developed World Bond Fund
Financial Highlights
| | | | | | | | | | | | | | | | | | | |
Class N Shares | | | | | | | | | | | | | | | |
For a share outstanding during the year ended June 30 | | 2023 | | | 2022 | | | 2021 | | | 2020 | | | 2019 | |
| Net Asset Value, Beginning of Period | | $8.57 | | | $9.90 | | | $9.91 | | | $9.67 | | | $9.32 | |
| Income/(Loss) from Investment Operations: | | | | | | | | | | | | | | | |
| | Net investment income/(loss)(1) | | 0.17 | | | 0.15 | | | 0.19 | | | 0.18 | | | 0.21 | |
| | Net realized and unrealized gain/(loss) | | (0.51) | | | (1.33) | | | 0.26 | | | 0.42 | | | 0.59 | |
| Total from Investment Operations | | (0.34) | | | (1.18) | | | 0.45 | | | 0.60 | | | 0.80 | |
| Less Dividends and Distributions: | | | | | | | | | | | | | | | |
| | Dividends (from net investment income) | | (0.71) | | | (0.15) | | | (0.46) | | | (0.33) | | | (0.45) | |
| | Distributions (from capital gains) | | — | | | — | | | — | | | (0.03) | | | — | |
| Total Dividends and Distributions | | (0.71) | | | (0.15) | | | (0.46) | | | (0.36) | | | (0.45) | |
| Net Asset Value, End of Period | | $7.52 | | | $8.57 | | | $9.90 | | | $9.91 | | | $9.67 | |
| Total Return* | | (4.00)% | | | (12.06)% | | | 4.58% | | | 6.32% | | | 8.94% | |
| Net Assets, End of Period (in thousands) | | $124,577 | | | $126,445 | | | $69,800 | | | $31,829 | | | $5,789 | |
| Average Net Assets for the Period (in thousands) | | $117,102 | | | $100,399 | | | $50,273 | | | $19,208 | | | $5,062 | |
| Ratios to Average Net Assets**: | | | | | | | | | | | | | | | |
| | Ratio of Gross Expenses | | 0.59% | | | 0.55% | | | 0.56% | | | 0.61% | | | 0.71% | |
| | Ratio of Net Expenses (After Waivers and Expense Offsets) | | 0.58% | | | 0.55% | | | 0.56% | | | 0.59% | | | 0.67% | |
| | Ratio of Net Investment Income/(Loss) | | 2.16% | | | 1.59% | | | 1.94% | | | 1.82% | | | 2.31% | |
| Portfolio Turnover Rate | | 60% | | | 86% | | | 37% | | | 88% | | | 42% | |
| | | | | | | | | | | | | | | | | | | |
| |
* Total return includes adjustments in accordance with generally accepted accounting principles required at the year or period end and are not annualized for periods of less than one full year. ** Annualized for periods of less than one full year. (1) Per share amounts are calculated based on average shares outstanding during the year or period. |
| | |
See Notes to Financial Statements. |
| |
Janus Investment Fund | 29 |
Janus Henderson Developed World Bond Fund
Financial Highlights
| | | | | | | | | | | | | | | | | | | |
Class S Shares | | | | | | | | | | | | | | | |
For a share outstanding during the year ended June 30 | | 2023 | | | 2022 | | | 2021 | | | 2020 | | | 2019 | |
| Net Asset Value, Beginning of Period | | $8.59 | | | $9.91 | | | $9.93 | | | $9.69 | | | $9.34 | |
| Income/(Loss) from Investment Operations: | | | | | | | | | | | | | | | |
| | Net investment income/(loss)(1) | | 0.14 | | | 0.10 | | | 0.15 | | | 0.13 | | | 0.18 | |
| | Net realized and unrealized gain/(loss) | | (0.51) | | | (1.32) | | | 0.25 | | | 0.42 | | | 0.59 | |
| Total from Investment Operations | | (0.37) | | | (1.22) | | | 0.40 | | | 0.55 | | | 0.77 | |
| Less Dividends and Distributions: | | | | | | | | | | | | | | | |
| | Dividends (from net investment income) | | (0.68) | | | (0.10) | | | (0.42) | | | (0.28) | | | (0.42) | |
| | Distributions (from capital gains) | | — | | | — | | | — | | | (0.03) | | | — | |
| Total Dividends and Distributions | | (0.68) | | | (0.10) | | | (0.42) | | | (0.31) | | | (0.42) | |
| Net Asset Value, End of Period | | $7.54 | | | $8.59 | | | $9.91 | | | $9.93 | | | $9.69 | |
| Total Return* | | (4.42)% | | | (12.38)% | | | 3.99% | | | 5.83% | | | 8.51% | |
| Net Assets, End of Period (in thousands) | | $470 | | | $585 | | | $527 | | | $224 | | | $158 | |
| Average Net Assets for the Period (in thousands) | | $516 | | | $614 | | | $500 | | | $201 | | | $141 | |
| Ratios to Average Net Assets**: | | | | | | | | | | | | | | | |
| | Ratio of Gross Expenses | | 1.64% | | | 1.50% | | | 1.62% | | | 2.55% | | | 3.21% | |
| | Ratio of Net Expenses (After Waivers and Expense Offsets) | | 1.04% | | | 1.03% | | | 1.02% | | | 1.06% | | | 1.06% | |
| | Ratio of Net Investment Income/(Loss) | | 1.67% | | | 1.06% | | | 1.50% | | | 1.31% | | | 1.91% | |
| Portfolio Turnover Rate | | 60% | | | 86% | | | 37% | | | 88% | | | 42% | |
| | | | | | | | | | | | | | | | | | | |
| |
* Total return includes adjustments in accordance with generally accepted accounting principles required at the year or period end and are not annualized for periods of less than one full year. ** Annualized for periods of less than one full year. (1) Per share amounts are calculated based on average shares outstanding during the year or period. |
| | |
See Notes to Financial Statements. |
| |
30 | JUNE 30, 2023 |
Janus Henderson Developed World Bond Fund
Financial Highlights
| | | | | | | | | | | | | | | | | | | |
Class T Shares | | | | | | | | | | | | | | | |
For a share outstanding during the year ended June 30 | | 2023 | | | 2022 | | | 2021 | | | 2020 | | | 2019 | |
| Net Asset Value, Beginning of Period | | $8.59 | | | $9.91 | | | $9.93 | | | $9.68 | | | $9.34 | |
| Income/(Loss) from Investment Operations: | | | | | | | | | | | | | | | |
| | Net investment income/(loss)(1) | | 0.15 | | | 0.13 | | | 0.17 | | | 0.15 | | | 0.19 | |
| | Net realized and unrealized gain/(loss) | | (0.51) | | | (1.32) | | | 0.25 | | | 0.44 | | | 0.58 | |
| Total from Investment Operations | | (0.36) | | | (1.19) | | | 0.42 | | | 0.59 | | | 0.77 | |
| Less Dividends and Distributions: | | | | | | | | | | | | | | | |
| | Dividends (from net investment income) | | (0.69) | | | (0.13) | | | (0.44) | | | (0.31) | | | (0.43) | |
| | Distributions (from capital gains) | | — | | | — | | | — | | | (0.03) | | | — | |
| Total Dividends and Distributions | | (0.69) | | | (0.13) | | | (0.44) | | | (0.34) | | | (0.43) | |
| Net Asset Value, End of Period | | $7.54 | | | $8.59 | | | $9.91 | | | $9.93 | | | $9.68 | |
| Total Return* | | (4.22)% | | | (12.17)% | | | 4.23% | | | 6.17% | | | 8.59% | |
| Net Assets, End of Period (in thousands) | | $36,795 | | | $74,856 | | | $118,467 | | | $100,323 | | | $70,554 | |
| Average Net Assets for the Period (in thousands) | | $57,961 | | | $106,431 | | | $131,360 | | | $106,719 | | | $45,901 | |
| Ratios to Average Net Assets**: | | | | | | | | | | | | | | | |
| | Ratio of Gross Expenses | | 0.83% | | | 0.78% | | | 0.81% | | | 0.84% | | | 0.91% | |
| | Ratio of Net Expenses (After Waivers and Expense Offsets) | | 0.82% | | | 0.77% | | | 0.79% | | | 0.83% | | | 0.90% | |
| | Ratio of Net Investment Income/(Loss) | | 1.81% | | | 1.31% | | | 1.74% | | | 1.52% | | | 2.05% | |
| Portfolio Turnover Rate | | 60% | | | 86% | | | 37% | | | 88% | | | 42% | |
| | | | | | | | | | | | | | | | | | | |
| |
* Total return includes adjustments in accordance with generally accepted accounting principles required at the year or period end and are not annualized for periods of less than one full year. ** Annualized for periods of less than one full year. (1) Per share amounts are calculated based on average shares outstanding during the year or period. |
| | |
See Notes to Financial Statements. |
| |
Janus Investment Fund | 31 |
Janus Henderson Developed World Bond Fund
Notes to Financial Statements
1. Organization and Significant Accounting Policies
Janus Henderson Developed World Bond Fund (the “Fund”) is a series of Janus Investment Fund (the “Trust”), which is organized as a Massachusetts business trust and is registered under the Investment Company Act of 1940, as amended (the “1940 Act”), as an open-end management investment company, and therefore has applied the specialized accounting and reporting guidance in Financial Accounting Standards Board (“FASB”) Accounting Standards Codification (“ASC”) Topic 946. The Trust offers 39 funds, each of which offers multiple share classes, with differing investment objectives and policies. The Fund seeks total return through current income and capital appreciation. The Fund is classified as diversified, as defined in the 1940 Act. Janus Henderson Investors US LLC is the investment adviser (the “Adviser”) to the Fund.
The Fund offers multiple classes of shares in order to meet the needs of various types of investors. Each class represents an interest in the same portfolio of investments. Certain financial intermediaries may not offer all classes of shares.
Shareholders, including other funds, individuals, accounts, as well as the Fund’s portfolio manager(s) and/or investment personnel, may from time to time own (beneficially or of record) a significant percentage of the Fund’s Shares and can be considered to “control” the Fund when that ownership exceeds 25% of the Fund’s assets (and which may differ from control as determined in accordance with United States of America generally accepted accounting principles ("US GAAP")).
Class A Shares are offered through financial intermediary platforms including, but not limited to, traditional brokerage platforms, mutual fund wrap fee programs, bank trust platforms, and retirement platforms.
Class C Shares are offered through financial intermediary platforms including, but not limited to, traditional brokerage platforms, mutual fund wrap fee programs, and bank trust platforms.
Class C Shares are closed to investments by new employer-sponsored retirement plans and existing employer-sponsored retirement plans are no longer able to make additional purchases or exchanges into Class C Shares.
The Fund currently implements an automatic conversion feature pursuant to which Class C Shares that have been held for eight years are automatically converted to Class A Shares without the imposition of any sales charge, fee or other charge. The conversion will generally occur no later than ten business days in the month following the month of the eighth anniversary of the date of purchase. Class C Shares purchased through the reinvestment of dividends and other distributions on Class C Shares will convert to Class A Shares at the same time as the original Class C Shares with respect to which they were purchased. For Class C Shares held in omnibus accounts on intermediary platforms, the Fund relies on these intermediaries to implement this conversion feature. Your financial intermediary may have separate policies and procedures as to when and how Class C Shares may be converted to Class A Shares.
Effective July 6, 2020, Class D Shares are available to new investors, subject to any closed fund policies for a Fund, as applicable. Previously, Class D Shares were only available to investors who already had a direct account with the Janus Henderson funds; immediate family members or members of the same household of an eligible individual investor; and existing beneficial owners of sole proprietorships or partnerships that hold accounts directly with the Janus Henderson funds.
Class I Shares are available through certain financial intermediary platforms including, but not limited to, mutual fund wrap fee programs, managed account programs, asset allocation programs, bank trust platforms, as well as certain retirement platforms. Class I Shares are also available to certain direct institutional investors including, but not limited to, corporations, certain retirement plans, public plans, and foundations/endowments, who established Class I Share accounts before August 4, 2017.
Class N Shares are generally available only to financial intermediaries purchasing on behalf of: 1) certain adviser-assisted, employer-sponsored retirement plans, including 401(k) plans, 457 plans, 403(b) plans, Taft-Hartley multi-employer plans, profit-sharing and money purchase pension plans, defined benefit plans and certain welfare benefit plans, such as health savings accounts, and nonqualified deferred compensation plans; and 2) retail investors purchasing in qualified or nonqualified accounts, whose accounts are held through an omnibus account at their financial intermediary, and where the financial intermediary requires no payment or reimbursement from the Fund, the Adviser, or its affiliates. Class N Shares are also available to Janus Henderson proprietary products and to certain direct institutional investors approved by Janus Henderson Distributors US LLC (the “Distributor”) including, but not limited to,
Janus Henderson Developed World Bond Fund
Notes to Financial Statements
corporations, certain retirement plans, public plans, and foundations and endowments, subject to minimum investment requirements.
Class S Shares are offered through financial intermediary platforms including, but not limited to, retirement platforms and asset allocation, mutual fund wrap, or other discretionary or nondiscretionary fee-based investment advisory programs. In addition, Class S Shares may be available through certain financial intermediaries who have an agreement with the Adviser or its affiliates to offer Class S Shares on their supermarket platforms.
Class T Shares are available through certain financial intermediary platforms including, but not limited to, mutual fund wrap fee programs, managed account programs, asset allocation programs, bank trust platforms, as well as certain retirement platforms. In addition, Class T Shares may be available through certain financial intermediaries who have an agreement with the Adviser or its affiliates to offer Class T Shares on their supermarket platforms.
The following accounting policies have been followed by the Fund and are in conformity with US GAAP.
Investment Valuation
Fund holdings are valued in accordance with policies and procedures established by the Adviser pursuant to Rule 2a-5 under the 1940 Act and approved by and subject to the oversight of the Trustees (the “Valuation Procedures”). Equity securities traded on a domestic securities exchange are generally valued at readily available market quotations, which are (i) the official close prices or (ii) last sale prices on the primary market or exchange in which the securities trade. If such price is lacking for the trading period immediately preceding the time of determination, such securities are generally valued at their current bid price. Equity securities that are traded on a foreign exchange are generally valued at the closing prices on such markets. In the event that there is no current trading volume on a particular security in such foreign exchange, the bid price from the primary exchange is generally used to value the security. Foreign securities and currencies are converted to U.S. dollars using the current spot USD dollar exchange rate in effect at the close of the New York Stock Exchange (“NYSE”). The Adviser will determine the market value of individual securities held by it by using prices provided by one or more Adviser-approved professional pricing services or, as needed, by obtaining market quotations from independent broker-dealers. Most debt securities are valued in accordance with the evaluated bid price supplied by the pricing service that is intended to reflect market value. The evaluated bid price supplied by the pricing service is an evaluation that may consider factors such as security prices, yields, maturities and ratings. Certain short-term securities maturing within 60 days or less may be evaluated and valued on an amortized cost basis provided that the amortized cost determined approximates market value. Securities for which market quotations or evaluated prices are not readily available or deemed unreliable are valued at fair value determined in good faith by the Adviser pursuant to the Valuation Procedures. Circumstances in which fair valuation may be utilized include, but are not limited to: (i) a significant event that may affect the securities of a single issuer, such as a merger, bankruptcy, or significant issuer-specific development; (ii) an event that may affect an entire market, such as a natural disaster or significant governmental action; (iii) a nonsignificant event such as a market closing early or not opening, or a security trading halt; and (iv) pricing of a nonvalued security and a restricted or nonpublic security. Special valuation considerations may apply with respect to “odd-lot” fixed-income transactions which, due to their small size, may receive evaluated prices by pricing services which reflect a large block trade and not what actually could be obtained for the odd-lot position. The value of the securities of other mutual funds held by the Fund, if any, will be calculated using the NAV of such mutual funds, and the prospectuses for such mutual funds explain the circumstances under which they use fair valuation and the effects of using fair valuation. The value of the securities of any cash management pooled investment vehicles that operate as money market funds held by the Fund, if any, will be calculated using the NAV of such funds.
Valuation Inputs Summary
FASB ASC 820, Fair Value Measurements and Disclosures (“ASC 820”), defines fair value, establishes a framework for measuring fair value, and expands disclosure requirements regarding fair value measurements. This standard emphasizes that fair value is a market-based measurement that should be determined based on the assumptions that market participants would use in pricing an asset or liability and establishes a hierarchy that prioritizes inputs to valuation techniques used to measure fair value. These inputs are summarized into three broad levels:
Level 1 – Unadjusted quoted prices in active markets the Fund has the ability to access for identical assets or liabilities.
Level 2 – Observable inputs other than unadjusted quoted prices included in Level 1 that are observable for the asset or liability either directly or indirectly. These inputs may include quoted prices for the identical instrument on
Janus Henderson Developed World Bond Fund
Notes to Financial Statements
an inactive market, prices for similar instruments, interest rates, prepayment speeds, credit risk, yield curves, default rates and similar data.
Assets or liabilities categorized as Level 2 in the hierarchy generally include: debt securities fair valued in accordance with the evaluated bid or ask prices supplied by a pricing service; securities traded on OTC markets and listed securities for which no sales are reported that are fair valued at the latest bid price (or yield equivalent thereof) obtained from one or more dealers transacting in a market for such securities or by a pricing service approved by the Fund’s Trustees; certain short-term debt securities with maturities of 60 days or less that are fair valued at amortized cost; and equity securities of foreign issuers whose fair value is determined by using systematic fair valuation models provided by independent third parties in order to adjust for stale pricing which may occur between the close of certain foreign exchanges and the close of the NYSE. Other securities that may be categorized as Level 2 in the hierarchy include, but are not limited to, preferred stocks, bank loans, swaps, investments in unregistered investment companies, options, and forward contracts.
Level 3 – Unobservable inputs for the asset or liability to the extent that relevant observable inputs are not available, representing the Fund’s own assumptions about the assumptions that a market participant would use in valuing the asset or liability, and that would be based on the best information available.
There have been no significant changes in valuation techniques used in valuing any such positions held by the Fund since the beginning of the fiscal year.
The inputs or methodology used for fair valuing securities are not necessarily an indication of the risk associated with investing in those securities. The summary of inputs used as of June 30, 2023 to fair value the Fund’s investments in securities and other financial instruments is included in the “Valuation Inputs Summary” in the Notes to Schedule of Investments and Other Information.
Investment Transactions and Investment Income
Investment transactions are accounted for as of the date purchased or sold (trade date). Dividend income is recorded on the ex-dividend date. Certain dividends from foreign securities will be recorded as soon as the Fund is informed of the dividend, if such information is obtained subsequent to the ex-dividend date. Dividends from foreign securities may be subject to withholding taxes in foreign jurisdictions. Non-cash dividends, if any, are recorded on the ex-dividend date at fair value. Interest income is recorded daily on the accrual basis and includes amortization of premiums and accretion of discounts. The Fund classifies gains and losses on prepayments received as an adjustment to interest income. Debt securities may be placed in non-accrual status and related interest income may be reduced by stopping current accruals and writing off interest receivables when collection of all or a portion of interest has become doubtful. Gains and losses are determined on the identified cost basis, which is the same basis used for federal income tax purposes. Income, as well as gains and losses, both realized and unrealized, are allocated daily to each class of shares based upon the ratio of net assets represented by each class as a percentage of total net assets.
Expenses
The Fund bears expenses incurred specifically on its behalf. Each class of shares bears a portion of general expenses, which are allocated daily to each class of shares based upon the ratio of net assets represented by each class as a percentage of total net assets. Expenses directly attributable to a specific class of shares are charged against the operations of such class.
Estimates
The preparation of financial statements in conformity with US GAAP requires management to make estimates and assumptions that affect the reported amount of assets and liabilities and disclosure of contingent assets and liabilities at the date of the financial statements, and the reported amounts of income and expenses during the reporting period. Actual results could differ from those estimates.
Indemnifications
In the normal course of business, the Fund may enter into contracts that contain provisions for indemnification of other parties against certain potential liabilities. The Fund’s maximum exposure under these arrangements is unknown, and would involve future claims that may be made against the Fund that have not yet occurred. Currently, the risk of material loss from such claims is considered remote.
Janus Henderson Developed World Bond Fund
Notes to Financial Statements
Foreign Currency Translations
The Fund does not isolate that portion of the results of operations resulting from the effect of changes in foreign exchange rates on investments from the fluctuations arising from changes in market prices of securities held at the date of the financial statements. Net unrealized appreciation or depreciation of investments and foreign currency translations arise from changes in the value of assets and liabilities, including investments in securities held at the date of the financial statements, resulting from changes in the exchange rates and changes in market prices of securities held.
Currency gains and losses are also calculated on payables and receivables that are denominated in foreign currencies. The payables and receivables are generally related to foreign security transactions and income translations.
Foreign currency-denominated assets and forward currency contracts may involve more risks than domestic transactions, including currency risk, counterparty risk, political and economic risk, regulatory risk and equity risk. Risks may arise from unanticipated movements in the value of foreign currencies relative to the U.S. dollar.
Dividends and Distributions
Dividends are declared and distributed monthly for the Fund. Realized capital gains, if any, are declared and distributed in December. The Fund may treat a portion of the amount paid to redeem shares as a distribution of investment company taxable income and realized capital gains that are reflected in the net asset value. This practice, commonly referred to as “equalization,” has no effect on the redeeming shareholder or a Fund’s total return, but may reduce the amounts that would otherwise be required to be paid as taxable dividends to the remaining shareholders. It is possible that the Internal Revenue Service (IRS) could challenge the Fund's equalization methodology or calculations, and any such challenge could result in additional tax, interest, or penalties to be paid by the Fund.
The Fund may make certain investments in real estate investment trusts (“REITs”) which pay dividends to their shareholders based upon funds available from operations. It is quite common for these dividends to exceed the REITs’ taxable earnings and profits, resulting in the excess portion of such dividends being designated as a return of capital. If the Fund distributes such amounts, such distributions could constitute a return of capital to shareholders for federal income tax purposes.
Federal Income Taxes
The Fund intends to continue to qualify as a regulated investment company and distribute all of its taxable income in accordance with the requirements of Subchapter M of the Internal Revenue Code. Management has analyzed the Fund’s tax positions taken for all open federal income tax years, generally a three-year period, and has concluded that no provision for federal income tax is required in the Fund’s financial statements. The Fund is not aware of any tax positions for which it is reasonably possible that the total amounts of unrecognized tax benefits will significantly change in the next twelve months.
2. Derivative Instruments
The Fund may invest in various types of derivatives, which may at times result in significant derivative exposure. A derivative is a financial instrument whose performance is derived from the performance of another asset. The Fund may invest in derivative instruments including, but not limited to: futures contracts, put options, call options, options on futures contracts, options on foreign currencies, options on recovery locks, options on security and commodity indices, swaps, forward contracts, structured investments, and other equity-linked derivatives. Each derivative instrument that was held by the Fund during the year ended June 30, 2023 is discussed in further detail below. A summary of derivative activity by the Fund is reflected in the tables at the end of the Schedule of Investments.
The Fund may use derivative instruments for hedging purposes (to offset risks associated with an investment, currency exposure, or market conditions), to adjust currency exposure relative to a benchmark index, or for speculative purposes (to earn income and seek to enhance returns). When the Fund invests in a derivative for speculative purposes, the Fund will be fully exposed to the risks of loss of that derivative, which may sometimes be greater than the derivative’s cost. The Fund may not use any derivative to gain exposure to an asset or class of assets that it would be prohibited by its investment restrictions from purchasing directly. The Fund’s ability to use derivative instruments may also be limited by tax considerations.
Investments in derivatives in general are subject to market risks that may cause their prices to fluctuate over time. Investments in derivatives may not directly correlate with the price movements of the underlying instrument. As a result, the use of derivatives may expose the Fund to additional risks that it would not be subject to if it invested directly in the
Janus Henderson Developed World Bond Fund
Notes to Financial Statements
securities underlying those derivatives. The use of derivatives may result in larger losses or smaller gains than otherwise would be the case. Derivatives can be volatile and may involve significant risks.
In pursuit of its investment objective, the Fund may seek to use derivatives to increase or decrease exposure to the following market risk factors:
· Commodity Risk – the risk related to the change in value of commodities or commodity-linked investments due to changes in the overall market movements, volatility of the underlying benchmark, changes in interest rates, or other factors affecting a particular industry or commodity such as drought, floods, weather, livestock disease, embargoes, tariffs, and international economic, political, and regulatory developments.
· Counterparty Risk – the risk that the counterparty (the party on the other side of the transaction) on a derivative transaction will be unable to honor its financial obligation to the Fund.
· Credit Risk – the risk an issuer will be unable to make principal and interest payments when due, or will default on its obligations.
· Currency Risk – the risk that changes in the exchange rate between currencies will adversely affect the value (in U.S. dollar terms) of an investment.
· Equity Risk – the risk related to the change in value of equity securities as they relate to increases or decreases in the general market.
· Index Risk – if the derivative is linked to the performance of an index, it will be subject to the risks associated with changes in that index. If the index changes, the Fund could receive lower interest payments or experience a reduction in the value of the derivative to below what the Fund paid. Certain indexed securities, including inverse securities (which move in an opposite direction to the index), may create leverage, to the extent that they increase or decrease in value at a rate that is a multiple of the changes in the applicable index.
· Interest Rate Risk – the risk that the value of fixed-income securities will generally decline as prevailing interest rates rise, which may cause the Fund’s NAV to likewise decrease.
· Leverage Risk – the risk associated with certain types of leveraged investments or trading strategies pursuant to which relatively small market movements may result in large changes in the value of an investment. The Fund creates leverage by investing in instruments, including derivatives, where the investment loss can exceed the original amount invested. Certain investments or trading strategies, such as short sales, that involve leverage can result in losses that greatly exceed the amount originally invested.
· Liquidity Risk – the risk that certain securities may be difficult or impossible to sell at the time that the seller would like or at the price that the seller believes the security is currently worth.
Derivatives may generally be traded OTC or on an exchange. Derivatives traded OTC are agreements that are individually negotiated between parties and can be tailored to meet a purchaser’s needs. OTC derivatives are not guaranteed by a clearing agency and may be subject to increased credit risk.
In an effort to mitigate credit risk associated with derivatives traded OTC, the Fund may enter into collateral agreements with certain counterparties whereby, subject to certain minimum exposure requirements, the Fund may require the counterparty to post collateral if the Fund has a net aggregate unrealized gain on all OTC derivative contracts with a particular counterparty. Additionally, the Fund may deposit cash and/or treasuries as collateral with the counterparty and/or custodian daily (based on the daily valuation of the financial asset) if the Fund has a net aggregate unrealized loss on OTC derivative contracts with a particular counterparty. All liquid securities and restricted cash are considered to cover in an amount at all times equal to or greater than the Fund’s commitment with respect to certain exchange-traded derivatives, centrally cleared derivatives, forward foreign currency exchange contracts, short sales, and/or securities with extended settlement dates. There is no guarantee that counterparty exposure is reduced and these arrangements are dependent on the Adviser’s ability to establish and maintain appropriate systems and trading.
Forward Foreign Currency Exchange Contracts
A forward foreign currency exchange contract (“forward currency contract”) is an obligation to buy or sell a specified currency at a future date at a negotiated rate (which may be U.S. dollars or a foreign currency). The Fund may enter into forward currency contracts for hedging purposes, including, but not limited to, reducing exposure to changes in foreign
Janus Henderson Developed World Bond Fund
Notes to Financial Statements
currency exchange rates on foreign portfolio holdings and locking in the U.S. dollar cost of firm purchase and sale commitments for securities denominated in or exposed to foreign currencies. The Fund may also invest in forward currency contracts for non-hedging purposes such as seeking to enhance returns. The Fund is subject to currency risk and counterparty risk in the normal course of pursuing its investment objective through its investments in forward currency contracts.
Forward currency contracts are valued by converting the foreign value to U.S. dollars by using the current spot U.S. dollar exchange rate and/or forward rate for that currency. Exchange and forward rates as of the close of the NYSE are used to value the forward currency contracts. The unrealized appreciation/(depreciation) for forward currency contracts is reported in the Statement of Assets and Liabilities as a receivable or payable and in the Statement of Operations for the change in unrealized net appreciation/depreciation (if applicable). The realized gain or loss arising from the difference between the U.S. dollar cost of the original contract and the value of the foreign currency in U.S. dollars upon closing a forward currency contract is reported on the Statement of Operations (if applicable).
During the year, the Fund entered into forward currency contracts with the obligation to purchase foreign currencies in the future at an agreed upon rate in order to decrease exposure to currency risk associated with foreign currency denominated securities held by the Fund.
During the year, the Fund entered into forward currency contracts with the obligation to sell foreign currencies in the future at an agreed upon rate in order to decrease exposure to currency risk associated with foreign currency denominated securities held by the Fund.
Futures Contracts
A futures contract is an exchange-traded agreement to take or make delivery of an underlying asset at a specific time in the future for a specific predetermined negotiated price. The Fund may enter into futures contracts to gain exposure to the stock market or other markets pending investment of cash balances or to meet liquidity needs. The Fund is subject to interest rate risk, equity risk, and currency risk in the normal course of pursuing its investment objective through its investments in futures contracts. The Fund may also use such derivative instruments to hedge or protect from adverse movements in securities prices, currency rates or interest rates. The use of futures contracts may involve risks such as the possibility of illiquid markets or imperfect correlation between the values of the contracts and the underlying securities, or that the counterparty will fail to perform its obligations.
Futures contracts are valued at the settlement price on valuation date on the exchange as reported by an approved vendor. Mini contracts, as defined in the description of the contract, shall be valued using the Actual Settlement Price or “ASET” price type as reported by an approved vendor. In the event that foreign futures trade when the foreign equity markets are closed, the last foreign futures trade price shall be used. Futures contracts are marked-to-market daily, and the daily variation margin is recorded as a receivable or payable on the Statement of Assets and Liabilities (if applicable). The change in unrealized net appreciation/depreciation is reported on the Statement of Operations (if applicable). When a contract is closed, a realized gain or loss is reported on the Statement of Operations (if applicable), equal to the difference between the opening and closing value of the contract. Securities held by the Fund that are designated as collateral for market value on futures contracts are noted on the Schedule of Investments (if applicable). Such collateral is in the possession of the Fund’s futures commission merchant.
With futures, there is minimal counterparty credit risk to the Fund since futures are exchange-traded and the exchange’s clearinghouse, as counterparty to all exchange-traded futures, guarantees the futures against default.
During the year, the Fund purchased interest rate futures to increase exposure to interest rate risk.
Swaps
Swap agreements are two-party contracts entered into primarily by institutional investors for periods ranging from a day to more than one year to exchange one set of cash flows for another. The most significant factor in the performance of swap agreements is the change in value of the specific index, security, or currency, or other factors that determine the amounts of payments due to and from the Fund. The use of swaps is a highly specialized activity which involves investment techniques and risks different from those associated with ordinary portfolio securities transactions. Swap transactions may in some instances involve the delivery of securities or other underlying assets by the Fund or its counterparty to collateralize obligations under the swap. If the other party to a swap that is not collateralized defaults, the Fund would risk the loss of the net amount of the payments that it contractually is entitled to receive. Swap agreements entail the risk that a party will default on its payment obligations to the Fund. If the other party to a swap
Janus Henderson Developed World Bond Fund
Notes to Financial Statements
defaults, the Fund would risk the loss of the net amount of the payments that it contractually is entitled to receive. If the Fund utilizes a swap at the wrong time or judges market conditions incorrectly, the swap may result in a loss to the Fund and reduce the Fund’s total return.
Swap agreements also bear the risk that the Fund will not be able to meet its obligation to the counterparty. Swap agreements are typically privately negotiated and entered into in the OTC market. However, certain swap agreements are required to be cleared through a clearinghouse and traded on an exchange or swap execution facility. Swaps that are required to be cleared are required to post initial and variation margins in accordance with the exchange requirements. Regulations enacted require the Fund to centrally clear certain interest rate and credit default index swaps through a clearinghouse or central counterparty (“CCP”). To clear a swap with a CCP, the Fund will submit the swap to, and post collateral with, a futures clearing merchant (“FCM”) that is a clearinghouse member. Alternatively, the Fund may enter into a swap with a financial institution other than the FCM (the “Executing Dealer”) and arrange for the swap to be transferred to the FCM for clearing. The Fund may also enter into a swap with the FCM itself. The CCP, the FCM, and the Executing Dealer are all subject to regulatory oversight by the U.S. Commodity Futures Trading Commission (“CFTC”). A default or failure by a CCP or an FCM, or the failure of a swap to be transferred from an Executing Dealer to the FCM for clearing, may expose the Fund to losses, increase its costs, or prevent the Fund from entering or exiting swap positions, accessing collateral, or fully implementing its investment strategies. The regulatory requirement to clear certain swaps could, either temporarily or permanently, reduce the liquidity of cleared swaps or increase the costs of entering into those swaps.
Index swaps, interest rate swaps, inflation swaps and credit default swaps are valued using an approved vendor supplied price. Basket swaps are valued using a broker supplied price. Equity swaps that consist of a single underlying equity are valued either at the closing price, the latest bid price, or the last sale price on the primary market or exchange it trades. The market value of swap contracts are aggregated by positive and negative values and are disclosed separately as an asset or liability on the Fund’s Statement of Assets and Liabilities (if applicable). Realized gains and losses are reported on the Fund’s Statement of Operations (if applicable). The change in unrealized net appreciation or depreciation during the year is included in the Statement of Operations (if applicable).
The Fund’s maximum risk of loss from counterparty risk or credit risk is the discounted value of the payments to be received from/paid to the counterparty over the contract’s remaining life, to the extent that the amount is positive. The risk is mitigated by having a netting arrangement between the Fund and the counterparty and by the posting of collateral by the counterparty to cover the Fund’s exposure to the counterparty.
The Fund may enter into various types of credit default swap agreements, including OTC credit default swap agreements, for investment purposes, to add leverage to its Fund, or to hedge against widening credit spreads on high-yield/high-risk bonds. Credit default swaps are a specific kind of counterparty agreement that allow the transfer of third party credit risk from one party to the other. One party in the swap is a lender and faces credit risk from a third party, and the counterparty in the credit default swap agrees to insure this risk in exchange for regular periodic payments. Credit default swaps could result in losses if the Fund does not correctly evaluate the creditworthiness of the company or companies on which the credit default swap is based. Credit default swap agreements may involve greater risks than if the Fund had invested in the reference obligation directly since, in addition to risks relating to the reference obligation, credit default swaps are subject to illiquidity risk, counterparty risk, and credit risk. The Fund will generally incur a greater degree of risk when it sells a credit default swap than when it purchases a credit default swap. As a buyer of a credit default swap, the Fund may lose its investment and recover nothing should no credit event occur and the swap is held to its termination date. As seller of a credit default swap, if a credit event were to occur, the value of any deliverable obligation received by the Fund, coupled with the upfront or periodic payments previously received, may be less than what it pays to the buyer, resulting in a loss of value to the Fund.
As a buyer of credit protection, the Fund is entitled to receive the par (or other agreed-upon) value of a referenced debt obligation from the counterparty to the contract in the event of a default or other credit event by a third party, such as a U.S. or foreign issuer, on the debt obligation. In return, the Fund as buyer would pay to the counterparty a periodic stream of payments over the term of the contract provided that no credit event has occurred. If no credit event occurs, the Fund would have spent the stream of payments and potentially received no benefit from the contract.
If the Fund is the seller of credit protection against a particular security, the Fund would receive an up-front or periodic payment to compensate against potential credit events. As the seller in a credit default swap contract, the Fund would be required to pay the par value (the “notional value”) (or other agreed-upon value) of a referenced debt obligation to
Janus Henderson Developed World Bond Fund
Notes to Financial Statements
the counterparty in the event of a default by a third party, such as a U.S. or foreign corporate issuer, on the debt obligation. In return, the Fund would receive from the counterparty a periodic stream of payments over the term of the contract provided that no event of default has occurred. If no default occurs, the Fund would keep the stream of payments and would have no payment obligations. As the seller, the Fund would effectively add leverage to its portfolio because, in addition to its total net assets, the Fund would be subject to investment exposure on the notional value of the swap. The maximum potential amount of future payments (undiscounted) that the Fund as a seller could be required to make in a credit default transaction would be the notional amount of the agreement.
The Fund may invest in single-name credit default swaps (“CDS”) to buy or sell credit protection to hedge its credit exposure, gain issuer exposure without owning the underlying security, or increase the Fund’s total return. Single-name CDS enable the Fund to buy or sell protection against a credit event of a specific issuer. When the Fund buys a single-name CDS, the Fund will receive a return on its investment only in the event of a credit event, such as default by the issuer of the underlying obligation (as opposed to a credit downgrade or other indication of financial difficulty). If a single-name CDS transaction is particularly large, or if the relevant market is illiquid, it may not be possible for the Fund to initiate a single-name CDS transaction or to liquidate its position at an advantageous time or price, which may result in significant losses. Moreover, the Fund bears the risk of loss of the amount expected to be received under a single-name CDS in the event of the default or bankruptcy of the counterparty. The risks associated with cleared single-name CDS may be lower than that for uncleared single-name CDS because for cleared single-name CDS, the counterparty is a clearinghouse (to the extent such a trading market is available). However, there can be no assurance that a clearinghouse or its members will satisfy their obligations to the Fund.
The Fund may invest in CDXs. A CDX is a swap on an index of credit default swaps. CDXs allow an investor to manage credit risk or take a position on a basket of credit entities (such as credit default swaps or commercial mortgage-backed securities) in a more efficient manner than transacting in a single-name CDS. If a credit event occurs in one of the underlying companies, the protection is paid out via the delivery of the defaulted bond by the buyer of protection in return for a payment of notional value of the defaulted bond by the seller of protection or it may be settled through a cash settlement between the two parties. The underlying company is then removed from the index. If the Fund holds a long position in a CDX, the Fund would indirectly bear its proportionate share of any expenses paid by a CDX. A Fund holding a long position in CDXs typically receives income from principal or interest paid on the underlying securities. By investing in CDXs, the Fund could be exposed to illiquidity risk, counterparty risk, and credit risk of the issuers of the underlying loan obligations and of the CDX markets. If there is a default by the CDX counterparty, the Fund will have contractual remedies pursuant to the agreements related to the transaction. CDXs also bear the risk that the Fund will not be able to meet its obligation to the counterparty.
During the year, the Fund purchased protection via the credit default swap market in order to reduce credit risk exposure to individual corporates, countries and/or credit indices where reducing this exposure via the cash bond market was less attractive.
3. Other Investments and Strategies
Market Risk
The Fund may be invested in lower-rated debt securities that have a higher risk of default or loss of value since these securities may be sensitive to economic changes, political changes, or adverse developments specific to the issuer.
The value of the Fund’s portfolio may decrease if the value of one or more issuers in the Fund’s portfolio decreases. Further, regardless of how well individual companies or securities perform, the value of the Fund’s portfolio could also decrease if there are deteriorating economic or market conditions, including, but not limited to, a general decline in prices on the stock markets, a general decline in real estate markets, a decline in commodities prices, or if the market favors different types of securities than the types of securities in which the Fund invests. If the value of the Fund’s portfolio decreases, the Fund’s NAV will also decrease, which means if you sell your shares in the Fund you may lose money. Market risk may affect a single issuer, industry, economic sector, or the market as a whole. The increasing interconnectivity between global economies and financial markets increases the likelihood that events or conditions in one region or financial market may adversely impact issuers in a different country, region or financial market. Social, political, economic and other conditions and events, such as natural disasters, health emergencies (e.g., epidemics and pandemics), terrorism, conflicts, including related sanctions, and social unrest, could reduce consumer demand or economic output, result in market closures, travel restrictions and/or quarantines, and generally have a significant impact on the global economies and financial markets.
Janus Henderson Developed World Bond Fund
Notes to Financial Statements
• COVID-19 Pandemic. The effects of COVID-19 have contributed to increased volatility in global financial markets and have affected and may continue to affect certain countries, regions, issuers, industries and market sectors more dramatically than others. These conditions and events could have a significant impact on the Fund and its investments, the Fund’s ability to meet redemption requests, and the processes and operations of the Fund’s service providers, including the Adviser.
• Russia/Ukraine Invasion. Russia launched a large-scale invasion of Ukraine on February 24, 2022. The extent and duration of the military action, resulting sanctions and resulting future market disruptions in the region are impossible to predict, but could be significant and have a severe adverse effect on the region, including significant negative impacts on the economy and the markets for certain securities and commodities, such as oil and natural gas, as well as other sectors.
Mortgage- and Asset-Backed Securities
Mortgage- and asset-backed securities represent interests in “pools” of commercial or residential mortgages or other assets, including consumer and commercial loans or receivables. The Fund may purchase fixed or variable rate commercial or residential mortgage-backed securities issued by the Government National Mortgage Association (“Ginnie Mae”), the Federal National Mortgage Association (“Fannie Mae”), the Federal Home Loan Mortgage Corporation (“Freddie Mac”), or other governmental or government-related entities. Ginnie Mae’s guarantees are backed as to the timely payment of principal and interest by the full faith and credit of the U.S. Government. Fannie Mae and Freddie Mac securities are not backed by the full faith and credit of the U.S. Government. In September 2008, the Federal Housing Finance Agency (“FHFA”), an agency of the U.S. Government, placed Fannie Mae and Freddie Mac under conservatorship. Since that time, Fannie Mae and Freddie Mac have received capital support through U.S. Treasury preferred stock purchases and Treasury and Federal Reserve purchases of their mortgage-backed securities. The FHFA and the U.S. Treasury have imposed strict limits on the size of these entities’ mortgage portfolios. The FHFA has the power to cancel any contract entered into by Fannie Mae and Freddie Mac prior to FHFA’s appointment as conservator or receiver, including the guarantee obligations of Fannie Mae and Freddie Mac.
The Fund may also purchase other mortgage- and asset-backed securities through single- and multi-seller conduits, collateralized debt obligations, structured investment vehicles, and other similar securities. Asset-backed securities may be backed by various consumer obligations, including automobile loans, equipment leases, credit card receivables, or other collateral. In the event the underlying loans are not paid, the securities’ issuer could be forced to sell the assets and recognize losses on such assets, which could impact your return. Unlike traditional debt instruments, payments on these securities include both interest and a partial payment of principal. Mortgage- and asset-backed securities are subject to both extension risk, where borrowers pay off their debt obligations more slowly in times of rising interest rates, and prepayment risk, where borrowers pay off their debt obligations sooner than expected in times of declining interest rates. These risks may reduce the Fund’s returns. In addition, investments in mortgage- and asset-backed securities, including those comprised of subprime mortgages, may be subject to a higher degree of credit risk, valuation risk, extension risk (if interest rates rise), and liquidity risk than various other types of fixed-income securities. Additionally, although mortgage-backed securities are generally supported by some form of government or private guarantee and/or insurance, there is no assurance that guarantors or insurers will meet their obligations.
Sovereign Debt
The Fund may invest in U.S. and non-U.S. government debt securities (“sovereign debt”). Some investments in sovereign debt, such as U.S. sovereign debt, are considered low risk. However, investments in sovereign debt, especially the debt of less developed countries, can involve a high degree of risk, including the risk that the governmental entity that controls the repayment of sovereign debt may not be willing or able to repay the principal and/or to pay the interest on its sovereign debt in a timely manner. A sovereign debtor’s willingness or ability to satisfy its debt obligation may be affected by various factors including, but not limited to, its cash flow situation, the extent of its foreign currency reserves, the availability of foreign exchange when a payment is due, the relative size of its debt position in relation to its economy as a whole, the sovereign debtor’s policy toward international lenders, and local political constraints to which the governmental entity may be subject. Sovereign debtors may also be dependent on expected disbursements from foreign governments, multilateral agencies, and other entities. The failure of a sovereign debtor to implement economic reforms, achieve specified levels of economic performance, or repay principal or interest when due may result in the cancellation of third party commitments to lend funds to the sovereign debtor, which may further impair such debtor’s ability or willingness to timely service its debts. The Fund may be requested to participate in the rescheduling of such sovereign debt and to extend further loans to governmental entities, which may adversely affect the Fund’s holdings. In
Janus Henderson Developed World Bond Fund
Notes to Financial Statements
the event of default, there may be limited or no legal remedies for collecting sovereign debt and there may be no bankruptcy proceedings through which the Fund may collect all or part of the sovereign debt that a governmental entity has not repaid. In addition, to the extent the Fund invests in non-U.S. sovereign debt, it may be subject to currency risk.
Counterparties
Fund transactions involving a counterparty are subject to the risk that the counterparty or a third party will not fulfill its obligation to the Fund (“counterparty risk”). Counterparty risk may arise because of the counterparty’s financial condition (i.e., financial difficulties, bankruptcy, or insolvency), market activities and developments, or other reasons, whether foreseen or not. A counterparty’s inability to fulfill its obligation may result in significant financial loss to the Fund. The Fund may be unable to recover its investment from the counterparty or may obtain a limited recovery, and/or recovery may be delayed. The extent of the Fund’s exposure to counterparty risk with respect to financial assets and liabilities approximates its carrying value. See the "Offsetting Assets and Liabilities" section of this Note for further details.
The Fund may be exposed to counterparty risk through participation in various programs, including, but not limited to, lending its securities to third parties, cash sweep arrangements whereby the Fund’s cash balance is invested in one or more types of cash management vehicles, as well as investments in, but not limited to, repurchase agreements, debt securities, and derivatives, including various types of swaps, futures and options. The Fund intends to enter into financial transactions with counterparties that the Adviser believes to be creditworthy at the time of the transaction. There is always the risk that the Adviser’s analysis of a counterparty’s creditworthiness is incorrect or may change due to market conditions. To the extent that the Fund focuses its transactions with a limited number of counterparties, it will have greater exposure to the risks associated with one or more counterparties.
Securities Lending
Under procedures adopted by the Trustees, the Fund may seek to earn additional income by lending securities to certain qualified broker-dealers and institutions. JPMorgan Chase Bank, National Association acts as securities lending agent and a limited purpose custodian or subcustodian to receive and disburse cash balances and cash collateral, hold short-term investments, hold collateral, and perform other custodial functions in accordance with the Non-Custodial Securities Lending Agreement. For financial reporting purposes, the Fund does not offset financial instruments’ payables and receivables and related collateral on the Statement of Assets and Liabilities. The Fund may lend fund securities in an amount equal to up to 1/3 of its total assets as determined at the time of the loan origination. There is the risk of delay in recovering a loaned security or the risk of loss in collateral rights if the borrower fails financially. In addition, the Adviser makes efforts to balance the benefits and risks from granting such loans. All loans will be continuously secured by collateral which may consist of cash, U.S. Government securities, domestic and foreign short-term debt instruments, letters of credit, time deposits, repurchase agreements, money market mutual funds or other money market accounts, or such other collateral as permitted by the SEC. If the Fund is unable to recover a security on loan, the Fund may use the collateral to purchase replacement securities in the market. There is a risk that the value of the collateral could decrease below the cost of the replacement security by the time the replacement investment is made, resulting in a loss to the Fund. In certain circumstances individual loan transactions could yield negative returns.
Upon receipt of cash collateral, the Adviser may invest it in affiliated or non-affiliated cash management vehicles, whether registered or unregistered entities, as permitted by the 1940 Act and rules promulgated thereunder. The Adviser currently intends to primarily invest the cash collateral in a cash management vehicle for which the Adviser serves as investment adviser, Janus Henderson Cash Collateral Fund LLC, or in time deposits. An investment in Janus Henderson Cash Collateral Fund LLC is generally subject to the same risks that shareholders experience when investing in similarly structured vehicles, such as the potential for significant fluctuations in assets as a result of the purchase and redemption activity of the securities lending program, a decline in the value of the collateral, and possible liquidity issues. Such risks may delay the return of the cash collateral and cause the Fund to violate its agreement to return the cash collateral to a borrower in a timely manner. As adviser to the Fund and Janus Henderson Cash Collateral Fund LLC, the Adviser has an inherent conflict of interest as a result of its fiduciary duties to both the Fund and Janus Henderson Cash Collateral Fund LLC. Additionally, the Adviser receives an investment advisory fee of 0.05% for managing Janus Henderson Cash Collateral Fund LLC, but it may not receive a fee for managing certain other affiliated cash management vehicles in which the Fund may invest, and therefore may have an incentive to allocate preferred investment opportunities to investment vehicles for which it is receiving a fee.
The value of the collateral must be at least 102% of the market value of the loaned securities that are denominated in U.S. dollars and 105% of the market value of the loaned securities that are not denominated in U.S. dollars. Loaned securities and related collateral are marked-to-market each business day based upon the market value of the loaned
Janus Henderson Developed World Bond Fund
Notes to Financial Statements
securities at the close of business, employing the most recent available pricing information. Collateral levels are then adjusted based on this mark-to-market evaluation. Additional required collateral, or excess collateral returned, is delivered on the next business day. Therefore, the value of the collateral held may be temporarily less than 102% or 105% value of the securities on loan. The cash collateral invested by the Adviser is disclosed in the Schedule of Investments (if applicable).
Income earned from the investment of the cash collateral, net of rebates paid to, or fees paid by, borrowers and less the fees paid to the lending agent are included as “Affiliated securities lending income, net” on the Statement of Operations. As of June 30, 2023, securities lending transactions accounted for as secured borrowings with an overnight and continuous contractual maturity are $3,339,181. Gross amounts of recognized liabilities for securities lending (collateral received) as of June 30, 2023 is $3,460,395, resulting in the net amount due to the counterparty of $121,214.
Offsetting Assets and Liabilities
The Fund presents gross and net information about transactions that are either offset in the financial statements or subject to an enforceable master netting arrangement or similar agreement with a designated counterparty, regardless of whether the transactions are actually offset in the Statement of Assets and Liabilities.
In order to better define its contractual rights and to secure rights that will help the Fund mitigate its counterparty risk, the Fund has entered into an International Swaps and Derivatives Association, Inc. Master Agreement (“ISDA Master Agreement”) or similar agreement with its derivative contract counterparties. An ISDA Master Agreement is a bilateral agreement between the Fund and a counterparty that governs OTC derivatives and forward foreign currency exchange contracts and typically contains, among other things, collateral posting terms and netting provisions in the event of a default and/or termination event. Under an ISDA Master Agreement, in the event of a default and/or termination event, the Fund may offset with each counterparty certain derivative financial instruments’ payables and/or receivables with collateral held and/or posted and create one single net payment.
The Offsetting Assets and Liabilities tables located in the Schedule of Investments present gross amounts of recognized assets and/or liabilities and the net amounts after deducting collateral that has been pledged by counterparties or has been pledged to counterparties (if applicable). For corresponding information grouped by type of instrument, see the “Fair Value of Derivative Instruments (not accounted for as hedging instruments) as of June 30, 2023” table located in the Fund’s Schedule of Investments.
The Fund may require the counterparty to pledge securities as collateral daily (based on the daily valuation of the financial asset) if the Fund has a net aggregate unrealized gain on OTC derivative contracts with a particular counterparty. The Fund may deposit cash as collateral with the counterparty and/or custodian daily (based on the daily valuation of the financial asset) if the Fund has a net aggregate unrealized loss on OTC derivative contracts with a particular counterparty. The collateral amounts are subject to minimum exposure requirements and initial margin requirements. Collateral amounts are monitored and subsequently adjusted up or down as valuations fluctuate by at least the minimum exposure requirement. Collateral may reduce the risk of loss.
The Fund generally does not exchange collateral on its forward foreign currency contracts with its counterparties; however, all liquid securities and restricted cash are considered to cover in an amount at all times equal to or greater than the Fund’s commitment with respect to these contracts. Certain securities may be segregated at the Fund’s custodian. These segregated securities are denoted on the accompanying Schedule of Investments and are evaluated daily to ensure their cover and/or market value equals or exceeds the Fund’s corresponding forward foreign currency exchange contract's obligation value.
4. Investment Advisory Agreements and Other Transactions with Affiliates
The Fund pays the Adviser an investment advisory fee which is calculated daily and paid monthly. The following table reflects the Fund’s contractual investment advisory fee rate (expressed as an annual rate).
| | |
Average Daily Net Assets of the Fund | Contractual Investment Advisory Fee (%) |
First $1 Billion | 0.55 |
Next $500 Million | 0.50 |
Above $1.5 Billion | 0.45 |
Janus Henderson Developed World Bond Fund
Notes to Financial Statements
The Fund’s actual investment advisory fee rate for the reporting period was 0.52% of average annual net assets before any applicable waivers.
The Adviser has entered into a personnel-sharing arrangement with its foreign (non-U.S.) affiliates, Henderson Global Investors Limited, Henderson Global Investors (Japan) Ltd., and Henderson Global Investors (Singapore) Ltd. (collectively, “HGIL”), pursuant to which HGIL and certain employees of HGIL serve as “associated persons” of the Adviser. In this capacity, such employees of HGIL are subject to the oversight and supervision of the Adviser and may provide portfolio management, research, and related services to the Fund on behalf of the Adviser.
The Adviser has contractually agreed to waive the advisory fee and/or reimburse operating expenses to the extent that the Fund’s total annual fund operating expenses, excluding the fees payable pursuant to a Rule 12b-1 plan, shareholder servicing fees, such as transfer agency fees (but excluding out-of-pocket costs), brokerage commissions, interest, dividends, taxes, acquired fund fees and expenses, and extraordinary expenses, exceed the annual rate of 0.57% of the Fund’s average daily net assets. The Adviser has agreed to continue the waivers for at least a one-year period commencing October 28, 2022. Networking/omnibus fees and out-of-pocket transfer agency fees were not waived under the Fund’s prior expense limitation agreement. If applicable, amounts waived and/or reimbursed to the Fund by the Adviser are disclosed as “Excess Expense Reimbursement and Waivers” on the Statement of Operations.
The Adviser serves as administrator to the Fund pursuant to an administration agreement between the Adviser and the Trust. Under the administration agreement, the Adviser is authorized to perform, or cause others to perform certain administration, compliance, and accounting services to the Fund, including providing office space for the Fund, and is reimbursed by the Fund for certain of its costs in providing these services (to the extent the Adviser seeks reimbursement and such costs are not otherwise waived). In addition, employees of the Adviser and/or its affiliates may serve as officers of the Trust. The Fund pays for some or all of the salaries, fees, and expenses of the Adviser employees and Fund officers, with respect to certain specified administration functions they perform on behalf of the Fund. The Fund pays these costs based on out-of-pocket expenses incurred by the Adviser, and these costs are separate and apart from advisory fees and other expenses paid in connection with the investment advisory services the Adviser (or any subadvisor, as applicable) provides to the Fund. These amounts are disclosed as “Affiliated fund administration fees” on the Statement of Operations. In addition, some expenses related to compensation payable to the Fund’s Chief Compliance Officer and certain compliance staff, all of whom are employees of the Adviser and/or its affiliates, are shared with the Fund. Total compensation of $343,237 was paid to the Chief Compliance Officer and certain compliance staff by the Trust during the year ended June 30, 2023. The Fund's portion is reported as part of “Other expenses” on the Statement of Operations.
Janus Henderson Services US LLC (the “Transfer Agent”), a wholly-owned subsidiary of the Adviser, is the Fund’s transfer agent. The Transfer Agent provides or arranges for the provision of shareholder services including, but not limited to, recordkeeping, subaccounting, answering inquiries regarding accounts, order processing, transaction confirmations, the mailing of prospectuses and shareholder reports, and other shareholder services provided to or on behalf of shareholders. These amounts are disclosed as “Transfer agent administrative fees and expenses” on the Statement of Operations.
Class D Shares of the Fund pay the Transfer Agent an annual administrative services fee based on the average daily net assets of Class D Shares as detailed below.
| | |
Average Daily Net Assets of Class D Shares of the Janus Henderson funds | Administrative Services Fee |
Under $40 billion | 0.12% |
$40 billion – $49.9 billion | 0.10% |
Over $49.9 billion | 0.08% |
During the reporting period, the administrative services fee rate was 0.12%.
The Transfer Agent receives an administrative services fee at an annual rate of up to 0.25% of the average daily net assets of the Fund’s Class S Shares and Class T Shares for providing or procuring administrative services to investors in Class S Shares and Class T Shares of the Fund. The Transfer Agent expects to use all or a significant portion of this fee to compensate retirement plan service providers, broker-dealers, bank trust departments, financial advisors, and other financial intermediaries for providing these services. The Transfer Agent may keep certain amounts retained for reimbursement of out-of-pocket costs incurred for servicing clients of Class S Shares and Class T Shares.
Janus Henderson Developed World Bond Fund
Notes to Financial Statements
Shareholder Services provided by these financial intermediaries may include, but are not limited to, recordkeeping, subaccounting, order processing, providing order confirmations, periodic statements, forwarding prospectuses, shareholder reports, and other materials to existing customers, answering inquiries regarding accounts, and other administrative services. Order processing includes the submission of transactions through the National Securities Clearing Corporation (“NSCC”) or similar systems, or those processed on a manual basis with the Adviser. For all share classes, the Transfer Agent also seeks reimbursement for costs it incurs as transfer agent and for providing servicing.
Certain, but not all, intermediaries may charge administrative fees to investors in Class A Shares, Class C Shares, and Class I Shares for administrative services provided on behalf of such investors. These administrative fees are paid by the Class A Shares, Class C Shares, and Class I Shares of the Fund to the Transfer Agent, which uses such fees to reimburse intermediaries. Consistent with the Transfer Agency Agreement between the Transfer Agent and the Fund, the Transfer Agent may negotiate the level, structure, and/or terms of the administrative fees with intermediaries requiring such fees on behalf of the Fund. The Adviser and its affiliates benefit from an increase in assets that may result from such relationships. The Adviser has agreed to limit these fees up to 0.20% for Class A Shares and Class C Shares, and up to 0.15% for Class I Shares on an annual basis based on the daily net assets of each share class. Such limits are subject to change by the Trustees in the future. These amounts are disclosed as “Transfer agent networking and omnibus fees” on the Statement of Operations.
The Transfer Agent is not compensated for its services related to the shares, except for out-of-pocket costs, although the Transfer Agent is compensated for its services related to Fund’s Class D Shares. These amounts are disclosed as “Other transfer agent fees and expenses” on the Statement of Operations.
Under distribution and shareholder servicing plans (the “Plans”) adopted in accordance with Rule 12b-1 under the 1940 Act, the Fund pays the Trust’s distributor, the Distributor, a wholly-owned subsidiary of the Adviser, a fee for the sale and distribution and/or shareholder servicing of the shares based on the average daily net assets for each share class at an annual rate of up to 0.25% for Class A Shares, up to 1.00% for Class C Shares, and up to 0.25% for Class S Shares. Under the terms of the Plans, the Trust is authorized to make payments to the Distributor for remittance to retirement plan service providers, broker-dealers, bank trust departments, financial advisors, and other financial intermediaries, as compensation for distribution and/or shareholder services performed by such entities for their customers who are investors in the Fund. These amounts are disclosed as “12b-1 Distribution and shareholder servicing fees” on the Statement of Operations.
Class A Shares include a 4.75% upfront sales charge of the offering price of the Fund. The sales charge is allocated between the Distributor and financial intermediaries. During the year ended June 30, 2023, the Distributor retained upfront sales charges of $960.
A contingent deferred sales charge (“CDSC”) of 1.00% will be deducted with respect to Class A Shares purchased without a sales load and redeemed within 12 months of purchase, unless waived. Any applicable CDSC will be 1.00% of the lesser of the original purchase price or the value of the redemption of the Class A Shares redeemed. There were no CDSCs paid by redeeming shareholders of Class A Shares to the Distributor during the year ended June 30, 2023.
A CDSC of 1.00% will be deducted with respect to Class C Shares redeemed within 12 months of purchase, unless waived. Any applicable CDSC will be 1.00% of the lesser of the original purchase price or the value of the redemption of the Class C Shares redeemed. During the year ended June 30, 2023, redeeming shareholders of Class C Shares paid CDSCs of $2,828.
The Board of Trustees has adopted a deferred compensation plan (the “Deferred Plan”) for independent Trustees to elect to defer receipt of all or a portion of the annual compensation they are entitled to receive from the Fund. All deferred fees are credited to an account established in the name of the Trustees. The amounts credited to the account then increase or decrease, as the case may be, in accordance with the performance of one or more of the Janus Henderson funds that are selected by the Trustees. The account balance continues to fluctuate in accordance with the performance of the selected fund or funds until final payment of all amounts are credited to the account. The fluctuation of the account balance is recorded by the Fund as unrealized appreciation/(depreciation) and is included as of June 30, 2023 on the Statement of Assets and Liabilities in the asset, “Trustees’ deferred compensation,” and liability, “Trustees’ deferred compensation fees.” Additionally, the recorded unrealized appreciation/(depreciation) is included in “Total distributable earnings (loss)” on the Statement of Assets and Liabilities. Deferred compensation expenses for the year ended June 30, 2023 are included in “Trustees’ fees and expenses” on the Statement of Operations. Trustees are allowed to change their designation of mutual funds from time to time. Amounts will be deferred until distributed in
Janus Henderson Developed World Bond Fund
Notes to Financial Statements
accordance with the Deferred Plan. Deferred fees of $426,025 were paid by the Trust to the Trustees under the Deferred Plan during the year ended June 30, 2023.
Pursuant to the provisions of the 1940 Act and related rules, the Fund may participate in an affiliated or non-affiliated cash sweep program. In the cash sweep program, uninvested cash balances of the Fund may be used to purchase shares of affiliated or non-affiliated money market funds or cash management pooled investment vehicles that operate as money market funds. The Fund is eligible to participate in the cash sweep program (the “Investing Funds”). The Adviser has an inherent conflict of interest because of its fiduciary duties to the affiliated money market funds or cash management pooled investment vehicles and the Investing Funds. Janus Henderson Cash Liquidity Fund LLC (the “Sweep Vehicle”) is an affiliated unregistered cash management pooled investment vehicle that invests primarily in highly-rated short-term fixed-income securities. The Sweep Vehicle operates pursuant to the provisions of the 1940 Act that govern the operation of money market funds and prices its shares at NAV reflecting market-based values of its portfolio securities (i.e., a “floating” NAV) rounded to the fourth decimal place (e.g., $1.0000). The Sweep Vehicle is permitted to impose a liquidity fee (of up to 2%) on redemptions from the Sweep Vehicle or a redemption gate that temporarily suspends redemptions from the Sweep Vehicle for up to 10 business days during a 90 day period. There are no restrictions on the Fund's ability to withdraw investments from the Sweep Vehicle at will, and there are no unfunded capital commitments due from the Fund to the Sweep Vehicle. The Sweep Vehicle does not charge any management fee, sales charge or service fee.
Any purchases and sales, realized gains/losses and recorded dividends from affiliated investments during the year ended June 30, 2023 can be found in the “Schedules of Affiliated Investments” located in the Schedule of Investments.
5. Federal Income Tax
The tax components of capital shown in the table below represent: (1) distribution requirements the Fund must satisfy under the income tax regulations; (2) losses or deductions the Fund may be able to offset against income and gains realized in future years; and (3) unrealized appreciation or depreciation of investments for federal income tax purposes.
Other book to tax differences primarily consist of deferred compensation, derivatives, and foreign currency contract adjustments. The Fund has elected to treat gains and losses on forward foreign currency contracts as capital gains and losses, if applicable. Other foreign currency gains and losses on debt instruments are treated as ordinary income for federal income tax purposes pursuant to Section 988 of the Internal Revenue Code.
| | | | | | | |
| | | | Other Book | Net Tax | |
Undistributed
Ordinary Income | Undistributed
Long-Term Gains | Accumulated
Capital Losses | Loss Deferrals | to Tax
Differences | Appreciation/
(Depreciation) | |
$ - | $ - | $(354,404,536) | $ (93,046,363) | $ (879,656) | $(154,960,057) | |
The Fund has elected to defer qualified late-year losses. These losses will be deferred for tax purposes and recognized during the next fiscal year.
Accumulated capital losses noted below represent net capital loss carryovers, as of June 30, 2023, that may be available to offset future realized capital gains and thereby reduce future taxable gains distributions. The following table shows these capital loss carryovers.
| | | | | | |
| | | | | |
Capital Loss Carryover Schedule | | |
For the year ended June 30, 2023 | | |
| No Expiration | | | |
| Short-Term | Long-Term | Accumulated
Capital Losses | | |
| $(193,724,124) | $(160,680,412) | $ (354,404,536) | | |
Janus Henderson Developed World Bond Fund
Notes to Financial Statements
The aggregate cost of investments and the composition of unrealized appreciation and depreciation of investment securities for federal income tax purposes as of June 30, 2023 are noted below. The primary difference between book and tax appreciation or depreciation of investments are wash sale loss deferrals and investments in partnerships.
| | | | |
Federal Tax Cost | Unrealized
Appreciation | Unrealized
(Depreciation) | Net Tax Appreciation/
(Depreciation) |
$ 1,674,564,420 | $ 2,992,752 | $(157,952,809) | $ (154,960,057) |
Information on the tax components of derivatives as of June 30, 2023 is as follows:
| | | | |
Federal Tax Cost | Unrealized
Appreciation | Unrealized
(Depreciation) | Net Tax Appreciation/
(Depreciation) |
$(13,637,654) | $ - | $ (809,120) | $ (809,120) |
Tax cost of investments and unrealized appreciation/(depreciation) may also include timing differences that do not constitute adjustments to tax basis.
Income and capital gains distributions are determined in accordance with income tax regulations that may differ from US GAAP. These differences are due to differing treatments for items such as net short-term gains, deferral of wash sale losses, foreign currency transactions, and capital loss carryovers. Certain permanent differences such as tax returns of capital and net investment losses noted below have been reclassified to capital.
| | | | | |
For the year ended June 30, 2023 | |
Distributions | | |
From Ordinary Income | From Long-Term Capital Gains | Tax Return of Capital | Net Investment Loss | |
$ 151,233,489 | $ - | $ - | $ - | |
| | | | | |
For the year ended June 30, 2022 | |
Distributions | | |
From Ordinary Income | From Long-Term Capital Gains | Tax Return of Capital | Net Investment Loss | |
$ 39,647,438 | $ - | $ - | $ - | |
Permanent book to tax basis differences may result in reclassifications between the components of net assets. These differences have no impact on the results of operations or net assets.
Janus Henderson Developed World Bond Fund
Notes to Financial Statements
6. Capital Share Transactions
| | | | | | | |
| | | | | | |
| | Year ended June 30, 2023 | | Year ended June 30, 2022 |
| | Shares | Amount | | Shares | Amount |
| | | | | | | |
Class A Shares: | | | | | |
Shares sold | 1,825,554 | $ 14,740,687 | | 3,724,450 | $ 36,170,406 |
Reinvested dividends and distributions | 652,142 | 5,051,901 | | 128,149 | 1,221,106 |
Shares repurchased | (3,656,662) | (29,898,015) | | (6,109,525) | (57,667,456) |
Net Increase/(Decrease) | (1,178,966) | $ (10,105,427) | | (2,256,926) | $ (20,275,944) |
Class C Shares: | | | | | |
Shares sold | 215,007 | $ 1,727,806 | | 509,317 | $ 4,920,366 |
Reinvested dividends and distributions | 195,316 | 1,497,608 | | 17,675 | 165,894 |
Shares repurchased | (1,288,629) | (10,309,251) | | (1,125,213) | (10,596,810) |
Net Increase/(Decrease) | (878,306) | $ (7,083,837) | | (598,221) | $ (5,510,550) |
Class D Shares: | | | | | |
Shares sold | 477,478 | $ 3,798,154 | | 713,782 | $ 6,955,172 |
Reinvested dividends and distributions | 286,006 | 2,216,282 | | 51,468 | 489,636 |
Shares repurchased | (756,072) | (6,049,801) | | (1,249,560) | (12,010,633) |
Net Increase/(Decrease) | 7,412 | $ (35,365) | | (484,310) | $ (4,565,825) |
Class I Shares: | | | | | |
Shares sold | 95,536,255 | $ 778,007,707 | | 120,461,770 | $1,155,949,553 |
Reinvested dividends and distributions | 15,329,937 | 118,519,077 | | 3,350,139 | 31,715,689 |
Shares repurchased | (163,752,700) | (1,324,933,832) | | (120,336,993) | (1,118,613,332) |
Net Increase/(Decrease) | (52,886,508) | $ (428,407,048) | | 3,474,916 | $ 69,051,910 |
Class N Shares: | | | | | |
Shares sold | 6,992,628 | $ 55,766,678 | | 11,532,890 | $ 109,974,619 |
Reinvested dividends and distributions | 1,243,015 | 9,607,045 | | 165,644 | 1,547,996 |
Shares repurchased | (6,420,382) | (52,193,097) | | (4,004,887) | (37,338,302) |
Net Increase/(Decrease) | 1,815,261 | $ 13,180,626 | | 7,693,647 | $ 74,184,313 |
Class S Shares: | | | | | |
Shares sold | 2,505 | $ 20,204 | | 24,245 | $ 238,399 |
Reinvested dividends and distributions | 5,451 | 42,120 | | 701 | 6,612 |
Shares repurchased | (13,706) | (112,771) | | (10,017) | (94,172) |
Net Increase/(Decrease) | (5,750) | $ (50,447) | | 14,929 | $ 150,839 |
Class T Shares: | | | | | |
Shares sold | 1,829,763 | $ 14,844,807 | | 2,830,394 | $ 27,554,407 |
Reinvested dividends and distributions | 559,121 | 4,332,015 | | 137,011 | 1,307,056 |
Shares repurchased | (6,221,943) | (49,849,879) | | (6,204,046) | (58,775,990) |
Net Increase/(Decrease) | (3,833,059) | $ (30,673,057) | | (3,236,641) | $ (29,914,527) |
7. Purchases and Sales of Investment Securities
For the year ended June 30, 2023, the aggregate cost of purchases and proceeds from sales of investment securities (excluding any short-term securities, short-term options contracts, TBAs, and in-kind transactions, as applicable) was as follows:
| | | | |
Purchases of
Securities | Proceeds from Sales
of Securities | Purchases of Long-
Term U.S. Government
Obligations | Proceeds from Sales
of Long-Term U.S.
Government Obligations |
$933,593,630 | $1,280,314,524 | $ 91,756,252 | $ 337,164,557 |
Janus Henderson Developed World Bond Fund
Notes to Financial Statements
8. Subsequent Event
Management has evaluated whether any events or transactions occurred subsequent to June 30, 2023 and through the date of issuance of the Fund’s financial statements and determined that there were no material events or transactions that would require recognition or disclosure in the Fund’s financial statements.
Janus Henderson Developed World Bond Fund
Report of Independent Registered Public Accounting Firm
To the Board of Trustees of Janus Investment Fund and Shareholders of Janus Henderson Developed World Bond Fund
Opinion on the Financial Statements
We have audited the accompanying statement of assets and liabilities, including the schedule of investments, of Janus Henderson Developed World Bond Fund (one of the funds constituting Janus Investment Fund, referred to hereafter as the "Fund") as of June 30, 2023, the related statement of operations for the year ended June 30, 2023, the statements of changes in net assets for each of the two years in the period ended June 30, 2023, including the related notes, and the financial highlights for each of the five years in the period ended June 30, 2023 (collectively referred to as the “financial statements”). In our opinion, the financial statements present fairly, in all material respects, the financial position of the Fund as of June 30, 2023, the results of its operations for the year then ended, the changes in its net assets for each of the two years in the period ended June 30, 2023 and the financial highlights for each of the five years in the period ended June 30, 2023 in conformity with accounting principles generally accepted in the United States of America.
Basis for Opinion
These financial statements are the responsibility of the Fund’s management. Our responsibility is to express an opinion on the Fund’s financial statements based on our audits. We are a public accounting firm registered with the Public Company Accounting Oversight Board (United States) (PCAOB) and are required to be independent with respect to the Fund in accordance with the U.S. federal securities laws and the applicable rules and regulations of the Securities and Exchange Commission and the PCAOB.
We conducted our audits of these financial statements in accordance with the standards of the PCAOB. Those standards require that we plan and perform the audit to obtain reasonable assurance about whether the financial statements are free of material misstatement, whether due to error or fraud.
Our audits included performing procedures to assess the risks of material misstatement of the financial statements, whether due to error or fraud, and performing procedures that respond to those risks. Such procedures included examining, on a test basis, evidence regarding the amounts and disclosures in the financial statements. Our audits also included evaluating the accounting principles used and significant estimates made by management, as well as evaluating the overall presentation of the financial statements. Our procedures included confirmation of securities owned as of June 30, 2023 by correspondence with the custodian, transfer agent and brokers. We believe that our audits provide a reasonable basis for our opinion.

Denver, Colorado
August 21, 2023
We have served as the auditor of one or more investment companies in Janus Henderson Funds since 1990.
Janus Henderson Developed World Bond Fund
Additional Information (unaudited)
Proxy Voting Policies and Voting Record
A description of the policies and procedures that the Fund uses to determine how to vote proxies relating to its portfolio securities is available without charge: (i) upon request, by calling 1-800-525-1093; (ii) on the Fund’s website at janushenderson.com/proxyvoting; and (iii) on the SEC’s website at http://www.sec.gov. Additionally, information regarding the Fund’s proxy voting record for the most recent twelve-month period ended June 30 is also available, free of charge, through janushenderson.com/proxyvoting and from the SEC’s website at http://www.sec.gov.
Full Holdings
The Fund files its complete portfolio holdings (schedule of investments) with the SEC as an exhibit to Form N-PORT within 60 days of the end of the first and third fiscal quarters, and in the annual report and semiannual report to shareholders. The Fund’s Form N-PORT filings and annual and semiannual reports: (i) are available on the SEC’s website at http://www.sec.gov; and (ii) are available without charge, upon request, by calling a Janus Henderson representative at 1-877-335-2687 (toll free) (or 1-800-525-3713 if you hold Class D shares). Portfolio holdings consisting of at least the names of the holdings are generally available on a monthly basis with a 30-day lag under Full Holdings for the Fund at janushenderson.com/info (or janushenderson.com/reports if you hold Class D Shares).
APPROVAL OF ADVISORY AGREEMENTS DURING THE PERIOD
The Trustees of Janus Aspen Series, each of whom serves as an “independent” Trustee (the “Trustees”), oversee the management of each portfolio of Janus Aspen Series (each, a “VIT Portfolio,” and collectively, the “VIT Portfolios”), as well as each fund of Janus Investment Fund (each, a “Fund,” and collectively, the “Funds” and together with the VIT Portfolios, the “Janus Henderson Funds,” and each, a “Janus Henderson Fund”). As required by law, the Trustees determine annually whether to continue the investment advisory agreement for each Janus Henderson Fund.
In connection with their most recent consideration of those agreements for each Janus Henderson Fund, the Trustees received and reviewed information provided by Janus Henderson Investors US LLC (the “Adviser”) in response to requests of the Trustees and their independent legal counsel. They also received and reviewed information and analysis provided by, and in response to requests of, their independent fee consultant. Throughout their consideration of the agreements, the Trustees were advised by their independent legal counsel. The Trustees met with management to consider the agreements, and also met separately in executive session with their independent legal counsel and their independent fee consultant.
At meetings held on November 9-10, 2022 and December 13-14, 2022, the Trustees evaluated the information provided by the Adviser and the independent fee consultant, as well as other information provided by the Adviser and the independent fee consultant during the year. Following such evaluation, the Trustees determined that the overall arrangements between each Janus Henderson Fund and the Adviser were fair and reasonable in light of the nature, extent, and quality of the services provided by the Adviser and its affiliates, the fees charged for those services, and other matters that the Trustees considered relevant in the exercise of their business judgment, and unanimously approved the continuation of the investment advisory agreement for each Janus Henderson Fund for the period from February 1, 2023 through February 1, 2024, subject to earlier termination as provided for in each agreement.
In considering the continuation of those agreements, the Trustees reviewed and analyzed various factors that they determined were relevant, including the factors described below, none of which by itself was considered dispositive. However, the material factors and conclusions that formed the basis for the Trustees’ determination to approve the continuation of the agreements are discussed separately below. Also included is a summary of the independent fee consultant’s conclusions and opinions that arose during, and were included as part of, the Trustees’ consideration of the agreements. “Management fees,” as used herein, reflect actual annual advisory fees and, for the purpose of peer comparisons any administration fees (excluding out of pocket costs), net of any waivers, paid by a fund as a percentage of average net assets.
Nature, Extent and Quality of Services
The Trustees reviewed the nature, extent, and quality of the services provided by the Adviser to the Janus Henderson Funds, taking into account the investment objective, strategies, and policies of each Janus Henderson Fund, and the knowledge the Trustees gained from their regular meetings with management on at least a quarterly basis and their ongoing review of information related to the Janus Henderson Funds. In addition, the Trustees reviewed the resources and key personnel of the Adviser, particularly noting those employees who provide investment and risk management services to the Janus Henderson Funds. The Trustees also considered other services provided to the Janus Henderson
Janus Henderson Developed World Bond Fund
Additional Information (unaudited)
Funds by the Adviser, such as managing the execution of portfolio transactions and the selection of broker-dealers for those transactions. The Trustees considered the Adviser’s role as administrator to the Janus Henderson Funds, noting that the Adviser generally does not receive a fee for its services as administrator, but is reimbursed for its out-of-pocket costs. The Trustees considered the role of the Adviser in monitoring adherence to the Janus Henderson Funds’ investment restrictions, providing support services for the Trustees and Trustee committees, and overseeing communications with Janus Henderson Fund shareholders and the activities of other service providers, including monitoring compliance with various policies and procedures of the Janus Henderson Funds and with applicable securities laws and regulations.
In this regard, the independent fee consultant noted that the Adviser provides a number of different services for the Janus Henderson Funds and their shareholders, ranging from investment management services to various other servicing functions, and that, in its view, the Adviser is a capable provider of those services. The independent fee consultant also provided its belief that the Adviser has developed a number of institutional competitive advantages that should enable it to provide superior investment and service performance over the long term.
The Trustees concluded that the nature, extent, and quality of the services provided by the Adviser to each Janus Henderson Fund were appropriate and consistent with the terms of the respective advisory agreements, and that, taking into account steps taken to address those Janus Henderson Funds whose performance lagged that of their peers for certain periods, the Janus Henderson Funds were likely to benefit from the continued provision of those services. They also concluded that the Adviser had sufficient personnel, with the appropriate education and experience, to serve the Janus Henderson Funds effectively and had demonstrated its ability to attract well-qualified personnel.
Performance of the Funds
The Trustees considered the performance results of each Janus Henderson Fund over various time periods. They noted that they considered Janus Henderson Fund performance data throughout the year, including periodic meetings with each Janus Henderson Fund’s portfolio manager(s), and also reviewed information comparing each Janus Henderson Fund’s performance with the performance of comparable fund peer groups identified by Broadridge Financial Solutions, Inc. (“Broadridge”), an independent data provider, and with the Janus Henderson Fund’s benchmark index. In this regard, the independent fee consultant found that the overall Janus Henderson Funds’ performance has been reasonable, noting that: (i) for the 36 months ended May 31, 2022, approximately 38% of the Janus Henderson Funds were in the top two quartiles of their Broadridge peer groups; (ii) for the 36 months ended September 30, 2022, approximately 45% of the Janus Henderson Funds were in the top two quartiles of performance as reported by Morningstar, and (iii) for the 12 months ended September 30, 2022, approximately 55% of the Janus Henderson Funds were in the top two quartiles of performance as reported by Morningstar.
The Trustees considered the performance of each Janus Henderson Fund, noting that performance may vary by share class, and noted the following with respect to the Funds:
Asset Allocation Funds
· For Janus Henderson Global Allocation Fund – Conservative, the Trustees noted that the Fund’s performance was in the third Broadridge quartile for the 36 months ended May 31, 2022 and the bottom Broadridge quartile for the 12 months ended May 31, 2022. The Trustees noted the reasons for the Fund’s underperformance and the steps the Adviser had taken or was taking to improve performance.
· For Janus Henderson Global Allocation Fund – Growth, the Trustees noted that the Fund’s performance was in the bottom Broadridge quartile for the 36 months ended May 31, 2022 and the bottom Broadridge quartile for the 12 months ended May 31, 2022. The Trustees noted the reasons for the Fund’s underperformance and the steps the Adviser had taken or was taking to improve performance.
· For Janus Henderson Global Allocation Fund – Moderate, the Trustees noted that the Fund’s performance was in the bottom Broadridge quartile for the 36 months ended May 31, 2022 and the bottom Broadridge quartile for the 12 months ended May 31, 2022. The Trustees noted the reasons for the Fund’s underperformance and the steps the Adviser had taken or was taking to improve performance.
Fixed-Income Funds
· For Janus Henderson Absolute Return Income Opportunities Fund, the Trustees noted that the Fund’s performance was in the third Broadridge quartile for the 36 months ended May 31, 2022 and the first Broadridge
Janus Henderson Developed World Bond Fund
Additional Information (unaudited)
quartile for the 12 months ended May 31, 2022. The Trustees noted the reasons for the Fund’s underperformance, the steps the Adviser had taken or was taking to improve performance, and that the performance trend was improving.
· For Janus Developed World Bond Fund, the Trustees noted that the Fund’s performance was in the bottom Broadridge quartile for the 36 months ended May 31, 2022 and the bottom Broadridge quartile for the 12 months ended May 31, 2022. The Trustees noted the reasons for the Fund’s underperformance and the steps the Adviser had taken or was taking to improve performance.
· For Janus Henderson Flexible Bond Fund, the Trustees noted that the Fund’s performance was in the first Broadridge quartile for the 36 months ended May 31, 2022 and the second Broadridge quartile for the 12 months ended May 31, 2022.
· For Janus Henderson Global Bond Fund, the Trustees noted that the Fund’s performance was in the third Broadridge quartile for the 36 months ended May 31, 2022 and the bottom Broadridge quartile for the 12 months ended May 31, 2022. The Trustees noted the reasons for the Fund’s underperformance and the steps the Adviser had taken or was taking to improve performance.
· For Janus Henderson High-Yield Fund, the Trustees noted that the Fund’s performance was in the third Broadridge quartile for the 36 months ended May 31, 2022 and the bottom Broadridge quartile for the 12 months ended May 31, 2022. The Trustees noted the reasons for the Fund’s underperformance and the steps the Adviser had taken or was taking to improve performance.
· For Janus Henderson Multi-Sector Income Fund, the Trustees noted that the Fund’s performance was in the second Broadridge quartile for the 36 months ended May 31, 2022 and the third Broadridge quartile for the 12 months ended May 31, 2022.
· For Janus Henderson Short Duration Flexible Bond Fund, the Trustees noted that the Fund’s performance was in the third Broadridge quartile for the 36 months ended May 31, 2022 and the bottom Broadridge quartile for the 12 months ended May 31, 2022. The Trustees noted the reasons for the Fund’s underperformance and the steps the Adviser had taken or was taking to improve performance.
Global and International Equity Funds
· For Janus Henderson Asia Equity Fund, the Trustees noted that the Fund’s performance was in the third Broadridge quartile for the 36 months ended May 31, 2022 and the third Broadridge quartile for the 12 months ended May 31, 2022. The Trustees noted the reasons for the Fund’s underperformance, while also noting that the Fund has a performance fee structure that results in lower management fees during periods of underperformance, and the steps the Adviser had taken or was taking to improve performance.
· For Janus Henderson Emerging Markets Fund, the Trustees noted that the Fund’s performance was in the third Broadridge quartile for the 36 months ended May 31, 2022 and the third Broadridge quartile for the 12 months ended May 31, 2022. The Trustees noted the reasons for the Fund’s underperformance and the steps the Adviser had taken or was taking to improve performance.
· For Janus Henderson European Focus Fund, the Trustees noted that the Fund’s performance was in the first Broadridge quartile for the 36 months ended May 31, 2022 and the second Broadridge quartile for the 12 months ended May 31, 2022.
· For Janus Henderson Global Equity Income Fund, the Trustees noted that the Fund’s performance was in the third Broadridge quartile for the 36 months ended May 31, 2022 and the first Broadridge quartile for the 12 months ended May 31, 2022. The Trustees noted the reasons for the Fund’s underperformance, the steps the Adviser had taken or was taking to improve performance, and that the performance trend was improving.
· For Janus Henderson Global Life Sciences Fund, the Trustees noted that the Fund’s performance was in the third Broadridge quartile for the 36 months ended May 31, 2022 and the second Broadridge quartile for the 12 months ended May 31, 2022. The Trustees noted the reasons for the Fund’s underperformance, the steps the Adviser had taken or was taking to improve performance, and that the performance trend was improving.
Janus Henderson Developed World Bond Fund
Additional Information (unaudited)
· For Janus Henderson Global Sustainable Equity Fund, the Trustees noted that the Fund’s performance was in the second Broadridge quartile for the 12 months ended May 31, 2022. The Trustees noted that 36 month-end performance was not yet available.
· For Janus Henderson Global Real Estate Fund, the Trustees noted that the Fund’s performance was in the second Broadridge quartile for the 36 months ended May 31, 2022 and the bottom Broadridge quartile for the 12 months ended May 31, 2022.
· For Janus Henderson Global Research Fund, the Trustees noted that the Fund’s performance was in the second Broadridge quartile for the 36 months ended May 31, 2022 and the first Broadridge quartile for the 12 months ended May 31, 2022.
· For Janus Henderson Global Select Fund, the Trustees noted that the Fund’s performance was in the first Broadridge quartile for the 36 months ended May 31, 2022 and the first Broadridge quartile for the 12 months ended May 31, 2022.
· For Janus Henderson Global Technology and Innovation Fund, the Trustees noted that the Fund’s performance was in the second Broadridge quartile for the 36 months ended May 31, 2022 and the second Broadridge quartile for the 12 months ended May 31, 2022.
· For Janus Henderson International Opportunities Fund, the Trustees noted that the Fund’s performance was in the bottom Broadridge quartile for the 36 months ended May 31, 2022 and the third Broadridge quartile for the 12 months ended May 31, 2022. The Trustees noted the reasons for the Fund’s underperformance and the steps the Adviser had taken or was taking to improve performance.
· For Janus Henderson Overseas Fund, the Trustees noted that the Fund’s performance was in the first Broadridge quartile for the 36 months ended May 31, 2022 and the first Broadridge quartile for the 12 months ended May 31, 2022.
· For Janus Henderson Responsible International Dividend Fund (formerly the Janus Henderson Dividend & Income Builder Fund), the Trustees noted that the Fund’s performance was in the bottom Broadridge quartile for the 36 months ended May 31, 2022 and the bottom Broadridge quartile for the 12 months ended May 31, 2022. The Trustees noted the reasons for the Fund’s underperformance and the steps the Adviser had taken or was taking to improve performance.
Money Market Funds
· For Janus Henderson Government Money Market Fund, the Trustees noted that the Fund’s performance was in the third Broadridge quartile for the 36 months ended May 31, 2022 and the bottom Broadridge quartile for the 12 months ended May 31, 2022. The Trustees noted the reasons for the Fund’s underperformance and the steps the Adviser had taken or was taking to improve performance.
· For Janus Henderson Money Market Fund, the Trustees noted that the Fund’s performance was in the third Broadridge quartile for the 36 months ended May 31, 2022 and the bottom Broadridge quartile for the 12 months ended May 31, 2022. The Trustees noted the reasons for the Fund’s underperformance and the steps the Adviser had taken or was taking to improve performance.
Multi-Asset Funds
· For Janus Henderson Adaptive Global Allocation Fund, the Trustees noted that the Fund’s performance was in bottom Broadridge quartile for the 36 months ended May 31, 2022 and the second Broadridge quartile for the 12 months ended May 31, 2022. The Trustees noted the reasons for the Fund’s underperformance, the steps the Adviser had taken or was taking to improve performance, and that the performance trend was improving.
· For Janus Henderson Balanced Fund, the Trustees noted that the Fund’s performance was in the first Broadridge quartile for the 36 months ended May 31, 2022 and the first Broadridge quartile for the 12 months ended May 31, 2022.
Janus Henderson Developed World Bond Fund
Additional Information (unaudited)
U.S. Equity Funds
· For Janus Henderson Adaptive Risk Managed U.S. Equity Fund, the Trustees noted that the Fund’s performance was in the bottom Broadridge quartile for the 36 months ended May 31, 2022 and the second Broadridge quartile for the 12 months ended May 31, 2022. The Trustees noted the reasons for the Fund’s underperformance, the steps the Adviser had taken or were taking to improve performance, and that the performance trend was improving.
· For Janus Henderson Contrarian Fund, the Trustees noted that the Fund’s performance was in the first Broadridge quartile for the 36 months ended May 31, 2022 and the bottom Broadridge quartile for the 12 months ended May 31, 2022.
· For Janus Henderson Enterprise Fund, the Trustees noted that the Fund’s performance was in the second Broadridge quartile for the 36 months ended May 31, 2022 and the first Broadridge quartile for the 12 months ended May 31, 2022.
· For Janus Henderson Forty Fund, the Trustees noted that the Fund’s performance was in the third Broadridge quartile for the 36 months ended May 31, 2022 and the bottom Broadridge quartile for the 12 months ended May 31, 2022. The Trustees noted the reasons for the Fund’s underperformance and the steps the Adviser had taken or was taking to improve performance.
· For Janus Henderson Growth and Income Fund, the Trustees noted that the Fund’s performance was in the bottom Broadridge quartile for the 36 months ended May 31, 2022 and the first Broadridge quartile for the 12 months ended May 31, 2022. The Trustees noted the reasons for the Fund’s underperformance, the steps the Adviser had taken or was taking to improve performance, and that the performance trend was improving.
· For Janus Henderson Mid Cap Value Fund, the Trustees noted that the Fund’s performance was in the bottom Broadridge quartile for the 36 months ended May 31, 2022 and the second Broadridge quartile for the 12 months ended May 31, 2022. The Trustees noted the reasons for the Fund’s underperformance, while also noting that the Fund has a performance fee structure that results in lower management fees during periods of underperformance, the steps the Adviser had taken or was taking to improve performance, and that the performance trend was improving.
· For Janus Henderson Research Fund, the Trustees noted that the Fund’s performance was in the third Broadridge quartile for the 36 months ended May 31, 2022 and the third Broadridge quartile for the 12 months ended May 31, 2022. The Trustees noted the reasons for the Fund’s underperformance, while also noting that the Fund has a performance fee structure that results in lower management fees during periods of underperformance and the steps the Adviser had taken or was taking to improve performance.
· For Janus Henderson Small Cap Value Fund, the Trustees noted that the Fund’s performance was in the bottom Broadridge quartile for the 36 months ended May 31, 2022 and the second Broadridge quartile for the 12 months ended May 31, 2022. The Trustees noted the reasons for the Fund’s underperformance, while also noting that the Fund has a performance fee structure that results in lower management fees during periods of underperformance, the steps the Adviser had taken or was taking to improve performance, and that the performance trend was improving.
· For Janus Henderson Small-Mid Cap Value Fund, the Trustees noted that the Fund’s performance was in the bottom Broadridge quartile for the 36 months ended May 31, 2022 and the second Broadridge quartile for the 12 months ended May 31, 2022. The Trustees noted the reasons for the Fund’s underperformance, while also noting that the Fund has a performance fee structure that results in lower management fees during periods of underperformance, the steps the Adviser had taken or was taking to improve performance, and that the performance trend is improving.
· For Janus Henderson Triton Fund, the Trustees noted that the Fund’s performance was in the bottom Broadridge quartile for the 36 months ended May 31, 2022 and the second Broadridge quartile for the 12 months ended May 31, 2022. The Trustees noted the reasons for the Fund’s underperformance, the steps the Adviser had taken or was taking to improve performance, and that the performance trend was improving.
· For Janus Henderson Venture Fund, the Trustees noted that the Fund’s performance was in the bottom Broadridge quartile for the 36 months ended May 31, 2022 and the second Broadridge quartile for the 12 months ended May
Janus Henderson Developed World Bond Fund
Additional Information (unaudited)
31, 2022. The Trustees noted the reasons for the Fund’s underperformance, the steps the Adviser had taken or was taking to improve performance, and that the performance trend was improving.
In consideration of each Janus Henderson Fund’s performance, the Trustees concluded that, taking into account the factors relevant to performance, as well as other considerations, including steps taken to improve performance, as applicable, the Janus Henderson Fund’s performance warranted continuation of such Janus Henderson Fund’s investment advisory agreement.
Costs of Services Provided
The Trustees examined information regarding the fees and expenses of each Janus Henderson Fund in comparison to similar information for other comparable funds as provided by Broadridge, an independent data provider. They also reviewed an analysis of that information provided by their independent fee consultant. The independent fee consultant provided its belief that the management fees charged by the Adviser to each of the Janus Henderson Funds under the current investment advisory and administration agreements are reasonable in relation to the services provided by the Adviser. The independent fee consultant found: (1) the total expenses and management fees of the Janus Henderson Funds to be reasonable relative to other comparable mutual funds; (2) the total expenses, on average, were 6% under the average total expenses of the respective Broadridge peer group; and (3) the management fees for the Janus Henderson Funds, on average, were 5% under the average management fees for the respective Broadridge peer group. The Trustees also considered the total expenses for each share class of each Janus Henderson Fund compared to the average total expenses for its Broadridge Expense Group and to average total expenses for its Broadridge Expense Universe.
For Janus Henderson Funds with three or more years of performance history, the independent fee consultant also performed a systematic “focus list” analysis of expenses which assessed fund fees in the context of fund performance being delivered. Based on this analysis, the independent fee consultant found that the combination of service quality/performance and expenses on these individual Janus Henderson Funds was reasonable in light of performance trends, performance histories, changes in portfolio management, relative average net asset levels, and the existence of performance fees, breakpoints, and/or expense waivers on such Janus Henderson Funds.
The Trustees considered the methodology used by the Adviser in determining compensation payable to portfolio managers, the competitive environment for investment management talent, and the competitive market for mutual funds in different distribution channels.
The Trustees also reviewed management fees charged by the Adviser to comparable separate account clients and to comparable non-affiliated funds subadvised by the Adviser (for which the Adviser provides only or primarily portfolio management services). Although in most instances subadvisory and separate account fee rates for various investment strategies were lower than management fee rates for Janus Henderson Funds having a similar strategy, the Trustees considered that the Adviser noted that, under the terms of the management agreements with the Janus Henderson Funds, the Adviser performs significant additional services for the Janus Henderson Funds that it does not provide to those other clients, including administration services, oversight of the Janus Henderson Funds’ other service providers, Trustee support, regulatory compliance and numerous other services, and that, in serving the Janus Henderson Funds, the Adviser assumes many legal risks and other costs that it does not assume in servicing its other clients. Moreover, the Trustees noted that the independent fee consultant found that: (1) the management fees the Adviser charges to the Janus Henderson Funds are reasonable in relation to the management fees the Adviser charges to funds subadvised by the Adviser and to the fees the Adviser charges to its institutional separate account clients; (2) these subadvised and institutional separate accounts have different service and infrastructure needs and operate in markets very different from the retail fund market; (3) Janus Henderson mutual fund investors enjoy reasonable fees relative to the fees charged in these other markets; and (4) as part of its 2022 review, 9 of 11 Janus Henderson Funds have lower management fees than similar funds subadvised by the Adviser. The Trustees noted that for the two Janus Henderson Funds that did not, management fees for each were under the average of its 15(c) peer group.
The Trustees considered the fees for each Janus Henderson Fund for its fiscal year ended in 2021 and noted the following with regard to each Janus Henderson Fund’s total expenses, net of applicable fee waivers (the Fund’s “total expenses”) as reflected in the comparative information provided by Broadridge:
Janus Henderson Developed World Bond Fund
Additional Information (unaudited)
Asset Allocation Funds
· For Janus Henderson Global Allocation Fund – Conservative, the Trustees noted that, although the Fund’s total expenses exceeded the peer group average for certain share classes, overall the Fund’s total expenses were reasonable. The Trustees also noted that the Adviser has contractually agreed to limit the Fund’s expenses.
· For Janus Henderson Global Allocation Fund – Growth, the Trustees noted that, although the Fund’s total expenses exceeded the peer group average for certain share classes, overall the Fund’s total expenses were reasonable. The Trustees also noted that the Adviser has contractually agreed to limit the Fund’s expenses, although this limit did not apply because the Fund’s total expenses as shown were below the applicable fee limit.
· For Janus Henderson Global Allocation Fund – Moderate, the Trustees noted that, although the Fund’s total expenses exceeded the peer group average for one share class, overall the Fund’s total expenses were reasonable. The Trustees also noted that the Adviser has contractually agreed to limit the Fund’s expenses.
Fixed-Income Funds
· For Janus Henderson Absolute Return Income Opportunities Fund, the Trustees noted that, although the Fund’s total expenses exceeded the peer group average for certain share classes, overall the Fund’s total expenses were reasonable. The Trustees also noted that the Adviser has contractually agreed to limit the Fund’s expenses.
· For Janus Henderson Developed World Bond Fund, the Trustees noted that, although the Fund’s total expenses exceeded the peer group average for one share class, overall the Fund’s total expenses were reasonable. The Trustees also noted that the Adviser has contractually agreed to limit the Fund’s expenses.
· For Janus Henderson Flexible Bond Fund, the Trustees noted that, although the Fund’s total expenses exceeded the peer group average for certain share classes, overall the Fund’s total expenses were reasonable. The Trustees also noted that the Adviser has contractually agreed to limit the Fund’s expenses, although this limit did not apply because the Fund’s total expenses as shown were below the applicable fee limit.
· For Janus Henderson Global Bond Fund, the Trustees noted that, although the Fund’s total expenses exceeded the peer group average for certain share classes, overall the Fund’s total expenses were reasonable. The Trustees also noted that the Adviser has contractually agreed to limit the Fund’s expenses.
· For Janus Henderson High-Yield Fund, the Trustees noted that, although the Fund’s total expenses exceeded the peer group average for certain share classes, overall the Fund’s total expenses were reasonable. The Trustees also noted that the Adviser has contractually agreed to limit the Fund’s expenses.
· For Janus Henderson Multi-Sector Income Fund, the Trustees noted that, although the Fund’s total expenses exceeded the peer group average for certain share classes, overall the Fund’s total expenses were reasonable. The Trustees also noted that the Adviser has contractually agreed to limit the Fund’s expenses.
· For Janus Henderson Short Duration Flexible Bond Fund, the Trustees noted that, although the Fund’s total expenses exceeded the peer group average for certain share classes, overall the Fund’s total expenses were reasonable. The Trustees also noted that the Adviser has contractually agreed to limit the Fund’s expenses.
Global and International Equity Funds
· For Janus Henderson Asia Equity Fund, the Trustees noted that, although the Fund’s total expenses exceeded the peer group average for certain share classes, overall the Fund’s total expenses were reasonable. The Trustees also noted that the Adviser has contractually agreed to limit the Fund’s expenses.
· For Janus Henderson Emerging Markets Fund, the Trustees noted that, although the Fund’s total expenses exceeded the peer group average for certain share classes, overall the Fund’s total expenses were reasonable. The Trustees also noted that the Adviser has contractually agreed to limit the Fund’s expenses.
· For Janus Henderson European Focus Fund, the Trustees noted that, although the Fund’s total expenses exceeded the peer group average for one share class, overall the Fund’s expenses were reasonable. The Trustees also noted that the Adviser has contractually agreed to limit the Fund’s expenses.
· For Janus Henderson Global Equity Income Fund, the Trustees noted that, although the Fund’s total expenses exceeded the peer group average for one share class, overall the Fund’s total expenses were reasonable. The
Janus Henderson Developed World Bond Fund
Additional Information (unaudited)
Trustees also noted that the Adviser has contractually agreed to limit the Fund’s expenses, although this limit did not apply because the Fund’s total expenses as shown were below the applicable fee limit.
· For Janus Henderson Global Life Sciences Fund, the Trustees noted that the Fund’s total expenses were below the peer group average for all share classes.
· For Janus Henderson Global Real Estate Fund, the Trustees noted that, although the Fund’s total expenses exceeded the peer group average for certain share classes, overall the Fund’s total expenses were reasonable. The Trustees also noted that the Adviser has contractually agreed to limit the Fund’s expenses, although this limit did not apply because the Fund’s total expenses as shown were below the applicable fee limit.
· For Janus Henderson Global Research Fund, the Trustees noted that, although the Fund’s total expenses exceeded the peer group average for one share class, overall the Fund’s total expenses were reasonable. The Trustees also noted that the Adviser has contractually agreed to limit the Fund’s expenses, although this limit did not apply because the Fund’s total expenses as shown were below the applicable fee limit.
· For Janus Henderson Global Select Fund, the Trustees noted that, although the Fund’s total expenses exceeded the peer group average for certain share classes, overall the Fund’s total expenses were reasonable. The Trustees also noted that the Adviser has contractually agreed to limit the Fund’s expenses.
· For Janus Henderson Global Sustainable Equity Fund, the Trustees noted that, although the Fund’s total expenses exceeded the peer group average for certain share classes, overall the Fund’s expenses were reasonable. The Trustees also noted that the Adviser has contractually agreed to limit the Fund’s expenses.
· For Janus Henderson Global Technology and Innovation Fund, the Trustees noted that the Fund’s total expenses were below the peer group average for all share classes.
· For Janus Henderson International Opportunities Fund, the Trustees noted that, although the Fund’s total expenses exceeded the peer group average for certain share classes, overall the Fund’s expenses were reasonable. The Trustees also noted that the Adviser has contractually agreed to limit the Fund’s expenses.
· For Janus Henderson Overseas Fund, the Trustees noted that although the Fund’s total expenses exceeded the peer group average for certain share classes, overall the Fund’s total expenses were reasonable. The Trustees also noted that the Adviser has contractually agreed to limit the Fund’s expenses, although this limit did not apply because the Fund’s total expenses as shown were below the applicable fee limit.
· For Janus Henderson Responsible International Dividend Fund (formerly the Janus Henderson Dividend & Income Builder Fund), the Trustees noted that, although the Fund’s total expenses exceeded the peer group for one share class, overall the Fund’s total expenses were reasonable. The Trustees also noted that the Adviser has contractually agreed to limit the Fund’s expenses.
Money Market Funds
· For Janus Henderson Government Money Market Fund, the Trustees noted that the Fund’s total expenses were below the peer group average for all share classes.
· For Janus Henderson Money Market Fund, the Trustees noted that the Fund’s total expenses were below the peer group average for all share classes.
Multi-Asset Funds
· For Janus Henderson Adaptive Global Allocation Fund, the Trustees noted that the Fund’s total expenses were below the peer group average for all share classes.
· For Janus Henderson Balanced Fund, the Trustees noted that, although the Fund’s total expenses exceeded the peer group average for certain share classes, overall the Fund’s total expenses were reasonable. The Trustees also noted that the Adviser has contractually agreed to limit the Fund’s expenses, although this limit did not apply because the Fund’s total expenses as shown were below the applicable fee limit.
Janus Henderson Developed World Bond Fund
Additional Information (unaudited)
U.S. Equity Funds
· For Janus Henderson Adaptive Risk Managed U.S. Equity Fund, the Trustees noted that, although the Fund’s total expenses exceeded the peer group average for certain share classes, overall the Fund’s total expenses were reasonable. The Trustees also noted that the Adviser has contractually agreed to limit the Fund’s expenses, although this limit did not apply because the Fund’s total expenses as shown were below the applicable fee limit.
· For Janus Henderson Contrarian Fund, the Trustees noted that, although the Fund’s total expenses exceeded the peer group average for all share classes, overall the Fund’s total expenses were reasonable. The Trustees also noted that the Adviser had contractually agreed to limit the Fund’s expenses.
· For Janus Henderson Enterprise Fund, the Trustees noted that, although the Fund’s total expenses exceeded the peer group average for certain share classes, overall the Fund’s total expenses were reasonable. The Trustees also noted that the Adviser has contractually agreed to limit the Fund’s expenses, although this limit did not apply because the Fund’s total expenses as shown were below the applicable fee limit.
· For Janus Henderson Forty Fund, the Trustees noted that, although the Fund’s total expenses exceeded the peer group average for certain share classes, overall the Fund’s total expenses were reasonable. The Trustees also noted that the Adviser has contractually agreed to limit the Fund’s expenses, although this limit did not apply because the Fund’s total expenses as shown were below the applicable fee limit.
· For Janus Henderson Growth and Income Fund, the Trustees noted that, although the Fund’s total expenses exceeded the peer group average for certain share classes, overall the Fund’s total expenses were reasonable. The Trustees also noted that the Adviser has contractually agreed to limit the Fund’s expenses, although this limit did not apply because the Fund’s total expenses as shown were below the applicable fee limit.
· For Janus Henderson Mid Cap Value Fund, the Trustees noted that the Fund’s total expenses were below the peer group average for all share classes.
· For Janus Henderson Research Fund, the Trustees noted that, although the Fund’s total expenses exceeded the peer group average for certain share classes, overall the Fund’s total expenses were reasonable. The Trustees also noted that the Adviser has contractually agreed to limit the Fund’s expenses.
· For Janus Henderson Small Cap Value Fund, the Trustees noted that, although the Fund’s total expenses exceeded the peer group average for one share class, overall the Fund’s total expenses were reasonable. The Trustees also noted that the Adviser has contractually agreed to limit the Fund’s expenses, although this limit did not apply because the Fund’s total expenses as shown were below the applicable fee limit.
· For Janus Henderson Small-Mid Cap Value Fund, the Trustees noted that the Fund’s total expenses were below the peer group average for all share classes.
· For Janus Henderson Triton Fund, the Trustees noted that, although the Fund’s total expenses exceeded the peer group average for one share class, overall the Fund’s total expenses were reasonable. The Trustees also noted that the Adviser has contractually agreed to limit the Fund’s expenses, although this limit did not apply because the Fund’s total expenses as shown were below the applicable fee limit.
· For Janus Henderson Venture Fund, the Trustees noted that although the Fund’s total expenses exceeded the peer group average for one share class, overall the Fund’s total expenses were reasonable. The Trustees also noted that the Adviser has contractually agreed to limit the Fund’s expenses, although this limit did not apply because the Fund’s total expenses as shown were below the applicable fee limit.
The Trustees reviewed information on the overall profitability to the Adviser and its affiliates from their relationships with the Janus Henderson Funds, and considered profitability data of other publicly traded mutual fund advisers. The Trustees recognized that profitability comparisons among fund managers are difficult because of the variation in the type of comparative information that is publicly available, and the profitability of any fund manager is affected by numerous factors, including the organizational structure of the particular fund manager, differences in complex size, difference in product mix, difference in types of business (mutual fund, institutional and other), differences in the types of funds and other accounts it manages, possible other lines of business, the methodology for allocating expenses and the fund manager’s capital structure and cost of capital.
Janus Henderson Developed World Bond Fund
Additional Information (unaudited)
Additionally, the Trustees considered the estimated profitability to the Adviser from the investment management services it provided to each Janus Henderson Fund. In their review, the Trustees considered whether the Adviser receive adequate incentives and resources to manage the Janus Henderson Funds effectively. In reviewing profitability, the Trustees noted that the estimated profitability for an individual Janus Henderson Fund is necessarily a product of the allocation methodology utilized by the Adviser to allocate its expenses as part of the estimated profitability calculation. In this regard, the Trustees noted that the independent fee consultant found as part of its 2022 review that (1) the expense allocation methodology and rationales utilized by the Adviser were reasonable and (2) no clear correlation exists between expense allocations and operating margins. The Trustees also considered that the estimated profitability for an individual Janus Henderson Fund was influenced by a number of factors, including not only the allocation methodology selected, but also the presence of fee waivers and expense caps, and whether the Janus Henderson Fund’s investment management agreement contained breakpoints or a performance fee component. The Trustees determined, after taking into account these factors, among others, that the Adviser’s estimated profitability with respect to each Janus Henderson Fund was not unreasonable in relation to the services provided, and that the variation in the range of such estimated profitability among the Janus Henderson Funds was not a material factor in the Board’s approval of the reasonableness of any Janus Henderson Fund’s investment management fees.
The Trustees concluded that the management fees payable by each Janus Henderson Fund to the Adviser were reasonable in relation to the nature, extent, and quality of the services provided, taking into account the fees charged by other advisers for managing comparable mutual funds with similar strategies, the fees the Adviser charges to other clients, and, as applicable, the impact of fund performance on management fees payable by the Janus Henderson Funds. The Trustees also concluded that each Janus Henderson Fund’s total expenses were reasonable, taking into account the size of the Janus Henderson Fund, the quality of services provided by the Adviser, the investment performance of the Janus Henderson Fund, and any expense limitations agreed to or provided by the Adviser.
Economies of Scale
The Trustees considered information about the potential for the Adviser to realize economies of scale as the assets of the Janus Henderson Funds increase. They noted that their independent fee consultant published a report to the Trustees in June 2022 which provided its research and analysis into economies of scale. They also noted that, although many Janus Henderson Funds pay advisory fees at a fixed base rate as a percentage of net assets, without any breakpoints or performance fees, their independent fee consultant concluded that 75% of these Janus Henderson Funds’ have contractual management fees (gross of waivers) below their Broadridge Expense Group averages. The Trustees also noted the following from the independent fee consultant’s report: (1) that 31% of Janus Henderson Funds had management fee breakpoints in place whereby investors pay lower management fees as fund AUM increases; (2) that 29% of Janus Henderson Funds have low flat-rate fees and performance fees where the Adviser is incentivized to invest in resources which drive Janus Henderson Fund performance; and (3) that 39% of Janus Henderson Funds have low flat-rate fees versus peers where investors pay low fixed fees when the Janus Henderson Fund is small/midsized and higher fees when the Janus Henderson Fund grows in assets. The Trustees also noted that the Janus Henderson Funds share directly in economies of scale through the significant investments made by the Adviser and its affiliates related to services provided to the Funds and the lower charges of third-party service providers that are based in part on the combined scale of all of the Janus Henderson Funds.
The Trustees also considered the independent fee consultant’s conclusion that, given the limitations of various analytical approaches to economies of scale and their conflicting results, it is difficult to analytically confirm or deny the existence of economies of scale in the Janus Henderson complex. In this regard, the independent consultant concluded that (1) to the extent there were economies of scale at the Adviser, the Adviser’s general strategy of setting fixed management fees below peers appeared to share any such economies with investors even on smaller Janus Henderson Funds which have not yet achieved those economies and (2) by setting lower fixed fees from the start on these Janus Henderson Funds, the Adviser appeared to be investing to increase the likelihood that these Janus Henderson Funds will grow to a level to achieve any economies of scale that may exist. Further, the independent fee consultant provided its belief that Janus Henderson Fund investors are well-served by the fee levels and performance fee structures in place on the Janus Henderson Funds in light of any economies of scale that may be present at the Adviser.
Based on all of the information reviewed, including the recent and past research and analysis conducted by the Trustees’ independent fee consultant, the Trustees concluded that the current fee structure of each Janus Henderson Fund was reasonable and that the current rates of fees do reflect a sharing between the Adviser and the Janus
Janus Henderson Developed World Bond Fund
Additional Information (unaudited)
Henderson Fund of any economies of scale that may be present at the current asset level of the Janus Henderson Fund.
Other Benefits to the Adviser
The Trustees also considered benefits that accrue to the Adviser and its affiliates from their relationships with the Janus Henderson Funds. They recognized that two affiliates of the Adviser separately serve the Janus Henderson Funds as transfer agent and distributor, respectively, and the transfer agent receives compensation directly from the non-money market Janus Henderson Funds for services provided, and that such compensation contributes to the overall profitability of the Adviser and its affiliates that results from their relationship with the Janus Henderson Funds. The Trustees also considered the Adviser’s past and proposed use of commissions paid by the Janus Henderson Funds on portfolio brokerage transactions to obtain proprietary and third-party research products and services benefiting the Janus Henderson Fund and/or other clients of the Adviser and/or the Adviser. The Trustees concluded that the Adviser’s use of these types of client commission arrangements to obtain proprietary and third-party research products and services was consistent with regulatory requirements and guidelines and was likely to benefit each Janus Henderson Fund. The Trustees also concluded that, other than the services provided by the Adviser and its affiliates pursuant to the agreements and the fees to be paid by each Janus Henderson Fund therefor, the Janus Henderson Funds and the Adviser may potentially benefit from their relationship with each other in other ways. They concluded that the Adviser and its affiliates share directly in economies of scale through the lower charges of third-party service providers that are based in part on the combined scale of the Janus Henderson Funds and other clients serviced by the Adviser and its affiliates. They also concluded that the Adviser benefits from the receipt of research products and services acquired through commissions paid on portfolio transactions of the Janus Henderson Funds and that the Janus Henderson Funds benefit from the Adviser’s receipt of those products and services as well as research products and services acquired through commissions paid by other clients of the Adviser. They further concluded that the success of any Janus Henderson Fund could attract other business to the Adviser or other Janus Henderson Funds, and that the success of the Adviser could enhance the Adviser’s ability to serve the Janus Henderson Funds.
Janus Henderson Developed World Bond Fund
Liquidity Risk Management Program (unaudited)
Liquidity Risk Management Program
Rule 22e-4 under the Investment Company Act of 1940, as amended (the “Liquidity Rule”), requires open-end funds (but not money market funds) to adopt and implement a written liquidity risk management program (the “LRMP”) that is reasonably designed to assess and manage liquidity risk, which is the risk that a fund could not meet redemption requests without significant dilution of remaining investors’ interest in the fund. The Fund has implemented a LRMP, which incorporates the following elements: (i) assessment, management, and periodic review of liquidity risk; (ii) classification of portfolio holdings; (iii) the establishment and monitoring of a highly liquid investment minimum, as applicable; (iv) a 15% limitation on a Fund’s illiquid investments; (v) redemptions in-kind; and (vi) board oversight.
The Trustees of the Fund (the “Trustees”) have designated Janus Henderson Investors US LLC, the Fund’s investment adviser (the “Adviser”), as the Program Administrator for the LRMP responsible for administering the LRMP and carrying out the specific responsibilities of the LRMP. A working group comprised of various teams within the Adviser’s business is responsible for administering the LRMP and carrying out the specific responsibilities of different aspects of the LRMP (the “Liquidity Risk Working Group”). In assessing each Fund’s liquidity risk, the Liquidity Risk Working Group periodically considers, as relevant, factors including (i) the liquidity of a Fund’s portfolio investments during normal and reasonably foreseeable stressed conditions; (ii) whether a Fund’s investment strategy is appropriate for an open-end fund; (iii) the extent to which a Fund’s strategy involves a relatively concentrated portfolio or large positions in any issuer; (iv) a Fund’s use of borrowing for investment purposes; and (v) a Fund’s use of derivatives.
The Liquidity Rule requires the Trustees to review at least annually a written report provided by the Program Administrator that addresses the operation of the LRMP and assesses its adequacy and the effectiveness of its implementation, including, if applicable, the operation of the highly liquid investment minimum, and any material changes to the LRMP (the “Program Administrator Report”). At a meeting held on March 15, 2023, the Adviser provided the Program Administrator Report to the Trustees which covered the operation of the LRMP from January 1, 2022 through December 31, 2022 (the “Reporting Period”).
The Program Administrator Report discussed the operation and effectiveness of the LRMP during the Reporting Period. Among other things, the Program Administrator Report indicated that there were no material changes to the LRMP during the Reporting Period, although there were certain methodology adjustments implemented relating to a change in data provider. Additionally, the findings presented in the Program Administrator Report indicated that the LRMP operated adequately during the Reporting Period. These findings included that the Fund was able to meet redemptions during the normal course of business during the Reporting Period. The Program Administrator Report also stated that the Fund did not exceed the 15% limit on illiquid assets during the Reporting Period, that the Fund held primarily highly liquid assets, and was considered to be a primarily highly liquid fund during the Reporting Period. Also included among the Program Administrator Report’s findings was the determination that the Fund’s investment strategy remains appropriate for an open-end fund. In addition, the Adviser expressed its belief in the Program Administrator Report that the LRMP is reasonably designed and adequate to assess and manage the Fund’s liquidity risk, considering the Fund’s particular risks and circumstances, and includes policies and procedures reasonably designed to implement each required component of the Liquidity Rule.
There can be no assurance that the LRMP will achieve its objectives in the future. Please refer to your Fund’s prospectus for more information regarding the risks to which an investment in the Fund may be subject.
Janus Henderson Developed World Bond Fund
Useful Information About Your Fund Report (unaudited)
Management Commentary
The Management Commentary in this report includes valuable insight as well as statistical information to help you understand how your Fund’s performance and characteristics stack up against those of comparable indices.
If the Fund invests in foreign securities, this report may include information about country exposure. Country exposure is based primarily on the country of risk. A company may be allocated to a country based on other factors such as location of the company’s principal office, the location of the principal trading market for the company’s securities, or the country where a majority of the company’s revenues are derived.
Please keep in mind that the opinions expressed in the Management Commentary are just that: opinions. They are a reflection based on best judgment at the time this report was compiled, which was June 30, 2023. As the investing environment changes, so could opinions. These views are unique and are not necessarily shared by fellow employees or by Janus Henderson in general.
Performance Overviews
Performance overview graphs compare the performance of a hypothetical $10,000 investment in the Fund with one or more widely used market indices. When comparing the performance of the Fund with an index, keep in mind that market indices are not available for investment and do not reflect deduction of expenses.
Average annual total returns are quoted for a Fund with more than one year of performance history. Average annual total return is calculated by taking the growth or decline in value of an investment over a period of time, including reinvestment of dividends and distributions, then calculating the annual compounded percentage rate that would have produced the same result had the rate of growth been constant throughout the period. Average annual total return does not reflect the deduction of taxes that a shareholder would pay on Fund distributions or redemptions of Fund shares.
Cumulative total returns are quoted for a Fund with less than one year of performance history. Cumulative total return is the growth or decline in value of an investment over time, independent of the period of time involved. Cumulative total return does not reflect the deduction of taxes that a shareholder would pay on Fund distributions or redemptions of Fund shares.
Pursuant to federal securities rules, expense ratios shown in the performance chart reflect subsidized (if applicable) and unsubsidized ratios. The total annual fund operating expenses ratio is gross of any fee waivers, reflecting the Fund’s unsubsidized expense ratio. The net annual fund operating expenses ratio (if applicable) includes contractual waivers of the Adviser and reflects the Fund’s subsidized expense ratio. Ratios may be higher or lower than those shown in the “Financial Highlights” in this report.
Schedule of Investments
Following the performance overview section is the Fund’s Schedule of Investments. This schedule reports the types of securities held in the Fund on the last day of the reporting period. Securities are usually listed by type (common stock, corporate bonds, U.S. Government obligations, etc.) and by industry classification (banking, communications, insurance, etc.). Holdings are subject to change without notice.
The value of each security is quoted as of the last day of the reporting period. The value of securities denominated in foreign currencies is converted into U.S. dollars.
If the Fund invests in foreign securities, it will also provide a summary of investments by country. This summary reports the Fund exposure to different countries by providing the percentage of securities invested in each country. The country of each security represents the country of risk. The Fund’s Schedule of Investments relies upon the industry group and country classifications published by Bloomberg and/or MSCI Inc.
Tables listing details of individual forward currency contracts, futures, written options, swaptions, and swaps follow the Fund’s Schedule of Investments (if applicable).
Statement of Assets and Liabilities
This statement is often referred to as the “balance sheet.” It lists the assets and liabilities of the Fund on the last day of the reporting period.
Janus Henderson Developed World Bond Fund
Useful Information About Your Fund Report (unaudited)
The Fund’s assets are calculated by adding the value of the securities owned, the receivable for securities sold but not yet settled, the receivable for dividends declared but not yet received on securities owned, and the receivable for Fund shares sold to investors but not yet settled. The Fund’s liabilities include payables for securities purchased but not yet settled, Fund shares redeemed but not yet paid, and expenses owed but not yet paid. Additionally, there may be other assets and liabilities such as unrealized gain or loss on forward currency contracts.
The section entitled “Net Assets Consist of” breaks down the components of the Fund’s net assets. Because the Fund must distribute substantially all earnings, you will notice that a significant portion of net assets is shareholder capital.
The last section of this statement reports the net asset value (“NAV”) per share on the last day of the reporting period. The NAV is calculated by dividing the Fund’s net assets for each share class (assets minus liabilities) by the number of shares outstanding.
Statement of Operations
This statement details the Fund’s income, expenses, realized gains and losses on securities and currency transactions, and changes in unrealized appreciation or depreciation of Fund holdings.
The first section in this statement, entitled “Investment Income,” reports the dividends earned from securities and interest earned from interest-bearing securities in the Fund.
The next section reports the expenses incurred by the Fund, including the advisory fee paid to the investment adviser, transfer agent fees and expenses, and printing and postage for mailing statements, financial reports and prospectuses. Expense offsets and expense reimbursements, if any, are also shown.
The last section lists the amounts of realized gains or losses from investment and foreign currency transactions, and changes in unrealized appreciation or depreciation of investments and foreign currency-denominated assets and liabilities. The Fund will realize a gain (or loss) when it sells its position in a particular security. A change in unrealized gain (or loss) refers to the change in net appreciation or depreciation of the Fund during the reporting period. “Net Realized and Unrealized Gain/(Loss) on Investments” is affected both by changes in the market value of Fund holdings and by gains (or losses) realized during the reporting period.
Statements of Changes in Net Assets
These statements report the increase or decrease in the Fund’s net assets during the reporting period. Changes in the Fund’s net assets are attributable to investment operations, dividends and distributions to investors, and capital share transactions. This is important to investors because it shows exactly what caused the Fund’s net asset size to change during the period.
The first section summarizes the information from the Statement of Operations regarding changes in net assets due to the Fund’s investment operations. The Fund’s net assets may also change as a result of dividend and capital gains distributions to investors. If investors receive their dividends and/or distributions in cash, money is taken out of the Fund to pay the dividend and/or distribution. If investors reinvest their dividends and/or distributions, the Fund’s net assets will not be affected.
The reinvestment of dividends and distributions is included under “Capital Share Transactions.” “Capital Shares” refers to the money investors contribute to the Fund through purchases or withdrawals via redemptions. The Fund’s net assets will increase and decrease in value as investors purchase and redeem shares from the Fund.
Financial Highlights
This schedule provides a per-share breakdown of the components that affect the Fund’s NAV for current and past reporting periods as well as total return, asset size, ratios, and portfolio turnover rate.
The first line in the table reflects the NAV per share at the beginning of the reporting period. The next line reports the net investment income/(loss) per share. Following is the per share total of net gains/(losses), realized and unrealized. Per share dividends and distributions to investors are then subtracted to arrive at the NAV per share at the end of the period. The next line reflects the total return for the period. The total return may include adjustments in accordance with generally accepted accounting principles required at the period end for financial reporting purposes. As a result, the total return may differ from the total return reflected for individual shareholder transactions. Also included are ratios of expenses and net investment income to average net assets.
Janus Henderson Developed World Bond Fund
Useful Information About Your Fund Report (unaudited)
The Fund’s expenses may be reduced through expense offsets and expense reimbursements. The ratios shown reflect expenses before and after any such offsets and reimbursements.
The ratio of net investment income/(loss) summarizes the income earned less expenses, divided by the average net assets of the Fund during the reporting period. Do not confuse this ratio with the Fund’s yield. The net investment income ratio is not a true measure of the Fund’s yield because it does not take into account the dividends distributed to the Fund’s investors.
The next figure is the portfolio turnover rate, which measures the buying and selling activity in the Fund. Portfolio turnover is affected by market conditions, changes in the asset size of the Fund, fluctuating volume of shareholder purchase and redemption orders, the nature of the Fund’s investments, and the investment style and/or outlook of the portfolio manager(s) and/or investment personnel. A 100% rate implies that an amount equal to the value of the entire portfolio was replaced once during the fiscal year; a 50% rate means that an amount equal to the value of half the portfolio is traded in a year; and a 200% rate means that an amount equal to the value of the entire portfolio is traded every six months.
Janus Henderson Developed World Bond Fund
Designation Requirements (unaudited)
For federal income tax purposes, the Fund designated the following for the year ended June 30, 2023:
| | |
| | |
Section 163(j) Interest Dividend | 43% |
Janus Henderson Developed World Bond Fund
Trustees and Officers (unaudited)
The following are the Trustees and officers of the Trust, together with a brief description of their principal occupations during the last five years (principal occupations for certain Trustees may include periods over five years). The Fund’s Statement of Additional Information includes additional information about the Trustees and officers and is available, without charge, by calling 1-877-335-2687.
Each Trustee has served in that capacity since he or she was originally elected or appointed. The Trustees do not serve a specified term of office. Each Trustee will hold office until the termination of the Trust or his or her earlier death, resignation, retirement, incapacity, or removal. Under the Fund’s Governance Procedures and Guidelines, the policy is for Trustees to retire no later than the end of the calendar year in which the Trustee turns 75. The Trustees review the Fund’s Governance Procedures and Guidelines from time to time and may make changes they deem appropriate. The Fund’s Nominating and Governance Committee will consider nominees for the position of Trustee recommended by shareholders. Shareholders may submit the name of a candidate for consideration by the Committee by submitting their recommendations to the Trust’s Secretary. Each Trustee is currently a Trustee of one other registered investment company advised by the Adviser: Janus Aspen Series. Collectively, these two registered investment companies consist of 49 series or funds referred to herein as the Fund Complex.
The Trust’s officers are elected annually by the Trustees for a one-year term. Certain officers also serve as officers of Janus Aspen Series. Certain officers of the Fund may also be officers and/or directors of the Adviser. Except as otherwise disclosed, Fund officers receive no compensation from the Fund, except for the Fund’s Chief Compliance Officer, as authorized by the Trustees.
| | | | | | |
TRUSTEES |
Name, Address, and Age | Positions Held with the Trust | Length of Time Served | Principal Occupations During the Past Five Years | Number of Portfolios/Funds in Fund Complex Overseen by Trustee | Other Directorships Held by Trustee During the Past Five Years |
Independent Trustees | | | | |
Alan A. Brown
151 Detroit Street
Denver, CO 80206
DOB: 1962 | Chairman
Trustee | 5/22-Present
1/13-Present | Principal, Curam Holdings LLC (since 2018). Formerly, Executive Vice President, Institutional Markets, of Black Creek Group (private equity real estate investment management firm) (2012-2018), Executive Vice President and Co-Head, Global Private Client Group (2007-2010), Executive Vice President, Mutual Funds (2005-2007), and Chief Marketing Officer (2001-2005) of Nuveen Investments, Inc. (asset management). | 49 | Advisory Board Member of AEW Core Property Trust (open-end property fund) (since 2020), and Director of WTTW (PBS affiliate) (since 2003). Formerly, Director of MotiveQuest LLC (strategic social market research company) (2003-2016), Director of Nuveen Global Investors LLC (2007-2011), Director of Communities in Schools (2004-2010), and Director of Mutual Fund Education Alliance (until 2010). |
Janus Henderson Developed World Bond Fund
Trustees and Officers (unaudited)
| | | | | | |
TRUSTEES |
Name, Address, and Age | Positions Held with the Trust | Length of Time Served | Principal Occupations During the Past Five Years | Number of Portfolios/Funds in Fund Complex Overseen by Trustee | Other Directorships Held by Trustee During the Past Five Years |
Independent Trustees | | | | |
Cheryl D. Alston
151 Detroit Street
Denver, CO 80206
DOB: 1966 | Trustee | 8/22-Present | Executive Director and Chief Investment Officer, Employees’ Retirement Fund of the City of Dallas (since 2004). | 49 | Director of Blue Cross Blue Shield of Kansas City (a not-for-profit health insurance provider) (since 2016) and Director of Global Life Insurance (life and supplemental health insurance provider) (since 2017). Formerly, Director of Federal Home Loan Bank of Dallas (2017-2021). |
Janus Henderson Developed World Bond Fund
Trustees and Officers (unaudited)
| | | | | | |
TRUSTEES |
Name, Address, and Age | Positions Held with the Trust | Length of Time Served | Principal Occupations During the Past Five Years | Number of Portfolios/Funds in Fund Complex Overseen by Trustee | Other Directorships Held by Trustee During the Past Five Years |
Independent Trustees | | | | |
Janus Henderson Developed World Bond Fund
Trustees and Officers (unaudited)
| | | | | | |
William D. Cvengros
151 Detroit Street
Denver, CO 80206
DOB: 1948 | Trustee | 1/11-Present | Chief Executive Officer of SJC Capital, LLC (a personal investment company and consulting firm) (since 2002). Formerly, Chief Executive Officer and President of PIMCO Advisors Holdings L.P. (a publicly traded investment management firm) (1994-2000), and Chief Investment Officer (1987-1994) and Vice Chairman and Director (1990-1994) of Pacific Life Insurance Company (a mutual life insurance and annuity company) (1987-1994). | 49 | Member, Limited Partner Advisory Committee, Karmel Capital Fund III (later stage growth fund) (since 2022), Member of the Investment Committee for the Orange County Community Foundation (a grantmaking foundation) (since 2020), Advisory Board Member, RevOZ Fund LP and related funds (real estate investments for opportunity zones) (since 2020), and Advisory Board Member, Innovate Partners Emerging Growth and Equity Fund I (early stage venture capital fund) (since 2014). Formerly, Managing Trustee of National Retirement Partners Liquidating Trust (2013-2016), Chairman, National Retirement Partners, Inc. (formerly a network of advisors to 401(k) plans) (2005-2013), Director of Prospect Acquisition Corp. (a special purpose acquisition corporation) (2007-2009), Director of RemedyTemp, Inc. (temporary help services company) (1996-2006), and Trustee of PIMCO Funds Multi-Manager Series (1990-2000) and Pacific Life Variable Life & Annuity Trusts (1987-1994). |
Janus Henderson Developed World Bond Fund
Trustees and Officers (unaudited)
| | | | | | |
TRUSTEES |
Name, Address, and Age | Positions Held with the Trust | Length of Time Served | Principal Occupations During the Past Five Years | Number of Portfolios/Funds in Fund Complex Overseen by Trustee | Other Directorships Held by Trustee During the Past Five Years |
Independent Trustees | | | | |
Raudline Etienne
151 Detroit Street
Denver, CO 80206
DOB: 1965 | Trustee | 6/16-Present | Founder, Daraja Capital (advisory and investment firm) (since 2016). Formerly, Senior Vice President and Senior Advisor, Albright Stonebridge Group LLC (global strategy firm) (2011-2021), and Deputy Comptroller and Chief Investment Officer, New York State Common Retirement Fund (public pension fund) (2008-2011). | 49 | Member of the Investment Committee for Cooper Union (private college) (since 2021) and Director of Brightwood Capital Advisors, LLC (since 2014). Formerly, Board Member, Van Alen Institute (nonprofit architectural and design organization) (2019-2022). |
Darrell B. Jackson
151 Detroit Street
Denver, CO 80206
DOB: 1958 | Trustee | 8/22-Present | President and Chief Executive Officer, The Efficace Group Inc. (since 2018). Formerly, President and Chief Executive Officer, Seaway Bank and Trust Company (community bank) (2014-2015), and Executive Vice President and Co-President, Wealth Management (2009-2014), and several senior positions, including Group Executive, Senior Vice President, and Vice President (1995-2009) of Northern Trust Company (financial services company) (1995-2014). | 49 | Director of Amalgamated Financial Corp (bank) (since August 2021), Director of YR Media (a not-for-profit production company) (since 2021), and Director of Gray-Bowen-Scott (transportation project consulting firm) (since April 2020). Formerly, Director of Delaware Place Bank (closely held commercial bank) (2016-2018) and Director of Seaway Bank and Trust Company (2014-2015). |
Janus Henderson Developed World Bond Fund
Trustees and Officers (unaudited)
| | | | | | |
TRUSTEES |
Name, Address, and Age | Positions Held with the Trust | Length of Time Served | Principal Occupations During the Past Five Years | Number of Portfolios/Funds in Fund Complex Overseen by Trustee | Other Directorships Held by Trustee During the Past Five Years |
Independent Trustees | | | | |
William F. McCalpin
151 Detroit Street
Denver, CO 80206
DOB: 1957 | Trustee | 6/02-Present | Chief Executive Officer, muun chi LLC (organic food business) (since 2022) and Independent Consultant (since 2019). Formerly, Chief Operating Officer, muun chi LLC (2020-2022), Managing Partner, Impact Investments, Athena Capital Advisors LLC (independent registered investment advisor) (2016-2019), Managing Director, Holos Consulting LLC (provides consulting services to foundations and other nonprofit organizations) (2009-2016), Chief Executive Officer, Imprint Capital Advisors (impact investment firm) (2013-2015), and Executive Vice President and Chief Operating Officer of The Rockefeller Brothers Fund (a private family foundation) (1998-2006). | 49 | Chairman of the Board and Trustee of The Investment Fund for Foundations Investment Program (TIP) (consisting of 1 fund) (since 2008). Formerly, Director of the F.B. Heron Foundation (a private grantmaking foundation) (2006-2022), and Director of Mutual Fund Directors Forum (a non-profit organization serving independent directors of U.S. mutual funds) (2016-2021). |
Janus Henderson Developed World Bond Fund
Trustees and Officers (unaudited)
| | | | | | |
TRUSTEES |
Name, Address, and Age | Positions Held with the Trust | Length of Time Served | Principal Occupations During the Past Five Years | Number of Portfolios/Funds in Fund Complex Overseen by Trustee | Other Directorships Held by Trustee During the Past Five Years |
Independent Trustees | | | | |
Gary A. Poliner
151 Detroit Street
Denver, CO 80206
DOB: 1953 | Trustee | 6/16-Present | Retired. Formerly, President (2010-2013) of Northwestern Mutual Life Insurance Company. | 49 | Director of MGIC Investment Corporation (private mortgage insurance) (since 2013). Formerly, Director, West Bend Mutual Insurance Company (property/casualty insurance) (2013-2021), Trustee of Northwestern Mutual Life Insurance Company (2010-2013) and Director of Frank Russell Company (global asset management firm) (2008-2013). |
Diane L. Wallace
151 Detroit Street
Denver, CO 80206
DOB: 1958 | Trustee | 6/17-Present | Retired. Formerly, Chief Operating Officer, Senior Vice President-Operations, and Chief Financial Officer for Driehaus Capital Management, LLC (1988-2006) and Treasurer for Driehaus Mutual Funds (1996-2002). | 49 | Formerly, Director of Family Service of Lake County (2019-2021), Independent Trustee, Henderson Global Funds (13 portfolios) (2015-2017), Independent Trustee, State Farm Associates’ Funds Trust, State Farm Mutual Fund Trust, and State Farm Variable Product Trust (28 portfolios) (2013-2017). |
Janus Henderson Developed World Bond Fund
Trustees and Officers (unaudited)
| | | | |
OFFICERS |
Name, Address, and Age | Positions Held with the Trust | Term of Office* and Length of Time Served | Principal Occupations During the Past Five Years |
Jenna Barnard
151 Detroit Street
Denver, CO 80206
DOB: 1980 | Executive Vice President and Co-Portfolio Manager
Janus Henderson Developed World Bond Fund | 6/17-Present (predecessor fund: since 12/08) | Co-Head of Global Bonds of Janus Henderson Investors and Portfolio Manager for other Janus Henderson accounts. |
John Pattullo
151 Detroit Street
Denver, CO 80206
DOB: 1970 | Executive Vice President and Co-Portfolio Manager
Janus Henderson Developed World Bond Fund | 6/17-Present (predecessor fund: since 12/08) | Co-Head of Global Bonds of Janus Henderson Investors and Portfolio Manager for other Janus Henderson accounts. |
Michelle Rosenberg
151 Detroit Street
Denver, CO 80206
DOB: 1973 | President and Chief Executive Officer | 9/22-Present | General Counsel and Corporate Secretary of Janus Henderson Investors (since 2018). Formerly, Interim President and Chief Executive Officer of the Trust and Janus Aspen Series (2022), Senior Vice President and Head of Legal, North America of Janus Henderson Investors (2017-2018) and Deputy General Counsel of Janus Henderson US (Holdings) Inc. (2015-2018). |
Kristin Mariani
151 Detroit Street
Denver, CO 80206
DOB: 1966 | Vice President and Chief Compliance Officer | 7/20-Present | Head of Compliance, North America at Janus Henderson Investors (since September 2020) and Chief Compliance Officer at Janus Henderson Investors US LLC (since September 2017). Formerly, Anti-Money Laundering Officer for the Trust and Janus Aspen Series (July 2020-December 2022), Global Head of Investment Management Compliance at Janus Henderson Investors (February 2019-August 2020), Vice President, Head of Global Distribution Compliance and Chief Compliance Officer at Janus Henderson Distributors US LLC (May 2017-September 2017), Vice President, Compliance at Janus Henderson US (Holdings) Inc., Janus Henderson Investors US LLC, and Janus Henderson Distributors US LLC (2009-2017). |
Janus Henderson Developed World Bond Fund
Trustees and Officers (unaudited)
| | | | |
OFFICERS |
Name, Address, and Age | Positions Held with the Trust | Term of Office* and Length of Time Served | Principal Occupations During the Past Five Years |
Jesper Nergaard
151 Detroit Street
Denver, CO 80206
DOB: 1962 | Chief Financial Officer
Vice President, Treasurer, and Principal Accounting Officer | 3/05-Present
2/05-Present | Head of U.S. Fund Administration, Janus Henderson Investors and Janus Henderson Services US LLC. |
Abigail J. Murray
151 Detroit Street
Denver, CO 80206
DOB: 1975 | Vice President, Chief Legal Counsel, and Secretary | 12/20-Present | Managing Counsel (since 2020). Formerly, Senior Counsel for Invesco Ltd. (2017-2020), and Vice President and Senior Counsel, ALPS Fund Services, Inc. and Assistant General Counsel, ALPS Advisors, Inc. (2015-2017). |
Ciaran Askin
151 Detroit Street
Denver, CO 80206
DOB: 1978 | Anti-Money Laundering Officer | 12/22-Present | Global Head of Financial Crime, Janus Henderson Investors (since 2022). Formerly, Global Head of Financial Crime for Invesco Ltd. (2017-2022). |
* Officers are elected at least annually by the Trustees for a one-year term and may also be elected from time to time by the Trustees for an interim period. |
| | | | | | | | |
| | | | | |

| | | | |
This report is submitted for the general information of shareholders of the Fund. It is not an offer or solicitation for the Fund and is not authorized for distribution to prospective investors unless preceded or accompanied by an effective prospectus. |
Janus Henderson is a trademark of Janus Henderson Group plc or one of its subsidiaries. © Janus Henderson Group plc Janus Henderson Distributors US LLC Janus Henderson Group is the ultimate parent of Janus Henderson Distributors US LLC |
| | | | 125-02-93077 08-23 |
| | | |
| | | |
| | | ANNUAL REPORT June 30, 2023 |
| | |
| | Janus Henderson Flexible Bond Fund |
| | |
| | Janus Investment Fund |
| |
| | | |
| | | HIGHLIGHTS · Portfolio management perspective · Investment strategy behind your fund · Fund performance, characteristics
and holdings |
Table of Contents
Janus Henderson Flexible Bond Fund
Janus Henderson Flexible Bond Fund (unaudited)
| | | | | | |
| | | | 
Greg Wilensky co-portfolio manager | 
Michael Keough co-portfolio manager |
| | | |
PERFORMANCE SUMMARY
For the 12-month period ended June 30, 2023, the Janus Henderson Flexible Bond Fund’s Class I shares returned -1.36% compared with -0.94% for the Fund’s benchmark, the Bloomberg U.S. Aggregate Bond Index.
MARKET ENVIRONMENT
The U.S. fixed income market posted a negative return over the past 12 months, with the Bloomberg U.S. Aggregate Bond Index declining 0.94%. Positive returns in investment-grade and high-yield corporates were offset by negative performance in U.S. Treasuries.
The Treasury yield curve became more inverted, and yields rose across the board. The Federal Reserve (Fed) consistently raised rates to combat inflation before taking a hawkish pause in June 2023 to evaluate the impact of its prior rate hikes. However, the dot plot projection released with the Fed Minutes implied two incremental rate increases before the end of the year.
Rising investor concerns about an economic hard landing pressured returns in the last six months of 2022. However, these concerns dissipated in 2023 as gross domestic product (GDP) growth exceeded expectations, inflation moderated, and the labor market consistently showed signs of resilience. As a result, expectations for a soft landing increased and risk assets rallied in the back half of the 12-month period.
The yield on the 10-year U.S. Treasury ended June 2023 at 3.84% relative to 3.01% in June of last year. Over the past 12 months, corporate investment-grade credit spreads tightened 32 basis points to 1.23% and high-yield credit spreads tightened 179 basis points to 3.90%.
PERFORMANCE DISCUSSION
Treasury rates rode the proverbial rollercoaster during the period, and we actively managed duration amid the volatility. Our overall interest-rate positioning largely balanced the opposing forces of high and sticky inflation and a hawkish Fed with the chances of an economic slowdown. While the Fund’s interest-rate positioning detracted, we believe we are currently well placed for yield-curve steepening, considering the Fed is close to the end of its hiking cycle and yield-curve inversion is near multi-decade highs. We are also more comfortable with duration risk at current levels following the rapid rise in 10-year Treasury yields late in the period.
While we maintained a relatively defensive stance within the Fund, our overall spread risk positioning contributed to performance. Relative outperformance was driven primarily by our overweight exposure to securitized sectors, particularly commercial mortgage-backed securities (CMBS), asset-backed securities (ABS), and commercial mortgage obligations (CMO). We continue to prefer exposure to securitized credit relative to corporate credit, as we believe spreads on the former are attractively valued and better reflect the risk of a cooling economy. In our view, taking advantage of the yield available at the front end of the yield curve through high-quality, short-duration securitized credit is one of the most attractive spots in fixed income now.
On a ratings basis, we continued to improve the overall credit quality of the portfolio, preferring higher-rated issuers in anticipation of a more challenging economic environment. While high yield outperformed investment grade, we maintained our allocation to high yield at cycle lows, due to our belief that corporate spreads are not yet adequately pricing in the chances of an economic slowdown.
Janus Henderson Flexible Bond Fund (unaudited)
While the Fund’s regional banking allocation detracted, we consolidated our banking exposure in globally systemic important banks (G-SIB), and in banks we believe are best positioned to navigate a more challenging lending environment. We also continue to be selective and active within the Fund’s CMBS exposure – we have minimal exposure to the troubled office sector, preferring sectors with strong fundamentals such as multi-family housing, industrial, and hospitality.
DERIVATIVES USAGE
The Fund made use of derivative instruments in the form of Treasury futures contracts to manage interest rate risk during the period. Use of derivatives instruments detracted for the 12-month period ended June 30, 2023. Please see the Derivative Instruments section in the “Notes to Financial Statements” for a discussion of derivatives used by the Fund.
OUTLOOK
The U.S. economy continues to show resilience in the face of higher interest rates, which is encouraging. As the Fed hiking cycle marches deeper into its second year, the recession many predicted is yet to materialize. That said, investors should exercise caution – we believe an economic slowdown remains a distinct possibility. Monetary policy works in long and variable lags and, to a large extent, we are yet to feel the full impact of prior rate hikes. A positive development is the easing of recent stress in the banking sector. Notwithstanding, we do expect tighter lending conditions, which is likely to be an additional headwind.
On the core inflation front, we have seen some promising signs of cooling prices while the labor market remains strong. Still, we think the move from the present level of around 4% to the Fed’s target of 2% might end up being slower and bumpier than markets are expecting. In our view, it seems unlikely that inflation would come back down to 2% without an economic slowdown. So, while the progress on inflation has increased the probability of a soft landing, it is not our base case.
Most developed market central banks continue to push in the same upward direction on interest rates, but this is now largely priced into rates markets. While a stronger-for-longer economy is likely to necessitate a higher-for-longer interest-rate environment, we think the risk that interest rates go materially higher from here is slim. As such, taking advantage of the yield available at the front end of the yield curve through high-quality, short-duration credit remains one of the most attractive spots in fixed income. At the same time, we are also more comfortable adding duration risk at current levels, thereby providing much-needed defensive characteristics for portfolios.
There are both positive and negative scenarios on the horizon, but it is late in the cycle, so we remain mindful around the overall amount of spread risk in the portfolio. As such, we eschew lower-quality issuers and industries that are more sensitive to tighter lending conditions, while favoring exposure to securitized sectors where spreads better reflect the risks of our outlook. And, as always, we maintain a dynamic and flexible approach that we believe can take advantage of opportunities that present themselves as the environment evolves.
Thank you for your investment in the Janus Henderson Flexible Bond Fund.
A yield curve plots the yields (interest rate) of bonds with equal credit quality but differing maturity dates. Typically bonds with longer maturities have higher yields.
Duration measures a bond price’s sensitivity to changes in interest rates. The longer a bond’s duration, the higher its sensitivity to changes in interest rates and vice versa.
An inverted yield curve occurs when short-term yields are higher than long-term yields.
The FOMC dot plot is a chart that summarizes the FOMC's outlook for the federal funds rate.
10-Year Treasury Yield is the interest rate on U.S. Treasury bonds that will mature 10 years from the date of purchase.
Credit Spread is the difference in yield between securities with similar maturity but different credit quality. Widening spreads generally indicate deteriorating creditworthiness of corporate borrowers, and narrowing indicate improving.
Basis point (bp) equals 1/100 of a percentage point. 1 bp = 0.01%, 100 bps = 1%.
Actively managed portfolios may fail to produce the intended results. No investment strategy can ensure a profit or eliminate the risk of loss.
Credit quality ratings reflect the middle rating received from Moody’s, Standard & Poor’s and Fitch, where all three agencies have provided a rating. If only two agencies rate a security, the lowest rating is used. If only one agency rates a security, that rating is used. Ratings are measured on a scale that ranges from Aaa (highest) to D (lowest).
Janus Henderson Flexible Bond Fund (unaudited)
Any risk management process discussed includes an effort to monitor and manage risk which should not be confused with and does not imply low risk or the ability to control certain risk factors.
Important Notice – Tailored Shareholder Reports
Effective January 24, 2023, the Securities and Exchange Commission (the “SEC”) adopted rule and form amendments that require mutual funds and exchange-traded funds to provide shareholders with streamlined annual and semi-annual shareholder reports that highlight key information. Other information, including financial statements, that currently appears in shareholder reports will be made available online, delivered free of charge to shareholders upon request, and filed with the SEC. The first tailored shareholder report for the Fund will be for the reporting period ending June 30, 2024. Currently, management is evaluating the impact of the rule and form amendments on the content of the Fund’s current shareholder reports.
Janus Henderson Flexible Bond Fund (unaudited)
Fund At A Glance
June 30, 2023
| | | |
Fund Profile | | |
30-day SEC Yield* | Without
Reimbursement | With
Reimbursement |
Class A Shares NAV | 2.86% | 2.86% |
Class A Shares MOP | 2.72% | 2.72% |
Class C Shares** | 2.29% | 2.29% |
Class D Shares | 3.26% | 3.27% |
Class I Shares | 3.30% | 3.30% |
Class N Shares | 3.39% | 3.39% |
Class R Shares | 2.62% | 2.63% |
Class S Shares | 2.87% | 2.88% |
Class T Shares | 3.14% | 3.14% |
Weighted Average Maturity | 8.3 Years |
Average Effective Duration*** | 6.4 Years |
* Yield will fluctuate. | |
** Does not include the 1.00% contingent deferred sales charge. |
*** A theoretical measure of price volatility. |
| | |
Ratings† Summary - (% of Total Investments) | |
AAA | 1.6% |
AA | 53.2% |
A | 8.3% |
BBB | 16.3% |
BB | 1.3% |
B | 0.1% |
Not Rated | 17.3% |
Other | 1.9% |
† Credit ratings provided by Standard & Poor's (S&P), an independent credit rating agency. Credit ratings range from AAA (highest) to D (lowest) based on S&P's measures. Further information on S&P's rating methodology may be found at www.standardandpoors.com. Other rating agencies may rate the same securities differently. Ratings are relative and subjective and are not absolute standards of quality. Credit quality does not remove market risk and is subject to change. "Not Rated" securities are not rated by S&P, but may be rated by other rating agencies and do not necessarily indicate low quality. "Other" includes cash equivalents, equity securities, and certain derivative instruments. |
Significant Areas of Investment - (% of Net Assets)
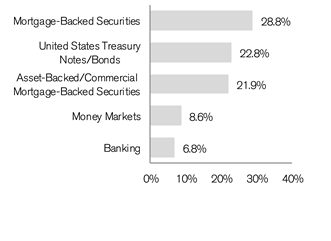
| | | | | | |
Asset Allocation - (% of Net Assets) | |
Mortgage-Backed Securities | | 28.8% | |
Corporate Bonds | | 24.0% | |
United States Treasury Notes/Bonds | | 22.8% | |
Asset-Backed/Commercial Mortgage-Backed Securities | | 21.9% | |
Investment Companies | | 8.6% | |
Investments Purchased with Cash Collateral from Securities Lending | | 0.0% | |
Other | | (6.1)% |
| | | 100.0% |
Janus Henderson Flexible Bond Fund (unaudited)
Performance
| |
See important disclosures on the next page. |

| | | | | | | | | | | |
| | | | | | | | | |
| | | | | | | | | |
Average Annual Total Return - for the periods ended June 30, 2023 | | | Prospectus Expense Ratios |
| | One
Year | Five
Year | Ten
Year | Since
Inception* | | | Total Annual Fund
Operating Expenses‡ | Net Annual Fund
Operating Expenses‡ |
Class A Shares at NAV | | -1.60% | 0.97% | 1.45% | 5.66% | | | 0.85% | 0.70% |
Class A Shares at MOP | | -6.30% | 0.00% | 0.96% | 5.51% | | | | |
Class C Shares at NAV | | -2.31% | 0.33% | 0.78% | 4.97% | | | 1.51% | 1.45% |
Class C Shares at CDSC | | -3.26% | 0.33% | 0.78% | 4.97% | | | | |
Class D Shares | | -1.47% | 1.22% | 1.69% | 5.75% | | | 0.57% | 0.57% |
Class I Shares | | -1.36% | 1.31% | 1.76% | 5.77% | | | 0.51% | 0.45% |
Class N Shares | | -1.35% | 1.36% | 1.83% | 5.78% | | | 0.43% | 0.43% |
Class R Shares | | -2.09% | 0.61% | 1.08% | 5.26% | | | 1.19% | 1.19% |
Class S Shares | | -1.84% | 0.85% | 1.33% | 5.52% | | | 0.95% | 0.95% |
Class T Shares | | -1.58% | 1.12% | 1.61% | 5.71% | | | 0.68% | 0.68% |
Bloomberg U.S. Aggregate Bond Index | | -0.94% | 0.77% | 1.52% | 5.42%** | | | | |
Morningstar Quartile - Class T Shares | | 4th | 2nd | 3rd | 2nd | | | | |
Morningstar Ranking - based on total returns for Intermediate Core - Plus Bond Funds | | 481/626 | 191/549 | 271/466 | 25/89 | | | | |
Returns quoted are past performance and do not guarantee future results; current performance may be lower or higher. Investment returns and principal value will vary; there may be a gain or loss when shares are sold. For the most recent month-end performance call 800.668.0434 (or 800.525.3713 if you hold shares directly with Janus Henderson) or visit janushenderson.com/performance (or janushenderson.com/allfunds if you hold shares directly with Janus Henderson).
Maximum Offering Price (MOP) returns include the maximum sales charge of 4.75%. Net Asset Value (NAV) returns exclude this charge, which would have reduced returns.
CDSC returns include a 1% contingent deferred sales charge (CDSC) on Shares redeemed within 12 months of purchase. Net Asset Value (NAV) returns exclude this charge, which would have reduced returns.
For certain periods, the Fund’s performance may reflect the effects of expense waivers.
Performance may be affected by risks that include those associated with foreign and emerging markets, fixed income securities, high-yield and high-risk
Janus Henderson Flexible Bond Fund (unaudited)
Performance
securities, undervalued, overlooked and smaller capitalization companies, real estate related securities including Real Estate Investment Trusts (REITs), Environmental, Social and Governance (ESG) factors, non-diversification, portfolio turnover, derivatives, short sales, initial public offerings (IPOs) and potential conflicts of interest. Each product has different risks. Please see the prospectus for more information about risks, holdings and other details.
Returns include reinvestment of all dividends and distributions and do not reflect the deduction of taxes that a shareholder would pay on Fund distributions or redemptions of Fund shares. The returns do not include adjustments in accordance with generally accepted accounting principles required at the period end for financial reporting purposes.
Class A Shares, Class C Shares, Class R Shares, and Class S Shares commenced operations on July 6, 2009. Performance shown for each class for periods prior to July 6, 2009, reflects the performance of the Fund’s Class J Shares, the initial share class (renamed Class T Shares effective February 16, 2010), calculated using the fees and expenses of each respective share class, without the effect of any fee and expense limitations or waivers.
Class D Shares commenced operations on February 16, 2010. Performance shown for periods prior to February 16, 2010, reflects the performance of the Fund’s former Class J Shares, calculated using the fees and expenses in effect during the periods shown, net of any applicable fee and expense limitations or waivers.
Class I Shares commenced operations on July 6, 2009. Performance shown for periods prior to July 6, 2009, reflects the performance of the Fund’s former Class J Shares, calculated using the fees and expenses of Class J Shares, net of any applicable fee and expense limitations or waivers.
Class N Shares commenced operations on May 31, 2012. Performance shown for periods prior to May 31, 2012, reflects the performance of the Fund’s Class T Shares, calculated using the fees and expenses of Class T Shares, net of any applicable fee and expense limitations or waivers.
If each share class of the Fund had been available during periods prior to its commencement, the performance shown may have been different. The performance shown for periods following the Fund’s commencement of each share class reflects the fees and expenses of each respective share class, net of any applicable fee and expense limitations or waivers. Please refer to the Fund’s prospectuses for further details concerning historical performance.
Ranking is for the share class shown only; other classes may have different performance characteristics. When an expense waiver is in effect, it may have a material effect on the total return, and therefore the ranking for the period.
© 2023 Morningstar, Inc. All Rights Reserved.
There is no assurance that the investment process will consistently lead to successful investing.
See Notes to Schedule of Investments and Other Information for index definitions.
Index performance does not reflect the expenses of managing a portfolio as an index is unmanaged and not available for direct investment.
See “Useful Information About Your Fund Report.”
*The Fund’s inception date – July 7, 1987
** The Bloomberg U.S. Aggregate Bond Index’s since inception returns are calculated from June 30, 1987.
‡ As stated in the prospectus. Net expense ratios reflect the expense waiver, if any, contractually agreed to for at least a one-year period commencing on October 28, 2022. This contractual waiver may be terminated or modified only at the discretion of the Board of Trustees. See Financial Highlights for actual expense ratios during the reporting period.
Janus Henderson Flexible Bond Fund (unaudited)
Expense Examples
As a shareholder of the Fund, you incur two types of costs: (1) transaction costs, such as sales charges (loads) on purchase payments (applicable to Class A Shares only); and (2) ongoing costs, including management fees; 12b-1 distribution and shareholder servicing fees; transfer agent fees and expenses payable pursuant to the Transfer Agency Agreement; and other Fund expenses. This example is intended to help you understand your ongoing costs (in dollars) of investing in the Fund and to compare these costs with the ongoing costs of investing in other mutual funds. To do so, compare this 5% hypothetical example with the 5% hypothetical examples that appear in the shareholder reports of the other funds. The example is based upon an investment of $1,000 invested at the beginning of the period and held for the six-months indicated, unless noted otherwise in the table and footnotes below.
Actual Expenses
The information in the table under the heading “Actual” provides information about actual account values and actual expenses. You may use the information in these columns, together with the amount you invested, to estimate the expenses that you paid over the period. Simply divide your account value by $1,000 (for example, an $8,600 account value divided by $1,000 = 8.6), then multiply the result by the number in the appropriate column for your share class under the heading entitled “Expenses Paid During Period” to estimate the expenses you paid on your account during the period.
Hypothetical Example for Comparison Purposes
The information in the table under the heading “Hypothetical (5% return before expenses)” provides information about hypothetical account values and hypothetical expenses based upon the Fund’s actual expense ratio and an assumed rate of return of 5% per year before expenses, which is not the Fund’s actual return. The hypothetical account values and expenses may not be used to estimate the actual ending account balance or expenses you paid for the period. You may use this information to compare the ongoing costs of investing in the Fund and other funds. To do so, compare this 5% hypothetical example with the 5% hypothetical examples that appear in the shareholder reports of the other funds. Additionally, for an analysis of the fees associated with an investment in any share class or other similar funds, please visit www.finra.org/fundanalyzer.
Please note that the expenses shown in the table are meant to highlight your ongoing costs only and do not reflect any transaction costs. These fees are fully described in the Fund’s prospectuses. Therefore, the hypothetical examples are useful in comparing ongoing costs only, and will not help you determine the relative total costs of owning different funds. In addition, if these transaction costs were included, your costs would have been higher.
| | | | | | | | | | | |
| | | | | | | | |
| | | Actual | | Hypothetical
(5% return before expenses) | |
| Beginning
Account
Value
(1/1/23) | Ending
Account
Value
(6/30/23) | Expenses
Paid During
Period
(1/1/23 - 6/30/23)† | | Beginning
Account
Value
(1/1/23) | Ending
Account
Value
(6/30/23) | Expenses
Paid During
Period
(1/1/23 - 6/30/23)† | Net Annualized
Expense Ratio
(1/1/23 - 6/30/23) |
Class A Shares | $1,000.00 | $1,016.30 | $3.50 | | $1,000.00 | $1,021.32 | $3.51 | 0.70% |
Class C Shares | $1,000.00 | $1,012.60 | $7.09 | | $1,000.00 | $1,017.75 | $7.10 | 1.42% |
Class D Shares | $1,000.00 | $1,016.90 | $2.85 | | $1,000.00 | $1,021.97 | $2.86 | 0.57% |
Class I Shares | $1,000.00 | $1,017.50 | $2.30 | | $1,000.00 | $1,022.51 | $2.31 | 0.46% |
Class N Shares | $1,000.00 | $1,017.50 | $2.30 | | $1,000.00 | $1,022.51 | $2.31 | 0.46% |
Class R Shares | $1,000.00 | $1,013.80 | $5.99 | | $1,000.00 | $1,018.84 | $6.01 | 1.20% |
Class S Shares | $1,000.00 | $1,015.00 | $4.75 | | $1,000.00 | $1,020.08 | $4.76 | 0.95% |
Class T Shares | $1,000.00 | $1,016.30 | $3.45 | | $1,000.00 | $1,021.37 | $3.46 | 0.69% |
† | Expenses Paid During Period are equal to the Net Annualized Expense Ratio multiplied by the average account value over the period, multiplied by 181/365 (to reflect the one-half year period). Expenses in the examples include the effect of applicable fee waivers and/or expense reimbursements, if any. Had such waivers and/or reimbursements not been in effect, your expenses would have been higher. Please refer to the Notes to Financial Statements or the Fund’s prospectuses for more information regarding waivers and/or reimbursements. |
Janus Henderson Flexible Bond Fund
Schedule of Investments
June 30, 2023
| | | | | | | | |
Shares or
Principal Amounts | | | Value | |
Asset-Backed/Commercial Mortgage-Backed Securities– 21.9% | | | |
| | 208 Park Avenue Mortgage Trust 2017-280P, | | | | | | |
| | ICE LIBOR USD 1 Month + 0.8800%, 6.0620%, 9/15/34 (144A)‡ | | $4,050,930 | | | $3,932,875 | |
| | A&D Mortgage Trust 2023-NQM2 A1, 6.1320%, 5/25/68 (144A)Ç | | 5,489,757 | | | 5,402,546 | |
| | ACC Auto Trust 2021-A A, 1.0800%, 4/15/27 (144A) | | 116,717 | | | 116,546 | |
| | ACC Auto Trust 2022-A A, 4.5800%, 7/15/26 (144A) | | 1,339,270 | | | 1,320,581 | |
| | Affirm Asset Securitization Trust 2020-Z2 A, 1.9000%, 1/15/25 (144A) | | 194,320 | | | 191,942 | |
| | Affirm Asset Securitization Trust 2021-B A, 1.0300%, 8/17/26 (144A) | | 4,780,000 | | | 4,649,861 | |
| | Aimco 2020-11A AR, | | | | | | |
| | ICE LIBOR USD 3 Month + 1.1300%, 6.3903%, 10/17/34 (144A)‡ | | 1,763,000 | | | 1,730,718 | |
| | Angel Oak Mortgage Trust I LLC 2019-5, 2.5930%, 10/25/49 (144A)‡ | | 486,636 | | | 465,253 | |
| | Angel Oak Mortgage Trust I LLC 2019-6, | | | | | | |
| | ICE LIBOR USD 12 Month + 0.9500%, 2.6200%, 11/25/59 (144A)‡ | | 440,204 | | | 416,034 | |
| | Angel Oak Mortgage Trust I LLC 2020-2, | | | | | | |
| | ICE LIBOR USD 12 Month + 2.2000%, 2.5310%, 1/26/65 (144A)‡ | | 1,369,224 | | | 1,229,808 | |
| | Angel Oak Mortgage Trust I LLC 2020-3, | | | | | | |
| | ICE LIBOR USD 12 Month + 1.0000%, 2.4100%, 4/25/65 (144A)‡ | | 1,081,419 | | | 975,010 | |
| | Aqua Finance Trust 2021-A A, 1.5400%, 7/17/46 (144A) | | 1,860,239 | | | 1,645,463 | |
| | ARES CLO Ltd 2021-60A A, | | | | | | |
| | ICE LIBOR USD 3 Month + 1.1200%, 6.3817%, 7/18/34 (144A)‡ | | 1,486,000 | | | 1,452,277 | |
| | Arivo Acceptance Auto Loan Receivables 2022-1A A, 3.9300%, 5/15/28 (144A) | | 1,486,466 | | | 1,438,804 | |
| | Atalaya Equipment Leasing Fund I LP 2021-1A A2, 1.2300%, 5/15/26 (144A) | | 1,589,658 | | | 1,557,573 | |
| | Babson CLO Ltd 2018-3A A1, | | | | | | |
| | ICE LIBOR USD 3 Month + 0.9500%, 6.2004%, 7/20/29 (144A)‡ | | 1,983,071 | | | 1,976,219 | |
| | Babson CLO Ltd 2019-3A A1R, | | | | | | |
| | ICE LIBOR USD 3 Month + 1.0700%, 6.3204%, 4/20/31 (144A)‡ | | 6,351,000 | | | 6,301,862 | |
| | Barclays Commercial Mortgage Securities LLC 2015-SRCH, | | | | | | |
| | 4.1970%, 8/10/35 (144A) | | 9,721,000 | | | 8,778,244 | |
| | BPR Trust 2022-OANA A, | | | | | | |
| | CME Term SOFR 1 Month + 1.8980%, 7.0450%, 4/15/37 (144A)‡ | | 11,487,000 | | | 11,183,709 | |
| | BX Commercial Mortgage Trust 2019-OC11, 3.6050%, 12/9/41 (144A) | | 2,160,000 | | | 1,852,211 | |
| | BX Commercial Mortgage Trust 2019-OC11, 3.8560%, 12/9/41 (144A) | | 4,295,000 | | | 3,638,667 | |
| | BX Commercial Mortgage Trust 2019-XL, | | | | | | |
| | CME Term SOFR 1 Month + 1.0345%, 6.1815%, 10/15/36 (144A)‡ | | 9,196,119 | | | 9,135,183 | |
| | BX Commercial Mortgage Trust 2019-XL, | | | | | | |
| | CME Term SOFR 1 Month + 1.1945%, 6.3415%, 10/15/36 (144A)‡ | | 2,552,550 | | | 2,526,927 | |
| | BX Commercial Mortgage Trust 2020-VKNG A, | | | | | | |
| | CME Term SOFR 1 Month + 1.0445%, 6.1915%, 10/15/37 (144A)‡ | | 1,032,857 | | | 1,019,839 | |
| | BX Commercial Mortgage Trust 2021-LBA AJV, | | | | | | |
| | CME Term SOFR 1 Month + 0.9145%, 6.0615%, 2/15/36 (144A)‡ | | 5,348,000 | | | 5,176,153 | |
| | BX Commercial Mortgage Trust 2021-LBA AV, | | | | | | |
| | CME Term SOFR 1 Month + 0.9145%, 6.0615%, 2/15/36 (144A)‡ | | 6,081,000 | | | 5,889,133 | |
| | BX Commercial Mortgage Trust 2021-VINO A, | | | | | | |
| | ICE LIBOR USD 1 Month + 0.6523%, 5.8453%, 5/15/38 (144A)‡ | | 1,473,000 | | | 1,432,290 | |
| | BX Commercial Mortgage Trust 2021-VOLT B, | | | | | | |
| | ICE LIBOR USD 1 Month + 0.9500%, 6.1433%, 9/15/36 (144A)‡ | | 6,188,000 | | | 5,921,297 | |
| | BX Commercial Mortgage Trust 2021-VOLT D, | | | | | | |
| | ICE LIBOR USD 1 Month + 1.6500%, 6.8433%, 9/15/36 (144A)‡ | | 6,499,000 | | | 6,161,535 | |
| | BX Commercial Mortgage Trust 2022-FOX2 A2, | | | | | | |
| | CME Term SOFR 1 Month + 0.7492%, 5.8962%, 4/15/39 (144A)‡ | | 6,106,777 | | | 5,838,471 | |
| | BX Commercial Mortgage Trust 2023-VLT2 A, | | | | | | |
| | CME Term SOFR 1 Month + 2.2810%, 7.4280%, 6/15/40 (144A)‡ | | 1,109,000 | | | 1,104,533 | |
| | BX Commercial Mortgage Trust 2023-VLT2 B, | | | | | | |
| | CME Term SOFR 1 Month + 3.1290%, 8.2760%, 6/15/40 (144A)‡ | | 2,466,000 | | | 2,452,224 | |
| | Carvana Auto Receivables Trust 2021-P4 A2, 0.8200%, 4/10/25 | | 311,300 | | | 310,871 | |
| | CBAM CLO Management 2019-11RA A1, | | | | | | |
| | ICE LIBOR USD 3 Month + 1.1800%, 6.4304%, 1/20/35 (144A)‡ | | 7,300,000 | | | 7,177,068 | |
| | CBAM CLO Management 2019-11RA B, | | | | | | |
| | ICE LIBOR USD 3 Month + 1.7500%, 7.0004%, 1/20/35 (144A)‡ | | 2,775,193 | | | 2,655,921 | |
| | Cedar Funding Ltd 2019-11A A1R, | | | | | | |
| | ICE LIBOR USD 3 Month + 1.0500%, 6.0034%, 5/29/32 (144A)‡ | | 5,305,000 | | | 5,242,831 | |
| | |
See Notes to Schedule of Investments and Other Information and Notes to Financial Statements. |
| |
8 | JUNE 30, 2023 |
Janus Henderson Flexible Bond Fund
Schedule of Investments
June 30, 2023
| | | | | | | | |
Shares or
Principal Amounts | | | Value | |
Asset-Backed/Commercial Mortgage-Backed Securities– (continued) | | | |
| | CF Hippolyta Issuer LLC 2021-1A A1, 1.5300%, 3/15/61 (144A) | | $7,105,112 | | | $6,142,616 | |
| | CF Hippolyta Issuer LLC 2021-1A B1, 1.9800%, 3/15/61 (144A) | | 2,608,695 | | | 2,198,167 | |
| | CF Hippolyta Issuer LLC 2022-1A A1, 5.9700%, 8/15/62 (144A) | | 6,581,951 | | | 6,394,688 | |
| | CF Hippolyta Issuer LLC 2022-1A A2, 6.1100%, 8/15/62 (144A) | | 15,903,775 | | | 14,815,243 | |
| | Chase Auto Credit Linked Notes 2021-2 B, 0.8890%, 12/26/28 (144A) | | 1,817,263 | | | 1,755,929 | |
| | Chase Mortgage Finance Corp 2021-CL1 M1, | | | | | | |
| | US 30 Day Average SOFR + 1.2000%, 6.2666%, 2/25/50 (144A)‡ | | 3,093,729 | | | 2,829,387 | |
| | CIFC Funding Ltd 2021-4A A, | | | | | | |
| | ICE LIBOR USD 3 Month + 1.0500%, 6.3103%, 7/15/33 (144A)‡ | | 5,567,595 | | | 5,505,639 | |
| | CIFC Funding Ltd 2021-7A B, | | | | | | |
| | ICE LIBOR USD 3 Month + 1.6000%, 6.8727%, 1/23/35 (144A)‡ | | 2,232,376 | | | 2,160,929 | |
| | CIM Trust 2021-NR1 A1, 2.5690%, 7/25/55 (144A)Ç | | 3,016,770 | | | 2,898,663 | |
| | CIM Trust 2021-NR4 A1, 2.8160%, 10/25/61 (144A)Ç | | 1,391,901 | | | 1,298,691 | |
| | Cold Storage Trust 2020-ICE5 A, | | | | | | |
| | ICE LIBOR USD 1 Month + 0.9000%, 6.0933%, 11/15/37 (144A)‡ | | 10,993,766 | | | 10,798,898 | |
| | Cold Storage Trust 2020-ICE5 B, | | | | | | |
| | ICE LIBOR USD 1 Month + 1.3000%, 6.4933%, 11/15/37 (144A)‡ | | 4,888,412 | | | 4,800,058 | |
| | Cold Storage Trust 2020-ICE5 C, | | | | | | |
| | ICE LIBOR USD 1 Month + 1.6500%, 6.8433%, 11/15/37 (144A)‡ | | 4,906,106 | | | 4,811,489 | |
| | COLT Funding LLC 2020-2, | | | | | | |
| | ICE LIBOR USD 12 Month + 1.5000%, 1.8530%, 3/25/65 (144A)‡ | | 41,779 | | | 41,252 | |
| | COLT Funding LLC 2020-3, | | | | | | |
| | ICE LIBOR USD 12 Month + 1.2000%, 1.5060%, 4/27/65 (144A)‡ | | 372,156 | | | 342,470 | |
| | Connecticut Avenue Securities Trust 2018-R07, | | | | | | |
| | ICE LIBOR USD 1 Month + 2.4000%, 7.5504%, 4/25/31 (144A)‡ | | 140,190 | | | 140,629 | |
| | Connecticut Avenue Securities Trust 2019-R02, | | | | | | |
| | ICE LIBOR USD 1 Month + 2.3000%, 7.4504%, 8/25/31 (144A)‡ | | 27,336 | | | 27,337 | |
| | Connecticut Avenue Securities Trust 2019-R03, | | | | | | |
| | ICE LIBOR USD 1 Month + 2.1500%, 7.3004%, 9/25/31 (144A)‡ | | 167,070 | | | 167,305 | |
| | Connecticut Avenue Securities Trust 2019-R07, | | | | | | |
| | ICE LIBOR USD 1 Month + 2.1000%, 7.2504%, 10/25/39 (144A)‡ | | 89,278 | | | 89,423 | |
| | Connecticut Avenue Securities Trust 2021-R02 2M2, | | | | | | |
| | US 30 Day Average SOFR + 2.0000%, 7.0666%, 11/25/41 (144A)‡ | | 5,654,000 | | | 5,504,730 | |
| | Connecticut Avenue Securities Trust 2021-R03 1M1, | | | | | | |
| | US 30 Day Average SOFR + 0.8500%, 5.9166%, 12/25/41 (144A)‡ | | 2,422,192 | | | 2,394,076 | |
| | Connecticut Avenue Securities Trust 2021-R03 1M2, | | | | | | |
| | US 30 Day Average SOFR + 1.6500%, 6.7166%, 12/25/41 (144A)‡ | | 3,943,000 | | | 3,810,211 | |
| | Connecticut Avenue Securities Trust 2022-R01 1B1, | | | | | | |
| | US 30 Day Average SOFR + 3.1500%, 8.2166%, 12/25/41 (144A)‡ | | 6,109,000 | | | 5,984,695 | |
| | Connecticut Avenue Securities Trust 2022-R03 1M1, | | | | | | |
| | US 30 Day Average SOFR + 2.1000%, 7.1666%, 3/25/42 (144A)‡ | | 7,033,377 | | | 7,050,403 | |
| | Connecticut Avenue Securities Trust 2022-R04 1M1, | | | | | | |
| | US 30 Day Average SOFR + 2.0000%, 7.0666%, 3/25/42 (144A)‡ | | 3,091,746 | | | 3,096,778 | |
| | Connecticut Avenue Securities Trust 2022-R06 1M1, | | | | | | |
| | US 30 Day Average SOFR + 2.7500%, 7.8166%, 5/25/42 (144A)‡ | | 2,120,871 | | | 2,159,305 | |
| | Connecticut Avenue Securities Trust 2022-R08 1M1, | | | | | | |
| | US 30 Day Average SOFR + 2.5500%, 7.6166%, 7/25/42 (144A)‡ | | 1,684,709 | | | 1,705,374 | |
| | Connecticut Avenue Securities Trust 2023-R01 1M1, | | | | | | |
| | US 30 Day Average SOFR + 2.4000%, 7.4666%, 12/25/42 (144A)‡ | | 2,822,305 | | | 2,835,746 | |
| | Connecticut Avenue Securities Trust 2023-R03 2M1, | | | | | | |
| | US 30 Day Average SOFR + 2.5000%, 7.5666%, 4/25/43 (144A)‡ | | 4,069,653 | | | 4,104,632 | |
| | Consumer Loan Underlying Bond Credit Trust 2019-P2 C, | | | | | | |
| | 4.4100%, 10/15/26 (144A) | | 182,080 | | | 181,965 | |
| | Consumer Loan Underlying Bond Credit Trust 2020-P1 C, | | | | | | |
| | 4.6100%, 3/15/28 (144A) | | 141,775 | | | 141,229 | |
| | CP EF Asset Securitization I LLC 2002-1A A, 5.9600%, 4/15/30 (144A) | | 2,223,758 | | | 2,186,031 | |
| | Credit Suisse Commercial Mortgage Trust 2019-ICE4, | | | | | | |
| | ICE LIBOR USD 1 Month + 0.9800%, 6.1730%, 5/15/36 (144A)‡ | | 9,165,198 | | | 9,106,305 | |
| | Credit Suisse Commercial Mortgage Trust 2019-ICE4 C, | | | | | | |
| | ICE LIBOR USD 1 Month + 1.4300%, 6.6230%, 5/15/36 (144A)‡ | | 5,155,175 | | | 5,097,100 | |
| | |
See Notes to Schedule of Investments and Other Information and Notes to Financial Statements. |
| |
Janus Investment Fund | 9 |
Janus Henderson Flexible Bond Fund
Schedule of Investments
June 30, 2023
| | | | | | | | |
Shares or
Principal Amounts | | | Value | |
Asset-Backed/Commercial Mortgage-Backed Securities– (continued) | | | |
| | Credit Suisse Commercial Mortgage Trust 2021-WEHO A, | | | | | | |
| | CME Term SOFR 1 Month + 4.0838%, 9.2308%, 4/15/26 (144A)‡ | | $4,709,120 | | | $4,665,272 | |
| | Diamond Infrastructure Funding LLC 2021-1A A, 1.7600%, 4/15/49 (144A) | | 7,083,000 | | | 6,080,389 | |
| | Elmwood CLO VIII Ltd 2019-2A AR, | | | | | | |
| | ICE LIBOR USD 3 Month + 1.1500%, 5.9577%, 4/20/34 (144A)‡ | | 2,239,000 | | | 2,204,875 | |
| | Exeter Automobile Receivables Trust 2019-1, 5.2000%, 1/15/26 (144A) | | 3,260,000 | | | 3,249,295 | |
| | Exeter Automobile Receivables Trust 2021-1A D, 1.0800%, 11/16/26 | | 3,626,000 | | | 3,404,722 | |
| | Fannie Mae REMICS, 3.0000%, 5/25/48 | | 4,707,899 | | | 4,259,973 | |
| | Fannie Mae REMICS, 3.0000%, 11/25/49 | | 5,965,045 | | | 5,271,527 | |
| | Flagstar Mortgage Trust 2021-13IN A2, 3.0000%, 12/30/51 (144A)‡ | | 13,843,661 | | | 11,604,345 | |
| | Freddie Mac Structured Agency Credit Risk Debt Notes 2019-DNA4 M2, | | | | | | |
| | ICE LIBOR USD 1 Month + 1.9500%, 7.1004%, 10/25/49 (144A)‡ | | 62,186 | | | 62,273 | |
| | Freddie Mac Structured Agency Credit Risk Debt Notes 2020-DNA6 M2, | | | | | | |
| | US 30 Day Average SOFR + 2.0000%, 7.0666%, 12/25/50 (144A)‡ | | 4,395,285 | | | 4,436,362 | |
| | Freddie Mac Structured Agency Credit Risk Debt Notes 2020-HQA5 M2, | | | | | | |
| | US 30 Day Average SOFR + 2.6000%, 7.6666%, 11/25/50 (144A)‡ | | 4,937,391 | | | 5,007,918 | |
| | Freddie Mac Structured Agency Credit Risk Debt Notes 2021-DNA2 M2, | | | | | | |
| | US 30 Day Average SOFR + 2.3000%, 7.3666%, 8/25/33 (144A)‡ | | 6,179,172 | | | 6,182,323 | |
| | Freddie Mac Structured Agency Credit Risk Debt Notes 2021-DNA6 M1, | | | | | | |
| | US 30 Day Average SOFR + 0.8000%, 5.8666%, 10/25/41 (144A)‡ | | 3,721,889 | | | 3,695,851 | |
| | Freddie Mac Structured Agency Credit Risk Debt Notes 2021-HQA1 M2, | | | | | | |
| | US 30 Day Average SOFR + 2.2500%, 7.3166%, 8/25/33 (144A)‡ | | 2,897,809 | | | 2,851,544 | |
| | Freddie Mac Structured Agency Credit Risk Debt Notes 2022-DNA5 M1A, | | | | | | |
| | US 30 Day Average SOFR + 2.9500%, 8.0166%, 6/25/42 (144A)‡ | | 4,346,091 | | | 4,417,361 | |
| | Freddie Mac Structured Agency Credit Risk Debt Notes 2022-DNA6 M1A, | | | | | | |
| | US 30 Day Average SOFR + 2.1500%, 7.2166%, 9/25/42 (144A)‡ | | 910,971 | | | 912,867 | |
| | Freddie Mac Structured Agency Credit Risk Debt Notes 2022-HQA1 M1A, | | | | | | |
| | US 30 Day Average SOFR + 2.1000%, 7.1666%, 3/25/42 (144A)‡ | | 3,226,455 | | | 3,230,157 | |
| | Freddie Mac Structured Agency Credit Risk Debt Notes 2023-DNA2 M1A, | | | | | | |
| | US 30 Day Average SOFR + 2.1000%, 7.1666%, 4/25/43 (144A)‡ | | 2,060,157 | | | 2,066,165 | |
| | GCAT 2022-INV1 A1, 3.0000%, 12/25/51 (144A)‡ | | 14,783,362 | | | 12,402,275 | |
| | Great Wolf Trust, | | | | | | |
| | CME Term SOFR 1 Month + 1.1485%, 6.2955%, 12/15/36 (144A)‡ | | 2,050,000 | | | 2,025,694 | |
| | Great Wolf Trust, | | | | | | |
| | CME Term SOFR 1 Month + 1.4485%, 6.5955%, 12/15/36 (144A)‡ | | 2,296,000 | | | 2,257,806 | |
| | Great Wolf Trust, | | | | | | |
| | CME Term SOFR 1 Month + 1.7475%, 6.8945%, 12/15/36 (144A)‡ | | 2,558,000 | | | 2,510,484 | |
| | Highbridge Loan Management Ltd 2021-16A B, | | | | | | |
| | ICE LIBOR USD 3 Month + 1.7000%, 6.9727%, 1/23/35 (144A)‡ | | 2,113,425 | | | 2,042,558 | |
| | JP Morgan Chase Commercial Mortgage Sec Trust 2020-ACE A, | | | | | | |
| | 3.2865%, 1/10/37 (144A) | | 6,185,000 | | | 5,760,771 | |
| | JP Morgan Chase Commercial Mortgage Sec Trust 2020-ACE B, | | | | | | |
| | 3.6401%, 1/10/37 (144A) | | 4,370,000 | | | 3,988,502 | |
| | LAD Auto Receivables Trust 2021-1A A, 1.3000%, 8/17/26 (144A) | | 1,377,479 | | | 1,341,644 | |
| | LAD Auto Receivables Trust 2022-1A A, 5.2100%, 6/15/27 (144A) | | 3,873,503 | | | 3,828,327 | |
| | Lendbuzz Securitization Trust 2021-1A A, 4.2200%, 5/17/27 (144A)‡ | | 3,893,240 | | | 3,761,136 | |
| | Lendbuzz Securitization Trust 2023-1A A2, 6.9200%, 8/15/28 (144A) | | 2,675,000 | | | 2,661,875 | |
| | Life Financial Services Trust 2021-BMR A, | | | | | | |
| | CME Term SOFR 1 Month + 0.8145%, 5.9615%, 3/15/38 (144A)‡ | | 11,607,894 | | | 11,306,344 | |
| | Life Financial Services Trust 2021-BMR C, | | | | | | |
| | CME Term SOFR 1 Month + 1.2145%, 6.3615%, 3/15/38 (144A)‡ | | 6,486,620 | | | 6,245,056 | |
| | Life Financial Services Trust 2022-BMR2 A1, | | | | | | |
| | CME Term SOFR 1 Month + 1.2952%, 6.4422%, 5/15/39 (144A)‡ | | 6,610,000 | | | 6,456,371 | |
| | Madison Park Funding Ltd 2019-35A A1R, | | | | | | |
| | ICE LIBOR USD 3 Month + 0.9900%, 6.2404%, 4/20/32 (144A)‡ | | 7,174,000 | | | 7,072,488 | |
| | Marlette Funding Trust 2023-2A B, 6.5400%, 6/15/33 (144A) | | 1,710,000 | | | 1,707,460 | |
| | MED Trust 2021-MDLN E, | | | | | | |
| | ICE LIBOR USD 1 Month + 3.1500%, 8.3440%, 11/15/38 (144A)‡ | | 8,277,275 | | | 7,821,593 | |
| | Mello Mortgage Capital Acceptance Trust 2021-INV2 A11, | | | | | | |
| | US 30 Day Average SOFR + 0.9500%, 5.0000%, 8/25/51 (144A)‡ | | 4,277,402 | | | 3,923,627 | |
| | |
See Notes to Schedule of Investments and Other Information and Notes to Financial Statements. |
| |
10 | JUNE 30, 2023 |
Janus Henderson Flexible Bond Fund
Schedule of Investments
June 30, 2023
| | | | | | | | |
Shares or
Principal Amounts | | | Value | |
Asset-Backed/Commercial Mortgage-Backed Securities– (continued) | | | |
| | Mello Mortgage Capital Acceptance Trust 2021-INV3 A11, | | | | | | |
| | US 30 Day Average SOFR + 0.9500%, 5.0000%, 10/25/51 (144A)‡ | | $5,410,929 | | | $4,963,496 | |
| | Mello Mortgage Capital Acceptance Trust 2021-INV4 A3, | | | | | | |
| | 2.5000%, 12/25/51 (144A)‡ | | 4,081,975 | | | 3,276,696 | |
| | Mello Mortgage Capital Acceptance Trust 2022-INV1 A2, | | | | | | |
| | 3.0000%, 3/25/52 (144A)‡ | | 10,143,886 | | | 8,518,043 | |
| | Mercury Financial Credit Card Master Trust 2023-1A A, | | | | | | |
| | 8.0400%, 9/20/27 (144A) | | 4,532,000 | | | 4,535,741 | |
| | MHC Commercial Mortgage Trust 2021-MHC A, | | | | | | |
| | CME Term SOFR 1 Month + 0.9154%, 6.0624%, 4/15/38 (144A)‡ | | 10,483,358 | | | 10,294,389 | |
| | MHC Commercial Mortgage Trust 2021-MHC C, | | | | | | |
| | CME Term SOFR 1 Month + 1.4654%, 6.6124%, 4/15/38 (144A)‡ | | 5,917,835 | | | 5,765,075 | |
| | New Residential Mortgage Loan Trust 2018-2, | | | | | | |
| | ICE LIBOR USD 6 Month + 0.6800%, 4.5000%, 2/25/58 (144A)‡ | | 2,057,076 | | | 1,937,187 | |
| | NRZ Excess Spread Collateralized Notes 2020-PLS1 A, | | | | | | |
| | 3.8440%, 12/25/25 (144A) | | 1,110,216 | | | 1,027,652 | |
| | NRZ Excess Spread Collateralized Notes 2021-FHT1 A, 3.1040%, 7/25/26 (144A) | | 3,296,608 | | | 2,950,588 | |
| | Oak Street Investment Grade Net Lease Fund 2020-1A A1, | | | | | | |
| | 1.8500%, 11/20/50 (144A) | | 4,666,837 | | | 4,211,714 | |
| | Oasis Securitization 2022-1A A, 4.7500%, 5/15/34 (144A) | | 1,250,984 | | | 1,231,345 | |
| | Oceanview Mortgage Trust 2021-4 A11, | | | | | | |
| | US 30 Day Average SOFR + 0.8500%, 5.0000%, 10/25/51 (144A)‡ | | 5,915,866 | | | 5,379,849 | |
| | Oceanview Mortgage Trust 2021-5 AF, | | | | | | |
| | US 30 Day Average SOFR + 0.8500%, 5.0000%, 11/25/51 (144A)‡ | | 5,748,720 | | | 5,230,215 | |
| | Oceanview Mortgage Trust 2022-1 A1, 3.0000%, 12/25/51 (144A)‡ | | 5,999,967 | | | 5,034,001 | |
| | Oceanview Mortgage Trust 2022-2 A1, 3.0000%, 12/25/51 (144A)‡ | | 11,629,020 | | | 9,756,822 | |
| | Onslow Bay Financial LLC 2021-INV3 A3, 2.5000%, 10/25/51 (144A)‡ | | 4,625,454 | | | 3,709,629 | |
| | Onslow Bay Financial LLC 2022-INV1 A1, 3.0000%, 12/25/51 (144A)‡ | | 11,775,285 | | | 9,878,140 | |
| | Onslow Bay Financial LLC 2022-INV1 A18, 3.0000%, 12/25/51 (144A)‡ | | 4,993,111 | | | 4,073,258 | |
| | Pagaya AI Debt Selection Trust 2021-1 A, 1.1800%, 11/15/27 (144A) | | 506,398 | | | 505,519 | |
| | Pagaya AI Debt Selection Trust 2022-1 A, 2.0300%, 10/15/29 (144A) | | 1,896,528 | | | 1,844,573 | |
| | Preston Ridge Partners Mortgage Trust 2020-4 A1, 2.9510%, 10/25/25 (144A)Ç | | 3,002,943 | | | 2,886,383 | |
| | Preston Ridge Partners Mortgage Trust 2021-10 A1, 2.4870%, 10/25/26 (144A)Ç | | 5,537,008 | | | 5,100,454 | |
| | Preston Ridge Partners Mortgage Trust 2021-9 A1, 2.3630%, 10/25/26 (144A)Ç | | 10,548,021 | | | 9,780,789 | |
| | Preston Ridge Partners Mortgage Trust 2021-RPL2 A1, | | | | | | |
| | 1.4550%, 10/25/51 (144A)‡ | | 6,392,815 | | | 5,519,340 | |
| | Preston Ridge Partners Mortgage Trust 2022-2 A1, 5.0000%, 3/25/27 (144A)Ç | | 7,194,835 | | | 6,917,898 | |
| | Provident Funding Mortgage Trust 2021-INV1 A1, 2.5000%, 8/25/51 (144A)‡ | | 4,900,428 | | | 3,931,421 | |
| | Regatta XXIII Funding Ltd 2021-4A B, | | | | | | |
| | ICE LIBOR USD 3 Month + 1.7000%, 6.9504%, 1/20/35 (144A)‡ | | 2,192,711 | | | 2,130,118 | |
| | Saluda Grade Alternative Mortgage Trust 2023-SEQ3 A1, | | | | | | |
| | 7.1620%, 6/1/53 (144A)‡ | | 2,256,837 | | | 2,250,754 | |
| | Santander Bank Auto Credit-Linked Notes 2021-1A B, 1.8330%, 12/15/31 (144A) | | 905,695 | | | 870,933 | |
| | Santander Bank Auto Credit-Linked Notes 2022-A B, 5.2810%, 5/15/32 (144A) | | 3,323,047 | | | 3,273,053 | |
| | Santander Drive Auto Receivables Trust 2020-3 D, 1.6400%, 11/16/26 | | 8,787,649 | | | 8,560,775 | |
| | Santander Drive Auto Receivables Trust 2021-1 D, 1.1300%, 11/16/26 | | 15,238,000 | | | 14,569,599 | |
| | Sequoia Mortgage Trust 2013-5, 2.5000%, 5/25/43 (144A)‡ | | 544,695 | | | 465,961 | |
| | Sequoia Mortgage Trust 2020-2, 3.5000%, 3/25/50 (144A)‡ | | 433,833 | | | 378,415 | |
| | SMRT 2022-MINI A, CME Term SOFR 1 Month + 1.0000%, 6.1470%, 1/15/39 (144A)‡ | | 3,548,000 | | | 3,443,064 | |
| | Sound Point CLO Ltd 2019-1A AR, | | | | | | |
| | ICE LIBOR USD 3 Month + 1.0800%, 5.8877%, 1/20/32 (144A)‡ | | 6,462,000 | | | 6,351,144 | |
| | Spruce Hill Mortgage Loan Trust 2020-SH1 A1, | | | | | | |
| | ICE LIBOR USD 12 Month + 0.9500%, 2.5210%, 1/28/50 (144A)‡ | | 32,881 | | | 32,458 | |
| | Spruce Hill Mortgage Loan Trust 2020-SH1 A2, | | | | | | |
| | ICE LIBOR USD 12 Month + 1.0500%, 2.6240%, 1/28/50 (144A)‡ | | 144,781 | | | 143,031 | |
| | SREIT Trust 2021-MFP A, | | | | | | |
| | ICE LIBOR USD 1 Month + 0.7308%, 5.9241%, 11/15/38 (144A)��� | | 816,000 | | | 792,043 | |
| | Tesla Auto Lease Trust 2021-B A3, 0.6000%, 9/22/25 (144A) | | 3,326,000 | | | 3,201,127 | |
| | Tesla Auto Lease Trust 2021-B B, 0.9100%, 9/22/25 (144A) | | 1,705,000 | | | 1,613,779 | |
| | |
See Notes to Schedule of Investments and Other Information and Notes to Financial Statements. |
| |
Janus Investment Fund | 11 |
Janus Henderson Flexible Bond Fund
Schedule of Investments
June 30, 2023
| | | | | | | | |
Shares or
Principal Amounts | | | Value | |
Asset-Backed/Commercial Mortgage-Backed Securities– (continued) | | | |
| | Theorem Funding Trust 2021-1A A, 1.2100%, 12/15/27 (144A) | | $757,992 | | | $754,524 | |
| | TPI Re-Remic Trust 2022-FRR1 AK33, 0%, 7/25/46 (144A)◊ | | 3,087,000 | | | 3,071,339 | |
| | TPI Re-Remic Trust 2022-FRR1 AK34, 0%, 7/25/46 (144A)◊ | | 2,543,000 | | | 2,530,099 | |
| | TPI Re-Remic Trust 2022-FRR1 AK35, 0%, 8/25/46 (144A)◊ | | 3,447,000 | | | 3,408,942 | |
| | Tricolor Auto Securitization Trust 2022-1A A, 3.3000%, 2/18/25 (144A) | | 260,606 | | | 259,138 | |
| | UNIFY Auto Receivables Trust 2021-1A A4, 0.9800%, 7/15/26 (144A) | | 3,808,000 | | | 3,694,273 | |
| | United Wholesale Mortgage LLC 2021-INV1 A9, | | | | | | |
| | US 30 Day Average SOFR + 0.9000%, 5.0000%, 8/25/51 (144A)‡ | | 5,130,371 | | | 4,675,966 | |
| | United Wholesale Mortgage LLC 2021-INV4 A3, 2.5000%, 12/25/51 (144A)‡ | | 3,138,613 | | | 2,519,437 | |
| | Upstart Securitization Trust 2021-5 A, 1.3100%, 11/20/31 (144A) | | 781,780 | | | 765,365 | |
| | Upstart Securitization Trust 2022-1 A, 3.1200%, 3/20/32 (144A) | | 3,786,915 | | | 3,708,076 | |
| | Upstart Securitization Trust 2022-2 A, 4.3700%, 5/20/32 (144A) | | 4,853,922 | | | 4,799,474 | |
| | Vantage Data Centers LLC 2020-1A A2, 1.6450%, 9/15/45 (144A) | | 6,324,000 | | | 5,667,119 | |
| | Vantage Data Centers LLC 2020-2A A2, 1.9920%, 9/15/45 (144A) | | 4,083,000 | | | 3,444,499 | |
| | VASA Trust 2021-VASA A, | | | | | | |
| | ICE LIBOR USD 1 Month + 0.9000%, 6.0930%, 7/15/39 (144A)‡ | | 3,768,000 | | | 3,310,144 | |
| | VCAT Asset Securitization LLC 2021-NPL1 A1, 2.2891%, 12/26/50 (144A) | | 724,191 | | | 692,401 | |
| | VMC Finance LLC 2021-HT1 A, | | | | | | |
| | ICE LIBOR USD 1 Month + 1.6500%, 6.8066%, 1/18/37 (144A)‡ | | 3,880,788 | | | 3,756,562 | |
| | Wells Fargo Commercial Mortgage Trust 2021-SAVE A, | | | | | | |
| | ICE LIBOR USD 1 Month + 1.1500%, 6.3430%, 2/15/40 (144A)‡ | | 1,906,219 | | | 1,792,804 | |
| | Westgate Resorts 2022-1A A, 1.7880%, 8/20/36 (144A) | | 1,677,486 | | | 1,577,215 | |
| | Westlake Automobile Receivable Trust 2020-1A D, 2.8000%, 6/16/25 (144A) | | 2,938,390 | | | 2,909,587 | |
| | Woodward Capital Management 2021-3 A21, | | | | | | |
| | US 30 Day Average SOFR + 0.8000%, 5.0000%, 7/25/51 (144A)‡ | | 4,097,137 | | | 3,743,672 | |
| | Woodward Capital Management 2023-CES1 A1A, 6.5150%, 6/25/43 (144A)‡ | | 4,376,000 | | | 4,357,805 | |
Total Asset-Backed/Commercial Mortgage-Backed Securities (cost $681,941,673) | | 643,370,014 | |
Corporate Bonds– 24.0% | | | |
Banking – 6.8% | | | |
| | American Express Co, SOFR + 1.8350%, 5.0430%, 5/1/34‡ | | 6,687,000 | | | 6,540,700 | |
| | Bank of America Corp, SOFR + 1.9900%, 6.2040%, 11/10/28‡ | | 2,498,000 | | | 2,567,567 | |
| | Bank of America Corp, CME Term SOFR 3 Month + 3.9666%, 6.2500%‡,µ | | 8,517,000 | | | 8,410,537 | |
| | Bank of New York Mellon Corp/The, SOFR + 1.0260%, 4.9470%, 4/26/27‡ | | 4,155,000 | | | 4,103,741 | |
| | Bank of New York Mellon Corp/The, SOFR + 1.6060%, 4.9670%, 4/26/34‡ | | 2,556,000 | | | 2,496,134 | |
| | Bank of Montreal, | | | | | | |
| | US Treasury Yield Curve Rate 5 Year + 1.4000%, 3.0880%, 1/10/37‡ | | 18,727,000 | | | 14,707,940 | |
| | BNP Paribas SA, SOFR + 1.2280%, 2.5910%, 1/20/28 (144A)‡ | | 4,430,000 | | | 3,959,138 | |
| | BNP Paribas SA, | | | | | | |
| | US Treasury Yield Curve Rate 1 Year + 1.4500%, 5.1250%, 1/13/29 (144A)‡ | | 6,476,000 | | | 6,336,826 | |
| | Capital One Financial Corp, SOFR + 2.6400%, 6.3120%, 6/8/29‡ | | 7,500,000 | | | 7,449,476 | |
| | Citigroup Inc, CME Term SOFR 3 Month + 4.1666%, 5.9500%‡,µ | | 4,099,000 | | | 3,931,056 | |
| | Citigroup Inc, CME Term SOFR 3 Month + 3.6846%, 6.3000%‡,µ | | 916,000 | | | 890,810 | |
| | Cooperatieve Rabobank UA, | | | | | | |
| | US Treasury Yield Curve Rate 1 Year + 1.4000%, 5.5640%, 2/28/29 (144A)‡ | | 9,718,000 | | | 9,588,238 | |
| | Deutsche Bank AG / New York, SOFR + 3.0430%, 3.5470%, 9/18/31‡ | | 1,338,000 | | | 1,111,223 | |
| | Deutsche Bank AG / New York, SOFR + 3.6500%, 7.0790%, 2/10/34‡ | | 3,590,000 | | | 3,320,876 | |
| | JPMorgan Chase & Co, CME Term SOFR 3 Month + 2.5150%, 2.9560%, 5/13/31‡ | | 9,112,000 | | | 7,813,088 | |
| | JPMorgan Chase & Co, SOFR + 2.5800%, 5.7170%, 9/14/33‡ | | 3,406,000 | | | 3,455,364 | |
| | JPMorgan Chase & Co, CME Term SOFR 3 Month + 3.3800%, 5.0000%‡,µ | | 3,293,000 | | | 3,216,849 | |
| | Mitsubishi UFJ Financial Group Inc, | | | | | | |
| | US Treasury Yield Curve Rate 1 Year + 1.7000%, 4.7880%, 7/18/25‡ | | 4,681,000 | | | 4,613,795 | |
| | Morgan Stanley, SOFR + 1.9900%, 2.1880%, 4/28/26‡ | | 11,145,000 | | | 10,461,899 | |
| | Morgan Stanley, SOFR + 1.2950%, 5.0500%, 1/28/27‡ | | 1,965,000 | | | 1,948,627 | |
| | Morgan Stanley, SOFR + 0.8790%, 1.5930%, 5/4/27‡ | | 4,849,000 | | | 4,340,913 | |
| | Morgan Stanley, CME Term SOFR 3 Month + 1.4016%, 3.7720%, 1/24/29‡ | | 691,000 | | | 645,101 | |
| | Morgan Stanley, SOFR + 1.7300%, 5.1230%, 2/1/29‡ | | 4,412,000 | | | 4,351,277 | |
| | Morgan Stanley, SOFR + 1.5900%, 5.1640%, 4/20/29‡ | | 6,520,000 | | | 6,440,363 | |
| | Morgan Stanley, SOFR + 1.2900%, 2.9430%, 1/21/33‡ | | 5,212,000 | | | 4,332,358 | |
| | Morgan Stanley, SOFR + 1.8700%, 5.2500%, 4/21/34‡ | | 2,072,000 | | | 2,045,993 | |
| | | | | | | | |
| | |
See Notes to Schedule of Investments and Other Information and Notes to Financial Statements. |
| |
12 | JUNE 30, 2023 |
Janus Henderson Flexible Bond Fund
Schedule of Investments
June 30, 2023
| | | | | | | | |
Shares or
Principal Amounts | | | Value | |
Corporate Bonds– (continued) | | | |
Banking– (continued) | | | |
| | Morgan Stanley, | | | | | | |
| | US Treasury Yield Curve Rate 5 Year + 2.4300%, 5.9480%, 1/19/38‡ | | $1,681,000 | | | $1,659,217 | |
| | PNC Financial Services Group Inc/The, SOFR + 1.8410%, 5.5820%, 6/12/29‡ | | 10,455,000 | | | 10,405,799 | |
| | PNC Financial Services Group Inc/The, SOFR + 2.1400%, 6.0370%, 10/28/33‡ | | 2,874,000 | | | 2,941,172 | |
| | PNC Financial Services Group Inc/The, SOFR + 1.9330%, 5.0680%, 1/24/34‡ | | 4,445,000 | | | 4,262,578 | |
| | Royal Bank of Canada, 5.0000%, 5/2/33 | | 10,492,000 | | | 10,238,304 | |
| | State Street Corp, SOFR + 1.5670%, 4.8210%, 1/26/34‡ | | 1,988,000 | | | 1,930,286 | |
| | Sumitomo Mitsui Financial Group Inc, 5.7100%, 1/13/30 | | 7,960,000 | | | 8,055,336 | |
| | Truist Financial Corp, SOFR + 2.0500%, 6.0470%, 6/8/27‡ | | 4,023,000 | | | 4,024,670 | |
| | Truist Financial Corp, SOFR + 2.3610%, 5.8670%, 6/8/34‡ | | 4,675,000 | | | 4,676,923 | |
| | US Bancorp, SOFR + 2.0200%, 5.7750%, 6/12/29‡ | | 7,839,000 | | | 7,836,656 | |
| | US Bancorp, SOFR + 2.1100%, 4.9670%, 7/22/33‡ | | 8,250,000 | | | 7,474,307 | |
| | Westpac Banking Corp, | | | | | | |
| | US Treasury Yield Curve Rate 5 Year + 1.7500%, 2.6680%, 11/15/35‡ | | 9,029,000 | | | 6,928,731 | |
| | | 199,513,868 | |
Brokerage – 0.8% | | | |
| | Nasdaq Inc, 5.3500%, 6/28/28 | | 1,472,000 | | | 1,474,124 | |
| | Nasdaq Inc, 5.5500%, 2/15/34 | | 9,845,000 | | | 9,883,720 | |
| | Nasdaq Inc, 5.9500%, 8/15/53 | | 4,648,000 | | | 4,759,042 | |
| | Nasdaq Inc, 6.1000%, 6/28/63 | | 1,974,000 | | | 2,018,519 | |
| | Pershing Square Holdings Ltd, 3.2500%, 10/1/31 (144A) | | 5,000,000 | | | 3,801,900 | |
| | | 21,937,305 | |
Capital Goods – 0.4% | | | |
| | Lockheed Martin Corp, 4.4500%, 5/15/28 | | 2,778,000 | | | 2,738,320 | |
| | Lockheed Martin Corp, 4.7500%, 2/15/34 | | 4,130,000 | | | 4,120,030 | |
| | Regal Rexnord Corp, 6.0500%, 4/15/28 (144A) | | 4,838,000 | | | 4,802,720 | |
| | | 11,661,070 | |
Communications – 0.5% | | | |
| | AT&T Inc, 5.4000%, 2/15/34 | | 7,365,000 | | | 7,377,652 | |
| | Comcast Corp, 4.5500%, 1/15/29 | | 4,465,000 | | | 4,384,612 | |
| | Comcast Corp, 4.8000%, 5/15/33 | | 3,438,000 | | | 3,401,677 | |
| | | 15,163,941 | |
Consumer Cyclical – 1.1% | | | |
| | CBRE Services Inc, 5.9500%, 8/15/34 | | 12,706,000 | | | 12,546,220 | |
| | GLP Capital LP / GLP Financing II Inc, 5.3000%, 1/15/29 | | 603,000 | | | 574,149 | |
| | LKQ Corp, 5.7500%, 6/15/28 (144A) | | 6,722,000 | | | 6,700,135 | |
| | LKQ Corp, 6.2500%, 6/15/33 (144A) | | 6,323,000 | | | 6,370,668 | |
| | Lowe's Cos Inc, 5.1500%, 7/1/33 | | 6,930,000 | | | 6,927,490 | |
| | | 33,118,662 | |
Consumer Non-Cyclical – 4.0% | | | |
| | Albertsons Cos Inc / Safeway Inc / New Albertsons LP / Albertsons LLC, | | | | | | |
| | 6.5000%, 2/15/28 (144A) | | 4,458,000 | | | 4,465,400 | |
| | Amgen Inc, 5.1500%, 3/2/28 | | 5,449,000 | | | 5,444,093 | |
| | Amgen Inc, 5.2500%, 3/2/30 | | 4,345,000 | | | 4,353,669 | |
| | Amgen Inc, 5.2500%, 3/2/33 | | 2,844,000 | | | 2,847,628 | |
| | CSL Finance Ltd, 3.8500%, 4/27/27 (144A) | | 1,839,000 | | | 1,755,098 | |
| | GE HealthCare Technologies Inc, 5.6500%, 11/15/27 | | 5,628,000 | | | 5,696,955 | |
| | GE HealthCare Technologies Inc, 5.8570%, 3/15/30 | | 6,721,000 | | | 6,897,975 | |
| | GE HealthCare Technologies Inc, 5.9050%, 11/22/32 | | 4,003,000 | | | 4,187,848 | |
| | Hasbro Inc, 3.9000%, 11/19/29 | | 14,554,000 | | | 13,151,581 | |
| | Hasbro Inc, 5.1000%, 5/15/44 | | 1,655,000 | | | 1,455,944 | |
| | HCA Inc, 5.2000%, 6/1/28 | | 3,494,000 | | | 3,465,585 | |
| | HCA Inc, 3.6250%, 3/15/32 (144A) | | 8,110,000 | | | 7,039,548 | |
| | HCA Inc, 5.9000%, 6/1/53 | | 3,417,000 | | | 3,385,045 | |
| | Illumina Inc, 5.7500%, 12/13/27 | | 8,548,000 | | | 8,585,662 | |
| | JBS USA LUX SA / JBS USA Food Co / JBS USA Finance Inc, | | | | | | |
| | 5.5000%, 1/15/30 (144A) | | 9,007,000 | | | 8,640,415 | |
| | JBS USA LUX SA / JBS USA Food Co / JBS USA Finance Inc, | | | | | | |
| | 3.6250%, 1/15/32 (144A) | | 3,897,000 | | | 3,162,182 | |
| | |
See Notes to Schedule of Investments and Other Information and Notes to Financial Statements. |
| |
Janus Investment Fund | 13 |
Janus Henderson Flexible Bond Fund
Schedule of Investments
June 30, 2023
| | | | | | | | |
Shares or
Principal Amounts | | | Value | |
Corporate Bonds– (continued) | | | |
Consumer Non-Cyclical– (continued) | | | |
| | Pfizer Investment Enterprises Pte Ltd, 4.4500%, 5/19/28 | | $7,413,000 | | | $7,286,173 | |
| | Pfizer Investment Enterprises Pte Ltd, 4.6500%, 5/19/30 | | 4,448,000 | | | 4,394,907 | |
| | Pfizer Investment Enterprises Pte Ltd, 4.7500%, 5/19/33 | | 5,420,000 | | | 5,399,579 | |
| | Pilgrim's Pride Corp, 6.2500%, 7/1/33 | | 7,434,000 | | | 7,200,513 | |
| | Universal Health Services Inc, 2.6500%, 1/15/32 | | 10,445,000 | | | 8,233,351 | |
| | | 117,049,151 | |
Electric – 1.7% | | | |
| | American Electric Power Co Inc, 5.6250%, 3/1/33 | | 6,736,000 | | | 6,848,217 | |
| | CMS Energy Corp, | | | | | | |
| | US Treasury Yield Curve Rate 5 Year + 4.1160%, 4.7500%, 6/1/50‡ | | 8,111,000 | | | 6,973,270 | |
| | Duke Energy Corp, 4.3000%, 3/15/28 | | 4,804,000 | | | 4,614,722 | |
| | Exelon Corp, 5.1500%, 3/15/28 | | 3,254,000 | | | 3,239,196 | |
| | Exelon Corp, 5.3000%, 3/15/33 | | 5,211,000 | | | 5,194,354 | |
| | Georgia Power Co, 4.6500%, 5/16/28 | | 3,459,000 | | | 3,389,074 | |
| | Georgia Power Co, 4.9500%, 5/17/33 | | 5,466,000 | | | 5,395,474 | |
| | National Grid PLC, 5.6020%, 6/12/28 | | 2,487,000 | | | 2,497,418 | |
| | National Grid PLC, 5.8090%, 6/12/33 | | 5,218,000 | | | 5,309,776 | |
| | Southern California Edison Co, 5.8500%, 11/1/27 | | 6,094,000 | | | 6,231,590 | |
| | | 49,693,091 | |
Energy – 1.2% | | | |
| | Enbridge Inc, 5.7000%, 3/8/33 | | 7,230,000 | | | 7,329,278 | |
| | Energy Transfer LP, 5.5500%, 2/15/28 | | 3,965,000 | | | 3,953,862 | |
| | EQT Corp, 3.1250%, 5/15/26 (144A) | | 13,469,000 | | | 12,383,533 | |
| | EQT Corp, 5.7000%, 4/1/28# | | 2,135,000 | | | 2,107,176 | |
| | Hess Midstream Operations LP, 5.1250%, 6/15/28 (144A) | | 3,041,000 | | | 2,846,044 | |
| | Kinder Morgan Inc, 5.2000%, 6/1/33 | | 6,407,000 | | | 6,208,879 | |
| | | 34,828,772 | |
Finance Companies – 0.6% | | | |
| | Ares Capital Corp, 3.2000%, 11/15/31 | | 7,000,000 | | | 5,365,948 | |
| | OWL Rock Core Income Corp, 4.7000%, 2/8/27 | | 743,000 | | | 674,214 | |
| | OWL Rock Core Income Corp, 7.7500%, 9/16/27 (144A) | | 4,462,000 | | | 4,439,415 | |
| | OWL Rock Core Income Corp, 7.9500%, 6/13/28 (144A) | | 3,583,000 | | | 3,590,030 | |
| | Quicken Loans LLC, 3.8750%, 3/1/31 (144A) | | 4,262,000 | | | 3,455,875 | |
| | | 17,525,482 | |
Government Sponsored – 0.4% | | | |
| | Electricite de France SA, 5.7000%, 5/23/28 (144A) | | 2,832,000 | | | 2,827,724 | |
| | Electricite de France SA, 6.2500%, 5/23/33 (144A) | | 4,591,000 | | | 4,667,115 | |
| | Electricite de France SA, 6.9000%, 5/23/53 (144A) | | 4,407,000 | | | 4,566,640 | |
| | | 12,061,479 | |
Insurance – 1.6% | | | |
| | Athene Global Funding, 2.7170%, 1/7/29 (144A)# | | 7,222,000 | | | 5,881,303 | |
| | Athene Global Funding, 2.6460%, 10/4/31 (144A) | | 5,495,000 | | | 4,159,657 | |
| | Brown & Brown Inc, 4.2000%, 3/17/32 | | 2,203,000 | | | 1,978,353 | |
| | Centene Corp, 4.2500%, 12/15/27 | | 16,614,000 | | | 15,533,342 | |
| | Centene Corp, 2.4500%, 7/15/28 | | 7,054,000 | | | 6,029,449 | |
| | Centene Corp, 3.0000%, 10/15/30 | | 5,571,000 | | | 4,642,298 | |
| | Elevance Health Inc, 4.7500%, 2/15/33 | | 5,831,000 | | | 5,663,390 | |
| | UnitedHealth Group Inc, 5.2500%, 2/15/28 | | 2,771,000 | | | 2,825,105 | |
| | | 46,712,897 | |
Real Estate Investment Trusts (REITs) – 0.9% | | | |
| | Agree LP, 2.9000%, 10/1/30 | | 7,291,000 | | | 6,074,368 | |
| | Alexandria Real Estate Equities Inc, 4.7500%, 4/15/35 | | 4,375,000 | | | 4,059,272 | |
| | American Tower Trust I, 5.4900%, 3/15/28 (144A) | | 10,515,000 | | | 10,491,957 | |
| | Sun Communities Operating LP, 2.7000%, 7/15/31 | | 8,985,000 | | | 7,099,611 | |
| | | 27,725,208 | |
Technology – 3.8% | | | |
| | Broadcom Inc, 2.6000%, 2/15/33 (144A) | | 3,689,000 | | | 2,882,929 | |
| | Broadcom Inc, 3.4690%, 4/15/34 (144A) | | 5,962,000 | | | 4,890,681 | |
| | Broadcom Inc, 3.1370%, 11/15/35 (144A) | | 7,414,000 | | | 5,686,872 | |
| | |
See Notes to Schedule of Investments and Other Information and Notes to Financial Statements. |
| |
14 | JUNE 30, 2023 |
Janus Henderson Flexible Bond Fund
Schedule of Investments
June 30, 2023
| | | | | | | | |
Shares or
Principal Amounts | | | Value | |
Corporate Bonds– (continued) | | | |
Technology– (continued) | | | |
| | Cadence Design Systems Inc, 4.3750%, 10/15/24 | | $18,064,000 | | | $17,775,134 | |
| | CoStar Group Inc, 2.8000%, 7/15/30 (144A) | | 5,441,000 | | | 4,487,748 | |
| | Fiserv Inc, 5.4500%, 3/2/28 | | 5,618,000 | | | 5,645,431 | |
| | Foundry JV Holdco LLC, 5.8750%, 1/25/34 (144A) | | 10,378,000 | | | 10,336,974 | |
| | Leidos Inc, 2.3000%, 2/15/31 | | 1,276,000 | | | 1,005,422 | |
| | Leidos Inc, 5.7500%, 3/15/33 | | 4,301,000 | | | 4,272,802 | |
| | Marvell Technology Inc, 1.6500%, 4/15/26 | | 5,742,000 | | | 5,171,741 | |
| | Marvell Technology Inc, 4.8750%, 6/22/28 | | 6,709,000 | | | 6,509,987 | |
| | Microchip Technology Inc, 2.6700%, 9/1/23 | | 9,518,000 | | | 9,478,763 | |
| | Micron Technology Inc, 6.7500%, 11/1/29 | | 3,160,000 | | | 3,284,793 | |
| | Micron Technology Inc, 5.8750%, 9/15/33 | | 3,507,000 | | | 3,475,202 | |
| | Total System Services Inc, 4.8000%, 4/1/26 | | 2,905,000 | | | 2,835,831 | |
| | Trimble Inc, 4.7500%, 12/1/24 | | 10,216,000 | | | 10,026,749 | |
| | Trimble Inc, 4.9000%, 6/15/28 | | 2,415,000 | | | 2,357,005 | |
| | Trimble Inc, 6.1000%, 3/15/33 | | 10,969,000 | | | 11,114,121 | |
| | | 111,238,185 | |
Transportation – 0.2% | | | |
| | GXO Logistics Inc, 1.6500%, 7/15/26 | | 6,199,000 | | | 5,390,259 | |
Total Corporate Bonds (cost $736,784,306) | | 703,619,370 | |
Mortgage-Backed Securities– 28.8% | | | |
Fannie Mae: | | | |
| | 3.0000%, TBA, 15 Year Maturity | | 20,838,597 | | | 19,445,829 | |
| | 3.5000%, TBA, 15 Year Maturity | | 20,894,000 | | | 19,870,173 | |
| | 4.0000%, TBA, 15 Year Maturity | | 20,519,000 | | | 19,811,977 | |
| | 2.5000%, TBA, 30 Year Maturity | | 2,801,801 | | | 2,377,768 | |
| | 4.5000%, TBA, 30 Year Maturity | | 22,329,111 | | | 21,477,434 | |
| | 5.0000%, TBA, 30 Year Maturity | | 13,224,497 | | | 12,958,341 | |
| | 5.5000%, TBA, 30 Year Maturity | | 10,886,065 | | | 10,833,344 | |
| | 6.0000%, TBA, 30 Year Maturity | | 14,555,000 | | | 14,676,534 | |
| | | 121,451,400 | |
Fannie Mae Pool: | | | |
| | 3.0000%, 10/1/34 | | 22,014 | | | 20,641 | |
| | 2.5000%, 11/1/34 | | 2,051,692 | | | 1,881,926 | |
| | 3.0000%, 11/1/34 | | 125,461 | | | 117,631 | |
| | 3.0000%, 12/1/34 | | 129,289 | | | 121,220 | |
| | 2.5000%, 12/1/36 | | 2,869,270 | | | 2,632,653 | |
| | 6.0000%, 2/1/37 | | 671,485 | | | 704,765 | |
| | 4.5000%, 11/1/42 | | 681,079 | | | 671,529 | |
| | 3.0000%, 1/1/43 | | 131,522 | | | 118,901 | |
| | 3.0000%, 2/1/43 | | 217,994 | | | 197,075 | |
| | 5.0000%, 7/1/44 | | 3,427,834 | | | 3,448,935 | |
| | 4.5000%, 10/1/44 | | 1,577,792 | | | 1,558,193 | |
| | 4.5000%, 3/1/45 | | 2,392,370 | | | 2,362,651 | |
| | 4.0000%, 5/1/45 | | 216,045 | | | 207,053 | |
| | 4.5000%, 6/1/45 | | 1,185,142 | | | 1,169,568 | |
| | 3.5000%, 12/1/45 | | 931,106 | | | 863,639 | |
| | 4.5000%, 2/1/46 | | 2,327,048 | | | 2,294,420 | |
| | 3.5000%, 7/1/46 | | 5,817,106 | | | 5,399,614 | |
| | 3.0000%, 2/1/47 | | 31,451,474 | | | 28,562,855 | |
| | 3.5000%, 3/1/47 | | 816,975 | | | 757,778 | |
| | 3.5000%, 7/1/47 | | 722,856 | | | 670,479 | |
| | 3.5000%, 8/1/47 | | 1,640,024 | | | 1,513,508 | |
| | 4.0000%, 10/1/47 | | 1,180,872 | | | 1,124,195 | |
| | 4.0000%, 11/1/47 | | 1,707,787 | | | 1,625,820 | |
| | 4.0000%, 1/1/48 | | 952,369 | | | 906,659 | |
| | 3.0000%, 2/1/48 | | 310,448 | | | 278,911 | |
| | 5.0000%, 5/1/48 | | 587,120 | | | 584,161 | |
| | 4.5000%, 6/1/48 | | 1,186,961 | | | 1,158,394 | |
| | 3.5000%, 7/1/48 | | 18,387,478 | | | 16,976,974 | |
| | |
See Notes to Schedule of Investments and Other Information and Notes to Financial Statements. |
| |
Janus Investment Fund | 15 |
Janus Henderson Flexible Bond Fund
Schedule of Investments
June 30, 2023
| | | | | | | | |
Shares or
Principal Amounts | | | Value | |
Mortgage-Backed Securities– (continued) | | | |
Fannie Mae Pool– (continued) | | | |
| | 4.0000%, 7/1/48 | | $1,446,993 | | | $1,376,606 | |
| | 4.0000%, 8/1/48 | | 639,212 | | | 608,118 | |
| | 4.0000%, 9/1/48 | | 1,525,549 | | | 1,452,329 | |
| | 4.0000%, 10/1/48 | | 551,532 | | | 526,516 | |
| | 4.0000%, 11/1/48 | | 1,688,706 | | | 1,606,561 | |
| | 4.0000%, 12/1/48 | | 267,927 | | | 254,894 | |
| | 4.0000%, 2/1/49 | | 1,043,690 | | | 992,921 | |
| | 3.5000%, 5/1/49 | | 2,879,788 | | | 2,651,483 | |
| | 3.5000%, 6/1/49 | | 7,900,716 | | | 7,291,234 | |
| | 4.0000%, 6/1/49 | | 218,335 | | | 207,049 | |
| | 4.5000%, 6/1/49 | | 101,886 | | | 99,301 | |
| | 3.0000%, 8/1/49 | | 1,481,788 | | | 1,307,952 | |
| | 3.0000%, 8/1/49 | | 388,758 | | | 343,151 | |
| | 4.5000%, 8/1/49 | | 153,035 | | | 149,152 | |
| | 3.0000%, 9/1/49 | | 219,572 | | | 196,835 | |
| | 3.0000%, 9/1/49 | | 12,639 | | | 11,223 | |
| | 4.0000%, 9/1/49 | | 1,123,185 | | | 1,065,127 | |
| | 4.0000%, 11/1/49 | | 3,565,792 | | | 3,392,338 | |
| | 4.0000%, 11/1/49 | | 317,176 | | | 302,648 | |
| | 3.5000%, 12/1/49 | | 9,155,803 | | | 8,449,500 | |
| | 4.5000%, 1/1/50 | | 2,862,106 | | | 2,793,223 | |
| | 4.5000%, 1/1/50 | | 200,678 | | | 195,586 | |
| | 4.0000%, 3/1/50 | | 5,231,187 | | | 4,993,918 | |
| | 4.0000%, 3/1/50 | | 2,823,030 | | | 2,685,707 | |
| | 4.0000%, 3/1/50 | | 1,075,362 | | | 1,023,052 | |
| | 4.0000%, 4/1/50 | | 487,311 | | | 462,152 | |
| | 2.5000%, 8/1/50 | | 821,988 | | | 708,198 | |
| | 4.0000%, 8/1/50 | | 660,559 | | | 626,455 | |
| | 4.0000%, 9/1/50 | | 5,969,527 | | | 5,660,958 | |
| | 4.0000%, 10/1/50 | | 5,728,615 | | | 5,466,228 | |
| | 4.5000%, 10/1/50 | | 3,502,267 | | | 3,417,977 | |
| | 3.5000%, 2/1/51 | | 2,423,451 | | | 2,229,040 | |
| | 4.0000%, 3/1/51 | | 14,704,624 | | | 13,944,534 | |
| | 4.0000%, 3/1/51 | | 282,513 | | | 267,910 | |
| | 4.0000%, 3/1/51 | | 140,380 | | | 133,551 | |
| | 4.0000%, 10/1/51 | | 11,523,413 | | | 10,927,761 | |
| | 4.0000%, 10/1/51 | | 2,062,472 | | | 1,955,861 | |
| | 3.0000%, 12/1/51 | | 181,306 | | | 160,789 | |
| | 2.5000%, 1/1/52 | | 5,093,078 | | | 4,356,636 | |
| | 3.5000%, 1/1/52 | | 1,944,853 | | | 1,799,155 | |
| | 2.5000%, 2/1/52 | | 24,670,214 | | | 21,078,139 | |
| | 3.5000%, 2/1/52 | | 5,052,670 | | | 4,672,586 | |
| | 2.5000%, 3/1/52 | | 10,534,222 | | | 8,993,000 | |
| | 2.5000%, 3/1/52 | | 10,263,502 | | | 8,769,098 | |
| | 2.5000%, 3/1/52 | | 3,816,896 | | | 3,261,635 | |
| | 2.5000%, 3/1/52 | | 867,081 | | | 739,751 | |
| | 2.5000%, 3/1/52 | | 830,260 | | | 708,788 | |
| | 2.5000%, 3/1/52 | | 727,656 | | | 621,706 | |
| | 2.5000%, 3/1/52 | | 298,381 | | | 254,970 | |
| | 3.0000%, 3/1/52 | | 4,008,260 | | | 3,557,581 | |
| | 3.5000%, 3/1/52 | | 5,245,848 | | | 4,830,292 | |
| | 3.0000%, 4/1/52 | | 2,467,437 | | | 2,195,384 | |
| | 3.0000%, 4/1/52 | | 2,077,553 | | | 1,843,540 | |
| | 3.0000%, 4/1/52 | | 17,131 | | | 15,203 | |
| | 3.5000%, 4/1/52 | | 2,938,188 | | | 2,693,387 | |
| | 3.5000%, 4/1/52 | | 2,030,549 | | | 1,874,629 | |
| | 3.5000%, 4/1/52 | | 1,646,183 | | | 1,507,742 | |
| | 3.5000%, 4/1/52 | | 978,922 | | | 897,361 | |
| | 3.5000%, 4/1/52 | | 580,102 | | | 531,387 | |
| | |
See Notes to Schedule of Investments and Other Information and Notes to Financial Statements. |
| |
16 | JUNE 30, 2023 |
Janus Henderson Flexible Bond Fund
Schedule of Investments
June 30, 2023
| | | | | | | | |
Shares or
Principal Amounts | | | Value | |
Mortgage-Backed Securities– (continued) | | | |
Fannie Mae Pool– (continued) | | | |
| | 3.5000%, 4/1/52 | | $475,725 | | | $435,717 | |
| | 4.0000%, 4/1/52 | | 2,136,762 | | | 2,029,776 | |
| | 4.5000%, 4/1/52 | | 395,984 | | | 380,666 | |
| | 4.5000%, 4/1/52 | | 334,897 | | | 321,942 | |
| | 4.5000%, 4/1/52 | | 192,025 | | | 184,597 | |
| | 4.5000%, 4/1/52 | | 174,339 | | | 167,595 | |
| | 4.5000%, 4/1/52 | | 152,448 | | | 146,551 | |
| | 4.5000%, 4/1/52 | | 98,162 | | | 94,348 | |
| | 3.5000%, 5/1/52 | | 2,404,949 | | | 2,212,947 | |
| | 3.5000%, 5/1/52 | | 1,549,422 | | | 1,420,089 | |
| | 4.5000%, 5/1/52 | | 531,321 | | | 510,768 | |
| | 3.5000%, 6/1/52 | | 8,733,721 | | | 8,054,955 | |
| | 3.5000%, 6/1/52 | | 5,036,847 | | | 4,650,793 | |
| | 4.0000%, 6/1/52 | | 1,653,572 | | | 1,553,400 | |
| | 4.0000%, 6/1/52 | | 465,644 | | | 437,436 | |
| | 3.5000%, 7/1/52 | | 10,861,369 | | | 9,990,868 | |
| | 3.5000%, 7/1/52 | | 1,270,012 | | | 1,171,309 | |
| | 3.5000%, 7/1/52 | | 437,964 | | | 404,260 | |
| | 4.0000%, 7/1/52 | | 742,532 | | | 697,550 | |
| | 4.5000%, 7/1/52 | | 2,226,264 | | | 2,142,444 | |
| | 3.5000%, 8/1/52 | | 2,148,205 | | | 1,975,367 | |
| | 3.5000%, 8/1/52 | | 787,902 | | | 726,423 | |
| | 4.5000%, 8/1/52 | | 8,383,281 | | | 8,067,649 | |
| | 3.5000%, 9/1/52 | | 4,219,502 | | | 3,882,632 | |
| | 5.0000%, 9/1/52 | | 3,840,702 | | | 3,762,411 | |
| | 5.5000%, 9/1/52 | | 10,369,518 | | | 10,338,238 | |
| | 5.0000%, 10/1/52 | | 1,675,206 | | | 1,654,970 | |
| | 5.0000%, 10/1/52 | | 736,533 | | | 727,636 | |
| | 5.5000%, 10/1/52 | | 16,752,089 | | | 16,887,263 | |
| | 5.0000%, 11/1/52 | | 4,072,191 | | | 4,023,000 | |
| | 5.5000%, 11/1/52 | | 3,778,568 | | | 3,809,057 | |
| | 4.5000%, 12/1/52 | | 2,528,305 | | | 2,440,082 | |
| | 5.0000%, 1/1/53 | | 3,521,553 | | | 3,461,491 | |
| | 5.0000%, 3/1/53 | | 1,006,117 | | | 985,681 | |
| | 5.5000%, 3/1/53 | | 401,245 | | | 401,875 | |
| | 5.0000%, 4/1/53 | | 1,318,253 | | | 1,291,477 | |
| | 5.0000%, 4/1/53 | | 314,133 | | | 307,752 | |
| | 5.0000%, 4/1/53 | | 263,598 | | | 258,244 | |
| | 5.5000%, 4/1/53 | | 191,205 | | | 191,505 | |
| | 5.5000%, 5/1/53 | | 359,224 | | | 359,788 | |
| | 5.5000%, 5/1/53 | | 185,475 | | | 185,767 | |
| | 5.0000%, 6/1/53 | | 384,443 | | | 378,169 | |
| | 3.5000%, 8/1/56 | | 17,359,732 | | | 15,893,185 | |
| | 3.0000%, 2/1/57 | | 9,950,709 | | | 8,767,172 | |
| | 3.0000%, 6/1/57 | | 36,484 | | | 32,140 | |
| | | 370,886,941 | |
Freddie Mac Gold Pool: | | | |
| | 3.5000%, 1/1/47 | | 550,315 | | | 514,679 | |
| | 4.0000%, 8/1/48 | | 745,314 | | | 709,856 | |
| | 4.0000%, 9/1/48 | | 507,850 | | | 483,690 | |
| | | 1,708,225 | |
Freddie Mac Pool: | | | |
| | 3.0000%, 5/1/31 | | 7,649,193 | | | 7,261,855 | |
| | 3.0000%, 9/1/32 | | 244,119 | | | 230,309 | |
| | 3.0000%, 10/1/32 | | 304,637 | | | 287,402 | |
| | 3.0000%, 1/1/33 | | 170,700 | | | 161,043 | |
| | 2.5000%, 12/1/33 | | 6,357,424 | | | 5,893,750 | |
| | 3.0000%, 10/1/34 | | 55,681 | | | 52,203 | |
| | 3.0000%, 10/1/34 | | 24,670 | | | 23,129 | |
| | |
See Notes to Schedule of Investments and Other Information and Notes to Financial Statements. |
| |
Janus Investment Fund | 17 |
Janus Henderson Flexible Bond Fund
Schedule of Investments
June 30, 2023
| | | | | | | | |
Shares or
Principal Amounts | | | Value | |
Mortgage-Backed Securities– (continued) | | | |
Freddie Mac Pool– (continued) | | | |
| | 2.5000%, 11/1/34 | | $2,103,930 | | | $1,929,887 | |
| | 2.5000%, 11/1/34 | | 773,985 | | | 709,959 | |
| | 6.0000%, 4/1/40 | | 1,153,355 | | | 1,213,636 | |
| | 3.5000%, 7/1/42 | | 45,899 | | | 42,878 | |
| | 3.5000%, 8/1/42 | | 51,264 | | | 47,890 | |
| | 3.5000%, 8/1/42 | | 47,160 | | | 44,057 | |
| | 3.5000%, 2/1/43 | | 1,947,663 | | | 1,818,232 | |
| | 3.0000%, 3/1/43 | | 683,396 | | | 617,729 | |
| | 3.0000%, 6/1/43 | | 56,553 | | | 50,270 | |
| | 3.5000%, 2/1/44 | | 3,364,601 | | | 3,141,008 | |
| | 4.5000%, 5/1/44 | | 1,076,570 | | | 1,062,434 | |
| | 3.5000%, 12/1/44 | | 40,066 | | | 37,404 | |
| | 3.0000%, 1/1/46 | | 92,921 | | | 83,992 | |
| | 4.0000%, 2/1/46 | | 2,839,153 | | | 2,738,678 | |
| | 4.0000%, 3/1/47 | | 7,247 | | | 6,943 | |
| | 3.0000%, 4/1/47 | | 855,714 | | | 765,886 | |
| | 3.5000%, 4/1/47 | | 39,218 | | | 36,403 | |
| | 3.5000%, 9/1/47 | | 12,832 | | | 11,842 | |
| | 4.0000%, 4/1/48 | | 122,415 | | | 116,459 | |
| | 4.5000%, 7/1/48 | | 679,355 | | | 662,988 | |
| | 5.0000%, 9/1/48 | | 118,249 | | | 117,653 | |
| | 4.0000%, 11/1/48 | | 152,137 | | | 144,734 | |
| | 4.0000%, 12/1/48 | | 1,802,377 | | | 1,714,681 | |
| | 4.5000%, 6/1/49 | | 113,483 | | | 110,605 | |
| | 4.0000%, 7/1/49 | | 1,425,658 | | | 1,351,961 | |
| | 4.5000%, 7/1/49 | | 1,012,389 | | | 986,720 | |
| | 4.5000%, 7/1/49 | | 143,732 | | | 140,088 | |
| | 3.0000%, 8/1/49 | | 540,733 | | | 477,323 | |
| | 4.5000%, 8/1/49 | | 869,911 | | | 847,855 | |
| | 3.0000%, 12/1/49 | | 776,044 | | | 689,177 | |
| | 3.0000%, 12/1/49 | | 352,716 | | | 313,235 | |
| | 4.5000%, 1/1/50 | | 575,889 | | | 561,287 | |
| | 4.5000%, 1/1/50 | | 160,734 | | | 156,658 | |
| | 4.0000%, 3/1/50 | | 1,793,162 | | | 1,705,915 | |
| | 4.0000%, 6/1/50 | | 2,954,075 | | | 2,823,499 | |
| | 2.5000%, 8/1/50 | | 424,138 | | | 365,570 | |
| | 2.5000%, 8/1/50 | | 151,225 | | | 130,290 | |
| | 2.5000%, 9/1/50 | | 768,784 | | | 662,089 | |
| | 4.5000%, 9/1/50 | | 5,356,597 | | | 5,227,549 | |
| | 4.0000%, 10/1/50 | | 506,926 | | | 480,721 | |
| | 2.5000%, 11/1/51 | | 6,459,092 | | | 5,541,512 | |
| | 2.5000%, 1/1/52 | | 1,573,402 | | | 1,346,662 | |
| | 2.5000%, 1/1/52 | | 967,968 | | | 827,628 | |
| | 2.5000%, 2/1/52 | | 2,315,146 | | | 1,978,097 | |
| | 3.0000%, 2/1/52 | | 1,081,278 | | | 959,880 | |
| | 3.0000%, 2/1/52 | | 801,782 | | | 713,724 | |
| | 2.5000%, 3/1/52 | | 365,418 | | | 311,920 | |
| | 3.0000%, 3/1/52 | | 1,440,108 | | | 1,281,610 | |
| | 4.5000%, 3/1/52 | | 82,552 | | | 79,359 | |
| | 3.5000%, 4/1/52 | | 2,095,624 | | | 1,938,767 | |
| | 3.5000%, 4/1/52 | | 1,162,273 | | | 1,065,424 | |
| | 3.5000%, 4/1/52 | | 1,114,463 | | | 1,021,598 | |
| | 3.5000%, 4/1/52 | | 387,927 | | | 355,347 | |
| | 3.5000%, 4/1/52 | | 352,825 | | | 323,150 | |
| | 3.0000%, 6/1/52 | | 12,228,303 | | | 10,885,296 | |
| | 3.5000%, 6/1/52 | | 5,083,205 | | | 4,678,909 | |
| | 3.5000%, 7/1/52 | | 17,260,365 | | | 15,876,845 | |
| | 4.0000%, 7/1/52 | | 1,668,094 | | | 1,567,009 | |
| | 3.5000%, 8/1/52 | | 3,068,317 | | | 2,822,373 | |
| | |
See Notes to Schedule of Investments and Other Information and Notes to Financial Statements. |
| |
18 | JUNE 30, 2023 |
Janus Henderson Flexible Bond Fund
Schedule of Investments
June 30, 2023
| | | | | | | | |
Shares or
Principal Amounts | | | Value | |
Mortgage-Backed Securities– (continued) | | | |
Freddie Mac Pool– (continued) | | | |
| | 4.0000%, 8/1/52 | | $1,893,803 | | | $1,781,600 | |
| | 4.5000%, 8/1/52 | | 18,302,108 | | | 17,612,899 | |
| | 4.5000%, 8/1/52 | | 7,760,129 | | | 7,470,183 | |
| | 4.5000%, 8/1/52 | | 4,042,814 | | | 3,890,573 | |
| | 4.0000%, 9/1/52 | | 4,225,591 | | | 3,975,237 | |
| | 5.5000%, 9/1/52 | | 2,576,998 | | | 2,586,315 | |
| | 4.5000%, 10/1/52 | | 2,531,881 | | | 2,459,622 | |
| | 5.0000%, 10/1/52 | | 5,066,587 | | | 5,005,372 | |
| | 5.0000%, 10/1/52 | | 3,336,569 | | | 3,296,256 | |
| | 5.0000%, 10/1/52 | | 101,268 | | | 100,044 | |
| | 5.5000%, 11/1/52 | | 11,489,361 | | | 11,582,097 | |
| | 5.0000%, 3/1/53 | | 1,635,555 | | | 1,602,329 | |
| | 5.0000%, 3/1/53 | | 295,791 | | | 289,782 | |
| | 5.0000%, 5/1/53 | | 4,796,252 | | | 4,717,966 | |
| | 5.0000%, 5/1/53 | | 1,949,167 | | | 1,917,352 | |
| | 5.0000%, 5/1/53 | | 1,100,602 | | | 1,082,638 | |
| | 5.5000%, 5/1/53 | | 2,065,294 | | | 2,072,755 | |
| | 5.5000%, 5/1/53 | | 828,658 | | | 829,956 | |
| | 5.0000%, 6/1/53 | | 1,659,897 | | | 1,632,804 | |
| | 5.0000%, 6/1/53 | | 772,241 | | | 756,420 | |
| | 5.0000%, 6/1/53 | | 725,781 | | | 710,892 | |
| | 5.0000%, 6/1/53 | | 705,382 | | | 691,052 | |
| | 5.0000%, 6/1/53 | | 575,586 | | | 563,809 | |
| | 5.0000%, 6/1/53 | | 436,102 | | | 427,243 | |
| | 5.0000%, 6/1/53 | | 406,610 | | | 398,350 | |
| | 5.0000%, 6/1/53 | | 311,922 | | | 305,523 | |
| | 5.5000%, 6/1/53 | | 1,834,256 | | | 1,837,128 | |
| | 5.5000%, 6/1/53 | | 784,947 | | | 781,669 | |
| | 5.5000%, 6/1/53 | | 608,203 | | | 605,663 | |
| | 5.5000%, 6/1/53 | | 549,837 | | | 547,541 | |
| | 5.5000%, 6/1/53 | | 525,511 | | | 522,955 | |
| | 5.0000%, 7/1/53 | | 899,510 | | | 881,237 | |
| | 5.5000%, 7/1/53 | | 1,375,351 | | | 1,369,607 | |
| | | 185,935,855 | |
Ginnie Mae: | | | |
| | 2.5000%, TBA, 30 Year Maturity | | 41,130,337 | | | 35,587,407 | |
| | 3.5000%, TBA, 30 Year Maturity | | 30,213,313 | | | 27,883,534 | |
| | 4.0000%, TBA, 30 Year Maturity | | 11,354,740 | | | 10,731,592 | |
| | 4.5000%, TBA, 30 Year Maturity | | 9,618,566 | | | 9,280,704 | |
| | 5.0000%, TBA, 30 Year Maturity | | 4,526,907 | | | 4,446,084 | |
| | | 87,929,321 | |
Ginnie Mae I Pool: | | | |
| | 4.0000%, 8/15/47 | | 434,789 | | | 415,365 | |
| | 4.0000%, 11/15/47 | | 389,119 | | | 371,735 | |
| | 4.0000%, 12/15/47 | | 1,262,791 | | | 1,206,375 | |
| | | 1,993,475 | |
Ginnie Mae II Pool: | | | |
| | 3.0000%, 11/20/46 | | 10,813,968 | | | 9,830,950 | |
| | 4.0000%, 8/20/47 | | 296,058 | | | 283,254 | |
| | 4.0000%, 8/20/47 | | 135,367 | | | 129,513 | |
| | 4.5000%, 2/20/48 | | 1,463,641 | | | 1,432,024 | |
| | 4.0000%, 5/20/48 | | 6,070,216 | | | 5,817,139 | |
| | 4.5000%, 5/20/48 | | 562,918 | | | 550,485 | |
| | 4.0000%, 6/20/48 | | 1,709,897 | | | 1,638,074 | |
| | 5.0000%, 8/20/48 | | 1,683,825 | | | 1,677,398 | |
| | 3.5000%, 5/20/49 | | 14,498,294 | | | 13,544,228 | |
| | 2.5000%, 3/20/51 | | 13,534,692 | | | 11,751,476 | |
| | 3.0000%, 4/20/51 | | 4,799,671 | | | 4,310,568 | |
| | 3.0000%, 7/20/51 | | 7,204,562 | | | 6,464,387 | |
| | |
See Notes to Schedule of Investments and Other Information and Notes to Financial Statements. |
| |
Janus Investment Fund | 19 |
Janus Henderson Flexible Bond Fund
Schedule of Investments
June 30, 2023
| | | | | | | | |
Shares or
Principal Amounts | | | Value | |
Mortgage-Backed Securities– (continued) | | | |
Ginnie Mae II Pool– (continued) | | | |
| | 3.0000%, 8/20/51 | | $20,606,339 | | | $18,483,580 | |
| | | 75,913,076 | |
Total Mortgage-Backed Securities (cost $886,242,758) | | 845,818,293 | |
United States Treasury Notes/Bonds– 22.8% | | | |
| | 4.1250%, 6/15/26 | | 20,923,000 | | | 20,712,135 | |
| | 3.5000%, 4/30/28 | | 79,248,100 | | | 77,006,865 | |
| | 3.6250%, 5/31/28 | | 41,814,600 | | | 40,899,906 | |
| | 4.0000%, 6/30/28 | | 43,668,000 | | | 43,429,191 | |
| | 1.1250%, 8/31/28 | | 65,528,600 | | | 56,459,544 | |
| | 3.7500%, 6/30/30 | | 57,556,000 | | | 56,791,584 | |
| | 3.3750%, 5/15/33 | | 45,952,800 | | | 44,315,731 | |
| | 3.8750%, 2/15/43 | | 134,948,000 | | | 131,574,300 | |
| | 3.8750%, 5/15/43 | | 100,327,000 | | | 97,897,205 | |
| | 3.6250%, 2/15/53 | | 103,707,300 | | | 99,526,599 | |
Total United States Treasury Notes/Bonds (cost $680,383,520) | | 668,613,060 | |
Investment Companies– 8.6% | | | |
Money Markets – 8.6% | | | |
| | Janus Henderson Cash Liquidity Fund LLC, 5.1900%ºº,£((cost $251,595,670) | | 251,570,514 | | | 251,620,828 | |
Investments Purchased with Cash Collateral from Securities Lending– 0% | | | |
Investment Companies – 0% | | | |
| | Janus Henderson Cash Collateral Fund LLC, 4.9971%ºº,£ | | 678,968 | | | 678,968 | |
Time Deposits – 0% | | | |
| | Royal Bank of Canada, 5.0600%, 7/3/23 | | $169,742 | | | 169,742 | |
Total Investments Purchased with Cash Collateral from Securities Lending (cost $848,710) | | 848,710 | |
Total Investments (total cost $3,237,796,637) – 106.1% | | 3,113,890,275 | |
Liabilities, net of Cash, Receivables and Other Assets – (6.1)% | | (179,553,939) | |
Net Assets – 100% | | $2,934,336,336 | |
| | | | | | |
Summary of Investments by Country - (Long Positions) (unaudited) |
| |
| | | | | % of | |
| | | | | Investment | |
Country | | Value | | Securities | |
United States | | $3,012,274,919 | | 96.7 | % |
Canada | | 32,275,522 | | 1.0 | |
France | | 22,357,443 | | 0.7 | |
Japan | | 12,669,131 | | 0.4 | |
Netherlands | | 9,588,238 | | 0.3 | |
Australia | | 8,683,829 | | 0.3 | |
United Kingdom | | 7,807,194 | | 0.3 | |
Germany | | 4,432,099 | | 0.2 | |
Guernsey | | 3,801,900 | | 0.1 | |
| | | | | | |
| | | | | | |
Total | | $3,113,890,275 | | 100.0 | % |
| | |
See Notes to Schedule of Investments and Other Information and Notes to Financial Statements. |
| |
20 | JUNE 30, 2023 |
Janus Henderson Flexible Bond Fund
Schedule of Investments
June 30, 2023
Schedules of Affiliated Investments – (% of Net Assets)
| | | | | | | | | | | |
| | Dividend Income | Realized Gain/(Loss) | Change in Unrealized Appreciation/ Depreciation | Value at 6/30/23 |
Investment Companies - 8.6% |
Money Markets - 8.6% | |
| | Janus Henderson Cash Liquidity Fund LLC, 5.1900%ºº | $ | 11,479,370 | $ | 1,352 | $ | 21,734 | $ | 251,620,828 |
Investments Purchased with Cash Collateral from Securities Lending - 0.0% |
Investment Companies - 0.0% | |
| | Janus Henderson Cash Collateral Fund LLC, 4.9971%ºº | | 317,575∆ | | - | | - | | 678,968 |
Total Affiliated Investments - 8.6% | $ | 11,796,945 | $ | 1,352 | $ | 21,734 | $ | 252,299,796 |
| | | | | | | | | | | |
| | Value at 6/30/22 | Purchases | Sales Proceeds | Value at 6/30/23 |
Investment Companies - 8.6% |
Money Markets - 8.6% | |
| | Janus Henderson Cash Liquidity Fund LLC, 5.1900%ºº | | 340,994,626 | | 1,562,185,542 | | (1,651,582,426) | | 251,620,828 |
Investments Purchased with Cash Collateral from Securities Lending - 0.0% |
Investment Companies - 0.0% | |
| | Janus Henderson Cash Collateral Fund LLC, 4.9971%ºº | | 200,500 | | 738,250,082 | | (737,771,614) | | 678,968 |
| | |
See Notes to Schedule of Investments and Other Information and Notes to Financial Statements. |
| |
Janus Investment Fund | 21 |
Janus Henderson Flexible Bond Fund
Schedule of Investments
June 30, 2023
Schedule of Futures
| | | | | | | | | | | | | | | |
Description | | Number of Contracts | | Expiration Date | | Notional Amount | | Value and Unrealized Appreciation/(Depreciation) | | |
Futures Long: | | | | | | | | | | |
10 Year US Treasury Note | | 141 | | 9/29/23 | $ | 15,829,453 | $ | (300,647) | |
2 Year US Treasury Note | | 3,712 | | 10/4/23 | | 754,812,000 | | (9,024,090) | |
5 Year US Treasury Note | | 4,205 | | 10/4/23 | | 450,329,219 | | (6,711,796) | |
Total - Futures Long | | | | | | | | (16,036,533) | |
Futures Short: | | | | | | | | | | |
Ultra 10-Year Treasury Note | | 399 | | 9/29/23 | | (47,256,563) | | 570,446 | |
Ultra Long Term US Treasury Bond | | 108 | | 9/29/23 | | (14,711,625) | | (27,038) | |
Total - Futures Short | | | | | | | | 543,408 | |
Total | | | | | | | $ | (15,493,125) | | |
The following table, grouped by derivative type, provides information about the fair value and location of derivatives within the Statement of Assets and Liabilities as of June 30, 2023.
| | | | | | |
Fair Value of Derivative Instruments (not accounted for as hedging instruments) as of June 30, 2023 |
| | | | | |
| | | | | Interest Rate
Contracts |
Asset Derivatives: | | | |
*Futures contracts | | | $ 570,446 |
| | | | |
Liability Derivatives: | | | |
*Futures contracts | | | $16,063,571 |
| | | | |
*The fair value presented includes net cumulative unrealized appreciation (depreciation) on futures contracts and centrally cleared swaps. In the Statement of Assets and Liabilities, only current day's variation margin is reported in receivables or payables and the net cumulative unrealized appreciation (depreciation) is included in total distributable earnings (loss). |
| | |
See Notes to Schedule of Investments and Other Information and Notes to Financial Statements. |
| |
22 | JUNE 30, 2023 |
Janus Henderson Flexible Bond Fund
Schedule of Investments
June 30, 2023
The following tables provide information about the effect of derivatives and hedging activities on the Fund’s Statement of Operations for the year ended June 30, 2023.
| | | | | | | | | |
The effect of Derivative Instruments (not accounted for as hedging instruments) on the Statement of Operations for the year ended June 30, 2023 |
| | | | | | | | |
Amount of Realized Gain/(Loss) Recognized on Derivatives |
Derivative | | Credit
Contracts | | Interest Rate
Contracts | | Total |
Futures contracts | | $ - | | $ (8,950,336) | | $ (8,950,336) |
Swap contracts | | (1,307,002) | | - | | $ (1,307,002) |
| | | | | | | | | |
Total | | $(1,307,002) | | $ (8,950,336) | | $(10,257,338) |
| | | | | | | | | |
| | | | | | | | | |
Amount of Change in Unrealized Appreciation/Depreciation Recognized on Derivatives |
Derivative | | Credit
Contracts | | Interest Rate
Contracts | | Total |
Futures contracts | | $ - | | $(14,634,329) | | $(14,634,329) |
| | | | | | | | | |
Please see the "Net Realized Gain/(Loss) on investments" and "Change in Unrealized Net Appreciation/Depreciation" sections of the Fund’s Statement of Operations.
| | |
Average Ending Monthly Value of Derivative Instruments During the Year Ended June 30, 2023 |
| |
| |
Futures contracts: | |
Average notional amount of contracts - long | $571,133,902 |
Average notional amount of contracts - short | 51,990,100 |
| | |
| |
| |
| |
| | | | | | | | | | |
Offsetting of Financial Assets and Derivative Assets |
| |
| | | Gross Amounts | | | | | | |
| | | of Recognized | | Offsetting Asset | | Collateral | | |
Counterparty | | Assets | | or Liability(a) | | Pledged(b) | | Net Amount |
| | | | | | | | | |
JPMorgan Chase Bank, National Association | $ | 815,740 | $ | — | $ | (815,740) | $ | — |
| | | | | | | | | |
(a) | Represents the amount of assets or liabilities that could be offset with the same counterparty under master netting or similar agreements that management elects not to offset on the Statement of Assets and Liabilities. |
(b) | Collateral pledged is limited to the net outstanding amount due to/from an individual counterparty. The actual collateral amounts pledged may exceed these amounts and may fluctuate in value. |
| | |
See Notes to Schedule of Investments and Other Information and Notes to Financial Statements. |
| |
Janus Investment Fund | 23 |
Janus Henderson Flexible Bond Fund
Notes to Schedule of Investments and Other Information
| | |
Bloomberg U.S. Aggregate Bond Index | Bloomberg U.S. Aggregate Bond Index is a broad-based measure of the investment grade, US dollar-denominated, fixed-rate taxable bond market. |
| | |
ICE | Intercontinental Exchange |
LIBOR | London Interbank Offered Rate |
LLC | Limited Liability Company |
LP | Limited Partnership |
PLC | Public Limited Company |
SOFR | Secured Overnight Financing Rate |
TBA | (To Be Announced) Securities are purchased/sold on a forward commitment basis with an approximate principal amount and no defined maturity date. The actual principal and maturity date will be determined upon settlement when specific mortgage pools are assigned. |
| | |
144A | Securities sold under Rule 144A of the Securities Act of 1933, as amended, are subject to legal and/or contractual restrictions on resale and may not be publicly sold without registration under the 1933 Act. Unless otherwise noted, these securities have been determined to be liquid under guidelines established by the Board of Trustees. The total value of 144A securities as of the year ended June 30, 2023 is $761,209,312, which represents 25.9% of net assets. |
| | |
‡ | Variable or floating rate security. Rate shown is the current rate as of June 30, 2023. Certain variable rate securities are not based on a published reference rate and spread; they are determined by the issuer or agent and current market conditions. Reference rate is as of reset date and may vary by security, which may not indicate a reference rate and/or spread in their description. |
| | |
ºº | Rate shown is the 7-day yield as of June 30, 2023. |
| | |
# | Loaned security; a portion of the security is on loan at June 30, 2023. |
| | |
µ | Perpetual security. Perpetual securities have no stated maturity date, but they may be called/redeemed by the issuer. The date indicated, if any, represents the next call date. |
| | |
Ç | Step bond. The coupon rate will increase or decrease periodically based upon a predetermined schedule. The rate shown reflects the current rate. |
| | |
£ | The Fund may invest in certain securities that are considered affiliated companies. As defined by the Investment Company Act of 1940, as amended, an affiliated company is one in which the Fund owns 5% or more of the outstanding voting securities, or a company which is under common ownership or control. |
| | |
∆ | Net of income paid to the securities lending agent and rebates paid to the borrowing counterparties. |
Janus Henderson Flexible Bond Fund
Notes to Schedule of Investments and Other Information
| | | | | | | | | | | | | | |
The following is a summary of the inputs that were used to value the Fund’s investments in securities and other financial instruments as of June 30, 2023. See Notes to Financial Statements for more information. |
| |
Valuation Inputs Summary |
| | | | | | | |
| | | | | Level 2 - | | Level 3 - |
| | | Level 1 - | | Other Significant | | Significant |
| | | Quoted Prices | | Observable Inputs | | Unobservable Inputs |
| | | | | | | |
Assets | | | | | | |
Investments In Securities: | | | | | | |
Asset-Backed/Commercial Mortgage-Backed Securities | $ | - | $ | 643,370,014 | $ | - |
Corporate Bonds | | - | | 703,619,370 | | - |
Mortgage-Backed Securities | | - | | 845,818,293 | | - |
United States Treasury Notes/Bonds | | - | | 668,613,060 | | - |
Investment Companies | | - | | 251,620,828 | | - |
Investments Purchased with Cash Collateral from Securities Lending | | - | | 848,710 | | - |
Total Investments in Securities | $ | - | $ | 3,113,890,275 | $ | - |
Other Financial Instruments(a): | | | | | | |
Futures Contracts | | 570,446 | | - | | - |
Total Assets | $ | 570,446 | $ | 3,113,890,275 | $ | - |
Liabilities | | | | | | |
Other Financial Instruments(a): | | | | | | |
Futures Contracts | $ | 16,063,571 | $ | - | $ | - |
| | | | | | | |
(a) | Other financial instruments may include forward foreign currency exchange contracts, futures, written options, written swaptions, and swap contracts. Forward foreign currency exchange contracts, futures contracts, and swap contracts are reported at their unrealized appreciation/(depreciation) at measurement date, which represents the change in the contract's value from trade date. Written options and written swaptions are reported at their market value at measurement date. |
Janus Henderson Flexible Bond Fund
Statement of Assets and Liabilities
June 30, 2023
| |
See footnotes at the end of the Statement. |
| | | | | | | |
| | | | | | |
Assets: | | | | |
| Unaffiliated investments, at value (cost $2,985,521,999)(1) | | $ | 2,861,590,479 | |
| Affiliated investments, at value (cost $252,274,638) | | | 252,299,796 | |
| Deposits with brokers for futures | | | 9,570,000 | |
| Variation margin receivable on futures contracts | | | 19,828 | |
| Trustees' deferred compensation | | | 74,314 | |
| Receivables: | | | | |
| | Investments sold | | | 112,340,871 | |
| | Interest | | | 17,082,512 | |
| | Fund shares sold | | | 3,537,694 | |
| | Dividends from affiliates | | | 1,132,067 | |
| Other assets | | | 88,427 | |
Total Assets | | | 3,257,735,988 | |
Liabilities: | | | | |
| Due to custodian | | | 4,830,604 | |
| Collateral for securities loaned (Note 3) | | | 848,710 | |
| Variation margin payable on futures contracts | | | 369,522 | |
| Payables: | | | — | |
| | TBA investments purchased | | | 209,858,134 | |
| | Investments purchased | | | 100,206,295 | |
| | Fund shares repurchased | | | 4,382,712 | |
| | Dividends | | | 1,231,654 | |
| | Advisory fees | | | 881,537 | |
| | Transfer agent fees and expenses | | | 325,642 | |
| | Trustees' deferred compensation fees | | | 74,314 | |
| | Professional fees | | | 65,662 | |
| | 12b-1 Distribution and shareholder servicing fees | | | 61,273 | |
| | Trustees' fees and expenses | | | 17,758 | |
| | Affiliated fund administration fees payable | | | 6,452 | |
| | Custodian fees | | | 2,536 | |
| | Accrued expenses and other payables | | | 236,847 | |
Total Liabilities | | | 323,399,652 | |
Net Assets | | $ | 2,934,336,336 | |
| | |
See Notes to Financial Statements. |
| |
26 | JUNE 30, 2023 |
Janus Henderson Flexible Bond Fund
Statement of Assets and Liabilities
June 30, 2023
| | | | | | | |
| | | | | | |
| | | | | | | |
Net Assets Consist of: | | | | |
| Capital (par value and paid-in surplus) | | $ | 3,521,190,234 | |
| Total distributable earnings (loss) | | | (586,853,898) | |
Total Net Assets | | $ | 2,934,336,336 | |
Net Assets - Class A Shares | | $ | 112,400,083 | |
| Shares Outstanding, $0.01 Par Value (unlimited shares authorized) | | | 12,091,225 | |
Net Asset Value Per Share(2) | | $ | 9.30 | |
Maximum Offering Price Per Share(3) | | $ | 9.76 | |
Net Assets - Class C Shares | | $ | 28,508,503 | |
| Shares Outstanding, $0.01 Par Value (unlimited shares authorized) | | | 3,065,720 | |
Net Asset Value Per Share(2) | | $ | 9.30 | |
Net Assets - Class D Shares | | $ | 442,270,728 | |
| Shares Outstanding, $0.01 Par Value (unlimited shares authorized) | | | 47,562,566 | |
Net Asset Value Per Share | | $ | 9.30 | |
Net Assets - Class I Shares | | $ | 1,489,875,148 | |
| Shares Outstanding, $0.01 Par Value (unlimited shares authorized) | | | 160,197,860 | |
Net Asset Value Per Share | | $ | 9.30 | |
Net Assets - Class N Shares | | $ | 481,187,784 | |
| Shares Outstanding, $0.01 Par Value (unlimited shares authorized) | | | 51,782,606 | |
Net Asset Value Per Share | | $ | 9.29 | |
Net Assets - Class R Shares | | $ | 17,621,504 | |
| Shares Outstanding, $0.01 Par Value (unlimited shares authorized) | | | 1,894,721 | |
Net Asset Value Per Share | | $ | 9.30 | |
Net Assets - Class S Shares | | $ | 14,489,197 | |
| Shares Outstanding, $0.01 Par Value (unlimited shares authorized) | | | 1,558,039 | |
Net Asset Value Per Share | | $ | 9.30 | |
Net Assets - Class T Shares | | $ | 347,983,389 | |
| Shares Outstanding, $0.01 Par Value (unlimited shares authorized) | | | 37,428,472 | |
Net Asset Value Per Share | | $ | 9.30 | |
| |
(1) Includes $815,740 of securities on loan. See Note 3 in Notes to Financial Statements. (2) Redemption price per share may be reduced for any applicable contingent deferred sales charge. (3) Maximum offering price is computed at 100/95.25 of net asset value. |
| | |
See Notes to Financial Statements. |
| |
Janus Investment Fund | 27 |
Janus Henderson Flexible Bond Fund
Statement of Operations
For the year ended June 30, 2023
| | | | | | |
| | | | | |
Investment Income: |
| Interest | $ | 104,254,255 | |
| Dividends from affiliates | | 11,479,370 | |
| Affiliated securities lending income, net | | 317,575 | |
| Unaffiliated securities lending income, net | | 82,523 | |
| Other income | | 316,726 | |
Total Investment Income | | 116,450,449 | |
Expenses: | | | |
| Advisory fees | | 12,115,913 | |
| 12b-1 Distribution and shareholder servicing fees: |
| | Class A Shares | | 283,689 | |
| | Class C Shares | | 346,717 | |
| | Class R Shares | | 92,472 | |
| | Class S Shares | | 36,917 | |
| Transfer agent administrative fees and expenses: | | |
| | Class D Shares | | 551,935 | |
| | Class R Shares | | 46,799 | |
| | Class S Shares | | 36,966 | |
| | Class T Shares | | 929,680 | |
| Transfer agent networking and omnibus fees: | | | |
| | Class A Shares | | 203,577 | |
| | Class C Shares | | 26,538 | |
| | Class I Shares | | 1,127,925 | |
| Other transfer agent fees and expenses: | | | |
| | Class A Shares | | 7,576 | |
| | Class C Shares | | 1,614 | |
| | Class D Shares | | 80,108 | |
| | Class I Shares | | 73,637 | |
| | Class N Shares | | 18,879 | |
| | Class R Shares | | 516 | |
| | Class S Shares | | 304 | |
| | Class T Shares | | 4,109 | |
| Shareholder reports expense | | 199,191 | |
| Registration fees | | 179,750 | |
| Affiliated fund administration fees | | 94,647 | |
| Professional fees | | 82,889 | |
| Trustees’ fees and expenses | | 82,502 | |
| Custodian fees | | 25,542 | |
| Other expenses | | 408,812 | |
Total Expenses | | 17,059,204 | |
Less: Excess Expense Reimbursement and Waivers | | (1,339,171) | |
Net Expenses | | 15,720,033 | |
Net Investment Income/(Loss) | | 100,730,416 | |
| | | | | |
| | |
See Notes to Financial Statements. |
| |
28 | JUNE 30, 2023 |
Janus Henderson Flexible Bond Fund
Statement of Operations
For the year ended June 30, 2023
| | | | | | |
| | | | | |
Net Realized Gain/(Loss) on Investments: | |
| Investments | $ | (232,841,922) | |
| Investments in affiliates | | 1,352 | |
| Futures contracts | | (8,950,336) | |
| Swap contracts | | (1,307,002) | |
Total Net Realized Gain/(Loss) on Investments | (243,097,908) | |
Change in Unrealized Net Appreciation/Depreciation: |
| Investments and Trustees’ deferred compensation | | 111,620,595 | |
| Investments in affiliates | | 21,734 | |
| Futures contracts | | (14,634,329) | |
Total Change in Unrealized Net Appreciation/Depreciation | 97,008,000 | |
Net Increase/(Decrease) in Net Assets Resulting from Operations | $ | (45,359,492) | |
| | | | | |
| | |
See Notes to Financial Statements. |
| |
Janus Investment Fund | 29 |
Janus Henderson Flexible Bond Fund
Statements of Changes in Net Assets
| | | | | | | | | |
| | | | | | | | |
| | | Year ended
June 30, 2023 | | Year ended
June 30, 2022 | |
| | | | | | | | | |
Operations: | | | | | | |
| Net investment income/(loss) | $ | 100,730,416 | | $ | 65,834,218 | |
| Net realized gain/(loss) on investments | | (243,097,908) | | | (146,413,867) | |
| Change in unrealized net appreciation/depreciation | 97,008,000 | | | (315,721,916) | |
Net Increase/(Decrease) in Net Assets Resulting from Operations | (45,359,492) | | | (396,301,565) | |
Dividends and Distributions to Shareholders: | | | | | | |
| | Class A Shares | | (3,658,551) | | | (2,319,706) | |
| | Class C Shares | | (869,717) | | | (629,788) | |
| | Class D Shares | | (15,693,299) | | | (11,208,505) | |
| | Class I Shares | | (50,800,690) | | | (37,482,205) | |
| | Class N Shares | | (16,123,613) | | | (10,093,840) | |
| | Class R Shares | | (508,784) | | | (320,467) | |
| | Class S Shares | | (439,859) | | | (267,972) | |
| | Class T Shares | | (12,017,415) | | | (8,632,499) | |
| Total Dividends and Distributions to Shareholders | (100,111,928) | | | (70,954,982) | |
| Return of Capital on Dividends and Distributions | | | | | |
| | Class A Shares | | (75,544) | | | — | |
| | Class C Shares | | (23,801) | | | — | |
| | Class D Shares | | (312,644) | | | — | |
| | Class I Shares | | (974,821) | | | — | |
| | Class N Shares | | (309,806) | | | — | |
| | Class R Shares | | (12,473) | | | — | |
| | Class S Shares | | (9,845) | | | — | |
| | Class T Shares | | (247,782) | | | — | |
| Total Return of Capital Dividends and Distributions | (1,966,716) | | | — | |
Net Decrease from Dividends and Distributions to Shareholders | (102,078,644) | | | (70,954,982) | |
Capital Share Transactions: | | | | | | |
| | Class A Shares | | 4,030,249 | | | (13,933,764) | |
| | Class C Shares | | (13,764,677) | | | (23,291,071) | |
| | Class D Shares | | (31,617,091) | | | (68,347,840) | |
| | Class I Shares | | 35,370,063 | | | (199,015,100) | |
| | Class N Shares | | (44,483,585) | | | 125,235,678 | |
| | Class R Shares | | (1,560,405) | | | (2,343,443) | |
| | Class S Shares | | 205,450 | | | (1,891,500) | |
| | Class T Shares | | (16,923,475) | | | (105,092,515) | |
Net Increase/(Decrease) from Capital Share Transactions | (68,743,471) | | | (288,679,555) | |
Net Increase/(Decrease) in Net Assets | | (216,181,607) | | | (755,936,102) | |
Net Assets: | | | | | | |
| Beginning of period | | 3,150,517,943 | | | 3,906,454,045 | |
| End of period | $ | 2,934,336,336 | | $ | 3,150,517,943 | |
| | | | | | | | |
| | |
See Notes to Financial Statements. |
| |
30 | JUNE 30, 2023 |
Janus Henderson Flexible Bond Fund
Financial Highlights
| | | | | | | | | | | | | | | | | | | |
Class A Shares | | | | | | | | | | | | | | | |
For a share outstanding during the year ended June 30 | | 2023 | | | 2022 | | | 2021 | | | 2020 | | | 2019 | |
| Net Asset Value, Beginning of Period | | $9.76 | | | $11.16 | | | $11.14 | | | $10.39 | | | $10.03 | |
| Income/(Loss) from Investment Operations: | | | | | | | | | | | | | | | |
| | Net investment income/(loss)(1) | | 0.31 | | | 0.17 | | | 0.20 | | | 0.25 | | | 0.28 | |
| | Net realized and unrealized gain/(loss) | | (0.46) | | | (1.38) | | | 0.04 | | | 0.76 | | | 0.37 | |
| Total from Investment Operations | | (0.15) | | | (1.21) | | | 0.24 | | | 1.01 | | | 0.65 | |
| Less Dividends and Distributions: | | | | | | | | | | | | | | | |
| | Dividends (from net investment income) | | (0.31) | | | (0.19) | | | (0.22) | | | (0.26) | | | (0.29) | |
| | Return of capital | | —(2) | | | — | | | — | | | — | | | — | |
| Total Dividends and Distributions | | (0.31) | | | (0.19) | | | (0.22) | | | (0.26) | | | (0.29) | |
| Net Asset Value, End of Period | | $9.30 | | | $9.76 | | | $11.16 | | | $11.14 | | | $10.39 | |
| Total Return* | | (1.50)% | | | (11.00)% | | | 2.19% | | | 9.90% | | | 6.61% | |
| Net Assets, End of Period (in thousands) | | $112,400 | | | $113,840 | | | $144,886 | | | $118,862 | | | $115,349 | |
| Average Net Assets for the Period (in thousands) | | $112,838 | | | $134,145 | | | $145,458 | | | $114,334 | | | $137,456 | |
| Ratios to Average Net Assets**: | | | | | | | | | | | | | | | |
| | Ratio of Gross Expenses | | 0.89% | | | 0.85% | | | 0.86% | | | 0.92% | | | 1.01% | |
| | Ratio of Net Expenses (After Waivers and Expense Offsets) | | 0.71% | | | 0.76% | | | 0.86% | | | 0.88% | | | 0.91% | |
| | Ratio of Net Investment Income/(Loss) | | 3.26% | | | 1.59% | | | 1.74% | | | 2.30% | | | 2.78% | |
| Portfolio Turnover Rate(3) | | 195% | | | 158% | | | 132% | | | 175% | | | 219% | |
| | | | | | | | | | | | | | | | | | | |
| |
* Total return includes adjustments in accordance with generally accepted accounting principles required at the year or period end and are not annualized for periods of less than one full year. ** Annualized for periods of less than one full year. (1) Per share amounts are calculated based on average shares outstanding during the year or period. (2) Less than $0.005 on a per share basis. (3) Portfolio Turnover Rate excludes TBA (to be announced) purchase and sales commitments. |
| | |
See Notes to Financial Statements. |
| |
Janus Investment Fund | 31 |
Janus Henderson Flexible Bond Fund
Financial Highlights
| | | | | | | | | | | | | | | | | | | |
Class C Shares | | | | | | | | | | | | | | | |
For a share outstanding during the year ended June 30 | | 2023 | | | 2022 | | | 2021 | | | 2020 | | | 2019 | |
| Net Asset Value, Beginning of Period | | $9.76 | | | $11.16 | | | $11.14 | | | $10.39 | | | $10.03 | |
| Income/(Loss) from Investment Operations: | | | | | | | | | | | | | | | |
| | Net investment income/(loss)(1) | | 0.24 | | | 0.09 | | | 0.13 | | | 0.18 | | | 0.22 | |
| | Net realized and unrealized gain/(loss) | | (0.46) | | | (1.38) | | | 0.05 | | | 0.77 | | | 0.37 | |
| Total from Investment Operations | | (0.22) | | | (1.29) | | | 0.18 | | | 0.95 | | | 0.59 | |
| Less Dividends and Distributions: | | | | | | | | | | | | | | | |
| | Dividends (from net investment income) | | (0.24) | | | (0.11) | | | (0.16) | | | (0.20) | | | (0.23) | |
| | Return of capital | | —(2) | | | — | | | — | | | — | | | — | |
| Total Dividends and Distributions | | (0.24) | | | (0.11) | | | (0.16) | | | (0.20) | | | (0.23) | |
| Net Asset Value, End of Period | | $9.30 | | | $9.76 | | | $11.16 | | | $11.14 | | | $10.39 | |
| Total Return* | | (2.21)% | | | (11.62)% | | | 1.60% | | | 9.23% | | | 5.97% | |
| Net Assets, End of Period (in thousands) | | $28,509 | | | $44,112 | | | $74,867 | | | $122,908 | | | $135,639 | |
| Average Net Assets for the Period (in thousands) | | $35,550 | | | $61,758 | | | $97,560 | | | $123,202 | | | $155,770 | |
| Ratios to Average Net Assets**: | | | | | | | | | | | | | | | |
| | Ratio of Gross Expenses | | 1.51% | | | 1.49% | | | 1.44% | | | 1.50% | | | 1.52% | |
| | Ratio of Net Expenses (After Waivers and Expense Offsets) | | 1.43% | | | 1.45% | | | 1.44% | | | 1.50% | | | 1.52% | |
| | Ratio of Net Investment Income/(Loss) | | 2.47% | | | 0.88% | | | 1.17% | | | 1.67% | | | 2.17% | |
| Portfolio Turnover Rate(3) | | 195% | | | 158% | | | 132% | | | 175% | | | 219% | |
| | | | | | | | | | | | | | | | | | | |
| |
* Total return includes adjustments in accordance with generally accepted accounting principles required at the year or period end and are not annualized for periods of less than one full year. ** Annualized for periods of less than one full year. (1) Per share amounts are calculated based on average shares outstanding during the year or period. (2) Less than $0.005 on a per share basis. (3) Portfolio Turnover Rate excludes TBA (to be announced) purchase and sales commitments. |
| | |
See Notes to Financial Statements. |
| |
32 | JUNE 30, 2023 |
Janus Henderson Flexible Bond Fund
Financial Highlights
| | | | | | | | | | | | | | | | | | | |
Class D Shares | | | | | | | | | | | | | | | |
For a share outstanding during the year ended June 30 | | 2023 | | | 2022 | | | 2021 | | | 2020 | | | 2019 | |
| Net Asset Value, Beginning of Period | | $9.76 | | | $11.16 | | | $11.14 | | | $10.39 | | | $10.03 | |
| Income/(Loss) from Investment Operations: | | | | | | | | | | | | | | | |
| | Net investment income/(loss)(1) | | 0.32 | | | 0.19 | | | 0.23 | | | 0.28 | | | 0.31 | |
| | Net realized and unrealized gain/(loss) | | (0.45) | | | (1.38) | | | 0.05 | | | 0.77 | | | 0.37 | |
| Total from Investment Operations | | (0.13) | | | (1.19) | | | 0.28 | | | 1.05 | | | 0.68 | |
| Less Dividends and Distributions: | | | | | | | | | | | | | | | |
| | Dividends (from net investment income) | | (0.33) | | | (0.21) | | | (0.26) | | | (0.30) | | | (0.32) | |
| | Return of capital | | —(2) | | | — | | | — | | | — | | | — | |
| Total Dividends and Distributions | | (0.33) | | | (0.21) | | | (0.26) | | | (0.30) | | | (0.32) | |
| Net Asset Value, End of Period | | $9.30 | | | $9.76 | | | $11.16 | | | $11.14 | | | $10.39 | |
| Total Return* | | (1.37)% | | | (10.83)% | | | 2.49% | | | 10.22% | | | 6.93% | |
| Net Assets, End of Period (in thousands) | | $442,271 | | | $496,739 | | | $639,286 | | | $641,920 | | | $547,759 | |
| Average Net Assets for the Period (in thousands) | | $466,985 | | | $583,882 | | | $664,448 | | | $576,119 | | | $538,993 | |
| Ratios to Average Net Assets**: | | | | | | | | | | | | | | | |
| | Ratio of Gross Expenses | | 0.59% | | | 0.57% | | | 0.57% | | | 0.59% | | | 0.61% | |
| | Ratio of Net Expenses (After Waivers and Expense Offsets) | | 0.57% | | | 0.57% | | | 0.57% | | | 0.59% | | | 0.61% | |
| | Ratio of Net Investment Income/(Loss) | | 3.38% | | | 1.78% | | | 2.03% | | | 2.58% | | | 3.09% | |
| Portfolio Turnover Rate(3) | | 195% | | | 158% | | | 132% | | | 175% | | | 219% | |
| | | | | | | | | | | | | | | | | | | |
| |
* Total return includes adjustments in accordance with generally accepted accounting principles required at the year or period end and are not annualized for periods of less than one full year. ** Annualized for periods of less than one full year. (1) Per share amounts are calculated based on average shares outstanding during the year or period. (2) Less than $0.005 on a per share basis. (3) Portfolio Turnover Rate excludes TBA (to be announced) purchase and sales commitments. |
| | |
See Notes to Financial Statements. |
| |
Janus Investment Fund | 33 |
Janus Henderson Flexible Bond Fund
Financial Highlights
| | | | | | | | | | | | | | | | | | | |
Class I Shares | | | | | | | | | | | | | | | |
For a share outstanding during the year ended June 30 | | 2023 | | | 2022 | | | 2021 | | | 2020 | | | 2019 | |
| Net Asset Value, Beginning of Period | | $9.76 | | | $11.16 | | | $11.14 | | | $10.39 | | | $10.03 | |
| Income/(Loss) from Investment Operations: | | | | | | | | | | | | | | | |
| | Net investment income/(loss)(1) | | 0.33 | | | 0.20 | | | 0.24 | | | 0.28 | | | 0.32 | |
| | Net realized and unrealized gain/(loss) | | (0.45) | | | (1.38) | | | 0.04 | | | 0.77 | | | 0.37 | |
| Total from Investment Operations | | (0.12) | | | (1.18) | | | 0.28 | | | 1.05 | | | 0.69 | |
| Less Dividends and Distributions: | | | | | | | | | | | | | | | |
| | Dividends (from net investment income) | | (0.34) | | | (0.22) | | | (0.26) | | | (0.30) | | | (0.33) | |
| | Return of capital | | —(2) | | | — | | | — | | | — | | | — | |
| Total Dividends and Distributions | | (0.34) | | | (0.22) | | | (0.26) | | | (0.30) | | | (0.33) | |
| Net Asset Value, End of Period | | $9.30 | | | $9.76 | | | $11.16 | | | $11.14 | | | $10.39 | |
| Total Return* | | (1.25)% | | | (10.75)% | | | 2.56% | | | 10.31% | | | 7.02% | |
| Net Assets, End of Period (in thousands) | | $1,489,875 | | | $1,527,891 | | | $1,967,268 | | | $1,746,376 | | | $2,007,132 | |
| Average Net Assets for the Period (in thousands) | | $1,456,058 | | | $1,864,618 | | | $1,866,732 | | | $1,806,163 | | | $3,245,500 | |
| Ratios to Average Net Assets**: | | | | | | | | | | | | | | | |
| | Ratio of Gross Expenses | | 0.53% | | | 0.51% | | | 0.50% | | | 0.51% | | | 0.52% | |
| | Ratio of Net Expenses (After Waivers and Expense Offsets) | | 0.46% | | | 0.47% | | | 0.50% | | | 0.51% | | | 0.52% | |
| | Ratio of Net Investment Income/(Loss) | | 3.51% | | | 1.87% | | | 2.10% | | | 2.67% | | | 3.17% | |
| Portfolio Turnover Rate(3) | | 195% | | | 158% | | | 132% | | | 175% | | | 219% | |
| | | | | | | | | | | | | | | | | | | |
| |
* Total return includes adjustments in accordance with generally accepted accounting principles required at the year or period end and are not annualized for periods of less than one full year. ** Annualized for periods of less than one full year. (1) Per share amounts are calculated based on average shares outstanding during the year or period. (2) Less than $0.005 on a per share basis. (3) Portfolio Turnover Rate excludes TBA (to be announced) purchase and sales commitments. |
| | |
See Notes to Financial Statements. |
| |
34 | JUNE 30, 2023 |
Janus Henderson Flexible Bond Fund
Financial Highlights
| | | | | | | | | | | | | | | | | | | |
Class N Shares | | | | | | | | | | | | | | | |
For a share outstanding during the year ended June 30 | | 2023 | | | 2022 | | | 2021 | | | 2020 | | | 2019 | |
| Net Asset Value, Beginning of Period | | $9.76 | | | $11.15 | | | $11.14 | | | $10.38 | | | $10.02 | |
| Income/(Loss) from Investment Operations: | | | | | | | | | | | | | | | |
| | Net investment income/(loss)(1) | | 0.33 | | | 0.21 | | | 0.24 | | | 0.29 | | | 0.33 | |
| | Net realized and unrealized gain/(loss) | | (0.46) | | | (1.38) | | | 0.04 | | | 0.78 | | | 0.37 | |
| Total from Investment Operations | | (0.13) | | | (1.17) | | | 0.28 | | | 1.07 | | | 0.70 | |
| Less Dividends and Distributions: | | | | | | | | | | | | | | | |
| | Dividends (from net investment income) | | (0.34) | | | (0.22) | | | (0.27) | | | (0.31) | | | (0.34) | |
| | Return of capital | | —(2) | | | — | | | — | | | — | | | — | |
| Total Dividends and Distributions | | (0.34) | | | (0.22) | | | (0.27) | | | (0.31) | | | (0.34) | |
| Net Asset Value, End of Period | | $9.29 | | | $9.76 | | | $11.15 | | | $11.14 | | | $10.38 | |
| Total Return* | | (1.35)% | | | (10.63)% | | | 2.54% | | | 10.49% | | | 7.10% | |
| Net Assets, End of Period (in thousands) | | $481,188 | | | $549,639 | | | $487,997 | | | $539,154 | | | $680,664 | |
| Average Net Assets for the Period (in thousands) | | $462,747 | | | $485,064 | | | $509,158 | | | $662,412 | | | $1,190,558 | |
| Ratios to Average Net Assets**: | | | | | | | | | | | | | | | |
| | Ratio of Gross Expenses | | 0.45% | | | 0.43% | | | 0.43% | | | 0.44% | | | 0.45% | |
| | Ratio of Net Expenses (After Waivers and Expense Offsets) | | 0.45% | | | 0.43% | | | 0.43% | | | 0.44% | | | 0.45% | |
| | Ratio of Net Investment Income/(Loss) | | 3.51% | | | 1.94% | | | 2.18% | | | 2.74% | | | 3.25% | |
| Portfolio Turnover Rate(3) | | 195% | | | 158% | | | 132% | | | 175% | | | 219% | |
| | | | | | | | | | | | | | | | | | | |
| |
* Total return includes adjustments in accordance with generally accepted accounting principles required at the year or period end and are not annualized for periods of less than one full year. ** Annualized for periods of less than one full year. (1) Per share amounts are calculated based on average shares outstanding during the year or period. (2) Less than $0.005 on a per share basis. (3) Portfolio Turnover Rate excludes TBA (to be announced) purchase and sales commitments. |
| | |
See Notes to Financial Statements. |
| |
Janus Investment Fund | 35 |
Janus Henderson Flexible Bond Fund
Financial Highlights
| | | | | | | | | | | | | | | | | | | |
Class R Shares | | | | | | | | | | | | | | | |
For a share outstanding during the year ended June 30 | | 2023 | | | 2022 | | | 2021 | | | 2020 | | | 2019 | |
| Net Asset Value, Beginning of Period | | $9.76 | | | $11.16 | | | $11.15 | | | $10.39 | | | $10.03 | |
| Income/(Loss) from Investment Operations: | | | | | | | | | | | | | | | |
| | Net investment income/(loss)(1) | | 0.26 | | | 0.12 | | | 0.16 | | | 0.21 | | | 0.25 | |
| | Net realized and unrealized gain/(loss) | | (0.45) | | | (1.38) | | | 0.04 | | | 0.78 | | | 0.37 | |
| Total from Investment Operations | | (0.19) | | | (1.26) | | | 0.20 | | | 0.99 | | | 0.62 | |
| Less Dividends and Distributions: | | | | | | | | | | | | | | | |
| | Dividends (from net investment income) | | (0.27) | | | (0.14) | | | (0.19) | | | (0.23) | | | (0.26) | |
| | Return of capital | | —(2) | | | — | | | — | | | — | | | — | |
| Total Dividends and Distributions | | (0.27) | | | (0.14) | | | (0.19) | | | (0.23) | | | (0.26) | |
| Net Asset Value, End of Period | | $9.30 | | | $9.76 | | | $11.16 | | | $11.15 | | | $10.39 | |
| Total Return* | | (1.98)% | | | (11.38)% | | | 1.80% | | | 9.65% | | | 6.30% | |
| Net Assets, End of Period (in thousands) | | $17,622 | | | $20,102 | | | $25,664 | | | $24,453 | | | $27,580 | |
| Average Net Assets for the Period (in thousands) | | $18,630 | | | $24,638 | | | $26,042 | | | $25,769 | | | $31,616 | |
| Ratios to Average Net Assets**: | | | | | | | | | | | | | | | |
| | Ratio of Gross Expenses | | 1.21% | | | 1.18% | | | 1.16% | | | 1.20% | | | 1.21% | |
| | Ratio of Net Expenses (After Waivers and Expense Offsets) | | 1.20% | | | 1.18% | | | 1.16% | | | 1.20% | | | 1.21% | |
| | Ratio of Net Investment Income/(Loss) | | 2.75% | | | 1.16% | | | 1.45% | | | 1.98% | | | 2.49% | |
| Portfolio Turnover Rate(3) | | 195% | | | 158% | | | 132% | | | 175% | | | 219% | |
| | | | | | | | | | | | | | | | | | | |
| |
* Total return includes adjustments in accordance with generally accepted accounting principles required at the year or period end and are not annualized for periods of less than one full year. ** Annualized for periods of less than one full year. (1) Per share amounts are calculated based on average shares outstanding during the year or period. (2) Less than $0.005 on a per share basis. (3) Portfolio Turnover Rate excludes TBA (to be announced) purchase and sales commitments. |
| | |
See Notes to Financial Statements. |
| |
36 | JUNE 30, 2023 |
Janus Henderson Flexible Bond Fund
Financial Highlights
| | | | | | | | | | | | | | | | | | | |
Class S Shares | | | | | | | | | | | | | | | |
For a share outstanding during the year ended June 30 | | 2023 | | | 2022 | | | 2021 | | | 2020 | | | 2019 | |
| Net Asset Value, Beginning of Period | | $9.76 | | | $11.16 | | | $11.14 | | | $10.39 | | | $10.03 | |
| Income/(Loss) from Investment Operations: | | | | | | | | | | | | | | | |
| | Net investment income/(loss)(1) | | 0.29 | | | 0.15 | | | 0.19 | | | 0.24 | | | 0.27 | |
| | Net realized and unrealized gain/(loss) | | (0.46) | | | (1.38) | | | 0.04 | | | 0.77 | | | 0.37 | |
| Total from Investment Operations | | (0.17) | | | (1.23) | | | 0.23 | | | 1.01 | | | 0.64 | |
| Less Dividends and Distributions: | | | | | | | | | | | | | | | |
| | Dividends (from net investment income) | | (0.29) | | | (0.17) | | | (0.21) | | | (0.26) | | | (0.28) | |
| | Return of capital | | —(2) | | | — | | | — | | | — | | | — | |
| Total Dividends and Distributions | | (0.29) | | | (0.17) | | | (0.21) | | | (0.26) | | | (0.28) | |
| Net Asset Value, End of Period | | $9.30 | | | $9.76 | | | $11.16 | | | $11.14 | | | $10.39 | |
| Total Return* | | (1.74)% | | | (11.17)% | | | 2.11% | | | 9.83% | | | 6.56% | |
| Net Assets, End of Period (in thousands) | | $14,489 | | | $15,002 | | | $19,114 | | | $18,630 | | | $28,020 | |
| Average Net Assets for the Period (in thousands) | | $14,706 | | | $17,308 | | | $19,517 | | | $23,253 | | | $30,601 | |
| Ratios to Average Net Assets**: | | | | | | | | | | | | | | | |
| | Ratio of Gross Expenses | | 0.97% | | | 0.95% | | | 0.94% | | | 0.95% | | | 0.96% | |
| | Ratio of Net Expenses (After Waivers and Expense Offsets) | | 0.95% | | | 0.94% | | | 0.94% | | | 0.95% | | | 0.96% | |
| | Ratio of Net Investment Income/(Loss) | | 3.01% | | | 1.41% | | | 1.66% | | | 2.24% | | | 2.73% | |
| Portfolio Turnover Rate(3) | | 195% | | | 158% | | | 132% | | | 175% | | | 219% | |
| | | | | | | | | | | | | | | | | | | |
| |
* Total return includes adjustments in accordance with generally accepted accounting principles required at the year or period end and are not annualized for periods of less than one full year. ** Annualized for periods of less than one full year. (1) Per share amounts are calculated based on average shares outstanding during the year or period. (2) Less than $0.005 on a per share basis. (3) Portfolio Turnover Rate excludes TBA (to be announced) purchase and sales commitments. |
| | |
See Notes to Financial Statements. |
| |
Janus Investment Fund | 37 |
Janus Henderson Flexible Bond Fund
Financial Highlights
| | | | | | | | | | | | | | | | | | | |
Class T Shares | | | | | | | | | | | | | | | |
For a share outstanding during the year ended June 30 | | 2023 | | | 2022 | | | 2021 | | | 2020 | | | 2019 | |
| Net Asset Value, Beginning of Period | | $9.76 | | | $11.16 | | | $11.14 | | | $10.39 | | | $10.03 | |
| Income/(Loss) from Investment Operations: | | | | | | | | | | | | | | | |
| | Net investment income/(loss)(1) | | 0.31 | | | 0.18 | | | 0.22 | | | 0.27 | | | 0.30 | |
| | Net realized and unrealized gain/(loss) | | (0.45) | | | (1.38) | | | 0.04 | | | 0.77 | | | 0.37 | |
| Total from Investment Operations | | (0.14) | | | (1.20) | | | 0.26 | | | 1.04 | | | 0.67 | |
| Less Dividends and Distributions: | | | | | | | | | | | | | | | |
| | Dividends (from net investment income) | | (0.32) | | | (0.20) | | | (0.24) | | | (0.29) | | | (0.31) | |
| | Return of capital | | —(2) | | | — | | | — | | | — | | | — | |
| Total Dividends and Distributions | | (0.32) | | | (0.20) | | | (0.24) | | | (0.29) | | | (0.31) | |
| Net Asset Value, End of Period | | $9.30 | | | $9.76 | | | $11.16 | | | $11.14 | | | $10.39 | |
| Total Return* | | (1.48)% | | | (10.93)% | | | 2.39% | | | 10.12% | | | 6.84% | |
| Net Assets, End of Period (in thousands) | | $347,983 | | | $383,193 | | | $547,371 | | | $597,879 | | | $641,190 | |
| Average Net Assets for the Period (in thousands) | | $370,104 | | | $477,073 | | | $590,025 | | | $605,817 | | | $736,901 | |
| Ratios to Average Net Assets**: | | | | | | | | | | | | | | | |
| | Ratio of Gross Expenses | | 0.70% | | | 0.68% | | | 0.68% | | | 0.69% | | | 0.70% | |
| | Ratio of Net Expenses (After Waivers and Expense Offsets) | | 0.69% | | | 0.67% | | | 0.67% | | | 0.68% | | | 0.69% | |
| | Ratio of Net Investment Income/(Loss) | | 3.27% | | | 1.67% | | | 1.94% | | | 2.49% | | | 3.00% | |
| Portfolio Turnover Rate(3) | | 195% | | | 158% | | | 132% | | | 175% | | | 219% | |
| | | | | | | | | | | | | | | | | | | |
| |
* Total return includes adjustments in accordance with generally accepted accounting principles required at the year or period end and are not annualized for periods of less than one full year. ** Annualized for periods of less than one full year. (1) Per share amounts are calculated based on average shares outstanding during the year or period. (2) Less than $0.005 on a per share basis. (3) Portfolio Turnover Rate excludes TBA (to be announced) purchase and sales commitments. |
| | |
See Notes to Financial Statements. |
| |
38 | JUNE 30, 2023 |
Janus Henderson Flexible Bond Fund
Notes to Financial Statements
1. Organization and Significant Accounting Policies
Janus Henderson Flexible Bond Fund (the “Fund”) is a series of Janus Investment Fund (the “Trust”), which is organized as a Massachusetts business trust and is registered under the Investment Company Act of 1940, as amended (the “1940 Act”), as an open-end management investment company, and therefore has applied the specialized accounting and reporting guidance in Financial Accounting Standards Board (“FASB”) Accounting Standards Codification (“ASC”) Topic 946. The Trust offers 39 funds, each of which offers multiple share classes, with differing investment objectives and policies. The Fund seeks to obtain maximum total return, consistent with preservation of capital. The Fund is classified as diversified, as defined in the 1940 Act. Janus Henderson Investors US LLC is the investment adviser (the “Adviser”) to the Fund.
The Fund offers multiple classes of shares in order to meet the needs of various types of investors. Each class represents an interest in the same portfolio of investments. Certain financial intermediaries may not offer all classes of shares.
Shareholders, including other funds, individuals, accounts, as well as the Fund’s portfolio manager(s) and/or investment personnel, may from time to time own (beneficially or of record) a significant percentage of the Fund’s Shares and can be considered to “control” the Fund when that ownership exceeds 25% of the Fund’s assets (and which may differ from control as determined in accordance with United States of America generally accepted accounting principles ("US GAAP")).
Class A Shares are offered through financial intermediary platforms including, but not limited to, traditional brokerage platforms, mutual fund wrap fee programs, bank trust platforms, and retirement platforms.
Class C Shares are offered through financial intermediary platforms including, but not limited to, traditional brokerage platforms, mutual fund wrap fee programs, and bank trust platforms.
Class C Shares are closed to investments by new employer-sponsored retirement plans and existing employer-sponsored retirement plans are no longer able to make additional purchases or exchanges into Class C Shares.
The Fund currently implements an automatic conversion feature pursuant to which Class C Shares that have been held for eight years are automatically converted to Class A Shares without the imposition of any sales charge, fee or other charge. The conversion will generally occur no later than ten business days in the month following the month of the eighth anniversary of the date of purchase. Class C Shares purchased through the reinvestment of dividends and other distributions on Class C Shares will convert to Class A Shares at the same time as the original Class C Shares with respect to which they were purchased. For Class C Shares held in omnibus accounts on intermediary platforms, the Fund relies on these intermediaries to implement this conversion feature. Your financial intermediary may have separate policies and procedures as to when and how Class C Shares may be converted to Class A Shares.
Effective July 6, 2020, Class D Shares are available to new investors, subject to any closed fund policies for a Fund, as applicable. Previously, Class D Shares were only available to investors who already had a direct account with the Janus Henderson funds; immediate family members or members of the same household of an eligible individual investor; and existing beneficial owners of sole proprietorships or partnerships that hold accounts directly with the Janus Henderson funds.
Class I Shares are available through certain financial intermediary platforms including, but not limited to, mutual fund wrap fee programs, managed account programs, asset allocation programs, bank trust platforms, as well as certain retirement platforms. Class I Shares are also available to certain direct institutional investors including, but not limited to, corporations, certain retirement plans, public plans, and foundations/endowments, who established Class I Share accounts before August 4, 2017.
Class N Shares are generally available only to financial intermediaries purchasing on behalf of: 1) certain adviser-assisted, employer-sponsored retirement plans, including 401(k) plans, 457 plans, 403(b) plans, Taft-Hartley multi-employer plans, profit-sharing and money purchase pension plans, defined benefit plans and certain welfare benefit plans, such as health savings accounts, and nonqualified deferred compensation plans; and 2) retail investors purchasing in qualified or nonqualified accounts, whose accounts are held through an omnibus account at their financial intermediary, and where the financial intermediary requires no payment or reimbursement from the Fund, the Adviser, or its affiliates. Class N Shares are also available to Janus Henderson proprietary products and to certain direct institutional investors approved by Janus Henderson Distributors US LLC (the “Distributor”) including, but not limited to,
Janus Henderson Flexible Bond Fund
Notes to Financial Statements
corporations, certain retirement plans, public plans, and foundations and endowments, subject to minimum investment requirements.
Class R Shares are offered through financial intermediary platforms including, but not limited to, retirement platforms.
Class S Shares are offered through financial intermediary platforms including, but not limited to, retirement platforms and asset allocation, mutual fund wrap, or other discretionary or nondiscretionary fee-based investment advisory programs. In addition, Class S Shares may be available through certain financial intermediaries who have an agreement with the Adviser or its affiliates to offer Class S Shares on their supermarket platforms.
Class T Shares are available through certain financial intermediary platforms including, but not limited to, mutual fund wrap fee programs, managed account programs, asset allocation programs, bank trust platforms, as well as certain retirement platforms. In addition, Class T Shares may be available through certain financial intermediaries who have an agreement with the Adviser or its affiliates to offer Class T Shares on their supermarket platforms.
The following accounting policies have been followed by the Fund and are in conformity with US GAAP.
Investment Valuation
Fund holdings are valued in accordance with policies and procedures established by the Adviser pursuant to Rule 2a-5 under the 1940 Act and approved by and subject to the oversight of the Trustees (the “Valuation Procedures”). Equity securities traded on a domestic securities exchange are generally valued at readily available market quotations, which are (i) the official close prices or (ii) last sale prices on the primary market or exchange in which the securities trade. If such price is lacking for the trading period immediately preceding the time of determination, such securities are generally valued at their current bid price. Equity securities that are traded on a foreign exchange are generally valued at the closing prices on such markets. In the event that there is no current trading volume on a particular security in such foreign exchange, the bid price from the primary exchange is generally used to value the security. Foreign securities and currencies are converted to U.S. dollars using the current spot USD dollar exchange rate in effect at the close of the New York Stock Exchange (“NYSE”). The Adviser will determine the market value of individual securities held by it by using prices provided by one or more Adviser-approved professional pricing services or, as needed, by obtaining market quotations from independent broker-dealers. Most debt securities are valued in accordance with the evaluated bid price supplied by the pricing service that is intended to reflect market value. The evaluated bid price supplied by the pricing service is an evaluation that may consider factors such as security prices, yields, maturities and ratings. Certain short-term securities maturing within 60 days or less may be evaluated and valued on an amortized cost basis provided that the amortized cost determined approximates market value. Securities for which market quotations or evaluated prices are not readily available or deemed unreliable are valued at fair value determined in good faith by the Adviser pursuant to the Valuation Procedures. Circumstances in which fair valuation may be utilized include, but are not limited to: (i) a significant event that may affect the securities of a single issuer, such as a merger, bankruptcy, or significant issuer-specific development; (ii) an event that may affect an entire market, such as a natural disaster or significant governmental action; (iii) a nonsignificant event such as a market closing early or not opening, or a security trading halt; and (iv) pricing of a nonvalued security and a restricted or nonpublic security. Special valuation considerations may apply with respect to “odd-lot” fixed-income transactions which, due to their small size, may receive evaluated prices by pricing services which reflect a large block trade and not what actually could be obtained for the odd-lot position. The value of the securities of other mutual funds held by the Fund, if any, will be calculated using the NAV of such mutual funds, and the prospectuses for such mutual funds explain the circumstances under which they use fair valuation and the effects of using fair valuation. The value of the securities of any cash management pooled investment vehicles that operate as money market funds held by the Fund, if any, will be calculated using the NAV of such funds.
Valuation Inputs Summary
FASB ASC 820, Fair Value Measurements and Disclosures (“ASC 820”), defines fair value, establishes a framework for measuring fair value, and expands disclosure requirements regarding fair value measurements. This standard emphasizes that fair value is a market-based measurement that should be determined based on the assumptions that market participants would use in pricing an asset or liability and establishes a hierarchy that prioritizes inputs to valuation techniques used to measure fair value. These inputs are summarized into three broad levels:
Level 1 – Unadjusted quoted prices in active markets the Fund has the ability to access for identical assets or liabilities.
Janus Henderson Flexible Bond Fund
Notes to Financial Statements
Level 2 – Observable inputs other than unadjusted quoted prices included in Level 1 that are observable for the asset or liability either directly or indirectly. These inputs may include quoted prices for the identical instrument on an inactive market, prices for similar instruments, interest rates, prepayment speeds, credit risk, yield curves, default rates and similar data.
Assets or liabilities categorized as Level 2 in the hierarchy generally include: debt securities fair valued in accordance with the evaluated bid or ask prices supplied by a pricing service; securities traded on OTC markets and listed securities for which no sales are reported that are fair valued at the latest bid price (or yield equivalent thereof) obtained from one or more dealers transacting in a market for such securities or by a pricing service approved by the Fund’s Trustees; certain short-term debt securities with maturities of 60 days or less that are fair valued at amortized cost; and equity securities of foreign issuers whose fair value is determined by using systematic fair valuation models provided by independent third parties in order to adjust for stale pricing which may occur between the close of certain foreign exchanges and the close of the NYSE. Other securities that may be categorized as Level 2 in the hierarchy include, but are not limited to, preferred stocks, bank loans, swaps, investments in unregistered investment companies, options, and forward contracts.
Level 3 – Unobservable inputs for the asset or liability to the extent that relevant observable inputs are not available, representing the Fund’s own assumptions about the assumptions that a market participant would use in valuing the asset or liability, and that would be based on the best information available.
There have been no significant changes in valuation techniques used in valuing any such positions held by the Fund since the beginning of the fiscal year.
The inputs or methodology used for fair valuing securities are not necessarily an indication of the risk associated with investing in those securities. The summary of inputs used as of June 30, 2023 to fair value the Fund’s investments in securities and other financial instruments is included in the “Valuation Inputs Summary” in the Notes to Schedule of Investments and Other Information.
Investment Transactions and Investment Income
Investment transactions are accounted for as of the date purchased or sold (trade date). Dividend income is recorded on the ex-dividend date. Certain dividends from foreign securities will be recorded as soon as the Fund is informed of the dividend, if such information is obtained subsequent to the ex-dividend date. Dividends from foreign securities may be subject to withholding taxes in foreign jurisdictions. Non-cash dividends, if any, are recorded on the ex-dividend date at fair value. Interest income is recorded daily on the accrual basis and includes amortization of premiums and accretion of discounts. The Fund classifies gains and losses on prepayments received as an adjustment to interest income. Debt securities may be placed in non-accrual status and related interest income may be reduced by stopping current accruals and writing off interest receivables when collection of all or a portion of interest has become doubtful. Gains and losses are determined on the identified cost basis, which is the same basis used for federal income tax purposes. Income, as well as gains and losses, both realized and unrealized, are allocated daily to each class of shares based upon the ratio of net assets represented by each class as a percentage of total net assets.
Expenses
The Fund bears expenses incurred specifically on its behalf. Each class of shares bears a portion of general expenses, which are allocated daily to each class of shares based upon the ratio of net assets represented by each class as a percentage of total net assets. Expenses directly attributable to a specific class of shares are charged against the operations of such class.
Estimates
The preparation of financial statements in conformity with US GAAP requires management to make estimates and assumptions that affect the reported amount of assets and liabilities and disclosure of contingent assets and liabilities at the date of the financial statements, and the reported amounts of income and expenses during the reporting period. Actual results could differ from those estimates.
Indemnifications
In the normal course of business, the Fund may enter into contracts that contain provisions for indemnification of other parties against certain potential liabilities. The Fund’s maximum exposure under these arrangements is unknown, and would involve future claims that may be made against the Fund that have not yet occurred. Currently, the risk of material loss from such claims is considered remote.
Janus Henderson Flexible Bond Fund
Notes to Financial Statements
Dividends and Distributions
Dividends are declared daily and distributed monthly for the Fund. Realized capital gains, if any, are declared and distributed in December. The Fund may treat a portion of the amount paid to redeem shares as a distribution of investment company taxable income and realized capital gains that are reflected in the net asset value. This practice, commonly referred to as “equalization,” has no effect on the redeeming shareholder or a Fund’s total return, but may reduce the amounts that would otherwise be required to be paid as taxable dividends to the remaining shareholders. It is possible that the Internal Revenue Service (IRS) could challenge the Fund's equalization methodology or calculations, and any such challenge could result in additional tax, interest, or penalties to be paid by the Fund.
The Fund may make certain investments in real estate investment trusts (“REITs”) which pay dividends to their shareholders based upon funds available from operations. It is quite common for these dividends to exceed the REITs’ taxable earnings and profits, resulting in the excess portion of such dividends being designated as a return of capital. If the Fund distributes such amounts, such distributions could constitute a return of capital to shareholders for federal income tax purposes.
Federal Income Taxes
The Fund intends to continue to qualify as a regulated investment company and distribute all of its taxable income in accordance with the requirements of Subchapter M of the Internal Revenue Code. Management has analyzed the Fund’s tax positions taken for all open federal income tax years, generally a three-year period, and has concluded that no provision for federal income tax is required in the Fund’s financial statements. The Fund is not aware of any tax positions for which it is reasonably possible that the total amounts of unrecognized tax benefits will significantly change in the next twelve months.
2. Derivative Instruments
The Fund may invest in various types of derivatives, which may at times result in significant derivative exposure. A derivative is a financial instrument whose performance is derived from the performance of another asset. The Fund may invest in derivative instruments including, but not limited to: futures contracts, put options, call options, options on futures contracts, options on foreign currencies, options on recovery locks, options on security and commodity indices, swaps, forward contracts, structured investments, and other equity-linked derivatives. Each derivative instrument that was held by the Fund during the year ended June 30, 2023 is discussed in further detail below. A summary of derivative activity by the Fund is reflected in the tables at the end of the Schedule of Investments.
The Fund may use derivative instruments for hedging purposes (to offset risks associated with an investment, currency exposure, or market conditions), to adjust currency exposure relative to a benchmark index, or for speculative purposes (to earn income and seek to enhance returns). When the Fund invests in a derivative for speculative purposes, the Fund will be fully exposed to the risks of loss of that derivative, which may sometimes be greater than the derivative’s cost. The Fund may not use any derivative to gain exposure to an asset or class of assets that it would be prohibited by its investment restrictions from purchasing directly. The Fund’s ability to use derivative instruments may also be limited by tax considerations.
Investments in derivatives in general are subject to market risks that may cause their prices to fluctuate over time. Investments in derivatives may not directly correlate with the price movements of the underlying instrument. As a result, the use of derivatives may expose the Fund to additional risks that it would not be subject to if it invested directly in the securities underlying those derivatives. The use of derivatives may result in larger losses or smaller gains than otherwise would be the case. Derivatives can be volatile and may involve significant risks.
In pursuit of its investment objective, the Fund may seek to use derivatives to increase or decrease exposure to the following market risk factors:
· Commodity Risk – the risk related to the change in value of commodities or commodity-linked investments due to changes in the overall market movements, volatility of the underlying benchmark, changes in interest rates, or other factors affecting a particular industry or commodity such as drought, floods, weather, livestock disease, embargoes, tariffs, and international economic, political, and regulatory developments.
· Counterparty Risk – the risk that the counterparty (the party on the other side of the transaction) on a derivative transaction will be unable to honor its financial obligation to the Fund.
Janus Henderson Flexible Bond Fund
Notes to Financial Statements
· Credit Risk – the risk an issuer will be unable to make principal and interest payments when due, or will default on its obligations.
· Currency Risk – the risk that changes in the exchange rate between currencies will adversely affect the value (in U.S. dollar terms) of an investment.
· Equity Risk – the risk related to the change in value of equity securities as they relate to increases or decreases in the general market.
· Index Risk – if the derivative is linked to the performance of an index, it will be subject to the risks associated with changes in that index. If the index changes, the Fund could receive lower interest payments or experience a reduction in the value of the derivative to below what the Fund paid. Certain indexed securities, including inverse securities (which move in an opposite direction to the index), may create leverage, to the extent that they increase or decrease in value at a rate that is a multiple of the changes in the applicable index.
· Interest Rate Risk – the risk that the value of fixed-income securities will generally decline as prevailing interest rates rise, which may cause the Fund’s NAV to likewise decrease.
· Leverage Risk – the risk associated with certain types of leveraged investments or trading strategies pursuant to which relatively small market movements may result in large changes in the value of an investment. The Fund creates leverage by investing in instruments, including derivatives, where the investment loss can exceed the original amount invested. Certain investments or trading strategies, such as short sales, that involve leverage can result in losses that greatly exceed the amount originally invested.
· Liquidity Risk – the risk that certain securities may be difficult or impossible to sell at the time that the seller would like or at the price that the seller believes the security is currently worth.
Derivatives may generally be traded OTC or on an exchange. Derivatives traded OTC are agreements that are individually negotiated between parties and can be tailored to meet a purchaser’s needs. OTC derivatives are not guaranteed by a clearing agency and may be subject to increased credit risk.
In an effort to mitigate credit risk associated with derivatives traded OTC, the Fund may enter into collateral agreements with certain counterparties whereby, subject to certain minimum exposure requirements, the Fund may require the counterparty to post collateral if the Fund has a net aggregate unrealized gain on all OTC derivative contracts with a particular counterparty. Additionally, the Fund may deposit cash and/or treasuries as collateral with the counterparty and/or custodian daily (based on the daily valuation of the financial asset) if the Fund has a net aggregate unrealized loss on OTC derivative contracts with a particular counterparty. All liquid securities and restricted cash are considered to cover in an amount at all times equal to or greater than the Fund’s commitment with respect to certain exchange-traded derivatives, centrally cleared derivatives, forward foreign currency exchange contracts, short sales, and/or securities with extended settlement dates. There is no guarantee that counterparty exposure is reduced and these arrangements are dependent on the Adviser’s ability to establish and maintain appropriate systems and trading.
Futures Contracts
A futures contract is an exchange-traded agreement to take or make delivery of an underlying asset at a specific time in the future for a specific predetermined negotiated price. The Fund may enter into futures contracts to gain exposure to the stock market or other markets pending investment of cash balances or to meet liquidity needs. The Fund is subject to interest rate risk, equity risk, and currency risk in the normal course of pursuing its investment objective through its investments in futures contracts. The Fund may also use such derivative instruments to hedge or protect from adverse movements in securities prices, currency rates or interest rates. The use of futures contracts may involve risks such as the possibility of illiquid markets or imperfect correlation between the values of the contracts and the underlying securities, or that the counterparty will fail to perform its obligations.
Futures contracts are valued at the settlement price on valuation date on the exchange as reported by an approved vendor. Mini contracts, as defined in the description of the contract, shall be valued using the Actual Settlement Price or “ASET” price type as reported by an approved vendor. In the event that foreign futures trade when the foreign equity markets are closed, the last foreign futures trade price shall be used.
Futures contracts are marked-to-market daily, and the daily variation margin is recorded as a receivable or payable on the Statement of Assets and Liabilities (if applicable). The change in unrealized net appreciation/depreciation is reported on the Statement of Operations (if applicable). When a contract is closed, a realized gain or loss is reported on
Janus Henderson Flexible Bond Fund
Notes to Financial Statements
the Statement of Operations (if applicable), equal to the difference between the opening and closing value of the contract.
Securities held by the Fund that are designated as collateral for market value on futures contracts are noted on the Schedule of Investments (if applicable). Such collateral is in the possession of the Fund’s futures commission merchant.
With futures, there is minimal counterparty credit risk to the Fund since futures are exchange-traded and the exchange’s clearinghouse, as counterparty to all exchange-traded futures, guarantees the futures against default.
During the year, the Fund purchased interest rate futures to increase exposure to interest rate risk.
During the year, the Fund sold interest rate futures to decrease exposure to interest rate risk.
Swaps
Swap agreements are two-party contracts entered into primarily by institutional investors for periods ranging from a day to more than one year to exchange one set of cash flows for another. The most significant factor in the performance of swap agreements is the change in value of the specific index, security, or currency, or other factors that determine the amounts of payments due to and from the Fund. The use of swaps is a highly specialized activity which involves investment techniques and risks different from those associated with ordinary portfolio securities transactions. Swap transactions may in some instances involve the delivery of securities or other underlying assets by the Fund or its counterparty to collateralize obligations under the swap. If the other party to a swap that is not collateralized defaults, the Fund would risk the loss of the net amount of the payments that it contractually is entitled to receive. Swap agreements entail the risk that a party will default on its payment obligations to the Fund. If the other party to a swap defaults, the Fund would risk the loss of the net amount of the payments that it contractually is entitled to receive. If the Fund utilizes a swap at the wrong time or judges market conditions incorrectly, the swap may result in a loss to the Fund and reduce the Fund’s total return.
Swap agreements also bear the risk that the Fund will not be able to meet its obligation to the counterparty. Swap agreements are typically privately negotiated and entered into in the OTC market. However, certain swap agreements are required to be cleared through a clearinghouse and traded on an exchange or swap execution facility. Swaps that are required to be cleared are required to post initial and variation margins in accordance with the exchange requirements. Regulations enacted require the Fund to centrally clear certain interest rate and credit default index swaps through a clearinghouse or central counterparty (“CCP”). To clear a swap with a CCP, the Fund will submit the swap to, and post collateral with, a futures clearing merchant (“FCM”) that is a clearinghouse member. Alternatively, the Fund may enter into a swap with a financial institution other than the FCM (the “Executing Dealer”) and arrange for the swap to be transferred to the FCM for clearing. The Fund may also enter into a swap with the FCM itself. The CCP, the FCM, and the Executing Dealer are all subject to regulatory oversight by the U.S. Commodity Futures Trading Commission (“CFTC”). A default or failure by a CCP or an FCM, or the failure of a swap to be transferred from an Executing Dealer to the FCM for clearing, may expose the Fund to losses, increase its costs, or prevent the Fund from entering or exiting swap positions, accessing collateral, or fully implementing its investment strategies. The regulatory requirement to clear certain swaps could, either temporarily or permanently, reduce the liquidity of cleared swaps or increase the costs of entering into those swaps.
Index swaps, interest rate swaps, inflation swaps and credit default swaps are valued using an approved vendor supplied price. Basket swaps are valued using a broker supplied price. Equity swaps that consist of a single underlying equity are valued either at the closing price, the latest bid price, or the last sale price on the primary market or exchange it trades.
The market value of swap contracts are aggregated by positive and negative values and are disclosed separately as an asset or liability on the Fund’s Statement of Assets and Liabilities (if applicable). Realized gains and losses are reported on the Fund’s Statement of Operations (if applicable). The change in unrealized net appreciation or depreciation during the year is included in the Statement of Operations (if applicable).
The Fund’s maximum risk of loss from counterparty risk or credit risk is the discounted value of the payments to be received from/paid to the counterparty over the contract’s remaining life, to the extent that the amount is positive. The risk is mitigated by having a netting arrangement between the Fund and the counterparty and by the posting of collateral by the counterparty to cover the Fund’s exposure to the counterparty.
Janus Henderson Flexible Bond Fund
Notes to Financial Statements
The Fund may enter into various types of credit default swap agreements, including OTC credit default swap agreements, for investment purposes, to add leverage to its Fund, or to hedge against widening credit spreads on high-yield/high-risk bonds. Credit default swaps are a specific kind of counterparty agreement that allow the transfer of third party credit risk from one party to the other. One party in the swap is a lender and faces credit risk from a third party, and the counterparty in the credit default swap agrees to insure this risk in exchange for regular periodic payments. Credit default swaps could result in losses if the Fund does not correctly evaluate the creditworthiness of the company or companies on which the credit default swap is based. Credit default swap agreements may involve greater risks than if the Fund had invested in the reference obligation directly since, in addition to risks relating to the reference obligation, credit default swaps are subject to illiquidity risk, counterparty risk, and credit risk. The Fund will generally incur a greater degree of risk when it sells a credit default swap than when it purchases a credit default swap. As a buyer of a credit default swap, the Fund may lose its investment and recover nothing should no credit event occur and the swap is held to its termination date. As seller of a credit default swap, if a credit event were to occur, the value of any deliverable obligation received by the Fund, coupled with the upfront or periodic payments previously received, may be less than what it pays to the buyer, resulting in a loss of value to the Fund.
As a buyer of credit protection, the Fund is entitled to receive the par (or other agreed-upon) value of a referenced debt obligation from the counterparty to the contract in the event of a default or other credit event by a third party, such as a U.S. or foreign issuer, on the debt obligation. In return, the Fund as buyer would pay to the counterparty a periodic stream of payments over the term of the contract provided that no credit event has occurred. If no credit event occurs, the Fund would have spent the stream of payments and potentially received no benefit from the contract.
If the Fund is the seller of credit protection against a particular security, the Fund would receive an up-front or periodic payment to compensate against potential credit events. As the seller in a credit default swap contract, the Fund would be required to pay the par value (the “notional value”) (or other agreed-upon value) of a referenced debt obligation to the counterparty in the event of a default by a third party, such as a U.S. or foreign corporate issuer, on the debt obligation. In return, the Fund would receive from the counterparty a periodic stream of payments over the term of the contract provided that no event of default has occurred. If no default occurs, the Fund would keep the stream of payments and would have no payment obligations. As the seller, the Fund would effectively add leverage to its portfolio because, in addition to its total net assets, the Fund would be subject to investment exposure on the notional value of the swap. The maximum potential amount of future payments (undiscounted) that the Fund as a seller could be required to make in a credit default transaction would be the notional amount of the agreement.
The Fund may invest in CDXs. A CDX is a swap on an index of credit default swaps. CDXs allow an investor to manage credit risk or take a position on a basket of credit entities (such as credit default swaps or commercial mortgage-backed securities) in a more efficient manner than transacting in a single-name CDS. If a credit event occurs in one of the underlying companies, the protection is paid out via the delivery of the defaulted bond by the buyer of protection in return for a payment of notional value of the defaulted bond by the seller of protection or it may be settled through a cash settlement between the two parties. The underlying company is then removed from the index. If the Fund holds a long position in a CDX, the Fund would indirectly bear its proportionate share of any expenses paid by a CDX. A Fund holding a long position in CDXs typically receives income from principal or interest paid on the underlying securities. By investing in CDXs, the Fund could be exposed to illiquidity risk, counterparty risk, and credit risk of the issuers of the underlying loan obligations and of the CDX markets. If there is a default by the CDX counterparty, the Fund will have contractual remedies pursuant to the agreements related to the transaction. CDXs also bear the risk that the Fund will not be able to meet its obligation to the counterparty.
During the year, the Fund purchased protection via the credit default swap market in order to reduce credit risk exposure to individual corporates, countries and/or credit indices where reducing this exposure via the cash bond market was less attractive.
There were no credit default swaps held at June 30, 2023.
3. Other Investments and Strategies
Market Risk
The Fund may be invested in lower-rated debt securities that have a higher risk of default or loss of value since these securities may be sensitive to economic changes, political changes, or adverse developments specific to the issuer.
Janus Henderson Flexible Bond Fund
Notes to Financial Statements
The value of the Fund’s portfolio may decrease if the value of one or more issuers in the Fund’s portfolio decreases. Further, regardless of how well individual companies or securities perform, the value of the Fund’s portfolio could also decrease if there are deteriorating economic or market conditions, including, but not limited to, a general decline in prices on the stock markets, a general decline in real estate markets, a decline in commodities prices, or if the market favors different types of securities than the types of securities in which the Fund invests. If the value of the Fund’s portfolio decreases, the Fund’s NAV will also decrease, which means if you sell your shares in the Fund you may lose money. Market risk may affect a single issuer, industry, economic sector, or the market as a whole. The increasing interconnectivity between global economies and financial markets increases the likelihood that events or conditions in one region or financial market may adversely impact issuers in a different country, region or financial market. Social, political, economic and other conditions and events, such as natural disasters, health emergencies (e.g., epidemics and pandemics), terrorism, conflicts, including related sanctions, and social unrest, could reduce consumer demand or economic output, result in market closures, travel restrictions and/or quarantines, and generally have a significant impact on the global economies and financial markets.
• COVID-19 Pandemic. The effects of COVID-19 have contributed to increased volatility in global financial markets and have affected and may continue to affect certain countries, regions, issuers, industries and market sectors more dramatically than others. These conditions and events could have a significant impact on the Fund and its investments, the Fund’s ability to meet redemption requests, and the processes and operations of the Fund’s service providers, including the Adviser.
• Russia/Ukraine Invasion. Russia launched a large-scale invasion of Ukraine on February 24, 2022. The extent and duration of the military action, resulting sanctions and resulting future market disruptions in the region are impossible to predict, but could be significant and have a severe adverse effect on the region, including significant negative impacts on the economy and the markets for certain securities and commodities, such as oil and natural gas, as well as other sectors.
Mortgage- and Asset-Backed Securities
Mortgage- and asset-backed securities represent interests in “pools” of commercial or residential mortgages or other assets, including consumer and commercial loans or receivables. The Fund may purchase fixed or variable rate commercial or residential mortgage-backed securities issued by the Government National Mortgage Association (“Ginnie Mae”), the Federal National Mortgage Association (“Fannie Mae”), the Federal Home Loan Mortgage Corporation (“Freddie Mac”), or other governmental or government-related entities. Ginnie Mae’s guarantees are backed as to the timely payment of principal and interest by the full faith and credit of the U.S. Government. Fannie Mae and Freddie Mac securities are not backed by the full faith and credit of the U.S. Government. In September 2008, the Federal Housing Finance Agency (“FHFA”), an agency of the U.S. Government, placed Fannie Mae and Freddie Mac under conservatorship. Since that time, Fannie Mae and Freddie Mac have received capital support through U.S. Treasury preferred stock purchases and Treasury and Federal Reserve purchases of their mortgage-backed securities. The FHFA and the U.S. Treasury have imposed strict limits on the size of these entities’ mortgage portfolios. The FHFA has the power to cancel any contract entered into by Fannie Mae and Freddie Mac prior to FHFA’s appointment as conservator or receiver, including the guarantee obligations of Fannie Mae and Freddie Mac.
The Fund may also purchase other mortgage- and asset-backed securities through single- and multi-seller conduits, collateralized debt obligations, structured investment vehicles, and other similar securities. Asset-backed securities may be backed by various consumer obligations, including automobile loans, equipment leases, credit card receivables, or other collateral. In the event the underlying loans are not paid, the securities’ issuer could be forced to sell the assets and recognize losses on such assets, which could impact your return. Unlike traditional debt instruments, payments on these securities include both interest and a partial payment of principal. Mortgage- and asset-backed securities are subject to both extension risk, where borrowers pay off their debt obligations more slowly in times of rising interest rates, and prepayment risk, where borrowers pay off their debt obligations sooner than expected in times of declining interest rates. These risks may reduce the Fund’s returns. In addition, investments in mortgage- and asset-backed securities, including those comprised of subprime mortgages, may be subject to a higher degree of credit risk, valuation risk, extension risk (if interest rates rise), and liquidity risk than various other types of fixed-income securities. Additionally, although mortgage-backed securities are generally supported by some form of government or private guarantee and/or insurance, there is no assurance that guarantors or insurers will meet their obligations.
Janus Henderson Flexible Bond Fund
Notes to Financial Statements
Sovereign Debt
The Fund may invest in U.S. and non-U.S. government debt securities (“sovereign debt”). Some investments in sovereign debt, such as U.S. sovereign debt, are considered low risk. However, investments in sovereign debt, especially the debt of less developed countries, can involve a high degree of risk, including the risk that the governmental entity that controls the repayment of sovereign debt may not be willing or able to repay the principal and/or to pay the interest on its sovereign debt in a timely manner. A sovereign debtor’s willingness or ability to satisfy its debt obligation may be affected by various factors including, but not limited to, its cash flow situation, the extent of its foreign currency reserves, the availability of foreign exchange when a payment is due, the relative size of its debt position in relation to its economy as a whole, the sovereign debtor’s policy toward international lenders, and local political constraints to which the governmental entity may be subject. Sovereign debtors may also be dependent on expected disbursements from foreign governments, multilateral agencies, and other entities. The failure of a sovereign debtor to implement economic reforms, achieve specified levels of economic performance, or repay principal or interest when due may result in the cancellation of third party commitments to lend funds to the sovereign debtor, which may further impair such debtor’s ability or willingness to timely service its debts. The Fund may be requested to participate in the rescheduling of such sovereign debt and to extend further loans to governmental entities, which may adversely affect the Fund’s holdings. In the event of default, there may be limited or no legal remedies for collecting sovereign debt and there may be no bankruptcy proceedings through which the Fund may collect all or part of the sovereign debt that a governmental entity has not repaid. In addition, to the extent the Fund invests in non-U.S. sovereign debt, it may be subject to currency risk.
TBA Commitments
The Fund may enter into “to be announced” or “TBA” commitments. TBAs are forward agreements for the purchase or sale of securities, including mortgage-backed securities, for a fixed price, with payment and delivery on an agreed upon future settlement date. The specific securities to be delivered are not identified at the trade date. However, delivered securities must meet specified terms, including issuer, rate, and mortgage terms. Although TBA securities must meet industry-accepted “good delivery” standards, there can be no assurance that a security purchased on forward commitment basis will ultimately be issued or delivered by the counterparty. During the settlement period, the Fund will still bear the risk of any decline in the value of the security to be delivered. Because TBA commitments do not require the delivery of a specific security, the characteristics of the security delivered to the Fund may be less favorable than expected. If the counterparty to a transaction fails to deliver the security, the Fund could suffer a loss. Cash collateral that has been pledged to cover the obligations of a Fund and cash collateral received from the counterparty, if any, is reported separately in the Statement of Assets and Liabilities as Collateral for To Be Announced Transactions.
When-Issued, Delayed Delivery and Forward Commitment Transactions
The Fund may purchase or sell securities on a when-issued, delayed delivery, or forward commitment basis. When purchasing a security on a when-issued, delayed delivery, or forward commitment basis, the Fund assumes the rights and risks of ownership of the security, including the risk of price and yield fluctuations, and takes such fluctuations into account when determining its net asset value. Typically, no income accrues on securities the Fund has committed to purchase prior to the time delivery of the securities is made. Because the Fund is not required to pay for the security until the delivery date, these risks are in addition to the risks associated with the Fund’s other investments. If the other party to a transaction fails to deliver the securities, the Fund could miss a favorable price or yield opportunity. If the Fund remains substantially fully invested at a time when when-issued, delayed delivery, or forward commitment purchases are outstanding, the purchases may result in a form of leverage. If the Fund remains substantially fully invested at a time when when-issued, delayed delivery, or forward commitment purchases (including TBA commitments) are outstanding, the purchases may result in a form of leverage.
When the Fund has sold a security on a when-issued, delayed delivery, or forward commitment basis, the Fund does not participate in future gains or losses with respect to the security. If the other party to a transaction fails to pay for the securities, the Fund could suffer a loss. Additionally, when selling a security on a when-issued, delayed delivery, or forward commitment basis without owning the security, the Fund will incur a loss if the security’s price appreciates in value such that the security’s price is above the agreed upon price on the settlement date. The Fund may dispose of or renegotiate a transaction after it is entered into, and may purchase or sell when-issued, delayed delivery or forward commitment securities before the settlement date, which may result in a gain or loss.
Counterparties
Fund transactions involving a counterparty are subject to the risk that the counterparty or a third party will not fulfill its obligation to the Fund (“counterparty risk”). Counterparty risk may arise because of the counterparty’s financial condition
Janus Henderson Flexible Bond Fund
Notes to Financial Statements
(i.e., financial difficulties, bankruptcy, or insolvency), market activities and developments, or other reasons, whether foreseen or not. A counterparty’s inability to fulfill its obligation may result in significant financial loss to the Fund. The Fund may be unable to recover its investment from the counterparty or may obtain a limited recovery, and/or recovery may be delayed. The extent of the Fund’s exposure to counterparty risk with respect to financial assets and liabilities approximates its carrying value. See the "Offsetting Assets and Liabilities" section of this Note for further details.
The Fund may be exposed to counterparty risk through participation in various programs, including, but not limited to, lending its securities to third parties, cash sweep arrangements whereby the Fund’s cash balance is invested in one or more types of cash management vehicles, as well as investments in, but not limited to, repurchase agreements, debt securities, and derivatives, including various types of swaps, futures and options. The Fund intends to enter into financial transactions with counterparties that the Adviser believes to be creditworthy at the time of the transaction. There is always the risk that the Adviser’s analysis of a counterparty’s creditworthiness is incorrect or may change due to market conditions. To the extent that the Fund focuses its transactions with a limited number of counterparties, it will have greater exposure to the risks associated with one or more counterparties.
Securities Lending
Under procedures adopted by the Trustees, the Fund may seek to earn additional income by lending securities to certain qualified broker-dealers and institutions. JPMorgan Chase Bank, National Association acts as securities lending agent and a limited purpose custodian or subcustodian to receive and disburse cash balances and cash collateral, hold short-term investments, hold collateral, and perform other custodial functions in accordance with the Non-Custodial Securities Lending Agreement. For financial reporting purposes, the Fund does not offset financial instruments’ payables and receivables and related collateral on the Statement of Assets and Liabilities. The Fund may lend fund securities in an amount equal to up to 1/3 of its total assets as determined at the time of the loan origination. There is the risk of delay in recovering a loaned security or the risk of loss in collateral rights if the borrower fails financially. In addition, the Adviser makes efforts to balance the benefits and risks from granting such loans. All loans will be continuously secured by collateral which may consist of cash, U.S. Government securities, domestic and foreign short-term debt instruments, letters of credit, time deposits, repurchase agreements, money market mutual funds or other money market accounts, or such other collateral as permitted by the SEC. If the Fund is unable to recover a security on loan, the Fund may use the collateral to purchase replacement securities in the market. There is a risk that the value of the collateral could decrease below the cost of the replacement security by the time the replacement investment is made, resulting in a loss to the Fund. In certain circumstances individual loan transactions could yield negative returns.
Upon receipt of cash collateral, the Adviser may invest it in affiliated or non-affiliated cash management vehicles, whether registered or unregistered entities, as permitted by the 1940 Act and rules promulgated thereunder. The Adviser currently intends to primarily invest the cash collateral in a cash management vehicle for which the Adviser serves as investment adviser, Janus Henderson Cash Collateral Fund LLC, or in time deposits. An investment in Janus Henderson Cash Collateral Fund LLC is generally subject to the same risks that shareholders experience when investing in similarly structured vehicles, such as the potential for significant fluctuations in assets as a result of the purchase and redemption activity of the securities lending program, a decline in the value of the collateral, and possible liquidity issues. Such risks may delay the return of the cash collateral and cause the Fund to violate its agreement to return the cash collateral to a borrower in a timely manner. As adviser to the Fund and Janus Henderson Cash Collateral Fund LLC, the Adviser has an inherent conflict of interest as a result of its fiduciary duties to both the Fund and Janus Henderson Cash Collateral Fund LLC. Additionally, the Adviser receives an investment advisory fee of 0.05% for managing Janus Henderson Cash Collateral Fund LLC, but it may not receive a fee for managing certain other affiliated cash management vehicles in which the Fund may invest, and therefore may have an incentive to allocate preferred investment opportunities to investment vehicles for which it is receiving a fee.
The value of the collateral must be at least 102% of the market value of the loaned securities that are denominated in U.S. dollars and 105% of the market value of the loaned securities that are not denominated in U.S. dollars. Loaned securities and related collateral are marked-to-market each business day based upon the market value of the loaned securities at the close of business, employing the most recent available pricing information. Collateral levels are then adjusted based on this mark-to-market evaluation. Additional required collateral, or excess collateral returned, is delivered on the next business day. Therefore, the value of the collateral held may be temporarily less than 102% or 105% value of the securities on loan. The cash collateral invested by the Adviser is disclosed in the Schedule of Investments (if applicable).
Janus Henderson Flexible Bond Fund
Notes to Financial Statements
Income earned from the investment of the cash collateral, net of rebates paid to, or fees paid by, borrowers and less the fees paid to the lending agent are included as “Affiliated securities lending income, net” on the Statement of Operations. As of June 30, 2023, securities lending transactions accounted for as secured borrowings with an overnight and continuous contractual maturity are $815,740. Gross amounts of recognized liabilities for securities lending (collateral received) as of June 30, 2023 is $848,710, resulting in the net amount due to the counterparty of $32,970.
Offsetting Assets and Liabilities
The Fund presents gross and net information about transactions that are either offset in the financial statements or subject to an enforceable master netting arrangement or similar agreement with a designated counterparty, regardless of whether the transactions are actually offset in the Statement of Assets and Liabilities.
The Offsetting Assets and Liabilities table located in the Schedule of Investments presents gross amounts of recognized assets and/or liabilities and the net amounts after deducting collateral that has been pledged by counterparties or has been pledged to counterparties (if applicable). For corresponding information grouped by type of instrument, see the Fund's Schedule of Investments.
4. Investment Advisory Agreements and Other Transactions with Affiliates
The Fund pays the Adviser an investment advisory fee which is calculated daily and paid monthly. The following table reflects the Fund’s contractual investment advisory fee rate (expressed as an annual rate).
| | |
Average Daily Net Assets of the Fund | Contractual Investment Advisory Fee (%) |
First $300 Million | 0.50 |
Over $300 Million | 0.40 |
The Fund’s actual investment advisory fee rate for the reporting period was 0.41% of average annual net assets before any applicable waivers.
The Adviser has contractually agreed to waive the advisory fee and/or reimburse operating expenses to the extent that the Fund’s total annual fund operating expenses, excluding the fees payable pursuant to a Rule 12b-1 plan, shareholder servicing fees, such as transfer agency fees (but excluding out-of-pocket costs), brokerage commissions, interest, dividends, taxes, acquired fund fees and expenses, and extraordinary expenses, exceed the annual rate of 0.45% of the Fund’s average daily net assets. The Adviser has agreed to continue the waivers for at least a one-year period commencing October 28, 2022. Networking/omnibus fees and out-of-pocket transfer agency fees were not waived under the Fund’s prior expense limitation agreement. If applicable, amounts waived and/or reimbursed to the Fund by the Adviser are disclosed as “Excess Expense Reimbursement and Waivers” on the Statement of Operations.
The Adviser serves as administrator to the Fund pursuant to an administration agreement between the Adviser and the Trust. Under the administration agreement, the Adviser is authorized to perform, or cause others to perform certain administration, compliance, and accounting services to the Fund, including providing office space for the Fund, and is reimbursed by the Fund for certain of its costs in providing these services (to the extent the Adviser seeks reimbursement and such costs are not otherwise waived). In addition, employees of the Adviser and/or its affiliates may serve as officers of the Trust. The Fund pays for some or all of the salaries, fees, and expenses of the Adviser employees and Fund officers, with respect to certain specified administration functions they perform on behalf of the Fund. The Fund pays these costs based on out-of-pocket expenses incurred by the Adviser, and these costs are separate and apart from advisory fees and other expenses paid in connection with the investment advisory services the Adviser (or any subadvisor, as applicable) provides to the Fund. These amounts are disclosed as “Affiliated fund administration fees” on the Statement of Operations. In addition, some expenses related to compensation payable to the Fund’s Chief Compliance Officer and certain compliance staff, all of whom are employees of the Adviser and/or its affiliates, are shared with the Fund. Total compensation of $343,237 was paid to the Chief Compliance Officer and certain compliance staff by the Trust during the year ended June 30, 2023. The Fund's portion is reported as part of “Other expenses” on the Statement of Operations.
Janus Henderson Services US LLC (the “Transfer Agent”), a wholly-owned subsidiary of the Adviser, is the Fund’s transfer agent. The Transfer Agent provides or arranges for the provision of shareholder services including, but not limited to, recordkeeping, subaccounting, answering inquiries regarding accounts, order processing, transaction confirmations, the mailing of prospectuses and shareholder reports, and other shareholder services provided to or on
Janus Henderson Flexible Bond Fund
Notes to Financial Statements
behalf of shareholders. These amounts are disclosed as “Transfer agent administrative fees and expenses” on the Statement of Operations.
Class D Shares of the Fund pay the Transfer Agent an annual administrative services fee based on the average daily net assets of Class D Shares as detailed below.
| | |
Average Daily Net Assets of Class D Shares of the Janus Henderson funds | Administrative Services Fee |
Under $40 billion | 0.12% |
$40 billion – $49.9 billion | 0.10% |
Over $49.9 billion | 0.08% |
During the reporting period, the administrative services fee rate was 0.12%.
The Transfer Agent receives an administrative services fee at an annual rate of up to 0.25% of the average daily net assets of the Fund’s Class R Shares, Class S Shares, and Class T Shares for providing or procuring administrative services to investors in Class R Shares, Class S Shares, and Class T Shares of the Fund. The Transfer Agent expects to use all or a significant portion of this fee to compensate retirement plan service providers, broker-dealers, bank trust departments, financial advisors, and other financial intermediaries for providing these services. The Transfer Agent may keep certain amounts retained for reimbursement of out-of-pocket costs incurred for servicing clients of Class R Shares, Class S Shares, and Class T Shares.
Shareholder Services provided by these financial intermediaries may include, but are not limited to, recordkeeping, subaccounting, order processing, providing order confirmations, periodic statements, forwarding prospectuses, shareholder reports, and other materials to existing customers, answering inquiries regarding accounts, and other administrative services. Order processing includes the submission of transactions through the National Securities Clearing Corporation (“NSCC”) or similar systems, or those processed on a manual basis with the Adviser. For all share classes, the Transfer Agent also seeks reimbursement for costs it incurs as transfer agent and for providing servicing.
Certain, but not all, intermediaries may charge administrative fees to investors in Class A Shares, Class C Shares, and Class I Shares for administrative services provided on behalf of such investors. These administrative fees are paid by the Class A Shares, Class C Shares, and Class I Shares of the Fund to the Transfer Agent, which uses such fees to reimburse intermediaries. Consistent with the Transfer Agency Agreement between the Transfer Agent and the Fund, the Transfer Agent may negotiate the level, structure, and/or terms of the administrative fees with intermediaries requiring such fees on behalf of the Fund. The Adviser and its affiliates benefit from an increase in assets that may result from such relationships. The Adviser has agreed to limit these fees up to 0.20% for Class A Shares and Class C Shares, and up to 0.15% for Class I Shares on an annual basis based on the daily net assets of each share class. Such limits are subject to change by the Trustees in the future. These amounts are disclosed as “Transfer agent networking and omnibus fees” on the Statement of Operations.
The Transfer Agent is not compensated for its services related to the shares, except for out-of-pocket costs, although the Transfer Agent is compensated for its services related to Fund’s Class D Shares. These amounts are disclosed as “Other transfer agent fees and expenses” on the Statement of Operations.
Under distribution and shareholder servicing plans (the “Plans”) adopted in accordance with Rule 12b-1 under the 1940 Act, the Fund pays the Trust’s distributor, the Distributor, a wholly-owned subsidiary of the Adviser, a fee for the sale and distribution and/or shareholder servicing of the shares based on the average daily net assets for each share class at an annual rate of up to 0.25% for Class A Shares, up to 1.00% for Class C Shares, up to 0.50% for Class R Shares, and up to 0.25% for Class S Shares. Under the terms of the Plans, the Trust is authorized to make payments to the Distributor for remittance to retirement plan service providers, broker-dealers, bank trust departments, financial advisors, and other financial intermediaries, as compensation for distribution and/or shareholder services performed by such entities for their customers who are investors in the Fund. These amounts are disclosed as “12b-1 Distribution and shareholder servicing fees” on the Statement of Operations.
Class A Shares include a 4.75% upfront sales charge of the offering price of the Fund. The sales charge is allocated between the Distributor and financial intermediaries. During the year ended June 30, 2023, the Distributor retained upfront sales charges of $1,561.
Janus Henderson Flexible Bond Fund
Notes to Financial Statements
A contingent deferred sales charge (“CDSC”) of 1.00% will be deducted with respect to Class A Shares purchased without a sales load and redeemed within 12 months of purchase, unless waived. Any applicable CDSC will be 1.00% of the lesser of the original purchase price or the value of the redemption of the Class A Shares redeemed. During the year ended June 30, 2023, redeeming shareholders of Class A Shares paid CDSCs of $13,570 to the Distributor.
A CDSC of 1.00% will be deducted with respect to Class C Shares redeemed within 12 months of purchase, unless waived. Any applicable CDSC will be 1.00% of the lesser of the original purchase price or the value of the redemption of the Class C Shares redeemed. During the year ended June 30, 2023, redeeming shareholders of Class C Shares paid CDSCs of $2,946.
The Board of Trustees has adopted a deferred compensation plan (the “Deferred Plan”) for independent Trustees to elect to defer receipt of all or a portion of the annual compensation they are entitled to receive from the Fund. All deferred fees are credited to an account established in the name of the Trustees. The amounts credited to the account then increase or decrease, as the case may be, in accordance with the performance of one or more of the Janus Henderson funds that are selected by the Trustees. The account balance continues to fluctuate in accordance with the performance of the selected fund or funds until final payment of all amounts are credited to the account. The fluctuation of the account balance is recorded by the Fund as unrealized appreciation/(depreciation) and is included as of June 30, 2023 on the Statement of Assets and Liabilities in the asset, “Trustees’ deferred compensation,” and liability, “Trustees’ deferred compensation fees.” Additionally, the recorded unrealized appreciation/(depreciation) is included in “Total distributable earnings (loss)” on the Statement of Assets and Liabilities. Deferred compensation expenses for the year ended June 30, 2023 are included in “Trustees’ fees and expenses” on the Statement of Operations. Trustees are allowed to change their designation of mutual funds from time to time. Amounts will be deferred until distributed in accordance with the Deferred Plan. Deferred fees of $426,025 were paid by the Trust to the Trustees under the Deferred Plan during the year ended June 30, 2023.
Pursuant to the provisions of the 1940 Act and related rules, the Fund may participate in an affiliated or non-affiliated cash sweep program. In the cash sweep program, uninvested cash balances of the Fund may be used to purchase shares of affiliated or non-affiliated money market funds or cash management pooled investment vehicles that operate as money market funds. The Fund is eligible to participate in the cash sweep program (the “Investing Funds”). The Adviser has an inherent conflict of interest because of its fiduciary duties to the affiliated money market funds or cash management pooled investment vehicles and the Investing Funds. Janus Henderson Cash Liquidity Fund LLC (the “Sweep Vehicle”) is an affiliated unregistered cash management pooled investment vehicle that invests primarily in highly-rated short-term fixed-income securities. The Sweep Vehicle operates pursuant to the provisions of the 1940 Act that govern the operation of money market funds and prices its shares at NAV reflecting market-based values of its portfolio securities (i.e., a “floating” NAV) rounded to the fourth decimal place (e.g., $1.0000). The Sweep Vehicle is permitted to impose a liquidity fee (of up to 2%) on redemptions from the Sweep Vehicle or a redemption gate that temporarily suspends redemptions from the Sweep Vehicle for up to 10 business days during a 90 day period. There are no restrictions on the Fund's ability to withdraw investments from the Sweep Vehicle at will, and there are no unfunded capital commitments due from the Fund to the Sweep Vehicle. The Sweep Vehicle does not charge any management fee, sales charge or service fee.
Any purchases and sales, realized gains/losses and recorded dividends from affiliated investments during the year ended June 30, 2023 can be found in the “Schedules of Affiliated Investments” located in the Schedule of Investments.
Janus Henderson Flexible Bond Fund
Notes to Financial Statements
5. Federal Income Tax
The tax components of capital shown in the table below represent: (1) distribution requirements the Fund must satisfy under the income tax regulations; (2) losses or deductions the Fund may be able to offset against income and gains realized in future years; and (3) unrealized appreciation or depreciation of investments for federal income tax purposes.
Other book to tax differences primarily consist of deferred compensation and derivatives. The Fund has elected to treat gains and losses on forward foreign currency contracts as capital gains and losses, if applicable. Other foreign currency gains and losses on debt instruments are treated as ordinary income for federal income tax purposes pursuant to Section 988 of the Internal Revenue Code.
| | | | | | | |
| | | | Other Book | Net Tax | |
Undistributed
Ordinary Income | Undistributed
Long-Term Gains | Accumulated
Capital Losses | Loss Deferrals | to Tax
Differences | Appreciation/
(Depreciation) | |
$ - | $ - | $(467,045,083) | $ - | $ (49,317) | $(119,759,498) | |
Accumulated capital losses noted below represent net capital loss carryovers, as of June 30, 2023, that may be available to offset future realized capital gains and thereby reduce future taxable gains distributions. The following table shows these capital loss carryovers.
| | | | | | |
| | | | | |
Capital Loss Carryover Schedule | | |
For the year ended June 30, 2023 | | |
| No Expiration | | | |
| Short-Term | Long-Term | Accumulated
Capital Losses | | |
| $(309,975,667) | $(157,069,416) | $ (467,045,083) | | |
The aggregate cost of investments and the composition of unrealized appreciation and depreciation of investment securities for federal income tax purposes as of June 30, 2023 are noted below. The primary differences between book and tax appreciation or depreciation of investments are wash sale loss deferrals, investments in partnerships, and investments in passive foreign investment companies.
| | | | |
Federal Tax Cost | Unrealized
Appreciation | Unrealized
(Depreciation) | Net Tax Appreciation/
(Depreciation) |
$3,233,649,773 | $5,778,455 | $(125,537,953) | $(119,759,498) |
Information on the tax components of derivatives as of June 30, 2023 is as follows:
| | | | |
Federal Tax Cost | Unrealized
Appreciation | Unrealized
(Depreciation) | Net Tax Appreciation/
(Depreciation) |
$(15,493,125) | $ - | $ - | $ - |
Tax cost of investments and unrealized appreciation/(depreciation) may also include timing differences that do not constitute adjustments to tax basis.
Janus Henderson Flexible Bond Fund
Notes to Financial Statements
Income and capital gains distributions are determined in accordance with income tax regulations that may differ from US GAAP. These differences are due to differing treatments for items such as net short-term gains, deferral of wash sale losses, and capital loss carryovers. Certain permanent differences such as tax returns of capital and net investment losses noted below have been reclassified to capital.
| | | | | |
For the year ended June 30, 2023 | |
Distributions | | |
From Ordinary Income | From Long-Term Capital Gains | Tax Return of Capital | Net Investment Loss | |
$ 100,111,928 | $ - | $ 1,966,716 | $ - | |
| | | | | |
For the year ended June 30, 2022 | |
Distributions | | |
From Ordinary Income | From Long-Term Capital Gains | Tax Return of Capital | Net Investment Loss | |
$ 70,954,982 | $ - | $ - | $ - | |
Permanent book to tax basis differences may result in reclassifications between the components of net assets. These differences have no impact on the results of operations or net assets.
Janus Henderson Flexible Bond Fund
Notes to Financial Statements
6. Capital Share Transactions
| | | | | | | |
| | | | | | |
| | Year ended June 30, 2023 | | Year ended June 30, 2022 |
| | Shares | Amount | | Shares | Amount |
| | | | | | | |
Class A Shares: | | | | | |
Shares sold | 3,639,114 | $ 34,392,871 | | 2,509,778 | $ 27,098,443 |
Reinvested dividends and distributions | 283,598 | 2,676,284 | | 151,483 | 1,612,422 |
Shares repurchased | (3,497,255) | (33,038,906) | | (3,980,526) | (42,644,629) |
Net Increase/(Decrease) | 425,457 | $ 4,030,249 | | (1,319,265) | $ (13,933,764) |
Class C Shares: | | | | | |
Shares sold | 628,916 | $ 5,915,263 | | 470,760 | $ 5,110,551 |
Reinvested dividends and distributions | 88,943 | 839,879 | | 55,132 | 587,782 |
Shares repurchased | (2,171,740) | (20,519,819) | | (2,714,547) | (28,989,404) |
Net Increase/(Decrease) | (1,453,881) | $(13,764,677) | | (2,188,655) | $ (23,291,071) |
Class D Shares: | | | | | |
Shares sold | 1,931,504 | $ 18,330,177 | | 3,666,390 | $ 39,538,215 |
Reinvested dividends and distributions | 1,585,804 | 14,975,373 | | 983,618 | 10,506,056 |
Shares repurchased | (6,843,426) | (64,922,641) | | (11,038,639) | (118,392,111) |
Net Increase/(Decrease) | (3,326,118) | $(31,617,091) | | (6,388,631) | $ (68,347,840) |
Class I Shares: | | | | | |
Shares sold | 61,228,049 | $580,131,750 | | 45,929,554 | $ 494,478,634 |
Reinvested dividends and distributions | 4,664,635 | 44,044,317 | | 2,861,250 | 30,540,098 |
Shares repurchased | (62,200,366) | (588,806,004) | | (68,532,690) | (724,033,832) |
Net Increase/(Decrease) | 3,692,318 | $ 35,370,063 | | (19,741,886) | $(199,015,100) |
Class N Shares: | | | | | |
Shares sold | 13,258,201 | $125,587,876 | | 25,585,523 | $ 261,848,513 |
Reinvested dividends and distributions | 1,522,259 | 14,371,001 | | 818,330 | 8,679,692 |
Shares repurchased | (19,330,656) | (184,442,462) | | (13,829,568) | (145,292,527) |
Net Increase/(Decrease) | (4,550,196) | $(44,483,585) | | 12,574,285 | $ 125,235,678 |
Class R Shares: | | | | | |
Shares sold | 236,065 | $ 2,246,676 | | 465,683 | $ 5,057,712 |
Reinvested dividends and distributions | 54,563 | 515,067 | | 29,594 | 315,241 |
Shares repurchased | (455,039) | (4,322,148) | | (735,175) | (7,716,396) |
Net Increase/(Decrease) | (164,411) | $ (1,560,405) | | (239,898) | $ (2,343,443) |
Class S Shares: | | | | | |
Shares sold | 379,086 | $ 3,601,384 | | 338,169 | $ 3,634,299 |
Reinvested dividends and distributions | 47,513 | 448,580 | | 25,133 | 267,784 |
Shares repurchased | (405,291) | (3,844,514) | | (539,181) | (5,793,583) |
Net Increase/(Decrease) | 21,308 | $ 205,450 | | (175,879) | $ (1,891,500) |
Class T Shares: | | | | | |
Shares sold | 5,938,312 | $ 56,606,163 | | 3,908,810 | $ 42,339,769 |
Reinvested dividends and distributions | 1,282,679 | 12,109,110 | | 796,864 | 8,520,000 |
Shares repurchased | (9,057,167) | (85,638,748) | | (14,493,731) | (155,952,284) |
Net Increase/(Decrease) | (1,836,176) | $(16,923,475) | | (9,788,057) | $(105,092,515) |
7. Purchases and Sales of Investment Securities
For the year ended June 30, 2023, the aggregate cost of purchases and proceeds from sales of investment securities (excluding any short-term securities, short-term options contracts, TBAs, and in-kind transactions, as applicable) was as follows:
| | | | |
Purchases of
Securities | Proceeds from Sales
of Securities | Purchases of Long-
Term U.S. Government
Obligations | Proceeds from Sales
of Long-Term U.S.
Government Obligations |
$1,228,880,291 | $996,368,683 | $ 3,935,556,309 | $ 4,181,032,406 |
Janus Henderson Flexible Bond Fund
Notes to Financial Statements
8. Subsequent Event
Management has evaluated whether any events or transactions occurred subsequent to June 30, 2023 and through the date of issuance of the Fund’s financial statements and determined that there were no material events or transactions that would require recognition or disclosure in the Fund’s financial statements.
Janus Henderson Flexible Bond Fund
Report of Independent Registered Public Accounting Firm
To the Board of Trustees of Janus Investment Fund and Shareholders of Janus Henderson Flexible Bond Fund
Opinion on the Financial Statements
We have audited the accompanying statement of assets and liabilities, including the schedule of investments, of Janus Henderson Flexible Bond Fund (one of the funds constituting Janus Investment Fund, referred to hereafter as the "Fund") as of June 30, 2023, the related statement of operations for the year ended June 30, 2023, the statements of changes in net assets for each of the two years in the period ended June 30, 2023, including the related notes, and the financial highlights for each of the five years in the period ended June 30, 2023 (collectively referred to as the “financial statements”). In our opinion, the financial statements present fairly, in all material respects, the financial position of the Fund as of June 30, 2023, the results of its operations for the year then ended, the changes in its net assets for each of the two years in the period ended June 30, 2023 and the financial highlights for each of the five years in the period ended June 30, 2023 in conformity with accounting principles generally accepted in the United States of America.
Basis for Opinion
These financial statements are the responsibility of the Fund’s management. Our responsibility is to express an opinion on the Fund’s financial statements based on our audits. We are a public accounting firm registered with the Public Company Accounting Oversight Board (United States) (PCAOB) and are required to be independent with respect to the Fund in accordance with the U.S. federal securities laws and the applicable rules and regulations of the Securities and Exchange Commission and the PCAOB.
We conducted our audits of these financial statements in accordance with the standards of the PCAOB. Those standards require that we plan and perform the audit to obtain reasonable assurance about whether the financial statements are free of material misstatement, whether due to error or fraud.
Our audits included performing procedures to assess the risks of material misstatement of the financial statements, whether due to error or fraud, and performing procedures that respond to those risks. Such procedures included examining, on a test basis, evidence regarding the amounts and disclosures in the financial statements. Our audits also included evaluating the accounting principles used and significant estimates made by management, as well as evaluating the overall presentation of the financial statements. Our procedures included confirmation of securities owned as of June 30, 2023 by correspondence with the custodian, transfer agent and brokers; when replies were not received from brokers, we performed other auditing procedures. We believe that our audits provide a reasonable basis for our opinion.

Denver, Colorado
August 21, 2023
We have served as the auditor of one or more investment companies in Janus Henderson Funds since 1990.
Janus Henderson Flexible Bond Fund
Additional Information (unaudited)
Proxy Voting Policies and Voting Record
A description of the policies and procedures that the Fund uses to determine how to vote proxies relating to its portfolio securities is available without charge: (i) upon request, by calling 1-800-525-1093; (ii) on the Fund’s website at janushenderson.com/proxyvoting; and (iii) on the SEC’s website at http://www.sec.gov. Additionally, information regarding the Fund’s proxy voting record for the most recent twelve-month period ended June 30 is also available, free of charge, through janushenderson.com/proxyvoting and from the SEC’s website at http://www.sec.gov.
Full Holdings
The Fund files its complete portfolio holdings (schedule of investments) with the SEC as an exhibit to Form N-PORT within 60 days of the end of the first and third fiscal quarters, and in the annual report and semiannual report to shareholders. The Fund’s Form N-PORT filings and annual and semiannual reports: (i) are available on the SEC’s website at http://www.sec.gov; and (ii) are available without charge, upon request, by calling a Janus Henderson representative at 1-877-335-2687 (toll free) (or 1-800-525-3713 if you hold Class D shares). Portfolio holdings consisting of at least the names of the holdings are generally available on a monthly basis with a 30-day lag under Full Holdings for the Fund at janushenderson.com/info (or janushenderson.com/reports if you hold Class D Shares).
APPROVAL OF ADVISORY AGREEMENTS DURING THE PERIOD
The Trustees of Janus Aspen Series, each of whom serves as an “independent” Trustee (the “Trustees”), oversee the management of each portfolio of Janus Aspen Series (each, a “VIT Portfolio,” and collectively, the “VIT Portfolios”), as well as each fund of Janus Investment Fund (each, a “Fund,” and collectively, the “Funds” and together with the VIT Portfolios, the “Janus Henderson Funds,” and each, a “Janus Henderson Fund”). As required by law, the Trustees determine annually whether to continue the investment advisory agreement for each Janus Henderson Fund.
In connection with their most recent consideration of those agreements for each Janus Henderson Fund, the Trustees received and reviewed information provided by Janus Henderson Investors US LLC (the “Adviser”) in response to requests of the Trustees and their independent legal counsel. They also received and reviewed information and analysis provided by, and in response to requests of, their independent fee consultant. Throughout their consideration of the agreements, the Trustees were advised by their independent legal counsel. The Trustees met with management to consider the agreements, and also met separately in executive session with their independent legal counsel and their independent fee consultant.
At meetings held on November 9-10, 2022 and December 13-14, 2022, the Trustees evaluated the information provided by the Adviser and the independent fee consultant, as well as other information provided by the Adviser and the independent fee consultant during the year. Following such evaluation, the Trustees determined that the overall arrangements between each Janus Henderson Fund and the Adviser were fair and reasonable in light of the nature, extent, and quality of the services provided by the Adviser and its affiliates, the fees charged for those services, and other matters that the Trustees considered relevant in the exercise of their business judgment, and unanimously approved the continuation of the investment advisory agreement for each Janus Henderson Fund for the period from February 1, 2023 through February 1, 2024, subject to earlier termination as provided for in each agreement.
In considering the continuation of those agreements, the Trustees reviewed and analyzed various factors that they determined were relevant, including the factors described below, none of which by itself was considered dispositive. However, the material factors and conclusions that formed the basis for the Trustees’ determination to approve the continuation of the agreements are discussed separately below. Also included is a summary of the independent fee consultant’s conclusions and opinions that arose during, and were included as part of, the Trustees’ consideration of the agreements. “Management fees,” as used herein, reflect actual annual advisory fees and, for the purpose of peer comparisons any administration fees (excluding out of pocket costs), net of any waivers, paid by a fund as a percentage of average net assets.
Nature, Extent and Quality of Services
The Trustees reviewed the nature, extent, and quality of the services provided by the Adviser to the Janus Henderson Funds, taking into account the investment objective, strategies, and policies of each Janus Henderson Fund, and the knowledge the Trustees gained from their regular meetings with management on at least a quarterly basis and their ongoing review of information related to the Janus Henderson Funds. In addition, the Trustees reviewed the resources and key personnel of the Adviser, particularly noting those employees who provide investment and risk management services to the Janus Henderson Funds. The Trustees also considered other services provided to the Janus Henderson
Janus Henderson Flexible Bond Fund
Additional Information (unaudited)
Funds by the Adviser, such as managing the execution of portfolio transactions and the selection of broker-dealers for those transactions. The Trustees considered the Adviser’s role as administrator to the Janus Henderson Funds, noting that the Adviser generally does not receive a fee for its services as administrator, but is reimbursed for its out-of-pocket costs. The Trustees considered the role of the Adviser in monitoring adherence to the Janus Henderson Funds’ investment restrictions, providing support services for the Trustees and Trustee committees, and overseeing communications with Janus Henderson Fund shareholders and the activities of other service providers, including monitoring compliance with various policies and procedures of the Janus Henderson Funds and with applicable securities laws and regulations.
In this regard, the independent fee consultant noted that the Adviser provides a number of different services for the Janus Henderson Funds and their shareholders, ranging from investment management services to various other servicing functions, and that, in its view, the Adviser is a capable provider of those services. The independent fee consultant also provided its belief that the Adviser has developed a number of institutional competitive advantages that should enable it to provide superior investment and service performance over the long term.
The Trustees concluded that the nature, extent, and quality of the services provided by the Adviser to each Janus Henderson Fund were appropriate and consistent with the terms of the respective advisory agreements, and that, taking into account steps taken to address those Janus Henderson Funds whose performance lagged that of their peers for certain periods, the Janus Henderson Funds were likely to benefit from the continued provision of those services. They also concluded that the Adviser had sufficient personnel, with the appropriate education and experience, to serve the Janus Henderson Funds effectively and had demonstrated its ability to attract well-qualified personnel.
Performance of the Funds
The Trustees considered the performance results of each Janus Henderson Fund over various time periods. They noted that they considered Janus Henderson Fund performance data throughout the year, including periodic meetings with each Janus Henderson Fund’s portfolio manager(s), and also reviewed information comparing each Janus Henderson Fund’s performance with the performance of comparable fund peer groups identified by Broadridge Financial Solutions, Inc. (“Broadridge”), an independent data provider, and with the Janus Henderson Fund’s benchmark index. In this regard, the independent fee consultant found that the overall Janus Henderson Funds’ performance has been reasonable, noting that: (i) for the 36 months ended May 31, 2022, approximately 38% of the Janus Henderson Funds were in the top two quartiles of their Broadridge peer groups; (ii) for the 36 months ended September 30, 2022, approximately 45% of the Janus Henderson Funds were in the top two quartiles of performance as reported by Morningstar, and (iii) for the 12 months ended September 30, 2022, approximately 55% of the Janus Henderson Funds were in the top two quartiles of performance as reported by Morningstar.
The Trustees considered the performance of each Janus Henderson Fund, noting that performance may vary by share class, and noted the following with respect to the Funds:
Asset Allocation Funds
· For Janus Henderson Global Allocation Fund – Conservative, the Trustees noted that the Fund’s performance was in the third Broadridge quartile for the 36 months ended May 31, 2022 and the bottom Broadridge quartile for the 12 months ended May 31, 2022. The Trustees noted the reasons for the Fund’s underperformance and the steps the Adviser had taken or was taking to improve performance.
· For Janus Henderson Global Allocation Fund – Growth, the Trustees noted that the Fund’s performance was in the bottom Broadridge quartile for the 36 months ended May 31, 2022 and the bottom Broadridge quartile for the 12 months ended May 31, 2022. The Trustees noted the reasons for the Fund’s underperformance and the steps the Adviser had taken or was taking to improve performance.
· For Janus Henderson Global Allocation Fund – Moderate, the Trustees noted that the Fund’s performance was in the bottom Broadridge quartile for the 36 months ended May 31, 2022 and the bottom Broadridge quartile for the 12 months ended May 31, 2022. The Trustees noted the reasons for the Fund’s underperformance and the steps the Adviser had taken or was taking to improve performance.
Fixed-Income Funds
· For Janus Henderson Absolute Return Income Opportunities Fund, the Trustees noted that the Fund’s performance was in the third Broadridge quartile for the 36 months ended May 31, 2022 and the first Broadridge
Janus Henderson Flexible Bond Fund
Additional Information (unaudited)
quartile for the 12 months ended May 31, 2022. The Trustees noted the reasons for the Fund’s underperformance, the steps the Adviser had taken or was taking to improve performance, and that the performance trend was improving.
· For Janus Developed World Bond Fund, the Trustees noted that the Fund’s performance was in the bottom Broadridge quartile for the 36 months ended May 31, 2022 and the bottom Broadridge quartile for the 12 months ended May 31, 2022. The Trustees noted the reasons for the Fund’s underperformance and the steps the Adviser had taken or was taking to improve performance.
· For Janus Henderson Flexible Bond Fund, the Trustees noted that the Fund’s performance was in the first Broadridge quartile for the 36 months ended May 31, 2022 and the second Broadridge quartile for the 12 months ended May 31, 2022.
· For Janus Henderson Global Bond Fund, the Trustees noted that the Fund’s performance was in the third Broadridge quartile for the 36 months ended May 31, 2022 and the bottom Broadridge quartile for the 12 months ended May 31, 2022. The Trustees noted the reasons for the Fund’s underperformance and the steps the Adviser had taken or was taking to improve performance.
· For Janus Henderson High-Yield Fund, the Trustees noted that the Fund’s performance was in the third Broadridge quartile for the 36 months ended May 31, 2022 and the bottom Broadridge quartile for the 12 months ended May 31, 2022. The Trustees noted the reasons for the Fund’s underperformance and the steps the Adviser had taken or was taking to improve performance.
· For Janus Henderson Multi-Sector Income Fund, the Trustees noted that the Fund’s performance was in the second Broadridge quartile for the 36 months ended May 31, 2022 and the third Broadridge quartile for the 12 months ended May 31, 2022.
· For Janus Henderson Short Duration Flexible Bond Fund, the Trustees noted that the Fund’s performance was in the third Broadridge quartile for the 36 months ended May 31, 2022 and the bottom Broadridge quartile for the 12 months ended May 31, 2022. The Trustees noted the reasons for the Fund’s underperformance and the steps the Adviser had taken or was taking to improve performance.
Global and International Equity Funds
· For Janus Henderson Asia Equity Fund, the Trustees noted that the Fund’s performance was in the third Broadridge quartile for the 36 months ended May 31, 2022 and the third Broadridge quartile for the 12 months ended May 31, 2022. The Trustees noted the reasons for the Fund’s underperformance, while also noting that the Fund has a performance fee structure that results in lower management fees during periods of underperformance, and the steps the Adviser had taken or was taking to improve performance.
· For Janus Henderson Emerging Markets Fund, the Trustees noted that the Fund’s performance was in the third Broadridge quartile for the 36 months ended May 31, 2022 and the third Broadridge quartile for the 12 months ended May 31, 2022. The Trustees noted the reasons for the Fund’s underperformance and the steps the Adviser had taken or was taking to improve performance.
· For Janus Henderson European Focus Fund, the Trustees noted that the Fund’s performance was in the first Broadridge quartile for the 36 months ended May 31, 2022 and the second Broadridge quartile for the 12 months ended May 31, 2022.
· For Janus Henderson Global Equity Income Fund, the Trustees noted that the Fund’s performance was in the third Broadridge quartile for the 36 months ended May 31, 2022 and the first Broadridge quartile for the 12 months ended May 31, 2022. The Trustees noted the reasons for the Fund’s underperformance, the steps the Adviser had taken or was taking to improve performance, and that the performance trend was improving.
· For Janus Henderson Global Life Sciences Fund, the Trustees noted that the Fund’s performance was in the third Broadridge quartile for the 36 months ended May 31, 2022 and the second Broadridge quartile for the 12 months ended May 31, 2022. The Trustees noted the reasons for the Fund’s underperformance, the steps the Adviser had taken or was taking to improve performance, and that the performance trend was improving.
Janus Henderson Flexible Bond Fund
Additional Information (unaudited)
· For Janus Henderson Global Sustainable Equity Fund, the Trustees noted that the Fund’s performance was in the second Broadridge quartile for the 12 months ended May 31, 2022. The Trustees noted that 36 month-end performance was not yet available.
· For Janus Henderson Global Real Estate Fund, the Trustees noted that the Fund’s performance was in the second Broadridge quartile for the 36 months ended May 31, 2022 and the bottom Broadridge quartile for the 12 months ended May 31, 2022.
· For Janus Henderson Global Research Fund, the Trustees noted that the Fund’s performance was in the second Broadridge quartile for the 36 months ended May 31, 2022 and the first Broadridge quartile for the 12 months ended May 31, 2022.
· For Janus Henderson Global Select Fund, the Trustees noted that the Fund’s performance was in the first Broadridge quartile for the 36 months ended May 31, 2022 and the first Broadridge quartile for the 12 months ended May 31, 2022.
· For Janus Henderson Global Technology and Innovation Fund, the Trustees noted that the Fund’s performance was in the second Broadridge quartile for the 36 months ended May 31, 2022 and the second Broadridge quartile for the 12 months ended May 31, 2022.
· For Janus Henderson International Opportunities Fund, the Trustees noted that the Fund’s performance was in the bottom Broadridge quartile for the 36 months ended May 31, 2022 and the third Broadridge quartile for the 12 months ended May 31, 2022. The Trustees noted the reasons for the Fund’s underperformance and the steps the Adviser had taken or was taking to improve performance.
· For Janus Henderson Overseas Fund, the Trustees noted that the Fund’s performance was in the first Broadridge quartile for the 36 months ended May 31, 2022 and the first Broadridge quartile for the 12 months ended May 31, 2022.
· For Janus Henderson Responsible International Dividend Fund (formerly the Janus Henderson Dividend & Income Builder Fund), the Trustees noted that the Fund’s performance was in the bottom Broadridge quartile for the 36 months ended May 31, 2022 and the bottom Broadridge quartile for the 12 months ended May 31, 2022. The Trustees noted the reasons for the Fund’s underperformance and the steps the Adviser had taken or was taking to improve performance.
Money Market Funds
· For Janus Henderson Government Money Market Fund, the Trustees noted that the Fund’s performance was in the third Broadridge quartile for the 36 months ended May 31, 2022 and the bottom Broadridge quartile for the 12 months ended May 31, 2022. The Trustees noted the reasons for the Fund’s underperformance and the steps the Adviser had taken or was taking to improve performance.
· For Janus Henderson Money Market Fund, the Trustees noted that the Fund’s performance was in the third Broadridge quartile for the 36 months ended May 31, 2022 and the bottom Broadridge quartile for the 12 months ended May 31, 2022. The Trustees noted the reasons for the Fund’s underperformance and the steps the Adviser had taken or was taking to improve performance.
Multi-Asset Funds
· For Janus Henderson Adaptive Global Allocation Fund, the Trustees noted that the Fund’s performance was in bottom Broadridge quartile for the 36 months ended May 31, 2022 and the second Broadridge quartile for the 12 months ended May 31, 2022. The Trustees noted the reasons for the Fund’s underperformance, the steps the Adviser had taken or was taking to improve performance, and that the performance trend was improving.
· For Janus Henderson Balanced Fund, the Trustees noted that the Fund’s performance was in the first Broadridge quartile for the 36 months ended May 31, 2022 and the first Broadridge quartile for the 12 months ended May 31, 2022.
Janus Henderson Flexible Bond Fund
Additional Information (unaudited)
U.S. Equity Funds
· For Janus Henderson Adaptive Risk Managed U.S. Equity Fund, the Trustees noted that the Fund’s performance was in the bottom Broadridge quartile for the 36 months ended May 31, 2022 and the second Broadridge quartile for the 12 months ended May 31, 2022. The Trustees noted the reasons for the Fund’s underperformance, the steps the Adviser had taken or were taking to improve performance, and that the performance trend was improving.
· For Janus Henderson Contrarian Fund, the Trustees noted that the Fund’s performance was in the first Broadridge quartile for the 36 months ended May 31, 2022 and the bottom Broadridge quartile for the 12 months ended May 31, 2022.
· For Janus Henderson Enterprise Fund, the Trustees noted that the Fund’s performance was in the second Broadridge quartile for the 36 months ended May 31, 2022 and the first Broadridge quartile for the 12 months ended May 31, 2022.
· For Janus Henderson Forty Fund, the Trustees noted that the Fund’s performance was in the third Broadridge quartile for the 36 months ended May 31, 2022 and the bottom Broadridge quartile for the 12 months ended May 31, 2022. The Trustees noted the reasons for the Fund’s underperformance and the steps the Adviser had taken or was taking to improve performance.
· For Janus Henderson Growth and Income Fund, the Trustees noted that the Fund’s performance was in the bottom Broadridge quartile for the 36 months ended May 31, 2022 and the first Broadridge quartile for the 12 months ended May 31, 2022. The Trustees noted the reasons for the Fund’s underperformance, the steps the Adviser had taken or was taking to improve performance, and that the performance trend was improving.
· For Janus Henderson Mid Cap Value Fund, the Trustees noted that the Fund’s performance was in the bottom Broadridge quartile for the 36 months ended May 31, 2022 and the second Broadridge quartile for the 12 months ended May 31, 2022. The Trustees noted the reasons for the Fund’s underperformance, while also noting that the Fund has a performance fee structure that results in lower management fees during periods of underperformance, the steps the Adviser had taken or was taking to improve performance, and that the performance trend was improving.
· For Janus Henderson Research Fund, the Trustees noted that the Fund’s performance was in the third Broadridge quartile for the 36 months ended May 31, 2022 and the third Broadridge quartile for the 12 months ended May 31, 2022. The Trustees noted the reasons for the Fund’s underperformance, while also noting that the Fund has a performance fee structure that results in lower management fees during periods of underperformance and the steps the Adviser had taken or was taking to improve performance.
· For Janus Henderson Small Cap Value Fund, the Trustees noted that the Fund’s performance was in the bottom Broadridge quartile for the 36 months ended May 31, 2022 and the second Broadridge quartile for the 12 months ended May 31, 2022. The Trustees noted the reasons for the Fund’s underperformance, while also noting that the Fund has a performance fee structure that results in lower management fees during periods of underperformance, the steps the Adviser had taken or was taking to improve performance, and that the performance trend was improving.
· For Janus Henderson Small-Mid Cap Value Fund, the Trustees noted that the Fund’s performance was in the bottom Broadridge quartile for the 36 months ended May 31, 2022 and the second Broadridge quartile for the 12 months ended May 31, 2022. The Trustees noted the reasons for the Fund’s underperformance, while also noting that the Fund has a performance fee structure that results in lower management fees during periods of underperformance, the steps the Adviser had taken or was taking to improve performance, and that the performance trend is improving.
· For Janus Henderson Triton Fund, the Trustees noted that the Fund’s performance was in the bottom Broadridge quartile for the 36 months ended May 31, 2022 and the second Broadridge quartile for the 12 months ended May 31, 2022. The Trustees noted the reasons for the Fund’s underperformance, the steps the Adviser had taken or was taking to improve performance, and that the performance trend was improving.
· For Janus Henderson Venture Fund, the Trustees noted that the Fund’s performance was in the bottom Broadridge quartile for the 36 months ended May 31, 2022 and the second Broadridge quartile for the 12 months ended May
Janus Henderson Flexible Bond Fund
Additional Information (unaudited)
31, 2022. The Trustees noted the reasons for the Fund’s underperformance, the steps the Adviser had taken or was taking to improve performance, and that the performance trend was improving.
In consideration of each Janus Henderson Fund’s performance, the Trustees concluded that, taking into account the factors relevant to performance, as well as other considerations, including steps taken to improve performance, as applicable, the Janus Henderson Fund’s performance warranted continuation of such Janus Henderson Fund’s investment advisory agreement.
Costs of Services Provided
The Trustees examined information regarding the fees and expenses of each Janus Henderson Fund in comparison to similar information for other comparable funds as provided by Broadridge, an independent data provider. They also reviewed an analysis of that information provided by their independent fee consultant. The independent fee consultant provided its belief that the management fees charged by the Adviser to each of the Janus Henderson Funds under the current investment advisory and administration agreements are reasonable in relation to the services provided by the Adviser. The independent fee consultant found: (1) the total expenses and management fees of the Janus Henderson Funds to be reasonable relative to other comparable mutual funds; (2) the total expenses, on average, were 6% under the average total expenses of the respective Broadridge peer group; and (3) the management fees for the Janus Henderson Funds, on average, were 5% under the average management fees for the respective Broadridge peer group. The Trustees also considered the total expenses for each share class of each Janus Henderson Fund compared to the average total expenses for its Broadridge Expense Group and to average total expenses for its Broadridge Expense Universe.
For Janus Henderson Funds with three or more years of performance history, the independent fee consultant also performed a systematic “focus list” analysis of expenses which assessed fund fees in the context of fund performance being delivered. Based on this analysis, the independent fee consultant found that the combination of service quality/performance and expenses on these individual Janus Henderson Funds was reasonable in light of performance trends, performance histories, changes in portfolio management, relative average net asset levels, and the existence of performance fees, breakpoints, and/or expense waivers on such Janus Henderson Funds.
The Trustees considered the methodology used by the Adviser in determining compensation payable to portfolio managers, the competitive environment for investment management talent, and the competitive market for mutual funds in different distribution channels.
The Trustees also reviewed management fees charged by the Adviser to comparable separate account clients and to comparable non-affiliated funds subadvised by the Adviser (for which the Adviser provides only or primarily portfolio management services). Although in most instances subadvisory and separate account fee rates for various investment strategies were lower than management fee rates for Janus Henderson Funds having a similar strategy, the Trustees considered that the Adviser noted that, under the terms of the management agreements with the Janus Henderson Funds, the Adviser performs significant additional services for the Janus Henderson Funds that it does not provide to those other clients, including administration services, oversight of the Janus Henderson Funds’ other service providers, Trustee support, regulatory compliance and numerous other services, and that, in serving the Janus Henderson Funds, the Adviser assumes many legal risks and other costs that it does not assume in servicing its other clients. Moreover, the Trustees noted that the independent fee consultant found that: (1) the management fees the Adviser charges to the Janus Henderson Funds are reasonable in relation to the management fees the Adviser charges to funds subadvised by the Adviser and to the fees the Adviser charges to its institutional separate account clients; (2) these subadvised and institutional separate accounts have different service and infrastructure needs and operate in markets very different from the retail fund market; (3) Janus Henderson mutual fund investors enjoy reasonable fees relative to the fees charged in these other markets; and (4) as part of its 2022 review, 9 of 11 Janus Henderson Funds have lower management fees than similar funds subadvised by the Adviser. The Trustees noted that for the two Janus Henderson Funds that did not, management fees for each were under the average of its 15(c) peer group.
The Trustees considered the fees for each Janus Henderson Fund for its fiscal year ended in 2021 and noted the following with regard to each Janus Henderson Fund’s total expenses, net of applicable fee waivers (the Fund’s “total expenses”) as reflected in the comparative information provided by Broadridge:
Janus Henderson Flexible Bond Fund
Additional Information (unaudited)
Asset Allocation Funds
· For Janus Henderson Global Allocation Fund – Conservative, the Trustees noted that, although the Fund’s total expenses exceeded the peer group average for certain share classes, overall the Fund’s total expenses were reasonable. The Trustees also noted that the Adviser has contractually agreed to limit the Fund’s expenses.
· For Janus Henderson Global Allocation Fund – Growth, the Trustees noted that, although the Fund’s total expenses exceeded the peer group average for certain share classes, overall the Fund’s total expenses were reasonable. The Trustees also noted that the Adviser has contractually agreed to limit the Fund’s expenses, although this limit did not apply because the Fund’s total expenses as shown were below the applicable fee limit.
· For Janus Henderson Global Allocation Fund – Moderate, the Trustees noted that, although the Fund’s total expenses exceeded the peer group average for one share class, overall the Fund’s total expenses were reasonable. The Trustees also noted that the Adviser has contractually agreed to limit the Fund’s expenses.
Fixed-Income Funds
· For Janus Henderson Absolute Return Income Opportunities Fund, the Trustees noted that, although the Fund’s total expenses exceeded the peer group average for certain share classes, overall the Fund’s total expenses were reasonable. The Trustees also noted that the Adviser has contractually agreed to limit the Fund’s expenses.
· For Janus Henderson Developed World Bond Fund, the Trustees noted that, although the Fund’s total expenses exceeded the peer group average for one share class, overall the Fund’s total expenses were reasonable. The Trustees also noted that the Adviser has contractually agreed to limit the Fund’s expenses.
· For Janus Henderson Flexible Bond Fund, the Trustees noted that, although the Fund’s total expenses exceeded the peer group average for certain share classes, overall the Fund’s total expenses were reasonable. The Trustees also noted that the Adviser has contractually agreed to limit the Fund’s expenses, although this limit did not apply because the Fund’s total expenses as shown were below the applicable fee limit.
· For Janus Henderson Global Bond Fund, the Trustees noted that, although the Fund’s total expenses exceeded the peer group average for certain share classes, overall the Fund’s total expenses were reasonable. The Trustees also noted that the Adviser has contractually agreed to limit the Fund’s expenses.
· For Janus Henderson High-Yield Fund, the Trustees noted that, although the Fund’s total expenses exceeded the peer group average for certain share classes, overall the Fund’s total expenses were reasonable. The Trustees also noted that the Adviser has contractually agreed to limit the Fund’s expenses.
· For Janus Henderson Multi-Sector Income Fund, the Trustees noted that, although the Fund’s total expenses exceeded the peer group average for certain share classes, overall the Fund’s total expenses were reasonable. The Trustees also noted that the Adviser has contractually agreed to limit the Fund’s expenses.
· For Janus Henderson Short Duration Flexible Bond Fund, the Trustees noted that, although the Fund’s total expenses exceeded the peer group average for certain share classes, overall the Fund’s total expenses were reasonable. The Trustees also noted that the Adviser has contractually agreed to limit the Fund’s expenses.
Global and International Equity Funds
· For Janus Henderson Asia Equity Fund, the Trustees noted that, although the Fund’s total expenses exceeded the peer group average for certain share classes, overall the Fund’s total expenses were reasonable. The Trustees also noted that the Adviser has contractually agreed to limit the Fund’s expenses.
· For Janus Henderson Emerging Markets Fund, the Trustees noted that, although the Fund’s total expenses exceeded the peer group average for certain share classes, overall the Fund’s total expenses were reasonable. The Trustees also noted that the Adviser has contractually agreed to limit the Fund’s expenses.
· For Janus Henderson European Focus Fund, the Trustees noted that, although the Fund’s total expenses exceeded the peer group average for one share class, overall the Fund’s expenses were reasonable. The Trustees also noted that the Adviser has contractually agreed to limit the Fund’s expenses.
· For Janus Henderson Global Equity Income Fund, the Trustees noted that, although the Fund’s total expenses exceeded the peer group average for one share class, overall the Fund’s total expenses were reasonable. The
Janus Henderson Flexible Bond Fund
Additional Information (unaudited)
Trustees also noted that the Adviser has contractually agreed to limit the Fund’s expenses, although this limit did not apply because the Fund’s total expenses as shown were below the applicable fee limit.
· For Janus Henderson Global Life Sciences Fund, the Trustees noted that the Fund’s total expenses were below the peer group average for all share classes.
· For Janus Henderson Global Real Estate Fund, the Trustees noted that, although the Fund’s total expenses exceeded the peer group average for certain share classes, overall the Fund’s total expenses were reasonable. The Trustees also noted that the Adviser has contractually agreed to limit the Fund’s expenses, although this limit did not apply because the Fund’s total expenses as shown were below the applicable fee limit.
· For Janus Henderson Global Research Fund, the Trustees noted that, although the Fund’s total expenses exceeded the peer group average for one share class, overall the Fund’s total expenses were reasonable. The Trustees also noted that the Adviser has contractually agreed to limit the Fund’s expenses, although this limit did not apply because the Fund’s total expenses as shown were below the applicable fee limit.
· For Janus Henderson Global Select Fund, the Trustees noted that, although the Fund’s total expenses exceeded the peer group average for certain share classes, overall the Fund’s total expenses were reasonable. The Trustees also noted that the Adviser has contractually agreed to limit the Fund’s expenses.
· For Janus Henderson Global Sustainable Equity Fund, the Trustees noted that, although the Fund’s total expenses exceeded the peer group average for certain share classes, overall the Fund’s expenses were reasonable. The Trustees also noted that the Adviser has contractually agreed to limit the Fund’s expenses.
· For Janus Henderson Global Technology and Innovation Fund, the Trustees noted that the Fund’s total expenses were below the peer group average for all share classes.
· For Janus Henderson International Opportunities Fund, the Trustees noted that, although the Fund’s total expenses exceeded the peer group average for certain share classes, overall the Fund’s expenses were reasonable. The Trustees also noted that the Adviser has contractually agreed to limit the Fund’s expenses.
· For Janus Henderson Overseas Fund, the Trustees noted that although the Fund’s total expenses exceeded the peer group average for certain share classes, overall the Fund’s total expenses were reasonable. The Trustees also noted that the Adviser has contractually agreed to limit the Fund’s expenses, although this limit did not apply because the Fund’s total expenses as shown were below the applicable fee limit.
· For Janus Henderson Responsible International Dividend Fund (formerly the Janus Henderson Dividend & Income Builder Fund), the Trustees noted that, although the Fund’s total expenses exceeded the peer group for one share class, overall the Fund’s total expenses were reasonable. The Trustees also noted that the Adviser has contractually agreed to limit the Fund’s expenses.
Money Market Funds
· For Janus Henderson Government Money Market Fund, the Trustees noted that the Fund’s total expenses were below the peer group average for all share classes.
· For Janus Henderson Money Market Fund, the Trustees noted that the Fund’s total expenses were below the peer group average for all share classes.
Multi-Asset Funds
· For Janus Henderson Adaptive Global Allocation Fund, the Trustees noted that the Fund’s total expenses were below the peer group average for all share classes.
· For Janus Henderson Balanced Fund, the Trustees noted that, although the Fund’s total expenses exceeded the peer group average for certain share classes, overall the Fund’s total expenses were reasonable. The Trustees also noted that the Adviser has contractually agreed to limit the Fund’s expenses, although this limit did not apply because the Fund’s total expenses as shown were below the applicable fee limit.
Janus Henderson Flexible Bond Fund
Additional Information (unaudited)
U.S. Equity Funds
· For Janus Henderson Adaptive Risk Managed U.S. Equity Fund, the Trustees noted that, although the Fund’s total expenses exceeded the peer group average for certain share classes, overall the Fund’s total expenses were reasonable. The Trustees also noted that the Adviser has contractually agreed to limit the Fund’s expenses, although this limit did not apply because the Fund’s total expenses as shown were below the applicable fee limit.
· For Janus Henderson Contrarian Fund, the Trustees noted that, although the Fund’s total expenses exceeded the peer group average for all share classes, overall the Fund’s total expenses were reasonable. The Trustees also noted that the Adviser had contractually agreed to limit the Fund’s expenses.
· For Janus Henderson Enterprise Fund, the Trustees noted that, although the Fund’s total expenses exceeded the peer group average for certain share classes, overall the Fund’s total expenses were reasonable. The Trustees also noted that the Adviser has contractually agreed to limit the Fund’s expenses, although this limit did not apply because the Fund’s total expenses as shown were below the applicable fee limit.
· For Janus Henderson Forty Fund, the Trustees noted that, although the Fund’s total expenses exceeded the peer group average for certain share classes, overall the Fund’s total expenses were reasonable. The Trustees also noted that the Adviser has contractually agreed to limit the Fund’s expenses, although this limit did not apply because the Fund’s total expenses as shown were below the applicable fee limit.
· For Janus Henderson Growth and Income Fund, the Trustees noted that, although the Fund’s total expenses exceeded the peer group average for certain share classes, overall the Fund’s total expenses were reasonable. The Trustees also noted that the Adviser has contractually agreed to limit the Fund’s expenses, although this limit did not apply because the Fund’s total expenses as shown were below the applicable fee limit.
· For Janus Henderson Mid Cap Value Fund, the Trustees noted that the Fund’s total expenses were below the peer group average for all share classes.
· For Janus Henderson Research Fund, the Trustees noted that, although the Fund’s total expenses exceeded the peer group average for certain share classes, overall the Fund’s total expenses were reasonable. The Trustees also noted that the Adviser has contractually agreed to limit the Fund’s expenses.
· For Janus Henderson Small Cap Value Fund, the Trustees noted that, although the Fund’s total expenses exceeded the peer group average for one share class, overall the Fund’s total expenses were reasonable. The Trustees also noted that the Adviser has contractually agreed to limit the Fund’s expenses, although this limit did not apply because the Fund’s total expenses as shown were below the applicable fee limit.
· For Janus Henderson Small-Mid Cap Value Fund, the Trustees noted that the Fund’s total expenses were below the peer group average for all share classes.
· For Janus Henderson Triton Fund, the Trustees noted that, although the Fund’s total expenses exceeded the peer group average for one share class, overall the Fund’s total expenses were reasonable. The Trustees also noted that the Adviser has contractually agreed to limit the Fund’s expenses, although this limit did not apply because the Fund’s total expenses as shown were below the applicable fee limit.
· For Janus Henderson Venture Fund, the Trustees noted that although the Fund’s total expenses exceeded the peer group average for one share class, overall the Fund’s total expenses were reasonable. The Trustees also noted that the Adviser has contractually agreed to limit the Fund’s expenses, although this limit did not apply because the Fund’s total expenses as shown were below the applicable fee limit.
The Trustees reviewed information on the overall profitability to the Adviser and its affiliates from their relationships with the Janus Henderson Funds, and considered profitability data of other publicly traded mutual fund advisers. The Trustees recognized that profitability comparisons among fund managers are difficult because of the variation in the type of comparative information that is publicly available, and the profitability of any fund manager is affected by numerous factors, including the organizational structure of the particular fund manager, differences in complex size, difference in product mix, difference in types of business (mutual fund, institutional and other), differences in the types of funds and other accounts it manages, possible other lines of business, the methodology for allocating expenses and the fund manager’s capital structure and cost of capital.
Janus Henderson Flexible Bond Fund
Additional Information (unaudited)
Additionally, the Trustees considered the estimated profitability to the Adviser from the investment management services it provided to each Janus Henderson Fund. In their review, the Trustees considered whether the Adviser receive adequate incentives and resources to manage the Janus Henderson Funds effectively. In reviewing profitability, the Trustees noted that the estimated profitability for an individual Janus Henderson Fund is necessarily a product of the allocation methodology utilized by the Adviser to allocate its expenses as part of the estimated profitability calculation. In this regard, the Trustees noted that the independent fee consultant found as part of its 2022 review that (1) the expense allocation methodology and rationales utilized by the Adviser were reasonable and (2) no clear correlation exists between expense allocations and operating margins. The Trustees also considered that the estimated profitability for an individual Janus Henderson Fund was influenced by a number of factors, including not only the allocation methodology selected, but also the presence of fee waivers and expense caps, and whether the Janus Henderson Fund’s investment management agreement contained breakpoints or a performance fee component. The Trustees determined, after taking into account these factors, among others, that the Adviser’s estimated profitability with respect to each Janus Henderson Fund was not unreasonable in relation to the services provided, and that the variation in the range of such estimated profitability among the Janus Henderson Funds was not a material factor in the Board’s approval of the reasonableness of any Janus Henderson Fund’s investment management fees.
The Trustees concluded that the management fees payable by each Janus Henderson Fund to the Adviser were reasonable in relation to the nature, extent, and quality of the services provided, taking into account the fees charged by other advisers for managing comparable mutual funds with similar strategies, the fees the Adviser charges to other clients, and, as applicable, the impact of fund performance on management fees payable by the Janus Henderson Funds. The Trustees also concluded that each Janus Henderson Fund’s total expenses were reasonable, taking into account the size of the Janus Henderson Fund, the quality of services provided by the Adviser, the investment performance of the Janus Henderson Fund, and any expense limitations agreed to or provided by the Adviser.
Economies of Scale
The Trustees considered information about the potential for the Adviser to realize economies of scale as the assets of the Janus Henderson Funds increase. They noted that their independent fee consultant published a report to the Trustees in June 2022 which provided its research and analysis into economies of scale. They also noted that, although many Janus Henderson Funds pay advisory fees at a fixed base rate as a percentage of net assets, without any breakpoints or performance fees, their independent fee consultant concluded that 75% of these Janus Henderson Funds’ have contractual management fees (gross of waivers) below their Broadridge Expense Group averages. The Trustees also noted the following from the independent fee consultant’s report: (1) that 31% of Janus Henderson Funds had management fee breakpoints in place whereby investors pay lower management fees as fund AUM increases; (2) that 29% of Janus Henderson Funds have low flat-rate fees and performance fees where the Adviser is incentivized to invest in resources which drive Janus Henderson Fund performance; and (3) that 39% of Janus Henderson Funds have low flat-rate fees versus peers where investors pay low fixed fees when the Janus Henderson Fund is small/midsized and higher fees when the Janus Henderson Fund grows in assets. The Trustees also noted that the Janus Henderson Funds share directly in economies of scale through the significant investments made by the Adviser and its affiliates related to services provided to the Funds and the lower charges of third-party service providers that are based in part on the combined scale of all of the Janus Henderson Funds.
The Trustees also considered the independent fee consultant’s conclusion that, given the limitations of various analytical approaches to economies of scale and their conflicting results, it is difficult to analytically confirm or deny the existence of economies of scale in the Janus Henderson complex. In this regard, the independent consultant concluded that (1) to the extent there were economies of scale at the Adviser, the Adviser’s general strategy of setting fixed management fees below peers appeared to share any such economies with investors even on smaller Janus Henderson Funds which have not yet achieved those economies and (2) by setting lower fixed fees from the start on these Janus Henderson Funds, the Adviser appeared to be investing to increase the likelihood that these Janus Henderson Funds will grow to a level to achieve any economies of scale that may exist. Further, the independent fee consultant provided its belief that Janus Henderson Fund investors are well-served by the fee levels and performance fee structures in place on the Janus Henderson Funds in light of any economies of scale that may be present at the Adviser.
Based on all of the information reviewed, including the recent and past research and analysis conducted by the Trustees’ independent fee consultant, the Trustees concluded that the current fee structure of each Janus Henderson Fund was reasonable and that the current rates of fees do reflect a sharing between the Adviser and the Janus
Janus Henderson Flexible Bond Fund
Additional Information (unaudited)
Henderson Fund of any economies of scale that may be present at the current asset level of the Janus Henderson Fund.
Other Benefits to the Adviser
The Trustees also considered benefits that accrue to the Adviser and its affiliates from their relationships with the Janus Henderson Funds. They recognized that two affiliates of the Adviser separately serve the Janus Henderson Funds as transfer agent and distributor, respectively, and the transfer agent receives compensation directly from the non-money market Janus Henderson Funds for services provided, and that such compensation contributes to the overall profitability of the Adviser and its affiliates that results from their relationship with the Janus Henderson Funds. The Trustees also considered the Adviser’s past and proposed use of commissions paid by the Janus Henderson Funds on portfolio brokerage transactions to obtain proprietary and third-party research products and services benefiting the Janus Henderson Fund and/or other clients of the Adviser and/or the Adviser. The Trustees concluded that the Adviser’s use of these types of client commission arrangements to obtain proprietary and third-party research products and services was consistent with regulatory requirements and guidelines and was likely to benefit each Janus Henderson Fund. The Trustees also concluded that, other than the services provided by the Adviser and its affiliates pursuant to the agreements and the fees to be paid by each Janus Henderson Fund therefor, the Janus Henderson Funds and the Adviser may potentially benefit from their relationship with each other in other ways. They concluded that the Adviser and its affiliates share directly in economies of scale through the lower charges of third-party service providers that are based in part on the combined scale of the Janus Henderson Funds and other clients serviced by the Adviser and its affiliates. They also concluded that the Adviser benefits from the receipt of research products and services acquired through commissions paid on portfolio transactions of the Janus Henderson Funds and that the Janus Henderson Funds benefit from the Adviser’s receipt of those products and services as well as research products and services acquired through commissions paid by other clients of the Adviser. They further concluded that the success of any Janus Henderson Fund could attract other business to the Adviser or other Janus Henderson Funds, and that the success of the Adviser could enhance the Adviser’s ability to serve the Janus Henderson Funds.
Janus Henderson Flexible Bond Fund
Liquidity Risk Management Program (unaudited)
Liquidity Risk Management Program
Rule 22e-4 under the Investment Company Act of 1940, as amended (the “Liquidity Rule”), requires open-end funds (but not money market funds) to adopt and implement a written liquidity risk management program (the “LRMP”) that is reasonably designed to assess and manage liquidity risk, which is the risk that a fund could not meet redemption requests without significant dilution of remaining investors’ interest in the fund. The Fund has implemented a LRMP, which incorporates the following elements: (i) assessment, management, and periodic review of liquidity risk; (ii) classification of portfolio holdings; (iii) the establishment and monitoring of a highly liquid investment minimum, as applicable; (iv) a 15% limitation on a Fund’s illiquid investments; (v) redemptions in-kind; and (vi) board oversight.
The Trustees of the Fund (the “Trustees”) have designated Janus Henderson Investors US LLC, the Fund’s investment adviser (the “Adviser”), as the Program Administrator for the LRMP responsible for administering the LRMP and carrying out the specific responsibilities of the LRMP. A working group comprised of various teams within the Adviser’s business is responsible for administering the LRMP and carrying out the specific responsibilities of different aspects of the LRMP (the “Liquidity Risk Working Group”). In assessing each Fund’s liquidity risk, the Liquidity Risk Working Group periodically considers, as relevant, factors including (i) the liquidity of a Fund’s portfolio investments during normal and reasonably foreseeable stressed conditions; (ii) whether a Fund’s investment strategy is appropriate for an open-end fund; (iii) the extent to which a Fund’s strategy involves a relatively concentrated portfolio or large positions in any issuer; (iv) a Fund’s use of borrowing for investment purposes; and (v) a Fund’s use of derivatives.
The Liquidity Rule requires the Trustees to review at least annually a written report provided by the Program Administrator that addresses the operation of the LRMP and assesses its adequacy and the effectiveness of its implementation, including, if applicable, the operation of the highly liquid investment minimum, and any material changes to the LRMP (the “Program Administrator Report”). At a meeting held on March 15, 2023, the Adviser provided the Program Administrator Report to the Trustees which covered the operation of the LRMP from January 1, 2022 through December 31, 2022 (the “Reporting Period”).
The Program Administrator Report discussed the operation and effectiveness of the LRMP during the Reporting Period. Among other things, the Program Administrator Report indicated that there were no material changes to the LRMP during the Reporting Period, although there were certain methodology adjustments implemented relating to a change in data provider. Additionally, the findings presented in the Program Administrator Report indicated that the LRMP operated adequately during the Reporting Period. These findings included that the Fund was able to meet redemptions during the normal course of business during the Reporting Period. The Program Administrator Report also stated that the Fund did not exceed the 15% limit on illiquid assets during the Reporting Period, that the Fund held primarily highly liquid assets, and was considered to be a primarily highly liquid fund during the Reporting Period. Also included among the Program Administrator Report’s findings was the determination that the Fund’s investment strategy remains appropriate for an open-end fund. In addition, the Adviser expressed its belief in the Program Administrator Report that the LRMP is reasonably designed and adequate to assess and manage the Fund’s liquidity risk, considering the Fund’s particular risks and circumstances, and includes policies and procedures reasonably designed to implement each required component of the Liquidity Rule.
There can be no assurance that the LRMP will achieve its objectives in the future. Please refer to your Fund’s prospectus for more information regarding the risks to which an investment in the Fund may be subject.
Janus Henderson Flexible Bond Fund
Useful Information About Your Fund Report (unaudited)
Management Commentary
The Management Commentary in this report includes valuable insight as well as statistical information to help you understand how your Fund’s performance and characteristics stack up against those of comparable indices.
If the Fund invests in foreign securities, this report may include information about country exposure. Country exposure is based primarily on the country of risk. A company may be allocated to a country based on other factors such as location of the company’s principal office, the location of the principal trading market for the company’s securities, or the country where a majority of the company’s revenues are derived.
Please keep in mind that the opinions expressed in the Management Commentary are just that: opinions. They are a reflection based on best judgment at the time this report was compiled, which was June 30, 2023. As the investing environment changes, so could opinions. These views are unique and are not necessarily shared by fellow employees or by Janus Henderson in general.
Performance Overviews
Performance overview graphs compare the performance of a hypothetical $10,000 investment in the Fund with one or more widely used market indices. When comparing the performance of the Fund with an index, keep in mind that market indices are not available for investment and do not reflect deduction of expenses.
Average annual total returns are quoted for a Fund with more than one year of performance history. Average annual total return is calculated by taking the growth or decline in value of an investment over a period of time, including reinvestment of dividends and distributions, then calculating the annual compounded percentage rate that would have produced the same result had the rate of growth been constant throughout the period. Average annual total return does not reflect the deduction of taxes that a shareholder would pay on Fund distributions or redemptions of Fund shares.
Cumulative total returns are quoted for a Fund with less than one year of performance history. Cumulative total return is the growth or decline in value of an investment over time, independent of the period of time involved. Cumulative total return does not reflect the deduction of taxes that a shareholder would pay on Fund distributions or redemptions of Fund shares.
Pursuant to federal securities rules, expense ratios shown in the performance chart reflect subsidized (if applicable) and unsubsidized ratios. The total annual fund operating expenses ratio is gross of any fee waivers, reflecting the Fund’s unsubsidized expense ratio. The net annual fund operating expenses ratio (if applicable) includes contractual waivers of the Adviser and reflects the Fund’s subsidized expense ratio. Ratios may be higher or lower than those shown in the “Financial Highlights” in this report.
Schedule of Investments
Following the performance overview section is the Fund’s Schedule of Investments. This schedule reports the types of securities held in the Fund on the last day of the reporting period. Securities are usually listed by type (common stock, corporate bonds, U.S. Government obligations, etc.) and by industry classification (banking, communications, insurance, etc.). Holdings are subject to change without notice.
The value of each security is quoted as of the last day of the reporting period. The value of securities denominated in foreign currencies is converted into U.S. dollars.
If the Fund invests in foreign securities, it will also provide a summary of investments by country. This summary reports the Fund exposure to different countries by providing the percentage of securities invested in each country. The country of each security represents the country of risk. The Fund’s Schedule of Investments relies upon the industry group and country classifications published by Bloomberg and/or MSCI Inc.
Tables listing details of individual forward currency contracts, futures, written options, swaptions, and swaps follow the Fund’s Schedule of Investments (if applicable).
Statement of Assets and Liabilities
This statement is often referred to as the “balance sheet.” It lists the assets and liabilities of the Fund on the last day of the reporting period.
Janus Henderson Flexible Bond Fund
Useful Information About Your Fund Report (unaudited)
The Fund’s assets are calculated by adding the value of the securities owned, the receivable for securities sold but not yet settled, the receivable for dividends declared but not yet received on securities owned, and the receivable for Fund shares sold to investors but not yet settled. The Fund’s liabilities include payables for securities purchased but not yet settled, Fund shares redeemed but not yet paid, and expenses owed but not yet paid. Additionally, there may be other assets and liabilities such as unrealized gain or loss on forward currency contracts.
The section entitled “Net Assets Consist of” breaks down the components of the Fund’s net assets. Because the Fund must distribute substantially all earnings, you will notice that a significant portion of net assets is shareholder capital.
The last section of this statement reports the net asset value (“NAV”) per share on the last day of the reporting period. The NAV is calculated by dividing the Fund’s net assets for each share class (assets minus liabilities) by the number of shares outstanding.
Statement of Operations
This statement details the Fund’s income, expenses, realized gains and losses on securities and currency transactions, and changes in unrealized appreciation or depreciation of Fund holdings.
The first section in this statement, entitled “Investment Income,” reports the dividends earned from securities and interest earned from interest-bearing securities in the Fund.
The next section reports the expenses incurred by the Fund, including the advisory fee paid to the investment adviser, transfer agent fees and expenses, and printing and postage for mailing statements, financial reports and prospectuses. Expense offsets and expense reimbursements, if any, are also shown.
The last section lists the amounts of realized gains or losses from investment and foreign currency transactions, and changes in unrealized appreciation or depreciation of investments and foreign currency-denominated assets and liabilities. The Fund will realize a gain (or loss) when it sells its position in a particular security. A change in unrealized gain (or loss) refers to the change in net appreciation or depreciation of the Fund during the reporting period. “Net Realized and Unrealized Gain/(Loss) on Investments” is affected both by changes in the market value of Fund holdings and by gains (or losses) realized during the reporting period.
Statements of Changes in Net Assets
These statements report the increase or decrease in the Fund’s net assets during the reporting period. Changes in the Fund’s net assets are attributable to investment operations, dividends and distributions to investors, and capital share transactions. This is important to investors because it shows exactly what caused the Fund’s net asset size to change during the period.
The first section summarizes the information from the Statement of Operations regarding changes in net assets due to the Fund’s investment operations. The Fund’s net assets may also change as a result of dividend and capital gains distributions to investors. If investors receive their dividends and/or distributions in cash, money is taken out of the Fund to pay the dividend and/or distribution. If investors reinvest their dividends and/or distributions, the Fund’s net assets will not be affected.
The reinvestment of dividends and distributions is included under “Capital Share Transactions.” “Capital Shares” refers to the money investors contribute to the Fund through purchases or withdrawals via redemptions. The Fund’s net assets will increase and decrease in value as investors purchase and redeem shares from the Fund.
Financial Highlights
This schedule provides a per-share breakdown of the components that affect the Fund’s NAV for current and past reporting periods as well as total return, asset size, ratios, and portfolio turnover rate.
The first line in the table reflects the NAV per share at the beginning of the reporting period. The next line reports the net investment income/(loss) per share. Following is the per share total of net gains/(losses), realized and unrealized. Per share dividends and distributions to investors are then subtracted to arrive at the NAV per share at the end of the period. The next line reflects the total return for the period. The total return may include adjustments in accordance with generally accepted accounting principles required at the period end for financial reporting purposes. As a result, the total return may differ from the total return reflected for individual shareholder transactions. Also included are ratios of expenses and net investment income to average net assets.
Janus Henderson Flexible Bond Fund
Useful Information About Your Fund Report (unaudited)
The Fund’s expenses may be reduced through expense offsets and expense reimbursements. The ratios shown reflect expenses before and after any such offsets and reimbursements.
The ratio of net investment income/(loss) summarizes the income earned less expenses, divided by the average net assets of the Fund during the reporting period. Do not confuse this ratio with the Fund’s yield. The net investment income ratio is not a true measure of the Fund’s yield because it does not take into account the dividends distributed to the Fund’s investors.
The next figure is the portfolio turnover rate, which measures the buying and selling activity in the Fund. Portfolio turnover is affected by market conditions, changes in the asset size of the Fund, fluctuating volume of shareholder purchase and redemption orders, the nature of the Fund’s investments, and the investment style and/or outlook of the portfolio manager(s) and/or investment personnel. A 100% rate implies that an amount equal to the value of the entire portfolio was replaced once during the fiscal year; a 50% rate means that an amount equal to the value of half the portfolio is traded in a year; and a 200% rate means that an amount equal to the value of the entire portfolio is traded every six months.
Janus Henderson Flexible Bond Fund
Designation Requirements (unaudited)
For federal income tax purposes, the Fund designated the following for the year ended June 30, 2023:
| | |
| | |
Section 163(j) Interest Dividend | 96% |
Return of Capital Distributions | $1,966,716 |
Janus Henderson Flexible Bond Fund
Trustees and Officers (unaudited)
The following are the Trustees and officers of the Trust, together with a brief description of their principal occupations during the last five years (principal occupations for certain Trustees may include periods over five years). The Fund’s Statement of Additional Information includes additional information about the Trustees and officers and is available, without charge, by calling 1-877-335-2687.
Each Trustee has served in that capacity since he or she was originally elected or appointed. The Trustees do not serve a specified term of office. Each Trustee will hold office until the termination of the Trust or his or her earlier death, resignation, retirement, incapacity, or removal. Under the Fund’s Governance Procedures and Guidelines, the policy is for Trustees to retire no later than the end of the calendar year in which the Trustee turns 75. The Trustees review the Fund’s Governance Procedures and Guidelines from time to time and may make changes they deem appropriate. The Fund’s Nominating and Governance Committee will consider nominees for the position of Trustee recommended by shareholders. Shareholders may submit the name of a candidate for consideration by the Committee by submitting their recommendations to the Trust’s Secretary. Each Trustee is currently a Trustee of one other registered investment company advised by the Adviser: Janus Aspen Series. Collectively, these two registered investment companies consist of 49 series or funds referred to herein as the Fund Complex.
The Trust’s officers are elected annually by the Trustees for a one-year term. Certain officers also serve as officers of Janus Aspen Series. Certain officers of the Fund may also be officers and/or directors of the Adviser. Except as otherwise disclosed, Fund officers receive no compensation from the Fund, except for the Fund’s Chief Compliance Officer, as authorized by the Trustees.
| | | | | | |
TRUSTEES |
Name, Address, and Age | Positions Held with the Trust | Length of Time Served | Principal Occupations During the Past Five Years | Number of Portfolios/Funds in Fund Complex Overseen by Trustee | Other Directorships Held by Trustee During the Past Five Years |
Independent Trustees | | | | |
Alan A. Brown
151 Detroit Street
Denver, CO 80206
DOB: 1962 | Chairman
Trustee | 5/22-Present
1/13-Present | Principal, Curam Holdings LLC (since 2018). Formerly, Executive Vice President, Institutional Markets, of Black Creek Group (private equity real estate investment management firm) (2012-2018), Executive Vice President and Co-Head, Global Private Client Group (2007-2010), Executive Vice President, Mutual Funds (2005-2007), and Chief Marketing Officer (2001-2005) of Nuveen Investments, Inc. (asset management). | 49 | Advisory Board Member of AEW Core Property Trust (open-end property fund) (since 2020), and Director of WTTW (PBS affiliate) (since 2003). Formerly, Director of MotiveQuest LLC (strategic social market research company) (2003-2016), Director of Nuveen Global Investors LLC (2007-2011), Director of Communities in Schools (2004-2010), and Director of Mutual Fund Education Alliance (until 2010). |
Janus Henderson Flexible Bond Fund
Trustees and Officers (unaudited)
| | | | | | |
TRUSTEES |
Name, Address, and Age | Positions Held with the Trust | Length of Time Served | Principal Occupations During the Past Five Years | Number of Portfolios/Funds in Fund Complex Overseen by Trustee | Other Directorships Held by Trustee During the Past Five Years |
Independent Trustees | | | | |
Cheryl D. Alston
151 Detroit Street
Denver, CO 80206
DOB: 1966 | Trustee | 8/22-Present | Executive Director and Chief Investment Officer, Employees’ Retirement Fund of the City of Dallas (since 2004). | 49 | Director of Blue Cross Blue Shield of Kansas City (a not-for-profit health insurance provider) (since 2016) and Director of Global Life Insurance (life and supplemental health insurance provider) (since 2017). Formerly, Director of Federal Home Loan Bank of Dallas (2017-2021). |
Janus Henderson Flexible Bond Fund
Trustees and Officers (unaudited)
| | | | | | |
TRUSTEES |
Name, Address, and Age | Positions Held with the Trust | Length of Time Served | Principal Occupations During the Past Five Years | Number of Portfolios/Funds in Fund Complex Overseen by Trustee | Other Directorships Held by Trustee During the Past Five Years |
Independent Trustees | | | | |
Janus Henderson Flexible Bond Fund
Trustees and Officers (unaudited)
| | | | | | |
William D. Cvengros
151 Detroit Street
Denver, CO 80206
DOB: 1948 | Trustee | 1/11-Present | Chief Executive Officer of SJC Capital, LLC (a personal investment company and consulting firm) (since 2002). Formerly, Chief Executive Officer and President of PIMCO Advisors Holdings L.P. (a publicly traded investment management firm) (1994-2000), and Chief Investment Officer (1987-1994) and Vice Chairman and Director (1990-1994) of Pacific Life Insurance Company (a mutual life insurance and annuity company) (1987-1994). | 49 | Member, Limited Partner Advisory Committee, Karmel Capital Fund III (later stage growth fund) (since 2022), Member of the Investment Committee for the Orange County Community Foundation (a grantmaking foundation) (since 2020), Advisory Board Member, RevOZ Fund LP and related funds (real estate investments for opportunity zones) (since 2020), and Advisory Board Member, Innovate Partners Emerging Growth and Equity Fund I (early stage venture capital fund) (since 2014). Formerly, Managing Trustee of National Retirement Partners Liquidating Trust (2013-2016), Chairman, National Retirement Partners, Inc. (formerly a network of advisors to 401(k) plans) (2005-2013), Director of Prospect Acquisition Corp. (a special purpose acquisition corporation) (2007-2009), Director of RemedyTemp, Inc. (temporary help services company) (1996-2006), and Trustee of PIMCO Funds Multi-Manager Series (1990-2000) and Pacific Life Variable Life & Annuity Trusts (1987-1994). |
Janus Henderson Flexible Bond Fund
Trustees and Officers (unaudited)
| | | | | | |
TRUSTEES |
Name, Address, and Age | Positions Held with the Trust | Length of Time Served | Principal Occupations During the Past Five Years | Number of Portfolios/Funds in Fund Complex Overseen by Trustee | Other Directorships Held by Trustee During the Past Five Years |
Independent Trustees | | | | |
Raudline Etienne
151 Detroit Street
Denver, CO 80206
DOB: 1965 | Trustee | 6/16-Present | Founder, Daraja Capital (advisory and investment firm) (since 2016). Formerly, Senior Vice President and Senior Advisor, Albright Stonebridge Group LLC (global strategy firm) (2011-2021), and Deputy Comptroller and Chief Investment Officer, New York State Common Retirement Fund (public pension fund) (2008-2011). | 49 | Member of the Investment Committee for Cooper Union (private college) (since 2021) and Director of Brightwood Capital Advisors, LLC (since 2014). Formerly, Board Member, Van Alen Institute (nonprofit architectural and design organization) (2019-2022). |
Darrell B. Jackson
151 Detroit Street
Denver, CO 80206
DOB: 1958 | Trustee | 8/22-Present | President and Chief Executive Officer, The Efficace Group Inc. (since 2018). Formerly, President and Chief Executive Officer, Seaway Bank and Trust Company (community bank) (2014-2015), and Executive Vice President and Co-President, Wealth Management (2009-2014), and several senior positions, including Group Executive, Senior Vice President, and Vice President (1995-2009) of Northern Trust Company (financial services company) (1995-2014). | 49 | Director of Amalgamated Financial Corp (bank) (since August 2021), Director of YR Media (a not-for-profit production company) (since 2021), and Director of Gray-Bowen-Scott (transportation project consulting firm) (since April 2020). Formerly, Director of Delaware Place Bank (closely held commercial bank) (2016-2018) and Director of Seaway Bank and Trust Company (2014-2015). |
Janus Henderson Flexible Bond Fund
Trustees and Officers (unaudited)
| | | | | | |
TRUSTEES |
Name, Address, and Age | Positions Held with the Trust | Length of Time Served | Principal Occupations During the Past Five Years | Number of Portfolios/Funds in Fund Complex Overseen by Trustee | Other Directorships Held by Trustee During the Past Five Years |
Independent Trustees | | | | |
William F. McCalpin
151 Detroit Street
Denver, CO 80206
DOB: 1957 | Trustee | 6/02-Present | Chief Executive Officer, muun chi LLC (organic food business) (since 2022) and Independent Consultant (since 2019). Formerly, Chief Operating Officer, muun chi LLC (2020-2022), Managing Partner, Impact Investments, Athena Capital Advisors LLC (independent registered investment advisor) (2016-2019), Managing Director, Holos Consulting LLC (provides consulting services to foundations and other nonprofit organizations) (2009-2016), Chief Executive Officer, Imprint Capital Advisors (impact investment firm) (2013-2015), and Executive Vice President and Chief Operating Officer of The Rockefeller Brothers Fund (a private family foundation) (1998-2006). | 49 | Chairman of the Board and Trustee of The Investment Fund for Foundations Investment Program (TIP) (consisting of 1 fund) (since 2008). Formerly, Director of the F.B. Heron Foundation (a private grantmaking foundation) (2006-2022), and Director of Mutual Fund Directors Forum (a non-profit organization serving independent directors of U.S. mutual funds) (2016-2021). |
Janus Henderson Flexible Bond Fund
Trustees and Officers (unaudited)
| | | | | | |
TRUSTEES |
Name, Address, and Age | Positions Held with the Trust | Length of Time Served | Principal Occupations During the Past Five Years | Number of Portfolios/Funds in Fund Complex Overseen by Trustee | Other Directorships Held by Trustee During the Past Five Years |
Independent Trustees | | | | |
Gary A. Poliner
151 Detroit Street
Denver, CO 80206
DOB: 1953 | Trustee | 6/16-Present | Retired. Formerly, President (2010-2013) of Northwestern Mutual Life Insurance Company. | 49 | Director of MGIC Investment Corporation (private mortgage insurance) (since 2013). Formerly, Director, West Bend Mutual Insurance Company (property/casualty insurance) (2013-2021), Trustee of Northwestern Mutual Life Insurance Company (2010-2013) and Director of Frank Russell Company (global asset management firm) (2008-2013). |
Diane L. Wallace
151 Detroit Street
Denver, CO 80206
DOB: 1958 | Trustee | 6/17-Present | Retired. Formerly, Chief Operating Officer, Senior Vice President-Operations, and Chief Financial Officer for Driehaus Capital Management, LLC (1988-2006) and Treasurer for Driehaus Mutual Funds (1996-2002). | 49 | Formerly, Director of Family Service of Lake County (2019-2021), Independent Trustee, Henderson Global Funds (13 portfolios) (2015-2017), Independent Trustee, State Farm Associates’ Funds Trust, State Farm Mutual Fund Trust, and State Farm Variable Product Trust (28 portfolios) (2013-2017). |
Janus Henderson Flexible Bond Fund
Trustees and Officers (unaudited)
| | | | |
OFFICERS |
Name, Address, and Age | Positions Held with the Trust | Term of Office* and Length of Time Served | Principal Occupations During the Past Five Years |
Michael Keough
151 Detroit Street
Denver, CO 80206
DOB: 1978 | Executive Vice President and Co-Portfolio Manager
Janus Henderson Flexible Bond Fund | 12/15-Present | Portfolio Manager for other Janus Henderson accounts. |
Greg Wilensky
151 Detroit Street
Denver, CO 80206
DOB: 1967 | Executive Vice President and Co-Portfolio Manager
Janus Henderson Flexible Bond Fund | 2/20-Present | Head of U.S. Fixed-Income of Janus Henderson Investors and Portfolio Manager for other Janus Henderson accounts. Formerly, Director and Lead Portfolio Manager of the U.S. Multi-Sector Fixed Income team at AllianceBernstein (2007-2019). |
Michelle Rosenberg
151 Detroit Street
Denver, CO 80206
DOB: 1973 | President and Chief Executive Officer | 9/22-Present | General Counsel and Corporate Secretary of Janus Henderson Investors (since 2018). Formerly, Interim President and Chief Executive Officer of the Trust and Janus Aspen Series (2022), Senior Vice President and Head of Legal, North America of Janus Henderson Investors (2017-2018) and Deputy General Counsel of Janus Henderson US (Holdings) Inc. (2015-2018). |
Janus Henderson Flexible Bond Fund
Trustees and Officers (unaudited)
| | | | |
OFFICERS |
Name, Address, and Age | Positions Held with the Trust | Term of Office* and Length of Time Served | Principal Occupations During the Past Five Years |
Kristin Mariani
151 Detroit Street
Denver, CO 80206
DOB: 1966 | Vice President and Chief Compliance Officer | 7/20-Present | Head of Compliance, North America at Janus Henderson Investors (since September 2020) and Chief Compliance Officer at Janus Henderson Investors US LLC (since September 2017). Formerly, Anti-Money Laundering Officer for the Trust and Janus Aspen Series (July 2020-December 2022), Global Head of Investment Management Compliance at Janus Henderson Investors (February 2019-August 2020), Vice President, Head of Global Distribution Compliance and Chief Compliance Officer at Janus Henderson Distributors US LLC (May 2017-September 2017), Vice President, Compliance at Janus Henderson US (Holdings) Inc., Janus Henderson Investors US LLC, and Janus Henderson Distributors US LLC (2009-2017). |
Jesper Nergaard
151 Detroit Street
Denver, CO 80206
DOB: 1962 | Chief Financial Officer
Vice President, Treasurer, and Principal Accounting Officer | 3/05-Present
2/05-Present | Head of U.S. Fund Administration, Janus Henderson Investors and Janus Henderson Services US LLC. |
Abigail J. Murray
151 Detroit Street
Denver, CO 80206
DOB: 1975 | Vice President, Chief Legal Counsel, and Secretary | 12/20-Present | Managing Counsel (since 2020). Formerly, Senior Counsel for Invesco Ltd. (2017-2020), and Vice President and Senior Counsel, ALPS Fund Services, Inc. and Assistant General Counsel, ALPS Advisors, Inc. (2015-2017). |
Ciaran Askin
151 Detroit Street
Denver, CO 80206
DOB: 1978 | Anti-Money Laundering Officer | 12/22-Present | Global Head of Financial Crime, Janus Henderson Investors (since 2022). Formerly, Global Head of Financial Crime for Invesco Ltd. (2017-2022). |
* Officers are elected at least annually by the Trustees for a one-year term and may also be elected from time to time by the Trustees for an interim period. |
Janus Henderson Flexible Bond Fund
Notes
NotesPage1
| | | | | | | | |
| | | | | |

| | | | |
This report is submitted for the general information of shareholders of the Fund. It is not an offer or solicitation for the Fund and is not authorized for distribution to prospective investors unless preceded or accompanied by an effective prospectus. |
Janus Henderson is a trademark of Janus Henderson Group plc or one of its subsidiaries. © Janus Henderson Group plc Janus Henderson Distributors US LLC Janus Henderson Group is the ultimate parent of Janus Henderson Distributors US LLC |
| | | | 125-02-93019 08-23 |
| | | |
| | | |
| | | ANNUAL REPORT June 30, 2023 |
| | |
| | Janus Henderson Global Allocation Fund – Conservative |
| | |
| | Janus Investment Fund |
| |
| | | |
| | | HIGHLIGHTS · Portfolio management perspective · Investment strategy behind your fund · Fund performance, characteristics
and holdings |
Table of Contents
Janus Henderson Global Allocation Fund - Conservative
Janus Henderson Global Allocation Fund - Conservative (unaudited)
| | | | | | |
| | | | | 
Ashwin Alankar portfolio manager |
| | | |
PERFORMANCE OVERVIEW
For the 12-month period ended June 30, 2023, the Janus Henderson Global Allocation Fund – Conservative’s Class I shares returned 4.80%. This compares with a return of -1.32% for the Bloomberg Global Aggregate Bond Index, the Fund’s primary benchmark, and a return of 5.67% for its secondary benchmark, the Global Conservative Allocation Index, an internally calculated, hypothetical combination of total returns from the Bloomberg Global Aggregate Bond Index (60%) and the MSCI All Country World IndexSM (40%).
MARKET ENVIRONMENT
Despite early-period volatility, global equities generated positive returns over the period as investors gained greater confidence that inflation was being brought under control and that a pronounced recession could be avoided. Global bonds, however, came under substantial pressure, with positive corporate returns more than offset by negative returns in U.S. Treasuries and sovereigns. Global rates rose as central banks continued to battle inflation. The U.S. economy remained resilient, especially compared to developed market peers. Inflation remained elevated in the UK, and the euro area officially entered a recession.
PERFORMANCE DISCUSSION
The Janus Henderson Global Allocation Fund – Conservative invests across a broad set of Janus Henderson funds that span a wide range of global asset categories with a base allocation of 30% to 50% equities, 50% to 65% fixed income and 0% to 20% alternative investments (to the extent these investments are available) that are monitored and rebalanced periodically. Janus Henderson Global Allocation Fund – Conservative is structured as a “fund of funds” portfolio that seeks to provide investors with broad, diversified exposure to various types of investments with an emphasis on managing investment risk.
The steep rise in interest rates during the period resulted in the Fund’s exposure to bonds being the primary driver of underperformance relative its secondary benchmark. Both the Janus Henderson Global Bond Fund and the Janus Henderson Flexible Bond Fund were among the leading individual detractors. Given the period’s rally in equities, the Fund’s stock positioning contributed to results. The Janus Henderson Overseas Fund was among the leading contributors, followed by the Janus Henderson Adaptive Risk-Managed U.S. Equity Fund.
OUTLOOK
Disagreement makes markets. When disagreement evolves into agreement, risk premiums re-price and a transition in the volatility regime can occur. It is worth identifying the epicenter of disagreements and contradictory data to better understand the root cause of market incongruencies. Today, the epicenter of disagreement is between low equity volatility – levels not seen since the pandemic – and consensus expectations for elevated recession risk.
Is low volatility masking recession dangers or is it telling us that the likelihood of economic contraction is low? Based on data we have analyzed from both the risks priced by the option market and consumer data, we believe it is the latter. Options are pricing in greater upside skew to equities, with expected tail gains – or the chance for gains that exceed what is priced in under a broad distribution of expected returns – greater than expected tail losses. This is true for both developed-market equities and also emerging markets and small caps. At the same time, equity downside risk, or expected tail losses, are well below average levels. We see similar attractiveness in fixed income, with short maturity treasuries slightly more
Janus Henderson Global Allocation Fund - Conservative (unaudited)
attractive than longer maturity notes. This suggests that inflation risks may be managed without leading to a deep recession.
Recession is very unlikely when the consumer is strong, and earnings estimates for consumer-focused companies as well as forecasts for consumer loan impairments indicate a healthy consumer.
The risk to this optimistic view is policy error. Historically monetary policy has been fraught with error. One risk is keeping the economy awash with cheap money for too long and, thus, fueling inflation, and the other is inconsistent responses on the part of central banks to rising prices.
The Federal Reserve (Fed) has reached a crucial point in its battle against inflation. The cost of money is once again expensive. The question now is whether Fed Chairman Jerome Powell will finish the job by keeping money expensive, or will he balk? Thus far, Mr. Powell has made it clear that he does not consider his job done.
Resilient consumer and other macro should portend that moderately expensive money over the medium term won’t derail the economy or the prospects for riskier assets. A Fed that stays the course will more likely fuel a right tail – or upside surprise – in capital markets while a premature dovish pivot would more likely fuel a left tail event.
The path of economic growth relies heavily on the Fed not committing a policy error and, therefore, uncertainly remains elevated.
Thank you for investing in the Janus Henderson Global Allocation Fund – Conservative.
Any risk management process discussed includes an effort to monitor and manage risk which should not be confused with and does not imply low risk or the ability to control certain risk factors.
Important Notice – Tailored Shareholder Reports
Effective January 24, 2023, the Securities and Exchange Commission (the “SEC”) adopted rule and form amendments that require mutual funds and exchange-traded funds to provide shareholders with streamlined annual and semi-annual shareholder reports that highlight key information. Other information, including financial statements, that currently appears in shareholder reports will be made available online, delivered free of charge to shareholders upon request, and filed with the SEC. The first tailored shareholder report for the Fund will be for the reporting period ending June 30, 2024. Currently, management is evaluating the impact of the rule and form amendments on the content of the Fund’s current shareholder reports.
Janus Henderson Global Allocation Fund - Conservative (unaudited)
Fund At A Glance
June 30, 2023
| | | | |
Holdings - (% of Net Assets) | | | |
Janus Henderson Global Bond Fund - Class N Shares | | 36.8 | % |
Janus Henderson Flexible Bond Fund - Class N Shares | | 14.3 | |
Janus Henderson Adaptive Global Allocation Fund - Class N Shares | | 5.6 | |
Janus Henderson Overseas Fund - Class N Shares | | 4.9 | |
Janus Henderson Short Duration Flexible Bond Fund - Class N Shares | | 4.5 | |
Janus Henderson Emerging Markets Fund - Class N Shares | | 3.8 | |
Janus Henderson Adaptive Risk Managed U.S. Equity Fund - Class N Shares | | 3.8 | |
Janus Henderson Global Select Fund - Class N Shares | | 2.5 | |
Janus Henderson Small-Mid Cap Value Fund - Class N Shares | | 2.4 | |
Janus Henderson Contrarian Fund - Class N Shares | | 2.4 | |
Janus Henderson AAA CLO | | 2.4 | |
Janus Henderson U.S. Dividend Income Fund - Class N Shares | | 2.2 | |
Janus Henderson Forty Fund - Class N Shares | | 1.8 | |
Janus Henderson Enterprise Fund - Class N Shares | | 1.7 | |
Janus Henderson Global Equity Income Fund - Class N Shares | | 1.6 | |
Janus Henderson Growth and Income Fund - Class N Shares | | 1.5 | |
Janus Henderson Global Real Estate Fund - Class N Shares | | 1.5 | |
Janus Henderson Asia Equity Fund - Class N Shares | | 1.4 | |
Janus Henderson Triton Fund - Class N Shares | | 1.3 | |
Janus Henderson Global Research Fund - Class N Shares | | 1.2 | |
Janus Henderson European Focus Fund - Class N Shares | | 1.0 | |
Janus Henderson High-Yield Fund - Class N Shares | | 0.8 | |
Janus Henderson Multi-Sector Income Fund - Class N Shares | | 0.5 | |
Janus Henderson Cash Liquidity Fund LLC | | 0.1 | |
| | | | | | |
Asset Allocation - (% of Net Assets) | |
Fixed Income Funds | | 56.9% | |
Equity Funds | | 40.6% | |
Exchange-Traded Funds (ETFs) | | 2.4% | |
Money Markets | | 0.1% | |
Other | | (0.0)% |
| | | 100.0% |
Janus Henderson Global Allocation Fund - Conservative (unaudited)
Performance
| |
See important disclosures on the next page. |

| | | | | | | | | | |
| | | | | | | | |
| | | | | | | | | |
Average Annual Total Return - for the periods ended June 30, 2023 | | | Prospectus Expense Ratios |
| | One
Year | Five
Year | Ten
Year | Since
Inception* | | | Total Annual Fund
Operating Expenses‡ |
Class A Shares at NAV | | 4.54% | 1.83% | 3.23% | 4.57% | | | 1.11% |
Class A Shares at MOP | | -1.46% | 0.63% | 2.62% | 4.22% | | | |
Class C Shares at NAV | | 3.88% | 1.14% | 2.59% | 3.87% | | | 1.86% |
Class C Shares at CDSC | | 2.88% | 1.14% | 2.59% | 3.87% | | | |
Class D Shares | | 4.78% | 2.05% | 3.44% | 4.78% | | | 0.91% |
Class I Shares | | 4.80% | 2.09% | 3.49% | 4.83% | | | 0.88% |
Class S Shares | | 4.36% | 1.66% | 3.05% | 4.37% | | | 1.29% |
Class T Shares | | 4.76% | 1.95% | 3.36% | 4.73% | | | 1.03% |
Bloomberg Global Aggregate Bond Index | | -1.32% | -1.09% | 0.20% | 2.25% | | | |
Global Conservative Allocation Index | | 5.67% | 2.78% | 3.74% | 4.29% | | | |
Morningstar Quartile - Class T Shares | | 3rd | 4th | 3rd | 3rd | | | |
Morningstar Ranking - based on total returns for World Allocation Funds | | 314/393 | 330/383 | 269/332 | 127/210 | | | |
Returns quoted are past performance and do not guarantee future results; current performance may be lower or higher. Investment returns and principal value will vary; there may be a gain or loss when shares are sold. For the most recent month-end performance call 800.668.0434 (or 800.525.3713 if you hold shares directly with Janus Henderson) or visit janushenderson.com/performance (or janushenderson.com/allfunds if you hold shares directly with Janus Henderson).
Maximum Offering Price (MOP) returns include the maximum sales charge of 5.75%. Net Asset Value (NAV) returns exclude this charge, which would have reduced returns.
CDSC returns include a 1% contingent deferred sales charge (CDSC) on Shares redeemed within 12 months of purchase. Net Asset Value (NAV) returns exclude this charge, which would have reduced returns.
For certain periods, the Fund’s performance may reflect the effects of expense waivers.
Janus Henderson Global Allocation Fund - Conservative (unaudited)
Performance
Performance may be affected by risks that include those associated with foreign and emerging markets, fixed income securities, high-yield and high-risk securities, undervalued, overlooked and smaller capitalization companies, real estate related securities including Real Estate Investment Trusts (REITs), Environmental, Social and Governance (ESG) factors, non-diversification, portfolio turnover, derivatives, short sales, initial public offerings (IPOs) and potential conflicts of interest. Each product has different risks. Please see the prospectus for more information about risks, holdings and other details.
Performance of the Global Allocation Funds depends on that of the underlying funds. They are subject to the volatility of the financial markets. Because Janus Henderson Investors US LLC is the adviser to the Fund and to the underlying affiliated funds held within the Fund, it is subject to certain potential conflicts of interest.
Returns include reinvestment of all dividends and distributions and do not reflect the deduction of taxes that a shareholder would pay on Fund distributions or redemptions of Fund shares. The returns do not include adjustments in accordance with generally accepted accounting principles required at the period end for financial reporting purposes.
Class A Shares, Class C Shares, Class I Shares, and Class S Shares commenced operations on July 6, 2009. Performance shown for each class for periods prior to July 6, 2009, reflects the performance of the Fund’s Class J Shares, the initial share class (renamed Class T Shares effective February 16, 2010), calculated using the fees and expenses of each respective share class, without the effect of any fee and expense limitations or waivers.
Class D Shares commenced operations on February 16, 2010. Performance shown for periods prior to February 16, 2010, reflects the performance of the Fund’s former Class J Shares, calculated using the fees and expenses in effect during the periods shown, net of any applicable fee and expense limitations or waivers.
If each share class of the Fund had been available during periods prior to its commencement, the performance shown may have been different. The performance shown for periods following the Fund’s commencement of each share class reflects the fees and expenses of each respective share class, net of any applicable fee and expense limitations or waivers. Please refer to the Fund’s prospectuses for further details concerning historical performance.
Ranking is for the share class shown only; other classes may have different performance characteristics. When an expense waiver is in effect, it may have a material effect on the total return, and therefore the ranking for the period.
© 2023 Morningstar, Inc. All Rights Reserved.
There is no assurance that the investment process will consistently lead to successful investing.
See Notes to Schedule of Investments and Other Information for index definitions.
Index performance does not reflect the expenses of managing a portfolio as an index is unmanaged and not available for direct investment.
See “Useful Information About Your Fund Report.”
*The Fund’s inception date – December 30, 2005
‡ As stated in the prospectus. See Financial Highlights for actual expense ratios during the reporting period.
Janus Henderson Global Allocation Fund - Conservative (unaudited)
Expense Examples
As a shareholder of the Fund, you incur two types of costs: (1) transaction costs, such as sales charges (loads) on purchase payments (applicable to Class A Shares only); and (2) ongoing costs, including management fees; 12b-1 distribution and shareholder servicing fees; transfer agent fees and expenses payable pursuant to the Transfer Agency Agreement; and other Fund expenses. This example is intended to help you understand your ongoing costs (in dollars) of investing in the Fund and to compare these costs with the ongoing costs of investing in other mutual funds. To do so, compare this 5% hypothetical example with the 5% hypothetical examples that appear in the shareholder reports of the other funds. The example is based upon an investment of $1,000 invested at the beginning of the period and held for the six-months indicated, unless noted otherwise in the table and footnotes below.
Actual Expenses
The information in the table under the heading “Actual” provides information about actual account values and actual expenses. You may use the information in these columns, together with the amount you invested, to estimate the expenses that you paid over the period. Simply divide your account value by $1,000 (for example, an $8,600 account value divided by $1,000 = 8.6), then multiply the result by the number in the appropriate column for your share class under the heading entitled “Expenses Paid During Period” to estimate the expenses you paid on your account during the period.
Hypothetical Example for Comparison Purposes
The information in the table under the heading “Hypothetical (5% return before expenses)” provides information about hypothetical account values and hypothetical expenses based upon the Fund’s actual expense ratio and an assumed rate of return of 5% per year before expenses, which is not the Fund’s actual return. The hypothetical account values and expenses may not be used to estimate the actual ending account balance or expenses you paid for the period. You may use this information to compare the ongoing costs of investing in the Fund and other funds. To do so, compare this 5% hypothetical example with the 5% hypothetical examples that appear in the shareholder reports of the other funds. Additionally, for an analysis of the fees associated with an investment in any share class or other similar funds, please visit www.finra.org/fundanalyzer.
Please note that the expenses shown in the table are meant to highlight your ongoing costs only and do not reflect any transaction costs. These fees are fully described in the Fund’s prospectuses. Therefore, the hypothetical examples are useful in comparing ongoing costs only, and will not help you determine the relative total costs of owning different funds. In addition, if these transaction costs were included, your costs would have been higher.
| | | | | | | | | | | |
| | | | | | | | |
| | | Actual | | Hypothetical
(5% return before expenses) | |
| Beginning
Account
Value
(1/1/23) | Ending
Account
Value
(6/30/23) | Expenses
Paid During
Period
(1/1/23 - 6/30/23)† | | Beginning
Account
Value
(1/1/23) | Ending
Account
Value
(6/30/23) | Expenses
Paid During
Period
(1/1/23 - 6/30/23)† | Net Annualized
Expense Ratio
(1/1/23 - 6/30/23)†† |
Class A Shares | $1,000.00 | $1,046.60 | $2.44 | | $1,000.00 | $1,022.41 | $2.41 | 0.48% |
Class C Shares | $1,000.00 | $1,043.80 | $6.03 | | $1,000.00 | $1,018.89 | $5.96 | 1.19% |
Class D Shares | $1,000.00 | $1,047.30 | $1.37 | | $1,000.00 | $1,023.46 | $1.35 | 0.27% |
Class I Shares | $1,000.00 | $1,048.40 | $1.37 | | $1,000.00 | $1,023.46 | $1.35 | 0.27% |
Class S Shares | $1,000.00 | $1,046.60 | $3.35 | | $1,000.00 | $1,021.52 | $3.31 | 0.66% |
Class T Shares | $1,000.00 | $1,047.40 | $1.73 | | $1,000.00 | $1,023.11 | $1.71 | 0.34% |
† | Expenses Paid During Period are equal to the Net Annualized Expense Ratio multiplied by the average account value over the period, multiplied by 181/365 (to reflect the one-half year period). Expenses in the examples include the effect of applicable fee waivers and/or expense reimbursements, if any. Had such waivers and/or reimbursements not been in effect, your expenses would have been higher. Please refer to the Notes to Financial Statements or the Fund’s prospectuses for more information regarding waivers and/or reimbursements. |
†† | Ratios do not include indirect expenses of the underlying funds and/or investment companies in which the Fund invests. |
Janus Henderson Global Allocation Fund - Conservative
Schedule of Investments
June 30, 2023
| | | | | | | | |
Shares
| | | Value | |
Investment Companies£– 100.0% | | | |
Equity Funds – 40.6% | | | |
| | Janus Henderson Adaptive Global Allocation Fund - Class N Shares | | 830,345 | | | $8,294,827 | |
| | Janus Henderson Adaptive Risk Managed U.S. Equity Fund - Class N Shares | | 565,786 | | | 5,555,857 | |
| | Janus Henderson Asia Equity Fund - Class N Shares* | | 207,356 | | | 2,039,935 | |
| | Janus Henderson Contrarian Fund - Class N Shares | | 133,055 | | | 3,523,700 | |
| | Janus Henderson Emerging Markets Fund - Class N Shares* | | 634,914 | | | 5,623,910 | |
| | Janus Henderson Enterprise Fund - Class N Shares | | 18,808 | | | 2,580,433 | |
| | Janus Henderson European Focus Fund - Class N Shares | | 36,184 | | | 1,515,164 | |
| | Janus Henderson Forty Fund - Class N Shares | | 55,029 | | | 2,649,937 | |
| | Janus Henderson Global Equity Income Fund - Class N Shares | | 394,690 | | | 2,379,944 | |
| | Janus Henderson Global Real Estate Fund - Class N Shares | | 193,973 | | | 2,178,313 | |
| | Janus Henderson Global Research Fund - Class N Shares | | 19,049 | | | 1,751,768 | |
| | Janus Henderson Global Select Fund - Class N Shares | | 216,131 | | | 3,667,946 | |
| | Janus Henderson Growth and Income Fund - Class N Shares | | 32,747 | | | 2,295,680 | |
| | Janus Henderson Overseas Fund - Class N Shares | | 169,359 | | | 7,214,737 | |
| | Janus Henderson Small-Mid Cap Value Fund - Class N Shares | | 261,046 | | | 3,537,057 | |
| | Janus Henderson Triton Fund - Class N Shares | | 69,447 | | | 1,907,549 | |
| | Janus Henderson U.S. Dividend Income Fund - Class N Shares | | 322,671 | | | 3,300,923 | |
| | | 60,017,680 | |
Exchange-Traded Funds (ETFs) – 2.4% | | | |
| | Janus Henderson AAA CLO | | 70,166 | | | 3,497,775 | |
Fixed Income Funds – 56.9% | | | |
| | Janus Henderson Flexible Bond Fund - Class N Shares | | 2,267,924 | | | 21,068,546 | |
| | Janus Henderson Global Bond Fund - Class N Shares | | 7,044,017 | | | 54,378,698 | |
| | Janus Henderson High-Yield Fund - Class N Shares | | 170,787 | | | 1,204,049 | |
| | Janus Henderson Multi-Sector Income Fund - Class N Shares | | 88,239 | | | 744,737 | |
| | Janus Henderson Short Duration Flexible Bond Fund - Class N Shares | | 2,366,349 | | | 6,602,049 | |
| | | 83,998,079 | |
Money Markets – 0.1% | | | |
| | Janus Henderson Cash Liquidity Fund LLC, 5.1900%ºº | | 213,769 | | | 213,812 | |
Total Investments (total cost $152,701,823) – 100.0% | | 147,727,346 | |
Liabilities, net of Cash, Receivables and Other Assets – (0)% | | (72,134) | |
Net Assets – 100% | | $147,655,212 | |
| | |
See Notes to Schedule of Investments and Other Information and Notes to Financial Statements. |
| |
Janus Investment Fund | 7 |
Janus Henderson Global Allocation Fund - Conservative
Schedule of Investments
June 30, 2023
Schedules of Affiliated Investments – (% of Net Assets)
| | | | | | | | | | | | |
| | Dividend Income | Realized Gain/(Loss) | Capital Gain Distributions from Underlying Funds | Change in Unrealized Appreciation/ Depreciation | Value at 6/30/23 |
Investment Companies - 100.0% |
Equity Funds - 40.6% |
| | Janus Henderson Adaptive Global Allocation Fund - Class N Shares | $ | 101,352 | $ | (137,083) | $ | - | $ | 754,602 | $ | 8,294,827 |
| | Janus Henderson Adaptive Risk Managed U.S. Equity Fund - Class N Shares | | 131,326 | | (292,653) | | 41,594 | | 939,237 | | 5,555,857 |
| | Janus Henderson Asia Equity Fund - Class N Shares* | | - | | (163,197) | | - | | 73,468 | | 2,039,935 |
| | Janus Henderson Contrarian Fund - Class N Shares | | 30,804 | | (186,443) | | - | | 845,139 | | 3,523,700 |
| | Janus Henderson Emerging Markets Fund - Class N Shares* | | - | | (377,776) | | - | | 351,568 | | 5,623,910 |
| | Janus Henderson Enterprise Fund - Class N Shares | | - | | (506,421) | | 280,497 | | 834,419 | | 2,580,433 |
| | Janus Henderson European Focus Fund - Class N Shares | | 93,555 | | 191,162 | | - | | 285,361 | | 1,515,164 |
| | Janus Henderson Forty Fund - Class N Shares | | - | | 71,623 | | 1,653 | | 616,835 | | 2,649,937 |
| | Janus Henderson Global Equity Income Fund - Class N Shares | | 283,515 | | (147,293) | | - | | 258,696 | | 2,379,944 |
| | Janus Henderson Global Real Estate Fund - Class N Shares | | 44,992 | | (80,084) | | - | | (44,274) | | 2,178,313 |
| | Janus Henderson Global Research Fund - Class N Shares | | 28,049 | | (40,472) | | 83,321 | | 375,981 | | 1,751,768 |
| | Janus Henderson Global Select Fund - Class N Shares | | 57,936 | | 434,545 | | 92,097 | | (6,365) | | 3,667,946 |
| | Janus Henderson Growth and Income Fund - Class N Shares | | 39,069 | | (33,564) | | 168,568 | | 223,257 | | 2,295,680 |
| | Janus Henderson Overseas Fund - Class N Shares | | 151,510 | | 130,762 | | - | | 904,589 | | 7,214,737 |
| | Janus Henderson Small-Mid Cap Value Fund - Class N Shares | | 16,864 | | (170,756) | | - | | 860,534 | | 3,537,057 |
| | Janus Henderson Triton Fund - Class N Shares | | - | | (958,569) | | 151,723 | | 1,160,719 | | 1,907,549 |
| | Janus Henderson U.S. Dividend Income Fund - Class N Shares | | 11,840 | | (248) | | - | | 64,350 | | 3,300,923 |
Total Equity Funds | $ | 990,812 | $ | (2,266,467) | $ | 819,453 | $ | 8,498,116 | $ | 60,017,680 |
Exchange-Traded Funds (ETFs) - 2.4% |
| | Janus Henderson AAA CLO | | 228,155 | | 10,817 | | - | | 37,083 | | 3,497,775 |
Fixed Income Funds - 56.9% |
| | Janus Henderson Flexible Bond Fund - Class N Shares | | 387,360 | | (53,428) | | - | | (632,022) | | 21,068,546 |
| | Janus Henderson Global Bond Fund - Class N Shares | | 290,259 | | (972,796) | | - | | (760,275) | | 54,378,698 |
| | Janus Henderson High-Yield Fund - Class N Shares | | 585,935 | | (2,876,339) | | - | | 2,897,327 | | 1,204,049 |
| | Janus Henderson Multi-Sector Income Fund - Class N Shares | | 92,476 | | 46,040 | | - | | 8,070 | | 744,737 |
| | Janus Henderson Short Duration Flexible Bond Fund - Class N Shares | | 217,790 | | (462,522) | | - | | 229,550 | | 6,602,049 |
Total Fixed Income Funds | $ | 1,573,820 | $ | (4,319,045) | $ | - | $ | 1,742,650 | $ | 83,998,079 |
Money Markets - 0.1% |
| | Janus Henderson Cash Liquidity Fund LLC, 5.1900%ºº | | 3,626 | | 5 | | - | | - | | 213,812 |
Total Affiliated Investments - 100.0% | $ | 2,796,413 | $ | (6,574,690) | $ | 819,453 | $ | 10,277,849 | $ | 147,727,346 |
| | |
See Notes to Schedule of Investments and Other Information and Notes to Financial Statements. |
| |
8 | JUNE 30, 2023 |
Janus Henderson Global Allocation Fund - Conservative
Schedule of Investments
June 30, 2023
| | | | | | | | | | | |
| | Value at 6/30/22 | Purchases | Sales Proceeds | Value at 6/30/23 |
Investment Companies - 100.0% |
Equity Funds - 40.6% | |
| | Janus Henderson Adaptive Global Allocation Fund - Class N Shares | | 8,662,926 | | 296,057 | | (1,281,675) | | 8,294,827 |
| | Janus Henderson Adaptive Risk Managed U.S. Equity Fund - Class N Shares | | 6,407,255 | | 324,254 | | (1,822,236) | | 5,555,857 |
| | Janus Henderson Asia Equity Fund - Class N Shares* | | 2,594,833 | | 53,553 | | (518,722) | | 2,039,935 |
| | Janus Henderson Contrarian Fund - Class N Shares | | 5,482,392 | | 147,037 | | (2,764,425) | | 3,523,700 |
| | Janus Henderson Emerging Markets Fund - Class N Shares* | | 6,795,688 | | 145,466 | | (1,291,036) | | 5,623,910 |
| | Janus Henderson Enterprise Fund - Class N Shares | | 4,888,687 | | 366,068 | | (3,002,320) | | 2,580,433 |
| | Janus Henderson European Focus Fund - Class N Shares | | 2,297,986 | | 1,290,915 | | (2,550,260) | | 1,515,164 |
| | Janus Henderson Forty Fund - Class N Shares | | 2,346,302 | | 856,843 | | (1,241,666) | | 2,649,937 |
| | Janus Henderson Global Equity Income Fund - Class N Shares | | 4,453,555 | | 376,842 | | (2,561,856) | | 2,379,944 |
| | Janus Henderson Global Real Estate Fund - Class N Shares | | 1,903,276 | | 863,552 | | (464,157) | | 2,178,313 |
| | Janus Henderson Global Research Fund - Class N Shares | | 2,450,154 | | 246,877 | | (1,280,772) | | 1,751,768 |
| | Janus Henderson Global Select Fund - Class N Shares | | 3,158,216 | | 2,292,470 | | (2,210,920) | | 3,667,946 |
| | Janus Henderson Growth and Income Fund - Class N Shares | | 2,037,272 | | 1,599,170 | | (1,530,455) | | 2,295,680 |
| | Janus Henderson Overseas Fund - Class N Shares | | 4,463,814 | | 4,535,687 | | (2,820,115) | | 7,214,737 |
| | Janus Henderson Small-Mid Cap Value Fund - Class N Shares | | 4,561,241 | | 1,100,988 | | (2,814,950) | | 3,537,057 |
| | Janus Henderson Triton Fund - Class N Shares | | 4,307,864 | | 226,073 | | (2,828,538) | | 1,907,549 |
| | Janus Henderson U.S. Dividend Income Fund - Class N Shares | | - | | 3,296,850 | | (60,029) | | 3,300,923 |
Exchange-Traded Funds (ETFs) - 2.4% | |
| | Janus Henderson AAA CLO | | - | | 8,013,807 | | (4,563,932) | | 3,497,775 |
Fixed Income Funds - 56.9% | |
| | Janus Henderson Flexible Bond Fund - Class N Shares | | 8,964,028 | | 14,239,497 | | (1,449,529) | | 21,068,546 |
| | Janus Henderson Global Bond Fund - Class N Shares | | 53,237,204 | | 10,842,635 | | (7,968,070) | | 54,378,698 |
| | Janus Henderson High-Yield Fund - Class N Shares | | 14,231,126 | | 806,507 | | (13,854,572) | | 1,204,049 |
| | Janus Henderson Multi-Sector Income Fund - Class N Shares | | - | | 3,166,559 | | (2,475,932) | | 744,737 |
| | Janus Henderson Short Duration Flexible Bond Fund - Class N Shares | | 14,747,967 | | 5,023,944 | | (12,936,890) | | 6,602,049 |
Money Markets - 0.1% | |
| | Janus Henderson Cash Liquidity Fund LLC, 5.1900%ºº | | - | | 1,145,824 | | (932,017) | | 213,812 |
| | |
See Notes to Schedule of Investments and Other Information and Notes to Financial Statements. |
| |
Janus Investment Fund | 9 |
Janus Henderson Global Allocation Fund - Conservative
Notes to Schedule of Investments and Other Information
| | |
Bloomberg Global Aggregate Bond Index | Bloomberg Global Aggregate Bond Index is a broad-based measure of the global investment grade fixed-rate debt markets. |
Global Conservative Allocation Index | Global Conservative Allocation Index is an internally-calculated, hypothetical combination of total returns from the Bloomberg Global Aggregate Bond Index (60%) and the MSCI All Country World IndexSM (40%). |
MSCI All Country World IndexSM | MSCI All Country World IndexSM reflects the equity market performance of global developed and emerging markets. |
| | |
LLC | Limited Liability Company |
| | |
* | Non-income producing security. |
| | |
ºº | Rate shown is the 7-day yield as of June 30, 2023. |
| | |
£ | The Fund may invest in certain securities that are considered affiliated companies. As defined by the Investment Company Act of 1940, as amended, an affiliated company is one in which the Fund owns 5% or more of the outstanding voting securities, or a company which is under common ownership or control. |
| | | | | | | | | | | | | |
The following is a summary of the inputs that were used to value the Fund’s investments in securities and other financial instruments as of June 30, 2023. See Notes to Financial Statements for more information. |
| |
Valuation Inputs Summary |
| | | | | | | |
| | | | | Level 2 - | | Level 3 - |
| | | Level 1 - | | Other Significant | | Significant |
| | | Quoted Prices | | Observable Inputs | | Unobservable Inputs |
| | | | | | | |
Assets | | | | | | |
Investments In Securities: | | | | | | |
Investment Companies | | | | | | |
Equity Funds | $ | 60,017,680 | $ | - | $ | - |
Exchange-Traded Funds (ETFs) | | 3,497,775 | | - | | - |
Fixed Income Funds | | 83,998,079 | | - | | - |
Money Markets | | - | | 213,812 | | - |
Total Assets | $ | 147,513,534 | $ | 213,812 | $ | - |
| | | | | | | |
Janus Henderson Global Allocation Fund - Conservative
Statement of Assets and Liabilities
June 30, 2023
| |
See footnotes at the end of the Statement. |
| | | | | | | |
| | | | | | |
Assets: | | | | |
| Affiliated investments, at value (cost $152,701,823) | | $ | 147,727,346 | |
| Trustees' deferred compensation | | | 3,753 | |
| Receivables: | | | | |
| | Dividends | | | 330,104 | |
| | Investments sold | | | 102,372 | |
| | Fund shares sold | | | 82,190 | |
| | Due from adviser | | | 11,112 | |
| | Dividends from affiliates | | | 952 | |
| Other assets | | | 196 | |
Total Assets | | | 148,258,025 | |
Liabilities: | | | | |
| Payables: | | | — | |
| | Investments purchased | | | 330,104 | |
| | Fund shares repurchased | | | 170,056 | |
| | Professional fees | | | 43,776 | |
| | Transfer agent fees and expenses | | | 19,824 | |
| | Advisory fees | | | 6,476 | |
| | 12b-1 Distribution and shareholder servicing fees | | | 4,520 | |
| | Trustees' deferred compensation fees | | | 3,753 | |
| | Custodian fees | | | 1,380 | |
| | Trustees' fees and expenses | | | 928 | |
| | Accrued expenses and other payables | | | 21,996 | |
Total Liabilities | | | 602,813 | |
Net Assets | | $ | 147,655,212 | |
| | |
See Notes to Financial Statements. |
| |
Janus Investment Fund | 11 |
Janus Henderson Global Allocation Fund - Conservative
Statement of Assets and Liabilities
June 30, 2023
| | | | | | | |
| | | | | | |
| | | | | | | |
Net Assets Consist of: | | | | |
| Capital (par value and paid-in surplus) | | $ | 158,192,585 | |
| Total distributable earnings (loss) | | | (10,537,373) | |
Total Net Assets | | $ | 147,655,212 | |
Net Assets - Class A Shares | | $ | 6,511,429 | |
| Shares Outstanding, $0.01 Par Value (unlimited shares authorized) | | | 604,353 | |
Net Asset Value Per Share(1) | | $ | 10.77 | |
Maximum Offering Price Per Share(2) | | $ | 11.43 | |
Net Assets - Class C Shares | | $ | 3,461,375 | |
| Shares Outstanding, $0.01 Par Value (unlimited shares authorized) | | | 330,111 | |
Net Asset Value Per Share(1) | | $ | 10.49 | |
Net Assets - Class D Shares | | $ | 125,119,024 | |
| Shares Outstanding, $0.01 Par Value (unlimited shares authorized) | | | 11,542,847 | |
Net Asset Value Per Share | | $ | 10.84 | |
Net Assets - Class I Shares | | $ | 1,842,408 | |
| Shares Outstanding, $0.01 Par Value (unlimited shares authorized) | | | 169,981 | |
Net Asset Value Per Share | | $ | 10.84 | |
Net Assets - Class S Shares | | $ | 55,188 | |
| Shares Outstanding, $0.01 Par Value (unlimited shares authorized) | | | 5,117 | |
Net Asset Value Per Share | | $ | 10.79 | |
Net Assets - Class T Shares | | $ | 10,665,788 | |
| Shares Outstanding, $0.01 Par Value (unlimited shares authorized) | | | 986,178 | |
Net Asset Value Per Share | | $ | 10.82 | |
| |
(1) Redemption price per share may be reduced for any applicable contingent deferred sales charge. (2) Maximum offering price is computed at 100/94.25 of net asset value. |
| | |
See Notes to Financial Statements. |
| |
12 | JUNE 30, 2023 |
Janus Henderson Global Allocation Fund - Conservative
Statement of Operations
For the year ended June 30, 2023
| | | | | | |
| | | | | |
Investment Income: | |
| Dividends from affiliates | $ | 2,796,413 | |
| Other income | | 133 | |
Total Investment Income | | 2,796,546 | |
Expenses: | | | |
| Advisory fees | | 76,139 | |
| 12b-1 Distribution and shareholder servicing fees: |
| | Class A Shares | | 16,925 | |
| | Class C Shares | | 40,901 | |
| | Class S Shares | | 185 | |
| Transfer agent administrative fees and expenses: | | | |
| | Class D Shares | | 149,411 | |
| | Class S Shares | | 186 | |
| | Class T Shares | | 28,258 | |
| Transfer agent networking and omnibus fees: | | | |
| | Class A Shares | | 5,649 | |
| | Class C Shares | | 3,943 | |
| | Class I Shares | | 2,723 | |
| Other transfer agent fees and expenses: | | | |
| | Class A Shares | | 497 | |
| | Class C Shares | | 240 | |
| | Class D Shares | | 18,809 | |
| | Class I Shares | | 183 | |
| | Class S Shares | | 17 | |
| | Class T Shares | | 202 | |
| Registration fees | | 100,136 | |
| Professional fees | | 40,826 | |
| Shareholder reports expense | | 24,621 | |
| Custodian fees | | 10,172 | |
| Trustees’ fees and expenses | | 4,197 | |
| Other expenses | | 15,816 | |
Total Expenses | | 540,036 | |
Less: Excess Expense Reimbursement and Waivers | | (64,160) | |
Net Expenses | | 475,876 | |
Net Investment Income/(Loss) | | 2,320,670 | |
Net Realized Gain/(Loss) on Investments: | |
| Investments in affiliates | | (6,574,690) | |
| Capital gain distributions from underlying funds | | 819,453 | |
Total Net Realized Gain/(Loss) on Investments | (5,755,237) | |
Change in Unrealized Net Appreciation/Depreciation: |
| Investments in affiliates | | 10,277,849 | |
Total Change in Unrealized Net Appreciation/Depreciation | 10,277,849 | |
Net Increase/(Decrease) in Net Assets Resulting from Operations | $ | 6,843,282 | |
| | | | | |
| | |
See Notes to Financial Statements. |
| |
Janus Investment Fund | 13 |
Janus Henderson Global Allocation Fund - Conservative
Statements of Changes in Net Assets
| | | | | | | | | |
| | | | | | | | |
| | | Year ended
June 30, 2023 | | Year ended
June 30, 2022 | |
| | | | | | | | | |
Operations: | | | | | | |
| Net investment income/(loss) | $ | 2,320,670 | | $ | 6,228,907 | |
| Net realized gain/(loss) on investments | | (5,755,237) | | | 4,303,301 | |
| Change in unrealized net appreciation/depreciation | | 10,277,849 | | | (44,104,456) | |
Net Increase/(Decrease) in Net Assets Resulting from Operations | | 6,843,282 | | | (33,572,248) | |
Dividends and Distributions to Shareholders: | | | | | | |
| | Class A Shares | | (131,557) | | | (822,848) | |
| | Class C Shares | | (74,669) | | | (760,171) | |
| | Class D Shares | | (2,866,502) | | | (15,718,092) | |
| | Class I Shares | | (59,077) | | | (354,854) | |
| | Class S Shares | | (988) | | | (10,096) | |
| | Class T Shares | | (236,186) | | | (1,581,411) | |
Net Decrease from Dividends and Distributions to Shareholders | | (3,368,979) | | | (19,247,472) | |
Capital Share Transactions: | | | | | | |
| | Class A Shares | | (868,840) | | | 894,095 | |
| | Class C Shares | | (2,712,685) | | | (1,053,445) | |
| | Class D Shares | | (7,317,963) | | | (1,870,347) | |
| | Class I Shares | | (866,985) | | | (229,562) | |
| | Class S Shares | | (42,971) | | | 17,572 | |
| | Class T Shares | | (1,930,543) | | | 306,390 | |
Net Increase/(Decrease) from Capital Share Transactions | | (13,739,987) | | | (1,935,297) | |
Net Increase/(Decrease) in Net Assets | | (10,265,684) | | | (54,755,017) | |
Net Assets: | | | | | | |
| Beginning of period | | 157,920,896 | | | 212,675,913 | |
| End of period | $ | 147,655,212 | | $ | 157,920,896 | |
| | | | | | | | |
| | |
See Notes to Financial Statements. |
| |
14 | JUNE 30, 2023 |
Janus Henderson Global Allocation Fund - Conservative
Financial Highlights
| | | | | | | | | | | | | | | | | | | |
Class A Shares | | | | | | | | | | | | | | | |
For a share outstanding during the year ended June 30 | | 2023 | | | 2022 | | | 2021 | | | 2020 | | | 2019 | |
| Net Asset Value, Beginning of Period | | $10.52 | | | $13.99 | | | $12.28 | | | $12.53 | | | $12.58 | |
| Income/(Loss) from Investment Operations: | | | | | | | | | | | | | | | |
| | Net investment income/(loss)(1) | | 0.14 | | | 0.39 | | | 0.25 | | | 0.14 | | | 0.05 | |
| | Net realized and unrealized gain/(loss) | | 0.33 | | | (2.57) | | | 2.07 | | | 0.19 | | | 0.35 | |
| Total from Investment Operations | | 0.47 | | | (2.18) | | | 2.32 | | | 0.33 | | | 0.40 | |
| Less Dividends and Distributions: | | | | | | | | | | | | | | | |
| | Dividends (from net investment income) | | (0.04) | | | (0.41) | | | (0.26) | | | (0.13) | | | (0.10) | |
| | Distributions (from capital gains) | | (0.18) | | | (0.88) | | | (0.35) | | | (0.45) | | | (0.35) | |
| Total Dividends and Distributions | | (0.22) | | | (1.29) | | | (0.61) | | | (0.58) | | | (0.45) | |
| Net Asset Value, End of Period | | $10.77 | | | $10.52 | | | $13.99 | | | $12.28 | | | $12.53 | |
| Total Return* | | 4.54% | | | (17.15)% | | | 19.10% | | | 2.58% | | | 3.47% | |
| Net Assets, End of Period (in thousands) | | $6,511 | | | $7,213 | | | $8,650 | | | $4,030 | | | $4,505 | |
| Average Net Assets for the Period (in thousands) | | $6,745 | | | $8,494 | | | $6,632 | | | $4,381 | | | $4,379 | |
| Ratios to Average Net Assets**: | | | | | | | | | | | | | | | |
| | Ratio of Gross Expenses(2) | | 0.51% | | | 0.47% | | | 0.47% | | | 0.47% | | | 0.46% | |
| | Ratio of Net Expenses (After Waivers and Expense Offsets)(2) | | 0.48% | | | 0.47% | | | 0.47% | | | 0.47% | | | 0.46% | |
| | Ratio of Net Investment Income/(Loss)(2) | | 1.36% | | | 3.03% | | | 1.84% | | | 1.13% | | | 0.43% | |
| Portfolio Turnover Rate | | 41% | | | 43% | | | 34% | | | 57% | | | 5% | |
| | | | | | | | | | | | | | | | | | | |
| |
* Total return includes adjustments in accordance with generally accepted accounting principles required at the year or period end and are not annualized for periods of less than one full year. ** Annualized for periods of less than one full year. (1) Per share amounts are calculated based on average shares outstanding during the year or period. (2) Ratios do not include indirect expenses of the underlying funds and/or investment companies in which the Fund invests. |
| | |
See Notes to Financial Statements. |
| |
Janus Investment Fund | 15 |
Janus Henderson Global Allocation Fund - Conservative
Financial Highlights
| | | | | | | | | | | | | | | | | | | |
Class C Shares | | | | | | | | | | | | | | | |
For a share outstanding during the year ended June 30 | | 2023 | | | 2022 | | | 2021 | | | 2020 | | | 2019 | |
| Net Asset Value, Beginning of Period | | $10.28 | | | $13.67 | | | $12.01 | | | $12.26 | | | $12.30 | |
| Income/(Loss) from Investment Operations: | | | | | | | | | | | | | | | |
| | Net investment income/(loss)(1) | | 0.08 | | | 0.29 | | | 0.18 | | | 0.05 | | | (0.02) | |
| | Net realized and unrealized gain/(loss) | | 0.31 | | | (2.50) | | | 1.98 | | | 0.18 | | | 0.33 | |
| Total from Investment Operations | | 0.39 | | | (2.21) | | | 2.16 | | | 0.23 | | | 0.31 | |
| Less Dividends and Distributions: | | | | | | | | | | | | | | | |
| | Dividends (from net investment income) | | — | | | (0.30) | | | (0.15) | | | (0.03) | | | —(2) | |
| | Distributions (from capital gains) | | (0.18) | | | (0.88) | | | (0.35) | | | (0.45) | | | (0.35) | |
| Total Dividends and Distributions | | (0.18) | | | (1.18) | | | (0.50) | | | (0.48) | | | (0.35) | |
| Net Asset Value, End of Period | | $10.49 | | | $10.28 | | | $13.67 | | | $12.01 | | | $12.26 | |
| Total Return* | | 3.88% | | | (17.65)% | | | 18.20% | | | 1.85% | | | 2.78% | |
| Net Assets, End of Period (in thousands) | | $3,461 | | | $6,096 | | | $9,356 | | | $10,655 | | | $13,392 | |
| Average Net Assets for the Period (in thousands) | | $4,472 | | | $8,302 | | | $9,960 | | | $12,057 | | | $14,347 | |
| Ratios to Average Net Assets**: | | | | | | | | | | | | | | | |
| | Ratio of Gross Expenses(3) | | 1.18% | | | 1.18% | | | 1.15% | | | 1.18% | | | 1.18% | |
| | Ratio of Net Expenses (After Waivers and Expense Offsets)(3) | | 1.15% | | | 1.18% | | | 1.15% | | | 1.18% | | | 1.18% | |
| | Ratio of Net Investment Income/(Loss)(3) | | 0.76% | | | 2.31% | | | 1.38% | | | 0.41% | | | (0.13)% | |
| Portfolio Turnover Rate | | 41% | | | 43% | | | 34% | | | 57% | | | 5% | |
| | | | | | | | | | | | | | | | | | | |
| |
* Total return includes adjustments in accordance with generally accepted accounting principles required at the year or period end and are not annualized for periods of less than one full year. ** Annualized for periods of less than one full year. (1) Per share amounts are calculated based on average shares outstanding during the year or period. (2) Less than $0.005 on a per share basis. (3) Ratios do not include indirect expenses of the underlying funds and/or investment companies in which the Fund invests. |
| | |
See Notes to Financial Statements. |
| |
16 | JUNE 30, 2023 |
Janus Henderson Global Allocation Fund - Conservative
Financial Highlights
| | | | | | | | | | | | | | | | | | | |
Class D Shares | | | | | | | | | | | | | | | |
For a share outstanding during the year ended June 30 | | 2023 | | | 2022 | | | 2021 | | | 2020 | | | 2019 | |
| Net Asset Value, Beginning of Period | | $10.59 | | | $14.06 | | | $12.34 | | | $12.59 | | | $12.63 | |
| Income/(Loss) from Investment Operations: | | | | | | | | | | | | | | | |
| | Net investment income/(loss)(1) | | 0.17 | | | 0.41 | | | 0.30 | | | 0.16 | | | 0.09 | |
| | Net realized and unrealized gain/(loss) | | 0.32 | | | (2.57) | | | 2.05 | | | 0.20 | | | 0.34 | |
| Total from Investment Operations | | 0.49 | | | (2.16) | | | 2.35 | | | 0.36 | | | 0.43 | |
| Less Dividends and Distributions: | | | | | | | | | | | | | | | |
| | Dividends (from net investment income) | | (0.06) | | | (0.43) | | | (0.28) | | | (0.16) | | | (0.12) | |
| | Distributions (from capital gains) | | (0.18) | | | (0.88) | | | (0.35) | | | (0.45) | | | (0.35) | |
| Total Dividends and Distributions | | (0.24) | | | (1.31) | | | (0.63) | | | (0.61) | | | (0.47) | |
| Net Asset Value, End of Period | | $10.84 | | | $10.59 | | | $14.06 | | | $12.34 | | | $12.59 | |
| Total Return* | | 4.78% | | | (16.91)% | | | 19.27% | | | 2.77% | | | 3.70% | |
| Net Assets, End of Period (in thousands) | | $125,119 | | | $129,498 | | | $174,449 | | | $147,682 | | | $159,468 | |
| Average Net Assets for the Period (in thousands) | | $126,365 | | | $160,466 | | | $162,759 | | | $152,767 | | | $163,822 | |
| Ratios to Average Net Assets**: | | | | | | | | | | | | | | | |
| | Ratio of Gross Expenses(2) | | 0.31% | | | 0.27% | | | 0.28% | | | 0.28% | | | 0.29% | |
| | Ratio of Net Expenses (After Waivers and Expense Offsets)(2) | | 0.27% | | | 0.27% | | | 0.27% | | | 0.27% | | | 0.27% | |
| | Ratio of Net Investment Income/(Loss)(2) | | 1.57% | | | 3.22% | | | 2.20% | | | 1.32% | | | 0.76% | |
| Portfolio Turnover Rate | | 41% | | | 43% | | | 34% | | | 57% | | | 5% | |
| | | | | | | | | | | | | | | | | | | |
| |
* Total return includes adjustments in accordance with generally accepted accounting principles required at the year or period end and are not annualized for periods of less than one full year. ** Annualized for periods of less than one full year. (1) Per share amounts are calculated based on average shares outstanding during the year or period. (2) Ratios do not include indirect expenses of the underlying funds and/or investment companies in which the Fund invests. |
| | |
See Notes to Financial Statements. |
| |
Janus Investment Fund | 17 |
Janus Henderson Global Allocation Fund - Conservative
Financial Highlights
| | | | | | | | | | | | | | | | | | | |
Class I Shares | | | | | | | | | | | | | | | |
For a share outstanding during the year ended June 30 | | 2023 | | | 2022 | | | 2021 | | | 2020 | | | 2019 | |
| Net Asset Value, Beginning of Period | | $10.59 | | | $14.07 | | | $12.34 | | | $12.58 | | | $12.63 | |
| Income/(Loss) from Investment Operations: | | | | | | | | | | | | | | | |
| | Net investment income/(loss)(1) | | 0.17 | | | 0.42 | | | 0.29 | | | 0.17 | | | 0.11 | |
| | Net realized and unrealized gain/(loss) | | 0.33 | | | (2.58) | | | 2.07 | | | 0.20 | | | 0.32 | |
| Total from Investment Operations | | 0.50 | | | (2.16) | | | 2.36 | | | 0.37 | | | 0.43 | |
| Less Dividends and Distributions: | | | | | | | | | | | | | | | |
| | Dividends (from net investment income) | | (0.07) | | | (0.44) | | | (0.28) | | | (0.16) | | | (0.13) | |
| | Distributions (from capital gains) | | (0.18) | | | (0.88) | | | (0.35) | | | (0.45) | | | (0.35) | |
| Total Dividends and Distributions | | (0.25) | | | (1.32) | | | (0.63) | | | (0.61) | | | (0.48) | |
| Net Asset Value, End of Period | | $10.84 | | | $10.59 | | | $14.07 | | | $12.34 | | | $12.58 | |
| Total Return* | | 4.80% | | | (16.92)% | | | 19.39% | | | 2.89% | | | 3.71% | |
| Net Assets, End of Period (in thousands) | | $1,842 | | | $2,645 | | | $3,830 | | | $3,381 | | | $3,786 | |
| Average Net Assets for the Period (in thousands) | | $2,574 | | | $3,502 | | | $3,247 | | | $3,491 | | | $4,489 | |
| Ratios to Average Net Assets**: | | | | | | | | | | | | | | | |
| | Ratio of Gross Expenses(2) | | 0.28% | | | 0.24% | | | 0.22% | | | 0.21% | | | 0.21% | |
| | Ratio of Net Expenses (After Waivers and Expense Offsets)(2) | | 0.25% | | | 0.24% | | | 0.22% | | | 0.21% | | | 0.21% | |
| | Ratio of Net Investment Income/(Loss)(2) | | 1.56% | | | 3.27% | | | 2.16% | | | 1.37% | | | 0.92% | |
| Portfolio Turnover Rate | | 41% | | | 43% | | | 34% | | | 57% | | | 5% | |
| | | | | | | | | | | | | | | | | | | |
| |
* Total return includes adjustments in accordance with generally accepted accounting principles required at the year or period end and are not annualized for periods of less than one full year. ** Annualized for periods of less than one full year. (1) Per share amounts are calculated based on average shares outstanding during the year or period. (2) Ratios do not include indirect expenses of the underlying funds and/or investment companies in which the Fund invests. |
| | |
See Notes to Financial Statements. |
| |
18 | JUNE 30, 2023 |
Janus Henderson Global Allocation Fund - Conservative
Financial Highlights
| | | | | | | | | | | | | | | | | | | |
Class S Shares | | | | | | | | | | | | | | | |
For a share outstanding during the year ended June 30 | | 2023 | | | 2022 | | | 2021 | | | 2020 | | | 2019 | |
| Net Asset Value, Beginning of Period | | $10.52 | | | $13.97 | | | $12.25 | | | $12.45 | | | $12.51 | |
| Income/(Loss) from Investment Operations: | | | | | | | | | | | | | | | |
| | Net investment income/(loss)(1) | | 0.13 | | | 0.36 | | | 0.25 | | | 0.11 | | | 0.09 | |
| | Net realized and unrealized gain/(loss) | | 0.32 | | | (2.55) | | | 2.02 | | | 0.20 | | | 0.29 | |
| Total from Investment Operations | | 0.45 | | | (2.19) | | | 2.27 | | | 0.31 | | | 0.38 | |
| Less Dividends and Distributions: | | | | | | | | | | | | | | | |
| | Dividends (from net investment income) | | — | | | (0.38) | | | (0.20) | | | (0.06) | | | (0.09) | |
| | Distributions (from capital gains) | | (0.18) | | | (0.88) | | | (0.35) | | | (0.45) | | | (0.35) | |
| Total Dividends and Distributions | | (0.18) | | | (1.26) | | | (0.55) | | | (0.51) | | | (0.44) | |
| Net Asset Value, End of Period | | $10.79 | | | $10.52 | | | $13.97 | | | $12.25 | | | $12.45 | |
| Total Return* | | 4.36% | | | (17.19)% | | | 18.70% | | | 2.43% | | | 3.32% | |
| Net Assets, End of Period (in thousands) | | $55 | | | $96 | | | $108 | | | $126 | | | $765 | |
| Average Net Assets for the Period (in thousands) | | $74 | | | $107 | | | $119 | | | $407 | | | $860 | |
| Ratios to Average Net Assets**: | | | | | | | | | | | | | | | |
| | Ratio of Gross Expenses(2) | | 0.69% | | | 0.65% | | | 0.65% | | | 0.63% | | | 0.56% | |
| | Ratio of Net Expenses (After Waivers and Expense Offsets)(2) | | 0.66% | | | 0.65% | | | 0.65% | | | 0.63% | | | 0.56% | |
| | Ratio of Net Investment Income/(Loss)(2) | | 1.19% | | | 2.83% | | | 1.88% | | | 0.90% | | | 0.76% | |
| Portfolio Turnover Rate | | 41% | | | 43% | | | 34% | | | 57% | | | 5% | |
| | | | | | | | | | | | | | | | | | | |
| |
* Total return includes adjustments in accordance with generally accepted accounting principles required at the year or period end and are not annualized for periods of less than one full year. ** Annualized for periods of less than one full year. (1) Per share amounts are calculated based on average shares outstanding during the year or period. (2) Ratios do not include indirect expenses of the underlying funds and/or investment companies in which the Fund invests. |
| | |
See Notes to Financial Statements. |
| |
Janus Investment Fund | 19 |
Janus Henderson Global Allocation Fund - Conservative
Financial Highlights
| | | | | | | | | | | | | | | | | | | |
Class T Shares | | | | | | | | | | | | | | | |
For a share outstanding during the year ended June 30 | | 2023 | | | 2022 | | | 2021 | | | 2020 | | | 2019 | |
| Net Asset Value, Beginning of Period | | $10.56 | | | $14.03 | | | $12.32 | | | $12.56 | | | $12.61 | |
| Income/(Loss) from Investment Operations: | | | | | | | | | | | | | | | |
| | Net investment income/(loss)(1) | | 0.16 | | | 0.41 | | | 0.29 | | | 0.16 | | | 0.10 | |
| | Net realized and unrealized gain/(loss) | | 0.33 | | | (2.58) | | | 2.04 | | | 0.20 | | | 0.31 | |
| Total from Investment Operations | | 0.49 | | | (2.17) | | | 2.33 | | | 0.36 | | | 0.41 | |
| Less Dividends and Distributions: | | | | | | | | | | | | | | | |
| | Dividends (from net investment income) | | (0.05) | | | (0.42) | | | (0.27) | | | (0.15) | | | (0.11) | |
| | Distributions (from capital gains) | | (0.18) | | | (0.88) | | | (0.35) | | | (0.45) | | | (0.35) | |
| Total Dividends and Distributions | | (0.23) | | | (1.30) | | | (0.62) | | | (0.60) | | | (0.46) | |
| Net Asset Value, End of Period | | $10.82 | | | $10.56 | | | $14.03 | | | $12.32 | | | $12.56 | |
| Total Return* | | 4.76% | | | (17.02)% | | | 19.12% | | | 2.78% | | | 3.51% | |
| Net Assets, End of Period (in thousands) | | $10,666 | | | $12,373 | | | $16,283 | | | $15,174 | | | $17,532 | |
| Average Net Assets for the Period (in thousands) | | $11,245 | | | $15,587 | | | $16,293 | | | $16,406 | | | $19,653 | |
| Ratios to Average Net Assets**: | | | | | | | | | | | | | | | |
| | Ratio of Gross Expenses(2) | | 0.42% | | | 0.39% | | | 0.39% | | | 0.38% | | | 0.39% | |
| | Ratio of Net Expenses (After Waivers and Expense Offsets)(2) | | 0.35% | | | 0.36% | | | 0.35% | | | 0.36% | | | 0.37% | |
| | Ratio of Net Investment Income/(Loss)(2) | | 1.51% | | | 3.22% | | | 2.14% | | | 1.27% | | | 0.78% | |
| Portfolio Turnover Rate | | 41% | | | 43% | | | 34% | | | 57% | | | 5% | |
| | | | | | | | | | | | | | | | | | | |
| |
* Total return includes adjustments in accordance with generally accepted accounting principles required at the year or period end and are not annualized for periods of less than one full year. ** Annualized for periods of less than one full year. (1) Per share amounts are calculated based on average shares outstanding during the year or period. (2) Ratios do not include indirect expenses of the underlying funds and/or investment companies in which the Fund invests. |
| | |
See Notes to Financial Statements. |
| |
20 | JUNE 30, 2023 |
Janus Henderson Global Allocation Fund - Conservative
Notes to Financial Statements
1. Organization and Significant Accounting Policies
Janus Henderson Global Allocation Fund - Conservative (the “Fund”) is a series of Janus Investment Fund (the “Trust”), which is organized as a Massachusetts business trust and is registered under the Investment Company Act of 1940, as amended (the “1940 Act”), as an open-end management investment company, and therefore has applied the specialized accounting and reporting guidance in Financial Accounting Standards Board (“FASB”) Accounting Standards Codification (“ASC”) Topic 946. The Fund operates as a “fund of funds,” meaning substantially all of the Fund’s assets will be invested in other Janus Henderson mutual funds and exchange-traded funds ("ETFs") (the “underlying funds”). The Trust offers 39 funds, each of which offers multiple share classes, with differing investment objectives and policies. The Fund seeks total return through a primary emphasis on income with a secondary emphasis on growth of capital. The Fund is classified as diversified, as defined in the 1940 Act. Janus Henderson Investors US LLC is the investment adviser (the “Adviser”) to the Fund.
The Fund offers multiple classes of shares in order to meet the needs of various types of investors. Each class represents an interest in the same portfolio of investments. Certain financial intermediaries may not offer all classes of shares.
Shareholders, including other funds, individuals, accounts, as well as the Fund’s portfolio manager(s) and/or investment personnel, may from time to time own (beneficially or of record) a significant percentage of the Fund’s Shares and can be considered to “control” the Fund when that ownership exceeds 25% of the Fund’s assets (and which may differ from control as determined in accordance with United States of America generally accepted accounting principles ("US GAAP")).
Class A Shares are offered through financial intermediary platforms including, but not limited to, traditional brokerage platforms, mutual fund wrap fee programs, bank trust platforms, and retirement platforms.
Class C Shares are offered through financial intermediary platforms including, but not limited to, traditional brokerage platforms, mutual fund wrap fee programs, and bank trust platforms.
Class C Shares are closed to investments by new employer-sponsored retirement plans and existing employer-sponsored retirement plans are no longer able to make additional purchases or exchanges into Class C Shares.
The Fund currently implements an automatic conversion feature pursuant to which Class C Shares that have been held for eight years are automatically converted to Class A Shares without the imposition of any sales charge, fee or other charge. The conversion will generally occur no later than ten business days in the month following the month of the eighth anniversary of the date of purchase. Class C Shares purchased through the reinvestment of dividends and other distributions on Class C Shares will convert to Class A Shares at the same time as the original Class C Shares with respect to which they were purchased. For Class C Shares held in omnibus accounts on intermediary platforms, the Fund relies on these intermediaries to implement this conversion feature. Your financial intermediary may have separate policies and procedures as to when and how Class C Shares may be converted to Class A Shares.
Effective July 6, 2020, Class D Shares are available to new investors, subject to any closed fund policies for a Fund, as applicable. Previously, Class D Shares were only available to investors who already had a direct account with the Janus Henderson funds; immediate family members or members of the same household of an eligible individual investor; and existing beneficial owners of sole proprietorships or partnerships that hold accounts directly with the Janus Henderson funds.
Class I Shares are available through certain financial intermediary platforms including, but not limited to, mutual fund wrap fee programs, managed account programs, asset allocation programs, bank trust platforms, as well as certain retirement platforms. Class I Shares are also available to certain direct institutional investors including, but not limited to, corporations, certain retirement plans, public plans, and foundations/endowments, who established Class I Share accounts before August 4, 2017.
Class S Shares are offered through financial intermediary platforms including, but not limited to, retirement platforms and asset allocation, mutual fund wrap, or other discretionary or nondiscretionary fee-based investment advisory programs. In addition, Class S Shares may be available through certain financial intermediaries who have an agreement with the Adviser or its affiliates to offer Class S Shares on their supermarket platforms.
Janus Henderson Global Allocation Fund - Conservative
Notes to Financial Statements
Class T Shares are available through certain financial intermediary platforms including, but not limited to, mutual fund wrap fee programs, managed account programs, asset allocation programs, bank trust platforms, as well as certain retirement platforms. In addition, Class T Shares may be available through certain financial intermediaries who have an agreement with the Adviser or its affiliates to offer Class T Shares on their supermarket platforms.
Underlying Funds
The Fund invests in a variety of underlying funds to pursue a target allocation of equity investments, fixed-income securities, and alternative investments and may also invest in money market instruments or cash/cash equivalents. The Fund has a target allocation, which is how the Fund's investments generally will be allocated among the major asset classes over the long term, as well as normal ranges, under normal market conditions, within which the Fund's asset class allocations generally will vary over short-term periods. The Fund's long-term expected average asset allocation is as follows: 40% to equity investments, 55% to fixed-income securities and money market instruments, and 5% to alternative investments. Additional details and descriptions of the investment objectives and strategies of each of the underlying funds are available in the Fund’s and underlying funds’ prospectuses available at janushenderson.com. The Trustees of the underlying funds may change the investment objectives or strategies of the underlying funds at any time without prior notice to the Fund’s shareholders.
The following accounting policies have been followed by the Fund and are in conformity with US GAAP.
Investment Valuation
The Fund’s net asset value (“NAV”) is calculated based upon the NAV of each of the underlying funds in which the Fund invests on the day of valuation. The NAV for each class of the underlying funds is computed by dividing the total value of securities and other assets allocated to the class, less liabilities allocated to that class, by the total number of shares outstanding for the class.
Valuation Inputs Summary
FASB ASC 820, Fair Value Measurements and Disclosures (“ASC 820”), defines fair value, establishes a framework for measuring fair value, and expands disclosure requirements regarding fair value measurements. This standard emphasizes that fair value is a market-based measurement that should be determined based on the assumptions that market participants would use in pricing an asset or liability and establishes a hierarchy that prioritizes inputs to valuation techniques used to measure fair value. These inputs are summarized into three broad levels:
Level 1 – Unadjusted quoted prices in active markets the Fund has the ability to access for identical assets or liabilities.
Level 2 – Observable inputs other than unadjusted quoted prices included in Level 1 that are observable for the asset or liability either directly or indirectly. These inputs may include quoted prices for the identical instrument on an inactive market, prices for similar instruments, interest rates, prepayment speeds, credit risk, yield curves, default rates and similar data.
Level 3 – Unobservable inputs for the asset or liability to the extent that relevant observable inputs are not available, representing the Fund’s own assumptions about the assumptions that a market participant would use in valuing the asset or liability, and that would be based on the best information available.
The Fund classifies each of its investments in underlying funds as Level 1, without consideration as to the classification level of the specific investments held by the underlying funds. There have been no significant changes in valuation techniques used in valuing any such positions held by the Fund since the beginning of the fiscal year.
The inputs or methodology used for fair valuing securities are not necessarily an indication of the risk associated with investing in those securities. The summary of inputs used as of June 30, 2023 to fair value the Fund’s investments in securities and other financial instruments is included in the “Valuation Inputs Summary” in the Notes to Schedule of Investments and Other Information.
Investment Transactions and Investment Income
Investment transactions are accounted for as of the date purchased or sold (trade date). Dividend income is recorded on the ex-dividend date. Certain dividends from foreign securities held by the underlying funds will be recorded as soon as the Fund is informed of the dividend, if such information is obtained subsequent to the ex-dividend date. Dividends from foreign securities may be subject to withholding taxes in foreign jurisdictions. Non-cash dividends, if any, are recorded on the ex-dividend date at fair value. Interest income is recorded daily on the accrual basis and includes
Janus Henderson Global Allocation Fund - Conservative
Notes to Financial Statements
amortization of premiums and accretion of discounts. The Fund classifies gains and losses on prepayments received as an adjustment to interest income. Debt securities may be placed in non-accrual status and related interest income may be reduced by stopping current accruals and writing off interest receivables when collection of all or a portion of interest has become doubtful. Gains and losses are determined on the identified cost basis, which is the same basis used for federal income tax purposes. Income, as well as gains and losses, both realized and unrealized, are allocated daily to each class of shares based upon the ratio of net assets represented by each class as a percentage of total net assets.
Dividend distributions received from the underlying funds are recorded on the ex-dividend date. Upon receipt of the notification from an underlying fund, and subsequent to the ex-dividend date, a part or all of the dividend income originally recorded by the Fund may be reclassified as a tax return of capital by reducing the cost basis of the underlying fund and/or increasing the realized gain on sales of investments in the underlying fund.
Expenses
The Fund bears expenses incurred specifically on its behalf. Additionally, the Fund, as a shareholder in the underlying funds, will also indirectly bear its pro rata share of the expenses incurred by the underlying funds. Each class of shares bears a portion of general expenses, which are allocated daily to each class of shares based upon the ratio of net assets represented by each class as a percentage of total net assets. Expenses directly attributable to a specific class of shares are charged against the operations of such class.
Estimates
The preparation of financial statements in conformity with US GAAP requires management to make estimates and assumptions that affect the reported amount of assets and liabilities and disclosure of contingent assets and liabilities at the date of the financial statements, and the reported amounts of income and expenses during the reporting period. Actual results could differ from those estimates.
Indemnifications
In the normal course of business, the Fund may enter into contracts that contain provisions for indemnification of other parties against certain potential liabilities. The Fund’s maximum exposure under these arrangements is unknown, and would involve future claims that may be made against the Fund that have not yet occurred. Currently, the risk of material loss from such claims is considered remote.
Dividends and Distributions
The Fund generally declares and distributes dividends of net investment income and realized capital gains (if any) annually. The Fund may treat a portion of the amount paid to redeem shares as a distribution of investment company taxable income and realized capital gains that are reflected in the net asset value. This practice, commonly referred to as “equalization,” has no effect on the redeeming shareholder or a Fund’s total return, but may reduce the amounts that would otherwise be required to be paid as taxable dividends to the remaining shareholders. It is possible that the Internal Revenue Service (IRS) could challenge the Fund's equalization methodology or calculations, and any such challenge could result in additional tax, interest, or penalties to be paid by the Fund.
The underlying funds may make certain investments in real estate investment trusts (“REITs”) which pay dividends to their shareholders based upon funds available from operations. It is quite common for these dividends to exceed the REITs’ taxable earnings and profits, resulting in the excess portion of such dividends being designated as a return of capital. If the underlying funds distribute such amounts, such distributions could constitute a return of capital to shareholders for federal income tax purposes.
Federal Income Taxes
The Fund intends to continue to qualify as a regulated investment company and distribute all of its taxable income in accordance with the requirements of Subchapter M of the Internal Revenue Code. Management has analyzed the Fund’s tax positions taken for all open federal income tax years, generally a three-year period, and has concluded that no provision for federal income tax is required in the Fund’s financial statements. The Fund is not aware of any tax positions for which it is reasonably possible that the total amounts of unrecognized tax benefits will significantly change in the next twelve months.
2. Investment Advisory Agreements and Other Transactions with Affiliates
The Fund pays the Adviser an investment advisory fee which is calculated daily and paid monthly. The Fund’s contractual investment advisory fee rate (expressed as an annual rate) is 0.05% of its average daily net assets.
Janus Henderson Global Allocation Fund - Conservative
Notes to Financial Statements
The Adviser has contractually agreed to waive the investment advisory fee and/or reimburse operating expenses to the extent that the Fund’s total annual fund operating expenses, excluding any expenses of an underlying fund (acquired fund fees and expenses), the fees payable pursuant to a Rule 12b-1 plan, shareholder servicing fees, such as transfer agency fees (including out-of-pocket costs), administrative services fees and any networking/omnibus payable by any share class, brokerage commissions, interest, dividends, taxes, and extraordinary expenses, exceed the annual rate of 0.14% of the Fund’s average daily net assets. The Adviser has agreed to continue the waivers for at least a one-year period commencing October 28, 2022. If applicable, amounts waived and/or reimbursed to the Fund by the Adviser are disclosed as “Excess Expense Reimbursement and Waivers” on the Statement of Operations.
The Adviser serves as administrator to the Fund pursuant to an administration agreement, and is authorized to perform, or cause others to perform, the administration services necessary for the operation of the Fund. The Adviser does not receive compensation for serving as administrator and it bears the expenses related to operation of the Fund, such as, but not limited to fund accounting and tax services; shareholder servicing; and preparation of various documents filed with the SEC. The Fund bears costs related to any compensation, fees, or reimbursements paid to Trustees who are independent of the Adviser; fees and expenses of counsel to the Independent Trustees; fees and expenses of consultants to the Fund; custody fees; audit expenses; brokerage commissions and all other expenses in connection with execution of portfolio transactions; blue sky registration costs; interest; all federal, state and local taxes (including stamp, excise, income, and franchise taxes); expenses of shareholder meetings, including the preparation, printing, and distribution of proxy statements, notices, and reports to shareholders; expenses of printing and mailing to existing shareholders prospectuses, statements of additional information, shareholder reports, and other materials required to be mailed to shareholders by federal or state laws or regulations; transfer agency fees and expenses payable pursuant to a transfer agency agreement between the Trust and the Transfer Agent on behalf of the Fund; any litigation; and other extraordinary expenses. In addition, some expenses related to compensation payable to the Fund's Chief Compliance Officer and compliance staff are shared with the Fund. Total compensation of $343,237 was paid to the Chief Compliance Officer and certain compliance staff by the Trust during the year ended June 30, 2023. The Fund's portion is reported as part of “Other expenses” on the Statement of Operations.
Janus Henderson Services US LLC (the “Transfer Agent”), a wholly-owned subsidiary of the Adviser, is the Fund’s and the underlying funds’ transfer agent. The Transfer Agent provides or arranges for the provision of shareholder services including, but not limited to, recordkeeping, subaccounting, answering inquiries regarding accounts, order processing, transaction confirmations, the mailing of prospectuses and shareholder reports, and other shareholder services provided to or on behalf of shareholders. These amounts are disclosed as “Transfer agent administrative fees and expenses” on the Statement of Operations.
Class D Shares of the Fund pay the Transfer Agent an annual administrative services fee based on the average daily net assets of Class D Shares as detailed below.
| | |
Average Daily Net Assets of Class D Shares of the Janus Henderson funds | Administrative Services Fee |
Under $40 billion | 0.12% |
$40 billion – $49.9 billion | 0.10% |
Over $49.9 billion | 0.08% |
During the reporting period, the administrative services fee rate was 0.12%.
The Transfer Agent receives an administrative services fee at an annual rate of up to 0.25% of the average daily net assets of the Fund’s Class S Shares and Class T Shares for providing or procuring administrative services to investors in Class S Shares and Class T Shares of the Fund. The Transfer Agent expects to use all or a significant portion of this fee to compensate retirement plan service providers, broker-dealers, bank trust departments, financial advisors, and other financial intermediaries for providing these services. The Transfer Agent may keep certain amounts retained for reimbursement of out-of-pocket costs incurred for servicing clients of Class S Shares and Class T Shares.
Shareholder Services provided by these financial intermediaries may include, but are not limited to, recordkeeping, subaccounting, order processing, providing order confirmations, periodic statements, forwarding prospectuses, shareholder reports, and other materials to existing customers, answering inquiries regarding accounts, and other administrative services. Order processing includes the submission of transactions through the National Securities Clearing Corporation (“NSCC”) or similar systems, or those processed on a manual basis with the Adviser. For all share classes, the Transfer Agent also seeks reimbursement for costs it incurs as transfer agent and for providing servicing.
Janus Henderson Global Allocation Fund - Conservative
Notes to Financial Statements
Certain, but not all, intermediaries may charge administrative fees to investors in Class A Shares, Class C Shares, and Class I Shares for administrative services provided on behalf of such investors. These administrative fees are paid by the Class A Shares, Class C Shares, and Class I Shares of the Fund to the Transfer Agent, which uses such fees to reimburse intermediaries. Consistent with the Transfer Agency Agreement between the Transfer Agent and the Fund, the Transfer Agent may negotiate the level, structure, and/or terms of the administrative fees with intermediaries requiring such fees on behalf of the Fund. The Adviser and its affiliates benefit from an increase in assets that may result from such relationships. The Adviser has agreed to limit these fees up to 0.20% for Class A Shares and Class C Shares, and up to 0.15% for Class I Shares on an annual basis based on the daily net assets of each share class. Such limits are subject to change by the Trustees in the future. These amounts are disclosed as “Transfer agent networking and omnibus fees” on the Statement of Operations.
The Transfer Agent is not compensated for its services related to the shares, except for out-of-pocket costs, although the Transfer Agent is compensated for its services related to Fund’s Class D Shares. These amounts are disclosed as “Other transfer agent fees and expenses” on the Statement of Operations.
Under a distribution and shareholder servicing plan (the “Plan”) adopted in accordance with Rule 12b-1 under the 1940 Act, the Fund pays the Trust’s distributor, Janus Henderson Distributors US LLC (the “Distributor”), a wholly-owned subsidiary of the Adviser, a fee for the sale and distribution and/or shareholder servicing of the Shares at an annual rate of up to 0.25% of the Class A Shares’ average daily net assets, of up to 1.00% of the Class C Shares’ average daily net assets, and of up to 0.25% of the Class S Shares’ average daily net assets. Under the terms of the Plan, the Trust is authorized to make payments to the Distributor for remittance to retirement plan service providers, broker-dealers, bank trust departments, financial advisors, and other financial intermediaries, as compensation for distribution and/or shareholder services performed by such entities for their customers who are investors in the Fund. These amounts are disclosed as “12b-1 Distribution and shareholder servicing fees” on the Statement of Operations.
Class A Shares include a 5.75% upfront sales charge of the offering price of the Fund. The sales charge is allocated between the Distributor and financial intermediaries. During the year ended June 30, 2023, the Distributor retained upfront sales charges of $33.
A contingent deferred sales charge (“CDSC”) of 1.00% will be deducted with respect to Class A Shares purchased without a sales load and redeemed within 12 months of purchase, unless waived. Any applicable CDSC will be 1.00% of the lesser of the original purchase price or the value of the redemption of the Class A Shares redeemed. There were no CDSCs paid by redeeming shareholders of Class A Shares to the Distributor during the year ended June 30, 2023.
A CDSC of 1.00% will be deducted with respect to Class C Shares redeemed within 12 months of purchase, unless waived. Any applicable CDSC will be 1.00% of the lesser of the original purchase price or the value of the redemption of the Class C Shares redeemed. During the year ended June 30, 2023, redeeming shareholders of Class C Shares paid CDSCs of $1,048.
The Board of Trustees has adopted a deferred compensation plan (the “Deferred Plan”) for independent Trustees to elect to defer receipt of all or a portion of the annual compensation they are entitled to receive from the Fund. All deferred fees are credited to an account established in the name of the Trustees. The amounts credited to the account then increase or decrease, as the case may be, in accordance with the performance of one or more of the Janus Henderson funds that are selected by the Trustees. The account balance continues to fluctuate in accordance with the performance of the selected fund or funds until final payment of all amounts are credited to the account. The fluctuation of the account balance is recorded by the Fund as unrealized appreciation/(depreciation) and is included as of June 30, 2023 on the Statement of Assets and Liabilities in the asset, “Trustees’ deferred compensation,” and liability, “Trustees’ deferred compensation fees.” Additionally, the recorded unrealized appreciation/(depreciation) is included in “Total distributable earnings (loss)” on the Statement of Assets and Liabilities. Deferred compensation expenses for the year ended June 30, 2023 are included in “Trustees’ fees and expenses” on the Statement of Operations. Trustees are allowed to change their designation of mutual funds from time to time. Amounts will be deferred until distributed in accordance with the Deferred Plan. Deferred fees of $426,025 were paid by the Trust to the Trustees under the Deferred Plan during the year ended June 30, 2023.
Pursuant to the provisions of the 1940 Act and related rules, the Fund may participate in an affiliated or non-affiliated cash sweep program. In the cash sweep program, uninvested cash balances of the Fund may be used to purchase shares of affiliated or non-affiliated money market funds or cash management pooled investment vehicles that operate as money market funds. The Fund is eligible to participate in the cash sweep program (the “Investing Funds”). The
Janus Henderson Global Allocation Fund - Conservative
Notes to Financial Statements
Adviser has an inherent conflict of interest because of its fiduciary duties to the affiliated money market funds or cash management pooled investment vehicles and the Investing Funds. Janus Henderson Cash Liquidity Fund LLC (the “Sweep Vehicle”) is an affiliated unregistered cash management pooled investment vehicle that invests primarily in highly-rated short-term fixed-income securities. The Sweep Vehicle operates pursuant to the provisions of the 1940 Act that govern the operation of money market funds and prices its shares at NAV reflecting market-based values of its portfolio securities (i.e., a “floating” NAV) rounded to the fourth decimal place (e.g., $1.0000). The Sweep Vehicle is permitted to impose a liquidity fee (of up to 2%) on redemptions from the Sweep Vehicle or a redemption gate that temporarily suspends redemptions from the Sweep Vehicle for up to 10 business days during a 90 day period. There are no restrictions on the Fund's ability to withdraw investments from the Sweep Vehicle at will, and there are no unfunded capital commitments due from the Fund to the Sweep Vehicle. The Sweep Vehicle does not charge any management fee, sales charge or service fee.
Any purchases and sales, realized gains/losses and recorded dividends from affiliated investments during the year ended June 30, 2023 can be found in the “Schedules of Affiliated Investments” located in the Schedule of Investments.
3. Federal Income Tax
The tax components of capital shown in the table below represent: (1) distribution requirements the Fund must satisfy under the income tax regulations; (2) losses or deductions the Fund may be able to offset against income and gains realized in future years; and (3) unrealized appreciation or depreciation of investments for federal income tax purposes.
Other book to tax differences primarily consist of deferred compensation. The Fund has elected to treat gains and losses on forward foreign currency contracts as capital gains and losses, if applicable. Other foreign currency gains and losses on debt instruments are treated as ordinary income for federal income tax purposes pursuant to Section 988 of the Internal Revenue Code.
| | | | | | | |
| | | | Other Book | Net Tax | |
Undistributed
Ordinary Income | Undistributed
Long-Term Gains | Accumulated
Capital Losses | Loss Deferrals | to Tax
Differences | Appreciation/
(Depreciation) | |
$ 2,279,947 | $ - | $ (5,482,944) | $ - | $ (2,598) | $ (7,331,778) | |
Accumulated capital losses noted below represent net capital loss carryovers, as of June 30, 2023, that may be available to offset future realized capital gains and thereby reduce future taxable gains distributions. The following table shows these capital loss carryovers.
| | | | | | |
| | | | | |
Capital Loss Carryover Schedule | | |
For the year ended June 30, 2023 | | |
| No Expiration | | | |
| Short-Term | Long-Term | Accumulated
Capital Losses | | |
| $(1,920,647) | $(3,562,297) | $ (5,482,944) | | |
The aggregate cost of investments and the composition of unrealized appreciation and depreciation of investment securities for federal income tax purposes as of June 30, 2023 are noted below. The primary difference between book and tax appreciation or depreciation of investments is wash sale loss deferrals.
| | | | |
Federal Tax Cost | Unrealized
Appreciation | Unrealized
(Depreciation) | Net Tax Appreciation/
(Depreciation) |
$155,059,124 | $ 6,377,642 | $ (13,709,420) | $ (7,331,778) |
Income and capital gains distributions are determined in accordance with income tax regulations that may differ from US GAAP. These differences are due to differing treatments for items such as net short-term gains, deferral of wash
Janus Henderson Global Allocation Fund - Conservative
Notes to Financial Statements
sale losses, and capital loss carryovers. Certain permanent differences such as tax returns of capital and net investment losses noted below have been reclassified to capital.
| | | | | |
For the year ended June 30, 2023 | |
Distributions | | |
From Ordinary Income | From Long-Term Capital Gains | Tax Return of Capital | Net Investment Loss | |
$ 834,110 | $ 2,534,869 | $ - | $ - | |
| | | | | |
For the year ended June 30, 2022 | |
Distributions | | |
From Ordinary Income | From Long-Term Capital Gains | Tax Return of Capital | Net Investment Loss | |
$ 7,500,765 | $ 11,746,707 | $ - | $ - | |
Permanent book to tax basis differences may result in reclassifications between the components of net assets. These differences have no impact on the results of operations or net assets.
4. Capital Share Transactions
| | | | | | | |
| | | | | | |
| | Year ended June 30, 2023 | | Year ended June 30, 2022 |
| | Shares | Amount | | Shares | Amount |
| | | | | | | |
Class A Shares: | | | | | |
Shares sold | 76,211 | $ 808,674 | | 131,319 | $ 1,710,244 |
Reinvested dividends and distributions | 11,370 | 117,336 | | 58,531 | 741,591 |
Shares repurchased | (168,774) | (1,794,850) | | (122,674) | (1,557,740) |
Net Increase/(Decrease) | (81,193) | $ (868,840) | | 67,176 | $ 894,095 |
Class C Shares: | | | | | |
Shares sold | 53,348 | $ 542,580 | | 48,373 | $ 647,356 |
Reinvested dividends and distributions | 7,366 | 74,253 | | 60,987 | 757,458 |
Shares repurchased | (323,680) | (3,329,518) | | (200,594) | (2,458,259) |
Net Increase/(Decrease) | (262,966) | $(2,712,685) | | (91,234) | $ (1,053,445) |
Class D Shares: | | | | | |
Shares sold | 606,807 | $ 6,472,180 | | 914,668 | $11,598,132 |
Reinvested dividends and distributions | 274,054 | 2,844,684 | | 1,225,701 | 15,615,425 |
Shares repurchased | (1,567,497) | (16,634,827) | | (2,315,355) | (29,083,904) |
Net Increase/(Decrease) | (686,636) | $(7,317,963) | | (174,986) | $ (1,870,347) |
Class I Shares: | | | | | |
Shares sold | 93,951 | $ 997,758 | | 59,747 | $ 758,459 |
Reinvested dividends and distributions | 5,670 | 58,799 | | 27,767 | 353,471 |
Shares repurchased | (179,492) | (1,923,542) | | (109,932) | (1,341,492) |
Net Increase/(Decrease) | (79,871) | $ (866,985) | | (22,418) | $ (229,562) |
Class S Shares: | | | | | |
Shares sold | 522 | $ 5,494 | | 611 | $ 7,771 |
Reinvested dividends and distributions | 95 | 988 | | 796 | 10,096 |
Shares repurchased | (4,623) | (49,453) | | (22) | (295) |
Net Increase/(Decrease) | (4,006) | $ (42,971) | | 1,385 | $ 17,572 |
Class T Shares: | | | | | |
Shares sold | 234,302 | $ 2,489,430 | | 362,289 | $ 4,761,019 |
Reinvested dividends and distributions | 22,539 | 233,507 | | 118,335 | 1,504,041 |
Shares repurchased | (442,216) | (4,653,480) | | (469,650) | (5,958,670) |
Net Increase/(Decrease) | (185,375) | $(1,930,543) | | 10,974 | $ 306,390 |
Janus Henderson Global Allocation Fund - Conservative
Notes to Financial Statements
5. Purchases and Sales of Investment Securities
For the year ended June 30, 2023, the aggregate cost of purchases and proceeds from sales of investment securities (excluding any short-term securities, short-term options contracts, TBAs, and in-kind transactions, as applicable) was as follows:
| | | | |
Purchases of
Securities | Proceeds from Sales
of Securities | Purchases of Long-
Term U.S. Government
Obligations | Proceeds from Sales
of Long-Term U.S.
Government Obligations |
$61,257,481 | $ 74,443,088 | $ - | $ - |
6. Subsequent Event
Management has evaluated whether any events or transactions occurred subsequent to June 30, 2023 and through the date of issuance of the Fund’s financial statements and determined that there were no material events or transactions that would require recognition or disclosure in the Fund’s financial statements.
Janus Henderson Global Allocation Fund - Conservative
Report of Independent Registered Public Accounting Firm
To the Board of Trustees of Janus Investment Fund and Shareholders of Janus Henderson Global Allocation Fund - Conservative
Opinion on the Financial Statements
We have audited the accompanying statement of assets and liabilities, including the schedule of investments, of Janus Henderson Global Allocation Fund - Conservative (one of the funds constituting Janus Investment Fund, referred to hereafter as the “Fund”) as of June 30, 2023, the related statement of operations for the year ended June 30, 2023, the statements of changes in net assets for each of the two years in the period ended June 30, 2023, including the related notes, and the financial highlights for each of the five years in the period ended June 30, 2023 (collectively referred to as the “financial statements”). In our opinion, the financial statements present fairly, in all material respects, the financial position of the Fund as of June 30, 2023, the results of its operations for the year then ended, the changes in its net assets for each of the two years in the period ended June 30, 2023 and the financial highlights for each of the five years in the period ended June 30, 2023 in conformity with accounting principles generally accepted in the United States of America.
Basis for Opinion
These financial statements are the responsibility of the Fund’s management. Our responsibility is to express an opinion on the Fund’s financial statements based on our audits. We are a public accounting firm registered with the Public Company Accounting Oversight Board (United States) (PCAOB) and are required to be independent with respect to the Fund in accordance with the U.S. federal securities laws and the applicable rules and regulations of the Securities and Exchange Commission and the PCAOB.
We conducted our audits of these financial statements in accordance with the standards of the PCAOB. Those standards require that we plan and perform the audit to obtain reasonable assurance about whether the financial statements are free of material misstatement, whether due to error or fraud.
Our audits included performing procedures to assess the risks of material misstatement of the financial statements, whether due to error or fraud, and performing procedures that respond to those risks. Such procedures included examining, on a test basis, evidence regarding the amounts and disclosures in the financial statements. Our audits also included evaluating the accounting principles used and significant estimates made by management, as well as evaluating the overall presentation of the financial statements. Our procedures included confirmation of securities owned as of June 30, 2023 by correspondence with the custodian, transfer agent and brokers; when replies were not received from brokers, we performed other auditing procedures. We believe that our audits provide a reasonable basis for our opinion.

Denver, Colorado
August 21, 2023
We have served as the auditor of one or more investment companies in Janus Henderson Funds since 1990.
Janus Henderson Global Allocation Fund - Conservative
Additional Information (unaudited)
Proxy Voting Policies and Voting Record
A description of the policies and procedures that the Fund uses to determine how to vote proxies relating to its portfolio securities is available without charge: (i) upon request, by calling 1-800-525-1093; (ii) on the Fund’s website at janushenderson.com/proxyvoting; and (iii) on the SEC’s website at http://www.sec.gov. Additionally, information regarding the Fund’s proxy voting record for the most recent twelve-month period ended June 30 is also available, free of charge, through janushenderson.com/proxyvoting and from the SEC’s website at http://www.sec.gov.
Full Holdings
The Fund files its complete portfolio holdings (schedule of investments) with the SEC as an exhibit to Form N-PORT within 60 days of the end of the first and third fiscal quarters, and in the annual report and semiannual report to shareholders. The Fund’s Form N-PORT filings and annual and semiannual reports: (i) are available on the SEC’s website at http://www.sec.gov; and (ii) are available without charge, upon request, by calling a Janus Henderson representative at 1-877-335-2687 (toll free) (or 1-800-525-3713 if you hold Class D shares). Portfolio holdings consisting of at least the names of the holdings are generally available on a monthly basis with a 30-day lag under Full Holdings for the Fund at janushenderson.com/info (or janushenderson.com/reports if you hold Class D Shares).
APPROVAL OF ADVISORY AGREEMENTS DURING THE PERIOD
The Trustees of Janus Aspen Series, each of whom serves as an “independent” Trustee (the “Trustees”), oversee the management of each portfolio of Janus Aspen Series (each, a “VIT Portfolio,” and collectively, the “VIT Portfolios”), as well as each fund of Janus Investment Fund (each, a “Fund,” and collectively, the “Funds” and together with the VIT Portfolios, the “Janus Henderson Funds,” and each, a “Janus Henderson Fund”). As required by law, the Trustees determine annually whether to continue the investment advisory agreement for each Janus Henderson Fund.
In connection with their most recent consideration of those agreements for each Janus Henderson Fund, the Trustees received and reviewed information provided by Janus Henderson Investors US LLC (the “Adviser”) in response to requests of the Trustees and their independent legal counsel. They also received and reviewed information and analysis provided by, and in response to requests of, their independent fee consultant. Throughout their consideration of the agreements, the Trustees were advised by their independent legal counsel. The Trustees met with management to consider the agreements, and also met separately in executive session with their independent legal counsel and their independent fee consultant.
At meetings held on November 9-10, 2022 and December 13-14, 2022, the Trustees evaluated the information provided by the Adviser and the independent fee consultant, as well as other information provided by the Adviser and the independent fee consultant during the year. Following such evaluation, the Trustees determined that the overall arrangements between each Janus Henderson Fund and the Adviser were fair and reasonable in light of the nature, extent, and quality of the services provided by the Adviser and its affiliates, the fees charged for those services, and other matters that the Trustees considered relevant in the exercise of their business judgment, and unanimously approved the continuation of the investment advisory agreement for each Janus Henderson Fund for the period from February 1, 2023 through February 1, 2024, subject to earlier termination as provided for in each agreement.
In considering the continuation of those agreements, the Trustees reviewed and analyzed various factors that they determined were relevant, including the factors described below, none of which by itself was considered dispositive. However, the material factors and conclusions that formed the basis for the Trustees’ determination to approve the continuation of the agreements are discussed separately below. Also included is a summary of the independent fee consultant’s conclusions and opinions that arose during, and were included as part of, the Trustees’ consideration of the agreements. “Management fees,” as used herein, reflect actual annual advisory fees and, for the purpose of peer comparisons any administration fees (excluding out of pocket costs), net of any waivers, paid by a fund as a percentage of average net assets.
Nature, Extent and Quality of Services
The Trustees reviewed the nature, extent, and quality of the services provided by the Adviser to the Janus Henderson Funds, taking into account the investment objective, strategies, and policies of each Janus Henderson Fund, and the knowledge the Trustees gained from their regular meetings with management on at least a quarterly basis and their ongoing review of information related to the Janus Henderson Funds. In addition, the Trustees reviewed the resources and key personnel of the Adviser, particularly noting those employees who provide investment and risk management services to the Janus Henderson Funds. The Trustees also considered other services provided to the Janus Henderson
Janus Henderson Global Allocation Fund - Conservative
Additional Information (unaudited)
Funds by the Adviser, such as managing the execution of portfolio transactions and the selection of broker-dealers for those transactions. The Trustees considered the Adviser’s role as administrator to the Janus Henderson Funds, noting that the Adviser generally does not receive a fee for its services as administrator, but is reimbursed for its out-of-pocket costs. The Trustees considered the role of the Adviser in monitoring adherence to the Janus Henderson Funds’ investment restrictions, providing support services for the Trustees and Trustee committees, and overseeing communications with Janus Henderson Fund shareholders and the activities of other service providers, including monitoring compliance with various policies and procedures of the Janus Henderson Funds and with applicable securities laws and regulations.
In this regard, the independent fee consultant noted that the Adviser provides a number of different services for the Janus Henderson Funds and their shareholders, ranging from investment management services to various other servicing functions, and that, in its view, the Adviser is a capable provider of those services. The independent fee consultant also provided its belief that the Adviser has developed a number of institutional competitive advantages that should enable it to provide superior investment and service performance over the long term.
The Trustees concluded that the nature, extent, and quality of the services provided by the Adviser to each Janus Henderson Fund were appropriate and consistent with the terms of the respective advisory agreements, and that, taking into account steps taken to address those Janus Henderson Funds whose performance lagged that of their peers for certain periods, the Janus Henderson Funds were likely to benefit from the continued provision of those services. They also concluded that the Adviser had sufficient personnel, with the appropriate education and experience, to serve the Janus Henderson Funds effectively and had demonstrated its ability to attract well-qualified personnel.
Performance of the Funds
The Trustees considered the performance results of each Janus Henderson Fund over various time periods. They noted that they considered Janus Henderson Fund performance data throughout the year, including periodic meetings with each Janus Henderson Fund’s portfolio manager(s), and also reviewed information comparing each Janus Henderson Fund’s performance with the performance of comparable fund peer groups identified by Broadridge Financial Solutions, Inc. (“Broadridge”), an independent data provider, and with the Janus Henderson Fund’s benchmark index. In this regard, the independent fee consultant found that the overall Janus Henderson Funds’ performance has been reasonable, noting that: (i) for the 36 months ended May 31, 2022, approximately 38% of the Janus Henderson Funds were in the top two quartiles of their Broadridge peer groups; (ii) for the 36 months ended September 30, 2022, approximately 45% of the Janus Henderson Funds were in the top two quartiles of performance as reported by Morningstar, and (iii) for the 12 months ended September 30, 2022, approximately 55% of the Janus Henderson Funds were in the top two quartiles of performance as reported by Morningstar.
The Trustees considered the performance of each Janus Henderson Fund, noting that performance may vary by share class, and noted the following with respect to the Funds:
Asset Allocation Funds
· For Janus Henderson Global Allocation Fund – Conservative, the Trustees noted that the Fund’s performance was in the third Broadridge quartile for the 36 months ended May 31, 2022 and the bottom Broadridge quartile for the 12 months ended May 31, 2022. The Trustees noted the reasons for the Fund’s underperformance and the steps the Adviser had taken or was taking to improve performance.
· For Janus Henderson Global Allocation Fund – Growth, the Trustees noted that the Fund’s performance was in the bottom Broadridge quartile for the 36 months ended May 31, 2022 and the bottom Broadridge quartile for the 12 months ended May 31, 2022. The Trustees noted the reasons for the Fund’s underperformance and the steps the Adviser had taken or was taking to improve performance.
· For Janus Henderson Global Allocation Fund – Moderate, the Trustees noted that the Fund’s performance was in the bottom Broadridge quartile for the 36 months ended May 31, 2022 and the bottom Broadridge quartile for the 12 months ended May 31, 2022. The Trustees noted the reasons for the Fund’s underperformance and the steps the Adviser had taken or was taking to improve performance.
Fixed-Income Funds
· For Janus Henderson Absolute Return Income Opportunities Fund, the Trustees noted that the Fund’s performance was in the third Broadridge quartile for the 36 months ended May 31, 2022 and the first Broadridge
Janus Henderson Global Allocation Fund - Conservative
Additional Information (unaudited)
quartile for the 12 months ended May 31, 2022. The Trustees noted the reasons for the Fund’s underperformance, the steps the Adviser had taken or was taking to improve performance, and that the performance trend was improving.
· For Janus Developed World Bond Fund, the Trustees noted that the Fund’s performance was in the bottom Broadridge quartile for the 36 months ended May 31, 2022 and the bottom Broadridge quartile for the 12 months ended May 31, 2022. The Trustees noted the reasons for the Fund’s underperformance and the steps the Adviser had taken or was taking to improve performance.
· For Janus Henderson Flexible Bond Fund, the Trustees noted that the Fund’s performance was in the first Broadridge quartile for the 36 months ended May 31, 2022 and the second Broadridge quartile for the 12 months ended May 31, 2022.
· For Janus Henderson Global Bond Fund, the Trustees noted that the Fund’s performance was in the third Broadridge quartile for the 36 months ended May 31, 2022 and the bottom Broadridge quartile for the 12 months ended May 31, 2022. The Trustees noted the reasons for the Fund’s underperformance and the steps the Adviser had taken or was taking to improve performance.
· For Janus Henderson High-Yield Fund, the Trustees noted that the Fund’s performance was in the third Broadridge quartile for the 36 months ended May 31, 2022 and the bottom Broadridge quartile for the 12 months ended May 31, 2022. The Trustees noted the reasons for the Fund’s underperformance and the steps the Adviser had taken or was taking to improve performance.
· For Janus Henderson Multi-Sector Income Fund, the Trustees noted that the Fund’s performance was in the second Broadridge quartile for the 36 months ended May 31, 2022 and the third Broadridge quartile for the 12 months ended May 31, 2022.
· For Janus Henderson Short Duration Flexible Bond Fund, the Trustees noted that the Fund’s performance was in the third Broadridge quartile for the 36 months ended May 31, 2022 and the bottom Broadridge quartile for the 12 months ended May 31, 2022. The Trustees noted the reasons for the Fund’s underperformance and the steps the Adviser had taken or was taking to improve performance.
Global and International Equity Funds
· For Janus Henderson Asia Equity Fund, the Trustees noted that the Fund’s performance was in the third Broadridge quartile for the 36 months ended May 31, 2022 and the third Broadridge quartile for the 12 months ended May 31, 2022. The Trustees noted the reasons for the Fund’s underperformance, while also noting that the Fund has a performance fee structure that results in lower management fees during periods of underperformance, and the steps the Adviser had taken or was taking to improve performance.
· For Janus Henderson Emerging Markets Fund, the Trustees noted that the Fund’s performance was in the third Broadridge quartile for the 36 months ended May 31, 2022 and the third Broadridge quartile for the 12 months ended May 31, 2022. The Trustees noted the reasons for the Fund’s underperformance and the steps the Adviser had taken or was taking to improve performance.
· For Janus Henderson European Focus Fund, the Trustees noted that the Fund’s performance was in the first Broadridge quartile for the 36 months ended May 31, 2022 and the second Broadridge quartile for the 12 months ended May 31, 2022.
· For Janus Henderson Global Equity Income Fund, the Trustees noted that the Fund’s performance was in the third Broadridge quartile for the 36 months ended May 31, 2022 and the first Broadridge quartile for the 12 months ended May 31, 2022. The Trustees noted the reasons for the Fund’s underperformance, the steps the Adviser had taken or was taking to improve performance, and that the performance trend was improving.
· For Janus Henderson Global Life Sciences Fund, the Trustees noted that the Fund’s performance was in the third Broadridge quartile for the 36 months ended May 31, 2022 and the second Broadridge quartile for the 12 months ended May 31, 2022. The Trustees noted the reasons for the Fund’s underperformance, the steps the Adviser had taken or was taking to improve performance, and that the performance trend was improving.
Janus Henderson Global Allocation Fund - Conservative
Additional Information (unaudited)
· For Janus Henderson Global Sustainable Equity Fund, the Trustees noted that the Fund’s performance was in the second Broadridge quartile for the 12 months ended May 31, 2022. The Trustees noted that 36 month-end performance was not yet available.
· For Janus Henderson Global Real Estate Fund, the Trustees noted that the Fund’s performance was in the second Broadridge quartile for the 36 months ended May 31, 2022 and the bottom Broadridge quartile for the 12 months ended May 31, 2022.
· For Janus Henderson Global Research Fund, the Trustees noted that the Fund’s performance was in the second Broadridge quartile for the 36 months ended May 31, 2022 and the first Broadridge quartile for the 12 months ended May 31, 2022.
· For Janus Henderson Global Select Fund, the Trustees noted that the Fund’s performance was in the first Broadridge quartile for the 36 months ended May 31, 2022 and the first Broadridge quartile for the 12 months ended May 31, 2022.
· For Janus Henderson Global Technology and Innovation Fund, the Trustees noted that the Fund’s performance was in the second Broadridge quartile for the 36 months ended May 31, 2022 and the second Broadridge quartile for the 12 months ended May 31, 2022.
· For Janus Henderson International Opportunities Fund, the Trustees noted that the Fund’s performance was in the bottom Broadridge quartile for the 36 months ended May 31, 2022 and the third Broadridge quartile for the 12 months ended May 31, 2022. The Trustees noted the reasons for the Fund’s underperformance and the steps the Adviser had taken or was taking to improve performance.
· For Janus Henderson Overseas Fund, the Trustees noted that the Fund’s performance was in the first Broadridge quartile for the 36 months ended May 31, 2022 and the first Broadridge quartile for the 12 months ended May 31, 2022.
· For Janus Henderson Responsible International Dividend Fund (formerly the Janus Henderson Dividend & Income Builder Fund), the Trustees noted that the Fund’s performance was in the bottom Broadridge quartile for the 36 months ended May 31, 2022 and the bottom Broadridge quartile for the 12 months ended May 31, 2022. The Trustees noted the reasons for the Fund’s underperformance and the steps the Adviser had taken or was taking to improve performance.
Money Market Funds
· For Janus Henderson Government Money Market Fund, the Trustees noted that the Fund’s performance was in the third Broadridge quartile for the 36 months ended May 31, 2022 and the bottom Broadridge quartile for the 12 months ended May 31, 2022. The Trustees noted the reasons for the Fund’s underperformance and the steps the Adviser had taken or was taking to improve performance.
· For Janus Henderson Money Market Fund, the Trustees noted that the Fund’s performance was in the third Broadridge quartile for the 36 months ended May 31, 2022 and the bottom Broadridge quartile for the 12 months ended May 31, 2022. The Trustees noted the reasons for the Fund’s underperformance and the steps the Adviser had taken or was taking to improve performance.
Multi-Asset Funds
· For Janus Henderson Adaptive Global Allocation Fund, the Trustees noted that the Fund’s performance was in bottom Broadridge quartile for the 36 months ended May 31, 2022 and the second Broadridge quartile for the 12 months ended May 31, 2022. The Trustees noted the reasons for the Fund’s underperformance, the steps the Adviser had taken or was taking to improve performance, and that the performance trend was improving.
· For Janus Henderson Balanced Fund, the Trustees noted that the Fund’s performance was in the first Broadridge quartile for the 36 months ended May 31, 2022 and the first Broadridge quartile for the 12 months ended May 31, 2022.
Janus Henderson Global Allocation Fund - Conservative
Additional Information (unaudited)
U.S. Equity Funds
· For Janus Henderson Adaptive Risk Managed U.S. Equity Fund, the Trustees noted that the Fund’s performance was in the bottom Broadridge quartile for the 36 months ended May 31, 2022 and the second Broadridge quartile for the 12 months ended May 31, 2022. The Trustees noted the reasons for the Fund’s underperformance, the steps the Adviser had taken or were taking to improve performance, and that the performance trend was improving.
· For Janus Henderson Contrarian Fund, the Trustees noted that the Fund’s performance was in the first Broadridge quartile for the 36 months ended May 31, 2022 and the bottom Broadridge quartile for the 12 months ended May 31, 2022.
· For Janus Henderson Enterprise Fund, the Trustees noted that the Fund’s performance was in the second Broadridge quartile for the 36 months ended May 31, 2022 and the first Broadridge quartile for the 12 months ended May 31, 2022.
· For Janus Henderson Forty Fund, the Trustees noted that the Fund’s performance was in the third Broadridge quartile for the 36 months ended May 31, 2022 and the bottom Broadridge quartile for the 12 months ended May 31, 2022. The Trustees noted the reasons for the Fund’s underperformance and the steps the Adviser had taken or was taking to improve performance.
· For Janus Henderson Growth and Income Fund, the Trustees noted that the Fund’s performance was in the bottom Broadridge quartile for the 36 months ended May 31, 2022 and the first Broadridge quartile for the 12 months ended May 31, 2022. The Trustees noted the reasons for the Fund’s underperformance, the steps the Adviser had taken or was taking to improve performance, and that the performance trend was improving.
· For Janus Henderson Mid Cap Value Fund, the Trustees noted that the Fund’s performance was in the bottom Broadridge quartile for the 36 months ended May 31, 2022 and the second Broadridge quartile for the 12 months ended May 31, 2022. The Trustees noted the reasons for the Fund’s underperformance, while also noting that the Fund has a performance fee structure that results in lower management fees during periods of underperformance, the steps the Adviser had taken or was taking to improve performance, and that the performance trend was improving.
· For Janus Henderson Research Fund, the Trustees noted that the Fund’s performance was in the third Broadridge quartile for the 36 months ended May 31, 2022 and the third Broadridge quartile for the 12 months ended May 31, 2022. The Trustees noted the reasons for the Fund’s underperformance, while also noting that the Fund has a performance fee structure that results in lower management fees during periods of underperformance and the steps the Adviser had taken or was taking to improve performance.
· For Janus Henderson Small Cap Value Fund, the Trustees noted that the Fund’s performance was in the bottom Broadridge quartile for the 36 months ended May 31, 2022 and the second Broadridge quartile for the 12 months ended May 31, 2022. The Trustees noted the reasons for the Fund’s underperformance, while also noting that the Fund has a performance fee structure that results in lower management fees during periods of underperformance, the steps the Adviser had taken or was taking to improve performance, and that the performance trend was improving.
· For Janus Henderson Small-Mid Cap Value Fund, the Trustees noted that the Fund’s performance was in the bottom Broadridge quartile for the 36 months ended May 31, 2022 and the second Broadridge quartile for the 12 months ended May 31, 2022. The Trustees noted the reasons for the Fund’s underperformance, while also noting that the Fund has a performance fee structure that results in lower management fees during periods of underperformance, the steps the Adviser had taken or was taking to improve performance, and that the performance trend is improving.
· For Janus Henderson Triton Fund, the Trustees noted that the Fund’s performance was in the bottom Broadridge quartile for the 36 months ended May 31, 2022 and the second Broadridge quartile for the 12 months ended May 31, 2022. The Trustees noted the reasons for the Fund’s underperformance, the steps the Adviser had taken or was taking to improve performance, and that the performance trend was improving.
· For Janus Henderson Venture Fund, the Trustees noted that the Fund’s performance was in the bottom Broadridge quartile for the 36 months ended May 31, 2022 and the second Broadridge quartile for the 12 months ended May
Janus Henderson Global Allocation Fund - Conservative
Additional Information (unaudited)
31, 2022. The Trustees noted the reasons for the Fund’s underperformance, the steps the Adviser had taken or was taking to improve performance, and that the performance trend was improving.
In consideration of each Janus Henderson Fund’s performance, the Trustees concluded that, taking into account the factors relevant to performance, as well as other considerations, including steps taken to improve performance, as applicable, the Janus Henderson Fund’s performance warranted continuation of such Janus Henderson Fund’s investment advisory agreement.
Costs of Services Provided
The Trustees examined information regarding the fees and expenses of each Janus Henderson Fund in comparison to similar information for other comparable funds as provided by Broadridge, an independent data provider. They also reviewed an analysis of that information provided by their independent fee consultant. The independent fee consultant provided its belief that the management fees charged by the Adviser to each of the Janus Henderson Funds under the current investment advisory and administration agreements are reasonable in relation to the services provided by the Adviser. The independent fee consultant found: (1) the total expenses and management fees of the Janus Henderson Funds to be reasonable relative to other comparable mutual funds; (2) the total expenses, on average, were 6% under the average total expenses of the respective Broadridge peer group; and (3) the management fees for the Janus Henderson Funds, on average, were 5% under the average management fees for the respective Broadridge peer group. The Trustees also considered the total expenses for each share class of each Janus Henderson Fund compared to the average total expenses for its Broadridge Expense Group and to average total expenses for its Broadridge Expense Universe.
For Janus Henderson Funds with three or more years of performance history, the independent fee consultant also performed a systematic “focus list” analysis of expenses which assessed fund fees in the context of fund performance being delivered. Based on this analysis, the independent fee consultant found that the combination of service quality/performance and expenses on these individual Janus Henderson Funds was reasonable in light of performance trends, performance histories, changes in portfolio management, relative average net asset levels, and the existence of performance fees, breakpoints, and/or expense waivers on such Janus Henderson Funds.
The Trustees considered the methodology used by the Adviser in determining compensation payable to portfolio managers, the competitive environment for investment management talent, and the competitive market for mutual funds in different distribution channels.
The Trustees also reviewed management fees charged by the Adviser to comparable separate account clients and to comparable non-affiliated funds subadvised by the Adviser (for which the Adviser provides only or primarily portfolio management services). Although in most instances subadvisory and separate account fee rates for various investment strategies were lower than management fee rates for Janus Henderson Funds having a similar strategy, the Trustees considered that the Adviser noted that, under the terms of the management agreements with the Janus Henderson Funds, the Adviser performs significant additional services for the Janus Henderson Funds that it does not provide to those other clients, including administration services, oversight of the Janus Henderson Funds’ other service providers, Trustee support, regulatory compliance and numerous other services, and that, in serving the Janus Henderson Funds, the Adviser assumes many legal risks and other costs that it does not assume in servicing its other clients. Moreover, the Trustees noted that the independent fee consultant found that: (1) the management fees the Adviser charges to the Janus Henderson Funds are reasonable in relation to the management fees the Adviser charges to funds subadvised by the Adviser and to the fees the Adviser charges to its institutional separate account clients; (2) these subadvised and institutional separate accounts have different service and infrastructure needs and operate in markets very different from the retail fund market; (3) Janus Henderson mutual fund investors enjoy reasonable fees relative to the fees charged in these other markets; and (4) as part of its 2022 review, 9 of 11 Janus Henderson Funds have lower management fees than similar funds subadvised by the Adviser. The Trustees noted that for the two Janus Henderson Funds that did not, management fees for each were under the average of its 15(c) peer group.
The Trustees considered the fees for each Janus Henderson Fund for its fiscal year ended in 2021 and noted the following with regard to each Janus Henderson Fund’s total expenses, net of applicable fee waivers (the Fund’s “total expenses”) as reflected in the comparative information provided by Broadridge:
Janus Henderson Global Allocation Fund - Conservative
Additional Information (unaudited)
Asset Allocation Funds
· For Janus Henderson Global Allocation Fund – Conservative, the Trustees noted that, although the Fund’s total expenses exceeded the peer group average for certain share classes, overall the Fund’s total expenses were reasonable. The Trustees also noted that the Adviser has contractually agreed to limit the Fund’s expenses.
· For Janus Henderson Global Allocation Fund – Growth, the Trustees noted that, although the Fund’s total expenses exceeded the peer group average for certain share classes, overall the Fund’s total expenses were reasonable. The Trustees also noted that the Adviser has contractually agreed to limit the Fund’s expenses, although this limit did not apply because the Fund’s total expenses as shown were below the applicable fee limit.
· For Janus Henderson Global Allocation Fund – Moderate, the Trustees noted that, although the Fund’s total expenses exceeded the peer group average for one share class, overall the Fund’s total expenses were reasonable. The Trustees also noted that the Adviser has contractually agreed to limit the Fund’s expenses.
Fixed-Income Funds
· For Janus Henderson Absolute Return Income Opportunities Fund, the Trustees noted that, although the Fund’s total expenses exceeded the peer group average for certain share classes, overall the Fund’s total expenses were reasonable. The Trustees also noted that the Adviser has contractually agreed to limit the Fund’s expenses.
· For Janus Henderson Developed World Bond Fund, the Trustees noted that, although the Fund’s total expenses exceeded the peer group average for one share class, overall the Fund’s total expenses were reasonable. The Trustees also noted that the Adviser has contractually agreed to limit the Fund’s expenses.
· For Janus Henderson Flexible Bond Fund, the Trustees noted that, although the Fund’s total expenses exceeded the peer group average for certain share classes, overall the Fund’s total expenses were reasonable. The Trustees also noted that the Adviser has contractually agreed to limit the Fund’s expenses, although this limit did not apply because the Fund’s total expenses as shown were below the applicable fee limit.
· For Janus Henderson Global Bond Fund, the Trustees noted that, although the Fund’s total expenses exceeded the peer group average for certain share classes, overall the Fund’s total expenses were reasonable. The Trustees also noted that the Adviser has contractually agreed to limit the Fund’s expenses.
· For Janus Henderson High-Yield Fund, the Trustees noted that, although the Fund’s total expenses exceeded the peer group average for certain share classes, overall the Fund’s total expenses were reasonable. The Trustees also noted that the Adviser has contractually agreed to limit the Fund’s expenses.
· For Janus Henderson Multi-Sector Income Fund, the Trustees noted that, although the Fund’s total expenses exceeded the peer group average for certain share classes, overall the Fund’s total expenses were reasonable. The Trustees also noted that the Adviser has contractually agreed to limit the Fund’s expenses.
· For Janus Henderson Short Duration Flexible Bond Fund, the Trustees noted that, although the Fund’s total expenses exceeded the peer group average for certain share classes, overall the Fund’s total expenses were reasonable. The Trustees also noted that the Adviser has contractually agreed to limit the Fund’s expenses.
Global and International Equity Funds
· For Janus Henderson Asia Equity Fund, the Trustees noted that, although the Fund’s total expenses exceeded the peer group average for certain share classes, overall the Fund’s total expenses were reasonable. The Trustees also noted that the Adviser has contractually agreed to limit the Fund’s expenses.
· For Janus Henderson Emerging Markets Fund, the Trustees noted that, although the Fund’s total expenses exceeded the peer group average for certain share classes, overall the Fund’s total expenses were reasonable. The Trustees also noted that the Adviser has contractually agreed to limit the Fund’s expenses.
· For Janus Henderson European Focus Fund, the Trustees noted that, although the Fund’s total expenses exceeded the peer group average for one share class, overall the Fund’s expenses were reasonable. The Trustees also noted that the Adviser has contractually agreed to limit the Fund’s expenses.
· For Janus Henderson Global Equity Income Fund, the Trustees noted that, although the Fund’s total expenses exceeded the peer group average for one share class, overall the Fund’s total expenses were reasonable. The
Janus Henderson Global Allocation Fund - Conservative
Additional Information (unaudited)
Trustees also noted that the Adviser has contractually agreed to limit the Fund’s expenses, although this limit did not apply because the Fund’s total expenses as shown were below the applicable fee limit.
· For Janus Henderson Global Life Sciences Fund, the Trustees noted that the Fund’s total expenses were below the peer group average for all share classes.
· For Janus Henderson Global Real Estate Fund, the Trustees noted that, although the Fund’s total expenses exceeded the peer group average for certain share classes, overall the Fund’s total expenses were reasonable. The Trustees also noted that the Adviser has contractually agreed to limit the Fund’s expenses, although this limit did not apply because the Fund’s total expenses as shown were below the applicable fee limit.
· For Janus Henderson Global Research Fund, the Trustees noted that, although the Fund’s total expenses exceeded the peer group average for one share class, overall the Fund’s total expenses were reasonable. The Trustees also noted that the Adviser has contractually agreed to limit the Fund’s expenses, although this limit did not apply because the Fund’s total expenses as shown were below the applicable fee limit.
· For Janus Henderson Global Select Fund, the Trustees noted that, although the Fund’s total expenses exceeded the peer group average for certain share classes, overall the Fund’s total expenses were reasonable. The Trustees also noted that the Adviser has contractually agreed to limit the Fund’s expenses.
· For Janus Henderson Global Sustainable Equity Fund, the Trustees noted that, although the Fund’s total expenses exceeded the peer group average for certain share classes, overall the Fund’s expenses were reasonable. The Trustees also noted that the Adviser has contractually agreed to limit the Fund’s expenses.
· For Janus Henderson Global Technology and Innovation Fund, the Trustees noted that the Fund’s total expenses were below the peer group average for all share classes.
· For Janus Henderson International Opportunities Fund, the Trustees noted that, although the Fund’s total expenses exceeded the peer group average for certain share classes, overall the Fund’s expenses were reasonable. The Trustees also noted that the Adviser has contractually agreed to limit the Fund’s expenses.
· For Janus Henderson Overseas Fund, the Trustees noted that although the Fund’s total expenses exceeded the peer group average for certain share classes, overall the Fund’s total expenses were reasonable. The Trustees also noted that the Adviser has contractually agreed to limit the Fund’s expenses, although this limit did not apply because the Fund’s total expenses as shown were below the applicable fee limit.
· For Janus Henderson Responsible International Dividend Fund (formerly the Janus Henderson Dividend & Income Builder Fund), the Trustees noted that, although the Fund’s total expenses exceeded the peer group for one share class, overall the Fund’s total expenses were reasonable. The Trustees also noted that the Adviser has contractually agreed to limit the Fund’s expenses.
Money Market Funds
· For Janus Henderson Government Money Market Fund, the Trustees noted that the Fund’s total expenses were below the peer group average for all share classes.
· For Janus Henderson Money Market Fund, the Trustees noted that the Fund’s total expenses were below the peer group average for all share classes.
Multi-Asset Funds
· For Janus Henderson Adaptive Global Allocation Fund, the Trustees noted that the Fund’s total expenses were below the peer group average for all share classes.
· For Janus Henderson Balanced Fund, the Trustees noted that, although the Fund’s total expenses exceeded the peer group average for certain share classes, overall the Fund’s total expenses were reasonable. The Trustees also noted that the Adviser has contractually agreed to limit the Fund’s expenses, although this limit did not apply because the Fund’s total expenses as shown were below the applicable fee limit.
Janus Henderson Global Allocation Fund - Conservative
Additional Information (unaudited)
U.S. Equity Funds
· For Janus Henderson Adaptive Risk Managed U.S. Equity Fund, the Trustees noted that, although the Fund’s total expenses exceeded the peer group average for certain share classes, overall the Fund’s total expenses were reasonable. The Trustees also noted that the Adviser has contractually agreed to limit the Fund’s expenses, although this limit did not apply because the Fund’s total expenses as shown were below the applicable fee limit.
· For Janus Henderson Contrarian Fund, the Trustees noted that, although the Fund’s total expenses exceeded the peer group average for all share classes, overall the Fund’s total expenses were reasonable. The Trustees also noted that the Adviser had contractually agreed to limit the Fund’s expenses.
· For Janus Henderson Enterprise Fund, the Trustees noted that, although the Fund’s total expenses exceeded the peer group average for certain share classes, overall the Fund’s total expenses were reasonable. The Trustees also noted that the Adviser has contractually agreed to limit the Fund’s expenses, although this limit did not apply because the Fund’s total expenses as shown were below the applicable fee limit.
· For Janus Henderson Forty Fund, the Trustees noted that, although the Fund’s total expenses exceeded the peer group average for certain share classes, overall the Fund’s total expenses were reasonable. The Trustees also noted that the Adviser has contractually agreed to limit the Fund’s expenses, although this limit did not apply because the Fund’s total expenses as shown were below the applicable fee limit.
· For Janus Henderson Growth and Income Fund, the Trustees noted that, although the Fund’s total expenses exceeded the peer group average for certain share classes, overall the Fund’s total expenses were reasonable. The Trustees also noted that the Adviser has contractually agreed to limit the Fund’s expenses, although this limit did not apply because the Fund’s total expenses as shown were below the applicable fee limit.
· For Janus Henderson Mid Cap Value Fund, the Trustees noted that the Fund’s total expenses were below the peer group average for all share classes.
· For Janus Henderson Research Fund, the Trustees noted that, although the Fund’s total expenses exceeded the peer group average for certain share classes, overall the Fund’s total expenses were reasonable. The Trustees also noted that the Adviser has contractually agreed to limit the Fund’s expenses.
· For Janus Henderson Small Cap Value Fund, the Trustees noted that, although the Fund’s total expenses exceeded the peer group average for one share class, overall the Fund’s total expenses were reasonable. The Trustees also noted that the Adviser has contractually agreed to limit the Fund’s expenses, although this limit did not apply because the Fund’s total expenses as shown were below the applicable fee limit.
· For Janus Henderson Small-Mid Cap Value Fund, the Trustees noted that the Fund’s total expenses were below the peer group average for all share classes.
· For Janus Henderson Triton Fund, the Trustees noted that, although the Fund’s total expenses exceeded the peer group average for one share class, overall the Fund’s total expenses were reasonable. The Trustees also noted that the Adviser has contractually agreed to limit the Fund’s expenses, although this limit did not apply because the Fund’s total expenses as shown were below the applicable fee limit.
· For Janus Henderson Venture Fund, the Trustees noted that although the Fund’s total expenses exceeded the peer group average for one share class, overall the Fund’s total expenses were reasonable. The Trustees also noted that the Adviser has contractually agreed to limit the Fund’s expenses, although this limit did not apply because the Fund’s total expenses as shown were below the applicable fee limit.
The Trustees reviewed information on the overall profitability to the Adviser and its affiliates from their relationships with the Janus Henderson Funds, and considered profitability data of other publicly traded mutual fund advisers. The Trustees recognized that profitability comparisons among fund managers are difficult because of the variation in the type of comparative information that is publicly available, and the profitability of any fund manager is affected by numerous factors, including the organizational structure of the particular fund manager, differences in complex size, difference in product mix, difference in types of business (mutual fund, institutional and other), differences in the types of funds and other accounts it manages, possible other lines of business, the methodology for allocating expenses and the fund manager’s capital structure and cost of capital.
Janus Henderson Global Allocation Fund - Conservative
Additional Information (unaudited)
Additionally, the Trustees considered the estimated profitability to the Adviser from the investment management services it provided to each Janus Henderson Fund. In their review, the Trustees considered whether the Adviser receive adequate incentives and resources to manage the Janus Henderson Funds effectively. In reviewing profitability, the Trustees noted that the estimated profitability for an individual Janus Henderson Fund is necessarily a product of the allocation methodology utilized by the Adviser to allocate its expenses as part of the estimated profitability calculation. In this regard, the Trustees noted that the independent fee consultant found as part of its 2022 review that (1) the expense allocation methodology and rationales utilized by the Adviser were reasonable and (2) no clear correlation exists between expense allocations and operating margins. The Trustees also considered that the estimated profitability for an individual Janus Henderson Fund was influenced by a number of factors, including not only the allocation methodology selected, but also the presence of fee waivers and expense caps, and whether the Janus Henderson Fund’s investment management agreement contained breakpoints or a performance fee component. The Trustees determined, after taking into account these factors, among others, that the Adviser’s estimated profitability with respect to each Janus Henderson Fund was not unreasonable in relation to the services provided, and that the variation in the range of such estimated profitability among the Janus Henderson Funds was not a material factor in the Board’s approval of the reasonableness of any Janus Henderson Fund’s investment management fees.
The Trustees concluded that the management fees payable by each Janus Henderson Fund to the Adviser were reasonable in relation to the nature, extent, and quality of the services provided, taking into account the fees charged by other advisers for managing comparable mutual funds with similar strategies, the fees the Adviser charges to other clients, and, as applicable, the impact of fund performance on management fees payable by the Janus Henderson Funds. The Trustees also concluded that each Janus Henderson Fund’s total expenses were reasonable, taking into account the size of the Janus Henderson Fund, the quality of services provided by the Adviser, the investment performance of the Janus Henderson Fund, and any expense limitations agreed to or provided by the Adviser.
Economies of Scale
The Trustees considered information about the potential for the Adviser to realize economies of scale as the assets of the Janus Henderson Funds increase. They noted that their independent fee consultant published a report to the Trustees in June 2022 which provided its research and analysis into economies of scale. They also noted that, although many Janus Henderson Funds pay advisory fees at a fixed base rate as a percentage of net assets, without any breakpoints or performance fees, their independent fee consultant concluded that 75% of these Janus Henderson Funds’ have contractual management fees (gross of waivers) below their Broadridge Expense Group averages. The Trustees also noted the following from the independent fee consultant’s report: (1) that 31% of Janus Henderson Funds had management fee breakpoints in place whereby investors pay lower management fees as fund AUM increases; (2) that 29% of Janus Henderson Funds have low flat-rate fees and performance fees where the Adviser is incentivized to invest in resources which drive Janus Henderson Fund performance; and (3) that 39% of Janus Henderson Funds have low flat-rate fees versus peers where investors pay low fixed fees when the Janus Henderson Fund is small/midsized and higher fees when the Janus Henderson Fund grows in assets. The Trustees also noted that the Janus Henderson Funds share directly in economies of scale through the significant investments made by the Adviser and its affiliates related to services provided to the Funds and the lower charges of third-party service providers that are based in part on the combined scale of all of the Janus Henderson Funds.
The Trustees also considered the independent fee consultant’s conclusion that, given the limitations of various analytical approaches to economies of scale and their conflicting results, it is difficult to analytically confirm or deny the existence of economies of scale in the Janus Henderson complex. In this regard, the independent consultant concluded that (1) to the extent there were economies of scale at the Adviser, the Adviser’s general strategy of setting fixed management fees below peers appeared to share any such economies with investors even on smaller Janus Henderson Funds which have not yet achieved those economies and (2) by setting lower fixed fees from the start on these Janus Henderson Funds, the Adviser appeared to be investing to increase the likelihood that these Janus Henderson Funds will grow to a level to achieve any economies of scale that may exist. Further, the independent fee consultant provided its belief that Janus Henderson Fund investors are well-served by the fee levels and performance fee structures in place on the Janus Henderson Funds in light of any economies of scale that may be present at the Adviser.
Based on all of the information reviewed, including the recent and past research and analysis conducted by the Trustees’ independent fee consultant, the Trustees concluded that the current fee structure of each Janus Henderson Fund was reasonable and that the current rates of fees do reflect a sharing between the Adviser and the Janus
Janus Henderson Global Allocation Fund - Conservative
Additional Information (unaudited)
Henderson Fund of any economies of scale that may be present at the current asset level of the Janus Henderson Fund.
Other Benefits to the Adviser
The Trustees also considered benefits that accrue to the Adviser and its affiliates from their relationships with the Janus Henderson Funds. They recognized that two affiliates of the Adviser separately serve the Janus Henderson Funds as transfer agent and distributor, respectively, and the transfer agent receives compensation directly from the non-money market Janus Henderson Funds for services provided, and that such compensation contributes to the overall profitability of the Adviser and its affiliates that results from their relationship with the Janus Henderson Funds. The Trustees also considered the Adviser’s past and proposed use of commissions paid by the Janus Henderson Funds on portfolio brokerage transactions to obtain proprietary and third-party research products and services benefiting the Janus Henderson Fund and/or other clients of the Adviser and/or the Adviser. The Trustees concluded that the Adviser’s use of these types of client commission arrangements to obtain proprietary and third-party research products and services was consistent with regulatory requirements and guidelines and was likely to benefit each Janus Henderson Fund. The Trustees also concluded that, other than the services provided by the Adviser and its affiliates pursuant to the agreements and the fees to be paid by each Janus Henderson Fund therefor, the Janus Henderson Funds and the Adviser may potentially benefit from their relationship with each other in other ways. They concluded that the Adviser and its affiliates share directly in economies of scale through the lower charges of third-party service providers that are based in part on the combined scale of the Janus Henderson Funds and other clients serviced by the Adviser and its affiliates. They also concluded that the Adviser benefits from the receipt of research products and services acquired through commissions paid on portfolio transactions of the Janus Henderson Funds and that the Janus Henderson Funds benefit from the Adviser’s receipt of those products and services as well as research products and services acquired through commissions paid by other clients of the Adviser. They further concluded that the success of any Janus Henderson Fund could attract other business to the Adviser or other Janus Henderson Funds, and that the success of the Adviser could enhance the Adviser’s ability to serve the Janus Henderson Funds.
Janus Henderson Global Allocation Fund - Conservative
Liquidity Risk Management Program (unaudited)
Liquidity Risk Management Program
Rule 22e-4 under the Investment Company Act of 1940, as amended (the “Liquidity Rule”), requires open-end funds (but not money market funds) to adopt and implement a written liquidity risk management program (the “LRMP”) that is reasonably designed to assess and manage liquidity risk, which is the risk that a fund could not meet redemption requests without significant dilution of remaining investors’ interest in the fund. The Fund has implemented a LRMP, which incorporates the following elements: (i) assessment, management, and periodic review of liquidity risk; (ii) classification of portfolio holdings; (iii) the establishment and monitoring of a highly liquid investment minimum, as applicable; (iv) a 15% limitation on a Fund’s illiquid investments; (v) redemptions in-kind; and (vi) board oversight.
The Trustees of the Fund (the “Trustees”) have designated Janus Henderson Investors US LLC, the Fund’s investment adviser (the “Adviser”), as the Program Administrator for the LRMP responsible for administering the LRMP and carrying out the specific responsibilities of the LRMP. A working group comprised of various teams within the Adviser’s business is responsible for administering the LRMP and carrying out the specific responsibilities of different aspects of the LRMP (the “Liquidity Risk Working Group”). In assessing each Fund’s liquidity risk, the Liquidity Risk Working Group periodically considers, as relevant, factors including (i) the liquidity of a Fund’s portfolio investments during normal and reasonably foreseeable stressed conditions; (ii) whether a Fund’s investment strategy is appropriate for an open-end fund; (iii) the extent to which a Fund’s strategy involves a relatively concentrated portfolio or large positions in any issuer; (iv) a Fund’s use of borrowing for investment purposes; and (v) a Fund’s use of derivatives.
The Liquidity Rule requires the Trustees to review at least annually a written report provided by the Program Administrator that addresses the operation of the LRMP and assesses its adequacy and the effectiveness of its implementation, including, if applicable, the operation of the highly liquid investment minimum, and any material changes to the LRMP (the “Program Administrator Report”). At a meeting held on March 15, 2023, the Adviser provided the Program Administrator Report to the Trustees which covered the operation of the LRMP from January 1, 2022 through December 31, 2022 (the “Reporting Period”).
The Program Administrator Report discussed the operation and effectiveness of the LRMP during the Reporting Period. Among other things, the Program Administrator Report indicated that there were no material changes to the LRMP during the Reporting Period, although there were certain methodology adjustments implemented relating to a change in data provider. Additionally, the findings presented in the Program Administrator Report indicated that the LRMP operated adequately during the Reporting Period. These findings included that the Fund was able to meet redemptions during the normal course of business during the Reporting Period. The Program Administrator Report also stated that the Fund did not exceed the 15% limit on illiquid assets during the Reporting Period, that the Fund held primarily highly liquid assets, and was considered to be a primarily highly liquid fund during the Reporting Period. Also included among the Program Administrator Report’s findings was the determination that the Fund’s investment strategy remains appropriate for an open-end fund. In addition, the Adviser expressed its belief in the Program Administrator Report that the LRMP is reasonably designed and adequate to assess and manage the Fund’s liquidity risk, considering the Fund’s particular risks and circumstances, and includes policies and procedures reasonably designed to implement each required component of the Liquidity Rule.
There can be no assurance that the LRMP will achieve its objectives in the future. Please refer to your Fund’s prospectus for more information regarding the risks to which an investment in the Fund may be subject.
Janus Henderson Global Allocation Fund - Conservative
Useful Information About Your Fund Report (unaudited)
Management Commentary
The Management Commentary in this report includes valuable insight as well as statistical information to help you understand how your Fund’s performance and characteristics stack up against those of comparable indices.
If the Fund invests in foreign securities, this report may include information about country exposure. Country exposure is based primarily on the country of risk. A company may be allocated to a country based on other factors such as location of the company���s principal office, the location of the principal trading market for the company’s securities, or the country where a majority of the company’s revenues are derived.
Please keep in mind that the opinions expressed in the Management Commentary are just that: opinions. They are a reflection based on best judgment at the time this report was compiled, which was June 30, 2023. As the investing environment changes, so could opinions. These views are unique and are not necessarily shared by fellow employees or by Janus Henderson in general.
Performance Overviews
Performance overview graphs compare the performance of a hypothetical $10,000 investment in the Fund with one or more widely used market indices. When comparing the performance of the Fund with an index, keep in mind that market indices are not available for investment and do not reflect deduction of expenses.
Average annual total returns are quoted for a Fund with more than one year of performance history. Average annual total return is calculated by taking the growth or decline in value of an investment over a period of time, including reinvestment of dividends and distributions, then calculating the annual compounded percentage rate that would have produced the same result had the rate of growth been constant throughout the period. Average annual total return does not reflect the deduction of taxes that a shareholder would pay on Fund distributions or redemptions of Fund shares.
Cumulative total returns are quoted for a Fund with less than one year of performance history. Cumulative total return is the growth or decline in value of an investment over time, independent of the period of time involved. Cumulative total return does not reflect the deduction of taxes that a shareholder would pay on Fund distributions or redemptions of Fund shares.
Pursuant to federal securities rules, expense ratios shown in the performance chart reflect subsidized (if applicable) and unsubsidized ratios. The total annual fund operating expenses ratio is gross of any fee waivers, reflecting the Fund’s unsubsidized expense ratio. The net annual fund operating expenses ratio (if applicable) includes contractual waivers of the Adviser and reflects the Fund’s subsidized expense ratio. Ratios may be higher or lower than those shown in the “Financial Highlights” in this report.
Schedule of Investments
Following the performance overview section is the Fund’s Schedule of Investments. This schedule reports the types of securities held in the Fund on the last day of the reporting period. Securities are usually listed by type (common stock, corporate bonds, U.S. Government obligations, etc.) and by industry classification (banking, communications, insurance, etc.). Holdings are subject to change without notice.
The value of each security is quoted as of the last day of the reporting period. The value of securities denominated in foreign currencies is converted into U.S. dollars.
If the Fund invests in foreign securities, it will also provide a summary of investments by country. This summary reports the Fund exposure to different countries by providing the percentage of securities invested in each country. The country of each security represents the country of risk. The Fund’s Schedule of Investments relies upon the industry group and country classifications published by Bloomberg and/or MSCI Inc.
Tables listing details of individual forward currency contracts, futures, written options, swaptions, and swaps follow the Fund’s Schedule of Investments (if applicable).
Statement of Assets and Liabilities
This statement is often referred to as the “balance sheet.” It lists the assets and liabilities of the Fund on the last day of the reporting period.
Janus Henderson Global Allocation Fund - Conservative
Useful Information About Your Fund Report (unaudited)
The Fund’s assets are calculated by adding the value of the securities owned, the receivable for securities sold but not yet settled, the receivable for dividends declared but not yet received on securities owned, and the receivable for Fund shares sold to investors but not yet settled. The Fund’s liabilities include payables for securities purchased but not yet settled, Fund shares redeemed but not yet paid, and expenses owed but not yet paid. Additionally, there may be other assets and liabilities such as unrealized gain or loss on forward currency contracts.
The section entitled “Net Assets Consist of” breaks down the components of the Fund’s net assets. Because the Fund must distribute substantially all earnings, you will notice that a significant portion of net assets is shareholder capital.
The last section of this statement reports the net asset value (“NAV”) per share on the last day of the reporting period. The NAV is calculated by dividing the Fund’s net assets for each share class (assets minus liabilities) by the number of shares outstanding.
Statement of Operations
This statement details the Fund’s income, expenses, realized gains and losses on securities and currency transactions, and changes in unrealized appreciation or depreciation of Fund holdings.
The first section in this statement, entitled “Investment Income,” reports the dividends earned from securities and interest earned from interest-bearing securities in the Fund.
The next section reports the expenses incurred by the Fund, including the advisory fee paid to the investment adviser, transfer agent fees and expenses, and printing and postage for mailing statements, financial reports and prospectuses. Expense offsets and expense reimbursements, if any, are also shown.
The last section lists the amounts of realized gains or losses from investment and foreign currency transactions, and changes in unrealized appreciation or depreciation of investments and foreign currency-denominated assets and liabilities. The Fund will realize a gain (or loss) when it sells its position in a particular security. A change in unrealized gain (or loss) refers to the change in net appreciation or depreciation of the Fund during the reporting period. “Net Realized and Unrealized Gain/(Loss) on Investments” is affected both by changes in the market value of Fund holdings and by gains (or losses) realized during the reporting period.
Statements of Changes in Net Assets
These statements report the increase or decrease in the Fund’s net assets during the reporting period. Changes in the Fund’s net assets are attributable to investment operations, dividends and distributions to investors, and capital share transactions. This is important to investors because it shows exactly what caused the Fund’s net asset size to change during the period.
The first section summarizes the information from the Statement of Operations regarding changes in net assets due to the Fund’s investment operations. The Fund’s net assets may also change as a result of dividend and capital gains distributions to investors. If investors receive their dividends and/or distributions in cash, money is taken out of the Fund to pay the dividend and/or distribution. If investors reinvest their dividends and/or distributions, the Fund’s net assets will not be affected.
The reinvestment of dividends and distributions is included under “Capital Share Transactions.” “Capital Shares” refers to the money investors contribute to the Fund through purchases or withdrawals via redemptions. The Fund’s net assets will increase and decrease in value as investors purchase and redeem shares from the Fund.
Financial Highlights
This schedule provides a per-share breakdown of the components that affect the Fund’s NAV for current and past reporting periods as well as total return, asset size, ratios, and portfolio turnover rate.
The first line in the table reflects the NAV per share at the beginning of the reporting period. The next line reports the net investment income/(loss) per share. Following is the per share total of net gains/(losses), realized and unrealized. Per share dividends and distributions to investors are then subtracted to arrive at the NAV per share at the end of the period. The next line reflects the total return for the period. The total return may include adjustments in accordance with generally accepted accounting principles required at the period end for financial reporting purposes. As a result, the total return may differ from the total return reflected for individual shareholder transactions. Also included are ratios of expenses and net investment income to average net assets.
Janus Henderson Global Allocation Fund - Conservative
Useful Information About Your Fund Report (unaudited)
The Fund’s expenses may be reduced through expense offsets and expense reimbursements. The ratios shown reflect expenses before and after any such offsets and reimbursements.
The ratio of net investment income/(loss) summarizes the income earned less expenses, divided by the average net assets of the Fund during the reporting period. Do not confuse this ratio with the Fund’s yield. The net investment income ratio is not a true measure of the Fund’s yield because it does not take into account the dividends distributed to the Fund’s investors.
The next figure is the portfolio turnover rate, which measures the buying and selling activity in the Fund. Portfolio turnover is affected by market conditions, changes in the asset size of the Fund, fluctuating volume of shareholder purchase and redemption orders, the nature of the Fund’s investments, and the investment style and/or outlook of the portfolio manager(s) and/or investment personnel. A 100% rate implies that an amount equal to the value of the entire portfolio was replaced once during the fiscal year; a 50% rate means that an amount equal to the value of half the portfolio is traded in a year; and a 200% rate means that an amount equal to the value of the entire portfolio is traded every six months.
Janus Henderson Global Allocation Fund - Conservative
Designation Requirements (unaudited)
For federal income tax purposes, the Fund designated the following for the year ended June 30, 2023:
| | |
| | |
Capital Gain Distributions | $2,534,869 |
Foreign Taxes Paid | $62,889 |
Foreign Source Income | $158,390 |
Dividends Received Deduction Percentage | 13% |
Qualified Dividend Income Percentage | 34% |
Janus Henderson Global Allocation Fund - Conservative
Trustees and Officers (unaudited)
The following are the Trustees and officers of the Trust, together with a brief description of their principal occupations during the last five years (principal occupations for certain Trustees may include periods over five years). The Fund’s Statement of Additional Information includes additional information about the Trustees and officers and is available, without charge, by calling 1-877-335-2687.
Each Trustee has served in that capacity since he or she was originally elected or appointed. The Trustees do not serve a specified term of office. Each Trustee will hold office until the termination of the Trust or his or her earlier death, resignation, retirement, incapacity, or removal. Under the Fund’s Governance Procedures and Guidelines, the policy is for Trustees to retire no later than the end of the calendar year in which the Trustee turns 75. The Trustees review the Fund’s Governance Procedures and Guidelines from time to time and may make changes they deem appropriate. The Fund’s Nominating and Governance Committee will consider nominees for the position of Trustee recommended by shareholders. Shareholders may submit the name of a candidate for consideration by the Committee by submitting their recommendations to the Trust’s Secretary. Each Trustee is currently a Trustee of one other registered investment company advised by the Adviser: Janus Aspen Series. Collectively, these two registered investment companies consist of 49 series or funds referred to herein as the Fund Complex.
The Trust’s officers are elected annually by the Trustees for a one-year term. Certain officers also serve as officers of Janus Aspen Series. Certain officers of the Fund may also be officers and/or directors of the Adviser. Except as otherwise disclosed, Fund officers receive no compensation from the Fund, except for the Fund’s Chief Compliance Officer, as authorized by the Trustees.
| | | | | | |
TRUSTEES |
Name, Address, and Age | Positions Held with the Trust | Length of Time Served | Principal Occupations During the Past Five Years | Number of Portfolios/Funds in Fund Complex Overseen by Trustee | Other Directorships Held by Trustee During the Past Five Years |
Independent Trustees | | | | |
Alan A. Brown
151 Detroit Street
Denver, CO 80206
DOB: 1962 | Chairman
Trustee | 5/22-Present
1/13-Present | Principal, Curam Holdings LLC (since 2018). Formerly, Executive Vice President, Institutional Markets, of Black Creek Group (private equity real estate investment management firm) (2012-2018), Executive Vice President and Co-Head, Global Private Client Group (2007-2010), Executive Vice President, Mutual Funds (2005-2007), and Chief Marketing Officer (2001-2005) of Nuveen Investments, Inc. (asset management). | 49 | Advisory Board Member of AEW Core Property Trust (open-end property fund) (since 2020), and Director of WTTW (PBS affiliate) (since 2003). Formerly, Director of MotiveQuest LLC (strategic social market research company) (2003-2016), Director of Nuveen Global Investors LLC (2007-2011), Director of Communities in Schools (2004-2010), and Director of Mutual Fund Education Alliance (until 2010). |
Janus Henderson Global Allocation Fund - Conservative
Trustees and Officers (unaudited)
| | | | | | |
TRUSTEES |
Name, Address, and Age | Positions Held with the Trust | Length of Time Served | Principal Occupations During the Past Five Years | Number of Portfolios/Funds in Fund Complex Overseen by Trustee | Other Directorships Held by Trustee During the Past Five Years |
Independent Trustees | | | | |
Cheryl D. Alston
151 Detroit Street
Denver, CO 80206
DOB: 1966 | Trustee | 8/22-Present | Executive Director and Chief Investment Officer, Employees’ Retirement Fund of the City of Dallas (since 2004). | 49 | Director of Blue Cross Blue Shield of Kansas City (a not-for-profit health insurance provider) (since 2016) and Director of Global Life Insurance (life and supplemental health insurance provider) (since 2017). Formerly, Director of Federal Home Loan Bank of Dallas (2017-2021). |
Janus Henderson Global Allocation Fund - Conservative
Trustees and Officers (unaudited)
| | | | | | |
TRUSTEES |
Name, Address, and Age | Positions Held with the Trust | Length of Time Served | Principal Occupations During the Past Five Years | Number of Portfolios/Funds in Fund Complex Overseen by Trustee | Other Directorships Held by Trustee During the Past Five Years |
Independent Trustees | | | | |
Janus Henderson Global Allocation Fund - Conservative
Trustees and Officers (unaudited)
| | | | | | |
William D. Cvengros
151 Detroit Street
Denver, CO 80206
DOB: 1948 | Trustee | 1/11-Present | Chief Executive Officer of SJC Capital, LLC (a personal investment company and consulting firm) (since 2002). Formerly, Chief Executive Officer and President of PIMCO Advisors Holdings L.P. (a publicly traded investment management firm) (1994-2000), and Chief Investment Officer (1987-1994) and Vice Chairman and Director (1990-1994) of Pacific Life Insurance Company (a mutual life insurance and annuity company) (1987-1994). | 49 | Member, Limited Partner Advisory Committee, Karmel Capital Fund III (later stage growth fund) (since 2022), Member of the Investment Committee for the Orange County Community Foundation (a grantmaking foundation) (since 2020), Advisory Board Member, RevOZ Fund LP and related funds (real estate investments for opportunity zones) (since 2020), and Advisory Board Member, Innovate Partners Emerging Growth and Equity Fund I (early stage venture capital fund) (since 2014). Formerly, Managing Trustee of National Retirement Partners Liquidating Trust (2013-2016), Chairman, National Retirement Partners, Inc. (formerly a network of advisors to 401(k) plans) (2005-2013), Director of Prospect Acquisition Corp. (a special purpose acquisition corporation) (2007-2009), Director of RemedyTemp, Inc. (temporary help services company) (1996-2006), and Trustee of PIMCO Funds Multi-Manager Series (1990-2000) and Pacific Life Variable Life & Annuity Trusts (1987-1994). |
Janus Henderson Global Allocation Fund - Conservative
Trustees and Officers (unaudited)
| | | | | | |
TRUSTEES |
Name, Address, and Age | Positions Held with the Trust | Length of Time Served | Principal Occupations During the Past Five Years | Number of Portfolios/Funds in Fund Complex Overseen by Trustee | Other Directorships Held by Trustee During the Past Five Years |
Independent Trustees | | | | |
Raudline Etienne
151 Detroit Street
Denver, CO 80206
DOB: 1965 | Trustee | 6/16-Present | Founder, Daraja Capital (advisory and investment firm) (since 2016). Formerly, Senior Vice President and Senior Advisor, Albright Stonebridge Group LLC (global strategy firm) (2011-2021), and Deputy Comptroller and Chief Investment Officer, New York State Common Retirement Fund (public pension fund) (2008-2011). | 49 | Member of the Investment Committee for Cooper Union (private college) (since 2021) and Director of Brightwood Capital Advisors, LLC (since 2014). Formerly, Board Member, Van Alen Institute (nonprofit architectural and design organization) (2019-2022). |
Darrell B. Jackson
151 Detroit Street
Denver, CO 80206
DOB: 1958 | Trustee | 8/22-Present | President and Chief Executive Officer, The Efficace Group Inc. (since 2018). Formerly, President and Chief Executive Officer, Seaway Bank and Trust Company (community bank) (2014-2015), and Executive Vice President and Co-President, Wealth Management (2009-2014), and several senior positions, including Group Executive, Senior Vice President, and Vice President (1995-2009) of Northern Trust Company (financial services company) (1995-2014). | 49 | Director of Amalgamated Financial Corp (bank) (since August 2021), Director of YR Media (a not-for-profit production company) (since 2021), and Director of Gray-Bowen-Scott (transportation project consulting firm) (since April 2020). Formerly, Director of Delaware Place Bank (closely held commercial bank) (2016-2018) and Director of Seaway Bank and Trust Company (2014-2015). |
Janus Henderson Global Allocation Fund - Conservative
Trustees and Officers (unaudited)
| | | | | | |
TRUSTEES |
Name, Address, and Age | Positions Held with the Trust | Length of Time Served | Principal Occupations During the Past Five Years | Number of Portfolios/Funds in Fund Complex Overseen by Trustee | Other Directorships Held by Trustee During the Past Five Years |
Independent Trustees | | | | |
William F. McCalpin
151 Detroit Street
Denver, CO 80206
DOB: 1957 | Trustee | 6/02-Present | Chief Executive Officer, muun chi LLC (organic food business) (since 2022) and Independent Consultant (since 2019). Formerly, Chief Operating Officer, muun chi LLC (2020-2022), Managing Partner, Impact Investments, Athena Capital Advisors LLC (independent registered investment advisor) (2016-2019), Managing Director, Holos Consulting LLC (provides consulting services to foundations and other nonprofit organizations) (2009-2016), Chief Executive Officer, Imprint Capital Advisors (impact investment firm) (2013-2015), and Executive Vice President and Chief Operating Officer of The Rockefeller Brothers Fund (a private family foundation) (1998-2006). | 49 | Chairman of the Board and Trustee of The Investment Fund for Foundations Investment Program (TIP) (consisting of 1 fund) (since 2008). Formerly, Director of the F.B. Heron Foundation (a private grantmaking foundation) (2006-2022), and Director of Mutual Fund Directors Forum (a non-profit organization serving independent directors of U.S. mutual funds) (2016-2021). |
Janus Henderson Global Allocation Fund - Conservative
Trustees and Officers (unaudited)
| | | | | | |
TRUSTEES |
Name, Address, and Age | Positions Held with the Trust | Length of Time Served | Principal Occupations During the Past Five Years | Number of Portfolios/Funds in Fund Complex Overseen by Trustee | Other Directorships Held by Trustee During the Past Five Years |
Independent Trustees | | | | |
Gary A. Poliner
151 Detroit Street
Denver, CO 80206
DOB: 1953 | Trustee | 6/16-Present | Retired. Formerly, President (2010-2013) of Northwestern Mutual Life Insurance Company. | 49 | Director of MGIC Investment Corporation (private mortgage insurance) (since 2013). Formerly, Director, West Bend Mutual Insurance Company (property/casualty insurance) (2013-2021), Trustee of Northwestern Mutual Life Insurance Company (2010-2013) and Director of Frank Russell Company (global asset management firm) (2008-2013). |
Diane L. Wallace
151 Detroit Street
Denver, CO 80206
DOB: 1958 | Trustee | 6/17-Present | Retired. Formerly, Chief Operating Officer, Senior Vice President-Operations, and Chief Financial Officer for Driehaus Capital Management, LLC (1988-2006) and Treasurer for Driehaus Mutual Funds (1996-2002). | 49 | Formerly, Director of Family Service of Lake County (2019-2021), Independent Trustee, Henderson Global Funds (13 portfolios) (2015-2017), Independent Trustee, State Farm Associates’ Funds Trust, State Farm Mutual Fund Trust, and State Farm Variable Product Trust (28 portfolios) (2013-2017). |
Janus Henderson Global Allocation Fund - Conservative
Trustees and Officers (unaudited)
| | | | |
OFFICERS |
Name, Address, and Age | Positions Held with the Trust | Term of Office* and Length of Time Served | Principal Occupations During the Past Five Years |
Ashwin Alankar
151 Detroit Street
Denver, CO 80206
DOB: 1974 | Executive Vice President and Portfolio Manager
Janus Henderson Global Allocation Fund - Conservative | 9/14-Present | Head of Global Asset Allocation of Janus Henderson Investors and Portfolio Manager for other Janus Henderson accounts. |
Michelle Rosenberg
151 Detroit Street
Denver, CO 80206
DOB: 1973 | President and Chief Executive Officer | 9/22-Present | General Counsel and Corporate Secretary of Janus Henderson Investors (since 2018). Formerly, Interim President and Chief Executive Officer of the Trust and Janus Aspen Series (2022), Senior Vice President and Head of Legal, North America of Janus Henderson Investors (2017-2018) and Deputy General Counsel of Janus Henderson US (Holdings) Inc. (2015-2018). |
Kristin Mariani
151 Detroit Street
Denver, CO 80206
DOB: 1966 | Vice President and Chief Compliance Officer | 7/20-Present | Head of Compliance, North America at Janus Henderson Investors (since September 2020) and Chief Compliance Officer at Janus Henderson Investors US LLC (since September 2017). Formerly, Anti-Money Laundering Officer for the Trust and Janus Aspen Series (July 2020-December 2022), Global Head of Investment Management Compliance at Janus Henderson Investors (February 2019-August 2020), Vice President, Head of Global Distribution Compliance and Chief Compliance Officer at Janus Henderson Distributors US LLC (May 2017-September 2017), Vice President, Compliance at Janus Henderson US (Holdings) Inc., Janus Henderson Investors US LLC, and Janus Henderson Distributors US LLC (2009-2017). |
Jesper Nergaard
151 Detroit Street
Denver, CO 80206
DOB: 1962 | Chief Financial Officer
Vice President, Treasurer, and Principal Accounting Officer | 3/05-Present
2/05-Present | Head of U.S. Fund Administration, Janus Henderson Investors and Janus Henderson Services US LLC. |
Janus Henderson Global Allocation Fund - Conservative
Trustees and Officers (unaudited)
| | | | |
OFFICERS |
Name, Address, and Age | Positions Held with the Trust | Term of Office* and Length of Time Served | Principal Occupations During the Past Five Years |
Abigail J. Murray
151 Detroit Street
Denver, CO 80206
DOB: 1975 | Vice President, Chief Legal Counsel, and Secretary | 12/20-Present | Managing Counsel (since 2020). Formerly, Senior Counsel for Invesco Ltd. (2017-2020), and Vice President and Senior Counsel, ALPS Fund Services, Inc. and Assistant General Counsel, ALPS Advisors, Inc. (2015-2017). |
Ciaran Askin
151 Detroit Street
Denver, CO 80206
DOB: 1978 | Anti-Money Laundering Officer | 12/22-Present | Global Head of Financial Crime, Janus Henderson Investors (since 2022). Formerly, Global Head of Financial Crime for Invesco Ltd. (2017-2022). |
* Officers are elected at least annually by the Trustees for a one-year term and may also be elected from time to time by the Trustees for an interim period. |
| | | | | | | | |
| | | | | |

| | | | |
This report is submitted for the general information of shareholders of the Fund. It is not an offer or solicitation for the Fund and is not authorized for distribution to prospective investors unless preceded or accompanied by an effective prospectus. |
Janus Henderson is a trademark of Janus Henderson Group plc or one of its subsidiaries. © Janus Henderson Group plc Janus Henderson Distributors US LLC Janus Henderson Group is the ultimate parent of Janus Henderson Distributors US LLC |
| | | | 125-02-93020 08-23 |
| | | |
| | | |
| | | ANNUAL REPORT June 30, 2023 |
| | |
| | Janus Henderson Global Allocation Fund - Growth |
| | |
| | Janus Investment Fund |
| |
| | | |
| | | HIGHLIGHTS · Portfolio management perspective · Investment strategy behind your fund · Fund performance, characteristics
and holdings |
Table of Contents
Janus Henderson Global Allocation Fund - Growth
Janus Henderson Global Allocation Fund - Growth (unaudited)
| | | | | | |
| | | | | 
Ashwin Alankar portfolio manager |
| | | |
PERFORMANCE OVERVIEW
For the 12-month period ended June 30, 2023, the Janus Henderson Global Allocation Fund – Growth’s Class I shares returned 10.40%. This compares with a return of 16.53% for the MSCI All Country World IndexSM, the Fund’s primary benchmark, and a return of 12.87% for its secondary benchmark, the Global Growth Allocation Index, an internally calculated, hypothetical combination of total returns from the MSCI All Country World Index (80%) and the Bloomberg Global Aggregate Bond Index (20%).
MARKET ENVIRONMENT
Despite early-period volatility, global equities generated positive returns over the period as investors gained greater confidence that inflation was being brought under control and that a pronounced recession could be avoided. Global bonds, however, came under substantial pressure, with positive corporate returns more than offset by negative returns in U.S. Treasuries and sovereigns. Global rates rose as central banks continued to battle inflation. The U.S. economy remained resilient, especially compared to developed market peers. Inflation remained elevated in the UK, and the euro area officially entered a recession.
PERFORMANCE DISCUSSION
The Janus Henderson Global Allocation Fund – Growth invests across a broad set of Janus Henderson funds that span a wide range of global asset categories with a base allocation of 70% to 85% equity investments, 10% to 25% fixed income investments and 5% to 20% alternative investments (to the extent available) that are monitored and rebalanced periodically. The Fund is structured as a “fund of funds” portfolio that seeks to provide investors with broad, diversified exposure to various types of investments with an emphasis on managing investment risk.
The steep rise in interest rates during the period resulted in the Fund’s exposure to bonds being the primary driver of underperformance relative its secondary benchmark. The Janus Henderson Global Bond Fund was the leading individual detractor. Also detracting was the Janus Henderson Global Real Estate Fund. Given the period’s rally in equities, the Fund’s stock positioning contributed to results. The Janus Henderson Overseas Fund was among the leading contributors, followed by the Janus Henderson Forty Fund.
OUTLOOK
Disagreement makes markets. When disagreement evolves into agreement, risk premiums re-price and a transition in the volatility regime can occur. It is worth identifying the epicenter of disagreements and contradictory data to better understand the root cause of market incongruencies. Today, the epicenter of disagreement is between low equity volatility – levels not seen since the pandemic – and consensus expectations for elevated recession risk.
Is low volatility masking recession dangers or is it telling us that the likelihood of economic contraction is low? Based on data we have analyzed from both the risks priced by the option market and consumer data, we believe it is the latter. Options are pricing in greater upside skew to equities, with expected tail gains – or the chance for gains that exceed what is priced in under a broad distribution of expected returns – greater than expected tail losses. This is true for both developed-market equities and also emerging markets and small caps. At the same time, equity downside risk, or expected tail losses, are well below average levels. We see similar attractiveness in fixed income, with short maturity treasuries slightly more
Janus Henderson Global Allocation Fund - Growth (unaudited)
attractive than longer maturity notes. This suggests that inflation risks may be managed without leading to a deep recession.
Recession is very unlikely when the consumer is strong, and earnings estimates for consumer-focused companies as well as forecasts for consumer loan impairments indicate a healthy consumer. The risk to this optimistic view is policy error. Historically monetary policy has been fraught with error. One risk is keeping the economy awash with cheap money for too long and, thus, fueling inflation, and the other is inconsistent responses on the part of central banks to rising prices.
The Federal Reserve (Fed) has reached a crucial point in its battle against inflation. The cost of money is once again expensive. The question now is whether Fed Chairman Jerome Powell will finish the job by keeping money expensive, or will he balk? Thus far, Mr. Powell has made it clear that he does not consider his job done. Resilient consumer and other macro should portend that moderately expensive money over the medium term won’t derail the economy or the prospects for riskier assets. A Fed that stays the course will more likely fuel a right tail – or upside surprise – in capital markets while a premature dovish pivot would more likely fuel a left tail event.
The path of economic growth relies heavily on the Fed not committing a policy error and, therefore, uncertainly remains elevated.
Thank you for investing in the Janus Henderson Global Allocation Fund – Growth.
Any risk management process discussed includes an effort to monitor and manage risk which should not be confused with and does not imply low risk or the ability to control certain risk factors.
Important Notice – Tailored Shareholder Reports
Effective January 24, 2023, the Securities and Exchange Commission (the “SEC”) adopted rule and form amendments that require mutual funds and exchange-traded funds to provide shareholders with streamlined annual and semi-annual shareholder reports that highlight key information. Other information, including financial statements, that currently appears in shareholder reports will be made available online, delivered free of charge to shareholders upon request, and filed with the SEC. The first tailored shareholder report for the Fund will be for the reporting period ending June 30, 2024. Currently, management is evaluating the impact of the rule and form amendments on the content of the Fund’s current shareholder reports.
Janus Henderson Global Allocation Fund - Growth (unaudited)
Fund At A Glance
June 30, 2023
| | | | |
Holdings - (% of Net Assets) | | | |
Janus Henderson Global Bond Fund - Class N Shares | | 12.2 | % |
Janus Henderson Overseas Fund - Class N Shares | | 8.6 | |
Janus Henderson Emerging Markets Fund - Class N Shares | | 8.2 | |
Janus Henderson Adaptive Risk Managed U.S. Equity Fund - Class N Shares | | 7.8 | |
Janus Henderson Flexible Bond Fund - Class N Shares | | 5.6 | |
Janus Henderson Adaptive Global Allocation Fund - Class N Shares | | 5.5 | |
Janus Henderson Contrarian Fund - Class N Shares | | 5.3 | |
Janus Henderson Small-Mid Cap Value Fund - Class N Shares | | 5.0 | |
Janus Henderson Global Select Fund - Class N Shares | | 4.5 | |
Janus Henderson Forty Fund - Class N Shares | | 4.2 | |
Janus Henderson Growth and Income Fund - Class N Shares | | 4.1 | |
Janus Henderson Enterprise Fund - Class N Shares | | 4.0 | |
Janus Henderson Global Equity Income Fund - Class N Shares | | 3.9 | |
Janus Henderson U.S. Dividend Income Fund - Class N Shares | | 3.8 | |
Janus Henderson Triton Fund - Class N Shares | | 3.3 | |
Janus Henderson Global Real Estate Fund - Class N Shares | | 3.0 | |
Janus Henderson Asia Equity Fund - Class N Shares | | 2.9 | |
Janus Henderson Global Research Fund - Class N Shares | | 2.8 | |
Janus Henderson European Focus Fund - Class N Shares | | 2.3 | |
Janus Henderson Short Duration Flexible Bond Fund - Class N Shares | | 1.5 | |
Janus Henderson AAA CLO | | 0.8 | |
Janus Henderson High-Yield Fund - Class N Shares | | 0.4 | |
Janus Henderson Multi-Sector Income Fund - Class N Shares | | 0.2 | |
Janus Henderson Cash Liquidity Fund LLC | | 0.1 | |
| | | | | | |
Asset Allocation - (% of Net Assets) | |
Equity Funds | | 79.2% | |
Fixed Income Funds | | 19.9% | |
Exchange-Traded Funds (ETFs) | | 0.8% | |
Money Markets | | 0.1% | |
Other | | (0.0)% |
| | | 100.0% |
Janus Henderson Global Allocation Fund - Growth (unaudited)
Performance
| |
See important disclosures on the next page. |
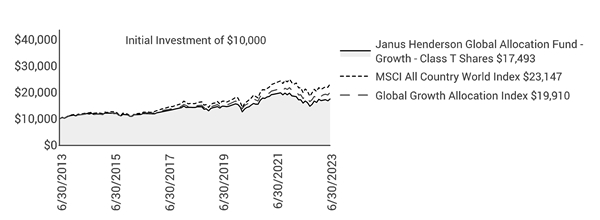
| | | | | | | | | | |
| | | | | | | | |
| | | | | | | | | |
Average Annual Total Return - for the periods ended June 30, 2023 | | | Prospectus Expense Ratios |
| | One
Year | Five
Year | Ten
Year | Since
Inception* | | | Total Annual Fund
Operating Expenses‡ |
Class A Shares at NAV | | 10.03% | 4.11% | 5.63% | 5.75% | | | 1.17% |
Class A Shares at MOP | | 3.74% | 2.89% | 5.01% | 5.39% | | | |
Class C Shares at NAV | | 9.31% | 3.37% | 4.92% | 5.00% | | | 1.92% |
Class C Shares at CDSC | | 8.31% | 3.37% | 4.92% | 5.00% | | | |
Class D Shares | | 10.31% | 4.30% | 5.82% | 5.93% | | | 0.98% |
Class I Shares | | 10.40% | 4.36% | 5.88% | 5.99% | | | 0.93% |
Class S Shares | | 9.88% | 3.94% | 5.46% | 5.55% | | | 1.34% |
Class T Shares | | 10.22% | 4.22% | 5.75% | 5.88% | | | 1.08% |
MSCI All Country World Index | | 16.53% | 8.10% | 8.75% | 6.73% | | | |
Global Growth Allocation Index | | 12.87% | 6.40% | 7.13% | 6.01% | | | |
Morningstar Quartile - Class T Shares | | 1st | 2nd | 1st | 1st | | | |
Morningstar Ranking - based on total returns for World Allocation Funds | | 67/393 | 159/383 | 62/332 | 43/210 | | | |
Returns quoted are past performance and do not guarantee future results; current performance may be lower or higher. Investment returns and principal value will vary; there may be a gain or loss when shares are sold. For the most recent month-end performance call 800.668.0434 (or 800.525.3713 if you hold shares directly with Janus Henderson) or visit janushenderson.com/performance (or janushenderson.com/allfunds if you hold shares directly with Janus Henderson).
Maximum Offering Price (MOP) returns include the maximum sales charge of 5.75%. Net Asset Value (NAV) returns exclude this charge, which would have reduced returns.
CDSC returns include a 1% contingent deferred sales charge (CDSC) on Shares redeemed within 12 months of purchase. Net Asset Value (NAV) returns exclude this charge, which would have reduced returns.
For certain periods, the Fund’s performance may reflect the effects of expense waivers.
Performance may be affected by risks that include those associated with foreign and emerging markets, fixed income securities, high-yield and high-risk securities, undervalued, overlooked and smaller capitalization companies, real estate related securities including Real Estate Investment Trusts (REITs), Environmental, Social and Governance (ESG) factors, non-diversification, portfolio turnover, derivatives, short sales, initial public offerings (IPOs) and potential conflicts of interest. Each product has different risks. Please see the prospectus for more information about risks, holdings and other details.
Janus Henderson Global Allocation Fund - Growth (unaudited)
Performance
Performance of the Global Allocation Funds depends on that of the underlying funds. They are subject to the volatility of the financial markets. Because Janus Henderson Investors US LLC is the adviser to the Fund and to the underlying affiliated funds held within the Fund, it is subject to certain potential conflicts of interest.
Returns include reinvestment of all dividends and distributions and do not reflect the deduction of taxes that a shareholder would pay on Fund distributions or redemptions of Fund shares. The returns do not include adjustments in accordance with generally accepted accounting principles required at the period end for financial reporting purposes.
Class A Shares, Class C Shares, and Class S Shares commenced operations on July 6, 2009. Performance shown for each class for periods prior to July 6, 2009, reflects the performance of the Fund’s Class J Shares, the initial share class (renamed Class T Shares effective February 16, 2010), calculated using the fees and expenses of each respective share class, without the effect of any fee and expense limitations or waivers.
Class D Shares commenced operations on February 16, 2010. Performance shown for periods prior to February 16, 2010, reflects the performance of the Fund’s former Class J Shares, calculated using the fees and expenses in effect during the periods shown, net of any applicable fee and expense limitations or waivers.
Class I Shares commenced operations on July 6, 2009. Performance shown for periods prior to July 6, 2009, reflects the performance of the Fund’s former Class J Shares, calculated using the fees and expenses of Class J Shares, net of any applicable fee and expense limitations or waivers.
If each share class of the Fund had been available during periods prior to its commencement, the performance shown may have been different. The performance shown for periods following the Fund’s commencement of each share class reflects the fees and expenses of each respective share class, net of any applicable fee and expense limitations or waivers. Please refer to the Fund’s prospectuses for further details concerning historical performance.
Ranking is for the share class shown only; other classes may have different performance characteristics. When an expense waiver is in effect, it may have a material effect on the total return, and therefore the ranking for the period.
© 2023 Morningstar, Inc. All Rights Reserved.
There is no assurance that the investment process will consistently lead to successful investing.
See Notes to Schedule of Investments and Other Information for index definitions.
Index performance does not reflect the expenses of managing a portfolio as an index is unmanaged and not available for direct investment.
See “Useful Information About Your Fund Report.”
*The Fund’s inception date – December 30, 2005
‡ As stated in the prospectus. See Financial Highlights for actual expense ratios during the reporting period.
Janus Henderson Global Allocation Fund - Growth (unaudited)
Expense Examples
As a shareholder of the Fund, you incur two types of costs: (1) transaction costs, such as sales charges (loads) on purchase payments (applicable to Class A Shares only); and (2) ongoing costs, including management fees; 12b-1 distribution and shareholder servicing fees; transfer agent fees and expenses payable pursuant to the Transfer Agency Agreement; and other Fund expenses. This example is intended to help you understand your ongoing costs (in dollars) of investing in the Fund and to compare these costs with the ongoing costs of investing in other mutual funds. To do so, compare this 5% hypothetical example with the 5% hypothetical examples that appear in the shareholder reports of the other funds. The example is based upon an investment of $1,000 invested at the beginning of the period and held for the six-months indicated, unless noted otherwise in the table and footnotes below.
Actual Expenses
The information in the table under the heading “Actual” provides information about actual account values and actual expenses. You may use the information in these columns, together with the amount you invested, to estimate the expenses that you paid over the period. Simply divide your account value by $1,000 (for example, an $8,600 account value divided by $1,000 = 8.6), then multiply the result by the number in the appropriate column for your share class under the heading entitled “Expenses Paid During Period” to estimate the expenses you paid on your account during the period.
Hypothetical Example for Comparison Purposes
The information in the table under the heading “Hypothetical (5% return before expenses)” provides information about hypothetical account values and hypothetical expenses based upon the Fund’s actual expense ratio and an assumed rate of return of 5% per year before expenses, which is not the Fund’s actual return. The hypothetical account values and expenses may not be used to estimate the actual ending account balance or expenses you paid for the period. You may use this information to compare the ongoing costs of investing in the Fund and other funds. To do so, compare this 5% hypothetical example with the 5% hypothetical examples that appear in the shareholder reports of the other funds. Additionally, for an analysis of the fees associated with an investment in any share class or other similar funds, please visit www.finra.org/fundanalyzer.
Please note that the expenses shown in the table are meant to highlight your ongoing costs only and do not reflect any transaction costs. These fees are fully described in the Fund’s prospectuses. Therefore, the hypothetical examples are useful in comparing ongoing costs only, and will not help you determine the relative total costs of owning different funds. In addition, if these transaction costs were included, your costs would have been higher.
| | | | | | | | | | | |
| | | | | | | | |
| | | Actual | | Hypothetical
(5% return before expenses) | |
| Beginning
Account
Value
(1/1/23) | Ending
Account
Value
(6/30/23) | Expenses
Paid During
Period
(1/1/23 - 6/30/23)† | | Beginning
Account
Value
(1/1/23) | Ending
Account
Value
(6/30/23) | Expenses
Paid During
Period
(1/1/23 - 6/30/23)† | Net Annualized
Expense Ratio
(1/1/23 - 6/30/23)†† |
Class A Shares | $1,000.00 | $1,082.90 | $2.48 | | $1,000.00 | $1,022.41 | $2.41 | 0.48% |
Class C Shares | $1,000.00 | $1,079.20 | $6.03 | | $1,000.00 | $1,018.99 | $5.86 | 1.17% |
Class D Shares | $1,000.00 | $1,083.80 | $1.45 | | $1,000.00 | $1,023.41 | $1.40 | 0.28% |
Class I Shares | $1,000.00 | $1,084.80 | $1.29 | | $1,000.00 | $1,023.55 | $1.25 | 0.25% |
Class S Shares | $1,000.00 | $1,082.60 | $3.30 | | $1,000.00 | $1,021.62 | $3.21 | 0.64% |
Class T Shares | $1,000.00 | $1,083.90 | $1.81 | | $1,000.00 | $1,023.06 | $1.76 | 0.35% |
† | Expenses Paid During Period are equal to the Net Annualized Expense Ratio multiplied by the average account value over the period, multiplied by 181/365 (to reflect the one-half year period). Expenses in the examples include the effect of applicable fee waivers and/or expense reimbursements, if any. Had such waivers and/or reimbursements not been in effect, your expenses would have been higher. Please refer to the Notes to Financial Statements or the Fund’s prospectuses for more information regarding waivers and/or reimbursements. |
†† | Ratios do not include indirect expenses of the underlying funds and/or investment companies in which the Fund invests. |
| | |
Janus Henderson Global Allocation Fund - Growth
Schedule of Investments
June 30, 2023
| | | | | | | | |
Shares
| | | Value | |
Investment Companies£– 100.0% | | | |
Equity Funds – 79.2% | | | |
| | Janus Henderson Adaptive Global Allocation Fund - Class N Shares | | 1,245,709 | | | $12,443,914 | |
| | Janus Henderson Adaptive Risk Managed U.S. Equity Fund - Class N Shares | | 1,809,040 | | | 17,762,545 | |
| | Janus Henderson Asia Equity Fund - Class N Shares* | | 668,286 | | | 6,574,368 | |
| | Janus Henderson Contrarian Fund - Class N Shares | | 450,707 | | | 11,934,681 | |
| | Janus Henderson Emerging Markets Fund - Class N Shares* | | 2,094,592 | | | 18,554,793 | |
| | Janus Henderson Enterprise Fund - Class N Shares | | 66,468 | | | 9,119,303 | |
| | Janus Henderson European Focus Fund - Class N Shares | | 116,470 | | | 4,876,866 | |
| | Janus Henderson Forty Fund - Class N Shares | | 196,900 | | | 9,481,531 | |
| | Janus Henderson Global Equity Income Fund - Class N Shares | | 1,474,800 | | | 8,892,937 | |
| | Janus Henderson Global Real Estate Fund - Class N Shares | | 614,771 | | | 6,903,772 | |
| | Janus Henderson Global Research Fund - Class N Shares | | 68,379 | | | 6,288,233 | |
| | Janus Henderson Global Select Fund - Class N Shares | | 599,321 | | | 10,170,853 | |
| | Janus Henderson Growth and Income Fund - Class N Shares | | 132,676 | | | 9,300,603 | |
| | Janus Henderson Overseas Fund - Class N Shares | | 457,654 | | | 19,492,007 | |
| | Janus Henderson Small-Mid Cap Value Fund - Class N Shares | | 830,880 | | | 11,258,174 | |
| | Janus Henderson Triton Fund - Class N Shares | | 273,590 | | | 7,514,081 | |
| | Janus Henderson U.S. Dividend Income Fund - Class N Shares | | 850,464 | | | 8,700,249 | |
| | | 179,268,910 | |
Exchange-Traded Funds (ETFs) – 0.8% | | | |
| | Janus Henderson AAA CLO | | 37,611 | | | 1,874,908 | |
Fixed Income Funds – 19.9% | | | |
| | Janus Henderson Flexible Bond Fund - Class N Shares | | 1,364,187 | | | 12,673,083 | |
| | Janus Henderson Global Bond Fund - Class N Shares | | 3,583,488 | | | 27,664,133 | |
| | Janus Henderson High-Yield Fund - Class N Shares | | 115,349 | | | 813,130 | |
| | Janus Henderson Multi-Sector Income Fund - Class N Shares | | 47,521 | | | 401,077 | |
| | Janus Henderson Short Duration Flexible Bond Fund - Class N Shares | | 1,269,997 | | | 3,543,268 | |
| | | 45,094,691 | |
Money Markets – 0.1% | | | |
| | Janus Henderson Cash Liquidity Fund LLC, 5.1900%ºº | | 153,999 | | | 154,030 | |
Total Investments (total cost $212,134,236) – 100.0% | | 226,392,539 | |
Liabilities, net of Cash, Receivables and Other Assets – (0)% | | (83,863) | |
Net Assets – 100% | | $226,308,676 | |
| | |
See Notes to Schedule of Investments and Other Information and Notes to Financial Statements. |
| |
Janus Investment Fund | 7 |
Janus Henderson Global Allocation Fund - Growth
Schedule of Investments
June 30, 2023
Schedules of Affiliated Investments – (% of Net Assets)
| | | | | | | | | | | | |
| | Dividend Income | Realized Gain/(Loss) | Capital Gain Distributions from Underlying Funds | Change in Unrealized Appreciation/ Depreciation | Value at 6/30/23 |
Investment Companies - 100.0% |
Equity Funds - 79.2% |
| | Janus Henderson Adaptive Global Allocation Fund - Class N Shares | $ | 147,438 | $ | (107,990) | $ | - | $ | 1,019,042 | $ | 12,443,914 |
| | Janus Henderson Adaptive Risk Managed U.S. Equity Fund - Class N Shares | | 345,898 | | (211,088) | | 109,554 | | 2,069,404 | | 17,762,545 |
| | Janus Henderson Asia Equity Fund - Class N Shares* | | - | | (126,970) | | - | | (11,637) | | 6,574,368 |
| | Janus Henderson Contrarian Fund - Class N Shares | | 83,759 | | (1,011,153) | | - | | 2,995,767 | | 11,934,681 |
| | Janus Henderson Emerging Markets Fund - Class N Shares* | | - | | (516,450) | | - | | 467,359 | | 18,554,793 |
| | Janus Henderson Enterprise Fund - Class N Shares | | - | | (1,200,430) | | 826,286 | | 2,226,115 | | 9,119,303 |
| | Janus Henderson European Focus Fund - Class N Shares | | 248,353 | | 327,593 | | - | | 985,971 | | 4,876,866 |
| | Janus Henderson Forty Fund - Class N Shares | | - | | 343,067 | | 6,434 | | 2,203,518 | | 9,481,531 |
| | Janus Henderson Global Equity Income Fund - Class N Shares | | 891,622 | | (301,972) | | - | | 579,120 | | 8,892,937 |
| | Janus Henderson Global Real Estate Fund - Class N Shares | | 132,402 | | (60,420) | | - | | (317,382) | | 6,903,772 |
| | Janus Henderson Global Research Fund - Class N Shares | | 92,263 | | (126,459) | | 274,074 | | 1,248,409 | | 6,288,233 |
| | Janus Henderson Global Select Fund - Class N Shares | | 144,784 | | 465,435 | | 230,151 | | 721,803 | | 10,170,853 |
| | Janus Henderson Growth and Income Fund - Class N Shares | | 140,496 | | (102,033) | | 599,202 | | 787,700 | | 9,300,603 |
| | Janus Henderson Overseas Fund - Class N Shares | | 381,563 | | 170,636 | | - | | 2,514,972 | | 19,492,007 |
| | Janus Henderson Small-Mid Cap Value Fund - Class N Shares | | 88,254 | | (412,685) | | - | | 2,261,143 | | 11,258,174 |
| | Janus Henderson Triton Fund - Class N Shares | | - | | (2,418,617) | | 467,056 | | 3,050,130 | | 7,514,081 |
| | Janus Henderson U.S. Dividend Income Fund - Class N Shares | | 31,200 | | (307) | | - | | 169,585 | | 8,700,249 |
Total Equity Funds | $ | 2,728,032 | $ | (5,289,843) | $ | 2,512,757 | $ | 22,971,019 | $ | 179,268,910 |
Exchange-Traded Funds (ETFs) - 0.8% |
| | Janus Henderson AAA CLO | | 82,454 | | 1,936 | | - | | 19,878 | | 1,874,908 |
Fixed Income Funds - 19.9% |
| | Janus Henderson Flexible Bond Fund - Class N Shares | | 205,305 | | (13,839) | | - | | (341,328) | | 12,673,083 |
| | Janus Henderson Global Bond Fund - Class N Shares | | 110,583 | | (1,515,983) | | - | | 511,692 | | 27,664,133 |
| | Janus Henderson High-Yield Fund - Class N Shares | | 235,283 | | (1,179,943) | | - | | 1,180,037 | | 813,130 |
| | Janus Henderson Multi-Sector Income Fund - Class N Shares | | 27,615 | | 9,014 | | - | | 4,299 | | 401,077 |
| | Janus Henderson Short Duration Flexible Bond Fund - Class N Shares | | 94,585 | | (217,069) | | - | | 106,164 | | 3,543,268 |
Total Fixed Income Funds | $ | 673,371 | $ | (2,917,820) | $ | - | $ | 1,460,864 | $ | 45,094,691 |
Money Markets - 0.1% |
| | Janus Henderson Cash Liquidity Fund LLC, 5.1900%ºº | | 3,217 | | 10 | | - | | - | | 154,030 |
Total Affiliated Investments - 100.0% | $ | 3,487,074 | $ | (8,205,717) | $ | 2,512,757 | $ | 24,451,761 | $ | 226,392,539 |
| | |
See Notes to Schedule of Investments and Other Information and Notes to Financial Statements. |
| |
8 | JUNE 30, 2023 |
Janus Henderson Global Allocation Fund - Growth
Schedule of Investments
June 30, 2023
| | | | | | | | | | | |
| | Value at 6/30/22 | Purchases | Sales Proceeds | Value at 6/30/23 |
Investment Companies - 100.0% |
Equity Funds - 79.2% | |
| | Janus Henderson Adaptive Global Allocation Fund - Class N Shares | | 11,813,103 | | 644,732 | | (924,973) | | 12,443,914 |
| | Janus Henderson Adaptive Risk Managed U.S. Equity Fund - Class N Shares | | 16,426,755 | | 1,034,585 | | (1,557,111) | | 17,762,545 |
| | Janus Henderson Asia Equity Fund - Class N Shares* | | 6,448,127 | | 745,287 | | (480,439) | | 6,574,368 |
| | Janus Henderson Contrarian Fund - Class N Shares | | 15,605,147 | | 458,358 | | (6,113,438) | | 11,934,681 |
| | Janus Henderson Emerging Markets Fund - Class N Shares* | | 19,934,573 | | 1,887,175 | | (3,217,864) | | 18,554,793 |
| | Janus Henderson Enterprise Fund - Class N Shares | | 13,547,670 | | 1,134,320 | | (6,588,372) | | 9,119,303 |
| | Janus Henderson European Focus Fund - Class N Shares | | 6,524,232 | | 2,697,789 | | (5,658,719) | | 4,876,866 |
| | Janus Henderson Forty Fund - Class N Shares | | 7,287,227 | | 4,776,318 | | (5,128,599) | | 9,481,531 |
| | Janus Henderson Global Equity Income Fund - Class N Shares | | 12,632,864 | | 1,197,461 | | (5,214,536) | | 8,892,937 |
| | Janus Henderson Global Real Estate Fund - Class N Shares | | 5,407,059 | | 2,361,325 | | (486,810) | | 6,903,772 |
| | Janus Henderson Global Research Fund - Class N Shares | | 7,581,576 | | 977,585 | | (3,392,878) | | 6,288,233 |
| | Janus Henderson Global Select Fund - Class N Shares | | 9,290,151 | | 3,903,737 | | (4,210,273) | | 10,170,853 |
| | Janus Henderson Growth and Income Fund - Class N Shares | | 6,417,135 | | 6,179,733 | | (3,981,932) | | 9,300,603 |
| | Janus Henderson Overseas Fund - Class N Shares | | 12,673,220 | | 9,375,865 | | (5,242,686) | | 19,492,007 |
| | Janus Henderson Small-Mid Cap Value Fund - Class N Shares | | 13,875,277 | | 447,409 | | (4,912,970) | | 11,258,174 |
| | Janus Henderson Triton Fund - Class N Shares | | 11,640,160 | | 735,720 | | (5,493,312) | | 7,514,081 |
| | Janus Henderson U.S. Dividend Income Fund - Class N Shares | | - | | 8,617,583 | | (86,612) | | 8,700,249 |
Exchange-Traded Funds (ETFs) - 0.8% | |
| | Janus Henderson AAA CLO | | - | | 2,724,286 | | (871,192) | | 1,874,908 |
Fixed Income Funds - 19.9% | |
| | Janus Henderson Flexible Bond Fund - Class N Shares | | 3,814,163 | | 9,631,721 | | (417,634) | | 12,673,083 |
| | Janus Henderson Global Bond Fund - Class N Shares | | 22,498,332 | | 13,325,187 | | (7,155,095) | | 27,664,133 |
| | Janus Henderson High-Yield Fund - Class N Shares | | 6,017,076 | | 355,770 | | (5,559,810) | | 813,130 |
| | Janus Henderson Multi-Sector Income Fund - Class N Shares | | - | | 863,826 | | (476,062) | | 401,077 |
| | Janus Henderson Short Duration Flexible Bond Fund - Class N Shares | | 6,235,954 | | 3,099,249 | | (5,681,030) | | 3,543,268 |
Money Markets - 0.1% | |
| | Janus Henderson Cash Liquidity Fund LLC, 5.1900%ºº | | - | | 551,339 | | (397,319) | | 154,030 |
| | |
See Notes to Schedule of Investments and Other Information and Notes to Financial Statements. |
| |
Janus Investment Fund | 9 |
Janus Henderson Global Allocation Fund - Growth
Notes to Schedule of Investments and Other Information
| | |
Bloomberg Global Aggregate Bond Index | Bloomberg Global Aggregate Bond Index is a broad-based measure of the global investment grade fixed-rate debt markets. |
Global Growth Allocation Index | Global Growth Allocation Index is an internally-calculated, hypothetical combination of total returns from the MSCI All Country World IndexSM (80%) and the Bloomberg Global Aggregate Bond Index (20%). |
MSCI All Country World IndexSM | MSCI All Country World IndexSM reflects the equity market performance of global developed and emerging markets. |
| | |
LLC | Limited Liability Company |
| | |
* | Non-income producing security. |
| | |
ºº | Rate shown is the 7-day yield as of June 30, 2023. |
| | |
£ | The Fund may invest in certain securities that are considered affiliated companies. As defined by the Investment Company Act of 1940, as amended, an affiliated company is one in which the Fund owns 5% or more of the outstanding voting securities, or a company which is under common ownership or control. |
| | | | | | | | | | | | | |
The following is a summary of the inputs that were used to value the Fund’s investments in securities and other financial instruments as of June 30, 2023. See Notes to Financial Statements for more information. |
| |
Valuation Inputs Summary |
| | | | | | | |
| | | | | Level 2 - | | Level 3 - |
| | | Level 1 - | | Other Significant | | Significant |
| | | Quoted Prices | | Observable Inputs | | Unobservable Inputs |
| | | | | | | |
Assets | | | | | | |
Investments In Securities: | | | | | | |
Investment Companies | | | | | | |
Equity Funds | $ | 179,268,910 | $ | - | $ | - |
Exchange-Traded Funds (ETFs) | | 1,874,908 | | - | | - |
Fixed Income Funds | | 45,094,691 | | - | | - |
Money Markets | | - | | 154,030 | | - |
Total Assets | $ | 226,238,509 | $ | 154,030 | $ | - |
| | | | | | | |
Janus Henderson Global Allocation Fund - Growth
Statement of Assets and Liabilities
June 30, 2023
| | | | | | | |
| | | | | | |
Assets: | | | | |
| Affiliated investments, at value (cost $212,134,236) | | $ | 226,392,539 | |
| Trustees' deferred compensation | | | 5,751 | |
| Receivables: | | | | |
| | Dividends | | | 494,130 | |
| | Investments sold | | | 108,413 | |
| | Fund shares sold | | | 37,842 | |
| Other assets | | | 304 | |
Total Assets | | | 227,038,979 | |
Liabilities: | | | | |
| Payables: | | | — | |
| | Investments purchased | | | 493,126 | |
| | Fund shares repurchased | | | 120,144 | |
| | Professional fees | | | 42,580 | |
| | Transfer agent fees and expenses | | | 31,271 | |
| | Trustees' deferred compensation fees | | | 5,751 | |
| | 12b-1 Distribution and shareholder servicing fees | | | 3,598 | |
| | Advisory fees | | | 2,693 | |
| | Custodian fees | | | 2,431 | |
| | Trustees' fees and expenses | | | 1,354 | |
| | Accrued expenses and other payables | | | 27,355 | |
Total Liabilities | | | 730,303 | |
Net Assets | | $ | 226,308,676 | |
Net Assets Consist of: | | | | |
| Capital (par value and paid-in surplus) | | $ | 219,239,123 | |
| Total distributable earnings (loss) | | | 7,069,553 | |
Total Net Assets | | $ | 226,308,676 | |
Net Assets - Class A Shares | | $ | 6,073,072 | |
| Shares Outstanding, $0.01 Par Value (unlimited shares authorized) | | | 499,836 | |
Net Asset Value Per Share(1) | | $ | 12.15 | |
Maximum Offering Price Per Share(2) | | $ | 12.89 | |
Net Assets - Class C Shares | | $ | 2,373,197 | |
| Shares Outstanding, $0.01 Par Value (unlimited shares authorized) | | | 200,111 | |
Net Asset Value Per Share(1) | | $ | 11.86 | |
Net Assets - Class D Shares | | $ | 190,496,760 | |
| Shares Outstanding, $0.01 Par Value (unlimited shares authorized) | | | 15,502,805 | |
Net Asset Value Per Share | | $ | 12.29 | |
Net Assets - Class I Shares | | $ | 13,699,966 | |
| Shares Outstanding, $0.01 Par Value (unlimited shares authorized) | | | 1,115,952 | |
Net Asset Value Per Share | | $ | 12.28 | |
Net Assets - Class S Shares | | $ | 1,031,042 | |
| Shares Outstanding, $0.01 Par Value (unlimited shares authorized) | | | 85,527 | |
Net Asset Value Per Share | | $ | 12.06 | |
Net Assets - Class T Shares | | $ | 12,634,639 | |
| Shares Outstanding, $0.01 Par Value (unlimited shares authorized) | | | 1,030,023 | |
Net Asset Value Per Share | | $ | 12.27 | |
| |
(1) Redemption price per share may be reduced for any applicable contingent deferred sales charge. (2) Maximum offering price is computed at 100/94.25 of net asset value. |
| | |
See Notes to Financial Statements. |
| |
Janus Investment Fund | 11 |
Janus Henderson Global Allocation Fund - Growth
Statement of Operations
For the year ended June 30, 2023
| | | | | | |
| | | | | |
Investment Income: | | | |
| Dividends from affiliates | $ | 3,487,074 | |
| Other income | | 260 | |
Total Investment Income | | 3,487,334 | |
Expenses: | | | |
| Advisory fees | | 110,165 | |
| 12b-1 Distribution and shareholder servicing fees: | | | |
| | Class A Shares | | 13,915 | |
| | Class C Shares | | 23,493 | |
| | Class S Shares | | 2,894 | |
| Transfer agent administrative fees and expenses: | | | |
| | Class D Shares | | 217,556 | |
| | Class S Shares | | 2,896 | |
| | Class T Shares | | 32,207 | |
| Transfer agent networking and omnibus fees: | | | |
| | Class A Shares | | 4,537 | |
| | Class C Shares | | 2,571 | |
| | Class I Shares | | 11,964 | |
| Other transfer agent fees and expenses: | | | |
| | Class A Shares | | 419 | |
| | Class C Shares | | 146 | |
| | Class D Shares | | 36,723 | |
| | Class I Shares | | 782 | |
| | Class S Shares | | 53 | |
| | Class T Shares | | 244 | |
| Registration fees | | 102,863 | |
| Professional fees | | 40,826 | |
| Shareholder reports expense | | 37,588 | |
| Custodian fees | | 10,431 | |
| Trustees’ fees and expenses | | 6,009 | |
| Other expenses | | 16,721 | |
Total Expenses | | 675,003 | |
Less: Excess Expense Reimbursement and Waivers | | (22,801) | |
Net Expenses | | 652,202 | |
Net Investment Income/(Loss) | | 2,835,132 | |
Net Realized Gain/(Loss) on Investments: | | | |
| Investments in affiliates | | (8,205,717) | |
| Capital gain distributions from underlying funds | | 2,512,757 | |
Total Net Realized Gain/(Loss) on Investments | | (5,692,960) | |
Change in Unrealized Net Appreciation/Depreciation: | | | |
| Investments in affiliates | | 24,451,761 | |
Total Change in Unrealized Net Appreciation/Depreciation | | 24,451,761 | |
Net Increase/(Decrease) in Net Assets Resulting from Operations | $ | 21,593,933 | |
| | | | | |
| | |
See Notes to Financial Statements. |
| |
12 | JUNE 30, 2023 |
Janus Henderson Global Allocation Fund - Growth
Statements of Changes in Net Assets
| | | | | | | | | |
| | | | | | | | |
| | | Year ended
June 30, 2023 | | Year ended
June 30, 2022 | |
| | | | | | | | | |
Operations: | | | | | | |
| Net investment income/(loss) | $ | 2,835,132 | | $ | 8,959,114 | |
| Net realized gain/(loss) on investments | | (5,692,960) | | | 11,486,988 | |
| Change in unrealized net appreciation/depreciation | | 24,451,761 | | | (69,697,246) | |
Net Increase/(Decrease) in Net Assets Resulting from Operations | | 21,593,933 | | | (49,251,144) | |
Dividends and Distributions to Shareholders: | | | | | | |
| | Class A Shares | | (230,518) | | | (921,690) | |
| | Class C Shares | | (86,622) | | | (566,187) | |
| | Class D Shares | | (8,037,482) | | | (33,023,195) | |
| | Class I Shares | | (588,717) | | | (2,339,152) | |
| | Class S Shares | | (54,407) | | | (230,063) | |
| | Class T Shares | | (545,358) | | | (2,369,409) | |
Net Decrease from Dividends and Distributions to Shareholders | | (9,543,104) | | | (39,449,696) | |
Capital Share Transactions: | | | | | | |
| | Class A Shares | | 623,306 | | | 1,260,008 | |
| | Class C Shares | | (768,807) | | | 228,029 | |
| | Class D Shares | | (1,068,279) | | | 22,065,920 | |
| | Class I Shares | | 1,481,819 | | | 1,630,858 | |
| | Class S Shares | | (154,959) | | | 217,222 | |
| | Class T Shares | | (1,440,925) | | | 2,457,324 | |
Net Increase/(Decrease) from Capital Share Transactions | | (1,327,845) | | | 27,859,361 | |
Net Increase/(Decrease) in Net Assets | | 10,722,984 | | | (60,841,479) | |
Net Assets: | | | | | | |
| Beginning of period | | 215,585,692 | | | 276,427,171 | |
| End of period | $ | 226,308,676 | | $ | 215,585,692 | |
| | | | | | | | |
| | |
See Notes to Financial Statements. |
| |
Janus Investment Fund | 13 |
Janus Henderson Global Allocation Fund - Growth
Financial Highlights
| | | | | | | | | | | | | | | | | | | |
Class A Shares | | | | | | | | | | | | | | | |
For a share outstanding during the year ended June 30 | | 2023 | | | 2022 | | | 2021 | | | 2020 | | | 2019 | |
| Net Asset Value, Beginning of Period | | $11.54 | | | $16.53 | | | $12.93 | | | $14.05 | | | $14.28 | |
| Income/(Loss) from Investment Operations: | | | | | | | | | | | | | | | |
| | Net investment income/(loss)(1) | | 0.13 | | | 0.48 | | | 0.18 | | | 0.17 | | | 0.15 | |
| | Net realized and unrealized gain/(loss) | | 0.99 | | | (3.08) | | | 4.12 | | | (0.32) | | | 0.27 | |
| Total from Investment Operations | | 1.12 | | | (2.60) | | | 4.30 | | | (0.15) | | | 0.42 | |
| Less Dividends and Distributions: | | | | | | | | | | | | | | | |
| | Dividends (from net investment income) | | (0.10) | | | (0.50) | | | (0.18) | | | (0.17) | | | (0.17) | |
| | Distributions (from capital gains) | | (0.41) | | | (1.89) | | | (0.52) | | | (0.80) | | | (0.48) | |
| Total Dividends and Distributions | | (0.51) | | | (2.39) | | | (0.70) | | | (0.97) | | | (0.65) | |
| Net Asset Value, End of Period | | $12.15 | | | $11.54 | | | $16.53 | | | $12.93 | | | $14.05 | |
| Total Return* | | 10.03% | | | (18.53)% | | | 33.72% | | | (1.48)% | | | 3.57% | |
| Net Assets, End of Period (in thousands) | | $6,073 | | | $5,148 | | | $6,003 | | | $4,381 | | | $4,845 | |
| Average Net Assets for the Period (in thousands) | | $5,533 | | | $6,076 | | | $4,883 | | | $4,624 | | | $4,564 | |
| Ratios to Average Net Assets**: | | | | | | | | | | | | | | | |
| | Ratio of Gross Expenses(2) | | 0.48% | | | 0.45% | | | 0.46% | | | 0.46% | | | 0.46% | |
| | Ratio of Net Expenses (After Waivers and Expense Offsets)(2) | | 0.48% | | | 0.45% | | | 0.46% | | | 0.46% | | | 0.46% | |
| | Ratio of Net Investment Income/(Loss)(2) | | 1.11% | | | 3.28% | | | 1.17% | | | 1.29% | | | 1.07% | |
| Portfolio Turnover Rate | | 35% | | | 32% | | | 50% | | | 49% | | | 9% | |
| | | | | | | | | | | | | | | | | | | |
| |
* Total return includes adjustments in accordance with generally accepted accounting principles required at the year or period end and are not annualized for periods of less than one full year. ** Annualized for periods of less than one full year. (1) Per share amounts are calculated based on average shares outstanding during the year or period. (2) Ratios do not include indirect expenses of the underlying funds and/or investment companies in which the Fund invests. |
| | |
See Notes to Financial Statements. |
| |
14 | JUNE 30, 2023 |
Janus Henderson Global Allocation Fund - Growth
Financial Highlights
| | | | | | | | | | | | | | | | | | | |
Class C Shares | | | | | | | | | | | | | | | |
For a share outstanding during the year ended June 30 | | 2023 | | | 2022 | | | 2021 | | | 2020 | | | 2019 | |
| Net Asset Value, Beginning of Period | | $11.25 | | | $16.16 | | | $12.65 | | | $13.76 | | | $14.00 | |
| Income/(Loss) from Investment Operations: | | | | | | | | | | | | | | | |
| | Net investment income/(loss)(1) | | 0.05 | | | 0.37 | | | 0.09 | | | 0.07 | | | 0.05 | |
| | Net realized and unrealized gain/(loss) | | 0.97 | | | (3.01) | | | 4.00 | | | (0.32) | | | 0.27 | |
| Total from Investment Operations | | 1.02 | | | (2.64) | | | 4.09 | | | (0.25) | | | 0.32 | |
| Less Dividends and Distributions: | | | | | | | | | | | | | | | |
| | Dividends (from net investment income) | | — | | | (0.38) | | | (0.06) | | | (0.06) | | | (0.08) | |
| | Distributions (from capital gains) | | (0.41) | | | (1.89) | | | (0.52) | | | (0.80) | | | (0.48) | |
| Total Dividends and Distributions | | (0.41) | | | (2.27) | | | (0.58) | | | (0.86) | | | (0.56) | |
| Net Asset Value, End of Period | | $11.86 | | | $11.25 | | | $16.16 | | | $12.65 | | | $13.76 | |
| Total Return* | | 9.31% | | | (19.11)% | | | 32.77% | | | (2.23)% | | | 2.83% | |
| Net Assets, End of Period (in thousands) | | $2,373 | | | $3,031 | | | $4,096 | | | $4,497 | | | $6,586 | |
| Average Net Assets for the Period (in thousands) | | $2,608 | | | $3,787 | | | $4,340 | | | $5,700 | | | $6,878 | |
| Ratios to Average Net Assets**: | | | | | | | | | | | | | | | |
| | Ratio of Gross Expenses(2) | | 1.14% | | | 1.16% | | | 1.14% | | | 1.18% | | | 1.20% | |
| | Ratio of Net Expenses (After Waivers and Expense Offsets)(2) | | 1.14% | | | 1.16% | | | 1.14% | | | 1.18% | | | 1.20% | |
| | Ratio of Net Investment Income/(Loss)(2) | | 0.40% | | | 2.60% | | | 0.64% | | | 0.55% | | | 0.38% | |
| Portfolio Turnover Rate | | 35% | | | 32% | | | 50% | | | 49% | | | 9% | |
| | | | | | | | | | | | | | | | | | | |
| |
* Total return includes adjustments in accordance with generally accepted accounting principles required at the year or period end and are not annualized for periods of less than one full year. ** Annualized for periods of less than one full year. (1) Per share amounts are calculated based on average shares outstanding during the year or period. (2) Ratios do not include indirect expenses of the underlying funds and/or investment companies in which the Fund invests. |
| | |
See Notes to Financial Statements. |
| |
Janus Investment Fund | 15 |
Janus Henderson Global Allocation Fund - Growth
Financial Highlights
| | | | | | | | | | | | | | | | | | | |
Class D Shares | | | | | | | | | | | | | | | |
For a share outstanding during the year ended June 30 | | 2023 | | | 2022 | | | 2021 | | | 2020 | | | 2019 | |
| Net Asset Value, Beginning of Period | | $11.66 | | | $16.68 | | | $13.04 | | | $14.17 | | | $14.39 | |
| Income/(Loss) from Investment Operations: | | | | | | | | | | | | | | | |
| | Net investment income/(loss)(1) | | 0.16 | | | 0.51 | | | 0.22 | | | 0.20 | | | 0.18 | |
| | Net realized and unrealized gain/(loss) | | 1.00 | | | (3.12) | | | 4.15 | | | (0.33) | | | 0.27 | |
| Total from Investment Operations | | 1.16 | | | (2.61) | | | 4.37 | | | (0.13) | | | 0.45 | |
| Less Dividends and Distributions: | | | | | | | | | | | | | | | |
| | Dividends (from net investment income) | | (0.12) | | | (0.52) | | | (0.21) | | | (0.20) | | | (0.19) | |
| | Distributions (from capital gains) | | (0.41) | | | (1.89) | | | (0.52) | | | (0.80) | | | (0.48) | |
| Total Dividends and Distributions | | (0.53) | | | (2.41) | | | (0.73) | | | (1.00) | | | (0.67) | |
| Net Asset Value, End of Period | | $12.29 | | | $11.66 | | | $16.68 | | | $13.04 | | | $14.17 | |
| Total Return* | | 10.31% | | | (18.41)% | | | 34.01% | | | (1.37)% | | | 3.77% | |
| Net Assets, End of Period (in thousands) | | $190,497 | | | $181,527 | | | $233,735 | | | $187,295 | | | $205,433 | |
| Average Net Assets for the Period (in thousands) | | $183,974 | | | $218,436 | | | $213,320 | | | $195,360 | | | $205,469 | |
| Ratios to Average Net Assets**: | | | | | | | | | | | | | | | |
| | Ratio of Gross Expenses(2) | | 0.29% | | | 0.26% | | | 0.27% | | | 0.28% | | | 0.29% | |
| | Ratio of Net Expenses (After Waivers and Expense Offsets)(2) | | 0.28% | | | 0.26% | | | 0.27% | | | 0.28% | | | 0.28% | |
| | Ratio of Net Investment Income/(Loss)(2) | | 1.31% | | | 3.45% | | | 1.45% | | | 1.46% | | | 1.27% | |
| Portfolio Turnover Rate | | 35% | | | 32% | | | 50% | | | 49% | | | 9% | |
| | | | | | | | | | | | | | | | | | | |
| |
* Total return includes adjustments in accordance with generally accepted accounting principles required at the year or period end and are not annualized for periods of less than one full year. ** Annualized for periods of less than one full year. (1) Per share amounts are calculated based on average shares outstanding during the year or period. (2) Ratios do not include indirect expenses of the underlying funds and/or investment companies in which the Fund invests. |
| | |
See Notes to Financial Statements. |
| |
16 | JUNE 30, 2023 |
Janus Henderson Global Allocation Fund - Growth
Financial Highlights
| | | | | | | | | | | | | | | | | | | |
Class I Shares | | | | | | | | | | | | | | | |
For a share outstanding during the year ended June 30 | | 2023 | | | 2022 | | | 2021 | | | 2020 | | | 2019 | |
| Net Asset Value, Beginning of Period | | $11.65 | | | $16.68 | | | $13.04 | | | $14.16 | | | $14.39 | |
| Income/(Loss) from Investment Operations: | | | | | | | | | | | | | | | |
| | Net investment income/(loss)(1) | | 0.16 | | | 0.54 | | | 0.23 | | | 0.22 | | | 0.19 | |
| | Net realized and unrealized gain/(loss) | | 1.01 | | | (3.14) | | | 4.14 | | | (0.33) | | | 0.26 | |
| Total from Investment Operations | | 1.17 | | | (2.60) | | | 4.37 | | | (0.11) | | | 0.45 | |
| Less Dividends and Distributions: | | | | | | | | | | | | | | | |
| | Dividends (from net investment income) | | (0.13) | | | (0.54) | | | (0.21) | | | (0.21) | | | (0.20) | |
| | Distributions (from capital gains) | | (0.41) | | | (1.89) | | | (0.52) | | | (0.80) | | | (0.48) | |
| Total Dividends and Distributions | | (0.54) | | | (2.43) | | | (0.73) | | | (1.01) | | | (0.68) | |
| Net Asset Value, End of Period | | $12.28 | | | $11.65 | | | $16.68 | | | $13.04 | | | $14.16 | |
| Total Return* | | 10.40% | | | (18.42)% | | | 34.07% | | | (1.24)% | | | 3.80% | |
| Net Assets, End of Period (in thousands) | | $13,700 | | | $11,359 | | | $14,799 | | | $11,548 | | | $14,977 | |
| Average Net Assets for the Period (in thousands) | | $13,019 | | | $14,681 | | | $12,747 | | | $13,319 | | | $15,240 | |
| Ratios to Average Net Assets**: | | | | | | | | | | | | | | | |
| | Ratio of Gross Expenses(2) | | 0.23% | | | 0.21% | | | 0.21% | | | 0.22% | | | 0.22% | |
| | Ratio of Net Expenses (After Waivers and Expense Offsets)(2) | | 0.23% | | | 0.21% | | | 0.21% | | | 0.22% | | | 0.22% | |
| | Ratio of Net Investment Income/(Loss)(2) | | 1.37% | | | 3.65% | | | 1.49% | | | 1.59% | | | 1.33% | |
| Portfolio Turnover Rate | | 35% | | | 32% | | | 50% | | | 49% | | | 9% | |
| | | | | | | | | | | | | | | | | | | |
| |
* Total return includes adjustments in accordance with generally accepted accounting principles required at the year or period end and are not annualized for periods of less than one full year. ** Annualized for periods of less than one full year. (1) Per share amounts are calculated based on average shares outstanding during the year or period. (2) Ratios do not include indirect expenses of the underlying funds and/or investment companies in which the Fund invests. |
| | |
See Notes to Financial Statements. |
| |
Janus Investment Fund | 17 |
Janus Henderson Global Allocation Fund - Growth
Financial Highlights
| | | | | | | | | | | | | | | | | | | |
Class S Shares | | | | | | | | | | | | | | | |
For a share outstanding during the year ended June 30 | | 2023 | | | 2022 | | | 2021 | | | 2020 | | | 2019 | |
| Net Asset Value, Beginning of Period | | $11.45 | | | $16.43 | | | $12.85 | | | $13.96 | | | $14.20 | |
| Income/(Loss) from Investment Operations: | | | | | | | | | | | | | | | |
| | Net investment income/(loss)(1) | | 0.12 | | | 0.48 | | | 0.16 | | | 0.18 | | | 0.13 | |
| | Net realized and unrealized gain/(loss) | | 0.99 | | | (3.09) | | | 4.08 | | | (0.35) | | | 0.26 | |
| Total from Investment Operations | | 1.11 | | | (2.61) | | | 4.24 | | | (0.17) | | | 0.39 | |
| Less Dividends and Distributions: | | | | | | | | | | | | | | | |
| | Dividends (from net investment income) | | (0.09) | | | (0.48) | | | (0.14) | | | (0.14) | | | (0.15) | |
| | Distributions (from capital gains) | | (0.41) | | | (1.89) | | | (0.52) | | | (0.80) | | | (0.48) | |
| Total Dividends and Distributions | | (0.50) | | | (2.37) | | | (0.66) | | | (0.94) | | | (0.63) | |
| Net Asset Value, End of Period | | $12.06 | | | $11.45 | | | $16.43 | | | $12.85 | | | $13.96 | |
| Total Return* | | 9.97% | | | (18.71)% | | | 33.45% | | | (1.67)% | | | 3.41% | |
| Net Assets, End of Period (in thousands) | | $1,031 | | | $1,134 | | | $1,408 | | | $1,539 | | | $2,157 | |
| Average Net Assets for the Period (in thousands) | | $1,153 | | | $1,423 | | | $1,325 | | | $1,879 | | | $2,446 | |
| Ratios to Average Net Assets**: | | | | | | | | | | | | | | | |
| | Ratio of Gross Expenses(2) | | 0.64% | | | 0.62% | | | 0.62% | | | 0.62% | | | 0.61% | |
| | Ratio of Net Expenses (After Waivers and Expense Offsets)(2) | | 0.64% | | | 0.62% | | | 0.62% | | | 0.62% | | | 0.61% | |
| | Ratio of Net Investment Income/(Loss)(2) | | 1.06% | | | 3.31% | | | 1.05% | | | 1.30% | | | 0.96% | |
| Portfolio Turnover Rate | | 35% | | | 32% | | | 50% | | | 49% | | | 9% | |
| | | | | | | | | | | | | | | | | | | |
| |
* Total return includes adjustments in accordance with generally accepted accounting principles required at the year or period end and are not annualized for periods of less than one full year. ** Annualized for periods of less than one full year. (1) Per share amounts are calculated based on average shares outstanding during the year or period. (2) Ratios do not include indirect expenses of the underlying funds and/or investment companies in which the Fund invests. |
| | |
See Notes to Financial Statements. |
| |
18 | JUNE 30, 2023 |
Janus Henderson Global Allocation Fund - Growth
Financial Highlights
| | | | | | | | | | | | | | | | | | | |
Class T Shares | | | | | | | | | | | | | | | |
For a share outstanding during the year ended June 30 | | 2023 | | | 2022 | | | 2021 | | | 2020 | | | 2019 | |
| Net Asset Value, Beginning of Period | | $11.64 | | | $16.65 | | | $13.02 | | | $14.14 | | | $14.37 | |
| Income/(Loss) from Investment Operations: | | | | | | | | | | | | | | | |
| | Net investment income/(loss)(1) | | 0.15 | | | 0.49 | | | 0.21 | | | 0.19 | | | 0.17 | |
| | Net realized and unrealized gain/(loss) | | 1.00 | | | (3.10) | | | 4.14 | | | (0.32) | | | 0.26 | |
| Total from Investment Operations | | 1.15 | | | (2.61) | | | 4.35 | | | (0.13) | | | 0.43 | |
| Less Dividends and Distributions: | | | | | | | | | | | | | | | |
| | Dividends (from net investment income) | | (0.11) | | | (0.51) | | | (0.20) | | | (0.19) | | | (0.18) | |
| | Distributions (from capital gains) | | (0.41) | | | (1.89) | | | (0.52) | | | (0.80) | | | (0.48) | |
| Total Dividends and Distributions | | (0.52) | | | (2.40) | | | (0.72) | | | (0.99) | | | (0.66) | |
| Net Asset Value, End of Period | | $12.27 | | | $11.64 | | | $16.65 | | | $13.02 | | | $14.14 | |
| Total Return* | | 10.22% | | | (18.45)% | | | 33.88% | | | (1.37)% | | | 3.61% | |
| Net Assets, End of Period (in thousands) | | $12,635 | | | $13,387 | | | $16,385 | | | $13,330 | | | $16,624 | |
| Average Net Assets for the Period (in thousands) | | $12,814 | | | $15,962 | | | $15,199 | | | $15,095 | | | $17,721 | |
| Ratios to Average Net Assets**: | | | | | | | | | | | | | | | |
| | Ratio of Gross Expenses(2) | | 0.39% | | | 0.36% | | | 0.37% | | | 0.37% | | | 0.38% | |
| | Ratio of Net Expenses (After Waivers and Expense Offsets)(2) | | 0.35% | | | 0.34% | | | 0.34% | | | 0.35% | | | 0.36% | |
| | Ratio of Net Investment Income/(Loss)(2) | | 1.24% | | | 3.34% | | | 1.37% | | | 1.43% | | | 1.20% | |
| Portfolio Turnover Rate | | 35% | | | 32% | | | 50% | | | 49% | | | 9% | |
| | | | | | | | | | | | | | | | | | | |
| |
* Total return includes adjustments in accordance with generally accepted accounting principles required at the year or period end and are not annualized for periods of less than one full year. ** Annualized for periods of less than one full year. (1) Per share amounts are calculated based on average shares outstanding during the year or period. (2) Ratios do not include indirect expenses of the underlying funds and/or investment companies in which the Fund invests. |
| | |
See Notes to Financial Statements. |
| |
Janus Investment Fund | 19 |
Janus Henderson Global Allocation Fund - Growth
Notes to Financial Statements
1. Organization and Significant Accounting Policies
Janus Henderson Global Allocation Fund - Growth (the “Fund”) is a series of Janus Investment Fund (the “Trust”), which is organized as a Massachusetts business trust and is registered under the Investment Company Act of 1940, as amended (the “1940 Act”), as an open-end management investment company, and therefore has applied the specialized accounting and reporting guidance in Financial Accounting Standards Board (“FASB”) Accounting Standards Codification (“ASC”) Topic 946. The Fund operates as a “fund of funds,” meaning substantially all of the Fund’s assets will be invested in other Janus Henderson mutual funds and exchange-traded funds ("ETFs") (the “underlying funds”). The Trust offers 39 funds, each of which offers multiple share classes, with differing investment objectives and policies. The Fund seeks total return through a primary emphasis on growth of capital with a secondary emphasis on income. The Fund is classified as diversified, as defined in the 1940 Act. Janus Henderson Investors US LLC is the investment adviser (the “Adviser”) to the Fund.
The Fund offers multiple classes of shares in order to meet the needs of various types of investors. Each class represents an interest in the same portfolio of investments. Certain financial intermediaries may not offer all classes of shares.
Shareholders, including other funds, individuals, accounts, as well as the Fund’s portfolio manager(s) and/or investment personnel, may from time to time own (beneficially or of record) a significant percentage of the Fund’s Shares and can be considered to “control” the Fund when that ownership exceeds 25% of the Fund’s assets (and which may differ from control as determined in accordance with United States of America generally accepted accounting principles ("US GAAP")).
Class A Shares are offered through financial intermediary platforms including, but not limited to, traditional brokerage platforms, mutual fund wrap fee programs, bank trust platforms, and retirement platforms.
Class C Shares are offered through financial intermediary platforms including, but not limited to, traditional brokerage platforms, mutual fund wrap fee programs, and bank trust platforms.
Class C Shares are closed to investments by new employer-sponsored retirement plans and existing employer-sponsored retirement plans are no longer able to make additional purchases or exchanges into Class C Shares.
The Fund currently implements an automatic conversion feature pursuant to which Class C Shares that have been held for eight years are automatically converted to Class A Shares without the imposition of any sales charge, fee or other charge. The conversion will generally occur no later than ten business days in the month following the month of the eighth anniversary of the date of purchase. Class C Shares purchased through the reinvestment of dividends and other distributions on Class C Shares will convert to Class A Shares at the same time as the original Class C Shares with respect to which they were purchased. For Class C Shares held in omnibus accounts on intermediary platforms, the Fund relies on these intermediaries to implement this conversion feature. Your financial intermediary may have separate policies and procedures as to when and how Class C Shares may be converted to Class A Shares.
Effective July 6, 2020, Class D Shares are available to new investors, subject to any closed fund policies for a Fund, as applicable. Previously, Class D Shares were only available to investors who already had a direct account with the Janus Henderson funds; immediate family members or members of the same household of an eligible individual investor; and existing beneficial owners of sole proprietorships or partnerships that hold accounts directly with the Janus Henderson funds.
Class I Shares are available through certain financial intermediary platforms including, but not limited to, mutual fund wrap fee programs, managed account programs, asset allocation programs, bank trust platforms, as well as certain retirement platforms. Class I Shares are also available to certain direct institutional investors including, but not limited to, corporations, certain retirement plans, public plans, and foundations/endowments, who established Class I Share accounts before August 4, 2017.
Class S Shares are offered through financial intermediary platforms including, but not limited to, retirement platforms and asset allocation, mutual fund wrap, or other discretionary or nondiscretionary fee-based investment advisory programs. In addition, Class S Shares may be available through certain financial intermediaries who have an agreement with the Adviser or its affiliates to offer Class S Shares on their supermarket platforms.
Janus Henderson Global Allocation Fund - Growth
Notes to Financial Statements
Class T Shares are available through certain financial intermediary platforms including, but not limited to, mutual fund wrap fee programs, managed account programs, asset allocation programs, bank trust platforms, as well as certain retirement platforms. In addition, Class T Shares may be available through certain financial intermediaries who have an agreement with the Adviser or its affiliates to offer Class T Shares on their supermarket platforms.
Underlying Funds
The Fund invests in a variety of underlying funds to pursue a target allocation of equity investments, fixed-income securities, and alternative investments and may also invest in money market instruments or cash/cash equivalents. The Fund has a target allocation, which is how the Fund's investments generally will be allocated among the major asset classes over the long term, as well as normal ranges, under normal market conditions, within which the Fund's asset class allocations generally will vary over short-term periods. The Fund's long-term expected average asset allocation is as follows: 75% to equity investments, 15% to fixed-income securities and money market instruments, and 10% to alternative investments. Additional details and descriptions of the investment objectives and strategies of each of the underlying funds are available in the Fund’s and underlying funds’ prospectuses available at janushenderson.com. The Trustees of the underlying funds may change the investment objectives or strategies of the underlying funds at any time without prior notice to the Fund’s shareholders.
The following accounting policies have been followed by the Fund and are in conformity with US GAAP.
Investment Valuation
The Fund’s net asset value (“NAV”) is calculated based upon the NAV of each of the underlying funds in which the Fund invests on the day of valuation. The NAV for each class of the underlying funds is computed by dividing the total value of securities and other assets allocated to the class, less liabilities allocated to that class, by the total number of shares outstanding for the class.
Valuation Inputs Summary
FASB ASC 820, Fair Value Measurements and Disclosures (“ASC 820”), defines fair value, establishes a framework for measuring fair value, and expands disclosure requirements regarding fair value measurements. This standard emphasizes that fair value is a market-based measurement that should be determined based on the assumptions that market participants would use in pricing an asset or liability and establishes a hierarchy that prioritizes inputs to valuation techniques used to measure fair value. These inputs are summarized into three broad levels:
Level 1 – Unadjusted quoted prices in active markets the Fund has the ability to access for identical assets or liabilities.
Level 2 – Observable inputs other than unadjusted quoted prices included in Level 1 that are observable for the asset or liability either directly or indirectly. These inputs may include quoted prices for the identical instrument on an inactive market, prices for similar instruments, interest rates, prepayment speeds, credit risk, yield curves, default rates and similar data.
Level 3 – Unobservable inputs for the asset or liability to the extent that relevant observable inputs are not available, representing the Fund’s own assumptions about the assumptions that a market participant would use in valuing the asset or liability, and that would be based on the best information available.
The Fund classifies each of its investments in underlying funds as Level 1, without consideration as to the classification level of the specific investments held by the underlying funds. There have been no significant changes in valuation techniques used in valuing any such positions held by the Fund since the beginning of the fiscal year.
The inputs or methodology used for fair valuing securities are not necessarily an indication of the risk associated with investing in those securities. The summary of inputs used as of June 30, 2023 to fair value the Fund’s investments in securities and other financial instruments is included in the “Valuation Inputs Summary” in the Notes to Schedule of Investments and Other Information.
Investment Transactions and Investment Income
Investment transactions are accounted for as of the date purchased or sold (trade date). Dividend income is recorded on the ex-dividend date. Certain dividends from foreign securities held by the underlying funds will be recorded as soon as the Fund is informed of the dividend, if such information is obtained subsequent to the ex-dividend date. Dividends from foreign securities may be subject to withholding taxes in foreign jurisdictions. Non-cash dividends, if any, are recorded on the ex-dividend date at fair value. Interest income is recorded daily on the accrual basis and includes
Janus Henderson Global Allocation Fund - Growth
Notes to Financial Statements
amortization of premiums and accretion of discounts. The Fund classifies gains and losses on prepayments received as an adjustment to interest income. Debt securities may be placed in non-accrual status and related interest income may be reduced by stopping current accruals and writing off interest receivables when collection of all or a portion of interest has become doubtful. Gains and losses are determined on the identified cost basis, which is the same basis used for federal income tax purposes. Income, as well as gains and losses, both realized and unrealized, are allocated daily to each class of shares based upon the ratio of net assets represented by each class as a percentage of total net assets.
Dividend distributions received from the underlying funds are recorded on the ex-dividend date. Upon receipt of the notification from an underlying fund, and subsequent to the ex-dividend date, a part or all of the dividend income originally recorded by the Fund may be reclassified as a tax return of capital by reducing the cost basis of the underlying fund and/or increasing the realized gain on sales of investments in the underlying fund.
Expenses
The Fund bears expenses incurred specifically on its behalf. Additionally, the Fund, as a shareholder in the underlying funds, will also indirectly bear its pro rata share of the expenses incurred by the underlying funds. Each class of shares bears a portion of general expenses, which are allocated daily to each class of shares based upon the ratio of net assets represented by each class as a percentage of total net assets. Expenses directly attributable to a specific class of shares are charged against the operations of such class.
Estimates
The preparation of financial statements in conformity with US GAAP requires management to make estimates and assumptions that affect the reported amount of assets and liabilities and disclosure of contingent assets and liabilities at the date of the financial statements, and the reported amounts of income and expenses during the reporting period. Actual results could differ from those estimates.
Indemnifications
In the normal course of business, the Fund may enter into contracts that contain provisions for indemnification of other parties against certain potential liabilities. The Fund’s maximum exposure under these arrangements is unknown, and would involve future claims that may be made against the Fund that have not yet occurred. Currently, the risk of material loss from such claims is considered remote.
Dividends and Distributions
The Fund generally declares and distributes dividends of net investment income and realized capital gains (if any) annually. The Fund may treat a portion of the amount paid to redeem shares as a distribution of investment company taxable income and realized capital gains that are reflected in the net asset value. This practice, commonly referred to as “equalization,” has no effect on the redeeming shareholder or a Fund’s total return, but may reduce the amounts that would otherwise be required to be paid as taxable dividends to the remaining shareholders. It is possible that the Internal Revenue Service (IRS) could challenge the Fund's equalization methodology or calculations, and any such challenge could result in additional tax, interest, or penalties to be paid by the Fund.
The underlying funds may make certain investments in real estate investment trusts (“REITs”) which pay dividends to their shareholders based upon funds available from operations. It is quite common for these dividends to exceed the REITs’ taxable earnings and profits, resulting in the excess portion of such dividends being designated as a return of capital. If the underlying funds distribute such amounts, such distributions could constitute a return of capital to shareholders for federal income tax purposes.
Federal Income Taxes
The Fund intends to continue to qualify as a regulated investment company and distribute all of its taxable income in accordance with the requirements of Subchapter M of the Internal Revenue Code. Management has analyzed the Fund’s tax positions taken for all open federal income tax years, generally a three-year period, and has concluded that no provision for federal income tax is required in the Fund’s financial statements. The Fund is not aware of any tax positions for which it is reasonably possible that the total amounts of unrecognized tax benefits will significantly change in the next twelve months.
2. Investment Advisory Agreements and Other Transactions with Affiliates
The Fund pays the Adviser an investment advisory fee which is calculated daily and paid monthly. The Fund’s contractual investment advisory fee rate (expressed as an annual rate) is 0.05% of its average daily net assets.
Janus Henderson Global Allocation Fund - Growth
Notes to Financial Statements
The Adviser has contractually agreed to waive the investment advisory fee and/or reimburse operating expenses to the extent that the Fund’s total annual fund operating expenses, excluding any expenses of an underlying fund (acquired fund fees and expenses), the fees payable pursuant to a Rule 12b-1 plan, shareholder servicing fees, such as transfer agency fees (including out-of-pocket costs), administrative services fees and any networking/omnibus payable by any share class, brokerage commissions, interest, dividends, taxes, and extraordinary expenses, exceed the annual rate of 0.14% of the Fund’s average daily net assets. The Adviser has agreed to continue the waivers for at least a one-year period commencing October 28, 2022. If applicable, amounts waived and/or reimbursed to the Fund by the Adviser are disclosed as “Excess Expense Reimbursement and Waivers” on the Statement of Operations.
The Adviser serves as administrator to the Fund pursuant to an administration agreement, and is authorized to perform, or cause others to perform, the administration services necessary for the operation of the Fund. The Adviser does not receive compensation for serving as administrator and it bears the expenses related to operation of the Fund, such as, but not limited to fund accounting and tax services; shareholder servicing; and preparation of various documents filed with the SEC. The Fund bears costs related to any compensation, fees, or reimbursements paid to Trustees who are independent of the Adviser; fees and expenses of counsel to the Independent Trustees; fees and expenses of consultants to the Fund; custody fees; audit expenses; brokerage commissions and all other expenses in connection with execution of portfolio transactions; blue sky registration costs; interest; all federal, state and local taxes (including stamp, excise, income, and franchise taxes); expenses of shareholder meetings, including the preparation, printing, and distribution of proxy statements, notices, and reports to shareholders; expenses of printing and mailing to existing shareholders prospectuses, statements of additional information, shareholder reports, and other materials required to be mailed to shareholders by federal or state laws or regulations; transfer agency fees and expenses payable pursuant to a transfer agency agreement between the Trust and the Transfer Agent on behalf of the Fund; any litigation; and other extraordinary expenses. In addition, some expenses related to compensation payable to the Fund's Chief Compliance Officer and compliance staff are shared with the Fund. Total compensation of $343,237 was paid to the Chief Compliance Officer and certain compliance staff by the Trust during the year ended June 30, 2023. The Fund's portion is reported as part of “Other expenses” on the Statement of Operations.
Janus Henderson Services US LLC (the “Transfer Agent”), a wholly-owned subsidiary of the Adviser, is the Fund’s and the underlying funds’ transfer agent. The Transfer Agent provides or arranges for the provision of shareholder services including, but not limited to, recordkeeping, subaccounting, answering inquiries regarding accounts, order processing, transaction confirmations, the mailing of prospectuses and shareholder reports, and other shareholder services provided to or on behalf of shareholders. These amounts are disclosed as “Transfer agent administrative fees and expenses” on the Statement of Operations.
Class D Shares of the Fund pay the Transfer Agent an annual administrative services fee based on the average daily net assets of Class D Shares as detailed below.
| | |
Average Daily Net Assets of Class D Shares of the Janus Henderson funds | Administrative Services Fee |
Under $40 billion | 0.12% |
$40 billion – $49.9 billion | 0.10% |
Over $49.9 billion | 0.08% |
During the reporting period, the administrative services fee rate was 0.12%.
The Transfer Agent receives an administrative services fee at an annual rate of up to 0.25% of the average daily net assets of the Fund’s Class S Shares and Class T Shares for providing or procuring administrative services to investors in Class S Shares and Class T Shares of the Fund. The Transfer Agent expects to use all or a significant portion of this fee to compensate retirement plan service providers, broker-dealers, bank trust departments, financial advisors, and other financial intermediaries for providing these services. The Transfer Agent may keep certain amounts retained for reimbursement of out-of-pocket costs incurred for servicing clients of Class S Shares and Class T Shares.
Shareholder Services provided by these financial intermediaries may include, but are not limited to, recordkeeping, subaccounting, order processing, providing order confirmations, periodic statements, forwarding prospectuses, shareholder reports, and other materials to existing customers, answering inquiries regarding accounts, and other administrative services. Order processing includes the submission of transactions through the National Securities Clearing Corporation (“NSCC”) or similar systems, or those processed on a manual basis with the Adviser. For all share classes, the Transfer Agent also seeks reimbursement for costs it incurs as transfer agent and for providing servicing.
Janus Henderson Global Allocation Fund - Growth
Notes to Financial Statements
Certain, but not all, intermediaries may charge administrative fees to investors in Class A Shares, Class C Shares, and Class I Shares for administrative services provided on behalf of such investors. These administrative fees are paid by the Class A Shares, Class C Shares, and Class I Shares of the Fund to the Transfer Agent, which uses such fees to reimburse intermediaries. Consistent with the Transfer Agency Agreement between the Transfer Agent and the Fund, the Transfer Agent may negotiate the level, structure, and/or terms of the administrative fees with intermediaries requiring such fees on behalf of the Fund. The Adviser and its affiliates benefit from an increase in assets that may result from such relationships. The Adviser has agreed to limit these fees up to 0.20% for Class A Shares and Class C Shares, and up to 0.15% for Class I Shares on an annual basis based on the daily net assets of each share class. Such limits are subject to change by the Trustees in the future. These amounts are disclosed as “Transfer agent networking and omnibus fees” on the Statement of Operations.
The Transfer Agent is not compensated for its services related to the shares, except for out-of-pocket costs, although the Transfer Agent is compensated for its services related to Fund’s Class D Shares. These amounts are disclosed as “Other transfer agent fees and expenses” on the Statement of Operations.
Under a distribution and shareholder servicing plan (the “Plan”) adopted in accordance with Rule 12b-1 under the 1940 Act, the Fund pays the Trust’s distributor, Janus Henderson Distributors US LLC (the “Distributor”), a wholly-owned subsidiary of the Adviser, a fee for the sale and distribution and/or shareholder servicing of the Shares at an annual rate of up to 0.25% of the Class A Shares’ average daily net assets, of up to 1.00% of the Class C Shares’ average daily net assets, and of up to 0.25% of the Class S Shares’ average daily net assets. Under the terms of the Plan, the Trust is authorized to make payments to the Distributor for remittance to retirement plan service providers, broker-dealers, bank trust departments, financial advisors, and other financial intermediaries, as compensation for distribution and/or shareholder services performed by such entities for their customers who are investors in the Fund. These amounts are disclosed as “12b-1 Distribution and shareholder servicing fees” on the Statement of Operations.
Class A Shares include a 5.75% upfront sales charge of the offering price of the Fund. The sales charge is allocated between the Distributor and financial intermediaries. During the year ended June 30, 2023, the Distributor retained upfront sales charges of $2,031.
A contingent deferred sales charge (“CDSC”) of 1.00% will be deducted with respect to Class A Shares purchased without a sales load and redeemed within 12 months of purchase, unless waived. Any applicable CDSC will be 1.00% of the lesser of the original purchase price or the value of the redemption of the Class A Shares redeemed. There were no CDSCs paid by redeeming shareholders of Class A Shares to the Distributor during the year ended June 30, 2023.
A CDSC of 1.00% will be deducted with respect to Class C Shares redeemed within 12 months of purchase, unless waived. Any applicable CDSC will be 1.00% of the lesser of the original purchase price or the value of the redemption of the Class C Shares redeemed. During the year ended June 30, 2023, redeeming shareholders of Class C Shares paid CDSCs of $74.
The Board of Trustees has adopted a deferred compensation plan (the “Deferred Plan”) for independent Trustees to elect to defer receipt of all or a portion of the annual compensation they are entitled to receive from the Fund. All deferred fees are credited to an account established in the name of the Trustees. The amounts credited to the account then increase or decrease, as the case may be, in accordance with the performance of one or more of the Janus Henderson funds that are selected by the Trustees. The account balance continues to fluctuate in accordance with the performance of the selected fund or funds until final payment of all amounts are credited to the account. The fluctuation of the account balance is recorded by the Fund as unrealized appreciation/(depreciation) and is included as of June 30, 2023 on the Statement of Assets and Liabilities in the asset, “Trustees’ deferred compensation,” and liability, “Trustees’ deferred compensation fees.” Additionally, the recorded unrealized appreciation/(depreciation) is included in “Total distributable earnings (loss)” on the Statement of Assets and Liabilities. Deferred compensation expenses for the year ended June 30, 2023 are included in “Trustees’ fees and expenses” on the Statement of Operations. Trustees are allowed to change their designation of mutual funds from time to time. Amounts will be deferred until distributed in accordance with the Deferred Plan. Deferred fees of $426,025 were paid by the Trust to the Trustees under the Deferred Plan during the year ended June 30, 2023.
Pursuant to the provisions of the 1940 Act and related rules, the Fund may participate in an affiliated or non-affiliated cash sweep program. In the cash sweep program, uninvested cash balances of the Fund may be used to purchase shares of affiliated or non-affiliated money market funds or cash management pooled investment vehicles that operate as money market funds. The Fund is eligible to participate in the cash sweep program (the “Investing Funds”). The
Janus Henderson Global Allocation Fund - Growth
Notes to Financial Statements
Adviser has an inherent conflict of interest because of its fiduciary duties to the affiliated money market funds or cash management pooled investment vehicles and the Investing Funds. Janus Henderson Cash Liquidity Fund LLC (the “Sweep Vehicle”) is an affiliated unregistered cash management pooled investment vehicle that invests primarily in highly-rated short-term fixed-income securities. The Sweep Vehicle operates pursuant to the provisions of the 1940 Act that govern the operation of money market funds and prices its shares at NAV reflecting market-based values of its portfolio securities (i.e., a “floating” NAV) rounded to the fourth decimal place (e.g., $1.0000). The Sweep Vehicle is permitted to impose a liquidity fee (of up to 2%) on redemptions from the Sweep Vehicle or a redemption gate that temporarily suspends redemptions from the Sweep Vehicle for up to 10 business days during a 90 day period. There are no restrictions on the Fund's ability to withdraw investments from the Sweep Vehicle at will, and there are no unfunded capital commitments due from the Fund to the Sweep Vehicle. The Sweep Vehicle does not charge any management fee, sales charge or service fee.
Any purchases and sales, realized gains/losses and recorded dividends from affiliated investments during the year ended June 30, 2023 can be found in the “Schedules of Affiliated Investments” located in the Schedule of Investments.
3. Federal Income Tax
The tax components of capital shown in the table below represent: (1) distribution requirements the Fund must satisfy under the income tax regulations; (2) losses or deductions the Fund may be able to offset against income and gains realized in future years; and (3) unrealized appreciation or depreciation of investments for federal income tax purposes.
Other book to tax differences primarily consist of deferred compensation. The Fund has elected to treat gains and losses on forward foreign currency contracts as capital gains and losses, if applicable. Other foreign currency gains and losses on debt instruments are treated as ordinary income for federal income tax purposes pursuant to Section 988 of the Internal Revenue Code.
| | | | | | | |
| | | | Other Book | Net Tax | |
Undistributed
Ordinary Income | Undistributed
Long-Term Gains | Accumulated
Capital Losses | Loss Deferrals | to Tax
Differences | Appreciation/
(Depreciation) | |
$ 1,127,325 | $ - | $ (4,926,051) | $ - | $ (4,670) | $ 10,872,949 | |
Accumulated capital losses noted below represent net capital loss carryovers, as of June 30, 2023, that may be available to offset future realized capital gains and thereby reduce future taxable gains distributions. The following table shows these capital loss carryovers.
| | | | | | |
| | | | | |
Capital Loss Carryover Schedule | | |
For the year ended June 30, 2023 | | |
| No Expiration | | | |
| Short-Term | Long-Term | Accumulated
Capital Losses | | |
| $(1,895,172) | $(3,030,879) | $ (4,926,051) | | |
The aggregate cost of investments and the composition of unrealized appreciation and depreciation of investment securities for federal income tax purposes as of June 30, 2023 are noted below. The primary difference between book and tax appreciation or depreciation of investments is wash sale loss deferrals.
| | | | |
Federal Tax Cost | Unrealized
Appreciation | Unrealized
(Depreciation) | Net Tax Appreciation/
(Depreciation) |
$ 215,519,590 | $20,034,518 | $ (9,161,569) | $ 10,872,949 |
Income and capital gains distributions are determined in accordance with income tax regulations that may differ from US GAAP. These differences are due to differing treatments for items such as net short-term gains, deferral of wash
Janus Henderson Global Allocation Fund - Growth
Notes to Financial Statements
sale losses, and capital loss carryovers. Certain permanent differences such as tax returns of capital and net investment losses noted below have been reclassified to capital.
| | | | | |
For the year ended June 30, 2023 | |
Distributions | | |
From Ordinary Income | From Long-Term Capital Gains | Tax Return of Capital | Net Investment Loss | |
$ 2,177,263 | $ 7,365,841 | $ - | $ - | |
| | | | | |
For the year ended June 30, 2022 | |
Distributions | | |
From Ordinary Income | From Long-Term Capital Gains | Tax Return of Capital | Net Investment Loss | |
$ 11,095,072 | $ 28,354,624 | $ - | $ - | |
Permanent book to tax basis differences may result in reclassifications between the components of net assets. These differences have no impact on the results of operations or net assets.
4. Capital Share Transactions
| | | | | | | |
| | | | | | |
| | Year ended June 30, 2023 | | Year ended June 30, 2022 |
| | Shares | Amount | | Shares | Amount |
| | | | | | | |
Class A Shares: | | | | | |
Shares sold | 115,901 | $ 1,364,485 | | 89,960 | $ 1,358,917 |
Reinvested dividends and distributions | 19,817 | 223,339 | | 62,381 | 892,045 |
Shares repurchased | (82,085) | (964,518) | | (69,241) | (990,954) |
Net Increase/(Decrease) | 53,633 | $ 623,306 | | 83,100 | $ 1,260,008 |
Class C Shares: | | | | | |
Shares sold | 18,242 | $ 206,928 | | 50,290 | $ 752,340 |
Reinvested dividends and distributions | 7,846 | 86,622 | | 40,471 | 566,187 |
Shares repurchased | (95,507) | (1,062,357) | | (74,702) | (1,090,498) |
Net Increase/(Decrease) | (69,419) | $ (768,807) | | 16,059 | $ 228,029 |
Class D Shares: | | | | | |
Shares sold | 502,381 | $ 5,966,714 | | 717,556 | $10,183,352 |
Reinvested dividends and distributions | 697,247 | 7,941,664 | | 2,264,733 | 32,702,741 |
Shares repurchased | (1,264,469) | (14,976,657) | | (1,428,267) | (20,820,173) |
Net Increase/(Decrease) | (64,841) | $(1,068,279) | | 1,554,022 | $22,065,920 |
Class I Shares: | | | | | |
Shares sold | 484,618 | $ 5,591,527 | | 281,698 | $ 4,311,736 |
Reinvested dividends and distributions | 51,778 | 588,717 | | 161,707 | 2,333,434 |
Shares repurchased | (395,189) | (4,698,425) | | (356,172) | (5,014,312) |
Net Increase/(Decrease) | 141,207 | $ 1,481,819 | | 87,233 | $ 1,630,858 |
Class S Shares: | | | | | |
Shares sold | 15,078 | $ 179,544 | | 17,126 | $ 272,937 |
Reinvested dividends and distributions | 4,862 | 54,407 | | 16,190 | 230,063 |
Shares repurchased | (33,387) | (388,910) | | (20,047) | (285,778) |
Net Increase/(Decrease) | (13,447) | $ (154,959) | | 13,269 | $ 217,222 |
Class T Shares: | | | | | |
Shares sold | 243,469 | $ 2,847,082 | | 413,560 | $ 6,024,828 |
Reinvested dividends and distributions | 47,633 | 541,587 | | 161,423 | 2,327,722 |
Shares repurchased | (411,256) | (4,829,594) | | (408,778) | (5,895,226) |
Net Increase/(Decrease) | (120,154) | $(1,440,925) | | 166,205 | $ 2,457,324 |
Janus Henderson Global Allocation Fund - Growth
Notes to Financial Statements
5. Purchases and Sales of Investment Securities
For the year ended June 30, 2023, the aggregate cost of purchases and proceeds from sales of investment securities (excluding any short-term securities, short-term options contracts, TBAs, and in-kind transactions, as applicable) was as follows:
| | | | |
Purchases of
Securities | Proceeds from Sales
of Securities | Purchases of Long-
Term U.S. Government
Obligations | Proceeds from Sales
of Long-Term U.S.
Government Obligations |
$ 77,726,360 | $ 82,940,290 | $ - | $ - |
6. Subsequent Event
Management has evaluated whether any events or transactions occurred subsequent to June 30, 2023 and through the date of issuance of the Fund’s financial statements and determined that there were no material events or transactions that would require recognition or disclosure in the Fund’s financial statements.
Janus Henderson Global Allocation Fund - Growth
Report of Independent Registered Public Accounting Firm
To the Board of Trustees of Janus Investment Fund and Shareholders of Janus Henderson Global Allocation Fund - Growth
Opinion on the Financial Statements
We have audited the accompanying statement of assets and liabilities, including the schedule of investments, of Janus Henderson Global Allocation Fund - Growth (one of the funds constituting Janus Investment Fund, referred to hereafter as the “Fund”) as of June 30, 2023, the related statement of operations for the year ended June 30, 2023, the statements of changes in net assets for each of the two years in the period ended June 30, 2023, including the related notes, and the financial highlights for each of the five years in the period ended June 30, 2023 (collectively referred to as the “financial statements”). In our opinion, the financial statements present fairly, in all material respects, the financial position of the Fund as of June 30, 2023, the results of its operations for the year then ended, the changes in its net assets for each of the two years in the period ended June 30, 2023 and the financial highlights for each of the five years in the period ended June 30, 2023 in conformity with accounting principles generally accepted in the United States of America
Basis for Opinion
These financial statements are the responsibility of the Fund’s management. Our responsibility is to express an opinion on the Fund’s financial statements based on our audits. We are a public accounting firm registered with the Public Company Accounting Oversight Board (United States) (PCAOB) and are required to be independent with respect to the Fund in accordance with the U.S. federal securities laws and the applicable rules and regulations of the Securities and Exchange Commission and the PCAOB.
We conducted our audits of these financial statements in accordance with the standards of the PCAOB. Those standards require that we plan and perform the audit to obtain reasonable assurance about whether the financial statements are free of material misstatement, whether due to error or fraud.
Our audits included performing procedures to assess the risks of material misstatement of the financial statements, whether due to error or fraud, and performing procedures that respond to those risks. Such procedures included examining, on a test basis, evidence regarding the amounts and disclosures in the financial statements. Our audits also included evaluating the accounting principles used and significant estimates made by management, as well as evaluating the overall presentation of the financial statements. Our procedures included confirmation of securities owned as of June 30, 2023 by correspondence with the custodian, transfer agent and brokers; when replies were not received from brokers, we performed other auditing procedures. We believe that our audits provide a reasonable basis for our opinion.

Denver, Colorado
August 21, 2023
We have served as the auditor of one or more investment companies in Janus Henderson Funds since 1990.
Janus Henderson Global Allocation Fund - Growth
Additional Information (unaudited)
Proxy Voting Policies and Voting Record
A description of the policies and procedures that the Fund uses to determine how to vote proxies relating to its portfolio securities is available without charge: (i) upon request, by calling 1-800-525-1093; (ii) on the Fund’s website at janushenderson.com/proxyvoting; and (iii) on the SEC’s website at http://www.sec.gov. Additionally, information regarding the Fund’s proxy voting record for the most recent twelve-month period ended June 30 is also available, free of charge, through janushenderson.com/proxyvoting and from the SEC’s website at http://www.sec.gov.
Full Holdings
The Fund files its complete portfolio holdings (schedule of investments) with the SEC as an exhibit to Form N-PORT within 60 days of the end of the first and third fiscal quarters, and in the annual report and semiannual report to shareholders. The Fund’s Form N-PORT filings and annual and semiannual reports: (i) are available on the SEC’s website at http://www.sec.gov; and (ii) are available without charge, upon request, by calling a Janus Henderson representative at 1-877-335-2687 (toll free) (or 1-800-525-3713 if you hold Class D shares). Portfolio holdings consisting of at least the names of the holdings are generally available on a monthly basis with a 30-day lag under Full Holdings for the Fund at janushenderson.com/info (or janushenderson.com/reports if you hold Class D Shares).
APPROVAL OF ADVISORY AGREEMENTS DURING THE PERIOD
The Trustees of Janus Aspen Series, each of whom serves as an “independent” Trustee (the “Trustees”), oversee the management of each portfolio of Janus Aspen Series (each, a “VIT Portfolio,” and collectively, the “VIT Portfolios”), as well as each fund of Janus Investment Fund (each, a “Fund,” and collectively, the “Funds” and together with the VIT Portfolios, the “Janus Henderson Funds,” and each, a “Janus Henderson Fund”). As required by law, the Trustees determine annually whether to continue the investment advisory agreement for each Janus Henderson Fund.
In connection with their most recent consideration of those agreements for each Janus Henderson Fund, the Trustees received and reviewed information provided by Janus Henderson Investors US LLC (the “Adviser”) in response to requests of the Trustees and their independent legal counsel. They also received and reviewed information and analysis provided by, and in response to requests of, their independent fee consultant. Throughout their consideration of the agreements, the Trustees were advised by their independent legal counsel. The Trustees met with management to consider the agreements, and also met separately in executive session with their independent legal counsel and their independent fee consultant.
At meetings held on November 9-10, 2022 and December 13-14, 2022, the Trustees evaluated the information provided by the Adviser and the independent fee consultant, as well as other information provided by the Adviser and the independent fee consultant during the year. Following such evaluation, the Trustees determined that the overall arrangements between each Janus Henderson Fund and the Adviser were fair and reasonable in light of the nature, extent, and quality of the services provided by the Adviser and its affiliates, the fees charged for those services, and other matters that the Trustees considered relevant in the exercise of their business judgment, and unanimously approved the continuation of the investment advisory agreement for each Janus Henderson Fund for the period from February 1, 2023 through February 1, 2024, subject to earlier termination as provided for in each agreement.
In considering the continuation of those agreements, the Trustees reviewed and analyzed various factors that they determined were relevant, including the factors described below, none of which by itself was considered dispositive. However, the material factors and conclusions that formed the basis for the Trustees’ determination to approve the continuation of the agreements are discussed separately below. Also included is a summary of the independent fee consultant’s conclusions and opinions that arose during, and were included as part of, the Trustees’ consideration of the agreements. “Management fees,” as used herein, reflect actual annual advisory fees and, for the purpose of peer comparisons any administration fees (excluding out of pocket costs), net of any waivers, paid by a fund as a percentage of average net assets.
Nature, Extent and Quality of Services
The Trustees reviewed the nature, extent, and quality of the services provided by the Adviser to the Janus Henderson Funds, taking into account the investment objective, strategies, and policies of each Janus Henderson Fund, and the knowledge the Trustees gained from their regular meetings with management on at least a quarterly basis and their ongoing review of information related to the Janus Henderson Funds. In addition, the Trustees reviewed the resources and key personnel of the Adviser, particularly noting those employees who provide investment and risk management services to the Janus Henderson Funds. The Trustees also considered other services provided to the Janus Henderson
Janus Henderson Global Allocation Fund - Growth
Additional Information (unaudited)
Funds by the Adviser, such as managing the execution of portfolio transactions and the selection of broker-dealers for those transactions. The Trustees considered the Adviser’s role as administrator to the Janus Henderson Funds, noting that the Adviser generally does not receive a fee for its services as administrator, but is reimbursed for its out-of-pocket costs. The Trustees considered the role of the Adviser in monitoring adherence to the Janus Henderson Funds’ investment restrictions, providing support services for the Trustees and Trustee committees, and overseeing communications with Janus Henderson Fund shareholders and the activities of other service providers, including monitoring compliance with various policies and procedures of the Janus Henderson Funds and with applicable securities laws and regulations.
In this regard, the independent fee consultant noted that the Adviser provides a number of different services for the Janus Henderson Funds and their shareholders, ranging from investment management services to various other servicing functions, and that, in its view, the Adviser is a capable provider of those services. The independent fee consultant also provided its belief that the Adviser has developed a number of institutional competitive advantages that should enable it to provide superior investment and service performance over the long term.
The Trustees concluded that the nature, extent, and quality of the services provided by the Adviser to each Janus Henderson Fund were appropriate and consistent with the terms of the respective advisory agreements, and that, taking into account steps taken to address those Janus Henderson Funds whose performance lagged that of their peers for certain periods, the Janus Henderson Funds were likely to benefit from the continued provision of those services. They also concluded that the Adviser had sufficient personnel, with the appropriate education and experience, to serve the Janus Henderson Funds effectively and had demonstrated its ability to attract well-qualified personnel.
Performance of the Funds
The Trustees considered the performance results of each Janus Henderson Fund over various time periods. They noted that they considered Janus Henderson Fund performance data throughout the year, including periodic meetings with each Janus Henderson Fund’s portfolio manager(s), and also reviewed information comparing each Janus Henderson Fund’s performance with the performance of comparable fund peer groups identified by Broadridge Financial Solutions, Inc. (“Broadridge”), an independent data provider, and with the Janus Henderson Fund’s benchmark index. In this regard, the independent fee consultant found that the overall Janus Henderson Funds’ performance has been reasonable, noting that: (i) for the 36 months ended May 31, 2022, approximately 38% of the Janus Henderson Funds were in the top two quartiles of their Broadridge peer groups; (ii) for the 36 months ended September 30, 2022, approximately 45% of the Janus Henderson Funds were in the top two quartiles of performance as reported by Morningstar, and (iii) for the 12 months ended September 30, 2022, approximately 55% of the Janus Henderson Funds were in the top two quartiles of performance as reported by Morningstar.
The Trustees considered the performance of each Janus Henderson Fund, noting that performance may vary by share class, and noted the following with respect to the Funds:
Asset Allocation Funds
· For Janus Henderson Global Allocation Fund – Conservative, the Trustees noted that the Fund’s performance was in the third Broadridge quartile for the 36 months ended May 31, 2022 and the bottom Broadridge quartile for the 12 months ended May 31, 2022. The Trustees noted the reasons for the Fund’s underperformance and the steps the Adviser had taken or was taking to improve performance.
· For Janus Henderson Global Allocation Fund – Growth, the Trustees noted that the Fund’s performance was in the bottom Broadridge quartile for the 36 months ended May 31, 2022 and the bottom Broadridge quartile for the 12 months ended May 31, 2022. The Trustees noted the reasons for the Fund’s underperformance and the steps the Adviser had taken or was taking to improve performance.
· For Janus Henderson Global Allocation Fund – Moderate, the Trustees noted that the Fund’s performance was in the bottom Broadridge quartile for the 36 months ended May 31, 2022 and the bottom Broadridge quartile for the 12 months ended May 31, 2022. The Trustees noted the reasons for the Fund’s underperformance and the steps the Adviser had taken or was taking to improve performance.
Fixed-Income Funds
· For Janus Henderson Absolute Return Income Opportunities Fund, the Trustees noted that the Fund’s performance was in the third Broadridge quartile for the 36 months ended May 31, 2022 and the first Broadridge
Janus Henderson Global Allocation Fund - Growth
Additional Information (unaudited)
quartile for the 12 months ended May 31, 2022. The Trustees noted the reasons for the Fund’s underperformance, the steps the Adviser had taken or was taking to improve performance, and that the performance trend was improving.
· For Janus Developed World Bond Fund, the Trustees noted that the Fund’s performance was in the bottom Broadridge quartile for the 36 months ended May 31, 2022 and the bottom Broadridge quartile for the 12 months ended May 31, 2022. The Trustees noted the reasons for the Fund’s underperformance and the steps the Adviser had taken or was taking to improve performance.
· For Janus Henderson Flexible Bond Fund, the Trustees noted that the Fund’s performance was in the first Broadridge quartile for the 36 months ended May 31, 2022 and the second Broadridge quartile for the 12 months ended May 31, 2022.
· For Janus Henderson Global Bond Fund, the Trustees noted that the Fund’s performance was in the third Broadridge quartile for the 36 months ended May 31, 2022 and the bottom Broadridge quartile for the 12 months ended May 31, 2022. The Trustees noted the reasons for the Fund’s underperformance and the steps the Adviser had taken or was taking to improve performance.
· For Janus Henderson High-Yield Fund, the Trustees noted that the Fund’s performance was in the third Broadridge quartile for the 36 months ended May 31, 2022 and the bottom Broadridge quartile for the 12 months ended May 31, 2022. The Trustees noted the reasons for the Fund’s underperformance and the steps the Adviser had taken or was taking to improve performance.
· For Janus Henderson Multi-Sector Income Fund, the Trustees noted that the Fund’s performance was in the second Broadridge quartile for the 36 months ended May 31, 2022 and the third Broadridge quartile for the 12 months ended May 31, 2022.
· For Janus Henderson Short Duration Flexible Bond Fund, the Trustees noted that the Fund’s performance was in the third Broadridge quartile for the 36 months ended May 31, 2022 and the bottom Broadridge quartile for the 12 months ended May 31, 2022. The Trustees noted the reasons for the Fund’s underperformance and the steps the Adviser had taken or was taking to improve performance.
Global and International Equity Funds
· For Janus Henderson Asia Equity Fund, the Trustees noted that the Fund’s performance was in the third Broadridge quartile for the 36 months ended May 31, 2022 and the third Broadridge quartile for the 12 months ended May 31, 2022. The Trustees noted the reasons for the Fund’s underperformance, while also noting that the Fund has a performance fee structure that results in lower management fees during periods of underperformance, and the steps the Adviser had taken or was taking to improve performance.
· For Janus Henderson Emerging Markets Fund, the Trustees noted that the Fund’s performance was in the third Broadridge quartile for the 36 months ended May 31, 2022 and the third Broadridge quartile for the 12 months ended May 31, 2022. The Trustees noted the reasons for the Fund’s underperformance and the steps the Adviser had taken or was taking to improve performance.
· For Janus Henderson European Focus Fund, the Trustees noted that the Fund’s performance was in the first Broadridge quartile for the 36 months ended May 31, 2022 and the second Broadridge quartile for the 12 months ended May 31, 2022.
· For Janus Henderson Global Equity Income Fund, the Trustees noted that the Fund’s performance was in the third Broadridge quartile for the 36 months ended May 31, 2022 and the first Broadridge quartile for the 12 months ended May 31, 2022. The Trustees noted the reasons for the Fund’s underperformance, the steps the Adviser had taken or was taking to improve performance, and that the performance trend was improving.
· For Janus Henderson Global Life Sciences Fund, the Trustees noted that the Fund’s performance was in the third Broadridge quartile for the 36 months ended May 31, 2022 and the second Broadridge quartile for the 12 months ended May 31, 2022. The Trustees noted the reasons for the Fund’s underperformance, the steps the Adviser had taken or was taking to improve performance, and that the performance trend was improving.
Janus Henderson Global Allocation Fund - Growth
Additional Information (unaudited)
· For Janus Henderson Global Sustainable Equity Fund, the Trustees noted that the Fund’s performance was in the second Broadridge quartile for the 12 months ended May 31, 2022. The Trustees noted that 36 month-end performance was not yet available.
· For Janus Henderson Global Real Estate Fund, the Trustees noted that the Fund’s performance was in the second Broadridge quartile for the 36 months ended May 31, 2022 and the bottom Broadridge quartile for the 12 months ended May 31, 2022.
· For Janus Henderson Global Research Fund, the Trustees noted that the Fund’s performance was in the second Broadridge quartile for the 36 months ended May 31, 2022 and the first Broadridge quartile for the 12 months ended May 31, 2022.
· For Janus Henderson Global Select Fund, the Trustees noted that the Fund’s performance was in the first Broadridge quartile for the 36 months ended May 31, 2022 and the first Broadridge quartile for the 12 months ended May 31, 2022.
· For Janus Henderson Global Technology and Innovation Fund, the Trustees noted that the Fund’s performance was in the second Broadridge quartile for the 36 months ended May 31, 2022 and the second Broadridge quartile for the 12 months ended May 31, 2022.
· For Janus Henderson International Opportunities Fund, the Trustees noted that the Fund’s performance was in the bottom Broadridge quartile for the 36 months ended May 31, 2022 and the third Broadridge quartile for the 12 months ended May 31, 2022. The Trustees noted the reasons for the Fund’s underperformance and the steps the Adviser had taken or was taking to improve performance.
· For Janus Henderson Overseas Fund, the Trustees noted that the Fund’s performance was in the first Broadridge quartile for the 36 months ended May 31, 2022 and the first Broadridge quartile for the 12 months ended May 31, 2022.
· For Janus Henderson Responsible International Dividend Fund (formerly the Janus Henderson Dividend & Income Builder Fund), the Trustees noted that the Fund’s performance was in the bottom Broadridge quartile for the 36 months ended May 31, 2022 and the bottom Broadridge quartile for the 12 months ended May 31, 2022. The Trustees noted the reasons for the Fund’s underperformance and the steps the Adviser had taken or was taking to improve performance.
Money Market Funds
· For Janus Henderson Government Money Market Fund, the Trustees noted that the Fund’s performance was in the third Broadridge quartile for the 36 months ended May 31, 2022 and the bottom Broadridge quartile for the 12 months ended May 31, 2022. The Trustees noted the reasons for the Fund’s underperformance and the steps the Adviser had taken or was taking to improve performance.
· For Janus Henderson Money Market Fund, the Trustees noted that the Fund’s performance was in the third Broadridge quartile for the 36 months ended May 31, 2022 and the bottom Broadridge quartile for the 12 months ended May 31, 2022. The Trustees noted the reasons for the Fund’s underperformance and the steps the Adviser had taken or was taking to improve performance.
Multi-Asset Funds
· For Janus Henderson Adaptive Global Allocation Fund, the Trustees noted that the Fund’s performance was in bottom Broadridge quartile for the 36 months ended May 31, 2022 and the second Broadridge quartile for the 12 months ended May 31, 2022. The Trustees noted the reasons for the Fund’s underperformance, the steps the Adviser had taken or was taking to improve performance, and that the performance trend was improving.
· For Janus Henderson Balanced Fund, the Trustees noted that the Fund’s performance was in the first Broadridge quartile for the 36 months ended May 31, 2022 and the first Broadridge quartile for the 12 months ended May 31, 2022.
Janus Henderson Global Allocation Fund - Growth
Additional Information (unaudited)
U.S. Equity Funds
· For Janus Henderson Adaptive Risk Managed U.S. Equity Fund, the Trustees noted that the Fund’s performance was in the bottom Broadridge quartile for the 36 months ended May 31, 2022 and the second Broadridge quartile for the 12 months ended May 31, 2022. The Trustees noted the reasons for the Fund’s underperformance, the steps the Adviser had taken or were taking to improve performance, and that the performance trend was improving.
· For Janus Henderson Contrarian Fund, the Trustees noted that the Fund’s performance was in the first Broadridge quartile for the 36 months ended May 31, 2022 and the bottom Broadridge quartile for the 12 months ended May 31, 2022.
· For Janus Henderson Enterprise Fund, the Trustees noted that the Fund’s performance was in the second Broadridge quartile for the 36 months ended May 31, 2022 and the first Broadridge quartile for the 12 months ended May 31, 2022.
· For Janus Henderson Forty Fund, the Trustees noted that the Fund’s performance was in the third Broadridge quartile for the 36 months ended May 31, 2022 and the bottom Broadridge quartile for the 12 months ended May 31, 2022. The Trustees noted the reasons for the Fund’s underperformance and the steps the Adviser had taken or was taking to improve performance.
· For Janus Henderson Growth and Income Fund, the Trustees noted that the Fund’s performance was in the bottom Broadridge quartile for the 36 months ended May 31, 2022 and the first Broadridge quartile for the 12 months ended May 31, 2022. The Trustees noted the reasons for the Fund’s underperformance, the steps the Adviser had taken or was taking to improve performance, and that the performance trend was improving.
· For Janus Henderson Mid Cap Value Fund, the Trustees noted that the Fund’s performance was in the bottom Broadridge quartile for the 36 months ended May 31, 2022 and the second Broadridge quartile for the 12 months ended May 31, 2022. The Trustees noted the reasons for the Fund’s underperformance, while also noting that the Fund has a performance fee structure that results in lower management fees during periods of underperformance, the steps the Adviser had taken or was taking to improve performance, and that the performance trend was improving.
· For Janus Henderson Research Fund, the Trustees noted that the Fund’s performance was in the third Broadridge quartile for the 36 months ended May 31, 2022 and the third Broadridge quartile for the 12 months ended May 31, 2022. The Trustees noted the reasons for the Fund’s underperformance, while also noting that the Fund has a performance fee structure that results in lower management fees during periods of underperformance and the steps the Adviser had taken or was taking to improve performance.
· For Janus Henderson Small Cap Value Fund, the Trustees noted that the Fund’s performance was in the bottom Broadridge quartile for the 36 months ended May 31, 2022 and the second Broadridge quartile for the 12 months ended May 31, 2022. The Trustees noted the reasons for the Fund’s underperformance, while also noting that the Fund has a performance fee structure that results in lower management fees during periods of underperformance, the steps the Adviser had taken or was taking to improve performance, and that the performance trend was improving.
· For Janus Henderson Small-Mid Cap Value Fund, the Trustees noted that the Fund’s performance was in the bottom Broadridge quartile for the 36 months ended May 31, 2022 and the second Broadridge quartile for the 12 months ended May 31, 2022. The Trustees noted the reasons for the Fund’s underperformance, while also noting that the Fund has a performance fee structure that results in lower management fees during periods of underperformance, the steps the Adviser had taken or was taking to improve performance, and that the performance trend is improving.
· For Janus Henderson Triton Fund, the Trustees noted that the Fund’s performance was in the bottom Broadridge quartile for the 36 months ended May 31, 2022 and the second Broadridge quartile for the 12 months ended May 31, 2022. The Trustees noted the reasons for the Fund’s underperformance, the steps the Adviser had taken or was taking to improve performance, and that the performance trend was improving.
· For Janus Henderson Venture Fund, the Trustees noted that the Fund’s performance was in the bottom Broadridge quartile for the 36 months ended May 31, 2022 and the second Broadridge quartile for the 12 months ended May
Janus Henderson Global Allocation Fund - Growth
Additional Information (unaudited)
31, 2022. The Trustees noted the reasons for the Fund’s underperformance, the steps the Adviser had taken or was taking to improve performance, and that the performance trend was improving.
In consideration of each Janus Henderson Fund’s performance, the Trustees concluded that, taking into account the factors relevant to performance, as well as other considerations, including steps taken to improve performance, as applicable, the Janus Henderson Fund’s performance warranted continuation of such Janus Henderson Fund’s investment advisory agreement.
Costs of Services Provided
The Trustees examined information regarding the fees and expenses of each Janus Henderson Fund in comparison to similar information for other comparable funds as provided by Broadridge, an independent data provider. They also reviewed an analysis of that information provided by their independent fee consultant. The independent fee consultant provided its belief that the management fees charged by the Adviser to each of the Janus Henderson Funds under the current investment advisory and administration agreements are reasonable in relation to the services provided by the Adviser. The independent fee consultant found: (1) the total expenses and management fees of the Janus Henderson Funds to be reasonable relative to other comparable mutual funds; (2) the total expenses, on average, were 6% under the average total expenses of the respective Broadridge peer group; and (3) the management fees for the Janus Henderson Funds, on average, were 5% under the average management fees for the respective Broadridge peer group. The Trustees also considered the total expenses for each share class of each Janus Henderson Fund compared to the average total expenses for its Broadridge Expense Group and to average total expenses for its Broadridge Expense Universe.
For Janus Henderson Funds with three or more years of performance history, the independent fee consultant also performed a systematic “focus list” analysis of expenses which assessed fund fees in the context of fund performance being delivered. Based on this analysis, the independent fee consultant found that the combination of service quality/performance and expenses on these individual Janus Henderson Funds was reasonable in light of performance trends, performance histories, changes in portfolio management, relative average net asset levels, and the existence of performance fees, breakpoints, and/or expense waivers on such Janus Henderson Funds.
The Trustees considered the methodology used by the Adviser in determining compensation payable to portfolio managers, the competitive environment for investment management talent, and the competitive market for mutual funds in different distribution channels.
The Trustees also reviewed management fees charged by the Adviser to comparable separate account clients and to comparable non-affiliated funds subadvised by the Adviser (for which the Adviser provides only or primarily portfolio management services). Although in most instances subadvisory and separate account fee rates for various investment strategies were lower than management fee rates for Janus Henderson Funds having a similar strategy, the Trustees considered that the Adviser noted that, under the terms of the management agreements with the Janus Henderson Funds, the Adviser performs significant additional services for the Janus Henderson Funds that it does not provide to those other clients, including administration services, oversight of the Janus Henderson Funds’ other service providers, Trustee support, regulatory compliance and numerous other services, and that, in serving the Janus Henderson Funds, the Adviser assumes many legal risks and other costs that it does not assume in servicing its other clients. Moreover, the Trustees noted that the independent fee consultant found that: (1) the management fees the Adviser charges to the Janus Henderson Funds are reasonable in relation to the management fees the Adviser charges to funds subadvised by the Adviser and to the fees the Adviser charges to its institutional separate account clients; (2) these subadvised and institutional separate accounts have different service and infrastructure needs and operate in markets very different from the retail fund market; (3) Janus Henderson mutual fund investors enjoy reasonable fees relative to the fees charged in these other markets; and (4) as part of its 2022 review, 9 of 11 Janus Henderson Funds have lower management fees than similar funds subadvised by the Adviser. The Trustees noted that for the two Janus Henderson Funds that did not, management fees for each were under the average of its 15(c) peer group.
The Trustees considered the fees for each Janus Henderson Fund for its fiscal year ended in 2021 and noted the following with regard to each Janus Henderson Fund’s total expenses, net of applicable fee waivers (the Fund’s “total expenses”) as reflected in the comparative information provided by Broadridge:
Janus Henderson Global Allocation Fund - Growth
Additional Information (unaudited)
Asset Allocation Funds
· For Janus Henderson Global Allocation Fund – Conservative, the Trustees noted that, although the Fund’s total expenses exceeded the peer group average for certain share classes, overall the Fund’s total expenses were reasonable. The Trustees also noted that the Adviser has contractually agreed to limit the Fund’s expenses.
· For Janus Henderson Global Allocation Fund – Growth, the Trustees noted that, although the Fund’s total expenses exceeded the peer group average for certain share classes, overall the Fund’s total expenses were reasonable. The Trustees also noted that the Adviser has contractually agreed to limit the Fund’s expenses, although this limit did not apply because the Fund’s total expenses as shown were below the applicable fee limit.
· For Janus Henderson Global Allocation Fund – Moderate, the Trustees noted that, although the Fund’s total expenses exceeded the peer group average for one share class, overall the Fund’s total expenses were reasonable. The Trustees also noted that the Adviser has contractually agreed to limit the Fund’s expenses.
Fixed-Income Funds
· For Janus Henderson Absolute Return Income Opportunities Fund, the Trustees noted that, although the Fund’s total expenses exceeded the peer group average for certain share classes, overall the Fund’s total expenses were reasonable. The Trustees also noted that the Adviser has contractually agreed to limit the Fund’s expenses.
· For Janus Henderson Developed World Bond Fund, the Trustees noted that, although the Fund’s total expenses exceeded the peer group average for one share class, overall the Fund’s total expenses were reasonable. The Trustees also noted that the Adviser has contractually agreed to limit the Fund’s expenses.
· For Janus Henderson Flexible Bond Fund, the Trustees noted that, although the Fund’s total expenses exceeded the peer group average for certain share classes, overall the Fund’s total expenses were reasonable. The Trustees also noted that the Adviser has contractually agreed to limit the Fund’s expenses, although this limit did not apply because the Fund’s total expenses as shown were below the applicable fee limit.
· For Janus Henderson Global Bond Fund, the Trustees noted that, although the Fund’s total expenses exceeded the peer group average for certain share classes, overall the Fund’s total expenses were reasonable. The Trustees also noted that the Adviser has contractually agreed to limit the Fund’s expenses.
· For Janus Henderson High-Yield Fund, the Trustees noted that, although the Fund’s total expenses exceeded the peer group average for certain share classes, overall the Fund’s total expenses were reasonable. The Trustees also noted that the Adviser has contractually agreed to limit the Fund’s expenses.
· For Janus Henderson Multi-Sector Income Fund, the Trustees noted that, although the Fund’s total expenses exceeded the peer group average for certain share classes, overall the Fund’s total expenses were reasonable. The Trustees also noted that the Adviser has contractually agreed to limit the Fund’s expenses.
· For Janus Henderson Short Duration Flexible Bond Fund, the Trustees noted that, although the Fund’s total expenses exceeded the peer group average for certain share classes, overall the Fund’s total expenses were reasonable. The Trustees also noted that the Adviser has contractually agreed to limit the Fund’s expenses.
Global and International Equity Funds
· For Janus Henderson Asia Equity Fund, the Trustees noted that, although the Fund’s total expenses exceeded the peer group average for certain share classes, overall the Fund’s total expenses were reasonable. The Trustees also noted that the Adviser has contractually agreed to limit the Fund’s expenses.
· For Janus Henderson Emerging Markets Fund, the Trustees noted that, although the Fund’s total expenses exceeded the peer group average for certain share classes, overall the Fund’s total expenses were reasonable. The Trustees also noted that the Adviser has contractually agreed to limit the Fund’s expenses.
· For Janus Henderson European Focus Fund, the Trustees noted that, although the Fund’s total expenses exceeded the peer group average for one share class, overall the Fund’s expenses were reasonable. The Trustees also noted that the Adviser has contractually agreed to limit the Fund’s expenses.
· For Janus Henderson Global Equity Income Fund, the Trustees noted that, although the Fund’s total expenses exceeded the peer group average for one share class, overall the Fund’s total expenses were reasonable. The
Janus Henderson Global Allocation Fund - Growth
Additional Information (unaudited)
Trustees also noted that the Adviser has contractually agreed to limit the Fund’s expenses, although this limit did not apply because the Fund’s total expenses as shown were below the applicable fee limit.
· For Janus Henderson Global Life Sciences Fund, the Trustees noted that the Fund’s total expenses were below the peer group average for all share classes.
· For Janus Henderson Global Real Estate Fund, the Trustees noted that, although the Fund’s total expenses exceeded the peer group average for certain share classes, overall the Fund’s total expenses were reasonable. The Trustees also noted that the Adviser has contractually agreed to limit the Fund’s expenses, although this limit did not apply because the Fund’s total expenses as shown were below the applicable fee limit.
· For Janus Henderson Global Research Fund, the Trustees noted that, although the Fund’s total expenses exceeded the peer group average for one share class, overall the Fund’s total expenses were reasonable. The Trustees also noted that the Adviser has contractually agreed to limit the Fund’s expenses, although this limit did not apply because the Fund’s total expenses as shown were below the applicable fee limit.
· For Janus Henderson Global Select Fund, the Trustees noted that, although the Fund’s total expenses exceeded the peer group average for certain share classes, overall the Fund’s total expenses were reasonable. The Trustees also noted that the Adviser has contractually agreed to limit the Fund’s expenses.
· For Janus Henderson Global Sustainable Equity Fund, the Trustees noted that, although the Fund’s total expenses exceeded the peer group average for certain share classes, overall the Fund’s expenses were reasonable. The Trustees also noted that the Adviser has contractually agreed to limit the Fund’s expenses.
· For Janus Henderson Global Technology and Innovation Fund, the Trustees noted that the Fund’s total expenses were below the peer group average for all share classes.
· For Janus Henderson International Opportunities Fund, the Trustees noted that, although the Fund’s total expenses exceeded the peer group average for certain share classes, overall the Fund’s expenses were reasonable. The Trustees also noted that the Adviser has contractually agreed to limit the Fund’s expenses.
· For Janus Henderson Overseas Fund, the Trustees noted that although the Fund’s total expenses exceeded the peer group average for certain share classes, overall the Fund’s total expenses were reasonable. The Trustees also noted that the Adviser has contractually agreed to limit the Fund’s expenses, although this limit did not apply because the Fund’s total expenses as shown were below the applicable fee limit.
· For Janus Henderson Responsible International Dividend Fund (formerly the Janus Henderson Dividend & Income Builder Fund), the Trustees noted that, although the Fund’s total expenses exceeded the peer group for one share class, overall the Fund’s total expenses were reasonable. The Trustees also noted that the Adviser has contractually agreed to limit the Fund’s expenses.
Money Market Funds
· For Janus Henderson Government Money Market Fund, the Trustees noted that the Fund’s total expenses were below the peer group average for all share classes.
· For Janus Henderson Money Market Fund, the Trustees noted that the Fund’s total expenses were below the peer group average for all share classes.
Multi-Asset Funds
· For Janus Henderson Adaptive Global Allocation Fund, the Trustees noted that the Fund’s total expenses were below the peer group average for all share classes.
· For Janus Henderson Balanced Fund, the Trustees noted that, although the Fund’s total expenses exceeded the peer group average for certain share classes, overall the Fund’s total expenses were reasonable. The Trustees also noted that the Adviser has contractually agreed to limit the Fund’s expenses, although this limit did not apply because the Fund’s total expenses as shown were below the applicable fee limit.
Janus Henderson Global Allocation Fund - Growth
Additional Information (unaudited)
U.S. Equity Funds
· For Janus Henderson Adaptive Risk Managed U.S. Equity Fund, the Trustees noted that, although the Fund’s total expenses exceeded the peer group average for certain share classes, overall the Fund’s total expenses were reasonable. The Trustees also noted that the Adviser has contractually agreed to limit the Fund’s expenses, although this limit did not apply because the Fund’s total expenses as shown were below the applicable fee limit.
· For Janus Henderson Contrarian Fund, the Trustees noted that, although the Fund’s total expenses exceeded the peer group average for all share classes, overall the Fund’s total expenses were reasonable. The Trustees also noted that the Adviser had contractually agreed to limit the Fund’s expenses.
· For Janus Henderson Enterprise Fund, the Trustees noted that, although the Fund’s total expenses exceeded the peer group average for certain share classes, overall the Fund’s total expenses were reasonable. The Trustees also noted that the Adviser has contractually agreed to limit the Fund’s expenses, although this limit did not apply because the Fund’s total expenses as shown were below the applicable fee limit.
· For Janus Henderson Forty Fund, the Trustees noted that, although the Fund’s total expenses exceeded the peer group average for certain share classes, overall the Fund’s total expenses were reasonable. The Trustees also noted that the Adviser has contractually agreed to limit the Fund’s expenses, although this limit did not apply because the Fund’s total expenses as shown were below the applicable fee limit.
· For Janus Henderson Growth and Income Fund, the Trustees noted that, although the Fund’s total expenses exceeded the peer group average for certain share classes, overall the Fund’s total expenses were reasonable. The Trustees also noted that the Adviser has contractually agreed to limit the Fund’s expenses, although this limit did not apply because the Fund’s total expenses as shown were below the applicable fee limit.
· For Janus Henderson Mid Cap Value Fund, the Trustees noted that the Fund’s total expenses were below the peer group average for all share classes.
· For Janus Henderson Research Fund, the Trustees noted that, although the Fund’s total expenses exceeded the peer group average for certain share classes, overall the Fund’s total expenses were reasonable. The Trustees also noted that the Adviser has contractually agreed to limit the Fund’s expenses.
· For Janus Henderson Small Cap Value Fund, the Trustees noted that, although the Fund’s total expenses exceeded the peer group average for one share class, overall the Fund’s total expenses were reasonable. The Trustees also noted that the Adviser has contractually agreed to limit the Fund’s expenses, although this limit did not apply because the Fund’s total expenses as shown were below the applicable fee limit.
· For Janus Henderson Small-Mid Cap Value Fund, the Trustees noted that the Fund’s total expenses were below the peer group average for all share classes.
· For Janus Henderson Triton Fund, the Trustees noted that, although the Fund’s total expenses exceeded the peer group average for one share class, overall the Fund’s total expenses were reasonable. The Trustees also noted that the Adviser has contractually agreed to limit the Fund’s expenses, although this limit did not apply because the Fund’s total expenses as shown were below the applicable fee limit.
· For Janus Henderson Venture Fund, the Trustees noted that although the Fund’s total expenses exceeded the peer group average for one share class, overall the Fund’s total expenses were reasonable. The Trustees also noted that the Adviser has contractually agreed to limit the Fund’s expenses, although this limit did not apply because the Fund’s total expenses as shown were below the applicable fee limit.
The Trustees reviewed information on the overall profitability to the Adviser and its affiliates from their relationships with the Janus Henderson Funds, and considered profitability data of other publicly traded mutual fund advisers. The Trustees recognized that profitability comparisons among fund managers are difficult because of the variation in the type of comparative information that is publicly available, and the profitability of any fund manager is affected by numerous factors, including the organizational structure of the particular fund manager, differences in complex size, difference in product mix, difference in types of business (mutual fund, institutional and other), differences in the types of funds and other accounts it manages, possible other lines of business, the methodology for allocating expenses and the fund manager’s capital structure and cost of capital.
Janus Henderson Global Allocation Fund - Growth
Additional Information (unaudited)
Additionally, the Trustees considered the estimated profitability to the Adviser from the investment management services it provided to each Janus Henderson Fund. In their review, the Trustees considered whether the Adviser receive adequate incentives and resources to manage the Janus Henderson Funds effectively. In reviewing profitability, the Trustees noted that the estimated profitability for an individual Janus Henderson Fund is necessarily a product of the allocation methodology utilized by the Adviser to allocate its expenses as part of the estimated profitability calculation. In this regard, the Trustees noted that the independent fee consultant found as part of its 2022 review that (1) the expense allocation methodology and rationales utilized by the Adviser were reasonable and (2) no clear correlation exists between expense allocations and operating margins. The Trustees also considered that the estimated profitability for an individual Janus Henderson Fund was influenced by a number of factors, including not only the allocation methodology selected, but also the presence of fee waivers and expense caps, and whether the Janus Henderson Fund’s investment management agreement contained breakpoints or a performance fee component. The Trustees determined, after taking into account these factors, among others, that the Adviser’s estimated profitability with respect to each Janus Henderson Fund was not unreasonable in relation to the services provided, and that the variation in the range of such estimated profitability among the Janus Henderson Funds was not a material factor in the Board’s approval of the reasonableness of any Janus Henderson Fund’s investment management fees.
The Trustees concluded that the management fees payable by each Janus Henderson Fund to the Adviser were reasonable in relation to the nature, extent, and quality of the services provided, taking into account the fees charged by other advisers for managing comparable mutual funds with similar strategies, the fees the Adviser charges to other clients, and, as applicable, the impact of fund performance on management fees payable by the Janus Henderson Funds. The Trustees also concluded that each Janus Henderson Fund’s total expenses were reasonable, taking into account the size of the Janus Henderson Fund, the quality of services provided by the Adviser, the investment performance of the Janus Henderson Fund, and any expense limitations agreed to or provided by the Adviser.
Economies of Scale
The Trustees considered information about the potential for the Adviser to realize economies of scale as the assets of the Janus Henderson Funds increase. They noted that their independent fee consultant published a report to the Trustees in June 2022 which provided its research and analysis into economies of scale. They also noted that, although many Janus Henderson Funds pay advisory fees at a fixed base rate as a percentage of net assets, without any breakpoints or performance fees, their independent fee consultant concluded that 75% of these Janus Henderson Funds’ have contractual management fees (gross of waivers) below their Broadridge Expense Group averages. The Trustees also noted the following from the independent fee consultant’s report: (1) that 31% of Janus Henderson Funds had management fee breakpoints in place whereby investors pay lower management fees as fund AUM increases; (2) that 29% of Janus Henderson Funds have low flat-rate fees and performance fees where the Adviser is incentivized to invest in resources which drive Janus Henderson Fund performance; and (3) that 39% of Janus Henderson Funds have low flat-rate fees versus peers where investors pay low fixed fees when the Janus Henderson Fund is small/midsized and higher fees when the Janus Henderson Fund grows in assets. The Trustees also noted that the Janus Henderson Funds share directly in economies of scale through the significant investments made by the Adviser and its affiliates related to services provided to the Funds and the lower charges of third-party service providers that are based in part on the combined scale of all of the Janus Henderson Funds.
The Trustees also considered the independent fee consultant’s conclusion that, given the limitations of various analytical approaches to economies of scale and their conflicting results, it is difficult to analytically confirm or deny the existence of economies of scale in the Janus Henderson complex. In this regard, the independent consultant concluded that (1) to the extent there were economies of scale at the Adviser, the Adviser’s general strategy of setting fixed management fees below peers appeared to share any such economies with investors even on smaller Janus Henderson Funds which have not yet achieved those economies and (2) by setting lower fixed fees from the start on these Janus Henderson Funds, the Adviser appeared to be investing to increase the likelihood that these Janus Henderson Funds will grow to a level to achieve any economies of scale that may exist. Further, the independent fee consultant provided its belief that Janus Henderson Fund investors are well-served by the fee levels and performance fee structures in place on the Janus Henderson Funds in light of any economies of scale that may be present at the Adviser.
Based on all of the information reviewed, including the recent and past research and analysis conducted by the Trustees’ independent fee consultant, the Trustees concluded that the current fee structure of each Janus Henderson Fund was reasonable and that the current rates of fees do reflect a sharing between the Adviser and the Janus
Janus Henderson Global Allocation Fund - Growth
Additional Information (unaudited)
Henderson Fund of any economies of scale that may be present at the current asset level of the Janus Henderson Fund.
Other Benefits to the Adviser
The Trustees also considered benefits that accrue to the Adviser and its affiliates from their relationships with the Janus Henderson Funds. They recognized that two affiliates of the Adviser separately serve the Janus Henderson Funds as transfer agent and distributor, respectively, and the transfer agent receives compensation directly from the non-money market Janus Henderson Funds for services provided, and that such compensation contributes to the overall profitability of the Adviser and its affiliates that results from their relationship with the Janus Henderson Funds. The Trustees also considered the Adviser’s past and proposed use of commissions paid by the Janus Henderson Funds on portfolio brokerage transactions to obtain proprietary and third-party research products and services benefiting the Janus Henderson Fund and/or other clients of the Adviser and/or the Adviser. The Trustees concluded that the Adviser’s use of these types of client commission arrangements to obtain proprietary and third-party research products and services was consistent with regulatory requirements and guidelines and was likely to benefit each Janus Henderson Fund. The Trustees also concluded that, other than the services provided by the Adviser and its affiliates pursuant to the agreements and the fees to be paid by each Janus Henderson Fund therefor, the Janus Henderson Funds and the Adviser may potentially benefit from their relationship with each other in other ways. They concluded that the Adviser and its affiliates share directly in economies of scale through the lower charges of third-party service providers that are based in part on the combined scale of the Janus Henderson Funds and other clients serviced by the Adviser and its affiliates. They also concluded that the Adviser benefits from the receipt of research products and services acquired through commissions paid on portfolio transactions of the Janus Henderson Funds and that the Janus Henderson Funds benefit from the Adviser’s receipt of those products and services as well as research products and services acquired through commissions paid by other clients of the Adviser. They further concluded that the success of any Janus Henderson Fund could attract other business to the Adviser or other Janus Henderson Funds, and that the success of the Adviser could enhance the Adviser’s ability to serve the Janus Henderson Funds.
Janus Henderson Global Allocation Fund - Growth
Liquidity Risk Management Program (unaudited)
Liquidity Risk Management Program
Rule 22e-4 under the Investment Company Act of 1940, as amended (the “Liquidity Rule”), requires open-end funds (but not money market funds) to adopt and implement a written liquidity risk management program (the “LRMP”) that is reasonably designed to assess and manage liquidity risk, which is the risk that a fund could not meet redemption requests without significant dilution of remaining investors’ interest in the fund. The Fund has implemented a LRMP, which incorporates the following elements: (i) assessment, management, and periodic review of liquidity risk; (ii) classification of portfolio holdings; (iii) the establishment and monitoring of a highly liquid investment minimum, as applicable; (iv) a 15% limitation on a Fund’s illiquid investments; (v) redemptions in-kind; and (vi) board oversight.
The Trustees of the Fund (the “Trustees”) have designated Janus Henderson Investors US LLC, the Fund’s investment adviser (the “Adviser”), as the Program Administrator for the LRMP responsible for administering the LRMP and carrying out the specific responsibilities of the LRMP. A working group comprised of various teams within the Adviser’s business is responsible for administering the LRMP and carrying out the specific responsibilities of different aspects of the LRMP (the “Liquidity Risk Working Group”). In assessing each Fund’s liquidity risk, the Liquidity Risk Working Group periodically considers, as relevant, factors including (i) the liquidity of a Fund’s portfolio investments during normal and reasonably foreseeable stressed conditions; (ii) whether a Fund’s investment strategy is appropriate for an open-end fund; (iii) the extent to which a Fund’s strategy involves a relatively concentrated portfolio or large positions in any issuer; (iv) a Fund’s use of borrowing for investment purposes; and (v) a Fund’s use of derivatives.
The Liquidity Rule requires the Trustees to review at least annually a written report provided by the Program Administrator that addresses the operation of the LRMP and assesses its adequacy and the effectiveness of its implementation, including, if applicable, the operation of the highly liquid investment minimum, and any material changes to the LRMP (the “Program Administrator Report”). At a meeting held on March 15, 2023, the Adviser provided the Program Administrator Report to the Trustees which covered the operation of the LRMP from January 1, 2022 through December 31, 2022 (the “Reporting Period”).
The Program Administrator Report discussed the operation and effectiveness of the LRMP during the Reporting Period. Among other things, the Program Administrator Report indicated that there were no material changes to the LRMP during the Reporting Period, although there were certain methodology adjustments implemented relating to a change in data provider. Additionally, the findings presented in the Program Administrator Report indicated that the LRMP operated adequately during the Reporting Period. These findings included that the Fund was able to meet redemptions during the normal course of business during the Reporting Period. The Program Administrator Report also stated that the Fund did not exceed the 15% limit on illiquid assets during the Reporting Period, that the Fund held primarily highly liquid assets, and was considered to be a primarily highly liquid fund during the Reporting Period. Also included among the Program Administrator Report’s findings was the determination that the Fund’s investment strategy remains appropriate for an open-end fund. In addition, the Adviser expressed its belief in the Program Administrator Report that the LRMP is reasonably designed and adequate to assess and manage the Fund’s liquidity risk, considering the Fund’s particular risks and circumstances, and includes policies and procedures reasonably designed to implement each required component of the Liquidity Rule.
There can be no assurance that the LRMP will achieve its objectives in the future. Please refer to your Fund’s prospectus for more information regarding the risks to which an investment in the Fund may be subject.
Janus Henderson Global Allocation Fund - Growth
Useful Information About Your Fund Report (unaudited)
Management Commentary
The Management Commentary in this report includes valuable insight as well as statistical information to help you understand how your Fund’s performance and characteristics stack up against those of comparable indices.
If the Fund invests in foreign securities, this report may include information about country exposure. Country exposure is based primarily on the country of risk. A company may be allocated to a country based on other factors such as location of the company’s principal office, the location of the principal trading market for the company’s securities, or the country where a majority of the company’s revenues are derived.
Please keep in mind that the opinions expressed in the Management Commentary are just that: opinions. They are a reflection based on best judgment at the time this report was compiled, which was June 30, 2023. As the investing environment changes, so could opinions. These views are unique and are not necessarily shared by fellow employees or by Janus Henderson in general.
Performance Overviews
Performance overview graphs compare the performance of a hypothetical $10,000 investment in the Fund with one or more widely used market indices. When comparing the performance of the Fund with an index, keep in mind that market indices are not available for investment and do not reflect deduction of expenses.
Average annual total returns are quoted for a Fund with more than one year of performance history. Average annual total return is calculated by taking the growth or decline in value of an investment over a period of time, including reinvestment of dividends and distributions, then calculating the annual compounded percentage rate that would have produced the same result had the rate of growth been constant throughout the period. Average annual total return does not reflect the deduction of taxes that a shareholder would pay on Fund distributions or redemptions of Fund shares.
Cumulative total returns are quoted for a Fund with less than one year of performance history. Cumulative total return is the growth or decline in value of an investment over time, independent of the period of time involved. Cumulative total return does not reflect the deduction of taxes that a shareholder would pay on Fund distributions or redemptions of Fund shares.
Pursuant to federal securities rules, expense ratios shown in the performance chart reflect subsidized (if applicable) and unsubsidized ratios. The total annual fund operating expenses ratio is gross of any fee waivers, reflecting the Fund’s unsubsidized expense ratio. The net annual fund operating expenses ratio (if applicable) includes contractual waivers of the Adviser and reflects the Fund’s subsidized expense ratio. Ratios may be higher or lower than those shown in the “Financial Highlights” in this report.
Schedule of Investments
Following the performance overview section is the Fund’s Schedule of Investments. This schedule reports the types of securities held in the Fund on the last day of the reporting period. Securities are usually listed by type (common stock, corporate bonds, U.S. Government obligations, etc.) and by industry classification (banking, communications, insurance, etc.). Holdings are subject to change without notice.
The value of each security is quoted as of the last day of the reporting period. The value of securities denominated in foreign currencies is converted into U.S. dollars.
If the Fund invests in foreign securities, it will also provide a summary of investments by country. This summary reports the Fund exposure to different countries by providing the percentage of securities invested in each country. The country of each security represents the country of risk. The Fund’s Schedule of Investments relies upon the industry group and country classifications published by Bloomberg and/or MSCI Inc.
Tables listing details of individual forward currency contracts, futures, written options, swaptions, and swaps follow the Fund’s Schedule of Investments (if applicable).
Statement of Assets and Liabilities
This statement is often referred to as the “balance sheet.” It lists the assets and liabilities of the Fund on the last day of the reporting period.
Janus Henderson Global Allocation Fund - Growth
Useful Information About Your Fund Report (unaudited)
The Fund’s assets are calculated by adding the value of the securities owned, the receivable for securities sold but not yet settled, the receivable for dividends declared but not yet received on securities owned, and the receivable for Fund shares sold to investors but not yet settled. The Fund’s liabilities include payables for securities purchased but not yet settled, Fund shares redeemed but not yet paid, and expenses owed but not yet paid. Additionally, there may be other assets and liabilities such as unrealized gain or loss on forward currency contracts.
The section entitled “Net Assets Consist of” breaks down the components of the Fund’s net assets. Because the Fund must distribute substantially all earnings, you will notice that a significant portion of net assets is shareholder capital.
The last section of this statement reports the net asset value (“NAV”) per share on the last day of the reporting period. The NAV is calculated by dividing the Fund’s net assets for each share class (assets minus liabilities) by the number of shares outstanding.
Statement of Operations
This statement details the Fund’s income, expenses, realized gains and losses on securities and currency transactions, and changes in unrealized appreciation or depreciation of Fund holdings.
The first section in this statement, entitled “Investment Income,” reports the dividends earned from securities and interest earned from interest-bearing securities in the Fund.
The next section reports the expenses incurred by the Fund, including the advisory fee paid to the investment adviser, transfer agent fees and expenses, and printing and postage for mailing statements, financial reports and prospectuses. Expense offsets and expense reimbursements, if any, are also shown.
The last section lists the amounts of realized gains or losses from investment and foreign currency transactions, and changes in unrealized appreciation or depreciation of investments and foreign currency-denominated assets and liabilities. The Fund will realize a gain (or loss) when it sells its position in a particular security. A change in unrealized gain (or loss) refers to the change in net appreciation or depreciation of the Fund during the reporting period. “Net Realized and Unrealized Gain/(Loss) on Investments” is affected both by changes in the market value of Fund holdings and by gains (or losses) realized during the reporting period.
Statements of Changes in Net Assets
These statements report the increase or decrease in the Fund’s net assets during the reporting period. Changes in the Fund’s net assets are attributable to investment operations, dividends and distributions to investors, and capital share transactions. This is important to investors because it shows exactly what caused the Fund’s net asset size to change during the period.
The first section summarizes the information from the Statement of Operations regarding changes in net assets due to the Fund’s investment operations. The Fund’s net assets may also change as a result of dividend and capital gains distributions to investors. If investors receive their dividends and/or distributions in cash, money is taken out of the Fund to pay the dividend and/or distribution. If investors reinvest their dividends and/or distributions, the Fund’s net assets will not be affected.
The reinvestment of dividends and distributions is included under “Capital Share Transactions.” “Capital Shares” refers to the money investors contribute to the Fund through purchases or withdrawals via redemptions. The Fund’s net assets will increase and decrease in value as investors purchase and redeem shares from the Fund.
Financial Highlights
This schedule provides a per-share breakdown of the components that affect the Fund’s NAV for current and past reporting periods as well as total return, asset size, ratios, and portfolio turnover rate.
The first line in the table reflects the NAV per share at the beginning of the reporting period. The next line reports the net investment income/(loss) per share. Following is the per share total of net gains/(losses), realized and unrealized. Per share dividends and distributions to investors are then subtracted to arrive at the NAV per share at the end of the period. The next line reflects the total return for the period. The total return may include adjustments in accordance with generally accepted accounting principles required at the period end for financial reporting purposes. As a result, the total return may differ from the total return reflected for individual shareholder transactions. Also included are ratios of expenses and net investment income to average net assets.
Janus Henderson Global Allocation Fund - Growth
Useful Information About Your Fund Report (unaudited)
The Fund’s expenses may be reduced through expense offsets and expense reimbursements. The ratios shown reflect expenses before and after any such offsets and reimbursements.
The ratio of net investment income/(loss) summarizes the income earned less expenses, divided by the average net assets of the Fund during the reporting period. Do not confuse this ratio with the Fund’s yield. The net investment income ratio is not a true measure of the Fund’s yield because it does not take into account the dividends distributed to the Fund’s investors.
The next figure is the portfolio turnover rate, which measures the buying and selling activity in the Fund. Portfolio turnover is affected by market conditions, changes in the asset size of the Fund, fluctuating volume of shareholder purchase and redemption orders, the nature of the Fund’s investments, and the investment style and/or outlook of the portfolio manager(s) and/or investment personnel. A 100% rate implies that an amount equal to the value of the entire portfolio was replaced once during the fiscal year; a 50% rate means that an amount equal to the value of half the portfolio is traded in a year; and a 200% rate means that an amount equal to the value of the entire portfolio is traded every six months.
Janus Henderson Global Allocation Fund - Growth
Designation Requirements (unaudited)
For federal income tax purposes, the Fund designated the following for the year ended June 30, 2023:
| | |
| | |
Capital Gain Distributions | $7,365,841 |
Foreign Taxes Paid | $168,167 |
Foreign Source Income | $407,481 |
Dividends Received Deduction Percentage | 31% |
Qualified Dividend Income Percentage | 81% |
Janus Henderson Global Allocation Fund - Growth
Trustees and Officers (unaudited)
The following are the Trustees and officers of the Trust, together with a brief description of their principal occupations during the last five years (principal occupations for certain Trustees may include periods over five years). The Fund’s Statement of Additional Information includes additional information about the Trustees and officers and is available, without charge, by calling 1-877-335-2687.
Each Trustee has served in that capacity since he or she was originally elected or appointed. The Trustees do not serve a specified term of office. Each Trustee will hold office until the termination of the Trust or his or her earlier death, resignation, retirement, incapacity, or removal. Under the Fund’s Governance Procedures and Guidelines, the policy is for Trustees to retire no later than the end of the calendar year in which the Trustee turns 75. The Trustees review the Fund’s Governance Procedures and Guidelines from time to time and may make changes they deem appropriate. The Fund’s Nominating and Governance Committee will consider nominees for the position of Trustee recommended by shareholders. Shareholders may submit the name of a candidate for consideration by the Committee by submitting their recommendations to the Trust’s Secretary. Each Trustee is currently a Trustee of one other registered investment company advised by the Adviser: Janus Aspen Series. Collectively, these two registered investment companies consist of 49 series or funds referred to herein as the Fund Complex.
The Trust’s officers are elected annually by the Trustees for a one-year term. Certain officers also serve as officers of Janus Aspen Series. Certain officers of the Fund may also be officers and/or directors of the Adviser. Except as otherwise disclosed, Fund officers receive no compensation from the Fund, except for the Fund’s Chief Compliance Officer, as authorized by the Trustees.
| | | | | | |
TRUSTEES |
Name, Address, and Age | Positions Held with the Trust | Length of Time Served | Principal Occupations During the Past Five Years | Number of Portfolios/Funds in Fund Complex Overseen by Trustee | Other Directorships Held by Trustee During the Past Five Years |
Independent Trustees | | | | |
Alan A. Brown
151 Detroit Street
Denver, CO 80206
DOB: 1962 | Chairman
Trustee | 5/22-Present
1/13-Present | Principal, Curam Holdings LLC (since 2018). Formerly, Executive Vice President, Institutional Markets, of Black Creek Group (private equity real estate investment management firm) (2012-2018), Executive Vice President and Co-Head, Global Private Client Group (2007-2010), Executive Vice President, Mutual Funds (2005-2007), and Chief Marketing Officer (2001-2005) of Nuveen Investments, Inc. (asset management). | 49 | Advisory Board Member of AEW Core Property Trust (open-end property fund) (since 2020), and Director of WTTW (PBS affiliate) (since 2003). Formerly, Director of MotiveQuest LLC (strategic social market research company) (2003-2016), Director of Nuveen Global Investors LLC (2007-2011), Director of Communities in Schools (2004-2010), and Director of Mutual Fund Education Alliance (until 2010). |
Janus Henderson Global Allocation Fund - Growth
Trustees and Officers (unaudited)
| | | | | | |
TRUSTEES |
Name, Address, and Age | Positions Held with the Trust | Length of Time Served | Principal Occupations During the Past Five Years | Number of Portfolios/Funds in Fund Complex Overseen by Trustee | Other Directorships Held by Trustee During the Past Five Years |
Independent Trustees | | | | |
Cheryl D. Alston
151 Detroit Street
Denver, CO 80206
DOB: 1966 | Trustee | 8/22-Present | Executive Director and Chief Investment Officer, Employees’ Retirement Fund of the City of Dallas (since 2004). | 49 | Director of Blue Cross Blue Shield of Kansas City (a not-for-profit health insurance provider) (since 2016) and Director of Global Life Insurance (life and supplemental health insurance provider) (since 2017). Formerly, Director of Federal Home Loan Bank of Dallas (2017-2021). |
Janus Henderson Global Allocation Fund - Growth
Trustees and Officers (unaudited)
| | | | | | |
TRUSTEES |
Name, Address, and Age | Positions Held with the Trust | Length of Time Served | Principal Occupations During the Past Five Years | Number of Portfolios/Funds in Fund Complex Overseen by Trustee | Other Directorships Held by Trustee During the Past Five Years |
Independent Trustees | | | | |
Janus Henderson Global Allocation Fund - Growth
Trustees and Officers (unaudited)
| | | | | | |
William D. Cvengros
151 Detroit Street
Denver, CO 80206
DOB: 1948 | Trustee | 1/11-Present | Chief Executive Officer of SJC Capital, LLC (a personal investment company and consulting firm) (since 2002). Formerly, Chief Executive Officer and President of PIMCO Advisors Holdings L.P. (a publicly traded investment management firm) (1994-2000), and Chief Investment Officer (1987-1994) and Vice Chairman and Director (1990-1994) of Pacific Life Insurance Company (a mutual life insurance and annuity company) (1987-1994). | 49 | Member, Limited Partner Advisory Committee, Karmel Capital Fund III (later stage growth fund) (since 2022), Member of the Investment Committee for the Orange County Community Foundation (a grantmaking foundation) (since 2020), Advisory Board Member, RevOZ Fund LP and related funds (real estate investments for opportunity zones) (since 2020), and Advisory Board Member, Innovate Partners Emerging Growth and Equity Fund I (early stage venture capital fund) (since 2014). Formerly, Managing Trustee of National Retirement Partners Liquidating Trust (2013-2016), Chairman, National Retirement Partners, Inc. (formerly a network of advisors to 401(k) plans) (2005-2013), Director of Prospect Acquisition Corp. (a special purpose acquisition corporation) (2007-2009), Director of RemedyTemp, Inc. (temporary help services company) (1996-2006), and Trustee of PIMCO Funds Multi-Manager Series (1990-2000) and Pacific Life Variable Life & Annuity Trusts (1987-1994). |
Janus Henderson Global Allocation Fund - Growth
Trustees and Officers (unaudited)
| | | | | | |
TRUSTEES |
Name, Address, and Age | Positions Held with the Trust | Length of Time Served | Principal Occupations During the Past Five Years | Number of Portfolios/Funds in Fund Complex Overseen by Trustee | Other Directorships Held by Trustee During the Past Five Years |
Independent Trustees | | | | |
Raudline Etienne
151 Detroit Street
Denver, CO 80206
DOB: 1965 | Trustee | 6/16-Present | Founder, Daraja Capital (advisory and investment firm) (since 2016). Formerly, Senior Vice President and Senior Advisor, Albright Stonebridge Group LLC (global strategy firm) (2011-2021), and Deputy Comptroller and Chief Investment Officer, New York State Common Retirement Fund (public pension fund) (2008-2011). | 49 | Member of the Investment Committee for Cooper Union (private college) (since 2021) and Director of Brightwood Capital Advisors, LLC (since 2014). Formerly, Board Member, Van Alen Institute (nonprofit architectural and design organization) (2019-2022). |
Darrell B. Jackson
151 Detroit Street
Denver, CO 80206
DOB: 1958 | Trustee | 8/22-Present | President and Chief Executive Officer, The Efficace Group Inc. (since 2018). Formerly, President and Chief Executive Officer, Seaway Bank and Trust Company (community bank) (2014-2015), and Executive Vice President and Co-President, Wealth Management (2009-2014), and several senior positions, including Group Executive, Senior Vice President, and Vice President (1995-2009) of Northern Trust Company (financial services company) (1995-2014). | 49 | Director of Amalgamated Financial Corp (bank) (since August 2021), Director of YR Media (a not-for-profit production company) (since 2021), and Director of Gray-Bowen-Scott (transportation project consulting firm) (since April 2020). Formerly, Director of Delaware Place Bank (closely held commercial bank) (2016-2018) and Director of Seaway Bank and Trust Company (2014-2015). |
Janus Henderson Global Allocation Fund - Growth
Trustees and Officers (unaudited)
| | | | | | |
TRUSTEES |
Name, Address, and Age | Positions Held with the Trust | Length of Time Served | Principal Occupations During the Past Five Years | Number of Portfolios/Funds in Fund Complex Overseen by Trustee | Other Directorships Held by Trustee During the Past Five Years |
Independent Trustees | | | | |
William F. McCalpin
151 Detroit Street
Denver, CO 80206
DOB: 1957 | Trustee | 6/02-Present | Chief Executive Officer, muun chi LLC (organic food business) (since 2022) and Independent Consultant (since 2019). Formerly, Chief Operating Officer, muun chi LLC (2020-2022), Managing Partner, Impact Investments, Athena Capital Advisors LLC (independent registered investment advisor) (2016-2019), Managing Director, Holos Consulting LLC (provides consulting services to foundations and other nonprofit organizations) (2009-2016), Chief Executive Officer, Imprint Capital Advisors (impact investment firm) (2013-2015), and Executive Vice President and Chief Operating Officer of The Rockefeller Brothers Fund (a private family foundation) (1998-2006). | 49 | Chairman of the Board and Trustee of The Investment Fund for Foundations Investment Program (TIP) (consisting of 1 fund) (since 2008). Formerly, Director of the F.B. Heron Foundation (a private grantmaking foundation) (2006-2022), and Director of Mutual Fund Directors Forum (a non-profit organization serving independent directors of U.S. mutual funds) (2016-2021). |
Janus Henderson Global Allocation Fund - Growth
Trustees and Officers (unaudited)
| | | | | | |
TRUSTEES |
Name, Address, and Age | Positions Held with the Trust | Length of Time Served | Principal Occupations During the Past Five Years | Number of Portfolios/Funds in Fund Complex Overseen by Trustee | Other Directorships Held by Trustee During the Past Five Years |
Independent Trustees | | | | |
Gary A. Poliner
151 Detroit Street
Denver, CO 80206
DOB: 1953 | Trustee | 6/16-Present | Retired. Formerly, President (2010-2013) of Northwestern Mutual Life Insurance Company. | 49 | Director of MGIC Investment Corporation (private mortgage insurance) (since 2013). Formerly, Director, West Bend Mutual Insurance Company (property/casualty insurance) (2013-2021), Trustee of Northwestern Mutual Life Insurance Company (2010-2013) and Director of Frank Russell Company (global asset management firm) (2008-2013). |
Diane L. Wallace
151 Detroit Street
Denver, CO 80206
DOB: 1958 | Trustee | 6/17-Present | Retired. Formerly, Chief Operating Officer, Senior Vice President-Operations, and Chief Financial Officer for Driehaus Capital Management, LLC (1988-2006) and Treasurer for Driehaus Mutual Funds (1996-2002). | 49 | Formerly, Director of Family Service of Lake County (2019-2021), Independent Trustee, Henderson Global Funds (13 portfolios) (2015-2017), Independent Trustee, State Farm Associates’ Funds Trust, State Farm Mutual Fund Trust, and State Farm Variable Product Trust (28 portfolios) (2013-2017). |
Janus Henderson Global Allocation Fund - Growth
Trustees and Officers (unaudited)
| | | | |
OFFICERS |
Name, Address, and Age | Positions Held with the Trust | Term of Office* and Length of Time Served | Principal Occupations During the Past Five Years |
Ashwin Alankar
151 Detroit Street
Denver, CO 80206
DOB: 1974 | Executive Vice President and Portfolio Manager
Janus Henderson Global Allocation Fund - Growth | 9/14-Present | Head of Global Asset Allocation of Janus Henderson Investors and Portfolio Manager for other Janus Henderson accounts. |
Michelle Rosenberg
151 Detroit Street
Denver, CO 80206
DOB: 1973 | President and Chief Executive Officer | 9/22-Present | General Counsel and Corporate Secretary of Janus Henderson Investors (since 2018). Formerly, Interim President and Chief Executive Officer of the Trust and Janus Aspen Series (2022), Senior Vice President and Head of Legal, North America of Janus Henderson Investors (2017-2018) and Deputy General Counsel of Janus Henderson US (Holdings) Inc. (2015-2018). |
Kristin Mariani
151 Detroit Street
Denver, CO 80206
DOB: 1966 | Vice President and Chief Compliance Officer | 7/20-Present | Head of Compliance, North America at Janus Henderson Investors (since September 2020) and Chief Compliance Officer at Janus Henderson Investors US LLC (since September 2017). Formerly, Anti-Money Laundering Officer for the Trust and Janus Aspen Series (July 2020-December 2022), Global Head of Investment Management Compliance at Janus Henderson Investors (February 2019-August 2020), Vice President, Head of Global Distribution Compliance and Chief Compliance Officer at Janus Henderson Distributors US LLC (May 2017-September 2017), Vice President, Compliance at Janus Henderson US (Holdings) Inc., Janus Henderson Investors US LLC, and Janus Henderson Distributors US LLC (2009-2017). |
Jesper Nergaard
151 Detroit Street
Denver, CO 80206
DOB: 1962 | Chief Financial Officer
Vice President, Treasurer, and Principal Accounting Officer | 3/05-Present
2/05-Present | Head of U.S. Fund Administration, Janus Henderson Investors and Janus Henderson Services US LLC. |
Janus Henderson Global Allocation Fund - Growth
Trustees and Officers (unaudited)
| | | | |
OFFICERS |
Name, Address, and Age | Positions Held with the Trust | Term of Office* and Length of Time Served | Principal Occupations During the Past Five Years |
Abigail J. Murray
151 Detroit Street
Denver, CO 80206
DOB: 1975 | Vice President, Chief Legal Counsel, and Secretary | 12/20-Present | Managing Counsel (since 2020). Formerly, Senior Counsel for Invesco Ltd. (2017-2020), and Vice President and Senior Counsel, ALPS Fund Services, Inc. and Assistant General Counsel, ALPS Advisors, Inc. (2015-2017). |
Ciaran Askin
151 Detroit Street
Denver, CO 80206
DOB: 1978 | Anti-Money Laundering Officer | 12/22-Present | Global Head of Financial Crime, Janus Henderson Investors (since 2022). Formerly, Global Head of Financial Crime for Invesco Ltd. (2017-2022). |
* Officers are elected at least annually by the Trustees for a one-year term and may also be elected from time to time by the Trustees for an interim period. |
Janus Henderson Global Allocation Fund - Growth
Notes
NotesPage1
| | | | | | | | |
| | | | | |

| | | | |
This report is submitted for the general information of shareholders of the Fund. It is not an offer or solicitation for the Fund and is not authorized for distribution to prospective investors unless preceded or accompanied by an effective prospectus. |
Janus Henderson is a trademark of Janus Henderson Group plc or one of its subsidiaries. © Janus Henderson Group plc Janus Henderson Distributors US LLC Janus Henderson Group is the ultimate parent of Janus Henderson Distributors US LLC |
| | | | 125-02-93021 08-23 |
| | | |
| | | |
| | | ANNUAL REPORT June 30, 2023 |
| | |
| | Janus Henderson Global Allocation Fund - Moderate |
| | |
| | Janus Investment Fund |
| |
| | | |
| | | HIGHLIGHTS · Portfolio management perspective · Investment strategy behind your fund · Fund performance, characteristics
and holdings |
Table of Contents
Janus Henderson Global Allocation Fund - Moderate
Janus Henderson Global Allocation Fund - Moderate (unaudited)
| | | | | | |
| | | | | 
Ashwin Alankar portfolio manager |
| | | |
PERFORMANCE OVERVIEW
For the 12-month period ended June 30, 2023, the Janus Henderson Global Allocation Fund – Moderate’s Class I shares returned 7.55%. This compares with a return of 16.53% for its primary benchmark, the MSCI All Country World IndexSM, and a 9.25% return for its secondary benchmark, the Global Moderate Allocation Index, an internally calculated, hypothetical combination of total returns from the MSCI All Country World Index (60%) and the Bloomberg Global Aggregate Bond Index (40%).
MARKET ENVIRONMENT
Despite early-period volatility, global equities generated positive returns over the period as investors gained greater confidence that inflation was being brought under control and that a pronounced recession could be avoided. Global bonds, however, came under substantial pressure, with positive corporate returns more than offset by negative returns in U.S. Treasuries and sovereigns. Global rates rose as central banks continued to battle inflation. The U.S. economy remained resilient, especially compared to developed market peers. Inflation remained elevated in the UK, and the euro area officially entered a recession.
PERFORMANCE DISCUSSION
The Janus Henderson Global Allocation Fund – Moderate invests across a broad set of Janus Henderson funds that span a wide range of global asset categories with a base allocation of 45% to 65% equity investments, 30% to 45% fixed income investments and 5% to 20% alternative investments (to the extent these are available) that are monitored and rebalanced periodically. The Fund is structured as a “fund of funds” portfolio that seeks to provide investors with broad, diversified exposure to various types of investments with an emphasis on managing investment risk.
The steep rise in interest rates during the period resulted in the Fund’s exposure to bonds being the primary driver of underperformance relative its secondary benchmark. Both the Janus Henderson Global Bond Fund and the Janus Henderson Flexible Bond Fund were among the leading individual detractors. Given the period’s rally in equities, the Fund’s stock positioning contributed to results. The Janus Henderson Overseas Fund was among the leading contributors, followed by the Janus Henderson Forty Fund.
OUTLOOK
Disagreement makes markets. When disagreement evolves into agreement, risk premiums re-price and a transition in the volatility regime can occur. It is worth identifying the epicenter of disagreements and contradictory data to better understand the root cause of market incongruencies. Today, the epicenter of disagreement is between low equity volatility – levels not seen since the pandemic – and consensus expectations for elevated recession risk.
Is low volatility masking recession dangers or is it telling us that the likelihood of economic contraction is low? Based on data we have analyzed from both the risks priced by the option market and consumer data, we believe it is the latter. Options are pricing in greater upside skew to equities, with expected tail gains – or the chance for gains that exceed what is priced in under a broad distribution of expected returns – greater than expected tail losses. This is true for both developed-market equities and also emerging markets and small caps. At the same time, equity downside risk, or expected tail losses, are well
Janus Henderson Global Allocation Fund - Moderate (unaudited)
below average levels. We see similar attractiveness in fixed income, with short maturity treasuries slightly more attractive than longer maturity notes. This suggests that inflation risks may be managed without leading to a deep recession.
Recession is very unlikely when the consumer is strong, and earnings estimates for consumer-focused companies as well as forecasts for consumer loan impairments indicate a healthy consumer. The risk to this optimistic view is policy error. Historically monetary policy has been fraught with error. One risk is keeping the economy awash with cheap money for too long and, thus, fueling inflation, and the other is inconsistent responses on the part of central banks to rising prices. The Federal Reserve (Fed) has reached a crucial point in its battle against inflation. The cost of money is once again expensive. The question now is whether Fed Chairman Jerome Powell will finish the job by keeping money expensive, or will he balk? Thus far, Mr. Powell has made it clear that he does not consider his job done.
Resilient consumer and other macro should portend that moderately expensive money over the medium term won’t derail the economy or the prospects for riskier assets. A Fed that stays the course will more likely fuel a right tail – or upside surprise – in capital markets while a premature dovish pivot would more likely fuel a left tail event.
The path of economic growth relies heavily on the Fed not committing a policy error and, therefore, uncertainly remains elevated.
Thank you for investing in the Janus Henderson Global Allocation Fund – Moderate.
Any risk management process discussed includes an effort to monitor and manage risk which should not be confused with and does not imply low risk or the ability to control certain risk factors.
Important Notice – Tailored Shareholder Reports
Effective January 24, 2023, the Securities and Exchange Commission (the “SEC”) adopted rule and form amendments that require mutual funds and exchange-traded funds to provide shareholders with streamlined annual and semi-annual shareholder reports that highlight key information. Other information, including financial statements, that currently appears in shareholder reports will be made available online, delivered free of charge to shareholders upon request, and filed with the SEC. The first tailored shareholder report for the Fund will be for the reporting period ending June 30, 2024. Currently, management is evaluating the impact of the rule and form amendments on the content of the Fund’s current shareholder reports.
Janus Henderson Global Allocation Fund - Moderate (unaudited)
Fund At A Glance
June 30, 2023
| | | | |
Holdings - (% of Net Assets) | | | |
Janus Henderson Global Bond Fund - Class N Shares | | 24.4 | % |
Janus Henderson Flexible Bond Fund - Class N Shares | | 9.9 | |
Janus Henderson Overseas Fund - Class N Shares | | 6.8 | |
Janus Henderson Emerging Markets Fund - Class N Shares | | 6.0 | |
Janus Henderson Adaptive Risk Managed U.S. Equity Fund - Class N Shares | | 5.8 | |
Janus Henderson Adaptive Global Allocation Fund - Class N Shares | | 5.6 | |
Janus Henderson Contrarian Fund - Class N Shares | | 3.8 | |
Janus Henderson Small-Mid Cap Value Fund - Class N Shares | | 3.8 | |
Janus Henderson Global Select Fund - Class N Shares | | 3.5 | |
Janus Henderson Forty Fund - Class N Shares | | 3.0 | |
Janus Henderson Short Duration Flexible Bond Fund - Class N Shares | | 3.0 | |
Janus Henderson U.S. Dividend Income Fund - Class N Shares | | 3.0 | |
Janus Henderson Enterprise Fund - Class N Shares | | 2.9 | |
Janus Henderson Growth and Income Fund - Class N Shares | | 2.8 | |
Janus Henderson Global Equity Income Fund - Class N Shares | | 2.8 | |
Janus Henderson Triton Fund - Class N Shares | | 2.3 | |
Janus Henderson Global Real Estate Fund - Class N Shares | | 2.3 | |
Janus Henderson Asia Equity Fund - Class N Shares | | 2.1 | |
Janus Henderson Global Research Fund - Class N Shares | | 2.0 | |
Janus Henderson European Focus Fund - Class N Shares | | 1.6 | |
Janus Henderson AAA CLO | | 1.6 | |
Janus Henderson High-Yield Fund - Class N Shares | | 0.6 | |
Janus Henderson Multi-Sector Income Fund - Class N Shares | | 0.3 | |
Janus Henderson Cash Liquidity Fund LLC | | 0.1 | |
| | | | | | |
Asset Allocation - (% of Net Assets) | |
Equity Funds | | 60.1% | |
Fixed Income Funds | | 38.2% | |
Exchange-Traded Funds (ETFs) | | 1.6% | |
Money Markets | | 0.1% | |
Other | | (0.0)% |
| | | 100.0% |
Janus Henderson Global Allocation Fund - Moderate (unaudited)
Performance
| |
See important disclosures on the next page. |
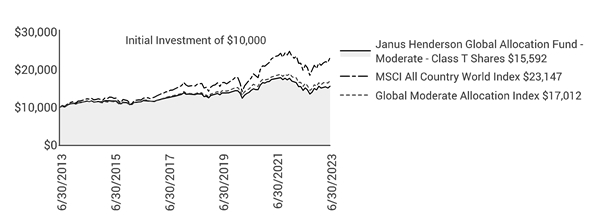
| | | | | | | | | | |
| | | | | | | | |
| | | | | | | | | |
Average Annual Total Return - for the periods ended June 30, 2023 | | | Prospectus Expense Ratios |
| | One
Year | Five
Year | Ten
Year | Since
Inception* | | | Total Annual Fund
Operating Expenses‡ |
Class A Shares at NAV | | 7.37% | 2.99% | 4.43% | 5.24% | | | 1.11% |
Class A Shares at MOP | | 1.18% | 1.78% | 3.81% | 4.89% | | | |
Class C Shares at NAV | | 6.61% | 2.26% | 3.72% | 4.50% | | | 1.90% |
Class C Shares at CDSC | | 5.61% | 2.26% | 3.72% | 4.50% | | | |
Class D Shares | | 7.49% | 3.16% | 4.61% | 5.43% | | | 0.94% |
Class I Shares | | 7.55% | 3.21% | 4.66% | 5.47% | | | 0.90% |
Class S Shares | | 7.11% | 2.79% | 4.23% | 5.03% | | | 1.30% |
Class T Shares | | 7.41% | 3.09% | 4.54% | 5.37% | | | 1.05% |
MSCI All Country World Index | | 16.53% | 8.10% | 8.75% | 6.73% | | | |
Global Moderate Allocation Index | | 9.25% | 4.62% | 5.46% | 5.19% | | | |
Morningstar Quartile - Class T Shares | | 2nd | 3rd | 2nd | 2nd | | | |
Morningstar Ranking - based on total returns for World Allocation Funds | | 200/393 | 282/383 | 188/332 | 78/210 | | | |
Returns quoted are past performance and do not guarantee future results; current performance may be lower or higher. Investment returns and principal value will vary; there may be a gain or loss when shares are sold. For the most recent month-end performance call 800.668.0434 (or 800.525.3713 if you hold shares directly with Janus Henderson) or visit janushenderson.com/performance (or janushenderson.com/allfunds if you hold shares directly with Janus Henderson).
Maximum Offering Price (MOP) returns include the maximum sales charge of 5.75%. Net Asset Value (NAV) returns exclude this charge, which would have reduced returns.
CDSC returns include a 1% contingent deferred sales charge (CDSC) on Shares redeemed within 12 months of purchase. Net Asset Value (NAV) returns exclude this charge, which would have reduced returns.
For certain periods, the Fund’s performance may reflect the effects of expense waivers.
Performance may be affected by risks that include those associated with foreign and emerging markets, fixed income securities, high-yield and high-risk securities, undervalued, overlooked and smaller capitalization companies, real estate related securities including Real Estate Investment Trusts (REITs), Environmental, Social and Governance (ESG) factors, non-diversification, portfolio turnover, derivatives, short sales, initial public offerings (IPOs) and potential conflicts of interest. Each product has different risks. Please see the prospectus for more information about risks, holdings and other details.
Janus Henderson Global Allocation Fund - Moderate (unaudited)
Performance
Performance of the Global Allocation Funds depends on that of the underlying funds. They are subject to the volatility of the financial markets. Because Janus Henderson Investors US LLC is the adviser to the Fund and to the underlying affiliated funds held within the Fund, it is subject to certain potential conflicts of interest.
Returns include reinvestment of all dividends and distributions and do not reflect the deduction of taxes that a shareholder would pay on Fund distributions or redemptions of Fund shares. The returns do not include adjustments in accordance with generally accepted accounting principles required at the period end for financial reporting purposes.
Class A Shares, Class C Shares, and Class S Shares commenced operations on July 6, 2009. Performance shown for each class for periods prior to July 6, 2009, reflects the performance of the Fund’s Class J Shares, the initial share class (renamed Class T Shares effective February 16, 2010), calculated using the fees and expenses of each respective share class, without the effect of any fee and expense limitations or waivers.
Class D Shares commenced operations on February 16, 2010. Performance shown for periods prior to February 16, 2010, reflects the performance of the Fund’s former Class J Shares, calculated using the fees and expenses in effect during the periods shown, net of any applicable fee and expense limitations or waivers.
Class I Shares commenced operations on July 6, 2009. Performance shown for periods prior to July 6, 2009, reflects the performance of the Fund’s former Class J Shares, calculated using the fees and expenses of Class J Shares, net of any applicable fee and expense limitations or waivers.
If each share class of the Fund had been available during periods prior to its commencement, the performance shown may have been different. The performance shown for periods following the Fund’s commencement of each share class reflects the fees and expenses of each respective share class, net of any applicable fee and expense limitations or waivers. Please refer to the Fund’s prospectuses for further details concerning historical performance.
Ranking is for the share class shown only; other classes may have different performance characteristics. When an expense waiver is in effect, it may have a material effect on the total return, and therefore the ranking for the period.
© 2023 Morningstar, Inc. All Rights Reserved.
There is no assurance that the investment process will consistently lead to successful investing.
See Notes to Schedule of Investments and Other Information for index definitions.
Index performance does not reflect the expenses of managing a portfolio as an index is unmanaged and not available for direct investment.
See “Useful Information About Your Fund Report.”
*The Fund’s inception date – December 30, 2005
‡ As stated in the prospectus. See Financial Highlights for actual expense ratios during the reporting period.
Janus Henderson Global Allocation Fund - Moderate (unaudited)
Expense Examples
As a shareholder of the Fund, you incur two types of costs: (1) transaction costs, such as sales charges (loads) on purchase payments (applicable to Class A Shares only); and (2) ongoing costs, including management fees; 12b-1 distribution and shareholder servicing fees; transfer agent fees and expenses payable pursuant to the Transfer Agency Agreement; and other Fund expenses. This example is intended to help you understand your ongoing costs (in dollars) of investing in the Fund and to compare these costs with the ongoing costs of investing in other mutual funds. To do so, compare this 5% hypothetical example with the 5% hypothetical examples that appear in the shareholder reports of the other funds. The example is based upon an investment of $1,000 invested at the beginning of the period and held for the six-months indicated, unless noted otherwise in the table and footnotes below.
Actual Expenses
The information in the table under the heading “Actual” provides information about actual account values and actual expenses. You may use the information in these columns, together with the amount you invested, to estimate the expenses that you paid over the period. Simply divide your account value by $1,000 (for example, an $8,600 account value divided by $1,000 = 8.6), then multiply the result by the number in the appropriate column for your share class under the heading entitled “Expenses Paid During Period” to estimate the expenses you paid on your account during the period.
Hypothetical Example for Comparison Purposes
The information in the table under the heading “Hypothetical (5% return before expenses)” provides information about hypothetical account values and hypothetical expenses based upon the Fund’s actual expense ratio and an assumed rate of return of 5% per year before expenses, which is not the Fund’s actual return. The hypothetical account values and expenses may not be used to estimate the actual ending account balance or expenses you paid for the period. You may use this information to compare the ongoing costs of investing in the Fund and other funds. To do so, compare this 5% hypothetical example with the 5% hypothetical examples that appear in the shareholder reports of the other funds. Additionally, for an analysis of the fees associated with an investment in any share class or other similar funds, please visit www.finra.org/fundanalyzer.
Please note that the expenses shown in the table are meant to highlight your ongoing costs only and do not reflect any transaction costs. These fees are fully described in the Fund’s prospectuses. Therefore, the hypothetical examples are useful in comparing ongoing costs only, and will not help you determine the relative total costs of owning different funds. In addition, if these transaction costs were included, your costs would have been higher.
| | | | | | | | | | | |
| | | | | | | | |
| | | Actual | | Hypothetical
(5% return before expenses) | |
| Beginning
Account
Value
(1/1/23) | Ending
Account
Value
(6/30/23) | Expenses
Paid During
Period
(1/1/23 - 6/30/23)† | | Beginning
Account
Value
(1/1/23) | Ending
Account
Value
(6/30/23) | Expenses
Paid During
Period
(1/1/23 - 6/30/23)† | Net Annualized
Expense Ratio
(1/1/23 - 6/30/23)†† |
Class A Shares | $1,000.00 | $1,065.20 | $2.25 | | $1,000.00 | $1,022.61 | $2.21 | 0.44% |
Class C Shares | $1,000.00 | $1,062.20 | $5.57 | | $1,000.00 | $1,019.39 | $5.46 | 1.09% |
Class D Shares | $1,000.00 | $1,065.60 | $1.28 | | $1,000.00 | $1,023.55 | $1.25 | 0.25% |
Class I Shares | $1,000.00 | $1,065.70 | $1.18 | | $1,000.00 | $1,023.65 | $1.15 | 0.23% |
Class S Shares | $1,000.00 | $1,063.90 | $3.17 | | $1,000.00 | $1,021.72 | $3.11 | 0.62% |
Class T Shares | $1,000.00 | $1,065.90 | $1.69 | | $1,000.00 | $1,023.16 | $1.66 | 0.33% |
† | Expenses Paid During Period are equal to the Net Annualized Expense Ratio multiplied by the average account value over the period, multiplied by 181/365 (to reflect the one-half year period). Expenses in the examples include the effect of applicable fee waivers and/or expense reimbursements, if any. Had such waivers and/or reimbursements not been in effect, your expenses would have been higher. Please refer to the Notes to Financial Statements or the Fund’s prospectuses for more information regarding waivers and/or reimbursements. |
†† | Ratios do not include indirect expenses of the underlying funds and/or investment companies in which the Fund invests. |
Janus Henderson Global Allocation Fund - Moderate
Schedule of Investments
June 30, 2023
| | | | | | | | |
Shares
| | | Value | |
Investment Companies£– 100.0% | | | |
Equity Funds – 60.1% | | | |
| | Janus Henderson Adaptive Global Allocation Fund - Class N Shares | | 1,057,987 | | | $10,568,203 | |
| | Janus Henderson Adaptive Risk Managed U.S. Equity Fund - Class N Shares | | 1,125,649 | | | 11,052,160 | |
| | Janus Henderson Asia Equity Fund - Class N Shares* | | 414,909 | | | 4,080,932 | |
| | Janus Henderson Contrarian Fund - Class N Shares | | 276,159 | | | 7,313,733 | |
| | Janus Henderson Emerging Markets Fund - Class N Shares* | | 1,282,929 | | | 11,363,068 | |
| | Janus Henderson Enterprise Fund - Class N Shares | | 40,134 | | | 5,506,479 | |
| | Janus Henderson European Focus Fund - Class N Shares | | 72,513 | | | 3,036,451 | |
| | Janus Henderson Forty Fund - Class N Shares | | 118,892 | | | 5,725,518 | |
| | Janus Henderson Global Equity Income Fund - Class N Shares | | 876,205 | | | 5,283,368 | |
| | Janus Henderson Global Real Estate Fund - Class N Shares | | 384,642 | | | 4,318,573 | |
| | Janus Henderson Global Research Fund - Class N Shares | | 41,174 | | | 3,786,506 | |
| | Janus Henderson Global Select Fund - Class N Shares | | 391,638 | | | 6,646,549 | |
| | Janus Henderson Growth and Income Fund - Class N Shares | | 77,204 | | | 5,412,270 | |
| | Janus Henderson Overseas Fund - Class N Shares | | 305,089 | | | 12,994,370 | |
| | Janus Henderson Small-Mid Cap Value Fund - Class N Shares | | 527,375 | | | 7,145,641 | |
| | Janus Henderson Triton Fund - Class N Shares | | 160,426 | | | 4,406,443 | |
| | Janus Henderson U.S. Dividend Income Fund - Class N Shares | | 556,344 | | | 5,691,394 | |
| | | 114,331,658 | |
Exchange-Traded Funds (ETFs) – 1.6% | | | |
| | Janus Henderson AAA CLO | | 60,498 | | | 3,015,825 | |
Fixed Income Funds – 38.2% | | | |
| | Janus Henderson Flexible Bond Fund - Class N Shares | | 2,025,138 | | | 18,813,049 | |
| | Janus Henderson Global Bond Fund - Class N Shares | | 6,009,260 | | | 46,390,269 | |
| | Janus Henderson High-Yield Fund - Class N Shares | | 158,338 | | | 1,116,081 | |
| | Janus Henderson Multi-Sector Income Fund - Class N Shares | | 76,382 | | | 644,661 | |
| | Janus Henderson Short Duration Flexible Bond Fund - Class N Shares | | 2,043,495 | | | 5,701,280 | |
| | | 72,665,340 | |
Money Markets – 0.1% | | | |
| | Janus Henderson Cash Liquidity Fund LLC, 5.1900%ºº | | 192,038 | | | 192,076 | |
Total Investments (total cost $186,514,293) – 100.0% | | 190,204,899 | |
Liabilities, net of Cash, Receivables and Other Assets – (0)% | | (76,820) | |
Net Assets – 100% | | $190,128,079 | |
| | |
See Notes to Schedule of Investments and Other Information and Notes to Financial Statements. |
| |
Janus Investment Fund | 7 |
Janus Henderson Global Allocation Fund - Moderate
Schedule of Investments
June 30, 2023
Schedules of Affiliated Investments – (% of Net Assets)
| | | | | | | | | | | | |
| | Dividend Income | Realized Gain/(Loss) | Capital Gain Distributions from Underlying Funds | Change in Unrealized Appreciation/ Depreciation | Value at 6/30/23 |
Investment Companies - 100.0% |
Equity Funds - 60.1% |
| | Janus Henderson Adaptive Global Allocation Fund - Class N Shares | $ | 128,954 | $ | (156,644) | $ | - | $ | 944,185 | $ | 10,568,203 |
| | Janus Henderson Adaptive Risk Managed U.S. Equity Fund - Class N Shares | | 235,857 | | (470,099) | | 74,702 | | 1,699,105 | | 11,052,160 |
| | Janus Henderson Asia Equity Fund - Class N Shares* | | - | | (149,822) | | - | | 36,002 | | 4,080,932 |
| | Janus Henderson Contrarian Fund - Class N Shares | | 53,182 | | (517,565) | | - | | 1,776,678 | | 7,313,733 |
| | Janus Henderson Emerging Markets Fund - Class N Shares* | | - | | (493,312) | | - | | 424,861 | | 11,363,068 |
| | Janus Henderson Enterprise Fund - Class N Shares | | - | | (935,280) | | 533,085 | | 1,618,141 | | 5,506,479 |
| | Janus Henderson European Focus Fund - Class N Shares | | 165,075 | | 277,250 | | - | | 589,440 | | 3,036,451 |
| | Janus Henderson Forty Fund - Class N Shares | | - | | 204,785 | | 3,867 | | 1,337,361 | | 5,725,518 |
| | Janus Henderson Global Equity Income Fund - Class N Shares | | 568,061 | | (229,387) | | - | | 424,019 | | 5,283,368 |
| | Janus Henderson Global Real Estate Fund - Class N Shares | | 86,211 | | (91,832) | | - | | (155,589) | | 4,318,573 |
| | Janus Henderson Global Research Fund - Class N Shares | | 65,506 | | (73,451) | | 194,589 | | 802,789 | | 3,786,506 |
| | Janus Henderson Global Select Fund - Class N Shares | | 102,084 | | 403,073 | | 162,275 | | 399,565 | | 6,646,549 |
| | Janus Henderson Growth and Income Fund - Class N Shares | | 81,625 | | (56,854) | | 343,055 | | 475,115 | | 5,412,270 |
| | Janus Henderson Overseas Fund - Class N Shares | | 267,168 | | 67,600 | | - | | 1,783,686 | | 12,994,370 |
| | Janus Henderson Small-Mid Cap Value Fund - Class N Shares | | 48,367 | | (218,352) | | - | | 1,477,463 | | 7,145,641 |
| | Janus Henderson Triton Fund - Class N Shares | | - | | (1,689,455) | | 309,983 | | 2,092,075 | | 4,406,443 |
| | Janus Henderson U.S. Dividend Income Fund - Class N Shares | | 20,418 | | (171) | | - | | 110,979 | | 5,691,394 |
Total Equity Funds | $ | 1,822,508 | $ | (4,129,516) | $ | 1,621,556 | $ | 15,835,875 | $ | 114,331,658 |
Exchange-Traded Funds (ETFs) - 1.6% |
| | Janus Henderson AAA CLO | | 180,495 | | 7,378 | | - | | 31,973 | | 3,015,825 |
Fixed Income Funds - 38.2% |
| | Janus Henderson Flexible Bond Fund - Class N Shares | | 336,425 | | (40,092) | | - | | (542,927) | | 18,813,049 |
| | Janus Henderson Global Bond Fund - Class N Shares | | 228,956 | | (822,417) | | - | | (660,649) | | 46,390,269 |
| | Janus Henderson High-Yield Fund - Class N Shares | | 473,151 | | (2,305,816) | | - | | 2,322,277 | | 1,116,081 |
| | Janus Henderson Multi-Sector Income Fund - Class N Shares | | 69,137 | | 32,256 | | - | | 6,982 | | 644,661 |
| | Janus Henderson Short Duration Flexible Bond Fund - Class N Shares | | 178,501 | | (373,391) | | - | | 179,502 | | 5,701,280 |
Total Fixed Income Funds | $ | 1,286,170 | $ | (3,509,460) | $ | - | $ | 1,305,185 | $ | 72,665,340 |
Money Markets - 0.1% |
| | Janus Henderson Cash Liquidity Fund LLC, 5.1900%ºº | | 3,450 | | 6 | | - | | - | | 192,076 |
Total Affiliated Investments - 100.0% | $ | 3,292,623 | $ | (7,631,592) | $ | 1,621,556 | $ | 17,173,033 | $ | 190,204,899 |
| | |
See Notes to Schedule of Investments and Other Information and Notes to Financial Statements. |
| |
8 | JUNE 30, 2023 |
Janus Henderson Global Allocation Fund - Moderate
Schedule of Investments
June 30, 2023
| | | | | | | | | | | |
| | Value at 6/30/22 | Purchases | Sales Proceeds | Value at 6/30/23 |
Investment Companies - 100.0% |
Equity Funds - 60.1% | |
| | Janus Henderson Adaptive Global Allocation Fund - Class N Shares | | 10,736,885 | | 416,028 | | (1,372,251) | | 10,568,203 |
| | Janus Henderson Adaptive Risk Managed U.S. Equity Fund - Class N Shares | | 11,631,873 | | 535,829 | | (2,344,548) | | 11,052,160 |
| | Janus Henderson Asia Equity Fund - Class N Shares* | | 4,442,547 | | 271,019 | | (518,814) | | 4,080,932 |
| | Janus Henderson Contrarian Fund - Class N Shares | | 10,514,114 | | 225,960 | | (4,685,454) | | 7,313,733 |
| | Janus Henderson Emerging Markets Fund - Class N Shares* | | 13,352,859 | | 583,557 | | (2,504,897) | | 11,363,068 |
| | Janus Henderson Enterprise Fund - Class N Shares | | 9,517,977 | | 664,096 | | (5,358,455) | | 5,506,479 |
| | Janus Henderson European Focus Fund - Class N Shares | | 4,399,177 | | 1,867,840 | | (4,097,256) | | 3,036,451 |
| | Janus Henderson Forty Fund - Class N Shares | | 4,642,362 | | 2,760,147 | | (3,219,137) | | 5,725,518 |
| | Janus Henderson Global Equity Income Fund - Class N Shares | | 8,521,513 | | 718,498 | | (4,151,275) | | 5,283,368 |
| | Janus Henderson Global Real Estate Fund - Class N Shares | | 3,645,461 | | 1,517,951 | | (597,418) | | 4,318,573 |
| | Janus Henderson Global Research Fund - Class N Shares | | 4,995,443 | | 1,233,373 | | (3,171,648) | | 3,786,506 |
| | Janus Henderson Global Select Fund - Class N Shares | | 6,262,968 | | 3,247,617 | | (3,666,674) | | 6,646,549 |
| | Janus Henderson Growth and Income Fund - Class N Shares | | 4,032,741 | | 3,304,005 | | (2,342,737) | | 5,412,270 |
| | Janus Henderson Overseas Fund - Class N Shares | | 8,468,136 | | 7,285,712 | | (4,610,764) | | 12,994,370 |
| | Janus Henderson Small-Mid Cap Value Fund - Class N Shares | | 9,037,656 | | 270,578 | | (3,421,704) | | 7,145,641 |
| | Janus Henderson Triton Fund - Class N Shares | | 7,967,613 | | 429,485 | | (4,393,275) | | 4,406,443 |
| | Janus Henderson U.S. Dividend Income Fund - Class N Shares | | - | | 5,677,281 | | (96,695) | | 5,691,394 |
Exchange-Traded Funds (ETFs) - 1.6% | |
| | Janus Henderson AAA CLO | | - | | 6,280,628 | | (3,304,154) | | 3,015,825 |
Fixed Income Funds - 38.2% | |
| | Janus Henderson Flexible Bond Fund - Class N Shares | | 7,315,634 | | 13,222,777 | | (1,142,343) | | 18,813,049 |
| | Janus Henderson Global Bond Fund - Class N Shares | | 43,214,541 | | 10,661,086 | | (6,002,292) | | 46,390,269 |
| | Janus Henderson High-Yield Fund - Class N Shares | | 11,572,760 | | 613,673 | | (11,086,813) | | 1,116,081 |
| | Janus Henderson Multi-Sector Income Fund - Class N Shares | | - | | 2,331,626 | | (1,726,203) | | 644,661 |
| | Janus Henderson Short Duration Flexible Bond Fund - Class N Shares | | 11,994,196 | | 4,463,536 | | (10,562,563) | | 5,701,280 |
Money Markets - 0.1% | |
| | Janus Henderson Cash Liquidity Fund LLC, 5.1900%ºº | | - | | 915,802 | | (723,732) | | 192,076 |
| | |
See Notes to Schedule of Investments and Other Information and Notes to Financial Statements. |
| |
Janus Investment Fund | 9 |
Janus Henderson Global Allocation Fund - Moderate
Notes to Schedule of Investments and Other Information
| | |
Bloomberg Global Aggregate Bond Index | Bloomberg Global Aggregate Bond Index is a broad-based measure of the global investment grade fixed-rate debt markets. |
Global Moderate Allocation Index | Global Moderate Allocation Index is an internally-calculated, hypothetical combination of total returns from the MSCI All Country World IndexSM (60%) and the Bloomberg Global Aggregate Bond Index (40%). |
MSCI All Country World IndexSM | MSCI All Country World IndexSM reflects the equity market performance of global developed and emerging markets. |
| | |
LLC | Limited Liability Company |
| | |
* | Non-income producing security. |
| | |
ºº | Rate shown is the 7-day yield as of June 30, 2023. |
| | |
£ | The Fund may invest in certain securities that are considered affiliated companies. As defined by the Investment Company Act of 1940, as amended, an affiliated company is one in which the Fund owns 5% or more of the outstanding voting securities, or a company which is under common ownership or control. |
| | | | | | | | | | | | | |
The following is a summary of the inputs that were used to value the Fund’s investments in securities and other financial instruments as of June 30, 2023. See Notes to Financial Statements for more information. |
| |
Valuation Inputs Summary |
| | | | | | | |
| | | | | Level 2 - | | Level 3 - |
| | | Level 1 - | | Other Significant | | Significant |
| | | Quoted Prices | | Observable Inputs | | Unobservable Inputs |
| | | | | | | |
Assets | | | | | | |
Investments In Securities: | | | | | | |
Investment Companies | | | | | | |
Equity Funds | $ | 114,331,658 | $ | - | $ | - |
Exchange-Traded Funds (ETFs) | | 3,015,825 | | - | | - |
Fixed Income Funds | | 72,665,340 | | - | | - |
Money Markets | | - | | 192,076 | | - |
Total Assets | $ | 190,012,823 | $ | 192,076 | $ | - |
| | | | | | | |
Janus Henderson Global Allocation Fund - Moderate
Statement of Assets and Liabilities
June 30, 2023
| | | | | | | |
| | | | | | |
Assets: | | | | |
| Affiliated investments, at value (cost $186,514,293) | | $ | 190,204,899 | |
| Trustees' deferred compensation | | | 4,833 | |
| Receivables: | | | | |
| | Dividends | | | 420,459 | |
| | Investments sold | | | 167,151 | |
| | Due from adviser | | | 12,405 | |
| | Fund shares sold | | | 9,373 | |
| Other assets | | | 264 | |
Total Assets | | | 190,819,384 | |
Liabilities: | | | | |
| Payables: | | | — | |
| | Investments purchased | | | 419,610 | |
| | Fund shares repurchased | | | 159,976 | |
| | Professional fees | | | 43,045 | |
| | Transfer agent fees and expenses | | | 25,611 | |
| | Advisory fees | | | 8,322 | |
| | Trustees' deferred compensation fees | | | 4,833 | |
| | 12b-1 Distribution and shareholder servicing fees | | | 2,879 | |
| | Custodian fees | | | 1,769 | |
| | Trustees' fees and expenses | | | 1,172 | |
| | Accrued expenses and other payables | | | 24,088 | |
Total Liabilities | | | 691,305 | |
Net Assets | | $ | 190,128,079 | |
Net Assets Consist of: | | | | |
| Capital (par value and paid-in surplus) | | $ | 193,042,321 | |
| Total distributable earnings (loss) | | | (2,914,242) | |
Total Net Assets | | $ | 190,128,079 | |
Net Assets - Class A Shares | | $ | 9,440,730 | |
| Shares Outstanding, $0.01 Par Value (unlimited shares authorized) | | | 836,908 | |
Net Asset Value Per Share(1) | | $ | 11.28 | |
Maximum Offering Price Per Share(2) | | $ | 11.97 | |
Net Assets - Class C Shares | | $ | 789,104 | |
| Shares Outstanding, $0.01 Par Value (unlimited shares authorized) | | | 71,116 | |
Net Asset Value Per Share(1) | | $ | 11.10 | |
Net Assets - Class D Shares | | $ | 164,311,851 | |
| Shares Outstanding, $0.01 Par Value (unlimited shares authorized) | | | 14,447,835 | |
Net Asset Value Per Share | | $ | 11.37 | |
Net Assets - Class I Shares | | $ | 3,929,959 | |
| Shares Outstanding, $0.01 Par Value (unlimited shares authorized) | | | 345,893 | |
Net Asset Value Per Share | | $ | 11.36 | |
Net Assets - Class S Shares | | $ | 443,096 | |
| Shares Outstanding, $0.01 Par Value (unlimited shares authorized) | | | 39,698 | |
Net Asset Value Per Share | | $ | 11.16 | |
Net Assets - Class T Shares | | $ | 11,213,339 | |
| Shares Outstanding, $0.01 Par Value (unlimited shares authorized) | | | 989,433 | |
Net Asset Value Per Share | | $ | 11.33 | |
| |
(1) Redemption price per share may be reduced for any applicable contingent deferred sales charge. (2) Maximum offering price is computed at 100/94.25 of net asset value. |
| | |
See Notes to Financial Statements. |
| |
Janus Investment Fund | 11 |
Janus Henderson Global Allocation Fund - Moderate
Statement of Operations
For the year ended June 30, 2023
| | | | | | |
| | | | | |
Investment Income: | | | |
| Dividends from affiliates | $ | 3,292,623 | |
| Other income | | 204 | |
Total Investment Income | | 3,292,827 | |
Expenses: | | | |
| Advisory fees | | 96,494 | |
| 12b-1 Distribution and shareholder servicing fees: | | | |
| | Class A Shares | | 25,104 | |
| | Class C Shares | | 10,016 | |
| | Class S Shares | | 2,382 | |
| Transfer agent administrative fees and expenses: | | | |
| | Class D Shares | | 193,396 | |
| | Class S Shares | | 2,384 | |
| | Class T Shares | | 30,409 | |
| Transfer agent networking and omnibus fees: | | | |
| | Class A Shares | | 5,951 | |
| | Class C Shares | | 1,102 | |
| | Class I Shares | | 3,432 | |
| Other transfer agent fees and expenses: | | | |
| | Class A Shares | | 734 | |
| | Class C Shares | | 71 | |
| | Class D Shares | | 28,509 | |
| | Class I Shares | | 281 | |
| | Class S Shares | | 39 | |
| | Class T Shares | | 238 | |
| Registration fees | | 99,699 | |
| Professional fees | | 40,827 | |
| Shareholder reports expense | | 34,287 | |
| Custodian fees | | 10,338 | |
| Trustees’ fees and expenses | | 5,266 | |
| Other expenses | | 16,389 | |
Total Expenses | | 607,348 | |
Less: Excess Expense Reimbursement and Waivers | | (77,089) | |
Net Expenses | | 530,259 | |
Net Investment Income/(Loss) | | 2,762,568 | |
Net Realized Gain/(Loss) on Investments: | | | |
| Investments in affiliates | | (7,631,592) | |
| Capital gain distributions from underlying funds | | 1,621,556 | |
Total Net Realized Gain/(Loss) on Investments | | (6,010,036) | |
Change in Unrealized Net Appreciation/Depreciation: | | | |
| Investments in affiliates | | 17,173,033 | |
Total Change in Unrealized Net Appreciation/Depreciation | | 17,173,033 | |
Net Increase/(Decrease) in Net Assets Resulting from Operations | $ | 13,925,565 | |
| | | | | |
| | |
See Notes to Financial Statements. |
| |
12 | JUNE 30, 2023 |
Janus Henderson Global Allocation Fund - Moderate
Statements of Changes in Net Assets
| | | | | | | | | |
| | | | | | | | |
| | | Year ended
June 30, 2023 | | Year ended
June 30, 2022 | |
| | | | | | | | | |
Operations: | | | | | | |
| Net investment income/(loss) | $ | 2,762,568 | | $ | 8,210,435 | |
| Net realized gain/(loss) on investments | | (6,010,036) | | | 7,144,074 | |
| Change in unrealized net appreciation/depreciation | | 17,173,033 | | | (59,485,428) | |
Net Increase/(Decrease) in Net Assets Resulting from Operations | | 13,925,565 | | | (44,130,919) | |
Dividends and Distributions to Shareholders: | | | | | | |
| | Class A Shares | | (242,632) | | | (1,713,006) | |
| | Class C Shares | | (20,118) | | | (264,396) | |
| | Class D Shares | | (4,624,841) | | | (24,712,793) | |
| | Class I Shares | | (122,537) | | | (1,956,536) | |
| | Class S Shares | | (26,980) | | | (165,949) | |
| | Class T Shares | | (324,596) | | | (1,949,321) | |
Net Decrease from Dividends and Distributions to Shareholders | | (5,361,704) | | | (30,762,001) | |
Capital Share Transactions: | | | | | | |
| | Class A Shares | | (2,434,840) | | | 1,609,701 | |
| | Class C Shares | | (653,691) | | | (820,511) | |
| | Class D Shares | | (7,638,439) | | | 11,777,201 | |
| | Class I Shares | | (767,425) | | | 1,728,132 | |
| | Class S Shares | | (664,740) | | | 88,622 | |
| | Class T Shares | | (2,468,613) | | | 1,120,898 | |
Net Increase/(Decrease) from Capital Share Transactions | | (14,627,748) | | | 15,504,043 | |
Net Increase/(Decrease) in Net Assets | | (6,063,887) | | | (59,388,877) | |
Net Assets: | | | | | | |
| Beginning of period | | 196,191,966 | | | 255,580,843 | |
| End of period | $ | 190,128,079 | | $ | 196,191,966 | |
| | | | | | | | |
| | |
See Notes to Financial Statements. |
| |
Janus Investment Fund | 13 |
Janus Henderson Global Allocation Fund - Moderate
Financial Highlights
| | | | | | | | | | | | | | | | | | | |
Class A Shares | | | | | | | | | | | | | | | |
For a share outstanding during the year ended June 30 | | 2023 | | | 2022 | | | 2021 | | | 2020 | | | 2019 | |
| Net Asset Value, Beginning of Period | | $10.79 | | | $14.88 | | | $12.29 | | | $12.90 | | | $13.07 | |
| Income/(Loss) from Investment Operations: | | | | | | | | | | | | | | | |
| | Net investment income/(loss)(1) | | 0.14 | | | 0.43 | | | 0.22 | | | 0.16 | | | 0.09 | |
| | Net realized and unrealized gain/(loss) | | 0.64 | | | (2.77) | | | 2.98 | | | (0.06) | | | 0.28 | |
| Total from Investment Operations | | 0.78 | | | (2.34) | | | 3.20 | | | 0.10 | | | 0.37 | |
| Less Dividends and Distributions: | | | | | | | | | | | | | | | |
| | Dividends (from net investment income) | | (0.06) | | | (0.44) | | | (0.22) | | | (0.14) | | | (0.10) | |
| | Distributions (from capital gains) | | (0.23) | | | (1.31) | | | (0.39) | | | (0.57) | | | (0.44) | |
| Total Dividends and Distributions | | (0.29) | | | (1.75) | | | (0.61) | | | (0.71) | | | (0.54) | |
| Net Asset Value, End of Period | | $11.28 | | | $10.79 | | | $14.88 | | | $12.29 | | | $12.90 | |
| Total Return* | | 7.37% | | | (17.84)% | | | 26.39% | | | 0.60% | | | 3.32% | |
| Net Assets, End of Period (in thousands) | | $9,441 | | | $11,371 | | | $14,023 | | | $8,165 | | | $9,529 | |
| Average Net Assets for the Period (in thousands) | | $10,004 | | | $13,650 | | | $11,150 | | | $9,063 | | | $9,899 | |
| Ratios to Average Net Assets**: | | | | | | | | | | | | | | | |
| | Ratio of Gross Expenses(2) | | 0.46% | | | 0.43% | | | 0.43% | | | 0.41% | | | 0.45% | |
| | Ratio of Net Expenses (After Waivers and Expense Offsets)(2) | | 0.44% | | | 0.43% | | | 0.43% | | | 0.41% | | | 0.45% | |
| | Ratio of Net Investment Income/(Loss)(2) | | 1.24% | | | 3.21% | | | 1.56% | | | 1.29% | | | 0.68% | |
| Portfolio Turnover Rate | | 36% | | | 43% | | | 41% | | | 51% | | | 6% | |
| | | | | | | | | | | | | | | | | | | |
| |
* Total return includes adjustments in accordance with generally accepted accounting principles required at the year or period end and are not annualized for periods of less than one full year. ** Annualized for periods of less than one full year. (1) Per share amounts are calculated based on average shares outstanding during the year or period. (2) Ratios do not include indirect expenses of the underlying funds and/or investment companies in which the Fund invests. |
| | |
See Notes to Financial Statements. |
| |
14 | JUNE 30, 2023 |
Janus Henderson Global Allocation Fund - Moderate
Financial Highlights
| | | | | | | | | | | | | | | | | | | |
Class C Shares | | | | | | | | | | | | | | | |
For a share outstanding during the year ended June 30 | | 2023 | | | 2022 | | | 2021 | | | 2020 | | | 2019 | |
| Net Asset Value, Beginning of Period | | $10.64 | | | $14.66 | | | $12.11 | | | $12.70 | | | $12.86 | |
| Income/(Loss) from Investment Operations: | | | | | | | | | | | | | | | |
| | Net investment income/(loss)(1) | | 0.06 | | | 0.32 | | | 0.16 | | | 0.06 | | | 0.01 | |
| | Net realized and unrealized gain/(loss) | | 0.63 | | | (2.72) | | | 2.88 | | | (0.05) | | | 0.27 | |
| Total from Investment Operations | | 0.69 | | | (2.40) | | | 3.04 | | | 0.01 | | | 0.28 | |
| Less Dividends and Distributions: | | | | | | | | | | | | | | | |
| | Dividends (from net investment income) | | — | | | (0.31) | | | (0.10) | | | (0.03) | | | —(2) | |
| | Distributions (from capital gains) | | (0.23) | | | (1.31) | | | (0.39) | | | (0.57) | | | (0.44) | |
| Total Dividends and Distributions | | (0.23) | | | (1.62) | | | (0.49) | | | (0.60) | | | (0.44) | |
| Net Asset Value, End of Period | | $11.10 | | | $10.64 | | | $14.66 | | | $12.11 | | | $12.70 | |
| Total Return* | | 6.61% | | | (18.40)% | | | 25.39% | | | (0.06)% | | | 2.57% | |
| Net Assets, End of Period (in thousands) | | $789 | | | $1,387 | | | $2,854 | | | $4,381 | | | $6,211 | |
| Average Net Assets for the Period (in thousands) | | $1,088 | | | $2,274 | | | $3,487 | | | $5,235 | | | $6,648 | |
| Ratios to Average Net Assets**: | | | | | | | | | | | | | | | |
| | Ratio of Gross Expenses(3) | | 1.17% | | | 1.19% | | | 1.12% | | | 1.18% | | | 1.14% | |
| | Ratio of Net Expenses (After Waivers and Expense Offsets)(3) | | 1.15% | | | 1.19% | | | 1.11% | | | 1.18% | | | 1.14% | |
| | Ratio of Net Investment Income/(Loss)(3) | | 0.56% | | | 2.42% | | | 1.17% | | | 0.45% | | | 0.08% | |
| Portfolio Turnover Rate | | 36% | | | 43% | | | 41% | | | 51% | | | 6% | |
| | | | | | | | | | | | | | | | | | | |
| |
* Total return includes adjustments in accordance with generally accepted accounting principles required at the year or period end and are not annualized for periods of less than one full year. ** Annualized for periods of less than one full year. (1) Per share amounts are calculated based on average shares outstanding during the year or period. (2) Less than $0.005 on a per share basis. (3) Ratios do not include indirect expenses of the underlying funds and/or investment companies in which the Fund invests. |
| | |
See Notes to Financial Statements. |
| |
| | 15 |
Janus Henderson Global Allocation Fund - Moderate
Financial Highlights
| | | | | | | | | | | | | | | | | | | |
Class D Shares | | | | | | | | | | | | | | | |
For a share outstanding during the year ended June 30 | | 2023 | | | 2022 | | | 2021 | | | 2020 | | | 2019 | |
| Net Asset Value, Beginning of Period | | $10.88 | | | $14.99 | | | $12.38 | | | $12.98 | | | $13.16 | |
| Income/(Loss) from Investment Operations: | | | | | | | | | | | | | | | |
| | Net investment income/(loss)(1) | | 0.16 | | | 0.45 | | | 0.26 | | | 0.18 | | | 0.11 | |
| | Net realized and unrealized gain/(loss) | | 0.65 | | | (2.79) | | | 2.98 | | | (0.05) | | | 0.28 | |
| Total from Investment Operations | | 0.81 | | | (2.34) | | | 3.24 | | | 0.13 | | | 0.39 | |
| Less Dividends and Distributions: | | | | | | | | | | | | | | | |
| | Dividends (from net investment income) | | (0.09) | | | (0.46) | | | (0.24) | | | (0.16) | | | (0.13) | |
| | Distributions (from capital gains) | | (0.23) | | | (1.31) | | | (0.39) | | | (0.57) | | | (0.44) | |
| Total Dividends and Distributions | | (0.32) | | | (1.77) | | | (0.63) | | | (0.73) | | | (0.57) | |
| Net Asset Value, End of Period | | $11.37 | | | $10.88 | | | $14.99 | | | $12.38 | | | $12.98 | |
| Total Return* | | 7.59% | | | (17.71)% | | | 26.53% | | | 0.84% | | | 3.44% | |
| Net Assets, End of Period (in thousands) | | $164,312 | | | $164,692 | | | $213,724 | | | $178,202 | | | $196,873 | |
| Average Net Assets for the Period (in thousands) | | $163,560 | | | $199,211 | | | $197,314 | | | $187,271 | | | $199,360 | |
| Ratios to Average Net Assets**: | | | | | | | | | | | | | | | |
| | Ratio of Gross Expenses(2) | | 0.30% | | | 0.26% | | | 0.27% | | | 0.27% | | | 0.29% | |
| | Ratio of Net Expenses (After Waivers and Expense Offsets)(2) | | 0.26% | | | 0.25% | | | 0.25% | | | 0.26% | | | 0.26% | |
| | Ratio of Net Investment Income/(Loss)(2) | | 1.46% | | | 3.35% | | | 1.84% | | | 1.40% | | | 0.88% | |
| Portfolio Turnover Rate | | 36% | | | 43% | | | 41% | | | 51% | | | 6% | |
| | | | | | | | | | | | | | | | | | | |
| |
* Total return includes adjustments in accordance with generally accepted accounting principles required at the year or period end and are not annualized for periods of less than one full year. ** Annualized for periods of less than one full year. (1) Per share amounts are calculated based on average shares outstanding during the year or period. (2) Ratios do not include indirect expenses of the underlying funds and/or investment companies in which the Fund invests. |
| | |
See Notes to Financial Statements. |
| |
16 | JUNE 30, 2023 |
Janus Henderson Global Allocation Fund - Moderate
Financial Highlights
| | | | | | | | | | | | | | | | | | | |
Class I Shares | | | | | | | | | | | | | | | |
For a share outstanding during the year ended June 30 | | 2023 | | | 2022 | | | 2021 | | | 2020 | | | 2019 | |
| Net Asset Value, Beginning of Period | | $10.86 | | | $14.98 | | | $12.37 | | | $12.97 | | | $13.15 | |
| Income/(Loss) from Investment Operations: | | | | | | | | | | | | | | | |
| | Net investment income/(loss)(1) | | 0.17 | | | 0.53 | | | 0.25 | | | 0.19 | | | 0.11 | |
| | Net realized and unrealized gain/(loss) | | 0.64 | | | (2.86) | | | 3.00 | | | (0.05) | | | 0.29 | |
| Total from Investment Operations | | 0.81 | | | (2.33) | | | 3.25 | | | 0.14 | | | 0.40 | |
| Less Dividends and Distributions: | | | | | | | | | | | | | | | |
| | Dividends (from net investment income) | | (0.08) | | | (0.48) | | | (0.25) | | | (0.17) | | | (0.14) | |
| | Distributions (from capital gains) | | (0.23) | | | (1.31) | | | (0.39) | | | (0.57) | | | (0.44) | |
| Total Dividends and Distributions | | (0.31) | | | (1.79) | | | (0.64) | | | (0.74) | | | (0.58) | |
| Net Asset Value, End of Period | | $11.36 | | | $10.86 | | | $14.98 | | | $12.37 | | | $12.97 | |
| Total Return* | | 7.65% | | | (17.72)% | | | 26.62% | | | 0.88% | | | 3.53% | |
| Net Assets, End of Period (in thousands) | | $3,930 | | | $4,528 | | | $6,744 | | | $4,551 | | | $5,533 | |
| Average Net Assets for the Period (in thousands) | | $4,247 | | | $12,862 | | | $5,660 | | | $4,907 | | | $5,905 | |
| Ratios to Average Net Assets**: | | | | | | | | | | | | | | | |
| | Ratio of Gross Expenses(2) | | 0.23% | | | 0.22% | | | 0.21% | | | 0.21% | | | 0.22% | |
| | Ratio of Net Expenses (After Waivers and Expense Offsets)(2) | | 0.21% | | | 0.22% | | | 0.21% | | | 0.21% | | | 0.22% | |
| | Ratio of Net Investment Income/(Loss)(2) | | 1.55% | | | 3.87% | | | 1.81% | | | 1.47% | | | 0.85% | |
�� | Portfolio Turnover Rate | | 36% | | | 43% | | | 41% | | | 51% | | | 6% | |
| | | | | | | | | | | | | | | | | | | |
| |
* Total return includes adjustments in accordance with generally accepted accounting principles required at the year or period end and are not annualized for periods of less than one full year. ** Annualized for periods of less than one full year. (1) Per share amounts are calculated based on average shares outstanding during the year or period. (2) Ratios do not include indirect expenses of the underlying funds and/or investment companies in which the Fund invests. |
| | |
See Notes to Financial Statements. |
| |
| | 17 |
Janus Henderson Global Allocation Fund - Moderate
Financial Highlights
| | | | | | | | | | | | | | | | | | | |
Class S Shares | | | | | | | | | | | | | | | |
For a share outstanding during the year ended June 30 | | 2023 | | | 2022 | | | 2021 | | | 2020 | | | 2019 | |
| Net Asset Value, Beginning of Period | | $10.69 | | | $14.75 | | | $12.19 | | | $12.79 | | | $12.97 | |
| Income/(Loss) from Investment Operations: | | | | | | | | | | | | | | | |
| | Net investment income/(loss)(1) | | 0.14 | | | 0.40 | | | 0.21 | | | 0.15 | | | 0.06 | |
| | Net realized and unrealized gain/(loss) | | 0.60 | | | (2.74) | | | 2.93 | | | (0.07) | | | 0.29 | |
| Total from Investment Operations | | 0.74 | | | (2.34) | | | 3.14 | | | 0.08 | | | 0.35 | |
| Less Dividends and Distributions: | | | | | | | | | | | | | | | |
| | Dividends (from net investment income) | | (0.04) | | | (0.41) | | | (0.19) | | | (0.11) | | | (0.09) | |
| | Distributions (from capital gains) | | (0.23) | | | (1.31) | | | (0.39) | | | (0.57) | | | (0.44) | |
| Total Dividends and Distributions | | (0.27) | | | (1.72) | | | (0.58) | | | (0.68) | | | (0.53) | |
| Net Asset Value, End of Period | | $11.16 | | | $10.69 | | | $14.75 | | | $12.19 | | | $12.79 | |
| Total Return* | | 7.11% | | | (17.97)% | | | 26.03% | | | 0.47% | | | 3.14% | |
| Net Assets, End of Period (in thousands) | | $443 | | | $1,066 | | | $1,385 | | | $1,247 | | | $2,217 | |
| Average Net Assets for the Period (in thousands) | | $951 | | | $1,322 | | | $1,358 | | | $1,929 | | | $2,482 | |
| Ratios to Average Net Assets**: | | | | | | | | | | | | | | | |
| | Ratio of Gross Expenses(2) | | 0.65% | | | 0.62% | | | 0.62% | | | 0.62% | | | 0.60% | |
| | Ratio of Net Expenses (After Waivers and Expense Offsets)(2) | | 0.63% | | | 0.62% | | | 0.62% | | | 0.62% | | | 0.60% | |
| | Ratio of Net Investment Income/(Loss)(2) | | 1.30% | | | 3.03% | | | 1.51% | | | 1.17% | | | 0.51% | |
| Portfolio Turnover Rate | | 36% | | | 43% | | | 41% | | | 51% | | | 6% | |
| | | | | | | | | | | | | | | | | | | |
| |
* Total return includes adjustments in accordance with generally accepted accounting principles required at the year or period end and are not annualized for periods of less than one full year. ** Annualized for periods of less than one full year. (1) Per share amounts are calculated based on average shares outstanding during the year or period. (2) Ratios do not include indirect expenses of the underlying funds and/or investment companies in which the Fund invests. |
| | |
See Notes to Financial Statements. |
| |
18 | JUNE 30, 2023 |
Janus Henderson Global Allocation Fund - Moderate
Financial Highlights
| | | | | | | | | | | | | | | | | | | |
Class T Shares | | | | | | | | | | | | | | | |
For a share outstanding during the year ended June 30 | | 2023 | | | 2022 | | | 2021 | | | 2020 | | | 2019 | |
| Net Asset Value, Beginning of Period | | $10.84 | | | $14.94 | | | $12.34 | | | $12.94 | | | $13.12 | |
| Income/(Loss) from Investment Operations: | | | | | | | | | | | | | | | |
| | Net investment income/(loss)(1) | | 0.15 | | | 0.44 | | | 0.24 | | | 0.16 | | | 0.10 | |
| | Net realized and unrealized gain/(loss) | | 0.64 | | | (2.78) | | | 2.98 | | | (0.04) | | | 0.28 | |
| Total from Investment Operations | | 0.79 | | | (2.34) | | | 3.22 | | | 0.12 | | | 0.38 | |
| Less Dividends and Distributions: | | | | | | | | | | | | | | | |
| | Dividends (from net investment income) | | (0.07) | | | (0.45) | | | (0.23) | | | (0.15) | | | (0.12) | |
| | Distributions (from capital gains) | | (0.23) | | | (1.31) | | | (0.39) | | | (0.57) | | | (0.44) | |
| Total Dividends and Distributions | | (0.30) | | | (1.76) | | | (0.62) | | | (0.72) | | | (0.56) | |
| Net Asset Value, End of Period | | $11.33 | | | $10.84 | | | $14.94 | | | $12.34 | | | $12.94 | |
| Total Return* | | 7.51% | | | (17.77)% | | | 26.43% | | | 0.76% | | | 3.38% | |
| Net Assets, End of Period (in thousands) | | $11,213 | | | $13,148 | | | $16,849 | | | $13,981 | | | $16,966 | |
| Average Net Assets for the Period (in thousands) | | $12,102 | | | $15,737 | | | $15,516 | | | $15,728 | | | $17,106 | |
| Ratios to Average Net Assets**: | | | | | | | | | | | | | | | |
| | Ratio of Gross Expenses(2) | | 0.40% | | | 0.37% | | | 0.37% | | | 0.37% | | | 0.38% | |
| | Ratio of Net Expenses (After Waivers and Expense Offsets)(2) | | 0.33% | | | 0.33% | | | 0.32% | | | 0.34% | | | 0.34% | |
| | Ratio of Net Investment Income/(Loss)(2) | | 1.38% | | | 3.27% | | | 1.76% | | | 1.29% | | | 0.79% | |
| Portfolio Turnover Rate | | 36% | | | 43% | | | 41% | | | 51% | | | 6% | |
| | | | | | | | | | | | | | | | | | | |
| |
* Total return includes adjustments in accordance with generally accepted accounting principles required at the year or period end and are not annualized for periods of less than one full year. ** Annualized for periods of less than one full year. (1) Per share amounts are calculated based on average shares outstanding during the year or period. (2) Ratios do not include indirect expenses of the underlying funds and/or investment companies in which the Fund invests. |
| | |
See Notes to Financial Statements. |
| |
| | 19 |
Janus Henderson Global Allocation Fund - Moderate
Notes to Financial Statements
1. Organization and Significant Accounting Policies
Janus Henderson Global Allocation Fund - Moderate (the “Fund”) is a series of Janus Investment Fund (the “Trust”), which is organized as a Massachusetts business trust and is registered under the Investment Company Act of 1940, as amended (the “1940 Act”), as an open-end management investment company, and therefore has applied the specialized accounting and reporting guidance in Financial Accounting Standards Board (“FASB”) Accounting Standards Codification (“ASC”) Topic 946. The Fund operates as a “fund of funds,” meaning substantially all of the Fund’s assets will be invested in other Janus Henderson mutual funds and exchange-traded funds ("ETFs") (the “underlying funds”). The Trust offers 39 funds, each of which offers multiple share classes, with differing investment objectives and policies. The Fund seeks total return through growth of capital and income. The Fund is classified as diversified, as defined in the 1940 Act. Janus Henderson Investors US LLC is the investment adviser (the “Adviser”) to the Fund.
The Fund offers multiple classes of shares in order to meet the needs of various types of investors. Each class represents an interest in the same portfolio of investments. Certain financial intermediaries may not offer all classes of shares.
Shareholders, including other funds, individuals, accounts, as well as the Fund’s portfolio manager(s) and/or investment personnel, may from time to time own (beneficially or of record) a significant percentage of the Fund’s Shares and can be considered to “control” the Fund when that ownership exceeds 25% of the Fund’s assets (and which may differ from control as determined in accordance with United States of America generally accepted accounting principles ("US GAAP")).
Class A Shares are offered through financial intermediary platforms including, but not limited to, traditional brokerage platforms, mutual fund wrap fee programs, bank trust platforms, and retirement platforms.
Class C Shares are offered through financial intermediary platforms including, but not limited to, traditional brokerage platforms, mutual fund wrap fee programs, and bank trust platforms.
Class C Shares are closed to investments by new employer-sponsored retirement plans and existing employer-sponsored retirement plans are no longer able to make additional purchases or exchanges into Class C Shares.
The Fund currently implements an automatic conversion feature pursuant to which Class C Shares that have been held for eight years are automatically converted to Class A Shares without the imposition of any sales charge, fee or other charge. The conversion will generally occur no later than ten business days in the month following the month of the eighth anniversary of the date of purchase. Class C Shares purchased through the reinvestment of dividends and other distributions on Class C Shares will convert to Class A Shares at the same time as the original Class C Shares with respect to which they were purchased. For Class C Shares held in omnibus accounts on intermediary platforms, the Fund relies on these intermediaries to implement this conversion feature. Your financial intermediary may have separate policies and procedures as to when and how Class C Shares may be converted to Class A Shares.
Effective July 6, 2020, Class D Shares are available to new investors, subject to any closed fund policies for a Fund, as applicable. Previously, Class D Shares were only available to investors who already had a direct account with the Janus Henderson funds; immediate family members or members of the same household of an eligible individual investor; and existing beneficial owners of sole proprietorships or partnerships that hold accounts directly with the Janus Henderson funds.
Class I Shares are available through certain financial intermediary platforms including, but not limited to, mutual fund wrap fee programs, managed account programs, asset allocation programs, bank trust platforms, as well as certain retirement platforms. Class I Shares are also available to certain direct institutional investors including, but not limited to, corporations, certain retirement plans, public plans, and foundations/endowments, who established Class I Share accounts before August 4, 2017.
Class S Shares are offered through financial intermediary platforms including, but not limited to, retirement platforms and asset allocation, mutual fund wrap, or other discretionary or nondiscretionary fee-based investment advisory programs. In addition, Class S Shares may be available through certain financial intermediaries who have an agreement with the Adviser or its affiliates to offer Class S Shares on their supermarket platforms.
Janus Henderson Global Allocation Fund - Moderate
Notes to Financial Statements
Class T Shares are available through certain financial intermediary platforms including, but not limited to, mutual fund wrap fee programs, managed account programs, asset allocation programs, bank trust platforms, as well as certain retirement platforms. In addition, Class T Shares may be available through certain financial intermediaries who have an agreement with the Adviser or its affiliates to offer Class T Shares on their supermarket platforms.
Underlying Funds
The Fund invests in a variety of underlying funds to pursue a target allocation of equity investments, fixed-income securities, and alternative investments and may also invest in money market instruments or cash/cash equivalents. The Fund has a target allocation, which is how the Fund's investments generally will be allocated among the major asset classes over the long term, as well as normal ranges, under normal market conditions, within which the Fund's asset class allocations generally will vary over short-term periods. The Fund's long-term expected average asset allocation is as follows: 55% to equity investments, 35% to fixed-income securities and money market instruments, and 10% to alternative investments. Additional details and descriptions of the investment objectives and strategies of each of the underlying funds are available in the Fund’s and underlying funds’ prospectuses available at janushenderson.com. The Trustees of the underlying funds may change the investment objectives or strategies of the underlying funds at any time without prior notice to the Fund’s shareholders.
The following accounting policies have been followed by the Fund and are in conformity with US GAAP.
Investment Valuation
The Fund’s net asset value (“NAV”) is calculated based upon the NAV of each of the underlying funds in which the Fund invests on the day of valuation. The NAV for each class of the underlying funds is computed by dividing the total value of securities and other assets allocated to the class, less liabilities allocated to that class, by the total number of shares outstanding for the class.
Valuation Inputs Summary
FASB ASC 820, Fair Value Measurements and Disclosures (“ASC 820”), defines fair value, establishes a framework for measuring fair value, and expands disclosure requirements regarding fair value measurements. This standard emphasizes that fair value is a market-based measurement that should be determined based on the assumptions that market participants would use in pricing an asset or liability and establishes a hierarchy that prioritizes inputs to valuation techniques used to measure fair value. These inputs are summarized into three broad levels:
Level 1 – Unadjusted quoted prices in active markets the Fund has the ability to access for identical assets or liabilities.
Level 2 – Observable inputs other than unadjusted quoted prices included in Level 1 that are observable for the asset or liability either directly or indirectly. These inputs may include quoted prices for the identical instrument on an inactive market, prices for similar instruments, interest rates, prepayment speeds, credit risk, yield curves, default rates and similar data.
Level 3 – Unobservable inputs for the asset or liability to the extent that relevant observable inputs are not available, representing the Fund’s own assumptions about the assumptions that a market participant would use in valuing the asset or liability, and that would be based on the best information available.
The Fund classifies each of its investments in underlying funds as Level 1, without consideration as to the classification level of the specific investments held by the underlying funds. There have been no significant changes in valuation techniques used in valuing any such positions held by the Fund since the beginning of the fiscal year.
The inputs or methodology used for fair valuing securities are not necessarily an indication of the risk associated with investing in those securities. The summary of inputs used as of June 30, 2023 to fair value the Fund’s investments in securities and other financial instruments is included in the “Valuation Inputs Summary” in the Notes to Schedule of Investments.
Investment Transactions and Investment Income
Investment transactions are accounted for as of the date purchased or sold (trade date). Dividend income is recorded on the ex-dividend date. Certain dividends from foreign securities held by the underlying funds will be recorded as soon as the Fund is informed of the dividend, if such information is obtained subsequent to the ex-dividend date. Dividends from foreign securities may be subject to withholding taxes in foreign jurisdictions. Non-cash dividends, if any, are recorded on the ex-dividend date at fair value. Interest income is recorded daily on the accrual basis and includes
Janus Henderson Global Allocation Fund - Moderate
Notes to Financial Statements
amortization of premiums and accretion of discounts. The Fund classifies gains and losses on prepayments received as an adjustment to interest income. Debt securities may be placed in non-accrual status and related interest income may be reduced by stopping current accruals and writing off interest receivables when collection of all or a portion of interest has become doubtful. Gains and losses are determined on the identified cost basis, which is the same basis used for federal income tax purposes. Income, as well as gains and losses, both realized and unrealized, are allocated daily to each class of shares based upon the ratio of net assets represented by each class as a percentage of total net assets.
Dividend distributions received from the underlying funds are recorded on the ex-dividend date. Upon receipt of the notification from an underlying fund, and subsequent to the ex-dividend date, a part or all of the dividend income originally recorded by the Fund may be reclassified as a tax return of capital by reducing the cost basis of the underlying fund and/or increasing the realized gain on sales of investments in the underlying fund.
Expenses
The Fund bears expenses incurred specifically on its behalf. Additionally, the Fund, as a shareholder in the underlying funds, will also indirectly bear its pro rata share of the expenses incurred by the underlying funds. Each class of shares bears a portion of general expenses, which are allocated daily to each class of shares based upon the ratio of net assets represented by each class as a percentage of total net assets. Expenses directly attributable to a specific class of shares are charged against the operations of such class.
Estimates
The preparation of financial statements in conformity with US GAAP requires management to make estimates and assumptions that affect the reported amount of assets and liabilities and disclosure of contingent assets and liabilities at the date of the financial statements, and the reported amounts of income and expenses during the reporting period. Actual results could differ from those estimates.
Indemnifications
In the normal course of business, the Fund may enter into contracts that contain provisions for indemnification of other parties against certain potential liabilities. The Fund’s maximum exposure under these arrangements is unknown, and would involve future claims that may be made against the Fund that have not yet occurred. Currently, the risk of material loss from such claims is considered remote.
Dividends and Distributions
The Fund generally declares and distributes dividends of net investment income and realized capital gains (if any) annually. The Fund may treat a portion of the amount paid to redeem shares as a distribution of investment company taxable income and realized capital gains that are reflected in the net asset value. This practice, commonly referred to as “equalization,” has no effect on the redeeming shareholder or a Fund’s total return, but may reduce the amounts that would otherwise be required to be paid as taxable dividends to the remaining shareholders. It is possible that the Internal Revenue Service (IRS) could challenge the Fund's equalization methodology or calculations, and any such challenge could result in additional tax, interest, or penalties to be paid by the Fund.
The underlying funds may make certain investments in real estate investment trusts (“REITs”) which pay dividends to their shareholders based upon funds available from operations. It is quite common for these dividends to exceed the REITs’ taxable earnings and profits, resulting in the excess portion of such dividends being designated as a return of capital. If the underlying funds distribute such amounts, such distributions could constitute a return of capital to shareholders for federal income tax purposes.
Federal Income Taxes
The Fund intends to continue to qualify as a regulated investment company and distribute all of its taxable income in accordance with the requirements of Subchapter M of the Internal Revenue Code. Management has analyzed the Fund’s tax positions taken for all open federal income tax years, generally a three-year period, and has concluded that no provision for federal income tax is required in the Fund’s financial statements. The Fund is not aware of any tax positions for which it is reasonably possible that the total amounts of unrecognized tax benefits will significantly change in the next twelve months.
2. Investment Advisory Agreements and Other Transactions with Affiliates
The Fund pays the Adviser an investment advisory fee which is calculated daily and paid monthly. The Fund’s contractual investment advisory fee rate (expressed as an annual rate) is 0.05% of its average daily net assets.
Janus Henderson Global Allocation Fund - Moderate
Notes to Financial Statements
The Adviser has contractually agreed to waive the investment advisory fee and/or reimburse operating expenses to the extent that the Fund’s total annual fund operating expenses, excluding any expenses of an underlying fund (acquired fund fees and expenses), the fees payable pursuant to a Rule 12b-1 plan, shareholder servicing fees, such as transfer agency fees (including out-of-pocket costs), administrative services fees and any networking/omnibus payable by any share class, brokerage commissions, interest, dividends, taxes, and extraordinary expenses, exceed the annual rate of 0.12% of the Fund’s average daily net assets. The Adviser has agreed to continue the waivers for at least a one-year period commencing October 28, 2022. If applicable, amounts waived and/or reimbursed to the Fund by the Adviser are disclosed as “Excess Expense Reimbursement and Waivers” on the Statement of Operations.
The Adviser serves as administrator to the Fund pursuant to an administration agreement, and is authorized to perform, or cause others to perform, the administration services necessary for the operation of the Fund. The Adviser does not receive compensation for serving as administrator and it bears the expenses related to operation of the Fund, such as, but not limited to fund accounting and tax services; shareholder servicing; and preparation of various documents filed with the SEC. The Fund bears costs related to any compensation, fees, or reimbursements paid to Trustees who are independent of the Adviser; fees and expenses of counsel to the Independent Trustees; fees and expenses of consultants to the Fund; custody fees; audit expenses; brokerage commissions and all other expenses in connection with execution of portfolio transactions; blue sky registration costs; interest; all federal, state and local taxes (including stamp, excise, income, and franchise taxes); expenses of shareholder meetings, including the preparation, printing, and distribution of proxy statements, notices, and reports to shareholders; expenses of printing and mailing to existing shareholders prospectuses, statements of additional information, shareholder reports, and other materials required to be mailed to shareholders by federal or state laws or regulations; transfer agency fees and expenses payable pursuant to a transfer agency agreement between the Trust and the Transfer Agent on behalf of the Fund; any litigation; and other extraordinary expenses. In addition, some expenses related to compensation payable to the Fund's Chief Compliance Officer and compliance staff are shared with the Fund. Total compensation of $343,237 was paid to the Chief Compliance Officer and certain compliance staff by the Trust during the year ended June 30, 2023. The Fund's portion is reported as part of “Other expenses” on the Statement of Operations.
Janus Henderson Services US LLC (the “Transfer Agent”), a wholly-owned subsidiary of the Adviser, is the Fund’s and the underlying funds’ transfer agent. The Transfer Agent provides or arranges for the provision of shareholder services including, but not limited to, recordkeeping, subaccounting, answering inquiries regarding accounts, order processing, transaction confirmations, the mailing of prospectuses and shareholder reports, and other shareholder services provided to or on behalf of shareholders. These amounts are disclosed as “Transfer agent administrative fees and expenses” on the Statement of Operations.
Class D Shares of the Fund pay the Transfer Agent an annual administrative services fee based on the average daily net assets of Class D Shares as detailed below.
| | |
Average Daily Net Assets of Class D Shares of the Janus Henderson funds | Administrative Services Fee |
Under $40 billion | 0.12% |
$40 billion – $49.9 billion | 0.10% |
Over $49.9 billion | 0.08% |
During the reporting period, the administrative services fee rate was 0.12%.
The Transfer Agent receives an administrative services fee at an annual rate of up to 0.25% of the average daily net assets of the Fund’s Class S Shares and Class T Shares for providing or procuring administrative services to investors in Class S Shares and Class T Shares of the Fund. The Transfer Agent expects to use all or a significant portion of this fee to compensate retirement plan service providers, broker-dealers, bank trust departments, financial advisors, and other financial intermediaries for providing these services. The Transfer Agent may keep certain amounts retained for reimbursement of out-of-pocket costs incurred for servicing clients of Class S Shares and Class T Shares.
Shareholder Services provided by these financial intermediaries may include, but are not limited to, recordkeeping, subaccounting, order processing, providing order confirmations, periodic statements, forwarding prospectuses, shareholder reports, and other materials to existing customers, answering inquiries regarding accounts, and other administrative services. Order processing includes the submission of transactions through the National Securities Clearing Corporation (“NSCC”) or similar systems, or those processed on a manual basis with the Adviser. For all share classes, the Transfer Agent also seeks reimbursement for costs it incurs as transfer agent and for providing servicing.
Janus Henderson Global Allocation Fund - Moderate
Notes to Financial Statements
Certain, but not all, intermediaries may charge administrative fees to investors in Class A Shares, Class C Shares, and Class I Shares for administrative services provided on behalf of such investors. These administrative fees are paid by the Class A Shares, Class C Shares, and Class I Shares of the Fund to the Transfer Agent, which uses such fees to reimburse intermediaries. Consistent with the Transfer Agency Agreement between the Transfer Agent and the Fund, the Transfer Agent may negotiate the level, structure, and/or terms of the administrative fees with intermediaries requiring such fees on behalf of the Fund. The Adviser and its affiliates benefit from an increase in assets that may result from such relationships. The Adviser has agreed to limit these fees up to 0.20% for Class A Shares and Class C Shares, and up to 0.15% for Class I Shares on an annual basis based on the daily net assets of each share class. Such limits are subject to change by the Trustees in the future. These amounts are disclosed as “Transfer agent networking and omnibus fees” on the Statement of Operations.
The Transfer Agent is not compensated for its services related to the shares, except for out-of-pocket costs, although the Transfer Agent is compensated for its services related to Fund’s Class D Shares. These amounts are disclosed as “Other transfer agent fees and expenses” on the Statement of Operations.
Under a distribution and shareholder servicing plan (the “Plan”) adopted in accordance with Rule 12b-1 under the 1940 Act, the Fund pays the Trust’s distributor, Janus Henderson Distributors US LLC (the “Distributor”), a wholly-owned subsidiary of the Adviser, a fee for the sale and distribution and/or shareholder servicing of the Shares at an annual rate of up to 0.25% of the Class A Shares’ average daily net assets, of up to 1.00% of the Class C Shares’ average daily net assets, and of up to 0.25% of the Class S Shares’ average daily net assets. Under the terms of the Plan, the Trust is authorized to make payments to the Distributor for remittance to retirement plan service providers, broker-dealers, bank trust departments, financial advisors, and other financial intermediaries, as compensation for distribution and/or shareholder services performed by such entities for their customers who are investors in the Fund. These amounts are disclosed as “12b-1 Distribution and shareholder servicing fees” on the Statement of Operations.
Class A Shares include a 5.75% upfront sales charge of the offering price of the Fund. The sales charge is allocated between the Distributor and financial intermediaries. During the year ended June 30, 2023, the Distributor retained upfront sales charges of $1,692.
A contingent deferred sales charge (“CDSC”) of 1.00% will be deducted with respect to Class A Shares purchased without a sales load and redeemed within 12 months of purchase, unless waived. Any applicable CDSC will be 1.00% of the lesser of the original purchase price or the value of the redemption of the Class A Shares redeemed. There were no CDSCs paid by redeeming shareholders of Class A Shares to the Distributor during the year ended June 30, 2023.
A CDSC of 1.00% will be deducted with respect to Class C Shares redeemed within 12 months of purchase, unless waived. Any applicable CDSC will be 1.00% of the lesser of the original purchase price or the value of the redemption of the Class C Shares redeemed. During the year ended June 30, 2023, redeeming shareholders of Class C Shares paid CDSCs of $10.
The Board of Trustees has adopted a deferred compensation plan (the “Deferred Plan”) for independent Trustees to elect to defer receipt of all or a portion of the annual compensation they are entitled to receive from the Fund. All deferred fees are credited to an account established in the name of the Trustees. The amounts credited to the account then increase or decrease, as the case may be, in accordance with the performance of one or more of the Janus Henderson funds that are selected by the Trustees. The account balance continues to fluctuate in accordance with the performance of the selected fund or funds until final payment of all amounts are credited to the account. The fluctuation of the account balance is recorded by the Fund as unrealized appreciation/(depreciation) and is included as of June 30, 2023 on the Statement of Assets and Liabilities in the asset, “Trustees’ deferred compensation,” and liability, “Trustees’ deferred compensation fees.” Additionally, the recorded unrealized appreciation/(depreciation) is included in “Total distributable earnings (loss)” on the Statement of Assets and Liabilities. Deferred compensation expenses for the year ended June 30, 2023 are included in “Trustees’ fees and expenses” on the Statement of Operations. Trustees are allowed to change their designation of mutual funds from time to time. Amounts will be deferred until distributed in accordance with the Deferred Plan. Deferred fees of $426,025 were paid by the Trust to the Trustees under the Deferred Plan during the year ended June 30, 2023.
Pursuant to the provisions of the 1940 Act and related rules, the Fund may participate in an affiliated or non-affiliated cash sweep program. In the cash sweep program, uninvested cash balances of the Fund may be used to purchase shares of affiliated or non-affiliated money market funds or cash management pooled investment vehicles that operate as money market funds. The Fund is eligible to participate in the cash sweep program (the “Investing Funds”). The
Janus Henderson Global Allocation Fund - Moderate
Notes to Financial Statements
Adviser has an inherent conflict of interest because of its fiduciary duties to the affiliated money market funds or cash management pooled investment vehicles and the Investing Funds. Janus Henderson Cash Liquidity Fund LLC (the “Sweep Vehicle”) is an affiliated unregistered cash management pooled investment vehicle that invests primarily in highly-rated short-term fixed-income securities. The Sweep Vehicle operates pursuant to the provisions of the 1940 Act that govern the operation of money market funds and prices its shares at NAV reflecting market-based values of its portfolio securities (i.e., a “floating” NAV) rounded to the fourth decimal place (e.g., $1.0000). The Sweep Vehicle is permitted to impose a liquidity fee (of up to 2%) on redemptions from the Sweep Vehicle or a redemption gate that temporarily suspends redemptions from the Sweep Vehicle for up to 10 business days during a 90 day period. There are no restrictions on the Fund's ability to withdraw investments from the Sweep Vehicle at will, and there are no unfunded capital commitments due from the Fund to the Sweep Vehicle. The Sweep Vehicle does not charge any management fee, sales charge or service fee.
Any purchases and sales, realized gains/losses and recorded dividends from affiliated investments during the year ended June 30, 2023 can be found in the “Schedules of Affiliated Investments” located in the Schedule of Investments.
3. Federal Income Tax
The tax components of capital shown in the table below represent: (1) distribution requirements the Fund must satisfy under the income tax regulations; (2) losses or deductions the Fund may be able to offset against income and gains realized in future years; and (3) unrealized appreciation or depreciation of investments for federal income tax purposes.
Other book to tax differences primarily consist of deferred compensation. The Fund has elected to treat gains and losses on forward foreign currency contracts as capital gains and losses, if applicable. Other foreign currency gains and losses on debt instruments are treated as ordinary income for federal income tax purposes pursuant to Section 988 of the Internal Revenue Code.
| | | | | | | |
| | | | Other Book | Net Tax | |
Undistributed
Ordinary Income | Undistributed
Long-Term Gains | Accumulated
Capital Losses | Loss Deferrals | to Tax
Differences | Appreciation/
(Depreciation) | |
$ 2,157,042 | $ - | $ (5,916,434) | $ - | $ (3,585) | $ 848,735 | |
Accumulated capital losses noted below represent net capital loss carryovers, as of June 30, 2023, that may be available to offset future realized capital gains and thereby reduce future taxable gains distributions. The following table shows these capital loss carryovers.
| | | | | | |
| | | | | |
Capital Loss Carryover Schedule | | |
For the year ended June 30, 2023 | | |
| No Expiration | | | |
| Short-Term | Long-Term | Accumulated
Capital Losses | | |
| $(2,349,736) | $(3,566,698) | $ (5,916,434) | | |
The aggregate cost of investments and the composition of unrealized appreciation and depreciation of investment securities for federal income tax purposes as of June 30, 2023 are noted below. The primary difference between book and tax appreciation or depreciation of investments is wash sale loss deferrals.
| | | | |
Federal Tax Cost | Unrealized
Appreciation | Unrealized
(Depreciation) | Net Tax Appreciation/
(Depreciation) |
$ 189,356,164 | $13,557,212 | $(12,708,477) | $ 848,735 |
Income and capital gains distributions are determined in accordance with income tax regulations that may differ from US GAAP. These differences are due to differing treatments for items such as net short-term gains, deferral of wash
Janus Henderson Global Allocation Fund - Moderate
Notes to Financial Statements
sale losses, and capital loss carryovers. Certain permanent differences such as tax returns of capital and net investment losses noted below have been reclassified to capital.
| | | | | |
For the year ended June 30, 2023 | |
Distributions | | |
From Ordinary Income | From Long-Term Capital Gains | Tax Return of Capital | Net Investment Loss | |
$ 1,422,861 | $ 3,938,843 | $ - | $ - | |
| | | | | |
For the year ended June 30, 2022 | |
Distributions | | |
From Ordinary Income | From Long-Term Capital Gains | Tax Return of Capital | Net Investment Loss | |
$ 9,783,763 | $ 20,978,238 | $ - | $ - | |
Permanent book to tax basis differences may result in reclassifications between the components of net assets. These differences have no impact on the results of operations or net assets.
4. Capital Share Transactions
| | | | | | | |
| | | | | | |
| | Year ended June 30, 2023 | | Year ended June 30, 2022 |
| | Shares | Amount | | Shares | Amount |
| | | | | | | |
Class A Shares: | | | | | |
Shares sold | 84,220 | $ 917,214 | | 99,542 | $ 1,392,186 |
Reinvested dividends and distributions | 21,826 | 232,007 | | 125,347 | 1,652,075 |
Shares repurchased | (322,999) | (3,584,061) | | (113,369) | (1,434,560) |
Net Increase/(Decrease) | (216,953) | $(2,434,840) | | 111,520 | $ 1,609,701 |
Class C Shares: | | | | | |
Shares sold | 28,017 | $ 287,539 | | 6,199 | $ 83,756 |
Reinvested dividends and distributions | 1,918 | 20,118 | | 20,276 | 264,396 |
Shares repurchased | (89,195) | (961,348) | | (90,803) | (1,168,663) |
Net Increase/(Decrease) | (59,260) | $ (653,691) | | (64,328) | $ (820,511) |
Class D Shares: | | | | | |
Shares sold | 714,673 | $ 7,931,540 | | 846,777 | $11,608,248 |
Reinvested dividends and distributions | 426,840 | 4,571,454 | | 1,838,940 | 24,439,514 |
Shares repurchased | (1,824,967) | (20,141,433) | | (1,811,000) | (24,270,561) |
Net Increase/(Decrease) | (683,454) | $(7,638,439) | | 874,717 | $11,777,201 |
Class I Shares: | | | | | |
Shares sold | 47,600 | $ 530,997 | | 926,725 | $13,710,075 |
Reinvested dividends and distributions | 11,452 | 122,537 | | 147,552 | 1,956,536 |
Shares repurchased | (129,897) | (1,420,959) | | (1,107,894) | (13,938,479) |
Net Increase/(Decrease) | (70,845) | $ (767,425) | | (33,617) | $ 1,728,132 |
Class S Shares: | | | | | |
Shares sold | 6,843 | $ 74,191 | | 6,701 | $ 87,320 |
Reinvested dividends and distributions | 2,562 | 26,980 | | 12,697 | 165,949 |
Shares repurchased | (69,443) | (765,911) | | (13,564) | (164,647) |
Net Increase/(Decrease) | (60,038) | $ (664,740) | | 5,834 | $ 88,622 |
Class T Shares: | | | | | |
Shares sold | 273,679 | $ 2,984,463 | | 365,108 | $ 4,932,414 |
Reinvested dividends and distributions | 30,278 | 323,070 | | 145,734 | 1,929,521 |
Shares repurchased | (526,952) | (5,776,146) | | (425,998) | (5,741,037) |
Net Increase/(Decrease) | (222,995) | $(2,468,613) | | 84,844 | $ 1,120,898 |
Janus Henderson Global Allocation Fund - Moderate
Notes to Financial Statements
5. Purchases and Sales of Investment Securities
For the year ended June 30, 2023, the aggregate cost of purchases and proceeds from sales of investment securities (excluding any short-term securities, short-term options contracts, TBAs, and in-kind transactions, as applicable) was as follows:
| | | | |
Purchases of
Securities | Proceeds from Sales
of Securities | Purchases of Long-
Term U.S. Government
Obligations | Proceeds from Sales
of Long-Term U.S.
Government Obligations |
$69,498,105 | $ 84,469,136 | $ - | $ - |
6. Subsequent Event
Management has evaluated whether any events or transactions occurred subsequent to June 30, 2023 and through the date of issuance of the Fund’s financial statements and determined that there were no material events or transactions that would require recognition or disclosure in the Fund’s financial statements.
Janus Henderson Global Allocation Fund - Moderate
Report of Independent Registered Public Accounting Firm
To the Board of Trustees of Janus Investment Fund and Shareholders of Janus Henderson Global Allocation Fund - Moderate
Opinion on the Financial Statements
We have audited the accompanying statement of assets and liabilities, including the schedule of investments, of Janus Henderson Global Allocation Fund - Moderate (one of the funds constituting Janus Investment Fund, referred to hereafter as the “Fund”) as of June 30, 2023, the related statement of operations for the year ended June 30, 2023, the statements of changes in net assets for each of the two years in the period ended June 30, 2023, including the related notes, and the financial highlights for each of the five years in the period ended June 30, 2023 (collectively referred to as the “financial statements”). In our opinion, the financial statements present fairly, in all material respects, the financial position of the Fund as of June 30, 2023, the results of its operations for the year then ended, the changes in its net assets for each of the two years in the period ended June 30, 2023 and the financial highlights for each of the five years in the period ended June 30, 2023 in conformity with accounting principles generally accepted in the United States of America.
Basis for Opinion
These financial statements are the responsibility of the Fund’s management. Our responsibility is to express an opinion on the Fund’s financial statements based on our audits. We are a public accounting firm registered with the Public Company Accounting Oversight Board (United States) (PCAOB) and are required to be independent with respect to the Fund in accordance with the U.S. federal securities laws and the applicable rules and regulations of the Securities and Exchange Commission and the PCAOB.
We conducted our audits of these financial statements in accordance with the standards of the PCAOB. Those standards require that we plan and perform the audit to obtain reasonable assurance about whether the financial statements are free of material misstatement, whether due to error or fraud.
Our audits included performing procedures to assess the risks of material misstatement of the financial statements, whether due to error or fraud, and performing procedures that respond to those risks. Such procedures included examining, on a test basis, evidence regarding the amounts and disclosures in the financial statements. Our audits also included evaluating the accounting principles used and significant estimates made by management, as well as evaluating the overall presentation of the financial statements. Our procedures included confirmation of securities owned as of June 30, 2023 by correspondence with the custodian, transfer agent and brokers; when replies were not received from brokers, we performed other auditing procedures. We believe that our audits provide a reasonable basis for our opinion.

Denver, Colorado
August 21, 2023
We have served as the auditor of one or more investment companies in Janus Henderson Funds since 1990.
Janus Henderson Global Allocation Fund - Moderate
Additional Information (unaudited)
Proxy Voting Policies and Voting Record
A description of the policies and procedures that the Fund uses to determine how to vote proxies relating to its portfolio securities is available without charge: (i) upon request, by calling 1-800-525-1093; (ii) on the Fund’s website at janushenderson.com/proxyvoting; and (iii) on the SEC’s website at http://www.sec.gov. Additionally, information regarding the Fund’s proxy voting record for the most recent twelve-month period ended June 30 is also available, free of charge, through janushenderson.com/proxyvoting and from the SEC’s website at http://www.sec.gov.
Full Holdings
The Fund files its complete portfolio holdings (schedule of investments) with the SEC as an exhibit to Form N-PORT within 60 days of the end of the first and third fiscal quarters, and in the annual report and semiannual report to shareholders. The Fund’s Form N-PORT filings and annual and semiannual reports: (i) are available on the SEC’s website at http://www.sec.gov; and (ii) are available without charge, upon request, by calling a Janus Henderson representative at 1-877-335-2687 (toll free) (or 1-800-525-3713 if you hold Class D shares). Portfolio holdings consisting of at least the names of the holdings are generally available on a monthly basis with a 30-day lag under Full Holdings for the Fund at janushenderson.com/info (or janushenderson.com/reports if you hold Class D Shares).
APPROVAL OF ADVISORY AGREEMENTS DURING THE PERIOD
The Trustees of Janus Aspen Series, each of whom serves as an “independent” Trustee (the “Trustees”), oversee the management of each portfolio of Janus Aspen Series (each, a “VIT Portfolio,” and collectively, the “VIT Portfolios”), as well as each fund of Janus Investment Fund (each, a “Fund,” and collectively, the “Funds” and together with the VIT Portfolios, the “Janus Henderson Funds,” and each, a “Janus Henderson Fund”). As required by law, the Trustees determine annually whether to continue the investment advisory agreement for each Janus Henderson Fund.
In connection with their most recent consideration of those agreements for each Janus Henderson Fund, the Trustees received and reviewed information provided by Janus Henderson Investors US LLC (the “Adviser”) in response to requests of the Trustees and their independent legal counsel. They also received and reviewed information and analysis provided by, and in response to requests of, their independent fee consultant. Throughout their consideration of the agreements, the Trustees were advised by their independent legal counsel. The Trustees met with management to consider the agreements, and also met separately in executive session with their independent legal counsel and their independent fee consultant.
At meetings held on November 9-10, 2022 and December 13-14, 2022, the Trustees evaluated the information provided by the Adviser and the independent fee consultant, as well as other information provided by the Adviser and the independent fee consultant during the year. Following such evaluation, the Trustees determined that the overall arrangements between each Janus Henderson Fund and the Adviser were fair and reasonable in light of the nature, extent, and quality of the services provided by the Adviser and its affiliates, the fees charged for those services, and other matters that the Trustees considered relevant in the exercise of their business judgment, and unanimously approved the continuation of the investment advisory agreement for each Janus Henderson Fund for the period from February 1, 2023 through February 1, 2024, subject to earlier termination as provided for in each agreement.
In considering the continuation of those agreements, the Trustees reviewed and analyzed various factors that they determined were relevant, including the factors described below, none of which by itself was considered dispositive. However, the material factors and conclusions that formed the basis for the Trustees’ determination to approve the continuation of the agreements are discussed separately below. Also included is a summary of the independent fee consultant’s conclusions and opinions that arose during, and were included as part of, the Trustees’ consideration of the agreements. “Management fees,” as used herein, reflect actual annual advisory fees and, for the purpose of peer comparisons any administration fees (excluding out of pocket costs), net of any waivers, paid by a fund as a percentage of average net assets.
Nature, Extent and Quality of Services
The Trustees reviewed the nature, extent, and quality of the services provided by the Adviser to the Janus Henderson Funds, taking into account the investment objective, strategies, and policies of each Janus Henderson Fund, and the knowledge the Trustees gained from their regular meetings with management on at least a quarterly basis and their ongoing review of information related to the Janus Henderson Funds. In addition, the Trustees reviewed the resources and key personnel of the Adviser, particularly noting those employees who provide investment and risk management services to the Janus Henderson Funds. The Trustees also considered other services provided to the Janus Henderson
Janus Henderson Global Allocation Fund - Moderate
Additional Information (unaudited)
Funds by the Adviser, such as managing the execution of portfolio transactions and the selection of broker-dealers for those transactions. The Trustees considered the Adviser’s role as administrator to the Janus Henderson Funds, noting that the Adviser generally does not receive a fee for its services as administrator, but is reimbursed for its out-of-pocket costs. The Trustees considered the role of the Adviser in monitoring adherence to the Janus Henderson Funds’ investment restrictions, providing support services for the Trustees and Trustee committees, and overseeing communications with Janus Henderson Fund shareholders and the activities of other service providers, including monitoring compliance with various policies and procedures of the Janus Henderson Funds and with applicable securities laws and regulations.
In this regard, the independent fee consultant noted that the Adviser provides a number of different services for the Janus Henderson Funds and their shareholders, ranging from investment management services to various other servicing functions, and that, in its view, the Adviser is a capable provider of those services. The independent fee consultant also provided its belief that the Adviser has developed a number of institutional competitive advantages that should enable it to provide superior investment and service performance over the long term.
The Trustees concluded that the nature, extent, and quality of the services provided by the Adviser to each Janus Henderson Fund were appropriate and consistent with the terms of the respective advisory agreements, and that, taking into account steps taken to address those Janus Henderson Funds whose performance lagged that of their peers for certain periods, the Janus Henderson Funds were likely to benefit from the continued provision of those services. They also concluded that the Adviser had sufficient personnel, with the appropriate education and experience, to serve the Janus Henderson Funds effectively and had demonstrated its ability to attract well-qualified personnel.
Performance of the Funds
The Trustees considered the performance results of each Janus Henderson Fund over various time periods. They noted that they considered Janus Henderson Fund performance data throughout the year, including periodic meetings with each Janus Henderson Fund’s portfolio manager(s), and also reviewed information comparing each Janus Henderson Fund’s performance with the performance of comparable fund peer groups identified by Broadridge Financial Solutions, Inc. (“Broadridge”), an independent data provider, and with the Janus Henderson Fund’s benchmark index. In this regard, the independent fee consultant found that the overall Janus Henderson Funds’ performance has been reasonable, noting that: (i) for the 36 months ended May 31, 2022, approximately 38% of the Janus Henderson Funds were in the top two quartiles of their Broadridge peer groups; (ii) for the 36 months ended September 30, 2022, approximately 45% of the Janus Henderson Funds were in the top two quartiles of performance as reported by Morningstar, and (iii) for the 12 months ended September 30, 2022, approximately 55% of the Janus Henderson Funds were in the top two quartiles of performance as reported by Morningstar.
The Trustees considered the performance of each Janus Henderson Fund, noting that performance may vary by share class, and noted the following with respect to the Funds:
Asset Allocation Funds
· For Janus Henderson Global Allocation Fund – Conservative, the Trustees noted that the Fund’s performance was in the third Broadridge quartile for the 36 months ended May 31, 2022 and the bottom Broadridge quartile for the 12 months ended May 31, 2022. The Trustees noted the reasons for the Fund’s underperformance and the steps the Adviser had taken or was taking to improve performance.
· For Janus Henderson Global Allocation Fund – Growth, the Trustees noted that the Fund’s performance was in the bottom Broadridge quartile for the 36 months ended May 31, 2022 and the bottom Broadridge quartile for the 12 months ended May 31, 2022. The Trustees noted the reasons for the Fund’s underperformance and the steps the Adviser had taken or was taking to improve performance.
· For Janus Henderson Global Allocation Fund – Moderate, the Trustees noted that the Fund’s performance was in the bottom Broadridge quartile for the 36 months ended May 31, 2022 and the bottom Broadridge quartile for the 12 months ended May 31, 2022. The Trustees noted the reasons for the Fund’s underperformance and the steps the Adviser had taken or was taking to improve performance.
Fixed-Income Funds
· For Janus Henderson Absolute Return Income Opportunities Fund, the Trustees noted that the Fund’s performance was in the third Broadridge quartile for the 36 months ended May 31, 2022 and the first Broadridge
Janus Henderson Global Allocation Fund - Moderate
Additional Information (unaudited)
quartile for the 12 months ended May 31, 2022. The Trustees noted the reasons for the Fund’s underperformance, the steps the Adviser had taken or was taking to improve performance, and that the performance trend was improving.
· For Janus Developed World Bond Fund, the Trustees noted that the Fund’s performance was in the bottom Broadridge quartile for the 36 months ended May 31, 2022 and the bottom Broadridge quartile for the 12 months ended May 31, 2022. The Trustees noted the reasons for the Fund’s underperformance and the steps the Adviser had taken or was taking to improve performance.
· For Janus Henderson Flexible Bond Fund, the Trustees noted that the Fund’s performance was in the first Broadridge quartile for the 36 months ended May 31, 2022 and the second Broadridge quartile for the 12 months ended May 31, 2022.
· For Janus Henderson Global Bond Fund, the Trustees noted that the Fund’s performance was in the third Broadridge quartile for the 36 months ended May 31, 2022 and the bottom Broadridge quartile for the 12 months ended May 31, 2022. The Trustees noted the reasons for the Fund’s underperformance and the steps the Adviser had taken or was taking to improve performance.
· For Janus Henderson High-Yield Fund, the Trustees noted that the Fund’s performance was in the third Broadridge quartile for the 36 months ended May 31, 2022 and the bottom Broadridge quartile for the 12 months ended May 31, 2022. The Trustees noted the reasons for the Fund’s underperformance and the steps the Adviser had taken or was taking to improve performance.
· For Janus Henderson Multi-Sector Income Fund, the Trustees noted that the Fund’s performance was in the second Broadridge quartile for the 36 months ended May 31, 2022 and the third Broadridge quartile for the 12 months ended May 31, 2022.
· For Janus Henderson Short Duration Flexible Bond Fund, the Trustees noted that the Fund’s performance was in the third Broadridge quartile for the 36 months ended May 31, 2022 and the bottom Broadridge quartile for the 12 months ended May 31, 2022. The Trustees noted the reasons for the Fund’s underperformance and the steps the Adviser had taken or was taking to improve performance.
Global and International Equity Funds
· For Janus Henderson Asia Equity Fund, the Trustees noted that the Fund’s performance was in the third Broadridge quartile for the 36 months ended May 31, 2022 and the third Broadridge quartile for the 12 months ended May 31, 2022. The Trustees noted the reasons for the Fund’s underperformance, while also noting that the Fund has a performance fee structure that results in lower management fees during periods of underperformance, and the steps the Adviser had taken or was taking to improve performance.
· For Janus Henderson Emerging Markets Fund, the Trustees noted that the Fund’s performance was in the third Broadridge quartile for the 36 months ended May 31, 2022 and the third Broadridge quartile for the 12 months ended May 31, 2022. The Trustees noted the reasons for the Fund’s underperformance and the steps the Adviser had taken or was taking to improve performance.
· For Janus Henderson European Focus Fund, the Trustees noted that the Fund’s performance was in the first Broadridge quartile for the 36 months ended May 31, 2022 and the second Broadridge quartile for the 12 months ended May 31, 2022.
· For Janus Henderson Global Equity Income Fund, the Trustees noted that the Fund’s performance was in the third Broadridge quartile for the 36 months ended May 31, 2022 and the first Broadridge quartile for the 12 months ended May 31, 2022. The Trustees noted the reasons for the Fund’s underperformance, the steps the Adviser had taken or was taking to improve performance, and that the performance trend was improving.
· For Janus Henderson Global Life Sciences Fund, the Trustees noted that the Fund’s performance was in the third Broadridge quartile for the 36 months ended May 31, 2022 and the second Broadridge quartile for the 12 months ended May 31, 2022. The Trustees noted the reasons for the Fund’s underperformance, the steps the Adviser had taken or was taking to improve performance, and that the performance trend was improving.
Janus Henderson Global Allocation Fund - Moderate
Additional Information (unaudited)
· For Janus Henderson Global Sustainable Equity Fund, the Trustees noted that the Fund’s performance was in the second Broadridge quartile for the 12 months ended May 31, 2022. The Trustees noted that 36 month-end performance was not yet available.
· For Janus Henderson Global Real Estate Fund, the Trustees noted that the Fund’s performance was in the second Broadridge quartile for the 36 months ended May 31, 2022 and the bottom Broadridge quartile for the 12 months ended May 31, 2022.
· For Janus Henderson Global Research Fund, the Trustees noted that the Fund’s performance was in the second Broadridge quartile for the 36 months ended May 31, 2022 and the first Broadridge quartile for the 12 months ended May 31, 2022.
· For Janus Henderson Global Select Fund, the Trustees noted that the Fund’s performance was in the first Broadridge quartile for the 36 months ended May 31, 2022 and the first Broadridge quartile for the 12 months ended May 31, 2022.
· For Janus Henderson Global Technology and Innovation Fund, the Trustees noted that the Fund’s performance was in the second Broadridge quartile for the 36 months ended May 31, 2022 and the second Broadridge quartile for the 12 months ended May 31, 2022.
· For Janus Henderson International Opportunities Fund, the Trustees noted that the Fund’s performance was in the bottom Broadridge quartile for the 36 months ended May 31, 2022 and the third Broadridge quartile for the 12 months ended May 31, 2022. The Trustees noted the reasons for the Fund’s underperformance and the steps the Adviser had taken or was taking to improve performance.
· For Janus Henderson Overseas Fund, the Trustees noted that the Fund’s performance was in the first Broadridge quartile for the 36 months ended May 31, 2022 and the first Broadridge quartile for the 12 months ended May 31, 2022.
· For Janus Henderson Responsible International Dividend Fund (formerly the Janus Henderson Dividend & Income Builder Fund), the Trustees noted that the Fund’s performance was in the bottom Broadridge quartile for the 36 months ended May 31, 2022 and the bottom Broadridge quartile for the 12 months ended May 31, 2022. The Trustees noted the reasons for the Fund’s underperformance and the steps the Adviser had taken or was taking to improve performance.
Money Market Funds
· For Janus Henderson Government Money Market Fund, the Trustees noted that the Fund’s performance was in the third Broadridge quartile for the 36 months ended May 31, 2022 and the bottom Broadridge quartile for the 12 months ended May 31, 2022. The Trustees noted the reasons for the Fund’s underperformance and the steps the Adviser had taken or was taking to improve performance.
· For Janus Henderson Money Market Fund, the Trustees noted that the Fund’s performance was in the third Broadridge quartile for the 36 months ended May 31, 2022 and the bottom Broadridge quartile for the 12 months ended May 31, 2022. The Trustees noted the reasons for the Fund’s underperformance and the steps the Adviser had taken or was taking to improve performance.
Multi-Asset Funds
· For Janus Henderson Adaptive Global Allocation Fund, the Trustees noted that the Fund’s performance was in bottom Broadridge quartile for the 36 months ended May 31, 2022 and the second Broadridge quartile for the 12 months ended May 31, 2022. The Trustees noted the reasons for the Fund’s underperformance, the steps the Adviser had taken or was taking to improve performance, and that the performance trend was improving.
· For Janus Henderson Balanced Fund, the Trustees noted that the Fund’s performance was in the first Broadridge quartile for the 36 months ended May 31, 2022 and the first Broadridge quartile for the 12 months ended May 31, 2022.
Janus Henderson Global Allocation Fund - Moderate
Additional Information (unaudited)
U.S. Equity Funds
· For Janus Henderson Adaptive Risk Managed U.S. Equity Fund, the Trustees noted that the Fund’s performance was in the bottom Broadridge quartile for the 36 months ended May 31, 2022 and the second Broadridge quartile for the 12 months ended May 31, 2022. The Trustees noted the reasons for the Fund’s underperformance, the steps the Adviser had taken or were taking to improve performance, and that the performance trend was improving.
· For Janus Henderson Contrarian Fund, the Trustees noted that the Fund’s performance was in the first Broadridge quartile for the 36 months ended May 31, 2022 and the bottom Broadridge quartile for the 12 months ended May 31, 2022.
· For Janus Henderson Enterprise Fund, the Trustees noted that the Fund’s performance was in the second Broadridge quartile for the 36 months ended May 31, 2022 and the first Broadridge quartile for the 12 months ended May 31, 2022.
· For Janus Henderson Forty Fund, the Trustees noted that the Fund’s performance was in the third Broadridge quartile for the 36 months ended May 31, 2022 and the bottom Broadridge quartile for the 12 months ended May 31, 2022. The Trustees noted the reasons for the Fund’s underperformance and the steps the Adviser had taken or was taking to improve performance.
· For Janus Henderson Growth and Income Fund, the Trustees noted that the Fund’s performance was in the bottom Broadridge quartile for the 36 months ended May 31, 2022 and the first Broadridge quartile for the 12 months ended May 31, 2022. The Trustees noted the reasons for the Fund’s underperformance, the steps the Adviser had taken or was taking to improve performance, and that the performance trend was improving.
· For Janus Henderson Mid Cap Value Fund, the Trustees noted that the Fund’s performance was in the bottom Broadridge quartile for the 36 months ended May 31, 2022 and the second Broadridge quartile for the 12 months ended May 31, 2022. The Trustees noted the reasons for the Fund’s underperformance, while also noting that the Fund has a performance fee structure that results in lower management fees during periods of underperformance, the steps the Adviser had taken or was taking to improve performance, and that the performance trend was improving.
· For Janus Henderson Research Fund, the Trustees noted that the Fund’s performance was in the third Broadridge quartile for the 36 months ended May 31, 2022 and the third Broadridge quartile for the 12 months ended May 31, 2022. The Trustees noted the reasons for the Fund’s underperformance, while also noting that the Fund has a performance fee structure that results in lower management fees during periods of underperformance and the steps the Adviser had taken or was taking to improve performance.
· For Janus Henderson Small Cap Value Fund, the Trustees noted that the Fund’s performance was in the bottom Broadridge quartile for the 36 months ended May 31, 2022 and the second Broadridge quartile for the 12 months ended May 31, 2022. The Trustees noted the reasons for the Fund’s underperformance, while also noting that the Fund has a performance fee structure that results in lower management fees during periods of underperformance, the steps the Adviser had taken or was taking to improve performance, and that the performance trend was improving.
· For Janus Henderson Small-Mid Cap Value Fund, the Trustees noted that the Fund’s performance was in the bottom Broadridge quartile for the 36 months ended May 31, 2022 and the second Broadridge quartile for the 12 months ended May 31, 2022. The Trustees noted the reasons for the Fund’s underperformance, while also noting that the Fund has a performance fee structure that results in lower management fees during periods of underperformance, the steps the Adviser had taken or was taking to improve performance, and that the performance trend is improving.
· For Janus Henderson Triton Fund, the Trustees noted that the Fund’s performance was in the bottom Broadridge quartile for the 36 months ended May 31, 2022 and the second Broadridge quartile for the 12 months ended May 31, 2022. The Trustees noted the reasons for the Fund’s underperformance, the steps the Adviser had taken or was taking to improve performance, and that the performance trend was improving.
· For Janus Henderson Venture Fund, the Trustees noted that the Fund’s performance was in the bottom Broadridge quartile for the 36 months ended May 31, 2022 and the second Broadridge quartile for the 12 months ended May
Janus Henderson Global Allocation Fund - Moderate
Additional Information (unaudited)
31, 2022. The Trustees noted the reasons for the Fund’s underperformance, the steps the Adviser had taken or was taking to improve performance, and that the performance trend was improving.
In consideration of each Janus Henderson Fund’s performance, the Trustees concluded that, taking into account the factors relevant to performance, as well as other considerations, including steps taken to improve performance, as applicable, the Janus Henderson Fund’s performance warranted continuation of such Janus Henderson Fund’s investment advisory agreement.
Costs of Services Provided
The Trustees examined information regarding the fees and expenses of each Janus Henderson Fund in comparison to similar information for other comparable funds as provided by Broadridge, an independent data provider. They also reviewed an analysis of that information provided by their independent fee consultant. The independent fee consultant provided its belief that the management fees charged by the Adviser to each of the Janus Henderson Funds under the current investment advisory and administration agreements are reasonable in relation to the services provided by the Adviser. The independent fee consultant found: (1) the total expenses and management fees of the Janus Henderson Funds to be reasonable relative to other comparable mutual funds; (2) the total expenses, on average, were 6% under the average total expenses of the respective Broadridge peer group; and (3) the management fees for the Janus Henderson Funds, on average, were 5% under the average management fees for the respective Broadridge peer group. The Trustees also considered the total expenses for each share class of each Janus Henderson Fund compared to the average total expenses for its Broadridge Expense Group and to average total expenses for its Broadridge Expense Universe.
For Janus Henderson Funds with three or more years of performance history, the independent fee consultant also performed a systematic “focus list” analysis of expenses which assessed fund fees in the context of fund performance being delivered. Based on this analysis, the independent fee consultant found that the combination of service quality/performance and expenses on these individual Janus Henderson Funds was reasonable in light of performance trends, performance histories, changes in portfolio management, relative average net asset levels, and the existence of performance fees, breakpoints, and/or expense waivers on such Janus Henderson Funds.
The Trustees considered the methodology used by the Adviser in determining compensation payable to portfolio managers, the competitive environment for investment management talent, and the competitive market for mutual funds in different distribution channels.
The Trustees also reviewed management fees charged by the Adviser to comparable separate account clients and to comparable non-affiliated funds subadvised by the Adviser (for which the Adviser provides only or primarily portfolio management services). Although in most instances subadvisory and separate account fee rates for various investment strategies were lower than management fee rates for Janus Henderson Funds having a similar strategy, the Trustees considered that the Adviser noted that, under the terms of the management agreements with the Janus Henderson Funds, the Adviser performs significant additional services for the Janus Henderson Funds that it does not provide to those other clients, including administration services, oversight of the Janus Henderson Funds’ other service providers, Trustee support, regulatory compliance and numerous other services, and that, in serving the Janus Henderson Funds, the Adviser assumes many legal risks and other costs that it does not assume in servicing its other clients. Moreover, the Trustees noted that the independent fee consultant found that: (1) the management fees the Adviser charges to the Janus Henderson Funds are reasonable in relation to the management fees the Adviser charges to funds subadvised by the Adviser and to the fees the Adviser charges to its institutional separate account clients; (2) these subadvised and institutional separate accounts have different service and infrastructure needs and operate in markets very different from the retail fund market; (3) Janus Henderson mutual fund investors enjoy reasonable fees relative to the fees charged in these other markets; and (4) as part of its 2022 review, 9 of 11 Janus Henderson Funds have lower management fees than similar funds subadvised by the Adviser. The Trustees noted that for the two Janus Henderson Funds that did not, management fees for each were under the average of its 15(c) peer group.
The Trustees considered the fees for each Janus Henderson Fund for its fiscal year ended in 2021 and noted the following with regard to each Janus Henderson Fund’s total expenses, net of applicable fee waivers (the Fund’s “total expenses”) as reflected in the comparative information provided by Broadridge:
Janus Henderson Global Allocation Fund - Moderate
Additional Information (unaudited)
Asset Allocation Funds
· For Janus Henderson Global Allocation Fund – Conservative, the Trustees noted that, although the Fund’s total expenses exceeded the peer group average for certain share classes, overall the Fund’s total expenses were reasonable. The Trustees also noted that the Adviser has contractually agreed to limit the Fund’s expenses.
· For Janus Henderson Global Allocation Fund – Growth, the Trustees noted that, although the Fund’s total expenses exceeded the peer group average for certain share classes, overall the Fund’s total expenses were reasonable. The Trustees also noted that the Adviser has contractually agreed to limit the Fund’s expenses, although this limit did not apply because the Fund’s total expenses as shown were below the applicable fee limit.
· For Janus Henderson Global Allocation Fund – Moderate, the Trustees noted that, although the Fund’s total expenses exceeded the peer group average for one share class, overall the Fund’s total expenses were reasonable. The Trustees also noted that the Adviser has contractually agreed to limit the Fund’s expenses.
Fixed-Income Funds
· For Janus Henderson Absolute Return Income Opportunities Fund, the Trustees noted that, although the Fund’s total expenses exceeded the peer group average for certain share classes, overall the Fund’s total expenses were reasonable. The Trustees also noted that the Adviser has contractually agreed to limit the Fund’s expenses.
· For Janus Henderson Developed World Bond Fund, the Trustees noted that, although the Fund’s total expenses exceeded the peer group average for one share class, overall the Fund’s total expenses were reasonable. The Trustees also noted that the Adviser has contractually agreed to limit the Fund’s expenses.
· For Janus Henderson Flexible Bond Fund, the Trustees noted that, although the Fund’s total expenses exceeded the peer group average for certain share classes, overall the Fund’s total expenses were reasonable. The Trustees also noted that the Adviser has contractually agreed to limit the Fund’s expenses, although this limit did not apply because the Fund’s total expenses as shown were below the applicable fee limit.
· For Janus Henderson Global Bond Fund, the Trustees noted that, although the Fund’s total expenses exceeded the peer group average for certain share classes, overall the Fund’s total expenses were reasonable. The Trustees also noted that the Adviser has contractually agreed to limit the Fund’s expenses.
· For Janus Henderson High-Yield Fund, the Trustees noted that, although the Fund’s total expenses exceeded the peer group average for certain share classes, overall the Fund’s total expenses were reasonable. The Trustees also noted that the Adviser has contractually agreed to limit the Fund’s expenses.
· For Janus Henderson Multi-Sector Income Fund, the Trustees noted that, although the Fund’s total expenses exceeded the peer group average for certain share classes, overall the Fund’s total expenses were reasonable. The Trustees also noted that the Adviser has contractually agreed to limit the Fund’s expenses.
· For Janus Henderson Short Duration Flexible Bond Fund, the Trustees noted that, although the Fund’s total expenses exceeded the peer group average for certain share classes, overall the Fund’s total expenses were reasonable. The Trustees also noted that the Adviser has contractually agreed to limit the Fund’s expenses.
Global and International Equity Funds
· For Janus Henderson Asia Equity Fund, the Trustees noted that, although the Fund’s total expenses exceeded the peer group average for certain share classes, overall the Fund’s total expenses were reasonable. The Trustees also noted that the Adviser has contractually agreed to limit the Fund’s expenses.
· For Janus Henderson Emerging Markets Fund, the Trustees noted that, although the Fund’s total expenses exceeded the peer group average for certain share classes, overall the Fund’s total expenses were reasonable. The Trustees also noted that the Adviser has contractually agreed to limit the Fund’s expenses.
· For Janus Henderson European Focus Fund, the Trustees noted that, although the Fund’s total expenses exceeded the peer group average for one share class, overall the Fund’s expenses were reasonable. The Trustees also noted that the Adviser has contractually agreed to limit the Fund’s expenses.
· For Janus Henderson Global Equity Income Fund, the Trustees noted that, although the Fund’s total expenses exceeded the peer group average for one share class, overall the Fund’s total expenses were reasonable. The
Janus Henderson Global Allocation Fund - Moderate
Additional Information (unaudited)
Trustees also noted that the Adviser has contractually agreed to limit the Fund’s expenses, although this limit did not apply because the Fund’s total expenses as shown were below the applicable fee limit.
· For Janus Henderson Global Life Sciences Fund, the Trustees noted that the Fund’s total expenses were below the peer group average for all share classes.
· For Janus Henderson Global Real Estate Fund, the Trustees noted that, although the Fund’s total expenses exceeded the peer group average for certain share classes, overall the Fund’s total expenses were reasonable. The Trustees also noted that the Adviser has contractually agreed to limit the Fund’s expenses, although this limit did not apply because the Fund’s total expenses as shown were below the applicable fee limit.
· For Janus Henderson Global Research Fund, the Trustees noted that, although the Fund’s total expenses exceeded the peer group average for one share class, overall the Fund’s total expenses were reasonable. The Trustees also noted that the Adviser has contractually agreed to limit the Fund’s expenses, although this limit did not apply because the Fund’s total expenses as shown were below the applicable fee limit.
· For Janus Henderson Global Select Fund, the Trustees noted that, although the Fund’s total expenses exceeded the peer group average for certain share classes, overall the Fund’s total expenses were reasonable. The Trustees also noted that the Adviser has contractually agreed to limit the Fund’s expenses.
· For Janus Henderson Global Sustainable Equity Fund, the Trustees noted that, although the Fund’s total expenses exceeded the peer group average for certain share classes, overall the Fund’s expenses were reasonable. The Trustees also noted that the Adviser has contractually agreed to limit the Fund’s expenses.
· For Janus Henderson Global Technology and Innovation Fund, the Trustees noted that the Fund’s total expenses were below the peer group average for all share classes.
· For Janus Henderson International Opportunities Fund, the Trustees noted that, although the Fund’s total expenses exceeded the peer group average for certain share classes, overall the Fund’s expenses were reasonable. The Trustees also noted that the Adviser has contractually agreed to limit the Fund’s expenses.
· For Janus Henderson Overseas Fund, the Trustees noted that although the Fund’s total expenses exceeded the peer group average for certain share classes, overall the Fund’s total expenses were reasonable. The Trustees also noted that the Adviser has contractually agreed to limit the Fund’s expenses, although this limit did not apply because the Fund’s total expenses as shown were below the applicable fee limit.
· For Janus Henderson Responsible International Dividend Fund (formerly the Janus Henderson Dividend & Income Builder Fund), the Trustees noted that, although the Fund’s total expenses exceeded the peer group for one share class, overall the Fund’s total expenses were reasonable. The Trustees also noted that the Adviser has contractually agreed to limit the Fund’s expenses.
Money Market Funds
· For Janus Henderson Government Money Market Fund, the Trustees noted that the Fund’s total expenses were below the peer group average for all share classes.
· For Janus Henderson Money Market Fund, the Trustees noted that the Fund’s total expenses were below the peer group average for all share classes.
Multi-Asset Funds
· For Janus Henderson Adaptive Global Allocation Fund, the Trustees noted that the Fund’s total expenses were below the peer group average for all share classes.
· For Janus Henderson Balanced Fund, the Trustees noted that, although the Fund’s total expenses exceeded the peer group average for certain share classes, overall the Fund’s total expenses were reasonable. The Trustees also noted that the Adviser has contractually agreed to limit the Fund’s expenses, although this limit did not apply because the Fund’s total expenses as shown were below the applicable fee limit.
Janus Henderson Global Allocation Fund - Moderate
Additional Information (unaudited)
U.S. Equity Funds
· For Janus Henderson Adaptive Risk Managed U.S. Equity Fund, the Trustees noted that, although the Fund’s total expenses exceeded the peer group average for certain share classes, overall the Fund’s total expenses were reasonable. The Trustees also noted that the Adviser has contractually agreed to limit the Fund’s expenses, although this limit did not apply because the Fund’s total expenses as shown were below the applicable fee limit.
· For Janus Henderson Contrarian Fund, the Trustees noted that, although the Fund’s total expenses exceeded the peer group average for all share classes, overall the Fund’s total expenses were reasonable. The Trustees also noted that the Adviser had contractually agreed to limit the Fund’s expenses.
· For Janus Henderson Enterprise Fund, the Trustees noted that, although the Fund’s total expenses exceeded the peer group average for certain share classes, overall the Fund’s total expenses were reasonable. The Trustees also noted that the Adviser has contractually agreed to limit the Fund’s expenses, although this limit did not apply because the Fund’s total expenses as shown were below the applicable fee limit.
· For Janus Henderson Forty Fund, the Trustees noted that, although the Fund’s total expenses exceeded the peer group average for certain share classes, overall the Fund’s total expenses were reasonable. The Trustees also noted that the Adviser has contractually agreed to limit the Fund’s expenses, although this limit did not apply because the Fund’s total expenses as shown were below the applicable fee limit.
· For Janus Henderson Growth and Income Fund, the Trustees noted that, although the Fund’s total expenses exceeded the peer group average for certain share classes, overall the Fund’s total expenses were reasonable. The Trustees also noted that the Adviser has contractually agreed to limit the Fund’s expenses, although this limit did not apply because the Fund’s total expenses as shown were below the applicable fee limit.
· For Janus Henderson Mid Cap Value Fund, the Trustees noted that the Fund’s total expenses were below the peer group average for all share classes.
· For Janus Henderson Research Fund, the Trustees noted that, although the Fund’s total expenses exceeded the peer group average for certain share classes, overall the Fund’s total expenses were reasonable. The Trustees also noted that the Adviser has contractually agreed to limit the Fund’s expenses.
· For Janus Henderson Small Cap Value Fund, the Trustees noted that, although the Fund’s total expenses exceeded the peer group average for one share class, overall the Fund’s total expenses were reasonable. The Trustees also noted that the Adviser has contractually agreed to limit the Fund’s expenses, although this limit did not apply because the Fund’s total expenses as shown were below the applicable fee limit.
· For Janus Henderson Small-Mid Cap Value Fund, the Trustees noted that the Fund’s total expenses were below the peer group average for all share classes.
· For Janus Henderson Triton Fund, the Trustees noted that, although the Fund’s total expenses exceeded the peer group average for one share class, overall the Fund’s total expenses were reasonable. The Trustees also noted that the Adviser has contractually agreed to limit the Fund’s expenses, although this limit did not apply because the Fund’s total expenses as shown were below the applicable fee limit.
· For Janus Henderson Venture Fund, the Trustees noted that although the Fund’s total expenses exceeded the peer group average for one share class, overall the Fund’s total expenses were reasonable. The Trustees also noted that the Adviser has contractually agreed to limit the Fund’s expenses, although this limit did not apply because the Fund’s total expenses as shown were below the applicable fee limit.
The Trustees reviewed information on the overall profitability to the Adviser and its affiliates from their relationships with the Janus Henderson Funds, and considered profitability data of other publicly traded mutual fund advisers. The Trustees recognized that profitability comparisons among fund managers are difficult because of the variation in the type of comparative information that is publicly available, and the profitability of any fund manager is affected by numerous factors, including the organizational structure of the particular fund manager, differences in complex size, difference in product mix, difference in types of business (mutual fund, institutional and other), differences in the types of funds and other accounts it manages, possible other lines of business, the methodology for allocating expenses and the fund manager’s capital structure and cost of capital.
Janus Henderson Global Allocation Fund - Moderate
Additional Information (unaudited)
Additionally, the Trustees considered the estimated profitability to the Adviser from the investment management services it provided to each Janus Henderson Fund. In their review, the Trustees considered whether the Adviser receive adequate incentives and resources to manage the Janus Henderson Funds effectively. In reviewing profitability, the Trustees noted that the estimated profitability for an individual Janus Henderson Fund is necessarily a product of the allocation methodology utilized by the Adviser to allocate its expenses as part of the estimated profitability calculation. In this regard, the Trustees noted that the independent fee consultant found as part of its 2022 review that (1) the expense allocation methodology and rationales utilized by the Adviser were reasonable and (2) no clear correlation exists between expense allocations and operating margins. The Trustees also considered that the estimated profitability for an individual Janus Henderson Fund was influenced by a number of factors, including not only the allocation methodology selected, but also the presence of fee waivers and expense caps, and whether the Janus Henderson Fund’s investment management agreement contained breakpoints or a performance fee component. The Trustees determined, after taking into account these factors, among others, that the Adviser’s estimated profitability with respect to each Janus Henderson Fund was not unreasonable in relation to the services provided, and that the variation in the range of such estimated profitability among the Janus Henderson Funds was not a material factor in the Board’s approval of the reasonableness of any Janus Henderson Fund’s investment management fees.
The Trustees concluded that the management fees payable by each Janus Henderson Fund to the Adviser were reasonable in relation to the nature, extent, and quality of the services provided, taking into account the fees charged by other advisers for managing comparable mutual funds with similar strategies, the fees the Adviser charges to other clients, and, as applicable, the impact of fund performance on management fees payable by the Janus Henderson Funds. The Trustees also concluded that each Janus Henderson Fund’s total expenses were reasonable, taking into account the size of the Janus Henderson Fund, the quality of services provided by the Adviser, the investment performance of the Janus Henderson Fund, and any expense limitations agreed to or provided by the Adviser.
Economies of Scale
The Trustees considered information about the potential for the Adviser to realize economies of scale as the assets of the Janus Henderson Funds increase. They noted that their independent fee consultant published a report to the Trustees in June 2022 which provided its research and analysis into economies of scale. They also noted that, although many Janus Henderson Funds pay advisory fees at a fixed base rate as a percentage of net assets, without any breakpoints or performance fees, their independent fee consultant concluded that 75% of these Janus Henderson Funds’ have contractual management fees (gross of waivers) below their Broadridge Expense Group averages. The Trustees also noted the following from the independent fee consultant’s report: (1) that 31% of Janus Henderson Funds had management fee breakpoints in place whereby investors pay lower management fees as fund AUM increases; (2) that 29% of Janus Henderson Funds have low flat-rate fees and performance fees where the Adviser is incentivized to invest in resources which drive Janus Henderson Fund performance; and (3) that 39% of Janus Henderson Funds have low flat-rate fees versus peers where investors pay low fixed fees when the Janus Henderson Fund is small/midsized and higher fees when the Janus Henderson Fund grows in assets. The Trustees also noted that the Janus Henderson Funds share directly in economies of scale through the significant investments made by the Adviser and its affiliates related to services provided to the Funds and the lower charges of third-party service providers that are based in part on the combined scale of all of the Janus Henderson Funds.
The Trustees also considered the independent fee consultant’s conclusion that, given the limitations of various analytical approaches to economies of scale and their conflicting results, it is difficult to analytically confirm or deny the existence of economies of scale in the Janus Henderson complex. In this regard, the independent consultant concluded that (1) to the extent there were economies of scale at the Adviser, the Adviser’s general strategy of setting fixed management fees below peers appeared to share any such economies with investors even on smaller Janus Henderson Funds which have not yet achieved those economies and (2) by setting lower fixed fees from the start on these Janus Henderson Funds, the Adviser appeared to be investing to increase the likelihood that these Janus Henderson Funds will grow to a level to achieve any economies of scale that may exist. Further, the independent fee consultant provided its belief that Janus Henderson Fund investors are well-served by the fee levels and performance fee structures in place on the Janus Henderson Funds in light of any economies of scale that may be present at the Adviser.
Based on all of the information reviewed, including the recent and past research and analysis conducted by the Trustees’ independent fee consultant, the Trustees concluded that the current fee structure of each Janus Henderson Fund was reasonable and that the current rates of fees do reflect a sharing between the Adviser and the Janus
Janus Henderson Global Allocation Fund - Moderate
Additional Information (unaudited)
Henderson Fund of any economies of scale that may be present at the current asset level of the Janus Henderson Fund.
Other Benefits to the Adviser
The Trustees also considered benefits that accrue to the Adviser and its affiliates from their relationships with the Janus Henderson Funds. They recognized that two affiliates of the Adviser separately serve the Janus Henderson Funds as transfer agent and distributor, respectively, and the transfer agent receives compensation directly from the non-money market Janus Henderson Funds for services provided, and that such compensation contributes to the overall profitability of the Adviser and its affiliates that results from their relationship with the Janus Henderson Funds. The Trustees also considered the Adviser’s past and proposed use of commissions paid by the Janus Henderson Funds on portfolio brokerage transactions to obtain proprietary and third-party research products and services benefiting the Janus Henderson Fund and/or other clients of the Adviser and/or the Adviser. The Trustees concluded that the Adviser’s use of these types of client commission arrangements to obtain proprietary and third-party research products and services was consistent with regulatory requirements and guidelines and was likely to benefit each Janus Henderson Fund. The Trustees also concluded that, other than the services provided by the Adviser and its affiliates pursuant to the agreements and the fees to be paid by each Janus Henderson Fund therefor, the Janus Henderson Funds and the Adviser may potentially benefit from their relationship with each other in other ways. They concluded that the Adviser and its affiliates share directly in economies of scale through the lower charges of third-party service providers that are based in part on the combined scale of the Janus Henderson Funds and other clients serviced by the Adviser and its affiliates. They also concluded that the Adviser benefits from the receipt of research products and services acquired through commissions paid on portfolio transactions of the Janus Henderson Funds and that the Janus Henderson Funds benefit from the Adviser’s receipt of those products and services as well as research products and services acquired through commissions paid by other clients of the Adviser. They further concluded that the success of any Janus Henderson Fund could attract other business to the Adviser or other Janus Henderson Funds, and that the success of the Adviser could enhance the Adviser’s ability to serve the Janus Henderson Funds.
Janus Henderson Global Allocation Fund - Moderate
Liquidity Risk Management Program (unaudited)
Liquidity Risk Management Program
Rule 22e-4 under the Investment Company Act of 1940, as amended (the “Liquidity Rule”), requires open-end funds (but not money market funds) to adopt and implement a written liquidity risk management program (the “LRMP”) that is reasonably designed to assess and manage liquidity risk, which is the risk that a fund could not meet redemption requests without significant dilution of remaining investors’ interest in the fund. The Fund has implemented a LRMP, which incorporates the following elements: (i) assessment, management, and periodic review of liquidity risk; (ii) classification of portfolio holdings; (iii) the establishment and monitoring of a highly liquid investment minimum, as applicable; (iv) a 15% limitation on a Fund’s illiquid investments; (v) redemptions in-kind; and (vi) board oversight.
The Trustees of the Fund (the “Trustees”) have designated Janus Henderson Investors US LLC, the Fund’s investment adviser (the “Adviser”), as the Program Administrator for the LRMP responsible for administering the LRMP and carrying out the specific responsibilities of the LRMP. A working group comprised of various teams within the Adviser’s business is responsible for administering the LRMP and carrying out the specific responsibilities of different aspects of the LRMP (the “Liquidity Risk Working Group”). In assessing each Fund’s liquidity risk, the Liquidity Risk Working Group periodically considers, as relevant, factors including (i) the liquidity of a Fund’s portfolio investments during normal and reasonably foreseeable stressed conditions; (ii) whether a Fund’s investment strategy is appropriate for an open-end fund; (iii) the extent to which a Fund’s strategy involves a relatively concentrated portfolio or large positions in any issuer; (iv) a Fund’s use of borrowing for investment purposes; and (v) a Fund’s use of derivatives.
The Liquidity Rule requires the Trustees to review at least annually a written report provided by the Program Administrator that addresses the operation of the LRMP and assesses its adequacy and the effectiveness of its implementation, including, if applicable, the operation of the highly liquid investment minimum, and any material changes to the LRMP (the “Program Administrator Report”). At a meeting held on March 15, 2023, the Adviser provided the Program Administrator Report to the Trustees which covered the operation of the LRMP from January 1, 2022 through December 31, 2022 (the “Reporting Period”).
The Program Administrator Report discussed the operation and effectiveness of the LRMP during the Reporting Period. Among other things, the Program Administrator Report indicated that there were no material changes to the LRMP during the Reporting Period, although there were certain methodology adjustments implemented relating to a change in data provider. Additionally, the findings presented in the Program Administrator Report indicated that the LRMP operated adequately during the Reporting Period. These findings included that the Fund was able to meet redemptions during the normal course of business during the Reporting Period. The Program Administrator Report also stated that the Fund did not exceed the 15% limit on illiquid assets during the Reporting Period, that the Fund held primarily highly liquid assets, and was considered to be a primarily highly liquid fund during the Reporting Period. Also included among the Program Administrator Report’s findings was the determination that the Fund’s investment strategy remains appropriate for an open-end fund. In addition, the Adviser expressed its belief in the Program Administrator Report that the LRMP is reasonably designed and adequate to assess and manage the Fund’s liquidity risk, considering the Fund’s particular risks and circumstances, and includes policies and procedures reasonably designed to implement each required component of the Liquidity Rule.
There can be no assurance that the LRMP will achieve its objectives in the future. Please refer to your Fund’s prospectus for more information regarding the risks to which an investment in the Fund may be subject.
Janus Henderson Global Allocation Fund - Moderate
Useful Information About Your Fund Report (unaudited)
Management Commentary
The Management Commentary in this report includes valuable insight as well as statistical information to help you understand how your Fund’s performance and characteristics stack up against those of comparable indices.
If the Fund invests in foreign securities, this report may include information about country exposure. Country exposure is based primarily on the country of risk. A company may be allocated to a country based on other factors such as location of the company’s principal office, the location of the principal trading market for the company’s securities, or the country where a majority of the company’s revenues are derived.
Please keep in mind that the opinions expressed in the Management Commentary are just that: opinions. They are a reflection based on best judgment at the time this report was compiled, which was June 30, 2023. As the investing environment changes, so could opinions. These views are unique and are not necessarily shared by fellow employees or by Janus Henderson in general.
Performance Overviews
Performance overview graphs compare the performance of a hypothetical $10,000 investment in the Fund with one or more widely used market indices. When comparing the performance of the Fund with an index, keep in mind that market indices are not available for investment and do not reflect deduction of expenses.
Average annual total returns are quoted for a Fund with more than one year of performance history. Average annual total return is calculated by taking the growth or decline in value of an investment over a period of time, including reinvestment of dividends and distributions, then calculating the annual compounded percentage rate that would have produced the same result had the rate of growth been constant throughout the period. Average annual total return does not reflect the deduction of taxes that a shareholder would pay on Fund distributions or redemptions of Fund shares.
Cumulative total returns are quoted for a Fund with less than one year of performance history. Cumulative total return is the growth or decline in value of an investment over time, independent of the period of time involved. Cumulative total return does not reflect the deduction of taxes that a shareholder would pay on Fund distributions or redemptions of Fund shares.
Pursuant to federal securities rules, expense ratios shown in the performance chart reflect subsidized (if applicable) and unsubsidized ratios. The total annual fund operating expenses ratio is gross of any fee waivers, reflecting the Fund’s unsubsidized expense ratio. The net annual fund operating expenses ratio (if applicable) includes contractual waivers of the Adviser and reflects the Fund’s subsidized expense ratio. Ratios may be higher or lower than those shown in the “Financial Highlights” in this report.
Schedule of Investments
Following the performance overview section is the Fund’s Schedule of Investments. This schedule reports the types of securities held in the Fund on the last day of the reporting period. Securities are usually listed by type (common stock, corporate bonds, U.S. Government obligations, etc.) and by industry classification (banking, communications, insurance, etc.). Holdings are subject to change without notice.
The value of each security is quoted as of the last day of the reporting period. The value of securities denominated in foreign currencies is converted into U.S. dollars.
If the Fund invests in foreign securities, it will also provide a summary of investments by country. This summary reports the Fund exposure to different countries by providing the percentage of securities invested in each country. The country of each security represents the country of risk. The Fund’s Schedule of Investments relies upon the industry group and country classifications published by Bloomberg and/or MSCI Inc.
Tables listing details of individual forward currency contracts, futures, written options, swaptions, and swaps follow the Fund’s Schedule of Investments (if applicable).
Statement of Assets and Liabilities
This statement is often referred to as the “balance sheet.” It lists the assets and liabilities of the Fund on the last day of the reporting period.
Janus Henderson Global Allocation Fund - Moderate
Useful Information About Your Fund Report (unaudited)
The Fund’s assets are calculated by adding the value of the securities owned, the receivable for securities sold but not yet settled, the receivable for dividends declared but not yet received on securities owned, and the receivable for Fund shares sold to investors but not yet settled. The Fund’s liabilities include payables for securities purchased but not yet settled, Fund shares redeemed but not yet paid, and expenses owed but not yet paid. Additionally, there may be other assets and liabilities such as unrealized gain or loss on forward currency contracts.
The section entitled “Net Assets Consist of” breaks down the components of the Fund’s net assets. Because the Fund must distribute substantially all earnings, you will notice that a significant portion of net assets is shareholder capital.
The last section of this statement reports the net asset value (“NAV”) per share on the last day of the reporting period. The NAV is calculated by dividing the Fund’s net assets for each share class (assets minus liabilities) by the number of shares outstanding.
Statement of Operations
This statement details the Fund’s income, expenses, realized gains and losses on securities and currency transactions, and changes in unrealized appreciation or depreciation of Fund holdings.
The first section in this statement, entitled “Investment Income,” reports the dividends earned from securities and interest earned from interest-bearing securities in the Fund.
The next section reports the expenses incurred by the Fund, including the advisory fee paid to the investment adviser, transfer agent fees and expenses, and printing and postage for mailing statements, financial reports and prospectuses. Expense offsets and expense reimbursements, if any, are also shown.
The last section lists the amounts of realized gains or losses from investment and foreign currency transactions, and changes in unrealized appreciation or depreciation of investments and foreign currency-denominated assets and liabilities. The Fund will realize a gain (or loss) when it sells its position in a particular security. A change in unrealized gain (or loss) refers to the change in net appreciation or depreciation of the Fund during the reporting period. “Net Realized and Unrealized Gain/(Loss) on Investments” is affected both by changes in the market value of Fund holdings and by gains (or losses) realized during the reporting period.
Statements of Changes in Net Assets
These statements report the increase or decrease in the Fund’s net assets during the reporting period. Changes in the Fund’s net assets are attributable to investment operations, dividends and distributions to investors, and capital share transactions. This is important to investors because it shows exactly what caused the Fund’s net asset size to change during the period.
The first section summarizes the information from the Statement of Operations regarding changes in net assets due to the Fund’s investment operations. The Fund’s net assets may also change as a result of dividend and capital gains distributions to investors. If investors receive their dividends and/or distributions in cash, money is taken out of the Fund to pay the dividend and/or distribution. If investors reinvest their dividends and/or distributions, the Fund’s net assets will not be affected.
The reinvestment of dividends and distributions is included under “Capital Share Transactions.” “Capital Shares” refers to the money investors contribute to the Fund through purchases or withdrawals via redemptions. The Fund’s net assets will increase and decrease in value as investors purchase and redeem shares from the Fund.
Financial Highlights
This schedule provides a per-share breakdown of the components that affect the Fund’s NAV for current and past reporting periods as well as total return, asset size, ratios, and portfolio turnover rate.
The first line in the table reflects the NAV per share at the beginning of the reporting period. The next line reports the net investment income/(loss) per share. Following is the per share total of net gains/(losses), realized and unrealized. Per share dividends and distributions to investors are then subtracted to arrive at the NAV per share at the end of the period. The next line reflects the total return for the period. The total return may include adjustments in accordance with generally accepted accounting principles required at the period end for financial reporting purposes. As a result, the total return may differ from the total return reflected for individual shareholder transactions. Also included are ratios of expenses and net investment income to average net assets.
Janus Henderson Global Allocation Fund - Moderate
Useful Information About Your Fund Report (unaudited)
The Fund’s expenses may be reduced through expense offsets and expense reimbursements. The ratios shown reflect expenses before and after any such offsets and reimbursements.
The ratio of net investment income/(loss) summarizes the income earned less expenses, divided by the average net assets of the Fund during the reporting period. Do not confuse this ratio with the Fund’s yield. The net investment income ratio is not a true measure of the Fund’s yield because it does not take into account the dividends distributed to the Fund’s investors.
The next figure is the portfolio turnover rate, which measures the buying and selling activity in the Fund. Portfolio turnover is affected by market conditions, changes in the asset size of the Fund, fluctuating volume of shareholder purchase and redemption orders, the nature of the Fund’s investments, and the investment style and/or outlook of the portfolio manager(s) and/or investment personnel. A 100% rate implies that an amount equal to the value of the entire portfolio was replaced once during the fiscal year; a 50% rate means that an amount equal to the value of half the portfolio is traded in a year; and a 200% rate means that an amount equal to the value of the entire portfolio is traded every six months.
Janus Henderson Global Allocation Fund - Moderate
Designation Requirements (unaudited)
For federal income tax purposes, the Fund designated the following for the year ended June 30, 2023:
| | |
| | |
Capital Gain Distributions | $3,938,843 |
Foreign Taxes Paid | $113,418 |
Foreign Source Income | $279,207 |
Dividends Received Deduction Percentage | 21% |
Qualified Dividend Income Percentage | 54% |
Janus Henderson Global Allocation Fund - Moderate
Trustees and Officers (unaudited)
The following are the Trustees and officers of the Trust, together with a brief description of their principal occupations during the last five years (principal occupations for certain Trustees may include periods over five years). The Fund’s Statement of Additional Information includes additional information about the Trustees and officers and is available, without charge, by calling 1-877-335-2687.
Each Trustee has served in that capacity since he or she was originally elected or appointed. The Trustees do not serve a specified term of office. Each Trustee will hold office until the termination of the Trust or his or her earlier death, resignation, retirement, incapacity, or removal. Under the Fund’s Governance Procedures and Guidelines, the policy is for Trustees to retire no later than the end of the calendar year in which the Trustee turns 75. The Trustees review the Fund’s Governance Procedures and Guidelines from time to time and may make changes they deem appropriate. The Fund’s Nominating and Governance Committee will consider nominees for the position of Trustee recommended by shareholders. Shareholders may submit the name of a candidate for consideration by the Committee by submitting their recommendations to the Trust’s Secretary. Each Trustee is currently a Trustee of one other registered investment company advised by the Adviser: Janus Aspen Series. Collectively, these two registered investment companies consist of 49 series or funds referred to herein as the Fund Complex.
The Trust’s officers are elected annually by the Trustees for a one-year term. Certain officers also serve as officers of Janus Aspen Series. Certain officers of the Fund may also be officers and/or directors of the Adviser. Except as otherwise disclosed, Fund officers receive no compensation from the Fund, except for the Fund’s Chief Compliance Officer, as authorized by the Trustees.
| | | | | | |
TRUSTEES |
Name, Address, and Age | Positions Held with the Trust | Length of Time Served | Principal Occupations During the Past Five Years | Number of Portfolios/Funds in Fund Complex Overseen by Trustee | Other Directorships Held by Trustee During the Past Five Years |
Independent Trustees | | | | |
Alan A. Brown
151 Detroit Street
Denver, CO 80206
DOB: 1962 | Chairman
Trustee | 5/22-Present
1/13-Present | Principal, Curam Holdings LLC (since 2018). Formerly, Executive Vice President, Institutional Markets, of Black Creek Group (private equity real estate investment management firm) (2012-2018), Executive Vice President and Co-Head, Global Private Client Group (2007-2010), Executive Vice President, Mutual Funds (2005-2007), and Chief Marketing Officer (2001-2005) of Nuveen Investments, Inc. (asset management). | 49 | Advisory Board Member of AEW Core Property Trust (open-end property fund) (since 2020), and Director of WTTW (PBS affiliate) (since 2003). Formerly, Director of MotiveQuest LLC (strategic social market research company) (2003-2016), Director of Nuveen Global Investors LLC (2007-2011), Director of Communities in Schools (2004-2010), and Director of Mutual Fund Education Alliance (until 2010). |
Janus Henderson Global Allocation Fund - Moderate
Trustees and Officers (unaudited)
| | | | | | |
TRUSTEES |
Name, Address, and Age | Positions Held with the Trust | Length of Time Served | Principal Occupations During the Past Five Years | Number of Portfolios/Funds in Fund Complex Overseen by Trustee | Other Directorships Held by Trustee During the Past Five Years |
Independent Trustees | | | | |
Cheryl D. Alston
151 Detroit Street
Denver, CO 80206
DOB: 1966 | Trustee | 8/22-Present | Executive Director and Chief Investment Officer, Employees’ Retirement Fund of the City of Dallas (since 2004). | 49 | Director of Blue Cross Blue Shield of Kansas City (a not-for-profit health insurance provider) (since 2016) and Director of Global Life Insurance (life and supplemental health insurance provider) (since 2017). Formerly, Director of Federal Home Loan Bank of Dallas (2017-2021). |
Janus Henderson Global Allocation Fund - Moderate
Trustees and Officers (unaudited)
| | | | | | |
TRUSTEES |
Name, Address, and Age | Positions Held with the Trust | Length of Time Served | Principal Occupations During the Past Five Years | Number of Portfolios/Funds in Fund Complex Overseen by Trustee | Other Directorships Held by Trustee During the Past Five Years |
Independent Trustees | | | | |
Janus Henderson Global Allocation Fund - Moderate
Trustees and Officers (unaudited)
| | | | | | |
William D. Cvengros
151 Detroit Street
Denver, CO 80206
DOB: 1948 | Trustee | 1/11-Present | Chief Executive Officer of SJC Capital, LLC (a personal investment company and consulting firm) (since 2002). Formerly, Chief Executive Officer and President of PIMCO Advisors Holdings L.P. (a publicly traded investment management firm) (1994-2000), and Chief Investment Officer (1987-1994) and Vice Chairman and Director (1990-1994) of Pacific Life Insurance Company (a mutual life insurance and annuity company) (1987-1994). | 49 | Member, Limited Partner Advisory Committee, Karmel Capital Fund III (later stage growth fund) (since 2022), Member of the Investment Committee for the Orange County Community Foundation (a grantmaking foundation) (since 2020), Advisory Board Member, RevOZ Fund LP and related funds (real estate investments for opportunity zones) (since 2020), and Advisory Board Member, Innovate Partners Emerging Growth and Equity Fund I (early stage venture capital fund) (since 2014). Formerly, Managing Trustee of National Retirement Partners Liquidating Trust (2013-2016), Chairman, National Retirement Partners, Inc. (formerly a network of advisors to 401(k) plans) (2005-2013), Director of Prospect Acquisition Corp. (a special purpose acquisition corporation) (2007-2009), Director of RemedyTemp, Inc. (temporary help services company) (1996-2006), and Trustee of PIMCO Funds Multi-Manager Series (1990-2000) and Pacific Life Variable Life & Annuity Trusts (1987-1994). |
Janus Henderson Global Allocation Fund - Moderate
Trustees and Officers (unaudited)
| | | | | | |
TRUSTEES |
Name, Address, and Age | Positions Held with the Trust | Length of Time Served | Principal Occupations During the Past Five Years | Number of Portfolios/Funds in Fund Complex Overseen by Trustee | Other Directorships Held by Trustee During the Past Five Years |
Independent Trustees | | | | |
Raudline Etienne
151 Detroit Street
Denver, CO 80206
DOB: 1965 | Trustee | 6/16-Present | Founder, Daraja Capital (advisory and investment firm) (since 2016). Formerly, Senior Vice President and Senior Advisor, Albright Stonebridge Group LLC (global strategy firm) (2011-2021), and Deputy Comptroller and Chief Investment Officer, New York State Common Retirement Fund (public pension fund) (2008-2011). | 49 | Member of the Investment Committee for Cooper Union (private college) (since 2021) and Director of Brightwood Capital Advisors, LLC (since 2014). Formerly, Board Member, Van Alen Institute (nonprofit architectural and design organization) (2019-2022). |
Darrell B. Jackson
151 Detroit Street
Denver, CO 80206
DOB: 1958 | Trustee | 8/22-Present | President and Chief Executive Officer, The Efficace Group Inc. (since 2018). Formerly, President and Chief Executive Officer, Seaway Bank and Trust Company (community bank) (2014-2015), and Executive Vice President and Co-President, Wealth Management (2009-2014), and several senior positions, including Group Executive, Senior Vice President, and Vice President (1995-2009) of Northern Trust Company (financial services company) (1995-2014). | 49 | Director of Amalgamated Financial Corp (bank) (since August 2021), Director of YR Media (a not-for-profit production company) (since 2021), and Director of Gray-Bowen-Scott (transportation project consulting firm) (since April 2020). Formerly, Director of Delaware Place Bank (closely held commercial bank) (2016-2018) and Director of Seaway Bank and Trust Company (2014-2015). |
Janus Henderson Global Allocation Fund - Moderate
Trustees and Officers (unaudited)
| | | | | | |
TRUSTEES |
Name, Address, and Age | Positions Held with the Trust | Length of Time Served | Principal Occupations During the Past Five Years | Number of Portfolios/Funds in Fund Complex Overseen by Trustee | Other Directorships Held by Trustee During the Past Five Years |
Independent Trustees | | | | |
William F. McCalpin
151 Detroit Street
Denver, CO 80206
DOB: 1957 | Trustee | 6/02-Present | Chief Executive Officer, muun chi LLC (organic food business) (since 2022) and Independent Consultant (since 2019). Formerly, Chief Operating Officer, muun chi LLC (2020-2022), Managing Partner, Impact Investments, Athena Capital Advisors LLC (independent registered investment advisor) (2016-2019), Managing Director, Holos Consulting LLC (provides consulting services to foundations and other nonprofit organizations) (2009-2016), Chief Executive Officer, Imprint Capital Advisors (impact investment firm) (2013-2015), and Executive Vice President and Chief Operating Officer of The Rockefeller Brothers Fund (a private family foundation) (1998-2006). | 49 | Chairman of the Board and Trustee of The Investment Fund for Foundations Investment Program (TIP) (consisting of 1 fund) (since 2008). Formerly, Director of the F.B. Heron Foundation (a private grantmaking foundation) (2006-2022), and Director of Mutual Fund Directors Forum (a non-profit organization serving independent directors of U.S. mutual funds) (2016-2021). |
Janus Henderson Global Allocation Fund - Moderate
Trustees and Officers (unaudited)
| | | | | | |
TRUSTEES |
Name, Address, and Age | Positions Held with the Trust | Length of Time Served | Principal Occupations During the Past Five Years | Number of Portfolios/Funds in Fund Complex Overseen by Trustee | Other Directorships Held by Trustee During the Past Five Years |
Independent Trustees | | | | |
Gary A. Poliner
151 Detroit Street
Denver, CO 80206
DOB: 1953 | Trustee | 6/16-Present | Retired. Formerly, President (2010-2013) of Northwestern Mutual Life Insurance Company. | 49 | Director of MGIC Investment Corporation (private mortgage insurance) (since 2013). Formerly, Director, West Bend Mutual Insurance Company (property/casualty insurance) (2013-2021), Trustee of Northwestern Mutual Life Insurance Company (2010-2013) and Director of Frank Russell Company (global asset management firm) (2008-2013). |
Diane L. Wallace
151 Detroit Street
Denver, CO 80206
DOB: 1958 | Trustee | 6/17-Present | Retired. Formerly, Chief Operating Officer, Senior Vice President-Operations, and Chief Financial Officer for Driehaus Capital Management, LLC (1988-2006) and Treasurer for Driehaus Mutual Funds (1996-2002). | 49 | Formerly, Director of Family Service of Lake County (2019-2021), Independent Trustee, Henderson Global Funds (13 portfolios) (2015-2017), Independent Trustee, State Farm Associates’ Funds Trust, State Farm Mutual Fund Trust, and State Farm Variable Product Trust (28 portfolios) (2013-2017). |
Janus Henderson Global Allocation Fund - Moderate
Trustees and Officers (unaudited)
| | | | |
OFFICERS |
Name, Address, and Age | Positions Held with the Trust | Term of Office* and Length of Time Served | Principal Occupations During the Past Five Years |
Ashwin Alankar
151 Detroit Street
Denver, CO 80206
DOB: 1974 | Executive Vice President and Portfolio Manager
Janus Henderson Global Allocation Fund - Moderate | 9/14-Present | Head of Global Asset Allocation of Janus Henderson Investors and Portfolio Manager for other Janus Henderson accounts. |
Michelle Rosenberg
151 Detroit Street
Denver, CO 80206
DOB: 1973 | President and Chief Executive Officer | 9/22-Present | General Counsel and Corporate Secretary of Janus Henderson Investors (since 2018). Formerly, Interim President and Chief Executive Officer of the Trust and Janus Aspen Series (2022), Senior Vice President and Head of Legal, North America of Janus Henderson Investors (2017-2018) and Deputy General Counsel of Janus Henderson US (Holdings) Inc. (2015-2018). |
Kristin Mariani
151 Detroit Street
Denver, CO 80206
DOB: 1966 | Vice President and Chief Compliance Officer | 7/20-Present | Head of Compliance, North America at Janus Henderson Investors (since September 2020) and Chief Compliance Officer at Janus Henderson Investors US LLC (since September 2017). Formerly, Anti-Money Laundering Officer for the Trust and Janus Aspen Series (July 2020-December 2022), Global Head of Investment Management Compliance at Janus Henderson Investors (February 2019-August 2020), Vice President, Head of Global Distribution Compliance and Chief Compliance Officer at Janus Henderson Distributors US LLC (May 2017-September 2017), Vice President, Compliance at Janus Henderson US (Holdings) Inc., Janus Henderson Investors US LLC, and Janus Henderson Distributors US LLC (2009-2017). |
Jesper Nergaard
151 Detroit Street
Denver, CO 80206
DOB: 1962 | Chief Financial Officer
Vice President, Treasurer, and Principal Accounting Officer | 3/05-Present
2/05-Present | Head of U.S. Fund Administration, Janus Henderson Investors and Janus Henderson Services US LLC. |
Janus Henderson Global Allocation Fund - Moderate
Trustees and Officers (unaudited)
| | | | |
OFFICERS |
Name, Address, and Age | Positions Held with the Trust | Term of Office* and Length of Time Served | Principal Occupations During the Past Five Years |
Abigail J. Murray
151 Detroit Street
Denver, CO 80206
DOB: 1975 | Vice President, Chief Legal Counsel, and Secretary | 12/20-Present | Managing Counsel (since 2020). Formerly, Senior Counsel for Invesco Ltd. (2017-2020), and Vice President and Senior Counsel, ALPS Fund Services, Inc. and Assistant General Counsel, ALPS Advisors, Inc. (2015-2017). |
Ciaran Askin
151 Detroit Street
Denver, CO 80206
DOB: 1978 | Anti-Money Laundering Officer | 12/22-Present | Global Head of Financial Crime, Janus Henderson Investors (since 2022). Formerly, Global Head of Financial Crime for Invesco Ltd. (2017-2022). |
* Officers are elected at least annually by the Trustees for a one-year term and may also be elected from time to time by the Trustees for an interim period. |
Janus Henderson Global Allocation Fund - Moderate
Notes
NotesPage1
| | | | | | | | |
| | | | | |

| | | | |
This report is submitted for the general information of shareholders of the Fund. It is not an offer or solicitation for the Fund and is not authorized for distribution to prospective investors unless preceded or accompanied by an effective prospectus. |
Janus Henderson is a trademark of Janus Henderson Group plc or one of its subsidiaries. © Janus Henderson Group plc Janus Henderson Distributors US LLC Janus Henderson Group is the ultimate parent of Janus Henderson Distributors US LLC |
| | | | 125-02-93022 08-23 |
| | | |
| | | |
| | | ANNUAL REPORT June 30, 2023 |
| | |
| | Janus Henderson Global Bond Fund |
| | |
| | Janus Investment Fund |
| |
| | | |
| | | HIGHLIGHTS · Portfolio management perspective · Investment strategy behind your fund · Fund performance, characteristics
and holdings |
Table of Contents
Janus Henderson Global Bond Fund
Janus Henderson Global Bond Fund (unaudited)
| | | | | | |
| | | 
Helen Anthony co-portfolio manager | 
John Pattullo co-portfolio manager | 
Jenna Barnard co-portfolio manager |
| | | |
PERFORMANCE OVERVIEW
For the 12-month period ended June 30, 2023, the Janus Henderson Global Bond Fund Class I shares returned -2.67%, compared with a return of -1.32% for the Bloomberg Global Aggregate Bond Index.
INVESTMENT ENVIRONMENT
Global bonds came under substantial pressure during the period, with positive corporate returns more than offset by negative returns in U.S. Treasuries and sovereigns. Global rates rose as central banks continued to battle inflation. The U.S. Federal Reserve (Fed), European Central Bank (ECB), and Bank of England (BOE) all embarked on a series of consistent rate increases, with mixed results. The U.S. economy remained the most resilient, with solid first-quarter gross domestic product (GDP) growth, consistent labor growth, and moderating inflation. Inflation, however, remained elevated in the UK, and the euro area officially entered a recession. Nonetheless, global investment-grade and high-yield credit spreads1 ended the period tighter as investor risk appetite rose on resilient U.S. economic data and moderating inflation.
PERFORMANCE DISCUSSION
Credit markets were weak in the first part of the period, with exposure to corporate credit and high-yield bonds dragging on returns. As signs of a deteriorating economic cycle became more apparent, we reduced overall credit exposure and moved to an overweight stance on agency mortgage-backed securities (MBS), recognizing the compelling valuation of current coupon agency MBS when compared to investment-grade corporate bonds. Within the corporate bond allocation, we tilted exposure toward large-cap noncyclical credits and reduced exposure to financials ahead of the March 2023 turmoil.
Government bond yields continued to trend higher over the period (prices fell), as central banks retained a focus on hiking interest rates to bring down inflation. As global yields continued to rise, we closed our long position in short-term Swiss rates as it reached our loss threshold. However, we made some gains from our short bond futures positions in core markets that we managed tactically over the period. Currency management aided performance, notably with the outperformance of the U.S. dollar versus a basket of Asian currencies.
Yield curve2 positions were the main detractors. The portfolio made gains in Japan, where we expected the yield curve to steepen, but losses in the euro area, where the portfolio was positioned for the yield curve to flatten. We exited our position in the UK, expecting front-end rates to outperform relative to intermediate maturities at a loss.
Toward the end of 2022, we materially increased portfolio duration in the U.S. and Australia on the expectation that government bond yields had peaked and would recouple with the deteriorating economic cycle.
DERIVATIVES USAGE
During the period, the portfolio used interest rate futures and swaps to help manage portfolio risk, duration3, and yield curve exposure. The portfolio also used credit default swaps to adjust the risk profile of the portfolio and manage exposure to the corporate credit market. The use of derivatives contributed to relative results during the period.
Please see the Derivative Instruments section in the “Notes to Financial Statements” for a discussion of derivatives used by the fund.
Janus Henderson Global Bond Fund (unaudited)
OUTLOOK
Bonds are a reflexive asset class. The higher central banks increase rates, the bigger the potential cost in lost output and unemployment. Some commentators suggest that we have only seen around one-third of the effect of the rate increases so far. The key issue for central banks is how quickly core inflation can be squeezed out of the system. The core inflation story seems to be that the U.S. is further along in bringing inflation down, while Europe’s position is more tentative. The UK remains the outlier, with high inflation still. Central banks in most markets appear to be contemplating the past few rate hikes in the cycle.
The portfolio's current duration position is higher than that of the benchmark. We have not made any significant changes to duration positioning, as we continue to believe that bond yields will recouple with the weak economic momentum. We continue to favor sovereign bonds and agency MBS and maintain a modest underweight position to corporate bonds, as we expect credit spreads to come under pressure from the impending downturn.
Thank you for your continued investment in the Janus Henderson Global Bond Fund.
1 Credit spread is the difference in yield between securities with similar maturity but different credit quality. Widening spreads generally indicate deteriorating creditworthiness of corporate borrowers and narrowing indicates improving.
2 A yield curve plots the yields (interest rate) of bonds with equal credit quality but differing maturity dates. Typically, bonds with longer maturities have higher yields. An inverted yield curve occurs when short-term yields are higher than long-term yields.
3 Duration measures a bond price’s sensitivity to changes in interest rates. The longer a bond’s duration, the higher its sensitivity to changes in interest rates and vice versa.
Important Notice – Tailored Shareholder Reports
Effective January 24, 2023, the Securities and Exchange Commission (the “SEC”) adopted rule and form amendments that require mutual funds and exchange-traded funds to provide shareholders with streamlined annual and semi-annual shareholder reports that highlight key information. Other information, including financial statements, that currently appears in shareholder reports will be made available online, delivered free of charge to shareholders upon request, and filed with the SEC. The first tailored shareholder report for the Fund will be for the reporting period ending June 30, 2024. Currently, management is evaluating the impact of the rule and form amendments on the content of the Fund’s current shareholder reports.
Janus Henderson Global Bond Fund (unaudited)
Fund At A Glance
June 30, 2023
| | | |
Fund Profile | | |
30-day SEC Yield* | Without
Reimbursement | With
Reimbursement |
Class A Shares NAV | 1.70% | 2.20% |
Class A Shares MOP | 1.62% | 2.10% |
Class C Shares** | 0.75% | 1.50% |
Class D Shares | 2.34% | 2.54% |
Class I Shares | 2.30% | 2.47% |
Class N Shares | 2.47% | 2.63% |
Class S Shares | -2.67% | 2.11% |
Class T Shares | 2.10% | 2.38% |
Weighted Average Maturity | 8.8 Years |
Average Effective Duration*** | 8.1 Years |
* Yield will fluctuate. | | |
** Does not include the 1.00% contingent deferred sales charge. |
*** A theoretical measure of price volatility. | |
| | |
Ratings† Summary - (% of Total Investments) | |
AAA | 1.9% |
AA | 38.4% |
A | 6.2% |
BBB | 8.8% |
Not Rated | 42.3% |
Other | 2.4% |
† Credit ratings provided by Standard & Poor's (S&P), an independent credit rating agency. Credit ratings range from AAA (highest) to D (lowest) based on S&P's measures. Further information on S&P's rating methodology may be found at www.standardandpoors.com. Other rating agencies may rate the same securities differently. Ratings are relative and subjective and are not absolute standards of quality. Credit quality does not remove market risk and is subject to change. "Not Rated" securities are not rated by S&P, but may be rated by other rating agencies and do not necessarily indicate low quality. "Other" includes cash equivalents, equity securities, and certain derivative instruments. |
Significant Areas of Investment - (% of Net Assets)
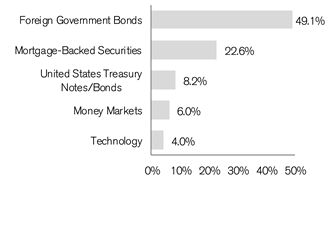
| | | | | | |
Asset Allocation - (% of Net Assets) | |
Foreign Government Bonds | | 49.1% | |
Mortgage-Backed Securities | | 22.6% | |
Corporate Bonds | | 16.5% | |
United States Treasury Notes/Bonds | | 8.2% | |
Investment Companies | | 6.0% | |
Asset-Backed/Commercial Mortgage-Backed Securities | | 0.9% | |
Investments Purchased with Cash Collateral from Securities Lending | | 0.2% | |
Other | | (3.5)% |
| | | 100.0% |
Emerging markets comprised 10.4% of total net assets.
Janus Henderson Global Bond Fund (unaudited)
Performance
| |
See important disclosures on the next page. |
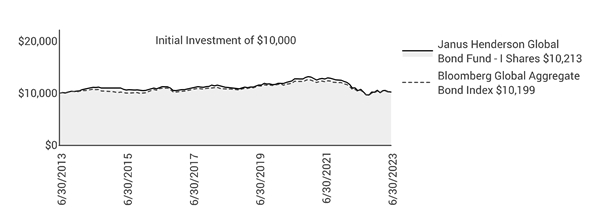
| | | | | | | | | | | |
| | | | | | | | | |
| | | | | | | | | |
Average Annual Total Return - for the periods ended June 30, 2023 | | | Prospectus Expense Ratios |
| | One
Year | Five
Year | Ten
Year | Since
Inception* | | | Total Annual Fund
Operating Expenses‡ | Net Annual Fund
Operating Expenses‡ |
Class A Shares at NAV | | -2.93% | -1.90% | -0.04% | 0.66% | | | 1.29% | 0.96% |
Class A Shares at MOP | | -7.50% | -2.85% | -0.52% | 0.27% | | | | |
Class C Shares at NAV | | -3.64% | -2.64% | -0.79% | -0.09% | | | 2.14% | 1.69% |
Class C Shares at CDSC | | -4.59% | -2.64% | -0.79% | -0.09% | | | | |
Class D Shares | | -2.70% | -1.69% | 0.14% | 0.83% | | | 0.93% | 0.76% |
Class I Shares | | -2.67% | -1.65% | 0.21% | 0.90% | | | 0.83% | 0.70% |
Class N Shares | | -2.44% | -1.55% | 0.31% | 0.92% | | | 0.72% | 0.59% |
Class S Shares | | -3.07% | -2.08% | -0.14% | 0.55% | | | 6.35% | 1.12% |
Class T Shares | | -2.79% | -1.80% | 0.06% | 0.74% | | | 1.02% | 0.84% |
Bloomberg Global Aggregate Bond Index | | -1.32% | -1.09% | 0.20% | 0.66% | | | | |
Morningstar Quartile - Class I Shares | | 4th | 3rd | 2nd | 2nd | | | | |
Morningstar Ranking - based on total returns for World Bond Funds | | 165/197 | 110/184 | 79/171 | 56/158 | | | | |
Returns quoted are past performance and do not guarantee future results; current performance may be lower or higher. Investment returns and principal value will vary; there may be a gain or loss when shares are sold. For the most recent month-end performance call 800.668.0434 (or 800.525.3713 if you hold shares directly with Janus Henderson) or visit janushenderson.com/performance (or janushenderson.com/allfunds if you hold shares directly with Janus Henderson).
Maximum Offering Price (MOP) returns include the maximum sales charge of 4.75%. Net Asset Value (NAV) returns exclude this charge, which would have reduced returns.
CDSC returns include a 1% contingent deferred sales charge (CDSC) on Shares redeemed within 12 months of purchase. Net Asset Value (NAV) returns exclude this charge, which would have reduced returns.
For certain periods, the Fund’s performance may reflect the effects of expense waivers.
Performance may be affected by risks that include those associated with foreign and emerging markets, fixed income securities, high-yield and high-risk securities, undervalued, overlooked and smaller capitalization companies, real estate related securities including Real Estate Investment Trusts (REITs), Environmental, Social and Governance (ESG) factors, non-diversification, portfolio turnover, derivatives, short sales, initial public offerings (IPOs) and
Janus Henderson Global Bond Fund (unaudited)
Performance
potential conflicts of interest. Each product has different risks. Please see the prospectus for more information about risks, holdings and other details.
Returns include reinvestment of all dividends and distributions and do not reflect the deduction of taxes that a shareholder would pay on Fund distributions or redemptions of Fund shares. The returns do not include adjustments in accordance with generally accepted accounting principles required at the period end for financial reporting purposes.
Class N Shares commenced operations on October 28, 2013. Performance shown for periods prior to October 28, 2013, reflects the performance of the Fund’s Class I Shares, calculated using the fees and expenses of Class N Shares, without the effect of any fee and expense limitations or waivers.
If each share class of the Fund had been available during periods prior to its commencement, the performance shown may have been different. The performance shown for periods following the Fund’s commencement of each share class reflects the fees and expenses of each respective share class, net of any applicable fee and expense limitations or waivers. Please refer to the Fund’s prospectuses for further details concerning historical performance.
Ranking is for the share class shown only; other classes may have different performance characteristics. When an expense waiver is in effect, it may have a material effect on the total return, and therefore the ranking for the period.
© 2023 Morningstar, Inc. All Rights Reserved.
There is no assurance that the investment process will consistently lead to successful investing.
See Notes to Schedule of Investments and Other Information for index definitions.
Index performance does not reflect the expenses of managing a portfolio as an index is unmanaged and not available for direct investment.
See “Useful Information About Your Fund Report.”
*The Fund’s inception date – December 28, 2010
‡ As stated in the prospectus. Net expense ratios reflect the expense waiver, if any, contractually agreed to for at least a one-year period commencing on October 28, 2022. This contractual waiver may be terminated or modified only at the discretion of the Board of Trustees. See Financial Highlights for actual expense ratios during the reporting period.
Janus Henderson Global Bond Fund (unaudited)
Expense Examples
As a shareholder of the Fund, you incur two types of costs: (1) transaction costs, such as sales charges (loads) on purchase payments (applicable to Class A Shares only); and (2) ongoing costs, including management fees; 12b-1 distribution and shareholder servicing fees; transfer agent fees and expenses payable pursuant to the Transfer Agency Agreement; and other Fund expenses. This example is intended to help you understand your ongoing costs (in dollars) of investing in the Fund and to compare these costs with the ongoing costs of investing in other mutual funds. To do so, compare this 5% hypothetical example with the 5% hypothetical examples that appear in the shareholder reports of the other funds. The example is based upon an investment of $1,000 invested at the beginning of the period and held for the six-months indicated, unless noted otherwise in the table and footnotes below.
Actual Expenses
The information in the table under the heading “Actual” provides information about actual account values and actual expenses. You may use the information in these columns, together with the amount you invested, to estimate the expenses that you paid over the period. Simply divide your account value by $1,000 (for example, an $8,600 account value divided by $1,000 = 8.6), then multiply the result by the number in the appropriate column for your share class under the heading entitled “Expenses Paid During Period” to estimate the expenses you paid on your account during the period.
Hypothetical Example for Comparison Purposes
The information in the table under the heading “Hypothetical (5% return before expenses)” provides information about hypothetical account values and hypothetical expenses based upon the Fund’s actual expense ratio and an assumed rate of return of 5% per year before expenses, which is not the Fund’s actual return. The hypothetical account values and expenses may not be used to estimate the actual ending account balance or expenses you paid for the period. You may use this information to compare the ongoing costs of investing in the Fund and other funds. To do so, compare this 5% hypothetical example with the 5% hypothetical examples that appear in the shareholder reports of the other funds. Additionally, for an analysis of the fees associated with an investment in any share class or other similar funds, please visit www.finra.org/fundanalyzer.
Please note that the expenses shown in the table are meant to highlight your ongoing costs only and do not reflect any transaction costs. These fees are fully described in the Fund’s prospectuses. Therefore, the hypothetical examples are useful in comparing ongoing costs only, and will not help you determine the relative total costs of owning different funds. In addition, if these transaction costs were included, your costs would have been higher.
| | | | | | | | | | | |
| | | | | | | | |
| | | Actual | | Hypothetical
(5% return before expenses) | |
| Beginning
Account
Value
(1/1/23) | Ending
Account
Value
(6/30/23) | Expenses
Paid During
Period
(1/1/23 - 6/30/23)† | | Beginning
Account
Value
(1/1/23) | Ending
Account
Value
(6/30/23) | Expenses
Paid During
Period
(1/1/23 - 6/30/23)† | Net Annualized
Expense Ratio
(1/1/23 - 6/30/23) |
Class A Shares | $1,000.00 | $1,003.60 | $4.87 | | $1,000.00 | $1,019.93 | $4.91 | 0.98% |
Class C Shares | $1,000.00 | $1,000.00 | $8.38 | | $1,000.00 | $1,016.41 | $8.45 | 1.69% |
Class D Shares | $1,000.00 | $1,004.90 | $3.53 | | $1,000.00 | $1,021.27 | $3.56 | 0.71% |
Class I Shares | $1,000.00 | $1,004.90 | $3.48 | | $1,000.00 | $1,021.32 | $3.51 | 0.70% |
Class N Shares | $1,000.00 | $1,006.80 | $2.99 | | $1,000.00 | $1,021.82 | $3.01 | 0.60% |
Class S Shares | $1,000.00 | $1,002.90 | $5.56 | | $1,000.00 | $1,019.24 | $5.61 | 1.12% |
Class T Shares | $1,000.00 | $1,004.30 | $4.08 | | $1,000.00 | $1,020.73 | $4.11 | 0.82% |
† | Expenses Paid During Period are equal to the Net Annualized Expense Ratio multiplied by the average account value over the period, multiplied by 181/365 (to reflect the one-half year period). Expenses in the examples include the effect of applicable fee waivers and/or expense reimbursements, if any. Had such waivers and/or reimbursements not been in effect, your expenses would have been higher. Please refer to the Notes to Financial Statements or the Fund’s prospectuses for more information regarding waivers and/or reimbursements. |
Janus Henderson Global Bond Fund
Schedule of Investments
June 30, 2023
| | | | | | | | |
Shares or
Principal Amounts | | | Value | |
Asset-Backed/Commercial Mortgage-Backed Securities– 0.9% | | | |
| | JP Morgan Mortgage Trust 2019-1 A15, 4.0000%, 5/25/49 (144A)‡ | | $97,875 | | | $91,098 | |
| | JP Morgan Mortgage Trust 2019-LTV2, 3.5000%, 12/25/49 (144A)‡ | | 4,312 | | | 4,268 | |
| | RMAC Securities No 1 2006-NS3X PLC, | | | | | | |
| | SONIA Interest Rate Benchmark + 0.2693%, 4.4902%, 6/12/44‡ | | 513,296 | GBP | | 623,563 | |
| | RMAC Securities No 1 2006-NS4X PLC, | | | | | | |
| | SONIA Interest Rate Benchmark + 0.2893%, 4.5102%, 6/12/44‡ | | 501,004 | GBP | | 610,009 | |
| | RMAC Securities No 1 PLC, | | | | | | |
| | SONIA Interest Rate Benchmark + 0.2693%, 4.4902%, 6/12/44‡ | | 143,963 | GBP | | 175,054 | |
Total Asset-Backed/Commercial Mortgage-Backed Securities (cost $1,569,709) | | 1,503,992 | |
Corporate Bonds– 16.5% | | | |
Banking – 3.9% | | | |
| | American Express Co, 4.0500%, 5/3/29 | | 467,000 | | | 444,593 | |
| | Bank of America Corp, EURIBOR 3 Month + 3.6700%, 3.6480%, 3/31/29‡ | | 515,000 | EUR | | 544,447 | |
| | BNP Paribas SA, 2.8750%, 2/24/29 | | 400,000 | GBP | | 419,083 | |
| | Credit Agricole SA/London, SOFR + 1.6760%, 1.9070%, 6/16/26 (144A)‡ | | 372,000 | | | 342,433 | |
| | Goldman Sachs Group Inc, 0.2500%, 1/26/28 | | 341,000 | EUR | | 311,093 | |
| | HSBC Holdings PLC, SOFR + 1.9290%, 2.0990%, 6/4/26‡ | | 1,100,000 | | | 1,017,890 | |
| | ING Groep NV, EURIBOR 3 Month + 0.8500%, 1.2500%, 2/16/27‡ | | 200,000 | EUR | | 199,652 | |
| | JPMorgan Chase & Co, EURIBOR 3 Month + 0.7600%, 1.0900%, 3/11/27‡ | | 600,000 | EUR | | 598,151 | |
| | JPMorgan Chase & Co, CME Term SOFR 3 Month + 3.7900%, 4.4930%, 3/24/31‡ | | 666,000 | | | 640,205 | |
| | Morgan Stanley, SOFR + 0.9400%, 2.6300%, 2/18/26‡ | | 791,000 | | | 749,871 | |
| | Royal Bank of Scotland Group PLC, | | | | | | |
| | UK Govt Bonds 5 Year Note Generic Bid Yield + 3.5500%, 3.6220%, 8/14/30‡ | | 222,000 | GBP | | 259,375 | |
| | Santander UK PLC, 3.8750%, 10/15/29 | | 400,000 | GBP | | 448,293 | |
| | UBS AG/London, 0.0100%, 3/31/26 | | 500,000 | EUR | | 484,367 | |
| | | 6,459,453 | |
Capital Goods – 0.5% | | | |
| | Signify NV, 2.3750%, 5/11/27 | | 837,000 | EUR | | 840,287 | |
Communications – 1.8% | | | |
| | AT&T Inc, 3.8500%, 6/1/60 | | 574,000 | | | 415,592 | |
| | Crown Castle International Corp, 2.2500%, 1/15/31 | | 470,000 | | | 383,069 | |
| | Netflix Inc, 4.6250%, 5/15/29 | | 972,000 | EUR | | 1,072,135 | |
| | Verizon Communications Inc, 3.0000%, 3/22/27# | | 289,000 | | | 269,669 | |
| | Walt Disney Co, 2.6500%, 1/13/31 | | 946,000 | | | 823,624 | |
| | | 2,964,089 | |
Consumer Cyclical – 1.0% | | | |
| | Amazon.com Inc, 2.7000%, 6/3/60 | | 606,000 | | | 389,573 | |
| | NIKE Inc, 3.3750%, 3/27/50 | | 1,025,000 | | | 830,326 | |
| | Rentokil Initial Finance Ltd, 3.8750%, 6/27/27 | | 447,000 | EUR | | 484,028 | |
| | | 1,703,927 | |
Consumer Non-Cyclical – 2.7% | | | |
| | Agilent Technologies Inc, 2.1000%, 6/4/30 | | 902,000 | | | 741,145 | |
| | Amgen Inc, 3.0000%, 2/22/29 | | 577,000 | | | 521,080 | |
| | Dentsply Sirona Inc, 3.2500%, 6/1/30 | | 642,000 | | | 555,452 | |
| | HCA Inc, 3.5000%, 9/1/30 | | 515,000 | | | 451,423 | |
| | Kraft Heinz Foods Co, 4.8750%, 10/1/49 | | 361,000 | | | 329,400 | |
| | Mars Inc, 4.1250%, 4/1/54 (144A) | | 290,000 | | | 241,755 | |
| | McCormick & Co Inc/MD, 2.5000%, 4/15/30 | | 194,000 | | | 164,105 | |
| | PepsiCo Inc, 3.2000%, 7/22/29 | | 595,000 | GBP | | 662,460 | |
| | Sysco Corp, 5.9500%, 4/1/30 | | 136,000 | | | 142,368 | |
| | Takeda Pharmaceutical Co Ltd, 2.0000%, 7/9/40 | | 251,000 | EUR | | 202,252 | |
| | Zoetis Inc, 3.9000%, 8/20/28 | | 399,000 | | | 382,824 | |
| | | 4,394,264 | |
Electric – 0.4% | | | |
| | AEP Transmission Co LLC, 3.6500%, 4/1/50 | | 192,000 | | | 149,092 | |
| | IE2 Holdco SAU, 2.8750%, 6/1/26 | | 400,000 | EUR | | 423,101 | |
| | | 572,193 | |
Government Sponsored – 0.7% | | | |
| | China Development Bank, 3.3400%, 7/14/25 | | 7,660,000 | CNY | | 1,074,935 | |
| | |
See Notes to Schedule of Investments and Other Information and Notes to Financial Statements. |
| |
Janus Investment Fund | 7 |
Janus Henderson Global Bond Fund
Schedule of Investments
June 30, 2023
| | | | | | | | |
Shares or
Principal Amounts | | | Value | |
Corporate Bonds– (continued) | | | |
Insurance – 1.5% | | | |
| | Anthem Inc, 2.2500%, 5/15/30 | | $462,000 | | | $387,003 | |
| | Aviva PLC, | | | | | | |
| | UK Govt Bonds 5 Year Note Generic Bid Yield + 4.7000%, 4.0000%, 6/3/55‡ | | 150,000 | GBP | | 142,190 | |
| | Centene Corp, 2.4500%, 7/15/28 | | 1,167,000 | | | 997,500 | |
| | Health Care Service Corp, 2.2000%, 6/1/30 (144A) | | 572,000 | | | 472,253 | |
| | New York Life Global Funding, 0.7500%, 12/14/28 | | 452,000 | GBP | | 438,366 | |
| | | 2,437,312 | |
Technology – 4.0% | | | |
| | Apple Inc, 2.3750%, 2/8/41 | | 940,000 | | | 693,257 | |
| | Apple Inc, 2.6500%, 5/11/50 | | 1,243,000 | | | 865,271 | |
| | Equinix Inc, 2.1500%, 7/15/30 | | 892,000 | | | 720,870 | |
| | Fiserv Inc, 1.6250%, 7/1/30 | | 232,000 | EUR | | 215,118 | |
| | Global Payments Inc, 2.9000%, 5/15/30 | | 613,000 | | | 519,565 | |
| | Oracle Corp, 2.9500%, 4/1/30 | | 449,000 | | | 391,917 | |
| | Oracle Corp, 4.9000%, 2/6/33 | | 883,000 | | | 857,132 | |
| | PayPal Holdings Inc, 2.3000%, 6/1/30# | | 301,000 | | | 255,175 | |
| | Sage Group PLC/The, 1.6250%, 2/25/31 | | 719,000 | GBP | | 669,315 | |
| | Salesforce.com Inc, 1.9500%, 7/15/31 | | 456,000 | | | 376,283 | |
| | VMware Inc, 4.6500%, 5/15/27 | | 979,000 | | | 951,191 | |
| | | 6,515,094 | |
Total Corporate Bonds (cost $30,121,529) | | 26,961,554 | |
Foreign Government Bonds– 49.1% | | | |
| | Australia Government Bond, 1.2500%, 5/21/32 | | 1,500,000 | AUD | | 793,364 | |
| | Australia Government Bond, 1.7500%, 6/21/51 | | 916,000 | AUD | | 354,693 | |
| | Canadian Government Bond, 2.2500%, 6/1/29 | | 2,565,000 | CAD | | 1,817,808 | |
| | Canadian Government Bond, 1.5000%, 12/1/31 | | 2,007,000 | CAD | | 1,313,580 | |
| | China Government Bond, 2.5600%, 10/21/23 | | 32,630,000 | CNY | | 4,501,333 | |
| | China Government Bond, 3.2900%, 5/23/29 | | 27,060,000 | CNY | | 3,881,981 | |
| | China Government Bond, 2.6800%, 5/21/30 | | 39,330,000 | CNY | | 5,407,312 | |
| | China Government Bond, 3.8600%, 7/22/49 | | 9,010,000 | CNY | | 1,406,589 | |
| | European Union, 0%, 10/4/30 | | 1,910,000 | EUR | | 1,680,194 | |
| | European Union, 0%, 7/4/31 | | 2,085,325 | EUR | | 1,793,979 | |
| | European Union, 0.1000%, 10/4/40 | | 1,043,000 | EUR | | 675,395 | |
| | Federal Republic of Germany Bond, 0%, 8/15/29 | | 757,028 | EUR | | 712,327 | |
| | Federal Republic of Germany Bond, 0%, 2/15/32 | | 1,039,456 | EUR | | 927,772 | |
| | Federal Republic of Germany Bond, 1.7000%, 8/15/32 | | 3,691,900 | EUR | | 3,809,154 | |
| | Federal Republic of Germany Bond, 1.8000%, 8/15/53 | | 1,624,650 | EUR | | 1,548,256 | |
| | French Republic Government Bond OAT, 0%, 11/25/30 | | 3,354,226 | EUR | | 2,973,133 | |
| | French Republic Government Bond OAT, 0%, 5/25/32 | | 2,571,051 | EUR | | 2,180,306 | |
| | French Republic Government Bond OAT, 4.0000%, 4/25/60 | | 230,416 | EUR | | 291,001 | |
| | Italy Buoni Poliennali Del Tesoro, 2.5000%, 12/1/24 | | 704,000 | EUR | | 754,855 | |
| | Italy Buoni Poliennali Del Tesoro, 1.8500%, 7/1/25 (144A) | | 3,406,000 | EUR | | 3,579,433 | |
| | Italy Buoni Poliennali Del Tesoro, 3.4500%, 3/1/48 (144A) | | 880,000 | EUR | | 844,215 | |
| | Japan Government Forty Year Bond, 0.8000%, 3/20/58 | | 29,800,000 | JPY | | 177,393 | |
| | Japan Government Ten Year Bond, 0.4000%, 6/20/25 | | 606,100,000 | JPY | | 4,240,432 | |
| | Japan Government Ten Year Bond, 0.1000%, 6/20/29 | | 867,050,000 | JPY | | 6,008,353 | |
| | Japan Government Ten Year Bond, 0.1000%, 6/20/31 | | 529,750,000 | JPY | | 3,621,158 | |
| | Japan Government Ten Year Bond, 0.2000%, 9/20/32 | | 679,700,000 | JPY | | 4,646,391 | |
| | Japan Government Thirty Year Bond, 0.5000%, 9/20/46 | | 72,000,000 | JPY | | 438,887 | |
| | Japan Government Thirty Year Bond, 0.7000%, 6/20/48 | | 205,500,000 | JPY | | 1,284,845 | |
| | Kingdom of Belgium Government Bond, 1.0000%, 6/22/26 (144A) | | 4,703,659 | EUR | | 4,835,801 | |
| | Kingdom of Belgium Government Bond, 2.1500%, 6/22/66 (144A) | | 1,176,268 | EUR | | 958,225 | |
| | Mexican Bonos, 8.0000%, 11/7/47 | | 136,200 | MXN | | 726,920 | |
| | Province of British Columbia Canada, 2.8500%, 6/18/25 | | 6,502,000 | CAD | | 4,739,205 | |
| | Spain Government Bond, 1.2500%, 10/31/30 (144A) | | 1,497,000 | EUR | | 1,421,679 | |
| | United Kingdom Gilt, 1.2500%, 7/22/27 | | 750,703 | GBP | | 827,795 | |
| | United Kingdom Gilt, 1.6250%, 10/22/28 | | 3,640,324 | GBP | | 3,967,918 | |
| | United Kingdom Gilt, 4.2500%, 6/7/32 | | 130,524 | GBP | | 164,862 | |
| | |
See Notes to Schedule of Investments and Other Information and Notes to Financial Statements. |
| |
8 | JUNE 30, 2023 |
Janus Henderson Global Bond Fund
Schedule of Investments
June 30, 2023
| | | | | | | | |
Shares or
Principal Amounts | | | Value | |
Foreign Government Bonds– (continued) | | | |
| | United Kingdom Gilt, 1.5000%, 7/22/47 | | 1,587,380 | GBP | | $1,139,242 | |
Total Foreign Government Bonds (cost $90,682,686) | | 80,445,786 | |
Mortgage-Backed Securities– 22.6% | | | |
Fannie Mae: | | | |
| | 2.5000%, TBA, 30 Year Maturity | | $18,453 | | | 15,660 | |
| | 3.5000%, TBA, 30 Year Maturity | | 886,700 | | | 808,587 | |
| | 4.5000%, TBA, 30 Year Maturity | | 4,641,673 | | | 4,464,630 | |
| | 5.5000%, TBA, 30 Year Maturity | | 240,100 | | | 238,937 | |
| | | 5,527,814 | |
Fannie Mae Pool: | | | |
| | 2.5000%, 11/1/34 | | 192,804 | | | 176,851 | |
| | 4.5000%, 11/1/42 | | 14,378 | | | 14,176 | |
| | 3.0000%, 1/1/43 | | 6,573 | | | 5,942 | |
| | 4.5000%, 10/1/44 | | 33,311 | | | 32,898 | |
| | 4.5000%, 3/1/45 | | 50,508 | | | 49,881 | |
| | 4.5000%, 6/1/45 | | 25,012 | | | 24,683 | |
| | 4.5000%, 2/1/46 | | 49,123 | | | 48,434 | |
| | 3.0000%, 3/1/46 | | 1,066,055 | | | 954,099 | |
| | 3.0000%, 2/1/47 | | 1,662,528 | | | 1,502,846 | |
| | 4.0000%, 1/1/48 | | 620,598 | | | 590,812 | |
| | 4.5000%, 6/1/48 | | 64,705 | | | 63,148 | |
| | 4.0000%, 8/1/48 | | 416,533 | | | 396,272 | |
| | 4.0000%, 9/1/48 | | 994,102 | | | 946,389 | |
| | 4.0000%, 10/1/48 | | 32,811 | | | 31,323 | |
| | 4.0000%, 6/1/49 | | 13,160 | | | 12,480 | |
| | 4.5000%, 6/1/49 | | 5,554 | | | 5,413 | |
| | 4.5000%, 8/1/49 | | 8,342 | | | 8,131 | |
| | 3.0000%, 9/1/49 | | 5,786 | | | 5,138 | |
| | 3.0000%, 9/1/49 | | 2,153 | | | 1,930 | |
| | 4.0000%, 11/1/49 | | 214,933 | | | 204,478 | |
| | 4.0000%, 11/1/49 | | 18,869 | | | 18,005 | |
| | 3.5000%, 12/1/49 | | 544,690 | | | 502,671 | |
| | 4.5000%, 1/1/50 | | 168,931 | | | 164,865 | |
| | 4.5000%, 1/1/50 | | 10,940 | | | 10,662 | |
| | 4.0000%, 3/1/50 | | 311,209 | | | 297,094 | |
| | 4.0000%, 3/1/50 | | 167,945 | | | 159,776 | |
| | 4.0000%, 3/1/50 | | 63,975 | | | 60,863 | |
| | 4.0000%, 9/1/50 | | 331,710 | | | 314,564 | |
| | 4.0000%, 10/1/50 | | 340,802 | | | 325,192 | |
| | 4.5000%, 10/1/50 | | 207,306 | | | 202,317 | |
| | 3.5000%, 2/1/51 | | 61,663 | | | 56,716 | |
| | 4.0000%, 3/1/51 | | 1,640,085 | | | 1,555,308 | |
| | 4.0000%, 3/1/51 | | 17,028 | | | 16,148 | |
| | 4.0000%, 3/1/51 | | 8,462 | | | 8,050 | |
| | 4.0000%, 10/1/51 | | 3,199,037 | | | 3,033,677 | |
| | 3.0000%, 12/1/51 | | 83,000 | | | 73,608 | |
| | 3.5000%, 3/1/52 | | 942,947 | | | 871,552 | |
| | 3.0000%, 4/1/52 | | 7,590 | | | 6,735 | |
| | 3.5000%, 4/1/52 | | 121,355 | | | 112,037 | |
| | 4.0000%, 4/1/52 | | 131,517 | | | 124,933 | |
| | 4.5000%, 4/1/52 | | 23,634 | | | 22,719 | |
| | 4.5000%, 4/1/52 | | 19,987 | | | 19,214 | |
| | 4.5000%, 4/1/52 | | 11,461 | | | 11,018 | |
| | 4.5000%, 4/1/52 | | 10,405 | | | 10,003 | |
| | 4.5000%, 4/1/52 | | 9,099 | | | 8,747 | |
| | 4.5000%, 4/1/52 | | 5,858 | | | 5,631 | |
| | 3.5000%, 5/1/52 | | 149,225 | | | 137,311 | |
| | 4.5000%, 5/1/52 | | 31,711 | | | 30,484 | |
| | 3.5000%, 6/1/52 | | 301,026 | | | 277,953 | |
| | 4.0000%, 6/1/52 | | 102,840 | | | 96,610 | |
| | |
See Notes to Schedule of Investments and Other Information and Notes to Financial Statements. |
| |
Janus Investment Fund | 9 |
Janus Henderson Global Bond Fund
Schedule of Investments
June 30, 2023
| | | | | | | | |
Shares or
Principal Amounts | | | Value | |
Mortgage-Backed Securities– (continued) | | | |
Fannie Mae Pool– (continued) | | | |
| | 4.0000%, 6/1/52 | | $28,960 | | | $27,206 | |
| | 3.5000%, 7/1/52 | | 27,132 | | | 25,044 | |
| | 4.0000%, 7/1/52 | | 46,180 | | | 43,382 | |
| | 4.5000%, 7/1/52 | | 135,787 | | | 130,674 | |
| | 3.5000%, 8/1/52 | | 133,082 | | | 122,374 | |
| | 3.5000%, 8/1/52 | | 48,811 | | | 45,003 | |
| | 4.5000%, 8/1/52 | | 514,654 | | | 495,277 | |
| | 3.5000%, 9/1/52 | | 242,868 | | | 223,479 | |
| | 5.5000%, 9/1/52 | | 613,791 | | | 611,940 | |
| | 5.5000%, 10/1/52 | | 1,364,572 | | | 1,375,583 | |
| | 5.0000%, 11/1/52 | | 225,816 | | | 223,088 | |
| | 4.5000%, 12/1/52 | | 137,826 | | | 133,017 | |
| | 5.0000%, 1/1/53 | | 180,927 | | | 177,841 | |
| | 5.0000%, 3/1/53 | | 51,855 | | | 50,802 | |
| | 5.5000%, 3/1/53 | | 69,627 | | | 69,736 | |
| | 5.0000%, 4/1/53 | | 67,429 | | | 66,059 | |
| | 5.0000%, 4/1/53 | | 16,141 | | | 15,813 | |
| | 5.0000%, 4/1/53 | | 13,545 | | | 13,270 | |
| | 5.5000%, 4/1/53 | | 33,179 | | | 33,231 | |
| | 5.5000%, 5/1/53 | | 62,334 | | | 62,432 | |
| | 5.5000%, 5/1/53 | | 32,186 | | | 32,236 | |
| | 5.0000%, 6/1/53 | | 22,129 | | | 21,768 | |
| | 3.0000%, 2/1/57 | | 24,822 | | | 21,870 | |
| | | 17,630,912 | |
Freddie Mac Pool: | | | |
| | 3.0000%, 5/1/31 | | 171,018 | | | 162,358 | |
| | 3.0000%, 9/1/32 | | 914 | | | 863 | |
| | 3.0000%, 10/1/32 | | 1,314 | | | 1,239 | |
| | 3.0000%, 12/1/32 | | 187,343 | | | 175,031 | |
| | 2.5000%, 4/1/33 | | 201,995 | | | 187,270 | |
| | 2.5000%, 11/1/34 | | 198,026 | | | 181,645 | |
| | 3.0000%, 6/1/43 | | 244 | | | 217 | |
| | 4.5000%, 5/1/44 | | 22,717 | | | 22,419 | |
| | 4.0000%, 4/1/48 | | 1,721,332 | | | 1,637,580 | |
| | 4.5000%, 7/1/48 | | 14,353 | | | 14,007 | |
| | 4.0000%, 12/1/48 | | 107,225 | | | 102,008 | |
| | 4.5000%, 6/1/49 | | 6,186 | | | 6,030 | |
| | 4.5000%, 7/1/49 | | 55,189 | | | 53,789 | |
| | 4.5000%, 7/1/49 | | 7,835 | | | 7,637 | |
| | 4.5000%, 8/1/49 | | 47,422 | | | 46,219 | |
| | 3.0000%, 11/1/49 | | 2,937,566 | | | 2,621,543 | |
| | 3.0000%, 12/1/49 | | 41,652 | | | 36,990 | |
| | 3.0000%, 12/1/49 | | 3,622 | | | 3,216 | |
| | 4.5000%, 1/1/50 | | 31,394 | | | 30,598 | |
| | 4.5000%, 1/1/50 | | 8,762 | | | 8,540 | |
| | 4.0000%, 6/1/50 | | 175,742 | | | 167,973 | |
| | 4.5000%, 9/1/50 | | 316,135 | | | 308,519 | |
| | 4.0000%, 10/1/50 | | 30,556 | | | 28,976 | |
| | 2.5000%, 6/1/51 | | 35,890 | | | 30,809 | |
| | 4.5000%, 3/1/52 | | 4,926 | | | 4,736 | |
| | 3.0000%, 6/1/52 | | 898,421 | | | 799,749 | |
| | 3.5000%, 6/1/52 | | 1,196,095 | | | 1,106,198 | |
| | 3.5000%, 7/1/52 | | 1,070,986 | | | 985,140 | |
| | 4.0000%, 7/1/52 | | 103,744 | | | 97,457 | |
| | 4.0000%, 8/1/52 | | 117,781 | | | 110,803 | |
| | 4.5000%, 8/1/52 | | 1,133,821 | | | 1,091,124 | |
| | 4.5000%, 8/1/52 | | 480,742 | | | 462,780 | |
| | 4.5000%, 8/1/52 | | 250,453 | | | 241,022 | |
| | 5.5000%, 9/1/52 | | 159,795 | | | 160,373 | |
| | |
See Notes to Schedule of Investments and Other Information and Notes to Financial Statements. |
| |
10 | JUNE 30, 2023 |
Janus Henderson Global Bond Fund
Schedule of Investments
June 30, 2023
| | | | | | | | |
Shares or
Principal Amounts | | | Value | |
Mortgage-Backed Securities– (continued) | | | |
Freddie Mac Pool– (continued) | | | |
| | 5.0000%, 3/1/53 | | $84,296 | | | $82,583 | |
| | 5.0000%, 3/1/53 | | 15,245 | | | 14,935 | |
| | 5.0000%, 5/1/53 | | 276,506 | | | 271,993 | |
| | 5.0000%, 5/1/53 | | 112,200 | | | 110,368 | |
| | 5.0000%, 5/1/53 | | 63,352 | | | 62,318 | |
| | 5.5000%, 5/1/53 | | 143,794 | | | 144,019 | |
| | 5.5000%, 5/1/53 | | 101,769 | | | 102,137 | |
| | 5.0000%, 6/1/53 | | 288,036 | | | 283,335 | |
| | 5.5000%, 6/1/53 | | 318,292 | | | 318,790 | |
| | | 12,285,336 | |
Ginnie Mae: | | | |
| | 4.5000%, TBA, 30 Year Maturity | | 351,500 | | | 339,153 | |
| | 5.0000%, TBA, 30 Year Maturity | | 259,800 | | | 255,162 | |
| | 5.5000%, TBA, 30 Year Maturity | | 171,500 | | | 170,681 | |
| | | 764,996 | |
Ginnie Mae II Pool: | | | |
| | 4.0000%, 5/20/48 | | 252,823 | | | 242,282 | |
| | 4.0000%, 6/20/48 | | 591,605 | | | 566,755 | |
| | | 809,037 | |
Total Mortgage-Backed Securities (cost $38,631,219) | | 37,018,095 | |
United States Treasury Notes/Bonds– 8.2% | | | |
| | 4.5000%, 11/30/24 | | 1,738,400 | | | 1,719,929 | |
| | 3.8750%, 12/31/27 | | 1,185,200 | | | 1,168,579 | |
| | 4.0000%, 2/28/30 | | 1,732,300 | | | 1,731,082 | |
| | 2.8750%, 5/15/32 | | 3,857,700 | | | 3,576,811 | |
| | 1.3750%, 11/15/40 | | 1,778,900 | | | 1,190,195 | |
| | 3.3750%, 5/15/44 | | 1,030,500 | | | 929,020 | |
| | 3.3750%, 11/15/48 | | 971,600 | | | 878,046 | |
| | 3.0000%, 2/15/49 | | 1,064,700 | | | 900,379 | |
| | 2.2500%, 2/15/52 | | 1,946,100 | | | 1,406,361 | |
Total United States Treasury Notes/Bonds (cost $14,265,068) | | 13,500,402 | |
Investment Companies– 6.0% | | | |
Money Markets – 6.0% | | | |
| | Janus Henderson Cash Liquidity Fund LLC, 5.1900%ºº,£((cost $9,892,898) | | 9,892,044 | | | 9,894,022 | |
Investments Purchased with Cash Collateral from Securities Lending– 0.2% | | | |
Investment Companies – 0.2% | | | |
| | Janus Henderson Cash Collateral Fund LLC, 4.9971%ºº,£ | | 232,500 | | | 232,500 | |
Time Deposits – 0% | | | |
| | Royal Bank of Canada, 5.0600%, 7/3/23 | | $58,125 | | | 58,125 | |
Total Investments Purchased with Cash Collateral from Securities Lending (cost $290,625) | | 290,625 | |
Total Investments (total cost $185,453,734) – 103.5% | | 169,614,476 | |
Liabilities, net of Cash, Receivables and Other Assets – (3.5)% | | (5,747,583) | |
Net Assets – 100% | | $163,866,893 | |
| | |
See Notes to Schedule of Investments and Other Information and Notes to Financial Statements. |
| |
Janus Investment Fund | 11 |
Janus Henderson Global Bond Fund
Schedule of Investments
June 30, 2023
| | | | | | |
Summary of Investments by Country - (Long Positions) (unaudited) |
| |
| | | | | % of | |
| | | | | Investment | |
Country | | Value | | Securities | |
United States | | $80,752,863 | | 47.6 | % |
Japan | | 20,619,711 | | 12.2 | |
China | | 16,272,150 | | 9.6 | |
United Kingdom | | 10,529,534 | | 6.2 | |
Canada | | 7,870,593 | | 4.6 | |
Germany | | 6,997,509 | | 4.1 | |
France | | 6,205,956 | | 3.7 | |
Belgium | | 5,794,026 | | 3.4 | |
Italy | | 5,178,503 | | 3.1 | |
Supranational | | 4,149,568 | | 2.4 | |
Spain | | 1,844,780 | | 1.1 | |
Australia | | 1,148,057 | | 0.7 | |
Netherlands | | 1,039,939 | | 0.6 | |
Mexico | | 726,920 | | 0.4 | |
Switzerland | | 484,367 | | 0.3 | |
| | | | | | |
| | | | | | |
Total | | $169,614,476 | | 100.0 | % |
| | |
See Notes to Schedule of Investments and Other Information and Notes to Financial Statements. |
| |
12 | JUNE 30, 2023 |
Janus Henderson Global Bond Fund
Schedule of Investments
June 30, 2023
Schedules of Affiliated Investments – (% of Net Assets)
| | | | | | | | | | | |
| | Dividend Income | Realized Gain/(Loss) | Change in Unrealized Appreciation/ Depreciation | Value at 6/30/23 |
Investment Companies - 6.0% |
Money Markets - 6.0% | |
| | Janus Henderson Cash Liquidity Fund LLC, 5.1900%ºº | $ | 633,409 | $ | 1,579 | $ | 115 | $ | 9,894,022 |
Investments Purchased with Cash Collateral from Securities Lending - 0.2% |
Investment Companies - 0.2% | |
| | Janus Henderson Cash Collateral Fund LLC, 4.9971%ºº | | 1,234∆ | | - | | - | | 232,500 |
Total Affiliated Investments - 6.2% | $ | 634,643 | $ | 1,579 | $ | 115 | $ | 10,126,522 |
| | | | | | | | | | | |
| | Value at 6/30/22 | Purchases | Sales Proceeds | Value at 6/30/23 |
Investment Companies - 6.0% |
Money Markets - 6.0% | |
| | Janus Henderson Cash Liquidity Fund LLC, 5.1900%ºº | | 15,281,571 | | 137,991,133 | | (143,380,376) | | 9,894,022 |
Investments Purchased with Cash Collateral from Securities Lending - 0.2% |
Investment Companies - 0.2% | |
| | Janus Henderson Cash Collateral Fund LLC, 4.9971%ºº | | 209,374 | | 4,367,220 | | (4,344,094) | | 232,500 |
| | |
See Notes to Schedule of Investments and Other Information and Notes to Financial Statements. |
| |
Janus Investment Fund | 13 |
Janus Henderson Global Bond Fund
Schedule of Investments
June 30, 2023
| | | | | | | |
Schedule of Forward Foreign Currency Exchange Contracts | | | | | | |
| | | | | | | | | |
Counterparty/ Foreign Currency | Settlement Date | Foreign Currency Amount (Sold)/ Purchased | | USD Currency Amount (Sold)/ Purchased | | Market Value and Unrealized Appreciation/ (Depreciation) | |
Barclays Capital, Inc.: | | | | | | | | |
Hungary Forint | 9/21/23 | 9,373,500 | $ | (26,844) | $ | 108 | | |
Mexican Peso | 9/21/23 | 4,309,400 | | (246,961) | | 1,012 | | |
| | | | | | | | | |
| | | | | | | 1,120 | | |
BNP Paribas: | | | | | | | | |
Israeli Shekel | 9/21/23 | 728,400 | | (199,995) | | (2,698) | | |
Korean Won | 9/21/23 | 2,220,592,300 | | (1,703,209) | | (7,431) | | |
Polish Zloty | 9/21/23 | 2,993,000 | | (730,440) | | 3,175 | | |
| | | | | | | | | |
| | | | | | | (6,954) | | |
Citibank, National Association: | | | | | | | | |
Canadian Dollar | 9/21/23 | (4,995,300) | | 3,790,950 | | 14,749 | | |
HSBC Securities (USA), Inc.: | | | | | | | | |
British Pound | 9/21/23 | 382,865 | | (486,700) | | (493) | | |
Canadian Dollar | 9/21/23 | 597,598 | | (453,500) | | (1,745) | | |
Chinese Renminbi | 9/21/23 | (18,534,863) | | 2,586,126 | | 18,295 | | |
Danish Krone | 9/21/23 | (206,000) | | 30,292 | | (62) | | |
Euro | 9/21/23 | 4,614,961 | | (5,048,300) | | 7,492 | | |
Indonesian Rupiah | 9/21/23 | 10,341,960,000 | | (686,348) | | (2,883) | | |
Japanese Yen | 9/21/23 | (500,798,300) | | 3,529,902 | | 14,129 | | |
Norwegian Krone | 9/21/23 | 1,461,000 | | (135,283) | | 1,308 | | |
Swedish Krona | 9/21/23 | 5,797,100 | | (542,816) | | (2,928) | | |
Swedish Krona | 9/21/23 | (1,404,378) | | 131,500 | | 709 | | |
Swiss Franc | 9/21/23 | 687,500 | | (772,912) | | 2,103 | | |
| | | | | | | | | |
| | | | | | | 35,925 | | |
JPMorgan Chase Bank, National Association: | | | | | | | | |
Australian Dollar | 9/21/23 | 2,678,499 | | (1,793,003) | | (5,072) | | |
British Pound | 9/21/23 | (3,923,600) | | 4,987,822 | | 5,178 | | |
Euro | 9/21/23 | (1,869,300) | | 2,044,972 | | (2,887) | | |
Japanese Yen | 9/21/23 | 314,858,092 | | (2,219,500) | | (9,090) | | |
New Zealand Dollar | 9/21/23 | (382,500) | | 234,860 | | 286 | | |
Singapore Dollar | 9/21/23 | 2,515,451 | | (1,865,854) | | 369 | | |
| | | | | | | | | |
| | | | | | | (11,216) | | |
State Street Bank and Trust Company: | | | | | | | | |
Euro | 9/21/23 | (1,328,305) | | 1,452,000 | | (3,188) | | |
Total | | | | | $ | 30,436 | | |
| | |
See Notes to Schedule of Investments and Other Information and Notes to Financial Statements. |
| |
14 | JUNE 30, 2023 |
Janus Henderson Global Bond Fund
Schedule of Investments
June 30, 2023
Schedule of Futures
| | | | | | | | | | | | | | |
Description | | Number of Contracts | | Expiration Date | | Notional Amount | | Value and Unrealized Appreciation/(Depreciation) | |
Futures Long: | | | | | | | | | |
10-Year Australian Bond | | 45 | | 9/15/23 | $ | 3,481,688 | $ | (19,214) | | |
5 Year US Treasury Note | | 192 | | 10/4/23 | | 20,562,000 | | (404,971) | | |
Euro-BTP | | 7 | | 9/11/23 | | 886,810 | | 21 | | |
Euro-Buxl 30-Year Bond | | 8 | | 9/11/23 | | 1,218,536 | | 2,808 | | |
Long Gilt | | 27 | | 9/29/23 | | 3,267,304 | | (43,034) | | |
Ultra 10-Year Treasury Note | | 17 | | 9/29/23 | | 2,013,438 | | (26,563) | | |
Ultra Long Term US Treasury Bond | | 15 | | 9/29/23 | | 2,043,281 | | 19,618 | | |
Total | | | | | | | $ | (471,335) | |
| | | | | | | | | | | | | | |
Schedule of Centrally Cleared Interest Rate Swaps |
Payments made by Fund | Payments received by Fund | Payment Frequency | | Maturity Date | | Notional Amount | | | Premiums Paid/ (Received) | | Unrealized Appreciation/ (Depreciation) | | Value |
STIBOR 3M | 3.2045% Fixed Rate | Quarterly | | 10/21/32 | | 33,100,000 | SEK | $ | 750 | $ | 74,549 | $ | 75,299 |
| | |
See Notes to Schedule of Investments and Other Information and Notes to Financial Statements. |
| |
Janus Investment Fund | 15 |
Janus Henderson Global Bond Fund
Schedule of Investments
June 30, 2023
| | | | | | | | | | |
Schedule of OTC Credit Default Swaps - Buy Protection |
Counterparty/ Reference Asset | Maturity Date | Notional Amount | | | Premiums Paid/(Received) | | Unrealized Appreciation/ (Depreciation) | | Swap Contracts, at Value Asset/(Liability) |
Bank of America, National Association:
| | | | | | | | | | |
CNHIND 3.85 15Nov27, Fixed Rate 5.00%, Paid Quarterly | 6/20/28 | (390,000) | EUR | $ | (74,072) | $ | (918) | $ | (74,990) |
WENL 1.375 26Apr26, Fixed Rate 5.00%, Paid Quarterly | 6/20/28 | (390,000) | EUR | | (74,986) | | (3,249) | | (78,235) |
Total | | | | | (149,058) | | (4,167) | | (153,225) |
BNP Paribas:
| | | | | | | | | | |
AKZO 1.75 07Nov24, Fixed Rate 1.00%, Paid Quarterly | 6/20/28 | (390,000) | EUR | | 896 | | (2,459) | | (1,563) |
DAMLR 1.4 12Jan24, Fixed Rate 1.00%, Paid Quarterly | 6/20/28 | (390,000) | EUR | | (5,435) | | (1,543) | | (6,978) |
PUBFP ..5 03Nov23, Fixed Rate 1.00%, Paid Quarterly | 6/20/28 | (390,000) | EUR | | (3,812) | | (2,714) | | (6,526) |
Total | | | | | (8,351) | | (6,716) | | (15,067) |
Citibank, National Association:
| | | | | | | | | | |
AACAP 1.625 11Mar26, Fixed Rate 5.00%, Paid Quarterly | 6/20/28 | (390,000) | EUR | | (59,840) | | (3,445) | | (63,285) |
ALSTOM .25 14Oct26, Fixed Rate 1.00%, Paid Quarterly | 6/20/28 | (390,000) | EUR | | 11,485 | | (7,130) | | 4,355 |
WPPF 2.25 22Sep26, Fixed Rate 1.00%, Paid Quarterly | 6/20/28 | (390,000) | EUR | | (1,597) | | (1,038) | | (2,635) |
Total | | | | | (49,952) | | (11,613) | | (61,565) |
JPMorgan Chase Bank, National Association:
| | | | | | | | | | |
NXT 3.625 18May28, Fixed Rate 1.00%, Paid Quarterly | 6/20/28 | (390,000) | EUR | | 9,170 | | (6,062) | | 3,108 |
Total | | | | $ | (198,191) | $ | (28,558) | $ | (226,749) |
| | |
See Notes to Schedule of Investments and Other Information and Notes to Financial Statements. |
| |
16 | JUNE 30, 2023 |
Janus Henderson Global Bond Fund
Schedule of Investments
June 30, 2023
The following table, grouped by derivative type, provides information about the fair value and location of derivatives within the Statement of Assets and Liabilities as of June 30, 2023.
| | | | | | | | | | | | |
Fair Value of Derivative Instruments (not accounted for as hedging instruments) as of June 30, 2023 |
| | | | | | | | | | | |
| | | | | Credit
Contracts | | Currency
Contracts | | Interest Rate
Contracts | | Total |
Asset Derivatives: | | | | | | | | | |
Forward foreign currency exchange contracts | | | $ - | | $ 68,913 | | $ - | | $ 68,913 |
Swaps – OTC, at value | | | 7,463 | | - | | - | | $ 7,463 |
*Futures contracts | | | - | | - | | 22,447 | | $ 22,447 |
*Swaps - centrally cleared | | | - | | - | | 74,549 | | $ 74,549 |
| | | | | | | | | | |
Total Asset Derivatives | | | $ 7,463 | | $ 68,913 | | $ 96,996 | | $173,372 |
Liability Derivatives: | | | | | | | | | |
Forward foreign currency exchange contracts | | | $ - | | $ 38,477 | | $ - | | $ 38,477 |
Swaps – OTC, at value | | | 234,212 | | - | | - | | $234,212 |
*Futures contracts | | | - | | - | | 493,782 | | $493,782 |
| | | | | | | | | | |
Total Liability Derivatives | | | $234,212 | | $ 38,477 | | $ 493,782 | | $766,471 |
*The fair value presented includes net cumulative unrealized appreciation (depreciation) on futures contracts and centrally cleared swaps. In the Statement of Assets and Liabilities, only current day's variation margin is reported in receivables or payables and the net cumulative unrealized appreciation (depreciation) is included in total distributable earnings (loss). |
The following tables provide information about the effect of derivatives and hedging activities on the Fund’s Statement of Operations for the year ended June 30, 2023.
| | | | | | | | | | | |
The effect of Derivative Instruments (not accounted for as hedging instruments) on the Statement of Operations for the year ended June 30, 2023 |
| | | | | | | | | | |
Amount of Realized Gain/(Loss) Recognized on Derivatives |
Derivative | | Credit
Contracts | | Currency
Contracts | | Interest Rate
Contracts | | Total |
Futures contracts | | $ - | | $ - | | $ (999,906) | | $ (999,906) |
Forward foreign currency exchange contracts | | - | | 274,399 | | - | | $ 274,399 |
Swap contracts | | (1,370,122) | | - | | (1,339,898) | | $(2,710,020) |
| | | | | | | | | | | |
Total | | $(1,370,122) | | $274,399 | | $ (2,339,804) | | $(3,435,527) |
| | | | | | | | | | | |
| | | | | | | | | | | |
Amount of Change in Unrealized Appreciation/Depreciation Recognized on Derivatives |
Derivative | | Credit
Contracts | | Currency
Contracts | | Interest Rate
Contracts | | Total |
Futures contracts | | $ - | | $ - | | $ (479,180) | | $ (479,180) |
Forward foreign currency exchange contracts | | - | | (21,693) | | - | | $ (21,693) |
Swap contracts | | 1,463,075 | | - | | 1,024,938 | | $ 2,488,013 |
| | | | | | | | | | | |
Total | | $ 1,463,075 | | $ (21,693) | | $ 545,758 | | $ 1,987,140 |
Please see the "Net Realized Gain/(Loss) on Investments" and "Change in Unrealized Net Appreciation/Depreciation" sections of the Fund’s Statement of Operations.
| | |
See Notes to Schedule of Investments and Other Information and Notes to Financial Statements. |
| |
Janus Investment Fund | 17 |
Janus Henderson Global Bond Fund
Schedule of Investments
June 30, 2023
| | |
Average Ending Monthly Value of Derivative Instruments During the Year Ended June 30, 2023 |
| |
| |
Credit default swaps: | |
Average notional amount - buy protection | $ 810,000 |
Average notional amount - sell protection | 1,586,538 |
Forward foreign currency exchange contracts: | |
Average amounts purchased - in USD | 32,169,849 |
Average amounts sold - in USD | 33,564,909 |
Futures contracts: | |
Average notional amount of contracts - long | 20,705,257 |
Average notional amount of contracts - short | 10,647,954 |
Interest rate swaps: | |
Average notional amount - pay fixed rate/receive floating rate | 1,305,608,129 |
Average notional amount - receive fixed rate/pay floating rate | 2,663,741,871 |
| | |
| |
| |
| |
| | |
See Notes to Schedule of Investments and Other Information and Notes to Financial Statements. |
| |
18 | JUNE 30, 2023 |
Janus Henderson Global Bond Fund
Schedule of Investments
June 30, 2023
| | | | | | | | | | |
Offsetting of Financial Assets and Derivative Assets |
| |
| | | Gross Amounts | | | | | | |
| | | of Recognized | | Offsetting Asset | | Collateral | | |
Counterparty | | Assets | | or Liability(a) | | Pledged(b) | | Net Amount |
| | | | | | | | | |
Barclays Capital, Inc. | $ | 1,120 | $ | — | $ | — | $ | 1,120 |
BNP Paribas | | 3,175 | | (3,175) | | — | | — |
Citibank, National Association | | 19,104 | | (19,104) | | — | | — |
HSBC Securities (USA), Inc. | | 44,036 | | (8,111) | | — | | 35,925 |
JPMorgan Chase Bank, National Association | | 292,998 | | (8,941) | | (284,057) | | — |
| | | | | | | | | |
Total | $ | 360,433 | $ | (39,331) | $ | (284,057) | $ | 37,045 |
Offsetting of Financial Liabilities and Derivative Liabilities |
| |
| | | Gross Amounts | | | | | | |
| | | of Recognized | | Offsetting Asset | | Collateral | | |
Counterparty | | Liabilities | | or Liability(a) | | Pledged(b) | | Net Amount |
| | | | | | | | | |
Bank of America, National Association | $ | 153,225 | $ | — | $ | — | $ | 153,225 |
BNP Paribas | | 25,196 | | (3,175) | | — | | 22,021 |
Citibank, National Association | | 65,920 | | (19,104) | | — | | 46,816 |
HSBC Securities (USA), Inc. | | 8,111 | | (8,111) | | — | | — |
JPMorgan Chase Bank, National Association | | 17,049 | | (8,941) | | — | | 8,108 |
State Street Bank and Trust Company | | 3,188 | | — | | — | | 3,188 |
| | | | | | | | | |
Total | $ | 272,689 | $ | (39,331) | $ | — | $ | 233,358 |
(a) | Represents the amount of assets or liabilities that could be offset with the same counterparty under master netting or similar agreements that management elects not to offset on the Statement of Assets and Liabilities. |
(b) | Collateral pledged is limited to the net outstanding amount due to/from an individual counterparty. The actual collateral amounts pledged may exceed these amounts and may fluctuate in value. |
| | |
See Notes to Schedule of Investments and Other Information and Notes to Financial Statements. |
| |
Janus Investment Fund | 19 |
Janus Henderson Global Bond Fund
Notes to Schedule of Investments and Other Information
| | |
Bloomberg Global Aggregate Bond Index | Bloomberg Global Aggregate Bond Index is a broad-based measure of the global investment grade fixed-rate debt markets. |
| | |
EURIBOR | Euro Interbank Offered Rate |
LLC | Limited Liability Company |
PLC | Public Limited Company |
SOFR | Secured Overnight Financing Rate |
SONIA | Sterling Overnight Interbank Average Rate |
STIBOR | Stockholm Interbank Offered Rate |
TBA | (To Be Announced) Securities are purchased/sold on a forward commitment basis with an approximate principal amount and no defined maturity date. The actual principal and maturity date will be determined upon settlement when specific mortgage pools are assigned. |
| | |
| | |
144A | Securities sold under Rule 144A of the Securities Act of 1933, as amended, are subject to legal and/or contractual restrictions on resale and may not be publicly sold without registration under the 1933 Act. Unless otherwise noted, these securities have been determined to be liquid under guidelines established by the Board of Trustees. The total value of 144A securities as of the year ended June 30, 2023 is $12,791,160, which represents 7.8% of net assets. |
| | |
‡ | Variable or floating rate security. Rate shown is the current rate as of June 30, 2023. Certain variable rate securities are not based on a published reference rate and spread; they are determined by the issuer or agent and current market conditions. Reference rate is as of reset date and may vary by security, which may not indicate a reference rate and/or spread in their description. |
| | |
ºº | Rate shown is the 7-day yield as of June 30, 2023. |
| | |
# | Loaned security; a portion of the security is on loan at June 30, 2023. |
| | |
£ | The Fund may invest in certain securities that are considered affiliated companies. As defined by the Investment Company Act of 1940, as amended, an affiliated company is one in which the Fund owns 5% or more of the outstanding voting securities, or a company which is under common ownership or control. |
| | |
∆ | Net of income paid to the securities lending agent and rebates paid to the borrowing counterparties. |
Janus Henderson Global Bond Fund
Notes to Schedule of Investments and Other Information
| | | | | | | | | | | | | | |
The following is a summary of the inputs that were used to value the Fund’s investments in securities and other financial instruments as of June 30, 2023. See Notes to Financial Statements for more information. |
| |
Valuation Inputs Summary |
| | | | | | | |
| | | | | Level 2 - | | Level 3 - |
| | | Level 1 - | | Other Significant | | Significant |
| | | Quoted Prices | | Observable Inputs | | Unobservable Inputs |
| | | | | | | |
Assets | | | | | | |
Investments In Securities: | | | | | | |
Asset-Backed/Commercial Mortgage-Backed Securities | $ | - | $ | 1,503,992 | $ | - |
Corporate Bonds | | - | | 26,961,554 | | - |
Foreign Government Bonds | | - | | 80,445,786 | | - |
Mortgage-Backed Securities | | - | | 37,018,095 | | - |
United States Treasury Notes/Bonds | | - | | 13,500,402 | | - |
Investment Companies | | - | | 9,894,022 | | - |
Investments Purchased with Cash Collateral from Securities Lending | | - | | 290,625 | | - |
Total Investments in Securities | $ | - | $ | 169,614,476 | $ | - |
Other Financial Instruments(a): | | | | | | |
Forward Foreign Currency Exchange Contracts | | - | | 68,913 | | - |
Futures Contracts | | 22,447 | | - | | - |
Centrally Cleared Swaps | | - | | 74,549 | | - |
Total Assets | $ | 22,447 | $ | 169,757,938 | $ | - |
Liabilities | | | | | | |
Other Financial Instruments(a): | | | | | | |
OTC Swaps | $ | - | $ | 28,558 | $ | - |
Forward Foreign Currency Exchange Contracts | | - | | 38,477 | | - |
Futures Contracts | | 493,782 | | - | | - |
Total Liabilities | $ | 493,782 | $ | 67,035 | $ | - |
| | | | | | | |
(a) | Other financial instruments may include forward foreign currency exchange contracts, futures, written options, written swaptions, and swap contracts. Forward foreign currency exchange contracts, futures contracts, and swap contracts are reported at their unrealized appreciation/(depreciation) at measurement date, which represents the change in the contract's value from trade date. Written options and written swaptions are reported at their market value at measurement date. |
Janus Henderson Global Bond Fund
Statement of Assets and Liabilities
June 30, 2023
| |
See footnotes at the end of the Statement. |
| | | | | | | |
| | | | | | |
Assets: | | | | |
| Unaffiliated investments, at value (cost $175,328,336)(1) | | $ | 159,487,954 | |
| Affiliated investments, at value (cost $10,125,398) | | | 10,126,522 | |
| Deposits with brokers for centrally cleared derivatives | | | 114,565 | |
| Deposits with brokers for futures | | | 965,000 | |
| Forward foreign currency exchange contracts | | | 68,913 | |
| Closed foreign currency contracts | | | 251,806 | |
| OTC swap contracts, at value (premium paid $20,655) | | | 7,463 | |
| Variation margin receivable on futures contracts | | | 31,695 | |
| Trustees' deferred compensation | | | 4,159 | |
| Receivables: | | | | |
| | Interest | | | 825,569 | |
| | Dividends from affiliates | | | 48,101 | |
| | Fund shares sold | | | 42,972 | |
| Other assets | | | 1,763 | |
Total Assets | | | 171,976,482 | |
Liabilities: | | | | |
| Due to custodian | | | 232,372 | |
| Foreign cash due to custodian | | | 239,903 | |
| Collateral for securities loaned (Note 3) | | | 290,625 | |
| Forward foreign currency exchange contracts | | | 38,477 | |
| OTC swap contracts, at value (net premium received $218,846) | | | 234,212 | |
| Variation margin payable on futures contracts | | | 45,376 | |
| Variation margin payable on centrally cleared swaps | | | 6,732 | |
| Payables: | | | — | |
| | TBA investments purchased | | | 6,292,164 | |
| | Fund shares repurchased | | | 275,989 | |
| | Investments purchased | | | 239,749 | |
| | Professional fees | | | 70,181 | |
| | Advisory fees | | | 62,194 | |
| | Custodian fees | | | 7,307 | |
| | Transfer agent fees and expenses | | | 6,991 | |
| | Trustees' deferred compensation fees | | | 4,159 | |
| | Dividends | | | 2,194 | |
| | Trustees' fees and expenses | | | 920 | |
| | 12b-1 Distribution and shareholder servicing fees | | | 649 | |
| | Affiliated fund administration fees payable | | | 363 | |
| | Accrued expenses and other payables | | | 59,032 | |
Total Liabilities | | | 8,109,589 | |
Net Assets | | $ | 163,866,893 | |
| | |
See Notes to Financial Statements. |
| |
22 | JUNE 30, 2023 |
Janus Henderson Global Bond Fund
Statement of Assets and Liabilities
June 30, 2023
| | | | | | | |
| | | | | | |
| | | | | | | |
Net Assets Consist of: | | | | |
| Capital (par value and paid-in surplus) | | $ | 207,413,484 | |
| Total distributable earnings (loss) | | | (43,546,591) | |
Total Net Assets | | $ | 163,866,893 | |
Net Assets - Class A Shares | | $ | 820,544 | |
| Shares Outstanding, $0.01 Par Value (unlimited shares authorized) | | | 106,155 | |
Net Asset Value Per Share(2) | | $ | 7.73 | |
Maximum Offering Price Per Share(3) | | $ | 8.12 | |
Net Assets - Class C Shares | | $ | 495,350 | |
| Shares Outstanding, $0.01 Par Value (unlimited shares authorized) | | | 64,045 | |
Net Asset Value Per Share(2) | | $ | 7.73 | |
Net Assets - Class D Shares | | $ | 11,455,947 | |
| Shares Outstanding, $0.01 Par Value (unlimited shares authorized) | | | 1,483,550 | |
Net Asset Value Per Share | | $ | 7.72 | |
Net Assets - Class I Shares | | $ | 17,798,941 | |
| Shares Outstanding, $0.01 Par Value (unlimited shares authorized) | | | 2,304,801 | |
Net Asset Value Per Share | | $ | 7.72 | |
Net Assets - Class N Shares | | $ | 130,635,800 | |
| Shares Outstanding, $0.01 Par Value (unlimited shares authorized) | | | 16,928,227 | |
Net Asset Value Per Share | | $ | 7.72 | |
Net Assets - Class S Shares | | $ | 64,096 | |
| Shares Outstanding, $0.01 Par Value (unlimited shares authorized) | | | 8,299 | |
Net Asset Value Per Share | | $ | 7.72 | |
Net Assets - Class T Shares | | $ | 2,596,215 | |
| Shares Outstanding, $0.01 Par Value (unlimited shares authorized) | | | 336,385 | |
Net Asset Value Per Share | | $ | 7.72 | |
| |
(1) Includes $284,057 of securities on loan. See Note 3 in Notes to Financial Statements. (2) Redemption price per share may be reduced for any applicable contingent deferred sales charge. (3) Maximum offering price is computed at 100/95.25 of net asset value. |
| | |
See Notes to Financial Statements. |
| |
Janus Investment Fund | 23 |
Janus Henderson Global Bond Fund
Statement of Operations
For the year ended June 30, 2023
| | | | | | |
| | | | | |
Investment Income: | | | |
| Interest | $ | 3,584,231 | |
| Dividends from affiliates | | 633,409 | |
| Affiliated securities lending income, net | | 1,234 | |
| Unaffiliated securities lending income, net | | 342 | |
| Other income | | 59,405 | |
Total Investment Income | | 4,278,621 | |
Expenses: | | | |
| Advisory fees | | 984,635 | |
| 12b-1 Distribution and shareholder servicing fees: | | | |
| | Class A Shares | | 2,374 | |
| | Class C Shares | | 5,788 | |
| | Class S Shares | | 159 | |
| Transfer agent administrative fees and expenses: | | | |
| | Class D Shares | | 14,256 | |
| | Class S Shares | | 159 | |
| | Class T Shares | | 7,282 | |
| Transfer agent networking and omnibus fees: | | | |
| | Class A Shares | | 1,238 | |
| | Class C Shares | | 579 | |
| | Class I Shares | | 33,106 | |
| Other transfer agent fees and expenses: | | | |
| | Class A Shares | | 87 | |
| | Class C Shares | | 41 | |
| | Class D Shares | | 3,453 | |
| | Class I Shares | | 1,738 | |
| | Class N Shares | | 4,704 | |
| | Class S Shares | | 14 | |
| | Class T Shares | | 61 | |
| Registration fees | | 92,762 | |
| Non-affiliated fund administration fees | | 91,244 | |
| Professional fees | | 70,538 | |
| Pricing valuation Fee | | 64,578 | |
| Custodian fees | | 37,907 | |
| Shareholder reports expense | | 16,862 | |
| Affiliated fund administration fees | | 5,165 | |
| Trustees’ fees and expenses | | 4,414 | |
| Other expenses | | 40,710 | |
Total Expenses | | 1,483,854 | |
Less: Excess Expense Reimbursement and Waivers | | (408,989) | |
Net Expenses | | 1,074,865 | |
Net Investment Income/(Loss) | | 3,203,756 | |
| | | | | |
| | |
See Notes to Financial Statements. |
| |
24 | JUNE 30, 2023 |
Janus Henderson Global Bond Fund
Statement of Operations
For the year ended June 30, 2023
| | | | | | |
| | | | | |
Net Realized Gain/(Loss) on Investments: | | | |
| Investments and foreign currency transactions (net of foreign taxes of $2,919) | $ | (20,599,305) | |
| Investments in affiliates | | 1,579 | |
| Forward foreign currency exchange contracts | | 274,399 | |
| Futures contracts | | (999,906) | |
| Swap contracts | | (2,710,020) | |
Total Net Realized Gain/(Loss) on Investments | | (24,033,253) | |
Change in Unrealized Net Appreciation/Depreciation: | | | |
| Investments, foreign currency translations and Trustees’ deferred compensation | | 12,931,886 | |
| Investments in affiliates | | 115 | |
| Forward foreign currency exchange contracts | | (21,693) | |
| Futures contracts | | (479,180) | |
| Swap contracts | | 2,488,013 | |
Total Change in Unrealized Net Appreciation/Depreciation | | 14,919,141 | |
Net Increase/(Decrease) in Net Assets Resulting from Operations | $ | (5,910,356) | |
| | | | | |
| | |
See Notes to Financial Statements. |
| |
Janus Investment Fund | 25 |
Janus Henderson Global Bond Fund
Statements of Changes in Net Assets
| | | | | | | | | |
| | | | | | | | |
| | | Year ended
June 30, 2023 | | Year ended
June 30, 2022 | |
| | | | | | | | | |
Operations: | | | | | | |
| Net investment income/(loss) | $ | 3,203,756 | | $ | 3,055,658 | |
| Net realized gain/(loss) on investments | | (24,033,253) | | | (10,135,715) | |
| Change in unrealized net appreciation/depreciation | | 14,919,141 | | | (36,670,088) | |
Net Increase/(Decrease) in Net Assets Resulting from Operations | | (5,910,356) | | | (43,750,145) | |
Dividends and Distributions to Shareholders: | | | | | | |
| | Class A Shares | | — | | | (17,293) | |
| | Class C Shares | | — | | | (3,826) | |
| | Class D Shares | | — | | | (215,160) | |
| | Class I Shares | | — | | | (879,318) | |
| | Class N Shares | | — | | | (2,258,673) | |
| | Class S Shares | | — | | | (721) | |
| | Class T Shares | | — | | | (72,893) | |
| Total Dividends and Distributions to Shareholders | | — | | | (3,447,884) | |
| Return of Capital on Dividends and Distributions | | | | | | |
| | Class A Shares | | (16,023) | | | (15,492) | |
| | Class C Shares | | (5,508) | | | (10,473) | |
| | Class D Shares | | (232,534) | | | (175,561) | |
| | Class I Shares | | (594,755) | | | (646,244) | |
| | Class N Shares | | (2,404,377) | | | (1,625,326) | |
| | Class S Shares | | (983) | | | (627) | |
| | Class T Shares | | (53,034) | | | (65,738) | |
| Total Return of Capital Dividends and Distributions | | (3,307,214) | | | (2,539,461) | |
Net Decrease from Dividends and Distributions to Shareholders | | (3,307,214) | | | (5,987,345) | |
Capital Share Transactions: | | | | | | |
| | Class A Shares | | (165,041) | | | (376,736) | |
| | Class C Shares | | (186,780) | | | (344,153) | |
| | Class D Shares | | (895,378) | | | (3,521,286) | |
| | Class I Shares | | (28,018,401) | | | (6,350,092) | |
| | Class N Shares | | 15,061,426 | | | 9,281,127 | |
| | Class S Shares | | 3,774 | | | 58,281 | |
| | Class T Shares | | (661,330) | | | (4,967,490) | |
Net Increase/(Decrease) from Capital Share Transactions | | (14,861,730) | | | (6,220,349) | |
Net Increase/(Decrease) in Net Assets | | (24,079,300) | | | (55,957,839) | |
Net Assets: | | | | | | |
| Beginning of period | | 187,946,193 | | | 243,904,032 | |
| End of period | $ | 163,866,893 | | $ | 187,946,193 | |
| | | | | | | | |
| | |
See Notes to Financial Statements. |
| |
26 | JUNE 30, 2023 |
Janus Henderson Global Bond Fund
Financial Highlights
| | | | | | | | | | | | | | | | | | | |
Class A Shares | | | | | | | | | | | | | | | |
For a share outstanding during the year ended June 30 | | 2023 | | | 2022 | | | 2021 | | | 2020 | | | 2019 | |
| Net Asset Value, Beginning of Period | | $8.10 | | | $10.07 | | | $10.10 | | | $9.63 | | | $9.40 | |
| Income/(Loss) from Investment Operations: | | | | | | | | | | | | | | | |
| | Net investment income/(loss)(1) | | 0.13 | | | 0.09 | | | 0.11 | | | 0.12 | | | 0.14 | |
| | Net realized and unrealized gain/(loss) | | (0.37) | | | (1.85) | | | 0.22 | | | 0.47 | | | 0.23 | |
| Total from Investment Operations | | (0.24) | | | (1.76) | | | 0.33 | | | 0.59 | | | 0.37 | |
| Less Dividends and Distributions: | | | | | | | | | | | | | | | |
| | Dividends (from net investment income) | | — | | | (0.11) | | | (0.13) | | | (0.12) | | | (0.09) | |
| | Distributions (from capital gains) | | — | | | (0.05) | | | (0.23) | | | — | | | — | |
| | Return of capital | | (0.13) | | | (0.05) | | | — | | | — | | | (0.05) | |
| Total Dividends and Distributions | | (0.13) | | | (0.21) | | | (0.36) | | | (0.12) | | | (0.14) | |
| Net Asset Value, End of Period | | $7.73 | | | $8.10 | | | $10.07 | | | $10.10 | | | $9.63 | |
| Total Return* | | (2.93)% | | | (17.77)% | | | 3.10% | | | 6.20% | | | 3.96% | |
| Net Assets, End of Period (in thousands) | | $821 | | | $1,040 | | | $1,693 | | | $1,530 | | | $1,364 | |
| Average Net Assets for the Period (in thousands) | | $955 | | | $1,452 | | | $1,848 | | | $1,532 | | | $1,522 | |
| Ratios to Average Net Assets**: | | | | | | | | | | | | | | | |
| | Ratio of Gross Expenses | | 1.55% | | | 1.29% | | | 1.25% | | | 1.29% | | | 1.33% | |
| | Ratio of Net Expenses (After Waivers and Expense Offsets) | | 1.00% | | | 0.96% | | | 0.94% | | | 0.95% | | | 0.97% | |
| | Ratio of Net Investment Income/(Loss) | | 1.62% | | | 0.96% | | | 1.04% | | | 1.21% | | | 1.49% | |
| Portfolio Turnover Rate | | 79%(2) | | | 41%(2) | | | 63%(2) | | | 164%(2) | | | 248% | |
| | | | | | | | | | | | | | | | | | | |
| |
* Total return includes adjustments in accordance with generally accepted accounting principles required at the year or period end and are not annualized for periods of less than one full year. ** Annualized for periods of less than one full year. (1) Per share amounts are calculated based on average shares outstanding during the year or period. (2) Portfolio Turnover Rate excludes TBA (to be announced) purchase and sales commitments. |
| | |
See Notes to Financial Statements. |
| |
Janus Investment Fund | 27 |
Janus Henderson Global Bond Fund
Financial Highlights
| | | | | | | | | | | | | | | | | | | |
Class C Shares | | | | | | | | | | | | | | | |
For a share outstanding during the year ended June 30 | | 2023 | | | 2022 | | | 2021 | | | 2020 | | | 2019 | |
| Net Asset Value, Beginning of Period | | $8.10 | | | $10.06 | | | $10.11 | | | $9.64 | | | $9.41 | |
| Income/(Loss) from Investment Operations: | | | | | | | | | | | | | | | |
| | Net investment income/(loss)(1) | | 0.07 | | | 0.02 | | | 0.03 | | | 0.04 | | | 0.07 | |
| | Net realized and unrealized gain/(loss) | | (0.36) | | | (1.85) | | | 0.20 | | | 0.48 | | | 0.23 | |
| Total from Investment Operations | | (0.29) | | | (1.83) | | | 0.23 | | | 0.52 | | | 0.30 | |
| Less Dividends and Distributions: | | | | | | | | | | | | | | | |
| | Dividends (from net investment income) | | — | | | (0.03) | | | (0.05) | | | (0.05) | | | (0.05) | |
| | Distributions (from capital gains) | | — | | | (0.08) | | | (0.23) | | | — | | | — | |
| | Return of capital | | (0.08) | | | (0.02) | | | — | | | — | | | (0.02) | |
| Total Dividends and Distributions | | (0.08) | | | (0.13) | | | (0.28) | | | (0.05) | | | (0.07) | |
| Net Asset Value, End of Period | | $7.73 | | | $8.10 | | | $10.06 | | | $10.11 | | | $9.64 | |
| Total Return* | | (3.64)% | | | (18.31)% | | | 2.15% | | | 5.41% | | | 3.19% | |
| Net Assets, End of Period (in thousands) | | $495 | | | $710 | | | $1,243 | | | $1,491 | | | $1,646 | |
| Average Net Assets for the Period (in thousands) | | $577 | | | $982 | | | $1,489 | | | $1,525 | | | $1,849 | |
| Ratios to Average Net Assets**: | | | | | | | | | | | | | | | |
| | Ratio of Gross Expenses | | 2.48% | | | 2.14% | | | 2.01% | | | 2.03% | | | 2.04% | |
| | Ratio of Net Expenses (After Waivers and Expense Offsets) | | 1.72% | | | 1.71% | | | 1.67% | | | 1.69% | | | 1.71% | |
| | Ratio of Net Investment Income/(Loss) | | 0.89% | | | 0.21% | | | 0.30% | | | 0.46% | | | 0.74% | |
| Portfolio Turnover Rate | | 79%(2) | | | 41%(2) | | | 63%(2) | | | 164%(2) | | | 248% | |
| | | | | | | | | | | | | | | | | | | |
| |
* Total return includes adjustments in accordance with generally accepted accounting principles required at the year or period end and are not annualized for periods of less than one full year. ** Annualized for periods of less than one full year. (1) Per share amounts are calculated based on average shares outstanding during the year or period. (2) Portfolio Turnover Rate excludes TBA (to be announced) purchase and sales commitments. |
| | |
See Notes to Financial Statements. |
| |
28 | JUNE 30, 2023 |
Janus Henderson Global Bond Fund
Financial Highlights
| | | | | | | | | | | | | | | | | | | |
Class D Shares | | | | | | | | | | | | | | | |
For a share outstanding during the year ended June 30 | | 2023 | | | 2022 | | | 2021 | | | 2020 | | | 2019 | |
| Net Asset Value, Beginning of Period | | $8.09 | | | $10.06 | | | $10.09 | | | $9.62 | | | $9.39 | |
| Income/(Loss) from Investment Operations: | | | | | | | | | | | | | | | |
| | Net investment income/(loss)(1) | | 0.15 | | | 0.11 | | | 0.13 | | | 0.13 | | | 0.16 | |
| | Net realized and unrealized gain/(loss) | | (0.37) | | | (1.85) | | | 0.22 | | | 0.48 | | | 0.23 | |
| Total from Investment Operations | | (0.22) | | | (1.74) | | | 0.35 | | | 0.61 | | | 0.39 | |
| Less Dividends and Distributions: | | | | | | | | | | | | | | | |
| | Dividends (from net investment income) | | — | | | (0.13) | | | (0.15) | | | (0.14) | | | (0.11) | |
| | Distributions (from capital gains) | | — | | | (0.04) | | | (0.23) | | | — | | | — | |
| | Return of capital | | (0.15) | | | (0.06) | | | — | | | — | | | (0.05) | |
| Total Dividends and Distributions | | (0.15) | | | (0.23) | | | (0.38) | | | (0.14) | | | (0.16) | |
| Net Asset Value, End of Period | | $7.72 | | | $8.09 | | | $10.06 | | | $10.09 | | | $9.62 | |
| Total Return* | | (2.70)% | | | (17.62)% | | | 3.32% | | | 6.43% | | | 4.18% | |
| Net Assets, End of Period (in thousands) | | $11,456 | | | $12,971 | | | $19,754 | | | $18,928 | | | $10,293 | |
| Average Net Assets for the Period (in thousands) | | $12,063 | | | $16,457 | | | $21,961 | | | $13,105 | | | $10,705 | |
| Ratios to Average Net Assets**: | | | | | | | | | | | | | | | |
| | Ratio of Gross Expenses | | 1.06% | | | 0.93% | | | 0.92% | | | 0.93% | | | 1.00% | |
| | Ratio of Net Expenses (After Waivers and Expense Offsets) | | 0.76% | | | 0.75% | | | 0.73% | | | 0.74% | | | 0.76% | |
| | Ratio of Net Investment Income/(Loss) | | 1.87% | | | 1.17% | | | 1.24% | | | 1.37% | | | 1.68% | |
| Portfolio Turnover Rate | | 79%(2) | | | 41%(2) | | | 63%(2) | | | 164%(2) | | | 248% | |
| | | | | | | | | | | | | | | | | | | |
| |
* Total return includes adjustments in accordance with generally accepted accounting principles required at the year or period end and are not annualized for periods of less than one full year. ** Annualized for periods of less than one full year. (1) Per share amounts are calculated based on average shares outstanding during the year or period. (2) Portfolio Turnover Rate excludes TBA (to be announced) purchase and sales commitments. |
| | |
See Notes to Financial Statements. |
| |
Janus Investment Fund | 29 |
Janus Henderson Global Bond Fund
Financial Highlights
| | | | | | | | | | | | | | | | | | | |
Class I Shares | | | | | | | | | | | | | | | |
For a share outstanding during the year ended June 30 | | 2023 | | | 2022 | | | 2021 | | | 2020 | | | 2019 | |
| Net Asset Value, Beginning of Period | | $8.09 | | | $10.08 | | | $10.09 | | | $9.62 | | | $9.39 | |
| Income/(Loss) from Investment Operations: | | | | | | | | | | | | | | | |
| | Net investment income/(loss)(1) | | 0.15 | | | 0.12 | | | 0.14 | | | 0.14 | | | 0.16 | |
| | Net realized and unrealized gain/(loss) | | (0.37) | | | (1.88) | | | 0.23 | | | 0.48 | | | 0.23 | |
| Total from Investment Operations | | (0.22) | | | (1.76) | | | 0.37 | | | 0.62 | | | 0.39 | |
| Less Dividends and Distributions: | | | | | | | | | | | | | | | |
| | Dividends (from net investment income) | | — | | | (0.13) | | | (0.15) | | | (0.15) | | | (0.11) | |
| | Distributions (from capital gains) | | — | | | (0.04) | | | (0.23) | | | — | | | — | |
| | Return of capital | | (0.15) | | | (0.06) | | | — | | | — | | | (0.05) | |
| Total Dividends and Distributions | | (0.15) | | | (0.23) | | | (0.38) | | | (0.15) | | | (0.16) | |
| Net Asset Value, End of Period | | $7.72 | | | $8.09 | | | $10.08 | | | $10.09 | | | $9.62 | |
| Total Return* | | (2.67)% | | | (17.74)% | | | 3.55% | | | 6.47% | | | 4.24% | |
| Net Assets, End of Period (in thousands) | | $17,799 | | | $47,991 | | | $66,581 | | | $29,927 | | | $22,953 | |
| Average Net Assets for the Period (in thousands) | | $31,004 | | | $60,579 | | | $40,487 | | | $21,968 | | | $22,886 | |
| Ratios to Average Net Assets**: | | | | | | | | | | | | | | | |
| | Ratio of Gross Expenses | | 0.95% | | | 0.83% | | | 0.85% | | | 0.85% | | | 0.88% | |
| | Ratio of Net Expenses (After Waivers and Expense Offsets) | | 0.72% | | | 0.71% | | | 0.70% | | | 0.70% | | | 0.71% | |
| | Ratio of Net Investment Income/(Loss) | | 1.85% | | | 1.22% | | | 1.33% | | | 1.45% | | | 1.74% | |
| Portfolio Turnover Rate | | 79%(3) | | | 41%(3) | | | 63%(3) | | | 164%(3) | | | 248% | |
| | | | | | | | | | | | | | | | | | | |
| |
* Total return includes adjustments in accordance with generally accepted accounting principles required at the year or period end and are not annualized for periods of less than one full year. ** Annualized for periods of less than one full year. (1) Per share amounts are calculated based on average shares outstanding during the year or period. (2) Portfolio Turnover Rate excludes TBA (to be announced) purchase and sales commitments. |
| | |
See Notes to Financial Statements. |
| |
30 | JUNE 30, 2023 |
Janus Henderson Global Bond Fund
Financial Highlights
| | | | | | | | | | | | | | | | | | | |
Class N Shares | | | | | | | | | | | | | | | |
For a share outstanding during the year ended June 30 | | 2023 | | | 2022 | | | 2021 | | | 2020 | | | 2019 | |
| Net Asset Value, Beginning of Period | | $8.08 | | | $10.05 | | | $10.09 | | | $9.61 | | | $9.39 | |
| Income/(Loss) from Investment Operations: | | | | | | | | | | | | | | | |
| | Net investment income/(loss)(1) | | 0.16 | | | 0.13 | | | 0.14 | | | 0.15 | | | 0.17 | |
| | Net realized and unrealized gain/(loss) | | (0.36) | | | (1.86) | | | 0.21 | | | 0.49 | | | 0.22 | |
| Total from Investment Operations | | (0.20) | | | (1.73) | | | 0.35 | | | 0.64 | | | 0.39 | |
| Less Dividends and Distributions: | | | | | | | | | | | | | | | |
| | Dividends (from net investment income) | | — | | | (0.14) | | | (0.16) | | | (0.16) | | | (0.11) | |
| | Distributions (from capital gains) | | — | | | (0.03) | | | (0.23) | | | — | | | — | |
| | Return of capital | | (0.16) | | | (0.07) | | | — | | | — | | | (0.06) | |
| Total Dividends and Distributions | | (0.16) | | | (0.24) | | | (0.39) | | | (0.16) | | | (0.17) | |
| Net Asset Value, End of Period | | $7.72 | | | $8.08 | | | $10.05 | | | $10.09 | | | $9.61 | |
| Total Return* | | (2.44)% | | | (17.51)% | | | 3.36% | | | 6.69% | | | 4.23% | |
| Net Assets, End of Period (in thousands) | | $130,636 | | | $121,761 | | | $145,333 | | | $158,474 | | | $166,397 | |
| Average Net Assets for the Period (in thousands) | | $115,649 | | | $152,358 | | | $148,263 | | | $161,595 | | | $170,128 | |
| Ratios to Average Net Assets**: | | | | | | | | | | | | | | | |
| | Ratio of Gross Expenses | | 0.86% | | | 0.72% | | | 0.74% | | | 0.74% | | | 0.77% | |
| | Ratio of Net Expenses (After Waivers and Expense Offsets) | | 0.62% | | | 0.60% | | | 0.60% | | | 0.60% | | | 0.61% | |
| | Ratio of Net Investment Income/(Loss) | | 2.02% | | | 1.34% | | | 1.38% | | | 1.55% | | | 1.83% | |
| Portfolio Turnover Rate | | 79%(2) | | | 41%(2) | | | 63%(2) | | | 164%(2) | | | 248% | |
| | | | | | | | | | | | | | | | | | | |
| |
* Total return includes adjustments in accordance with generally accepted accounting principles required at the year or period end and are not annualized for periods of less than one full year. ** Annualized for periods of less than one full year. (1) Per share amounts are calculated based on average shares outstanding during the year or period. (2) Portfolio Turnover Rate excludes TBA (to be announced) purchase and sales commitments. |
| | |
See Notes to Financial Statements. |
| |
Janus Investment Fund | 31 |
Janus Henderson Global Bond Fund
Financial Highlights
| | | | | | | | | | | | | | | | | | | |
Class S Shares | | | | | | | | | | | | | | | |
For a share outstanding during the year ended June 30 | | 2023 | | | 2022 | | | 2021 | | | 2020 | | | 2019 | |
| Net Asset Value, Beginning of Period | | $8.09 | | | $10.00 | | | $10.10 | | | $9.64 | | | $9.41 | |
| Income/(Loss) from Investment Operations: | | | | | | | | | | | | | | | |
| | Net investment income/(loss)(1) | | 0.12 | | | 0.08 | | | 0.08 | | | 0.11 | | | 0.13 | |
| | Net realized and unrealized gain/(loss) | | (0.37) | | | (1.80) | | | 0.16 | | | 0.46 | | | 0.23 | |
| Total from Investment Operations | | (0.25) | | | (1.72) | | | 0.24 | | | 0.57 | | | 0.36 | |
| Less Dividends and Distributions: | | | | | | | | | | | | | | | |
| | Dividends (from net investment income) | | — | | | (0.09) | | | (0.11) | | | (0.11) | | | (0.09) | |
| | Distributions (from capital gains) | | — | | | (0.06) | | | (0.23) | | | — | | | — | |
| | Return of capital | | (0.12) | | | (0.04) | | | — | | | — | | | (0.04) | |
| Total Dividends and Distributions | | (0.12) | | | (0.19) | | | (0.34) | | | (0.11) | | | (0.13) | |
| Net Asset Value, End of Period | | $7.72 | | | $8.09 | | | $10.00 | | | $10.10 | | | $9.64 | |
| Total Return* | | (3.07)% | | | (17.44)% | | | 2.19% | | | 5.92% | | | 3.93% | |
| Net Assets, End of Period (in thousands) | | $64 | | | $63 | | | $20 | | | $133 | | | $319 | |
| Average Net Assets for the Period (in thousands) | | $63 | | | $59 | | | $41 | | | $89 | | | $375 | |
| Ratios to Average Net Assets**: | | | | | | | | | | | | | | | |
| | Ratio of Gross Expenses | | 6.15% | | | 6.35% | | | 8.61% | | | 4.64% | | | 2.01% | |
| | Ratio of Net Expenses (After Waivers and Expense Offsets) | | 1.14% | | | 1.13% | | | 1.11% | | | 1.10% | | | 1.01% | |
| | Ratio of Net Investment Income/(Loss) | | 1.50% | | | 0.85% | | | 0.77% | | | 1.09% | | | 1.43% | |
| Portfolio Turnover Rate | | 79%(2) | | | 41%(2) | | | 63%(2) | | | 164%(2) | | | 248% | |
| | | | | | | | | | | | | | | | | | | |
| |
* Total return includes adjustments in accordance with generally accepted accounting principles required at the year or period end and are not annualized for periods of less than one full year. ** Annualized for periods of less than one full year. (1) Per share amounts are calculated based on average shares outstanding during the year or period. (2) Portfolio Turnover Rate excludes TBA (to be announced) purchase and sales commitments. |
| | |
See Notes to Financial Statements. |
| |
32 | JUNE 30, 2023 |
Janus Henderson Global Bond Fund
Financial Highlights
| | | | | | | | | | | | | | | | | | | |
Class T Shares | | | | | | | | | | | | | | | |
For a share outstanding during the year ended June 30 | | 2023 | | | 2022 | | | 2021 | | | 2020 | | | 2019 | |
| Net Asset Value, Beginning of Period | | $8.09 | | | $9.91 | | | $10.10 | | | $9.63 | | | $9.40 | |
| Income/(Loss) from Investment Operations: | | | | | | | | | | | | | | | |
| | Net investment income/(loss)(1) | | 0.14 | | | 0.10 | | | 0.11 | | | 0.13 | | | 0.15 | |
| | Net realized and unrealized gain/(loss) | | (0.37) | | | (1.70) | | | 0.07 | | | 0.47 | | | 0.23 | |
| Total from Investment Operations | | (0.23) | | | (1.60) | | | 0.18 | | | 0.60 | | | 0.38 | |
| Less Dividends and Distributions: | | | | | | | | | | | | | | | |
| | Dividends (from net investment income) | | — | | | (0.12) | | | (0.14) | | | (0.13) | | | (0.10) | |
| | Distributions (from capital gains) | | — | | | (0.04) | | | (0.23) | | | — | | | — | |
| | Return of capital | | (0.14) | | | (0.06) | | | — | | | — | | | (0.05) | |
| Total Dividends and Distributions | | (0.14) | | | (0.22) | | | (0.37) | | | (0.13) | | | (0.15) | |
| Net Asset Value, End of Period | | $7.72 | | | $8.09 | | | $9.91 | | | $10.10 | | | $9.63 | |
| Total Return* | | (2.79)% | | | (16.43)% | | | 1.56% | | | 6.32% | | | 4.09% | |
| Net Assets, End of Period (in thousands) | | $2,596 | | | $3,410 | | | $9,280 | | | $29,055 | | | $5,048 | |
| Average Net Assets for the Period (in thousands) | | $2,902 | | | $6,162 | | | $33,807 | | | $6,485 | | | $5,509 | |
| Ratios to Average Net Assets**: | | | | | | | | | | | | | | | |
| | Ratio of Gross Expenses | | 1.20% | | | 1.02% | | | 1.00% | | | 1.03% | | | 1.07% | |
| | Ratio of Net Expenses (After Waivers and Expense Offsets) | | 0.85% | | | 0.83% | | | 0.84% | | | 0.85% | | | 0.85% | |
| | Ratio of Net Investment Income/(Loss) | | 1.76% | | | 1.06% | | | 1.10% | | | 1.32% | | | 1.60% | |
| Portfolio Turnover Rate | | 79%(2) | | | 41%(2) | | | 63%(2) | | | 164%(2) | | | 248% | |
| | | | | | | | | | | | | | | | | | | |
| |
* Total return includes adjustments in accordance with generally accepted accounting principles required at the year or period end and are not annualized for periods of less than one full year. ** Annualized for periods of less than one full year. (1) Per share amounts are calculated based on average shares outstanding during the year or period. (2) Portfolio Turnover Rate excludes TBA (to be announced) purchase and sales commitments. |
| | |
See Notes to Financial Statements. |
| |
Janus Investment Fund | 33 |
Janus Henderson Global Bond Fund
Notes to Financial Statements
1. Organization and Significant Accounting Policies
Janus Henderson Global Bond Fund (the “Fund”) is a series of Janus Investment Fund (the “Trust”), which is organized as a Massachusetts business trust and is registered under the Investment Company Act of 1940, as amended (the “1940 Act”), as an open-end management investment company, and therefore has applied the specialized accounting and reporting guidance in Financial Accounting Standards Board (“FASB”) Accounting Standards Codification (“ASC”) Topic 946. The Trust offers 39 funds, each of which offers multiple share classes, with differing investment objectives and policies. The Fund seeks total return, consistent with preservation of capital. The Fund is classified as diversified, as defined in the 1940 Act. Janus Henderson Investors US LLC is the investment adviser (the “Adviser”) to the Fund.
The Fund offers multiple classes of shares in order to meet the needs of various types of investors. Each class represents an interest in the same portfolio of investments. Certain financial intermediaries may not offer all classes of shares.
Shareholders, including individuals, accounts, as well as the Fund’s portfolio manager(s) and/or investment personnel, may from time to time own (beneficially or of record) a significant percentage of the Fund’s Shares and can be considered to “control” the Fund when that ownership exceeds 25% of the Fund’s assets (and which may differ from control as determined in accordance with United States of America generally accepted accounting principles ("US GAAP")).
Class A Shares are offered through financial intermediary platforms including, but not limited to, traditional brokerage platforms, mutual fund wrap fee programs, bank trust platforms, and retirement platforms.
Class C Shares are offered through financial intermediary platforms including, but not limited to, traditional brokerage platforms, mutual fund wrap fee programs, and bank trust platforms.
Class C Shares are closed to investments by new employer-sponsored retirement plans and existing employer-sponsored retirement plans are no longer able to make additional purchases or exchanges into Class C Shares.
The Fund currently implements an automatic conversion feature pursuant to which Class C Shares that have been held for eight years are automatically converted to Class A Shares without the imposition of any sales charge, fee or other charge. The conversion will generally occur no later than ten business days in the month following the month of the eighth anniversary of the date of purchase. Class C Shares purchased through the reinvestment of dividends and other distributions on Class C Shares will convert to Class A Shares at the same time as the original Class C Shares with respect to which they were purchased. For Class C Shares held in omnibus accounts on intermediary platforms, the Fund relies on these intermediaries to implement this conversion feature. Your financial intermediary may have separate policies and procedures as to when and how Class C Shares may be converted to Class A Shares.
Effective July 6, 2020, Class D Shares are available to new investors, subject to any closed fund policies for a Fund, as applicable. Previously, Class D Shares were only available to investors who already had a direct account with the Janus Henderson funds; immediate family members or members of the same household of an eligible individual investor; and existing beneficial owners of sole proprietorships or partnerships that hold accounts directly with the Janus Henderson funds.
Class I Shares are available through certain financial intermediary platforms including, but not limited to, mutual fund wrap fee programs, managed account programs, asset allocation programs, bank trust platforms, as well as certain retirement platforms. Class I Shares are also available to certain direct institutional investors including, but not limited to, corporations, certain retirement plans, public plans, and foundations/endowments, who established Class I Share accounts before August 4, 2017.
Class N Shares are generally available only to financial intermediaries purchasing on behalf of: 1) certain adviser-assisted, employer-sponsored retirement plans, including 401(k) plans, 457 plans, 403(b) plans, Taft-Hartley multi-employer plans, profit-sharing and money purchase pension plans, defined benefit plans and certain welfare benefit plans, such as health savings accounts, and nonqualified deferred compensation plans; and 2) retail investors purchasing in qualified or nonqualified accounts, whose accounts are held through an omnibus account at their financial intermediary, and where the financial intermediary requires no payment or reimbursement from the Fund, the Adviser, or its affiliates. Class N Shares are also available to Janus Henderson proprietary products and to certain direct institutional investors approved by Janus Henderson Distributors US LLC (the “Distributor”) including, but not limited to,
Janus Henderson Global Bond Fund
Notes to Financial Statements
corporations, certain retirement plans, public plans, and foundations and endowments, subject to minimum investment requirements.
Class S Shares are offered through financial intermediary platforms including, but not limited to, retirement platforms and asset allocation, mutual fund wrap, or other discretionary or nondiscretionary fee-based investment advisory programs. In addition, Class S Shares may be available through certain financial intermediaries who have an agreement with the Adviser or its affiliates to offer Class S Shares on their supermarket platforms.
Class T Shares are available through certain financial intermediary platforms including, but not limited to, mutual fund wrap fee programs, managed account programs, asset allocation programs, bank trust platforms, as well as certain retirement platforms. In addition, Class T Shares may be available through certain financial intermediaries who have an agreement with the Adviser or its affiliates to offer Class T Shares on their supermarket platforms.
The following accounting policies have been followed by the Fund and are in conformity with US GAAP.
Investment Valuation
Fund holdings are valued in accordance with policies and procedures established by the Adviser pursuant to Rule 2a-5 under the 1940 Act and approved by and subject to the oversight of the Trustees (the “Valuation Procedures”). Equity securities traded on a domestic securities exchange are generally valued at readily available market quotations, which are (i) the official close prices or (ii) last sale prices on the primary market or exchange in which the securities trade. If such price is lacking for the trading period immediately preceding the time of determination, such securities are generally valued at their current bid price. Equity securities that are traded on a foreign exchange are generally valued at the closing prices on such markets. In the event that there is no current trading volume on a particular security in such foreign exchange, the bid price from the primary exchange is generally used to value the security. Foreign securities and currencies are converted to U.S. dollars using the current spot USD dollar exchange rate in effect at the close of the New York Stock Exchange (“NYSE”). The Adviser will determine the market value of individual securities held by it by using prices provided by one or more Adviser-approved professional pricing services or, as needed, by obtaining market quotations from independent broker-dealers. Most debt securities are valued in accordance with the evaluated bid price supplied by the pricing service that is intended to reflect market value. The evaluated bid price supplied by the pricing service is an evaluation that may consider factors such as security prices, yields, maturities and ratings. Certain short-term securities maturing within 60 days or less may be evaluated and valued on an amortized cost basis provided that the amortized cost determined approximates market value. Securities for which market quotations or evaluated prices are not readily available or deemed unreliable are valued at fair value determined in good faith by the Adviser pursuant to the Valuation Procedures. Circumstances in which fair valuation may be utilized include, but are not limited to: (i) a significant event that may affect the securities of a single issuer, such as a merger, bankruptcy, or significant issuer-specific development; (ii) an event that may affect an entire market, such as a natural disaster or significant governmental action; (iii) a nonsignificant event such as a market closing early or not opening, or a security trading halt; and (iv) pricing of a nonvalued security and a restricted or nonpublic security. Special valuation considerations may apply with respect to “odd-lot” fixed-income transactions which, due to their small size, may receive evaluated prices by pricing services which reflect a large block trade and not what actually could be obtained for the odd-lot position. The value of the securities of other mutual funds held by the Fund, if any, will be calculated using the NAV of such mutual funds, and the prospectuses for such mutual funds explain the circumstances under which they use fair valuation and the effects of using fair valuation. The value of the securities of any cash management pooled investment vehicles that operate as money market funds held by the Fund, if any, will be calculated using the NAV of such funds.
Valuation Inputs Summary
FASB ASC 820, Fair Value Measurements and Disclosures (“ASC 820”), defines fair value, establishes a framework for measuring fair value, and expands disclosure requirements regarding fair value measurements. This standard emphasizes that fair value is a market-based measurement that should be determined based on the assumptions that market participants would use in pricing an asset or liability and establishes a hierarchy that prioritizes inputs to valuation techniques used to measure fair value. These inputs are summarized into three broad levels:
Level 1 – Unadjusted quoted prices in active markets the Fund has the ability to access for identical assets or liabilities.
Level 2 – Observable inputs other than unadjusted quoted prices included in Level 1 that are observable for the asset or liability either directly or indirectly. These inputs may include quoted prices for the identical instrument on
Janus Henderson Global Bond Fund
Notes to Financial Statements
an inactive market, prices for similar instruments, interest rates, prepayment speeds, credit risk, yield curves, default rates and similar data.
Assets or liabilities categorized as Level 2 in the hierarchy generally include: debt securities fair valued in accordance with the evaluated bid or ask prices supplied by a pricing service; securities traded on OTC markets and listed securities for which no sales are reported that are fair valued at the latest bid price (or yield equivalent thereof) obtained from one or more dealers transacting in a market for such securities or by a pricing service approved by the Fund’s Trustees; certain short-term debt securities with maturities of 60 days or less that are fair valued at amortized cost; and equity securities of foreign issuers whose fair value is determined by using systematic fair valuation models provided by independent third parties in order to adjust for stale pricing which may occur between the close of certain foreign exchanges and the close of the NYSE. Other securities that may be categorized as Level 2 in the hierarchy include, but are not limited to, preferred stocks, bank loans, swaps, investments in unregistered investment companies, options, and forward contracts.
Level 3 – Unobservable inputs for the asset or liability to the extent that relevant observable inputs are not available, representing the Fund’s own assumptions about the assumptions that a market participant would use in valuing the asset or liability, and that would be based on the best information available.
There have been no significant changes in valuation techniques used in valuing any such positions held by the Fund since the beginning of the fiscal year.
The inputs or methodology used for fair valuing securities are not necessarily an indication of the risk associated with investing in those securities. The summary of inputs used as of June 30, 2023 to fair value the Fund’s investments in securities and other financial instruments is included in the “Valuation Inputs Summary” in the Notes to Schedule of Investments and Other Information.
Investment Transactions and Investment Income
Investment transactions are accounted for as of the date purchased or sold (trade date). Dividend income is recorded on the ex-dividend date. Certain dividends from foreign securities will be recorded as soon as the Fund is informed of the dividend, if such information is obtained subsequent to the ex-dividend date. Dividends from foreign securities may be subject to withholding taxes in foreign jurisdictions. Non-cash dividends, if any, are recorded on the ex-dividend date at fair value. Interest income is recorded daily on the accrual basis and includes amortization of premiums and accretion of discounts. The Fund classifies gains and losses on prepayments received as an adjustment to interest income. Debt securities may be placed in non-accrual status and related interest income may be reduced by stopping current accruals and writing off interest receivables when collection of all or a portion of interest has become doubtful. Gains and losses are determined on the identified cost basis, which is the same basis used for federal income tax purposes. Income, as well as gains and losses, both realized and unrealized, are allocated daily to each class of shares based upon the ratio of net assets represented by each class as a percentage of total net assets.
Expenses
The Fund bears expenses incurred specifically on its behalf. Each class of shares bears a portion of general expenses, which are allocated daily to each class of shares based upon the ratio of net assets represented by each class as a percentage of total net assets. Expenses directly attributable to a specific class of shares are charged against the operations of such class.
Estimates
The preparation of financial statements in conformity with US GAAP requires management to make estimates and assumptions that affect the reported amount of assets and liabilities and disclosure of contingent assets and liabilities at the date of the financial statements, and the reported amounts of income and expenses during the reporting period. Actual results could differ from those estimates.
Indemnifications
In the normal course of business, the Fund may enter into contracts that contain provisions for indemnification of other parties against certain potential liabilities. The Fund’s maximum exposure under these arrangements is unknown, and would involve future claims that may be made against the Fund that have not yet occurred. Currently, the risk of material loss from such claims is considered remote.
Janus Henderson Global Bond Fund
Notes to Financial Statements
Foreign Currency Translations
The Fund does not isolate that portion of the results of operations resulting from the effect of changes in foreign exchange rates on investments from the fluctuations arising from changes in market prices of securities held at the date of the financial statements. Net unrealized appreciation or depreciation of investments and foreign currency translations arise from changes in the value of assets and liabilities, including investments in securities held at the date of the financial statements, resulting from changes in the exchange rates and changes in market prices of securities held.
Currency gains and losses are also calculated on payables and receivables that are denominated in foreign currencies. The payables and receivables are generally related to foreign security transactions and income translations.
Foreign currency-denominated assets and forward currency contracts may involve more risks than domestic transactions, including currency risk, counterparty risk, political and economic risk, regulatory risk and equity risk. Risks may arise from unanticipated movements in the value of foreign currencies relative to the U.S. dollar.
Dividends and Distributions
Dividends are declared daily and distributed monthly for the Fund. Realized capital gains, if any, are declared and distributed in December. The Fund may treat a portion of the amount paid to redeem shares as a distribution of investment company taxable income and realized capital gains that are reflected in the net asset value. This practice, commonly referred to as “equalization,” has no effect on the redeeming shareholder or a Fund’s total return, but may reduce the amounts that would otherwise be required to be paid as taxable dividends to the remaining shareholders. It is possible that the Internal Revenue Service (IRS) could challenge the Fund's equalization methodology or calculations, and any such challenge could result in additional tax, interest, or penalties to be paid by the Fund.
The Fund may make certain investments in real estate investment trusts (“REITs”) which pay dividends to their shareholders based upon funds available from operations. It is quite common for these dividends to exceed the REITs’ taxable earnings and profits, resulting in the excess portion of such dividends being designated as a return of capital. If the Fund distributes such amounts, such distributions could constitute a return of capital to shareholders for federal income tax purposes.
Federal Income Taxes
The Fund intends to continue to qualify as a regulated investment company and distribute all of its taxable income in accordance with the requirements of Subchapter M of the Internal Revenue Code. Management has analyzed the Fund’s tax positions taken for all open federal income tax years, generally a three-year period, and has concluded that no provision for federal income tax is required in the Fund’s financial statements. The Fund is not aware of any tax positions for which it is reasonably possible that the total amounts of unrecognized tax benefits will significantly change in the next twelve months.
2. Derivative Instruments
The Fund may invest in various types of derivatives, which may at times result in significant derivative exposure. A derivative is a financial instrument whose performance is derived from the performance of another asset. The Fund may invest in derivative instruments including, but not limited to: futures contracts, put options, call options, options on futures contracts, options on foreign currencies, options on recovery locks, options on security and commodity indices, swaps, forward contracts, structured investments, and other equity-linked derivatives. Each derivative instrument that was held by the Fund during the year ended June 30, 2023 is discussed in further detail below. A summary of derivative activity by the Fund is reflected in the tables at the end of the Schedule of Investments.
The Fund may use derivative instruments for hedging purposes (to offset risks associated with an investment, currency exposure, or market conditions), to adjust currency exposure relative to a benchmark index, or for speculative purposes (to earn income and seek to enhance returns). When the Fund invests in a derivative for speculative purposes, the Fund will be fully exposed to the risks of loss of that derivative, which may sometimes be greater than the derivative’s cost. The Fund may not use any derivative to gain exposure to an asset or class of assets that it would be prohibited by its investment restrictions from purchasing directly. The Fund’s ability to use derivative instruments may also be limited by tax considerations.
Investments in derivatives in general are subject to market risks that may cause their prices to fluctuate over time. Investments in derivatives may not directly correlate with the price movements of the underlying instrument. As a result, the use of derivatives may expose the Fund to additional risks that it would not be subject to if it invested directly in the
Janus Henderson Global Bond Fund
Notes to Financial Statements
securities underlying those derivatives. The use of derivatives may result in larger losses or smaller gains than otherwise would be the case. Derivatives can be volatile and may involve significant risks.
In pursuit of its investment objective, the Fund may seek to use derivatives to increase or decrease exposure to the following market risk factors:
· Commodity Risk – the risk related to the change in value of commodities or commodity-linked investments due to changes in the overall market movements, volatility of the underlying benchmark, changes in interest rates, or other factors affecting a particular industry or commodity such as drought, floods, weather, livestock disease, embargoes, tariffs, and international economic, political, and regulatory developments.
· Counterparty Risk – the risk that the counterparty (the party on the other side of the transaction) on a derivative transaction will be unable to honor its financial obligation to the Fund.
· Credit Risk – the risk an issuer will be unable to make principal and interest payments when due, or will default on its obligations.
· Currency Risk – the risk that changes in the exchange rate between currencies will adversely affect the value (in U.S. dollar terms) of an investment.
· Equity Risk – the risk related to the change in value of equity securities as they relate to increases or decreases in the general market.
· Index Risk – if the derivative is linked to the performance of an index, it will be subject to the risks associated with changes in that index. If the index changes, the Fund could receive lower interest payments or experience a reduction in the value of the derivative to below what the Fund paid. Certain indexed securities, including inverse securities (which move in an opposite direction to the index), may create leverage, to the extent that they increase or decrease in value at a rate that is a multiple of the changes in the applicable index.
· Interest Rate Risk – the risk that the value of fixed-income securities will generally decline as prevailing interest rates rise, which may cause the Fund’s NAV to likewise decrease.
· Leverage Risk – the risk associated with certain types of leveraged investments or trading strategies pursuant to which relatively small market movements may result in large changes in the value of an investment. The Fund creates leverage by investing in instruments, including derivatives, where the investment loss can exceed the original amount invested. Certain investments or trading strategies, such as short sales, that involve leverage can result in losses that greatly exceed the amount originally invested.
· Liquidity Risk – the risk that certain securities may be difficult or impossible to sell at the time that the seller would like or at the price that the seller believes the security is currently worth.
Derivatives may generally be traded OTC or on an exchange. Derivatives traded OTC are agreements that are individually negotiated between parties and can be tailored to meet a purchaser’s needs. OTC derivatives are not guaranteed by a clearing agency and may be subject to increased credit risk.
In an effort to mitigate credit risk associated with derivatives traded OTC, the Fund may enter into collateral agreements with certain counterparties whereby, subject to certain minimum exposure requirements, the Fund may require the counterparty to post collateral if the Fund has a net aggregate unrealized gain on all OTC derivative contracts with a particular counterparty. Additionally, the Fund may deposit cash and/or treasuries as collateral with the counterparty and/or custodian daily (based on the daily valuation of the financial asset) if the Fund has a net aggregate unrealized loss on OTC derivative contracts with a particular counterparty. All liquid securities and restricted cash are considered to cover in an amount at all times equal to or greater than the Fund’s commitment with respect to certain exchange-traded derivatives, centrally cleared derivatives, forward foreign currency exchange contracts, short sales, and/or securities with extended settlement dates. There is no guarantee that counterparty exposure is reduced and these arrangements are dependent on the Adviser’s ability to establish and maintain appropriate systems and trading.
Forward Foreign Currency Exchange Contracts
A forward foreign currency exchange contract (“forward currency contract”) is an obligation to buy or sell a specified currency at a future date at a negotiated rate (which may be U.S. dollars or a foreign currency). The Fund may enter into forward currency contracts for hedging purposes, including, but not limited to, reducing exposure to changes in foreign
Janus Henderson Global Bond Fund
Notes to Financial Statements
currency exchange rates on foreign portfolio holdings and locking in the U.S. dollar cost of firm purchase and sale commitments for securities denominated in or exposed to foreign currencies. The Fund may also invest in forward currency contracts for non-hedging purposes such as seeking to enhance returns. The Fund is subject to currency risk and counterparty risk in the normal course of pursuing its investment objective through its investments in forward currency contracts.
Forward currency contracts are valued by converting the foreign value to U.S. dollars by using the current spot U.S. dollar exchange rate and/or forward rate for that currency. Exchange and forward rates as of the close of the NYSE are used to value the forward currency contracts. The unrealized appreciation/(depreciation) for forward currency contracts is reported in the Statement of Assets and Liabilities as a receivable or payable and in the Statement of Operations for the change in unrealized net appreciation/depreciation (if applicable). The realized gain or loss arising from the difference between the U.S. dollar cost of the original contract and the value of the foreign currency in U.S. dollars upon closing a forward currency contract is reported on the Statement of Operations (if applicable).
During the year, the Fund entered into forward currency contracts with the obligation to purchase foreign currencies in the future at an agreed upon rate in order to take a positive outlook on the related currency. These forward contracts seek to increase exposure to currency risk.
During the year, the Fund entered into forward currency contracts with the obligation to purchase foreign currencies in the future at an agreed upon rate in order to decrease exposure to currency risk associated with foreign currency denominated securities held by the Fund.
During the year, the Fund entered into forward currency contracts with the obligation to sell foreign currencies in the future at an agreed upon rate in order to take a negative outlook on the related currency. These forward contracts seek to increase exposure to currency risk.
During the year, the Fund entered into forward currency contracts with the obligation to sell foreign currencies in the future at an agreed upon rate in order to decrease exposure to currency risk associated with foreign currency denominated securities held by the Fund.
Futures Contracts
A futures contract is an exchange-traded agreement to take or make delivery of an underlying asset at a specific time in the future for a specific predetermined negotiated price. The Fund may enter into futures contracts to gain exposure to the stock market or other markets pending investment of cash balances or to meet liquidity needs. The Fund is subject to interest rate risk, equity risk, and currency risk in the normal course of pursuing its investment objective through its investments in futures contracts. The Fund may also use such derivative instruments to hedge or protect from adverse movements in securities prices, currency rates or interest rates. The use of futures contracts may involve risks such as the possibility of illiquid markets or imperfect correlation between the values of the contracts and the underlying securities, or that the counterparty will fail to perform its obligations.
Futures contracts are valued at the settlement price on valuation date on the exchange as reported by an approved vendor. Mini contracts, as defined in the description of the contract, shall be valued using the Actual Settlement Price or “ASET” price type as reported by an approved vendor. In the event that foreign futures trade when the foreign equity markets are closed, the last foreign futures trade price shall be used. Futures contracts are marked-to-market daily, and the daily variation margin is recorded as a receivable or payable on the Statement of Assets and Liabilities (if applicable). The change in unrealized net appreciation/depreciation is reported on the Statement of Operations (if applicable). When a contract is closed, a realized gain or loss is reported on the Statement of Operations (if applicable), equal to the difference between the opening and closing value of the contract. Securities held by the Fund that are designated as collateral for market value on futures contracts are noted on the Schedule of Investments (if applicable). Such collateral is in the possession of the Fund’s futures commission merchant.
With futures, there is minimal counterparty credit risk to the Fund since futures are exchange-traded and the exchange’s clearinghouse, as counterparty to all exchange-traded futures, guarantees the futures against default.
During the year, the Fund purchased interest rate futures to increase exposure to interest rate risk.
During the year, the Fund sold interest rate futures to decrease exposure to interest rate risk.
Janus Henderson Global Bond Fund
Notes to Financial Statements
Swaps
Swap agreements are two-party contracts entered into primarily by institutional investors for periods ranging from a day to more than one year to exchange one set of cash flows for another. The most significant factor in the performance of swap agreements is the change in value of the specific index, security, or currency, or other factors that determine the amounts of payments due to and from the Fund. The use of swaps is a highly specialized activity which involves investment techniques and risks different from those associated with ordinary portfolio securities transactions. Swap transactions may in some instances involve the delivery of securities or other underlying assets by the Fund or its counterparty to collateralize obligations under the swap. If the other party to a swap that is not collateralized defaults, the Fund would risk the loss of the net amount of the payments that it contractually is entitled to receive. Swap agreements entail the risk that a party will default on its payment obligations to the Fund. If the other party to a swap defaults, the Fund would risk the loss of the net amount of the payments that it contractually is entitled to receive. If the Fund utilizes a swap at the wrong time or judges market conditions incorrectly, the swap may result in a loss to the Fund and reduce the Fund’s total return.
Swap agreements also bear the risk that the Fund will not be able to meet its obligation to the counterparty. Swap agreements are typically privately negotiated and entered into in the OTC market. However, certain swap agreements are required to be cleared through a clearinghouse and traded on an exchange or swap execution facility. Swaps that are required to be cleared are required to post initial and variation margins in accordance with the exchange requirements. Regulations enacted require the Fund to centrally clear certain interest rate and credit default index swaps through a clearinghouse or central counterparty (“CCP”). To clear a swap with a CCP, the Fund will submit the swap to, and post collateral with, a futures clearing merchant (“FCM”) that is a clearinghouse member. Alternatively, the Fund may enter into a swap with a financial institution other than the FCM (the “Executing Dealer”) and arrange for the swap to be transferred to the FCM for clearing. The Fund may also enter into a swap with the FCM itself. The CCP, the FCM, and the Executing Dealer are all subject to regulatory oversight by the U.S. Commodity Futures Trading Commission (“CFTC”). A default or failure by a CCP or an FCM, or the failure of a swap to be transferred from an Executing Dealer to the FCM for clearing, may expose the Fund to losses, increase its costs, or prevent the Fund from entering or exiting swap positions, accessing collateral, or fully implementing its investment strategies. The regulatory requirement to clear certain swaps could, either temporarily or permanently, reduce the liquidity of cleared swaps or increase the costs of entering into those swaps.
Index swaps, interest rate swaps, inflation swaps and credit default swaps are valued using an approved vendor supplied price. Basket swaps are valued using a broker supplied price. Equity swaps that consist of a single underlying equity are valued either at the closing price, the latest bid price, or the last sale price on the primary market or exchange it trades. The market value of swap contracts are aggregated by positive and negative values and are disclosed separately as an asset or liability on the Fund’s Statement of Assets and Liabilities (if applicable). Realized gains and losses are reported on the Fund’s Statement of Operations (if applicable). The change in unrealized net appreciation or depreciation during the year is included in the Statement of Operations (if applicable).
The Fund’s maximum risk of loss from counterparty risk or credit risk is the discounted value of the payments to be received from/paid to the counterparty over the contract’s remaining life, to the extent that the amount is positive. The risk is mitigated by having a netting arrangement between the Fund and the counterparty and by the posting of collateral by the counterparty to cover the Fund’s exposure to the counterparty.
The Fund may enter into various types of credit default swap agreements, including OTC credit default swap agreements, for investment purposes, to add leverage to its Fund, or to hedge against widening credit spreads on high-yield/high-risk bonds. Credit default swaps are a specific kind of counterparty agreement that allow the transfer of third party credit risk from one party to the other. One party in the swap is a lender and faces credit risk from a third party, and the counterparty in the credit default swap agrees to insure this risk in exchange for regular periodic payments. Credit default swaps could result in losses if the Fund does not correctly evaluate the creditworthiness of the company or companies on which the credit default swap is based. Credit default swap agreements may involve greater risks than if the Fund had invested in the reference obligation directly since, in addition to risks relating to the reference obligation, credit default swaps are subject to illiquidity risk, counterparty risk, and credit risk. The Fund will generally incur a greater degree of risk when it sells a credit default swap than when it purchases a credit default swap. As a buyer of a credit default swap, the Fund may lose its investment and recover nothing should no credit event occur and the swap is held to its termination date. As seller of a credit default swap, if a credit event were to occur, the value of any deliverable
Janus Henderson Global Bond Fund
Notes to Financial Statements
obligation received by the Fund, coupled with the upfront or periodic payments previously received, may be less than what it pays to the buyer, resulting in a loss of value to the Fund.
As a buyer of credit protection, the Fund is entitled to receive the par (or other agreed-upon) value of a referenced debt obligation from the counterparty to the contract in the event of a default or other credit event by a third party, such as a U.S. or foreign issuer, on the debt obligation. In return, the Fund as buyer would pay to the counterparty a periodic stream of payments over the term of the contract provided that no credit event has occurred. If no credit event occurs, the Fund would have spent the stream of payments and potentially received no benefit from the contract.
If the Fund is the seller of credit protection against a particular security, the Fund would receive an up-front or periodic payment to compensate against potential credit events. As the seller in a credit default swap contract, the Fund would be required to pay the par value (the “notional value”) (or other agreed-upon value) of a referenced debt obligation to the counterparty in the event of a default by a third party, such as a U.S. or foreign corporate issuer, on the debt obligation. In return, the Fund would receive from the counterparty a periodic stream of payments over the term of the contract provided that no event of default has occurred. If no default occurs, the Fund would keep the stream of payments and would have no payment obligations. As the seller, the Fund would effectively add leverage to its portfolio because, in addition to its total net assets, the Fund would be subject to investment exposure on the notional value of the swap. The maximum potential amount of future payments (undiscounted) that the Fund as a seller could be required to make in a credit default transaction would be the notional amount of the agreement.
The Fund may invest in single-name credit default swaps (“CDS”) to buy or sell credit protection to hedge its credit exposure, gain issuer exposure without owning the underlying security, or increase the Fund’s total return. Single-name CDS enable the Fund to buy or sell protection against a credit event of a specific issuer. When the Fund buys a single-name CDS, the Fund will receive a return on its investment only in the event of a credit event, such as default by the issuer of the underlying obligation (as opposed to a credit downgrade or other indication of financial difficulty). If a single-name CDS transaction is particularly large, or if the relevant market is illiquid, it may not be possible for the Fund to initiate a single-name CDS transaction or to liquidate its position at an advantageous time or price, which may result in significant losses. Moreover, the Fund bears the risk of loss of the amount expected to be received under a single-name CDS in the event of the default or bankruptcy of the counterparty. The risks associated with cleared single-name CDS may be lower than that for uncleared single-name CDS because for cleared single-name CDS, the counterparty is a clearinghouse (to the extent such a trading market is available). However, there can be no assurance that a clearinghouse or its members will satisfy their obligations to the Fund.
During the year, the Fund sold protection via the credit default swap market in order to gain credit risk exposure to individual corporates, countries and/or credit indices where gaining this exposure via the cash bond market was less attractive.
During the year, the Fund purchased protection via the credit default swap market in order to reduce credit risk exposure to individual corporates, countries and/or credit indices where reducing this exposure via the cash bond market was less attractive.
The Fund’s use of interest rate swaps involves investment techniques and risks different from those associated with ordinary portfolio security transactions. Interest rate swaps do not involve the delivery of securities, other underlying assets, or principal. Interest rate swaps involve the exchange by two parties of their respective commitments to pay or receive interest (e.g., an exchange of floating rate payments for fixed rate payments). Interest rate swaps may result in potential losses if interest rates do not move as expected or if the counterparties are unable to satisfy their obligations. Interest rate swaps are generally entered into on a net basis. Accordingly, the risk of loss with respect to interest rate swaps is limited to the net amount of interest payments that the Fund is contractually obligated to make.
During the year, the Fund entered into interest rate swaps paying a floating interest rate and receiving a fixed interest rate in order to increase interest rate risk (duration) exposure. As interest rates fall, the Fund benefits by paying a lower future floating rate, while receiving a fixed rate that has not decreased.
During the year, the Fund entered into interest rate swaps paying a fixed interest rate and receiving a floating interest rate in order to decrease interest rate risk (duration) exposure. As interest rates rise, the Fund benefits by receiving a higher expected future floating rate, while paying a fixed rate that has not increased.
Janus Henderson Global Bond Fund
Notes to Financial Statements
3. Other Investments and Strategies
Market Risk
The Fund may be invested in lower-rated debt securities that have a higher risk of default or loss of value since these securities may be sensitive to economic changes, political changes, or adverse developments specific to the issuer.
The value of the Fund’s portfolio may decrease if the value of one or more issuers in the Fund’s portfolio decreases. Further, regardless of how well individual companies or securities perform, the value of the Fund’s portfolio could also decrease if there are deteriorating economic or market conditions, including, but not limited to, a general decline in prices on the stock markets, a general decline in real estate markets, a decline in commodities prices, or if the market favors different types of securities than the types of securities in which the Fund invests. If the value of the Fund’s portfolio decreases, the Fund’s NAV will also decrease, which means if you sell your shares in the Fund you may lose money. Market risk may affect a single issuer, industry, economic sector, or the market as a whole. The increasing interconnectivity between global economies and financial markets increases the likelihood that events or conditions in one region or financial market may adversely impact issuers in a different country, region or financial market. Social, political, economic and other conditions and events, such as natural disasters, health emergencies (e.g., epidemics and pandemics), terrorism, conflicts, including related sanctions, and social unrest, could reduce consumer demand or economic output, result in market closures, travel restrictions and/or quarantines, and generally have a significant impact on the global economies and financial markets.
• COVID-19 Pandemic. The effects of COVID-19 have contributed to increased volatility in global financial markets and have affected and may continue to affect certain countries, regions, issuers, industries and market sectors more dramatically than others. These conditions and events could have a significant impact on the Fund and its investments, the Fund’s ability to meet redemption requests, and the processes and operations of the Fund’s service providers, including the Adviser.
• Russia/Ukraine Invasion. Russia launched a large-scale invasion of Ukraine on February 24, 2022. The extent and duration of the military action, resulting sanctions and resulting future market disruptions in the region are impossible to predict, but could be significant and have a severe adverse effect on the region, including significant negative impacts on the economy and the markets for certain securities and commodities, such as oil and natural gas, as well as other sectors.
Emerging Market Investing
Within the parameters of its specific investment policies, the Fund may invest in securities of issuers or companies from or with exposure to one or more “developing countries” or “emerging market countries.” Such countries include but are not limited to countries included in the MSCI Emerging Markets IndexSM. Emerging market countries in which the Fund may invest include frontier market countries, the economies of which are less developed than other emerging market countries. To the extent that the Fund invests a significant amount of its assets in one or more of these countries, its returns and net asset value may be affected to a large degree by events and economic conditions in such countries. The risks of foreign investing are heightened when investing in emerging markets, which may result in the price of investments in emerging markets experiencing sudden and sharp price swings. In many developing markets, there is less government supervision and regulation of stock exchanges, brokers, and listed companies, making these investments potentially more volatile in price and less liquid than investments in developed securities markets, resulting in greater risk to investors. Similarly, issuers in such markets may not be subject to regulatory, accounting, auditing, and financial reporting and recordkeeping standards comparable to those to which U.S. companies are subject. There is a risk in developing countries that a current or future economic or political crisis could lead to price controls, forced mergers of companies, expropriation or confiscatory taxation, imposition or enforcement of foreign ownership limits, seizure, nationalization, sanctions or imposition of restrictions by various governmental entities on investment and trading, or creation of government monopolies, any of which may have a detrimental effect on the Fund’s investments. In addition, the Fund’s investments may be denominated in foreign currencies and therefore, changes in the value of a country’s currency compared to the U.S. dollar may affect the value of the Fund’s investments. To the extent that the Fund invests a significant portion of its assets in the securities of issuers in or companies of a single country or region, it is more likely to be impacted by events or conditions affecting that country or region, which could have a negative impact on the Fund’s performance. Developing countries may also experience a higher level of exposure and vulnerability to the adverse effects of climate change. This can be attributed to both the geographic location of emerging market countries and/or a country’s lack of access to technology or resources to adjust and adapt to its effects. An increased occurrence and severity of natural disasters and extreme weather events such as droughts and
Janus Henderson Global Bond Fund
Notes to Financial Statements
decreased crop yields, heat waves, flooding and rising sea levels, and increased spread of disease, could cause harmful effects to the performance of affected economies. Additionally, foreign and emerging market risks, including, but not limited to, price controls, expropriation or confiscatory taxation, imposition or enforcement of foreign ownership limits, nationalization, and restrictions on repatriation of assets may be heightened to the extent the Fund invests in Chinese local market securities.
Mortgage- and Asset-Backed Securities
Mortgage- and asset-backed securities represent interests in “pools” of commercial or residential mortgages or other assets, including consumer and commercial loans or receivables. The Fund may purchase fixed or variable rate commercial or residential mortgage-backed securities issued by the Government National Mortgage Association (“Ginnie Mae”), the Federal National Mortgage Association (“Fannie Mae”), the Federal Home Loan Mortgage Corporation (“Freddie Mac”), or other governmental or government-related entities. Ginnie Mae’s guarantees are backed as to the timely payment of principal and interest by the full faith and credit of the U.S. Government. Fannie Mae and Freddie Mac securities are not backed by the full faith and credit of the U.S. Government. In September 2008, the Federal Housing Finance Agency (“FHFA”), an agency of the U.S. Government, placed Fannie Mae and Freddie Mac under conservatorship. Since that time, Fannie Mae and Freddie Mac have received capital support through U.S. Treasury preferred stock purchases and Treasury and Federal Reserve purchases of their mortgage-backed securities. The FHFA and the U.S. Treasury have imposed strict limits on the size of these entities’ mortgage portfolios. The FHFA has the power to cancel any contract entered into by Fannie Mae and Freddie Mac prior to FHFA’s appointment as conservator or receiver, including the guarantee obligations of Fannie Mae and Freddie Mac.
The Fund may also purchase other mortgage- and asset-backed securities through single- and multi-seller conduits, collateralized debt obligations, structured investment vehicles, and other similar securities. Asset-backed securities may be backed by various consumer obligations, including automobile loans, equipment leases, credit card receivables, or other collateral. In the event the underlying loans are not paid, the securities’ issuer could be forced to sell the assets and recognize losses on such assets, which could impact your return. Unlike traditional debt instruments, payments on these securities include both interest and a partial payment of principal. Mortgage- and asset-backed securities are subject to both extension risk, where borrowers pay off their debt obligations more slowly in times of rising interest rates, and prepayment risk, where borrowers pay off their debt obligations sooner than expected in times of declining interest rates. These risks may reduce the Fund’s returns. In addition, investments in mortgage- and asset-backed securities, including those comprised of subprime mortgages, may be subject to a higher degree of credit risk, valuation risk, extension risk (if interest rates rise), and liquidity risk than various other types of fixed-income securities. Additionally, although mortgage-backed securities are generally supported by some form of government or private guarantee and/or insurance, there is no assurance that guarantors or insurers will meet their obligations.
Sovereign Debt
The Fund may invest in U.S. and non-U.S. government debt securities (“sovereign debt”). Some investments in sovereign debt, such as U.S. sovereign debt, are considered low risk. However, investments in sovereign debt, especially the debt of less developed countries, can involve a high degree of risk, including the risk that the governmental entity that controls the repayment of sovereign debt may not be willing or able to repay the principal and/or to pay the interest on its sovereign debt in a timely manner. A sovereign debtor’s willingness or ability to satisfy its debt obligation may be affected by various factors including, but not limited to, its cash flow situation, the extent of its foreign currency reserves, the availability of foreign exchange when a payment is due, the relative size of its debt position in relation to its economy as a whole, the sovereign debtor’s policy toward international lenders, and local political constraints to which the governmental entity may be subject. Sovereign debtors may also be dependent on expected disbursements from foreign governments, multilateral agencies, and other entities. The failure of a sovereign debtor to implement economic reforms, achieve specified levels of economic performance, or repay principal or interest when due may result in the cancellation of third party commitments to lend funds to the sovereign debtor, which may further impair such debtor’s ability or willingness to timely service its debts. The Fund may be requested to participate in the rescheduling of such sovereign debt and to extend further loans to governmental entities, which may adversely affect the Fund’s holdings. In the event of default, there may be limited or no legal remedies for collecting sovereign debt and there may be no bankruptcy proceedings through which the Fund may collect all or part of the sovereign debt that a governmental entity has not repaid. In addition, to the extent the Fund invests in non-U.S. sovereign debt, it may be subject to currency risk.
Janus Henderson Global Bond Fund
Notes to Financial Statements
TBA Commitments
The Fund may enter into “to be announced” or “TBA” commitments. TBAs are forward agreements for the purchase or sale of securities, including mortgage-backed securities, for a fixed price, with payment and delivery on an agreed upon future settlement date. The specific securities to be delivered are not identified at the trade date. However, delivered securities must meet specified terms, including issuer, rate, and mortgage terms. Although TBA securities must meet industry-accepted “good delivery” standards, there can be no assurance that a security purchased on forward commitment basis will ultimately be issued or delivered by the counterparty. During the settlement period, the Fund will still bear the risk of any decline in the value of the security to be delivered. Because TBA commitments do not require the delivery of a specific security, the characteristics of the security delivered to the Fund may be less favorable than expected. If the counterparty to a transaction fails to deliver the security, the Fund could suffer a loss. Cash collateral that has been pledged to cover the obligations of a Fund and cash collateral received from the counterparty, if any, is reported separately in the Statement of Assets and Liabilities as Collateral for To Be Announced Transactions.
When-Issued, Delayed Delivery and Forward Commitment Transactions
The Fund may purchase or sell securities on a when-issued, delayed delivery, or forward commitment basis. When purchasing a security on a when-issued, delayed delivery, or forward commitment basis, the Fund assumes the rights and risks of ownership of the security, including the risk of price and yield fluctuations, and takes such fluctuations into account when determining its net asset value. Typically, no income accrues on securities the Fund has committed to purchase prior to the time delivery of the securities is made. Because the Fund is not required to pay for the security until the delivery date, these risks are in addition to the risks associated with the Fund’s other investments. If the other party to a transaction fails to deliver the securities, the Fund could miss a favorable price or yield opportunity. If the Fund remains substantially fully invested at a time when when-issued, delayed delivery, or forward commitment purchases are outstanding, the purchases may result in a form of leverage. If the Fund remains substantially fully invested at a time when when-issued, delayed delivery, or forward commitment purchases (including TBA commitments) are outstanding, the purchases may result in a form of leverage.
When the Fund has sold a security on a when-issued, delayed delivery, or forward commitment basis, the Fund does not participate in future gains or losses with respect to the security. If the other party to a transaction fails to pay for the securities, the Fund could suffer a loss. Additionally, when selling a security on a when-issued, delayed delivery, or forward commitment basis without owning the security, the Fund will incur a loss if the security’s price appreciates in value such that the security’s price is above the agreed upon price on the settlement date. The Fund may dispose of or renegotiate a transaction after it is entered into, and may purchase or sell when-issued, delayed delivery or forward commitment securities before the settlement date, which may result in a gain or loss.
Counterparties
Fund transactions involving a counterparty are subject to the risk that the counterparty or a third party will not fulfill its obligation to the Fund (“counterparty risk”). Counterparty risk may arise because of the counterparty’s financial condition (i.e., financial difficulties, bankruptcy, or insolvency), market activities and developments, or other reasons, whether foreseen or not. A counterparty’s inability to fulfill its obligation may result in significant financial loss to the Fund. The Fund may be unable to recover its investment from the counterparty or may obtain a limited recovery, and/or recovery may be delayed. The extent of the Fund’s exposure to counterparty risk with respect to financial assets and liabilities approximates its carrying value. See the "Offsetting Assets and Liabilities" section of this Note for further details.
The Fund may be exposed to counterparty risk through participation in various programs, including, but not limited to, lending its securities to third parties, cash sweep arrangements whereby the Fund’s cash balance is invested in one or more types of cash management vehicles, as well as investments in, but not limited to, repurchase agreements, debt securities, and derivatives, including various types of swaps, futures and options. The Fund intends to enter into financial transactions with counterparties that the Adviser believes to be creditworthy at the time of the transaction. There is always the risk that the Adviser’s analysis of a counterparty’s creditworthiness is incorrect or may change due to market conditions. To the extent that the Fund focuses its transactions with a limited number of counterparties, it will have greater exposure to the risks associated with one or more counterparties.
Securities Lending
Under procedures adopted by the Trustees, the Fund may seek to earn additional income by lending securities to certain qualified broker-dealers and institutions. JPMorgan Chase Bank, National Association acts as securities lending agent and a limited purpose custodian or subcustodian to receive and disburse cash balances and cash collateral, hold short-term investments, hold collateral, and perform other custodial functions in accordance with the Non-Custodial
Janus Henderson Global Bond Fund
Notes to Financial Statements
Securities Lending Agreement. For financial reporting purposes, the Fund does not offset financial instruments’ payables and receivables and related collateral on the Statement of Assets and Liabilities. The Fund may lend fund securities in an amount equal to up to 1/3 of its total assets as determined at the time of the loan origination. There is the risk of delay in recovering a loaned security or the risk of loss in collateral rights if the borrower fails financially. In addition, the Adviser makes efforts to balance the benefits and risks from granting such loans. All loans will be continuously secured by collateral which may consist of cash, U.S. Government securities, domestic and foreign short-term debt instruments, letters of credit, time deposits, repurchase agreements, money market mutual funds or other money market accounts, or such other collateral as permitted by the SEC. If the Fund is unable to recover a security on loan, the Fund may use the collateral to purchase replacement securities in the market. There is a risk that the value of the collateral could decrease below the cost of the replacement security by the time the replacement investment is made, resulting in a loss to the Fund. In certain circumstances individual loan transactions could yield negative returns.
Upon receipt of cash collateral, the Adviser may invest it in affiliated or non-affiliated cash management vehicles, whether registered or unregistered entities, as permitted by the 1940 Act and rules promulgated thereunder. The Adviser currently intends to primarily invest the cash collateral in a cash management vehicle for which the Adviser serves as investment adviser, Janus Henderson Cash Collateral Fund LLC, or in time deposits. An investment in Janus Henderson Cash Collateral Fund LLC is generally subject to the same risks that shareholders experience when investing in similarly structured vehicles, such as the potential for significant fluctuations in assets as a result of the purchase and redemption activity of the securities lending program, a decline in the value of the collateral, and possible liquidity issues. Such risks may delay the return of the cash collateral and cause the Fund to violate its agreement to return the cash collateral to a borrower in a timely manner. As adviser to the Fund and Janus Henderson Cash Collateral Fund LLC, the Adviser has an inherent conflict of interest as a result of its fiduciary duties to both the Fund and Janus Henderson Cash Collateral Fund LLC. Additionally, the Adviser receives an investment advisory fee of 0.05% for managing Janus Henderson Cash Collateral Fund LLC, but it may not receive a fee for managing certain other affiliated cash management vehicles in which the Fund may invest, and therefore may have an incentive to allocate preferred investment opportunities to investment vehicles for which it is receiving a fee.
The value of the collateral must be at least 102% of the market value of the loaned securities that are denominated in U.S. dollars and 105% of the market value of the loaned securities that are not denominated in U.S. dollars. Loaned securities and related collateral are marked-to-market each business day based upon the market value of the loaned securities at the close of business, employing the most recent available pricing information. Collateral levels are then adjusted based on this mark-to-market evaluation. Additional required collateral, or excess collateral returned, is delivered on the next business day. Therefore, the value of the collateral held may be temporarily less than 102% or 105% value of the securities on loan. The cash collateral invested by the Adviser is disclosed in the Schedule of Investments (if applicable).
Income earned from the investment of the cash collateral, net of rebates paid to, or fees paid by, borrowers and less the fees paid to the lending agent are included as “Affiliated securities lending income, net” on the Statement of Operations. As of June 30, 2023, securities lending transactions accounted for as secured borrowings with an overnight and continuous contractual maturity are $284,057. Gross amounts of recognized liabilities for securities lending (collateral received) as of June 30, 2023 is $290,625, resulting in the net amount due to the counterparty of $6,568.
Offsetting Assets and Liabilities
The Fund presents gross and net information about transactions that are either offset in the financial statements or subject to an enforceable master netting arrangement or similar agreement with a designated counterparty, regardless of whether the transactions are actually offset in the Statement of Assets and Liabilities.
In order to better define its contractual rights and to secure rights that will help the Fund mitigate its counterparty risk, the Fund has entered into an International Swaps and Derivatives Association, Inc. Master Agreement (“ISDA Master Agreement”) or similar agreement with its derivative contract counterparties. An ISDA Master Agreement is a bilateral agreement between the Fund and a counterparty that governs OTC derivatives and forward foreign currency exchange contracts and typically contains, among other things, collateral posting terms and netting provisions in the event of a default and/or termination event. Under an ISDA Master Agreement, in the event of a default and/or termination event, the Fund may offset with each counterparty certain derivative financial instruments’ payables and/or receivables with collateral held and/or posted and create one single net payment.
Janus Henderson Global Bond Fund
Notes to Financial Statements
The Offsetting Assets and Liabilities tables located in the Schedule of Investments present gross amounts of recognized assets and/or liabilities and the net amounts after deducting collateral that has been pledged by counterparties or has been pledged to counterparties (if applicable). For corresponding information grouped by type of instrument, see the “Fair Value of Derivative Instruments (not accounted for as hedging instruments) as of June 30, 2023” table located in the Fund’s Schedule of Investments.
The Fund may require the counterparty to pledge securities as collateral daily (based on the daily valuation of the financial asset) if the Fund has a net aggregate unrealized gain on OTC derivative contracts with a particular counterparty. The Fund may deposit cash as collateral with the counterparty and/or custodian daily (based on the daily valuation of the financial asset) if the Fund has a net aggregate unrealized loss on OTC derivative contracts with a particular counterparty. The collateral amounts are subject to minimum exposure requirements and initial margin requirements. Collateral amounts are monitored and subsequently adjusted up or down as valuations fluctuate by at least the minimum exposure requirement. Collateral may reduce the risk of loss.
The Fund generally does not exchange collateral on its forward foreign currency contracts with its counterparties; however, all liquid securities and restricted cash are considered to cover in an amount at all times equal to or greater than the Fund’s commitment with respect to these contracts. Certain securities may be segregated at the Fund’s custodian. These segregated securities are denoted on the accompanying Schedule of Investments and are evaluated daily to ensure their cover and/or market value equals or exceeds the Fund’s corresponding forward foreign currency exchange contract's obligation value.
4. Investment Advisory Agreements and Other Transactions with Affiliates
The Fund pays the Adviser an investment advisory fee which is calculated daily and paid monthly. The following table reflects the Fund’s contractual investment advisory fee rate (expressed as an annual rate).
| | |
Average Daily Net Assets of the Fund | Contractual Investment Advisory Fee (%) |
First $1 Billion | 0.60 |
Next $1 Billion | 0.55 |
Over $2 Billion | 0.50 |
The Fund’s actual investment advisory fee rate for the reporting period was 0.60% of average annual net assets before any applicable waivers.
The Adviser has entered into a personnel-sharing arrangement with its foreign (non-U.S.) affiliate, Janus Capital International Limited (UK) (“JCIL”), pursuant to which one or more employees of JCIL may also serve as “associated persons” of the Adviser. In this capacity, such employees of JCIL are subject to the oversight and supervision of the Adviser and may provide portfolio management, research, and related services to the Fund on behalf of the Adviser. The responsibilities of both the Adviser and JCIL under the participating affiliate arrangement are documented in a memorandum of understanding between the two entities.
The Adviser has contractually agreed to waive the investment advisory fee and/or reimburse operating expenses to the extent that the Fund’s total annual fund operating expenses, excluding the fees payable pursuant to a Rule 12b-1 plan, shareholder servicing fees, such as transfer agency fees (including out-of-pocket costs), administrative services fees and any networking/omnibus payable by any share class, brokerage commissions, interest, dividends, taxes, acquired fund fees and expenses, and extraordinary expenses, exceed the annual rate of 0.59% of the Fund’s average daily net assets. The Adviser has agreed to continue the waivers for at least a one-year period commencing October 28, 2022. If applicable, amounts waived and/or reimbursed to the Fund by the Adviser are disclosed as “Excess Expense Reimbursement and Waivers” on the Statement of Operations.
The Adviser serves as administrator to the Fund pursuant to an administration agreement between the Adviser and the Trust. Under the administration agreement, the Adviser is authorized to perform, or cause others to perform certain administration, compliance, and accounting services to the Fund, including providing office space for the Fund, and is reimbursed by the Fund for certain of its costs in providing these services (to the extent the Adviser seeks reimbursement and such costs are not otherwise waived). In addition, employees of the Adviser and/or its affiliates may serve as officers of the Trust. The Fund pays for some or all of the salaries, fees, and expenses of the Adviser employees and Fund officers, with respect to certain specified administration functions they perform on behalf of the
Janus Henderson Global Bond Fund
Notes to Financial Statements
Fund. The Fund pays these costs based on out-of-pocket expenses incurred by the Adviser, and these costs are separate and apart from advisory fees and other expenses paid in connection with the investment advisory services the Adviser (or any subadvisor, as applicable) provides to the Fund. These amounts are disclosed as “Affiliated fund administration fees” on the Statement of Operations. In addition, some expenses related to compensation payable to the Fund’s Chief Compliance Officer and certain compliance staff, all of whom are employees of the Adviser and/or its affiliates, are shared with the Fund. Total compensation of $343,237 was paid to the Chief Compliance Officer and certain compliance staff by the Trust during the year ended June 30, 2023. The Fund's portion is reported as part of “Other expenses” on the Statement of Operations.
Janus Henderson Services US LLC (the “Transfer Agent”), a wholly-owned subsidiary of the Adviser, is the Fund’s transfer agent. The Transfer Agent provides or arranges for the provision of shareholder services including, but not limited to, recordkeeping, subaccounting, answering inquiries regarding accounts, order processing, transaction confirmations, the mailing of prospectuses and shareholder reports, and other shareholder services provided to or on behalf of shareholders. These amounts are disclosed as “Transfer agent administrative fees and expenses” on the Statement of Operations.
Class D Shares of the Fund pay the Transfer Agent an annual administrative services fee based on the average daily net assets of Class D Shares as detailed below.
| | |
Average Daily Net Assets of Class D Shares of the Janus Henderson funds | Administrative Services Fee |
Under $40 billion | 0.12% |
$40 billion – $49.9 billion | 0.10% |
Over $49.9 billion | 0.08% |
During the reporting period, the administrative services fee rate was 0.12%.
The Transfer Agent receives an administrative services fee at an annual rate of up to 0.25% of the average daily net assets of the Fund’s Class S Shares and Class T Shares for providing or procuring administrative services to investors in Class S Shares and Class T Shares of the Fund. The Transfer Agent expects to use all or a significant portion of this fee to compensate retirement plan service providers, broker-dealers, bank trust departments, financial advisors, and other financial intermediaries for providing these services. The Transfer Agent may keep certain amounts retained for reimbursement of out-of-pocket costs incurred for servicing clients of Class S Shares and Class T Shares.
Shareholder Services provided by these financial intermediaries may include, but are not limited to, recordkeeping, subaccounting, order processing, providing order confirmations, periodic statements, forwarding prospectuses, shareholder reports, and other materials to existing customers, answering inquiries regarding accounts, and other administrative services. Order processing includes the submission of transactions through the National Securities Clearing Corporation (“NSCC”) or similar systems, or those processed on a manual basis with the Adviser. For all share classes, the Transfer Agent also seeks reimbursement for costs it incurs as transfer agent and for providing servicing.
Certain, but not all, intermediaries may charge administrative fees to investors in Class A Shares, Class C Shares, and Class I Shares for administrative services provided on behalf of such investors. These administrative fees are paid by the Class A Shares, Class C Shares, and Class I Shares of the Fund to the Transfer Agent, which uses such fees to reimburse intermediaries. Consistent with the Transfer Agency Agreement between the Transfer Agent and the Fund, the Transfer Agent may negotiate the level, structure, and/or terms of the administrative fees with intermediaries requiring such fees on behalf of the Fund. The Adviser and its affiliates benefit from an increase in assets that may result from such relationships. The Adviser has agreed to limit these fees up to 0.20% for Class A Shares and Class C Shares, and up to 0.15% for Class I Shares on an annual basis based on the daily net assets of each share class. Such limits are subject to change by the Trustees in the future. These amounts are disclosed as “Transfer agent networking and omnibus fees” on the Statement of Operations.
The Transfer Agent is not compensated for its services related to the shares, except for out-of-pocket costs, although the Transfer Agent is compensated for its services related to Fund’s Class D Shares. These amounts are disclosed as “Other transfer agent fees and expenses” on the Statement of Operations.
Under distribution and shareholder servicing plans (the “Plans”) adopted in accordance with Rule 12b-1 under the 1940 Act, the Fund pays the Trust’s distributor, the Distributor, a wholly-owned subsidiary of the Adviser, a fee for the sale and distribution and/or shareholder servicing of the shares based on the average daily net assets for each share
Janus Henderson Global Bond Fund
Notes to Financial Statements
class at an annual rate of up to 0.25% for Class A Shares, up to 1.00% for Class C Shares, and up to 0.25% for Class S Shares. Under the terms of the Plans, the Trust is authorized to make payments to the Distributor for remittance to retirement plan service providers, broker-dealers, bank trust departments, financial advisors, and other financial intermediaries, as compensation for distribution and/or shareholder services performed by such entities for their customers who are investors in the Fund. These amounts are disclosed as “12b-1 Distribution and shareholder servicing fees” on the Statement of Operations.
Class A Shares include a 4.75% upfront sales charge of the offering price of the Fund. The sales charge is allocated between the Distributor and financial intermediaries. During the year ended June 30, 2023, the Distributor retained upfront sales charges of $30.
A contingent deferred sales charge (“CDSC”) of 1.00% will be deducted with respect to Class A Shares purchased without a sales load and redeemed within 12 months of purchase, unless waived. Any applicable CDSC will be 1.00% of the lesser of the original purchase price or the value of the redemption of the Class A Shares redeemed. There were no CDSCs paid by redeeming shareholders of Class A Shares to the Distributor during the year ended June 30, 2023.
A CDSC of 1.00% will be deducted with respect to Class C Shares redeemed within 12 months of purchase, unless waived. Any applicable CDSC will be 1.00% of the lesser of the original purchase price or the value of the redemption of the Class C Shares redeemed. There were no CDSCs paid by redeeming shareholders of Class C Shares during the year ended June 30, 2023.
The Board of Trustees has adopted a deferred compensation plan (the “Deferred Plan”) for independent Trustees to elect to defer receipt of all or a portion of the annual compensation they are entitled to receive from the Fund. All deferred fees are credited to an account established in the name of the Trustees. The amounts credited to the account then increase or decrease, as the case may be, in accordance with the performance of one or more of the Janus Henderson funds that are selected by the Trustees. The account balance continues to fluctuate in accordance with the performance of the selected fund or funds until final payment of all amounts are credited to the account. The fluctuation of the account balance is recorded by the Fund as unrealized appreciation/(depreciation) and is included as of June 30, 2023 on the Statement of Assets and Liabilities in the asset, “Trustees’ deferred compensation,” and liability, “Trustees’ deferred compensation fees.” Additionally, the recorded unrealized appreciation/(depreciation) is included in “Total distributable earnings (loss)” on the Statement of Assets and Liabilities. Deferred compensation expenses for the year ended June 30, 2023 are included in “Trustees’ fees and expenses” on the Statement of Operations. Trustees are allowed to change their designation of mutual funds from time to time. Amounts will be deferred until distributed in accordance with the Deferred Plan. Deferred fees of $426,025 were paid by the Trust to the Trustees under the Deferred Plan during the year ended June 30, 2023.
Pursuant to the provisions of the 1940 Act and related rules, the Fund may participate in an affiliated or non-affiliated cash sweep program. In the cash sweep program, uninvested cash balances of the Fund may be used to purchase shares of affiliated or non-affiliated money market funds or cash management pooled investment vehicles that operate as money market funds. The Fund is eligible to participate in the cash sweep program (the “Investing Funds”). The Adviser has an inherent conflict of interest because of its fiduciary duties to the affiliated money market funds or cash management pooled investment vehicles and the Investing Funds. Janus Henderson Cash Liquidity Fund LLC (the “Sweep Vehicle”) is an affiliated unregistered cash management pooled investment vehicle that invests primarily in highly-rated short-term fixed-income securities. The Sweep Vehicle operates pursuant to the provisions of the 1940 Act that govern the operation of money market funds and prices its shares at NAV reflecting market-based values of its portfolio securities (i.e., a “floating” NAV) rounded to the fourth decimal place (e.g., $1.0000). The Sweep Vehicle is permitted to impose a liquidity fee (of up to 2%) on redemptions from the Sweep Vehicle or a redemption gate that temporarily suspends redemptions from the Sweep Vehicle for up to 10 business days during a 90 day period. There are no restrictions on the Fund's ability to withdraw investments from the Sweep Vehicle at will, and there are no unfunded capital commitments due from the Fund to the Sweep Vehicle. The Sweep Vehicle does not charge any management fee, sales charge or service fee.
Any purchases and sales, realized gains/losses and recorded dividends from affiliated investments during the year ended June 30, 2023 can be found in the “Schedules of Affiliated Investments” located in the Schedule of Investments.
Janus Henderson Global Bond Fund
Notes to Financial Statements
As of June 30, 2023, shares of the Fund were owned by affiliates of the Adviser, and/or other funds advised by the Adviser, as indicated in the table below:
| | | | | | |
Class | % of Class Owned | | % of Fund Owned | | |
Class A Shares | - | % | - | % | |
Class C Shares | - | | - | | |
Class D Shares | - | | - | | |
Class I Shares | - | | - | | |
Class N Shares | 98 | | 78 | | |
Class S Shares | - | | - | | |
Class T Shares | - | | - | | |
| | | | | | |
5. Federal Income Tax
The tax components of capital shown in the table below represent: (1) distribution requirements the Fund must satisfy under the income tax regulations; (2) losses or deductions the Fund may be able to offset against income and gains realized in future years; and (3) unrealized appreciation or depreciation of investments for federal income tax purposes.
Other book to tax differences primarily consist of deferred compensation, derivatives, and foreign currency contract adjustments. The Fund has elected to treat gains and losses on forward foreign currency contracts as capital gains and losses, if applicable. Other foreign currency gains and losses on debt instruments are treated as ordinary income for federal income tax purposes pursuant to Section 988 of the Internal Revenue Code.
| | | | | | | |
| | | | Other Book | Net Tax | |
Undistributed
Ordinary Income | Undistributed
Long-Term Gains | Accumulated
Capital Losses | Loss Deferrals | to Tax
Differences | Appreciation/
(Depreciation) | |
$ - | $ - | $ (19,945,167) | $ (7,422,920) | $ 24,190 | $(16,202,694) | |
The Fund has elected to defer qualified late-year losses. These losses will be deferred for tax purposes and recognized during the next fiscal year.
Accumulated capital losses noted below represent net capital loss carryovers, as of June 30, 2023, that may be available to offset future realized capital gains and thereby reduce future taxable gains distributions. The following table shows these capital loss carryovers.
| | | | | | |
| | | | | |
Capital Loss Carryover Schedule | | |
For the year ended June 30, 2023 | | |
| No Expiration | | | |
| Short-Term | Long-Term | Accumulated
Capital Losses | | |
| $(9,448,123) | $(10,497,044) | $ (19,945,167) | | |
Janus Henderson Global Bond Fund
Notes to Financial Statements
The aggregate cost of investments and the composition of unrealized appreciation and depreciation of investment securities for federal income tax purposes as of June 30, 2023 are noted below. The primary differences between book and tax appreciation or depreciation of investments are wash sale loss deferrals and investments in partnerships.
| | | | |
Federal Tax Cost | Unrealized
Appreciation | Unrealized
(Depreciation) | Net Tax Appreciation/
(Depreciation) |
$ 185,817,170 | $ 185,358 | $(16,388,052) | $ (16,202,694) |
Information on the tax components of derivatives as of June 30, 2023 is as follows:
| | | | |
Federal Tax Cost | Unrealized
Appreciation | Unrealized
(Depreciation) | Net Tax Appreciation/
(Depreciation) |
$ (616,611) | $ 74,549 | $ (50,287) | $ 24,262 |
Tax cost of investments and unrealized appreciation/(depreciation) may also include timing differences that do not constitute adjustments to tax basis.
Income and capital gains distributions are determined in accordance with income tax regulations that may differ from US GAAP. These differences are due to differing treatments for items such as net short-term gains, deferral of wash sale losses, foreign currency transactions, and capital loss carryovers. Certain permanent differences such as tax returns of capital and net investment losses noted below have been reclassified to capital.
| | | | | |
For the year ended June 30, 2023 | |
Distributions | | |
From Ordinary Income | From Long-Term Capital Gains | Tax Return of Capital | Net Investment Loss | |
$ - | $ - | $ 3,307,214 | $ 3,210,342 | |
| | | | | |
For the year ended June 30, 2022 | |
Distributions | | |
From Ordinary Income | From Long-Term Capital Gains | Tax Return of Capital | Net Investment Loss | |
$ 2,734,223 | $ 713,661 | $ 2,539,461 | $ - | |
Permanent book to tax basis differences may result in reclassifications between the components of net assets. These differences have no impact on the results of operations or net assets.
Janus Henderson Global Bond Fund
Notes to Financial Statements
6. Capital Share Transactions
| | | | | | | |
| | | | | | |
| | Year ended June 30, 2023 | | Year ended June 30, 2022 |
| | Shares | Amount | | Shares | Amount |
| | | | | | | |
Class A Shares: | | | | | |
Shares sold | 76,407 | $ 622,005 | | 31,444 | $ 306,412 |
Reinvested dividends and distributions | 1,622 | 12,649 | | 2,757 | 26,397 |
Shares repurchased | (100,242) | (799,695) | | (73,970) | (709,545) |
Net Increase/(Decrease) | (22,213) | $ (165,041) | | (39,769) | $ (376,736) |
Class C Shares: | | | | | |
Shares sold | 8,198 | $ 64,318 | | 2,805 | $ 28,398 |
Reinvested dividends and distributions | 699 | 5,458 | | 1,478 | 14,186 |
Shares repurchased | (32,490) | (256,556) | | (40,167) | (386,737) |
Net Increase/(Decrease) | (23,593) | $ (186,780) | | (35,884) | $ (344,153) |
Class D Shares: | | | | | |
Shares sold | 208,273 | $ 1,643,778 | | 326,697 | $ 3,123,232 |
Reinvested dividends and distributions | 28,670 | 223,578 | | 39,917 | 379,717 |
Shares repurchased | (356,755) | (2,762,734) | | (727,791) | (7,024,235) |
Net Increase/(Decrease) | (119,812) | $ (895,378) | | (361,177) | $ (3,521,286) |
Class I Shares: | | | | | |
Shares sold | 455,081 | $ 3,544,074 | | 2,188,047 | $20,332,011 |
Reinvested dividends and distributions | 76,340 | 594,066 | | 160,227 | 1,525,071 |
Shares repurchased | (4,159,382) | (32,156,541) | | (3,019,679) | (28,207,174) |
Net Increase/(Decrease) | (3,627,961) | $(28,018,401) | | (671,405) | $ (6,350,092) |
Class N Shares: | | | | | |
Shares sold | 4,146,831 | $ 32,849,587 | | 3,887,539 | $38,153,598 |
Reinvested dividends and distributions | 308,685 | 2,404,109 | | 410,058 | 3,883,999 |
Shares repurchased | (2,587,689) | (20,192,270) | | (3,695,383) | (32,756,470) |
Net Increase/(Decrease) | 1,867,827 | $ 15,061,426 | | 602,214 | $ 9,281,127 |
Class S Shares: | | | | | |
Shares sold | 399 | $ 3,129 | | 5,710 | $ 57,300 |
Reinvested dividends and distributions | 126 | 983 | | 143 | 1,348 |
Shares repurchased | (43) | (338) | | (39) | (367) |
Net Increase/(Decrease) | 482 | $ 3,774 | | 5,814 | $ 58,281 |
Class T Shares: | | | | | |
Shares sold | 23,432 | $ 184,809 | | 173,218 | $ 1,554,038 |
Reinvested dividends and distributions | 5,912 | 46,065 | | 13,190 | 126,549 |
Shares repurchased | (114,641) | (892,204) | | (700,718) | (6,648,077) |
Net Increase/(Decrease) | (85,297) | $ (661,330) | | (514,310) | $ (4,967,490) |
7. Purchases and Sales of Investment Securities
For the year ended June 30, 2023, the aggregate cost of purchases and proceeds from sales of investment securities (excluding any short-term securities, short-term options contracts, TBAs, and in-kind transactions, as applicable) was as follows:
| | | | |
Purchases of
Securities | Proceeds from Sales
of Securities | Purchases of Long-
Term U.S. Government
Obligations | Proceeds from Sales
of Long-Term U.S.
Government Obligations |
$75,684,310 | $ 90,863,226 | $ 37,369,352 | $ 27,658,819 |
Janus Henderson Global Bond Fund
Notes to Financial Statements
8. Subsequent Event
Management has evaluated whether any events or transactions occurred subsequent to June 30, 2023 and through the date of issuance of the Fund’s financial statements and determined that there were no material events or transactions that would require recognition or disclosure in the Fund’s financial statements.
Janus Henderson Global Bond Fund
Report of Independent Registered Public Accounting Firm
To the Board of Trustees of Janus Investment Fund and Shareholders of Janus Henderson Global Bond Fund
Opinion on the Financial Statements
We have audited the accompanying statement of assets and liabilities, including the schedule of investments, of Janus Henderson Global Bond Fund (one of the funds constituting Janus Investment Fund, referred to hereafter as the "Fund") as of June 30, 2023, the related statement of operations for the year ended June 30, 2023, the statements of changes in net assets for each of the two years in the period ended June 30, 2023, including the related notes, and the financial highlights for each of the five years in the period ended June 30, 2023 (collectively referred to as the “financial statements”). In our opinion, the financial statements present fairly, in all material respects, the financial position of the Fund as of June 30, 2023, the results of its operations for the year then ended, the changes in its net assets for each of the two years in the period ended June 30, 2023 and the financial highlights for each of the five years in the period ended June 30, 2023 in conformity with accounting principles generally accepted in the United States of America.
Basis for Opinion
These financial statements are the responsibility of the Fund’s management. Our responsibility is to express an opinion on the Fund’s financial statements based on our audits. We are a public accounting firm registered with the Public Company Accounting Oversight Board (United States) (PCAOB) and are required to be independent with respect to the Fund in accordance with the U.S. federal securities laws and the applicable rules and regulations of the Securities and Exchange Commission and the PCAOB.
We conducted our audits of these financial statements in accordance with the standards of the PCAOB. Those standards require that we plan and perform the audit to obtain reasonable assurance about whether the financial statements are free of material misstatement, whether due to error or fraud.
Our audits included performing procedures to assess the risks of material misstatement of the financial statements, whether due to error or fraud, and performing procedures that respond to those risks. Such procedures included examining, on a test basis, evidence regarding the amounts and disclosures in the financial statements. Our audits also included evaluating the accounting principles used and significant estimates made by management, as well as evaluating the overall presentation of the financial statements. Our procedures included confirmation of securities owned as of June 30, 2023 by correspondence with the custodian, transfer agent and brokers; when replies were not received from brokers, we performed other auditing procedures. We believe that our audits provide a reasonable basis for our opinion.

Denver, Colorado
August 21, 2023
We have served as the auditor of one or more investment companies in Janus Henderson Funds since 1990.
Janus Henderson Global Bond Fund
Additional Information (unaudited)
Proxy Voting Policies and Voting Record
A description of the policies and procedures that the Fund uses to determine how to vote proxies relating to its portfolio securities is available without charge: (i) upon request, by calling 1-800-525-1093; (ii) on the Fund’s website at janushenderson.com/proxyvoting; and (iii) on the SEC’s website at http://www.sec.gov. Additionally, information regarding the Fund’s proxy voting record for the most recent twelve-month period ended June 30 is also available, free of charge, through janushenderson.com/proxyvoting and from the SEC’s website at http://www.sec.gov.
Full Holdings
The Fund files its complete portfolio holdings (schedule of investments) with the SEC as an exhibit to Form N-PORT within 60 days of the end of the first and third fiscal quarters, and in the annual report and semiannual report to shareholders. The Fund’s Form N-PORT filings and annual and semiannual reports: (i) are available on the SEC’s website at http://www.sec.gov; and (ii) are available without charge, upon request, by calling a Janus Henderson representative at 1-877-335-2687 (toll free) (or 1-800-525-3713 if you hold Class D shares). Portfolio holdings consisting of at least the names of the holdings are generally available on a monthly basis with a 30-day lag under Full Holdings for the Fund at janushenderson.com/info (or janushenderson.com/reports if you hold Class D Shares).
APPROVAL OF ADVISORY AGREEMENTS DURING THE PERIOD
The Trustees of Janus Aspen Series, each of whom serves as an “independent” Trustee (the “Trustees”), oversee the management of each portfolio of Janus Aspen Series (each, a “VIT Portfolio,” and collectively, the “VIT Portfolios”), as well as each fund of Janus Investment Fund (each, a “Fund,” and collectively, the “Funds” and together with the VIT Portfolios, the “Janus Henderson Funds,” and each, a “Janus Henderson Fund”). As required by law, the Trustees determine annually whether to continue the investment advisory agreement for each Janus Henderson Fund.
In connection with their most recent consideration of those agreements for each Janus Henderson Fund, the Trustees received and reviewed information provided by Janus Henderson Investors US LLC (the “Adviser”) in response to requests of the Trustees and their independent legal counsel. They also received and reviewed information and analysis provided by, and in response to requests of, their independent fee consultant. Throughout their consideration of the agreements, the Trustees were advised by their independent legal counsel. The Trustees met with management to consider the agreements, and also met separately in executive session with their independent legal counsel and their independent fee consultant.
At meetings held on November 9-10, 2022 and December 13-14, 2022, the Trustees evaluated the information provided by the Adviser and the independent fee consultant, as well as other information provided by the Adviser and the independent fee consultant during the year. Following such evaluation, the Trustees determined that the overall arrangements between each Janus Henderson Fund and the Adviser were fair and reasonable in light of the nature, extent, and quality of the services provided by the Adviser and its affiliates, the fees charged for those services, and other matters that the Trustees considered relevant in the exercise of their business judgment, and unanimously approved the continuation of the investment advisory agreement for each Janus Henderson Fund for the period from February 1, 2023 through February 1, 2024, subject to earlier termination as provided for in each agreement.
In considering the continuation of those agreements, the Trustees reviewed and analyzed various factors that they determined were relevant, including the factors described below, none of which by itself was considered dispositive. However, the material factors and conclusions that formed the basis for the Trustees’ determination to approve the continuation of the agreements are discussed separately below. Also included is a summary of the independent fee consultant’s conclusions and opinions that arose during, and were included as part of, the Trustees’ consideration of the agreements. “Management fees,” as used herein, reflect actual annual advisory fees and, for the purpose of peer comparisons any administration fees (excluding out of pocket costs), net of any waivers, paid by a fund as a percentage of average net assets.
Nature, Extent and Quality of Services
The Trustees reviewed the nature, extent, and quality of the services provided by the Adviser to the Janus Henderson Funds, taking into account the investment objective, strategies, and policies of each Janus Henderson Fund, and the knowledge the Trustees gained from their regular meetings with management on at least a quarterly basis and their ongoing review of information related to the Janus Henderson Funds. In addition, the Trustees reviewed the resources and key personnel of the Adviser, particularly noting those employees who provide investment and risk management services to the Janus Henderson Funds. The Trustees also considered other services provided to the Janus Henderson
Janus Henderson Global Bond Fund
Additional Information (unaudited)
Funds by the Adviser, such as managing the execution of portfolio transactions and the selection of broker-dealers for those transactions. The Trustees considered the Adviser’s role as administrator to the Janus Henderson Funds, noting that the Adviser generally does not receive a fee for its services as administrator, but is reimbursed for its out-of-pocket costs. The Trustees considered the role of the Adviser in monitoring adherence to the Janus Henderson Funds’ investment restrictions, providing support services for the Trustees and Trustee committees, and overseeing communications with Janus Henderson Fund shareholders and the activities of other service providers, including monitoring compliance with various policies and procedures of the Janus Henderson Funds and with applicable securities laws and regulations.
In this regard, the independent fee consultant noted that the Adviser provides a number of different services for the Janus Henderson Funds and their shareholders, ranging from investment management services to various other servicing functions, and that, in its view, the Adviser is a capable provider of those services. The independent fee consultant also provided its belief that the Adviser has developed a number of institutional competitive advantages that should enable it to provide superior investment and service performance over the long term.
The Trustees concluded that the nature, extent, and quality of the services provided by the Adviser to each Janus Henderson Fund were appropriate and consistent with the terms of the respective advisory agreements, and that, taking into account steps taken to address those Janus Henderson Funds whose performance lagged that of their peers for certain periods, the Janus Henderson Funds were likely to benefit from the continued provision of those services. They also concluded that the Adviser had sufficient personnel, with the appropriate education and experience, to serve the Janus Henderson Funds effectively and had demonstrated its ability to attract well-qualified personnel.
Performance of the Funds
The Trustees considered the performance results of each Janus Henderson Fund over various time periods. They noted that they considered Janus Henderson Fund performance data throughout the year, including periodic meetings with each Janus Henderson Fund’s portfolio manager(s), and also reviewed information comparing each Janus Henderson Fund’s performance with the performance of comparable fund peer groups identified by Broadridge Financial Solutions, Inc. (“Broadridge”), an independent data provider, and with the Janus Henderson Fund’s benchmark index. In this regard, the independent fee consultant found that the overall Janus Henderson Funds’ performance has been reasonable, noting that: (i) for the 36 months ended May 31, 2022, approximately 38% of the Janus Henderson Funds were in the top two quartiles of their Broadridge peer groups; (ii) for the 36 months ended September 30, 2022, approximately 45% of the Janus Henderson Funds were in the top two quartiles of performance as reported by Morningstar, and (iii) for the 12 months ended September 30, 2022, approximately 55% of the Janus Henderson Funds were in the top two quartiles of performance as reported by Morningstar.
The Trustees considered the performance of each Janus Henderson Fund, noting that performance may vary by share class, and noted the following with respect to the Funds:
Asset Allocation Funds
· For Janus Henderson Global Allocation Fund – Conservative, the Trustees noted that the Fund’s performance was in the third Broadridge quartile for the 36 months ended May 31, 2022 and the bottom Broadridge quartile for the 12 months ended May 31, 2022. The Trustees noted the reasons for the Fund’s underperformance and the steps the Adviser had taken or was taking to improve performance.
· For Janus Henderson Global Allocation Fund – Growth, the Trustees noted that the Fund’s performance was in the bottom Broadridge quartile for the 36 months ended May 31, 2022 and the bottom Broadridge quartile for the 12 months ended May 31, 2022. The Trustees noted the reasons for the Fund’s underperformance and the steps the Adviser had taken or was taking to improve performance.
· For Janus Henderson Global Allocation Fund – Moderate, the Trustees noted that the Fund’s performance was in the bottom Broadridge quartile for the 36 months ended May 31, 2022 and the bottom Broadridge quartile for the 12 months ended May 31, 2022. The Trustees noted the reasons for the Fund’s underperformance and the steps the Adviser had taken or was taking to improve performance.
Fixed-Income Funds
· For Janus Henderson Absolute Return Income Opportunities Fund, the Trustees noted that the Fund’s performance was in the third Broadridge quartile for the 36 months ended May 31, 2022 and the first Broadridge
Janus Henderson Global Bond Fund
Additional Information (unaudited)
quartile for the 12 months ended May 31, 2022. The Trustees noted the reasons for the Fund’s underperformance, the steps the Adviser had taken or was taking to improve performance, and that the performance trend was improving.
· For Janus Developed World Bond Fund, the Trustees noted that the Fund’s performance was in the bottom Broadridge quartile for the 36 months ended May 31, 2022 and the bottom Broadridge quartile for the 12 months ended May 31, 2022. The Trustees noted the reasons for the Fund’s underperformance and the steps the Adviser had taken or was taking to improve performance.
· For Janus Henderson Flexible Bond Fund, the Trustees noted that the Fund’s performance was in the first Broadridge quartile for the 36 months ended May 31, 2022 and the second Broadridge quartile for the 12 months ended May 31, 2022.
· For Janus Henderson Global Bond Fund, the Trustees noted that the Fund’s performance was in the third Broadridge quartile for the 36 months ended May 31, 2022 and the bottom Broadridge quartile for the 12 months ended May 31, 2022. The Trustees noted the reasons for the Fund’s underperformance and the steps the Adviser had taken or was taking to improve performance.
· For Janus Henderson High-Yield Fund, the Trustees noted that the Fund’s performance was in the third Broadridge quartile for the 36 months ended May 31, 2022 and the bottom Broadridge quartile for the 12 months ended May 31, 2022. The Trustees noted the reasons for the Fund’s underperformance and the steps the Adviser had taken or was taking to improve performance.
· For Janus Henderson Multi-Sector Income Fund, the Trustees noted that the Fund’s performance was in the second Broadridge quartile for the 36 months ended May 31, 2022 and the third Broadridge quartile for the 12 months ended May 31, 2022.
· For Janus Henderson Short Duration Flexible Bond Fund, the Trustees noted that the Fund’s performance was in the third Broadridge quartile for the 36 months ended May 31, 2022 and the bottom Broadridge quartile for the 12 months ended May 31, 2022. The Trustees noted the reasons for the Fund’s underperformance and the steps the Adviser had taken or was taking to improve performance.
Global and International Equity Funds
· For Janus Henderson Asia Equity Fund, the Trustees noted that the Fund’s performance was in the third Broadridge quartile for the 36 months ended May 31, 2022 and the third Broadridge quartile for the 12 months ended May 31, 2022. The Trustees noted the reasons for the Fund’s underperformance, while also noting that the Fund has a performance fee structure that results in lower management fees during periods of underperformance, and the steps the Adviser had taken or was taking to improve performance.
· For Janus Henderson Emerging Markets Fund, the Trustees noted that the Fund’s performance was in the third Broadridge quartile for the 36 months ended May 31, 2022 and the third Broadridge quartile for the 12 months ended May 31, 2022. The Trustees noted the reasons for the Fund’s underperformance and the steps the Adviser had taken or was taking to improve performance.
· For Janus Henderson European Focus Fund, the Trustees noted that the Fund’s performance was in the first Broadridge quartile for the 36 months ended May 31, 2022 and the second Broadridge quartile for the 12 months ended May 31, 2022.
· For Janus Henderson Global Equity Income Fund, the Trustees noted that the Fund’s performance was in the third Broadridge quartile for the 36 months ended May 31, 2022 and the first Broadridge quartile for the 12 months ended May 31, 2022. The Trustees noted the reasons for the Fund’s underperformance, the steps the Adviser had taken or was taking to improve performance, and that the performance trend was improving.
· For Janus Henderson Global Life Sciences Fund, the Trustees noted that the Fund’s performance was in the third Broadridge quartile for the 36 months ended May 31, 2022 and the second Broadridge quartile for the 12 months ended May 31, 2022. The Trustees noted the reasons for the Fund’s underperformance, the steps the Adviser had taken or was taking to improve performance, and that the performance trend was improving.
Janus Henderson Global Bond Fund
Additional Information (unaudited)
· For Janus Henderson Global Sustainable Equity Fund, the Trustees noted that the Fund’s performance was in the second Broadridge quartile for the 12 months ended May 31, 2022. The Trustees noted that 36 month-end performance was not yet available.
· For Janus Henderson Global Real Estate Fund, the Trustees noted that the Fund’s performance was in the second Broadridge quartile for the 36 months ended May 31, 2022 and the bottom Broadridge quartile for the 12 months ended May 31, 2022.
· For Janus Henderson Global Research Fund, the Trustees noted that the Fund’s performance was in the second Broadridge quartile for the 36 months ended May 31, 2022 and the first Broadridge quartile for the 12 months ended May 31, 2022.
· For Janus Henderson Global Select Fund, the Trustees noted that the Fund’s performance was in the first Broadridge quartile for the 36 months ended May 31, 2022 and the first Broadridge quartile for the 12 months ended May 31, 2022.
· For Janus Henderson Global Technology and Innovation Fund, the Trustees noted that the Fund’s performance was in the second Broadridge quartile for the 36 months ended May 31, 2022 and the second Broadridge quartile for the 12 months ended May 31, 2022.
· For Janus Henderson International Opportunities Fund, the Trustees noted that the Fund’s performance was in the bottom Broadridge quartile for the 36 months ended May 31, 2022 and the third Broadridge quartile for the 12 months ended May 31, 2022. The Trustees noted the reasons for the Fund’s underperformance and the steps the Adviser had taken or was taking to improve performance.
· For Janus Henderson Overseas Fund, the Trustees noted that the Fund’s performance was in the first Broadridge quartile for the 36 months ended May 31, 2022 and the first Broadridge quartile for the 12 months ended May 31, 2022.
· For Janus Henderson Responsible International Dividend Fund (formerly the Janus Henderson Dividend & Income Builder Fund), the Trustees noted that the Fund’s performance was in the bottom Broadridge quartile for the 36 months ended May 31, 2022 and the bottom Broadridge quartile for the 12 months ended May 31, 2022. The Trustees noted the reasons for the Fund’s underperformance and the steps the Adviser had taken or was taking to improve performance.
Money Market Funds
· For Janus Henderson Government Money Market Fund, the Trustees noted that the Fund’s performance was in the third Broadridge quartile for the 36 months ended May 31, 2022 and the bottom Broadridge quartile for the 12 months ended May 31, 2022. The Trustees noted the reasons for the Fund’s underperformance and the steps the Adviser had taken or was taking to improve performance.
· For Janus Henderson Money Market Fund, the Trustees noted that the Fund’s performance was in the third Broadridge quartile for the 36 months ended May 31, 2022 and the bottom Broadridge quartile for the 12 months ended May 31, 2022. The Trustees noted the reasons for the Fund’s underperformance and the steps the Adviser had taken or was taking to improve performance.
Multi-Asset Funds
· For Janus Henderson Adaptive Global Allocation Fund, the Trustees noted that the Fund’s performance was in bottom Broadridge quartile for the 36 months ended May 31, 2022 and the second Broadridge quartile for the 12 months ended May 31, 2022. The Trustees noted the reasons for the Fund’s underperformance, the steps the Adviser had taken or was taking to improve performance, and that the performance trend was improving.
· For Janus Henderson Balanced Fund, the Trustees noted that the Fund’s performance was in the first Broadridge quartile for the 36 months ended May 31, 2022 and the first Broadridge quartile for the 12 months ended May 31, 2022.
Janus Henderson Global Bond Fund
Additional Information (unaudited)
U.S. Equity Funds
· For Janus Henderson Adaptive Risk Managed U.S. Equity Fund, the Trustees noted that the Fund’s performance was in the bottom Broadridge quartile for the 36 months ended May 31, 2022 and the second Broadridge quartile for the 12 months ended May 31, 2022. The Trustees noted the reasons for the Fund’s underperformance, the steps the Adviser had taken or were taking to improve performance, and that the performance trend was improving.
· For Janus Henderson Contrarian Fund, the Trustees noted that the Fund’s performance was in the first Broadridge quartile for the 36 months ended May 31, 2022 and the bottom Broadridge quartile for the 12 months ended May 31, 2022.
· For Janus Henderson Enterprise Fund, the Trustees noted that the Fund’s performance was in the second Broadridge quartile for the 36 months ended May 31, 2022 and the first Broadridge quartile for the 12 months ended May 31, 2022.
· For Janus Henderson Forty Fund, the Trustees noted that the Fund’s performance was in the third Broadridge quartile for the 36 months ended May 31, 2022 and the bottom Broadridge quartile for the 12 months ended May 31, 2022. The Trustees noted the reasons for the Fund’s underperformance and the steps the Adviser had taken or was taking to improve performance.
· For Janus Henderson Growth and Income Fund, the Trustees noted that the Fund’s performance was in the bottom Broadridge quartile for the 36 months ended May 31, 2022 and the first Broadridge quartile for the 12 months ended May 31, 2022. The Trustees noted the reasons for the Fund’s underperformance, the steps the Adviser had taken or was taking to improve performance, and that the performance trend was improving.
· For Janus Henderson Mid Cap Value Fund, the Trustees noted that the Fund’s performance was in the bottom Broadridge quartile for the 36 months ended May 31, 2022 and the second Broadridge quartile for the 12 months ended May 31, 2022. The Trustees noted the reasons for the Fund’s underperformance, while also noting that the Fund has a performance fee structure that results in lower management fees during periods of underperformance, the steps the Adviser had taken or was taking to improve performance, and that the performance trend was improving.
· For Janus Henderson Research Fund, the Trustees noted that the Fund’s performance was in the third Broadridge quartile for the 36 months ended May 31, 2022 and the third Broadridge quartile for the 12 months ended May 31, 2022. The Trustees noted the reasons for the Fund’s underperformance, while also noting that the Fund has a performance fee structure that results in lower management fees during periods of underperformance and the steps the Adviser had taken or was taking to improve performance.
· For Janus Henderson Small Cap Value Fund, the Trustees noted that the Fund’s performance was in the bottom Broadridge quartile for the 36 months ended May 31, 2022 and the second Broadridge quartile for the 12 months ended May 31, 2022. The Trustees noted the reasons for the Fund’s underperformance, while also noting that the Fund has a performance fee structure that results in lower management fees during periods of underperformance, the steps the Adviser had taken or was taking to improve performance, and that the performance trend was improving.
· For Janus Henderson Small-Mid Cap Value Fund, the Trustees noted that the Fund’s performance was in the bottom Broadridge quartile for the 36 months ended May 31, 2022 and the second Broadridge quartile for the 12 months ended May 31, 2022. The Trustees noted the reasons for the Fund’s underperformance, while also noting that the Fund has a performance fee structure that results in lower management fees during periods of underperformance, the steps the Adviser had taken or was taking to improve performance, and that the performance trend is improving.
· For Janus Henderson Triton Fund, the Trustees noted that the Fund’s performance was in the bottom Broadridge quartile for the 36 months ended May 31, 2022 and the second Broadridge quartile for the 12 months ended May 31, 2022. The Trustees noted the reasons for the Fund’s underperformance, the steps the Adviser had taken or was taking to improve performance, and that the performance trend was improving.
· For Janus Henderson Venture Fund, the Trustees noted that the Fund’s performance was in the bottom Broadridge quartile for the 36 months ended May 31, 2022 and the second Broadridge quartile for the 12 months ended May
Janus Henderson Global Bond Fund
Additional Information (unaudited)
31, 2022. The Trustees noted the reasons for the Fund’s underperformance, the steps the Adviser had taken or was taking to improve performance, and that the performance trend was improving.
In consideration of each Janus Henderson Fund’s performance, the Trustees concluded that, taking into account the factors relevant to performance, as well as other considerations, including steps taken to improve performance, as applicable, the Janus Henderson Fund’s performance warranted continuation of such Janus Henderson Fund’s investment advisory agreement.
Costs of Services Provided
The Trustees examined information regarding the fees and expenses of each Janus Henderson Fund in comparison to similar information for other comparable funds as provided by Broadridge, an independent data provider. They also reviewed an analysis of that information provided by their independent fee consultant. The independent fee consultant provided its belief that the management fees charged by the Adviser to each of the Janus Henderson Funds under the current investment advisory and administration agreements are reasonable in relation to the services provided by the Adviser. The independent fee consultant found: (1) the total expenses and management fees of the Janus Henderson Funds to be reasonable relative to other comparable mutual funds; (2) the total expenses, on average, were 6% under the average total expenses of the respective Broadridge peer group; and (3) the management fees for the Janus Henderson Funds, on average, were 5% under the average management fees for the respective Broadridge peer group. The Trustees also considered the total expenses for each share class of each Janus Henderson Fund compared to the average total expenses for its Broadridge Expense Group and to average total expenses for its Broadridge Expense Universe.
For Janus Henderson Funds with three or more years of performance history, the independent fee consultant also performed a systematic “focus list” analysis of expenses which assessed fund fees in the context of fund performance being delivered. Based on this analysis, the independent fee consultant found that the combination of service quality/performance and expenses on these individual Janus Henderson Funds was reasonable in light of performance trends, performance histories, changes in portfolio management, relative average net asset levels, and the existence of performance fees, breakpoints, and/or expense waivers on such Janus Henderson Funds.
The Trustees considered the methodology used by the Adviser in determining compensation payable to portfolio managers, the competitive environment for investment management talent, and the competitive market for mutual funds in different distribution channels.
The Trustees also reviewed management fees charged by the Adviser to comparable separate account clients and to comparable non-affiliated funds subadvised by the Adviser (for which the Adviser provides only or primarily portfolio management services). Although in most instances subadvisory and separate account fee rates for various investment strategies were lower than management fee rates for Janus Henderson Funds having a similar strategy, the Trustees considered that the Adviser noted that, under the terms of the management agreements with the Janus Henderson Funds, the Adviser performs significant additional services for the Janus Henderson Funds that it does not provide to those other clients, including administration services, oversight of the Janus Henderson Funds’ other service providers, Trustee support, regulatory compliance and numerous other services, and that, in serving the Janus Henderson Funds, the Adviser assumes many legal risks and other costs that it does not assume in servicing its other clients. Moreover, the Trustees noted that the independent fee consultant found that: (1) the management fees the Adviser charges to the Janus Henderson Funds are reasonable in relation to the management fees the Adviser charges to funds subadvised by the Adviser and to the fees the Adviser charges to its institutional separate account clients; (2) these subadvised and institutional separate accounts have different service and infrastructure needs and operate in markets very different from the retail fund market; (3) Janus Henderson mutual fund investors enjoy reasonable fees relative to the fees charged in these other markets; and (4) as part of its 2022 review, 9 of 11 Janus Henderson Funds have lower management fees than similar funds subadvised by the Adviser. The Trustees noted that for the two Janus Henderson Funds that did not, management fees for each were under the average of its 15(c) peer group.
The Trustees considered the fees for each Janus Henderson Fund for its fiscal year ended in 2021 and noted the following with regard to each Janus Henderson Fund’s total expenses, net of applicable fee waivers (the Fund’s “total expenses”) as reflected in the comparative information provided by Broadridge:
Janus Henderson Global Bond Fund
Additional Information (unaudited)
Asset Allocation Funds
· For Janus Henderson Global Allocation Fund – Conservative, the Trustees noted that, although the Fund’s total expenses exceeded the peer group average for certain share classes, overall the Fund’s total expenses were reasonable. The Trustees also noted that the Adviser has contractually agreed to limit the Fund’s expenses.
· For Janus Henderson Global Allocation Fund – Growth, the Trustees noted that, although the Fund’s total expenses exceeded the peer group average for certain share classes, overall the Fund’s total expenses were reasonable. The Trustees also noted that the Adviser has contractually agreed to limit the Fund’s expenses, although this limit did not apply because the Fund’s total expenses as shown were below the applicable fee limit.
· For Janus Henderson Global Allocation Fund – Moderate, the Trustees noted that, although the Fund’s total expenses exceeded the peer group average for one share class, overall the Fund’s total expenses were reasonable. The Trustees also noted that the Adviser has contractually agreed to limit the Fund’s expenses.
Fixed-Income Funds
· For Janus Henderson Absolute Return Income Opportunities Fund, the Trustees noted that, although the Fund’s total expenses exceeded the peer group average for certain share classes, overall the Fund’s total expenses were reasonable. The Trustees also noted that the Adviser has contractually agreed to limit the Fund’s expenses.
· For Janus Henderson Developed World Bond Fund, the Trustees noted that, although the Fund’s total expenses exceeded the peer group average for one share class, overall the Fund’s total expenses were reasonable. The Trustees also noted that the Adviser has contractually agreed to limit the Fund’s expenses.
· For Janus Henderson Flexible Bond Fund, the Trustees noted that, although the Fund’s total expenses exceeded the peer group average for certain share classes, overall the Fund’s total expenses were reasonable. The Trustees also noted that the Adviser has contractually agreed to limit the Fund’s expenses, although this limit did not apply because the Fund’s total expenses as shown were below the applicable fee limit.
· For Janus Henderson Global Bond Fund, the Trustees noted that, although the Fund’s total expenses exceeded the peer group average for certain share classes, overall the Fund’s total expenses were reasonable. The Trustees also noted that the Adviser has contractually agreed to limit the Fund’s expenses.
· For Janus Henderson High-Yield Fund, the Trustees noted that, although the Fund’s total expenses exceeded the peer group average for certain share classes, overall the Fund’s total expenses were reasonable. The Trustees also noted that the Adviser has contractually agreed to limit the Fund’s expenses.
· For Janus Henderson Multi-Sector Income Fund, the Trustees noted that, although the Fund’s total expenses exceeded the peer group average for certain share classes, overall the Fund’s total expenses were reasonable. The Trustees also noted that the Adviser has contractually agreed to limit the Fund’s expenses.
· For Janus Henderson Short Duration Flexible Bond Fund, the Trustees noted that, although the Fund’s total expenses exceeded the peer group average for certain share classes, overall the Fund’s total expenses were reasonable. The Trustees also noted that the Adviser has contractually agreed to limit the Fund’s expenses.
Global and International Equity Funds
· For Janus Henderson Asia Equity Fund, the Trustees noted that, although the Fund’s total expenses exceeded the peer group average for certain share classes, overall the Fund’s total expenses were reasonable. The Trustees also noted that the Adviser has contractually agreed to limit the Fund’s expenses.
· For Janus Henderson Emerging Markets Fund, the Trustees noted that, although the Fund’s total expenses exceeded the peer group average for certain share classes, overall the Fund’s total expenses were reasonable. The Trustees also noted that the Adviser has contractually agreed to limit the Fund’s expenses.
· For Janus Henderson European Focus Fund, the Trustees noted that, although the Fund’s total expenses exceeded the peer group average for one share class, overall the Fund’s expenses were reasonable. The Trustees also noted that the Adviser has contractually agreed to limit the Fund’s expenses.
· For Janus Henderson Global Equity Income Fund, the Trustees noted that, although the Fund’s total expenses exceeded the peer group average for one share class, overall the Fund’s total expenses were reasonable. The
Janus Henderson Global Bond Fund
Additional Information (unaudited)
Trustees also noted that the Adviser has contractually agreed to limit the Fund’s expenses, although this limit did not apply because the Fund’s total expenses as shown were below the applicable fee limit.
· For Janus Henderson Global Life Sciences Fund, the Trustees noted that the Fund’s total expenses were below the peer group average for all share classes.
· For Janus Henderson Global Real Estate Fund, the Trustees noted that, although the Fund’s total expenses exceeded the peer group average for certain share classes, overall the Fund’s total expenses were reasonable. The Trustees also noted that the Adviser has contractually agreed to limit the Fund’s expenses, although this limit did not apply because the Fund’s total expenses as shown were below the applicable fee limit.
· For Janus Henderson Global Research Fund, the Trustees noted that, although the Fund’s total expenses exceeded the peer group average for one share class, overall the Fund’s total expenses were reasonable. The Trustees also noted that the Adviser has contractually agreed to limit the Fund’s expenses, although this limit did not apply because the Fund’s total expenses as shown were below the applicable fee limit.
· For Janus Henderson Global Select Fund, the Trustees noted that, although the Fund’s total expenses exceeded the peer group average for certain share classes, overall the Fund’s total expenses were reasonable. The Trustees also noted that the Adviser has contractually agreed to limit the Fund’s expenses.
· For Janus Henderson Global Sustainable Equity Fund, the Trustees noted that, although the Fund’s total expenses exceeded the peer group average for certain share classes, overall the Fund’s expenses were reasonable. The Trustees also noted that the Adviser has contractually agreed to limit the Fund’s expenses.
· For Janus Henderson Global Technology and Innovation Fund, the Trustees noted that the Fund’s total expenses were below the peer group average for all share classes.
· For Janus Henderson International Opportunities Fund, the Trustees noted that, although the Fund’s total expenses exceeded the peer group average for certain share classes, overall the Fund’s expenses were reasonable. The Trustees also noted that the Adviser has contractually agreed to limit the Fund’s expenses.
· For Janus Henderson Overseas Fund, the Trustees noted that although the Fund’s total expenses exceeded the peer group average for certain share classes, overall the Fund’s total expenses were reasonable. The Trustees also noted that the Adviser has contractually agreed to limit the Fund’s expenses, although this limit did not apply because the Fund’s total expenses as shown were below the applicable fee limit.
· For Janus Henderson Responsible International Dividend Fund (formerly the Janus Henderson Dividend & Income Builder Fund), the Trustees noted that, although the Fund’s total expenses exceeded the peer group for one share class, overall the Fund’s total expenses were reasonable. The Trustees also noted that the Adviser has contractually agreed to limit the Fund’s expenses.
Money Market Funds
· For Janus Henderson Government Money Market Fund, the Trustees noted that the Fund’s total expenses were below the peer group average for all share classes.
· For Janus Henderson Money Market Fund, the Trustees noted that the Fund’s total expenses were below the peer group average for all share classes.
Multi-Asset Funds
· For Janus Henderson Adaptive Global Allocation Fund, the Trustees noted that the Fund’s total expenses were below the peer group average for all share classes.
· For Janus Henderson Balanced Fund, the Trustees noted that, although the Fund’s total expenses exceeded the peer group average for certain share classes, overall the Fund’s total expenses were reasonable. The Trustees also noted that the Adviser has contractually agreed to limit the Fund’s expenses, although this limit did not apply because the Fund’s total expenses as shown were below the applicable fee limit.
Janus Henderson Global Bond Fund
Additional Information (unaudited)
U.S. Equity Funds
· For Janus Henderson Adaptive Risk Managed U.S. Equity Fund, the Trustees noted that, although the Fund’s total expenses exceeded the peer group average for certain share classes, overall the Fund’s total expenses were reasonable. The Trustees also noted that the Adviser has contractually agreed to limit the Fund’s expenses, although this limit did not apply because the Fund’s total expenses as shown were below the applicable fee limit.
· For Janus Henderson Contrarian Fund, the Trustees noted that, although the Fund’s total expenses exceeded the peer group average for all share classes, overall the Fund’s total expenses were reasonable. The Trustees also noted that the Adviser had contractually agreed to limit the Fund’s expenses.
· For Janus Henderson Enterprise Fund, the Trustees noted that, although the Fund’s total expenses exceeded the peer group average for certain share classes, overall the Fund’s total expenses were reasonable. The Trustees also noted that the Adviser has contractually agreed to limit the Fund’s expenses, although this limit did not apply because the Fund’s total expenses as shown were below the applicable fee limit.
· For Janus Henderson Forty Fund, the Trustees noted that, although the Fund’s total expenses exceeded the peer group average for certain share classes, overall the Fund’s total expenses were reasonable. The Trustees also noted that the Adviser has contractually agreed to limit the Fund’s expenses, although this limit did not apply because the Fund’s total expenses as shown were below the applicable fee limit.
· For Janus Henderson Growth and Income Fund, the Trustees noted that, although the Fund’s total expenses exceeded the peer group average for certain share classes, overall the Fund’s total expenses were reasonable. The Trustees also noted that the Adviser has contractually agreed to limit the Fund’s expenses, although this limit did not apply because the Fund’s total expenses as shown were below the applicable fee limit.
· For Janus Henderson Mid Cap Value Fund, the Trustees noted that the Fund’s total expenses were below the peer group average for all share classes.
· For Janus Henderson Research Fund, the Trustees noted that, although the Fund’s total expenses exceeded the peer group average for certain share classes, overall the Fund’s total expenses were reasonable. The Trustees also noted that the Adviser has contractually agreed to limit the Fund’s expenses.
· For Janus Henderson Small Cap Value Fund, the Trustees noted that, although the Fund’s total expenses exceeded the peer group average for one share class, overall the Fund’s total expenses were reasonable. The Trustees also noted that the Adviser has contractually agreed to limit the Fund’s expenses, although this limit did not apply because the Fund’s total expenses as shown were below the applicable fee limit.
· For Janus Henderson Small-Mid Cap Value Fund, the Trustees noted that the Fund’s total expenses were below the peer group average for all share classes.
· For Janus Henderson Triton Fund, the Trustees noted that, although the Fund’s total expenses exceeded the peer group average for one share class, overall the Fund’s total expenses were reasonable. The Trustees also noted that the Adviser has contractually agreed to limit the Fund’s expenses, although this limit did not apply because the Fund’s total expenses as shown were below the applicable fee limit.
· For Janus Henderson Venture Fund, the Trustees noted that although the Fund’s total expenses exceeded the peer group average for one share class, overall the Fund’s total expenses were reasonable. The Trustees also noted that the Adviser has contractually agreed to limit the Fund’s expenses, although this limit did not apply because the Fund’s total expenses as shown were below the applicable fee limit.
The Trustees reviewed information on the overall profitability to the Adviser and its affiliates from their relationships with the Janus Henderson Funds, and considered profitability data of other publicly traded mutual fund advisers. The Trustees recognized that profitability comparisons among fund managers are difficult because of the variation in the type of comparative information that is publicly available, and the profitability of any fund manager is affected by numerous factors, including the organizational structure of the particular fund manager, differences in complex size, difference in product mix, difference in types of business (mutual fund, institutional and other), differences in the types of funds and other accounts it manages, possible other lines of business, the methodology for allocating expenses and the fund manager’s capital structure and cost of capital.
Janus Henderson Global Bond Fund
Additional Information (unaudited)
Additionally, the Trustees considered the estimated profitability to the Adviser from the investment management services it provided to each Janus Henderson Fund. In their review, the Trustees considered whether the Adviser receive adequate incentives and resources to manage the Janus Henderson Funds effectively. In reviewing profitability, the Trustees noted that the estimated profitability for an individual Janus Henderson Fund is necessarily a product of the allocation methodology utilized by the Adviser to allocate its expenses as part of the estimated profitability calculation. In this regard, the Trustees noted that the independent fee consultant found as part of its 2022 review that (1) the expense allocation methodology and rationales utilized by the Adviser were reasonable and (2) no clear correlation exists between expense allocations and operating margins. The Trustees also considered that the estimated profitability for an individual Janus Henderson Fund was influenced by a number of factors, including not only the allocation methodology selected, but also the presence of fee waivers and expense caps, and whether the Janus Henderson Fund’s investment management agreement contained breakpoints or a performance fee component. The Trustees determined, after taking into account these factors, among others, that the Adviser’s estimated profitability with respect to each Janus Henderson Fund was not unreasonable in relation to the services provided, and that the variation in the range of such estimated profitability among the Janus Henderson Funds was not a material factor in the Board’s approval of the reasonableness of any Janus Henderson Fund’s investment management fees.
The Trustees concluded that the management fees payable by each Janus Henderson Fund to the Adviser were reasonable in relation to the nature, extent, and quality of the services provided, taking into account the fees charged by other advisers for managing comparable mutual funds with similar strategies, the fees the Adviser charges to other clients, and, as applicable, the impact of fund performance on management fees payable by the Janus Henderson Funds. The Trustees also concluded that each Janus Henderson Fund’s total expenses were reasonable, taking into account the size of the Janus Henderson Fund, the quality of services provided by the Adviser, the investment performance of the Janus Henderson Fund, and any expense limitations agreed to or provided by the Adviser.
Economies of Scale
The Trustees considered information about the potential for the Adviser to realize economies of scale as the assets of the Janus Henderson Funds increase. They noted that their independent fee consultant published a report to the Trustees in June 2022 which provided its research and analysis into economies of scale. They also noted that, although many Janus Henderson Funds pay advisory fees at a fixed base rate as a percentage of net assets, without any breakpoints or performance fees, their independent fee consultant concluded that 75% of these Janus Henderson Funds’ have contractual management fees (gross of waivers) below their Broadridge Expense Group averages. The Trustees also noted the following from the independent fee consultant’s report: (1) that 31% of Janus Henderson Funds had management fee breakpoints in place whereby investors pay lower management fees as fund AUM increases; (2) that 29% of Janus Henderson Funds have low flat-rate fees and performance fees where the Adviser is incentivized to invest in resources which drive Janus Henderson Fund performance; and (3) that 39% of Janus Henderson Funds have low flat-rate fees versus peers where investors pay low fixed fees when the Janus Henderson Fund is small/midsized and higher fees when the Janus Henderson Fund grows in assets. The Trustees also noted that the Janus Henderson Funds share directly in economies of scale through the significant investments made by the Adviser and its affiliates related to services provided to the Funds and the lower charges of third-party service providers that are based in part on the combined scale of all of the Janus Henderson Funds.
The Trustees also considered the independent fee consultant’s conclusion that, given the limitations of various analytical approaches to economies of scale and their conflicting results, it is difficult to analytically confirm or deny the existence of economies of scale in the Janus Henderson complex. In this regard, the independent consultant concluded that (1) to the extent there were economies of scale at the Adviser, the Adviser’s general strategy of setting fixed management fees below peers appeared to share any such economies with investors even on smaller Janus Henderson Funds which have not yet achieved those economies and (2) by setting lower fixed fees from the start on these Janus Henderson Funds, the Adviser appeared to be investing to increase the likelihood that these Janus Henderson Funds will grow to a level to achieve any economies of scale that may exist. Further, the independent fee consultant provided its belief that Janus Henderson Fund investors are well-served by the fee levels and performance fee structures in place on the Janus Henderson Funds in light of any economies of scale that may be present at the Adviser.
Based on all of the information reviewed, including the recent and past research and analysis conducted by the Trustees’ independent fee consultant, the Trustees concluded that the current fee structure of each Janus Henderson Fund was reasonable and that the current rates of fees do reflect a sharing between the Adviser and the Janus
Janus Henderson Global Bond Fund
Additional Information (unaudited)
Henderson Fund of any economies of scale that may be present at the current asset level of the Janus Henderson Fund.
Other Benefits to the Adviser
The Trustees also considered benefits that accrue to the Adviser and its affiliates from their relationships with the Janus Henderson Funds. They recognized that two affiliates of the Adviser separately serve the Janus Henderson Funds as transfer agent and distributor, respectively, and the transfer agent receives compensation directly from the non-money market Janus Henderson Funds for services provided, and that such compensation contributes to the overall profitability of the Adviser and its affiliates that results from their relationship with the Janus Henderson Funds. The Trustees also considered the Adviser’s past and proposed use of commissions paid by the Janus Henderson Funds on portfolio brokerage transactions to obtain proprietary and third-party research products and services benefiting the Janus Henderson Fund and/or other clients of the Adviser and/or the Adviser. The Trustees concluded that the Adviser’s use of these types of client commission arrangements to obtain proprietary and third-party research products and services was consistent with regulatory requirements and guidelines and was likely to benefit each Janus Henderson Fund. The Trustees also concluded that, other than the services provided by the Adviser and its affiliates pursuant to the agreements and the fees to be paid by each Janus Henderson Fund therefor, the Janus Henderson Funds and the Adviser may potentially benefit from their relationship with each other in other ways. They concluded that the Adviser and its affiliates share directly in economies of scale through the lower charges of third-party service providers that are based in part on the combined scale of the Janus Henderson Funds and other clients serviced by the Adviser and its affiliates. They also concluded that the Adviser benefits from the receipt of research products and services acquired through commissions paid on portfolio transactions of the Janus Henderson Funds and that the Janus Henderson Funds benefit from the Adviser’s receipt of those products and services as well as research products and services acquired through commissions paid by other clients of the Adviser. They further concluded that the success of any Janus Henderson Fund could attract other business to the Adviser or other Janus Henderson Funds, and that the success of the Adviser could enhance the Adviser’s ability to serve the Janus Henderson Funds.
Janus Henderson Global Bond Fund
Liquidity Risk Management Program (unaudited)
Liquidity Risk Management Program
Rule 22e-4 under the Investment Company Act of 1940, as amended (the “Liquidity Rule”), requires open-end funds (but not money market funds) to adopt and implement a written liquidity risk management program (the “LRMP”) that is reasonably designed to assess and manage liquidity risk, which is the risk that a fund could not meet redemption requests without significant dilution of remaining investors’ interest in the fund. The Fund has implemented a LRMP, which incorporates the following elements: (i) assessment, management, and periodic review of liquidity risk; (ii) classification of portfolio holdings; (iii) the establishment and monitoring of a highly liquid investment minimum, as applicable; (iv) a 15% limitation on a Fund’s illiquid investments; (v) redemptions in-kind; and (vi) board oversight.
The Trustees of the Fund (the “Trustees”) have designated Janus Henderson Investors US LLC, the Fund’s investment adviser (the “Adviser”), as the Program Administrator for the LRMP responsible for administering the LRMP and carrying out the specific responsibilities of the LRMP. A working group comprised of various teams within the Adviser’s business is responsible for administering the LRMP and carrying out the specific responsibilities of different aspects of the LRMP (the “Liquidity Risk Working Group”). In assessing each Fund’s liquidity risk, the Liquidity Risk Working Group periodically considers, as relevant, factors including (i) the liquidity of a Fund’s portfolio investments during normal and reasonably foreseeable stressed conditions; (ii) whether a Fund’s investment strategy is appropriate for an open-end fund; (iii) the extent to which a Fund’s strategy involves a relatively concentrated portfolio or large positions in any issuer; (iv) a Fund’s use of borrowing for investment purposes; and (v) a Fund’s use of derivatives.
The Liquidity Rule requires the Trustees to review at least annually a written report provided by the Program Administrator that addresses the operation of the LRMP and assesses its adequacy and the effectiveness of its implementation, including, if applicable, the operation of the highly liquid investment minimum, and any material changes to the LRMP (the “Program Administrator Report”). At a meeting held on March 15, 2023, the Adviser provided the Program Administrator Report to the Trustees which covered the operation of the LRMP from January 1, 2022 through December 31, 2022 (the “Reporting Period”).
The Program Administrator Report discussed the operation and effectiveness of the LRMP during the Reporting Period. Among other things, the Program Administrator Report indicated that there were no material changes to the LRMP during the Reporting Period, although there were certain methodology adjustments implemented relating to a change in data provider. Additionally, the findings presented in the Program Administrator Report indicated that the LRMP operated adequately during the Reporting Period. These findings included that the Fund was able to meet redemptions during the normal course of business during the Reporting Period. The Program Administrator Report also stated that the Fund did not exceed the 15% limit on illiquid assets during the Reporting Period, that the Fund held primarily highly liquid assets, and was considered to be a primarily highly liquid fund during the Reporting Period. Also included among the Program Administrator Report’s findings was the determination that the Fund’s investment strategy remains appropriate for an open-end fund. In addition, the Adviser expressed its belief in the Program Administrator Report that the LRMP is reasonably designed and adequate to assess and manage the Fund’s liquidity risk, considering the Fund’s particular risks and circumstances, and includes policies and procedures reasonably designed to implement each required component of the Liquidity Rule.
There can be no assurance that the LRMP will achieve its objectives in the future. Please refer to your Fund’s prospectus for more information regarding the risks to which an investment in the Fund may be subject.
Janus Henderson Global Bond Fund
Useful Information About Your Fund Report (unaudited)
Management Commentary
The Management Commentary in this report includes valuable insight as well as statistical information to help you understand how your Fund’s performance and characteristics stack up against those of comparable indices.
If the Fund invests in foreign securities, this report may include information about country exposure. Country exposure is based primarily on the country of risk. A company may be allocated to a country based on other factors such as location of the company’s principal office, the location of the principal trading market for the company’s securities, or the country where a majority of the company’s revenues are derived.
Please keep in mind that the opinions expressed in the Management Commentary are just that: opinions. They are a reflection based on best judgment at the time this report was compiled, which was June 30, 2023. As the investing environment changes, so could opinions. These views are unique and are not necessarily shared by fellow employees or by Janus Henderson in general.
Performance Overviews
Performance overview graphs compare the performance of a hypothetical $10,000 investment in the Fund with one or more widely used market indices. When comparing the performance of the Fund with an index, keep in mind that market indices are not available for investment and do not reflect deduction of expenses.
Average annual total returns are quoted for a Fund with more than one year of performance history. Average annual total return is calculated by taking the growth or decline in value of an investment over a period of time, including reinvestment of dividends and distributions, then calculating the annual compounded percentage rate that would have produced the same result had the rate of growth been constant throughout the period. Average annual total return does not reflect the deduction of taxes that a shareholder would pay on Fund distributions or redemptions of Fund shares.
Cumulative total returns are quoted for a Fund with less than one year of performance history. Cumulative total return is the growth or decline in value of an investment over time, independent of the period of time involved. Cumulative total return does not reflect the deduction of taxes that a shareholder would pay on Fund distributions or redemptions of Fund shares.
Pursuant to federal securities rules, expense ratios shown in the performance chart reflect subsidized (if applicable) and unsubsidized ratios. The total annual fund operating expenses ratio is gross of any fee waivers, reflecting the Fund’s unsubsidized expense ratio. The net annual fund operating expenses ratio (if applicable) includes contractual waivers of the Adviser and reflects the Fund’s subsidized expense ratio. Ratios may be higher or lower than those shown in the “Financial Highlights” in this report.
Schedule of Investments
Following the performance overview section is the Fund’s Schedule of Investments. This schedule reports the types of securities held in the Fund on the last day of the reporting period. Securities are usually listed by type (common stock, corporate bonds, U.S. Government obligations, etc.) and by industry classification (banking, communications, insurance, etc.). Holdings are subject to change without notice.
The value of each security is quoted as of the last day of the reporting period. The value of securities denominated in foreign currencies is converted into U.S. dollars.
If the Fund invests in foreign securities, it will also provide a summary of investments by country. This summary reports the Fund exposure to different countries by providing the percentage of securities invested in each country. The country of each security represents the country of risk. The Fund’s Schedule of Investments relies upon the industry group and country classifications published by Bloomberg and/or MSCI Inc.
Tables listing details of individual forward currency contracts, futures, written options, swaptions, and swaps follow the Fund’s Schedule of Investments (if applicable).
Statement of Assets and Liabilities
This statement is often referred to as the “balance sheet.” It lists the assets and liabilities of the Fund on the last day of the reporting period.
Janus Henderson Global Bond Fund
Useful Information About Your Fund Report (unaudited)
The Fund’s assets are calculated by adding the value of the securities owned, the receivable for securities sold but not yet settled, the receivable for dividends declared but not yet received on securities owned, and the receivable for Fund shares sold to investors but not yet settled. The Fund’s liabilities include payables for securities purchased but not yet settled, Fund shares redeemed but not yet paid, and expenses owed but not yet paid. Additionally, there may be other assets and liabilities such as unrealized gain or loss on forward currency contracts.
The section entitled “Net Assets Consist of” breaks down the components of the Fund’s net assets. Because the Fund must distribute substantially all earnings, you will notice that a significant portion of net assets is shareholder capital.
The last section of this statement reports the net asset value (“NAV”) per share on the last day of the reporting period. The NAV is calculated by dividing the Fund’s net assets for each share class (assets minus liabilities) by the number of shares outstanding.
Statement of Operations
This statement details the Fund’s income, expenses, realized gains and losses on securities and currency transactions, and changes in unrealized appreciation or depreciation of Fund holdings.
The first section in this statement, entitled “Investment Income,” reports the dividends earned from securities and interest earned from interest-bearing securities in the Fund.
The next section reports the expenses incurred by the Fund, including the advisory fee paid to the investment adviser, transfer agent fees and expenses, and printing and postage for mailing statements, financial reports and prospectuses. Expense offsets and expense reimbursements, if any, are also shown.
The last section lists the amounts of realized gains or losses from investment and foreign currency transactions, and changes in unrealized appreciation or depreciation of investments and foreign currency-denominated assets and liabilities. The Fund will realize a gain (or loss) when it sells its position in a particular security. A change in unrealized gain (or loss) refers to the change in net appreciation or depreciation of the Fund during the reporting period. “Net Realized and Unrealized Gain/(Loss) on Investments” is affected both by changes in the market value of Fund holdings and by gains (or losses) realized during the reporting period.
Statements of Changes in Net Assets
These statements report the increase or decrease in the Fund’s net assets during the reporting period. Changes in the Fund’s net assets are attributable to investment operations, dividends and distributions to investors, and capital share transactions. This is important to investors because it shows exactly what caused the Fund’s net asset size to change during the period.
The first section summarizes the information from the Statement of Operations regarding changes in net assets due to the Fund’s investment operations. The Fund’s net assets may also change as a result of dividend and capital gains distributions to investors. If investors receive their dividends and/or distributions in cash, money is taken out of the Fund to pay the dividend and/or distribution. If investors reinvest their dividends and/or distributions, the Fund’s net assets will not be affected.
The reinvestment of dividends and distributions is included under “Capital Share Transactions.” “Capital Shares” refers to the money investors contribute to the Fund through purchases or withdrawals via redemptions. The Fund’s net assets will increase and decrease in value as investors purchase and redeem shares from the Fund.
Financial Highlights
This schedule provides a per-share breakdown of the components that affect the Fund’s NAV for current and past reporting periods as well as total return, asset size, ratios, and portfolio turnover rate.
The first line in the table reflects the NAV per share at the beginning of the reporting period. The next line reports the net investment income/(loss) per share. Following is the per share total of net gains/(losses), realized and unrealized. Per share dividends and distributions to investors are then subtracted to arrive at the NAV per share at the end of the period. The next line reflects the total return for the period. The total return may include adjustments in accordance with generally accepted accounting principles required at the period end for financial reporting purposes. As a result, the total return may differ from the total return reflected for individual shareholder transactions. Also included are ratios of expenses and net investment income to average net assets.
Janus Henderson Global Bond Fund
Useful Information About Your Fund Report (unaudited)
The Fund’s expenses may be reduced through expense offsets and expense reimbursements. The ratios shown reflect expenses before and after any such offsets and reimbursements.
The ratio of net investment income/(loss) summarizes the income earned less expenses, divided by the average net assets of the Fund during the reporting period. Do not confuse this ratio with the Fund’s yield. The net investment income ratio is not a true measure of the Fund’s yield because it does not take into account the dividends distributed to the Fund’s investors.
The next figure is the portfolio turnover rate, which measures the buying and selling activity in the Fund. Portfolio turnover is affected by market conditions, changes in the asset size of the Fund, fluctuating volume of shareholder purchase and redemption orders, the nature of the Fund’s investments, and the investment style and/or outlook of the portfolio manager(s) and/or investment personnel. A 100% rate implies that an amount equal to the value of the entire portfolio was replaced once during the fiscal year; a 50% rate means that an amount equal to the value of half the portfolio is traded in a year; and a 200% rate means that an amount equal to the value of the entire portfolio is traded every six months.
Janus Henderson Global Bond Fund
Designation Requirements (unaudited)
For federal income tax purposes, the Fund designated the following for the year ended June 30, 2023:
| | |
| | |
Return of Capital Distributions | $3,307,214 |
Janus Henderson Global Bond Fund
Trustees and Officers (unaudited)
The following are the Trustees and officers of the Trust, together with a brief description of their principal occupations during the last five years (principal occupations for certain Trustees may include periods over five years). The Fund’s Statement of Additional Information includes additional information about the Trustees and officers and is available, without charge, by calling 1-877-335-2687.
Each Trustee has served in that capacity since he or she was originally elected or appointed. The Trustees do not serve a specified term of office. Each Trustee will hold office until the termination of the Trust or his or her earlier death, resignation, retirement, incapacity, or removal. Under the Fund’s Governance Procedures and Guidelines, the policy is for Trustees to retire no later than the end of the calendar year in which the Trustee turns 75. The Trustees review the Fund’s Governance Procedures and Guidelines from time to time and may make changes they deem appropriate. The Fund’s Nominating and Governance Committee will consider nominees for the position of Trustee recommended by shareholders. Shareholders may submit the name of a candidate for consideration by the Committee by submitting their recommendations to the Trust’s Secretary. Each Trustee is currently a Trustee of one other registered investment company advised by the Adviser: Janus Aspen Series. Collectively, these two registered investment companies consist of 49 series or funds referred to herein as the Fund Complex.
The Trust’s officers are elected annually by the Trustees for a one-year term. Certain officers also serve as officers of Janus Aspen Series. Certain officers of the Fund may also be officers and/or directors of the Adviser. Except as otherwise disclosed, Fund officers receive no compensation from the Fund, except for the Fund’s Chief Compliance Officer, as authorized by the Trustees.
| | | | | | |
TRUSTEES |
Name, Address, and Age | Positions Held with the Trust | Length of Time Served | Principal Occupations During the Past Five Years | Number of Portfolios/Funds in Fund Complex Overseen by Trustee | Other Directorships Held by Trustee During the Past Five Years |
Independent Trustees | | | | |
Alan A. Brown
151 Detroit Street
Denver, CO 80206
DOB: 1962 | Chairman
Trustee | 5/22-Present
1/13-Present | Principal, Curam Holdings LLC (since 2018). Formerly, Executive Vice President, Institutional Markets, of Black Creek Group (private equity real estate investment management firm) (2012-2018), Executive Vice President and Co-Head, Global Private Client Group (2007-2010), Executive Vice President, Mutual Funds (2005-2007), and Chief Marketing Officer (2001-2005) of Nuveen Investments, Inc. (asset management). | 49 | Advisory Board Member of AEW Core Property Trust (open-end property fund) (since 2020), and Director of WTTW (PBS affiliate) (since 2003). Formerly, Director of MotiveQuest LLC (strategic social market research company) (2003-2016), Director of Nuveen Global Investors LLC (2007-2011), Director of Communities in Schools (2004-2010), and Director of Mutual Fund Education Alliance (until 2010). |
Janus Henderson Global Bond Fund
Trustees and Officers (unaudited)
| | | | | | |
TRUSTEES |
Name, Address, and Age | Positions Held with the Trust | Length of Time Served | Principal Occupations During the Past Five Years | Number of Portfolios/Funds in Fund Complex Overseen by Trustee | Other Directorships Held by Trustee During the Past Five Years |
Independent Trustees | | | | |
Cheryl D. Alston
151 Detroit Street
Denver, CO 80206
DOB: 1966 | Trustee | 8/22-Present | Executive Director and Chief Investment Officer, Employees’ Retirement Fund of the City of Dallas (since 2004). | 49 | Director of Blue Cross Blue Shield of Kansas City (a not-for-profit health insurance provider) (since 2016) and Director of Global Life Insurance (life and supplemental health insurance provider) (since 2017). Formerly, Director of Federal Home Loan Bank of Dallas (2017-2021). |
Janus Henderson Global Bond Fund
Trustees and Officers (unaudited)
| | | | | | |
TRUSTEES |
Name, Address, and Age | Positions Held with the Trust | Length of Time Served | Principal Occupations During the Past Five Years | Number of Portfolios/Funds in Fund Complex Overseen by Trustee | Other Directorships Held by Trustee During the Past Five Years |
Independent Trustees | | | | |
Janus Henderson Global Bond Fund
Trustees and Officers (unaudited)
| | | | | | |
William D. Cvengros
151 Detroit Street
Denver, CO 80206
DOB: 1948 | Trustee | 1/11-Present | Chief Executive Officer of SJC Capital, LLC (a personal investment company and consulting firm) (since 2002). Formerly, Chief Executive Officer and President of PIMCO Advisors Holdings L.P. (a publicly traded investment management firm) (1994-2000), and Chief Investment Officer (1987-1994) and Vice Chairman and Director (1990-1994) of Pacific Life Insurance Company (a mutual life insurance and annuity company) (1987-1994). | 49 | Member, Limited Partner Advisory Committee, Karmel Capital Fund III (later stage growth fund) (since 2022), Member of the Investment Committee for the Orange County Community Foundation (a grantmaking foundation) (since 2020), Advisory Board Member, RevOZ Fund LP and related funds (real estate investments for opportunity zones) (since 2020), and Advisory Board Member, Innovate Partners Emerging Growth and Equity Fund I (early stage venture capital fund) (since 2014). Formerly, Managing Trustee of National Retirement Partners Liquidating Trust (2013-2016), Chairman, National Retirement Partners, Inc. (formerly a network of advisors to 401(k) plans) (2005-2013), Director of Prospect Acquisition Corp. (a special purpose acquisition corporation) (2007-2009), Director of RemedyTemp, Inc. (temporary help services company) (1996-2006), and Trustee of PIMCO Funds Multi-Manager Series (1990-2000) and Pacific Life Variable Life & Annuity Trusts (1987-1994). |
Janus Henderson Global Bond Fund
Trustees and Officers (unaudited)
| �� | | | | | |
TRUSTEES |
Name, Address, and Age | Positions Held with the Trust | Length of Time Served | Principal Occupations During the Past Five Years | Number of Portfolios/Funds in Fund Complex Overseen by Trustee | Other Directorships Held by Trustee During the Past Five Years |
Independent Trustees | | | | |
Raudline Etienne
151 Detroit Street
Denver, CO 80206
DOB: 1965 | Trustee | 6/16-Present | Founder, Daraja Capital (advisory and investment firm) (since 2016). Formerly, Senior Vice President and Senior Advisor, Albright Stonebridge Group LLC (global strategy firm) (2011-2021), and Deputy Comptroller and Chief Investment Officer, New York State Common Retirement Fund (public pension fund) (2008-2011). | 49 | Member of the Investment Committee for Cooper Union (private college) (since 2021) and Director of Brightwood Capital Advisors, LLC (since 2014). Formerly, Board Member, Van Alen Institute (nonprofit architectural and design organization) (2019-2022). |
Darrell B. Jackson
151 Detroit Street
Denver, CO 80206
DOB: 1958 | Trustee | 8/22-Present | President and Chief Executive Officer, The Efficace Group Inc. (since 2018). Formerly, President and Chief Executive Officer, Seaway Bank and Trust Company (community bank) (2014-2015), and Executive Vice President and Co-President, Wealth Management (2009-2014), and several senior positions, including Group Executive, Senior Vice President, and Vice President (1995-2009) of Northern Trust Company (financial services company) (1995-2014). | 49 | Director of Amalgamated Financial Corp (bank) (since August 2021), Director of YR Media (a not-for-profit production company) (since 2021), and Director of Gray-Bowen-Scott (transportation project consulting firm) (since April 2020). Formerly, Director of Delaware Place Bank (closely held commercial bank) (2016-2018) and Director of Seaway Bank and Trust Company (2014-2015). |
Janus Henderson Global Bond Fund
Trustees and Officers (unaudited)
| | | | | | |
TRUSTEES |
Name, Address, and Age | Positions Held with the Trust | Length of Time Served | Principal Occupations During the Past Five Years | Number of Portfolios/Funds in Fund Complex Overseen by Trustee | Other Directorships Held by Trustee During the Past Five Years |
Independent Trustees | | | | |
William F. McCalpin
151 Detroit Street
Denver, CO 80206
DOB: 1957 | Trustee | 6/02-Present | Chief Executive Officer, muun chi LLC (organic food business) (since 2022) and Independent Consultant (since 2019). Formerly, Chief Operating Officer, muun chi LLC (2020-2022), Managing Partner, Impact Investments, Athena Capital Advisors LLC (independent registered investment advisor) (2016-2019), Managing Director, Holos Consulting LLC (provides consulting services to foundations and other nonprofit organizations) (2009-2016), Chief Executive Officer, Imprint Capital Advisors (impact investment firm) (2013-2015), and Executive Vice President and Chief Operating Officer of The Rockefeller Brothers Fund (a private family foundation) (1998-2006). | 49 | Chairman of the Board and Trustee of The Investment Fund for Foundations Investment Program (TIP) (consisting of 1 fund) (since 2008). Formerly, Director of the F.B. Heron Foundation (a private grantmaking foundation) (2006-2022), and Director of Mutual Fund Directors Forum (a non-profit organization serving independent directors of U.S. mutual funds) (2016-2021). |
Janus Henderson Global Bond Fund
Trustees and Officers (unaudited)
| | | | | | |
TRUSTEES |
Name, Address, and Age | Positions Held with the Trust | Length of Time Served | Principal Occupations During the Past Five Years | Number of Portfolios/Funds in Fund Complex Overseen by Trustee | Other Directorships Held by Trustee During the Past Five Years |
Independent Trustees | | | | |
Gary A. Poliner
151 Detroit Street
Denver, CO 80206
DOB: 1953 | Trustee | 6/16-Present | Retired. Formerly, President (2010-2013) of Northwestern Mutual Life Insurance Company. | 49 | Director of MGIC Investment Corporation (private mortgage insurance) (since 2013). Formerly, Director, West Bend Mutual Insurance Company (property/casualty insurance) (2013-2021), Trustee of Northwestern Mutual Life Insurance Company (2010-2013) and Director of Frank Russell Company (global asset management firm) (2008-2013). |
Diane L. Wallace
151 Detroit Street
Denver, CO 80206
DOB: 1958 | Trustee | 6/17-Present | Retired. Formerly, Chief Operating Officer, Senior Vice President-Operations, and Chief Financial Officer for Driehaus Capital Management, LLC (1988-2006) and Treasurer for Driehaus Mutual Funds (1996-2002). | 49 | Formerly, Director of Family Service of Lake County (2019-2021), Independent Trustee, Henderson Global Funds (13 portfolios) (2015-2017), Independent Trustee, State Farm Associates’ Funds Trust, State Farm Mutual Fund Trust, and State Farm Variable Product Trust (28 portfolios) (2013-2017). |
Janus Henderson Global Bond Fund
Trustees and Officers (unaudited)
| | | | |
OFFICERS |
Name, Address, and Age | Positions Held with the Trust | Term of Office* and Length of Time Served | Principal Occupations During the Past Five Years |
Helen Anthony
151 Detroit Street
Denver, CO 80206
DOB: 1988 | Executive Vice President and Co-Portfolio Manager Janus Henderson Global Bond Fund | 6/20-Present | Portfolio Manager for other Janus Henderson accounts. |
Jenna Barnard
151 Detroit Street
Denver, CO 80206
DOB: 1980 | Executive Vice President and Co-Portfolio Manager Janus Henderson Global Bond Fund | 11/22-Present | Co-Head of Global Bonds of Janus Henderson Investors and Portfolio Manager for other Janus Henderson accounts. |
John Pattullo
151 Detroit Street
Denver, CO 80206
DOB: 1970 | Executive Vice President and Co-Portfolio Manager Janus Henderson Global Bond Fund | 11/22-Present | Co-Head of Global Bonds of Janus Henderson Investors and Portfolio Manager for other Janus Henderson accounts. |
Michelle Rosenberg
151 Detroit Street
Denver, CO 80206
DOB: 1973 | President and Chief Executive Officer | 9/22-Present | General Counsel and Corporate Secretary of Janus Henderson Investors (since 2018). Formerly, Interim President and Chief Executive Officer of the Trust and Janus Aspen Series (2022), Senior Vice President and Head of Legal, North America of Janus Henderson Investors (2017-2018) and Deputy General Counsel of Janus Henderson US (Holdings) Inc. (2015-2018). |
Janus Henderson Global Bond Fund
Trustees and Officers (unaudited)
| | | | |
OFFICERS |
Name, Address, and Age | Positions Held with the Trust | Term of Office* and Length of Time Served | Principal Occupations During the Past Five Years |
Kristin Mariani
151 Detroit Street
Denver, CO 80206
DOB: 1966 | Vice President and Chief Compliance Officer | 7/20-Present | Head of Compliance, North America at Janus Henderson Investors (since September 2020) and Chief Compliance Officer at Janus Henderson Investors US LLC (since September 2017). Formerly, Anti-Money Laundering Officer for the Trust and Janus Aspen Series (July 2020-December 2022), Global Head of Investment Management Compliance at Janus Henderson Investors (February 2019-August 2020), Vice President, Head of Global Distribution Compliance and Chief Compliance Officer at Janus Henderson Distributors US LLC (May 2017-September 2017), Vice President, Compliance at Janus Henderson US (Holdings) Inc., Janus Henderson Investors US LLC, and Janus Henderson Distributors US LLC (2009-2017). |
Jesper Nergaard
151 Detroit Street
Denver, CO 80206
DOB: 1962 | Chief Financial Officer
Vice President, Treasurer, and Principal Accounting Officer | 3/05-Present
2/05-Present | Head of U.S. Fund Administration, Janus Henderson Investors and Janus Henderson Services US LLC. |
Abigail J. Murray
151 Detroit Street
Denver, CO 80206
DOB: 1975 | Vice President, Chief Legal Counsel, and Secretary | 12/20-Present | Managing Counsel (since 2020). Formerly, Senior Counsel for Invesco Ltd. (2017-2020), and Vice President and Senior Counsel, ALPS Fund Services, Inc. and Assistant General Counsel, ALPS Advisors, Inc. (2015-2017). |
Ciaran Askin
151 Detroit Street
Denver, CO 80206
DOB: 1978 | Anti-Money Laundering Officer | 12/22-Present | Global Head of Financial Crime, Janus Henderson Investors (since 2022). Formerly, Global Head of Financial Crime for Invesco Ltd. (2017-2022). |
* Officers are elected at least annually by the Trustees for a one-year term and may also be elected from time to time by the Trustees for an interim period. |
| | | | | | | | |
| | | | | |

| | | | |
This report is submitted for the general information of shareholders of the Fund. It is not an offer or solicitation for the Fund and is not authorized for distribution to prospective investors unless preceded or accompanied by an effective prospectus. |
Janus Henderson is a trademark of Janus Henderson Group plc or one of its subsidiaries. © Janus Henderson Group plc Janus Henderson Distributors US LLC Janus Henderson Group is the ultimate parent of Janus Henderson Distributors US LLC |
| | | | 125-02-93023 08-23 |
| | | |
| | | |
| | | ANNUAL REPORT June 30, 2023 |
| | |
| | Janus Henderson Government Money Market Fund |
| | |
| | Janus Investment Fund |
| |
Table of Contents
Janus Henderson Government Money Market Fund
Important Notice - Tailored Shareholder Reports
Effective January 24, 2023, the Securities and Exchange Commission (the “SEC”) adopted rule and form amendments that require mutual funds and exchange-traded funds to provide shareholders with streamlined annual and semi-annual shareholder reports that highlight key information. Other information, including financial statements, that currently appears in shareholder reports will be made available online, delivered free of charge to shareholders upon request, and filed with the SEC. The first tailored shareholder report for the Fund will be for the reporting period ending June 30, 2024. Currently, management is evaluating the impact of the rule and form amendments on the content of the Fund’s current shareholder reports.
Janus Henderson Government Money Market Fund (unaudited)
Performance
| | | | | | |
| | | | 
Vince Ahn co-portfolio manager | 
Garrett Strum co-portfolio manager |
| | | |
| | | | | | |
Average Annual Total Return | | Seven-Day Current Yield | |
For the periods ended June 30, 2023 | | | Class D Shares | | |
Class D Shares | | | With Reimbursement | 4.57% | |
1 Year | 3.27% | | Without Reimbursement | 4.57% | |
5 Year | 1.18% | | Class T Shares | | |
10 Year | 0.67% | | With Reimbursement | 4.55% | |
Since Inception (February 14, 1995) | 2.01% | | Without Reimbursement | 4.55% | |
Class T Shares | | | Prospectus Expense Ratios | |
1 Year | 3.25% | | Class D Shares | | |
5 Year | 1.17% | | Total Annual Fund Operating Expenses‡ | 0.57% | |
10 Year | 0.66% | | Class T Shares | | |
Since Inception (February 14, 1995) | 2.01% | | Total Annual Fund Operating Expenses‡ | 0.59% | |
| | | | | |
| | | | | |
Returns quoted are past performance and do not guarantee future results; current performance may be lower or higher. For the most recent month-end performance call 800.668.0434 (or 800.525.3713 if you hold shares directly with Janus Henderson) or visit janushenderson.com/performance (or janushenderson.com/allfunds if you hold shares directly with Janus Henderson).
You could lose money by investing in the Fund. Although the Fund seeks to preserve the value of your investment at $1.00 per share, it cannot guarantee it will do so. An investment in the Fund is not insured or guaranteed by the Federal Deposit Insurance Corporation or any other government agency. The Fund’s sponsor has no legal obligation to provide financial support to the Fund, and you should not expect that the sponsor will provide financial support to the Fund at any time.
Returns include reinvestment of all dividends and distributions.
The yield more closely reflects the current earnings of the money market fund than the total return.
Class D Shares of the Fund commenced operations on February 16, 2010. Performance shown for periods prior to February 16, 2010, reflects the performance of the Fund’s former Class J Shares, the initial share class (renamed Class T Shares effective February 16, 2010), calculated using the fees and expenses in effect during the periods shown, net of any applicable fee and expense limitations or waivers.
If Class D Shares of the Fund had been available during periods prior to February 16, 2010, the performance shown may have been different. The performance shown for periods following the Fund’s commencement of Class D Shares reflects the fees and expenses of Class D Shares, net of any applicable fee and expense limitations or waivers. Please refer to the Fund’s prospectuses for further details concerning historical performance.
See Notes to Schedule of Investments and Other Information and Notes to Financial Statements.
See “Useful Information About Your Fund Report.”
‡ As stated in the prospectus. See Financial Highlights for actual expense ratios during the reporting period.
Janus Henderson Government Money Market Fund (unaudited)
Expense Examples
As a shareholder of the Fund, you incur two types of costs: (1) transaction costs and (2) ongoing costs, including management fees; transfer agent fees and expenses payable pursuant to the Transfer Agency Agreement; and other Fund expenses. This example is intended to help you understand your ongoing costs (in dollars) of investing in the Fund and to compare these costs with the ongoing costs of investing in other mutual funds. To do so, compare this 5% hypothetical example with the 5% hypothetical examples that appear in the shareholder reports of the other funds. The example is based upon an investment of $1,000 invested at the beginning of the period and held for the six-months indicated, unless noted otherwise in the table and footnotes below.
Actual Expenses
The information in the table under the heading “Actual” provides information about actual account values and actual expenses. You may use the information in these columns, together with the amount you invested, to estimate the expenses that you paid over the period. Simply divide your account value by $1,000 (for example, an $8,600 account value divided by $1,000 = 8.6), then multiply the result by the number in the appropriate column for your share class under the heading entitled “Expenses Paid During Period” to estimate the expenses you paid on your account during the period.
Hypothetical Example for Comparison Purposes
The information in the table under the heading “Hypothetical (5% return before expenses)” provides information about hypothetical account values and hypothetical expenses based upon the Fund’s actual expense ratio and an assumed rate of return of 5% per year before expenses, which is not the Fund’s actual return. The hypothetical account values and expenses may not be used to estimate the actual ending account balance or expenses you paid for the period. You may use this information to compare the ongoing costs of investing in the Fund and other funds. To do so, compare this 5% hypothetical example with the 5% hypothetical examples that appear in the shareholder reports of the other funds. Additionally, for an analysis of the fees associated with an investment in either share class or other similar funds, please visit www.finra.org/fundanalyzer.
Please note that the expenses shown in the table are meant to highlight your ongoing costs only and do not reflect any transaction costs. These fees are fully described in the Fund’s prospectuses. Therefore, the hypothetical examples are useful in comparing ongoing costs only, and will not help you determine the relative total costs of owning different funds. In addition, if these transaction costs were included, your costs would have been higher.
| | | | | | | | | | | |
| | | | | | | | |
| | | Actual | | Hypothetical
(5% return before expenses) | |
| Beginning
Account
Value
(1/1/23) | Ending
Account
Value
(6/30/23) | Expenses
Paid During
Period
(1/1/23 - 6/30/23)† | | Beginning
Account
Value
(1/1/23) | Ending
Account
Value
(6/30/23) | Expenses
Paid During
Period
(1/1/23 - 6/30/23)† | Net Annualized
Expense Ratio
(1/1/23 - 6/30/23) |
Class D Shares | $1,000.00 | $1,020.90 | $2.86 | | $1,000.00 | $1,021.97 | $2.86 | 0.57% |
Class T Shares | $1,000.00 | $1,020.80 | $2.96 | | $1,000.00 | $1,021.87 | $2.96 | 0.59% |
† | Expenses Paid During Period are equal to the Net Annualized Expense Ratio multiplied by the average account value over the period, multiplied by 181/365 (to reflect the one-half year period). Expenses in the examples include the effect of applicable fee waivers and/or expense reimbursements, if any. Had such waivers and/or reimbursements not been in effect, your expenses would have been higher. Please refer to the Notes to Financial Statements or the Fund’s prospectuses for more information regarding waivers and/or reimbursements. |
| | |
Janus Henderson Government Money Market Fund
Schedule of Investments
June 30, 2023
| | | | | | | | |
Principal Amounts
| | | Value | |
U.S. Government Agency Notes– 35.4% | | | |
Federal Home Loan Bank Discount Notes: | | | |
| | 5.0525%, 7/3/23 | | $5,000,000 | | | $5,000,000 | |
| | 4.7779%, 7/7/23 | | 6,000,000 | | | 5,996,889 | |
| | 5.2075%, 7/11/23 | | 5,000,000 | | | 4,994,363 | |
| | 4.8735%, 7/14/23 | | 6,000,000 | | | 5,991,282 | |
| | 5.0990%, 7/17/23 | | 6,000,000 | | | 5,988,407 | |
| | 5.1086%, 7/19/23 | | 6,000,000 | | | 5,986,728 | |
| | 4.9946%, 7/21/23 | | 6,000,000 | | | 5,985,396 | |
| | 5.1671%, 7/25/23 | | 6,000,000 | | | 5,981,556 | |
| | 5.1772%, 7/26/23 | | 4,500,000 | | | 4,485,511 | |
| | 4.8984%, 7/28/23 | | 6,000,000 | | | 5,980,107 | |
| | 5.0472%, 8/1/23 | | 6,000,000 | | | 5,976,248 | |
| | 4.9345%, 8/2/23 | | 1,700,000 | | | 1,693,190 | |
| | 4.9128%, 8/4/23 | | 4,500,000 | | | 4,480,857 | |
| | 5.1439%, 8/9/23 | | 6,000,000 | | | 5,969,148 | |
| | 4.9945%, 8/16/23 | | 5,000,000 | | | 4,970,305 | |
| | 5.2709%, 8/21/23 | | 6,000,000 | | | 5,958,197 | |
| | 5.3099%, 8/23/23 | | 6,000,000 | | | 5,956,185 | |
| | 5.3680%, 8/25/23 | | 6,000,000 | | | 5,953,989 | |
| | 5.4051%, 8/30/23 | | 6,000,000 | | | 5,949,328 | |
| | 5.3743%, 9/1/23 | | 5,000,000 | | | 4,956,566 | |
| | 5.3771%, 9/8/23 | | 6,000,000 | | | 5,941,798 | |
| | 5.2538%, 9/13/23 | | 6,000,000 | | | 5,938,868 | |
| | 5.4224%, 9/15/23 | | 6,000,000 | | | 5,935,227 | |
| | 5.4026%, 9/22/23 | | 6,000,000 | | | 5,929,386 | |
| | 5.3031%, 9/29/23 | | 6,000,000 | | | 5,924,690 | |
Total U.S. Government Agency Notes (cost $137,924,221) | | 137,924,221 | |
U.S. Treasury Debt– 7.6% | | | |
| | United States Treasury Bill, 5.1942%, 7/5/23 | | 6,000,000 | | | 5,998,312 | |
| | United States Treasury Bill, 6.2451%, 7/20/23 | | 6,000,000 | | | 5,985,428 | |
| | United States Treasury Bill, 5.4840%, 8/15/23 | | 6,000,000 | | | 5,964,339 | |
| | United States Treasury Bill, 5.8198%, 8/24/23 | | 6,000,000 | | | 5,956,203 | |
| | United States Treasury Bill, 5.8399%, 9/7/23 | | 6,000,000 | | | 5,943,156 | |
Total U.S. Treasury Debt (cost $29,847,438) | | 29,847,438 | |
Variable Rate Demand Notes¶– 16.1% | | | |
| | 6213 Montezuma LLC (LOC: FHLB of San Francisco), 5.2100%, 2/1/62 | | 2,200,000 | | | 2,200,000 | |
| | Alberta Street Development LLC (LOC: FHLB of San Francisco), | | | | | | |
| | 5.2100%, 3/1/61 | | 2,000,000 | | | 2,000,000 | |
| | Bryan W Kelley 2019 Irrevocable Insurance Trust (LOC: FHLB of Dallas), | | | | | | |
| | 5.2000%, 7/1/70 | | 2,980,000 | | | 2,980,000 | |
| | Cypress Bend Real Estate Development Co LLC (LOC: FHLB of Dallas), | | | | | | |
| | 5.1200%, 4/1/33 | | 9,000,000 | | | 9,000,000 | |
| | Irvine Inn Apartments LP (LOC: FHLB of San Francisco), 5.2100%, 2/1/60 | | 4,000,000 | | | 4,000,000 | |
| | John H Smith Irrevocable Insurance Trust of 2017/The (LOC: FHLB of Dallas), | | | | | | |
| | 5.1200%, 2/1/41 | | 5,820,000 | | | 5,820,000 | |
| | Johnson Capital Management LLC (LOC: FHLB of Indianapolis), 5.2900%, 6/3/47 | | 2,845,000 | | | 2,845,000 | |
| | LML Trust (LOC: FHLB of Dallas), 5.1200%, 2/1/41 | | 4,500,000 | | | 4,500,000 | |
| | Olivetree Apartments LP (LOC: FHLB of San Francisco), 5.2100%, 6/2/59 | | 10,000,000 | | | 10,000,000 | |
| | Rieber Life Insurance Trust/The (LOC: FHLB of Dallas), 5.1200%, 5/1/42 | | 4,000,000 | | | 4,000,000 | |
| | SIL Irrevocable Trust (LOC: FHLB of Dallas), 5.1200%, 6/1/43 | | 6,150,000 | | | 6,150,000 | |
| | SMZ Holdings LLC (LOC: FHLB of Dallas), 5.1200%, 6/1/40 | | 4,240,000 | | | 4,240,000 | |
| | Ventana Housing LP (LOC: FHLB of San Francisco), 5.2100%, 6/1/60 | | 5,000,000 | | | 5,000,000 | |
Total Variable Rate Demand Notes (cost $62,735,000) | | 62,735,000 | |
Repurchase Agreementsë– 40.9% | | | |
| | Credit Agricole, New York, Joint repurchase agreement, 5.0000%, dated 6/30/23, maturing 7/3/23 to be repurchased at $5,002,083 collateralized by $5,814,450 in U.S. Treasuries 1.2500%, 3/31/28 with a value of $5,100,016 | | 5,000,000 | | | 5,000,000 | |
| | |
See Notes to Schedule of Investments and Other Information and Notes to Financial Statements. |
| |
Janus Investment Fund | 3 |
Janus Henderson Government Money Market Fund
Schedule of Investments
June 30, 2023
| | | | | | | | |
Principal Amounts
| | | Value | |
Repurchase Agreementsë– (continued) | | | |
| | Goldman Sachs & Co, Joint repurchase agreement, 4.9200%, dated 6/30/23, maturing 7/3/23 to be repurchased at $25,010,250 collateralized by $21,136,883 in U.S. Government Agencies 2.7500% - 6.5000%, 8/15/24 - 1/15/58 and $7,321,263 in U.S. Treasuries 1.1250% - 1.5000%, 2/15/25 - 8/15/50 with a value of $25,500,000 | | $25,000,000 | | | $25,000,000 | |
| | HSBC Securities (USA) Inc, Joint repurchase agreement, 5.0000%, dated 6/30/23, maturing 7/3/23 to be repurchased at $10,004,167 collateralized by $10,742,533 in U.S. Treasuries 1.5000%, 2/15/25 with a value of $10,200,002 | | 10,000,000 | | | 10,000,000 | |
| | ING Financial Markets LLC, Joint repurchase agreement, 5.0500%, dated 6/30/23, maturing 7/3/23 to be repurchased at $35,014,729 collateralized by $38,148,839 in U.S. Treasuries 0% - 4.3750%, 8/15/23 - 11/15/52 with a value of $35,715,024 | | 35,000,000 | | | 35,000,000 | |
| | ING Financial Markets LLC, Joint repurchase agreement, 5.0500%, dated 6/30/23, maturing 7/3/23 to be repurchased at $25,010,521 collateralized by $27,309,842 in U.S. Government Agencies 1.5000% - 8.0000%, 3/1/27 - 2/1/57 with a value of $25,510,731 | | 25,000,000 | | | 25,000,000 | |
| | Royal Bank of Canada, NY Branch, Joint repurchase agreement, 4.9900%, dated 6/30/23, maturing 7/3/23 to be repurchased at $5,002,079 collateralized by $5,471,410 in U.S. Treasuries 2.2500% - 5.4177%, 1/31/24 - 8/15/27 with a value of $5,102,121 | | 5,000,000 | | | 5,000,000 | |
| | Royal Bank of Canada, NY Branch, Joint repurchase agreement, 5.0000%, dated 6/30/23, maturing 7/3/23 to be repurchased at $54,722,792 collateralized by $14,713,431 in U.S. Government Agencies 5.9163% - 7.0000%, 5/20/53 and $40,835,321 in U.S. Treasuries 0.5000% - 4.1250%, 3/31/25 - 11/15/32 with a value of $55,817,253 | | 54,700,000 | | | 54,700,000 | |
Total Repurchase Agreements (cost $159,700,000) | | 159,700,000 | |
Total Investments (total cost $390,206,659) – 100.0% | | 390,206,659 | |
Liabilities, net of Cash, Receivables and Other Assets – (0)% | | (63,384) | |
Net Assets – 100% | | $390,143,275 | |
| | |
See Notes to Schedule of Investments and Other Information and Notes to Financial Statements. |
| |
4 | JUNE 30, 2023 |
Janus Henderson Government Money Market Fund
Schedule of Investments
June 30, 2023
| | | | | | | | | | |
Offsetting of Financial Assets and Derivative Assets |
| |
| | | Gross Amounts | | | | | | |
| | | of Recognized | | Offsetting Asset | | Collateral | | |
Counterparty | | Assets | | or Liability(a) | | Pledged(b) | | Net Amount |
| | | | | | | | | |
Credit Agricole, New York | $ | 5,000,000 | $ | — | $ | (5,000,000) | $ | — |
Goldman Sachs & Co | | 25,000,000 | | — | | (25,000,000) | | — |
HSBC Securities (USA) Inc | | 10,000,000 | | — | | (10,000,000) | | — |
ING Financial Markets LLC | | 60,000,000 | | — | | (60,000,000) | | — |
Royal Bank of Canada, NY Branch | | 59,700,000 | | — | | (59,700,000) | | — |
| | | | | | | | | |
Total | $ | 159,700,000 | $ | — | $ | (159,700,000) | $ | — |
(a) | Represents the amount of assets or liabilities that could be offset with the same counterparty under master netting or similar agreements that management elects not to offset on the Statement of Assets and Liabilities. |
(b) | Collateral pledged is limited to the net outstanding amount due to/from an individual counterparty. The actual collateral amounts pledged may exceed these amounts and may fluctuate in value. |
| | |
See Notes to Schedule of Investments and Other Information and Notes to Financial Statements. |
| |
Janus Investment Fund | 5 |
Janus Henderson Government Money Market Fund
Notes to Schedule of Investments and Other Information
| | |
LLC | Limited Liability Company |
LOC | Letter of Credit |
LP | Limited Partnership |
Money market funds may hold securities with stated maturities of greater than 397 days when those securities have features that allow a fund to “put” back the security to the issuer or to a third party within 397 days of acquisition. The maturity dates shown in the security descriptions are the stated maturity dates.
| | |
¶ | Variable rate demand notes are not based on a published reference rate and spread; they are determined by the issuer or remarketing agent and current market conditions. The reference rate in the security description is as of June 30, 2023. |
| | |
ë | The Fund may have elements of risk due to concentration of investments. Such concentrations may subject the Fund to additional risks. |
| | | | | | | | | | | | | |
The following is a summary of the inputs that were used to value the Fund’s investments in securities and other financial instruments as of June 30, 2023. See Notes to Financial Statements for more information. |
| |
Valuation Inputs Summary |
| | | | | | | |
| | | | | Level 2 - | | Level 3 - |
| | | Level 1 - | | Other Significant | | Significant |
| | | Quoted Prices | | Observable Inputs | | Unobservable Inputs |
| | | | | | | |
Assets | | | | | | |
Investments In Securities: | | | | | | |
U.S. Government Agency Notes | $ | - | $ | 137,924,221 | $ | - |
U.S. Treasury Debt | | - | | 29,847,438 | | - |
Variable Rate Demand Notes | | - | | 62,735,000 | | - |
Repurchase Agreements | | - | | 159,700,000 | | - |
Total Assets | $ | - | $ | 390,206,659 | $ | - |
| | | | | | | |
Janus Henderson Government Money Market Fund
Statement of Assets and Liabilities
June 30, 2023
| | | | | | | |
| | | | | | |
Assets: | | | | |
| Investments, at value (cost $230,506,659) | | $ | 230,506,659 | |
| Repurchase agreements, at value (cost $159,700,000) | | | 159,700,000 | |
| Cash | | | 150,490 | |
| Trustees' deferred compensation | | | 9,879 | |
| Receivables: | | | | |
| | Interest | | | 333,734 | |
| | Fund shares sold | | | 167,983 | |
| Other assets | | | 2 | |
Total Assets | | | 390,868,747 | |
Liabilities: | | | | |
| Payables: | | | — | |
| | Fund shares repurchased | | | 469,847 | |
| | Administration services fees | | | 123,751 | |
| | Advisory fees | | | 68,687 | |
| | Professional fees | | | 43,200 | |
| | Trustees' deferred compensation fees | | | 9,879 | |
| | Dividends | | | 7,624 | |
| | Trustees' fees and expenses | | | 2,454 | |
| | Accrued expenses and other payables | | | 30 | |
Total Liabilities | | | 725,472 | |
Net Assets | | $ | 390,143,275 | |
Net Assets Consist of: | | | | |
| Capital (par value and paid-in surplus) | | $ | 390,148,336 | |
| Total distributable earnings (loss) | | | (5,061) | |
Total Net Assets | | $ | 390,143,275 | |
Net Assets - Class D Shares | | $ | 383,879,471 | |
| Shares Outstanding, $0.01 Par Value (unlimited shares authorized) | | | 383,888,589 | |
Net Asset Value Per Share | | $ | 1.00 | |
Net Assets - Class T Shares | | $ | 6,263,804 | |
| Shares Outstanding, $0.01 Par Value (unlimited shares authorized) | | | 6,264,079 | |
Net Asset Value Per Share | | $ | 1.00 | |
| | |
See Notes to Financial Statements. |
| |
Janus Investment Fund | 7 |
Janus Henderson Government Money Market Fund
Statement of Operations
For the year ended June 30, 2023
| | | | | | |
| | | | | |
Investment Income: |
| Interest | $ | 15,267,383 | |
| Other income | | 276 | |
Total Investment Income | | 15,267,659 | |
Expenses: | | | |
| Advisory fees | | 812,468 | |
| Administration services fees: | | | |
| | Class D Shares | | 1,430,993 | |
| | Class T Shares | | 33,197 | |
| Professional fees | | 44,791 | |
| Trustees’ fees and expenses | | 11,821 | |
Total Expenses | | 2,333,270 | |
Net Investment Income/(Loss) | | 12,934,389 | |
Net Increase/(Decrease) in Net Assets Resulting from Operations | $ | 12,934,389 | |
| | | | | |
| | |
See Notes to Financial Statements. |
| |
8 | JUNE 30, 2023 |
Janus Henderson Government Money Market Fund
Statements of Changes in Net Assets
| | | | | | | | | |
| | | | | | | | |
| | | Year ended
June 30, 2023 | | Year ended
June 30, 2022 | |
| | | | | | | | | |
Operations: | | | | | | |
| Net investment income/(loss) | $ | 12,934,389 | | $ | 5,414 | |
| Net realized gain/(loss) on investments | | — | | | 12,305 | |
Net Increase/(Decrease) in Net Assets Resulting from Operations | 12,934,389 | | | 17,719 | |
Dividends and Distributions to Shareholders: | | | | | | |
| | Class D Shares | | (12,672,152) | | | (5,316) | |
| | Class T Shares | | (274,409) | | | (100) | |
Net Decrease from Dividends and Distributions to Shareholders | (12,946,561) | | | (5,416) | |
Capital Share Transactions: | | | | | | |
| | Class D Shares | | (23,016,362) | | | 63,765,200 | |
| | Class T Shares | | (2,602,317) | | | 2,019,916 | |
Net Increase/(Decrease) from Capital Share Transactions | (25,618,679) | | | 65,785,116 | |
Net Increase/(Decrease) in Net Assets | | (25,630,851) | | | 65,797,419 | |
Net Assets: | | | | | | |
| Beginning of period | | 415,774,126 | | | 349,976,707 | |
| End of period | $ | 390,143,275 | | $ | 415,774,126 | |
| | | | | | | | |
| | |
See Notes to Financial Statements. |
| |
Janus Investment Fund | 9 |
Janus Henderson Government Money Market Fund
Financial Highlights
| | | | | | | | | | | | | | | | | | | |
Class D Shares | | | | | | | | | | | | | | | |
For a share outstanding during the year ended June 30 | | 2023 | | | 2022 | | | 2021 | | | 2020 | | | 2019 | |
| Net Asset Value, Beginning of Period | | $1.00 | | | $1.00 | | | $1.00 | | | $1.00 | | | $1.00 | |
| Income/(Loss) from Investment Operations: | | | | | | | | | | | | | | | |
| | Net investment income/(loss)(1) | | 0.03 | | | —(2) | | | —(2) | | | 0.01 | | | 0.02 | |
| | Net realized and unrealized gain/(loss)(2) | | — | | | — | | | — | | | — | | | — | |
| Total from Investment Operations | | 0.03 | | | — | | | — | | | 0.01 | | | 0.02 | |
| Less Dividends and Distributions: | | | | | | | | | | | | | | | |
| | Dividends (from net investment income) | | (0.03) | | | —(2) | | | —(2) | | | (0.01) | | | (0.02) | |
| | Distributions (from capital gains) | | —(2) | | | — | | | — | | | — | | | — | |
| Total Dividends and Distributions | | (0.03) | | | — | | | — | | | (0.01) | | | (0.02) | |
| Net Asset Value, End of Period | | $1.00 | | | $1.00 | | | $1.00 | | | $1.00 | | | $1.00 | |
| Total Return* | | 3.27% | | | 0.00% | | | 0.00% | | | 0.96% | | | 1.71% | |
| Net Assets, End of Period (in thousands) | | $383,879 | | | $406,908 | | | $343,130 | | | $324,601 | | | $202,580 | |
| Average Net Assets for the Period (in thousands) | | $395,495 | | | $356,187 | | | $344,963 | | | $252,388 | | | $197,526 | |
| Ratios to Average Net Assets**: | | | | | | | | | | | | | | | |
| | Ratio of Gross Expenses | | 0.58% | | | 0.57% | | | 0.57% | | | 0.63% | | | 0.69% | |
| | Ratio of Net Expenses (After Waivers and Expense Offsets) | | 0.58% | | | 0.25% | | | 0.09% | | | 0.49% | | | 0.59% | |
| | Ratio of Net Investment Income/(Loss) | | 3.20% | | | 0.00%(3) | | | 0.00%(3) | | | 0.84% | | | 1.70% | |
| | | | | | | | | | | | | | | | | | | |
| |
* Total return includes adjustments in accordance with generally accepted accounting principles required at the year or period end and are not annualized for periods of less than one full year. ** Annualized for periods of less than one full year. (1) Per share amounts are calculated based on average shares outstanding during the year or period. (2) Less than $0.005 on a per share basis. (3) Less than 0.005%. |
| | |
See Notes to Financial Statements. |
| |
10 | JUNE 30, 2023 |
Janus Henderson Government Money Market Fund
Financial Highlights
| | | | | | | | | | | | | | | | | | | |
Class T Shares | | | | | | | | | | | | | | | |
For a share outstanding during the year ended June 30 | | 2023 | | | 2022 | | | 2021 | | | 2020 | | | 2019 | |
| Net Asset Value, Beginning of Period | | $1.00 | | | $1.00 | | | $1.00 | | | $1.00 | | | $1.00 | |
| Income/(Loss) from Investment Operations: | | | | | | | | | | | | | | | |
| | Net investment income/(loss)(1) | | 0.03 | | | —(2) | | | —(2) | | | 0.01 | | | 0.02 | |
| | Net realized and unrealized gain/(loss)(2) | | — | | | — | | | — | | | — | | | — | |
| Total from Investment Operations | | 0.03 | | | — | | | — | | | 0.01 | | | 0.02 | |
| Less Dividends and Distributions: | | | | | | | | | | | | | | | |
| | Dividends (from net investment income) | | (0.03) | | | —(2) | | | —(2) | | | (0.01) | | | (0.02) | |
| | Distributions (from capital gains) | | —(2) | | | — | | | — | | | — | | | — | |
| Total Dividends and Distributions | | (0.03) | | | — | | | — | | | (0.01) | | | (0.02) | |
| Net Asset Value, End of Period | | $1.00 | | | $1.00 | | | $1.00 | | | $1.00 | | | $1.00 | |
| Total Return* | | 3.25% | | | 0.00% | | | 0.00% | | | 0.94% | | | 1.70% | |
| Net Assets, End of Period (in thousands) | | $6,264 | | | $8,866 | | | $6,846 | | | $7,384 | | | $7,849 | |
| Average Net Assets for the Period (in thousands) | | $8,717 | | | $6,856 | | | $7,040 | | | $7,745 | | | $8,055 | |
| Ratios to Average Net Assets**: | | | | | | | | | | | | | | | |
| | Ratio of Gross Expenses | | 0.60% | | | 0.59% | | | 0.59% | | | 0.66% | | | 0.71% | |
| | Ratio of Net Expenses (After Waivers and Expense Offsets) | | 0.60% | | | 0.26% | | | 0.09% | | | 0.53% | | | 0.61% | |
| | Ratio of Net Investment Income/(Loss) | | 3.14% | | | 0.00%(3) | | | 0.00%(3) | | | 0.98% | | | 1.67% | |
| | | | | | | | | | | | | | | | | | | |
| |
* Total return includes adjustments in accordance with generally accepted accounting principles required at the year or period end and are not annualized for periods of less than one full year. ** Annualized for periods of less than one full year. (1) Per share amounts are calculated based on average shares outstanding during the year or period. (2) Less than $0.005 on a per share basis. (3) Less than 0.005%. |
| | |
See Notes to Financial Statements. |
| |
Janus Investment Fund | 11 |
Janus Henderson Government Money Market Fund
Notes to Financial Statements
1. Organization and Significant Accounting Policies
Janus Henderson Government Money Market Fund (the “Fund”) is a series fund. The Fund is part of Janus Investment Fund (the “Trust”), which is organized as a Massachusetts business trust and is registered under the Investment Company Act of 1940, as amended (the “1940 Act”), as an open-end management investment company, and therefore has applied the specialized accounting and reporting guidance in Financial Accounting Standards Board (“FASB”) Accounting Standards Codification (“ASC”) Topic 946. The Trust offers 39 Funds which include multiple series of shares, with differing investment objectives and policies. The Fund seeks capital preservation and liquidity with current income as a secondary objective. Janus Henderson Investors US LLC is the investment adviser (the “Adviser”) to the Fund.
The Fund offers two classes of shares in order to meet the needs of various types of investors. Each class represents an interest in the same portfolio of investments. Certain financial intermediaries may not offer both classes of shares.
The Fund operates as a “government money market fund” as such term is defined in or interpreted under Rule 2a-7 under the Investment Company Act of 1940, as amended. As a government money market fund, the Fund pursues its investment objectives by normally investing at least 99.5% of its total assets in cash, U.S. Government securities, and/or repurchase agreements that are collateralized fully (i.e., collateralized by cash and/or government securities).
As a government money market fund, the Fund is not required to impose a liquidity fee and/or a redemption gate on fund redemptions. The Trustees have determined not to subject the Fund to a liquidity fee and/or a redemption gate on fund redemptions. The Trustees have reserved its ability to change this determination with respect to liquidity fees and/or redemption gates, but only after providing appropriate prior notice to shareholders.
Shareholders, including individuals, accounts, as well as the Fund’s portfolio manager(s) and/or investment personnel, may from time to time own (beneficially or of record) a significant percentage of the Fund’s Shares and can be considered to “control” the Fund when that ownership exceeds 25% of the Fund’s assets (and which may differ from control as determined in accordance with United States of America generally accepted accounting principles ("US GAAP")).
Effective July 6, 2020, Class D Shares are available to new investors, subject to any closed fund policies for a Fund, as applicable. Previously, Class D Shares were only available to investors who already had a direct account with the Janus Henderson funds; immediate family members or members of the same household of an eligible individual investor; and existing beneficial owners of sole proprietorships or partnerships that hold accounts directly with the Janus Henderson funds.
Class T Shares are available through certain financial intermediary platforms including, but not limited to, mutual fund wrap fee programs, managed account programs, asset allocation programs, bank trust platforms, as well as certain retirement platforms. In addition, Class T Shares may be available through certain financial intermediaries who have an agreement with the Adviser or its affiliates to offer Class T Shares on their supermarket platforms.
The following accounting policies have been followed by the Fund and are in conformity with US GAAP.
Liquidity
The Fund has adopted liquidity requirements (measured at the time of purchase) as noted:
The Fund will limit its investments in illiquid securities to 5% or less of its total assets.
Daily liquidity. The Fund will invest at least 10% of its total assets in “daily liquid assets,” which generally include cash (including demand deposits), direct obligations of the U.S. Government, securities (including repurchase agreements) that will mature or are subject to a demand feature that is exercisable and payable within one business day, and/or amounts receivable and due unconditionally within one business day on pending sales of portfolio securities.
Weekly liquidity. The Fund will invest at least 30% of its assets in “weekly liquid assets,” which generally include cash (including demand deposits), direct obligations of the U.S. Government, agency discount notes with remaining maturities of 60 days or less, and securities (including repurchase agreements) that will mature or are subject to a demand feature that is exercisable and payable within five business days.
Janus Henderson Government Money Market Fund
Notes to Financial Statements
Investment Valuation
Fund holdings are valued in accordance with policies and procedures established by the Adviser pursuant to Rule 2a-5 under the 1940 Act and approved by and subject to the oversight of the Trustees (the “Valuation Procedures”). Investments held by the Fund are valued utilizing the amortized cost method of valuation permitted in accordance with Rule 2a-7 under the 1940 Act and certain conditions therein. Under the amortized cost method, which does not take into account unrealized capital gains or losses, an instrument is initially valued at its cost and thereafter assumes a constant accretion/amortization to maturity of any discount or premium.
Valuation Inputs Summary
FASB ASC 820, Fair Value Measurements and Disclosures (“ASC 820”), defines fair value, establishes a framework for measuring fair value, and expands disclosure requirements regarding fair value measurements. This standard emphasizes that fair value is a market-based measurement that should be determined based on the assumptions that market participants would use in pricing an asset or liability and establishes a hierarchy that prioritizes inputs to valuation techniques used to measure fair value. These inputs are summarized into three broad levels:
Level 1 – Unadjusted quoted prices in active markets the Fund has the ability to access for identical assets or liabilities.
Level 2 – Observable inputs other than unadjusted quoted prices included in Level 1 that are observable for the asset or liability either directly or indirectly. These inputs may include quoted prices for the identical instrument on an inactive market, prices for similar instruments, interest rates, prepayment speeds, credit risk, yield curves, default rates and similar data.
Assets or liabilities categorized as Level 2 in the hierarchy generally include: debt securities fair valued in accordance with the evaluated bid or ask prices supplied by a pricing service; securities traded on OTC markets and listed securities for which no sales are reported that are fair valued at the latest bid price (or yield equivalent thereof) obtained from one or more dealers transacting in a market for such securities or by a pricing service approved by the Fund’s Trustees; certain short-term debt securities with maturities of 60 days or less that are fair valued at amortized cost; and equity securities of foreign issuers whose fair value is determined by using systematic fair valuation models provided by independent third parties in order to adjust for stale pricing which may occur between the close of certain foreign exchanges and the close of the NYSE.
Periodic review and monitoring of the valuation of short-term securities is performed in an effort to ensure that amortized cost approximates market value. Other securities that may be categorized as Level 2 in the hierarchy include, but are not limited to, preferred stocks, bank loans, swaps, investments in unregistered investment companies, options, and forward contracts.
Level 3 – Unobservable inputs for the asset or liability to the extent that relevant observable inputs are not available, representing the Fund’s own assumptions about the assumptions that a market participant would use in valuing the asset or liability, and that would be based on the best information available.
There have been no significant changes in valuation techniques used in valuing any such positions held by the Fund since the beginning of the fiscal year.
The inputs or methodology used for fair valuing securities are not necessarily an indication of the risk associated with investing in those securities. The summary of inputs used as of June 30, 2023 to fair value the Fund’s investments in securities and other financial instruments is included in the “Valuation Inputs Summary” in the Notes to Schedule of Investments and Other Information.
Investment Transactions and Investment Income
Investment transactions are accounted for as of the date purchased or sold (trade date). Dividend income is recorded on the ex-dividend date. Certain dividends from foreign securities will be recorded as soon as the Fund is informed of the dividend, if such information is obtained subsequent to the ex-dividend date. Dividends from foreign securities may be subject to withholding taxes in foreign jurisdictions. Non-cash dividends, if any, are recorded on the ex-dividend date at fair value. Interest income is recorded daily on the accrual basis and includes amortization of premiums and accretion of discounts. The Fund classifies gains and losses on prepayments received as an adjustment to interest income. Debt securities may be placed in non-accrual status and related interest income may be reduced by stopping current accruals and writing off interest receivables when collection of all or a portion of interest has become doubtful. Gains and losses are determined on the identified cost basis, which is the same basis used for federal income tax purposes.
Janus Henderson Government Money Market Fund
Notes to Financial Statements
Income, as well as gains and losses, both realized and unrealized, are allocated daily to each class of shares based upon the ratio of net assets represented by each class as a percentage of total net assets.
Expenses
The Fund bears expenses incurred specifically on its behalf. Each class of shares bears a portion of general expenses, which are allocated daily to each class of shares based upon the ratio of net assets represented by each class as a percentage of total net assets. Expenses directly attributable to a specific class of shares are charged against the operations of such class.
Estimates
The preparation of financial statements in conformity with US GAAP requires management to make estimates and assumptions that affect the reported amount of assets and liabilities and disclosure of contingent assets and liabilities at the date of the financial statements, and the reported amounts of income and expenses during the reporting period. Actual results could differ from those estimates.
Indemnifications
In the normal course of business, the Fund may enter into contracts that contain provisions for indemnification of other parties against certain potential liabilities. The Fund’s maximum exposure under these arrangements is unknown, and would involve future claims that may be made against the Fund that have not yet occurred. Currently, the risk of material loss from such claims is considered remote.
Dividends and Distributions
Dividends, if any, are declared daily and distributed monthly for the Fund. Realized capital gains, if any, are declared and distributed in December. The Fund may treat a portion of the amount paid to redeem shares as a distribution of investment company taxable income and realized capital gains that are reflected in the net asset value. This practice, commonly referred to as “equalization,” has no effect on the redeeming shareholder or the Fund’s total return, but may reduce the amounts that would otherwise be required to be paid as taxable dividends to the remaining shareholders. It is possible that the Internal Revenue Service (IRS) could challenge the Fund's equalization methodology or calculations, and any such challenge could result in additional tax, interest, or penalties to be paid by the Fund.
Federal Income Taxes
The Fund intends to continue to qualify as a regulated investment company and distribute all of its taxable income in accordance with the requirements of Subchapter M of the Internal Revenue Code. Management has analyzed the Fund’s tax positions taken for all open federal income tax years, generally a three-year period, and has concluded that no provision for federal income tax is required in the Fund’s financial statements. The Fund is not aware of any tax positions for which it is reasonably possible that the total amounts of unrecognized tax benefits will significantly change in the next twelve months.
2. Other Investments and Strategies
Market Risk
The value of the Fund’s portfolio may decrease if the value of one or more issuers in the Fund’s portfolio decreases. Further, regardless of how well individual companies or securities perform, the value of the Fund’s portfolio could also decrease if there are deteriorating economic or market conditions, including, but not limited to, a general decline in prices on the stock markets, a general decline in real estate markets, a decline in commodities prices, or if the market favors different types of securities than the types of securities in which the Fund invests. If the value of the Fund’s portfolio decreases, the Fund’s NAV will also decrease, which means if you sell your shares in the Fund you may lose money. Market risk may affect a single issuer, industry, economic sector, or the market as a whole. The increasing interconnectivity between global economies and financial markets increases the likelihood that events or conditions in one region or financial market may adversely impact issuers in a different country, region or financial market. Social, political, economic and other conditions and events, such as natural disasters, health emergencies (e.g., epidemics and pandemics), terrorism, conflicts, including related sanctions, and social unrest, could reduce consumer demand or economic output, result in market closures, travel restrictions and/or quarantines, and generally have a significant impact on the global economies and financial markets.
• COVID-19 Pandemic. The effects of COVID-19 have contributed to increased volatility in global financial markets and have affected and may continue to affect certain countries, regions, issuers, industries and market sectors more dramatically than others. These conditions and events could have a significant impact on the Fund and its investments,
Janus Henderson Government Money Market Fund
Notes to Financial Statements
the Fund’s ability to meet redemption requests, and the processes and operations of the Fund’s service providers, including the Adviser.
• Russia/Ukraine Invasion. Russia launched a large-scale invasion of Ukraine on February 24, 2022. The extent and duration of the military action, resulting sanctions and resulting future market disruptions in the region are impossible to predict, but could be significant and have a severe adverse effect on the region, including significant negative impacts on the economy and the markets for certain securities and commodities, such as oil and natural gas, as well as other sectors.
Repurchase Agreements
The Fund and other funds advised by the Adviser or its affiliates may transfer daily uninvested cash balances into one or more joint trading accounts. Assets in the joint trading accounts are invested in money market instruments and the proceeds are allocated to the participating funds on a pro rata basis.
Repurchase agreements held by the Fund are fully collateralized, and such collateral is in the possession of the Fund’s custodian or, for tri-party agreements, the custodian designated by the agreement. The collateral is evaluated daily to ensure its market value exceeds the current market value of the repurchase agreements, including accrued interest. In the event of default on the obligation to repurchase, the Fund has the right to liquidate the collateral and apply the proceeds in satisfaction of the obligation. In the event of default or bankruptcy by the other party to the agreement, realization and/or retention of the collateral or proceeds may be subject to legal proceedings.
Sovereign Debt
The Fund may invest in U.S. and non-U.S. government debt securities (“sovereign debt”). Some investments in sovereign debt, such as U.S. sovereign debt, are considered low risk. However, investments in sovereign debt, especially the debt of less developed countries, can involve a high degree of risk, including the risk that the governmental entity that controls the repayment of sovereign debt may not be willing or able to repay the principal and/or to pay the interest on its sovereign debt in a timely manner. A sovereign debtor’s willingness or ability to satisfy its debt obligation may be affected by various factors including, but not limited to, its cash flow situation, the extent of its foreign currency reserves, the availability of foreign exchange when a payment is due, the relative size of its debt position in relation to its economy as a whole, the sovereign debtor’s policy toward international lenders, and local political constraints to which the governmental entity may be subject. Sovereign debtors may also be dependent on expected disbursements from foreign governments, multilateral agencies, and other entities. The failure of a sovereign debtor to implement economic reforms, achieve specified levels of economic performance, or repay principal or interest when due may result in the cancellation of third party commitments to lend funds to the sovereign debtor, which may further impair such debtor’s ability or willingness to timely service its debts. The Fund may be requested to participate in the rescheduling of such sovereign debt and to extend further loans to governmental entities, which may adversely affect the Fund’s holdings. In the event of default, there may be limited or no legal remedies for collecting sovereign debt and there may be no bankruptcy proceedings through which the Fund may collect all or part of the sovereign debt that a governmental entity has not repaid. In addition, to the extent the Fund invests in non-U.S. sovereign debt, it may be subject to currency risk.
Variable and Floating Rate Notes
The Fund also may purchase variable and floating rate demand notes of corporations and other entities, which are unsecured obligations redeemable upon not more than 30 days’ notice. The Fund may purchase variable and floating rate demand notes of U.S. Government issuers or commercial banks. These obligations include master demand notes that permit investment of fluctuating amounts at varying rates of interest pursuant to direct arrangements with the issuer of the instrument. The issuer of these obligations often has the right, after a given period, to prepay the outstanding principal amount of the obligations upon a specified number of days’ notice. These obligations generally are not traded, nor generally is there an established secondary market for these obligations. To the extent a demand note does not have a seven day or shorter demand feature and there is no readily available market for the obligation, it is treated as an illiquid investment. The rate of interest on securities purchased by the Fund may be tied to short-term Treasury or other government securities or indices on securities that are permissible investments of the Fund, as well as other money market rates of interest. The Fund will not purchase securities whose values are tied to interest rates or indices that are not appropriate for the duration and volatility standards of a money market fund.
Counterparties
Fund transactions involving a counterparty are subject to the risk that the counterparty or a third party will not fulfill its obligation to the Fund (“counterparty risk”). Counterparty risk may arise because of the counterparty’s financial condition
Janus Henderson Government Money Market Fund
Notes to Financial Statements
(i.e., financial difficulties, bankruptcy, or insolvency), market activities and developments, or other reasons, whether foreseen or not. A counterparty’s inability to fulfill its obligation may result in significant financial loss to the Fund. The Fund may be unable to recover its investment from the counterparty or may obtain a limited recovery, and/or recovery may be delayed. The extent of the Fund’s exposure to counterparty risk with respect to financial assets and liabilities approximates its carrying value. See the "Offsetting Assets and Liabilities" section of this Note for further details.
The Fund may be exposed to counterparty risk through its investments in certain securities, including, but not limited to, repurchase agreements and debt securities. The Fund intends to enter into financial transactions with counterparties that the Adviser believes to be creditworthy at the time of the transaction. There is always the risk that the Adviser’s analysis of a counterparty’s creditworthiness is incorrect or may change due to market conditions. To the extent that the Fund focuses its transactions with a limited number of counterparties, it will have greater exposure to the risks associated with one or more counterparties.
Offsetting Assets and Liabilities
The Fund presents gross and net information about transactions that are either offset in the financial statements or subject to an enforceable master netting arrangement or similar agreement with a designated counterparty, regardless of whether the transactions are actually offset in the Statement of Assets and Liabilities.
The Offsetting Assets and Liabilities table located in the Schedule of Investments presents gross amounts of recognized assets and/or liabilities and the net amounts after deducting collateral that has been pledged by counterparties or has been pledged to counterparties (if applicable). For corresponding information grouped by type of instrument, see the Fund's Schedule of Investments.
All repurchase agreements are transacted under legally enforceable master repurchase agreements that give the Fund, in the event of default by the counterparty, the right to liquidate securities held and to offset receivables and payables with the counterparty. For financial reporting purposes, the Fund does not offset financial instruments' payables and receivables and related collateral on the Statement of Assets and Liabilities. Repurchase agreements held by the Fund are fully collateralized, and such collateral is in the possession of the Fund’s custodian or, for tri-party agreements, the custodian designated by the agreement. The collateral is evaluated daily to ensure its market value exceeds the current market value of the repurchase agreements, including accrued interest.
3. Investment Advisory Agreements and Other Transactions with Affiliates
The Fund pays the Adviser an investment advisory fee which is calculated daily and paid monthly. The Fund’s contractual investment advisory fee rate (expressed as an annual rate) is 0.20% of its average daily net assets.
The Adviser may voluntarily waive and/or reimburse additional fees to the extent necessary to assist the Fund in attempting to maintain a yield of at least 0.00%. These waivers and reimbursements are voluntary and could change or be terminated at any time at the discretion of the Adviser. There is no guarantee that the Fund will maintain a positive yield. If applicable, amounts waived and/or reimbursed to the Fund by the Adviser are disclosed as “Excess Expense Reimbursement” on the Statement of Operations.
Class D Shares and Class T Shares of the Fund compensate the Adviser at an annual rate of 0.36% and 0.38%, respectively, of average daily net assets for providing certain administration services including, but not limited to, oversight and coordination of the Fund’s service providers, recordkeeping and registration functions and also to pay for costs such as shareholder servicing and custody. These amounts are disclosed as “Administration services fees” on the Statement of Operations. A portion of the Fund’s administration fee is paid to BNP Paribas Financial Services ("BPFS"). BPFS provides certain administrative services to the Fund, including services related to Fund accounting, calculation of the Fund’s daily NAV, and Fund audit, tax, and reporting obligations, pursuant to a sub-administration agreement with the Adviser on behalf of the Fund. The Adviser does not receive any additional compensation, beyond the administration services fee for serving as administrator.
The Board of Trustees has adopted a deferred compensation plan (the “Deferred Plan”) for independent Trustees to elect to defer receipt of all or a portion of the annual compensation they are entitled to receive from the Fund. All deferred fees are credited to an account established in the name of the Trustees. The amounts credited to the account then increase or decrease, as the case may be, in accordance with the performance of one or more of the Janus Henderson funds that are selected by the Trustees. The account balance continues to fluctuate in accordance with the performance of the selected fund or funds until final payment of all amounts are credited to the account. The fluctuation of the account balance is recorded by the Fund as unrealized appreciation/(depreciation) and is included as of June 30,
Janus Henderson Government Money Market Fund
Notes to Financial Statements
2023 on the Statement of Assets and Liabilities in the asset, “Trustees’ deferred compensation,” and liability, “Trustees’ deferred compensation fees.” Additionally, the recorded unrealized appreciation/(depreciation) is included in “Total distributable earnings (loss)” on the Statement of Assets and Liabilities. Deferred compensation expenses for the year ended June 30, 2023 are included in “Trustees’ fees and expenses” on the Statement of Operations. Trustees are allowed to change their designation of mutual funds from time to time. Amounts will be deferred until distributed in accordance with the Deferred Plan. Deferred fees of $426,025 were paid by the Trust to the Trustees under the Deferred Plan during the year ended June 30, 2023.
4. Federal Income Tax
The tax components of capital shown in the table below represent: (1) distribution requirements the Fund must satisfy under the income tax regulations; (2) losses or deductions the Fund may be able to offset against income and gains realized in future years; and (3) unrealized appreciation or depreciation of investments for federal income tax purposes.
Other book to tax differences primarily consist of deferred compensation. The Fund has elected to treat gains and losses on forward foreign currency contracts as capital gains and losses, if applicable. Other foreign currency gains and losses on debt instruments are treated as ordinary income for federal income tax purposes pursuant to Section 988 of the Internal Revenue Code.
| | | | | | | |
| | | | Other Book | Net Tax | |
Undistributed
Ordinary Income | Undistributed
Long-Term Gains | Accumulated
Capital Losses | Loss Deferrals | to Tax
Differences | Appreciation/
(Depreciation) | |
$ 4,180 | $ - | $ - | $ - | $ (9,241) | $ - | |
Income and capital gains distributions are determined in accordance with income tax regulations that may differ from US GAAP. These differences are due to differing treatments for items such as net short-term gains and deferral of wash sale losses. Certain permanent differences such as tax returns of capital and net investment losses noted below have been reclassified to capital.
| | | | | |
For the year ended June 30, 2023 | |
Distributions | | |
From Ordinary Income | From Long-Term Capital Gains | Tax Return of Capital | Net Investment Loss | |
$ 12,936,711 | $ 9,850 | $ - | $ - | |
| | | | | |
For the year ended June 30, 2022 | |
Distributions | | |
From Ordinary Income | From Long-Term Capital Gains | Tax Return of Capital | Net Investment Loss | |
$ 5,416 | $ - | $ - | $ - | |
Permanent book to tax basis differences may result in reclassifications between the components of net assets. These differences have no impact on the results of operations or net assets.
Janus Henderson Government Money Market Fund
Notes to Financial Statements
5. Capital Share Transactions
| | | | | | | |
| | | | | | |
| | Year ended June 30, 2023 | | Year ended June 30, 2022 |
| | Shares | Amount | | Shares | Amount |
| | | | | | | |
Class D Shares: | | | | | |
Shares sold | 138,981,154 | $138,981,797 | | 248,101,255 | $248,101,256 |
Reinvested dividends and distributions | 12,522,215 | 12,522,215 | | 3,743 | 3,744 |
Shares repurchased | (174,520,374) | (174,520,374) | | (184,339,799) | (184,339,800) |
Net Increase/(Decrease) | (23,017,005) | $(23,016,362) | | 63,765,199 | $ 63,765,200 |
Class T Shares: | | | | | |
Shares sold | 9,837,496 | $ 9,837,512 | | 11,702,462 | $ 11,702,461 |
Reinvested dividends and distributions | 272,793 | 272,793 | | 101 | 100 |
Shares repurchased | (12,712,622) | (12,712,622) | | (9,682,645) | (9,682,645) |
Net Increase/(Decrease) | (2,602,333) | $ (2,602,317) | | 2,019,918 | $ 2,019,916 |
6. Subsequent Event
Management has evaluated whether any events or transactions occurred subsequent to June 30, 2023 and through the date of issuance of the Fund’s financial statements and determined that there were no material events or transactions that would require recognition or disclosure in the Fund’s financial statements.
Janus Henderson Government Money Market Fund
Report of Independent Registered Public Accounting Firm
To the Board of Trustees of Janus Investment Fund and Shareholders of Janus Henderson Government Money Market Fund
Opinion on the Financial Statements
We have audited the accompanying statement of assets and liabilities, including the schedule of investments, of Janus Henderson Government Money Market Fund (one of the funds constituting Janus Investment Fund, referred to hereafter as the “Fund”) as of June 30, 2023, the related statement of operations for the year ended June 30, 2023, the statements of changes in net assets for each of the two years in the period ended June 30, 2023, including the related notes, and the financial highlights for each of the five years in the period ended June 30, 2023 (collectively referred to as the “financial statements”). In our opinion, the financial statements present fairly, in all material respects, the financial position of the Fund as of June 30, 2023, the results of its operations for the year then ended, the changes in its net assets for each of the two years in the period ended June 30, 2023 and the financial highlights for each of the five years in the period ended June 30, 2023 in conformity with accounting principles generally accepted in the United States of America.
Basis for Opinion
These financial statements are the responsibility of the Fund’s management. Our responsibility is to express an opinion on the Fund’s financial statements based on our audits. We are a public accounting firm registered with the Public Company Accounting Oversight Board (United States) (PCAOB) and are required to be independent with respect to the Fund in accordance with the U.S. federal securities laws and the applicable rules and regulations of the Securities and Exchange Commission and the PCAOB.
We conducted our audits of these financial statements in accordance with the standards of the PCAOB. Those standards require that we plan and perform the audit to obtain reasonable assurance about whether the financial statements are free of material misstatement, whether due to error or fraud.
Our audits included performing procedures to assess the risks of material misstatement of the financial statements, whether due to error or fraud, and performing procedures that respond to those risks. Such procedures included examining, on a test basis, evidence regarding the amounts and disclosures in the financial statements. Our audits also included evaluating the accounting principles used and significant estimates made by management, as well as evaluating the overall presentation of the financial statements. Our procedures included confirmation of securities owned as of June 30, 2023 by correspondence with the custodian and brokers. We believe that our audits provide a reasonable basis for our opinion.

Denver, Colorado
August 21, 2023
We have served as the auditor of one or more investment companies in Janus Henderson Funds since 1990.
Janus Henderson Government Money Market Fund
Additional Information (unaudited)
Proxy Voting Policies and Voting Record
A description of the policies and procedures that the Fund uses to determine how to vote proxies relating to its portfolio securities is available without charge: (i) upon request, by calling 1-800-525-1093; (ii) on the Fund’s website at janushenderson.com/proxyvoting; and (iii) on the SEC’s website at http://www.sec.gov. Additionally, information regarding the Fund’s proxy voting record for the most recent twelve-month period ended June 30 is also available, free of charge, through janushenderson.com/proxyvoting and from the SEC’s website at http://www.sec.gov.
Monthly Portfolio Holdings
The Fund files its complete holdings in a monthly report on Form N-MFP within 5 business days after each month end. These reports (i) are available on the SEC’s website at http://www.sec.gov; (ii) may be reviewed and copied at the SEC’s Public Reference Room in Washington, D.C. (information on the Public Reference Room may be obtained by calling 1-800-SEC-0330); and (iii) are available without charge, upon request, by calling a Janus Henderson representative at 1-877-335-2687 (toll free) (or 1-800-525-3713 if you hold Class D Shares).
APPROVAL OF ADVISORY AGREEMENTS DURING THE PERIOD
The Trustees of Janus Aspen Series, each of whom serves as an “independent” Trustee (the “Trustees”), oversee the management of each portfolio of Janus Aspen Series (each, a “VIT Portfolio,” and collectively, the “VIT Portfolios”), as well as each fund of Janus Investment Fund (each, a “Fund,” and collectively, the “Funds” and together with the VIT Portfolios, the “Janus Henderson Funds,” and each, a “Janus Henderson Fund”). As required by law, the Trustees determine annually whether to continue the investment advisory agreement for each Janus Henderson Fund.
In connection with their most recent consideration of those agreements for each Janus Henderson Fund, the Trustees received and reviewed information provided by Janus Henderson Investors US LLC (the “Adviser”) in response to requests of the Trustees and their independent legal counsel. They also received and reviewed information and analysis provided by, and in response to requests of, their independent fee consultant. Throughout their consideration of the agreements, the Trustees were advised by their independent legal counsel. The Trustees met with management to consider the agreements, and also met separately in executive session with their independent legal counsel and their independent fee consultant.
At meetings held on November 9-10, 2022 and December 13-14, 2022, the Trustees evaluated the information provided by the Adviser and the independent fee consultant, as well as other information provided by the Adviser and the independent fee consultant during the year. Following such evaluation, the Trustees determined that the overall arrangements between each Janus Henderson Fund and the Adviser were fair and reasonable in light of the nature, extent, and quality of the services provided by the Adviser and its affiliates, the fees charged for those services, and other matters that the Trustees considered relevant in the exercise of their business judgment, and unanimously approved the continuation of the investment advisory agreement for each Janus Henderson Fund for the period from February 1, 2023 through February 1, 2024, subject to earlier termination as provided for in each agreement.
In considering the continuation of those agreements, the Trustees reviewed and analyzed various factors that they determined were relevant, including the factors described below, none of which by itself was considered dispositive. However, the material factors and conclusions that formed the basis for the Trustees’ determination to approve the continuation of the agreements are discussed separately below. Also included is a summary of the independent fee consultant’s conclusions and opinions that arose during, and were included as part of, the Trustees’ consideration of the agreements. “Management fees,” as used herein, reflect actual annual advisory fees and, for the purpose of peer comparisons any administration fees (excluding out of pocket costs), net of any waivers, paid by a fund as a percentage of average net assets.
Nature, Extent and Quality of Services
The Trustees reviewed the nature, extent, and quality of the services provided by the Adviser to the Janus Henderson Funds, taking into account the investment objective, strategies, and policies of each Janus Henderson Fund, and the knowledge the Trustees gained from their regular meetings with management on at least a quarterly basis and their ongoing review of information related to the Janus Henderson Funds. In addition, the Trustees reviewed the resources and key personnel of the Adviser, particularly noting those employees who provide investment and risk management services to the Janus Henderson Funds. The Trustees also considered other services provided to the Janus Henderson
Janus Henderson Government Money Market Fund
Additional Information (unaudited)
Funds by the Adviser, such as managing the execution of portfolio transactions and the selection of broker-dealers for those transactions. The Trustees considered the Adviser’s role as administrator to the Janus Henderson Funds, noting that the Adviser generally does not receive a fee for its services as administrator, but is reimbursed for its out-of-pocket costs. The Trustees considered the role of the Adviser in monitoring adherence to the Janus Henderson Funds’ investment restrictions, providing support services for the Trustees and Trustee committees, and overseeing communications with Janus Henderson Fund shareholders and the activities of other service providers, including monitoring compliance with various policies and procedures of the Janus Henderson Funds and with applicable securities laws and regulations.
In this regard, the independent fee consultant noted that the Adviser provides a number of different services for the Janus Henderson Funds and their shareholders, ranging from investment management services to various other servicing functions, and that, in its view, the Adviser is a capable provider of those services. The independent fee consultant also provided its belief that the Adviser has developed a number of institutional competitive advantages that should enable it to provide superior investment and service performance over the long term.
The Trustees concluded that the nature, extent, and quality of the services provided by the Adviser to each Janus Henderson Fund were appropriate and consistent with the terms of the respective advisory agreements, and that, taking into account steps taken to address those Janus Henderson Funds whose performance lagged that of their peers for certain periods, the Janus Henderson Funds were likely to benefit from the continued provision of those services. They also concluded that the Adviser had sufficient personnel, with the appropriate education and experience, to serve the Janus Henderson Funds effectively and had demonstrated its ability to attract well-qualified personnel.
Performance of the Funds
The Trustees considered the performance results of each Janus Henderson Fund over various time periods. They noted that they considered Janus Henderson Fund performance data throughout the year, including periodic meetings with each Janus Henderson Fund’s portfolio manager(s), and also reviewed information comparing each Janus Henderson Fund’s performance with the performance of comparable fund peer groups identified by Broadridge Financial Solutions, Inc. (“Broadridge”), an independent data provider, and with the Janus Henderson Fund’s benchmark index. In this regard, the independent fee consultant found that the overall Janus Henderson Funds’ performance has been reasonable, noting that: (i) for the 36 months ended May 31, 2022, approximately 38% of the Janus Henderson Funds were in the top two quartiles of their Broadridge peer groups; (ii) for the 36 months ended September 30, 2022, approximately 45% of the Janus Henderson Funds were in the top two quartiles of performance as reported by Morningstar, and (iii) for the 12 months ended September 30, 2022, approximately 55% of the Janus Henderson Funds were in the top two quartiles of performance as reported by Morningstar.
The Trustees considered the performance of each Janus Henderson Fund, noting that performance may vary by share class, and noted the following with respect to the Funds:
Asset Allocation Funds
· For Janus Henderson Global Allocation Fund – Conservative, the Trustees noted that the Fund’s performance was in the third Broadridge quartile for the 36 months ended May 31, 2022 and the bottom Broadridge quartile for the 12 months ended May 31, 2022. The Trustees noted the reasons for the Fund’s underperformance and the steps the Adviser had taken or was taking to improve performance.
· For Janus Henderson Global Allocation Fund – Growth, the Trustees noted that the Fund’s performance was in the bottom Broadridge quartile for the 36 months ended May 31, 2022 and the bottom Broadridge quartile for the 12 months ended May 31, 2022. The Trustees noted the reasons for the Fund’s underperformance and the steps the Adviser had taken or was taking to improve performance.
· For Janus Henderson Global Allocation Fund – Moderate, the Trustees noted that the Fund’s performance was in the bottom Broadridge quartile for the 36 months ended May 31, 2022 and the bottom Broadridge quartile for the 12 months ended May 31, 2022. The Trustees noted the reasons for the Fund’s underperformance and the steps the Adviser had taken or was taking to improve performance.
Fixed-Income Funds
· For Janus Henderson Absolute Return Income Opportunities Fund, the Trustees noted that the Fund’s performance was in the third Broadridge quartile for the 36 months ended May 31, 2022 and the first Broadridge
Janus Henderson Government Money Market Fund
Additional Information (unaudited)
quartile for the 12 months ended May 31, 2022. The Trustees noted the reasons for the Fund’s underperformance, the steps the Adviser had taken or was taking to improve performance, and that the performance trend was improving.
· For Janus Developed World Bond Fund, the Trustees noted that the Fund’s performance was in the bottom Broadridge quartile for the 36 months ended May 31, 2022 and the bottom Broadridge quartile for the 12 months ended May 31, 2022. The Trustees noted the reasons for the Fund’s underperformance and the steps the Adviser had taken or was taking to improve performance.
· For Janus Henderson Flexible Bond Fund, the Trustees noted that the Fund’s performance was in the first Broadridge quartile for the 36 months ended May 31, 2022 and the second Broadridge quartile for the 12 months ended May 31, 2022.
· For Janus Henderson Global Bond Fund, the Trustees noted that the Fund’s performance was in the third Broadridge quartile for the 36 months ended May 31, 2022 and the bottom Broadridge quartile for the 12 months ended May 31, 2022. The Trustees noted the reasons for the Fund’s underperformance and the steps the Adviser had taken or was taking to improve performance.
· For Janus Henderson High-Yield Fund, the Trustees noted that the Fund’s performance was in the third Broadridge quartile for the 36 months ended May 31, 2022 and the bottom Broadridge quartile for the 12 months ended May 31, 2022. The Trustees noted the reasons for the Fund’s underperformance and the steps the Adviser had taken or was taking to improve performance.
· For Janus Henderson Multi-Sector Income Fund, the Trustees noted that the Fund’s performance was in the second Broadridge quartile for the 36 months ended May 31, 2022 and the third Broadridge quartile for the 12 months ended May 31, 2022.
· For Janus Henderson Short Duration Flexible Bond Fund, the Trustees noted that the Fund’s performance was in the third Broadridge quartile for the 36 months ended May 31, 2022 and the bottom Broadridge quartile for the 12 months ended May 31, 2022. The Trustees noted the reasons for the Fund’s underperformance and the steps the Adviser had taken or was taking to improve performance.
Global and International Equity Funds
· For Janus Henderson Asia Equity Fund, the Trustees noted that the Fund’s performance was in the third Broadridge quartile for the 36 months ended May 31, 2022 and the third Broadridge quartile for the 12 months ended May 31, 2022. The Trustees noted the reasons for the Fund’s underperformance, while also noting that the Fund has a performance fee structure that results in lower management fees during periods of underperformance, and the steps the Adviser had taken or was taking to improve performance.
· For Janus Henderson Emerging Markets Fund, the Trustees noted that the Fund’s performance was in the third Broadridge quartile for the 36 months ended May 31, 2022 and the third Broadridge quartile for the 12 months ended May 31, 2022. The Trustees noted the reasons for the Fund’s underperformance and the steps the Adviser had taken or was taking to improve performance.
· For Janus Henderson European Focus Fund, the Trustees noted that the Fund’s performance was in the first Broadridge quartile for the 36 months ended May 31, 2022 and the second Broadridge quartile for the 12 months ended May 31, 2022.
· For Janus Henderson Global Equity Income Fund, the Trustees noted that the Fund’s performance was in the third Broadridge quartile for the 36 months ended May 31, 2022 and the first Broadridge quartile for the 12 months ended May 31, 2022. The Trustees noted the reasons for the Fund’s underperformance, the steps the Adviser had taken or was taking to improve performance, and that the performance trend was improving.
· For Janus Henderson Global Life Sciences Fund, the Trustees noted that the Fund’s performance was in the third Broadridge quartile for the 36 months ended May 31, 2022 and the second Broadridge quartile for the 12 months ended May 31, 2022. The Trustees noted the reasons for the Fund’s underperformance, the steps the Adviser had taken or was taking to improve performance, and that the performance trend was improving.
Janus Henderson Government Money Market Fund
Additional Information (unaudited)
· For Janus Henderson Global Sustainable Equity Fund, the Trustees noted that the Fund’s performance was in the second Broadridge quartile for the 12 months ended May 31, 2022. The Trustees noted that 36 month-end performance was not yet available.
· For Janus Henderson Global Real Estate Fund, the Trustees noted that the Fund’s performance was in the second Broadridge quartile for the 36 months ended May 31, 2022 and the bottom Broadridge quartile for the 12 months ended May 31, 2022.
· For Janus Henderson Global Research Fund, the Trustees noted that the Fund’s performance was in the second Broadridge quartile for the 36 months ended May 31, 2022 and the first Broadridge quartile for the 12 months ended May 31, 2022.
· For Janus Henderson Global Select Fund, the Trustees noted that the Fund’s performance was in the first Broadridge quartile for the 36 months ended May 31, 2022 and the first Broadridge quartile for the 12 months ended May 31, 2022.
· For Janus Henderson Global Technology and Innovation Fund, the Trustees noted that the Fund’s performance was in the second Broadridge quartile for the 36 months ended May 31, 2022 and the second Broadridge quartile for the 12 months ended May 31, 2022.
· For Janus Henderson International Opportunities Fund, the Trustees noted that the Fund’s performance was in the bottom Broadridge quartile for the 36 months ended May 31, 2022 and the third Broadridge quartile for the 12 months ended May 31, 2022. The Trustees noted the reasons for the Fund’s underperformance and the steps the Adviser had taken or was taking to improve performance.
· For Janus Henderson Overseas Fund, the Trustees noted that the Fund’s performance was in the first Broadridge quartile for the 36 months ended May 31, 2022 and the first Broadridge quartile for the 12 months ended May 31, 2022.
· For Janus Henderson Responsible International Dividend Fund (formerly the Janus Henderson Dividend & Income Builder Fund), the Trustees noted that the Fund’s performance was in the bottom Broadridge quartile for the 36 months ended May 31, 2022 and the bottom Broadridge quartile for the 12 months ended May 31, 2022. The Trustees noted the reasons for the Fund’s underperformance and the steps the Adviser had taken or was taking to improve performance.
Money Market Funds
· For Janus Henderson Government Money Market Fund, the Trustees noted that the Fund’s performance was in the third Broadridge quartile for the 36 months ended May 31, 2022 and the bottom Broadridge quartile for the 12 months ended May 31, 2022. The Trustees noted the reasons for the Fund’s underperformance and the steps the Adviser had taken or was taking to improve performance.
· For Janus Henderson Money Market Fund, the Trustees noted that the Fund’s performance was in the third Broadridge quartile for the 36 months ended May 31, 2022 and the bottom Broadridge quartile for the 12 months ended May 31, 2022. The Trustees noted the reasons for the Fund’s underperformance and the steps the Adviser had taken or was taking to improve performance.
Multi-Asset Funds
· For Janus Henderson Adaptive Global Allocation Fund, the Trustees noted that the Fund’s performance was in bottom Broadridge quartile for the 36 months ended May 31, 2022 and the second Broadridge quartile for the 12 months ended May 31, 2022. The Trustees noted the reasons for the Fund’s underperformance, the steps the Adviser had taken or was taking to improve performance, and that the performance trend was improving.
· For Janus Henderson Balanced Fund, the Trustees noted that the Fund’s performance was in the first Broadridge quartile for the 36 months ended May 31, 2022 and the first Broadridge quartile for the 12 months ended May 31, 2022.
Janus Henderson Government Money Market Fund
Additional Information (unaudited)
U.S. Equity Funds
· For Janus Henderson Adaptive Risk Managed U.S. Equity Fund, the Trustees noted that the Fund’s performance was in the bottom Broadridge quartile for the 36 months ended May 31, 2022 and the second Broadridge quartile for the 12 months ended May 31, 2022. The Trustees noted the reasons for the Fund’s underperformance, the steps the Adviser had taken or were taking to improve performance, and that the performance trend was improving.
· For Janus Henderson Contrarian Fund, the Trustees noted that the Fund’s performance was in the first Broadridge quartile for the 36 months ended May 31, 2022 and the bottom Broadridge quartile for the 12 months ended May 31, 2022.
· For Janus Henderson Enterprise Fund, the Trustees noted that the Fund’s performance was in the second Broadridge quartile for the 36 months ended May 31, 2022 and the first Broadridge quartile for the 12 months ended May 31, 2022.
· For Janus Henderson Forty Fund, the Trustees noted that the Fund’s performance was in the third Broadridge quartile for the 36 months ended May 31, 2022 and the bottom Broadridge quartile for the 12 months ended May 31, 2022. The Trustees noted the reasons for the Fund’s underperformance and the steps the Adviser had taken or was taking to improve performance.
· For Janus Henderson Growth and Income Fund, the Trustees noted that the Fund’s performance was in the bottom Broadridge quartile for the 36 months ended May 31, 2022 and the first Broadridge quartile for the 12 months ended May 31, 2022. The Trustees noted the reasons for the Fund’s underperformance, the steps the Adviser had taken or was taking to improve performance, and that the performance trend was improving.
· For Janus Henderson Mid Cap Value Fund, the Trustees noted that the Fund’s performance was in the bottom Broadridge quartile for the 36 months ended May 31, 2022 and the second Broadridge quartile for the 12 months ended May 31, 2022. The Trustees noted the reasons for the Fund’s underperformance, while also noting that the Fund has a performance fee structure that results in lower management fees during periods of underperformance, the steps the Adviser had taken or was taking to improve performance, and that the performance trend was improving.
· For Janus Henderson Research Fund, the Trustees noted that the Fund’s performance was in the third Broadridge quartile for the 36 months ended May 31, 2022 and the third Broadridge quartile for the 12 months ended May 31, 2022. The Trustees noted the reasons for the Fund’s underperformance, while also noting that the Fund has a performance fee structure that results in lower management fees during periods of underperformance and the steps the Adviser had taken or was taking to improve performance.
· For Janus Henderson Small Cap Value Fund, the Trustees noted that the Fund’s performance was in the bottom Broadridge quartile for the 36 months ended May 31, 2022 and the second Broadridge quartile for the 12 months ended May 31, 2022. The Trustees noted the reasons for the Fund’s underperformance, while also noting that the Fund has a performance fee structure that results in lower management fees during periods of underperformance, the steps the Adviser had taken or was taking to improve performance, and that the performance trend was improving.
· For Janus Henderson Small-Mid Cap Value Fund, the Trustees noted that the Fund’s performance was in the bottom Broadridge quartile for the 36 months ended May 31, 2022 and the second Broadridge quartile for the 12 months ended May 31, 2022. The Trustees noted the reasons for the Fund’s underperformance, while also noting that the Fund has a performance fee structure that results in lower management fees during periods of underperformance, the steps the Adviser had taken or was taking to improve performance, and that the performance trend is improving.
· For Janus Henderson Triton Fund, the Trustees noted that the Fund’s performance was in the bottom Broadridge quartile for the 36 months ended May 31, 2022 and the second Broadridge quartile for the 12 months ended May 31, 2022. The Trustees noted the reasons for the Fund’s underperformance, the steps the Adviser had taken or was taking to improve performance, and that the performance trend was improving.
· For Janus Henderson Venture Fund, the Trustees noted that the Fund’s performance was in the bottom Broadridge quartile for the 36 months ended May 31, 2022 and the second Broadridge quartile for the 12 months ended May
Janus Henderson Government Money Market Fund
Additional Information (unaudited)
31, 2022. The Trustees noted the reasons for the Fund’s underperformance, the steps the Adviser had taken or was taking to improve performance, and that the performance trend was improving.
In consideration of each Janus Henderson Fund’s performance, the Trustees concluded that, taking into account the factors relevant to performance, as well as other considerations, including steps taken to improve performance, as applicable, the Janus Henderson Fund’s performance warranted continuation of such Janus Henderson Fund’s investment advisory agreement.
Costs of Services Provided
The Trustees examined information regarding the fees and expenses of each Janus Henderson Fund in comparison to similar information for other comparable funds as provided by Broadridge, an independent data provider. They also reviewed an analysis of that information provided by their independent fee consultant. The independent fee consultant provided its belief that the management fees charged by the Adviser to each of the Janus Henderson Funds under the current investment advisory and administration agreements are reasonable in relation to the services provided by the Adviser. The independent fee consultant found: (1) the total expenses and management fees of the Janus Henderson Funds to be reasonable relative to other comparable mutual funds; (2) the total expenses, on average, were 6% under the average total expenses of the respective Broadridge peer group; and (3) the management fees for the Janus Henderson Funds, on average, were 5% under the average management fees for the respective Broadridge peer group. The Trustees also considered the total expenses for each share class of each Janus Henderson Fund compared to the average total expenses for its Broadridge Expense Group and to average total expenses for its Broadridge Expense Universe.
For Janus Henderson Funds with three or more years of performance history, the independent fee consultant also performed a systematic “focus list” analysis of expenses which assessed fund fees in the context of fund performance being delivered. Based on this analysis, the independent fee consultant found that the combination of service quality/performance and expenses on these individual Janus Henderson Funds was reasonable in light of performance trends, performance histories, changes in portfolio management, relative average net asset levels, and the existence of performance fees, breakpoints, and/or expense waivers on such Janus Henderson Funds.
The Trustees considered the methodology used by the Adviser in determining compensation payable to portfolio managers, the competitive environment for investment management talent, and the competitive market for mutual funds in different distribution channels.
The Trustees also reviewed management fees charged by the Adviser to comparable separate account clients and to comparable non-affiliated funds subadvised by the Adviser (for which the Adviser provides only or primarily portfolio management services). Although in most instances subadvisory and separate account fee rates for various investment strategies were lower than management fee rates for Janus Henderson Funds having a similar strategy, the Trustees considered that the Adviser noted that, under the terms of the management agreements with the Janus Henderson Funds, the Adviser performs significant additional services for the Janus Henderson Funds that it does not provide to those other clients, including administration services, oversight of the Janus Henderson Funds’ other service providers, Trustee support, regulatory compliance and numerous other services, and that, in serving the Janus Henderson Funds, the Adviser assumes many legal risks and other costs that it does not assume in servicing its other clients. Moreover, the Trustees noted that the independent fee consultant found that: (1) the management fees the Adviser charges to the Janus Henderson Funds are reasonable in relation to the management fees the Adviser charges to funds subadvised by the Adviser and to the fees the Adviser charges to its institutional separate account clients; (2) these subadvised and institutional separate accounts have different service and infrastructure needs and operate in markets very different from the retail fund market; (3) Janus Henderson mutual fund investors enjoy reasonable fees relative to the fees charged in these other markets; and (4) as part of its 2022 review, 9 of 11 Janus Henderson Funds have lower management fees than similar funds subadvised by the Adviser. The Trustees noted that for the two Janus Henderson Funds that did not, management fees for each were under the average of its 15(c) peer group.
The Trustees considered the fees for each Janus Henderson Fund for its fiscal year ended in 2021 and noted the following with regard to each Janus Henderson Fund’s total expenses, net of applicable fee waivers (the Fund’s “total expenses”) as reflected in the comparative information provided by Broadridge:
Janus Henderson Government Money Market Fund
Additional Information (unaudited)
Asset Allocation Funds
· For Janus Henderson Global Allocation Fund – Conservative, the Trustees noted that, although the Fund’s total expenses exceeded the peer group average for certain share classes, overall the Fund’s total expenses were reasonable. The Trustees also noted that the Adviser has contractually agreed to limit the Fund’s expenses.
· For Janus Henderson Global Allocation Fund – Growth, the Trustees noted that, although the Fund’s total expenses exceeded the peer group average for certain share classes, overall the Fund’s total expenses were reasonable. The Trustees also noted that the Adviser has contractually agreed to limit the Fund’s expenses, although this limit did not apply because the Fund’s total expenses as shown were below the applicable fee limit.
· For Janus Henderson Global Allocation Fund – Moderate, the Trustees noted that, although the Fund’s total expenses exceeded the peer group average for one share class, overall the Fund’s total expenses were reasonable. The Trustees also noted that the Adviser has contractually agreed to limit the Fund’s expenses.
Fixed-Income Funds
· For Janus Henderson Absolute Return Income Opportunities Fund, the Trustees noted that, although the Fund’s total expenses exceeded the peer group average for certain share classes, overall the Fund’s total expenses were reasonable. The Trustees also noted that the Adviser has contractually agreed to limit the Fund’s expenses.
· For Janus Henderson Developed World Bond Fund, the Trustees noted that, although the Fund’s total expenses exceeded the peer group average for one share class, overall the Fund’s total expenses were reasonable. The Trustees also noted that the Adviser has contractually agreed to limit the Fund’s expenses.
· For Janus Henderson Flexible Bond Fund, the Trustees noted that, although the Fund’s total expenses exceeded the peer group average for certain share classes, overall the Fund’s total expenses were reasonable. The Trustees also noted that the Adviser has contractually agreed to limit the Fund’s expenses, although this limit did not apply because the Fund’s total expenses as shown were below the applicable fee limit.
· For Janus Henderson Global Bond Fund, the Trustees noted that, although the Fund’s total expenses exceeded the peer group average for certain share classes, overall the Fund’s total expenses were reasonable. The Trustees also noted that the Adviser has contractually agreed to limit the Fund’s expenses.
· For Janus Henderson High-Yield Fund, the Trustees noted that, although the Fund’s total expenses exceeded the peer group average for certain share classes, overall the Fund’s total expenses were reasonable. The Trustees also noted that the Adviser has contractually agreed to limit the Fund’s expenses.
· For Janus Henderson Multi-Sector Income Fund, the Trustees noted that, although the Fund’s total expenses exceeded the peer group average for certain share classes, overall the Fund’s total expenses were reasonable. The Trustees also noted that the Adviser has contractually agreed to limit the Fund’s expenses.
· For Janus Henderson Short Duration Flexible Bond Fund, the Trustees noted that, although the Fund’s total expenses exceeded the peer group average for certain share classes, overall the Fund’s total expenses were reasonable. The Trustees also noted that the Adviser has contractually agreed to limit the Fund’s expenses.
Global and International Equity Funds
· For Janus Henderson Asia Equity Fund, the Trustees noted that, although the Fund’s total expenses exceeded the peer group average for certain share classes, overall the Fund’s total expenses were reasonable. The Trustees also noted that the Adviser has contractually agreed to limit the Fund’s expenses.
· For Janus Henderson Emerging Markets Fund, the Trustees noted that, although the Fund’s total expenses exceeded the peer group average for certain share classes, overall the Fund’s total expenses were reasonable. The Trustees also noted that the Adviser has contractually agreed to limit the Fund’s expenses.
· For Janus Henderson European Focus Fund, the Trustees noted that, although the Fund’s total expenses exceeded the peer group average for one share class, overall the Fund’s expenses were reasonable. The Trustees also noted that the Adviser has contractually agreed to limit the Fund’s expenses.
· For Janus Henderson Global Equity Income Fund, the Trustees noted that, although the Fund’s total expenses exceeded the peer group average for one share class, overall the Fund’s total expenses were reasonable. The
Janus Henderson Government Money Market Fund
Additional Information (unaudited)
Trustees also noted that the Adviser has contractually agreed to limit the Fund’s expenses, although this limit did not apply because the Fund’s total expenses as shown were below the applicable fee limit.
· For Janus Henderson Global Life Sciences Fund, the Trustees noted that the Fund’s total expenses were below the peer group average for all share classes.
· For Janus Henderson Global Real Estate Fund, the Trustees noted that, although the Fund’s total expenses exceeded the peer group average for certain share classes, overall the Fund’s total expenses were reasonable. The Trustees also noted that the Adviser has contractually agreed to limit the Fund’s expenses, although this limit did not apply because the Fund’s total expenses as shown were below the applicable fee limit.
· For Janus Henderson Global Research Fund, the Trustees noted that, although the Fund’s total expenses exceeded the peer group average for one share class, overall the Fund’s total expenses were reasonable. The Trustees also noted that the Adviser has contractually agreed to limit the Fund’s expenses, although this limit did not apply because the Fund’s total expenses as shown were below the applicable fee limit.
· For Janus Henderson Global Select Fund, the Trustees noted that, although the Fund’s total expenses exceeded the peer group average for certain share classes, overall the Fund’s total expenses were reasonable. The Trustees also noted that the Adviser has contractually agreed to limit the Fund’s expenses.
· For Janus Henderson Global Sustainable Equity Fund, the Trustees noted that, although the Fund’s total expenses exceeded the peer group average for certain share classes, overall the Fund’s expenses were reasonable. The Trustees also noted that the Adviser has contractually agreed to limit the Fund’s expenses.
· For Janus Henderson Global Technology and Innovation Fund, the Trustees noted that the Fund’s total expenses were below the peer group average for all share classes.
· For Janus Henderson International Opportunities Fund, the Trustees noted that, although the Fund’s total expenses exceeded the peer group average for certain share classes, overall the Fund’s expenses were reasonable. The Trustees also noted that the Adviser has contractually agreed to limit the Fund’s expenses.
· For Janus Henderson Overseas Fund, the Trustees noted that although the Fund’s total expenses exceeded the peer group average for certain share classes, overall the Fund’s total expenses were reasonable. The Trustees also noted that the Adviser has contractually agreed to limit the Fund’s expenses, although this limit did not apply because the Fund’s total expenses as shown were below the applicable fee limit.
· For Janus Henderson Responsible International Dividend Fund (formerly the Janus Henderson Dividend & Income Builder Fund), the Trustees noted that, although the Fund’s total expenses exceeded the peer group for one share class, overall the Fund’s total expenses were reasonable. The Trustees also noted that the Adviser has contractually agreed to limit the Fund’s expenses.
Money Market Funds
· For Janus Henderson Government Money Market Fund, the Trustees noted that the Fund’s total expenses were below the peer group average for all share classes.
· For Janus Henderson Money Market Fund, the Trustees noted that the Fund’s total expenses were below the peer group average for all share classes.
Multi-Asset Funds
· For Janus Henderson Adaptive Global Allocation Fund, the Trustees noted that the Fund’s total expenses were below the peer group average for all share classes.
· For Janus Henderson Balanced Fund, the Trustees noted that, although the Fund’s total expenses exceeded the peer group average for certain share classes, overall the Fund’s total expenses were reasonable. The Trustees also noted that the Adviser has contractually agreed to limit the Fund’s expenses, although this limit did not apply because the Fund’s total expenses as shown were below the applicable fee limit.
Janus Henderson Government Money Market Fund
Additional Information (unaudited)
U.S. Equity Funds
· For Janus Henderson Adaptive Risk Managed U.S. Equity Fund, the Trustees noted that, although the Fund’s total expenses exceeded the peer group average for certain share classes, overall the Fund’s total expenses were reasonable. The Trustees also noted that the Adviser has contractually agreed to limit the Fund’s expenses, although this limit did not apply because the Fund’s total expenses as shown were below the applicable fee limit.
· For Janus Henderson Contrarian Fund, the Trustees noted that, although the Fund’s total expenses exceeded the peer group average for all share classes, overall the Fund’s total expenses were reasonable. The Trustees also noted that the Adviser had contractually agreed to limit the Fund’s expenses.
· For Janus Henderson Enterprise Fund, the Trustees noted that, although the Fund’s total expenses exceeded the peer group average for certain share classes, overall the Fund’s total expenses were reasonable. The Trustees also noted that the Adviser has contractually agreed to limit the Fund’s expenses, although this limit did not apply because the Fund’s total expenses as shown were below the applicable fee limit.
· For Janus Henderson Forty Fund, the Trustees noted that, although the Fund’s total expenses exceeded the peer group average for certain share classes, overall the Fund’s total expenses were reasonable. The Trustees also noted that the Adviser has contractually agreed to limit the Fund’s expenses, although this limit did not apply because the Fund’s total expenses as shown were below the applicable fee limit.
· For Janus Henderson Growth and Income Fund, the Trustees noted that, although the Fund’s total expenses exceeded the peer group average for certain share classes, overall the Fund’s total expenses were reasonable. The Trustees also noted that the Adviser has contractually agreed to limit the Fund’s expenses, although this limit did not apply because the Fund’s total expenses as shown were below the applicable fee limit.
· For Janus Henderson Mid Cap Value Fund, the Trustees noted that the Fund’s total expenses were below the peer group average for all share classes.
· For Janus Henderson Research Fund, the Trustees noted that, although the Fund’s total expenses exceeded the peer group average for certain share classes, overall the Fund’s total expenses were reasonable. The Trustees also noted that the Adviser has contractually agreed to limit the Fund’s expenses.
· For Janus Henderson Small Cap Value Fund, the Trustees noted that, although the Fund’s total expenses exceeded the peer group average for one share class, overall the Fund’s total expenses were reasonable. The Trustees also noted that the Adviser has contractually agreed to limit the Fund’s expenses, although this limit did not apply because the Fund’s total expenses as shown were below the applicable fee limit.
· For Janus Henderson Small-Mid Cap Value Fund, the Trustees noted that the Fund’s total expenses were below the peer group average for all share classes.
· For Janus Henderson Triton Fund, the Trustees noted that, although the Fund’s total expenses exceeded the peer group average for one share class, overall the Fund’s total expenses were reasonable. The Trustees also noted that the Adviser has contractually agreed to limit the Fund’s expenses, although this limit did not apply because the Fund’s total expenses as shown were below the applicable fee limit.
· For Janus Henderson Venture Fund, the Trustees noted that although the Fund’s total expenses exceeded the peer group average for one share class, overall the Fund’s total expenses were reasonable. The Trustees also noted that the Adviser has contractually agreed to limit the Fund’s expenses, although this limit did not apply because the Fund’s total expenses as shown were below the applicable fee limit.
The Trustees reviewed information on the overall profitability to the Adviser and its affiliates from their relationships with the Janus Henderson Funds, and considered profitability data of other publicly traded mutual fund advisers. The Trustees recognized that profitability comparisons among fund managers are difficult because of the variation in the type of comparative information that is publicly available, and the profitability of any fund manager is affected by numerous factors, including the organizational structure of the particular fund manager, differences in complex size, difference in product mix, difference in types of business (mutual fund, institutional and other), differences in the types of funds and other accounts it manages, possible other lines of business, the methodology for allocating expenses and the fund manager’s capital structure and cost of capital.
Janus Henderson Government Money Market Fund
Additional Information (unaudited)
Additionally, the Trustees considered the estimated profitability to the Adviser from the investment management services it provided to each Janus Henderson Fund. In their review, the Trustees considered whether the Adviser receive adequate incentives and resources to manage the Janus Henderson Funds effectively. In reviewing profitability, the Trustees noted that the estimated profitability for an individual Janus Henderson Fund is necessarily a product of the allocation methodology utilized by the Adviser to allocate its expenses as part of the estimated profitability calculation. In this regard, the Trustees noted that the independent fee consultant found as part of its 2022 review that (1) the expense allocation methodology and rationales utilized by the Adviser were reasonable and (2) no clear correlation exists between expense allocations and operating margins. The Trustees also considered that the estimated profitability for an individual Janus Henderson Fund was influenced by a number of factors, including not only the allocation methodology selected, but also the presence of fee waivers and expense caps, and whether the Janus Henderson Fund’s investment management agreement contained breakpoints or a performance fee component. The Trustees determined, after taking into account these factors, among others, that the Adviser’s estimated profitability with respect to each Janus Henderson Fund was not unreasonable in relation to the services provided, and that the variation in the range of such estimated profitability among the Janus Henderson Funds was not a material factor in the Board’s approval of the reasonableness of any Janus Henderson Fund’s investment management fees.
The Trustees concluded that the management fees payable by each Janus Henderson Fund to the Adviser were reasonable in relation to the nature, extent, and quality of the services provided, taking into account the fees charged by other advisers for managing comparable mutual funds with similar strategies, the fees the Adviser charges to other clients, and, as applicable, the impact of fund performance on management fees payable by the Janus Henderson Funds. The Trustees also concluded that each Janus Henderson Fund’s total expenses were reasonable, taking into account the size of the Janus Henderson Fund, the quality of services provided by the Adviser, the investment performance of the Janus Henderson Fund, and any expense limitations agreed to or provided by the Adviser.
Economies of Scale
The Trustees considered information about the potential for the Adviser to realize economies of scale as the assets of the Janus Henderson Funds increase. They noted that their independent fee consultant published a report to the Trustees in June 2022 which provided its research and analysis into economies of scale. They also noted that, although many Janus Henderson Funds pay advisory fees at a fixed base rate as a percentage of net assets, without any breakpoints or performance fees, their independent fee consultant concluded that 75% of these Janus Henderson Funds’ have contractual management fees (gross of waivers) below their Broadridge Expense Group averages. The Trustees also noted the following from the independent fee consultant’s report: (1) that 31% of Janus Henderson Funds had management fee breakpoints in place whereby investors pay lower management fees as fund AUM increases; (2) that 29% of Janus Henderson Funds have low flat-rate fees and performance fees where the Adviser is incentivized to invest in resources which drive Janus Henderson Fund performance; and (3) that 39% of Janus Henderson Funds have low flat-rate fees versus peers where investors pay low fixed fees when the Janus Henderson Fund is small/midsized and higher fees when the Janus Henderson Fund grows in assets. The Trustees also noted that the Janus Henderson Funds share directly in economies of scale through the significant investments made by the Adviser and its affiliates related to services provided to the Funds and the lower charges of third-party service providers that are based in part on the combined scale of all of the Janus Henderson Funds.
The Trustees also considered the independent fee consultant’s conclusion that, given the limitations of various analytical approaches to economies of scale and their conflicting results, it is difficult to analytically confirm or deny the existence of economies of scale in the Janus Henderson complex. In this regard, the independent consultant concluded that (1) to the extent there were economies of scale at the Adviser, the Adviser’s general strategy of setting fixed management fees below peers appeared to share any such economies with investors even on smaller Janus Henderson Funds which have not yet achieved those economies and (2) by setting lower fixed fees from the start on these Janus Henderson Funds, the Adviser appeared to be investing to increase the likelihood that these Janus Henderson Funds will grow to a level to achieve any economies of scale that may exist. Further, the independent fee consultant provided its belief that Janus Henderson Fund investors are well-served by the fee levels and performance fee structures in place on the Janus Henderson Funds in light of any economies of scale that may be present at the Adviser.
Based on all of the information reviewed, including the recent and past research and analysis conducted by the Trustees’ independent fee consultant, the Trustees concluded that the current fee structure of each Janus Henderson Fund was reasonable and that the current rates of fees do reflect a sharing between the Adviser and the Janus
Janus Henderson Government Money Market Fund
Additional Information (unaudited)
Henderson Fund of any economies of scale that may be present at the current asset level of the Janus Henderson Fund.
Other Benefits to the Adviser
The Trustees also considered benefits that accrue to the Adviser and its affiliates from their relationships with the Janus Henderson Funds. They recognized that two affiliates of the Adviser separately serve the Janus Henderson Funds as transfer agent and distributor, respectively, and the transfer agent receives compensation directly from the non-money market Janus Henderson Funds for services provided, and that such compensation contributes to the overall profitability of the Adviser and its affiliates that results from their relationship with the Janus Henderson Funds. The Trustees also considered the Adviser’s past and proposed use of commissions paid by the Janus Henderson Funds on portfolio brokerage transactions to obtain proprietary and third-party research products and services benefiting the Janus Henderson Fund and/or other clients of the Adviser and/or the Adviser. The Trustees concluded that the Adviser’s use of these types of client commission arrangements to obtain proprietary and third-party research products and services was consistent with regulatory requirements and guidelines and was likely to benefit each Janus Henderson Fund. The Trustees also concluded that, other than the services provided by the Adviser and its affiliates pursuant to the agreements and the fees to be paid by each Janus Henderson Fund therefor, the Janus Henderson Funds and the Adviser may potentially benefit from their relationship with each other in other ways. They concluded that the Adviser and its affiliates share directly in economies of scale through the lower charges of third-party service providers that are based in part on the combined scale of the Janus Henderson Funds and other clients serviced by the Adviser and its affiliates. They also concluded that the Adviser benefits from the receipt of research products and services acquired through commissions paid on portfolio transactions of the Janus Henderson Funds and that the Janus Henderson Funds benefit from the Adviser’s receipt of those products and services as well as research products and services acquired through commissions paid by other clients of the Adviser. They further concluded that the success of any Janus Henderson Fund could attract other business to the Adviser or other Janus Henderson Funds, and that the success of the Adviser could enhance the Adviser’s ability to serve the Janus Henderson Funds.
Janus Henderson Government Money Market Fund
Liquidity Risk Management Program (unaudited)
Liquidity Risk Management Program
Rule 22e-4 under the Investment Company Act of 1940, as amended (the “Liquidity Rule”), requires open-end funds (but not money market funds) to adopt and implement a written liquidity risk management program (the “LRMP”) that is reasonably designed to assess and manage liquidity risk, which is the risk that a fund could not meet redemption requests without significant dilution of remaining investors’ interest in the fund. The Fund has implemented a LRMP, which incorporates the following elements: (i) assessment, management, and periodic review of liquidity risk; (ii) classification of portfolio holdings; (iii) the establishment and monitoring of a highly liquid investment minimum, as applicable; (iv) a 15% limitation on a Fund’s illiquid investments; (v) redemptions in-kind; and (vi) board oversight.
The Trustees of the Fund (the “Trustees”) have designated Janus Henderson Investors US LLC, the Fund’s investment adviser (the “Adviser”), as the Program Administrator for the LRMP responsible for administering the LRMP and carrying out the specific responsibilities of the LRMP. A working group comprised of various teams within the Adviser’s business is responsible for administering the LRMP and carrying out the specific responsibilities of different aspects of the LRMP (the “Liquidity Risk Working Group”). In assessing each Fund’s liquidity risk, the Liquidity Risk Working Group periodically considers, as relevant, factors including (i) the liquidity of a Fund’s portfolio investments during normal and reasonably foreseeable stressed conditions; (ii) whether a Fund’s investment strategy is appropriate for an open-end fund; (iii) the extent to which a Fund’s strategy involves a relatively concentrated portfolio or large positions in any issuer; (iv) a Fund’s use of borrowing for investment purposes; and (v) a Fund’s use of derivatives.
The Liquidity Rule requires the Trustees to review at least annually a written report provided by the Program Administrator that addresses the operation of the LRMP and assesses its adequacy and the effectiveness of its implementation, including, if applicable, the operation of the highly liquid investment minimum, and any material changes to the LRMP (the “Program Administrator Report”). At a meeting held on March 15, 2023, the Adviser provided the Program Administrator Report to the Trustees which covered the operation of the LRMP from January 1, 2022 through December 31, 2022 (the “Reporting Period”).
The Program Administrator Report discussed the operation and effectiveness of the LRMP during the Reporting Period. Among other things, the Program Administrator Report indicated that there were no material changes to the LRMP during the Reporting Period, although there were certain methodology adjustments implemented relating to a change in data provider. Additionally, the findings presented in the Program Administrator Report indicated that the LRMP operated adequately during the Reporting Period. These findings included that the Fund was able to meet redemptions during the normal course of business during the Reporting Period. The Program Administrator Report also stated that the Fund did not exceed the 15% limit on illiquid assets during the Reporting Period, that the Fund held primarily highly liquid assets, and was considered to be a primarily highly liquid fund during the Reporting Period. Also included among the Program Administrator Report’s findings was the determination that the Fund’s investment strategy remains appropriate for an open-end fund. In addition, the Adviser expressed its belief in the Program Administrator Report that the LRMP is reasonably designed and adequate to assess and manage the Fund’s liquidity risk, considering the Fund’s particular risks and circumstances, and includes policies and procedures reasonably designed to implement each required component of the Liquidity Rule.
There can be no assurance that the LRMP will achieve its objectives in the future. Please refer to your Fund’s prospectus for more information regarding the risks to which an investment in the Fund may be subject.
Janus Henderson Government Money Market Fund
Useful Information About Your Fund Report (unaudited)
Performance Overviews
Average annual total returns are quoted for a Fund with more than one year of performance history. Average annual total return is calculated by taking the growth or decline in value of an investment over a period of time, including reinvestment of dividends and distributions, then calculating the annual compounded percentage rate that would have produced the same result had the rate of growth been constant throughout the period. Average annual total return does not reflect the deduction of taxes that a shareholder would pay on Fund distributions or redemptions of Fund shares.
Pursuant to federal securities rules, expense ratios shown in the performance chart reflect subsidized (if applicable) and unsubsidized ratios. The total annual fund operating expenses ratio is gross of any fee waivers, reflecting the Fund’s unsubsidized expense ratio. The net annual fund operating expenses ratio (if applicable) includes contractual waivers of Janus Capital and reflects the Fund’s subsidized expense ratio. Ratios may be higher or lower than those shown in the “Financial Highlights” in this report.
Schedule of Investments
Following the performance overview section is the Fund’s Schedule of Investments. This schedule reports the types of securities held in the Fund on the last day of the reporting period. Securities are usually listed by type (common stock, corporate bonds, U.S. Government obligations, etc.) and by industry classification (banking, communications, insurance, etc.). Holdings are subject to change without notice.
The value of each security is quoted as of the last day of the reporting period. The value of securities denominated in foreign currencies is converted into U.S. dollars.
If the Fund invests in foreign securities, it will also provide a summary of investments by country. This summary reports the Fund exposure to different countries by providing the percentage of securities invested in each country. The country of each security represents the country of risk. The Fund’s Schedule of Investments relies upon the industry group and country classifications published by Bloomberg and/or MSCI Inc.
Tables listing details of individual forward currency contracts, futures, written options, swaptions, and swaps follow the Fund’s Schedule of Investments (if applicable).
Statement of Assets and Liabilities
This statement is often referred to as the “balance sheet.” It lists the assets and liabilities of the Fund on the last day of the reporting period.
The Fund’s assets are calculated by adding the value of the securities owned, the receivable for securities sold but not yet settled, the receivable for dividends declared but not yet received on securities owned, and the receivable for Fund shares sold to investors but not yet settled. The Fund’s liabilities include payables for securities purchased but not yet settled, Fund shares redeemed but not yet paid, and expenses owed but not yet paid. Additionally, there may be other assets and liabilities such as unrealized gain or loss on forward currency contracts.
The section entitled “Net Assets Consist of” breaks down the components of the Fund’s net assets. Because the Fund must distribute substantially all earnings, you will notice that a significant portion of net assets is shareholder capital.
The last section of this statement reports the net asset value (“NAV”) per share on the last day of the reporting period. The NAV is calculated by dividing the Fund’s net assets for each share class (assets minus liabilities) by the number of shares outstanding.
Statement of Operations
This statement details the Fund’s income, expenses, realized gains and losses on securities and currency transactions, and changes in unrealized appreciation or depreciation of Fund holdings.
The first section in this statement, entitled “Investment Income,” reports the dividends earned from securities and interest earned from interest-bearing securities in the Fund.
The next section reports the expenses incurred by the Fund, including the advisory fee paid to the investment adviser, transfer agent fees and expenses, and printing and postage for mailing statements, financial reports and prospectuses. Expense offsets and expense reimbursements, if any, are also shown.
Janus Henderson Government Money Market Fund
Useful Information About Your Fund Report (unaudited)
The last section lists the amounts of realized gains or losses from investment and foreign currency transactions, and changes in unrealized appreciation or depreciation of investments and foreign currency-denominated assets and liabilities. The Fund will realize a gain (or loss) when it sells its position in a particular security. A change in unrealized gain (or loss) refers to the change in net appreciation or depreciation of the Fund during the reporting period. “Net Realized and Unrealized Gain/(Loss) on Investments” is affected both by changes in the market value of Fund holdings and by gains (or losses) realized during the reporting period.
Statements of Changes in Net Assets
These statements report the increase or decrease in the Fund’s net assets during the reporting period. Changes in the Fund’s net assets are attributable to investment operations, dividends and distributions to investors, and capital share transactions. This is important to investors because it shows exactly what caused the Fund’s net asset size to change during the period.
The first section summarizes the information from the Statement of Operations regarding changes in net assets due to the Fund’s investment operations. The Fund’s net assets may also change as a result of dividend and capital gains distributions to investors. If investors receive their dividends and/or distributions in cash, money is taken out of the Fund to pay the dividend and/or distribution. If investors reinvest their dividends and/or distributions, the Fund’s net assets will not be affected.
The reinvestment of dividends and distributions is included under “Capital Share Transactions.” “Capital Shares” refers to the money investors contribute to the Fund through purchases or withdrawals via redemptions. The Fund’s net assets will increase and decrease in value as investors purchase and redeem shares from the Fund.
Financial Highlights
This schedule provides a per-share breakdown of the components that affect the Fund’s NAV for current and past reporting periods as well as total return, asset size, ratios, and portfolio turnover rate.
The first line in the table reflects the NAV per share at the beginning of the reporting period. The next line reports the net investment income/(loss) per share. Following is the per share total of net gains/(losses), realized and unrealized. Per share dividends and distributions to investors are then subtracted to arrive at the NAV per share at the end of the period. The next line reflects the total return for the period. The total return may include adjustments in accordance with generally accepted accounting principles required at the period end for financial reporting purposes. As a result, the total return may differ from the total return reflected for individual shareholder transactions. Also included are ratios of expenses and net investment income to average net assets.
The Fund’s expenses may be reduced through expense offsets and expense reimbursements. The ratios shown reflect expenses before and after any such offsets and reimbursements.
The ratio of net investment income/(loss) summarizes the income earned less expenses, divided by the average net assets of the Fund during the reporting period. Do not confuse this ratio with the Fund’s yield. The net investment income ratio is not a true measure of the Fund’s yield because it does not take into account the dividends distributed to the Fund’s investors.
The next figure is the portfolio turnover rate, which measures the buying and selling activity in the Fund. Portfolio turnover is affected by market conditions, changes in the asset size of the Fund, fluctuating volume of shareholder purchase and redemption orders, the nature of the Fund’s investments, and the investment style and/or outlook of the portfolio manager(s) and/or investment personnel. A 100% rate implies that an amount equal to the value of the entire portfolio was replaced once during the fiscal year; a 50% rate means that an amount equal to the value of half the portfolio is traded in a year; and a 200% rate means that an amount equal to the value of the entire portfolio is traded every six months.
Janus Henderson Government Money Market Fund
Designation Requirements (unaudited)
For federal income tax purposes, the Fund designated the following for the year ended June 30, 2023:
| | |
| | |
Section 163(j) Interest Dividend | 100% |
Capital Gain Distributions | $9,850 |
Janus Henderson Government Money Market Fund
Trustees and Officers (unaudited)
The following are the Trustees and officers of the Trust, together with a brief description of their principal occupations during the last five years (principal occupations for certain Trustees may include periods over five years). The Fund’s Statement of Additional Information includes additional information about the Trustees and officers and is available, without charge, by calling 1-877-335-2687.
Each Trustee has served in that capacity since he or she was originally elected or appointed. The Trustees do not serve a specified term of office. Each Trustee will hold office until the termination of the Trust or his or her earlier death, resignation, retirement, incapacity, or removal. Under the Fund’s Governance Procedures and Guidelines, the policy is for Trustees to retire no later than the end of the calendar year in which the Trustee turns 75. The Trustees review the Fund’s Governance Procedures and Guidelines from time to time and may make changes they deem appropriate. The Fund’s Nominating and Governance Committee will consider nominees for the position of Trustee recommended by shareholders. Shareholders may submit the name of a candidate for consideration by the Committee by submitting their recommendations to the Trust’s Secretary. Each Trustee is currently a Trustee of one other registered investment company advised by the Adviser: Janus Aspen Series. Collectively, these two registered investment companies consist of 49 series or funds referred to herein as the Fund Complex.
The Trust’s officers are elected annually by the Trustees for a one-year term. Certain officers also serve as officers of Janus Aspen Series. Certain officers of the Fund may also be officers and/or directors of the Adviser. Except as otherwise disclosed, Fund officers receive no compensation from the Fund, except for the Fund’s Chief Compliance Officer, as authorized by the Trustees.
| | | | | | |
TRUSTEES |
Name, Address, and Age | Positions Held with the Trust | Length of Time Served | Principal Occupations During the Past Five Years | Number of Portfolios/Funds in Fund Complex Overseen by Trustee | Other Directorships Held by Trustee During the Past Five Years |
Independent Trustees | | | | |
Alan A. Brown
151 Detroit Street
Denver, CO 80206
DOB: 1962 | Chairman
Trustee | 5/22-Present
1/13-Present | Principal, Curam Holdings LLC (since 2018). Formerly, Executive Vice President, Institutional Markets, of Black Creek Group (private equity real estate investment management firm) (2012-2018), Executive Vice President and Co-Head, Global Private Client Group (2007-2010), Executive Vice President, Mutual Funds (2005-2007), and Chief Marketing Officer (2001-2005) of Nuveen Investments, Inc. (asset management). | 49 | Advisory Board Member of AEW Core Property Trust (open-end property fund) (since 2020), and Director of WTTW (PBS affiliate) (since 2003). Formerly, Director of MotiveQuest LLC (strategic social market research company) (2003-2016), Director of Nuveen Global Investors LLC (2007-2011), Director of Communities in Schools (2004-2010), and Director of Mutual Fund Education Alliance (until 2010). |
Janus Henderson Government Money Market Fund
Trustees and Officers (unaudited)
| | | | | | |
TRUSTEES |
Name, Address, and Age | Positions Held with the Trust | Length of Time Served | Principal Occupations During the Past Five Years | Number of Portfolios/Funds in Fund Complex Overseen by Trustee | Other Directorships Held by Trustee During the Past Five Years |
Independent Trustees | | | | |
Cheryl D. Alston
151 Detroit Street
Denver, CO 80206
DOB: 1966 | Trustee | 8/22-Present | Executive Director and Chief Investment Officer, Employees’ Retirement Fund of the City of Dallas (since 2004). | 49 | Director of Blue Cross Blue Shield of Kansas City (a not-for-profit health insurance provider) (since 2016) and Director of Global Life Insurance (life and supplemental health insurance provider) (since 2017). Formerly, Director of Federal Home Loan Bank of Dallas (2017-2021). |
Janus Henderson Government Money Market Fund
Trustees and Officers (unaudited)
| | | | | | |
TRUSTEES |
Name, Address, and Age | Positions Held with the Trust | Length of Time Served | Principal Occupations During the Past Five Years | Number of Portfolios/Funds in Fund Complex Overseen by Trustee | Other Directorships Held by Trustee During the Past Five Years |
Independent Trustees | | | | |
Janus Henderson Government Money Market Fund
Trustees and Officers (unaudited)
| | | | | | |
William D. Cvengros
151 Detroit Street
Denver, CO 80206
DOB: 1948 | Trustee | 1/11-Present | Chief Executive Officer of SJC Capital, LLC (a personal investment company and consulting firm) (since 2002). Formerly, Chief Executive Officer and President of PIMCO Advisors Holdings L.P. (a publicly traded investment management firm) (1994-2000), and Chief Investment Officer (1987-1994) and Vice Chairman and Director (1990-1994) of Pacific Life Insurance Company (a mutual life insurance and annuity company) (1987-1994). | 49 | Member, Limited Partner Advisory Committee, Karmel Capital Fund III (later stage growth fund) (since 2022), Member of the Investment Committee for the Orange County Community Foundation (a grantmaking foundation) (since 2020), Advisory Board Member, RevOZ Fund LP and related funds (real estate investments for opportunity zones) (since 2020), and Advisory Board Member, Innovate Partners Emerging Growth and Equity Fund I (early stage venture capital fund) (since 2014). Formerly, Managing Trustee of National Retirement Partners Liquidating Trust (2013-2016), Chairman, National Retirement Partners, Inc. (formerly a network of advisors to 401(k) plans) (2005-2013), Director of Prospect Acquisition Corp. (a special purpose acquisition corporation) (2007-2009), Director of RemedyTemp, Inc. (temporary help services company) (1996-2006), and Trustee of PIMCO Funds Multi-Manager Series (1990-2000) and Pacific Life Variable Life & Annuity Trusts (1987-1994). |
Janus Henderson Government Money Market Fund
Trustees and Officers (unaudited)
| | | | | | |
TRUSTEES |
Name, Address, and Age | Positions Held with the Trust | Length of Time Served | Principal Occupations During the Past Five Years | Number of Portfolios/Funds in Fund Complex Overseen by Trustee | Other Directorships Held by Trustee During the Past Five Years |
Independent Trustees | | | | |
Raudline Etienne
151 Detroit Street
Denver, CO 80206
DOB: 1965 | Trustee | 6/16-Present | Founder, Daraja Capital (advisory and investment firm) (since 2016). Formerly, Senior Vice President and Senior Advisor, Albright Stonebridge Group LLC (global strategy firm) (2011-2021), and Deputy Comptroller and Chief Investment Officer, New York State Common Retirement Fund (public pension fund) (2008-2011). | 49 | Member of the Investment Committee for Cooper Union (private college) (since 2021) and Director of Brightwood Capital Advisors, LLC (since 2014). Formerly, Board Member, Van Alen Institute (nonprofit architectural and design organization) (2019-2022). |
Darrell B. Jackson
151 Detroit Street
Denver, CO 80206
DOB: 1958 | Trustee | 8/22-Present | President and Chief Executive Officer, The Efficace Group Inc. (since 2018). Formerly, President and Chief Executive Officer, Seaway Bank and Trust Company (community bank) (2014-2015), and Executive Vice President and Co-President, Wealth Management (2009-2014), and several senior positions, including Group Executive, Senior Vice President, and Vice President (1995-2009) of Northern Trust Company (financial services company) (1995-2014). | 49 | Director of Amalgamated Financial Corp (bank) (since August 2021), Director of YR Media (a not-for-profit production company) (since 2021), and Director of Gray-Bowen-Scott (transportation project consulting firm) (since April 2020). Formerly, Director of Delaware Place Bank (closely held commercial bank) (2016-2018) and Director of Seaway Bank and Trust Company (2014-2015). |
Janus Henderson Government Money Market Fund
Trustees and Officers (unaudited)
| | | | | | |
TRUSTEES |
Name, Address, and Age | Positions Held with the Trust | Length of Time Served | Principal Occupations During the Past Five Years | Number of Portfolios/Funds in Fund Complex Overseen by Trustee | Other Directorships Held by Trustee During the Past Five Years |
Independent Trustees | | | | |
William F. McCalpin
151 Detroit Street
Denver, CO 80206
DOB: 1957 | Trustee | 6/02-Present | Chief Executive Officer, muun chi LLC (organic food business) (since 2022) and Independent Consultant (since 2019). Formerly, Chief Operating Officer, muun chi LLC (2020-2022), Managing Partner, Impact Investments, Athena Capital Advisors LLC (independent registered investment advisor) (2016-2019), Managing Director, Holos Consulting LLC (provides consulting services to foundations and other nonprofit organizations) (2009-2016), Chief Executive Officer, Imprint Capital Advisors (impact investment firm) (2013-2015), and Executive Vice President and Chief Operating Officer of The Rockefeller Brothers Fund (a private family foundation) (1998-2006). | 49 | Chairman of the Board and Trustee of The Investment Fund for Foundations Investment Program (TIP) (consisting of 1 fund) (since 2008). Formerly, Director of the F.B. Heron Foundation (a private grantmaking foundation) (2006-2022), and Director of Mutual Fund Directors Forum (a non-profit organization serving independent directors of U.S. mutual funds) (2016-2021). |
Janus Henderson Government Money Market Fund
Trustees and Officers (unaudited)
| | | | | | |
TRUSTEES |
Name, Address, and Age | Positions Held with the Trust | Length of Time Served | Principal Occupations During the Past Five Years | Number of Portfolios/Funds in Fund Complex Overseen by Trustee | Other Directorships Held by Trustee During the Past Five Years |
Independent Trustees | | | | |
Gary A. Poliner
151 Detroit Street
Denver, CO 80206
DOB: 1953 | Trustee | 6/16-Present | Retired. Formerly, President (2010-2013) of Northwestern Mutual Life Insurance Company. | 49 | Director of MGIC Investment Corporation (private mortgage insurance) (since 2013). Formerly, Director, West Bend Mutual Insurance Company (property/casualty insurance) (2013-2021), Trustee of Northwestern Mutual Life Insurance Company (2010-2013) and Director of Frank Russell Company (global asset management firm) (2008-2013). |
Diane L. Wallace
151 Detroit Street
Denver, CO 80206
DOB: 1958 | Trustee | 6/17-Present | Retired. Formerly, Chief Operating Officer, Senior Vice President-Operations, and Chief Financial Officer for Driehaus Capital Management, LLC (1988-2006) and Treasurer for Driehaus Mutual Funds (1996-2002). | 49 | Formerly, Director of Family Service of Lake County (2019-2021), Independent Trustee, Henderson Global Funds (13 portfolios) (2015-2017), Independent Trustee, State Farm Associates’ Funds Trust, State Farm Mutual Fund Trust, and State Farm Variable Product Trust (28 portfolios) (2013-2017). |
Janus Henderson Government Money Market Fund
Trustees and Officers (unaudited)
| | | | |
OFFICERS |
Name, Address, and Age | Positions Held with the Trust | Term of Office* and Length of Time Served | Principal Occupations During the Past Five Years |
Vincent Ahn
151 Detroit Street
Denver, CO 80206
DOB: 1987 | Executive Vice President and Co-Portfolio Manager
Janus Henderson Government Money Market Fund | 11/22-Present | Portfolio Manager for other Janus Henderson accounts. |
Garrett Strum
151 Detroit Street
Denver, CO 80206
DOB: 1981 | Executive Vice President and Co-Portfolio Manager
Janus Henderson Government Money Market Fund | 5/17-Present | Portfolio Manager for other Janus Henderson accounts and Analyst for the Adviser. |
Michelle Rosenberg
151 Detroit Street
Denver, CO 80206
DOB: 1973 | President and Chief Executive Officer | 9/22-Present | General Counsel and Corporate Secretary of Janus Henderson Investors (since 2018). Formerly, Interim President and Chief Executive Officer of the Trust and Janus Aspen Series (2022), Senior Vice President and Head of Legal, North America of Janus Henderson Investors (2017-2018) and Deputy General Counsel of Janus Henderson US (Holdings) Inc. (2015-2018). |
Kristin Mariani
151 Detroit Street
Denver, CO 80206
DOB: 1966 | Vice President and Chief Compliance Officer | 7/20-Present | Head of Compliance, North America at Janus Henderson Investors (since September 2020) and Chief Compliance Officer at Janus Henderson Investors US LLC (since September 2017). Formerly, Anti-Money Laundering Officer for the Trust and Janus Aspen Series (July 2020-December 2022), Global Head of Investment Management Compliance at Janus Henderson Investors (February 2019-August 2020), Vice President, Head of Global Distribution Compliance and Chief Compliance Officer at Janus Henderson Distributors US LLC (May 2017-September 2017), Vice President, Compliance at Janus Henderson US (Holdings) Inc., Janus Henderson Investors US LLC, and Janus Henderson Distributors US LLC (2009-2017). |
Janus Henderson Government Money Market Fund
Trustees and Officers (unaudited)
| | | | |
OFFICERS |
Name, Address, and Age | Positions Held with the Trust | Term of Office* and Length of Time Served | Principal Occupations During the Past Five Years |
Jesper Nergaard
151 Detroit Street
Denver, CO 80206
DOB: 1962 | Chief Financial Officer
Vice President, Treasurer, and Principal Accounting Officer | 3/05-Present
2/05-Present | Head of U.S. Fund Administration, Janus Henderson Investors and Janus Henderson Services US LLC. |
Abigail J. Murray
151 Detroit Street
Denver, CO 80206
DOB: 1975 | Vice President, Chief Legal Counsel, and Secretary | 12/20-Present | Managing Counsel (since 2020). Formerly, Senior Counsel for Invesco Ltd. (2017-2020), and Vice President and Senior Counsel, ALPS Fund Services, Inc. and Assistant General Counsel, ALPS Advisors, Inc. (2015-2017). |
Ciaran Askin
151 Detroit Street
Denver, CO 80206
DOB: 1978 | Anti-Money Laundering Officer | 12/22-Present | Global Head of Financial Crime, Janus Henderson Investors (since 2022). Formerly, Global Head of Financial Crime for Invesco Ltd. (2017-2022). |
* Officers are elected at least annually by the Trustees for a one-year term and may also be elected from time to time by the Trustees for an interim period. |
Janus Henderson Government Money Market Fund
Notes
NotesPage1
Janus Henderson Government Money Market Fund
Notes
NotesPage2
Janus Henderson Government Money Market Fund
Notes
NotesPage3
| | | | | | | | |
| | | | | |

| | | | |
This report is submitted for the general information of shareholders of the Fund. It is not an offer or solicitation for the Fund and is not authorized for distribution to prospective investors unless preceded or accompanied by an effective prospectus. |
Janus Henderson is a trademark of Janus Henderson Group plc or one of its subsidiaries. © Janus Henderson Group plc Janus Henderson Distributors US LLC Janus Henderson Group is the ultimate parent of Janus Henderson Distributors US LLC |
| | | | 125-02-93025 08-23 |
| | | |
| | | |
| | | ANNUAL REPORT June 30, 2023 |
| | |
| | Janus Henderson High-Yield Fund |
| | |
| | Janus Investment Fund |
| |
| | | |
| | | HIGHLIGHTS · Portfolio management perspective · Investment strategy behind your fund · Fund performance, characteristics
and holdings |
Table of Contents
Janus Henderson High-Yield Fund
Janus Henderson High-Yield Fund (unaudited)
| | | | | | |
| | | 
Tom Ross co-portfolio manager | 
Seth Meyer co-portfolio manager | 
Brent Olson co-portfolio manager |
| | | |
PERFORMANCE OVERVIEW
For the 12-month period ended June 30, 2023, the Janus Henderson High-Yield Fund’s Class I shares returned 7.10% compared with a 9.06% return for the Fund’s benchmark, the Bloomberg U.S. Corporate High Yield Bond Index.
MARKET ENVIRONMENT
While the Bloomberg U.S. Aggregate Bond Index declined 0.94% over the period, it was a different story for high-yield corporates, with the Bloomberg U.S. Corporate High Yield Bond Index rising 9.06%.
The Treasury yield curve became more inverted, and yields rose across the board. The Federal Reserve (Fed) consistently raised rates to combat inflation before taking a hawkish pause in June 2023 to evaluate the impact of its prior rate hikes. However, the dot plot projection released with the Fed Minutes implied two incremental rate increases before the end of the year.
Rising investor concerns about an economic hard landing pressured returns in the last six months of 2022. However, these concerns dissipated in 2023 as gross domestic product (GDP) growth exceeded expectations, inflation moderated, and the labor market consistently showed signs of resilience. As a result, expectations for a soft landing increased and risk assets rallied in the back half of the 12-month period.
The yield on the 10-year U.S. Treasury ended June 2023 at 3.84% relative to 3.01% in June of last year. Over the past 12 months, corporate high-yield credit spreads tightened 179 basis points to 3.90%.
PERFORMANCE DISCUSSION
Relative underperformance was driven primarily by our more defensive positioning versus the benchmark during the period. We continue to maintain a slightly defensive stance as we think an economic slowdown appears more likely in light of a hawkish Fed and tighter borrowing conditions due to recent banking sector stress.
During the fiscal year, we raised the overall credit quality of the Fund by increasing our overweight to BB and B holdings, as we expect wider dispersion in returns between the CCC segment and higher-rated securities. If an economic slowdown does unfold, higher defaults are likely to impact CCC bonds to a greater degree, with a commensurate widening in spreads. Conversely, we expect the BB and B segments to be relatively more affected by rates than credit risk. Considering our view that most of the move up in rates is in the rearview mirror, we think rate moves should underpin relative outperformance for higher-rated bonds, and we have positioned the portfolio accordingly.
Small allocations to common stock and commercial mortgage-backed securities (CMBS) also detracted. And while our regional banking allocation detracted, we consolidated our banking exposure in those banks that we believe have the strongest business models. A small allocation to Silicon Valley Bank detracted, but we moved swiftly to close out all positions and exit the Fund’s exposure to the bank.
Security selection within high-yield corporates contributed, helping to offset relative underperformance. On an issuer basis, Catalent Pharmaceuticals proved to be a notable contributor, as it rallied on potential buyout interest from Danaher Corp, while cruise line operator Carnival benefitted from robust travel demand. Chart Industries was another individual contributor, as the equipment manufacturer benefitted from a vibrant liquid natural gas (LNG) industry and a softening in investor concerns regarding the firm’s amount of leverage.
Janus Henderson High-Yield Fund (unaudited)
DERIVATIVES USAGE
The Fund made use of derivative instruments in the form of credit swap contracts to manage credit risk during the period. Use of derivatives detracted for the 12-month period ended June 30, 2023.
OUTLOOK
The U.S. economy continues to show resilience in the face of higher interest rates. As the Fed hiking cycle marches deeper into its second year, the recession many predicted is yet to materialize. That said, investors should exercise caution – we believe an economic slowdown remains a distinct possibility. Monetary policy works in long and variable lags and, to a large extent, we are yet to feel the full impact of prior rate hikes. Additionally, recent stress in the banking sector is resulting in tighter lending conditions, which is likely to be an additional headwind.
On the inflation front, we have seen some promising signs of cooling prices. Still, we think the move from the present level of around 4% to the Fed’s target of 2% might end up being slower and bumpier than markets are expecting. In our view, it seems unlikely that inflation would come back down to 2% without an economic slowdown. So, while the probability thereof has increased, we still think the chance of a soft landing remains low.
As the economic environment becomes more challenging, we expect the divergence of clear winners and losers. Therefore, we view a research-driven approach as more important than ever. While we do anticipate some spread widening if economic conditions continue to deteriorate, we believe high yield spread levels are supported by several mitigating factors: the somewhat lower expected default rate (3%-4%) relative to prior periods of credit stress, the higher quality of the high-yield index versus history (BB rated issuers now make up almost 50% of the high yield index), and the limited new issuance calendar.
The Bloomberg U.S. Corporate High Yield Bond Index now offers yields around 8.5% – some of the highest we’ve seen since the Global Financial Crisis. While the outlook is uncertain and we continue to exercise caution, we believe high yield offers an attractive income opportunity for long-term investors prepared to weather any near-term volatility.
Thank you for your investment in the Janus Henderson High-Yield Fund.
Any risk management process discussed includes an effort to monitor and manage risk which should not be confused with and does not imply low risk or the ability to control certain risk factors.
Bloomberg U.S. Aggregate Bond Index is a broad-based measure of the investment grade, US dollar-denominated, fixed-rate taxable bond market.
A yield curve plots the yields (interest rate) of bonds with equal credit quality but differing maturity dates. Typically bonds with longer maturities have higher yields.
An inverted yield curve occurs when short-term yields are higher than long-term yields.
The FOMC dot plot is a chart that summarizes the FOMC's outlook for the federal funds rate.
10-Year Treasury Yield is the interest rate on U.S. Treasury bonds that will mature 10 years from the date of purchase.
Credit Spread is the difference in yield between securities with similar maturity but different credit quality. Widening spreads generally indicate deteriorating creditworthiness of corporate borrowers, and narrowing indicate improving.
Basis point (bp) equals 1/100 of a percentage point. 1 bp = 0.01%, 100 bps = 1%.
Credit quality ratings reflect the middle rating received from Moody’s, Standard & Poor’s and Fitch, where all three agencies have provided a rating. If only two agencies rate a security, the lowest rating is used. If only one agency rates a security, that rating is used. Ratings are measured on a scale that ranges from AAA (highest) to D (lowest).
Important Notice – Tailored Shareholder Reports
Effective January 24, 2023, the Securities and Exchange Commission (the “SEC”) adopted rule and form amendments that require mutual funds and exchange-traded funds to provide shareholders with streamlined annual and semi-annual shareholder reports that highlight key information. Other information, including financial statements, that currently appears in shareholder reports will be made available online, delivered free of charge to shareholders upon request, and filed with the SEC. The first tailored shareholder report for the Fund will be for the reporting period ending June 30, 2024. Currently, management is evaluating the impact of the rule and form amendments on the content of the Fund’s current shareholder reports.
Janus Henderson High-Yield Fund (unaudited)
Fund At A Glance
June 30, 2023
| | | |
Fund Profile | | |
30-day SEC Yield* | Without
Reimbursement | With
Reimbursement |
Class A Shares NAV | 2.86% | 2.86% |
Class A Shares MOP | 2.72% | 2.72% |
Class C Shares** | 2.29% | 2.29% |
Class D Shares | 3.26% | 3.27% |
Class I Shares | 3.30% | 3.30% |
Class N Shares | 3.39% | 3.39% |
Class R Shares | 2.62% | 2.63% |
Class S Shares | 2.87% | 2.88% |
Class T Shares | 3.14% | 3.14% |
Weighted Average Maturity | 5.8 Years |
Average Effective Duration*** | 3.6 Years |
* Yield will fluctuate. | | |
** Does not include the 1.00% contingent deferred sales charge. |
*** A theoretical measure of price volatility. | |
| | |
Ratings† Summary - (% of Total Investments) | |
A | 0.5% |
BBB | 1.9% |
BB | 45.0% |
B | 36.8% |
CCC | 8.0% |
Not Rated | 3.2% |
Other | 4.6% |
† Credit ratings provided by Standard & Poor's (S&P), an independent credit rating agency. Credit ratings range from AAA (highest) to D (lowest) based on S&P's measures. Further information on S&P's rating methodology may be found at www.standardandpoors.com. Other rating agencies may rate the same securities differently. Ratings are relative and subjective and are not absolute standards of quality. Credit quality does not remove market risk and is subject to change. "Not Rated" securities are not rated by S&P, but may be rated by other rating agencies and do not necessarily indicate low quality. "Other" includes cash equivalents, equity securities, and certain derivative instruments. |
Significant Areas of Investment - (% of Net Assets)

| | | | | | |
Asset Allocation - (% of Net Assets) | |
Corporate Bonds | | 88.8% | |
Investments Purchased with Cash Collateral from Securities Lending | | 4.2% | |
Asset-Backed/Commercial Mortgage-Backed Securities | | 3.2% | |
Investment Companies | | 2.9% | |
Common Stocks | | 1.7% | |
Bank Loans and Mezzanine Loans | | 0.8% | |
Convertible Corporate Bonds | | 0.7% | |
Preferred Stocks | | 0.3% | |
Convertible Preferred Stocks | | 0.2% | |
Other | | (2.8)% |
| | | 100.0% |
Janus Henderson High-Yield Fund (unaudited)
Performance
| |
See important disclosures on the next page. |

| | | | | | | | | | | |
| | | | | | | | | |
| | | | | | | | | |
Average Annual Total Return - for the periods ended June 30, 2023 | | | Prospectus Expense Ratios |
| | One
Year | Five
Year | Ten
Year | Since
Inception* | | | Total Annual Fund
Operating Expenses‡ | Net Annual Fund
Operating Expenses‡ |
Class A Shares at NAV | | 6.99% | 2.19% | 3.33% | 6.26% | | | 0.98% | 0.98% |
Class A Shares at MOP | | 1.89% | 1.19% | 2.83% | 6.07% | | | | |
Class C Shares at NAV | | 6.24% | 1.48% | 2.62% | 5.51% | | | 1.73% | 1.70% |
Class C Shares at CDSC | | 5.24% | 1.48% | 2.62% | 5.51% | | | | |
Class D Shares | | 7.23% | 2.41% | 3.56% | 6.39% | | | 0.76% | 0.76% |
Class I Shares | | 7.10% | 2.43% | 3.61% | 6.42% | | | 0.72% | 0.72% |
Class N Shares | | 7.37% | 2.56% | 3.71% | 6.45% | | | 0.63% | 0.63% |
Class R Shares | | 6.41% | 1.72% | 2.90% | 5.79% | | | 1.41% | 1.38% |
Class S Shares | | 6.83% | 2.02% | 3.17% | 6.06% | | | 1.28% | 1.13% |
Class T Shares | | 7.12% | 2.31% | 3.47% | 6.34% | | | 0.87% | 0.87% |
Bloomberg U.S. Corporate High-Yield Bond Index | | 9.06% | 3.36% | 4.43% | 6.39% | | | | |
Morningstar Quartile - Class T Shares | | 4th | 3rd | 3rd | 1st | | | | |
Morningstar Ranking - based on total returns for High Yield Bond Funds | | 540/690 | 438/620 | 302/527 | 22/187 | | | | |
Returns quoted are past performance and do not guarantee future results; current performance may be lower or higher. Investment returns and principal value will vary; there may be a gain or loss when shares are sold. For the most recent month-end performance call 800.668.0434 (or 800.525.3713 if you hold shares directly with Janus Henderson) or visit janushenderson.com/performance (or janushenderson.com/allfunds if you hold shares directly with Janus Henderson).
Maximum Offering Price (MOP) returns include the maximum sales charge of 4.75%. Net Asset Value (NAV) returns exclude this charge, which would have reduced returns.
CDSC returns include a 1% contingent deferred sales charge (CDSC) on Shares redeemed within 12 months of purchase. Net Asset Value (NAV) returns exclude this charge, which would have reduced returns.
For certain periods, the Fund’s performance may reflect the effects of expense waivers.
Janus Henderson High-Yield Fund (unaudited)
Performance
Performance may be affected by risks that include those associated with foreign and emerging markets, fixed income securities, high-yield and high-risk securities, undervalued, overlooked and smaller capitalization companies, real estate related securities including Real Estate Investment Trusts (REITs), Environmental, Social and Governance (ESG) factors, non-diversification, portfolio turnover, derivatives, short sales, initial public offerings (IPOs) and potential conflicts of interest. Each product has different risks. Please see the prospectus for more information about risks, holdings and other details.
Returns include reinvestment of all dividends and distributions and do not reflect the deduction of taxes that a shareholder would pay on Fund distributions or redemptions of Fund shares. The returns do not include adjustments in accordance with generally accepted accounting principles required at the period end for financial reporting purposes.
Class A Shares, Class C Shares, Class R Shares, and Class S Shares commenced operations on July 6, 2009. Performance shown for each class for periods prior to July 6, 2009, reflects the performance of the Fund's Class J Shares, the initial share class (renamed Class T Shares effective February 16, 2010), calculated using the fees and expenses of each respective share class, without the effect of any fee and expense limitations or waivers.
Class D Shares commenced operations on February 16, 2010. Performance shown for periods prior to February 16, 2010, reflects the performance of the Fund's former Class J Shares, calculated using the fees and expenses in effect during the periods shown, net of any applicable fee and expense limitations or waivers.
Class I Shares of the Fund commenced operations on July 6, 2009. Performance shown for periods prior to July 6, 2009, reflects the performance of the Fund's former Class J Shares, calculated using the fees and expenses of Class J Shares, net of any applicable fee and expense limitations or waivers.
Class N Shares of the Fund commenced operations on May 31, 2012. Performance shown for periods prior to May 31, 2012, reflects the performance of the Fund's Class T Shares, calculated using the fees and expenses of Class T Shares, net of any applicable fee and expense limitations or waivers.
If each share class of the Fund had been available during periods prior to its commencement, the performance shown may have been different. The performance shown for periods following the Fund’s commencement of each share class reflects the fees and expenses of each respective share class, net of any applicable fee and expense limitations or waivers. Please refer to the Fund’s prospectuses for further details concerning historical performance.
Ranking is for the share class shown only; other classes may have different performance characteristics. When an expense waiver is in effect, it may have a material effect on the total return, and therefore the ranking for the period.
© 2023 Morningstar, Inc. All Rights Reserved.
There is no assurance that the investment process will consistently lead to successful investing.
See Notes to Schedule of Investments and Other Information for index definitions.
Index performance does not reflect the expenses of managing a portfolio as an index is unmanaged and not available for direct investment.
See “Useful Information About Your Fund Report.”
*The Fund’s inception date – December 29, 1995
‡ As stated in the prospectus. Net expense ratios reflect the expense waiver, if any, contractually agreed to for at least a one-year period commencing on October 28, 2022. This contractual waiver may be terminated or modified only at the discretion of the Board of Trustees. See Financial Highlights for actual expense ratios during the reporting period.
Janus Henderson High-Yield Fund (unaudited)
Expense Examples
As a shareholder of the Fund, you incur two types of costs: (1) transaction costs, such as sales charges (loads) on purchase payments (applicable to Class A Shares only); and (2) ongoing costs, including management fees; 12b-1 distribution and shareholder servicing fees; transfer agent fees and expenses payable pursuant to the Transfer Agency Agreement; and other Fund expenses. This example is intended to help you understand your ongoing costs (in dollars) of investing in the Fund and to compare these costs with the ongoing costs of investing in other mutual funds. To do so, compare this 5% hypothetical example with the 5% hypothetical examples that appear in the shareholder reports of the other funds. The example is based upon an investment of $1,000 invested at the beginning of the period and held for the six-months indicated, unless noted otherwise in the table and footnotes below.
Actual Expenses
The information in the table under the heading “Actual” provides information about actual account values and actual expenses. You may use the information in these columns, together with the amount you invested, to estimate the expenses that you paid over the period. Simply divide your account value by $1,000 (for example, an $8,600 account value divided by $1,000 = 8.6), then multiply the result by the number in the appropriate column for your share class under the heading entitled “Expenses Paid During Period” to estimate the expenses you paid on your account during the period.
Hypothetical Example for Comparison Purposes
The information in the table under the heading “Hypothetical (5% return before expenses)” provides information about hypothetical account values and hypothetical expenses based upon the Fund’s actual expense ratio and an assumed rate of return of 5% per year before expenses, which is not the Fund’s actual return. The hypothetical account values and expenses may not be used to estimate the actual ending account balance or expenses you paid for the period. You may use this information to compare the ongoing costs of investing in the Fund and other funds. To do so, compare this 5% hypothetical example with the 5% hypothetical examples that appear in the shareholder reports of the other funds. Additionally, for an analysis of the fees associated with an investment in any share class or other similar funds, please visit www.finra.org/fundanalyzer.
Please note that the expenses shown in the table are meant to highlight your ongoing costs only and do not reflect any transaction costs. These fees are fully described in the Fund’s prospectuses. Therefore, the hypothetical examples are useful in comparing ongoing costs only, and will not help you determine the relative total costs of owning different funds. In addition, if these transaction costs were included, your costs would have been higher.
| | | | | | | | | | | |
| | | | | | | | |
| | | Actual | | Hypothetical
(5% return before expenses) | |
| Beginning
Account
Value
(1/1/23) | Ending
Account
Value
(6/30/23) | Expenses
Paid During
Period
(1/1/23 - 6/30/23)† | | Beginning
Account
Value
(1/1/23) | Ending
Account
Value
(6/30/23) | Expenses
Paid During
Period
(1/1/23 - 6/30/23)† | Net Annualized
Expense Ratio
(1/1/23 - 6/30/23) |
Class A Shares | $1,000.00 | $1,053.40 | $4.94 | | $1,000.00 | $1,019.98 | $4.86 | 0.97% |
Class C Shares | $1,000.00 | $1,048.30 | $8.43 | | $1,000.00 | $1,016.56 | $8.30 | 1.66% |
Class D Shares | $1,000.00 | $1,052.90 | $3.87 | | $1,000.00 | $1,021.03 | $3.81 | 0.76% |
Class I Shares | $1,000.00 | $1,053.10 | $3.77 | | $1,000.00 | $1,021.12 | $3.71 | 0.74% |
Class N Shares | $1,000.00 | $1,053.60 | $3.21 | | $1,000.00 | $1,021.67 | $3.16 | 0.63% |
Class R Shares | $1,000.00 | $1,049.80 | $7.01 | | $1,000.00 | $1,017.95 | $6.90 | 1.38% |
Class S Shares | $1,000.00 | $1,051.00 | $5.70 | | $1,000.00 | $1,019.24 | $5.61 | 1.12% |
Class T Shares | $1,000.00 | $1,052.40 | $4.38 | | $1,000.00 | $1,020.53 | $4.31 | 0.86% |
† | Expenses Paid During Period are equal to the Net Annualized Expense Ratio multiplied by the average account value over the period, multiplied by 181/365 (to reflect the one-half year period). Expenses in the examples include the effect of applicable fee waivers and/or expense reimbursements, if any. Had such waivers and/or reimbursements not been in effect, your expenses would have been higher. Please refer to the Notes to Financial Statements or the Fund’s prospectuses for more information regarding waivers and/or reimbursements. |
Janus Henderson High-Yield Fund
Schedule of Investments
June 30, 2023
| | | | | | | | |
Shares or
Principal Amounts | | | Value | |
Asset-Backed/Commercial Mortgage-Backed Securities– 3.2% | | | |
| | Amercian Airlines Inc / AAdvantage Loyalty IP Ltd, 5.5000%, 4/20/26 (144A) | | $2,969,734 | | | $2,942,085 | |
| | Amercian Airlines Inc / AAdvantage Loyalty IP Ltd, 5.7500%, 4/20/29 (144A) | | 2,683,200 | | | 2,605,330 | |
| | BX Commercial Mortgage Trust 2021-ARIA F, | | | | | | |
| | ICE LIBOR USD 1 Month + 2.5935%, 7.7865%, 10/15/36 (144A)‡ | | 6,000,000 | | | 5,570,217 | |
| | JP Morgan Chase Commercial Mortgage Sec Trust 2020-ACE C, | | | | | | |
| | 3.8173%, 1/10/37 (144A)‡ | | 5,000,000 | | | 4,522,280 | |
| | MED Trust 2021-MDLN F, | | | | | | |
| | ICE LIBOR USD 1 Month + 4.0000%, 9.1940%, 11/15/38 (144A)‡ | | 5,476,379 | | | 5,170,775 | |
| | New Economy Assets Phase 1 Issuer LLC 2021-1 B1, 2.4100%, 10/20/61 (144A) | | 5,000,000 | | | 4,163,677 | |
| | VASA Trust 2021-VASA F, | | | | | | |
| | ICE LIBOR USD 1 Month + 3.9000%, 9.0930%, 7/15/39 (144A)‡ | | 3,083,000 | | | 1,555,989 | |
Total Asset-Backed/Commercial Mortgage-Backed Securities (cost $27,197,423) | | 26,530,353 | |
Bank Loans and Mezzanine Loans– 0.8% | | | |
Consumer Cyclical – 0.7% | | | |
| | Boardriders Inc, | | | | | | |
| | ICE LIBOR USD 3 Month + 8.0000%, 13.3369% (13.22% Cash or 13.34% PIK), 4/23/24‡,Ø,¢ | | 393,761 | | | 393,761 | |
| | Mic Glen LLC, CME Term SOFR 1 Month + 6.7500%, 11.9525%, 7/20/29‡ | | 2,303,342 | | | 2,119,075 | |
| | Tacala Investment Corp, ICE LIBOR USD 1 Month + 7.5000%, 12.6537%, 2/4/28‡ | | 3,481,080 | | | 3,263,512 | |
| | | 5,776,348 | |
Transportation – 0.1% | | | |
| | AAdvantage Loyalty IP Ltd, | | | | | | |
| | ICE LIBOR USD 3 Month + 4.7500%, 10.0004%, 4/20/28‡ | | 821,515 | | | 837,945 | |
Total Bank Loans and Mezzanine Loans (cost $6,872,079) | | 6,614,293 | |
Corporate Bonds– 88.8% | | | |
Basic Industry – 4.5% | | | |
| | Arconic Rolled Products, 6.1250%, 2/15/28 (144A) | | 3,364,000 | | | 3,405,727 | |
| | Compass Minerals International Inc, 6.7500%, 12/1/27 (144A) | | 4,992,000 | | | 4,812,787 | |
| | Element Solutions Inc, 3.8750%, 9/1/28 (144A) | | 3,484,000 | | | 3,039,358 | |
| | First Quantum Minerals Ltd, 6.8750%, 10/15/27 (144A) | | 4,353,000 | | | 4,246,351 | |
| | FMG Resources (August 2006) Pty Ltd, 4.3750%, 4/1/31 (144A) | | 5,838,000 | | | 4,984,555 | |
| | Hudbay Minerals Inc, 4.5000%, 4/1/26 (144A) | | 9,689,000 | | | 9,021,810 | |
| | Hudbay Minerals Inc, 6.1250%, 4/1/29 (144A) | | 5,276,000 | | | 4,857,983 | |
| | Kaiser Aluminum Corp, 4.5000%, 6/1/31 (144A) | | 3,387,000 | | | 2,700,049 | |
| | | 37,068,620 | |
Brokerage – 0.1% | | | |
| | AG TTMT Escrow Issuer LLC, 8.6250%, 9/30/27 (144A) | | 1,265,000 | | | 1,296,578 | |
Capital Goods – 11.2% | | | |
| | ARD Finance SA, 6.5000% (6.50% Cash or 7.25% PIK), 6/30/27 (144A)Ø | | 12,818,678 | | | 10,385,001 | |
| | Ardagh Packaging Finance PLC / Ardagh Holdings USA Inc, | | | | | | |
| | 5.2500%, 8/15/27 (144A) | | 6,942,000 | | | 5,880,439 | |
| | Bombardier Inc, 7.5000%, 2/1/29 (144A) | | 3,067,000 | | | 3,031,254 | |
| | Builders FirstSource Inc, 4.2500%, 2/1/32 (144A) | | 2,735,000 | | | 2,379,858 | |
| | Builders FirstSource Inc, 6.3750%, 6/15/32 (144A) | | 4,359,000 | | | 4,330,672 | |
| | Cemex SAB de CV, | | | | | | |
| | US Treasury Yield Curve Rate 5 Year + 4.9070%, 9.1250% (144A)‡,µ | | 2,593,000 | | | 2,626,053 | |
| | Chart Industries Inc, 7.5000%, 1/1/30 (144A) | | 4,111,000 | | | 4,194,268 | |
| | JELD-WEN Inc, 4.8750%, 12/15/27 (144A) | | 4,064,000 | | | 3,599,282 | |
| | LABL Escrow Issuer LLC, 10.5000%, 7/15/27 (144A) | | 4,270,000 | | | 4,099,493 | |
| | LABL Inc, 5.8750%, 11/1/28 (144A) | | 3,003,000 | | | 2,731,170 | |
| | LABL Inc, 8.2500%, 11/1/29 (144A) | | 7,037,000 | | | 5,884,691 | |
| | PECF USS Intermediate Holding III Corp, 8.0000%, 11/15/29 (144A)# | | 2,257,000 | | | 1,269,563 | |
| | Standard Industries Inc/NJ, 3.3750%, 1/15/31 (144A) | | 13,444,000 | | | 10,823,001 | |
| | Summit Materials LLC / Summit Materials Finance Corp, | | | | | | |
| | 5.2500%, 1/15/29 (144A) | | 4,697,000 | | | 4,437,585 | |
| | TransDigm Inc, 6.7500%, 8/15/28 (144A) | | 1,705,000 | | | 1,711,462 | |
| | TransDigm Inc, 4.8750%, 5/1/29 | | 8,461,000 | | | 7,557,900 | |
| | TransDigm UK Holdings PLC, 6.8750%, 5/15/26 | | 2,228,000 | | | 2,207,255 | |
| | Trinity Industries Inc, 7.7500%, 7/15/28 (144A) | | 2,865,000 | | | 2,882,906 | |
| | |
See Notes to Schedule of Investments and Other Information and Notes to Financial Statements. |
| |
Janus Investment Fund | 7 |
Janus Henderson High-Yield Fund
Schedule of Investments
June 30, 2023
| | | | | | | | |
Shares or
Principal Amounts | | | Value | |
Corporate Bonds– (continued) | | | |
Capital Goods– (continued) | | | |
| | Trivium Packaging Finance BV, 5.5000%, 8/15/26 (144A) | | $2,279,000 | | | $2,188,192 | |
| | Trivium Packaging Finance BV, 8.5000%, 8/15/27 (144A)# | | 7,722,000 | | | 7,433,326 | |
| | Vertical US Newco Inc, 5.2500%, 7/15/27 (144A) | | 3,245,000 | | | 2,997,967 | |
| | | 92,651,338 | |
Communications – 5.2% | | | |
| | Block Communications Inc, 4.8750%, 3/1/28 (144A) | | 2,601,000 | | | 2,152,328 | |
| | CCO Holdings LLC / CCO Holdings Capital Corp, 4.5000%, 8/15/30 (144A) | | 4,280,000 | | | 3,563,918 | |
| | CCO Holdings LLC / CCO Holdings Capital Corp, 4.5000%, 6/1/33 (144A) | | 2,755,000 | | | 2,163,461 | |
| | Connect Finco Sarl / Connect US Finco LLC, 6.7500%, 10/1/26 (144A) | | 4,770,000 | | | 4,633,179 | |
| | Frotier Communications Holdings LLC, 6.7500%, 5/1/29 (144A)# | | 6,366,000 | | | 4,938,777 | |
| | Gray Escrow II Inc, 5.3750%, 11/15/31 (144A)# | | 2,361,000 | | | 1,564,842 | |
| | Gray Television Inc, 4.7500%, 10/15/30 (144A) | | 10,002,000 | | | 6,782,656 | |
| | Nexstar Broadcasting Inc, 4.7500%, 11/1/28 (144A) | | 3,578,000 | | | 3,103,969 | |
| | Scripps Escrow II Inc, 3.8750%, 1/15/29 (144A) | | 1,825,000 | | | 1,473,578 | |
| | Scripps Escrow II Inc, 5.3750%, 1/15/31 (144A) | | 8,480,000 | | | 5,976,691 | |
| | Scripps Escrow Inc, 5.8750%, 7/15/27 (144A) | | 2,433,000 | | | 1,969,417 | |
| | Univision Communications Inc, 4.5000%, 5/1/29 (144A) | | 1,911,000 | | | 1,641,849 | |
| | Univision Communications Inc, 7.3750%, 6/30/30 (144A) | | 3,356,000 | | | 3,195,306 | |
| | | 43,159,971 | |
Consumer Cyclical – 20.9% | | | |
| | American Axle & Manufacturing Inc, 6.2500%, 3/15/26 | | 987,000 | | | 958,513 | |
| | Arches Buyer Inc, 4.2500%, 6/1/28 (144A) | | 10,036,000 | | | 8,733,251 | |
| | Caesars Entertainment Inc, 7.0000%, 2/15/30 (144A) | | 4,281,000 | | | 4,299,151 | |
| | Carnival Corp, 7.6250%, 3/1/26 (144A)# | | 11,579,000 | | | 11,340,460 | |
| | Carnival Corp, 6.0000%, 5/1/29 (144A) | | 19,639,000 | | | 17,579,022 | |
| | Century Communities Inc, 3.8750%, 8/15/29 (144A) | | 2,758,000 | | | 2,389,979 | |
| | Churchill Downs Inc, 6.7500%, 5/1/31 (144A) | | 2,060,000 | | | 2,036,825 | |
| | Colt Merger Sub Inc, 8.1250%, 7/1/27 (144A)# | | 6,295,000 | | | 6,442,737 | |
| | Foot Locker Inc, 4.0000%, 10/1/29 (144A) | | 4,171,000 | | | 3,140,974 | |
| | Ford Motor Co, 3.2500%, 2/12/32 | | 8,179,000 | | | 6,434,292 | |
| | Ford Motor Credit Co LLC, 3.3750%, 11/13/25 | | 2,404,000 | | | 2,235,418 | |
| | Ford Motor Credit Co LLC, 3.6250%, 6/17/31 | | 7,239,000 | | | 5,933,264 | |
| | Full House Resorts Inc, 8.2500%, 2/15/28 (144A)# | | 9,094,000 | | | 8,511,802 | |
| | Goodyear Tire & Rubber Co/The, 5.2500%, 4/30/31 | | 2,262,000 | | | 1,986,798 | |
| | Kohl's Corp, 4.6250%, 5/1/31Ç | | 7,087,000 | | | 4,930,993 | |
| | LGI Homes Inc, 4.0000%, 7/15/29 (144A) | | 4,345,000 | | | 3,615,811 | |
| | Lithia Motors Inc, 4.3750%, 1/15/31 (144A) | | 7,372,000 | | | 6,363,491 | |
| | LSF9 Atlantis Holdings LLC / Victra Finance Corp, 7.7500%, 2/15/26 (144A) | | 7,071,000 | | | 6,583,467 | |
| | Macy's Retail Holdings LLC, 5.8750%, 4/1/29 (144A)# | | 8,108,000 | | | 7,398,550 | |
| | Michaels Cos Inc/The, 5.2500%, 5/1/28 (144A) | | 2,488,000 | | | 2,010,155 | |
| | Midwest Gaming Borrower LLC, 4.8750%, 5/1/29 (144A) | | 2,644,000 | | | 2,334,779 | |
| | Royal Caribbean Cruises Ltd, 9.2500%, 1/15/29 (144A) | | 4,134,000 | | | 4,404,413 | |
| | Sands China Ltd, 4.8750%, 6/18/30 | | 2,771,000 | | | 2,466,389 | |
| | Service Corp International/US, 3.3750%, 8/15/30 | | 9,115,000 | | | 7,622,874 | |
| | Shea Homes LP / Shea Homes Funding Corp, 4.7500%, 4/1/29 | | 5,756,000 | | | 4,997,497 | |
| | Six Flags Entertainment Corp, 5.5000%, 4/15/27 (144A) | | 970,000 | | | 913,209 | |
| | Six Flags Entertainment Corp, 7.2500%, 5/15/31 (144A)# | | 4,015,000 | | | 3,910,410 | |
| | Sugarhouse HSP Gaming Prop Mezz LP / Sugarhouse HSP Gaming Finance Corp, | | | | | | |
| | 5.8750%, 5/15/25 (144A) | | 5,120,000 | | | 4,940,800 | |
| | Travel + Leisure Co, 4.6250%, 3/1/30 (144A) | | 5,383,000 | | | 4,555,364 | |
| | Victoria's Secret & Co, 4.6250%, 7/15/29 (144A)# | | 9,440,000 | | | 6,899,577 | |
| | Weekley Homes LLC / Weekly Finance Corp, 4.8750%, 9/15/28 (144A) | | 5,799,000 | | | 5,219,216 | |
| | Wyndham Destinations Inc, 6.6250%, 7/31/26 (144A) | | 3,383,000 | | | 3,357,286 | |
| | Wynn Macau Ltd, 5.1250%, 12/15/29 (144A) | | 1,762,000 | | | 1,480,186 | |
| | Wynn Resorts Finance LLC / Wynn Resorts Capital Corp, | | | | | | |
| | 7.1250%, 2/15/31 (144A) | | 5,122,000 | | | 5,090,970 | |
| | ZF North America Capital Inc, 6.8750%, 4/14/28 (144A) | | 1,536,000 | | | 1,555,483 | |
| | | 172,673,406 | |
| | |
See Notes to Schedule of Investments and Other Information and Notes to Financial Statements. |
| |
8 | JUNE 30, 2023 |
Janus Henderson High-Yield Fund
Schedule of Investments
June 30, 2023
| | | | | | | | |
Shares or
Principal Amounts | | | Value | |
Corporate Bonds– (continued) | | | |
Consumer Non-Cyclical – 14.2% | | | |
| | AdaptHealth LLC, 5.1250%, 3/1/30 (144A) | | $4,116,000 | | | $3,333,960 | |
| | AMN Healthcare Inc, 4.0000%, 4/15/29 (144A) | | 6,179,000 | | | 5,388,459 | |
| | B&G Foods Inc, 5.2500%, 4/1/25 | | 4,142,000 | | | 3,954,325 | |
| | B&G Foods Inc, 5.2500%, 9/15/27# | | 333,000 | | | 289,315 | |
| | BellRing Brands Inc, 7.0000%, 3/15/30 (144A) | | 5,187,000 | | | 5,219,419 | |
| | Catalent Pharma Solutions Inc, 3.5000%, 4/1/30 (144A) | | 5,815,000 | | | 4,710,150 | |
| | Chobani LLC / Chobani Finance Corp Inc, 7.5000%, 4/15/25 (144A) | | 7,536,000 | | | 7,498,405 | |
| | Chobani LLC / Chobani Finance Corp Inc, 4.6250%, 11/15/28 (144A) | | 1,737,000 | | | 1,580,670 | |
| | FAGE International SA / FAGE USA Dairy Industry Inc, | | | | | | |
| | 5.6250%, 8/15/26 (144A) | | 5,605,000 | | | 5,278,065 | |
| | Hadrian Merger Sub Inc, 8.5000%, 5/1/26 (144A) | | 8,301,000 | | | 7,426,214 | |
| | Heartland Dental LLC / Heartland Dental Finance Corp, | | | | | | |
| | 10.5000%, 4/30/28 (144A) | | 6,295,000 | | | 6,255,656 | |
| | HLF Financing Sarl LLC / Herbalife International Inc, | | | | | | |
| | 4.8750%, 6/1/29 (144A) | | 4,255,000 | | | 3,032,836 | |
| | Mozart Debt Merger Sub Inc, 5.2500%, 10/1/29 (144A) | | 15,030,000 | | | 13,041,517 | |
| | Organon Finance 1 LLC, 5.1250%, 4/30/31 (144A) | | 14,899,000 | | | 12,292,037 | |
| | Owens & Minor Inc, 4.5000%, 3/31/29 (144A)# | | 1,665,000 | | | 1,382,598 | |
| | Owens & Minor Inc, 6.6250%, 4/1/30 (144A) | | 2,479,000 | | | 2,249,098 | |
| | Pediatrix Medical Group Inc, 5.3750%, 2/15/30 (144A) | | 3,903,000 | | | 3,590,760 | |
| | Post Holdings Inc, 4.5000%, 9/15/31 (144A) | | 2,671,000 | | | 2,281,124 | |
| | Surgery Center Holdings Inc, 10.0000%, 4/15/27 (144A) | | 3,084,000 | | | 3,153,390 | |
| | Tenet Healthcare Corp, 4.8750%, 1/1/26 | | 4,717,000 | | | 4,594,308 | |
| | Tenet Healthcare Corp, 4.2500%, 6/1/29 | | 4,603,000 | | | 4,158,476 | |
| | Tenet Healthcare Corp, 6.1250%, 6/15/30 | | 7,152,000 | | | 7,049,726 | |
| | Teva Pharmaceutical Finance Netherlands III BV, 3.1500%, 10/1/26 | | 4,194,000 | | | 3,758,016 | |
| | Thor Industries Inc, 4.0000%, 10/15/29 (144A) | | 7,089,000 | | | 6,016,789 | |
| | | 117,535,313 | |
Electric – 1.0% | | | |
| | NRG Energy Inc, 3.6250%, 2/15/31 (144A) | | 600,000 | | | 468,387 | |
| | NRG Energy Inc, 3.8750%, 2/15/32 (144A) | | 1,681,000 | | | 1,295,186 | |
| | TerraForm Power Operating LLC, 4.7500%, 1/15/30 (144A) | | 7,195,000 | | | 6,349,587 | |
| | | 8,113,160 | |
Energy – 11.5% | | | |
| | AmeriGas Partners LP / AmeriGas Finance Corp, 9.3750%, 6/1/28 (144A) | | 99,000 | | | 100,546 | |
| | Antero Resources Corp, 5.3750%, 3/1/30 (144A) | | 3,686,000 | | | 3,412,297 | |
| | Archrock Partners LP / Archrock Partners Finance Corp, | | | | | | |
| | 6.8750%, 4/1/27 (144A) | | 2,253,000 | | | 2,162,880 | |
| | Civitas Resources Inc, 8.3750%, 7/1/28 (144A) | | 3,171,000 | | | 3,206,832 | |
| | DT Midstream Inc, 4.1250%, 6/15/29 (144A) | | 5,401,000 | | | 4,739,784 | |
| | DT Midstream Inc, 4.3750%, 6/15/31 (144A) | | 3,200,000 | | | 2,756,009 | |
| | EnLink Midstream LLC, 5.6250%, 1/15/28 (144A) | | 2,723,000 | | | 2,635,001 | |
| | EnLink Midstream Partners LP, ICE LIBOR USD 3 Month + 4.1100%, 9.6184%‡,µ | | 2,422,000 | | | 1,992,710 | |
| | EQM Midstream Partners LP, 7.5000%, 6/1/27 (144A) | | 2,074,000 | | | 2,093,848 | |
| | EQM Midstream Partners LP, 4.7500%, 1/15/31 (144A) | | 4,316,000 | | | 3,780,747 | |
| | FTAI Infra Escrow Holdings LLC, 10.5000%, 6/1/27 (144A) | | 11,022,000 | | | 10,824,749 | |
| | Hess Midstream Operations LP, 5.1250%, 6/15/28 (144A)# | | 2,099,000 | | | 1,964,435 | |
| | Hess Midstream Operations LP, 4.2500%, 2/15/30 (144A) | | 2,001,000 | | | 1,745,873 | |
| | Howard Midstream Energy Partners LLC, 6.7500%, 1/15/27 (144A) | | 4,181,000 | | | 3,982,402 | |
| | Magnolia Oil & Gas Operating LLC / Magnolia Oil & Gas Finance Corp, | | | | | | |
| | 6.0000%, 8/1/26 (144A) | | 5,456,000 | | | 5,276,843 | |
| | NGL Energy Partners LP / NGL Energy Finance Corp, 7.5000%, 2/1/26 (144A) | | 9,188,000 | | | 9,049,001 | |
| | Southwestern Energy Co, 5.3750%, 3/15/30 | | 2,858,000 | | | 2,667,093 | |
| | Southwestern Energy Co, 4.7500%, 2/1/32 | | 2,873,000 | | | 2,532,080 | |
| | Sunoco LP / Sunoco Finance Corp, 4.5000%, 4/30/30 | | 10,097,000 | | | 8,827,274 | |
| | Tallgrass Energy Partners LP / Tallgrass Energy Finance Corp, | | | | | | |
| | 5.5000%, 1/15/28 (144A) | | 6,644,000 | | | 6,072,500 | |
| | Tallgrass Energy Partners LP / Tallgrass Energy Finance Corp, | | | | | | |
| | 6.0000%, 9/1/31 (144A) | | 5,175,000 | | | 4,452,743 | |
| | |
See Notes to Schedule of Investments and Other Information and Notes to Financial Statements. |
| |
Janus Investment Fund | 9 |
Janus Henderson High-Yield Fund
Schedule of Investments
June 30, 2023
| | | | | | | | |
Shares or
Principal Amounts | | | Value | |
Corporate Bonds– (continued) | | | |
Energy– (continued) | | | |
| | Venture Global LNG Inc, 8.1250%, 6/1/28 (144A) | | $5,954,000 | | | $6,047,089 | |
| | Viper Energy Partners LP, 5.3750%, 11/1/27 (144A) | | 5,177,000 | | | 4,968,458 | |
| | | 95,291,194 | |
Finance Companies – 4.4% | | | |
| | Fortress Transportation and Infrastructure Investors LLC, | | | | | | |
| | 6.5000%, 10/1/25 (144A) | | 978,000 | | | 963,490 | |
| | Fortress Transportation and Infrastructure Investors LLC, | | | | | | |
| | 9.7500%, 8/1/27 (144A) | | 4,230,000 | | | 4,368,622 | |
| | Navient Corp, 5.6250%, 8/1/33 | | 3,453,000 | | | 2,596,656 | |
| | OneMain Finance Corp, 6.6250%, 1/15/28 | | 943,000 | | | 889,504 | |
| | OneMain Finance Corp, 4.0000%, 9/15/30 | | 4,250,000 | | | 3,272,500 | |
| | OWL Rock Core Income Corp, 7.7500%, 9/16/27 (144A) | | 4,463,000 | | | 4,440,410 | |
| | OWL Rock Core Income Corp, 7.9500%, 6/13/28 (144A) | | 3,075,000 | | | 3,081,033 | |
| | PennyMac Financial Services Inc, 5.7500%, 9/15/31 (144A) | | 7,490,000 | | | 6,108,758 | |
| | Quicken Loans LLC, 3.8750%, 3/1/31 (144A) | | 5,185,000 | | | 4,204,296 | |
| | SLM Corp, 3.1250%, 11/2/26 | | 2,727,000 | | | 2,358,855 | |
| | Springleaf Finance Corp, 5.3750%, 11/15/29 | | 5,181,000 | | | 4,404,615 | |
| | | 36,688,739 | |
Financial Institutions – 1.5% | | | |
| | Burford Capital Global Finance LLC, 6.2500%, 4/15/28 (144A) | | 1,955,000 | | | 1,798,600 | |
| | Burford Capital Global Finance LLC, 6.8750%, 4/15/30 (144A) | | 4,210,000 | | | 3,837,496 | |
| | GGAM Finance Ltd, 8.0000%, 6/15/28 (144A) | | 6,428,000 | | | 6,431,278 | |
| | | 12,067,374 | |
Industrial – 1.5% | | | |
| | KBR Inc, 4.7500%, 9/30/28 (144A) | | 3,564,000 | | | 3,234,418 | |
| | TopBuild Corp, 4.1250%, 2/15/32 (144A) | | 11,106,000 | | | 9,461,352 | |
| | | 12,695,770 | |
Insurance – 1.2% | | | |
| | Broadstreet Partners Inc, 5.8750%, 4/15/29 (144A) | | 4,826,000 | | | 4,186,745 | |
| | HUB International Ltd, 5.6250%, 12/1/29 (144A)# | | 2,498,000 | | | 2,240,910 | |
| | HUB International Ltd, 7.2500%, 6/15/30 (144A) | | 1,970,000 | | | 2,034,222 | |
| | Ryan Specialty Group LLC, 4.3750%, 2/1/30 (144A)# | | 1,424,000 | | | 1,260,525 | |
| | | 9,722,402 | |
Real Estate Investment Trusts (REITs) – 0.3% | | | |
| | Global Net Lease Inc / Global Net Lease Operating Partnership LP, | | | | | | |
| | 3.7500%, 12/15/27 (144A) | | 3,713,000 | | | 2,723,861 | |
Technology – 8.4% | | | |
| | Austin BidCo Inc, 7.1250%, 12/15/28 (144A) | | 4,281,000 | | | 3,486,415 | |
| | CA Magnum Holdings, 5.3750%, 10/31/26 (144A) | | 2,811,000 | | | 2,516,865 | |
| | Ciena Corp, 4.0000%, 1/31/30 (144A)# | | 3,771,000 | | | 3,285,484 | |
| | Entegris Escrow Corp, 5.9500%, 6/15/30 (144A) | | 2,402,000 | | | 2,302,635 | |
| | Entegris Inc, 3.6250%, 5/1/29 (144A)# | | 8,833,000 | | | 7,612,103 | |
| | II-VI Inc, 5.0000%, 12/15/29 (144A) | | 8,454,000 | | | 7,630,665 | |
| | ION Trading Technologies Sarl, 5.7500%, 5/15/28 (144A) | | 4,114,000 | | | 3,551,246 | |
| | Iron Mountain Inc, 4.8750%, 9/15/27 (144A) | | 2,819,000 | | | 2,662,842 | |
| | Iron Mountain Inc, 7.0000%, 2/15/29 (144A) | | 2,968,000 | | | 2,972,992 | |
| | Iron Mountain Inc, 5.2500%, 7/15/30 (144A) | | 9,808,000 | | | 8,837,546 | |
| | NortonLifeLock Inc, 6.7500%, 9/30/27 (144A) | | 7,097,000 | | | 7,077,018 | |
| | Seagate HDD Cayman, 8.2500%, 12/15/29 (144A) | | 1,780,000 | | | 1,859,157 | |
| | Seagate HDD Cayman, 4.1250%, 1/15/31 | | 4,930,000 | | | 4,037,786 | |
| | Seagate HDD Cayman, 9.6250%, 12/1/32 (144A) | | 10,441,586 | | | 11,521,643 | |
| | | 69,354,397 | |
Transportation – 2.9% | | | |
| | Cargo Aircraft Management Inc, 4.7500%, 2/1/28 (144A) | | 12,334,000 | | | 10,805,447 | |
| | Rand Parent LLC, 8.5000%, 2/15/30 (144A)# | | 7,732,000 | | | 7,000,187 | |
| | Watco Cos LLC / Watco Finance Corp, 6.5000%, 6/15/27 (144A) | | 6,823,000 | | | 6,483,888 | |
| | | 24,289,522 | |
Total Corporate Bonds (cost $777,734,879) | | 735,331,645 | |
| | |
See Notes to Schedule of Investments and Other Information and Notes to Financial Statements. |
| |
10 | JUNE 30, 2023 |
Janus Henderson High-Yield Fund
Schedule of Investments
June 30, 2023
| | | | | | | | |
Shares or
Principal Amounts | | | Value | |
Convertible Corporate Bonds– 0.7% | | | |
Media – 0.7% | | | |
| | DISH Network Corp, 2.3750%, 3/15/24((cost $6,191,625) | | $6,446,000 | | | $5,712,767 | |
Common Stocks– 1.7% | | | |
Chemicals – 0.2% | | | |
| | Scotts Miracle-Gro Co | | 23,977 | | | 1,503,118 | |
Communications Equipment – 0.3% | | | |
| | Juniper Networks Inc | | 88,782 | | | 2,781,540 | |
Consumer Finance – 0.2% | | | |
| | OneMain Holdings Inc | | 30,306 | | | 1,324,069 | |
Health Care Equipment & Supplies – 0.9% | | | |
| | Globus Medical Inc* | | 55,018 | | | 3,275,772 | |
| | Hologic Inc* | | 30,602 | | | 2,477,844 | |
| | Teleflex Inc | | 8,756 | | | 2,119,215 | |
| | | 7,872,831 | |
Metals & Mining – 0.1% | | | |
| | Hudbay Minerals Inc | | 159,538 | | | 765,782 | |
Total Common Stocks (cost $14,366,324) | | 14,247,340 | |
Preferred Stocks– 0.3% | | | |
Consumer Cyclical – 0.3% | | | |
| | Quiksilver Inc¢((cost $2,633,063) | | 3,097,721 | | | 2,633,063 | |
Convertible Preferred Stocks– 0.2% | | | |
Machinery – 0.2% | | | |
| | Chart Industries Inc, 6.7500%, 12/15/25((cost $1,420,417) | | 26,859 | | | 1,742,881 | |
Investment Companies– 2.9% | | | |
Money Markets – 2.9% | | | |
| | Janus Henderson Cash Liquidity Fund LLC, 5.1900%ºº,£((cost $23,554,604) | | 23,550,907 | | | 23,555,617 | |
Investments Purchased with Cash Collateral from Securities Lending– 4.2% | | | |
Investment Companies – 3.3% | | | |
| | Janus Henderson Cash Collateral Fund LLC, 4.9971%ºº,£ | | 26,971,853 | | | 26,971,853 | |
Time Deposits – 0.9% | | | |
| | Royal Bank of Canada, 5.0600%, 7/3/23 | | $7,545,096 | | | 7,545,096 | |
Total Investments Purchased with Cash Collateral from Securities Lending (cost $34,516,949) | | 34,516,949 | |
Total Investments (total cost $894,487,363) – 102.8% | | 850,884,908 | |
Liabilities, net of Cash, Receivables and Other Assets – (2.8)% | | (23,184,796) | |
Net Assets – 100% | | $827,700,112 | |
| | |
See Notes to Schedule of Investments and Other Information and Notes to Financial Statements. |
| |
Janus Investment Fund | 11 |
Janus Henderson High-Yield Fund
Schedule of Investments
June 30, 2023
| | | | | | |
Summary of Investments by Country - (Long Positions) (unaudited) |
| |
| | | | | % of | |
| | | | | Investment | |
Country | | Value | | Securities | |
United States | | $766,675,927 | | 90.1 | % |
Luxembourg | | 19,214,312 | | 2.3 | |
Peru | | 13,879,793 | | 1.6 | |
Netherlands | | 9,621,518 | | 1.1 | |
Ireland | | 6,431,278 | | 0.8 | |
Australia | | 4,984,555 | | 0.6 | |
United Kingdom | | 4,633,179 | | 0.5 | |
Germany | | 4,553,450 | | 0.5 | |
Zambia | | 4,246,351 | | 0.5 | |
Macao | | 3,946,575 | | 0.5 | |
Canada | | 3,797,036 | | 0.5 | |
Israel | | 3,758,016 | | 0.4 | |
Mexico | | 2,626,053 | | 0.3 | |
India | | 2,516,865 | | 0.3 | |
| | | | | | |
| | | | | | |
Total | | $850,884,908 | | 100.0 | % |
| | |
See Notes to Schedule of Investments and Other Information and Notes to Financial Statements. |
| |
12 | JUNE 30, 2023 |
Janus Henderson High-Yield Fund
Schedule of Investments
June 30, 2023
Schedules of Affiliated Investments – (% of Net Assets)
| | | | | | | | | | | |
| | Dividend Income | Realized Gain/(Loss) | Change in Unrealized Appreciation/ Depreciation | Value at 6/30/23 |
Investment Companies - 2.9% |
Money Markets - 2.9% | |
| | Janus Henderson Cash Liquidity Fund LLC, 5.1900%ºº | $ | 1,134,093 | $ | 273 | $ | 777 | $ | 23,555,617 |
Investments Purchased with Cash Collateral from Securities Lending - 3.3% |
Investment Companies - 3.3% | |
| | Janus Henderson Cash Collateral Fund LLC, 4.9971%ºº | | 354,860∆ | | - | | - | | 26,971,853 |
Total Affiliated Investments - 6.2% | $ | 1,488,953 | $ | 273 | $ | 777 | $ | 50,527,470 |
| | | | | | | | | | | |
| | Value at 6/30/22 | Purchases | Sales Proceeds | Value at 6/30/23 |
Investment Companies - 2.9% |
Money Markets - 2.9% | |
| | Janus Henderson Cash Liquidity Fund LLC, 5.1900%ºº | | 22,494,643 | | 460,269,216 | | (459,209,292) | | 23,555,617 |
Investments Purchased with Cash Collateral from Securities Lending - 3.3% |
Investment Companies - 3.3% | |
| | Janus Henderson Cash Collateral Fund LLC, 4.9971%ºº | | 33,838,933 | | 193,869,284 | | (200,736,364) | | 26,971,853 |
The following tables provide information about the effect of derivatives and hedging activities on the Fund’s Statement of Operations for the year ended June 30, 2023.
| | | | | |
The effect of Derivative Instruments (not accounted for as hedging instruments) on the Statement of Operations for the year ended June 30, 2023 |
| | | | |
Amount of Realized Gain/(Loss) Recognized on Derivatives |
Derivative | | Credit
Contracts |
Swap contracts | | $(5,391,533) |
| | | | | |
| | | | | |
| | | | | |
Amount of Change in Unrealized Appreciation/Depreciation Recognized on Derivatives |
Derivative | | Credit
Contracts |
Swap contracts | | $(2,249,045) |
| | | | | |
Please see the "Net Realized Gain/(Loss) on Investments" and “Change in Unrealized Net Appreciation/Depreciation” sections of the Fund’s Statement of Operations.
| | |
See Notes to Schedule of Investments and Other Information and Notes to Financial Statements. |
| |
Janus Investment Fund | 13 |
Janus Henderson High-Yield Fund
Schedule of Investments
June 30, 2023
| | |
Average Ending Monthly Value of Derivative Instruments During the Year Ended June 30, 2023 |
| |
| |
Credit default swaps: | |
Average notional amount - buy protection | $44,631,038 |
| | |
| |
| |
| |
| | | | | | | | | | |
Offsetting of Financial Assets and Derivative Assets |
| |
| | | Gross Amounts | | | | | | |
| | | of Recognized | | Offsetting Asset | | Collateral | | |
Counterparty | | Assets | | or Liability(a) | | Pledged(b) | | Net Amount |
| | | | | | | | | |
JPMorgan Chase Bank, National Association | $ | 33,176,749 | $ | — | $ | (33,176,749) | $ | — |
| | | | | | | | | |
(a) | Represents the amount of assets or liabilities that could be offset with the same counterparty under master netting or similar agreements that management elects not to offset on the Statement of Assets and Liabilities. |
(b) | Collateral pledged is limited to the net outstanding amount due to/from an individual counterparty. The actual collateral amounts pledged may exceed these amounts and may fluctuate in value. |
| | |
See Notes to Schedule of Investments and Other Information and Notes to Financial Statements. |
| |
14 | JUNE 30, 2023 |
Janus Henderson High-Yield Fund
Notes to Schedule of Investments and Other Information
| | |
Bloomberg U.S. Corporate High-Yield Bond Index | Bloomberg U.S. Corporate High Yield Bond Index measures the US dollar-denominated, high yield, fixed-rate corporate bond market. |
| | |
ICE | Intercontinental Exchange |
LIBOR | London Interbank Offered Rate |
LLC | Limited Liability Company |
LP | Limited Partnership |
PIK | Pay-in-kind (PIK) bonds give the issuer an option to make the interest payment in cash or additional securities. |
PLC | Public Limited Company |
SOFR | Secured Overnight Financing Rate |
| | |
144A | Securities sold under Rule 144A of the Securities Act of 1933, as amended, are subject to legal and/or contractual restrictions on resale and may not be publicly sold without registration under the 1933 Act. Unless otherwise noted, these securities have been determined to be liquid under guidelines established by the Board of Trustees. The total value of 144A securities as of the year ended June 30, 2023 is $657,147,566, which represents 79.4% of net assets. |
| | |
* | Non-income producing security. |
| | |
‡ | Variable or floating rate security. Rate shown is the current rate as of June 30, 2023. Certain variable rate securities are not based on a published reference rate and spread; they are determined by the issuer or agent and current market conditions. Reference rate is as of reset date and may vary by security, which may not indicate a reference rate and/or spread in their description. |
| | |
ºº | Rate shown is the 7-day yield as of June 30, 2023. |
| | |
# | Loaned security; a portion of the security is on loan at June 30, 2023. |
| | |
µ | Perpetual security. Perpetual securities have no stated maturity date, but they may be called/redeemed by the issuer. The date indicated, if any, represents the next call date. |
| | |
Ç | Step bond. The coupon rate will increase or decrease periodically based upon a predetermined schedule. The rate shown reflects the current rate. |
| | |
Ø | Payment-in-kind security which may pay interest/dividends in additional par/shares and/or in cash. Rates shown are the current rate and possible payment rates. |
| | |
¢ | Security is valued using significant unobservable inputs. The total value of Level 3 securities as of the year ended June 30, 2023 is $3,026,824, which represents 0.4% of net assets. |
| | |
£ | The Fund may invest in certain securities that are considered affiliated companies. As defined by the Investment Company Act of 1940, as amended, an affiliated company is one in which the Fund owns 5% or more of the outstanding voting securities, or a company which is under common ownership or control. |
| | |
∆ | Net of income paid to the securities lending agent and rebates paid to the borrowing counterparties. |
Janus Henderson High-Yield Fund
Notes to Schedule of Investments and Other Information
| | | | | | | | | | | | | |
The following is a summary of the inputs that were used to value the Fund’s investments in securities and other financial instruments as of June 30, 2023. See Notes to Financial Statements for more information. |
| |
Valuation Inputs Summary |
| | | | | | | |
| | | | | Level 2 - | | Level 3 - |
| | | Level 1 - | | Other Significant | | Significant |
| | | Quoted Prices | | Observable Inputs | | Unobservable Inputs |
| | | | | | | |
Assets | | | | | | |
Investments In Securities: | | | | | | |
Asset-Backed/Commercial Mortgage-Backed Securities | $ | - | $ | 26,530,353 | $ | - |
Bank Loans and Mezzanine Loans | | - | | 6,220,532 | | 393,761 |
Corporate Bonds | | - | | 735,331,645 | | - |
Convertible Corporate Bonds | | - | | 5,712,767 | | - |
Common Stocks | | 14,247,340 | | - | | - |
Preferred Stocks | | - | | - | | 2,633,063 |
Convertible Preferred Stocks | | - | | 1,742,881 | | - |
Investment Companies | | - | | 23,555,617 | | - |
Investments Purchased with Cash Collateral from Securities Lending | | - | | 34,516,949 | | - |
Total Assets | $ | 14,247,340 | $ | 833,610,744 | $ | 3,026,824 |
| | | | | | | |
Janus Henderson High-Yield Fund
Statement of Assets and Liabilities
June 30, 2023
| |
See footnotes at the end of the Statement. |
| | | | | | | |
| | | | | | |
Assets: | | | | |
| Unaffiliated investments, at value (cost $843,960,906)(1) | | $ | 800,357,438 | |
| Affiliated investments, at value (cost $50,526,457) | | | 50,527,470 | |
| Cash | | | 874 | |
| Cash denominated in foreign currency (cost $50) | | | 50 | |
| Trustees' deferred compensation | | | 20,948 | |
| Receivables: | | | | |
| | Interest | | | 12,467,020 | |
| | Investments sold | | | 1,696,632 | |
| | Fund shares sold | | | 201,016 | |
| | Dividends from affiliates | | | 132,738 | |
| Other assets | | | 32,640 | |
Total Assets | | | 865,436,826 | |
Liabilities: | | | | |
| Collateral for securities loaned (Note 3) | | | 34,516,949 | |
| Payables: | | | — | |
| | Fund shares repurchased | | | 1,490,909 | |
| | Investments purchased | | | 580,880 | |
| | Advisory fees | | | 404,068 | |
| | Dividends | | | 386,327 | |
| | Transfer agent fees and expenses | | | 119,096 | |
| | Professional fees | | | 61,101 | |
| | Trustees' deferred compensation fees | | | 20,948 | |
| | 12b-1 Distribution and shareholder servicing fees | | | 11,612 | |
| | Trustees' fees and expenses | | | 5,284 | |
| | Custodian fees | | | 2,710 | |
| | Affiliated fund administration fees payable | | | 1,806 | |
| | Accrued expenses and other payables | | | 135,024 | |
Total Liabilities | | | 37,736,714 | |
Net Assets | | $ | 827,700,112 | |
| | |
See Notes to Financial Statements. |
| |
Janus Investment Fund | 17 |
Janus Henderson High-Yield Fund
Statement of Assets and Liabilities
June 30, 2023
| | | | | | | |
| | | | | | |
| | | | | | | |
Net Assets Consist of: | | | | |
| Capital (par value and paid-in surplus) | | $ | 1,160,517,974 | |
| Total distributable earnings (loss) | | | (332,817,862) | |
Total Net Assets | | $ | 827,700,112 | |
Net Assets - Class A Shares | | $ | 20,697,530 | |
| Shares Outstanding, $0.01 Par Value (unlimited shares authorized) | | | 2,936,960 | |
Net Asset Value Per Share(2) | | $ | 7.05 | |
Maximum Offering Price Per Share(3) | | $ | 7.40 | |
Net Assets - Class C Shares | | $ | 4,248,521 | |
| Shares Outstanding, $0.01 Par Value (unlimited shares authorized) | | | 602,617 | |
Net Asset Value Per Share(2) | | $ | 7.05 | |
Net Assets - Class D Shares | | $ | 283,344,765 | |
| Shares Outstanding, $0.01 Par Value (unlimited shares authorized) | | | 40,191,891 | |
Net Asset Value Per Share | | $ | 7.05 | |
Net Assets - Class I Shares | | $ | 144,956,304 | |
| Shares Outstanding, $0.01 Par Value (unlimited shares authorized) | | | 20,553,271 | |
Net Asset Value Per Share | | $ | 7.05 | |
Net Assets - Class N Shares | | $ | 99,578,545 | |
| Shares Outstanding, $0.01 Par Value (unlimited shares authorized) | | | 14,128,735 | |
Net Asset Value Per Share | | $ | 7.05 | |
Net Assets - Class R Shares | | $ | 7,070,665 | |
| Shares Outstanding, $0.01 Par Value (unlimited shares authorized) | | | 1,004,021 | |
Net Asset Value Per Share | | $ | 7.04 | |
Net Assets - Class S Shares | | $ | 1,259,875 | |
| Shares Outstanding, $0.01 Par Value (unlimited shares authorized) | | | 178,477 | |
Net Asset Value Per Share | | $ | 7.06 | |
Net Assets - Class T Shares | | $ | 266,543,907 | |
| Shares Outstanding, $0.01 Par Value (unlimited shares authorized) | | | 37,810,430 | |
Net Asset Value Per Share | | $ | 7.05 | |
| |
(1) Includes $33,176,749 of securities on loan. See Note 3 in Notes to Financial Statements. (2) Redemption price per share may be reduced for any applicable contingent deferred sales charge. (3) Maximum offering price is computed at 100/95.25 of net asset value. |
| | |
See Notes to Financial Statements. |
| |
18 | JUNE 30, 2023 |
Janus Henderson High-Yield Fund
Statement of Operations
For the year ended June 30, 2023
| | | | | | |
| | | | | |
Investment Income: | | | |
| Interest | $ | 58,929,680 | |
| Dividends from affiliates | | 1,134,093 | |
| Affiliated securities lending income, net | | 354,860 | |
| Unaffiliated securities lending income, net | | 104,577 | |
| Dividends | | 52,243 | |
| Other income | | 1,185,974 | |
Total Investment Income | | 61,761,427 | |
Expenses: | | | |
| Advisory fees | | 5,204,728 | |
| 12b-1 Distribution and shareholder servicing fees: | | | |
| | Class A Shares | | 59,296 | |
| | Class C Shares | | 48,378 | |
| | Class R Shares | | 32,877 | |
| | Class S Shares | | 3,845 | |
| Transfer agent administrative fees and expenses: | | | |
| | Class D Shares | | 331,513 | |
| | Class R Shares | | 16,458 | |
| | Class S Shares | | 3,850 | |
| | Class T Shares | | 696,191 | |
| Transfer agent networking and omnibus fees: | | | |
| | Class A Shares | | 22,011 | |
| | Class C Shares | | 3,102 | |
| | Class I Shares | | 156,159 | |
| Other transfer agent fees and expenses: | | | |
| | Class A Shares | | 1,648 | |
| | Class C Shares | | 246 | |
| | Class D Shares | | 43,865 | |
| | Class I Shares | | 8,450 | |
| | Class N Shares | | 5,899 | |
| | Class R Shares | | 149 | |
| | Class S Shares | | 65 | |
| | Class T Shares | | 3,422 | |
| Registration fees | | 160,938 | |
| Shareholder reports expense | | 110,044 | |
| Professional fees | | 72,083 | |
| Affiliated fund administration fees | | 28,331 | |
| Trustees’ fees and expenses | | 24,300 | |
| Custodian fees | | 12,947 | |
| Other expenses | | 198,524 | |
Total Expenses | | 7,249,319 | |
Less: Excess Expense Reimbursement and Waivers | | (244,409) | |
Net Expenses | | 7,004,910 | |
Net Investment Income/(Loss) | | 54,756,517 | |
| | | | | |
| | |
See Notes to Financial Statements. |
| |
Janus Investment Fund | 19 |
Janus Henderson High-Yield Fund
Statement of Operations
For the year ended June 30, 2023
| | | | | | |
| | | | | |
Net Realized Gain/(Loss) on Investments: | | | |
| Investments | $ | (106,006,453) | |
| Investments in affiliates | | 273 | |
| Swap contracts | | (5,391,533) | |
Total Net Realized Gain/(Loss) on Investments | | (111,397,713) | |
Change in Unrealized Net Appreciation/Depreciation: | | | |
| Investments, foreign currency translations and Trustees’ deferred compensation | | 119,035,227 | |
| Investments in affiliates | | 777 | |
| Swap contracts | | (2,249,045) | |
Total Change in Unrealized Net Appreciation/Depreciation | | 116,786,959 | |
Net Increase/(Decrease) in Net Assets Resulting from Operations | $ | 60,145,763 | |
| | | | | |
| | |
See Notes to Financial Statements. |
| |
20 | JUNE 30, 2023 |
Janus Henderson High-Yield Fund
Statements of Changes in Net Assets
| | | | | | | | | |
| | | | | | | | |
| | | Year ended
June 30, 2023 | | Year ended
June 30, 2022 | |
| | | | | | | | | |
Operations: | | | | | | |
| Net investment income/(loss) | $ | 54,756,517 | | $ | 52,778,558 | |
| Net realized gain/(loss) on investments | | (111,397,713) | | | (13,296,880) | |
| Change in unrealized net appreciation/depreciation | | 116,786,959 | | | (213,605,131) | |
Net Increase/(Decrease) in Net Assets Resulting from Operations | | 60,145,763 | | | (174,123,453) | |
Dividends and Distributions to Shareholders: | | | | | | |
| | Class A Shares | | (1,386,629) | | | (1,458,379) | |
| | Class C Shares | | (251,395) | | | (272,044) | |
| | Class D Shares | | (17,165,352) | | | (15,872,470) | |
| | Class I Shares | | (9,540,829) | | | (11,094,566) | |
| | Class N Shares | | (8,447,921) | | | (8,664,053) | |
| | Class R Shares | | (360,959) | | | (306,981) | |
| | Class S Shares | | (87,915) | | | (84,973) | |
| | Class T Shares | | (16,647,404) | | | (16,314,962) | |
Net Decrease from Dividends and Distributions to Shareholders | | (53,888,404) | | | (54,068,428) | |
Capital Share Transactions: | | | | | | |
| | Class A Shares | | (4,060,462) | | | (7,831,246) | |
| | Class C Shares | | (1,003,230) | | | (978,532) | |
| | Class D Shares | | 1,921,557 | | | (2,184,631) | |
| | Class I Shares | | (20,613,843) | | | (55,382,146) | |
| | Class N Shares | | (67,136,855) | | | 55,710,955 | |
| | Class R Shares | | 674,281 | | | 52,678 | |
| | Class S Shares | | (202,744) | | | (418,662) | |
| | Class T Shares | | (18,864,030) | | | (20,522,556) | |
Net Increase/(Decrease) from Capital Share Transactions | | (109,285,326) | | | (31,554,140) | |
Net Increase/(Decrease) in Net Assets | | (103,027,967) | | | (259,746,021) | |
Net Assets: | | | | | | |
| Beginning of period | | 930,728,079 | | | 1,190,474,100 | |
| End of period | $ | 827,700,112 | | $ | 930,728,079 | |
| | | | | | | | |
| | |
See Notes to Financial Statements. |
| |
Janus Investment Fund | 21 |
Janus Henderson High-Yield Fund
Financial Highlights
| | | | | | | | | | | | | | | | | | | |
Class A Shares | | | | | | | | | | | | | | | |
For a share outstanding during the year ended June 30 | | 2023 | | | 2022 | | | 2021 | | | 2020 | | | 2019 | |
| Net Asset Value, Beginning of Period | | $6.99 | | | $8.64 | | | $7.77 | | | $8.34 | | | $8.18 | |
| Income/(Loss) from Investment Operations: | | | | | | | | | | | | | | | |
| | Net investment income/(loss)(1) | | 0.42 | | | 0.36 | | | 0.39 | | | 0.41 | | | 0.43 | |
| | Net realized and unrealized gain/(loss) | | 0.06 | | | (1.64) | | | 0.88 | | | (0.57) | | | 0.16 | |
| Total from Investment Operations | | 0.48 | | | (1.28) | | | 1.27 | | | (0.16) | | | 0.59 | |
| Less Dividends and Distributions: | | | | | | | | | | | | | | | |
| | Dividends (from net investment income) | | (0.42) | | | (0.37) | | | (0.40) | | | (0.41) | | | (0.43) | |
| Total Dividends and Distributions | | (0.42) | | | (0.37) | | | (0.40) | | | (0.41) | | | (0.43) | |
| Net Asset Value, End of Period | | $7.05 | | | $6.99 | | | $8.64 | | | $7.77 | | | $8.34 | |
| Total Return* | | 6.99% | | | (15.31)% | | | 16.69% | | | (1.95)% | | | 7.48% | |
| Net Assets, End of Period (in thousands) | | $20,698 | | | $24,533 | | | $38,432 | | | $32,937 | | | $28,510 | |
| Average Net Assets for the Period (in thousands) | | $23,632 | | | $32,275 | | | $36,570 | | | $35,108 | | | $27,131 | |
| Ratios to Average Net Assets**: | | | | | | | | | | | | | | | |
| | Ratio of Gross Expenses | | 1.01% | | | 0.98% | | | 0.97% | | | 0.98% | | | 1.04% | |
| | Ratio of Net Expenses (After Waivers and Expense Offsets) | | 0.98% | | | 0.98% | | | 0.97% | | | 0.98% | | | 1.04% | |
| | Ratio of Net Investment Income/(Loss) | | 5.97% | | | 4.41% | | | 4.71% | | | 5.09% | | | 5.23% | |
| Portfolio Turnover Rate | | 73% | | | 81% | | | 120% | | | 146% | | | 110% | |
| | | | | | | | | | | | | | | | | | | |
| |
* Total return includes adjustments in accordance with generally accepted accounting principles required at the year or period end and are not annualized for periods of less than one full year. ** Annualized for periods of less than one full year. (1) Per share amounts are calculated based on average shares outstanding during the year or period. |
| | |
See Notes to Financial Statements. |
| |
22 | JUNE 30, 2023 |
Janus Henderson High-Yield Fund
Financial Highlights
| | | | | | | | | | | | | | | | | | | |
Class C Shares | | | | | | | | | | | | | | | |
For a share outstanding during the year ended June 30 | | 2023 | | | 2022 | | | 2021 | | | 2020 | | | 2019 | |
| Net Asset Value, Beginning of Period | | $6.99 | | | $8.63 | | | $7.77 | | | $8.34 | | | $8.18 | |
| Income/(Loss) from Investment Operations: | | | | | | | | | | | | | | | |
| | Net investment income/(loss)(1) | | 0.37 | | | 0.31 | | | 0.34 | | | 0.36 | | | 0.37 | |
| | Net realized and unrealized gain/(loss) | | 0.06 | | | (1.63) | | | 0.86 | | | (0.57) | | | 0.17 | |
| Total from Investment Operations | | 0.43 | | | (1.32) | | | 1.20 | | | (0.21) | | | 0.54 | |
| Less Dividends and Distributions: | | | | | | | | | | | | | | | |
| | Dividends (from net investment income) | | (0.37) | | | (0.32) | | | (0.34) | | | (0.36) | | | (0.38) | |
| Total Dividends and Distributions | | (0.37) | | | (0.32) | | | (0.34) | | | (0.36) | | | (0.38) | |
| Net Asset Value, End of Period | | $7.05 | | | $6.99 | | | $8.63 | | | $7.77 | | | $8.34 | |
| Total Return* | | 6.24% | | | (15.81)% | | | 15.73% | | | (2.64)% | | | 6.78% | |
| Net Assets, End of Period (in thousands) | | $4,249 | | | $5,200 | | | $7,519 | | | $12,402 | | | $23,026 | |
| Average Net Assets for the Period (in thousands) | | $4,863 | | | $7,124 | | | $9,532 | | | $15,009 | | | $27,890 | |
| Ratios to Average Net Assets**: | | | | | | | | | | | | | | | |
| | Ratio of Gross Expenses | | 1.77% | | | 1.71% | | | 1.70% | | | 1.69% | | | 1.70% | |
| | Ratio of Net Expenses (After Waivers and Expense Offsets) | | 1.70% | | | 1.68% | | | 1.69% | | | 1.69% | | | 1.70% | |
| | Ratio of Net Investment Income/(Loss) | | 5.28% | | | 3.71% | | | 4.03% | | | 4.37% | | | 4.57% | |
| Portfolio Turnover Rate | | 73% | | | 81% | | | 120% | | | 146% | | | 110% | |
| | | | | | | | | | | | | | | | | | | |
| |
* Total return includes adjustments in accordance with generally accepted accounting principles required at the year or period end and are not annualized for periods of less than one full year. ** Annualized for periods of less than one full year. (1) Per share amounts are calculated based on average shares outstanding during the year or period. |
| | |
See Notes to Financial Statements. |
| |
Janus Investment Fund | 23 |
Janus Henderson High-Yield Fund
Financial Highlights
| | | | | | | | | | | | | | | | | | | |
Class D Shares | | | | | | | | | | | | | | | |
For a share outstanding during the year ended June 30 | | 2023 | | | 2022 | | | 2021 | | | 2020 | | | 2019 | |
| Net Asset Value, Beginning of Period | | $6.99 | | | $8.64 | | | $7.77 | | | $8.34 | | | $8.18 | |
| Income/(Loss) from Investment Operations: | | | | | | | | | | | | | | | |
| | Net investment income/(loss)(1) | | 0.44 | | | 0.38 | | | 0.41 | | | 0.43 | | | 0.45 | |
| | Net realized and unrealized gain/(loss) | | 0.05 | | | (1.64) | | | 0.88 | | | (0.57) | | | 0.16 | |
| Total from Investment Operations | | 0.49 | | | (1.26) | | | 1.29 | | | (0.14) | | | 0.61 | |
| Less Dividends and Distributions: | | | | | | | | | | | | | | | |
| | Dividends (from net investment income) | | (0.43) | | | (0.39) | | | (0.42) | | | (0.43) | | | (0.45) | |
| Total Dividends and Distributions | | (0.43) | | | (0.39) | | | (0.42) | | | (0.43) | | | (0.45) | |
| Net Asset Value, End of Period | | $7.05 | | | $6.99 | | | $8.64 | | | $7.77 | | | $8.34 | |
| Total Return* | | 7.23% | | | (15.13)% | | | 16.93% | | | (1.73)% | | | 7.74% | |
| Net Assets, End of Period (in thousands) | | $283,345 | | | $279,111 | | | $347,855 | | | $309,023 | | | $348,041 | |
| Average Net Assets for the Period (in thousands) | | $280,360 | | | $333,960 | | | $330,438 | | | $337,185 | | | $339,785 | |
| Ratios to Average Net Assets**: | | | | | | | | | | | | | | | |
| | Ratio of Gross Expenses | | 0.80% | | | 0.76% | | | 0.76% | | | 0.77% | | | 0.80% | |
| | Ratio of Net Expenses (After Waivers and Expense Offsets) | | 0.77% | | | 0.76% | | | 0.76% | | | 0.77% | | | 0.80% | |
| | Ratio of Net Investment Income/(Loss) | | 6.21% | | | 4.64% | | | 4.92% | | | 5.31% | | | 5.49% | |
| Portfolio Turnover Rate | | 73% | | | 81% | | | 120% | | | 146% | | | 110% | |
| | | | | | | | | | | | | | | | | | | |
| |
* Total return includes adjustments in accordance with generally accepted accounting principles required at the year or period end and are not annualized for periods of less than one full year. ** Annualized for periods of less than one full year. (1) Per share amounts are calculated based on average shares outstanding during the year or period. |
| | |
See Notes to Financial Statements. |
| |
24 | JUNE 30, 2023 |
Janus Henderson High-Yield Fund
Financial Highlights
| | | | | | | | | | | | | | | | | | | |
Class I Shares | | | | | | | | | | | | | | | |
For a share outstanding during the year ended June 30 | | 2023 | | | 2022 | | | 2021 | | | 2020 | | | 2019 | |
| Net Asset Value, Beginning of Period | | $7.00 | | | $8.64 | | | $7.77 | | | $8.34 | | | $8.19 | |
| Income/(Loss) from Investment Operations: | | | | | | | | | | | | | | | |
| | Net investment income/(loss)(1) | | 0.44 | | | 0.39 | | | 0.42 | | | 0.44 | | | 0.45 | |
| | Net realized and unrealized gain/(loss) | | 0.04 | | | (1.64) | | | 0.88 | | | (0.57) | | | 0.16 | |
| Total from Investment Operations | | 0.48 | | | (1.25) | | | 1.30 | | | (0.13) | | | 0.61 | |
| Less Dividends and Distributions: | | | | | | | | | | | | | | | |
| | Dividends (from net investment income) | | (0.43) | | | (0.39) | | | (0.43) | | | (0.44) | | | (0.46) | |
| Total Dividends and Distributions | | (0.43) | | | (0.39) | | | (0.43) | | | (0.44) | | | (0.46) | |
| Net Asset Value, End of Period | | $7.05 | | | $7.00 | | | $8.64 | | | $7.77 | | | $8.34 | |
| Total Return* | | 7.10% | | | (14.98)% | | | 16.99% | | | (1.69)% | | | 7.68% | |
| Net Assets, End of Period (in thousands) | | $144,956 | | | $165,462 | | | $264,363 | | | $258,255 | | | $289,574 | |
| Average Net Assets for the Period (in thousands) | | $156,144 | | | $232,609 | | | $258,975 | | | $277,116 | | | $323,343 | |
| Ratios to Average Net Assets**: | | | | | | | | | | | | | | | |
| | Ratio of Gross Expenses | | 0.75% | | | 0.72% | | | 0.71% | | | 0.72% | | | 0.73% | |
| | Ratio of Net Expenses (After Waivers and Expense Offsets) | | 0.74% | | | 0.72% | | | 0.71% | | | 0.72% | | | 0.73% | |
| | Ratio of Net Investment Income/(Loss) | | 6.22% | | | 4.66% | | | 4.97% | | | 5.34% | | | 5.54% | |
| Portfolio Turnover Rate | | 73% | | | 81% | | | 120% | | | 146% | | | 110% | |
| | | | | | | | | | | | | | | | | | | |
| |
* Total return includes adjustments in accordance with generally accepted accounting principles required at the year or period end and are not annualized for periods of less than one full year. ** Annualized for periods of less than one full year. (1) Per share amounts are calculated based on average shares outstanding during the year or period. |
| | |
See Notes to Financial Statements. |
| |
Janus Investment Fund | 25 |
Janus Henderson High-Yield Fund
Financial Highlights
| | | | | | | | | | | | | | | | | | | |
Class N Shares | | | | | | | | | | | | | | | |
For a share outstanding during the year ended June 30 | | 2023 | | | 2022 | | | 2021 | | | 2020 | | | 2019 | |
| Net Asset Value, Beginning of Period | | $6.99 | | | $8.64 | | | $7.77 | | | $8.34 | | | $8.18 | |
| Income/(Loss) from Investment Operations: | | | | | | | | | | | | | | | |
| | Net investment income/(loss)(1) | | 0.45 | | | 0.39 | | | 0.42 | | | 0.44 | | | 0.46 | |
| | Net realized and unrealized gain/(loss) | | 0.05 | | | (1.64) | | | 0.88 | | | (0.57) | | | 0.16 | |
| Total from Investment Operations | | 0.50 | | | (1.25) | | | 1.30 | | | (0.13) | | | 0.62 | |
| Less Dividends and Distributions: | | | | | | | | | | | | | | | |
| | Dividends (from net investment income) | | (0.44) | | | (0.40) | | | (0.43) | | | (0.44) | | | (0.46) | |
| Total Dividends and Distributions | | (0.44) | | | (0.40) | | | (0.43) | | | (0.44) | | | (0.46) | |
| Net Asset Value, End of Period | | $7.05 | | | $6.99 | | | $8.64 | | | $7.77 | | | $8.34 | |
| Total Return* | | 7.37% | | | (15.01)% | | | 17.09% | | | (1.59)% | | | 7.90% | |
| Net Assets, End of Period (in thousands) | | $99,579 | | | $165,384 | | | $149,967 | | | $129,944 | | | $124,803 | |
| Average Net Assets for the Period (in thousands) | | $136,839 | | | $176,304 | | | $139,565 | | | $129,946 | | | $170,511 | |
| Ratios to Average Net Assets**: | | | | | | | | | | | | | | | |
| | Ratio of Gross Expenses | | 0.65% | | | 0.63% | | | 0.62% | | | 0.62% | | | 0.65% | |
| | Ratio of Net Expenses (After Waivers and Expense Offsets) | | 0.64% | | | 0.63% | | | 0.62% | | | 0.62% | | | 0.65% | |
| | Ratio of Net Investment Income/(Loss) | | 6.27% | | | 4.80% | | | 5.05% | | | 5.47% | | | 5.61% | |
| Portfolio Turnover Rate | | 73% | | | 81% | | | 120% | | | 146% | | | 110% | |
| | | | | | | | | | | | | | | | | | | |
| |
* Total return includes adjustments in accordance with generally accepted accounting principles required at the year or period end and are not annualized for periods of less than one full year. ** Annualized for periods of less than one full year. (1) Per share amounts are calculated based on average shares outstanding during the year or period. |
| | |
See Notes to Financial Statements. |
| |
26 | JUNE 30, 2023 |
Janus Henderson High-Yield Fund
Financial Highlights
| | | | | | | | | | | | | | | | | | | |
Class R Shares | | | | | | | | | | | | | | | |
For a share outstanding during the year ended June 30 | | 2023 | | | 2022 | | | 2021 | | | 2020 | | | 2019 | |
| Net Asset Value, Beginning of Period | | $6.99 | | | $8.63 | | | $7.76 | | | $8.33 | | | $8.18 | |
| Income/(Loss) from Investment Operations: | | | | | | | | | | | | | | | |
| | Net investment income/(loss)(1) | | 0.39 | | | 0.33 | | | 0.35 | | | 0.38 | | | 0.39 | |
| | Net realized and unrealized gain/(loss) | | 0.05 | | | (1.63) | | | 0.89 | | | (0.57) | | | 0.15 | |
| Total from Investment Operations | | 0.44 | | | (1.30) | | | 1.24 | | | (0.19) | | | 0.54 | |
| Less Dividends and Distributions: | | | | | | | | | | | | | | | |
| | Dividends (from net investment income) | | (0.39) | | | (0.34) | | | (0.37) | | | (0.38) | | | (0.39) | |
| Total Dividends and Distributions | | (0.39) | | | (0.34) | | | (0.37) | | | (0.38) | | | (0.39) | |
| Net Asset Value, End of Period | | $7.04 | | | $6.99 | | | $8.63 | | | $7.76 | | | $8.33 | |
| Total Return* | | 6.41% | | | (15.56)% | | | 16.20% | | | (2.41)% | | | 6.89% | |
| Net Assets, End of Period (in thousands) | | $7,071 | | | $6,351 | | | $7,788 | | | $1,551 | | | $1,623 | |
| Average Net Assets for the Period (in thousands) | | $6,544 | | | $7,434 | | | $3,865 | | | $1,538 | | | $1,397 | |
| Ratios to Average Net Assets**: | | | | | | | | | | | | | | | |
| | Ratio of Gross Expenses | | 1.45% | | | 1.41% | | | 1.45% | | | 1.57% | | | 1.62% | |
| | Ratio of Net Expenses (After Waivers and Expense Offsets) | | 1.39% | | | 1.38% | | | 1.39% | | | 1.45% | | | 1.48% | |
| | Ratio of Net Investment Income/(Loss) | | 5.60% | | | 4.02% | | | 4.20% | | | 4.64% | | | 4.82% | |
| Portfolio Turnover Rate | | 73% | | | 81% | | | 120% | | | 146% | | | 110% | |
| | | | | | | | | | | | | | | | | | | |
| |
* Total return includes adjustments in accordance with generally accepted accounting principles required at the year or period end and are not annualized for periods of less than one full year. ** Annualized for periods of less than one full year. (1) Per share amounts are calculated based on average shares outstanding during the year or period. |
| | |
See Notes to Financial Statements. |
| |
Janus Investment Fund | 27 |
Janus Henderson High-Yield Fund
Financial Highlights
| | | | | | | | | | | | | | | | | | | |
Class S Shares | | | | | | | | | | | | | | | |
For a share outstanding during the year ended June 30 | | 2023 | | | 2022 | | | 2021 | | | 2020 | | | 2019 | |
| Net Asset Value, Beginning of Period | | $7.00 | | | $8.65 | | | $7.78 | | | $8.35 | | | $8.19 | |
| Income/(Loss) from Investment Operations: | | | | | | | | | | | | | | | |
| | Net investment income/(loss)(1) | | 0.41 | | | 0.35 | | | 0.38 | | | 0.40 | | | 0.41 | |
| | Net realized and unrealized gain/(loss) | | 0.06 | | | (1.64) | | | 0.88 | | | (0.57) | | | 0.17 | |
| Total from Investment Operations | | 0.47 | | | (1.29) | | | 1.26 | | | (0.17) | | | 0.58 | |
| Less Dividends and Distributions: | | | | | | | | | | | | | | | |
| | Dividends (from net investment income) | | (0.41) | | | (0.36) | | | (0.39) | | | (0.40) | | | (0.42) | |
| Total Dividends and Distributions | | (0.41) | | | (0.36) | | | (0.39) | | | (0.40) | | | (0.42) | |
| Net Asset Value, End of Period | | $7.06 | | | $7.00 | | | $8.65 | | | $7.78 | | | $8.35 | |
| Total Return* | | 6.83% | | | (15.42)% | | | 16.47% | | | (2.14)% | | | 7.29% | |
| Net Assets, End of Period (in thousands) | | $1,260 | | | $1,449 | | | $2,237 | | | $1,859 | | | $1,496 | |
| Average Net Assets for the Period (in thousands) | | $1,534 | | | $1,946 | | | $2,057 | | | $1,687 | | | $1,833 | |
| Ratios to Average Net Assets**: | | | | | | | | | | | | | | | |
| | Ratio of Gross Expenses | | 1.35% | | | 1.28% | | | 1.27% | | | 1.30% | | | 1.31% | |
| | Ratio of Net Expenses (After Waivers and Expense Offsets) | | 1.13% | | | 1.13% | | | 1.15% | | | 1.19% | | | 1.22% | |
| | Ratio of Net Investment Income/(Loss) | | 5.83% | | | 4.25% | | | 4.53% | | | 4.90% | | | 5.07% | |
| Portfolio Turnover Rate | | 73% | | | 81% | | | 120% | | | 146% | | | 110% | |
| | | | | | | | | | | | | | | | | | | |
| |
* Total return includes adjustments in accordance with generally accepted accounting principles required at the year or period end and are not annualized for periods of less than one full year. ** Annualized for periods of less than one full year. (1) Per share amounts are calculated based on average shares outstanding during the year or period. |
| | |
See Notes to Financial Statements. |
| |
28 | JUNE 30, 2023 |
Janus Henderson High-Yield Fund
Financial Highlights
| | | | | | | | | | | | | | | | | | | |
Class T Shares | | | | | | | | | | | | | | | |
For a share outstanding during the year ended June 30 | | 2023 | | | 2022 | | | 2021 | | | 2020 | | | 2019 | |
| Net Asset Value, Beginning of Period | | $6.99 | | | $8.64 | | | $7.77 | | | $8.34 | | | $8.18 | |
| Income/(Loss) from Investment Operations: | | | | | | | | | | | | | | | |
| | Net investment income/(loss)(1) | | 0.43 | | | 0.37 | | | 0.40 | | | 0.42 | | | 0.44 | |
| | Net realized and unrealized gain/(loss) | | 0.05 | | | (1.64) | | | 0.88 | | | (0.57) | | | 0.16 | |
| Total from Investment Operations | | 0.48 | | | (1.27) | | | 1.28 | | | (0.15) | | | 0.60 | |
| Less Dividends and Distributions: | | | | | | | | | | | | | | | |
| | Dividends (from net investment income) | | (0.42) | | | (0.38) | | | (0.41) | | | (0.42) | | | (0.44) | |
| Total Dividends and Distributions | | (0.42) | | | (0.38) | | | (0.41) | | | (0.42) | | | (0.44) | |
| Net Asset Value, End of Period | | $7.05 | | | $6.99 | | | $8.64 | | | $7.77 | | | $8.34 | |
| Total Return* | | 7.12% | | | (15.21)% | | | 16.82% | | | (1.83)% | | | 7.64% | |
| Net Assets, End of Period (in thousands) | | $266,544 | | | $283,236 | | | $372,314 | | | $349,513 | | | $442,866 | |
| Average Net Assets for the Period (in thousands) | | $277,063 | | | $351,039 | | | $364,038 | | | $411,154 | | | $460,568 | |
| Ratios to Average Net Assets**: | | | | | | | | | | | | | | | |
| | Ratio of Gross Expenses | | 0.90% | | | 0.87% | | | 0.87% | | | 0.87% | | | 0.89% | |
| | Ratio of Net Expenses (After Waivers and Expense Offsets) | | 0.87% | | | 0.86% | | | 0.85% | | | 0.86% | | | 0.89% | |
| | Ratio of Net Investment Income/(Loss) | | 6.10% | | | 4.53% | | | 4.82% | | | 5.21% | | | 5.39% | |
| Portfolio Turnover Rate | | 73% | | | 81% | | | 120% | | | 146% | | | 110% | |
| | | | | | | | | | | | | | | | | | | |
| |
* Total return includes adjustments in accordance with generally accepted accounting principles required at the year or period end and are not annualized for periods of less than one full year. ** Annualized for periods of less than one full year. (1) Per share amounts are calculated based on average shares outstanding during the year or period. |
| | |
See Notes to Financial Statements. |
| |
Janus Investment Fund | 29 |
Janus Henderson High-Yield Fund
Notes to Financial Statements
1. Organization and Significant Accounting Policies
Janus Henderson High-Yield Fund (the “Fund”) is a series of Janus Investment Fund (the “Trust”), which is organized as a Massachusetts business trust and is registered under the Investment Company Act of 1940, as amended (the “1940 Act”), as an open-end management investment company, and therefore has applied the specialized accounting and reporting guidance in Financial Accounting Standards Board (“FASB”) Accounting Standards Codification (“ASC”) Topic 946. The Trust offers 39 funds, each of which offers multiple share classes, with differing investment objectives and policies. The Fund seeks to obtain high current income. Capital appreciation is a secondary investment objective when consistent with its primary investment objective. The Fund is classified as diversified, as defined in the 1940 Act. Janus Henderson Investors US LLC is the investment adviser (the “Adviser”) to the Fund.
The Fund offers multiple classes of shares in order to meet the needs of various types of investors. Each class represents an interest in the same portfolio of investments. Certain financial intermediaries may not offer all classes of shares.
Shareholders, including other funds, individuals, accounts, as well as the Fund’s portfolio manager(s) and/or investment personnel, may from time to time own (beneficially or of record) a significant percentage of the Fund’s Shares and can be considered to “control” the Fund when that ownership exceeds 25% of the Fund’s assets (and which may differ from control as determined in accordance with United States of America generally accepted accounting principles ("US GAAP")).
Class A Shares are offered through financial intermediary platforms including, but not limited to, traditional brokerage platforms, mutual fund wrap fee programs, bank trust platforms, and retirement platforms.
Class C Shares are offered through financial intermediary platforms including, but not limited to, traditional brokerage platforms, mutual fund wrap fee programs, and bank trust platforms.
Class C Shares are closed to investments by new employer-sponsored retirement plans and existing employer-sponsored retirement plans are no longer able to make additional purchases or exchanges into Class C Shares.
The Fund currently implements an automatic conversion feature pursuant to which Class C Shares that have been held for eight years are automatically converted to Class A Shares without the imposition of any sales charge, fee or other charge. The conversion will generally occur no later than ten business days in the month following the month of the eighth anniversary of the date of purchase. Class C Shares purchased through the reinvestment of dividends and other distributions on Class C Shares will convert to Class A Shares at the same time as the original Class C Shares with respect to which they were purchased. For Class C Shares held in omnibus accounts on intermediary platforms, the Fund relies on these intermediaries to implement this conversion feature. Your financial intermediary may have separate policies and procedures as to when and how Class C Shares may be converted to Class A Shares.
Effective July 6, 2020, Class D Shares are available to new investors, subject to any closed fund policies for a Fund, as applicable. Previously, Class D Shares were only available to investors who already had a direct account with the Janus Henderson funds; immediate family members or members of the same household of an eligible individual investor; and existing beneficial owners of sole proprietorships or partnerships that hold accounts directly with the Janus Henderson funds.
Class I Shares are available through certain financial intermediary platforms including, but not limited to, mutual fund wrap fee programs, managed account programs, asset allocation programs, bank trust platforms, as well as certain retirement platforms. Class I Shares are also available to certain direct institutional investors including, but not limited to, corporations, certain retirement plans, public plans, and foundations/endowments, who established Class I Share accounts before August 4, 2017.
Class N Shares are generally available only to financial intermediaries purchasing on behalf of: 1) certain adviser-assisted, employer-sponsored retirement plans, including 401(k) plans, 457 plans, 403(b) plans, Taft-Hartley multi-employer plans, profit-sharing and money purchase pension plans, defined benefit plans and certain welfare benefit plans, such as health savings accounts, and nonqualified deferred compensation plans; and 2) retail investors purchasing in qualified or nonqualified accounts, whose accounts are held through an omnibus account at their financial intermediary, and where the financial intermediary requires no payment or reimbursement from the Fund, the Adviser, or its affiliates. Class N Shares are also available to Janus Henderson proprietary products and to certain direct institutional investors approved by Janus Henderson Distributors US LLC (the “Distributor”) including, but not limited to,
Janus Henderson High-Yield Fund
Notes to Financial Statements
corporations, certain retirement plans, public plans, and foundations and endowments, subject to minimum investment requirements.
Class R Shares are offered through financial intermediary platforms including, but not limited to, retirement platforms.
Class S Shares are offered through financial intermediary platforms including, but not limited to, retirement platforms and asset allocation, mutual fund wrap, or other discretionary or nondiscretionary fee-based investment advisory programs. In addition, Class S Shares may be available through certain financial intermediaries who have an agreement with the Adviser or its affiliates to offer Class S Shares on their supermarket platforms.
Class T Shares are available through certain financial intermediary platforms including, but not limited to, mutual fund wrap fee programs, managed account programs, asset allocation programs, bank trust platforms, as well as certain retirement platforms. In addition, Class T Shares may be available through certain financial intermediaries who have an agreement with the Adviser or its affiliates to offer Class T Shares on their supermarket platforms.
The following accounting policies have been followed by the Fund and are in conformity with US GAAP.
Investment Valuation
Fund holdings are valued in accordance with policies and procedures established by the Adviser pursuant to Rule 2a-5 under the 1940 Act and approved by and subject to the oversight of the Trustees (the “Valuation Procedures”). Equity securities traded on a domestic securities exchange are generally valued at readily available market quotations, which are (i) the official close prices or (ii) last sale prices on the primary market or exchange in which the securities trade. If such price is lacking for the trading period immediately preceding the time of determination, such securities are generally valued at their current bid price. Equity securities that are traded on a foreign exchange are generally valued at the closing prices on such markets. In the event that there is no current trading volume on a particular security in such foreign exchange, the bid price from the primary exchange is generally used to value the security. Foreign securities and currencies are converted to U.S. dollars using the current spot USD dollar exchange rate in effect at the close of the New York Stock Exchange (“NYSE”). The Adviser will determine the market value of individual securities held by it by using prices provided by one or more Adviser-approved professional pricing services or, as needed, by obtaining market quotations from independent broker-dealers. Most debt securities are valued in accordance with the evaluated bid price supplied by the pricing service that is intended to reflect market value. The evaluated bid price supplied by the pricing service is an evaluation that may consider factors such as security prices, yields, maturities and ratings. Certain short-term securities maturing within 60 days or less may be evaluated and valued on an amortized cost basis provided that the amortized cost determined approximates market value. Securities for which market quotations or evaluated prices are not readily available or deemed unreliable are valued at fair value determined in good faith by the Adviser pursuant to the Valuation Procedures. Circumstances in which fair valuation may be utilized include, but are not limited to: (i) a significant event that may affect the securities of a single issuer, such as a merger, bankruptcy, or significant issuer-specific development; (ii) an event that may affect an entire market, such as a natural disaster or significant governmental action; (iii) a nonsignificant event such as a market closing early or not opening, or a security trading halt; and (iv) pricing of a nonvalued security and a restricted or nonpublic security. Special valuation considerations may apply with respect to “odd-lot” fixed-income transactions which, due to their small size, may receive evaluated prices by pricing services which reflect a large block trade and not what actually could be obtained for the odd-lot position. The value of the securities of other mutual funds held by the Fund, if any, will be calculated using the NAV of such mutual funds, and the prospectuses for such mutual funds explain the circumstances under which they use fair valuation and the effects of using fair valuation. The value of the securities of any cash management pooled investment vehicles that operate as money market funds held by the Fund, if any, will be calculated using the NAV of such funds.
Valuation Inputs Summary
FASB ASC 820, Fair Value Measurements and Disclosures (“ASC 820”), defines fair value, establishes a framework for measuring fair value, and expands disclosure requirements regarding fair value measurements. This standard emphasizes that fair value is a market-based measurement that should be determined based on the assumptions that market participants would use in pricing an asset or liability and establishes a hierarchy that prioritizes inputs to valuation techniques used to measure fair value. These inputs are summarized into three broad levels:
Level 1 – Unadjusted quoted prices in active markets the Fund has the ability to access for identical assets or liabilities.
Janus Henderson High-Yield Fund
Notes to Financial Statements
Level 2 – Observable inputs other than unadjusted quoted prices included in Level 1 that are observable for the asset or liability either directly or indirectly. These inputs may include quoted prices for the identical instrument on an inactive market, prices for similar instruments, interest rates, prepayment speeds, credit risk, yield curves, default rates and similar data.
Assets or liabilities categorized as Level 2 in the hierarchy generally include: debt securities fair valued in accordance with the evaluated bid or ask prices supplied by a pricing service; securities traded on OTC markets and listed securities for which no sales are reported that are fair valued at the latest bid price (or yield equivalent thereof) obtained from one or more dealers transacting in a market for such securities or by a pricing service approved by the Fund’s Trustees; certain short-term debt securities with maturities of 60 days or less that are fair valued at amortized cost; and equity securities of foreign issuers whose fair value is determined by using systematic fair valuation models provided by independent third parties in order to adjust for stale pricing which may occur between the close of certain foreign exchanges and the close of the NYSE. Other securities that may be categorized as Level 2 in the hierarchy include, but are not limited to, preferred stocks, bank loans, swaps, investments in unregistered investment companies, options, and forward contracts.
Level 3 – Unobservable inputs for the asset or liability to the extent that relevant observable inputs are not available, representing the Fund’s own assumptions about the assumptions that a market participant would use in valuing the asset or liability, and that would be based on the best information available.
There have been no significant changes in valuation techniques used in valuing any such positions held by the Fund since the beginning of the fiscal year.
The inputs or methodology used for fair valuing securities are not necessarily an indication of the risk associated with investing in those securities. The summary of inputs used as of June 30, 2023 to fair value the Fund’s investments in securities and other financial instruments is included in the “Valuation Inputs Summary” in the Notes to Schedule of Investments and Other Information.
The Fund did not hold a significant amount of Level 3 securities as of June 30, 2023.
Investment Transactions and Investment Income
Investment transactions are accounted for as of the date purchased or sold (trade date). Dividend income is recorded on the ex-dividend date. Certain dividends from foreign securities will be recorded as soon as the Fund is informed of the dividend, if such information is obtained subsequent to the ex-dividend date. Dividends from foreign securities may be subject to withholding taxes in foreign jurisdictions. Non-cash dividends, if any, are recorded on the ex-dividend date at fair value. Interest income is recorded daily on the accrual basis and includes amortization of premiums and accretion of discounts. The Fund classifies gains and losses on prepayments received as an adjustment to interest income. Debt securities may be placed in non-accrual status and related interest income may be reduced by stopping current accruals and writing off interest receivables when collection of all or a portion of interest has become doubtful. Gains and losses are determined on the identified cost basis, which is the same basis used for federal income tax purposes. Income, as well as gains and losses, both realized and unrealized, are allocated daily to each class of shares based upon the ratio of net assets represented by each class as a percentage of total net assets.
Expenses
The Fund bears expenses incurred specifically on its behalf. Each class of shares bears a portion of general expenses, which are allocated daily to each class of shares based upon the ratio of net assets represented by each class as a percentage of total net assets. Expenses directly attributable to a specific class of shares are charged against the operations of such class.
Estimates
The preparation of financial statements in conformity with US GAAP requires management to make estimates and assumptions that affect the reported amount of assets and liabilities and disclosure of contingent assets and liabilities at the date of the financial statements, and the reported amounts of income and expenses during the reporting period. Actual results could differ from those estimates.
Indemnifications
In the normal course of business, the Fund may enter into contracts that contain provisions for indemnification of other parties against certain potential liabilities. The Fund’s maximum exposure under these arrangements is unknown, and
Janus Henderson High-Yield Fund
Notes to Financial Statements
would involve future claims that may be made against the Fund that have not yet occurred. Currently, the risk of material loss from such claims is considered remote.
Foreign Currency Translations
The Fund does not isolate that portion of the results of operations resulting from the effect of changes in foreign exchange rates on investments from the fluctuations arising from changes in market prices of securities held at the date of the financial statements. Net unrealized appreciation or depreciation of investments and foreign currency translations arise from changes in the value of assets and liabilities, including investments in securities held at the date of the financial statements, resulting from changes in the exchange rates and changes in market prices of securities held.
Currency gains and losses are also calculated on payables and receivables that are denominated in foreign currencies. The payables and receivables are generally related to foreign security transactions and income translations.
Foreign currency-denominated assets and forward currency contracts may involve more risks than domestic transactions, including currency risk, counterparty risk, political and economic risk, regulatory risk and equity risk. Risks may arise from unanticipated movements in the value of foreign currencies relative to the U.S. dollar.
Dividends and Distributions
Dividends are declared daily and distributed monthly for the Fund. Realized capital gains, if any, are declared and distributed in December. The Fund may treat a portion of the amount paid to redeem shares as a distribution of investment company taxable income and realized capital gains that are reflected in the net asset value. This practice, commonly referred to as “equalization,” has no effect on the redeeming shareholder or a Fund’s total return, but may reduce the amounts that would otherwise be required to be paid as taxable dividends to the remaining shareholders. It is possible that the Internal Revenue Service (IRS) could challenge the Fund's equalization methodology or calculations, and any such challenge could result in additional tax, interest, or penalties to be paid by the Fund.
The Fund may make certain investments in real estate investment trusts (“REITs”) which pay dividends to their shareholders based upon funds available from operations. It is quite common for these dividends to exceed the REITs’ taxable earnings and profits, resulting in the excess portion of such dividends being designated as a return of capital. If the Fund distributes such amounts, such distributions could constitute a return of capital to shareholders for federal income tax purposes.
Federal Income Taxes
The Fund intends to continue to qualify as a regulated investment company and distribute all of its taxable income in accordance with the requirements of Subchapter M of the Internal Revenue Code. Management has analyzed the Fund’s tax positions taken for all open federal income tax years, generally a three-year period, and has concluded that no provision for federal income tax is required in the Fund’s financial statements. The Fund is not aware of any tax positions for which it is reasonably possible that the total amounts of unrecognized tax benefits will significantly change in the next twelve months.
2. Derivative Instruments
The Fund may invest in various types of derivatives, which may at times result in significant derivative exposure. A derivative is a financial instrument whose performance is derived from the performance of another asset. The Fund may invest in derivative instruments including, but not limited to: futures contracts, put options, call options, options on futures contracts, options on foreign currencies, options on recovery locks, options on security and commodity indices, swaps, forward contracts, structured investments, and other equity-linked derivatives. Each derivative instrument that was held by the Fund during the year ended June 30, 2023 is discussed in further detail below. A summary of derivative activity by the Fund is reflected in the tables at the end of the Schedule of Investments.
The Fund may use derivative instruments for hedging purposes (to offset risks associated with an investment, currency exposure, or market conditions), to adjust currency exposure relative to a benchmark index, or for speculative purposes (to earn income and seek to enhance returns). When the Fund invests in a derivative for speculative purposes, the Fund will be fully exposed to the risks of loss of that derivative, which may sometimes be greater than the derivative’s cost. The Fund may not use any derivative to gain exposure to an asset or class of assets that it would be prohibited by its investment restrictions from purchasing directly. The Fund’s ability to use derivative instruments may also be limited by tax considerations.
Janus Henderson High-Yield Fund
Notes to Financial Statements
Investments in derivatives in general are subject to market risks that may cause their prices to fluctuate over time. Investments in derivatives may not directly correlate with the price movements of the underlying instrument. As a result, the use of derivatives may expose the Fund to additional risks that it would not be subject to if it invested directly in the securities underlying those derivatives. The use of derivatives may result in larger losses or smaller gains than otherwise would be the case. Derivatives can be volatile and may involve significant risks.
In pursuit of its investment objective, the Fund may seek to use derivatives to increase or decrease exposure to the following market risk factors:
· Commodity Risk – the risk related to the change in value of commodities or commodity-linked investments due to changes in the overall market movements, volatility of the underlying benchmark, changes in interest rates, or other factors affecting a particular industry or commodity such as drought, floods, weather, livestock disease, embargoes, tariffs, and international economic, political, and regulatory developments.
· Counterparty Risk – the risk that the counterparty (the party on the other side of the transaction) on a derivative transaction will be unable to honor its financial obligation to the Fund.
· Credit Risk – the risk an issuer will be unable to make principal and interest payments when due, or will default on its obligations.
· Currency Risk – the risk that changes in the exchange rate between currencies will adversely affect the value (in U.S. dollar terms) of an investment.
· Equity Risk – the risk related to the change in value of equity securities as they relate to increases or decreases in the general market.
· Index Risk – if the derivative is linked to the performance of an index, it will be subject to the risks associated with changes in that index. If the index changes, the Fund could receive lower interest payments or experience a reduction in the value of the derivative to below what the Fund paid. Certain indexed securities, including inverse securities (which move in an opposite direction to the index), may create leverage, to the extent that they increase or decrease in value at a rate that is a multiple of the changes in the applicable index.
· Interest Rate Risk – the risk that the value of fixed-income securities will generally decline as prevailing interest rates rise, which may cause the Fund’s NAV to likewise decrease.
· Leverage Risk – the risk associated with certain types of leveraged investments or trading strategies pursuant to which relatively small market movements may result in large changes in the value of an investment. The Fund creates leverage by investing in instruments, including derivatives, where the investment loss can exceed the original amount invested. Certain investments or trading strategies, such as short sales, that involve leverage can result in losses that greatly exceed the amount originally invested.
· Liquidity Risk – the risk that certain securities may be difficult or impossible to sell at the time that the seller would like or at the price that the seller believes the security is currently worth.
Derivatives may generally be traded OTC or on an exchange. Derivatives traded OTC are agreements that are individually negotiated between parties and can be tailored to meet a purchaser’s needs. OTC derivatives are not guaranteed by a clearing agency and may be subject to increased credit risk.
In an effort to mitigate credit risk associated with derivatives traded OTC, the Fund may enter into collateral agreements with certain counterparties whereby, subject to certain minimum exposure requirements, the Fund may require the counterparty to post collateral if the Fund has a net aggregate unrealized gain on all OTC derivative contracts with a particular counterparty. Additionally, the Fund may deposit cash and/or treasuries as collateral with the counterparty and/or custodian daily (based on the daily valuation of the financial asset) if the Fund has a net aggregate unrealized loss on OTC derivative contracts with a particular counterparty. All liquid securities and restricted cash are considered to cover in an amount at all times equal to or greater than the Fund’s commitment with respect to certain exchange-traded derivatives, centrally cleared derivatives, forward foreign currency exchange contracts, short sales, and/or securities with extended settlement dates. There is no guarantee that counterparty exposure is reduced and these arrangements are dependent on the Adviser’s ability to establish and maintain appropriate systems and trading.
Janus Henderson High-Yield Fund
Notes to Financial Statements
Swaps
Swap agreements are two-party contracts entered into primarily by institutional investors for periods ranging from a day to more than one year to exchange one set of cash flows for another. The most significant factor in the performance of swap agreements is the change in value of the specific index, security, or currency, or other factors that determine the amounts of payments due to and from the Fund. The use of swaps is a highly specialized activity which involves investment techniques and risks different from those associated with ordinary portfolio securities transactions. Swap transactions may in some instances involve the delivery of securities or other underlying assets by the Fund or its counterparty to collateralize obligations under the swap. If the other party to a swap that is not collateralized defaults, the Fund would risk the loss of the net amount of the payments that it contractually is entitled to receive. Swap agreements entail the risk that a party will default on its payment obligations to the Fund. If the other party to a swap defaults, the Fund would risk the loss of the net amount of the payments that it contractually is entitled to receive. If the Fund utilizes a swap at the wrong time or judges market conditions incorrectly, the swap may result in a loss to the Fund and reduce the Fund’s total return.
Swap agreements also bear the risk that the Fund will not be able to meet its obligation to the counterparty. Swap agreements are typically privately negotiated and entered into in the OTC market. However, certain swap agreements are required to be cleared through a clearinghouse and traded on an exchange or swap execution facility. Swaps that are required to be cleared are required to post initial and variation margins in accordance with the exchange requirements. Regulations enacted require the Fund to centrally clear certain interest rate and credit default index swaps through a clearinghouse or central counterparty (“CCP”). To clear a swap with a CCP, the Fund will submit the swap to, and post collateral with, a futures clearing merchant (“FCM”) that is a clearinghouse member. Alternatively, the Fund may enter into a swap with a financial institution other than the FCM (the “Executing Dealer”) and arrange for the swap to be transferred to the FCM for clearing. The Fund may also enter into a swap with the FCM itself. The CCP, the FCM, and the Executing Dealer are all subject to regulatory oversight by the U.S. Commodity Futures Trading Commission (“CFTC”). A default or failure by a CCP or an FCM, or the failure of a swap to be transferred from an Executing Dealer to the FCM for clearing, may expose the Fund to losses, increase its costs, or prevent the Fund from entering or exiting swap positions, accessing collateral, or fully implementing its investment strategies. The regulatory requirement to clear certain swaps could, either temporarily or permanently, reduce the liquidity of cleared swaps or increase the costs of entering into those swaps.
Index swaps, interest rate swaps, inflation swaps and credit default swaps are valued using an approved vendor supplied price. Basket swaps are valued using a broker supplied price. Equity swaps that consist of a single underlying equity are valued either at the closing price, the latest bid price, or the last sale price on the primary market or exchange it trades. The market value of swap contracts are aggregated by positive and negative values and are disclosed separately as an asset or liability on the Fund’s Statement of Assets and Liabilities (if applicable). Realized gains and losses are reported on the Fund’s Statement of Operations (if applicable). The change in unrealized net appreciation or depreciation during the year is included in the Statement of Operations (if applicable).
The Fund’s maximum risk of loss from counterparty risk or credit risk is the discounted value of the payments to be received from/paid to the counterparty over the contract’s remaining life, to the extent that the amount is positive. The risk is mitigated by having a netting arrangement between the Fund and the counterparty and by the posting of collateral by the counterparty to cover the Fund’s exposure to the counterparty.
The Fund may enter into various types of credit default swap agreements, including OTC credit default swap agreements, for investment purposes, to add leverage to its Fund, or to hedge against widening credit spreads on high-yield/high-risk bonds. Credit default swaps are a specific kind of counterparty agreement that allow the transfer of third party credit risk from one party to the other. One party in the swap is a lender and faces credit risk from a third party, and the counterparty in the credit default swap agrees to insure this risk in exchange for regular periodic payments. Credit default swaps could result in losses if the Fund does not correctly evaluate the creditworthiness of the company or companies on which the credit default swap is based. Credit default swap agreements may involve greater risks than if the Fund had invested in the reference obligation directly since, in addition to risks relating to the reference obligation, credit default swaps are subject to illiquidity risk, counterparty risk, and credit risk. The Fund will generally incur a greater degree of risk when it sells a credit default swap than when it purchases a credit default swap. As a buyer of a credit default swap, the Fund may lose its investment and recover nothing should no credit event occur and the swap is held to its termination date. As seller of a credit default swap, if a credit event were to occur, the value of any deliverable
Janus Henderson High-Yield Fund
Notes to Financial Statements
obligation received by the Fund, coupled with the upfront or periodic payments previously received, may be less than what it pays to the buyer, resulting in a loss of value to the Fund.
As a buyer of credit protection, the Fund is entitled to receive the par (or other agreed-upon) value of a referenced debt obligation from the counterparty to the contract in the event of a default or other credit event by a third party, such as a U.S. or foreign issuer, on the debt obligation. In return, the Fund as buyer would pay to the counterparty a periodic stream of payments over the term of the contract provided that no credit event has occurred. If no credit event occurs, the Fund would have spent the stream of payments and potentially received no benefit from the contract.
If the Fund is the seller of credit protection against a particular security, the Fund would receive an up-front or periodic payment to compensate against potential credit events. As the seller in a credit default swap contract, the Fund would be required to pay the par value (the “notional value”) (or other agreed-upon value) of a referenced debt obligation to the counterparty in the event of a default by a third party, such as a U.S. or foreign corporate issuer, on the debt obligation. In return, the Fund would receive from the counterparty a periodic stream of payments over the term of the contract provided that no event of default has occurred. If no default occurs, the Fund would keep the stream of payments and would have no payment obligations. As the seller, the Fund would effectively add leverage to its portfolio because, in addition to its total net assets, the Fund would be subject to investment exposure on the notional value of the swap. The maximum potential amount of future payments (undiscounted) that the Fund as a seller could be required to make in a credit default transaction would be the notional amount of the agreement.
The Fund may invest in CDXs. A CDX is a swap on an index of credit default swaps. CDXs allow an investor to manage credit risk or take a position on a basket of credit entities (such as credit default swaps or commercial mortgage-backed securities) in a more efficient manner than transacting in a single-name CDS. If a credit event occurs in one of the underlying companies, the protection is paid out via the delivery of the defaulted bond by the buyer of protection in return for a payment of notional value of the defaulted bond by the seller of protection or it may be settled through a cash settlement between the two parties. The underlying company is then removed from the index. If the Fund holds a long position in a CDX, the Fund would indirectly bear its proportionate share of any expenses paid by a CDX. A Fund holding a long position in CDXs typically receives income from principal or interest paid on the underlying securities. By investing in CDXs, the Fund could be exposed to illiquidity risk, counterparty risk, and credit risk of the issuers of the underlying loan obligations and of the CDX markets. If there is a default by the CDX counterparty, the Fund will have contractual remedies pursuant to the agreements related to the transaction. CDXs also bear the risk that the Fund will not be able to meet its obligation to the counterparty.
During the year, the Fund purchased protection via the credit default swap market in order to reduce credit risk exposure to individual corporates, countries and/or credit indices where reducing this exposure via the cash bond market was less attractive.
There were no credit default swaps held at June 30, 2023.
3. Other Investments and Strategies
Market Risk
The Fund may be invested in lower-rated debt securities that have a higher risk of default or loss of value since these securities may be sensitive to economic changes, political changes, or adverse developments specific to the issuer.
The value of the Fund’s portfolio may decrease if the value of one or more issuers in the Fund’s portfolio decreases. Further, regardless of how well individual companies or securities perform, the value of the Fund’s portfolio could also decrease if there are deteriorating economic or market conditions, including, but not limited to, a general decline in prices on the stock markets, a general decline in real estate markets, a decline in commodities prices, or if the market favors different types of securities than the types of securities in which the Fund invests. If the value of the Fund’s portfolio decreases, the Fund’s NAV will also decrease, which means if you sell your shares in the Fund you may lose money. Market risk may affect a single issuer, industry, economic sector, or the market as a whole. The increasing interconnectivity between global economies and financial markets increases the likelihood that events or conditions in one region or financial market may adversely impact issuers in a different country, region or financial market. Social, political, economic and other conditions and events, such as natural disasters, health emergencies (e.g., epidemics and pandemics), terrorism, conflicts, including related sanctions, and social unrest, could reduce consumer demand or economic output, result in market closures, travel restrictions and/or quarantines, and generally have a significant impact on the global economies and financial markets.
Janus Henderson High-Yield Fund
Notes to Financial Statements
• COVID-19 Pandemic. The effects of COVID-19 have contributed to increased volatility in global financial markets and have affected and may continue to affect certain countries, regions, issuers, industries and market sectors more dramatically than others. These conditions and events could have a significant impact on the Fund and its investments, the Fund’s ability to meet redemption requests, and the processes and operations of the Fund’s service providers, including the Adviser.
• Russia/Ukraine Invasion. Russia launched a large-scale invasion of Ukraine on February 24, 2022. The extent and duration of the military action, resulting sanctions and resulting future market disruptions in the region are impossible to predict, but could be significant and have a severe adverse effect on the region, including significant negative impacts on the economy and the markets for certain securities and commodities, such as oil and natural gas, as well as other sectors.
Loans
The Fund may invest in various commercial loans, including bank loans, bridge loans, debtor-in-possession (“DIP”) loans, mezzanine loans, and other fixed and floating rate loans. These loans may be acquired through loan participations and assignments or on a when-issued basis. Commercial loans will comprise no more than 20% of the Fund’s total assets. Below are descriptions of the types of loans held by the Fund as of June 30, 2023.
· Bank Loans - Bank loans are obligations of companies or other entities entered into in connection with recapitalizations, acquisitions, and refinancings. The Fund’s investments in bank loans are generally acquired as a participation interest in, or assignment of, loans originated by a lender or other financial institution. These investments may include institutionally-traded floating and fixed-rate debt securities.
· Floating Rate Loans – Floating rate loans are debt securities that have floating interest rates, that adjust periodically, and are tied to a benchmark lending rate, such as London Interbank Offered Rate (“LIBOR”). In other cases, the lending rate could be tied to the prime rate offered by one or more major U.S. banks or the rate paid on large certificates of deposit traded in the secondary markets. If the benchmark lending rate changes, the rate payable to lenders under the loan will change at the next scheduled adjustment date specified in the loan agreement. Floating rate loans are typically issued to companies (‘‘borrowers’’) in connection with recapitalizations, acquisitions, and refinancings. Floating rate loan investments are generally below investment grade. Senior floating rate loans are secured by specific collateral of a borrower and are senior in the borrower’s capital structure. The senior position in the borrower’s capital structure generally gives holders of senior loans a claim on certain of the borrower’s assets that is senior to subordinated debt and preferred and common stock in the case of a borrower’s default. Floating rate loan investments may involve foreign borrowers, and investments may be denominated in foreign currencies. Floating rate loans often involve borrowers whose financial condition is troubled or uncertain and companies that are highly leveraged. The Fund may invest in obligations of borrowers who are in bankruptcy proceedings. While the Fund generally expects to invest in fully funded term loans, certain of the loans in which the Fund may invest include revolving loans, bridge loans, and delayed draw term loans.
Purchasers of floating rate loans may pay and/or receive certain fees. The Fund may receive fees such as covenant waiver fees or prepayment penalty fees. The Fund may pay fees such as facility fees. Such fees may affect the Fund’s return.
· Mezzanine Loans - Mezzanine loans are secured by the stock of the company that owns the assets. Mezzanine loans are a hybrid of debt and equity financing that is typically used to fund the expansion of existing companies. A mezzanine loan is composed of debt capital that gives the lender the right to convert to an ownership or equity interest in the company if the loan is not paid back in time and in full. Mezzanine loans typically are the most subordinated debt obligation in an issuer’s capital structure.
Mortgage- and Asset-Backed Securities
Mortgage- and asset-backed securities represent interests in “pools” of commercial or residential mortgages or other assets, including consumer and commercial loans or receivables. The Fund may purchase fixed or variable rate commercial or residential mortgage-backed securities issued by the Government National Mortgage Association (“Ginnie Mae”), the Federal National Mortgage Association (“Fannie Mae”), the Federal Home Loan Mortgage Corporation (“Freddie Mac”), or other governmental or government-related entities. Ginnie Mae’s guarantees are backed as to the timely payment of principal and interest by the full faith and credit of the U.S. Government. Fannie Mae and Freddie Mac securities are not backed by the full faith and credit of the U.S. Government. In September 2008, the
Janus Henderson High-Yield Fund
Notes to Financial Statements
Federal Housing Finance Agency (“FHFA”), an agency of the U.S. Government, placed Fannie Mae and Freddie Mac under conservatorship. Since that time, Fannie Mae and Freddie Mac have received capital support through U.S. Treasury preferred stock purchases and Treasury and Federal Reserve purchases of their mortgage-backed securities. The FHFA and the U.S. Treasury have imposed strict limits on the size of these entities’ mortgage portfolios. The FHFA has the power to cancel any contract entered into by Fannie Mae and Freddie Mac prior to FHFA’s appointment as conservator or receiver, including the guarantee obligations of Fannie Mae and Freddie Mac.
The Fund may also purchase other mortgage- and asset-backed securities through single- and multi-seller conduits, collateralized debt obligations, structured investment vehicles, and other similar securities. Asset-backed securities may be backed by various consumer obligations, including automobile loans, equipment leases, credit card receivables, or other collateral. In the event the underlying loans are not paid, the securities’ issuer could be forced to sell the assets and recognize losses on such assets, which could impact your return. Unlike traditional debt instruments, payments on these securities include both interest and a partial payment of principal. Mortgage- and asset-backed securities are subject to both extension risk, where borrowers pay off their debt obligations more slowly in times of rising interest rates, and prepayment risk, where borrowers pay off their debt obligations sooner than expected in times of declining interest rates. These risks may reduce the Fund’s returns. In addition, investments in mortgage- and asset-backed securities, including those comprised of subprime mortgages, may be subject to a higher degree of credit risk, valuation risk, extension risk (if interest rates rise), and liquidity risk than various other types of fixed-income securities. Additionally, although mortgage-backed securities are generally supported by some form of government or private guarantee and/or insurance, there is no assurance that guarantors or insurers will meet their obligations.
Counterparties
Fund transactions involving a counterparty are subject to the risk that the counterparty or a third party will not fulfill its obligation to the Fund (“counterparty risk”). Counterparty risk may arise because of the counterparty’s financial condition (i.e., financial difficulties, bankruptcy, or insolvency), market activities and developments, or other reasons, whether foreseen or not. A counterparty’s inability to fulfill its obligation may result in significant financial loss to the Fund. The Fund may be unable to recover its investment from the counterparty or may obtain a limited recovery, and/or recovery may be delayed. The extent of the Fund’s exposure to counterparty risk with respect to financial assets and liabilities approximates its carrying value. See the "Offsetting Assets and Liabilities" section of this Note for further details.
The Fund may be exposed to counterparty risk through participation in various programs, including, but not limited to, lending its securities to third parties, cash sweep arrangements whereby the Fund’s cash balance is invested in one or more types of cash management vehicles, as well as investments in, but not limited to, repurchase agreements, debt securities, and derivatives, including various types of swaps, futures and options. The Fund intends to enter into financial transactions with counterparties that the Adviser believes to be creditworthy at the time of the transaction. There is always the risk that the Adviser’s analysis of a counterparty’s creditworthiness is incorrect or may change due to market conditions. To the extent that the Fund focuses its transactions with a limited number of counterparties, it will have greater exposure to the risks associated with one or more counterparties.
Securities Lending
Under procedures adopted by the Trustees, the Fund may seek to earn additional income by lending securities to certain qualified broker-dealers and institutions. JPMorgan Chase Bank, National Association acts as securities lending agent and a limited purpose custodian or subcustodian to receive and disburse cash balances and cash collateral, hold short-term investments, hold collateral, and perform other custodial functions in accordance with the Non-Custodial Securities Lending Agreement. For financial reporting purposes, the Fund does not offset financial instruments’ payables and receivables and related collateral on the Statement of Assets and Liabilities. The Fund may lend fund securities in an amount equal to up to 1/3 of its total assets as determined at the time of the loan origination. There is the risk of delay in recovering a loaned security or the risk of loss in collateral rights if the borrower fails financially. In addition, the Adviser makes efforts to balance the benefits and risks from granting such loans. All loans will be continuously secured by collateral which may consist of cash, U.S. Government securities, domestic and foreign short-term debt instruments, letters of credit, time deposits, repurchase agreements, money market mutual funds or other money market accounts, or such other collateral as permitted by the SEC. If the Fund is unable to recover a security on loan, the Fund may use the collateral to purchase replacement securities in the market. There is a risk that the value of the collateral could decrease below the cost of the replacement security by the time the replacement investment is made, resulting in a loss to the Fund. In certain circumstances individual loan transactions could yield negative returns.
Janus Henderson High-Yield Fund
Notes to Financial Statements
Upon receipt of cash collateral, the Adviser may invest it in affiliated or non-affiliated cash management vehicles, whether registered or unregistered entities, as permitted by the 1940 Act and rules promulgated thereunder. The Adviser currently intends to primarily invest the cash collateral in a cash management vehicle for which the Adviser serves as investment adviser, Janus Henderson Cash Collateral Fund LLC, or in time deposits. An investment in Janus Henderson Cash Collateral Fund LLC is generally subject to the same risks that shareholders experience when investing in similarly structured vehicles, such as the potential for significant fluctuations in assets as a result of the purchase and redemption activity of the securities lending program, a decline in the value of the collateral, and possible liquidity issues. Such risks may delay the return of the cash collateral and cause the Fund to violate its agreement to return the cash collateral to a borrower in a timely manner. As adviser to the Fund and Janus Henderson Cash Collateral Fund LLC, the Adviser has an inherent conflict of interest as a result of its fiduciary duties to both the Fund and Janus Henderson Cash Collateral Fund LLC. Additionally, the Adviser receives an investment advisory fee of 0.05% for managing Janus Henderson Cash Collateral Fund LLC, but it may not receive a fee for managing certain other affiliated cash management vehicles in which the Fund may invest, and therefore may have an incentive to allocate preferred investment opportunities to investment vehicles for which it is receiving a fee.
The value of the collateral must be at least 102% of the market value of the loaned securities that are denominated in U.S. dollars and 105% of the market value of the loaned securities that are not denominated in U.S. dollars. Loaned securities and related collateral are marked-to-market each business day based upon the market value of the loaned securities at the close of business, employing the most recent available pricing information. Collateral levels are then adjusted based on this mark-to-market evaluation. Additional required collateral, or excess collateral returned, is delivered on the next business day. Therefore, the value of the collateral held may be temporarily less than 102% or 105% value of the securities on loan. The cash collateral invested by the Adviser is disclosed in the Schedule of Investments (if applicable).
Income earned from the investment of the cash collateral, net of rebates paid to, or fees paid by, borrowers and less the fees paid to the lending agent are included as “Affiliated securities lending income, net” on the Statement of Operations. As of June 30, 2023, securities lending transactions accounted for as secured borrowings with an overnight and continuous contractual maturity are $33,176,749. Gross amounts of recognized liabilities for securities lending (collateral received) as of June 30, 2023 is $34,516,949, resulting in the net amount due to the counterparty of $1,340,200.
Offsetting Assets and Liabilities
The Fund presents gross and net information about transactions that are either offset in the financial statements or subject to an enforceable master netting arrangement or similar agreement with a designated counterparty, regardless of whether the transactions are actually offset in the Statement of Assets and Liabilities.
The Offsetting Assets and Liabilities table located in the Schedule of Investments presents gross amounts of recognized assets and/or liabilities and the net amounts after deducting collateral that has been pledged by counterparties or has been pledged to counterparties (if applicable). For corresponding information grouped by type of instrument, see the Fund's Schedule of Investments.
4. Investment Advisory Agreements and Other Transactions with Affiliates
The Fund pays the Adviser an investment advisory fee which is calculated daily and paid monthly. The following table reflects the Fund’s contractual investment advisory fee rate (expressed as an annual rate).
| | |
Average Daily Net Assets of the Fund | Contractual Investment Advisory Fee (%) |
First $300 Million | 0.65 |
Over $300 Million | 0.55 |
The Fund’s actual investment advisory fee rate for the reporting period was 0.59% of average annual net assets before any applicable waivers.
The Adviser has contractually agreed to waive the investment advisory fee and/or reimburse operating expenses to the extent that the Fund’s total annual fund operating expenses, excluding the fees payable pursuant to a Rule 12b-1 plan, shareholder servicing fees, such as transfer agency fees (including out-of-pocket costs), administrative services fees and any networking/omnibus payable by any share class, brokerage commissions, interest, dividends, taxes, acquired
Janus Henderson High-Yield Fund
Notes to Financial Statements
fund fees and expenses, and extraordinary expenses, exceed the annual rate of 0.63% of the Fund’s average daily net assets. The Adviser has agreed to continue the waivers for at least a one-year period commencing October 28, 2022. If applicable, amounts waived and/or reimbursed to the Fund by the Adviser are disclosed as “Excess Expense Reimbursement and Waivers” on the Statement of Operations.
The Adviser serves as administrator to the Fund pursuant to an administration agreement between the Adviser and the Trust. Under the administration agreement, the Adviser is authorized to perform, or cause others to perform certain administration, compliance, and accounting services to the Fund, including providing office space for the Fund, and is reimbursed by the Fund for certain of its costs in providing these services (to the extent the Adviser seeks reimbursement and such costs are not otherwise waived). In addition, employees of the Adviser and/or its affiliates may serve as officers of the Trust. The Fund pays for some or all of the salaries, fees, and expenses of the Adviser employees and Fund officers, with respect to certain specified administration functions they perform on behalf of the Fund. The Fund pays these costs based on out-of-pocket expenses incurred by the Adviser, and these costs are separate and apart from advisory fees and other expenses paid in connection with the investment advisory services the Adviser (or any subadvisor, as applicable) provides to the Fund. These amounts are disclosed as “Affiliated fund administration fees” on the Statement of Operations. In addition, some expenses related to compensation payable to the Fund’s Chief Compliance Officer and certain compliance staff, all of whom are employees of the Adviser and/or its affiliates, are shared with the Fund. Total compensation of $343,237 was paid to the Chief Compliance Officer and certain compliance staff by the Trust during the year ended June 30, 2023. The Fund's portion is reported as part of “Other expenses” on the Statement of Operations.
Janus Henderson Services US LLC (the “Transfer Agent”), a wholly-owned subsidiary of the Adviser, is the Fund’s transfer agent. The Transfer Agent provides or arranges for the provision of shareholder services including, but not limited to, recordkeeping, subaccounting, answering inquiries regarding accounts, order processing, transaction confirmations, the mailing of prospectuses and shareholder reports, and other shareholder services provided to or on behalf of shareholders. These amounts are disclosed as “Transfer agent administrative fees and expenses” on the Statement of Operations.
Class D Shares of the Fund pay the Transfer Agent an annual administrative services fee based on the average daily net assets of Class D Shares as detailed below.
| | |
Average Daily Net Assets of Class D Shares of the Janus Henderson funds | Administrative Services Fee |
Under $40 billion | 0.12% |
$40 billion – $49.9 billion | 0.10% |
Over $49.9 billion | 0.08% |
During the reporting period, the administrative services fee rate was 0.12%.
The Transfer Agent receives an administrative services fee at an annual rate of up to 0.25% of the average daily net assets of the Fund’s Class R Shares, Class S Shares, and Class T Shares for providing or procuring administrative services to investors in Class R Shares, Class S Shares, and Class T Shares of the Fund. The Transfer Agent expects to use all or a significant portion of this fee to compensate retirement plan service providers, broker-dealers, bank trust departments, financial advisors, and other financial intermediaries for providing these services. The Transfer Agent may keep certain amounts retained for reimbursement of out-of-pocket costs incurred for servicing clients of Class R Shares, Class S Shares, and Class T Shares.
Shareholder Services provided by these financial intermediaries may include, but are not limited to, recordkeeping, subaccounting, order processing, providing order confirmations, periodic statements, forwarding prospectuses, shareholder reports, and other materials to existing customers, answering inquiries regarding accounts, and other administrative services. Order processing includes the submission of transactions through the National Securities Clearing Corporation (“NSCC”) or similar systems, or those processed on a manual basis with the Adviser. For all share classes, the Transfer Agent also seeks reimbursement for costs it incurs as transfer agent and for providing servicing.
Certain, but not all, intermediaries may charge administrative fees to investors in Class A Shares, Class C Shares, and Class I Shares for administrative services provided on behalf of such investors. These administrative fees are paid by the Class A Shares, Class C Shares, and Class I Shares of the Fund to the Transfer Agent, which uses such fees to reimburse intermediaries. Consistent with the Transfer Agency Agreement between the Transfer Agent and the Fund, the Transfer Agent may negotiate the level, structure, and/or terms of the administrative fees with intermediaries
Janus Henderson High-Yield Fund
Notes to Financial Statements
requiring such fees on behalf of the Fund. The Adviser and its affiliates benefit from an increase in assets that may result from such relationships. The Adviser has agreed to limit these fees up to 0.20% for Class A Shares and Class C Shares, and up to 0.15% for Class I Shares on an annual basis based on the daily net assets of each share class. Such limits are subject to change by the Trustees in the future. These amounts are disclosed as “Transfer agent networking and omnibus fees” on the Statement of Operations.
The Transfer Agent is not compensated for its services related to the shares, except for out-of-pocket costs, although the Transfer Agent is compensated for its services related to Fund’s Class D Shares. These amounts are disclosed as “Other transfer agent fees and expenses” on the Statement of Operations.
Under distribution and shareholder servicing plans (the “Plans”) adopted in accordance with Rule 12b-1 under the 1940 Act, the Fund pays the Trust’s distributor, the Distributor, a wholly-owned subsidiary of the Adviser, a fee for the sale and distribution and/or shareholder servicing of the shares based on the average daily net assets for each share class at an annual rate of up to 0.25% for Class A Shares, up to 1.00% for Class C Shares, up to 0.50% for Class R Shares, and up to 0.25% for Class S Shares. Under the terms of the Plans, the Trust is authorized to make payments to the Distributor for remittance to retirement plan service providers, broker-dealers, bank trust departments, financial advisors, and other financial intermediaries, as compensation for distribution and/or shareholder services performed by such entities for their customers who are investors in the Fund. These amounts are disclosed as “12b-1 Distribution and shareholder servicing fees” on the Statement of Operations.
Class A Shares include a 4.75% upfront sales charge of the offering price of the Fund. The sales charge is allocated between the Distributor and financial intermediaries. During the year ended June 30, 2023, the Distributor retained upfront sales charges of $1,797.
A contingent deferred sales charge (“CDSC”) of 1.00% will be deducted with respect to Class A Shares purchased without a sales load and redeemed within 12 months of purchase, unless waived. Any applicable CDSC will be 1.00% of the lesser of the original purchase price or the value of the redemption of the Class A Shares redeemed. There were no CDSCs paid by redeeming shareholders of Class A Shares to the Distributor during the year ended June 30, 2023.
A CDSC of 1.00% will be deducted with respect to Class C Shares redeemed within 12 months of purchase, unless waived. Any applicable CDSC will be 1.00% of the lesser of the original purchase price or the value of the redemption of the Class C Shares redeemed. During the year ended June 30, 2023, redeeming shareholders of Class C Shares paid CDSCs of $613.
The Board of Trustees has adopted a deferred compensation plan (the “Deferred Plan”) for independent Trustees to elect to defer receipt of all or a portion of the annual compensation they are entitled to receive from the Fund. All deferred fees are credited to an account established in the name of the Trustees. The amounts credited to the account then increase or decrease, as the case may be, in accordance with the performance of one or more of the Janus Henderson funds that are selected by the Trustees. The account balance continues to fluctuate in accordance with the performance of the selected fund or funds until final payment of all amounts are credited to the account. The fluctuation of the account balance is recorded by the Fund as unrealized appreciation/(depreciation) and is included as of June 30, 2023 on the Statement of Assets and Liabilities in the asset, “Trustees’ deferred compensation,” and liability, “Trustees’ deferred compensation fees.” Additionally, the recorded unrealized appreciation/(depreciation) is included in “Total distributable earnings (loss)” on the Statement of Assets and Liabilities. Deferred compensation expenses for the year ended June 30, 2023 are included in “Trustees’ fees and expenses” on the Statement of Operations. Trustees are allowed to change their designation of mutual funds from time to time. Amounts will be deferred until distributed in accordance with the Deferred Plan. Deferred fees of $426,025 were paid by the Trust to the Trustees under the Deferred Plan during the year ended June 30, 2023.
Pursuant to the provisions of the 1940 Act and related rules, the Fund may participate in an affiliated or non-affiliated cash sweep program. In the cash sweep program, uninvested cash balances of the Fund may be used to purchase shares of affiliated or non-affiliated money market funds or cash management pooled investment vehicles that operate as money market funds. The Fund is eligible to participate in the cash sweep program (the “Investing Funds”). The Adviser has an inherent conflict of interest because of its fiduciary duties to the affiliated money market funds or cash management pooled investment vehicles and the Investing Funds. Janus Henderson Cash Liquidity Fund LLC (the “Sweep Vehicle”) is an affiliated unregistered cash management pooled investment vehicle that invests primarily in highly-rated short-term fixed-income securities. The Sweep Vehicle operates pursuant to the provisions of the 1940 Act that govern the operation of money market funds and prices its shares at NAV reflecting market-based values of its
Janus Henderson High-Yield Fund
Notes to Financial Statements
portfolio securities (i.e., a “floating” NAV) rounded to the fourth decimal place (e.g., $1.0000). The Sweep Vehicle is permitted to impose a liquidity fee (of up to 2%) on redemptions from the Sweep Vehicle or a redemption gate that temporarily suspends redemptions from the Sweep Vehicle for up to 10 business days during a 90 day period. There are no restrictions on the Fund's ability to withdraw investments from the Sweep Vehicle at will, and there are no unfunded capital commitments due from the Fund to the Sweep Vehicle. The Sweep Vehicle does not charge any management fee, sales charge or service fee.
Any purchases and sales, realized gains/losses and recorded dividends from affiliated investments during the year ended June 30, 2023 can be found in the “Schedules of Affiliated Investments” located in the Schedule of Investments.
5. Federal Income Tax
The tax components of capital shown in the table below represent: (1) distribution requirements the Fund must satisfy under the income tax regulations; (2) losses or deductions the Fund may be able to offset against income and gains realized in future years; and (3) unrealized appreciation or depreciation of investments for federal income tax purposes.
Other book to tax differences primarily consist of deferred compensation. The Fund has elected to treat gains and losses on forward foreign currency contracts as capital gains and losses, if applicable. Other foreign currency gains and losses on debt instruments are treated as ordinary income for federal income tax purposes pursuant to Section 988 of the Internal Revenue Code.
| | | | | | | |
| | | | Other Book | Net Tax | |
Undistributed
Ordinary Income | Undistributed
Long-Term Gains | Accumulated
Capital Losses | Loss Deferrals | to Tax
Differences | Appreciation/
(Depreciation) | |
$ - | $ - | $(288,310,435) | $ - | $ (10,365) | $(44,497,062) | |
Accumulated capital losses noted below represent net capital loss carryovers, as of June 30, 2023, that may be available to offset future realized capital gains and thereby reduce future taxable gains distributions. The following table shows these capital loss carryovers.
| | | | | | |
| | | | | |
Capital Loss Carryover Schedule | | |
For the year ended June 30, 2023 | | |
| No Expiration | | | |
| Short-Term | Long-Term | Accumulated
Capital Losses | | |
| $(103,405,253) | $(184,905,182) | $ (288,310,435) | | |
The aggregate cost of investments and the composition of unrealized appreciation and depreciation of investment securities for federal income tax purposes as of June 30, 2023 are noted below. The primary differences between book and tax appreciation or depreciation of investments are wash sale loss deferrals and investments in partnerships.
| | | | |
Federal Tax Cost | Unrealized
Appreciation | Unrealized
(Depreciation) | Net Tax Appreciation/
(Depreciation) |
$ 895,381,970 | $ 5,846,791 | $(50,343,853) | $ (44,497,062) |
Janus Henderson High-Yield Fund
Notes to Financial Statements
Income and capital gains distributions are determined in accordance with income tax regulations that may differ from US GAAP. These differences are due to differing treatments for items such as net short-term gains, deferral of wash sale losses and capital loss carryovers. Certain permanent differences such as tax returns of capital and net investment losses noted below have been reclassified to capital.
| | | | | |
For the year ended June 30, 2023 | |
Distributions | | |
From Ordinary Income | From Long-Term Capital Gains | Tax Return of Capital | Net Investment Loss | |
$ 53,888,404 | $ - | $ - | $ - | |
| | | | | |
For the year ended June 30, 2022 | |
Distributions | | |
From Ordinary Income | From Long-Term Capital Gains | Tax Return of Capital | Net Investment Loss | |
$ 54,068,428 | $ - | $ - | $ - | |
Permanent book to tax basis differences may result in reclassifications between the components of net assets. These differences have no impact on the results of operations or net assets.
Janus Henderson High-Yield Fund
Notes to Financial Statements
6. Capital Share Transactions
| | | | | | | |
| | | | | | |
| | Year ended June 30, 2023 | | Year ended June 30, 2022 |
| | Shares | Amount | | Shares | Amount |
| | | | | | | |
Class A Shares: | | | | | |
Shares sold | 1,135,338 | $ 7,980,217 | | 968,534 | $ 8,123,951 |
Reinvested dividends and distributions | 173,565 | 1,218,687 | | 154,236 | 1,262,944 |
Shares repurchased | (1,881,514) | (13,259,366) | | (2,063,242) | (17,218,141) |
Net Increase/(Decrease) | (572,611) | $ (4,060,462) | | (940,472) | $ (7,831,246) |
Class C Shares: | | | | | |
Shares sold | 81,372 | $ 574,356 | | 160,664 | $ 1,367,481 |
Reinvested dividends and distributions | 33,592 | 236,205 | | 31,007 | 253,507 |
Shares repurchased | (255,979) | (1,813,791) | | (318,778) | (2,599,520) |
Net Increase/(Decrease) | (141,015) | $ (1,003,230) | | (127,107) | $ (978,532) |
Class D Shares: | | | | | |
Shares sold | 2,871,686 | $ 20,254,591 | | 5,458,833 | $ 45,365,487 |
Reinvested dividends and distributions | 2,114,246 | 14,863,752 | | 1,689,999 | 13,782,737 |
Shares repurchased | (4,713,898) | (33,196,786) | | (7,500,467) | (61,332,855) |
Net Increase/(Decrease) | 272,034 | $ 1,921,557 | | (351,635) | $ (2,184,631) |
Class I Shares: | | | | | |
Shares sold | 12,148,011 | $ 87,074,770 | | 10,493,969 | $ 87,570,705 |
Reinvested dividends and distributions | 1,161,912 | 8,174,225 | | 1,170,587 | 9,595,832 |
Shares repurchased | (16,407,506) | (115,862,838) | | (18,602,709) | (152,548,683) |
Net Increase/(Decrease) | (3,097,583) | $(20,613,843) | | (6,938,153) | $ (55,382,146) |
Class N Shares: | | | | | |
Shares sold | 4,511,701 | $ 31,774,790 | | 13,829,484 | $115,346,449 |
Reinvested dividends and distributions | 1,196,622 | 8,415,423 | | 1,068,004 | 8,644,959 |
Shares repurchased | (15,232,813) | (107,327,068) | | (8,607,863) | (68,280,453) |
Net Increase/(Decrease) | (9,524,490) | $(67,136,855) | | 6,289,625 | $ 55,710,955 |
Class R Shares: | | | | | |
Shares sold | 229,273 | $ 1,612,535 | | 119,410 | $ 977,300 |
Reinvested dividends and distributions | 51,315 | 360,367 | | 37,679 | 306,583 |
Shares repurchased | (185,753) | (1,298,621) | | (150,353) | (1,231,205) |
Net Increase/(Decrease) | 94,835 | $ 674,281 | | 6,736 | $ 52,678 |
Class S Shares: | | | | | |
Shares sold | 47,388 | $ 333,679 | | 26,621 | $ 208,895 |
Reinvested dividends and distributions | 12,473 | 87,801 | | 10,363 | 84,905 |
Shares repurchased | (88,313) | (624,224) | | (88,582) | (712,462) |
Net Increase/(Decrease) | (28,452) | $ (202,744) | | (51,598) | $ (418,662) |
Class T Shares: | | | | | |
Shares sold | 5,921,426 | $ 42,279,328 | | 6,834,123 | $ 57,386,388 |
Reinvested dividends and distributions | 2,331,829 | 16,393,060 | | 1,955,013 | 15,957,838 |
Shares repurchased | (10,944,960) | (77,536,418) | | (11,384,240) | (93,866,782) |
Net Increase/(Decrease) | (2,691,705) | $(18,864,030) | | (2,595,104) | $ (20,522,556) |
7. Purchases and Sales of Investment Securities
For the year ended June 30, 2023, the aggregate cost of purchases and proceeds from sales of investment securities (excluding any short-term securities, short-term options contracts, TBAs, and in-kind transactions, as applicable) was as follows:
| | | | |
Purchases of
Securities | Proceeds from Sales
of Securities | Purchases of Long-
Term U.S. Government
Obligations | Proceeds from Sales
of Long-Term U.S.
Government Obligations |
$612,130,298 | $ 719,452,672 | $ - | $ - |
Janus Henderson High-Yield Fund
Notes to Financial Statements
8. Subsequent Event
Management has evaluated whether any events or transactions occurred subsequent to June 30, 2023 and through the date of issuance of the Fund’s financial statements and determined that there were no material events or transactions that would require recognition or disclosure in the Fund’s financial statements.
Janus Henderson High-Yield Fund
Report of Independent Registered Public Accounting Firm
To the Board of Trustees of Janus Investment Fund and Shareholders of Janus Henderson High-Yield Fund
Opinion on the Financial Statements
We have audited the accompanying statement of assets and liabilities, including the schedule of investments, of Janus Henderson High-Yield Fund (one of the funds constituting Janus Investment Fund, referred to hereafter as the "Fund") as of June 30, 2023, the related statement of operations for the year ended June 30, 2023, the statements of changes in net assets for each of the two years in the period ended June 30, 2023, including the related notes, and the financial highlights for each of the five years in the period ended June 30, 2023 (collectively referred to as the “financial statements”). In our opinion, the financial statements present fairly, in all material respects, the financial position of the Fund as of June 30, 2023, the results of its operations for the year then ended, the changes in its net assets for each of the two years in the period ended June 30, 2023 and the financial highlights for each of the five years in the period ended June 30, 2023 in conformity with accounting principles generally accepted in the United States of America.
Basis for Opinion
These financial statements are the responsibility of the Fund’s management. Our responsibility is to express an opinion on the Fund’s financial statements based on our audits. We are a public accounting firm registered with the Public Company Accounting Oversight Board (United States) (PCAOB) and are required to be independent with respect to the Fund in accordance with the U.S. federal securities laws and the applicable rules and regulations of the Securities and Exchange Commission and the PCAOB.
We conducted our audits of these financial statements in accordance with the standards of the PCAOB. Those standards require that we plan and perform the audit to obtain reasonable assurance about whether the financial statements are free of material misstatement, whether due to error or fraud.
Our audits included performing procedures to assess the risks of material misstatement of the financial statements, whether due to error or fraud, and performing procedures that respond to those risks. Such procedures included examining, on a test basis, evidence regarding the amounts and disclosures in the financial statements. Our audits also included evaluating the accounting principles used and significant estimates made by management, as well as evaluating the overall presentation of the financial statements. Our procedures included confirmation of securities owned as of June 30, 2023 by correspondence with the custodian, transfer agent and brokers; when replies were not received from brokers, we performed other auditing procedures. We believe that our audits provide a reasonable basis for our opinion.

Denver, Colorado
August 21, 2023
We have served as the auditor of one or more investment companies in Janus Henderson Funds since 1990.
Janus Henderson High-Yield Fund
Additional Information (unaudited)
Proxy Voting Policies and Voting Record
A description of the policies and procedures that the Fund uses to determine how to vote proxies relating to its portfolio securities is available without charge: (i) upon request, by calling 1-800-525-1093; (ii) on the Fund’s website at janushenderson.com/proxyvoting; and (iii) on the SEC’s website at http://www.sec.gov. Additionally, information regarding the Fund’s proxy voting record for the most recent twelve-month period ended June 30 is also available, free of charge, through janushenderson.com/proxyvoting and from the SEC’s website at http://www.sec.gov.
Full Holdings
The Fund files its complete portfolio holdings (schedule of investments) with the SEC as an exhibit to Form N-PORT within 60 days of the end of the first and third fiscal quarters, and in the annual report and semiannual report to shareholders. The Fund’s Form N-PORT filings and annual and semiannual reports: (i) are available on the SEC’s website at http://www.sec.gov; and (ii) are available without charge, upon request, by calling a Janus Henderson representative at 1-877-335-2687 (toll free) (or 1-800-525-3713 if you hold Class D shares). Portfolio holdings consisting of at least the names of the holdings are generally available on a monthly basis with a 30-day lag under Full Holdings for the Fund at janushenderson.com/info (or janushenderson.com/reports if you hold Class D Shares).
APPROVAL OF ADVISORY AGREEMENTS DURING THE PERIOD
The Trustees of Janus Aspen Series, each of whom serves as an “independent” Trustee (the “Trustees”), oversee the management of each portfolio of Janus Aspen Series (each, a “VIT Portfolio,” and collectively, the “VIT Portfolios”), as well as each fund of Janus Investment Fund (each, a “Fund,” and collectively, the “Funds” and together with the VIT Portfolios, the “Janus Henderson Funds,” and each, a “Janus Henderson Fund”). As required by law, the Trustees determine annually whether to continue the investment advisory agreement for each Janus Henderson Fund.
In connection with their most recent consideration of those agreements for each Janus Henderson Fund, the Trustees received and reviewed information provided by Janus Henderson Investors US LLC (the “Adviser”) in response to requests of the Trustees and their independent legal counsel. They also received and reviewed information and analysis provided by, and in response to requests of, their independent fee consultant. Throughout their consideration of the agreements, the Trustees were advised by their independent legal counsel. The Trustees met with management to consider the agreements, and also met separately in executive session with their independent legal counsel and their independent fee consultant.
At meetings held on November 9-10, 2022 and December 13-14, 2022, the Trustees evaluated the information provided by the Adviser and the independent fee consultant, as well as other information provided by the Adviser and the independent fee consultant during the year. Following such evaluation, the Trustees determined that the overall arrangements between each Janus Henderson Fund and the Adviser were fair and reasonable in light of the nature, extent, and quality of the services provided by the Adviser and its affiliates, the fees charged for those services, and other matters that the Trustees considered relevant in the exercise of their business judgment, and unanimously approved the continuation of the investment advisory agreement for each Janus Henderson Fund for the period from February 1, 2023 through February 1, 2024, subject to earlier termination as provided for in each agreement.
In considering the continuation of those agreements, the Trustees reviewed and analyzed various factors that they determined were relevant, including the factors described below, none of which by itself was considered dispositive. However, the material factors and conclusions that formed the basis for the Trustees’ determination to approve the continuation of the agreements are discussed separately below. Also included is a summary of the independent fee consultant’s conclusions and opinions that arose during, and were included as part of, the Trustees’ consideration of the agreements. “Management fees,” as used herein, reflect actual annual advisory fees and, for the purpose of peer comparisons any administration fees (excluding out of pocket costs), net of any waivers, paid by a fund as a percentage of average net assets.
Nature, Extent and Quality of Services
The Trustees reviewed the nature, extent, and quality of the services provided by the Adviser to the Janus Henderson Funds, taking into account the investment objective, strategies, and policies of each Janus Henderson Fund, and the knowledge the Trustees gained from their regular meetings with management on at least a quarterly basis and their ongoing review of information related to the Janus Henderson Funds. In addition, the Trustees reviewed the resources and key personnel of the Adviser, particularly noting those employees who provide investment and risk management services to the Janus Henderson Funds. The Trustees also considered other services provided to the Janus Henderson
Janus Henderson High-Yield Fund
Additional Information (unaudited)
Funds by the Adviser, such as managing the execution of portfolio transactions and the selection of broker-dealers for those transactions. The Trustees considered the Adviser’s role as administrator to the Janus Henderson Funds, noting that the Adviser generally does not receive a fee for its services as administrator, but is reimbursed for its out-of-pocket costs. The Trustees considered the role of the Adviser in monitoring adherence to the Janus Henderson Funds’ investment restrictions, providing support services for the Trustees and Trustee committees, and overseeing communications with Janus Henderson Fund shareholders and the activities of other service providers, including monitoring compliance with various policies and procedures of the Janus Henderson Funds and with applicable securities laws and regulations.
In this regard, the independent fee consultant noted that the Adviser provides a number of different services for the Janus Henderson Funds and their shareholders, ranging from investment management services to various other servicing functions, and that, in its view, the Adviser is a capable provider of those services. The independent fee consultant also provided its belief that the Adviser has developed a number of institutional competitive advantages that should enable it to provide superior investment and service performance over the long term.
The Trustees concluded that the nature, extent, and quality of the services provided by the Adviser to each Janus Henderson Fund were appropriate and consistent with the terms of the respective advisory agreements, and that, taking into account steps taken to address those Janus Henderson Funds whose performance lagged that of their peers for certain periods, the Janus Henderson Funds were likely to benefit from the continued provision of those services. They also concluded that the Adviser had sufficient personnel, with the appropriate education and experience, to serve the Janus Henderson Funds effectively and had demonstrated its ability to attract well-qualified personnel.
Performance of the Funds
The Trustees considered the performance results of each Janus Henderson Fund over various time periods. They noted that they considered Janus Henderson Fund performance data throughout the year, including periodic meetings with each Janus Henderson Fund’s portfolio manager(s), and also reviewed information comparing each Janus Henderson Fund’s performance with the performance of comparable fund peer groups identified by Broadridge Financial Solutions, Inc. (“Broadridge”), an independent data provider, and with the Janus Henderson Fund’s benchmark index. In this regard, the independent fee consultant found that the overall Janus Henderson Funds’ performance has been reasonable, noting that: (i) for the 36 months ended May 31, 2022, approximately 38% of the Janus Henderson Funds were in the top two quartiles of their Broadridge peer groups; (ii) for the 36 months ended September 30, 2022, approximately 45% of the Janus Henderson Funds were in the top two quartiles of performance as reported by Morningstar, and (iii) for the 12 months ended September 30, 2022, approximately 55% of the Janus Henderson Funds were in the top two quartiles of performance as reported by Morningstar.
The Trustees considered the performance of each Janus Henderson Fund, noting that performance may vary by share class, and noted the following with respect to the Funds:
Asset Allocation Funds
· For Janus Henderson Global Allocation Fund – Conservative, the Trustees noted that the Fund’s performance was in the third Broadridge quartile for the 36 months ended May 31, 2022 and the bottom Broadridge quartile for the 12 months ended May 31, 2022. The Trustees noted the reasons for the Fund’s underperformance and the steps the Adviser had taken or was taking to improve performance.
· For Janus Henderson Global Allocation Fund – Growth, the Trustees noted that the Fund’s performance was in the bottom Broadridge quartile for the 36 months ended May 31, 2022 and the bottom Broadridge quartile for the 12 months ended May 31, 2022. The Trustees noted the reasons for the Fund’s underperformance and the steps the Adviser had taken or was taking to improve performance.
· For Janus Henderson Global Allocation Fund – Moderate, the Trustees noted that the Fund’s performance was in the bottom Broadridge quartile for the 36 months ended May 31, 2022 and the bottom Broadridge quartile for the 12 months ended May 31, 2022. The Trustees noted the reasons for the Fund’s underperformance and the steps the Adviser had taken or was taking to improve performance.
Fixed-Income Funds
· For Janus Henderson Absolute Return Income Opportunities Fund, the Trustees noted that the Fund’s performance was in the third Broadridge quartile for the 36 months ended May 31, 2022 and the first Broadridge
Janus Henderson High-Yield Fund
Additional Information (unaudited)
quartile for the 12 months ended May 31, 2022. The Trustees noted the reasons for the Fund’s underperformance, the steps the Adviser had taken or was taking to improve performance, and that the performance trend was improving.
· For Janus Developed World Bond Fund, the Trustees noted that the Fund’s performance was in the bottom Broadridge quartile for the 36 months ended May 31, 2022 and the bottom Broadridge quartile for the 12 months ended May 31, 2022. The Trustees noted the reasons for the Fund’s underperformance and the steps the Adviser had taken or was taking to improve performance.
· For Janus Henderson Flexible Bond Fund, the Trustees noted that the Fund’s performance was in the first Broadridge quartile for the 36 months ended May 31, 2022 and the second Broadridge quartile for the 12 months ended May 31, 2022.
· For Janus Henderson Global Bond Fund, the Trustees noted that the Fund’s performance was in the third Broadridge quartile for the 36 months ended May 31, 2022 and the bottom Broadridge quartile for the 12 months ended May 31, 2022. The Trustees noted the reasons for the Fund’s underperformance and the steps the Adviser had taken or was taking to improve performance.
· For Janus Henderson High-Yield Fund, the Trustees noted that the Fund’s performance was in the third Broadridge quartile for the 36 months ended May 31, 2022 and the bottom Broadridge quartile for the 12 months ended May 31, 2022. The Trustees noted the reasons for the Fund’s underperformance and the steps the Adviser had taken or was taking to improve performance.
· For Janus Henderson Multi-Sector Income Fund, the Trustees noted that the Fund’s performance was in the second Broadridge quartile for the 36 months ended May 31, 2022 and the third Broadridge quartile for the 12 months ended May 31, 2022.
· For Janus Henderson Short Duration Flexible Bond Fund, the Trustees noted that the Fund’s performance was in the third Broadridge quartile for the 36 months ended May 31, 2022 and the bottom Broadridge quartile for the 12 months ended May 31, 2022. The Trustees noted the reasons for the Fund’s underperformance and the steps the Adviser had taken or was taking to improve performance.
Global and International Equity Funds
· For Janus Henderson Asia Equity Fund, the Trustees noted that the Fund’s performance was in the third Broadridge quartile for the 36 months ended May 31, 2022 and the third Broadridge quartile for the 12 months ended May 31, 2022. The Trustees noted the reasons for the Fund’s underperformance, while also noting that the Fund has a performance fee structure that results in lower management fees during periods of underperformance, and the steps the Adviser had taken or was taking to improve performance.
· For Janus Henderson Emerging Markets Fund, the Trustees noted that the Fund’s performance was in the third Broadridge quartile for the 36 months ended May 31, 2022 and the third Broadridge quartile for the 12 months ended May 31, 2022. The Trustees noted the reasons for the Fund’s underperformance and the steps the Adviser had taken or was taking to improve performance.
· For Janus Henderson European Focus Fund, the Trustees noted that the Fund’s performance was in the first Broadridge quartile for the 36 months ended May 31, 2022 and the second Broadridge quartile for the 12 months ended May 31, 2022.
· For Janus Henderson Global Equity Income Fund, the Trustees noted that the Fund’s performance was in the third Broadridge quartile for the 36 months ended May 31, 2022 and the first Broadridge quartile for the 12 months ended May 31, 2022. The Trustees noted the reasons for the Fund’s underperformance, the steps the Adviser had taken or was taking to improve performance, and that the performance trend was improving.
· For Janus Henderson Global Life Sciences Fund, the Trustees noted that the Fund’s performance was in the third Broadridge quartile for the 36 months ended May 31, 2022 and the second Broadridge quartile for the 12 months ended May 31, 2022. The Trustees noted the reasons for the Fund’s underperformance, the steps the Adviser had taken or was taking to improve performance, and that the performance trend was improving.
Janus Henderson High-Yield Fund
Additional Information (unaudited)
· For Janus Henderson Global Sustainable Equity Fund, the Trustees noted that the Fund’s performance was in the second Broadridge quartile for the 12 months ended May 31, 2022. The Trustees noted that 36 month-end performance was not yet available.
· For Janus Henderson Global Real Estate Fund, the Trustees noted that the Fund’s performance was in the second Broadridge quartile for the 36 months ended May 31, 2022 and the bottom Broadridge quartile for the 12 months ended May 31, 2022.
· For Janus Henderson Global Research Fund, the Trustees noted that the Fund’s performance was in the second Broadridge quartile for the 36 months ended May 31, 2022 and the first Broadridge quartile for the 12 months ended May 31, 2022.
· For Janus Henderson Global Select Fund, the Trustees noted that the Fund’s performance was in the first Broadridge quartile for the 36 months ended May 31, 2022 and the first Broadridge quartile for the 12 months ended May 31, 2022.
· For Janus Henderson Global Technology and Innovation Fund, the Trustees noted that the Fund’s performance was in the second Broadridge quartile for the 36 months ended May 31, 2022 and the second Broadridge quartile for the 12 months ended May 31, 2022.
· For Janus Henderson International Opportunities Fund, the Trustees noted that the Fund’s performance was in the bottom Broadridge quartile for the 36 months ended May 31, 2022 and the third Broadridge quartile for the 12 months ended May 31, 2022. The Trustees noted the reasons for the Fund’s underperformance and the steps the Adviser had taken or was taking to improve performance.
· For Janus Henderson Overseas Fund, the Trustees noted that the Fund’s performance was in the first Broadridge quartile for the 36 months ended May 31, 2022 and the first Broadridge quartile for the 12 months ended May 31, 2022.
· For Janus Henderson Responsible International Dividend Fund (formerly the Janus Henderson Dividend & Income Builder Fund), the Trustees noted that the Fund’s performance was in the bottom Broadridge quartile for the 36 months ended May 31, 2022 and the bottom Broadridge quartile for the 12 months ended May 31, 2022. The Trustees noted the reasons for the Fund’s underperformance and the steps the Adviser had taken or was taking to improve performance.
Money Market Funds
· For Janus Henderson Government Money Market Fund, the Trustees noted that the Fund’s performance was in the third Broadridge quartile for the 36 months ended May 31, 2022 and the bottom Broadridge quartile for the 12 months ended May 31, 2022. The Trustees noted the reasons for the Fund’s underperformance and the steps the Adviser had taken or was taking to improve performance.
· For Janus Henderson Money Market Fund, the Trustees noted that the Fund’s performance was in the third Broadridge quartile for the 36 months ended May 31, 2022 and the bottom Broadridge quartile for the 12 months ended May 31, 2022. The Trustees noted the reasons for the Fund’s underperformance and the steps the Adviser had taken or was taking to improve performance.
Multi-Asset Funds
· For Janus Henderson Adaptive Global Allocation Fund, the Trustees noted that the Fund’s performance was in bottom Broadridge quartile for the 36 months ended May 31, 2022 and the second Broadridge quartile for the 12 months ended May 31, 2022. The Trustees noted the reasons for the Fund’s underperformance, the steps the Adviser had taken or was taking to improve performance, and that the performance trend was improving.
· For Janus Henderson Balanced Fund, the Trustees noted that the Fund’s performance was in the first Broadridge quartile for the 36 months ended May 31, 2022 and the first Broadridge quartile for the 12 months ended May 31, 2022.
Janus Henderson High-Yield Fund
Additional Information (unaudited)
U.S. Equity Funds
· For Janus Henderson Adaptive Risk Managed U.S. Equity Fund, the Trustees noted that the Fund’s performance was in the bottom Broadridge quartile for the 36 months ended May 31, 2022 and the second Broadridge quartile for the 12 months ended May 31, 2022. The Trustees noted the reasons for the Fund’s underperformance, the steps the Adviser had taken or were taking to improve performance, and that the performance trend was improving.
· For Janus Henderson Contrarian Fund, the Trustees noted that the Fund’s performance was in the first Broadridge quartile for the 36 months ended May 31, 2022 and the bottom Broadridge quartile for the 12 months ended May 31, 2022.
· For Janus Henderson Enterprise Fund, the Trustees noted that the Fund’s performance was in the second Broadridge quartile for the 36 months ended May 31, 2022 and the first Broadridge quartile for the 12 months ended May 31, 2022.
· For Janus Henderson Forty Fund, the Trustees noted that the Fund’s performance was in the third Broadridge quartile for the 36 months ended May 31, 2022 and the bottom Broadridge quartile for the 12 months ended May 31, 2022. The Trustees noted the reasons for the Fund’s underperformance and the steps the Adviser had taken or was taking to improve performance.
· For Janus Henderson Growth and Income Fund, the Trustees noted that the Fund’s performance was in the bottom Broadridge quartile for the 36 months ended May 31, 2022 and the first Broadridge quartile for the 12 months ended May 31, 2022. The Trustees noted the reasons for the Fund’s underperformance, the steps the Adviser had taken or was taking to improve performance, and that the performance trend was improving.
· For Janus Henderson Mid Cap Value Fund, the Trustees noted that the Fund’s performance was in the bottom Broadridge quartile for the 36 months ended May 31, 2022 and the second Broadridge quartile for the 12 months ended May 31, 2022. The Trustees noted the reasons for the Fund’s underperformance, while also noting that the Fund has a performance fee structure that results in lower management fees during periods of underperformance, the steps the Adviser had taken or was taking to improve performance, and that the performance trend was improving.
· For Janus Henderson Research Fund, the Trustees noted that the Fund’s performance was in the third Broadridge quartile for the 36 months ended May 31, 2022 and the third Broadridge quartile for the 12 months ended May 31, 2022. The Trustees noted the reasons for the Fund’s underperformance, while also noting that the Fund has a performance fee structure that results in lower management fees during periods of underperformance and the steps the Adviser had taken or was taking to improve performance.
· For Janus Henderson Small Cap Value Fund, the Trustees noted that the Fund’s performance was in the bottom Broadridge quartile for the 36 months ended May 31, 2022 and the second Broadridge quartile for the 12 months ended May 31, 2022. The Trustees noted the reasons for the Fund’s underperformance, while also noting that the Fund has a performance fee structure that results in lower management fees during periods of underperformance, the steps the Adviser had taken or was taking to improve performance, and that the performance trend was improving.
· For Janus Henderson Small-Mid Cap Value Fund, the Trustees noted that the Fund’s performance was in the bottom Broadridge quartile for the 36 months ended May 31, 2022 and the second Broadridge quartile for the 12 months ended May 31, 2022. The Trustees noted the reasons for the Fund’s underperformance, while also noting that the Fund has a performance fee structure that results in lower management fees during periods of underperformance, the steps the Adviser had taken or was taking to improve performance, and that the performance trend is improving.
· For Janus Henderson Triton Fund, the Trustees noted that the Fund’s performance was in the bottom Broadridge quartile for the 36 months ended May 31, 2022 and the second Broadridge quartile for the 12 months ended May 31, 2022. The Trustees noted the reasons for the Fund’s underperformance, the steps the Adviser had taken or was taking to improve performance, and that the performance trend was improving.
· For Janus Henderson Venture Fund, the Trustees noted that the Fund’s performance was in the bottom Broadridge quartile for the 36 months ended May 31, 2022 and the second Broadridge quartile for the 12 months ended May
Janus Henderson High-Yield Fund
Additional Information (unaudited)
31, 2022. The Trustees noted the reasons for the Fund’s underperformance, the steps the Adviser had taken or was taking to improve performance, and that the performance trend was improving.
In consideration of each Janus Henderson Fund’s performance, the Trustees concluded that, taking into account the factors relevant to performance, as well as other considerations, including steps taken to improve performance, as applicable, the Janus Henderson Fund’s performance warranted continuation of such Janus Henderson Fund’s investment advisory agreement.
Costs of Services Provided
The Trustees examined information regarding the fees and expenses of each Janus Henderson Fund in comparison to similar information for other comparable funds as provided by Broadridge, an independent data provider. They also reviewed an analysis of that information provided by their independent fee consultant. The independent fee consultant provided its belief that the management fees charged by the Adviser to each of the Janus Henderson Funds under the current investment advisory and administration agreements are reasonable in relation to the services provided by the Adviser. The independent fee consultant found: (1) the total expenses and management fees of the Janus Henderson Funds to be reasonable relative to other comparable mutual funds; (2) the total expenses, on average, were 6% under the average total expenses of the respective Broadridge peer group; and (3) the management fees for the Janus Henderson Funds, on average, were 5% under the average management fees for the respective Broadridge peer group. The Trustees also considered the total expenses for each share class of each Janus Henderson Fund compared to the average total expenses for its Broadridge Expense Group and to average total expenses for its Broadridge Expense Universe.
For Janus Henderson Funds with three or more years of performance history, the independent fee consultant also performed a systematic “focus list” analysis of expenses which assessed fund fees in the context of fund performance being delivered. Based on this analysis, the independent fee consultant found that the combination of service quality/performance and expenses on these individual Janus Henderson Funds was reasonable in light of performance trends, performance histories, changes in portfolio management, relative average net asset levels, and the existence of performance fees, breakpoints, and/or expense waivers on such Janus Henderson Funds.
The Trustees considered the methodology used by the Adviser in determining compensation payable to portfolio managers, the competitive environment for investment management talent, and the competitive market for mutual funds in different distribution channels.
The Trustees also reviewed management fees charged by the Adviser to comparable separate account clients and to comparable non-affiliated funds subadvised by the Adviser (for which the Adviser provides only or primarily portfolio management services). Although in most instances subadvisory and separate account fee rates for various investment strategies were lower than management fee rates for Janus Henderson Funds having a similar strategy, the Trustees considered that the Adviser noted that, under the terms of the management agreements with the Janus Henderson Funds, the Adviser performs significant additional services for the Janus Henderson Funds that it does not provide to those other clients, including administration services, oversight of the Janus Henderson Funds’ other service providers, Trustee support, regulatory compliance and numerous other services, and that, in serving the Janus Henderson Funds, the Adviser assumes many legal risks and other costs that it does not assume in servicing its other clients. Moreover, the Trustees noted that the independent fee consultant found that: (1) the management fees the Adviser charges to the Janus Henderson Funds are reasonable in relation to the management fees the Adviser charges to funds subadvised by the Adviser and to the fees the Adviser charges to its institutional separate account clients; (2) these subadvised and institutional separate accounts have different service and infrastructure needs and operate in markets very different from the retail fund market; (3) Janus Henderson mutual fund investors enjoy reasonable fees relative to the fees charged in these other markets; and (4) as part of its 2022 review, 9 of 11 Janus Henderson Funds have lower management fees than similar funds subadvised by the Adviser. The Trustees noted that for the two Janus Henderson Funds that did not, management fees for each were under the average of its 15(c) peer group.
The Trustees considered the fees for each Janus Henderson Fund for its fiscal year ended in 2021 and noted the following with regard to each Janus Henderson Fund’s total expenses, net of applicable fee waivers (the Fund’s “total expenses”) as reflected in the comparative information provided by Broadridge:
Janus Henderson High-Yield Fund
Additional Information (unaudited)
Asset Allocation Funds
· For Janus Henderson Global Allocation Fund – Conservative, the Trustees noted that, although the Fund’s total expenses exceeded the peer group average for certain share classes, overall the Fund’s total expenses were reasonable. The Trustees also noted that the Adviser has contractually agreed to limit the Fund’s expenses.
· For Janus Henderson Global Allocation Fund – Growth, the Trustees noted that, although the Fund’s total expenses exceeded the peer group average for certain share classes, overall the Fund’s total expenses were reasonable. The Trustees also noted that the Adviser has contractually agreed to limit the Fund’s expenses, although this limit did not apply because the Fund’s total expenses as shown were below the applicable fee limit.
· For Janus Henderson Global Allocation Fund – Moderate, the Trustees noted that, although the Fund’s total expenses exceeded the peer group average for one share class, overall the Fund’s total expenses were reasonable. The Trustees also noted that the Adviser has contractually agreed to limit the Fund’s expenses.
Fixed-Income Funds
· For Janus Henderson Absolute Return Income Opportunities Fund, the Trustees noted that, although the Fund’s total expenses exceeded the peer group average for certain share classes, overall the Fund’s total expenses were reasonable. The Trustees also noted that the Adviser has contractually agreed to limit the Fund’s expenses.
· For Janus Henderson Developed World Bond Fund, the Trustees noted that, although the Fund’s total expenses exceeded the peer group average for one share class, overall the Fund’s total expenses were reasonable. The Trustees also noted that the Adviser has contractually agreed to limit the Fund’s expenses.
· For Janus Henderson Flexible Bond Fund, the Trustees noted that, although the Fund’s total expenses exceeded the peer group average for certain share classes, overall the Fund’s total expenses were reasonable. The Trustees also noted that the Adviser has contractually agreed to limit the Fund’s expenses, although this limit did not apply because the Fund’s total expenses as shown were below the applicable fee limit.
· For Janus Henderson Global Bond Fund, the Trustees noted that, although the Fund’s total expenses exceeded the peer group average for certain share classes, overall the Fund’s total expenses were reasonable. The Trustees also noted that the Adviser has contractually agreed to limit the Fund’s expenses.
· For Janus Henderson High-Yield Fund, the Trustees noted that, although the Fund’s total expenses exceeded the peer group average for certain share classes, overall the Fund’s total expenses were reasonable. The Trustees also noted that the Adviser has contractually agreed to limit the Fund’s expenses.
· For Janus Henderson Multi-Sector Income Fund, the Trustees noted that, although the Fund’s total expenses exceeded the peer group average for certain share classes, overall the Fund’s total expenses were reasonable. The Trustees also noted that the Adviser has contractually agreed to limit the Fund’s expenses.
· For Janus Henderson Short Duration Flexible Bond Fund, the Trustees noted that, although the Fund’s total expenses exceeded the peer group average for certain share classes, overall the Fund’s total expenses were reasonable. The Trustees also noted that the Adviser has contractually agreed to limit the Fund’s expenses.
Global and International Equity Funds
· For Janus Henderson Asia Equity Fund, the Trustees noted that, although the Fund’s total expenses exceeded the peer group average for certain share classes, overall the Fund’s total expenses were reasonable. The Trustees also noted that the Adviser has contractually agreed to limit the Fund’s expenses.
· For Janus Henderson Emerging Markets Fund, the Trustees noted that, although the Fund’s total expenses exceeded the peer group average for certain share classes, overall the Fund’s total expenses were reasonable. The Trustees also noted that the Adviser has contractually agreed to limit the Fund’s expenses.
· For Janus Henderson European Focus Fund, the Trustees noted that, although the Fund’s total expenses exceeded the peer group average for one share class, overall the Fund’s expenses were reasonable. The Trustees also noted that the Adviser has contractually agreed to limit the Fund’s expenses.
· For Janus Henderson Global Equity Income Fund, the Trustees noted that, although the Fund’s total expenses exceeded the peer group average for one share class, overall the Fund’s total expenses were reasonable. The
Janus Henderson High-Yield Fund
Additional Information (unaudited)
Trustees also noted that the Adviser has contractually agreed to limit the Fund’s expenses, although this limit did not apply because the Fund’s total expenses as shown were below the applicable fee limit.
· For Janus Henderson Global Life Sciences Fund, the Trustees noted that the Fund’s total expenses were below the peer group average for all share classes.
· For Janus Henderson Global Real Estate Fund, the Trustees noted that, although the Fund’s total expenses exceeded the peer group average for certain share classes, overall the Fund’s total expenses were reasonable. The Trustees also noted that the Adviser has contractually agreed to limit the Fund’s expenses, although this limit did not apply because the Fund’s total expenses as shown were below the applicable fee limit.
· For Janus Henderson Global Research Fund, the Trustees noted that, although the Fund’s total expenses exceeded the peer group average for one share class, overall the Fund’s total expenses were reasonable. The Trustees also noted that the Adviser has contractually agreed to limit the Fund’s expenses, although this limit did not apply because the Fund’s total expenses as shown were below the applicable fee limit.
· For Janus Henderson Global Select Fund, the Trustees noted that, although the Fund’s total expenses exceeded the peer group average for certain share classes, overall the Fund’s total expenses were reasonable. The Trustees also noted that the Adviser has contractually agreed to limit the Fund’s expenses.
· For Janus Henderson Global Sustainable Equity Fund, the Trustees noted that, although the Fund’s total expenses exceeded the peer group average for certain share classes, overall the Fund’s expenses were reasonable. The Trustees also noted that the Adviser has contractually agreed to limit the Fund’s expenses.
· For Janus Henderson Global Technology and Innovation Fund, the Trustees noted that the Fund’s total expenses were below the peer group average for all share classes.
· For Janus Henderson International Opportunities Fund, the Trustees noted that, although the Fund’s total expenses exceeded the peer group average for certain share classes, overall the Fund’s expenses were reasonable. The Trustees also noted that the Adviser has contractually agreed to limit the Fund’s expenses.
· For Janus Henderson Overseas Fund, the Trustees noted that although the Fund’s total expenses exceeded the peer group average for certain share classes, overall the Fund’s total expenses were reasonable. The Trustees also noted that the Adviser has contractually agreed to limit the Fund’s expenses, although this limit did not apply because the Fund’s total expenses as shown were below the applicable fee limit.
· For Janus Henderson Responsible International Dividend Fund (formerly the Janus Henderson Dividend & Income Builder Fund), the Trustees noted that, although the Fund’s total expenses exceeded the peer group for one share class, overall the Fund’s total expenses were reasonable. The Trustees also noted that the Adviser has contractually agreed to limit the Fund’s expenses.
Money Market Funds
· For Janus Henderson Government Money Market Fund, the Trustees noted that the Fund’s total expenses were below the peer group average for all share classes.
· For Janus Henderson Money Market Fund, the Trustees noted that the Fund’s total expenses were below the peer group average for all share classes.
Multi-Asset Funds
· For Janus Henderson Adaptive Global Allocation Fund, the Trustees noted that the Fund’s total expenses were below the peer group average for all share classes.
· For Janus Henderson Balanced Fund, the Trustees noted that, although the Fund’s total expenses exceeded the peer group average for certain share classes, overall the Fund’s total expenses were reasonable. The Trustees also noted that the Adviser has contractually agreed to limit the Fund’s expenses, although this limit did not apply because the Fund’s total expenses as shown were below the applicable fee limit.
Janus Henderson High-Yield Fund
Additional Information (unaudited)
U.S. Equity Funds
· For Janus Henderson Adaptive Risk Managed U.S. Equity Fund, the Trustees noted that, although the Fund’s total expenses exceeded the peer group average for certain share classes, overall the Fund’s total expenses were reasonable. The Trustees also noted that the Adviser has contractually agreed to limit the Fund’s expenses, although this limit did not apply because the Fund’s total expenses as shown were below the applicable fee limit.
· For Janus Henderson Contrarian Fund, the Trustees noted that, although the Fund’s total expenses exceeded the peer group average for all share classes, overall the Fund’s total expenses were reasonable. The Trustees also noted that the Adviser had contractually agreed to limit the Fund’s expenses.
· For Janus Henderson Enterprise Fund, the Trustees noted that, although the Fund’s total expenses exceeded the peer group average for certain share classes, overall the Fund’s total expenses were reasonable. The Trustees also noted that the Adviser has contractually agreed to limit the Fund’s expenses, although this limit did not apply because the Fund’s total expenses as shown were below the applicable fee limit.
· For Janus Henderson Forty Fund, the Trustees noted that, although the Fund’s total expenses exceeded the peer group average for certain share classes, overall the Fund’s total expenses were reasonable. The Trustees also noted that the Adviser has contractually agreed to limit the Fund’s expenses, although this limit did not apply because the Fund’s total expenses as shown were below the applicable fee limit.
· For Janus Henderson Growth and Income Fund, the Trustees noted that, although the Fund’s total expenses exceeded the peer group average for certain share classes, overall the Fund’s total expenses were reasonable. The Trustees also noted that the Adviser has contractually agreed to limit the Fund’s expenses, although this limit did not apply because the Fund’s total expenses as shown were below the applicable fee limit.
· For Janus Henderson Mid Cap Value Fund, the Trustees noted that the Fund’s total expenses were below the peer group average for all share classes.
· For Janus Henderson Research Fund, the Trustees noted that, although the Fund’s total expenses exceeded the peer group average for certain share classes, overall the Fund’s total expenses were reasonable. The Trustees also noted that the Adviser has contractually agreed to limit the Fund’s expenses.
· For Janus Henderson Small Cap Value Fund, the Trustees noted that, although the Fund’s total expenses exceeded the peer group average for one share class, overall the Fund’s total expenses were reasonable. The Trustees also noted that the Adviser has contractually agreed to limit the Fund’s expenses, although this limit did not apply because the Fund’s total expenses as shown were below the applicable fee limit.
· For Janus Henderson Small-Mid Cap Value Fund, the Trustees noted that the Fund’s total expenses were below the peer group average for all share classes.
· For Janus Henderson Triton Fund, the Trustees noted that, although the Fund’s total expenses exceeded the peer group average for one share class, overall the Fund’s total expenses were reasonable. The Trustees also noted that the Adviser has contractually agreed to limit the Fund’s expenses, although this limit did not apply because the Fund’s total expenses as shown were below the applicable fee limit.
· For Janus Henderson Venture Fund, the Trustees noted that although the Fund’s total expenses exceeded the peer group average for one share class, overall the Fund’s total expenses were reasonable. The Trustees also noted that the Adviser has contractually agreed to limit the Fund’s expenses, although this limit did not apply because the Fund’s total expenses as shown were below the applicable fee limit.
The Trustees reviewed information on the overall profitability to the Adviser and its affiliates from their relationships with the Janus Henderson Funds, and considered profitability data of other publicly traded mutual fund advisers. The Trustees recognized that profitability comparisons among fund managers are difficult because of the variation in the type of comparative information that is publicly available, and the profitability of any fund manager is affected by numerous factors, including the organizational structure of the particular fund manager, differences in complex size, difference in product mix, difference in types of business (mutual fund, institutional and other), differences in the types of funds and other accounts it manages, possible other lines of business, the methodology for allocating expenses and the fund manager’s capital structure and cost of capital.
Janus Henderson High-Yield Fund
Additional Information (unaudited)
Additionally, the Trustees considered the estimated profitability to the Adviser from the investment management services it provided to each Janus Henderson Fund. In their review, the Trustees considered whether the Adviser receive adequate incentives and resources to manage the Janus Henderson Funds effectively. In reviewing profitability, the Trustees noted that the estimated profitability for an individual Janus Henderson Fund is necessarily a product of the allocation methodology utilized by the Adviser to allocate its expenses as part of the estimated profitability calculation. In this regard, the Trustees noted that the independent fee consultant found as part of its 2022 review that (1) the expense allocation methodology and rationales utilized by the Adviser were reasonable and (2) no clear correlation exists between expense allocations and operating margins. The Trustees also considered that the estimated profitability for an individual Janus Henderson Fund was influenced by a number of factors, including not only the allocation methodology selected, but also the presence of fee waivers and expense caps, and whether the Janus Henderson Fund’s investment management agreement contained breakpoints or a performance fee component. The Trustees determined, after taking into account these factors, among others, that the Adviser’s estimated profitability with respect to each Janus Henderson Fund was not unreasonable in relation to the services provided, and that the variation in the range of such estimated profitability among the Janus Henderson Funds was not a material factor in the Board’s approval of the reasonableness of any Janus Henderson Fund’s investment management fees.
The Trustees concluded that the management fees payable by each Janus Henderson Fund to the Adviser were reasonable in relation to the nature, extent, and quality of the services provided, taking into account the fees charged by other advisers for managing comparable mutual funds with similar strategies, the fees the Adviser charges to other clients, and, as applicable, the impact of fund performance on management fees payable by the Janus Henderson Funds. The Trustees also concluded that each Janus Henderson Fund’s total expenses were reasonable, taking into account the size of the Janus Henderson Fund, the quality of services provided by the Adviser, the investment performance of the Janus Henderson Fund, and any expense limitations agreed to or provided by the Adviser.
Economies of Scale
The Trustees considered information about the potential for the Adviser to realize economies of scale as the assets of the Janus Henderson Funds increase. They noted that their independent fee consultant published a report to the Trustees in June 2022 which provided its research and analysis into economies of scale. They also noted that, although many Janus Henderson Funds pay advisory fees at a fixed base rate as a percentage of net assets, without any breakpoints or performance fees, their independent fee consultant concluded that 75% of these Janus Henderson Funds’ have contractual management fees (gross of waivers) below their Broadridge Expense Group averages. The Trustees also noted the following from the independent fee consultant’s report: (1) that 31% of Janus Henderson Funds had management fee breakpoints in place whereby investors pay lower management fees as fund AUM increases; (2) that 29% of Janus Henderson Funds have low flat-rate fees and performance fees where the Adviser is incentivized to invest in resources which drive Janus Henderson Fund performance; and (3) that 39% of Janus Henderson Funds have low flat-rate fees versus peers where investors pay low fixed fees when the Janus Henderson Fund is small/midsized and higher fees when the Janus Henderson Fund grows in assets. The Trustees also noted that the Janus Henderson Funds share directly in economies of scale through the significant investments made by the Adviser and its affiliates related to services provided to the Funds and the lower charges of third-party service providers that are based in part on the combined scale of all of the Janus Henderson Funds.
The Trustees also considered the independent fee consultant’s conclusion that, given the limitations of various analytical approaches to economies of scale and their conflicting results, it is difficult to analytically confirm or deny the existence of economies of scale in the Janus Henderson complex. In this regard, the independent consultant concluded that (1) to the extent there were economies of scale at the Adviser, the Adviser’s general strategy of setting fixed management fees below peers appeared to share any such economies with investors even on smaller Janus Henderson Funds which have not yet achieved those economies and (2) by setting lower fixed fees from the start on these Janus Henderson Funds, the Adviser appeared to be investing to increase the likelihood that these Janus Henderson Funds will grow to a level to achieve any economies of scale that may exist. Further, the independent fee consultant provided its belief that Janus Henderson Fund investors are well-served by the fee levels and performance fee structures in place on the Janus Henderson Funds in light of any economies of scale that may be present at the Adviser.
Based on all of the information reviewed, including the recent and past research and analysis conducted by the Trustees’ independent fee consultant, the Trustees concluded that the current fee structure of each Janus Henderson Fund was reasonable and that the current rates of fees do reflect a sharing between the Adviser and the Janus
Janus Henderson High-Yield Fund
Additional Information (unaudited)
Henderson Fund of any economies of scale that may be present at the current asset level of the Janus Henderson Fund.
Other Benefits to the Adviser
The Trustees also considered benefits that accrue to the Adviser and its affiliates from their relationships with the Janus Henderson Funds. They recognized that two affiliates of the Adviser separately serve the Janus Henderson Funds as transfer agent and distributor, respectively, and the transfer agent receives compensation directly from the non-money market Janus Henderson Funds for services provided, and that such compensation contributes to the overall profitability of the Adviser and its affiliates that results from their relationship with the Janus Henderson Funds. The Trustees also considered the Adviser’s past and proposed use of commissions paid by the Janus Henderson Funds on portfolio brokerage transactions to obtain proprietary and third-party research products and services benefiting the Janus Henderson Fund and/or other clients of the Adviser and/or the Adviser. The Trustees concluded that the Adviser’s use of these types of client commission arrangements to obtain proprietary and third-party research products and services was consistent with regulatory requirements and guidelines and was likely to benefit each Janus Henderson Fund. The Trustees also concluded that, other than the services provided by the Adviser and its affiliates pursuant to the agreements and the fees to be paid by each Janus Henderson Fund therefor, the Janus Henderson Funds and the Adviser may potentially benefit from their relationship with each other in other ways. They concluded that the Adviser and its affiliates share directly in economies of scale through the lower charges of third-party service providers that are based in part on the combined scale of the Janus Henderson Funds and other clients serviced by the Adviser and its affiliates. They also concluded that the Adviser benefits from the receipt of research products and services acquired through commissions paid on portfolio transactions of the Janus Henderson Funds and that the Janus Henderson Funds benefit from the Adviser’s receipt of those products and services as well as research products and services acquired through commissions paid by other clients of the Adviser. They further concluded that the success of any Janus Henderson Fund could attract other business to the Adviser or other Janus Henderson Funds, and that the success of the Adviser could enhance the Adviser’s ability to serve the Janus Henderson Funds.
Janus Henderson High-Yield Fund
Liquidity Risk Management Program (unaudited)
Liquidity Risk Management Program
Rule 22e-4 under the Investment Company Act of 1940, as amended (the “Liquidity Rule”), requires open-end funds (but not money market funds) to adopt and implement a written liquidity risk management program (the “LRMP”) that is reasonably designed to assess and manage liquidity risk, which is the risk that a fund could not meet redemption requests without significant dilution of remaining investors’ interest in the fund. The Fund has implemented a LRMP, which incorporates the following elements: (i) assessment, management, and periodic review of liquidity risk; (ii) classification of portfolio holdings; (iii) the establishment and monitoring of a highly liquid investment minimum, as applicable; (iv) a 15% limitation on a Fund’s illiquid investments; (v) redemptions in-kind; and (vi) board oversight.
The Trustees of the Fund (the “Trustees”) have designated Janus Henderson Investors US LLC, the Fund’s investment adviser (the “Adviser”), as the Program Administrator for the LRMP responsible for administering the LRMP and carrying out the specific responsibilities of the LRMP. A working group comprised of various teams within the Adviser’s business is responsible for administering the LRMP and carrying out the specific responsibilities of different aspects of the LRMP (the “Liquidity Risk Working Group”). In assessing each Fund’s liquidity risk, the Liquidity Risk Working Group periodically considers, as relevant, factors including (i) the liquidity of a Fund’s portfolio investments during normal and reasonably foreseeable stressed conditions; (ii) whether a Fund’s investment strategy is appropriate for an open-end fund; (iii) the extent to which a Fund’s strategy involves a relatively concentrated portfolio or large positions in any issuer; (iv) a Fund’s use of borrowing for investment purposes; and (v) a Fund’s use of derivatives.
The Liquidity Rule requires the Trustees to review at least annually a written report provided by the Program Administrator that addresses the operation of the LRMP and assesses its adequacy and the effectiveness of its implementation, including, if applicable, the operation of the highly liquid investment minimum, and any material changes to the LRMP (the “Program Administrator Report”). At a meeting held on March 15, 2023, the Adviser provided the Program Administrator Report to the Trustees which covered the operation of the LRMP from January 1, 2022 through December 31, 2022 (the “Reporting Period”).
The Program Administrator Report discussed the operation and effectiveness of the LRMP during the Reporting Period. Among other things, the Program Administrator Report indicated that there were no material changes to the LRMP during the Reporting Period, although there were certain methodology adjustments implemented relating to a change in data provider. Additionally, the findings presented in the Program Administrator Report indicated that the LRMP operated adequately during the Reporting Period. These findings included that the Fund was able to meet redemptions during the normal course of business during the Reporting Period. The Program Administrator Report also stated that the Fund did not exceed the 15% limit on illiquid assets during the Reporting Period, that the Fund held primarily highly liquid assets, and was considered to be a primarily highly liquid fund during the Reporting Period. Also included among the Program Administrator Report’s findings was the determination that the Fund’s investment strategy remains appropriate for an open-end fund. In addition, the Adviser expressed its belief in the Program Administrator Report that the LRMP is reasonably designed and adequate to assess and manage the Fund’s liquidity risk, considering the Fund’s particular risks and circumstances, and includes policies and procedures reasonably designed to implement each required component of the Liquidity Rule.
There can be no assurance that the LRMP will achieve its objectives in the future. Please refer to your Fund’s prospectus for more information regarding the risks to which an investment in the Fund may be subject.
Janus Henderson High-Yield Fund
Useful Information About Your Fund Report (unaudited)
Management Commentary
The Management Commentary in this report includes valuable insight as well as statistical information to help you understand how your Fund’s performance and characteristics stack up against those of comparable indices.
If the Fund invests in foreign securities, this report may include information about country exposure. Country exposure is based primarily on the country of risk. A company may be allocated to a country based on other factors such as location of the company’s principal office, the location of the principal trading market for the company’s securities, or the country where a majority of the company’s revenues are derived.
Please keep in mind that the opinions expressed in the Management Commentary are just that: opinions. They are a reflection based on best judgment at the time this report was compiled, which was June 30, 2023. As the investing environment changes, so could opinions. These views are unique and are not necessarily shared by fellow employees or by Janus Henderson in general.
Performance Overviews
Performance overview graphs compare the performance of a hypothetical $10,000 investment in the Fund with one or more widely used market indices. When comparing the performance of the Fund with an index, keep in mind that market indices are not available for investment and do not reflect deduction of expenses.
Average annual total returns are quoted for a Fund with more than one year of performance history. Average annual total return is calculated by taking the growth or decline in value of an investment over a period of time, including reinvestment of dividends and distributions, then calculating the annual compounded percentage rate that would have produced the same result had the rate of growth been constant throughout the period. Average annual total return does not reflect the deduction of taxes that a shareholder would pay on Fund distributions or redemptions of Fund shares.
Cumulative total returns are quoted for a Fund with less than one year of performance history. Cumulative total return is the growth or decline in value of an investment over time, independent of the period of time involved. Cumulative total return does not reflect the deduction of taxes that a shareholder would pay on Fund distributions or redemptions of Fund shares.
Pursuant to federal securities rules, expense ratios shown in the performance chart reflect subsidized (if applicable) and unsubsidized ratios. The total annual fund operating expenses ratio is gross of any fee waivers, reflecting the Fund’s unsubsidized expense ratio. The net annual fund operating expenses ratio (if applicable) includes contractual waivers of the Adviser and reflects the Fund’s subsidized expense ratio. Ratios may be higher or lower than those shown in the “Financial Highlights” in this report.
Schedule of Investments
Following the performance overview section is the Fund’s Schedule of Investments. This schedule reports the types of securities held in the Fund on the last day of the reporting period. Securities are usually listed by type (common stock, corporate bonds, U.S. Government obligations, etc.) and by industry classification (banking, communications, insurance, etc.). Holdings are subject to change without notice.
The value of each security is quoted as of the last day of the reporting period. The value of securities denominated in foreign currencies is converted into U.S. dollars.
If the Fund invests in foreign securities, it will also provide a summary of investments by country. This summary reports the Fund exposure to different countries by providing the percentage of securities invested in each country. The country of each security represents the country of risk. The Fund’s Schedule of Investments relies upon the industry group and country classifications published by Bloomberg and/or MSCI Inc.
Tables listing details of individual forward currency contracts, futures, written options, swaptions, and swaps follow the Fund’s Schedule of Investments (if applicable).
Statement of Assets and Liabilities
This statement is often referred to as the “balance sheet.” It lists the assets and liabilities of the Fund on the last day of the reporting period.
Janus Henderson High-Yield Fund
Useful Information About Your Fund Report (unaudited)
The Fund’s assets are calculated by adding the value of the securities owned, the receivable for securities sold but not yet settled, the receivable for dividends declared but not yet received on securities owned, and the receivable for Fund shares sold to investors but not yet settled. The Fund’s liabilities include payables for securities purchased but not yet settled, Fund shares redeemed but not yet paid, and expenses owed but not yet paid. Additionally, there may be other assets and liabilities such as unrealized gain or loss on forward currency contracts.
The section entitled “Net Assets Consist of” breaks down the components of the Fund’s net assets. Because the Fund must distribute substantially all earnings, you will notice that a significant portion of net assets is shareholder capital.
The last section of this statement reports the net asset value (“NAV”) per share on the last day of the reporting period. The NAV is calculated by dividing the Fund’s net assets for each share class (assets minus liabilities) by the number of shares outstanding.
Statement of Operations
This statement details the Fund’s income, expenses, realized gains and losses on securities and currency transactions, and changes in unrealized appreciation or depreciation of Fund holdings.
The first section in this statement, entitled “Investment Income,” reports the dividends earned from securities and interest earned from interest-bearing securities in the Fund.
The next section reports the expenses incurred by the Fund, including the advisory fee paid to the investment adviser, transfer agent fees and expenses, and printing and postage for mailing statements, financial reports and prospectuses. Expense offsets and expense reimbursements, if any, are also shown.
The last section lists the amounts of realized gains or losses from investment and foreign currency transactions, and changes in unrealized appreciation or depreciation of investments and foreign currency-denominated assets and liabilities. The Fund will realize a gain (or loss) when it sells its position in a particular security. A change in unrealized gain (or loss) refers to the change in net appreciation or depreciation of the Fund during the reporting period. “Net Realized and Unrealized Gain/(Loss) on Investments” is affected both by changes in the market value of Fund holdings and by gains (or losses) realized during the reporting period.
Statements of Changes in Net Assets
These statements report the increase or decrease in the Fund’s net assets during the reporting period. Changes in the Fund’s net assets are attributable to investment operations, dividends and distributions to investors, and capital share transactions. This is important to investors because it shows exactly what caused the Fund’s net asset size to change during the period.
The first section summarizes the information from the Statement of Operations regarding changes in net assets due to the Fund’s investment operations. The Fund’s net assets may also change as a result of dividend and capital gains distributions to investors. If investors receive their dividends and/or distributions in cash, money is taken out of the Fund to pay the dividend and/or distribution. If investors reinvest their dividends and/or distributions, the Fund’s net assets will not be affected.
The reinvestment of dividends and distributions is included under “Capital Share Transactions.” “Capital Shares” refers to the money investors contribute to the Fund through purchases or withdrawals via redemptions. The Fund’s net assets will increase and decrease in value as investors purchase and redeem shares from the Fund.
Financial Highlights
This schedule provides a per-share breakdown of the components that affect the Fund’s NAV for current and past reporting periods as well as total return, asset size, ratios, and portfolio turnover rate.
The first line in the table reflects the NAV per share at the beginning of the reporting period. The next line reports the net investment income/(loss) per share. Following is the per share total of net gains/(losses), realized and unrealized. Per share dividends and distributions to investors are then subtracted to arrive at the NAV per share at the end of the period. The next line reflects the total return for the period. The total return may include adjustments in accordance with generally accepted accounting principles required at the period end for financial reporting purposes. As a result, the total return may differ from the total return reflected for individual shareholder transactions. Also included are ratios of expenses and net investment income to average net assets.
Janus Henderson High-Yield Fund
Useful Information About Your Fund Report (unaudited)
The Fund’s expenses may be reduced through expense offsets and expense reimbursements. The ratios shown reflect expenses before and after any such offsets and reimbursements.
The ratio of net investment income/(loss) summarizes the income earned less expenses, divided by the average net assets of the Fund during the reporting period. Do not confuse this ratio with the Fund’s yield. The net investment income ratio is not a true measure of the Fund’s yield because it does not take into account the dividends distributed to the Fund’s investors.
The next figure is the portfolio turnover rate, which measures the buying and selling activity in the Fund. Portfolio turnover is affected by market conditions, changes in the asset size of the Fund, fluctuating volume of shareholder purchase and redemption orders, the nature of the Fund’s investments, and the investment style and/or outlook of the portfolio manager(s) and/or investment personnel. A 100% rate implies that an amount equal to the value of the entire portfolio was replaced once during the fiscal year; a 50% rate means that an amount equal to the value of half the portfolio is traded in a year; and a 200% rate means that an amount equal to the value of the entire portfolio is traded every six months.
Janus Henderson High-Yield Fund
Designation Requirements (unaudited)
For federal income tax purposes, the Fund designated the following for the year ended June 30, 2023:
| | |
| | |
Section 163(j) Interest Dividend | 93% |
Janus Henderson High-Yield Fund
Trustees and Officers (unaudited)
The following are the Trustees and officers of the Trust, together with a brief description of their principal occupations during the last five years (principal occupations for certain Trustees may include periods over five years). The Fund’s Statement of Additional Information includes additional information about the Trustees and officers and is available, without charge, by calling 1-877-335-2687.
Each Trustee has served in that capacity since he or she was originally elected or appointed. The Trustees do not serve a specified term of office. Each Trustee will hold office until the termination of the Trust or his or her earlier death, resignation, retirement, incapacity, or removal. Under the Fund’s Governance Procedures and Guidelines, the policy is for Trustees to retire no later than the end of the calendar year in which the Trustee turns 75. The Trustees review the Fund’s Governance Procedures and Guidelines from time to time and may make changes they deem appropriate. The Fund’s Nominating and Governance Committee will consider nominees for the position of Trustee recommended by shareholders. Shareholders may submit the name of a candidate for consideration by the Committee by submitting their recommendations to the Trust’s Secretary. Each Trustee is currently a Trustee of one other registered investment company advised by the Adviser: Janus Aspen Series. Collectively, these two registered investment companies consist of 49 series or funds referred to herein as the Fund Complex.
The Trust’s officers are elected annually by the Trustees for a one-year term. Certain officers also serve as officers of Janus Aspen Series. Certain officers of the Fund may also be officers and/or directors of the Adviser. Except as otherwise disclosed, Fund officers receive no compensation from the Fund, except for the Fund’s Chief Compliance Officer, as authorized by the Trustees.
| | | | | | |
TRUSTEES |
Name, Address, and Age | Positions Held with the Trust | Length of Time Served | Principal Occupations During the Past Five Years | Number of Portfolios/Funds in Fund Complex Overseen by Trustee | Other Directorships Held by Trustee During the Past Five Years |
Independent Trustees | | | | |
Alan A. Brown
151 Detroit Street
Denver, CO 80206
DOB: 1962 | Chairman
Trustee | 5/22-Present
1/13-Present | Principal, Curam Holdings LLC (since 2018). Formerly, Executive Vice President, Institutional Markets, of Black Creek Group (private equity real estate investment management firm) (2012-2018), Executive Vice President and Co-Head, Global Private Client Group (2007-2010), Executive Vice President, Mutual Funds (2005-2007), and Chief Marketing Officer (2001-2005) of Nuveen Investments, Inc. (asset management). | 49 | Advisory Board Member of AEW Core Property Trust (open-end property fund) (since 2020), and Director of WTTW (PBS affiliate) (since 2003). Formerly, Director of MotiveQuest LLC (strategic social market research company) (2003-2016), Director of Nuveen Global Investors LLC (2007-2011), Director of Communities in Schools (2004-2010), and Director of Mutual Fund Education Alliance (until 2010). |
Janus Henderson High-Yield Fund
Trustees and Officers (unaudited)
| | | | | | |
TRUSTEES |
Name, Address, and Age | Positions Held with the Trust | Length of Time Served | Principal Occupations During the Past Five Years | Number of Portfolios/Funds in Fund Complex Overseen by Trustee | Other Directorships Held by Trustee During the Past Five Years |
Independent Trustees | | | | |
Cheryl D. Alston
151 Detroit Street
Denver, CO 80206
DOB: 1966 | Trustee | 8/22-Present | Executive Director and Chief Investment Officer, Employees’ Retirement Fund of the City of Dallas (since 2004). | 49 | Director of Blue Cross Blue Shield of Kansas City (a not-for-profit health insurance provider) (since 2016) and Director of Global Life Insurance (life and supplemental health insurance provider) (since 2017). Formerly, Director of Federal Home Loan Bank of Dallas (2017-2021). |
Janus Henderson High-Yield Fund
Trustees and Officers (unaudited)
| | | | | | |
TRUSTEES |
Name, Address, and Age | Positions Held with the Trust | Length of Time Served | Principal Occupations During the Past Five Years | Number of Portfolios/Funds in Fund Complex Overseen by Trustee | Other Directorships Held by Trustee During the Past Five Years |
Independent Trustees | | | | |
Janus Henderson High-Yield Fund
Trustees and Officers (unaudited)
| | | | | | |
William D. Cvengros
151 Detroit Street
Denver, CO 80206
DOB: 1948 | Trustee | 1/11-Present | Chief Executive Officer of SJC Capital, LLC (a personal investment company and consulting firm) (since 2002). Formerly, Chief Executive Officer and President of PIMCO Advisors Holdings L.P. (a publicly traded investment management firm) (1994-2000), and Chief Investment Officer (1987-1994) and Vice Chairman and Director (1990-1994) of Pacific Life Insurance Company (a mutual life insurance and annuity company) (1987-1994). | 49 | Member, Limited Partner Advisory Committee, Karmel Capital Fund III (later stage growth fund) (since 2022), Member of the Investment Committee for the Orange County Community Foundation (a grantmaking foundation) (since 2020), Advisory Board Member, RevOZ Fund LP and related funds (real estate investments for opportunity zones) (since 2020), and Advisory Board Member, Innovate Partners Emerging Growth and Equity Fund I (early stage venture capital fund) (since 2014). Formerly, Managing Trustee of National Retirement Partners Liquidating Trust (2013-2016), Chairman, National Retirement Partners, Inc. (formerly a network of advisors to 401(k) plans) (2005-2013), Director of Prospect Acquisition Corp. (a special purpose acquisition corporation) (2007-2009), Director of RemedyTemp, Inc. (temporary help services company) (1996-2006), and Trustee of PIMCO Funds Multi-Manager Series (1990-2000) and Pacific Life Variable Life & Annuity Trusts (1987-1994). |
Janus Henderson High-Yield Fund
Trustees and Officers (unaudited)
| | | | | | |
TRUSTEES |
Name, Address, and Age | Positions Held with the Trust | Length of Time Served | Principal Occupations During the Past Five Years | Number of Portfolios/Funds in Fund Complex Overseen by Trustee | Other Directorships Held by Trustee During the Past Five Years |
Independent Trustees | | | | |
Raudline Etienne
151 Detroit Street
Denver, CO 80206
DOB: 1965 | Trustee | 6/16-Present | Founder, Daraja Capital (advisory and investment firm) (since 2016). Formerly, Senior Vice President and Senior Advisor, Albright Stonebridge Group LLC (global strategy firm) (2011-2021), and Deputy Comptroller and Chief Investment Officer, New York State Common Retirement Fund (public pension fund) (2008-2011). | 49 | Member of the Investment Committee for Cooper Union (private college) (since 2021) and Director of Brightwood Capital Advisors, LLC (since 2014). Formerly, Board Member, Van Alen Institute (nonprofit architectural and design organization) (2019-2022). |
Darrell B. Jackson
151 Detroit Street
Denver, CO 80206
DOB: 1958 | Trustee | 8/22-Present | President and Chief Executive Officer, The Efficace Group Inc. (since 2018). Formerly, President and Chief Executive Officer, Seaway Bank and Trust Company (community bank) (2014-2015), and Executive Vice President and Co-President, Wealth Management (2009-2014), and several senior positions, including Group Executive, Senior Vice President, and Vice President (1995-2009) of Northern Trust Company (financial services company) (1995-2014). | 49 | Director of Amalgamated Financial Corp (bank) (since August 2021), Director of YR Media (a not-for-profit production company) (since 2021), and Director of Gray-Bowen-Scott (transportation project consulting firm) (since April 2020). Formerly, Director of Delaware Place Bank (closely held commercial bank) (2016-2018) and Director of Seaway Bank and Trust Company (2014-2015). |
Janus Henderson High-Yield Fund
Trustees and Officers (unaudited)
| | | | | | |
TRUSTEES |
Name, Address, and Age | Positions Held with the Trust | Length of Time Served | Principal Occupations During the Past Five Years | Number of Portfolios/Funds in Fund Complex Overseen by Trustee | Other Directorships Held by Trustee During the Past Five Years |
Independent Trustees | | | | |
William F. McCalpin
151 Detroit Street
Denver, CO 80206
DOB: 1957 | Trustee | 6/02-Present | Chief Executive Officer, muun chi LLC (organic food business) (since 2022) and Independent Consultant (since 2019). Formerly, Chief Operating Officer, muun chi LLC (2020-2022), Managing Partner, Impact Investments, Athena Capital Advisors LLC (independent registered investment advisor) (2016-2019), Managing Director, Holos Consulting LLC (provides consulting services to foundations and other nonprofit organizations) (2009-2016), Chief Executive Officer, Imprint Capital Advisors (impact investment firm) (2013-2015), and Executive Vice President and Chief Operating Officer of The Rockefeller Brothers Fund (a private family foundation) (1998-2006). | 49 | Chairman of the Board and Trustee of The Investment Fund for Foundations Investment Program (TIP) (consisting of 1 fund) (since 2008). Formerly, Director of the F.B. Heron Foundation (a private grantmaking foundation) (2006-2022), and Director of Mutual Fund Directors Forum (a non-profit organization serving independent directors of U.S. mutual funds) (2016-2021). |
Janus Henderson High-Yield Fund
Trustees and Officers (unaudited)
| | | | | | |
TRUSTEES |
Name, Address, and Age | Positions Held with the Trust | Length of Time Served | Principal Occupations During the Past Five Years | Number of Portfolios/Funds in Fund Complex Overseen by Trustee | Other Directorships Held by Trustee During the Past Five Years |
Independent Trustees | | | | |
Gary A. Poliner
151 Detroit Street
Denver, CO 80206
DOB: 1953 | Trustee | 6/16-Present | Retired. Formerly, President (2010-2013) of Northwestern Mutual Life Insurance Company. | 49 | Director of MGIC Investment Corporation (private mortgage insurance) (since 2013). Formerly, Director, West Bend Mutual Insurance Company (property/casualty insurance) (2013-2021), Trustee of Northwestern Mutual Life Insurance Company (2010-2013) and Director of Frank Russell Company (global asset management firm) (2008-2013). |
Diane L. Wallace
151 Detroit Street
Denver, CO 80206
DOB: 1958 | Trustee | 6/17-Present | Retired. Formerly, Chief Operating Officer, Senior Vice President-Operations, and Chief Financial Officer for Driehaus Capital Management, LLC (1988-2006) and Treasurer for Driehaus Mutual Funds (1996-2002). | 49 | Formerly, Director of Family Service of Lake County (2019-2021), Independent Trustee, Henderson Global Funds (13 portfolios) (2015-2017), Independent Trustee, State Farm Associates’ Funds Trust, State Farm Mutual Fund Trust, and State Farm Variable Product Trust (28 portfolios) (2013-2017). |
Janus Henderson High-Yield Fund
Trustees and Officers (unaudited)
| | | | |
OFFICERS |
Name, Address, and Age | Positions Held with the Trust | Term of Office* and Length of Time Served | Principal Occupations During the Past Five Years |
Seth Meyer
151 Detroit Street
Denver, CO 80206
DOB: 1976 | Executive Vice President and Co-Portfolio Manager
Janus Henderson High-Yield Fund | 12/15-Present
| Head of Fixed-Income Strategy of Janus Henderson Investors and Portfolio Manager for other Janus Henderson accounts. |
Brent Olson
151 Detroit Street
Denver, CO 80206
DOB: 1967 | Executive Vice President and Co-Portfolio Manager
Janus Henderson High-Yield Fund | 6/19-Present | Portfolio Manager for other Janus Henderson accounts and Analyst for Janus Henderson Investors. Formerly, lead portfolio manager at Scout Investments on a growth equity strategy (2013-2017). |
Tom Ross
151 Detroit Street
Denver, CO 80206
DOB: 1979 | Executive Vice President and Co-Portfolio Manager
Janus Henderson High-Yield Fund | 10/22-Present | Global Head of High-Yield of Janus Henderson Investors and Portfolio Manager for other Janus Henderson accounts. |
Michelle Rosenberg
151 Detroit Street
Denver, CO 80206
DOB: 1973 | President and Chief Executive Officer | 9/22-Present | General Counsel and Corporate Secretary of Janus Henderson Investors (since 2018). Formerly, Interim President and Chief Executive Officer of the Trust and Janus Aspen Series (2022), Senior Vice President and Head of Legal, North America of Janus Henderson Investors (2017-2018) and Deputy General Counsel of Janus Henderson US (Holdings) Inc. (2015-2018). |
Janus Henderson High-Yield Fund
Trustees and Officers (unaudited)
| | | | |
OFFICERS |
Name, Address, and Age | Positions Held with the Trust | Term of Office* and Length of Time Served | Principal Occupations During the Past Five Years |
Kristin Mariani
151 Detroit Street
Denver, CO 80206
DOB: 1966 | Vice President and Chief Compliance Officer | 7/20-Present | Head of Compliance, North America at Janus Henderson Investors (since September 2020) and Chief Compliance Officer at Janus Henderson Investors US LLC (since September 2017). Formerly, Anti-Money Laundering Officer for the Trust and Janus Aspen Series (July 2020-December 2022), Global Head of Investment Management Compliance at Janus Henderson Investors (February 2019-August 2020), Vice President, Head of Global Distribution Compliance and Chief Compliance Officer at Janus Henderson Distributors US LLC (May 2017-September 2017), Vice President, Compliance at Janus Henderson US (Holdings) Inc., Janus Henderson Investors US LLC, and Janus Henderson Distributors US LLC (2009-2017). |
Jesper Nergaard
151 Detroit Street
Denver, CO 80206
DOB: 1962
| Chief Financial Officer
Vice President, Treasurer, and Principal Accounting Officer
| 3/05-Present
2/05-Present
| Head of U.S. Fund Administration, Janus Henderson Investors and Janus Henderson Services US LLC. |
Abigail J. Murray
151 Detroit Street
Denver, CO 80206
DOB: 1975 | Vice President, Chief Legal Counsel, and Secretary | 12/20-Present | Managing Counsel (since 2020). Formerly, Senior Counsel for Invesco Ltd. (2017-2020), and Vice President and Senior Counsel, ALPS Fund Services, Inc. and Assistant General Counsel, ALPS Advisors, Inc. (2015-2017). |
Ciaran Askin
151 Detroit Street
Denver, CO 80206
DOB: 1978 | Anti-Money Laundering Officer | 12/22-Present | Global Head of Financial Crime, Janus Henderson Investors (since 2022). Formerly, Global Head of Financial Crime for Invesco Ltd. (2017-2022). |
* Officers are elected at least annually by the Trustees for a one-year term and may also be elected from time to time by the Trustees for an interim period. |
Janus Henderson High-Yield Fund
Notes
NotesPage1
Janus Henderson High-Yield Fund
Notes
NotesPage2
Janus Henderson High-Yield Fund
Notes
NotesPage3
| | | | | | | | |
| | | | | |

| | | | |
This report is submitted for the general information of shareholders of the Fund. It is not an offer or solicitation for the Fund and is not authorized for distribution to prospective investors unless preceded or accompanied by an effective prospectus. |
Janus Henderson is a trademark of Janus Henderson Group plc or one of its subsidiaries. © Janus Henderson Group plc Janus Henderson Distributors US LLC Janus Henderson Group is the ultimate parent of Janus Henderson Distributors US LLC |
| | | | 125-02-93026 08-23 |
| | | |
| | | |
| | | ANNUAL REPORT June 30, 2023 |
| | |
| | Janus Henderson Mid Cap Value Fund |
| | |
| | Janus Investment Fund |
| |
| | | |
| | | HIGHLIGHTS · Portfolio management perspective · Investment strategy behind your fund · Fund performance, characteristics
and holdings |
Table of Contents
Janus Henderson Mid Cap Value Fund
Janus Henderson Mid Cap Value Fund (unaudited)
| | | | | | |
�� | | | | 
Kevin Preloger co-portfolio manager | 
Justin Tugman co-portfolio manager |
| | | |
PERFORMANCE OVERVIEW
For the 12-month period ended June 30, 2023, the Janus Henderson Mid Cap Value Fund Class I shares returned 11.75%, while its benchmark, the Russell Midcap® Value Index, returned 10.50%.
INVESTMENT ENVIRONMENT
Stocks began a volatile period in negative territory, with investors concerned about the pace and extent of interest rate hikes as central banks committed to getting inflation under control. Supply chain bottlenecks and commodity prices eased from earlier in 2022, but a tight labor market kept upward pressure on wages, leading the Federal Reserve (Fed) to hike interest rates 75 basis points (bps) in both July and September. The prospect of further rate tightening drove bond yields higher, adding to corporate funding challenges. Stocks then rose on hopes that moderating inflation might allow the Fed to slow the pace of its rate hikes. However, inflation remained stubbornly high, and the Fed raised rates by 75 bps in November, 50 bps in December, and 25 bps in both February and March.
The failure of several banks in March raised concerns over the condition of the U.S. and European banking industries, triggering a sell-off in financial and cyclical stocks and a flight to quality that benefited U.S. Treasuries. Amid the increased volatility, stocks continued to rally, especially in the industrials and consumer discretionary sectors, aided by signs of moderating inflation and resilient economic growth. Stocks in the utilities and materials sectors lagged the market. In May, the Fed raised rates by 25 bps but paused in June. Investors favored more speculative stocks toward period end, along with investments they expected to benefit from advancements in artificial intelligence.
PERFORMANCE DISCUSSION
The portfolio outperformed its benchmark for the 12-month period. Stock selection drove relative performance, with investments in consumer staples, materials, and real estate contributing on a relative basis, while stock selection in industrials, energy, and financials detracted. An underweight allocation to real estate also was beneficial.
In materials, our focus on cost-disciplined raw materials producers aided relative performance, as did our holding in Lincoln Electric Holdings, a multinational welding equipment manufacturer with quarterly earnings and year-over-year revenue over the period that consistently beat estimates. We also experienced a revival in housing construction near the close of the period, as the tight supply of existing homes on the market boosted demand for new construction. This benefited our holding in homebuilder Toll Brothers, which also reported strong revenue growth.
The top individual contributor over the period was Cardinal Health, which provides pharmaceutical and medical product distribution to healthcare providers – a business that has historically delivered stable returns and strong free cash flow.
On a negative note, despite reducing our bank exposure during the period, we remained slightly overweight relative to the benchmark, and while our stock selection in banks was additive, our overweight detracted. The period proved challenging for financial stocks, particularly in March, as rumors triggered a crisis of confidence that spurred customers to pull their deposits out of several regional banks. Among these was Silicon Valley Bank (SVB), one of our holdings. Unlike past bank crises, this run on deposits was not caused by credit concerns on the lending side. Instead, large depositors became concerned
Janus Henderson Mid Cap Value Fund (unaudited)
about the relative maturities of balance-sheet assets and liabilities that appeared worrisome in a rising rate environment. We responded by liquidating our investment in SVB. Nevertheless, the stock was one of the top individual detractors from relative performance over the period.
The crisis also triggered a broad-based – and, in our opinion, mostly indiscriminate – sell-off that impacted several other bank holdings including Zions Bancorp. While we reduced bank positions where we saw elevated risks, we believe the balance sheet fundamentals and lending practices of the banks we own remain strong. Additionally, we believe these banks have the capacity to manage deposit outflows because of their low loan-to-deposit ratios and diversified deposit bases. However, we were concerned that returns and profitability may decline, regulation may increase, and valuations may need to be reset. For these reasons, we further reduced our bank exposure. We believe the need for increased liquidity in the banking system likely will lead to a tightening of credit, which negatively could impact economic growth.
OUTLOOK
Going forward, we caution that markets may remain volatile, as investors wait to assess the repercussions of Fed rate hikes and the recent bank crisis. While we believe the risks of a wider banking crisis remain relatively low, we might see slower economic growth and a more challenging environment for companies with levered balance sheets or money-losing profiles. The Fed’s task has become more challenging, as policymakers must consider the health of the banking system against persistent inflation. While the bond market is discounting a Fed rate cut before the end of 2023, the bond market has been wrong in the past. Equity markets have not always responded positively to Fed rate cuts, which often have come in response to deteriorating economic conditions.
Despite these crosscurrents, we remain confident in our ability to navigate this environment through our disciplined, time-tested approach to value investing. We remain committed to owning companies with strong balance sheets, consistent free cash flow, and stable earnings profiles – attributes we believe will reward investors with strong investment performance. We also remain on the lookout for opportunities to use volatility to our advantage, as we seek out high-quality companies that may be trading at increasingly attractive valuations.
Thank you for your investment in the Janus Henderson Mid Cap Value Fund.
Basis point (bp) equals 1/100 of a percentage point. 1 bp = 0.01%, 100 bps = 1
Important Notice – Tailored Shareholder Reports
Effective January 24, 2023, the Securities and Exchange Commission (the “SEC”) adopted rule and form amendments that require mutual funds and exchange-traded funds to provide shareholders with streamlined annual and semi-annual shareholder reports that highlight key information. Other information, including financial statements, that currently appears in shareholder reports will be made available online, delivered free of charge to shareholders upon request, and filed with the SEC. The first tailored shareholder report for the Fund will be for the reporting period ending June 30, 2024. Currently, management is evaluating the impact of the rule and form amendments on the content of the Fund’s current shareholder reports.
Janus Henderson Mid Cap Value Fund (unaudited)
Fund At A Glance
June 30, 2023
| | | | | | | | | | |
| | | | | | | | | |
| | | | | | | | | |
| | | | | | | | | |
| 5 Top Contributors - Holdings | 5 Top Detractors - Holdings |
| | Average
Weight | | Relative
Contribution | | | Average
Weight | | Relative
Contribution |
| Cardinal Health Inc | 1.83% | | 0.89% | | SVB Financial Group | 0.25% | | -1.02% |
| Lincoln Electric Holdings Inc | 1.53% | | 0.68% | | Zions Bancorp NA | 0.49% | | -0.53% |
| Toll Brothers Inc | 0.65% | | 0.56% | | Entergy Corp | 2.11% | | -0.44% |
| Lamb Weston Holdings Inc | 1.17% | | 0.52% | | Alliant Energy Corp | 2.26% | | -0.40% |
| AMETEK Inc | 2.00% | | 0.50% | | Fidelity National Information Services Inc | 1.00% | | -0.40% |
| | | | | | | |
| 5 Top Contributors - Sectors* | | | | | |
| | | Relative | | Fund | Russell Midcap Value Index |
| | | Contribution | | Average Weight | Average Weight |
| Consumer Staples | | 1.17% | | 4.54% | 4.14% |
| Materials | | 1.07% | | 8.71% | 7.65% |
| Real Estate | | 1.04% | | 8.14% | 10.87% |
| Health Care | | 0.86% | | 11.14% | 7.28% |
| Information Technology | | 0.41% | | 9.05% | 8.97% |
| | | | | | |
| | | | | | |
| 5 Top Detractors - Sectors* | | | | | |
| | | Relative | | Fund | Russell Midcap Value Index |
| | | Contribution | | Average Weight | Average Weight |
| Industrials | | -1.62% | | 18.15% | 15.94% |
| Energy | | -0.52% | | 6.15% | 5.18% |
| Financials | | -0.51% | | 15.06% | 17.83% |
| Utilities | | -0.29% | | 4.98% | 8.83% |
| Other** | | -0.01% | | 1.84% | 0.00% |
| | | | | | | |
| Relative contribution reflects how the portolio's holdings impacted return relative to the benchmark. Cash and securities not held in the portfolio are not shown. For equity portfolios, relative contribution compares the performance of a security in the portfolio to the benchmark's total return, factoring in the difference in weight of that security in the benchmark. Returns are calculated using daily returns and previous day ending weights rolled up by ticker, excluding fixed income securities, gross of advisory fees, may exclude certain derivatives and will differ from actual performance.
Performance attribution reflects returns gross of advisory fees and may differ from actual returns as they are based on end of day holdings. Attribution is calculated by geometrically linking daily returns for the portfolio and index. |
* | Based on sector classification according to the Global Industry Classification Standard (“GICS”) codes, which are the exclusive property and a service mark of MSCI Inc. and Standard & Poor’s. |
** | Not a GICS classified sector. |
Janus Henderson Mid Cap Value Fund (unaudited)
Fund At A Glance
June 30, 2023
| | |
5 Largest Equity Holdings - (% of Net Assets) |
Cardinal Health Inc | |
Health Care Providers & Services | 2.8% |
Laboratory Corp of America Holdings | |
Health Care Providers & Services | 2.6% |
Hartford Financial Services Group Inc | |
Insurance | 2.6% |
Alliant Energy Corp | |
Electric Utilities | 2.5% |
AMETEK Inc | |
Electrical Equipment | 2.2% |
| | 12.7% |
| | | | | | |
Asset Allocation - (% of Net Assets) | |
Common Stocks | | 98.8% | |
Repurchase Agreements | | 1.2% | |
Other | | (0.0)% |
| | | 100.0% |
| | |
Top Country Allocations - Long Positions - (% of Investment Securities) |
As of June 30, 2023 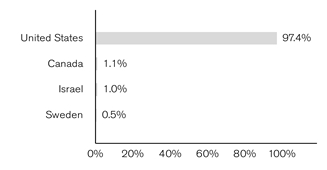
| As of June 30, 2022 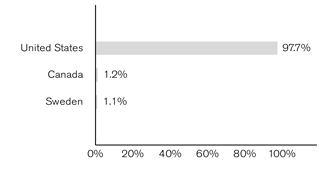
|
Janus Henderson Mid Cap Value Fund (unaudited)
Performance
| |
See important disclosures on the next page. |

| | | | | | | | | | |
| | | | | | | | |
| | | | | | | | | |
Average Annual Total Return - for the periods ended June 30, 2023 | | | Prospectus Expense Ratios |
| | One
Year | Five
Year | Ten
Year | Since
Inception* | | | Total Annual Fund
Operating Expenses‡ |
Class A Shares at NAV | | 11.30% | 5.46% | 7.36% | 10.10% | | | 0.93% |
Class A Shares at MOP | | 4.92% | 4.22% | 6.73% | 9.84% | | | |
Class C Shares at NAV | | 10.65% | 4.80% | 6.70% | 9.40% | | | 1.63% |
Class C Shares at CDSC | | 9.65% | 4.80% | 6.70% | 9.40% | | | |
Class D Shares | | 11.65% | 5.77% | 7.67% | 10.34% | | | 0.64% |
Class I Shares | | 11.75% | 5.82% | 7.71% | 10.36% | | | 0.60% |
Class L Shares(1) | | 11.66% | 5.76% | 7.71% | 10.43% | | | 0.81% |
Class N Shares | | 11.78% | 5.92% | 7.83% | 10.39% | | | 0.50% |
Class R Shares | | 10.94% | 5.12% | 7.03% | 9.77% | | | 1.26% |
Class S Shares | | 11.26% | 5.39% | 7.30% | 10.02% | | | 1.01% |
Class T Shares | | 11.57% | 5.67% | 7.57% | 10.28% | | | 0.75% |
Russell Midcap Value Index | | 10.50% | 6.84% | 9.03% | 9.14% | | | |
Morningstar Quartile - Class T Shares | | 3rd | 4th | 4th | 1st | | | |
Morningstar Ranking - based on total returns for Mid-Cap Value Funds | | 227/402 | 293/381 | 251/329 | 24/128 | | | |
Returns quoted are past performance and do not guarantee future results; current performance may be lower or higher. Investment returns and principal value will vary; there may be a gain or loss when shares are sold. For the most recent month-end performance call 800.668.0434 (or 800.525.3713 if you hold shares directly with Janus Henderson) or visit janushenderson.com/performance (or janushenderson.com/allfunds if you hold shares directly with Janus Henderson).
Maximum Offering Price (MOP) returns include the maximum sales charge of 5.75%. Net Asset Value (NAV) returns exclude this charge, which would have reduced returns.
CDSC returns include a 1% contingent deferred sales charge (CDSC) on Shares redeemed within 12 months of purchase. Net Asset Value (NAV) returns exclude this charge, which would have reduced returns.
For certain periods, the Fund’s performance may reflect the effects of expense waivers.
This Fund has a performance-based management fee that may adjust up or down based on the Fund’s performance.
Performance may be affected by risks that include those associated with foreign and emerging markets, fixed income securities, high-yield and high-risk
Janus Henderson Mid Cap Value Fund (unaudited)
Performance
securities, undervalued, overlooked and smaller capitalization companies, real estate related securities including Real Estate Investment Trusts (REITs), Environmental, Social and Governance (ESG) factors, non-diversification, portfolio turnover, derivatives, short sales, initial public offerings (IPOs) and potential conflicts of interest. Each product has different risks. Please see the prospectus for more information about risks, holdings and other details.
Returns include reinvestment of all dividends and distributions and do not reflect the deduction of taxes that a shareholder would pay on Fund distributions or redemptions of Fund shares. The returns do not include adjustments in accordance with generally accepted accounting principles required at the period end for financial reporting purposes.
Class A Shares, Class C Shares, Class R Shares, and Class S Shares commenced operations on July 6, 2009. Performance shown for each class reflects the performance of the Fund’s Class J Shares (formerly named Investor Shares), from April 21, 2003 to July 6, 2009, calculated using the fees and expenses of the corresponding class, without the effect of any fee and expense limitations or waivers. For periods prior to April 21, 2003, the performance shown for each class reflects the historical performance of Berger Mid Cap Value Fund – Investor Shares (as a result of a prior reorganization of Berger Mid Cap Value Fund – Investor Shares into the Fund’s former Class J Shares), calculated using the fees and expenses of the corresponding class respectively, without the effect of any fee and expense limitations or waivers.
Class D Shares commenced operations on February 16, 2010, as a result of the restructuring of Class J Shares, the predecessor share class. Performance shown for periods prior to February 16, 2010, reflects the performance of the Fund’s former Class J Shares (formerly named Investor Shares). For the periods prior to April 21, 2003, the performance shown for Class D Shares reflects the historical performance of Berger Mid Cap Value Fund – Investor Shares (as a result of a separate prior reorganization).
Class I Shares commenced operations on July 6, 2009. Performance shown reflects the performance of the Fund’s Class J Shares (formerly named Investor Shares) from April 21, 2003 to July 6, 2009, calculated using the fees and expenses of Class J Shares, net of any applicable fee and expense limitations or waivers. For the periods prior to April 21, 2003, the performance shown for Class I Shares reflects the historical performance of Berger Mid Cap Value Fund – Investor Shares (as a result of a separate prior reorganization), calculated using the fees and expenses of Class J Shares, net of any applicable fee and expense limitations or waivers.
Class L Shares commenced operations on April 21, 2003. Performance shown for periods following April 21, 2003, reflects the fees and expenses of Class L Shares (formerly named Institutional Shares), net of any applicable fee and expense limitations or waivers. The performance shown for Class L Shares for the periods from May 17, 2002 to April 17, 2003, reflects the historical performance of Berger Mid Cap Value Fund – Institutional Shares (as a result of a prior reorganization of Berger Mid Cap Value Fund – Institutional Shares into the Fund’s Class L Shares). For the periods prior to May 17, 2002, the performance shown reflects the historical performance of Berger Mid Cap Value Fund – Investor Shares.
Class N Shares of the Fund commenced operations on May 31, 2012. Performance shown for Class N Shares reflects the performance of the Fund’s Class T Shares from July 6, 2009 to May 31, 2012, calculated using the fees and expenses of Class T Shares, net of any applicable fee and expense limitations or waivers. For the period from April 21, 2003 to July 6, 2009, the performance shown for Class N Shares reflects the performance of Class J Shares (formerly named Investor Shares), calculated using the fees and expenses of Class J Shares, net of any applicable fee and expense limitations or waivers. For the periods prior to April 21, 2003, the performance shown for Class N Shares reflects the historical performance of Berger Mid Cap Value Fund – Investor Shares (as a result of a separate prior reorganization), calculated using the fees and expenses of Class J Shares, net of any applicable fee and expense limitations or waivers.
Class T Shares (formerly named Class J Shares) commenced operations with the Fund’s inception. Performance shown for periods following April 21, 2003, reflects the fees and expenses of Class T Shares in effect during the periods shown, net of any applicable fee and expense limitations or waivers. For the periods prior to April 21, 2003, the performance shown for Class T Shares reflects the historical performance of Berger Mid Cap Value Fund – Investor Shares (as a result of a separate prior reorganization).
If each share class of the Fund had been available during periods prior to its commencement, the performance shown may have been different. The performance shown for periods following the Fund’s commencement of each share class reflects the fees and expenses of each respective share class, net of any applicable fee and expense limitations or waivers. Please refer to the Fund’s prospectuses for further details concerning historical performance.
Ranking is for the share class shown only; other classes may have different performance characteristics. When an expense waiver is in effect, it may have a material effect on the total return, and therefore the ranking for the period.
© 2023 Morningstar, Inc. All Rights Reserved.
There is no assurance that the investment process will consistently lead to successful investing.
See Notes to Schedule of Investments and Other Information for index definitions.
Index performance does not reflect the expenses of managing a portfolio as an index is unmanaged and not available for direct investment.
See “Useful Information About Your Fund Report.”
*The predecessor Fund’s inception date – August 12, 1998
‡ As stated in the prospectus. See Financial Highlights for actual expense ratios during the reporting period.
(1) Closed to new investors.
Janus Henderson Mid Cap Value Fund (unaudited)
Expense Examples
As a shareholder of the Fund, you incur two types of costs: (1) transaction costs, such as sales charges (loads) on purchase payments (applicable to Class A Shares only); and (2) ongoing costs, including management fees; 12b-1 distribution and shareholder servicing fees; transfer agent fees and expenses payable pursuant to the Transfer Agency Agreement; and other Fund expenses. This example is intended to help you understand your ongoing costs (in dollars) of investing in the Fund and to compare these costs with the ongoing costs of investing in other mutual funds. To do so, compare this 5% hypothetical example with the 5% hypothetical examples that appear in the shareholder reports of the other funds. The example is based upon an investment of $1,000 invested at the beginning of the period and held for the six-months indicated, unless noted otherwise in the table and footnotes below.
Actual Expenses
The information in the table under the heading “Actual” provides information about actual account values and actual expenses. You may use the information in these columns, together with the amount you invested, to estimate the expenses that you paid over the period. Simply divide your account value by $1,000 (for example, an $8,600 account value divided by $1,000 = 8.6), then multiply the result by the number in the appropriate column for your share class under the heading entitled “Expenses Paid During Period” to estimate the expenses you paid on your account during the period.
Hypothetical Example for Comparison Purposes
The information in the table under the heading “Hypothetical (5% return before expenses)” provides information about hypothetical account values and hypothetical expenses based upon the Fund’s actual expense ratio and an assumed rate of return of 5% per year before expenses, which is not the Fund’s actual return. The hypothetical account values and expenses may not be used to estimate the actual ending account balance or expenses you paid for the period. You may use this information to compare the ongoing costs of investing in the Fund and other funds. To do so, compare this 5% hypothetical example with the 5% hypothetical examples that appear in the shareholder reports of the other funds. Additionally, for an analysis of the fees associated with an investment in any share class or other similar funds, please visit www.finra.org/fundanalyzer.
Please note that the expenses shown in the table are meant to highlight your ongoing costs only and do not reflect any transaction costs. These fees are fully described in the Fund’s prospectuses. Therefore, the hypothetical examples are useful in comparing ongoing costs only, and will not help you determine the relative total costs of owning different funds. In addition, if these transaction costs were included, your costs would have been higher.
| | | | | | | | | | | |
| | | | | | | | |
| | | Actual | | Hypothetical
(5% return before expenses) | |
| Beginning
Account
Value
(1/1/23) | Ending
Account
Value
(6/30/23) | Expenses
Paid During
Period
(1/1/23 - 6/30/23)† | | Beginning
Account
Value
(1/1/23) | Ending
Account
Value
(6/30/23) | Expenses
Paid During
Period
(1/1/23 - 6/30/23)† | Net Annualized
Expense Ratio
(1/1/23 - 6/30/23) |
Class A Shares | $1,000.00 | $1,037.00 | $4.55 | | $1,000.00 | $1,020.33 | $4.51 | 0.90% |
Class C Shares | $1,000.00 | $1,034.10 | $7.77 | | $1,000.00 | $1,017.16 | $7.70 | 1.54% |
Class D Shares | $1,000.00 | $1,039.30 | $3.19 | | $1,000.00 | $1,021.67 | $3.16 | 0.63% |
Class I Shares | $1,000.00 | $1,039.20 | $2.98 | | $1,000.00 | $1,021.87 | $2.96 | 0.59% |
Class L Shares | $1,000.00 | $1,038.40 | $3.29 | | $1,000.00 | $1,021.57 | $3.26 | 0.65% |
Class N Shares | $1,000.00 | $1,039.50 | $2.48 | | $1,000.00 | $1,022.36 | $2.46 | 0.49% |
Class R Shares | $1,000.00 | $1,035.70 | $6.26 | | $1,000.00 | $1,018.65 | $6.21 | 1.24% |
Class S Shares | $1,000.00 | $1,036.90 | $5.00 | | $1,000.00 | $1,019.89 | $4.96 | 0.99% |
Class T Shares | $1,000.00 | $1,038.30 | $3.64 | | $1,000.00 | $1,021.22 | $3.61 | 0.72% |
† | Expenses Paid During Period are equal to the Net Annualized Expense Ratio multiplied by the average account value over the period, multiplied by 181/365 (to reflect the one-half year period). Expenses in the examples include the effect of applicable fee waivers and/or expense reimbursements, if any. Had such waivers and/or reimbursements not been in effect, your expenses would have been higher. Please refer to the Notes to Financial Statements or the Fund’s prospectuses for more information regarding waivers and/or reimbursements. |
Janus Henderson Mid Cap Value Fund
Schedule of Investments
June 30, 2023
| | | | | | | | |
Shares or
Principal Amounts | | | Value | |
Common Stocks– 98.8% | | | |
Aerospace & Defense – 2.5% | | | |
| | BWX Technologies Inc | | 417,672 | | | $29,892,785 | |
| | L3Harris Technologies Inc | | 111,988 | | | 21,923,891 | |
| | | 51,816,676 | |
Auto Components – 1.2% | | | |
| | Aptiv PLC* | | 144,126 | | | 14,713,823 | |
| | Autoliv Inc | | 125,615 | | | 10,682,300 | |
| | | 25,396,123 | |
Banks – 2.9% | | | |
| | PNC Financial Services Group Inc/The | | 136,235 | | | 17,158,798 | |
| | Regions Financial Corp | | 678,109 | | | 12,083,902 | |
| | Synovus Financial Corp | | 457,062 | | | 13,826,126 | |
| | Wintrust Financial Corp | | 230,611 | | | 16,746,971 | |
| | | 59,815,797 | |
Building Products – 3.4% | | | |
| | Carlisle Cos Inc | | 113,300 | | | 29,064,849 | |
| | Fortune Brands Home & Security Inc | | 549,556 | | | 39,540,554 | |
| | | 68,605,403 | |
Capital Markets – 3.5% | | | |
| | Jefferies Financial Group Inc | | 1,009,255 | | | 33,476,988 | |
| | State Street Corp | | 507,351 | | | 37,127,946 | |
| | | 70,604,934 | |
Chemicals – 4.6% | | | |
| | Axalta Coating Systems Ltd* | | 936,329 | | | 30,720,954 | |
| | Corteva Inc | | 566,203 | | | 32,443,432 | |
| | FMC Corp | | 144,544 | | | 15,081,721 | |
| | Westlake Chemical Corp | | 133,191 | | | 15,912,329 | |
| | | 94,158,436 | |
Commercial Services & Supplies – 1.8% | | | |
| | Waste Connections Inc | | 255,442 | | | 36,510,325 | |
Construction Materials – 1.6% | | | |
| | Martin Marietta Materials Inc | | 70,856 | | | 32,713,507 | |
Containers & Packaging – 1.3% | | | |
| | Graphic Packaging Holding Co | | 1,074,488 | | | 25,819,947 | |
Diversified Financial Services – 1.5% | | | |
| | Fidelity National Information Services Inc | | 549,061 | | | 30,033,637 | |
Electric Utilities – 4.6% | | | |
| | Alliant Energy Corp | | 966,397 | | | 50,716,515 | |
| | Entergy Corp | | 447,993 | | | 43,621,078 | |
| | | 94,337,593 | |
Electrical Equipment – 2.2% | | | |
| | AMETEK Inc | | 283,447 | | | 45,884,400 | |
Electronic Equipment, Instruments & Components – 3.3% | | | |
| | Insight Enterprises Inc* | | 103,792 | | | 15,188,921 | |
| | Vontier Corp | | 932,527 | | | 30,036,695 | |
| | Zebra Technologies Corp* | | 73,252 | | | 21,670,139 | |
| | | 66,895,755 | |
Energy Equipment & Services – 1.9% | | | |
| | Baker Hughes Co | | 1,221,671 | | | 38,617,020 | |
Entertainment – 2.0% | | | |
| | Activision Blizzard Inc* | | 472,042 | | | 39,793,141 | |
Food & Staples Retailing – 2.1% | | | |
| | Casey's General Stores Inc | | 178,786 | | | 43,602,330 | |
Food Products – 2.6% | | | |
| | Kellogg Co | | 590,846 | | | 39,823,020 | |
| | Lamb Weston Holdings Inc | | 106,898 | | | 12,287,925 | |
| | | 52,110,945 | |
Health Care Equipment & Supplies – 2.4% | | | |
| | Envista Holdings Corp* | | 272,546 | | | 9,222,957 | |
| | |
See Notes to Schedule of Investments and Other Information and Notes to Financial Statements. |
| |
8 | JUNE 30, 2023 |
Janus Henderson Mid Cap Value Fund
Schedule of Investments
June 30, 2023
| | | | | | | | |
Shares or
Principal Amounts | | | Value | |
Common Stocks– (continued) | | | |
Health Care Equipment & Supplies– (continued) | | | |
| | Globus Medical Inc* | | 683,245 | | | $40,680,407 | |
| | | 49,903,364 | |
Health Care Providers & Services – 8.1% | | | |
| | Amedisys Inc* | | 224,255 | | | 20,505,877 | |
| | Cardinal Health Inc | | 611,732 | | | 57,851,495 | |
| | Henry Schein Inc* | | 182,386 | | | 14,791,505 | |
| | Humana Inc | | 40,322 | | | 18,029,176 | |
| | Laboratory Corp of America Holdings | | 220,455 | | | 53,202,405 | |
| | | 164,380,458 | |
Hotel & Resort Real Estate Investment Trusts (REITs) – 0.8% | | | |
| | Apple Hospitality Inc | | 1,106,578 | | | 16,720,394 | |
Household Durables – 1.9% | | | |
| | Toll Brothers Inc | | 479,065 | | | 37,879,670 | |
Industrial Real Estate Investment Trusts (REITs) – 1.2% | | | |
| | STAG Industrial Inc | | 655,110 | | | 23,505,347 | |
Insurance – 5.7% | | | |
| | Globe Life Inc | | 294,656 | | | 32,300,191 | |
| | Hartford Financial Services Group Inc | | 735,442 | | | 52,966,533 | |
| | RenaissanceRe Holdings Ltd | | 99,216 | | | 18,505,768 | |
| | Willis Towers Watson PLC | | 51,514 | | | 12,131,547 | |
| | | 115,904,039 | |
Life Sciences Tools & Services – 1.5% | | | |
| | Avantor Inc* | | 576,028 | | | 11,831,615 | |
| | Charles River Laboratories International Inc* | | 58,845 | | | 12,372,161 | |
| | PerkinElmer Inc | | 52,721 | | | 6,262,728 | |
| | | 30,466,504 | |
Machinery – 4.7% | | | |
| | Hillenbrand Inc | | 664,997 | | | 34,101,046 | |
| | Lincoln Electric Holdings Inc | | 181,542 | | | 36,059,687 | |
| | Oshkosh Corp | | 286,045 | | | 24,768,637 | |
| | | 94,929,370 | |
Media – 1.8% | | | |
| | Fox Corp - Class B | | 1,140,897 | | | 36,383,205 | |
Metals & Mining – 2.1% | | | |
| | Freeport-McMoRan Inc | | 1,047,198 | | | 41,887,920 | |
Oil, Gas & Consumable Fuels – 5.1% | | | |
| | Chesapeake Energy Corp | | 522,883 | | | 43,754,849 | |
| | Marathon Oil Corp | | 1,261,841 | | | 29,047,580 | |
| | Pioneer Natural Resources Co | | 145,674 | | | 30,180,739 | |
| | | 102,983,168 | |
Real Estate Management & Development – 0.7% | | | |
| | CBRE Group Inc* | | 181,889 | | | 14,680,261 | |
Residential Real Estate Investment Trusts (REITs) – 2.2% | | | |
| | Equity LifeStyle Properties Inc | | 674,104 | | | 45,090,817 | |
Road & Rail – 1.8% | | | |
| | Canadian Pacific Kansas City Ltd | | 263,015 | | | 21,243,722 | |
| | Landstar System Inc | | 78,931 | | | 15,197,375 | |
| | | 36,441,097 | |
Semiconductor & Semiconductor Equipment – 3.1% | | | |
| | Lam Research Corp | | 28,740 | | | 18,475,796 | |
| | Microchip Technology Inc | | 285,683 | | | 25,594,340 | |
| | Teradyne Inc | | 166,623 | | | 18,550,139 | |
| | | 62,620,275 | |
Software – 2.4% | | | |
| | Black Knight Inc* | | 454,934 | | | 27,173,208 | |
| | Nice Ltd (ADR)* | | 101,073 | | | 20,871,574 | |
| | | 48,044,782 | |
| | |
See Notes to Schedule of Investments and Other Information and Notes to Financial Statements. |
| |
Janus Investment Fund | 9 |
Janus Henderson Mid Cap Value Fund
Schedule of Investments
June 30, 2023
| | | | | | | | |
Shares or
Principal Amounts | | | Value | |
Common Stocks– (continued) | | | |
Specialized Real Estate Investment Trusts (REITs) – 2.7% | | | |
| | Lamar Advertising Co | | 410,533 | | | $40,745,400 | |
| | PotlatchDeltic Corp | | 284,978 | | | 15,061,087 | |
| | | 55,806,487 | |
Specialty Retail – 4.6% | | | |
| | AutoZone Inc* | | 8,409 | | | 20,966,664 | |
| | Bath & Body Works Inc | | 703,234 | | | 26,371,275 | |
| | Burlington Stores Inc* | | 139,580 | | | 21,968,496 | |
| | O'Reilly Automotive Inc* | | 26,434 | | | 25,252,400 | |
| | | 94,558,835 | |
Trading Companies & Distributors – 3.0% | | | |
| | GATX Corp | | 132,312 | | | 17,033,847 | |
| | MSC Industrial Direct Co Inc | | 469,504 | | | 44,734,341 | |
| | | 61,768,188 | |
Total Common Stocks (cost $1,482,166,399) | | 2,010,670,150 | |
Repurchase Agreements– 1.2% | | | |
| | ING Financial Markets LLC, Joint repurchase agreement, 5.0500%, dated 6/30/23, maturing 7/3/23 to be repurchased at $9,904,166 collateralized by $10,942,084 in U.S. Treasuries 0% - 4.6250%, 4/18/24 - 11/15/52 with a value of $10,102,251 | | $9,900,000 | | | 9,900,000 | |
| | Royal Bank of Canada, NY Branch, Joint repurchase agreement, 4.9900%, dated 6/30/23, maturing 7/3/23 to be repurchased at $15,006,238 collateralized by $16,414,230 in U.S. Treasuries 2.2500% - 5.4177%, 1/31/24 - 8/15/27 with a value of $15,306,363 | | 15,000,000 | | | 15,000,000 | |
Total Repurchase Agreements (cost $24,900,000) | | 24,900,000 | |
Total Investments (total cost $1,507,066,399) – 100.0% | | 2,035,570,150 | |
Liabilities, net of Cash, Receivables and Other Assets – (0)% | | (344,803) | |
Net Assets – 100% | | $2,035,225,347 | |
| | | | | | |
Summary of Investments by Country - (Long Positions) (unaudited) |
| |
| | | | | % of | |
| | | | | Investment | |
Country | | Value | | Securities | |
United States | | $1,982,772,554 | | 97.4 | % |
Canada | | 21,243,722 | | 1.1 | |
Israel | | 20,871,574 | | 1.0 | |
Sweden | | 10,682,300 | | 0.5 | |
| | | | | | |
| | | | | | |
Total | | $2,035,570,150 | | 100.0 | % |
| | |
See Notes to Schedule of Investments and Other Information and Notes to Financial Statements. |
| |
10 | JUNE 30, 2023 |
Janus Henderson Mid Cap Value Fund
Schedule of Investments
June 30, 2023
| | | | | | | | | | |
Offsetting of Financial Assets and Derivative Assets |
| |
| | | Gross Amounts | | | | | | |
| | | of Recognized | | Offsetting Asset | | Collateral | | |
Counterparty | | Assets | | or Liability(a) | | Pledged(b) | | Net Amount |
| | | | | | | | | |
ING Financial Markets LLC | $ | 9,900,000 | $ | — | $ | (9,900,000) | $ | — |
Royal Bank of Canada, NY Branch | | 15,000,000 | | — | | (15,000,000) | | — |
| | | | | | | | | |
Total | $ | 24,900,000 | $ | — | $ | (24,900,000) | $ | — |
(a) | Represents the amount of assets or liabilities that could be offset with the same counterparty under master netting or similar agreements that management elects not to offset on the Statement of Assets and Liabilities. |
(b) | Collateral pledged is limited to the net outstanding amount due to/from an individual counterparty. The actual collateral amounts pledged may exceed these amounts and may fluctuate in value. |
| | |
See Notes to Schedule of Investments and Other Information and Notes to Financial Statements. |
| |
Janus Investment Fund | 11 |
Janus Henderson Mid Cap Value Fund
Notes to Schedule of Investments and Other Information
| | |
Russell Midcap® Value Index | Russell Midcap® Value Index reflects the performance of U.S. mid-cap equities with lower price-to-book ratios and lower forecasted growth values. |
| | |
ADR | American Depositary Receipt |
LLC | Limited Liability Company |
PLC | Public Limited Company |
| | |
* | Non-income producing security. |
| | | | | | | | | | | | | |
The following is a summary of the inputs that were used to value the Fund’s investments in securities and other financial instruments as of June 30, 2023. See Notes to Financial Statements for more information. |
| |
Valuation Inputs Summary |
| | | | | | | |
| | | | | Level 2 - | | Level 3 - |
| | | Level 1 - | | Other Significant | | Significant |
| | | Quoted Prices | | Observable Inputs | | Unobservable Inputs |
| | | | | | | |
Assets | | | | | | |
Investments In Securities: | | | | | | |
Common Stocks | $ | 2,010,670,150 | $ | - | $ | - |
Repurchase Agreements | | - | | 24,900,000 | | - |
Total Assets | $ | 2,010,670,150 | $ | 24,900,000 | $ | - |
| | | | | | | |
Janus Henderson Mid Cap Value Fund
Statement of Assets and Liabilities
June 30, 2023
| |
See footnotes at the end of the Statement. |
| | | | | | | |
| | | | | | |
Assets: | | | | |
| Investments, at value (cost $1,482,166,399) | | $ | 2,010,670,150 | |
| Repurchase agreements, at value (cost $24,900,000) | | | 24,900,000 | |
| Cash | | | 18,393 | |
| Trustees' deferred compensation | | | 51,731 | |
| Receivables: | | | | |
| | Dividends | | | 2,394,781 | |
| | Fund shares sold | | | 682,547 | |
| | Interest | | | 10,404 | |
| Other assets | | | 7,584 | |
Total Assets | | | 2,038,735,590 | |
Liabilities: | | | | |
| Payables: | | | — | |
| | Fund shares repurchased | | | 2,073,366 | |
| | Advisory fees | | | 806,064 | |
| | Transfer agent fees and expenses | | | 316,724 | |
| | Professional fees | | | 55,156 | |
| | Trustees' deferred compensation fees | | | 51,731 | |
| | 12b-1 Distribution and shareholder servicing fees | | | 48,881 | |
| | Trustees' fees and expenses | | | 12,798 | |
| | Affiliated fund administration fees payable | | | 4,357 | |
| | Custodian fees | | | 2,718 | |
| | Accrued expenses and other payables | | | 138,448 | |
Total Liabilities | | | 3,510,243 | |
Net Assets | | $ | 2,035,225,347 | |
| | |
See Notes to Financial Statements. |
| |
Janus Investment Fund | 13 |
Janus Henderson Mid Cap Value Fund
Statement of Assets and Liabilities
June 30, 2023
| | | | | | | |
| | | | | | |
| | | | | | | |
Net Assets Consist of: | | | | |
| Capital (par value and paid-in surplus) | | $ | 1,403,283,661 | |
| Total distributable earnings (loss) | | | 631,941,686 | |
Total Net Assets | | $ | 2,035,225,347 | |
Net Assets - Class A Shares | | $ | 56,730,951 | |
| Shares Outstanding, $0.01 Par Value (unlimited shares authorized) | | | 3,610,822 | |
Net Asset Value Per Share(1) | | $ | 15.71 | |
Maximum Offering Price Per Share(2) | | $ | 16.67 | |
Net Assets - Class C Shares | | $ | 7,997,514 | |
| Shares Outstanding, $0.01 Par Value (unlimited shares authorized) | | | 528,033 | |
Net Asset Value Per Share(1) | | $ | 15.15 | |
Net Assets - Class D Shares | | $ | 685,186,082 | |
| Shares Outstanding, $0.01 Par Value (unlimited shares authorized) | | | 44,708,595 | |
Net Asset Value Per Share | | $ | 15.33 | |
Net Assets - Class I Shares | | $ | 208,187,117 | |
| Shares Outstanding, $0.01 Par Value (unlimited shares authorized) | | | 13,548,259 | |
Net Asset Value Per Share | | $ | 15.37 | |
Net Assets - Class L Shares | | $ | 4,014,272 | |
| Shares Outstanding, $0.01 Par Value (unlimited shares authorized) | | | 251,517 | |
Net Asset Value Per Share | | $ | 15.96 | |
Net Assets - Class N Shares | | $ | 187,335,217 | |
| Shares Outstanding, $0.01 Par Value (unlimited shares authorized) | | | 12,264,392 | |
Net Asset Value Per Share | | $ | 15.27 | |
Net Assets - Class R Shares | | $ | 35,106,983 | |
| Shares Outstanding, $0.01 Par Value (unlimited shares authorized) | | | 2,285,629 | |
Net Asset Value Per Share | | $ | 15.36 | |
Net Assets - Class S Shares | | $ | 68,572,167 | |
| Shares Outstanding, $0.01 Par Value (unlimited shares authorized) | | | 4,362,812 | |
Net Asset Value Per Share | | $ | 15.72 | |
Net Assets - Class T Shares | | $ | 782,095,044 | |
| Shares Outstanding, $0.01 Par Value (unlimited shares authorized) | | | 50,598,933 | |
Net Asset Value Per Share | | $ | 15.46 | |
| |
(1) Redemption price per share may be reduced for any applicable contingent deferred sales charge. (2) Maximum offering price is computed at 100/94.25 of net asset value. |
| | |
See Notes to Financial Statements. |
| |
14 | JUNE 30, 2023 |
Janus Henderson Mid Cap Value Fund
Statement of Operations
For the year ended June 30, 2023
| | | | | | |
| | | | | |
Investment Income: | | | |
| Dividends | $ | 38,071,653 | |
| Interest | | 1,296,141 | |
| Other income | | 774 | |
| Foreign tax withheld | | (75,064) | |
Total Investment Income | | 39,293,504 | |
Expenses: | | | |
| Advisory fees | | 9,456,417 | |
| 12b-1 Distribution and shareholder servicing fees: | | | |
| | Class A Shares | | 149,260 | |
| | Class C Shares | | 76,011 | |
| | Class R Shares | | 183,637 | |
| | Class S Shares | | 174,832 | |
| Transfer agent administrative fees and expenses: | | | |
| | Class D Shares | | 813,246 | |
| | Class L Shares | | 10,857 | |
| | Class R Shares | | 92,113 | |
| | Class S Shares | | 175,115 | |
| | Class T Shares | | 2,038,859 | |
| Transfer agent networking and omnibus fees: | | | |
| | Class A Shares | | 95,326 | |
| | Class C Shares | | 7,545 | |
| | Class I Shares | | 206,143 | |
| Other transfer agent fees and expenses: | | | |
| | Class A Shares | | 4,219 | |
| | Class C Shares | | 486 | |
| | Class D Shares | | 100,192 | |
| | Class I Shares | | 11,830 | |
| | Class L Shares | | 104 | |
| | Class N Shares | | 8,238 | |
| | Class R Shares | | 990 | |
| | Class S Shares | | 1,718 | |
| | Class T Shares | | 9,285 | |
| Shareholder reports expense | | 170,744 | |
| Registration fees | | 131,567 | |
| Professional fees | | 67,487 | |
| Affiliated fund administration fees | | 66,624 | |
| Trustees’ fees and expenses | | 56,569 | |
| Custodian fees | | 10,372 | |
| Other expenses | | 186,982 | |
Total Expenses | | 14,306,768 | |
Less: Excess Expense Reimbursement and Waivers | | (89,992) | |
Net Expenses | | 14,216,776 | |
Net Investment Income/(Loss) | | 25,076,728 | |
Net Realized Gain/(Loss) on Investments: | | | |
| Investments | | 120,849,434 | |
Total Net Realized Gain/(Loss) on Investments | | 120,849,434 | |
Change in Unrealized Net Appreciation/Depreciation: | | | |
| Investments, foreign currency translations and Trustees’ deferred compensation | | 80,841,432 | |
Total Change in Unrealized Net Appreciation/Depreciation | | 80,841,432 | |
Net Increase/(Decrease) in Net Assets Resulting from Operations | $ | 226,767,594 | |
| | | | | |
| | |
See Notes to Financial Statements. |
| |
Janus Investment Fund | 15 |
Janus Henderson Mid Cap Value Fund
Statements of Changes in Net Assets
| | | | | | | | | |
| | | | | | | | |
| | | Year ended
June 30, 2023 | | Year ended
June 30, 2022 | |
| | | | | | | | | |
Operations: | | | | | | |
| Net investment income/(loss) | $ | 25,076,728 | | $ | 27,298,555 | |
| Net realized gain/(loss) on investments | | 120,849,434 | | | 254,198,111 | |
| Change in unrealized net appreciation/depreciation | | 80,841,432 | | | (412,530,566) | |
Net Increase/(Decrease) in Net Assets Resulting from Operations | | 226,767,594 | | | (131,033,900) | |
Dividends and Distributions to Shareholders: | | | | | | |
| | Class A Shares | | (3,376,569) | | | (7,541,955) | |
| | Class C Shares | | (449,643) | | | (1,055,359) | |
| | Class D Shares | | (42,385,456) | | | (84,766,155) | |
| | Class I Shares | | (13,114,124) | | | (34,000,389) | |
| | Class L Shares | | (255,037) | | | (543,653) | |
| | Class N Shares | | (11,696,613) | | | (59,932,912) | |
| | Class R Shares | | (2,021,571) | | | (4,657,016) | |
| | Class S Shares | | (3,877,081) | | | (9,329,371) | |
| | Class T Shares | | (48,220,026) | | | (107,882,437) | |
Net Decrease from Dividends and Distributions to Shareholders | | (125,396,120) | | | (309,709,247) | |
Capital Share Transactions: | | | | | | |
| | Class A Shares | | (5,420,912) | | | (1,995,054) | |
| | Class C Shares | | (368,440) | | | (772,958) | |
| | Class D Shares | | (11,086,647) | | | 43,413,722 | |
| | Class I Shares | | (9,281,807) | | | (108,733,239) | |
| | Class L Shares | | (565,821) | | | 224,829 | |
| | Class N Shares | | (15,139,006) | | | (249,137,964) | |
| | Class R Shares | | (2,967,403) | | | (97,662) | |
| | Class S Shares | | (4,943,133) | | | (13,399,116) | |
| | Class T Shares | | (72,795,412) | | | (31,165,688) | |
Net Increase/(Decrease) from Capital Share Transactions | | (122,568,581) | | | (361,663,130) | |
Net Increase/(Decrease) in Net Assets | | (21,197,107) | | | (802,406,277) | |
Net Assets: | | | | | | |
| Beginning of period | | 2,056,422,454 | | | 2,858,828,731 | |
| End of period | $ | 2,035,225,347 | | $ | 2,056,422,454 | |
| | | | | | | | |
| | |
See Notes to Financial Statements. |
| |
16 | JUNE 30, 2023 |
Janus Henderson Mid Cap Value Fund
Financial Highlights
| | | | | | | | | | | | | | | | | | | |
Class A Shares | | | | | | | | | | | | | | | |
For a share outstanding during the year ended June 30 | | 2023 | | | 2022 | | | 2021 | | | 2020 | | | 2019 | |
| Net Asset Value, Beginning of Period | | $14.97 | | | $18.02 | | | $13.29 | | | $15.33 | | | $16.96 | |
| Income/(Loss) from Investment Operations: | | | | | | | | | | | | | | | |
| | Net investment income/(loss)(1) | | 0.15 | | | 0.13 | | | 0.12 | | | 0.13 | | | 0.17 | |
| | Net realized and unrealized gain/(loss) | | 1.50 | | | (1.17) | | | 4.73 | | | (1.82) | | | 0.12 | |
| Total from Investment Operations | | 1.65 | | | (1.04) | | | 4.85 | | | (1.69) | | | 0.29 | |
| Less Dividends and Distributions: | | | | | | | | | | | | | | | |
| | Dividends (from net investment income) | | (0.14) | | | (0.04) | | | (0.12) | | | (0.12) | | | (0.13) | |
| | Distributions (from capital gains) | | (0.77) | | | (1.97) | | | — | | | (0.23) | | | (1.79) | |
| Total Dividends and Distributions | | (0.91) | | | (2.01) | | | (0.12) | | | (0.35) | | | (1.92) | |
| Net Asset Value, End of Period | | $15.71 | | | $14.97 | | | $18.02 | | | $13.29 | | | $15.33 | |
| Total Return* | | 11.30% | | | (6.84)% | | | 36.65% | | | (11.47)% | | | 3.99% | |
| Net Assets, End of Period (in thousands) | | $56,731 | | | $59,218 | | | $73,118 | | | $59,211 | | | $74,864 | |
| Average Net Assets for the Period (in thousands) | | $59,394 | | | $69,576 | | | $67,847 | | | $71,147 | | | $75,623 | |
| Ratios to Average Net Assets**: | | | | | | | | | | | | | | | |
| | Ratio of Gross Expenses | | 0.91% | | | 0.93% | | | 0.97% | | | 1.19% | | | 1.06% | |
| | Ratio of Net Expenses (After Waivers and Expense Offsets) | | 0.91% | | | 0.93% | | | 0.97% | | | 1.19% | | | 1.05% | |
| | Ratio of Net Investment Income/(Loss) | | 0.98% | | | 0.78% | | | 0.76% | | | 0.90% | | | 1.09% | |
| Portfolio Turnover Rate | | 54% | | | 52% | | | 46% | | | 37% | | | 42% | |
| | | | | | | | | | | | | | | | | | | |
| |
* Total return includes adjustments in accordance with generally accepted accounting principles required at the year or period end and are not annualized for periods of less than one full year. ** Annualized for periods of less than one full year. (1) Per share amounts are calculated based on average shares outstanding during the year or period. |
| | |
See Notes to Financial Statements. |
| |
Janus Investment Fund | 17 |
Janus Henderson Mid Cap Value Fund
Financial Highlights
| | | | | | | | | | | | | | | | | | | |
Class C Shares | | | | | | | | | | | | | | | |
For a share outstanding during the year ended June 30 | | 2023 | | | 2022 | | | 2021 | | | 2020 | | | 2019 | |
| Net Asset Value, Beginning of Period | | $14.46 | | | $17.55 | | | $12.93 | | | $14.91 | | | $16.49 | |
| Income/(Loss) from Investment Operations: | | | | | | | | | | | | | | | |
| | Net investment income/(loss)(1) | | 0.05 | | | 0.01 | | | 0.04 | | | 0.05 | | | 0.07 | |
| | Net realized and unrealized gain/(loss) | | 1.45 | | | (1.13) | | | 4.58 | | | (1.80) | | | 0.14 | |
| Total from Investment Operations | | 1.50 | | | (1.12) | | | 4.62 | | | (1.75) | | | 0.21 | |
| Less Dividends and Distributions: | | | | | | | | | | | | | | | |
| | Dividends (from net investment income) | | (0.04) | | | — | | | —(2) | | | — | | | — | |
| | Distributions (from capital gains) | | (0.77) | | | (1.97) | | | — | | | (0.23) | | | (1.79) | |
| Total Dividends and Distributions | | (0.81) | | | (1.97) | | | — | | | (0.23) | | | (1.79) | |
| Net Asset Value, End of Period | | $15.15 | | | $14.46 | | | $17.55 | | | $12.93 | | | $14.91 | |
| Total Return* | | 10.65% | | | (7.50)% | | | 35.76% | | | (12.02)% | | | 3.40% | |
| Net Assets, End of Period (in thousands) | | $7,998 | | | $7,974 | | | $10,436 | | | $15,768 | | | $31,418 | |
| Average Net Assets for the Period (in thousands) | | $8,269 | | | $9,508 | | | $12,833 | | | $22,689 | | | $41,945 | |
| Ratios to Average Net Assets**: | | | | | | | | | | | | | | | |
| | Ratio of Gross Expenses | | 1.54% | | | 1.62% | | | 1.64% | | | 1.78% | | | 1.64% | |
| | Ratio of Net Expenses (After Waivers and Expense Offsets) | | 1.54% | | | 1.62% | | | 1.64% | | | 1.78% | | | 1.64% | |
| | Ratio of Net Investment Income/(Loss) | | 0.35% | | | 0.09% | | | 0.24% | | | 0.32% | | | 0.47% | |
| Portfolio Turnover Rate | | 54% | | | 52% | | | 46% | | | 37% | | | 42% | |
| | | | | | | | | | | | | | | | | | | |
| |
* Total return includes adjustments in accordance with generally accepted accounting principles required at the year or period end and are not annualized for periods of less than one full year. ** Annualized for periods of less than one full year. (1) Per share amounts are calculated based on average shares outstanding during the year or period. (2) Less than $0.005 on a per share basis. |
| | |
See Notes to Financial Statements. |
| |
18 | JUNE 30, 2023 |
Janus Henderson Mid Cap Value Fund
Financial Highlights
| | | | | | | | | | | | | | | | | | | |
Class D Shares | | | | | | | | | | | | | | | |
For a share outstanding during the year ended June 30 | | 2023 | | | 2022 | | | 2021 | | | 2020 | | | 2019 | |
| Net Asset Value, Beginning of Period | | $14.63 | | | $17.67 | | | $13.03 | | | $15.04 | | | $16.70 | |
| Income/(Loss) from Investment Operations: | | | | | | | | | | | | | | | |
| | Net investment income/(loss)(1) | | 0.19 | | | 0.18 | | | 0.17 | | | 0.17 | | | 0.21 | |
| | Net realized and unrealized gain/(loss) | | 1.47 | | | (1.15) | | | 4.64 | | | (1.79) | | | 0.11 | |
| Total from Investment Operations | | 1.66 | | | (0.97) | | | 4.81 | | | (1.62) | | | 0.32 | |
| Less Dividends and Distributions: | | | | | | | | | | | | | | | |
| | Dividends (from net investment income) | | (0.19) | | | (0.10) | | | (0.17) | | | (0.16) | | | (0.19) | |
| | Distributions (from capital gains) | | (0.77) | | | (1.97) | | | — | | | (0.23) | | | (1.79) | |
| Total Dividends and Distributions | | (0.96) | | | (2.07) | | | (0.17) | | | (0.39) | | | (1.98) | |
| Net Asset Value, End of Period | | $15.33 | | | $14.63 | | | $17.67 | | | $13.03 | | | $15.04 | |
| Total Return* | | 11.65% | | | (6.58)% | | | 37.11% | | | (11.24)% | | | 4.27% | |
| Net Assets, End of Period (in thousands) | | $685,186 | | | $663,819 | | | $752,405 | | | $615,270 | | | $763,597 | |
| Average Net Assets for the Period (in thousands) | | $687,765 | | | $738,640 | | | $680,218 | | | $715,784 | | | $765,452 | |
| Ratios to Average Net Assets**: | | | | | | | | | | | | | | | |
| | Ratio of Gross Expenses | | 0.63% | | | 0.64% | | | 0.66% | | | 0.89% | | | 0.73% | |
| | Ratio of Net Expenses (After Waivers and Expense Offsets) | | 0.63% | | | 0.64% | | | 0.66% | | | 0.89% | | | 0.73% | |
| | Ratio of Net Investment Income/(Loss) | | 1.26% | | | 1.07% | | | 1.07% | | | 1.18% | | | 1.39% | |
| Portfolio Turnover Rate | | 54% | | | 52% | | | 46% | | | 37% | | | 42% | |
| | | | | | | | | | | | | | | | | | | |
| |
* Total return includes adjustments in accordance with generally accepted accounting principles required at the year or period end and are not annualized for periods of less than one full year. ** Annualized for periods of less than one full year. (1) Per share amounts are calculated based on average shares outstanding during the year or period. |
| | |
See Notes to Financial Statements. |
| |
Janus Investment Fund | 19 |
Janus Henderson Mid Cap Value Fund
Financial Highlights
| | | | | | | | | | | | | | | | | | | |
Class I Shares | | | | | | | | | | | | | | | |
For a share outstanding during the year ended June 30 | | 2023 | | | 2022 | | | 2021 | | | 2020 | | | 2019 | |
| Net Asset Value, Beginning of Period | | $14.66 | | | $17.71 | | | $13.06 | | | $15.07 | | | $16.73 | |
| Income/(Loss) from Investment Operations: | | | | | | | | | | | | | | | |
| | Net investment income/(loss)(1) | | 0.20 | | | 0.19 | | | 0.18 | | | 0.18 | | | 0.22 | |
| | Net realized and unrealized gain/(loss) | | 1.47 | | | (1.16) | | | 4.65 | | | (1.79) | | | 0.10 | |
| Total from Investment Operations | | 1.67 | | | (0.97) | | | 4.83 | | | (1.61) | | | 0.32 | |
| Less Dividends and Distributions: | | | | | | | | | | | | | | | |
| | Dividends (from net investment income) | | (0.19) | | | (0.11) | | | (0.18) | | | (0.17) | | | (0.19) | |
| | Distributions (from capital gains) | | (0.77) | | | (1.97) | | | — | | | (0.23) | | | (1.79) | |
| Total Dividends and Distributions | | (0.96) | | | (2.08) | | | (0.18) | | | (0.40) | | | (1.98) | |
| Net Asset Value, End of Period | | $15.37 | | | $14.66 | | | $17.71 | | | $13.06 | | | $15.07 | |
| Total Return* | | 11.75% | | | (6.60)% | | | 37.15% | | | (11.16)% | | | 4.33% | |
| Net Assets, End of Period (in thousands) | | $208,187 | | | $207,292 | | | $359,761 | | | $310,803 | | | $364,502 | |
| Average Net Assets for the Period (in thousands) | | $210,750 | | | $289,382 | | | $338,794 | | | $342,719 | | | $386,284 | |
| Ratios to Average Net Assets**: | | | | | | | | | | | | | | | |
| | Ratio of Gross Expenses | | 0.59% | | | 0.60% | | | 0.62% | | | 0.85% | | | 0.68% | |
| | Ratio of Net Expenses (After Waivers and Expense Offsets) | | 0.59% | | | 0.60% | | | 0.62% | | | 0.85% | | | 0.68% | |
| | Ratio of Net Investment Income/(Loss) | | 1.30% | | | 1.11% | | | 1.13% | | | 1.20% | | | 1.46% | |
| Portfolio Turnover Rate | | 54% | | | 52% | | | 46% | | | 37% | | | 42% | |
| | | | | | | | | | | | | | | | | | | |
| |
* Total return includes adjustments in accordance with generally accepted accounting principles required at the year or period end and are not annualized for periods of less than one full year. ** Annualized for periods of less than one full year. (1) Per share amounts are calculated based on average shares outstanding during the year or period. |
| | |
See Notes to Financial Statements. |
| |
20 | JUNE 30, 2023 |
Janus Henderson Mid Cap Value Fund
Financial Highlights
| | | | | | | | | | | | | | | | | | | |
Class L Shares | | | | | | | | | | | | | | | |
For a share outstanding during the year ended June 30 | | 2023 | | | 2022 | | | 2021 | | | 2020 | | | 2019 | |
| Net Asset Value, Beginning of Period | | $15.19 | | | $18.28 | | | $13.47 | | | $15.54 | | | $17.18 | |
| Income/(Loss) from Investment Operations: | | | | | | | | | | | | | | | |
| | Net investment income/(loss)(1) | | 0.20 | | | 0.18 | | | 0.17 | | | 0.18 | | | 0.22 | |
| | Net realized and unrealized gain/(loss) | | 1.52 | | | (1.20) | | | 4.81 | | | (1.86) | | | 0.12 | |
| Total from Investment Operations | | 1.72 | | | (1.02) | | | 4.98 | | | (1.68) | | | 0.34 | |
| Less Dividends and Distributions: | | | | | | | | | | | | | | | |
| | Dividends (from net investment income) | | (0.18) | | | (0.10) | | | (0.17) | | | (0.16) | | | (0.19) | |
| | Distributions (from capital gains) | | (0.77) | | | (1.97) | | | — | | | (0.23) | | | (1.79) | |
| Total Dividends and Distributions | | (0.95) | | | (2.07) | | | (0.17) | | | (0.39) | | | (1.98) | |
| Net Asset Value, End of Period | | $15.96 | | | $15.19 | | | $18.28 | | | $13.47 | | | $15.54 | |
| Total Return* | | 11.66% | | | (6.66)% | | | 37.14% | | | (11.27)% | | | 4.32% | |
| Net Assets, End of Period (in thousands) | | $4,014 | | | $4,372 | | | $4,995 | | | $4,231 | | | $6,038 | |
| Average Net Assets for the Period (in thousands) | | $4,331 | | | $4,881 | | | $4,679 | | | $5,336 | | | $6,333 | |
| Ratios to Average Net Assets**: | | | | | | | | | | | | | | | |
| | Ratio of Gross Expenses | | 0.81% | | | 0.81% | | | 0.83% | | | 1.05% | | | 0.88% | |
| | Ratio of Net Expenses (After Waivers and Expense Offsets) | | 0.64% | | | 0.65% | | | 0.67% | | | 0.89% | | | 0.72% | |
| | Ratio of Net Investment Income/(Loss) | | 1.25% | | | 1.06% | | | 1.08% | | | 1.20% | | | 1.41% | |
| Portfolio Turnover Rate | | 54% | | | 52% | | | 46% | | | 37% | | | 42% | |
| | | | | | | | | | | | | | | | | | | |
| |
* Total return includes adjustments in accordance with generally accepted accounting principles required at the year or period end and are not annualized for periods of less than one full year. ** Annualized for periods of less than one full year. (1) Per share amounts are calculated based on average shares outstanding during the year or period. |
| | |
See Notes to Financial Statements. |
| |
Janus Investment Fund | 21 |
Janus Henderson Mid Cap Value Fund
Financial Highlights
| | | | | | | | | | | | | | | | | | | |
Class N Shares | | | | | | | | | | | | | | | |
For a share outstanding during the year ended June 30 | | 2023 | | | 2022 | | | 2021 | | | 2020 | | | 2019 | |
| Net Asset Value, Beginning of Period | | $14.58 | | | $17.62 | | | $12.99 | | | $15.00 | | | $16.66 | |
| Income/(Loss) from Investment Operations: | | | | | | | | | | | | | | | |
| | Net investment income/(loss)(1) | | 0.21 | | | 0.20 | | | 0.19 | | | 0.20 | | | 0.23 | |
| | Net realized and unrealized gain/(loss) | | 1.46 | | | (1.14) | | | 4.63 | | | (1.80) | | | 0.11 | |
| Total from Investment Operations | | 1.67 | | | (0.94) | | | 4.82 | | | (1.60) | | | 0.34 | |
| Less Dividends and Distributions: | | | | | | | | | | | | | | | |
| | Dividends (from net investment income) | | (0.21) | | | (0.13) | | | (0.19) | | | (0.18) | | | (0.21) | |
| | Distributions (from capital gains) | | (0.77) | | | (1.97) | | | — | | | (0.23) | | | (1.79) | |
| Total Dividends and Distributions | | (0.98) | | | (2.10) | | | (0.19) | | | (0.41) | | | (2.00) | |
| Net Asset Value, End of Period | | $15.27 | | | $14.58 | | | $17.62 | | | $12.99 | | | $15.00 | |
| Total Return* | | 11.78% | | | (6.47)% | | | 37.34% | | | (11.14)% | | | 4.47% | |
| Net Assets, End of Period (in thousands) | | $187,335 | | | $193,017 | | | $506,429 | | | $422,894 | | | $619,969 | |
| Average Net Assets for the Period (in thousands) | | $188,816 | | | $471,571 | | | $483,187 | | | $595,473 | | | $617,269 | |
| Ratios to Average Net Assets**: | | | | | | | | | | | | | | | |
| | Ratio of Gross Expenses | | 0.49% | | | 0.50% | | | 0.52% | | | 0.75% | | | 0.59% | |
| | Ratio of Net Expenses (After Waivers and Expense Offsets) | | 0.49% | | | 0.50% | | | 0.52% | | | 0.75% | | | 0.59% | |
| | Ratio of Net Investment Income/(Loss) | | 1.40% | | | 1.20% | | | 1.24% | | | 1.36% | | | 1.54% | |
| Portfolio Turnover Rate | | 54% | | | 52% | | | 46% | | | 37% | | | 42% | |
| | | | | | | | | | | | | | | | | | | |
| |
* Total return includes adjustments in accordance with generally accepted accounting principles required at the year or period end and are not annualized for periods of less than one full year. ** Annualized for periods of less than one full year. (1) Per share amounts are calculated based on average shares outstanding during the year or period. |
| | |
See Notes to Financial Statements. |
| |
22 | JUNE 30, 2023 |
Janus Henderson Mid Cap Value Fund
Financial Highlights
| | | | | | | | | | | | | | | | | | | |
Class R Shares | | | | | | | | | | | | | | | |
For a share outstanding during the year ended June 30 | | 2023 | | | 2022 | | | 2021 | | | 2020 | | | 2019 | |
| Net Asset Value, Beginning of Period | | $14.65 | | | $17.70 | | | $13.04 | | | $15.06 | | | $16.68 | |
| Income/(Loss) from Investment Operations: | | | | | | | | | | | | | | | |
| | Net investment income/(loss)(1) | | 0.10 | | | 0.08 | | | 0.08 | | | 0.09 | | | 0.12 | |
| | Net realized and unrealized gain/(loss) | | 1.46 | | | (1.16) | | | 4.65 | | | (1.82) | | | 0.13 | |
| Total from Investment Operations | | 1.56 | | | (1.08) | | | 4.73 | | | (1.73) | | | 0.25 | |
| Less Dividends and Distributions: | | | | | | | | | | | | | | | |
| | Dividends (from net investment income) | | (0.08) | | | — | | | (0.07) | | | (0.06) | | | (0.08) | |
| | Distributions (from capital gains) | | (0.77) | | | (1.97) | | | — | | | (0.23) | | | (1.79) | |
| Total Dividends and Distributions | | (0.85) | | | (1.97) | | | (0.07) | | | (0.29) | | | (1.87) | |
| Net Asset Value, End of Period | | $15.36 | | | $14.65 | | | $17.70 | | | $13.04 | | | $15.06 | |
| Total Return* | | 10.94% | | | (7.20)% | | | 36.38% | | | (11.83)% | | | 3.70% | |
| Net Assets, End of Period (in thousands) | | $35,107 | | | $36,305 | | | $43,893 | | | $38,246 | | | $55,536 | |
| Average Net Assets for the Period (in thousands) | | $36,655 | | | $42,298 | | | $41,183 | | | $48,448 | | | $57,426 | |
| Ratios to Average Net Assets**: | | | | | | | | | | | | | | | |
| | Ratio of Gross Expenses | | 1.25% | | | 1.26% | | | 1.26% | | | 1.50% | | | 1.34% | |
| | Ratio of Net Expenses (After Waivers and Expense Offsets) | | 1.25% | | | 1.26% | | | 1.26% | | | 1.50% | | | 1.34% | |
| | Ratio of Net Investment Income/(Loss) | | 0.65% | | | 0.45% | | | 0.49% | | | 0.59% | | | 0.79% | |
| Portfolio Turnover Rate | | 54% | | | 52% | | | 46% | | | 37% | | | 42% | |
| | | | | | | | | | | | | | | | | | | |
| |
* Total return includes adjustments in accordance with generally accepted accounting principles required at the year or period end and are not annualized for periods of less than one full year. ** Annualized for periods of less than one full year. (1) Per share amounts are calculated based on average shares outstanding during the year or period. |
| | |
See Notes to Financial Statements. |
| |
Janus Investment Fund | 23 |
Janus Henderson Mid Cap Value Fund
Financial Highlights
| | | | | | | | | | | | | | | | | | | |
Class S Shares | | | | | | | | | | | | | | | |
For a share outstanding during the year ended June 30 | | 2023 | | | 2022 | | | 2021 | | | 2020 | | | 2019 | |
| Net Asset Value, Beginning of Period | | $14.97 | | | $18.03 | | | $13.28 | | | $15.33 | | | $16.90 | |
| Income/(Loss) from Investment Operations: | | | | | | | | | | | | | | | |
| | Net investment income/(loss)(1) | | 0.14 | | | 0.12 | | | 0.11 | | | 0.12 | | | 0.17 | |
| | Net realized and unrealized gain/(loss) | | 1.50 | | | (1.18) | | | 4.74 | | | (1.83) | | | 0.12 | |
| Total from Investment Operations | | 1.64 | | | (1.06) | | | 4.85 | | | (1.71) | | | 0.29 | |
| Less Dividends and Distributions: | | | | | | | | | | | | | | | |
| | Dividends (from net investment income) | | (0.12) | | | (0.03) | | | (0.10) | | | (0.11) | | | (0.07) | |
| | Distributions (from capital gains) | | (0.77) | | | (1.97) | | | — | | | (0.23) | | | (1.79) | |
| Total Dividends and Distributions | | (0.89) | | | (2.00) | | | (0.10) | | | (0.34) | | | (1.86) | |
| Net Asset Value, End of Period | | $15.72 | | | $14.97 | | | $18.03 | | | $13.28 | | | $15.33 | |
| Total Return* | | 11.26% | | | (6.97)% | | | 36.67% | | | (11.58)% | | | 3.93% | |
| Net Assets, End of Period (in thousands) | | $68,572 | | | $70,035 | | | $97,606 | | | $99,159 | | | $110,404 | |
| Average Net Assets for the Period (in thousands) | | $69,673 | | | $86,513 | | | $91,479 | | | $107,902 | | | $148,179 | |
| Ratios to Average Net Assets**: | | | | | | | | | | | | | | | |
| | Ratio of Gross Expenses | | 0.99% | | | 1.01% | | | 1.02% | | | 1.25% | | | 1.09% | |
| | Ratio of Net Expenses (After Waivers and Expense Offsets) | | 0.99% | | | 1.01% | | | 1.02% | | | 1.25% | | | 1.09% | |
| | Ratio of Net Investment Income/(Loss) | | 0.90% | | | 0.70% | | | 0.72% | | | 0.79% | | | 1.07% | |
| Portfolio Turnover Rate | | 54% | | | 52% | | | 46% | | | 37% | | | 42% | |
| | | | | | | | | | | | | | | | | | | |
| |
* Total return includes adjustments in accordance with generally accepted accounting principles required at the year or period end and are not annualized for periods of less than one full year. ** Annualized for periods of less than one full year. (1) Per share amounts are calculated based on average shares outstanding during the year or period. |
| | |
See Notes to Financial Statements. |
| |
24 | JUNE 30, 2023 |
Janus Henderson Mid Cap Value Fund
Financial Highlights
| | | | | | | | | | | | | | | | | | | |
Class T Shares | | | | | | | | | | | | | | | |
For a share outstanding during the year ended June 30 | | 2023 | | | 2022 | | | 2021 | | | 2020 | | | 2019 | |
| Net Asset Value, Beginning of Period | | $14.74 | | | $17.79 | | | $13.12 | | | $15.14 | | | $16.78 | |
| Income/(Loss) from Investment Operations: | | | | | | | | | | | | | | | |
| | Net investment income/(loss)(1) | | 0.18 | | | 0.16 | | | 0.16 | | | 0.16 | | | 0.20 | |
| | Net realized and unrealized gain/(loss) | | 1.48 | | | (1.16) | | | 4.66 | | | (1.80) | | | 0.12 | |
| Total from Investment Operations | | 1.66 | | | (1.00) | | | 4.82 | | | (1.64) | | | 0.32 | |
| Less Dividends and Distributions: | | | | | | | | | | | | | | | |
| | Dividends (from net investment income) | | (0.17) | | | (0.08) | | | (0.15) | | | (0.15) | | | (0.17) | |
| | Distributions (from capital gains) | | (0.77) | | | (1.97) | | | — | | | (0.23) | | | (1.79) | |
| Total Dividends and Distributions | | (0.94) | | | (2.05) | | | (0.15) | | | (0.38) | | | (1.96) | |
| Net Asset Value, End of Period | | $15.46 | | | $14.74 | | | $17.79 | | | $13.12 | | | $15.14 | |
| Total Return* | | 11.57% | | | (6.72)% | | | 36.95% | | | (11.31)% | | | 4.22% | |
| Net Assets, End of Period (in thousands) | | $782,095 | | | $814,391 | | | $1,010,187 | | | $896,622 | | | $1,204,382 | |
| Average Net Assets for the Period (in thousands) | | $811,301 | | | $947,426 | | | $971,268 | | | $1,089,574 | | | $1,281,003 | |
| Ratios to Average Net Assets**: | | | | | | | | | | | | | | | |
| | Ratio of Gross Expenses | | 0.74% | | | 0.75% | | | 0.77% | | | 0.99% | | | 0.84% | |
| | Ratio of Net Expenses (After Waivers and Expense Offsets) | | 0.73% | | | 0.74% | | | 0.76% | | | 0.99% | | | 0.83% | |
| | Ratio of Net Investment Income/(Loss) | | 1.17% | | | 0.96% | | | 1.00% | | | 1.09% | | | 1.30% | |
| Portfolio Turnover Rate | | 54% | | | 52% | | | 46% | | | 37% | | | 42% | |
| | | | | | | | | | | | | | | | | | | |
| |
* Total return includes adjustments in accordance with generally accepted accounting principles required at the year or period end and are not annualized for periods of less than one full year. ** Annualized for periods of less than one full year. (1) Per share amounts are calculated based on average shares outstanding during the year or period. |
| | |
See Notes to Financial Statements. |
| |
Janus Investment Fund | 25 |
Janus Henderson Mid Cap Value Fund
Notes to Financial Statements
1. Organization and Significant Accounting Policies
Janus Henderson Mid Cap Value Fund (the “Fund”) is a series of Janus Investment Fund (the “Trust”), which is organized as a Massachusetts business trust and is registered under the Investment Company Act of 1940, as amended (the “1940 Act”), as an open-end management investment company, and therefore has applied the specialized accounting and reporting guidance in Financial Accounting Standards Board (“FASB”) Accounting Standards Codification (“ASC”) Topic 946. The Trust offers 39 funds, each of which offers multiple share classes, with differing investment objectives and policies. The Fund seeks capital appreciation. The Fund is classified as diversified, as defined in the 1940 Act. Janus Henderson Investors US LLC is the investment adviser (the “Adviser”) to the Fund.
The Fund offers multiple classes of shares in order to meet the needs of various types of investors. Each class represents an interest in the same portfolio of investments. Certain financial intermediaries may not offer all classes of shares.
Shareholders, including other funds, individuals, accounts, as well as the Fund’s portfolio manager(s) and/or investment personnel, may from time to time own (beneficially or of record) a significant percentage of the Fund’s Shares and can be considered to “control” the Fund when that ownership exceeds 25% of the Fund’s assets (and which may differ from control as determined in accordance with United States of America generally accepted accounting principles ("US GAAP")).
Class A Shares are offered through financial intermediary platforms including, but not limited to, traditional brokerage platforms, mutual fund wrap fee programs, bank trust platforms, and retirement platforms.
Class C Shares are offered through financial intermediary platforms including, but not limited to, traditional brokerage platforms, mutual fund wrap fee programs, and bank trust platforms.
Class C Shares are closed to investments by new employer-sponsored retirement plans and existing employer-sponsored retirement plans are no longer able to make additional purchases or exchanges into Class C Shares.
The Fund currently implements an automatic conversion feature pursuant to which Class C Shares that have been held for eight years are automatically converted to Class A Shares without the imposition of any sales charge, fee or other charge. The conversion will generally occur no later than ten business days in the month following the month of the eighth anniversary of the date of purchase. Class C Shares purchased through the reinvestment of dividends and other distributions on Class C Shares will convert to Class A Shares at the same time as the original Class C Shares with respect to which they were purchased. For Class C Shares held in omnibus accounts on intermediary platforms, the Fund relies on these intermediaries to implement this conversion feature. Your financial intermediary may have separate policies and procedures as to when and how Class C Shares may be converted to Class A Shares.
Effective July 6, 2020, Class D Shares are available to new investors, subject to any closed fund policies for a Fund, as applicable. Previously, Class D Shares were only available to investors who already had a direct account with the Janus Henderson funds; immediate family members or members of the same household of an eligible individual investor; and existing beneficial owners of sole proprietorships or partnerships that hold accounts directly with the Janus Henderson funds.
Class I Shares are available through certain financial intermediary platforms including, but not limited to, mutual fund wrap fee programs, managed account programs, asset allocation programs, bank trust platforms, as well as certain retirement platforms. Class I Shares are also available to certain direct institutional investors including, but not limited to, corporations, certain retirement plans, public plans, and foundations/endowments, who established Class I Share accounts before August 4, 2017.
Class L Shares are designed for pension and profit-sharing plans, employee benefit trusts, endowments, foundations and corporations, as well as high net worth individuals and financial intermediaries who are willing to maintain a minimum account balance of $250,000.
Class N Shares are generally available only to financial intermediaries purchasing on behalf of: 1) certain adviser-assisted, employer-sponsored retirement plans, including 401(k) plans, 457 plans, 403(b) plans, Taft-Hartley multi-employer plans, profit-sharing and money purchase pension plans, defined benefit plans and certain welfare benefit plans, such as health savings accounts, and nonqualified deferred compensation plans; and 2) retail investors purchasing in qualified or nonqualified accounts, whose accounts are held through an omnibus account at their financial
Janus Henderson Mid Cap Value Fund
Notes to Financial Statements
intermediary, and where the financial intermediary requires no payment or reimbursement from the Fund, the Adviser, or its affiliates. Class N Shares are also available to Janus Henderson proprietary products and to certain direct institutional investors approved by Janus Henderson Distributors US LLC (the “Distributor”) including, but not limited to, corporations, certain retirement plans, public plans, and foundations and endowments, subject to minimum investment requirements.
Class R Shares are offered through financial intermediary platforms including, but not limited to, retirement platforms.
Class S Shares are offered through financial intermediary platforms including, but not limited to, retirement platforms and asset allocation, mutual fund wrap, or other discretionary or nondiscretionary fee-based investment advisory programs. In addition, Class S Shares may be available through certain financial intermediaries who have an agreement with the Adviser or its affiliates to offer Class S Shares on their supermarket platforms.
Class T Shares are available through certain financial intermediary platforms including, but not limited to, mutual fund wrap fee programs, managed account programs, asset allocation programs, bank trust platforms, as well as certain retirement platforms. In addition, Class T Shares may be available through certain financial intermediaries who have an agreement with the Adviser or its affiliates to offer Class T Shares on their supermarket platforms.
The following accounting policies have been followed by the Fund and are in conformity with US GAAP.
Investment Valuation
Fund holdings are valued in accordance with policies and procedures established by the Adviser pursuant to Rule 2a-5 under the 1940 Act and approved by and subject to the oversight of the Trustees (the “Valuation Procedures”). Equity securities traded on a domestic securities exchange are generally valued at readily available market quotations, which are (i) the official close prices or (ii) last sale prices on the primary market or exchange in which the securities trade. If such price is lacking for the trading period immediately preceding the time of determination, such securities are generally valued at their current bid price. Equity securities that are traded on a foreign exchange are generally valued at the closing prices on such markets. In the event that there is no current trading volume on a particular security in such foreign exchange, the bid price from the primary exchange is generally used to value the security. Foreign securities and currencies are converted to U.S. dollars using the current spot USD dollar exchange rate in effect at the close of the New York Stock Exchange (“NYSE”). The Adviser will determine the market value of individual securities held by it by using prices provided by one or more Adviser-approved professional pricing services or, as needed, by obtaining market quotations from independent broker-dealers. Most debt securities are valued in accordance with the evaluated bid price supplied by the pricing service that is intended to reflect market value. The evaluated bid price supplied by the pricing service is an evaluation that may consider factors such as security prices, yields, maturities and ratings. Certain short-term securities maturing within 60 days or less may be evaluated and valued on an amortized cost basis provided that the amortized cost determined approximates market value. Securities for which market quotations or evaluated prices are not readily available or deemed unreliable are valued at fair value determined in good faith by the Adviser pursuant to the Valuation Procedures. Circumstances in which fair valuation may be utilized include, but are not limited to: (i) a significant event that may affect the securities of a single issuer, such as a merger, bankruptcy, or significant issuer-specific development; (ii) an event that may affect an entire market, such as a natural disaster or significant governmental action; (iii) a nonsignificant event such as a market closing early or not opening, or a security trading halt; and (iv) pricing of a nonvalued security and a restricted or nonpublic security. Special valuation considerations may apply with respect to “odd-lot” fixed-income transactions which, due to their small size, may receive evaluated prices by pricing services which reflect a large block trade and not what actually could be obtained for the odd-lot position. The value of the securities of other mutual funds held by the Fund, if any, will be calculated using the NAV of such mutual funds, and the prospectuses for such mutual funds explain the circumstances under which they use fair valuation and the effects of using fair valuation. The value of the securities of any cash management pooled investment vehicles that operate as money market funds held by the Fund, if any, will be calculated using the NAV of such funds.
Valuation Inputs Summary
FASB ASC 820, Fair Value Measurements and Disclosures (“ASC 820”), defines fair value, establishes a framework for measuring fair value, and expands disclosure requirements regarding fair value measurements. This standard emphasizes that fair value is a market-based measurement that should be determined based on the assumptions that market participants would use in pricing an asset or liability and establishes a hierarchy that prioritizes inputs to valuation techniques used to measure fair value. These inputs are summarized into three broad levels:
Janus Henderson Mid Cap Value Fund
Notes to Financial Statements
Level 1 – Unadjusted quoted prices in active markets the Fund has the ability to access for identical assets or liabilities.
Level 2 – Observable inputs other than unadjusted quoted prices included in Level 1 that are observable for the asset or liability either directly or indirectly. These inputs may include quoted prices for the identical instrument on an inactive market, prices for similar instruments, interest rates, prepayment speeds, credit risk, yield curves, default rates and similar data.
Assets or liabilities categorized as Level 2 in the hierarchy generally include: debt securities fair valued in accordance with the evaluated bid or ask prices supplied by a pricing service; securities traded on OTC markets and listed securities for which no sales are reported that are fair valued at the latest bid price (or yield equivalent thereof) obtained from one or more dealers transacting in a market for such securities or by a pricing service approved by the Fund’s Trustees; certain short-term debt securities with maturities of 60 days or less that are fair valued at amortized cost; and equity securities of foreign issuers whose fair value is determined by using systematic fair valuation models provided by independent third parties in order to adjust for stale pricing which may occur between the close of certain foreign exchanges and the close of the NYSE. Other securities that may be categorized as Level 2 in the hierarchy include, but are not limited to, preferred stocks, bank loans, swaps, investments in unregistered investment companies, options, and forward contracts.
Level 3 – Unobservable inputs for the asset or liability to the extent that relevant observable inputs are not available, representing the Fund’s own assumptions about the assumptions that a market participant would use in valuing the asset or liability, and that would be based on the best information available.
There have been no significant changes in valuation techniques used in valuing any such positions held by the Fund since the beginning of the fiscal year.
The inputs or methodology used for fair valuing securities are not necessarily an indication of the risk associated with investing in those securities. The summary of inputs used as of June 30, 2023 to fair value the Fund’s investments in securities and other financial instruments is included in the “Valuation Inputs Summary” in the Notes to Schedule of Investments and Other Information.
Investment Transactions and Investment Income
Investment transactions are accounted for as of the date purchased or sold (trade date). Dividend income is recorded on the ex-dividend date. Certain dividends from foreign securities will be recorded as soon as the Fund is informed of the dividend, if such information is obtained subsequent to the ex-dividend date. Dividends from foreign securities may be subject to withholding taxes in foreign jurisdictions. Non-cash dividends, if any, are recorded on the ex-dividend date at fair value. Interest income is recorded daily on the accrual basis and includes amortization of premiums and accretion of discounts. The Fund classifies gains and losses on prepayments received as an adjustment to interest income. Debt securities may be placed in non-accrual status and related interest income may be reduced by stopping current accruals and writing off interest receivables when collection of all or a portion of interest has become doubtful. Gains and losses are determined on the identified cost basis, which is the same basis used for federal income tax purposes. Income, as well as gains and losses, both realized and unrealized, are allocated daily to each class of shares based upon the ratio of net assets represented by each class as a percentage of total net assets.
Expenses
The Fund bears expenses incurred specifically on its behalf. Each class of shares bears a portion of general expenses, which are allocated daily to each class of shares based upon the ratio of net assets represented by each class as a percentage of total net assets. Expenses directly attributable to a specific class of shares are charged against the operations of such class.
Estimates
The preparation of financial statements in conformity with US GAAP requires management to make estimates and assumptions that affect the reported amount of assets and liabilities and disclosure of contingent assets and liabilities at the date of the financial statements, and the reported amounts of income and expenses during the reporting period. Actual results could differ from those estimates.
Indemnifications
In the normal course of business, the Fund may enter into contracts that contain provisions for indemnification of other parties against certain potential liabilities. The Fund’s maximum exposure under these arrangements is unknown, and
Janus Henderson Mid Cap Value Fund
Notes to Financial Statements
would involve future claims that may be made against the Fund that have not yet occurred. Currently, the risk of material loss from such claims is considered remote.
Foreign Currency Translations
The Fund does not isolate that portion of the results of operations resulting from the effect of changes in foreign exchange rates on investments from the fluctuations arising from changes in market prices of securities held at the date of the financial statements. Net unrealized appreciation or depreciation of investments and foreign currency translations arise from changes in the value of assets and liabilities, including investments in securities held at the date of the financial statements, resulting from changes in the exchange rates and changes in market prices of securities held.
Currency gains and losses are also calculated on payables and receivables that are denominated in foreign currencies. The payables and receivables are generally related to foreign security transactions and income translations.
Foreign currency-denominated assets and forward currency contracts may involve more risks than domestic transactions, including currency risk, counterparty risk, political and economic risk, regulatory risk and equity risk. Risks may arise from unanticipated movements in the value of foreign currencies relative to the U.S. dollar.
Dividends and Distributions
The Fund generally declares and distributes dividends of net investment income and realized capital gains (if any) annually. The Fund may treat a portion of the amount paid to redeem shares as a distribution of investment company taxable income and realized capital gains that are reflected in the net asset value. This practice, commonly referred to as “equalization,” has no effect on the redeeming shareholder or a Fund’s total return, but may reduce the amounts that would otherwise be required to be paid as taxable dividends to the remaining shareholders. It is possible that the Internal Revenue Service (IRS) could challenge the Fund's equalization methodology or calculations, and any such challenge could result in additional tax, interest, or penalties to be paid by the Fund.
The Fund may make certain investments in real estate investment trusts (“REITs”) which pay dividends to their shareholders based upon funds available from operations. It is quite common for these dividends to exceed the REITs’ taxable earnings and profits, resulting in the excess portion of such dividends being designated as a return of capital. If the Fund distributes such amounts, such distributions could constitute a return of capital to shareholders for federal income tax purposes.
Federal Income Taxes
The Fund intends to continue to qualify as a regulated investment company and distribute all of its taxable income in accordance with the requirements of Subchapter M of the Internal Revenue Code. Management has analyzed the Fund’s tax positions taken for all open federal income tax years, generally a three-year period, and has concluded that no provision for federal income tax is required in the Fund’s financial statements. The Fund is not aware of any tax positions for which it is reasonably possible that the total amounts of unrecognized tax benefits will significantly change in the next twelve months.
2. Other Investments and Strategies
Market Risk
The value of the Fund’s portfolio may decrease if the value of one or more issuers in the Fund’s portfolio decreases. Further, regardless of how well individual companies or securities perform, the value of the Fund’s portfolio could also decrease if there are deteriorating economic or market conditions, including, but not limited to, a general decline in prices on the stock markets, a general decline in real estate markets, a decline in commodities prices, or if the market favors different types of securities than the types of securities in which the Fund invests. If the value of the Fund’s portfolio decreases, the Fund’s NAV will also decrease, which means if you sell your shares in the Fund you may lose money. Market risk may affect a single issuer, industry, economic sector, or the market as a whole. The increasing interconnectivity between global economies and financial markets increases the likelihood that events or conditions in one region or financial market may adversely impact issuers in a different country, region or financial market. Social, political, economic and other conditions and events, such as natural disasters, health emergencies (e.g., epidemics and pandemics), terrorism, conflicts, including related sanctions, and social unrest, could reduce consumer demand or economic output, result in market closures, travel restrictions and/or quarantines, and generally have a significant impact on the global economies and financial markets.
Janus Henderson Mid Cap Value Fund
Notes to Financial Statements
• COVID-19 Pandemic. The effects of COVID-19 have contributed to increased volatility in global financial markets and have affected and may continue to affect certain countries, regions, issuers, industries and market sectors more dramatically than others. These conditions and events could have a significant impact on the Fund and its investments, the Fund’s ability to meet redemption requests, and the processes and operations of the Fund’s service providers, including the Adviser.
• Russia/Ukraine Invasion. Russia launched a large-scale invasion of Ukraine on February 24, 2022. The extent and duration of the military action, resulting sanctions and resulting future market disruptions in the region are impossible to predict, but could be significant and have a severe adverse effect on the region, including significant negative impacts on the economy and the markets for certain securities and commodities, such as oil and natural gas, as well as other sectors.
Real Estate Investing
The Fund may invest in equity and debt securities of real estate-related companies. Such companies may include those in the real estate industry or real estate-related industries. These securities may include common stocks, corporate bonds, preferred stocks, and other equity securities, including, but not limited to, mortgage-backed securities, real estate-backed securities, securities of REITs and similar REIT-like entities. A REIT is a trust that invests in real estate-related projects, such as properties, mortgage loans, and construction loans. REITs are generally categorized as equity, mortgage, or hybrid REITs. A REIT may be listed on an exchange or traded OTC.
Repurchase Agreements
The Fund and other funds advised by the Adviser or its affiliates may transfer daily uninvested cash balances into one or more joint trading accounts. Assets in the joint trading accounts are invested in money market instruments and the proceeds are allocated to the participating funds on a pro rata basis.
Repurchase agreements held by the Fund are fully collateralized, and such collateral is in the possession of the Fund’s custodian or, for tri-party agreements, the custodian designated by the agreement. The collateral is evaluated daily to ensure its market value exceeds the current market value of the repurchase agreements, including accrued interest. In the event of default on the obligation to repurchase, the Fund has the right to liquidate the collateral and apply the proceeds in satisfaction of the obligation. In the event of default or bankruptcy by the other party to the agreement, realization and/or retention of the collateral or proceeds may be subject to legal proceedings.
Counterparties
Fund transactions involving a counterparty are subject to the risk that the counterparty or a third party will not fulfill its obligation to the Fund (“counterparty risk”). Counterparty risk may arise because of the counterparty’s financial condition (i.e., financial difficulties, bankruptcy, or insolvency), market activities and developments, or other reasons, whether foreseen or not. A counterparty’s inability to fulfill its obligation may result in significant financial loss to the Fund. The Fund may be unable to recover its investment from the counterparty or may obtain a limited recovery, and/or recovery may be delayed. The extent of the Fund’s exposure to counterparty risk with respect to financial assets and liabilities approximates its carrying value. See the "Offsetting Assets and Liabilities" section of this Note for further details.
The Fund may be exposed to counterparty risk through participation in various programs, including, but not limited to, lending its securities to third parties, cash sweep arrangements whereby the Fund’s cash balance is invested in one or more types of cash management vehicles, as well as investments in, but not limited to, repurchase agreements, debt securities, and derivatives, including various types of swaps, futures and options. The Fund intends to enter into financial transactions with counterparties that the Adviser believes to be creditworthy at the time of the transaction. There is always the risk that the Adviser’s analysis of a counterparty’s creditworthiness is incorrect or may change due to market conditions. To the extent that the Fund focuses its transactions with a limited number of counterparties, it will have greater exposure to the risks associated with one or more counterparties.
Offsetting Assets and Liabilities
The Fund presents gross and net information about transactions that are either offset in the financial statements or subject to an enforceable master netting arrangement or similar agreement with a designated counterparty, regardless of whether the transactions are actually offset in the Statement of Assets and Liabilities.
The Offsetting Assets and Liabilities table located in the Schedule of Investments presents gross amounts of recognized assets and/or liabilities and the net amounts after deducting collateral that has been pledged by
Janus Henderson Mid Cap Value Fund
Notes to Financial Statements
counterparties or has been pledged to counterparties (if applicable). For corresponding information grouped by type of instrument, see the Fund's Schedule of Investments.
All repurchase agreements are transacted under legally enforceable master repurchase agreements that give the Fund, in the event of default by the counterparty, the right to liquidate securities held and to offset receivables and payables with the counterparty. For financial reporting purposes, the Fund does not offset financial instruments' payables and receivables and related collateral on the Statement of Assets and Liabilities. Repurchase agreements held by the Fund are fully collateralized, and such collateral is in the possession of the Fund’s custodian or, for tri-party agreements, the custodian designated by the agreement. The collateral is evaluated daily to ensure its market value exceeds the current market value of the repurchase agreements, including accrued interest.
3. Investment Advisory Agreements and Other Transactions with Affiliates
The Fund pays the Adviser an investment advisory fee rate that may adjust up or down based on the Fund’s performance relative to its benchmark index.
The investment advisory fee rate paid to the Adviser by the Fund consists of two components: (1) a base fee calculated by applying the contractual fixed rate of the advisory fee to the Fund’s average daily net assets during the previous month (the “Base Fee Rate”), plus or minus (2) a performance-fee adjustment (the “Performance Adjustment”) calculated by applying a variable rate of up to 0.15% (positive or negative) to the Fund’s average daily net assets based on the Fund’s relative performance compared to the cumulative investment record of its benchmark index over a 36-month performance measurement period or shorter time period, as applicable. The investment advisory fee rate is calculated daily and paid monthly.
The investment performance of the Fund’s Class A Shares (waiving the upfront sales load) for the performance measurement period is used to calculate the Performance Adjustment. The Fund’s Base Fee Rate prior to any performance adjustment (expressed as an annual rate) is 0.64%, and the Fund’s benchmark index used in the calculation is the Russell Midcap® Value Index.
No Performance Adjustment is applied unless the difference between the Fund’s investment performance and the cumulative investment record of the Fund’s benchmark index is 0.50% or greater (positive or negative) during the applicable performance measurement period. The Base Fee Rate is subject to an upward or downward Performance Adjustment for every full 0.50% increment by which the Fund outperforms or underperforms its benchmark index, up to the Fund’s full performance rate of ±4.00%. Because the Performance Adjustment is tied to a Fund’s relative performance compared to its benchmark index (and not its absolute performance), the Performance Adjustment could increase the Adviser’s fee even if the Fund’s Shares lose value during the performance measurement period and could decrease the Adviser’s fee even if the Fund’s Shares increase in value during the performance measurement period. For purposes of computing the Base Fee Rate and the Performance Adjustment, net assets are averaged over different periods (average daily net assets during the previous month for the Base Fee Rate, versus average daily net assets during the performance measurement period for the Performance Adjustment). Performance of the Fund is calculated net of expenses whereas the Fund’s benchmark index does not have any fees or expenses. Reinvestment of dividends and distributions is included in calculating both the performance of a Fund and the Fund’s benchmark index.
The Fund’s prospectuses and statement(s) of additional information contain additional information about performance-based fees. The amount shown as advisory fees on the Statement of Operations reflects the Base Fee Rate plus/minus any Performance Adjustment. For the year ended June 30, 2023, the performance adjusted investment advisory fee rate before any waivers and/or reimbursements of expenses is 0.45%.
The Adviser has contractually agreed to waive the investment advisory fee and/or reimburse operating expenses to the extent that the Fund’s total annual fund operating expenses, excluding the fees payable pursuant to a Rule 12b-1 plan, shareholder servicing fees, such as transfer agency fees (including out-of-pocket costs), administrative services fees and any networking/omnibus payable by any share class, brokerage commissions, interest, dividends, taxes, acquired fund fees and expenses, and extraordinary expenses, exceed the annual rate of 0.83% of the Fund’s average daily net assets. The Adviser has agreed to continue the waivers for at least a one-year period commencing October 28, 2022. If applicable, amounts waived and/or reimbursed to the Fund by the Adviser are disclosed as “Excess Expense Reimbursement and Waivers” on the Statement of Operations.
The Adviser serves as administrator to the Fund pursuant to an administration agreement between the Adviser and the Trust. Under the administration agreement, the Adviser is authorized to perform, or cause others to perform certain
Janus Henderson Mid Cap Value Fund
Notes to Financial Statements
administration, compliance, and accounting services to the Fund, including providing office space for the Fund, and is reimbursed by the Fund for certain of its costs in providing these services (to the extent the Adviser seeks reimbursement and such costs are not otherwise waived). In addition, employees of the Adviser and/or its affiliates may serve as officers of the Trust. The Fund pays for some or all of the salaries, fees, and expenses of the Adviser employees and Fund officers, with respect to certain specified administration functions they perform on behalf of the Fund. The Fund pays these costs based on out-of-pocket expenses incurred by the Adviser, and these costs are separate and apart from advisory fees and other expenses paid in connection with the investment advisory services the Adviser (or any subadvisor, as applicable) provides to the Fund. These amounts are disclosed as “Affiliated fund administration fees” on the Statement of Operations. In addition, some expenses related to compensation payable to the Fund’s Chief Compliance Officer and certain compliance staff, all of whom are employees of the Adviser and/or its affiliates, are shared with the Fund. Total compensation of $343,237 was paid to the Chief Compliance Officer and certain compliance staff by the Trust during the year ended June 30, 2023. The Fund's portion is reported as part of “Other expenses” on the Statement of Operations.
Janus Henderson Services US LLC (the “Transfer Agent”), a wholly-owned subsidiary of the Adviser, is the Fund’s transfer agent. The Transfer Agent provides or arranges for the provision of shareholder services including, but not limited to, recordkeeping, subaccounting, answering inquiries regarding accounts, order processing, transaction confirmations, the mailing of prospectuses and shareholder reports, and other shareholder services provided to or on behalf of shareholders. These amounts are disclosed as “Transfer agent administrative fees and expenses” on the Statement of Operations.
Class D Shares of the Fund pay the Transfer Agent an annual administrative services fee based on the average daily net assets of Class D Shares as detailed below.
| | |
Average Daily Net Assets of Class D Shares of the Janus Henderson funds | Administrative Services Fee |
Under $40 billion | 0.12% |
$40 billion – $49.9 billion | 0.10% |
Over $49.9 billion | 0.08% |
During the reporting period, the administrative services fee rate was 0.12%.
The Transfer Agent receives an administrative services fee at an annual rate of up to 0.25% of the average daily net assets of the Fund’s Class R Shares, Class S Shares, and Class T Shares for providing or procuring administrative services to investors in Class R Shares, Class S Shares, and Class T Shares of the Fund. The Transfer Agent expects to use all or a significant portion of this fee to compensate retirement plan service providers, broker-dealers, bank trust departments, financial advisors, and other financial intermediaries for providing these services. The Transfer Agent may keep certain amounts retained for reimbursement of out-of-pocket costs incurred for servicing clients of Class R Shares, Class S Shares, and Class T Shares.
The Transfer Agent receives an administrative fee based on the average daily net assets Class L Shares of the Fund based on the average proportion of the Fund’s total net assets sold directly and the average proportion of the Fund’s net assets sold through financial intermediaries on a monthly basis. The asset-weighted fee is calculated by applying a blended annual fee rate of 0.12% on average net assets for the proportion of assets sold directly and 0.25% on average net assets for the proportion of assets sold through financial intermediaries. These amounts are disclosed as “Transfer agent administrative fees and expenses” on the Statement of Operations. The Transfer Agent has agreed to waive all or a portion of this fee. Such waiver is voluntary and could change or be terminated at any time at the discretion of the Transfer Agent or the Adviser without prior notification to shareholders. Removal of this fee waiver may have a significant impact on Class L Shares’ total expense ratio. If applicable, amounts waived to the Fund by the Adviser are disclosed as “Excess Expense Reimbursement and Waivers” on the Statement of Operations.
Shareholder Services provided by these financial intermediaries may include, but are not limited to, recordkeeping, subaccounting, order processing, providing order confirmations, periodic statements, forwarding prospectuses, shareholder reports, and other materials to existing customers, answering inquiries regarding accounts, and other administrative services. Order processing includes the submission of transactions through the National Securities Clearing Corporation (“NSCC”) or similar systems, or those processed on a manual basis with the Adviser. For all share classes, the Transfer Agent also seeks reimbursement for costs it incurs as transfer agent and for providing servicing.
Janus Henderson Mid Cap Value Fund
Notes to Financial Statements
Certain, but not all, intermediaries may charge administrative fees to investors in Class A Shares, Class C Shares, and Class I Shares for administrative services provided on behalf of such investors. These administrative fees are paid by the Class A Shares, Class C Shares, and Class I Shares of the Fund to the Transfer Agent, which uses such fees to reimburse intermediaries. Consistent with the Transfer Agency Agreement between the Transfer Agent and the Fund, the Transfer Agent may negotiate the level, structure, and/or terms of the administrative fees with intermediaries requiring such fees on behalf of the Fund. The Adviser and its affiliates benefit from an increase in assets that may result from such relationships. The Adviser has agreed to limit these fees up to 0.20% for Class A Shares and Class C Shares, and up to 0.15% for Class I Shares on an annual basis based on the daily net assets of each share class. Such limits are subject to change by the Trustees in the future. These amounts are disclosed as “Transfer agent networking and omnibus fees” on the Statement of Operations.
The Transfer Agent is not compensated for its services related to the shares, except for out-of-pocket costs, although the Transfer Agent is compensated for its services related to Fund’s Class L Shares and Class D Shares. These amounts are disclosed as “Other transfer agent fees and expenses” on the Statement of Operations.
Under distribution and shareholder servicing plans (the “Plans”) adopted in accordance with Rule 12b-1 under the 1940 Act, the Fund pays the Trust’s distributor, the Distributor, a wholly-owned subsidiary of the Adviser, a fee for the sale and distribution and/or shareholder servicing of the shares based on the average daily net assets for each share class at an annual rate of up to 0.25% for Class A Shares, up to 1.00% for Class C Shares, up to 0.50% for Class R Shares, and up to 0.25% for Class S Shares. Under the terms of the Plans, the Trust is authorized to make payments to the Distributor for remittance to retirement plan service providers, broker-dealers, bank trust departments, financial advisors, and other financial intermediaries, as compensation for distribution and/or shareholder services performed by such entities for their customers who are investors in the Fund. These amounts are disclosed as “12b-1 Distribution and shareholder servicing fees” on the Statement of Operations.
Class A Shares include a 5.75% upfront sales charge of the offering price of the Fund. The sales charge is allocated between the Distributor and financial intermediaries. During the year ended June 30, 2023, the Distributor retained upfront sales charges of $1,642.
A contingent deferred sales charge (“CDSC”) of 1.00% will be deducted with respect to Class A Shares purchased without a sales load and redeemed within 12 months of purchase, unless waived. Any applicable CDSC will be 1.00% of the lesser of the original purchase price or the value of the redemption of the Class A Shares redeemed. There were no CDSCs paid by redeeming shareholders of Class A Shares to the Distributor during the year ended June 30, 2023.
A CDSC of 1.00% will be deducted with respect to Class C Shares redeemed within 12 months of purchase, unless waived. Any applicable CDSC will be 1.00% of the lesser of the original purchase price or the value of the redemption of the Class C Shares redeemed. During the year ended June 30, 2023, redeeming shareholders of Class C Shares paid CDSCs of $480.
The Board of Trustees has adopted a deferred compensation plan (the “Deferred Plan”) for independent Trustees to elect to defer receipt of all or a portion of the annual compensation they are entitled to receive from the Fund. All deferred fees are credited to an account established in the name of the Trustees. The amounts credited to the account then increase or decrease, as the case may be, in accordance with the performance of one or more of the Janus Henderson funds that are selected by the Trustees. The account balance continues to fluctuate in accordance with the performance of the selected fund or funds until final payment of all amounts are credited to the account. The fluctuation of the account balance is recorded by the Fund as unrealized appreciation/(depreciation) and is included as of June 30, 2023 on the Statement of Assets and Liabilities in the asset, “Trustees’ deferred compensation,” and liability, “Trustees’ deferred compensation fees.” Additionally, the recorded unrealized appreciation/(depreciation) is included in “Total distributable earnings (loss)” on the Statement of Assets and Liabilities. Deferred compensation expenses for the year ended June 30, 2023 are included in “Trustees’ fees and expenses” on the Statement of Operations. Trustees are allowed to change their designation of mutual funds from time to time. Amounts will be deferred until distributed in accordance with the Deferred Plan. Deferred fees of $426,025 were paid by the Trust to the Trustees under the Deferred Plan during the year ended June 30, 2023.
Janus Henderson Mid Cap Value Fund
Notes to Financial Statements
4. Federal Income Tax
The tax components of capital shown in the table below represent: (1) distribution requirements the Fund must satisfy under the income tax regulations; (2) losses or deductions the Fund may be able to offset against income and gains realized in future years; and (3) unrealized appreciation or depreciation of investments for federal income tax purposes.
Other book to tax differences primarily consist of deferred compensation. The Fund has elected to treat gains and losses on forward foreign currency contracts as capital gains and losses, if applicable. Other foreign currency gains and losses on debt instruments are treated as ordinary income for federal income tax purposes pursuant to Section 988 of the Internal Revenue Code.
| | | | | | | |
| | | | Other Book | Net Tax | |
Undistributed
Ordinary Income | Undistributed
Long-Term Gains | Accumulated
Capital Losses | Loss Deferrals | to Tax
Differences | Appreciation/
(Depreciation) | |
$ 10,452,104 | $ 98,363,793 | $ - | $ - | $ (18,330) | $523,144,119 | |
The aggregate cost of investments and the composition of unrealized appreciation and depreciation of investment securities for federal income tax purposes as of June 30, 2023 are noted below. The primary difference between book and tax appreciation or depreciation of investments is wash sale loss deferrals.
| | | | |
Federal Tax Cost | Unrealized
Appreciation | Unrealized
(Depreciation) | Net Tax Appreciation/
(Depreciation) |
$ 1,512,426,031 | $553,502,989 | $(30,358,870) | $ 523,144,119 |
Janus Henderson Mid Cap Value Fund
Notes to Financial Statements
Income and capital gains distributions are determined in accordance with income tax regulations that may differ from US GAAP. These differences are due to differing treatments for items such as net short-term gains and deferral of wash sale losses. Certain permanent differences such as tax returns of capital and net investment losses noted below have been reclassified to capital.
| | | | | |
For the year ended June 30, 2023 | |
Distributions | | |
From Ordinary Income | From Long-Term Capital Gains | Tax Return of Capital | Net Investment Loss | |
$ 23,550,606 | $ 101,845,514 | $ - | $ - | |
| | | | | |
For the year ended June 30, 2022 | |
Distributions | | |
From Ordinary Income | From Long-Term Capital Gains | Tax Return of Capital | Net Investment Loss | |
$ 15,479,766 | $ 294,229,481 | $ - | $ - | |
Permanent book to tax basis differences may result in reclassifications between the components of net assets. These differences have no impact on the results of operations or net assets. Capital has been adjusted by $7,976,748, including $6,589,937 of long-term capital gain, for distributions in connection with Fund shares redemption (tax equalization).
Janus Henderson Mid Cap Value Fund
Notes to Financial Statements
5. Capital Share Transactions
| | | | | | | |
| | | | | | |
| | Year ended June 30, 2023 | | Year ended June 30, 2022 |
| | Shares | Amount | | Shares | Amount |
| | | | | | | |
Class A Shares: | | | | | |
Shares sold | 316,306 | $ 4,884,230 | | 510,288 | $ 8,695,125 |
Reinvested dividends and distributions | 196,023 | 2,942,303 | | 383,641 | 6,349,261 |
Shares repurchased | (858,181) | (13,247,445) | | (994,039) | (17,039,440) |
Net Increase/(Decrease) | (345,852) | $ (5,420,912) | | (100,110) | $ (1,995,054) |
Class C Shares: | | | | | |
Shares sold | 97,675 | $ 1,456,626 | | 91,873 | $ 1,488,405 |
Reinvested dividends and distributions | 29,072 | 421,842 | | 62,797 | 1,007,261 |
Shares repurchased | (150,288) | (2,246,908) | | (197,690) | (3,268,624) |
Net Increase/(Decrease) | (23,541) | $ (368,440) | | (43,020) | $ (772,958) |
Class D Shares: | | | | | |
Shares sold | 1,432,517 | $ 21,898,738 | | 2,748,541 | $ 45,546,718 |
Reinvested dividends and distributions | 2,815,147 | 41,157,447 | | 5,123,025 | 82,736,860 |
Shares repurchased | (4,922,699) | (74,142,832) | | (5,067,036) | (84,869,856) |
Net Increase/(Decrease) | (675,035) | $(11,086,647) | | 2,804,530 | $ 43,413,722 |
Class I Shares: | | | | | |
Shares sold | 2,080,493 | $ 31,615,667 | | 2,724,019 | $ 45,914,498 |
Reinvested dividends and distributions | 846,464 | 12,400,700 | | 1,976,237 | 31,995,274 |
Shares repurchased | (3,514,919) | (53,298,174) | | (10,879,166) | (186,643,011) |
Net Increase/(Decrease) | (587,962) | $ (9,281,807) | | (6,178,910) | $(108,733,239) |
Class L Shares: | | | | | |
Shares sold | 129 | $ 1,986 | | 271 | $ 4,692 |
Reinvested dividends and distributions | 16,638 | 253,234 | | 32,048 | 537,763 |
Shares repurchased | (52,974) | (821,041) | | (17,855) | (317,626) |
Net Increase/(Decrease) | (36,207) | $ (565,821) | | 14,464 | $ 224,829 |
Class N Shares: | | | | | |
Shares sold | 2,552,662 | $ 38,423,059 | | 3,760,843 | $ 63,661,529 |
Reinvested dividends and distributions | 716,344 | 10,429,961 | | 3,468,019 | 55,800,430 |
Shares repurchased | (4,241,789) | (63,992,026) | | (22,731,758) | (368,599,923) |
Net Increase/(Decrease) | (972,783) | $(15,139,006) | | (15,502,896) | $(249,137,964) |
Class R Shares: | | | | | |
Shares sold | 316,092 | $ 4,805,866 | | 439,185 | $ 7,352,129 |
Reinvested dividends and distributions | 137,432 | 2,020,246 | | 286,109 | 4,643,550 |
Shares repurchased | (646,438) | (9,793,515) | | (727,269) | (12,093,341) |
Net Increase/(Decrease) | (192,914) | $ (2,967,403) | | (1,975) | $ (97,662) |
Class S Shares: | | | | | |
Shares sold | 832,331 | $ 12,926,292 | | 695,152 | $ 11,868,148 |
Reinvested dividends and distributions | 258,120 | 3,876,964 | | 563,353 | 9,329,121 |
Shares repurchased | (1,405,850) | (21,746,389) | | (1,994,406) | (34,596,385) |
Net Increase/(Decrease) | (315,399) | $ (4,943,133) | | (735,901) | $ (13,399,116) |
Class T Shares: | | | | | |
Shares sold | 2,212,621 | $ 33,902,575 | | 2,694,930 | $ 45,420,050 |
Reinvested dividends and distributions | 3,240,578 | 47,798,527 | | 6,561,448 | 106,885,982 |
Shares repurchased | (10,100,502) | (154,496,514) | | (10,794,302) | (183,471,720) |
Net Increase/(Decrease) | (4,647,303) | $(72,795,412) | | (1,537,924) | $ (31,165,688) |
Janus Henderson Mid Cap Value Fund
Notes to Financial Statements
6. Purchases and Sales of Investment Securities
For the year ended June 30, 2023, the aggregate cost of purchases and proceeds from sales of investment securities (excluding any short-term securities, short-term options contracts, TBAs, and in-kind transactions, as applicable) was as follows:
| | | | |
Purchases of
Securities | Proceeds from Sales
of Securities | Purchases of Long-
Term U.S. Government
Obligations | Proceeds from Sales
of Long-Term U.S.
Government Obligations |
$1,095,230,410 | $1,272,225,942 | $ - | $ - |
7. Subsequent Event
Management has evaluated whether any events or transactions occurred subsequent to June 30, 2023 and through the date of issuance of the Fund's financial statements and determined that there were no material events or transactions that would require recognition or disclosure in the Fund’s financial statements.
Janus Henderson Mid Cap Value Fund
Report of Independent Registered Public Accounting Firm
To the Board of Trustees of Janus Investment Fund and Shareholders of Janus Henderson Mid Cap Value Fund
Opinion on the Financial Statements
We have audited the accompanying statement of assets and liabilities, including the schedule of investments, of Janus Henderson Mid Cap Value Fund (one of the funds constituting Janus Investment Fund, referred to hereafter as the “Fund”) as of June 30, 2023, the related statement of operations for the year ended June 30, 2023, the statements of changes in net assets for each of the two years in the period ended June 30, 2023, including the related notes, and the financial highlights for each of the five years in the period ended June 30, 2023 (collectively referred to as the “financial statements”). In our opinion, the financial statements present fairly, in all material respects, the financial position of the Fund as of June 30, 2023, the results of its operations for the year then ended, the changes in its net assets for each of the two years in the period ended June 30, 2023 and the financial highlights for each of the five years in the period ended June 30, 2023 in conformity with accounting principles generally accepted in the United States of America.
Basis for Opinion
These financial statements are the responsibility of the Fund’s management. Our responsibility is to express an opinion on the Fund’s financial statements based on our audits. We are a public accounting firm registered with the Public Company Accounting Oversight Board (United States) (PCAOB) and are required to be independent with respect to the Fund in accordance with the U.S. federal securities laws and the applicable rules and regulations of the Securities and Exchange Commission and the PCAOB.
We conducted our audits of these financial statements in accordance with the standards of the PCAOB. Those standards require that we plan and perform the audit to obtain reasonable assurance about whether the financial statements are free of material misstatement, whether due to error or fraud.
Our audits included performing procedures to assess the risks of material misstatement of the financial statements, whether due to error or fraud, and performing procedures that respond to those risks. Such procedures included examining, on a test basis, evidence regarding the amounts and disclosures in the financial statements. Our audits also included evaluating the accounting principles used and significant estimates made by management, as well as evaluating the overall presentation of the financial statements. Our procedures included confirmation of securities owned as of June 30, 2023 by correspondence with the custodian and brokers. We believe that our audits provide a reasonable basis for our opinion.

Denver, Colorado
August 21, 2023
We have served as the auditor of one or more investment companies in Janus Henderson Funds since 1990.
Janus Henderson Mid Cap Value Fund
Additional Information (unaudited)
Proxy Voting Policies and Voting Record
A description of the policies and procedures that the Fund uses to determine how to vote proxies relating to its portfolio securities is available without charge: (i) upon request, by calling 1-800-525-1093; (ii) on the Fund’s website at janushenderson.com/proxyvoting; and (iii) on the SEC’s website at http://www.sec.gov. Additionally, information regarding the Fund’s proxy voting record for the most recent twelve-month period ended June 30 is also available, free of charge, through janushenderson.com/proxyvoting and from the SEC’s website at http://www.sec.gov.
Full Holdings
The Fund files its complete portfolio holdings (schedule of investments) with the SEC as an exhibit to Form N-PORT within 60 days of the end of the first and third fiscal quarters, and in the annual report and semiannual report to shareholders. The Fund’s Form N-PORT filings and annual and semiannual reports: (i) are available on the SEC’s website at http://www.sec.gov; and (ii) are available without charge, upon request, by calling a Janus Henderson representative at 1-877-335-2687 (toll free) (or 1-800-525-3713 if you hold Class D shares). Portfolio holdings consisting of at least the names of the holdings are generally available on a monthly basis with a 30-day lag under Full Holdings for the Fund at janushenderson.com/info (or janushenderson.com/reports if you hold Class D Shares).
APPROVAL OF ADVISORY AGREEMENTS DURING THE PERIOD
The Trustees of Janus Aspen Series, each of whom serves as an “independent” Trustee (the “Trustees”), oversee the management of each portfolio of Janus Aspen Series (each, a “VIT Portfolio,” and collectively, the “VIT Portfolios”), as well as each fund of Janus Investment Fund (each, a “Fund,” and collectively, the “Funds” and together with the VIT Portfolios, the “Janus Henderson Funds,” and each, a “Janus Henderson Fund”). As required by law, the Trustees determine annually whether to continue the investment advisory agreement for each Janus Henderson Fund.
In connection with their most recent consideration of those agreements for each Janus Henderson Fund, the Trustees received and reviewed information provided by Janus Henderson Investors US LLC (the “Adviser”) in response to requests of the Trustees and their independent legal counsel. They also received and reviewed information and analysis provided by, and in response to requests of, their independent fee consultant. Throughout their consideration of the agreements, the Trustees were advised by their independent legal counsel. The Trustees met with management to consider the agreements, and also met separately in executive session with their independent legal counsel and their independent fee consultant.
At meetings held on November 9-10, 2022 and December 13-14, 2022, the Trustees evaluated the information provided by the Adviser and the independent fee consultant, as well as other information provided by the Adviser and the independent fee consultant during the year. Following such evaluation, the Trustees determined that the overall arrangements between each Janus Henderson Fund and the Adviser were fair and reasonable in light of the nature, extent, and quality of the services provided by the Adviser and its affiliates, the fees charged for those services, and other matters that the Trustees considered relevant in the exercise of their business judgment, and unanimously approved the continuation of the investment advisory agreement for each Janus Henderson Fund for the period from February 1, 2023 through February 1, 2024, subject to earlier termination as provided for in each agreement.
In considering the continuation of those agreements, the Trustees reviewed and analyzed various factors that they determined were relevant, including the factors described below, none of which by itself was considered dispositive. However, the material factors and conclusions that formed the basis for the Trustees’ determination to approve the continuation of the agreements are discussed separately below. Also included is a summary of the independent fee consultant’s conclusions and opinions that arose during, and were included as part of, the Trustees’ consideration of the agreements. “Management fees,” as used herein, reflect actual annual advisory fees and, for the purpose of peer comparisons any administration fees (excluding out of pocket costs), net of any waivers, paid by a fund as a percentage of average net assets.
Nature, Extent and Quality of Services
The Trustees reviewed the nature, extent, and quality of the services provided by the Adviser to the Janus Henderson Funds, taking into account the investment objective, strategies, and policies of each Janus Henderson Fund, and the knowledge the Trustees gained from their regular meetings with management on at least a quarterly basis and their ongoing review of information related to the Janus Henderson Funds. In addition, the Trustees reviewed the resources and key personnel of the Adviser, particularly noting those employees who provide investment and risk management services to the Janus Henderson Funds. The Trustees also considered other services provided to the Janus Henderson
Janus Henderson Mid Cap Value Fund
Additional Information (unaudited)
Funds by the Adviser, such as managing the execution of portfolio transactions and the selection of broker-dealers for those transactions. The Trustees considered the Adviser’s role as administrator to the Janus Henderson Funds, noting that the Adviser generally does not receive a fee for its services as administrator, but is reimbursed for its out-of-pocket costs. The Trustees considered the role of the Adviser in monitoring adherence to the Janus Henderson Funds’ investment restrictions, providing support services for the Trustees and Trustee committees, and overseeing communications with Janus Henderson Fund shareholders and the activities of other service providers, including monitoring compliance with various policies and procedures of the Janus Henderson Funds and with applicable securities laws and regulations.
In this regard, the independent fee consultant noted that the Adviser provides a number of different services for the Janus Henderson Funds and their shareholders, ranging from investment management services to various other servicing functions, and that, in its view, the Adviser is a capable provider of those services. The independent fee consultant also provided its belief that the Adviser has developed a number of institutional competitive advantages that should enable it to provide superior investment and service performance over the long term.
The Trustees concluded that the nature, extent, and quality of the services provided by the Adviser to each Janus Henderson Fund were appropriate and consistent with the terms of the respective advisory agreements, and that, taking into account steps taken to address those Janus Henderson Funds whose performance lagged that of their peers for certain periods, the Janus Henderson Funds were likely to benefit from the continued provision of those services. They also concluded that the Adviser had sufficient personnel, with the appropriate education and experience, to serve the Janus Henderson Funds effectively and had demonstrated its ability to attract well-qualified personnel.
Performance of the Funds
The Trustees considered the performance results of each Janus Henderson Fund over various time periods. They noted that they considered Janus Henderson Fund performance data throughout the year, including periodic meetings with each Janus Henderson Fund’s portfolio manager(s), and also reviewed information comparing each Janus Henderson Fund’s performance with the performance of comparable fund peer groups identified by Broadridge Financial Solutions, Inc. (“Broadridge”), an independent data provider, and with the Janus Henderson Fund’s benchmark index. In this regard, the independent fee consultant found that the overall Janus Henderson Funds’ performance has been reasonable, noting that: (i) for the 36 months ended May 31, 2022, approximately 38% of the Janus Henderson Funds were in the top two quartiles of their Broadridge peer groups; (ii) for the 36 months ended September 30, 2022, approximately 45% of the Janus Henderson Funds were in the top two quartiles of performance as reported by Morningstar, and (iii) for the 12 months ended September 30, 2022, approximately 55% of the Janus Henderson Funds were in the top two quartiles of performance as reported by Morningstar.
The Trustees considered the performance of each Janus Henderson Fund, noting that performance may vary by share class, and noted the following with respect to the Funds:
Asset Allocation Funds
· For Janus Henderson Global Allocation Fund – Conservative, the Trustees noted that the Fund’s performance was in the third Broadridge quartile for the 36 months ended May 31, 2022 and the bottom Broadridge quartile for the 12 months ended May 31, 2022. The Trustees noted the reasons for the Fund’s underperformance and the steps the Adviser had taken or was taking to improve performance.
· For Janus Henderson Global Allocation Fund – Growth, the Trustees noted that the Fund’s performance was in the bottom Broadridge quartile for the 36 months ended May 31, 2022 and the bottom Broadridge quartile for the 12 months ended May 31, 2022. The Trustees noted the reasons for the Fund’s underperformance and the steps the Adviser had taken or was taking to improve performance.
· For Janus Henderson Global Allocation Fund – Moderate, the Trustees noted that the Fund’s performance was in the bottom Broadridge quartile for the 36 months ended May 31, 2022 and the bottom Broadridge quartile for the 12 months ended May 31, 2022. The Trustees noted the reasons for the Fund’s underperformance and the steps the Adviser had taken or was taking to improve performance.
Fixed-Income Funds
· For Janus Henderson Absolute Return Income Opportunities Fund, the Trustees noted that the Fund’s performance was in the third Broadridge quartile for the 36 months ended May 31, 2022 and the first Broadridge
Janus Henderson Mid Cap Value Fund
Additional Information (unaudited)
quartile for the 12 months ended May 31, 2022. The Trustees noted the reasons for the Fund’s underperformance, the steps the Adviser had taken or was taking to improve performance, and that the performance trend was improving.
· For Janus Developed World Bond Fund, the Trustees noted that the Fund’s performance was in the bottom Broadridge quartile for the 36 months ended May 31, 2022 and the bottom Broadridge quartile for the 12 months ended May 31, 2022. The Trustees noted the reasons for the Fund’s underperformance and the steps the Adviser had taken or was taking to improve performance.
· For Janus Henderson Flexible Bond Fund, the Trustees noted that the Fund’s performance was in the first Broadridge quartile for the 36 months ended May 31, 2022 and the second Broadridge quartile for the 12 months ended May 31, 2022.
· For Janus Henderson Global Bond Fund, the Trustees noted that the Fund’s performance was in the third Broadridge quartile for the 36 months ended May 31, 2022 and the bottom Broadridge quartile for the 12 months ended May 31, 2022. The Trustees noted the reasons for the Fund’s underperformance and the steps the Adviser had taken or was taking to improve performance.
· For Janus Henderson High-Yield Fund, the Trustees noted that the Fund’s performance was in the third Broadridge quartile for the 36 months ended May 31, 2022 and the bottom Broadridge quartile for the 12 months ended May 31, 2022. The Trustees noted the reasons for the Fund’s underperformance and the steps the Adviser had taken or was taking to improve performance.
· For Janus Henderson Multi-Sector Income Fund, the Trustees noted that the Fund’s performance was in the second Broadridge quartile for the 36 months ended May 31, 2022 and the third Broadridge quartile for the 12 months ended May 31, 2022.
· For Janus Henderson Short Duration Flexible Bond Fund, the Trustees noted that the Fund’s performance was in the third Broadridge quartile for the 36 months ended May 31, 2022 and the bottom Broadridge quartile for the 12 months ended May 31, 2022. The Trustees noted the reasons for the Fund’s underperformance and the steps the Adviser had taken or was taking to improve performance.
Global and International Equity Funds
· For Janus Henderson Asia Equity Fund, the Trustees noted that the Fund’s performance was in the third Broadridge quartile for the 36 months ended May 31, 2022 and the third Broadridge quartile for the 12 months ended May 31, 2022. The Trustees noted the reasons for the Fund’s underperformance, while also noting that the Fund has a performance fee structure that results in lower management fees during periods of underperformance, and the steps the Adviser had taken or was taking to improve performance.
· For Janus Henderson Emerging Markets Fund, the Trustees noted that the Fund’s performance was in the third Broadridge quartile for the 36 months ended May 31, 2022 and the third Broadridge quartile for the 12 months ended May 31, 2022. The Trustees noted the reasons for the Fund’s underperformance and the steps the Adviser had taken or was taking to improve performance.
· For Janus Henderson European Focus Fund, the Trustees noted that the Fund’s performance was in the first Broadridge quartile for the 36 months ended May 31, 2022 and the second Broadridge quartile for the 12 months ended May 31, 2022.
· For Janus Henderson Global Equity Income Fund, the Trustees noted that the Fund’s performance was in the third Broadridge quartile for the 36 months ended May 31, 2022 and the first Broadridge quartile for the 12 months ended May 31, 2022. The Trustees noted the reasons for the Fund’s underperformance, the steps the Adviser had taken or was taking to improve performance, and that the performance trend was improving.
· For Janus Henderson Global Life Sciences Fund, the Trustees noted that the Fund’s performance was in the third Broadridge quartile for the 36 months ended May 31, 2022 and the second Broadridge quartile for the 12 months ended May 31, 2022. The Trustees noted the reasons for the Fund’s underperformance, the steps the Adviser had taken or was taking to improve performance, and that the performance trend was improving.
Janus Henderson Mid Cap Value Fund
Additional Information (unaudited)
· For Janus Henderson Global Sustainable Equity Fund, the Trustees noted that the Fund’s performance was in the second Broadridge quartile for the 12 months ended May 31, 2022. The Trustees noted that 36 month-end performance was not yet available.
· For Janus Henderson Global Real Estate Fund, the Trustees noted that the Fund’s performance was in the second Broadridge quartile for the 36 months ended May 31, 2022 and the bottom Broadridge quartile for the 12 months ended May 31, 2022.
· For Janus Henderson Global Research Fund, the Trustees noted that the Fund’s performance was in the second Broadridge quartile for the 36 months ended May 31, 2022 and the first Broadridge quartile for the 12 months ended May 31, 2022.
· For Janus Henderson Global Select Fund, the Trustees noted that the Fund’s performance was in the first Broadridge quartile for the 36 months ended May 31, 2022 and the first Broadridge quartile for the 12 months ended May 31, 2022.
· For Janus Henderson Global Technology and Innovation Fund, the Trustees noted that the Fund’s performance was in the second Broadridge quartile for the 36 months ended May 31, 2022 and the second Broadridge quartile for the 12 months ended May 31, 2022.
· For Janus Henderson International Opportunities Fund, the Trustees noted that the Fund’s performance was in the bottom Broadridge quartile for the 36 months ended May 31, 2022 and the third Broadridge quartile for the 12 months ended May 31, 2022. The Trustees noted the reasons for the Fund’s underperformance and the steps the Adviser had taken or was taking to improve performance.
· For Janus Henderson Overseas Fund, the Trustees noted that the Fund’s performance was in the first Broadridge quartile for the 36 months ended May 31, 2022 and the first Broadridge quartile for the 12 months ended May 31, 2022.
· For Janus Henderson Responsible International Dividend Fund (formerly the Janus Henderson Dividend & Income Builder Fund), the Trustees noted that the Fund’s performance was in the bottom Broadridge quartile for the 36 months ended May 31, 2022 and the bottom Broadridge quartile for the 12 months ended May 31, 2022. The Trustees noted the reasons for the Fund’s underperformance and the steps the Adviser had taken or was taking to improve performance.
Money Market Funds
· For Janus Henderson Government Money Market Fund, the Trustees noted that the Fund’s performance was in the third Broadridge quartile for the 36 months ended May 31, 2022 and the bottom Broadridge quartile for the 12 months ended May 31, 2022. The Trustees noted the reasons for the Fund’s underperformance and the steps the Adviser had taken or was taking to improve performance.
· For Janus Henderson Money Market Fund, the Trustees noted that the Fund’s performance was in the third Broadridge quartile for the 36 months ended May 31, 2022 and the bottom Broadridge quartile for the 12 months ended May 31, 2022. The Trustees noted the reasons for the Fund’s underperformance and the steps the Adviser had taken or was taking to improve performance.
Multi-Asset Funds
· For Janus Henderson Adaptive Global Allocation Fund, the Trustees noted that the Fund’s performance was in bottom Broadridge quartile for the 36 months ended May 31, 2022 and the second Broadridge quartile for the 12 months ended May 31, 2022. The Trustees noted the reasons for the Fund’s underperformance, the steps the Adviser had taken or was taking to improve performance, and that the performance trend was improving.
· For Janus Henderson Balanced Fund, the Trustees noted that the Fund’s performance was in the first Broadridge quartile for the 36 months ended May 31, 2022 and the first Broadridge quartile for the 12 months ended May 31, 2022.
Janus Henderson Mid Cap Value Fund
Additional Information (unaudited)
U.S. Equity Funds
· For Janus Henderson Adaptive Risk Managed U.S. Equity Fund, the Trustees noted that the Fund’s performance was in the bottom Broadridge quartile for the 36 months ended May 31, 2022 and the second Broadridge quartile for the 12 months ended May 31, 2022. The Trustees noted the reasons for the Fund’s underperformance, the steps the Adviser had taken or were taking to improve performance, and that the performance trend was improving.
· For Janus Henderson Contrarian Fund, the Trustees noted that the Fund’s performance was in the first Broadridge quartile for the 36 months ended May 31, 2022 and the bottom Broadridge quartile for the 12 months ended May 31, 2022.
· For Janus Henderson Enterprise Fund, the Trustees noted that the Fund’s performance was in the second Broadridge quartile for the 36 months ended May 31, 2022 and the first Broadridge quartile for the 12 months ended May 31, 2022.
· For Janus Henderson Forty Fund, the Trustees noted that the Fund’s performance was in the third Broadridge quartile for the 36 months ended May 31, 2022 and the bottom Broadridge quartile for the 12 months ended May 31, 2022. The Trustees noted the reasons for the Fund’s underperformance and the steps the Adviser had taken or was taking to improve performance.
· For Janus Henderson Growth and Income Fund, the Trustees noted that the Fund’s performance was in the bottom Broadridge quartile for the 36 months ended May 31, 2022 and the first Broadridge quartile for the 12 months ended May 31, 2022. The Trustees noted the reasons for the Fund’s underperformance, the steps the Adviser had taken or was taking to improve performance, and that the performance trend was improving.
· For Janus Henderson Mid Cap Value Fund, the Trustees noted that the Fund’s performance was in the bottom Broadridge quartile for the 36 months ended May 31, 2022 and the second Broadridge quartile for the 12 months ended May 31, 2022. The Trustees noted the reasons for the Fund’s underperformance, while also noting that the Fund has a performance fee structure that results in lower management fees during periods of underperformance, the steps the Adviser had taken or was taking to improve performance, and that the performance trend was improving.
· For Janus Henderson Research Fund, the Trustees noted that the Fund’s performance was in the third Broadridge quartile for the 36 months ended May 31, 2022 and the third Broadridge quartile for the 12 months ended May 31, 2022. The Trustees noted the reasons for the Fund’s underperformance, while also noting that the Fund has a performance fee structure that results in lower management fees during periods of underperformance and the steps the Adviser had taken or was taking to improve performance.
· For Janus Henderson Small Cap Value Fund, the Trustees noted that the Fund’s performance was in the bottom Broadridge quartile for the 36 months ended May 31, 2022 and the second Broadridge quartile for the 12 months ended May 31, 2022. The Trustees noted the reasons for the Fund’s underperformance, while also noting that the Fund has a performance fee structure that results in lower management fees during periods of underperformance, the steps the Adviser had taken or was taking to improve performance, and that the performance trend was improving.
· For Janus Henderson Small-Mid Cap Value Fund, the Trustees noted that the Fund’s performance was in the bottom Broadridge quartile for the 36 months ended May 31, 2022 and the second Broadridge quartile for the 12 months ended May 31, 2022. The Trustees noted the reasons for the Fund’s underperformance, while also noting that the Fund has a performance fee structure that results in lower management fees during periods of underperformance, the steps the Adviser had taken or was taking to improve performance, and that the performance trend is improving.
· For Janus Henderson Triton Fund, the Trustees noted that the Fund’s performance was in the bottom Broadridge quartile for the 36 months ended May 31, 2022 and the second Broadridge quartile for the 12 months ended May 31, 2022. The Trustees noted the reasons for the Fund’s underperformance, the steps the Adviser had taken or was taking to improve performance, and that the performance trend was improving.
· For Janus Henderson Venture Fund, the Trustees noted that the Fund’s performance was in the bottom Broadridge quartile for the 36 months ended May 31, 2022 and the second Broadridge quartile for the 12 months ended May
Janus Henderson Mid Cap Value Fund
Additional Information (unaudited)
31, 2022. The Trustees noted the reasons for the Fund’s underperformance, the steps the Adviser had taken or was taking to improve performance, and that the performance trend was improving.
In consideration of each Janus Henderson Fund’s performance, the Trustees concluded that, taking into account the factors relevant to performance, as well as other considerations, including steps taken to improve performance, as applicable, the Janus Henderson Fund’s performance warranted continuation of such Janus Henderson Fund’s investment advisory agreement.
Costs of Services Provided
The Trustees examined information regarding the fees and expenses of each Janus Henderson Fund in comparison to similar information for other comparable funds as provided by Broadridge, an independent data provider. They also reviewed an analysis of that information provided by their independent fee consultant. The independent fee consultant provided its belief that the management fees charged by the Adviser to each of the Janus Henderson Funds under the current investment advisory and administration agreements are reasonable in relation to the services provided by the Adviser. The independent fee consultant found: (1) the total expenses and management fees of the Janus Henderson Funds to be reasonable relative to other comparable mutual funds; (2) the total expenses, on average, were 6% under the average total expenses of the respective Broadridge peer group; and (3) the management fees for the Janus Henderson Funds, on average, were 5% under the average management fees for the respective Broadridge peer group. The Trustees also considered the total expenses for each share class of each Janus Henderson Fund compared to the average total expenses for its Broadridge Expense Group and to average total expenses for its Broadridge Expense Universe.
For Janus Henderson Funds with three or more years of performance history, the independent fee consultant also performed a systematic “focus list” analysis of expenses which assessed fund fees in the context of fund performance being delivered. Based on this analysis, the independent fee consultant found that the combination of service quality/performance and expenses on these individual Janus Henderson Funds was reasonable in light of performance trends, performance histories, changes in portfolio management, relative average net asset levels, and the existence of performance fees, breakpoints, and/or expense waivers on such Janus Henderson Funds.
The Trustees considered the methodology used by the Adviser in determining compensation payable to portfolio managers, the competitive environment for investment management talent, and the competitive market for mutual funds in different distribution channels.
The Trustees also reviewed management fees charged by the Adviser to comparable separate account clients and to comparable non-affiliated funds subadvised by the Adviser (for which the Adviser provides only or primarily portfolio management services). Although in most instances subadvisory and separate account fee rates for various investment strategies were lower than management fee rates for Janus Henderson Funds having a similar strategy, the Trustees considered that the Adviser noted that, under the terms of the management agreements with the Janus Henderson Funds, the Adviser performs significant additional services for the Janus Henderson Funds that it does not provide to those other clients, including administration services, oversight of the Janus Henderson Funds’ other service providers, Trustee support, regulatory compliance and numerous other services, and that, in serving the Janus Henderson Funds, the Adviser assumes many legal risks and other costs that it does not assume in servicing its other clients. Moreover, the Trustees noted that the independent fee consultant found that: (1) the management fees the Adviser charges to the Janus Henderson Funds are reasonable in relation to the management fees the Adviser charges to funds subadvised by the Adviser and to the fees the Adviser charges to its institutional separate account clients; (2) these subadvised and institutional separate accounts have different service and infrastructure needs and operate in markets very different from the retail fund market; (3) Janus Henderson mutual fund investors enjoy reasonable fees relative to the fees charged in these other markets; and (4) as part of its 2022 review, 9 of 11 Janus Henderson Funds have lower management fees than similar funds subadvised by the Adviser. The Trustees noted that for the two Janus Henderson Funds that did not, management fees for each were under the average of its 15(c) peer group.
The Trustees considered the fees for each Janus Henderson Fund for its fiscal year ended in 2021 and noted the following with regard to each Janus Henderson Fund’s total expenses, net of applicable fee waivers (the Fund’s “total expenses”) as reflected in the comparative information provided by Broadridge:
Janus Henderson Mid Cap Value Fund
Additional Information (unaudited)
Asset Allocation Funds
· For Janus Henderson Global Allocation Fund – Conservative, the Trustees noted that, although the Fund’s total expenses exceeded the peer group average for certain share classes, overall the Fund’s total expenses were reasonable. The Trustees also noted that the Adviser has contractually agreed to limit the Fund’s expenses.
· For Janus Henderson Global Allocation Fund – Growth, the Trustees noted that, although the Fund’s total expenses exceeded the peer group average for certain share classes, overall the Fund’s total expenses were reasonable. The Trustees also noted that the Adviser has contractually agreed to limit the Fund’s expenses, although this limit did not apply because the Fund’s total expenses as shown were below the applicable fee limit.
· For Janus Henderson Global Allocation Fund – Moderate, the Trustees noted that, although the Fund’s total expenses exceeded the peer group average for one share class, overall the Fund’s total expenses were reasonable. The Trustees also noted that the Adviser has contractually agreed to limit the Fund’s expenses.
Fixed-Income Funds
· For Janus Henderson Absolute Return Income Opportunities Fund, the Trustees noted that, although the Fund’s total expenses exceeded the peer group average for certain share classes, overall the Fund’s total expenses were reasonable. The Trustees also noted that the Adviser has contractually agreed to limit the Fund’s expenses.
· For Janus Henderson Developed World Bond Fund, the Trustees noted that, although the Fund’s total expenses exceeded the peer group average for one share class, overall the Fund’s total expenses were reasonable. The Trustees also noted that the Adviser has contractually agreed to limit the Fund’s expenses.
· For Janus Henderson Flexible Bond Fund, the Trustees noted that, although the Fund’s total expenses exceeded the peer group average for certain share classes, overall the Fund’s total expenses were reasonable. The Trustees also noted that the Adviser has contractually agreed to limit the Fund’s expenses, although this limit did not apply because the Fund’s total expenses as shown were below the applicable fee limit.
· For Janus Henderson Global Bond Fund, the Trustees noted that, although the Fund’s total expenses exceeded the peer group average for certain share classes, overall the Fund’s total expenses were reasonable. The Trustees also noted that the Adviser has contractually agreed to limit the Fund’s expenses.
· For Janus Henderson High-Yield Fund, the Trustees noted that, although the Fund’s total expenses exceeded the peer group average for certain share classes, overall the Fund’s total expenses were reasonable. The Trustees also noted that the Adviser has contractually agreed to limit the Fund’s expenses.
· For Janus Henderson Multi-Sector Income Fund, the Trustees noted that, although the Fund’s total expenses exceeded the peer group average for certain share classes, overall the Fund’s total expenses were reasonable. The Trustees also noted that the Adviser has contractually agreed to limit the Fund’s expenses.
· For Janus Henderson Short Duration Flexible Bond Fund, the Trustees noted that, although the Fund’s total expenses exceeded the peer group average for certain share classes, overall the Fund’s total expenses were reasonable. The Trustees also noted that the Adviser has contractually agreed to limit the Fund’s expenses.
Global and International Equity Funds
· For Janus Henderson Asia Equity Fund, the Trustees noted that, although the Fund’s total expenses exceeded the peer group average for certain share classes, overall the Fund’s total expenses were reasonable. The Trustees also noted that the Adviser has contractually agreed to limit the Fund’s expenses.
· For Janus Henderson Emerging Markets Fund, the Trustees noted that, although the Fund’s total expenses exceeded the peer group average for certain share classes, overall the Fund’s total expenses were reasonable. The Trustees also noted that the Adviser has contractually agreed to limit the Fund’s expenses.
· For Janus Henderson European Focus Fund, the Trustees noted that, although the Fund’s total expenses exceeded the peer group average for one share class, overall the Fund’s expenses were reasonable. The Trustees also noted that the Adviser has contractually agreed to limit the Fund’s expenses.
· For Janus Henderson Global Equity Income Fund, the Trustees noted that, although the Fund’s total expenses exceeded the peer group average for one share class, overall the Fund’s total expenses were reasonable. The
Janus Henderson Mid Cap Value Fund
Additional Information (unaudited)
Trustees also noted that the Adviser has contractually agreed to limit the Fund’s expenses, although this limit did not apply because the Fund’s total expenses as shown were below the applicable fee limit.
· For Janus Henderson Global Life Sciences Fund, the Trustees noted that the Fund’s total expenses were below the peer group average for all share classes.
· For Janus Henderson Global Real Estate Fund, the Trustees noted that, although the Fund’s total expenses exceeded the peer group average for certain share classes, overall the Fund’s total expenses were reasonable. The Trustees also noted that the Adviser has contractually agreed to limit the Fund’s expenses, although this limit did not apply because the Fund’s total expenses as shown were below the applicable fee limit.
· For Janus Henderson Global Research Fund, the Trustees noted that, although the Fund’s total expenses exceeded the peer group average for one share class, overall the Fund’s total expenses were reasonable. The Trustees also noted that the Adviser has contractually agreed to limit the Fund’s expenses, although this limit did not apply because the Fund’s total expenses as shown were below the applicable fee limit.
· For Janus Henderson Global Select Fund, the Trustees noted that, although the Fund’s total expenses exceeded the peer group average for certain share classes, overall the Fund’s total expenses were reasonable. The Trustees also noted that the Adviser has contractually agreed to limit the Fund’s expenses.
· For Janus Henderson Global Sustainable Equity Fund, the Trustees noted that, although the Fund’s total expenses exceeded the peer group average for certain share classes, overall the Fund’s expenses were reasonable. The Trustees also noted that the Adviser has contractually agreed to limit the Fund’s expenses.
· For Janus Henderson Global Technology and Innovation Fund, the Trustees noted that the Fund’s total expenses were below the peer group average for all share classes.
· For Janus Henderson International Opportunities Fund, the Trustees noted that, although the Fund’s total expenses exceeded the peer group average for certain share classes, overall the Fund’s expenses were reasonable. The Trustees also noted that the Adviser has contractually agreed to limit the Fund’s expenses.
· For Janus Henderson Overseas Fund, the Trustees noted that although the Fund’s total expenses exceeded the peer group average for certain share classes, overall the Fund’s total expenses were reasonable. The Trustees also noted that the Adviser has contractually agreed to limit the Fund’s expenses, although this limit did not apply because the Fund’s total expenses as shown were below the applicable fee limit.
· For Janus Henderson Responsible International Dividend Fund (formerly the Janus Henderson Dividend & Income Builder Fund), the Trustees noted that, although the Fund’s total expenses exceeded the peer group for one share class, overall the Fund’s total expenses were reasonable. The Trustees also noted that the Adviser has contractually agreed to limit the Fund’s expenses.
Money Market Funds
· For Janus Henderson Government Money Market Fund, the Trustees noted that the Fund’s total expenses were below the peer group average for all share classes.
· For Janus Henderson Money Market Fund, the Trustees noted that the Fund’s total expenses were below the peer group average for all share classes.
Multi-Asset Funds
· For Janus Henderson Adaptive Global Allocation Fund, the Trustees noted that the Fund’s total expenses were below the peer group average for all share classes.
· For Janus Henderson Balanced Fund, the Trustees noted that, although the Fund’s total expenses exceeded the peer group average for certain share classes, overall the Fund’s total expenses were reasonable. The Trustees also noted that the Adviser has contractually agreed to limit the Fund’s expenses, although this limit did not apply because the Fund’s total expenses as shown were below the applicable fee limit.
Janus Henderson Mid Cap Value Fund
Additional Information (unaudited)
U.S. Equity Funds
· For Janus Henderson Adaptive Risk Managed U.S. Equity Fund, the Trustees noted that, although the Fund’s total expenses exceeded the peer group average for certain share classes, overall the Fund’s total expenses were reasonable. The Trustees also noted that the Adviser has contractually agreed to limit the Fund’s expenses, although this limit did not apply because the Fund’s total expenses as shown were below the applicable fee limit.
· For Janus Henderson Contrarian Fund, the Trustees noted that, although the Fund’s total expenses exceeded the peer group average for all share classes, overall the Fund’s total expenses were reasonable. The Trustees also noted that the Adviser had contractually agreed to limit the Fund’s expenses.
· For Janus Henderson Enterprise Fund, the Trustees noted that, although the Fund’s total expenses exceeded the peer group average for certain share classes, overall the Fund’s total expenses were reasonable. The Trustees also noted that the Adviser has contractually agreed to limit the Fund’s expenses, although this limit did not apply because the Fund’s total expenses as shown were below the applicable fee limit.
· For Janus Henderson Forty Fund, the Trustees noted that, although the Fund’s total expenses exceeded the peer group average for certain share classes, overall the Fund’s total expenses were reasonable. The Trustees also noted that the Adviser has contractually agreed to limit the Fund’s expenses, although this limit did not apply because the Fund’s total expenses as shown were below the applicable fee limit.
· For Janus Henderson Growth and Income Fund, the Trustees noted that, although the Fund’s total expenses exceeded the peer group average for certain share classes, overall the Fund’s total expenses were reasonable. The Trustees also noted that the Adviser has contractually agreed to limit the Fund’s expenses, although this limit did not apply because the Fund’s total expenses as shown were below the applicable fee limit.
· For Janus Henderson Mid Cap Value Fund, the Trustees noted that the Fund’s total expenses were below the peer group average for all share classes.
· For Janus Henderson Research Fund, the Trustees noted that, although the Fund’s total expenses exceeded the peer group average for certain share classes, overall the Fund’s total expenses were reasonable. The Trustees also noted that the Adviser has contractually agreed to limit the Fund’s expenses.
· For Janus Henderson Small Cap Value Fund, the Trustees noted that, although the Fund’s total expenses exceeded the peer group average for one share class, overall the Fund’s total expenses were reasonable. The Trustees also noted that the Adviser has contractually agreed to limit the Fund’s expenses, although this limit did not apply because the Fund’s total expenses as shown were below the applicable fee limit.
· For Janus Henderson Small-Mid Cap Value Fund, the Trustees noted that the Fund’s total expenses were below the peer group average for all share classes.
· For Janus Henderson Triton Fund, the Trustees noted that, although the Fund’s total expenses exceeded the peer group average for one share class, overall the Fund’s total expenses were reasonable. The Trustees also noted that the Adviser has contractually agreed to limit the Fund’s expenses, although this limit did not apply because the Fund’s total expenses as shown were below the applicable fee limit.
· For Janus Henderson Venture Fund, the Trustees noted that although the Fund’s total expenses exceeded the peer group average for one share class, overall the Fund’s total expenses were reasonable. The Trustees also noted that the Adviser has contractually agreed to limit the Fund’s expenses, although this limit did not apply because the Fund’s total expenses as shown were below the applicable fee limit.
The Trustees reviewed information on the overall profitability to the Adviser and its affiliates from their relationships with the Janus Henderson Funds, and considered profitability data of other publicly traded mutual fund advisers. The Trustees recognized that profitability comparisons among fund managers are difficult because of the variation in the type of comparative information that is publicly available, and the profitability of any fund manager is affected by numerous factors, including the organizational structure of the particular fund manager, differences in complex size, difference in product mix, difference in types of business (mutual fund, institutional and other), differences in the types of funds and other accounts it manages, possible other lines of business, the methodology for allocating expenses and the fund manager’s capital structure and cost of capital.
Janus Henderson Mid Cap Value Fund
Additional Information (unaudited)
Additionally, the Trustees considered the estimated profitability to the Adviser from the investment management services it provided to each Janus Henderson Fund. In their review, the Trustees considered whether the Adviser receive adequate incentives and resources to manage the Janus Henderson Funds effectively. In reviewing profitability, the Trustees noted that the estimated profitability for an individual Janus Henderson Fund is necessarily a product of the allocation methodology utilized by the Adviser to allocate its expenses as part of the estimated profitability calculation. In this regard, the Trustees noted that the independent fee consultant found as part of its 2022 review that (1) the expense allocation methodology and rationales utilized by the Adviser were reasonable and (2) no clear correlation exists between expense allocations and operating margins. The Trustees also considered that the estimated profitability for an individual Janus Henderson Fund was influenced by a number of factors, including not only the allocation methodology selected, but also the presence of fee waivers and expense caps, and whether the Janus Henderson Fund’s investment management agreement contained breakpoints or a performance fee component. The Trustees determined, after taking into account these factors, among others, that the Adviser’s estimated profitability with respect to each Janus Henderson Fund was not unreasonable in relation to the services provided, and that the variation in the range of such estimated profitability among the Janus Henderson Funds was not a material factor in the Board’s approval of the reasonableness of any Janus Henderson Fund’s investment management fees.
The Trustees concluded that the management fees payable by each Janus Henderson Fund to the Adviser were reasonable in relation to the nature, extent, and quality of the services provided, taking into account the fees charged by other advisers for managing comparable mutual funds with similar strategies, the fees the Adviser charges to other clients, and, as applicable, the impact of fund performance on management fees payable by the Janus Henderson Funds. The Trustees also concluded that each Janus Henderson Fund’s total expenses were reasonable, taking into account the size of the Janus Henderson Fund, the quality of services provided by the Adviser, the investment performance of the Janus Henderson Fund, and any expense limitations agreed to or provided by the Adviser.
Economies of Scale
The Trustees considered information about the potential for the Adviser to realize economies of scale as the assets of the Janus Henderson Funds increase. They noted that their independent fee consultant published a report to the Trustees in June 2022 which provided its research and analysis into economies of scale. They also noted that, although many Janus Henderson Funds pay advisory fees at a fixed base rate as a percentage of net assets, without any breakpoints or performance fees, their independent fee consultant concluded that 75% of these Janus Henderson Funds’ have contractual management fees (gross of waivers) below their Broadridge Expense Group averages. The Trustees also noted the following from the independent fee consultant’s report: (1) that 31% of Janus Henderson Funds had management fee breakpoints in place whereby investors pay lower management fees as fund AUM increases; (2) that 29% of Janus Henderson Funds have low flat-rate fees and performance fees where the Adviser is incentivized to invest in resources which drive Janus Henderson Fund performance; and (3) that 39% of Janus Henderson Funds have low flat-rate fees versus peers where investors pay low fixed fees when the Janus Henderson Fund is small/midsized and higher fees when the Janus Henderson Fund grows in assets. The Trustees also noted that the Janus Henderson Funds share directly in economies of scale through the significant investments made by the Adviser and its affiliates related to services provided to the Funds and the lower charges of third-party service providers that are based in part on the combined scale of all of the Janus Henderson Funds.
The Trustees also considered the independent fee consultant’s conclusion that, given the limitations of various analytical approaches to economies of scale and their conflicting results, it is difficult to analytically confirm or deny the existence of economies of scale in the Janus Henderson complex. In this regard, the independent consultant concluded that (1) to the extent there were economies of scale at the Adviser, the Adviser’s general strategy of setting fixed management fees below peers appeared to share any such economies with investors even on smaller Janus Henderson Funds which have not yet achieved those economies and (2) by setting lower fixed fees from the start on these Janus Henderson Funds, the Adviser appeared to be investing to increase the likelihood that these Janus Henderson Funds will grow to a level to achieve any economies of scale that may exist. Further, the independent fee consultant provided its belief that Janus Henderson Fund investors are well-served by the fee levels and performance fee structures in place on the Janus Henderson Funds in light of any economies of scale that may be present at the Adviser.
Based on all of the information reviewed, including the recent and past research and analysis conducted by the Trustees’ independent fee consultant, the Trustees concluded that the current fee structure of each Janus Henderson Fund was reasonable and that the current rates of fees do reflect a sharing between the Adviser and the Janus
Janus Henderson Mid Cap Value Fund
Additional Information (unaudited)
Henderson Fund of any economies of scale that may be present at the current asset level of the Janus Henderson Fund.
Other Benefits to the Adviser
The Trustees also considered benefits that accrue to the Adviser and its affiliates from their relationships with the Janus Henderson Funds. They recognized that two affiliates of the Adviser separately serve the Janus Henderson Funds as transfer agent and distributor, respectively, and the transfer agent receives compensation directly from the non-money market Janus Henderson Funds for services provided, and that such compensation contributes to the overall profitability of the Adviser and its affiliates that results from their relationship with the Janus Henderson Funds. The Trustees also considered the Adviser’s past and proposed use of commissions paid by the Janus Henderson Funds on portfolio brokerage transactions to obtain proprietary and third-party research products and services benefiting the Janus Henderson Fund and/or other clients of the Adviser and/or the Adviser. The Trustees concluded that the Adviser’s use of these types of client commission arrangements to obtain proprietary and third-party research products and services was consistent with regulatory requirements and guidelines and was likely to benefit each Janus Henderson Fund. The Trustees also concluded that, other than the services provided by the Adviser and its affiliates pursuant to the agreements and the fees to be paid by each Janus Henderson Fund therefor, the Janus Henderson Funds and the Adviser may potentially benefit from their relationship with each other in other ways. They concluded that the Adviser and its affiliates share directly in economies of scale through the lower charges of third-party service providers that are based in part on the combined scale of the Janus Henderson Funds and other clients serviced by the Adviser and its affiliates. They also concluded that the Adviser benefits from the receipt of research products and services acquired through commissions paid on portfolio transactions of the Janus Henderson Funds and that the Janus Henderson Funds benefit from the Adviser’s receipt of those products and services as well as research products and services acquired through commissions paid by other clients of the Adviser. They further concluded that the success of any Janus Henderson Fund could attract other business to the Adviser or other Janus Henderson Funds, and that the success of the Adviser could enhance the Adviser’s ability to serve the Janus Henderson Funds.
Janus Henderson Mid Cap Value Fund
Liquidity Risk Management Program (unaudited)
Liquidity Risk Management Program
Rule 22e-4 under the Investment Company Act of 1940, as amended (the “Liquidity Rule”), requires open-end funds (but not money market funds) to adopt and implement a written liquidity risk management program (the “LRMP”) that is reasonably designed to assess and manage liquidity risk, which is the risk that a fund could not meet redemption requests without significant dilution of remaining investors’ interest in the fund. The Fund has implemented a LRMP, which incorporates the following elements: (i) assessment, management, and periodic review of liquidity risk; (ii) classification of portfolio holdings; (iii) the establishment and monitoring of a highly liquid investment minimum, as applicable; (iv) a 15% limitation on a Fund’s illiquid investments; (v) redemptions in-kind; and (vi) board oversight.
The Trustees of the Fund (the “Trustees”) have designated Janus Henderson Investors US LLC, the Fund’s investment adviser (the “Adviser”), as the Program Administrator for the LRMP responsible for administering the LRMP and carrying out the specific responsibilities of the LRMP. A working group comprised of various teams within the Adviser’s business is responsible for administering the LRMP and carrying out the specific responsibilities of different aspects of the LRMP (the “Liquidity Risk Working Group”). In assessing each Fund’s liquidity risk, the Liquidity Risk Working Group periodically considers, as relevant, factors including (i) the liquidity of a Fund’s portfolio investments during normal and reasonably foreseeable stressed conditions; (ii) whether a Fund’s investment strategy is appropriate for an open-end fund; (iii) the extent to which a Fund’s strategy involves a relatively concentrated portfolio or large positions in any issuer; (iv) a Fund’s use of borrowing for investment purposes; and (v) a Fund’s use of derivatives.
The Liquidity Rule requires the Trustees to review at least annually a written report provided by the Program Administrator that addresses the operation of the LRMP and assesses its adequacy and the effectiveness of its implementation, including, if applicable, the operation of the highly liquid investment minimum, and any material changes to the LRMP (the “Program Administrator Report”). At a meeting held on March 15, 2023, the Adviser provided the Program Administrator Report to the Trustees which covered the operation of the LRMP from January 1, 2022 through December 31, 2022 (the “Reporting Period”).
The Program Administrator Report discussed the operation and effectiveness of the LRMP during the Reporting Period. Among other things, the Program Administrator Report indicated that there were no material changes to the LRMP during the Reporting Period, although there were certain methodology adjustments implemented relating to a change in data provider. Additionally, the findings presented in the Program Administrator Report indicated that the LRMP operated adequately during the Reporting Period. These findings included that the Fund was able to meet redemptions during the normal course of business during the Reporting Period. The Program Administrator Report also stated that the Fund did not exceed the 15% limit on illiquid assets during the Reporting Period, that the Fund held primarily highly liquid assets, and was considered to be a primarily highly liquid fund during the Reporting Period. Also included among the Program Administrator Report’s findings was the determination that the Fund’s investment strategy remains appropriate for an open-end fund. In addition, the Adviser expressed its belief in the Program Administrator Report that the LRMP is reasonably designed and adequate to assess and manage the Fund’s liquidity risk, considering the Fund’s particular risks and circumstances, and includes policies and procedures reasonably designed to implement each required component of the Liquidity Rule.
There can be no assurance that the LRMP will achieve its objectives in the future. Please refer to your Fund’s prospectus for more information regarding the risks to which an investment in the Fund may be subject.
Janus Henderson Mid Cap Value Fund
Useful Information About Your Fund Report (unaudited)
Management Commentary
The Management Commentary in this report includes valuable insight as well as statistical information to help you understand how your Fund’s performance and characteristics stack up against those of comparable indices.
If the Fund invests in foreign securities, this report may include information about country exposure. Country exposure is based primarily on the country of risk. A company may be allocated to a country based on other factors such as location of the company’s principal office, the location of the principal trading market for the company’s securities, or the country where a majority of the company’s revenues are derived.
Please keep in mind that the opinions expressed in the Management Commentary are just that: opinions. They are a reflection based on best judgment at the time this report was compiled, which was June 30, 2023. As the investing environment changes, so could opinions. These views are unique and are not necessarily shared by fellow employees or by Janus Henderson in general.
Performance Overviews
Performance overview graphs compare the performance of a hypothetical $10,000 investment in the Fund with one or more widely used market indices. When comparing the performance of the Fund with an index, keep in mind that market indices are not available for investment and do not reflect deduction of expenses.
Average annual total returns are quoted for a Fund with more than one year of performance history. Average annual total return is calculated by taking the growth or decline in value of an investment over a period of time, including reinvestment of dividends and distributions, then calculating the annual compounded percentage rate that would have produced the same result had the rate of growth been constant throughout the period. Average annual total return does not reflect the deduction of taxes that a shareholder would pay on Fund distributions or redemptions of Fund shares.
Cumulative total returns are quoted for a Fund with less than one year of performance history. Cumulative total return is the growth or decline in value of an investment over time, independent of the period of time involved. Cumulative total return does not reflect the deduction of taxes that a shareholder would pay on Fund distributions or redemptions of Fund shares.
Pursuant to federal securities rules, expense ratios shown in the performance chart reflect subsidized (if applicable) and unsubsidized ratios. The total annual fund operating expenses ratio is gross of any fee waivers, reflecting the Fund’s unsubsidized expense ratio. The net annual fund operating expenses ratio (if applicable) includes contractual waivers of the Adviser and reflects the Fund’s subsidized expense ratio. Ratios may be higher or lower than those shown in the “Financial Highlights” in this report.
Schedule of Investments
Following the performance overview section is the Fund’s Schedule of Investments. This schedule reports the types of securities held in the Fund on the last day of the reporting period. Securities are usually listed by type (common stock, corporate bonds, U.S. Government obligations, etc.) and by industry classification (banking, communications, insurance, etc.). Holdings are subject to change without notice.
The value of each security is quoted as of the last day of the reporting period. The value of securities denominated in foreign currencies is converted into U.S. dollars.
If the Fund invests in foreign securities, it will also provide a summary of investments by country. This summary reports the Fund exposure to different countries by providing the percentage of securities invested in each country. The country of each security represents the country of risk. The Fund’s Schedule of Investments relies upon the industry group and country classifications published by Bloomberg and/or MSCI Inc.
Tables listing details of individual forward currency contracts, futures, written options, swaptions, and swaps follow the Fund’s Schedule of Investments (if applicable).
Statement of Assets and Liabilities
This statement is often referred to as the “balance sheet.” It lists the assets and liabilities of the Fund on the last day of the reporting period.
Janus Henderson Mid Cap Value Fund
Useful Information About Your Fund Report (unaudited)
The Fund’s assets are calculated by adding the value of the securities owned, the receivable for securities sold but not yet settled, the receivable for dividends declared but not yet received on securities owned, and the receivable for Fund shares sold to investors but not yet settled. The Fund’s liabilities include payables for securities purchased but not yet settled, Fund shares redeemed but not yet paid, and expenses owed but not yet paid. Additionally, there may be other assets and liabilities such as unrealized gain or loss on forward currency contracts.
The section entitled “Net Assets Consist of” breaks down the components of the Fund’s net assets. Because the Fund must distribute substantially all earnings, you will notice that a significant portion of net assets is shareholder capital.
The last section of this statement reports the net asset value (“NAV”) per share on the last day of the reporting period. The NAV is calculated by dividing the Fund’s net assets for each share class (assets minus liabilities) by the number of shares outstanding.
Statement of Operations
This statement details the Fund’s income, expenses, realized gains and losses on securities and currency transactions, and changes in unrealized appreciation or depreciation of Fund holdings.
The first section in this statement, entitled “Investment Income,” reports the dividends earned from securities and interest earned from interest-bearing securities in the Fund.
The next section reports the expenses incurred by the Fund, including the advisory fee paid to the investment adviser, transfer agent fees and expenses, and printing and postage for mailing statements, financial reports and prospectuses. Expense offsets and expense reimbursements, if any, are also shown.
The last section lists the amounts of realized gains or losses from investment and foreign currency transactions, and changes in unrealized appreciation or depreciation of investments and foreign currency-denominated assets and liabilities. The Fund will realize a gain (or loss) when it sells its position in a particular security. A change in unrealized gain (or loss) refers to the change in net appreciation or depreciation of the Fund during the reporting period. “Net Realized and Unrealized Gain/(Loss) on Investments” is affected both by changes in the market value of Fund holdings and by gains (or losses) realized during the reporting period.
Statements of Changes in Net Assets
These statements report the increase or decrease in the Fund’s net assets during the reporting period. Changes in the Fund’s net assets are attributable to investment operations, dividends and distributions to investors, and capital share transactions. This is important to investors because it shows exactly what caused the Fund’s net asset size to change during the period.
The first section summarizes the information from the Statement of Operations regarding changes in net assets due to the Fund’s investment operations. The Fund’s net assets may also change as a result of dividend and capital gains distributions to investors. If investors receive their dividends and/or distributions in cash, money is taken out of the Fund to pay the dividend and/or distribution. If investors reinvest their dividends and/or distributions, the Fund’s net assets will not be affected.
The reinvestment of dividends and distributions is included under “Capital Share Transactions.” “Capital Shares” refers to the money investors contribute to the Fund through purchases or withdrawals via redemptions. The Fund’s net assets will increase and decrease in value as investors purchase and redeem shares from the Fund.
Financial Highlights
This schedule provides a per-share breakdown of the components that affect the Fund’s NAV for current and past reporting periods as well as total return, asset size, ratios, and portfolio turnover rate.
The first line in the table reflects the NAV per share at the beginning of the reporting period. The next line reports the net investment income/(loss) per share. Following is the per share total of net gains/(losses), realized and unrealized. Per share dividends and distributions to investors are then subtracted to arrive at the NAV per share at the end of the period. The next line reflects the total return for the period. The total return may include adjustments in accordance with generally accepted accounting principles required at the period end for financial reporting purposes. As a result, the total return may differ from the total return reflected for individual shareholder transactions. Also included are ratios of expenses and net investment income to average net assets.
Janus Henderson Mid Cap Value Fund
Useful Information About Your Fund Report (unaudited)
The Fund’s expenses may be reduced through expense offsets and expense reimbursements. The ratios shown reflect expenses before and after any such offsets and reimbursements.
The ratio of net investment income/(loss) summarizes the income earned less expenses, divided by the average net assets of the Fund during the reporting period. Do not confuse this ratio with the Fund’s yield. The net investment income ratio is not a true measure of the Fund’s yield because it does not take into account the dividends distributed to the Fund’s investors.
The next figure is the portfolio turnover rate, which measures the buying and selling activity in the Fund. Portfolio turnover is affected by market conditions, changes in the asset size of the Fund, fluctuating volume of shareholder purchase and redemption orders, the nature of the Fund’s investments, and the investment style and/or outlook of the portfolio manager(s) and/or investment personnel. A 100% rate implies that an amount equal to the value of the entire portfolio was replaced once during the fiscal year; a 50% rate means that an amount equal to the value of half the portfolio is traded in a year; and a 200% rate means that an amount equal to the value of the entire portfolio is traded every six months.
Janus Henderson Mid Cap Value Fund
Designation Requirements (unaudited)
For federal income tax purposes, the Fund designated the following for the year ended June 30, 2023:
| | |
| | |
Section 163(j) Interest Dividend | 3% |
Capital Gain Distributions | $108,435,451 |
Dividends Received Deduction Percentage | 100% |
Qualified Dividend Income Percentage | 100% |
Janus Henderson Mid Cap Value Fund
Trustees and Officers (unaudited)
The following are the Trustees and officers of the Trust, together with a brief description of their principal occupations during the last five years (principal occupations for certain Trustees may include periods over five years). The Fund’s Statement of Additional Information includes additional information about the Trustees and officers and is available, without charge, by calling 1-877-335-2687.
Each Trustee has served in that capacity since he or she was originally elected or appointed. The Trustees do not serve a specified term of office. Each Trustee will hold office until the termination of the Trust or his or her earlier death, resignation, retirement, incapacity, or removal. Under the Fund’s Governance Procedures and Guidelines, the policy is for Trustees to retire no later than the end of the calendar year in which the Trustee turns 75. The Trustees review the Fund’s Governance Procedures and Guidelines from time to time and may make changes they deem appropriate. The Fund’s Nominating and Governance Committee will consider nominees for the position of Trustee recommended by shareholders. Shareholders may submit the name of a candidate for consideration by the Committee by submitting their recommendations to the Trust’s Secretary. Each Trustee is currently a Trustee of one other registered investment company advised by the Adviser: Janus Aspen Series. Collectively, these two registered investment companies consist of 49 series or funds referred to herein as the Fund Complex.
The Trust’s officers are elected annually by the Trustees for a one-year term. Certain officers also serve as officers of Janus Aspen Series. Certain officers of the Fund may also be officers and/or directors of the Adviser. Except as otherwise disclosed, Fund officers receive no compensation from the Fund, except for the Fund’s Chief Compliance Officer, as authorized by the Trustees.
| | | | | | |
TRUSTEES |
Name, Address, and Age | Positions Held with the Trust | Length of Time Served | Principal Occupations During the Past Five Years | Number of Portfolios/Funds in Fund Complex Overseen by Trustee | Other Directorships Held by Trustee During the Past Five Years |
Independent Trustees | | | | |
Alan A. Brown
151 Detroit Street
Denver, CO 80206
DOB: 1962 | Chairman
Trustee | 5/22-Present
1/13-Present | Principal, Curam Holdings LLC (since 2018). Formerly, Executive Vice President, Institutional Markets, of Black Creek Group (private equity real estate investment management firm) (2012-2018), Executive Vice President and Co-Head, Global Private Client Group (2007-2010), Executive Vice President, Mutual Funds (2005-2007), and Chief Marketing Officer (2001-2005) of Nuveen Investments, Inc. (asset management). | 49 | Advisory Board Member of AEW Core Property Trust (open-end property fund) (since 2020), and Director of WTTW (PBS affiliate) (since 2003). Formerly, Director of MotiveQuest LLC (strategic social market research company) (2003-2016), Director of Nuveen Global Investors LLC (2007-2011), Director of Communities in Schools (2004-2010), and Director of Mutual Fund Education Alliance (until 2010). |
Janus Henderson Mid Cap Value Fund
Trustees and Officers (unaudited)
| | | | | | |
TRUSTEES |
Name, Address, and Age | Positions Held with the Trust | Length of Time Served | Principal Occupations During the Past Five Years | Number of Portfolios/Funds in Fund Complex Overseen by Trustee | Other Directorships Held by Trustee During the Past Five Years |
Independent Trustees | | | | |
Cheryl D. Alston
151 Detroit Street
Denver, CO 80206
DOB: 1966 | Trustee | 8/22-Present | Executive Director and Chief Investment Officer, Employees’ Retirement Fund of the City of Dallas (since 2004). | 49 | Director of Blue Cross Blue Shield of Kansas City (a not-for-profit health insurance provider) (since 2016) and Director of Global Life Insurance (life and supplemental health insurance provider) (since 2017). Formerly, Director of Federal Home Loan Bank of Dallas (2017-2021). |
Janus Henderson Mid Cap Value Fund
Trustees and Officers (unaudited)
| | | | | | |
TRUSTEES |
Name, Address, and Age | Positions Held with the Trust | Length of Time Served | Principal Occupations During the Past Five Years | Number of Portfolios/Funds in Fund Complex Overseen by Trustee | Other Directorships Held by Trustee During the Past Five Years |
Independent Trustees | | | | |
Janus Henderson Mid Cap Value Fund
Trustees and Officers (unaudited)
| | | | | | |
William D. Cvengros
151 Detroit Street
Denver, CO 80206
DOB: 1948 | Trustee | 1/11-Present | Chief Executive Officer of SJC Capital, LLC (a personal investment company and consulting firm) (since 2002). Formerly, Chief Executive Officer and President of PIMCO Advisors Holdings L.P. (a publicly traded investment management firm) (1994-2000), and Chief Investment Officer (1987-1994) and Vice Chairman and Director (1990-1994) of Pacific Life Insurance Company (a mutual life insurance and annuity company) (1987-1994). | 49 | Member, Limited Partner Advisory Committee, Karmel Capital Fund III (later stage growth fund) (since 2022), Member of the Investment Committee for the Orange County Community Foundation (a grantmaking foundation) (since 2020), Advisory Board Member, RevOZ Fund LP and related funds (real estate investments for opportunity zones) (since 2020), and Advisory Board Member, Innovate Partners Emerging Growth and Equity Fund I (early stage venture capital fund) (since 2014). Formerly, Managing Trustee of National Retirement Partners Liquidating Trust (2013-2016), Chairman, National Retirement Partners, Inc. (formerly a network of advisors to 401(k) plans) (2005-2013), Director of Prospect Acquisition Corp. (a special purpose acquisition corporation) (2007-2009), Director of RemedyTemp, Inc. (temporary help services company) (1996-2006), and Trustee of PIMCO Funds Multi-Manager Series (1990-2000) and Pacific Life Variable Life & Annuity Trusts (1987-1994). |
Janus Henderson Mid Cap Value Fund
Trustees and Officers (unaudited)
| | | | | | |
TRUSTEES |
Name, Address, and Age | Positions Held with the Trust | Length of Time Served | Principal Occupations During the Past Five Years | Number of Portfolios/Funds in Fund Complex Overseen by Trustee | Other Directorships Held by Trustee During the Past Five Years |
Independent Trustees | | | | |
Raudline Etienne
151 Detroit Street
Denver, CO 80206
DOB: 1965 | Trustee | 6/16-Present | Founder, Daraja Capital (advisory and investment firm) (since 2016). Formerly, Senior Vice President and Senior Advisor, Albright Stonebridge Group LLC (global strategy firm) (2011-2021), and Deputy Comptroller and Chief Investment Officer, New York State Common Retirement Fund (public pension fund) (2008-2011). | 49 | Member of the Investment Committee for Cooper Union (private college) (since 2021) and Director of Brightwood Capital Advisors, LLC (since 2014). Formerly, Board Member, Van Alen Institute (nonprofit architectural and design organization) (2019-2022). |
Darrell B. Jackson
151 Detroit Street
Denver, CO 80206
DOB: 1958 | Trustee | 8/22-Present | President and Chief Executive Officer, The Efficace Group Inc. (since 2018). Formerly, President and Chief Executive Officer, Seaway Bank and Trust Company (community bank) (2014-2015), and Executive Vice President and Co-President, Wealth Management (2009-2014), and several senior positions, including Group Executive, Senior Vice President, and Vice President (1995-2009) of Northern Trust Company (financial services company) (1995-2014). | 49 | Director of Amalgamated Financial Corp (bank) (since August 2021), Director of YR Media (a not-for-profit production company) (since 2021), and Director of Gray-Bowen-Scott (transportation project consulting firm) (since April 2020). Formerly, Director of Delaware Place Bank (closely held commercial bank) (2016-2018) and Director of Seaway Bank and Trust Company (2014-2015). |
Janus Henderson Mid Cap Value Fund
Trustees and Officers (unaudited)
| | | | | | |
TRUSTEES |
Name, Address, and Age | Positions Held with the Trust | Length of Time Served | Principal Occupations During the Past Five Years | Number of Portfolios/Funds in Fund Complex Overseen by Trustee | Other Directorships Held by Trustee During the Past Five Years |
Independent Trustees | | | | |
William F. McCalpin
151 Detroit Street
Denver, CO 80206
DOB: 1957 | Trustee | 6/02-Present | Chief Executive Officer, muun chi LLC (organic food business) (since 2022) and Independent Consultant (since 2019). Formerly, Chief Operating Officer, muun chi LLC (2020-2022), Managing Partner, Impact Investments, Athena Capital Advisors LLC (independent registered investment advisor) (2016-2019), Managing Director, Holos Consulting LLC (provides consulting services to foundations and other nonprofit organizations) (2009-2016), Chief Executive Officer, Imprint Capital Advisors (impact investment firm) (2013-2015), and Executive Vice President and Chief Operating Officer of The Rockefeller Brothers Fund (a private family foundation) (1998-2006). | 49 | Chairman of the Board and Trustee of The Investment Fund for Foundations Investment Program (TIP) (consisting of 1 fund) (since 2008). Formerly, Director of the F.B. Heron Foundation (a private grantmaking foundation) (2006-2022), and Director of Mutual Fund Directors Forum (a non-profit organization serving independent directors of U.S. mutual funds) (2016-2021). |
Janus Henderson Mid Cap Value Fund
Trustees and Officers (unaudited)
| | | | | | |
TRUSTEES |
Name, Address, and Age | Positions Held with the Trust | Length of Time Served | Principal Occupations During the Past Five Years | Number of Portfolios/Funds in Fund Complex Overseen by Trustee | Other Directorships Held by Trustee During the Past Five Years |
Independent Trustees | | | | |
Gary A. Poliner
151 Detroit Street
Denver, CO 80206
DOB: 1953 | Trustee | 6/16-Present | Retired. Formerly, President (2010-2013) of Northwestern Mutual Life Insurance Company. | 49 | Director of MGIC Investment Corporation (private mortgage insurance) (since 2013). Formerly, Director, West Bend Mutual Insurance Company (property/casualty insurance) (2013-2021), Trustee of Northwestern Mutual Life Insurance Company (2010-2013) and Director of Frank Russell Company (global asset management firm) (2008-2013). |
Diane L. Wallace
151 Detroit Street
Denver, CO 80206
DOB: 1958 | Trustee | 6/17-Present | Retired. Formerly, Chief Operating Officer, Senior Vice President-Operations, and Chief Financial Officer for Driehaus Capital Management, LLC (1988-2006) and Treasurer for Driehaus Mutual Funds (1996-2002). | 49 | Formerly, Director of Family Service of Lake County (2019-2021), Independent Trustee, Henderson Global Funds (13 portfolios) (2015-2017), Independent Trustee, State Farm Associates’ Funds Trust, State Farm Mutual Fund Trust, and State Farm Variable Product Trust (28 portfolios) (2013-2017). |
Janus Henderson Mid Cap Value Fund
Trustees and Officers (unaudited)
| | | | |
OFFICERS |
Name, Address, and Age | Positions Held with the Trust | Term of Office* and Length of Time Served | Principal Occupations During the Past Five Years |
Kevin Preloger
151 Detroit Street
Denver, CO 80206
DOB: 1975 | Executive Vice President and Co-Portfolio Manager
Janus Henderson Mid Cap Value Fund | 4/13-Present | Portfolio Manager for other Janus Henderson accounts. |
Justin Tugman
151 Detroit Street
Denver, CO 80206
DOB: 1973 | Executive Vice President and Co-Portfolio Manager
Janus Henderson Mid Cap Value Fund | 3/15-Present | Portfolio Manager for other Janus Henderson accounts. |
Michelle Rosenberg
151 Detroit Street
Denver, CO 80206
DOB: 1973 | President and Chief Executive Officer | 9/22-Present | General Counsel and Corporate Secretary of Janus Henderson Investors (since 2018). Formerly, Interim President and Chief Executive Officer of the Trust and Janus Aspen Series (2022), Senior Vice President and Head of Legal, North America of Janus Henderson Investors (2017-2018) and Deputy General Counsel of Janus Henderson US (Holdings) Inc. (2015-2018). |
Kristin Mariani
151 Detroit Street
Denver, CO 80206
DOB: 1966 | Vice President and Chief Compliance Officer | 7/20-Present | Head of Compliance, North America at Janus Henderson Investors (since September 2020) and Chief Compliance Officer at Janus Henderson Investors US LLC (since September 2017). Formerly, Anti-Money Laundering Officer for the Trust and Janus Aspen Series (July 2020-December 2022), Global Head of Investment Management Compliance at Janus Henderson Investors (February 2019-August 2020), Vice President, Head of Global Distribution Compliance and Chief Compliance Officer at Janus Henderson Distributors US LLC (May 2017-September 2017), Vice President, Compliance at Janus Henderson US (Holdings) Inc., Janus Henderson Investors US LLC, and Janus Henderson Distributors US LLC (2009-2017). |
Janus Henderson Mid Cap Value Fund
Trustees and Officers (unaudited)
| | | | |
OFFICERS |
Name, Address, and Age | Positions Held with the Trust | Term of Office* and Length of Time Served | Principal Occupations During the Past Five Years |
Jesper Nergaard
151 Detroit Street
Denver, CO 80206
DOB: 1962 | Chief Financial Officer
Vice President, Treasurer, and Principal Accounting Officer | 3/05-Present
2/05-Present | Head of U.S. Fund Administration, Janus Henderson Investors and Janus Henderson Services US LLC. |
Abigail J. Murray
151 Detroit Street
Denver, CO 80206
DOB: 1975 | Vice President, Chief Legal Counsel, and Secretary | 12/20-Present | Managing Counsel (since 2020). Formerly, Senior Counsel for Invesco Ltd. (2017-2020), and Vice President and Senior Counsel, ALPS Fund Services, Inc. and Assistant General Counsel, ALPS Advisors, Inc. (2015-2017). |
Ciaran Askin
151 Detroit Street
Denver, CO 80206
DOB: 1978 | Anti-Money Laundering Officer | 12/22-Present | Global Head of Financial Crime, Janus Henderson Investors (since 2022). Formerly, Global Head of Financial Crime for Invesco Ltd. (2017-2022). |
* Officers are elected at least annually by the Trustees for a one-year term and may also be elected from time to time by the Trustees for an interim period. |
Janus Henderson Mid Cap Value Fund
Notes
NotesPage1
Janus Henderson Mid Cap Value Fund
Notes
NotesPage2
Janus Henderson Mid Cap Value Fund
Notes
NotesPage3
| | | | | | | | |
| | | | | |

| | | | |
This report is submitted for the general information of shareholders of the Fund. It is not an offer or solicitation for the Fund and is not authorized for distribution to prospective investors unless preceded or accompanied by an effective prospectus. |
Janus Henderson is a trademark of Janus Henderson Group plc or one of its subsidiaries. © Janus Henderson Group plc Janus Henderson Distributors US LLC Janus Henderson Group is the ultimate parent of Janus Henderson Distributors US LLC |
| | | | 125-02-93032 08-23 |
| | | |
| | | |
| | | ANNUAL REPORT June 30, 2023 |
| | |
| | Janus Henderson Money Market Fund |
| | |
| | Janus Investment Fund |
| |
Table of Contents
Janus Henderson Money Market Fund
Important Notice - Tailored Shareholder Reports
Effective January 24, 2023, the Securities and Exchange Commission (the “SEC”) adopted rule and form amendments that require mutual funds and exchange-traded funds to provide shareholders with streamlined annual and semi-annual shareholder reports that highlight key information. Other information, including financial statements, that currently appears in shareholder reports will be made available online, delivered free of charge to shareholders upon request, and filed with the SEC. The first tailored shareholder report for the Fund will be for the reporting period ending June 30, 2024. Currently, management is evaluating the impact of the rule and form amendments on the content of the Fund’s current shareholder reports.
Janus Henderson Money Market Fund (unaudited)
Performance
| | | | | | |
| | | | 
Vincent Ahn co-portfolio manager | 
Garrett Strum co-portfolio manager |
| | | |
| | | | | | | | | |
Average Annual Total Return | | | | | Seven-Day Current Yield | |
For the periods ended June 30, 2023 | | | | | | Class D Shares | | |
Class D Shares | | | | | | With Reimbursement | 4.64% | |
1 Year | 3.36% | | | | | Without Reimbursement | 4.64% | |
5 Year | 1.24% | | | | | Class T Shares | | |
10 Year | 0.72% | | | | | With Reimbursement | 4.62% | |
Since Inception (February 14, 1995) | 2.08% | | | | | Without Reimbursement | 4.62% | |
Class T Shares | | | | | | Prospectus Expense Ratios | |
1 Year | 3.34% | | | | | Class D Shares | | |
5 Year | 1.22% | | | | | Total Annual Fund Operating Expenses‡ | 0.57% | |
10 Year | 0.70% | | | | | Class T Shares | | |
Since Inception (February 14, 1995) | 2.07% | | | | | Total Annual Fund Operating Expenses‡ | 0.58% | |
| | | | | | | | |
| | | | | | | | |
Returns quoted are past performance and do not guarantee future results; current performance may be lower or higher. For the most recent month-end performance call 800.668.0434 (or 800.525.3713 if you hold shares directly with Janus Henderson) or visit janushenderson.com/performance (or janushenderson.com/allfunds if you hold shares directly with Janus Henderson).
You could lose money by investing in the Fund. Although the Fund seeks to preserve the value of your investment at $1.00 per share, it cannot guarantee it will do so. The Fund may impose a fee upon the sale of your shares or may temporarily suspend your ability to sell shares if the Fund’s liquidity falls below required minimums because of market conditions or other factors. An investment in the Fund is not insured or guaranteed by the Federal Deposit Insurance Corporation or any other government agency. The Fund’s sponsor has no legal obligation to provide financial support to the Fund, and you should not expect that the sponsor will provide financial support to the Fund at any time.
Returns include reinvestment of all dividends and distributions.
The yield more closely reflects the current earnings of the money market fund than the total return.
Class D Shares of the Fund commenced operations on February 16, 2010. Performance shown for periods prior to February 16, 2010, reflects the performance of the Fund’s former Class J Shares, the initial share class (renamed Class T Shares effective February 16, 2010), calculated using the fees and expenses in effect during the periods shown, net of any applicable fee and expense limitations or waivers.
If Class D Shares of the Fund had been available during periods prior to February 16, 2010, the performance shown may have been different. The performance shown for periods following the Fund’s commencement of Class D Shares reflects the fees and expenses of Class D Shares, net of any applicable fee and expense limitations or waivers. Please refer to the Fund’s prospectuses for further details concerning historical performance.
See Notes to Schedule of Investments and Other Information and Notes to Financial Statements.
See “Useful Information About Your Fund Report.”
‡ As stated in the prospectus. See Financial Highlights for actual expense ratios during the reporting period.
Janus Henderson Money Market Fund (unaudited)
Expense Examples
As a shareholder of the Fund, you incur two types of costs: (1) transaction costs and (2) ongoing costs, including management fees; transfer agent fees and expenses payable pursuant to the Transfer Agency Agreement; and other Fund expenses. This example is intended to help you understand your ongoing costs (in dollars) of investing in the Fund and to compare these costs with the ongoing costs of investing in other mutual funds. To do so, compare this 5% hypothetical example with the 5% hypothetical examples that appear in the shareholder reports of the other funds. The example is based upon an investment of $1,000 invested at the beginning of the period and held for the six-months indicated, unless noted otherwise in the table and footnotes below.
Actual Expenses
The information in the table under the heading “Actual” provides information about actual account values and actual expenses. You may use the information in these columns, together with the amount you invested, to estimate the expenses that you paid over the period. Simply divide your account value by $1,000 (for example, an $8,600 account value divided by $1,000 = 8.6), then multiply the result by the number in the appropriate column for your share class under the heading entitled “Expenses Paid During Period” to estimate the expenses you paid on your account during the period.
Hypothetical Example for Comparison Purposes
The information in the table under the heading “Hypothetical (5% return before expenses)” provides information about hypothetical account values and hypothetical expenses based upon the Fund’s actual expense ratio and an assumed rate of return of 5% per year before expenses, which is not the Fund’s actual return. The hypothetical account values and expenses may not be used to estimate the actual ending account balance or expenses you paid for the period. You may use this information to compare the ongoing costs of investing in the Fund and other funds. To do so, compare this 5% hypothetical example with the 5% hypothetical examples that appear in the shareholder reports of the other funds. Additionally, for an analysis of the fees associated with an investment in either share class or other similar funds, please visit www.finra.org/fundanalyzer.
Please note that the expenses shown in the table are meant to highlight your ongoing costs only and do not reflect any transaction costs. These fees are fully described in the Fund’s prospectuses. Therefore, the hypothetical examples are useful in comparing ongoing costs only, and will not help you determine the relative total costs of owning different funds. In addition, if these transaction costs were included, your costs would have been higher.
| | | | | | | | | | | |
| | | | | | | | |
| | | Actual | | Hypothetical
(5% return before expenses) | |
| Beginning
Account
Value
(1/1/23) | Ending
Account
Value
(6/30/23) | Expenses
Paid During
Period
(1/1/23 - 6/30/23)† | | Beginning
Account
Value
(1/1/23) | Ending
Account
Value
(6/30/23) | Expenses
Paid During
Period
(1/1/23 - 6/30/23)† | Net Annualized
Expense Ratio
(1/1/23 - 6/30/23) |
Class D Shares | $1,000.00 | $1,000.00 | $2.83 | | $1,000.00 | $1,021.97 | $2.86 | 0.57% |
Class T Shares | $1,000.00 | $1,000.00 | $2.93 | | $1,000.00 | $1,021.87 | $2.96 | 0.59% |
† | Expenses Paid During Period are equal to the Net Annualized Expense Ratio multiplied by the average account value over the period, multiplied by 181/365 (to reflect the one-half year period). Expenses in the examples include the effect of applicable fee waivers and/or expense reimbursements, if any. Had such waivers and/or reimbursements not been in effect, your expenses would have been higher. Please refer to the Notes to Financial Statements or the Fund’s prospectuses for more information regarding waivers and/or reimbursements. |
Janus Henderson Money Market Fund
Schedule of Investments
June 30, 2023
| | | | | | | | |
Principal Amounts
| | | Value | |
Certificates of Deposit– 6.2% | | | |
| | Bank of Montreal/Chicago IL, 5.4400%, 9/19/23 | | $10,000,000 | | | $10,000,021 | |
| | MUFG Bank Ltd/New York NY, 5.1800%, 7/19/23 | | 20,000,000 | | | 20,000,000 | |
| | Royal Bank of Canada/New York NY, 4.0800%, 8/4/23 | | 5,700,000 | | | 5,692,794 | |
| | Standard Chartered Bank/New York, 5.3900%, 7/14/23 | | 8,135,000 | | | 8,135,059 | |
| | Swedbank AB/New York, 4.9900%, 7/20/23 | | 10,000,000 | | | 9,998,548 | |
| | Toronto-Dominion Bank/New York, 4.3500%, 9/13/23 | | 17,208,000 | | | 17,164,849 | |
Total Certificates of Deposit (cost $70,991,271) | | 70,991,271 | |
Commercial Paper– 30.6% | | | |
| | Atlantic Asset Securitization LLC, 5.2683%, 7/18/23 (Section 4(2)) | | 25,000,000 | | | 24,947,307 | |
| | Atlantic Asset Securitization LLC, 5.4278%, 7/21/23 (Section 4(2)) | | 15,000,000 | | | 14,960,952 | |
| | Atlantic Asset Securitization LLC, 5.4533%, 8/7/23 (Section 4(2)) | | 10,000,000 | | | 9,949,213 | |
| | Bank of Montreal, 5.5843%, 7/24/23 | | 10,000,000 | | | 9,968,785 | |
| | Bank of Montreal, 5.5674%, 8/1/23 | | 20,000,000 | | | 19,914,092 | |
| | Cooperatieve Rabobank UA/NY, 5.2147%, 9/11/23 | | 15,000,000 | | | 14,854,479 | |
| | Manhattan Asset Funding Co LLC, 5.4489%, 7/12/23 (Section 4(2)) | | 15,000,000 | | | 14,980,389 | |
| | Manhattan Asset Funding Co LLC, 5.4381%, 7/13/23 (Section 4(2)) | | 10,000,000 | | | 9,985,503 | |
| | Manhattan Asset Funding Co LLC, 5.4856%, 7/28/23 (Section 4(2)) | | 25,000,000 | | | 24,908,721 | |
| | National Bank of Canada, 5.3519%, 7/10/23 (Section 4(2)) | | 10,000,000 | | | 9,990,007 | |
| | National Bank of Canada, 5.4491%, 8/21/23 (Section 4(2)) | | 20,000,000 | | | 19,858,049 | |
| | National Bank of Canada, 5.4515%, 9/1/23 (Section 4(2)) | | 20,000,000 | | | 19,826,245 | |
| | Nieuw Amsterdam Receivables Corp BV, 5.2532%, 7/6/23 (Section 4(2)) | | 15,000,000 | | | 14,993,690 | |
| | Nieuw Amsterdam Receivables Corp BV, 5.2684%, 7/7/23 (Section 4(2)) | | 15,000,000 | | | 14,991,563 | |
| | Nieuw Amsterdam Receivables Corp BV, 5.5462%, 8/16/23 (Section 4(2)) | | 20,000,000 | | | 19,870,281 | |
| | Skandinaviska Enskilda Banken AB, 5.5698%, 9/6/23 (Section 4(2)) | | 20,000,000 | | | 19,807,880 | |
| | Svenska Handelsbanken AB, 5.1793%, 7/13/23 (Section 4(2)) | | 22,000,000 | | | 21,969,585 | |
| | Swedbank AB, 5.3427%, 7/5/23 | | 15,000,000 | | | 14,995,723 | |
| | Swedbank AB, 5.2572%, 7/28/23 | | 10,000,000 | | | 9,964,968 | |
| | Swedbank AB, 5.5911%, 9/5/23 | | 10,000,000 | | | 9,905,061 | |
| | Victory Receivables Corp, 5.3840%, 7/5/23 (Section 4(2)) | | 15,000,000 | | | 14,995,691 | |
| | Victory Receivables Corp, 5.3939%, 7/7/23 | | 15,000,000 | | | 14,991,367 | |
Total Commercial Paper (cost $350,629,549) | | 350,629,551 | |
U.S. Government Agency Notes– 6.9% | | | |
Federal Home Loan Bank Discount Notes: | | | |
| | 4.9771%, 7/3/23 | | 10,000,000 | | | 10,000,000 | |
| | 5.2075%, 7/11/23 | | 10,000,000 | | | 9,988,725 | |
| | 5.0796%, 7/21/23 | | 10,000,000 | | | 9,975,257 | |
| | 5.1671%, 7/25/23 | | 10,000,000 | | | 9,969,259 | |
| | 5.0472%, 8/1/23 | | 10,000,000 | | | 9,960,413 | |
| | 5.3233%, 8/16/23 | | 10,000,000 | | | 9,936,811 | |
| | 5.3099%, 8/23/23 | | 10,000,000 | | | 9,926,974 | |
| | 5.4059%, 9/1/23 | | 10,000,000 | | | 9,912,635 | |
Total U.S. Government Agency Notes (cost $79,670,075) | | 79,670,074 | |
U.S. Treasury Debt– 2.6% | | | |
| | United States Treasury Bill, 5.4840%, 8/15/23 | | 10,000,000 | | | 9,940,565 | |
| | United States Treasury Bill, 5.8198%, 8/24/23 | | 10,000,000 | | | 9,927,004 | |
| | United States Treasury Bill, 5.8399%, 9/7/23 | | 10,000,000 | | | 9,905,259 | |
Total U.S. Treasury Debt (cost $29,772,829) | | 29,772,828 | |
Variable Rate Demand Notes¶– 14.9% | | | |
| | Alper Drive Apts LLC (LOC: The Northern Trust Company), 5.2400%, 8/1/61 | | 11,000,000 | | | 11,000,000 | |
| | Bellevue 10 Apartments LLC (LOC: The Northern Trust Company), | | | | | | |
| | 5.2400%, 4/1/60 | | 3,450,000 | | | 3,450,000 | |
| | Breckenridge Terrace LLC (LOC: Bank of America NA), 5.2900%, 5/2/39 | | 14,980,000 | | | 14,980,000 | |
| | Breckenridge Terrace LLC (LOC: Bank of America NA), 5.2900%, 5/2/39 | | 4,000,000 | | | 4,000,000 | |
| | Cellmark Inc (LOC: Swedbank AB NY), 5.1200%, 6/1/38 | | 10,000,000 | | | 10,000,000 | |
| | CG-USA Simi Valley LP (LOC: FHLB of San Francisco), 5.2100%, 10/1/60 | | 6,900,000 | | | 6,900,000 | |
| | County of Eagle CO (LOC: Bank of America NA), 5.2900%, 6/1/27 | | 9,100,000 | | | 9,100,000 | |
| | County of Eagle CO (LOC: Bank of America NA), 5.2900%, 5/2/39 | | 8,000,000 | | | 8,000,000 | |
| | Dorfman 2020 Family Trust (LOC: FHLB of Dallas), 5.1200%, 8/1/40 | | 5,285,000 | | | 5,285,000 | |
| | Drummond Family Life Insurance LLC (LOC: FHLB of Dallas), 5.2000%, 6/1/72 | | 14,575,000 | | | 14,575,000 | |
| | |
See Notes to Schedule of Investments and Other Information and Notes to Financial Statements. |
| |
Janus Investment Fund | 3 |
Janus Henderson Money Market Fund
Schedule of Investments
June 30, 2023
| | | | | | | | |
Principal Amounts
| | | Value | |
Variable Rate Demand Notes¶– (continued) | | | |
| | Encinitas Senior Living LP (LOC: FHLB of San Francisco), 5.2100%, 8/1/59 | | $3,370,000 | | | $3,370,000 | |
| | Griffin-Spalding County Development Authority (LOC: Bank of America NA), | | | | | | |
| | 5.1200%, 8/1/28 | | 3,750,000 | | | 3,750,000 | |
| | Jefferson Centerpointe LLC (LOC: FHLB of San Francisco), 5.2100%, 12/1/60 | | 22,285,000 | | | 22,285,000 | |
| | Lodi LV Loca LP (LOC: FHLB of San Francisco), 5.2100%, 8/1/59 | | 13,500,000 | | | 13,500,000 | |
| | Michael Dennis Sullivan Irrevocable Trust (LOC: Wells Fargo Bank NA), | | | | | | |
| | 5.1200%, 11/1/39 | | 11,375,000 | | | 11,375,000 | |
| | Mississippi Business Finance Corp (LOC: FHLB of Dallas), 5.2600%, 12/1/42 | | 9,615,000 | | | 9,615,000 | |
| | Phoenix Realty Special Account-U LP (LOC: The Northern Trust Company), | | | | | | |
| | 5.3900%, 4/1/25 | | 1,675,000 | | | 1,675,000 | |
| | Rieber Life Insurance Trust/The (LOC: FHLB of Dallas), 5.1200%, 5/1/42 | | 11,645,000 | | | 11,645,000 | |
| | Tenderfoot Seasonal Housing LLC (LOC: Bank of America NA), 5.2900%, 7/2/35 | | 5,700,000 | | | 5,700,000 | |
Total Variable Rate Demand Notes (cost $170,205,000) | | 170,205,000 | |
Repurchase Agreementsë– 34.6% | | | |
| | Credit Agricole, New York, Joint repurchase agreement, 5.0000%, dated 6/30/23, maturing 7/3/23 to be repurchased at $5,002,083 collateralized by $5,814,450 in U.S. Treasuries 1.2500%, 3/31/28 with a value of $5,100,016 | | 5,000,000 | | | 5,000,000 | |
| | Goldman Sachs & Co, Joint repurchase agreement, 4.9200%, dated 6/30/23, maturing 7/3/23 to be repurchased at $65,026,650 collateralized by $54,955,896 in U.S. Government Agencies 2.7500% - 6.5000%, 8/15/24 - 1/15/58 and $19,035,283 in U.S. Treasuries 1.1250% - 1.5000%, 2/15/25 - 8/15/50 with a value of $66,300,000 | | 65,000,000 | | | 65,000,000 | |
| | HSBC Securities (USA) Inc, Joint repurchase agreement, 5.0000%, dated 6/30/23, maturing 7/3/23 to be repurchased at $25,010,417 collateralized by $26,856,333 in U.S. Treasuries 1.5000%, 2/15/25 with a value of $25,500,006 | | 25,000,000 | | | 25,000,000 | |
| | ING Financial Markets LLC, Joint repurchase agreement, 5.0500%, dated 6/30/23, maturing 7/3/23 to be repurchased at $85,035,771 collateralized by $92,647,180 in U.S. Treasuries 0% - 4.3750%, 8/15/23 - 11/15/52 with a value of $86,736,487 | | 85,000,000 | | | 85,000,000 | |
| | ING Financial Markets LLC, Joint repurchase agreement, 5.0500%, dated 6/30/23, maturing 7/3/23 to be repurchased at $70,029,458 collateralized by $76,467,557 in U.S. Government Agencies 1.5000% - 8.0000%, 3/1/27 - 2/1/57 with a value of $71,430,048 | | 70,000,000 | | | 70,000,000 | |
| | Royal Bank of Canada, NY Branch, Joint repurchase agreement, 4.9900%, dated 6/30/23, maturing 7/3/23 to be repurchased at $10,004,158 collateralized by $10,942,820 in U.S. Treasuries 2.2500% - 5.4177%, 1/31/24 - 8/15/27 with a value of $10,204,242 | | 10,000,000 | | | 10,000,000 | |
| | Royal Bank of Canada, NY Branch, Joint repurchase agreement, 5.0000%, dated 6/30/23, maturing 7/3/23 to be repurchased at $136,756,958 collateralized by $36,770,127 in U.S. Government Agencies 5.9163% - 7.0000%, 5/20/53 and $102,050,976 in U.S. Treasuries 0.5000% - 4.1250%, 3/31/25 - 11/15/32 with a value of $139,492,111 | | 136,700,000 | | | 136,700,000 | |
Total Repurchase Agreements (cost $396,700,000) | | 396,700,000 | |
Time Deposits– 4.4% | | | |
| | Credit Agricole, 5.0500%, 7/3/23((cost $50,000,000) | | 50,000,000 | | | 50,000,000 | |
Total Investments (total cost $1,147,968,724) – 100.2% | | 1,147,968,724 | |
Liabilities, net of Cash, Receivables and Other Assets – (0.2)% | | (2,849,906) | |
Net Assets – 100% | | $1,145,118,818 | |
| | |
See Notes to Schedule of Investments and Other Information and Notes to Financial Statements. |
| |
4 | JUNE 30, 2023 |
Janus Henderson Money Market Fund
Schedule of Investments
June 30, 2023
| | | | | | | | | | |
Offsetting of Financial Assets and Derivative Assets |
| |
| | | Gross Amounts | | | | | | |
| | | of Recognized | | Offsetting Asset | | Collateral | | |
Counterparty | | Assets | | or Liability(a) | | Pledged(b) | | Net Amount |
| | | | | | | | | |
Credit Agricole, New York | $ | 5,000,000 | $ | — | $ | (5,000,000) | $ | — |
Goldman Sachs & Co | | 65,000,000 | | — | | (65,000,000) | | — |
HSBC Securities (USA), Inc | | 25,000,000 | | — | | (25,000,000) | | — |
ING Financial Markets LLC | | 155,000,000 | | — | | (155,000,000) | | — |
Royal Bank of Canada, NY Branch | | 146,700,000 | | — | | (146,700,000) | | — |
| | | | | | | | | |
Total | $ | 396,700,000 | $ | — | $ | (396,700,000) | $ | — |
(a) | Represents the amount of assets or liabilities that could be offset with the same counterparty under master netting or similar agreements that management elects not to offset on the Statement of Assets and Liabilities. |
(b) | Collateral pledged is limited to the net outstanding amount due to/from an individual counterparty. The actual collateral amounts pledged may exceed these amounts and may fluctuate in value. |
| | |
See Notes to Schedule of Investments and Other Information and Notes to Financial Statements. |
| |
Janus Investment Fund | 5 |
Janus Henderson Money Market Fund
Notes to Schedule of Investments and Other Information
| | |
LLC | Limited Liability Company |
LOC | Letter of Credit |
LP | Limited Partnership |
Money market funds may hold securities with stated maturities of greater than 397 days when those securities have features that allow a fund to “put” back the security to the issuer or to a third party within 397 days of acquisition. The maturity dates shown in the security descriptions are the stated maturity dates.
| | |
4(2) | Securities sold under Section 4(2) of the Securities Act of 1933, as amended, are subject to legal and/or contractual restrictions on resale and may not be publicly sold without registration under the 1933 Act. Unless otherwise noted, these securities have been determined to be liquid under guidelines established by the Board of Trustees. The total value of 4(2) securities as of the year ended June 30, 2023 is $256,035,076, which represents 22.4% of net assets. |
| | |
¶ | Variable rate demand notes are not based on a published reference rate and spread; they are determined by the issuer or remarketing agent and current market conditions. The reference rate in the security description is as of June 30, 2023. |
| | |
ë | The Fund may have elements of risk due to concentration of investments. Such concentrations may subject the Fund to additional risks. |
| | | | | | | | | | | | | |
The following is a summary of the inputs that were used to value the Fund’s investments in securities and other financial instruments as of June 30, 2023. See Notes to Financial Statements for more information. |
| |
Valuation Inputs Summary |
| | | | | | | |
| | | | | Level 2 - | | Level 3 - |
| | | Level 1 - | | Other Significant | | Significant |
| | | Quoted Prices | | Observable Inputs | | Unobservable Inputs |
| | | | | | | |
Assets | | | | | | |
Investments In Securities: | | | | | | |
Certificates of Deposit | $ | - | $ | 70,991,271 | $ | - |
Commercial Paper | | - | | 350,629,551 | | - |
U.S. Government Agency Notes | | - | | 79,670,074 | | - |
U.S. Treasury Debt | | - | | 29,772,828 | | - |
Variable Rate Demand Notes | | - | | 170,205,000 | | - |
Repurchase Agreements | | - | | 396,700,000 | | - |
Time Deposits | | - | | 50,000,000 | | - |
Total Assets | $ | - | $ | 1,147,968,724 | $ | - |
| | | | | | | |
Janus Henderson Money Market Fund
Statement of Assets and Liabilities
June 30, 2023
| | | | | | | |
| | | | | | |
Assets: | | | | |
| Investments, at value (cost $751,268,724) | | $ | 751,268,724 | |
| Repurchase agreements, at value (cost $396,700,000) | | | 396,700,000 | |
| Cash | | | 165,096 | |
| Trustees' deferred compensation | | | 28,955 | |
| Receivables: | | | | |
| | Interest | | | 2,324,042 | |
| | Fund shares sold | | | 2,151,176 | |
Total Assets | | | 1,152,637,993 | |
Liabilities: | | | | |
| Payables: | | | — | |
| | Investments purchased | | | 5,300,000 | |
| | Fund shares repurchased | | | 1,520,595 | |
| | Administration services fees | | | 362,932 | |
| | Advisory fees | | | 201,500 | |
| | Dividends | | | 54,038 | |
| | Professional fees | | | 43,897 | |
| | Trustees' deferred compensation fees | | | 28,955 | |
| | Trustees' fees and expenses | | | 7,204 | |
| | Accrued expenses and other payables | | | 54 | |
Total Liabilities | | | 7,519,175 | |
Net Assets | | $ | 1,145,118,818 | |
Net Assets Consist of: | | | | |
| Capital (par value and paid-in surplus) | | $ | 1,145,137,084 | |
| Total distributable earnings (loss) | | | (18,266) | |
Total Net Assets | | $ | 1,145,118,818 | |
Net Assets - Class D Shares | | $ | 1,132,208,222 | |
| Shares Outstanding, $0.01 Par Value (unlimited shares authorized) | | | 1,132,222,814 | |
Net Asset Value Per Share | | $ | 1.00 | |
Net Assets - Class T Shares | | $ | 12,910,596 | |
| Shares Outstanding, $0.01 Par Value (unlimited shares authorized) | | | 12,918,705 | |
Net Asset Value Per Share | | $ | 1.00 | |
| | |
See Notes to Financial Statements. |
| |
Janus Investment Fund | 7 |
Janus Henderson Money Market Fund
Statement of Operations
For the year ended June 30, 2023
| | | | | | |
| | | | | |
Investment Income: | | | |
| Interest | $ | 45,455,992 | |
| Other income | | 1,226 | |
Total Investment Income | | 45,457,218 | |
Expenses: | | | |
| Advisory fees | | 2,362,757 | |
| Administration services fees: | | | |
| | Class D Shares | | 4,200,445 | |
| | Class T Shares | | 55,435 | |
| Professional fees | | 51,848 | |
| Trustees’ fees and expenses | | 34,121 | |
Total Expenses | | 6,704,606 | |
Net Investment Income/(Loss) | | 38,752,612 | |
Net Realized Gain/(Loss) on Investments: | | | |
| Investments | | (110) | |
Total Net Realized Gain/(Loss) on Investments | | (110) | |
Net Increase/(Decrease) in Net Assets Resulting from Operations | $ | 38,752,502 | |
| | | | | |
| | |
See Notes to Financial Statements. |
| |
8 | JUNE 30, 2023 |
Janus Henderson Money Market Fund
Statements of Changes in Net Assets
| | | | | | | | | |
| | | | | | | | |
| | | Year ended
June 30, 2023 | | Year ended
June 30, 2022 | |
| | | | | | | | | |
Operations: | | | | | | |
| Net investment income/(loss) | $ | 38,752,612 | | $ | 12,370 | |
| Net realized gain/(loss) on investments | | (110) | | | 23,179 | |
Net Increase/(Decrease) in Net Assets Resulting from Operations | | 38,752,502 | | | 35,549 | |
Dividends and Distributions to Shareholders: | | | | | | |
| | Class D Shares | | (38,304,476) | | | (12,192) | |
| | Class T Shares | | (471,872) | | | (176) | |
Net Decrease from Dividends and Distributions to Shareholders | | (38,776,348) | | | (12,368) | |
Capital Share Transactions: | | | | | | |
| | Class D Shares | | (61,835,136) | | | 44,101,793 | |
| | Class T Shares | | (3,027,737) | | | 143,044 | |
Net Increase/(Decrease) from Capital Share Transactions | | (64,862,873) | | | 44,244,837 | |
Net Increase/(Decrease) in Net Assets | | (64,886,719) | | | 44,268,018 | |
Net Assets: | | | | | | |
| Beginning of period | | 1,210,005,537 | | | 1,165,737,519 | |
| End of period | $ | 1,145,118,818 | | $ | 1,210,005,537 | |
| | | | | | | | |
| | |
See Notes to Financial Statements. |
| |
Janus Investment Fund | 9 |
Janus Henderson Money Market Fund
Financial Highlights
| | | | | | | | | | | | | | | | | | | |
Class D Shares | | | | | | | | | | | | | | | |
For a share outstanding during the year ended June 30 | | 2023 | | | 2022 | | | 2021 | | | 2020 | | | 2019 | |
| Net Asset Value, Beginning of Period | | $1.00 | | | $1.00 | | | $1.00 | | | $1.00 | | | $1.00 | |
| Income/(Loss) from Investment Operations: | | | | | | | | | | | | | | | |
| | Net investment income/(loss)(1) | | 0.03 | | | —(2) | | | —(2) | | | 0.01 | | | 0.02 | |
| | Net realized and unrealized gain/(loss)(2) | | — | | | — | | | — | | | — | | | — | |
| Total from Investment Operations | | 0.03 | | | — | | | — | | | 0.01 | | | 0.02 | |
| Less Dividends and Distributions: | | | | | | | | | | | | | | | |
| | Dividends (from net investment income) | | (0.03) | | | —(2) | | | —(2) | | | (0.01) | | | (0.02) | |
| | Distributions (from capital gains) | | —(2) | | | — | | | — | | | — | | | — | |
| Total Dividends and Distributions | | (0.03) | | | — | | | — | | | (0.01) | | | (0.02) | |
| Net Asset Value, End of Period | | $1.00 | | | $1.00 | | | $1.00 | | | $1.00 | | | $1.00 | |
| Total Return* | | 3.36% | | | 0.00% | | | 0.00% | | | 1.05% | | | 1.80% | |
| Net Assets, End of Period (in thousands) | | $1,132,208 | | | $1,194,067 | | | $1,149,942 | | | $1,155,176 | | | $910,866 | |
| Average Net Assets for the Period (in thousands) | | $1,160,934 | | | $1,134,774 | | | $1,202,890 | | | $1,006,448 | | | $886,310 | |
| Ratios to Average Net Assets**: | | | | | | | | | | | | | | | |
| | Ratio of Gross Expenses | | 0.57% | | | 0.57% | | | 0.57% | | | 0.62% | | | 0.67% | |
| | Ratio of Net Expenses (After Waivers and Expense Offsets) | | 0.57% | | | 0.28% | | | 0.13% | | | 0.53% | | | 0.57% | |
| | Ratio of Net Investment Income/(Loss) | | 3.30% | | | 0.00%(3) | | | 0.00%(3) | | | 0.98% | | | 1.79% | |
| | | | | | | | | | | | | | | | | | | |
| |
* Total return includes adjustments in accordance with generally accepted accounting principles required at the year or period end and are not annualized for periods of less than one full year. ** Annualized for periods of less than one full year. (1) Per share amounts are calculated based on average shares outstanding during the year or period. (2) Less than $0.005 on a per share basis. (3) Less than 0.005%. |
| | |
See Notes to Financial Statements. |
| |
10 | JUNE 30, 2023 |
Janus Henderson Money Market Fund
Financial Highlights
| | | | | | | | | | | | | | | | | | | |
Class T Shares | | | | | | | | | | | | | | | |
For a share outstanding during the year ended June 30 | | 2023 | | | 2022 | | | 2021 | | | 2020 | | | 2019 | |
| Net Asset Value, Beginning of Period | | $1.00 | | | $1.00 | | | $1.00 | | | $1.00 | | | $1.00 | |
| Income/(Loss) from Investment Operations: | | | | | | | | | | | | | | | |
| | Net investment income/(loss)(1) | | 0.03 | | | —(2) | | | —(2) | | | 0.01 | | | 0.02 | |
| | Net realized and unrealized gain/(loss)(2) | | — | | | — | | | — | | | — | | | — | |
| Total from Investment Operations | | 0.03 | | | — | | | — | | | 0.01 | | | 0.02 | |
| Less Dividends and Distributions: | | | | | | | | | | | | | | | |
| | Dividends (from net investment income) | | (0.03) | | | —(2) | | | —(2) | | | (0.01) | | | (0.02) | |
| | Distributions (from capital gains) | | —(2) | | | — | | | — | | | — | | | — | |
| Total Dividends and Distributions | | (0.03) | | | — | | | — | | | (0.01) | | | (0.02) | |
| Net Asset Value, End of Period | | $1.00 | | | $1.00 | | | $1.00 | | | $1.00 | | | $1.00 | |
| Total Return* | | 3.34% | | | 0.00% | | | 0.00% | | | 1.03% | | | 1.79% | |
| Net Assets, End of Period (in thousands) | | $12,911 | | | $15,939 | | | $15,795 | | | $13,158 | | | $12,045 | |
| Average Net Assets for the Period (in thousands) | | $14,523 | | | $16,109 | | | $14,191 | | | $13,238 | | | $11,795 | |
| Ratios to Average Net Assets**: | | | | | | | | | | | | | | | |
| | Ratio of Gross Expenses | | 0.59% | | | 0.58% | | | 0.59% | | | 0.65% | | | 0.69% | |
| | Ratio of Net Expenses (After Waivers and Expense Offsets) | | 0.59% | | | 0.28% | | | 0.13% | | | 0.55% | | | 0.59% | |
| | Ratio of Net Investment Income/(Loss) | | 3.25% | | | 0.00%(3) | | | 0.00%(3) | | | 1.02% | | | 1.76% | |
| | | | | | | | | | | | | | | | | | | |
| |
* Total return includes adjustments in accordance with generally accepted accounting principles required at the year or period end and are not annualized for periods of less than one full year. ** Annualized for periods of less than one full year. (1) Per share amounts are calculated based on average shares outstanding during the year or period. (2) Less than $0.005 on a per share basis. (3) Less than 0.005%. |
| | |
See Notes to Financial Statements. |
| |
Janus Investment Fund | 11 |
Janus Henderson Money Market Fund
Notes to Financial Statements
1. Organization and Significant Accounting Policies
Janus Henderson Money Market Fund (the “Fund”) is a series fund. The Fund is part of Janus Investment Fund (the “Trust”), which is organized as a Massachusetts business trust and is registered under the Investment Company Act of 1940, as amended (the “1940 Act”), as an open-end management investment company, and therefore has applied the specialized accounting and reporting guidance in Financial Accounting Standards Board (“FASB”) Accounting Standards Codification (“ASC”) Topic 946. The Trust offers 39 Funds which include multiple series of shares, with differing investment objectives and policies. The Fund seeks capital preservation and liquidity with current income as a secondary objective. Janus Henderson Investors US LLC is the investment adviser (the “Adviser”) to the Fund.
The Fund offers two classes of shares in order to meet the needs of various types of investors. Each class represents an interest in the same portfolio of investments. Certain financial intermediaries may not offer both classes of shares.
The Fund is classified as a “retail money market fund,” as such term is defined in or interpreted under the rules governing money market funds. A retail money market fund is a money market fund that has policies and procedures reasonably designed to limit all beneficial owners of the Fund to natural persons, which means that the Fund’s Shares can only be held through individual investors. In order to make an initial investment in the Fund, the Fund requires that a shareholder provide certain information (e.g., Social Security number or government-issued identification) that confirms your eligibility to invest in the Fund. Accounts that are not beneficially owned by natural persons, such as business and limited liability company accounts, charitable or financial organizations, and corporate and S-Corp accounts, are not eligible to invest in the Fund, and will be involuntarily redeemed from the Fund after having been provided sufficient notice.
As a retail money market fund, the Fund may be subject to liquidity fees and/or redemption gates on fund redemptions if the Fund’s liquidity falls below required minimums because of market conditions or other factors. Liquidity fees and redemption gates are most likely to be imposed during times of extraordinary market stress. Pursuant to Rule 2a-7 under the 1940 Act, the Trustees are permitted to impose a liquidity fee on redemptions from the Fund (up to 2%) or a redemption gate to temporarily restrict redemptions from the Fund for up to 10 business days (in any 90-day period) in the event that the Fund’s weekly liquid assets fall below certain designated thresholds.
If the Fund’s weekly liquid assets fall below 30% of the Fund’s total assets, the Trustees are permitted, but not required, to (i) impose a liquidity fee of no more than 2% of the amount redeemed and/or (ii) impose a redemption gate to temporarily suspend the right of redemption. If the Fund’s weekly liquid assets fall below 10% of the Fund’s total assets, the Fund will impose, generally as of the beginning of the next business day, a liquidity fee of 1% of the amount redeemed unless the Trustees determine that such a fee would not be in the best interests of the Fund or determines that a lower or higher fee (subject to the 2% limit) would be in the best interests of the Fund. A liquidity fee or redemption gate may be imposed as early as the same day that the Fund's weekly liquid assets fall below the 30% or 10% thresholds.
Shareholders, including individuals, accounts, as well as the Fund’s portfolio manager(s) and/or investment personnel, may from time to time own (beneficially or of record) a significant percentage of the Fund’s Shares and can be considered to “control” the Fund when that ownership exceeds 25% of the Fund’s assets (and which may differ from control as determined in accordance with United States of America generally accepted accounting principles ("US GAAP")).
Effective July 6, 2020, Class D Shares are available to new investors, subject to any closed fund policies for a Fund, as applicable. Previously, Class D Shares were only available to investors who already had a direct account with the Janus Henderson funds; immediate family members or members of the same household of an eligible individual investor; and existing beneficial owners of sole proprietorships or partnerships that hold accounts directly with the Janus Henderson funds.
Class T Shares are available through certain financial intermediary platforms including, but not limited to, mutual fund wrap fee programs, managed account programs, asset allocation programs, bank trust platforms, as well as certain retirement platforms. In addition, Class T Shares may be available through certain financial intermediaries who have an agreement with the Adviser or its affiliates to offer Class T Shares on their supermarket platforms.
The following accounting policies have been followed by the Fund and are in conformity with US GAAP.
Janus Henderson Money Market Fund
Notes to Financial Statements
Liquidity
The Fund has adopted liquidity requirements (measured at the time of purchase) as noted:
The Fund will limit its investments in illiquid securities to 5% or less of its total assets.
Daily liquidity. The Fund will invest at least 10% of its total assets in “daily liquid assets,” which generally include cash (including demand deposits), direct obligations of the U.S. Government, securities (including repurchase agreements) that will mature or are subject to a demand feature that is exercisable and payable within one business day, and/or amounts receivable and due unconditionally within one business day on pending sales of portfolio securities.
Weekly liquidity. The Fund will invest at least 30% of its assets in “weekly liquid assets,” which generally include cash (including demand deposits), direct obligations of the U.S. Government, agency discount notes with remaining maturities of 60 days or less, and securities (including repurchase agreements) that will mature or are subject to a demand feature that is exercisable and payable within five business days.
Investment Valuation
Fund holdings are valued in accordance with policies and procedures established by the Adviser pursuant to Rule 2a-5 under the 1940 Act and approved by and subject to the oversight of the Trustees (the “Valuation Procedures”). Investments held by the Fund are valued utilizing the amortized cost method of valuation permitted in accordance with Rule 2a-7 under the 1940 Act and certain conditions therein. Under the amortized cost method, which does not take into account unrealized capital gains or losses, an instrument is initially valued at its cost and thereafter assumes a constant accretion/amortization to maturity of any discount or premium.
Valuation Inputs Summary
FASB ASC 820, Fair Value Measurements and Disclosures (“ASC 820”), defines fair value, establishes a framework for measuring fair value, and expands disclosure requirements regarding fair value measurements. This standard emphasizes that fair value is a market-based measurement that should be determined based on the assumptions that market participants would use in pricing an asset or liability and establishes a hierarchy that prioritizes inputs to valuation techniques used to measure fair value. These inputs are summarized into three broad levels:
Level 1 – Unadjusted quoted prices in active markets the Fund has the ability to access for identical assets or liabilities.
Level 2 – Observable inputs other than unadjusted quoted prices included in Level 1 that are observable for the asset or liability either directly or indirectly. These inputs may include quoted prices for the identical instrument on an inactive market, prices for similar instruments, interest rates, prepayment speeds, credit risk, yield curves, default rates and similar data.
Assets or liabilities categorized as Level 2 in the hierarchy generally include: debt securities fair valued in accordance with the evaluated bid or ask prices supplied by a pricing service; securities traded on OTC markets and listed securities for which no sales are reported that are fair valued at the latest bid price (or yield equivalent thereof) obtained from one or more dealers transacting in a market for such securities or by a pricing service approved by the Fund’s Trustees; certain short-term debt securities with maturities of 60 days or less that are fair valued at amortized cost; and equity securities of foreign issuers whose fair value is determined by using systematic fair valuation models provided by independent third parties in order to adjust for stale pricing which may occur between the close of certain foreign exchanges and the close of the NYSE.
Periodic review and monitoring of the valuation of short-term securities is performed in an effort to ensure that amortized cost approximates market value. Other securities that may be categorized as Level 2 in the hierarchy include, but are not limited to, preferred stocks, bank loans, swaps, investments in unregistered investment companies, options, and forward contracts.
Level 3 – Unobservable inputs for the asset or liability to the extent that relevant observable inputs are not available, representing the Fund’s own assumptions about the assumptions that a market participant would use in valuing the asset or liability, and that would be based on the best information available.
There have been no significant changes in valuation techniques used in valuing any such positions held by the Fund since the beginning of the fiscal year.
Janus Henderson Money Market Fund
Notes to Financial Statements
The inputs or methodology used for fair valuing securities are not necessarily an indication of the risk associated with investing in those securities. The summary of inputs used as of June 30, 2023 to fair value the Fund’s investments in securities and other financial instruments is included in the “Valuation Inputs Summary” in the Notes to Schedule of Investments and Other Information.
Investment Transactions and Investment Income
Investment transactions are accounted for as of the date purchased or sold (trade date). Dividend income is recorded on the ex-dividend date. Certain dividends from foreign securities will be recorded as soon as the Fund is informed of the dividend, if such information is obtained subsequent to the ex-dividend date. Dividends from foreign securities may be subject to withholding taxes in foreign jurisdictions. Non-cash dividends, if any, are recorded on the ex-dividend date at fair value. Interest income is recorded daily on the accrual basis and includes amortization of premiums and accretion of discounts. The Fund classifies gains and losses on prepayments received as an adjustment to interest income. Debt securities may be placed in non-accrual status and related interest income may be reduced by stopping current accruals and writing off interest receivables when collection of all or a portion of interest has become doubtful. Gains and losses are determined on the identified cost basis, which is the same basis used for federal income tax purposes. Income, as well as gains and losses, both realized and unrealized, are allocated daily to each class of shares based upon the ratio of net assets represented by each class as a percentage of total net assets.
Expenses
The Fund bears expenses incurred specifically on its behalf. Each class of shares bears a portion of general expenses, which are allocated daily to each class of shares based upon the ratio of net assets represented by each class as a percentage of total net assets. Expenses directly attributable to a specific class of shares are charged against the operations of such class.
Estimates
The preparation of financial statements in conformity with US GAAP requires management to make estimates and assumptions that affect the reported amount of assets and liabilities and disclosure of contingent assets and liabilities at the date of the financial statements, and the reported amounts of income and expenses during the reporting period. Actual results could differ from those estimates.
Indemnifications
In the normal course of business, the Fund may enter into contracts that contain provisions for indemnification of other parties against certain potential liabilities. The Fund’s maximum exposure under these arrangements is unknown, and would involve future claims that may be made against the Fund that have not yet occurred. Currently, the risk of material loss from such claims is considered remote.
Dividends and Distributions
Dividends, if any, are declared daily and distributed monthly for the Fund. Realized capital gains, if any, are declared and distributed in December. The Fund may treat a portion of the amount paid to redeem shares as a distribution of investment company taxable income and realized capital gains that are reflected in the net asset value. This practice, commonly referred to as “equalization,” has no effect on the redeeming shareholder or the Fund’s total return, but may reduce the amounts that would otherwise be required to be paid as taxable dividends to the remaining shareholders. It is possible that the Internal Revenue Service (IRS) could challenge the Fund's equalization methodology or calculations, and any such challenge could result in additional tax, interest, or penalties to be paid by the Fund.
Federal Income Taxes
The Fund intends to continue to qualify as a regulated investment company and distribute all of its taxable income in accordance with the requirements of Subchapter M of the Internal Revenue Code. Management has analyzed the Fund’s tax positions taken for all open federal income tax years, generally a three-year period, and has concluded that no provision for federal income tax is required in the Fund’s financial statements. The Fund is not aware of any tax positions for which it is reasonably possible that the total amounts of unrecognized tax benefits will significantly change in the next twelve months.
2. Other Investments and Strategies
Market Risk
The value of the Fund’s portfolio may decrease if the value of one or more issuers in the Fund’s portfolio decreases. Further, regardless of how well individual companies or securities perform, the value of the Fund’s portfolio could also
Janus Henderson Money Market Fund
Notes to Financial Statements
decrease if there are deteriorating economic or market conditions, including, but not limited to, a general decline in prices on the stock markets, a general decline in real estate markets, a decline in commodities prices, or if the market favors different types of securities than the types of securities in which the Fund invests. If the value of the Fund’s portfolio decreases, the Fund’s NAV will also decrease, which means if you sell your shares in the Fund you may lose money. Market risk may affect a single issuer, industry, economic sector, or the market as a whole. The increasing interconnectivity between global economies and financial markets increases the likelihood that events or conditions in one region or financial market may adversely impact issuers in a different country, region or financial market. Social, political, economic and other conditions and events, such as natural disasters, health emergencies (e.g., epidemics and pandemics), terrorism, conflicts, including related sanctions, and social unrest, could reduce consumer demand or economic output, result in market closures, travel restrictions and/or quarantines, and generally have a significant impact on the global economies and financial markets.
• COVID-19 Pandemic. The effects of COVID-19 have contributed to increased volatility in global financial markets and have affected and may continue to affect certain countries, regions, issuers, industries and market sectors more dramatically than others. These conditions and events could have a significant impact on the Fund and its investments, the Fund’s ability to meet redemption requests, and the processes and operations of the Fund’s service providers, including the Adviser.
• Russia/Ukraine Invasion. Russia launched a large-scale invasion of Ukraine on February 24, 2022. The extent and duration of the military action, resulting sanctions and resulting future market disruptions in the region are impossible to predict, but could be significant and have a severe adverse effect on the region, including significant negative impacts on the economy and the markets for certain securities and commodities, such as oil and natural gas, as well as other sectors.
Repurchase Agreements
The Fund and other funds advised by the Adviser or its affiliates may transfer daily uninvested cash balances into one or more joint trading accounts. Assets in the joint trading accounts are invested in money market instruments and the proceeds are allocated to the participating funds on a pro rata basis.
Repurchase agreements held by the Fund are fully collateralized, and such collateral is in the possession of the Fund’s custodian or, for tri-party agreements, the custodian designated by the agreement. The collateral is evaluated daily to ensure its market value exceeds the current market value of the repurchase agreements, including accrued interest. In the event of default on the obligation to repurchase, the Fund has the right to liquidate the collateral and apply the proceeds in satisfaction of the obligation. In the event of default or bankruptcy by the other party to the agreement, realization and/or retention of the collateral or proceeds may be subject to legal proceedings.
Sovereign Debt
The Fund may invest in U.S. and non-U.S. government debt securities (“sovereign debt”). Some investments in sovereign debt, such as U.S. sovereign debt, are considered low risk. However, investments in sovereign debt, especially the debt of less developed countries, can involve a high degree of risk, including the risk that the governmental entity that controls the repayment of sovereign debt may not be willing or able to repay the principal and/or to pay the interest on its sovereign debt in a timely manner. A sovereign debtor’s willingness or ability to satisfy its debt obligation may be affected by various factors including, but not limited to, its cash flow situation, the extent of its foreign currency reserves, the availability of foreign exchange when a payment is due, the relative size of its debt position in relation to its economy as a whole, the sovereign debtor’s policy toward international lenders, and local political constraints to which the governmental entity may be subject. Sovereign debtors may also be dependent on expected disbursements from foreign governments, multilateral agencies, and other entities. The failure of a sovereign debtor to implement economic reforms, achieve specified levels of economic performance, or repay principal or interest when due may result in the cancellation of third party commitments to lend funds to the sovereign debtor, which may further impair such debtor’s ability or willingness to timely service its debts. The Fund may be requested to participate in the rescheduling of such sovereign debt and to extend further loans to governmental entities, which may adversely affect the Fund’s holdings. In the event of default, there may be limited or no legal remedies for collecting sovereign debt and there may be no bankruptcy proceedings through which the Fund may collect all or part of the sovereign debt that a governmental entity has not repaid. In addition, to the extent the Fund invests in non-U.S. sovereign debt, it may be subject to currency risk.
Janus Henderson Money Market Fund
Notes to Financial Statements
Variable and Floating Rate Notes
The Fund also may purchase variable and floating rate demand notes of corporations and other entities, which are unsecured obligations redeemable upon not more than 30 days’ notice. The Fund may purchase variable and floating rate demand notes of U.S. Government issuers or commercial banks. These obligations include master demand notes that permit investment of fluctuating amounts at varying rates of interest pursuant to direct arrangements with the issuer of the instrument. The issuer of these obligations often has the right, after a given period, to prepay the outstanding principal amount of the obligations upon a specified number of days’ notice. These obligations generally are not traded, nor generally is there an established secondary market for these obligations. To the extent a demand note does not have a seven day or shorter demand feature and there is no readily available market for the obligation, it is treated as an illiquid investment. The rate of interest on securities purchased by the Fund may be tied to short-term Treasury or other government securities or indices on securities that are permissible investments of the Fund, as well as other money market rates of interest. The Fund will not purchase securities whose values are tied to interest rates or indices that are not appropriate for the duration and volatility standards of a money market fund.
Counterparties
Fund transactions involving a counterparty are subject to the risk that the counterparty or a third party will not fulfill its obligation to the Fund (“counterparty risk”). Counterparty risk may arise because of the counterparty’s financial condition (i.e., financial difficulties, bankruptcy, or insolvency), market activities and developments, or other reasons, whether foreseen or not. A counterparty’s inability to fulfill its obligation may result in significant financial loss to the Fund. The Fund may be unable to recover its investment from the counterparty or may obtain a limited recovery, and/or recovery may be delayed. The extent of the Fund’s exposure to counterparty risk with respect to financial assets and liabilities approximates its carrying value. See the "Offsetting Assets and Liabilities" section of this Note for further details.
The Fund may be exposed to counterparty risk through its investments in certain securities, including, but not limited to, repurchase agreements and debt securities. The Fund intends to enter into financial transactions with counterparties that the Adviser believes to be creditworthy at the time of the transaction. There is always the risk that the Adviser’s analysis of a counterparty’s creditworthiness is incorrect or may change due to market conditions. To the extent that the Fund focuses its transactions with a limited number of counterparties, it will have greater exposure to the risks associated with one or more counterparties.
Offsetting Assets and Liabilities
The Fund presents gross and net information about transactions that are either offset in the financial statements or subject to an enforceable master netting arrangement or similar agreement with a designated counterparty, regardless of whether the transactions are actually offset in the Statement of Assets and Liabilities.
The Offsetting Assets and Liabilities table located in the Schedule of Investments presents gross amounts of recognized assets and/or liabilities and the net amounts after deducting collateral that has been pledged by counterparties or has been pledged to counterparties (if applicable). For corresponding information grouped by type of instrument, see the Fund's Schedule of Investments.
All repurchase agreements are transacted under legally enforceable master repurchase agreements that give the Fund, in the event of default by the counterparty, the right to liquidate securities held and to offset receivables and payables with the counterparty. For financial reporting purposes, the Fund does not offset financial instruments' payables and receivables and related collateral on the Statement of Assets and Liabilities. Repurchase agreements held by the Fund are fully collateralized, and such collateral is in the possession of the Fund’s custodian or, for tri-party agreements, the custodian designated by the agreement. The collateral is evaluated daily to ensure its market value exceeds the current market value of the repurchase agreements, including accrued interest.
3. Investment Advisory Agreements and Other Transactions with Affiliates
The Fund pays the Adviser an investment advisory fee which is calculated daily and paid monthly. The Fund’s contractual investment advisory fee rate (expressed as an annual rate) is 0.20% of its average daily net assets.
The Adviser may voluntarily waive and/or reimburse additional fees to the extent necessary to assist the Fund in attempting to maintain a yield of at least 0.00%. These waivers and reimbursements are voluntary and could change or be terminated at any time at the discretion of the Adviser. There is no guarantee that the Fund will maintain a positive yield. If applicable, amounts waived and/or reimbursed to the Fund by the Adviser are disclosed as “Excess Expense Reimbursement” on the Statement of Operations.
Janus Henderson Money Market Fund
Notes to Financial Statements
Class D Shares and Class T Shares of the Fund compensate the Adviser at an annual rate of 0.36% and 0.38%, respectively, of average daily net assets for providing certain administration services including, but not limited to, oversight and coordination of the Fund’s service providers, recordkeeping and registration functions and also to pay for costs such as shareholder servicing and custody. These amounts are disclosed as “Administration services fees” on the Statement of Operations. A portion of the Fund’s administration fee is paid to BNP Paribas Financial Services ("BPFS"). BPFS provides certain administrative services to the Fund, including services related to Fund accounting, calculation of the Fund’s daily NAV, and Fund audit, tax, and reporting obligations, pursuant to a sub-administration agreement with the Adviser on behalf of the Fund. The Adviser does not receive any additional compensation, beyond the administration services fee for serving as administrator.
The Board of Trustees has adopted a deferred compensation plan (the “Deferred Plan”) for independent Trustees to elect to defer receipt of all or a portion of the annual compensation they are entitled to receive from the Fund. All deferred fees are credited to an account established in the name of the Trustees. The amounts credited to the account then increase or decrease, as the case may be, in accordance with the performance of one or more of the Janus Henderson funds that are selected by the Trustees. The account balance continues to fluctuate in accordance with the performance of the selected fund or funds until final payment of all amounts are credited to the account. The fluctuation of the account balance is recorded by the Fund as unrealized appreciation/(depreciation) and is included as of June 30, 2023 on the Statement of Assets and Liabilities in the asset, “Trustees’ deferred compensation,” and liability, “Trustees’ deferred compensation fees.” Additionally, the recorded unrealized appreciation/(depreciation) is included in “Total distributable earnings (loss)” on the Statement of Assets and Liabilities. Deferred compensation expenses for the year ended June 30, 2023 are included in “Trustees’ fees and expenses” on the Statement of Operations. Trustees are allowed to change their designation of mutual funds from time to time. Amounts will be deferred until distributed in accordance with the Deferred Plan. Deferred fees of $426,025 were paid by the Trust to the Trustees under the Deferred Plan during the year ended June 30, 2023.
4. Federal Income Tax
The tax components of capital shown in the table below represent: (1) distribution requirements the Fund must satisfy under the income tax regulations; (2) losses or deductions the Fund may be able to offset against income and gains realized in future years; and (3) unrealized appreciation or depreciation of investments for federal income tax purposes.
Other book to tax differences primarily consist of deferred compensation. The Fund has elected to treat gains and losses on forward foreign currency contracts as capital gains and losses, if applicable. Other foreign currency gains and losses on debt instruments are treated as ordinary income for federal income tax purposes pursuant to Section 988 of the Internal Revenue Code.
| | | | | | | |
| | | | Other Book | Net Tax | |
Undistributed
Ordinary Income | Undistributed
Long-Term Gains | Accumulated
Capital Losses | Loss Deferrals | to Tax
Differences | Appreciation/
(Depreciation) | |
$ 6,177 | $ - | $ (110) | $ - | $ (24,333) | $ - | |
Accumulated capital losses noted below represent net capital loss carryovers, as of June 30, 2023, that may be available to offset future realized capital gains and thereby reduce future taxable gains distributions. The following table shows these capital loss carryovers.
| | | | | | |
| | | | | |
Capital Loss Carryover Schedule | | |
For the year ended June 30, 2023 | | |
| No Expiration | | | |
| Short-Term | Long-Term | Accumulated
Capital Losses | | |
| $ (110) | $ - | $ (110) | | |
Income and capital gains distributions are determined in accordance with income tax regulations that may differ from US GAAP. These differences are due to differing treatments for items such as net short-term gains, deferral of wash
Janus Henderson Money Market Fund
Notes to Financial Statements
sale losses, and capital loss carryovers. Certain permanent differences such as tax returns of capital and net investment losses noted below have been reclassified to capital.
| | | | | |
For the year ended June 30, 2023 | |
Distributions | | |
From Ordinary Income | From Long-Term Capital Gains | Tax Return of Capital | Net Investment Loss | |
$ 38,758,420 | $ 17,928 | $ - | $ - | |
| | | | | |
For the year ended June 30, 2022 | |
Distributions | | |
From Ordinary Income | From Long-Term Capital Gains | Tax Return of Capital | Net Investment Loss | |
$ 12,368 | $ - | $ - | $ - | |
Permanent book to tax basis differences may result in reclassifications between the components of net assets. These differences have no impact on the results of operations or net assets.
5. Capital Share Transactions
| | | | | | | |
| | | | | | |
| | Year ended June 30, 2023 | | Year ended June 30, 2022 |
| | Shares | Amount | | Shares | Amount |
| | | | | | | |
Class D Shares: | | | | | |
Shares sold | 390,659,510 | $390,661,189 | | 635,233,907 | $635,233,909 |
Reinvested dividends and distributions | 37,664,610 | 37,664,610 | | 7,541 | 7,541 |
Shares repurchased | (490,160,934) | (490,160,935) | | (591,139,655) | (591,139,657) |
Net Increase/(Decrease) | (61,836,814) | $ (61,835,136) | | 44,101,793 | $ 44,101,793 |
Class T Shares: | | | | | |
Shares sold | 23,339,683 | $ 23,339,704 | | 45,442,255 | $ 45,442,256 |
Reinvested dividends and distributions | 471,765 | 471,765 | | 181 | 176 |
Shares repurchased | (26,839,205) | (26,839,206) | | (45,299,388) | (45,299,388) |
Net Increase/(Decrease) | (3,027,757) | $ (3,027,737) | | 143,048 | $ 143,044 |
6. Subsequent Event
Management has evaluated whether any events or transactions occurred subsequent to June 30, 2023 and through the date of issuance of the Fund’s financial statements and determined that there were no material events or transactions that would require recognition or disclosure in the Fund’s financial statements.
Janus Henderson Money Market Fund
Report of Independent Registered Public Accounting Firm
To the Board of Trustees of Janus Investment Fund and Shareholders of Janus Henderson Money Market Fund
Opinion on the Financial Statements
We have audited the accompanying statement of assets and liabilities, including the schedule of investments, of Janus Henderson Money Market Fund (one of the funds constituting Janus Investment Fund, referred to hereafter as the “Fund”) as of June 30, 2023, the related statement of operations for the year ended June 30, 2023, the statements of changes in net assets for each of the two years in the period ended June 30, 2023, including the related notes, and the financial highlights for each of the five years in the period ended June 30, 2023 (collectively referred to as the “financial statements”). In our opinion, the financial statements present fairly, in all material respects, the financial position of the Fund as of June 30, 2023, the results of its operations for the year then ended, the changes in its net assets for each of the two years in the period ended June 30, 2023 and the financial highlights for each of the five years in the period ended June 30, 2023 in conformity with accounting principles generally accepted in the United States of America.
Basis for Opinion
These financial statements are the responsibility of the Fund’s management. Our responsibility is to express an opinion on the Fund’s financial statements based on our audits. We are a public accounting firm registered with the Public Company Accounting Oversight Board (United States) (PCAOB) and are required to be independent with respect to the Fund in accordance with the U.S. federal securities laws and the applicable rules and regulations of the Securities and Exchange Commission and the PCAOB.
We conducted our audits of these financial statements in accordance with the standards of the PCAOB. Those standards require that we plan and perform the audit to obtain reasonable assurance about whether the financial statements are free of material misstatement, whether due to error or fraud.
Our audits included performing procedures to assess the risks of material misstatement of the financial statements, whether due to error or fraud, and performing procedures that respond to those risks. Such procedures included examining, on a test basis, evidence regarding the amounts and disclosures in the financial statements. Our audits also included evaluating the accounting principles used and significant estimates made by management, as well as evaluating the overall presentation of the financial statements. Our procedures included confirmation of securities owned as of June 30, 2023 by correspondence with the custodian and brokers; when replies were not received from brokers, we performed other auditing procedures. We believe that our audits provide a reasonable basis for our opinion.

Denver, Colorado
August 21, 2023
We have served as the auditor of one or more investment companies in Janus Henderson Funds since 1990.
Janus Henderson Money Market Fund
Additional Information (unaudited)
Proxy Voting Policies and Voting Record
A description of the policies and procedures that the Fund uses to determine how to vote proxies relating to its portfolio securities is available without charge: (i) upon request, by calling 1-800-525-1093; (ii) on the Fund’s website at janushenderson.com/proxyvoting; and (iii) on the SEC’s website at http://www.sec.gov. Additionally, information regarding the Fund’s proxy voting record for the most recent twelve-month period ended June 30 is also available, free of charge, through janushenderson.com/proxyvoting and from the SEC’s website at http://www.sec.gov.
Monthly Portfolio Holdings
The Fund files its complete holdings in a monthly report on Form N-MFP within 5 business days after each month end. These reports (i) are available on the SEC’s website at http://www.sec.gov; (ii) may be reviewed and copied at the SEC’s Public Reference Room in Washington, D.C. (information on the Public Reference Room may be obtained by calling 1-800-SEC-0330); and (iii) are available without charge, upon request, by calling a Janus Henderson representative at 1-877-335-2687 (toll free) (or 1-800-525-3713 if you hold Class D Shares).
APPROVAL OF ADVISORY AGREEMENTS DURING THE PERIOD
The Trustees of Janus Aspen Series, each of whom serves as an “independent” Trustee (the “Trustees”), oversee the management of each portfolio of Janus Aspen Series (each, a “VIT Portfolio,” and collectively, the “VIT Portfolios”), as well as each fund of Janus Investment Fund (each, a “Fund,” and collectively, the “Funds” and together with the VIT Portfolios, the “Janus Henderson Funds,” and each, a “Janus Henderson Fund”). As required by law, the Trustees determine annually whether to continue the investment advisory agreement for each Janus Henderson Fund.
In connection with their most recent consideration of those agreements for each Janus Henderson Fund, the Trustees received and reviewed information provided by Janus Henderson Investors US LLC (the “Adviser”) in response to requests of the Trustees and their independent legal counsel. They also received and reviewed information and analysis provided by, and in response to requests of, their independent fee consultant. Throughout their consideration of the agreements, the Trustees were advised by their independent legal counsel. The Trustees met with management to consider the agreements, and also met separately in executive session with their independent legal counsel and their independent fee consultant.
At meetings held on November 9-10, 2022 and December 13-14, 2022, the Trustees evaluated the information provided by the Adviser and the independent fee consultant, as well as other information provided by the Adviser and the independent fee consultant during the year. Following such evaluation, the Trustees determined that the overall arrangements between each Janus Henderson Fund and the Adviser were fair and reasonable in light of the nature, extent, and quality of the services provided by the Adviser and its affiliates, the fees charged for those services, and other matters that the Trustees considered relevant in the exercise of their business judgment, and unanimously approved the continuation of the investment advisory agreement for each Janus Henderson Fund for the period from February 1, 2023 through February 1, 2024, subject to earlier termination as provided for in each agreement.
In considering the continuation of those agreements, the Trustees reviewed and analyzed various factors that they determined were relevant, including the factors described below, none of which by itself was considered dispositive. However, the material factors and conclusions that formed the basis for the Trustees’ determination to approve the continuation of the agreements are discussed separately below. Also included is a summary of the independent fee consultant’s conclusions and opinions that arose during, and were included as part of, the Trustees’ consideration of the agreements. “Management fees,” as used herein, reflect actual annual advisory fees and, for the purpose of peer comparisons any administration fees (excluding out of pocket costs), net of any waivers, paid by a fund as a percentage of average net assets.
Nature, Extent and Quality of Services
The Trustees reviewed the nature, extent, and quality of the services provided by the Adviser to the Janus Henderson Funds, taking into account the investment objective, strategies, and policies of each Janus Henderson Fund, and the knowledge the Trustees gained from their regular meetings with management on at least a quarterly basis and their ongoing review of information related to the Janus Henderson Funds. In addition, the Trustees reviewed the resources and key personnel of the Adviser, particularly noting those employees who provide investment and risk management services to the Janus Henderson Funds. The Trustees also considered other services provided to the Janus Henderson
Janus Henderson Money Market Fund
Additional Information (unaudited)
Funds by the Adviser, such as managing the execution of portfolio transactions and the selection of broker-dealers for those transactions. The Trustees considered the Adviser’s role as administrator to the Janus Henderson Funds, noting that the Adviser generally does not receive a fee for its services as administrator, but is reimbursed for its out-of-pocket costs. The Trustees considered the role of the Adviser in monitoring adherence to the Janus Henderson Funds’ investment restrictions, providing support services for the Trustees and Trustee committees, and overseeing communications with Janus Henderson Fund shareholders and the activities of other service providers, including monitoring compliance with various policies and procedures of the Janus Henderson Funds and with applicable securities laws and regulations.
In this regard, the independent fee consultant noted that the Adviser provides a number of different services for the Janus Henderson Funds and their shareholders, ranging from investment management services to various other servicing functions, and that, in its view, the Adviser is a capable provider of those services. The independent fee consultant also provided its belief that the Adviser has developed a number of institutional competitive advantages that should enable it to provide superior investment and service performance over the long term.
The Trustees concluded that the nature, extent, and quality of the services provided by the Adviser to each Janus Henderson Fund were appropriate and consistent with the terms of the respective advisory agreements, and that, taking into account steps taken to address those Janus Henderson Funds whose performance lagged that of their peers for certain periods, the Janus Henderson Funds were likely to benefit from the continued provision of those services. They also concluded that the Adviser had sufficient personnel, with the appropriate education and experience, to serve the Janus Henderson Funds effectively and had demonstrated its ability to attract well-qualified personnel.
Performance of the Funds
The Trustees considered the performance results of each Janus Henderson Fund over various time periods. They noted that they considered Janus Henderson Fund performance data throughout the year, including periodic meetings with each Janus Henderson Fund’s portfolio manager(s), and also reviewed information comparing each Janus Henderson Fund’s performance with the performance of comparable fund peer groups identified by Broadridge Financial Solutions, Inc. (“Broadridge”), an independent data provider, and with the Janus Henderson Fund’s benchmark index. In this regard, the independent fee consultant found that the overall Janus Henderson Funds’ performance has been reasonable, noting that: (i) for the 36 months ended May 31, 2022, approximately 38% of the Janus Henderson Funds were in the top two quartiles of their Broadridge peer groups; (ii) for the 36 months ended September 30, 2022, approximately 45% of the Janus Henderson Funds were in the top two quartiles of performance as reported by Morningstar, and (iii) for the 12 months ended September 30, 2022, approximately 55% of the Janus Henderson Funds were in the top two quartiles of performance as reported by Morningstar.
The Trustees considered the performance of each Janus Henderson Fund, noting that performance may vary by share class, and noted the following with respect to the Funds:
Asset Allocation Funds
· For Janus Henderson Global Allocation Fund – Conservative, the Trustees noted that the Fund’s performance was in the third Broadridge quartile for the 36 months ended May 31, 2022 and the bottom Broadridge quartile for the 12 months ended May 31, 2022. The Trustees noted the reasons for the Fund’s underperformance and the steps the Adviser had taken or was taking to improve performance.
· For Janus Henderson Global Allocation Fund – Growth, the Trustees noted that the Fund’s performance was in the bottom Broadridge quartile for the 36 months ended May 31, 2022 and the bottom Broadridge quartile for the 12 months ended May 31, 2022. The Trustees noted the reasons for the Fund’s underperformance and the steps the Adviser had taken or was taking to improve performance.
· For Janus Henderson Global Allocation Fund – Moderate, the Trustees noted that the Fund’s performance was in the bottom Broadridge quartile for the 36 months ended May 31, 2022 and the bottom Broadridge quartile for the 12 months ended May 31, 2022. The Trustees noted the reasons for the Fund’s underperformance and the steps the Adviser had taken or was taking to improve performance.
Fixed-Income Funds
· For Janus Henderson Absolute Return Income Opportunities Fund, the Trustees noted that the Fund’s performance was in the third Broadridge quartile for the 36 months ended May 31, 2022 and the first Broadridge
Janus Henderson Money Market Fund
Additional Information (unaudited)
quartile for the 12 months ended May 31, 2022. The Trustees noted the reasons for the Fund’s underperformance, the steps the Adviser had taken or was taking to improve performance, and that the performance trend was improving.
· For Janus Developed World Bond Fund, the Trustees noted that the Fund’s performance was in the bottom Broadridge quartile for the 36 months ended May 31, 2022 and the bottom Broadridge quartile for the 12 months ended May 31, 2022. The Trustees noted the reasons for the Fund’s underperformance and the steps the Adviser had taken or was taking to improve performance.
· For Janus Henderson Flexible Bond Fund, the Trustees noted that the Fund’s performance was in the first Broadridge quartile for the 36 months ended May 31, 2022 and the second Broadridge quartile for the 12 months ended May 31, 2022.
· For Janus Henderson Global Bond Fund, the Trustees noted that the Fund’s performance was in the third Broadridge quartile for the 36 months ended May 31, 2022 and the bottom Broadridge quartile for the 12 months ended May 31, 2022. The Trustees noted the reasons for the Fund’s underperformance and the steps the Adviser had taken or was taking to improve performance.
· For Janus Henderson High-Yield Fund, the Trustees noted that the Fund’s performance was in the third Broadridge quartile for the 36 months ended May 31, 2022 and the bottom Broadridge quartile for the 12 months ended May 31, 2022. The Trustees noted the reasons for the Fund’s underperformance and the steps the Adviser had taken or was taking to improve performance.
· For Janus Henderson Multi-Sector Income Fund, the Trustees noted that the Fund’s performance was in the second Broadridge quartile for the 36 months ended May 31, 2022 and the third Broadridge quartile for the 12 months ended May 31, 2022.
· For Janus Henderson Short Duration Flexible Bond Fund, the Trustees noted that the Fund’s performance was in the third Broadridge quartile for the 36 months ended May 31, 2022 and the bottom Broadridge quartile for the 12 months ended May 31, 2022. The Trustees noted the reasons for the Fund’s underperformance and the steps the Adviser had taken or was taking to improve performance.
Global and International Equity Funds
· For Janus Henderson Asia Equity Fund, the Trustees noted that the Fund’s performance was in the third Broadridge quartile for the 36 months ended May 31, 2022 and the third Broadridge quartile for the 12 months ended May 31, 2022. The Trustees noted the reasons for the Fund’s underperformance, while also noting that the Fund has a performance fee structure that results in lower management fees during periods of underperformance, and the steps the Adviser had taken or was taking to improve performance.
· For Janus Henderson Emerging Markets Fund, the Trustees noted that the Fund’s performance was in the third Broadridge quartile for the 36 months ended May 31, 2022 and the third Broadridge quartile for the 12 months ended May 31, 2022. The Trustees noted the reasons for the Fund’s underperformance and the steps the Adviser had taken or was taking to improve performance.
· For Janus Henderson European Focus Fund, the Trustees noted that the Fund’s performance was in the first Broadridge quartile for the 36 months ended May 31, 2022 and the second Broadridge quartile for the 12 months ended May 31, 2022.
· For Janus Henderson Global Equity Income Fund, the Trustees noted that the Fund’s performance was in the third Broadridge quartile for the 36 months ended May 31, 2022 and the first Broadridge quartile for the 12 months ended May 31, 2022. The Trustees noted the reasons for the Fund’s underperformance, the steps the Adviser had taken or was taking to improve performance, and that the performance trend was improving.
· For Janus Henderson Global Life Sciences Fund, the Trustees noted that the Fund’s performance was in the third Broadridge quartile for the 36 months ended May 31, 2022 and the second Broadridge quartile for the 12 months ended May 31, 2022. The Trustees noted the reasons for the Fund’s underperformance, the steps the Adviser had taken or was taking to improve performance, and that the performance trend was improving.
Janus Henderson Money Market Fund
Additional Information (unaudited)
· For Janus Henderson Global Sustainable Equity Fund, the Trustees noted that the Fund’s performance was in the second Broadridge quartile for the 12 months ended May 31, 2022. The Trustees noted that 36 month-end performance was not yet available.
· For Janus Henderson Global Real Estate Fund, the Trustees noted that the Fund’s performance was in the second Broadridge quartile for the 36 months ended May 31, 2022 and the bottom Broadridge quartile for the 12 months ended May 31, 2022.
· For Janus Henderson Global Research Fund, the Trustees noted that the Fund’s performance was in the second Broadridge quartile for the 36 months ended May 31, 2022 and the first Broadridge quartile for the 12 months ended May 31, 2022.
· For Janus Henderson Global Select Fund, the Trustees noted that the Fund’s performance was in the first Broadridge quartile for the 36 months ended May 31, 2022 and the first Broadridge quartile for the 12 months ended May 31, 2022.
· For Janus Henderson Global Technology and Innovation Fund, the Trustees noted that the Fund’s performance was in the second Broadridge quartile for the 36 months ended May 31, 2022 and the second Broadridge quartile for the 12 months ended May 31, 2022.
· For Janus Henderson International Opportunities Fund, the Trustees noted that the Fund’s performance was in the bottom Broadridge quartile for the 36 months ended May 31, 2022 and the third Broadridge quartile for the 12 months ended May 31, 2022. The Trustees noted the reasons for the Fund’s underperformance and the steps the Adviser had taken or was taking to improve performance.
· For Janus Henderson Overseas Fund, the Trustees noted that the Fund’s performance was in the first Broadridge quartile for the 36 months ended May 31, 2022 and the first Broadridge quartile for the 12 months ended May 31, 2022.
· For Janus Henderson Responsible International Dividend Fund (formerly the Janus Henderson Dividend & Income Builder Fund), the Trustees noted that the Fund’s performance was in the bottom Broadridge quartile for the 36 months ended May 31, 2022 and the bottom Broadridge quartile for the 12 months ended May 31, 2022. The Trustees noted the reasons for the Fund’s underperformance and the steps the Adviser had taken or was taking to improve performance.
Money Market Funds
· For Janus Henderson Government Money Market Fund, the Trustees noted that the Fund’s performance was in the third Broadridge quartile for the 36 months ended May 31, 2022 and the bottom Broadridge quartile for the 12 months ended May 31, 2022. The Trustees noted the reasons for the Fund’s underperformance and the steps the Adviser had taken or was taking to improve performance.
· For Janus Henderson Money Market Fund, the Trustees noted that the Fund’s performance was in the third Broadridge quartile for the 36 months ended May 31, 2022 and the bottom Broadridge quartile for the 12 months ended May 31, 2022. The Trustees noted the reasons for the Fund’s underperformance and the steps the Adviser had taken or was taking to improve performance.
Multi-Asset Funds
· For Janus Henderson Adaptive Global Allocation Fund, the Trustees noted that the Fund’s performance was in bottom Broadridge quartile for the 36 months ended May 31, 2022 and the second Broadridge quartile for the 12 months ended May 31, 2022. The Trustees noted the reasons for the Fund’s underperformance, the steps the Adviser had taken or was taking to improve performance, and that the performance trend was improving.
· For Janus Henderson Balanced Fund, the Trustees noted that the Fund’s performance was in the first Broadridge quartile for the 36 months ended May 31, 2022 and the first Broadridge quartile for the 12 months ended May 31, 2022.
Janus Henderson Money Market Fund
Additional Information (unaudited)
U.S. Equity Funds
· For Janus Henderson Adaptive Risk Managed U.S. Equity Fund, the Trustees noted that the Fund’s performance was in the bottom Broadridge quartile for the 36 months ended May 31, 2022 and the second Broadridge quartile for the 12 months ended May 31, 2022. The Trustees noted the reasons for the Fund’s underperformance, the steps the Adviser had taken or were taking to improve performance, and that the performance trend was improving.
· For Janus Henderson Contrarian Fund, the Trustees noted that the Fund’s performance was in the first Broadridge quartile for the 36 months ended May 31, 2022 and the bottom Broadridge quartile for the 12 months ended May 31, 2022.
· For Janus Henderson Enterprise Fund, the Trustees noted that the Fund’s performance was in the second Broadridge quartile for the 36 months ended May 31, 2022 and the first Broadridge quartile for the 12 months ended May 31, 2022.
· For Janus Henderson Forty Fund, the Trustees noted that the Fund’s performance was in the third Broadridge quartile for the 36 months ended May 31, 2022 and the bottom Broadridge quartile for the 12 months ended May 31, 2022. The Trustees noted the reasons for the Fund’s underperformance and the steps the Adviser had taken or was taking to improve performance.
· For Janus Henderson Growth and Income Fund, the Trustees noted that the Fund’s performance was in the bottom Broadridge quartile for the 36 months ended May 31, 2022 and the first Broadridge quartile for the 12 months ended May 31, 2022. The Trustees noted the reasons for the Fund’s underperformance, the steps the Adviser had taken or was taking to improve performance, and that the performance trend was improving.
· For Janus Henderson Mid Cap Value Fund, the Trustees noted that the Fund’s performance was in the bottom Broadridge quartile for the 36 months ended May 31, 2022 and the second Broadridge quartile for the 12 months ended May 31, 2022. The Trustees noted the reasons for the Fund’s underperformance, while also noting that the Fund has a performance fee structure that results in lower management fees during periods of underperformance, the steps the Adviser had taken or was taking to improve performance, and that the performance trend was improving.
· For Janus Henderson Research Fund, the Trustees noted that the Fund’s performance was in the third Broadridge quartile for the 36 months ended May 31, 2022 and the third Broadridge quartile for the 12 months ended May 31, 2022. The Trustees noted the reasons for the Fund’s underperformance, while also noting that the Fund has a performance fee structure that results in lower management fees during periods of underperformance and the steps the Adviser had taken or was taking to improve performance.
· For Janus Henderson Small Cap Value Fund, the Trustees noted that the Fund’s performance was in the bottom Broadridge quartile for the 36 months ended May 31, 2022 and the second Broadridge quartile for the 12 months ended May 31, 2022. The Trustees noted the reasons for the Fund’s underperformance, while also noting that the Fund has a performance fee structure that results in lower management fees during periods of underperformance, the steps the Adviser had taken or was taking to improve performance, and that the performance trend was improving.
· For Janus Henderson Small-Mid Cap Value Fund, the Trustees noted that the Fund’s performance was in the bottom Broadridge quartile for the 36 months ended May 31, 2022 and the second Broadridge quartile for the 12 months ended May 31, 2022. The Trustees noted the reasons for the Fund’s underperformance, while also noting that the Fund has a performance fee structure that results in lower management fees during periods of underperformance, the steps the Adviser had taken or was taking to improve performance, and that the performance trend is improving.
· For Janus Henderson Triton Fund, the Trustees noted that the Fund’s performance was in the bottom Broadridge quartile for the 36 months ended May 31, 2022 and the second Broadridge quartile for the 12 months ended May 31, 2022. The Trustees noted the reasons for the Fund’s underperformance, the steps the Adviser had taken or was taking to improve performance, and that the performance trend was improving.
· For Janus Henderson Venture Fund, the Trustees noted that the Fund’s performance was in the bottom Broadridge quartile for the 36 months ended May 31, 2022 and the second Broadridge quartile for the 12 months ended May
Janus Henderson Money Market Fund
Additional Information (unaudited)
31, 2022. The Trustees noted the reasons for the Fund’s underperformance, the steps the Adviser had taken or was taking to improve performance, and that the performance trend was improving.
In consideration of each Janus Henderson Fund’s performance, the Trustees concluded that, taking into account the factors relevant to performance, as well as other considerations, including steps taken to improve performance, as applicable, the Janus Henderson Fund’s performance warranted continuation of such Janus Henderson Fund’s investment advisory agreement.
Costs of Services Provided
The Trustees examined information regarding the fees and expenses of each Janus Henderson Fund in comparison to similar information for other comparable funds as provided by Broadridge, an independent data provider. They also reviewed an analysis of that information provided by their independent fee consultant. The independent fee consultant provided its belief that the management fees charged by the Adviser to each of the Janus Henderson Funds under the current investment advisory and administration agreements are reasonable in relation to the services provided by the Adviser. The independent fee consultant found: (1) the total expenses and management fees of the Janus Henderson Funds to be reasonable relative to other comparable mutual funds; (2) the total expenses, on average, were 6% under the average total expenses of the respective Broadridge peer group; and (3) the management fees for the Janus Henderson Funds, on average, were 5% under the average management fees for the respective Broadridge peer group. The Trustees also considered the total expenses for each share class of each Janus Henderson Fund compared to the average total expenses for its Broadridge Expense Group and to average total expenses for its Broadridge Expense Universe.
For Janus Henderson Funds with three or more years of performance history, the independent fee consultant also performed a systematic “focus list” analysis of expenses which assessed fund fees in the context of fund performance being delivered. Based on this analysis, the independent fee consultant found that the combination of service quality/performance and expenses on these individual Janus Henderson Funds was reasonable in light of performance trends, performance histories, changes in portfolio management, relative average net asset levels, and the existence of performance fees, breakpoints, and/or expense waivers on such Janus Henderson Funds.
The Trustees considered the methodology used by the Adviser in determining compensation payable to portfolio managers, the competitive environment for investment management talent, and the competitive market for mutual funds in different distribution channels.
The Trustees also reviewed management fees charged by the Adviser to comparable separate account clients and to comparable non-affiliated funds subadvised by the Adviser (for which the Adviser provides only or primarily portfolio management services). Although in most instances subadvisory and separate account fee rates for various investment strategies were lower than management fee rates for Janus Henderson Funds having a similar strategy, the Trustees considered that the Adviser noted that, under the terms of the management agreements with the Janus Henderson Funds, the Adviser performs significant additional services for the Janus Henderson Funds that it does not provide to those other clients, including administration services, oversight of the Janus Henderson Funds’ other service providers, Trustee support, regulatory compliance and numerous other services, and that, in serving the Janus Henderson Funds, the Adviser assumes many legal risks and other costs that it does not assume in servicing its other clients. Moreover, the Trustees noted that the independent fee consultant found that: (1) the management fees the Adviser charges to the Janus Henderson Funds are reasonable in relation to the management fees the Adviser charges to funds subadvised by the Adviser and to the fees the Adviser charges to its institutional separate account clients; (2) these subadvised and institutional separate accounts have different service and infrastructure needs and operate in markets very different from the retail fund market; (3) Janus Henderson mutual fund investors enjoy reasonable fees relative to the fees charged in these other markets; and (4) as part of its 2022 review, 9 of 11 Janus Henderson Funds have lower management fees than similar funds subadvised by the Adviser. The Trustees noted that for the two Janus Henderson Funds that did not, management fees for each were under the average of its 15(c) peer group.
The Trustees considered the fees for each Janus Henderson Fund for its fiscal year ended in 2021 and noted the following with regard to each Janus Henderson Fund’s total expenses, net of applicable fee waivers (the Fund’s “total expenses”) as reflected in the comparative information provided by Broadridge:
Janus Henderson Money Market Fund
Additional Information (unaudited)
Asset Allocation Funds
· For Janus Henderson Global Allocation Fund – Conservative, the Trustees noted that, although the Fund’s total expenses exceeded the peer group average for certain share classes, overall the Fund’s total expenses were reasonable. The Trustees also noted that the Adviser has contractually agreed to limit the Fund’s expenses.
· For Janus Henderson Global Allocation Fund – Growth, the Trustees noted that, although the Fund’s total expenses exceeded the peer group average for certain share classes, overall the Fund’s total expenses were reasonable. The Trustees also noted that the Adviser has contractually agreed to limit the Fund’s expenses, although this limit did not apply because the Fund’s total expenses as shown were below the applicable fee limit.
· For Janus Henderson Global Allocation Fund – Moderate, the Trustees noted that, although the Fund’s total expenses exceeded the peer group average for one share class, overall the Fund’s total expenses were reasonable. The Trustees also noted that the Adviser has contractually agreed to limit the Fund’s expenses.
Fixed-Income Funds
· For Janus Henderson Absolute Return Income Opportunities Fund, the Trustees noted that, although the Fund’s total expenses exceeded the peer group average for certain share classes, overall the Fund’s total expenses were reasonable. The Trustees also noted that the Adviser has contractually agreed to limit the Fund’s expenses.
· For Janus Henderson Developed World Bond Fund, the Trustees noted that, although the Fund’s total expenses exceeded the peer group average for one share class, overall the Fund’s total expenses were reasonable. The Trustees also noted that the Adviser has contractually agreed to limit the Fund’s expenses.
· For Janus Henderson Flexible Bond Fund, the Trustees noted that, although the Fund’s total expenses exceeded the peer group average for certain share classes, overall the Fund’s total expenses were reasonable. The Trustees also noted that the Adviser has contractually agreed to limit the Fund’s expenses, although this limit did not apply because the Fund’s total expenses as shown were below the applicable fee limit.
· For Janus Henderson Global Bond Fund, the Trustees noted that, although the Fund’s total expenses exceeded the peer group average for certain share classes, overall the Fund’s total expenses were reasonable. The Trustees also noted that the Adviser has contractually agreed to limit the Fund’s expenses.
· For Janus Henderson High-Yield Fund, the Trustees noted that, although the Fund’s total expenses exceeded the peer group average for certain share classes, overall the Fund’s total expenses were reasonable. The Trustees also noted that the Adviser has contractually agreed to limit the Fund’s expenses.
· For Janus Henderson Multi-Sector Income Fund, the Trustees noted that, although the Fund’s total expenses exceeded the peer group average for certain share classes, overall the Fund’s total expenses were reasonable. The Trustees also noted that the Adviser has contractually agreed to limit the Fund’s expenses.
· For Janus Henderson Short Duration Flexible Bond Fund, the Trustees noted that, although the Fund’s total expenses exceeded the peer group average for certain share classes, overall the Fund’s total expenses were reasonable. The Trustees also noted that the Adviser has contractually agreed to limit the Fund’s expenses.
Global and International Equity Funds
· For Janus Henderson Asia Equity Fund, the Trustees noted that, although the Fund’s total expenses exceeded the peer group average for certain share classes, overall the Fund’s total expenses were reasonable. The Trustees also noted that the Adviser has contractually agreed to limit the Fund’s expenses.
· For Janus Henderson Emerging Markets Fund, the Trustees noted that, although the Fund’s total expenses exceeded the peer group average for certain share classes, overall the Fund’s total expenses were reasonable. The Trustees also noted that the Adviser has contractually agreed to limit the Fund’s expenses.
· For Janus Henderson European Focus Fund, the Trustees noted that, although the Fund’s total expenses exceeded the peer group average for one share class, overall the Fund’s expenses were reasonable. The Trustees also noted that the Adviser has contractually agreed to limit the Fund’s expenses.
· For Janus Henderson Global Equity Income Fund, the Trustees noted that, although the Fund’s total expenses exceeded the peer group average for one share class, overall the Fund’s total expenses were reasonable. The
Janus Henderson Money Market Fund
Additional Information (unaudited)
Trustees also noted that the Adviser has contractually agreed to limit the Fund’s expenses, although this limit did not apply because the Fund’s total expenses as shown were below the applicable fee limit.
· For Janus Henderson Global Life Sciences Fund, the Trustees noted that the Fund’s total expenses were below the peer group average for all share classes.
· For Janus Henderson Global Real Estate Fund, the Trustees noted that, although the Fund’s total expenses exceeded the peer group average for certain share classes, overall the Fund’s total expenses were reasonable. The Trustees also noted that the Adviser has contractually agreed to limit the Fund’s expenses, although this limit did not apply because the Fund’s total expenses as shown were below the applicable fee limit.
· For Janus Henderson Global Research Fund, the Trustees noted that, although the Fund’s total expenses exceeded the peer group average for one share class, overall the Fund’s total expenses were reasonable. The Trustees also noted that the Adviser has contractually agreed to limit the Fund’s expenses, although this limit did not apply because the Fund’s total expenses as shown were below the applicable fee limit.
· For Janus Henderson Global Select Fund, the Trustees noted that, although the Fund’s total expenses exceeded the peer group average for certain share classes, overall the Fund’s total expenses were reasonable. The Trustees also noted that the Adviser has contractually agreed to limit the Fund’s expenses.
· For Janus Henderson Global Sustainable Equity Fund, the Trustees noted that, although the Fund’s total expenses exceeded the peer group average for certain share classes, overall the Fund’s expenses were reasonable. The Trustees also noted that the Adviser has contractually agreed to limit the Fund’s expenses.
· For Janus Henderson Global Technology and Innovation Fund, the Trustees noted that the Fund’s total expenses were below the peer group average for all share classes.
· For Janus Henderson International Opportunities Fund, the Trustees noted that, although the Fund’s total expenses exceeded the peer group average for certain share classes, overall the Fund’s expenses were reasonable. The Trustees also noted that the Adviser has contractually agreed to limit the Fund’s expenses.
· For Janus Henderson Overseas Fund, the Trustees noted that although the Fund’s total expenses exceeded the peer group average for certain share classes, overall the Fund’s total expenses were reasonable. The Trustees also noted that the Adviser has contractually agreed to limit the Fund’s expenses, although this limit did not apply because the Fund’s total expenses as shown were below the applicable fee limit.
· For Janus Henderson Responsible International Dividend Fund (formerly the Janus Henderson Dividend & Income Builder Fund), the Trustees noted that, although the Fund’s total expenses exceeded the peer group for one share class, overall the Fund’s total expenses were reasonable. The Trustees also noted that the Adviser has contractually agreed to limit the Fund’s expenses.
Money Market Funds
· For Janus Henderson Government Money Market Fund, the Trustees noted that the Fund’s total expenses were below the peer group average for all share classes.
· For Janus Henderson Money Market Fund, the Trustees noted that the Fund’s total expenses were below the peer group average for all share classes.
Multi-Asset Funds
· For Janus Henderson Adaptive Global Allocation Fund, the Trustees noted that the Fund’s total expenses were below the peer group average for all share classes.
· For Janus Henderson Balanced Fund, the Trustees noted that, although the Fund’s total expenses exceeded the peer group average for certain share classes, overall the Fund’s total expenses were reasonable. The Trustees also noted that the Adviser has contractually agreed to limit the Fund’s expenses, although this limit did not apply because the Fund’s total expenses as shown were below the applicable fee limit.
Janus Henderson Money Market Fund
Additional Information (unaudited)
U.S. Equity Funds
· For Janus Henderson Adaptive Risk Managed U.S. Equity Fund, the Trustees noted that, although the Fund’s total expenses exceeded the peer group average for certain share classes, overall the Fund’s total expenses were reasonable. The Trustees also noted that the Adviser has contractually agreed to limit the Fund’s expenses, although this limit did not apply because the Fund’s total expenses as shown were below the applicable fee limit.
· For Janus Henderson Contrarian Fund, the Trustees noted that, although the Fund’s total expenses exceeded the peer group average for all share classes, overall the Fund’s total expenses were reasonable. The Trustees also noted that the Adviser had contractually agreed to limit the Fund’s expenses.
· For Janus Henderson Enterprise Fund, the Trustees noted that, although the Fund’s total expenses exceeded the peer group average for certain share classes, overall the Fund’s total expenses were reasonable. The Trustees also noted that the Adviser has contractually agreed to limit the Fund’s expenses, although this limit did not apply because the Fund’s total expenses as shown were below the applicable fee limit.
· For Janus Henderson Forty Fund, the Trustees noted that, although the Fund’s total expenses exceeded the peer group average for certain share classes, overall the Fund’s total expenses were reasonable. The Trustees also noted that the Adviser has contractually agreed to limit the Fund’s expenses, although this limit did not apply because the Fund’s total expenses as shown were below the applicable fee limit.
· For Janus Henderson Growth and Income Fund, the Trustees noted that, although the Fund’s total expenses exceeded the peer group average for certain share classes, overall the Fund’s total expenses were reasonable. The Trustees also noted that the Adviser has contractually agreed to limit the Fund’s expenses, although this limit did not apply because the Fund’s total expenses as shown were below the applicable fee limit.
· For Janus Henderson Mid Cap Value Fund, the Trustees noted that the Fund’s total expenses were below the peer group average for all share classes.
· For Janus Henderson Research Fund, the Trustees noted that, although the Fund’s total expenses exceeded the peer group average for certain share classes, overall the Fund’s total expenses were reasonable. The Trustees also noted that the Adviser has contractually agreed to limit the Fund’s expenses.
· For Janus Henderson Small Cap Value Fund, the Trustees noted that, although the Fund’s total expenses exceeded the peer group average for one share class, overall the Fund’s total expenses were reasonable. The Trustees also noted that the Adviser has contractually agreed to limit the Fund’s expenses, although this limit did not apply because the Fund’s total expenses as shown were below the applicable fee limit.
· For Janus Henderson Small-Mid Cap Value Fund, the Trustees noted that the Fund’s total expenses were below the peer group average for all share classes.
· For Janus Henderson Triton Fund, the Trustees noted that, although the Fund’s total expenses exceeded the peer group average for one share class, overall the Fund’s total expenses were reasonable. The Trustees also noted that the Adviser has contractually agreed to limit the Fund’s expenses, although this limit did not apply because the Fund’s total expenses as shown were below the applicable fee limit.
· For Janus Henderson Venture Fund, the Trustees noted that although the Fund’s total expenses exceeded the peer group average for one share class, overall the Fund’s total expenses were reasonable. The Trustees also noted that the Adviser has contractually agreed to limit the Fund’s expenses, although this limit did not apply because the Fund’s total expenses as shown were below the applicable fee limit.
The Trustees reviewed information on the overall profitability to the Adviser and its affiliates from their relationships with the Janus Henderson Funds, and considered profitability data of other publicly traded mutual fund advisers. The Trustees recognized that profitability comparisons among fund managers are difficult because of the variation in the type of comparative information that is publicly available, and the profitability of any fund manager is affected by numerous factors, including the organizational structure of the particular fund manager, differences in complex size, difference in product mix, difference in types of business (mutual fund, institutional and other), differences in the types of funds and other accounts it manages, possible other lines of business, the methodology for allocating expenses and the fund manager’s capital structure and cost of capital.
Janus Henderson Money Market Fund
Additional Information (unaudited)
Additionally, the Trustees considered the estimated profitability to the Adviser from the investment management services it provided to each Janus Henderson Fund. In their review, the Trustees considered whether the Adviser receive adequate incentives and resources to manage the Janus Henderson Funds effectively. In reviewing profitability, the Trustees noted that the estimated profitability for an individual Janus Henderson Fund is necessarily a product of the allocation methodology utilized by the Adviser to allocate its expenses as part of the estimated profitability calculation. In this regard, the Trustees noted that the independent fee consultant found as part of its 2022 review that (1) the expense allocation methodology and rationales utilized by the Adviser were reasonable and (2) no clear correlation exists between expense allocations and operating margins. The Trustees also considered that the estimated profitability for an individual Janus Henderson Fund was influenced by a number of factors, including not only the allocation methodology selected, but also the presence of fee waivers and expense caps, and whether the Janus Henderson Fund’s investment management agreement contained breakpoints or a performance fee component. The Trustees determined, after taking into account these factors, among others, that the Adviser’s estimated profitability with respect to each Janus Henderson Fund was not unreasonable in relation to the services provided, and that the variation in the range of such estimated profitability among the Janus Henderson Funds was not a material factor in the Board’s approval of the reasonableness of any Janus Henderson Fund’s investment management fees.
The Trustees concluded that the management fees payable by each Janus Henderson Fund to the Adviser were reasonable in relation to the nature, extent, and quality of the services provided, taking into account the fees charged by other advisers for managing comparable mutual funds with similar strategies, the fees the Adviser charges to other clients, and, as applicable, the impact of fund performance on management fees payable by the Janus Henderson Funds. The Trustees also concluded that each Janus Henderson Fund’s total expenses were reasonable, taking into account the size of the Janus Henderson Fund, the quality of services provided by the Adviser, the investment performance of the Janus Henderson Fund, and any expense limitations agreed to or provided by the Adviser.
Economies of Scale
The Trustees considered information about the potential for the Adviser to realize economies of scale as the assets of the Janus Henderson Funds increase. They noted that their independent fee consultant published a report to the Trustees in June 2022 which provided its research and analysis into economies of scale. They also noted that, although many Janus Henderson Funds pay advisory fees at a fixed base rate as a percentage of net assets, without any breakpoints or performance fees, their independent fee consultant concluded that 75% of these Janus Henderson Funds’ have contractual management fees (gross of waivers) below their Broadridge Expense Group averages. The Trustees also noted the following from the independent fee consultant’s report: (1) that 31% of Janus Henderson Funds had management fee breakpoints in place whereby investors pay lower management fees as fund AUM increases; (2) that 29% of Janus Henderson Funds have low flat-rate fees and performance fees where the Adviser is incentivized to invest in resources which drive Janus Henderson Fund performance; and (3) that 39% of Janus Henderson Funds have low flat-rate fees versus peers where investors pay low fixed fees when the Janus Henderson Fund is small/midsized and higher fees when the Janus Henderson Fund grows in assets. The Trustees also noted that the Janus Henderson Funds share directly in economies of scale through the significant investments made by the Adviser and its affiliates related to services provided to the Funds and the lower charges of third-party service providers that are based in part on the combined scale of all of the Janus Henderson Funds.
The Trustees also considered the independent fee consultant’s conclusion that, given the limitations of various analytical approaches to economies of scale and their conflicting results, it is difficult to analytically confirm or deny the existence of economies of scale in the Janus Henderson complex. In this regard, the independent consultant concluded that (1) to the extent there were economies of scale at the Adviser, the Adviser’s general strategy of setting fixed management fees below peers appeared to share any such economies with investors even on smaller Janus Henderson Funds which have not yet achieved those economies and (2) by setting lower fixed fees from the start on these Janus Henderson Funds, the Adviser appeared to be investing to increase the likelihood that these Janus Henderson Funds will grow to a level to achieve any economies of scale that may exist. Further, the independent fee consultant provided its belief that Janus Henderson Fund investors are well-served by the fee levels and performance fee structures in place on the Janus Henderson Funds in light of any economies of scale that may be present at the Adviser.
Based on all of the information reviewed, including the recent and past research and analysis conducted by the Trustees’ independent fee consultant, the Trustees concluded that the current fee structure of each Janus Henderson Fund was reasonable and that the current rates of fees do reflect a sharing between the Adviser and the Janus
Janus Henderson Money Market Fund
Additional Information (unaudited)
Henderson Fund of any economies of scale that may be present at the current asset level of the Janus Henderson Fund.
Other Benefits to the Adviser
The Trustees also considered benefits that accrue to the Adviser and its affiliates from their relationships with the Janus Henderson Funds. They recognized that two affiliates of the Adviser separately serve the Janus Henderson Funds as transfer agent and distributor, respectively, and the transfer agent receives compensation directly from the non-money market Janus Henderson Funds for services provided, and that such compensation contributes to the overall profitability of the Adviser and its affiliates that results from their relationship with the Janus Henderson Funds. The Trustees also considered the Adviser’s past and proposed use of commissions paid by the Janus Henderson Funds on portfolio brokerage transactions to obtain proprietary and third-party research products and services benefiting the Janus Henderson Fund and/or other clients of the Adviser and/or the Adviser. The Trustees concluded that the Adviser’s use of these types of client commission arrangements to obtain proprietary and third-party research products and services was consistent with regulatory requirements and guidelines and was likely to benefit each Janus Henderson Fund. The Trustees also concluded that, other than the services provided by the Adviser and its affiliates pursuant to the agreements and the fees to be paid by each Janus Henderson Fund therefor, the Janus Henderson Funds and the Adviser may potentially benefit from their relationship with each other in other ways. They concluded that the Adviser and its affiliates share directly in economies of scale through the lower charges of third-party service providers that are based in part on the combined scale of the Janus Henderson Funds and other clients serviced by the Adviser and its affiliates. They also concluded that the Adviser benefits from the receipt of research products and services acquired through commissions paid on portfolio transactions of the Janus Henderson Funds and that the Janus Henderson Funds benefit from the Adviser’s receipt of those products and services as well as research products and services acquired through commissions paid by other clients of the Adviser. They further concluded that the success of any Janus Henderson Fund could attract other business to the Adviser or other Janus Henderson Funds, and that the success of the Adviser could enhance the Adviser’s ability to serve the Janus Henderson Funds.
Janus Henderson Money Market Fund
Liquidity Risk Management Program (unaudited)
Liquidity Risk Management Program
Rule 22e-4 under the Investment Company Act of 1940, as amended (the “Liquidity Rule”), requires open-end funds (but not money market funds) to adopt and implement a written liquidity risk management program (the “LRMP”) that is reasonably designed to assess and manage liquidity risk, which is the risk that a fund could not meet redemption requests without significant dilution of remaining investors’ interest in the fund. The Fund has implemented a LRMP, which incorporates the following elements: (i) assessment, management, and periodic review of liquidity risk; (ii) classification of portfolio holdings; (iii) the establishment and monitoring of a highly liquid investment minimum, as applicable; (iv) a 15% limitation on a Fund’s illiquid investments; (v) redemptions in-kind; and (vi) board oversight.
The Trustees of the Fund (the “Trustees”) have designated Janus Henderson Investors US LLC, the Fund’s investment adviser (the “Adviser”), as the Program Administrator for the LRMP responsible for administering the LRMP and carrying out the specific responsibilities of the LRMP. A working group comprised of various teams within the Adviser’s business is responsible for administering the LRMP and carrying out the specific responsibilities of different aspects of the LRMP (the “Liquidity Risk Working Group”). In assessing each Fund’s liquidity risk, the Liquidity Risk Working Group periodically considers, as relevant, factors including (i) the liquidity of a Fund’s portfolio investments during normal and reasonably foreseeable stressed conditions; (ii) whether a Fund’s investment strategy is appropriate for an open-end fund; (iii) the extent to which a Fund’s strategy involves a relatively concentrated portfolio or large positions in any issuer; (iv) a Fund’s use of borrowing for investment purposes; and (v) a Fund’s use of derivatives.
The Liquidity Rule requires the Trustees to review at least annually a written report provided by the Program Administrator that addresses the operation of the LRMP and assesses its adequacy and the effectiveness of its implementation, including, if applicable, the operation of the highly liquid investment minimum, and any material changes to the LRMP (the “Program Administrator Report”). At a meeting held on March 15, 2023, the Adviser provided the Program Administrator Report to the Trustees which covered the operation of the LRMP from January 1, 2022 through December 31, 2022 (the “Reporting Period”).
The Program Administrator Report discussed the operation and effectiveness of the LRMP during the Reporting Period. Among other things, the Program Administrator Report indicated that there were no material changes to the LRMP during the Reporting Period, although there were certain methodology adjustments implemented relating to a change in data provider. Additionally, the findings presented in the Program Administrator Report indicated that the LRMP operated adequately during the Reporting Period. These findings included that the Fund was able to meet redemptions during the normal course of business during the Reporting Period. The Program Administrator Report also stated that the Fund did not exceed the 15% limit on illiquid assets during the Reporting Period, that the Fund held primarily highly liquid assets, and was considered to be a primarily highly liquid fund during the Reporting Period. Also included among the Program Administrator Report’s findings was the determination that the Fund’s investment strategy remains appropriate for an open-end fund. In addition, the Adviser expressed its belief in the Program Administrator Report that the LRMP is reasonably designed and adequate to assess and manage the Fund’s liquidity risk, considering the Fund’s particular risks and circumstances, and includes policies and procedures reasonably designed to implement each required component of the Liquidity Rule.
There can be no assurance that the LRMP will achieve its objectives in the future. Please refer to your Fund’s prospectus for more information regarding the risks to which an investment in the Fund may be subject.
Janus Henderson Money Market Fund
Useful Information About Your Fund Report (unaudited)
Performance Overviews
Average annual total returns are quoted for a Fund with more than one year of performance history. Average annual total return is calculated by taking the growth or decline in value of an investment over a period of time, including reinvestment of dividends and distributions, then calculating the annual compounded percentage rate that would have produced the same result had the rate of growth been constant throughout the period. Average annual total return does not reflect the deduction of taxes that a shareholder would pay on Fund distributions or redemptions of Fund shares.
Pursuant to federal securities rules, expense ratios shown in the performance chart reflect subsidized (if applicable) and unsubsidized ratios. The total annual fund operating expenses ratio is gross of any fee waivers, reflecting the Fund’s unsubsidized expense ratio. The net annual fund operating expenses ratio (if applicable) includes contractual waivers of Janus Capital and reflects the Fund’s subsidized expense ratio. Ratios may be higher or lower than those shown in the “Financial Highlights” in this report.
Schedule of Investments
Following the performance overview section is the Fund’s Schedule of Investments. This schedule reports the types of securities held in the Fund on the last day of the reporting period. Securities are usually listed by type (common stock, corporate bonds, U.S. Government obligations, etc.) and by industry classification (banking, communications, insurance, etc.). Holdings are subject to change without notice.
The value of each security is quoted as of the last day of the reporting period. The value of securities denominated in foreign currencies is converted into U.S. dollars.
If the Fund invests in foreign securities, it will also provide a summary of investments by country. This summary reports the Fund exposure to different countries by providing the percentage of securities invested in each country. The country of each security represents the country of risk. The Fund’s Schedule of Investments relies upon the industry group and country classifications published by Bloomberg and/or MSCI Inc.
Tables listing details of individual forward currency contracts, futures, written options, swaptions, and swaps follow the Fund’s Schedule of Investments (if applicable).
Statement of Assets and Liabilities
This statement is often referred to as the “balance sheet.” It lists the assets and liabilities of the Fund on the last day of the reporting period.
The Fund’s assets are calculated by adding the value of the securities owned, the receivable for securities sold but not yet settled, the receivable for dividends declared but not yet received on securities owned, and the receivable for Fund shares sold to investors but not yet settled. The Fund’s liabilities include payables for securities purchased but not yet settled, Fund shares redeemed but not yet paid, and expenses owed but not yet paid. Additionally, there may be other assets and liabilities such as unrealized gain or loss on forward currency contracts.
The section entitled “Net Assets Consist of” breaks down the components of the Fund’s net assets. Because the Fund must distribute substantially all earnings, you will notice that a significant portion of net assets is shareholder capital.
The last section of this statement reports the net asset value (“NAV”) per share on the last day of the reporting period. The NAV is calculated by dividing the Fund’s net assets for each share class (assets minus liabilities) by the number of shares outstanding.
Statement of Operations
This statement details the Fund’s income, expenses, realized gains and losses on securities and currency transactions, and changes in unrealized appreciation or depreciation of Fund holdings.
The first section in this statement, entitled “Investment Income,” reports the dividends earned from securities and interest earned from interest-bearing securities in the Fund.
The next section reports the expenses incurred by the Fund, including the advisory fee paid to the investment adviser, transfer agent fees and expenses, and printing and postage for mailing statements, financial reports and prospectuses. Expense offsets and expense reimbursements, if any, are also shown.
Janus Henderson Money Market Fund
Useful Information About Your Fund Report (unaudited)
The last section lists the amounts of realized gains or losses from investment and foreign currency transactions, and changes in unrealized appreciation or depreciation of investments and foreign currency-denominated assets and liabilities. The Fund will realize a gain (or loss) when it sells its position in a particular security. A change in unrealized gain (or loss) refers to the change in net appreciation or depreciation of the Fund during the reporting period. “Net Realized and Unrealized Gain/(Loss) on Investments” is affected both by changes in the market value of Fund holdings and by gains (or losses) realized during the reporting period.
Statements of Changes in Net Assets
These statements report the increase or decrease in the Fund’s net assets during the reporting period. Changes in the Fund’s net assets are attributable to investment operations, dividends and distributions to investors, and capital share transactions. This is important to investors because it shows exactly what caused the Fund’s net asset size to change during the period.
The first section summarizes the information from the Statement of Operations regarding changes in net assets due to the Fund’s investment operations. The Fund’s net assets may also change as a result of dividend and capital gains distributions to investors. If investors receive their dividends and/or distributions in cash, money is taken out of the Fund to pay the dividend and/or distribution. If investors reinvest their dividends and/or distributions, the Fund’s net assets will not be affected.
The reinvestment of dividends and distributions is included under “Capital Share Transactions.” “Capital Shares” refers to the money investors contribute to the Fund through purchases or withdrawals via redemptions. The Fund’s net assets will increase and decrease in value as investors purchase and redeem shares from the Fund.
Financial Highlights
This schedule provides a per-share breakdown of the components that affect the Fund’s NAV for current and past reporting periods as well as total return, asset size, ratios, and portfolio turnover rate.
The first line in the table reflects the NAV per share at the beginning of the reporting period. The next line reports the net investment income/(loss) per share. Following is the per share total of net gains/(losses), realized and unrealized. Per share dividends and distributions to investors are then subtracted to arrive at the NAV per share at the end of the period. The next line reflects the total return for the period. The total return may include adjustments in accordance with generally accepted accounting principles required at the period end for financial reporting purposes. As a result, the total return may differ from the total return reflected for individual shareholder transactions. Also included are ratios of expenses and net investment income to average net assets.
The Fund’s expenses may be reduced through expense offsets and expense reimbursements. The ratios shown reflect expenses before and after any such offsets and reimbursements.
The ratio of net investment income/(loss) summarizes the income earned less expenses, divided by the average net assets of the Fund during the reporting period. Do not confuse this ratio with the Fund’s yield. The net investment income ratio is not a true measure of the Fund’s yield because it does not take into account the dividends distributed to the Fund’s investors.
The next figure is the portfolio turnover rate, which measures the buying and selling activity in the Fund. Portfolio turnover is affected by market conditions, changes in the asset size of the Fund, fluctuating volume of shareholder purchase and redemption orders, the nature of the Fund’s investments, and the investment style and/or outlook of the portfolio manager(s) and/or investment personnel. A 100% rate implies that an amount equal to the value of the entire portfolio was replaced once during the fiscal year; a 50% rate means that an amount equal to the value of half the portfolio is traded in a year; and a 200% rate means that an amount equal to the value of the entire portfolio is traded every six months.
Janus Henderson Money Market Fund
Designation Requirements (unaudited)
For federal income tax purposes, the Fund designated the following for the year ended June 30, 2023:
| | |
| | |
Section 163(j) Interest Dividend | 100% |
Capital Gain Distributions | $17,928 |
Janus Henderson Money Market Fund
Trustees and Officers (unaudited)
The following are the Trustees and officers of the Trust, together with a brief description of their principal occupations during the last five years (principal occupations for certain Trustees may include periods over five years). The Fund’s Statement of Additional Information includes additional information about the Trustees and officers and is available, without charge, by calling 1-877-335-2687.
Each Trustee has served in that capacity since he or she was originally elected or appointed. The Trustees do not serve a specified term of office. Each Trustee will hold office until the termination of the Trust or his or her earlier death, resignation, retirement, incapacity, or removal. Under the Fund’s Governance Procedures and Guidelines, the policy is for Trustees to retire no later than the end of the calendar year in which the Trustee turns 75. The Trustees review the Fund’s Governance Procedures and Guidelines from time to time and may make changes they deem appropriate. The Fund’s Nominating and Governance Committee will consider nominees for the position of Trustee recommended by shareholders. Shareholders may submit the name of a candidate for consideration by the Committee by submitting their recommendations to the Trust’s Secretary. Each Trustee is currently a Trustee of one other registered investment company advised by the Adviser: Janus Aspen Series. Collectively, these two registered investment companies consist of 49 series or funds referred to herein as the Fund Complex.
The Trust’s officers are elected annually by the Trustees for a one-year term. Certain officers also serve as officers of Janus Aspen Series. Certain officers of the Fund may also be officers and/or directors of the Adviser. Except as otherwise disclosed, Fund officers receive no compensation from the Fund, except for the Fund’s Chief Compliance Officer, as authorized by the Trustees.
| | | | | | |
TRUSTEES |
Name, Address, and Age | Positions Held with the Trust | Length of Time Served | Principal Occupations During the Past Five Years | Number of Portfolios/Funds in Fund Complex Overseen by Trustee | Other Directorships Held by Trustee During the Past Five Years |
Independent Trustees | | | | |
Alan A. Brown
151 Detroit Street
Denver, CO 80206
DOB: 1962 | Chairman
Trustee | 5/22-Present
1/13-Present | Principal, Curam Holdings LLC (since 2018). Formerly, Executive Vice President, Institutional Markets, of Black Creek Group (private equity real estate investment management firm) (2012-2018), Executive Vice President and Co-Head, Global Private Client Group (2007-2010), Executive Vice President, Mutual Funds (2005-2007), and Chief Marketing Officer (2001-2005) of Nuveen Investments, Inc. (asset management). | 49 | Advisory Board Member of AEW Core Property Trust (open-end property fund) (since 2020), and Director of WTTW (PBS affiliate) (since 2003). Formerly, Director of MotiveQuest LLC (strategic social market research company) (2003-2016), Director of Nuveen Global Investors LLC (2007-2011), Director of Communities in Schools (2004-2010), and Director of Mutual Fund Education Alliance (until 2010). |
Janus Henderson Money Market Fund
Trustees and Officers (unaudited)
| | | | | | |
TRUSTEES |
Name, Address, and Age | Positions Held with the Trust | Length of Time Served | Principal Occupations During the Past Five Years | Number of Portfolios/Funds in Fund Complex Overseen by Trustee | Other Directorships Held by Trustee During the Past Five Years |
Independent Trustees | | | | |
Cheryl D. Alston
151 Detroit Street
Denver, CO 80206
DOB: 1966 | Trustee | 8/22-Present | Executive Director and Chief Investment Officer, Employees’ Retirement Fund of the City of Dallas (since 2004). | 49 | Director of Blue Cross Blue Shield of Kansas City (a not-for-profit health insurance provider) (since 2016) and Director of Global Life Insurance (life and supplemental health insurance provider) (since 2017). Formerly, Director of Federal Home Loan Bank of Dallas (2017-2021). |
Janus Henderson Money Market Fund
Trustees and Officers (unaudited)
| | | | | | |
TRUSTEES |
Name, Address, and Age | Positions Held with the Trust | Length of Time Served | Principal Occupations During the Past Five Years | Number of Portfolios/Funds in Fund Complex Overseen by Trustee | Other Directorships Held by Trustee During the Past Five Years |
Independent Trustees | | | | |
Janus Henderson Money Market Fund
Trustees and Officers (unaudited)
| | | | | | |
William D. Cvengros
151 Detroit Street
Denver, CO 80206
DOB: 1948 | Trustee | 1/11-Present | Chief Executive Officer of SJC Capital, LLC (a personal investment company and consulting firm) (since 2002). Formerly, Chief Executive Officer and President of PIMCO Advisors Holdings L.P. (a publicly traded investment management firm) (1994-2000), and Chief Investment Officer (1987-1994) and Vice Chairman and Director (1990-1994) of Pacific Life Insurance Company (a mutual life insurance and annuity company) (1987-1994). | 49 | Member, Limited Partner Advisory Committee, Karmel Capital Fund III (later stage growth fund) (since 2022), Member of the Investment Committee for the Orange County Community Foundation (a grantmaking foundation) (since 2020), Advisory Board Member, RevOZ Fund LP and related funds (real estate investments for opportunity zones) (since 2020), and Advisory Board Member, Innovate Partners Emerging Growth and Equity Fund I (early stage venture capital fund) (since 2014). Formerly, Managing Trustee of National Retirement Partners Liquidating Trust (2013-2016), Chairman, National Retirement Partners, Inc. (formerly a network of advisors to 401(k) plans) (2005-2013), Director of Prospect Acquisition Corp. (a special purpose acquisition corporation) (2007-2009), Director of RemedyTemp, Inc. (temporary help services company) (1996-2006), and Trustee of PIMCO Funds Multi-Manager Series (1990-2000) and Pacific Life Variable Life & Annuity Trusts (1987-1994). |
Janus Henderson Money Market Fund
Trustees and Officers (unaudited)
| | | | | | |
TRUSTEES |
Name, Address, and Age | Positions Held with the Trust | Length of Time Served | Principal Occupations During the Past Five Years | Number of Portfolios/Funds in Fund Complex Overseen by Trustee | Other Directorships Held by Trustee During the Past Five Years |
Independent Trustees | | | | |
Raudline Etienne
151 Detroit Street
Denver, CO 80206
DOB: 1965 | Trustee | 6/16-Present | Founder, Daraja Capital (advisory and investment firm) (since 2016). Formerly, Senior Vice President and Senior Advisor, Albright Stonebridge Group LLC (global strategy firm) (2011-2021), and Deputy Comptroller and Chief Investment Officer, New York State Common Retirement Fund (public pension fund) (2008-2011). | 49 | Member of the Investment Committee for Cooper Union (private college) (since 2021) and Director of Brightwood Capital Advisors, LLC (since 2014). Formerly, Board Member, Van Alen Institute (nonprofit architectural and design organization) (2019-2022). |
Darrell B. Jackson
151 Detroit Street
Denver, CO 80206
DOB: 1958 | Trustee | 8/22-Present | President and Chief Executive Officer, The Efficace Group Inc. (since 2018). Formerly, President and Chief Executive Officer, Seaway Bank and Trust Company (community bank) (2014-2015), and Executive Vice President and Co-President, Wealth Management (2009-2014), and several senior positions, including Group Executive, Senior Vice President, and Vice President (1995-2009) of Northern Trust Company (financial services company) (1995-2014). | 49 | Director of Amalgamated Financial Corp (bank) (since August 2021), Director of YR Media (a not-for-profit production company) (since 2021), and Director of Gray-Bowen-Scott (transportation project consulting firm) (since April 2020). Formerly, Director of Delaware Place Bank (closely held commercial bank) (2016-2018) and Director of Seaway Bank and Trust Company (2014-2015). |
Janus Henderson Money Market Fund
Trustees and Officers (unaudited)
| | | | | | |
TRUSTEES |
Name, Address, and Age | Positions Held with the Trust | Length of Time Served | Principal Occupations During the Past Five Years | Number of Portfolios/Funds in Fund Complex Overseen by Trustee | Other Directorships Held by Trustee During the Past Five Years |
Independent Trustees | | | | |
William F. McCalpin
151 Detroit Street
Denver, CO 80206
DOB: 1957 | Trustee | 6/02-Present | Chief Executive Officer, muun chi LLC (organic food business) (since 2022) and Independent Consultant (since 2019). Formerly, Chief Operating Officer, muun chi LLC (2020-2022), Managing Partner, Impact Investments, Athena Capital Advisors LLC (independent registered investment advisor) (2016-2019), Managing Director, Holos Consulting LLC (provides consulting services to foundations and other nonprofit organizations) (2009-2016), Chief Executive Officer, Imprint Capital Advisors (impact investment firm) (2013-2015), and Executive Vice President and Chief Operating Officer of The Rockefeller Brothers Fund (a private family foundation) (1998-2006). | 49 | Chairman of the Board and Trustee of The Investment Fund for Foundations Investment Program (TIP) (consisting of 1 fund) (since 2008). Formerly, Director of the F.B. Heron Foundation (a private grantmaking foundation) (2006-2022), and Director of Mutual Fund Directors Forum (a non-profit organization serving independent directors of U.S. mutual funds) (2016-2021). |
Janus Henderson Money Market Fund
Trustees and Officers (unaudited)
| | | | | | |
TRUSTEES |
Name, Address, and Age | Positions Held with the Trust | Length of Time Served | Principal Occupations During the Past Five Years | Number of Portfolios/Funds in Fund Complex Overseen by Trustee | Other Directorships Held by Trustee During the Past Five Years |
Independent Trustees | | | | |
Gary A. Poliner
151 Detroit Street
Denver, CO 80206
DOB: 1953 | Trustee | 6/16-Present | Retired. Formerly, President (2010-2013) of Northwestern Mutual Life Insurance Company. | 49 | Director of MGIC Investment Corporation (private mortgage insurance) (since 2013). Formerly, Director, West Bend Mutual Insurance Company (property/casualty insurance) (2013-2021), Trustee of Northwestern Mutual Life Insurance Company (2010-2013) and Director of Frank Russell Company (global asset management firm) (2008-2013). |
Diane L. Wallace
151 Detroit Street
Denver, CO 80206
DOB: 1958 | Trustee | 6/17-Present | Retired. Formerly, Chief Operating Officer, Senior Vice President-Operations, and Chief Financial Officer for Driehaus Capital Management, LLC (1988-2006) and Treasurer for Driehaus Mutual Funds (1996-2002). | 49 | Formerly, Director of Family Service of Lake County (2019-2021), Independent Trustee, Henderson Global Funds (13 portfolios) (2015-2017), Independent Trustee, State Farm Associates’ Funds Trust, State Farm Mutual Fund Trust, and State Farm Variable Product Trust (28 portfolios) (2013-2017). |
Janus Henderson Money Market Fund
Trustees and Officers (unaudited)
| | | | |
OFFICERS |
Name, Address, and Age | Positions Held with the Trust | Term of Office* and Length of Time Served | Principal Occupations During the Past Five Years |
Vincent Ahn
151 Detroit Street
Denver, CO 80206
DOB: 1987 | Executive Vice President and Co-Portfolio Manager
Janus Henderson Money Market Fund | 11/22-Present | Portfolio Manager for other Janus Henderson accounts. |
Garrett Strum
151 Detroit Street
Denver, CO 80206
DOB: 1981 | Executive Vice President and Co-Portfolio Manager
Janus Henderson Money Market Fund | 5/17-Present | Portfolio Manager for other Janus Henderson accounts and Analyst for the Adviser. |
Michelle Rosenberg
151 Detroit Street
Denver, CO 80206
DOB: 1973 | President and Chief Executive Officer | 9/22-Present | General Counsel and Corporate Secretary of Janus Henderson Investors (since 2018). Formerly, Interim President and Chief Executive Officer of the Trust and Janus Aspen Series (2022), Senior Vice President and Head of Legal, North America of Janus Henderson Investors (2017-2018) and Deputy General Counsel of Janus Henderson US (Holdings) Inc. (2015-2018). |
Kristin Mariani
151 Detroit Street
Denver, CO 80206
DOB: 1966 | Vice President and Chief Compliance Officer | 7/20-Present | Head of Compliance, North America at Janus Henderson Investors (since September 2020) and Chief Compliance Officer at Janus Henderson Investors US LLC (since September 2017). Formerly, Anti-Money Laundering Officer for the Trust and Janus Aspen Series (July 2020-December 2022), Global Head of Investment Management Compliance at Janus Henderson Investors (February 2019-August 2020), Vice President, Head of Global Distribution Compliance and Chief Compliance Officer at Janus Henderson Distributors US LLC (May 2017-September 2017), Vice President, Compliance at Janus Henderson US (Holdings) Inc., Janus Henderson Investors US LLC, and Janus Henderson Distributors US LLC (2009-2017). |
Janus Henderson Money Market Fund
Trustees and Officers (unaudited)
| | | | |
OFFICERS |
Name, Address, and Age | Positions Held with the Trust | Term of Office* and Length of Time Served | Principal Occupations During the Past Five Years |
Jesper Nergaard
151 Detroit Street
Denver, CO 80206
DOB: 1962 | Chief Financial Officer
Vice President, Treasurer, and Principal Accounting Officer | 3/05-Present
2/05-Present | Head of U.S. Fund Administration, Janus Henderson Investors and Janus Henderson Services US LLC. |
Abigail J. Murray
151 Detroit Street
Denver, CO 80206
DOB: 1975 | Vice President, Chief Legal Counsel, and Secretary | 12/20-Present | Managing Counsel (since 2020). Formerly, Senior Counsel for Invesco Ltd. (2017-2020), and Vice President and Senior Counsel, ALPS Fund Services, Inc. and Assistant General Counsel, ALPS Advisors, Inc. (2015-2017). |
Ciaran Askin
151 Detroit Street
Denver, CO 80206
DOB: 1978 | Anti-Money Laundering Officer | 12/22-Present | Global Head of Financial Crime, Janus Henderson Investors (since 2022). Formerly, Global Head of Financial Crime for Invesco Ltd. (2017-2022). |
* Officers are elected at least annually by the Trustees for a one-year term and may also be elected from time to time by the Trustees for an interim period. |
Janus Henderson Money Market Fund
Notes
NotesPage1
Janus Henderson Money Market Fund
Notes
NotesPage2
Janus Henderson Money Market Fund
Notes
NotesPage3
| | | | | | | | |
| | | | | |

| | | | |
This report is submitted for the general information of shareholders of the Fund. It is not an offer or solicitation for the Fund and is not authorized for distribution to prospective investors unless preceded or accompanied by an effective prospectus. |
Janus Henderson is a trademark of Janus Henderson Group plc or one of its subsidiaries. © Janus Henderson Group plc Janus Henderson Distributors US LLC Janus Henderson Group is the ultimate parent of Janus Henderson Distributors US LLC |
| | | | 125-02-93027 08-23 |
| | | |
| | | |
| | | ANNUAL REPORT June 30, 2023 |
| | |
| | Janus Henderson Multi-Sector Income Fund |
| | |
| | Janus Investment Fund |
| |
| | | |
| | | HIGHLIGHTS · Portfolio management perspective · Investment strategy behind your fund · Fund performance, characteristics
and holdings |
Table of Contents
Janus Henderson Multi-Sector Income Fund
Janus Henderson Multi-Sector Income Fund (unaudited)
| | | | | | |
| | | 
John Kerschner co-portfolio manager | 
John Lloyd co-portfolio manager | 
Seth Meyer co-portfolio manager |
| | | |
PERFORMANCE OVERVIEW
For the 12-month period ended June 30, 2023, the Janus Henderson Multi-Sector Income Fund’s Class I shares returned 2.72% compared with a -0.94% return for the Fund’s benchmark, the Bloomberg U.S. Aggregate Bond Index.
MARKET ENVIRONMENT
The U.S. fixed income market posted a negative return over the past 12 months, with the Bloomberg U.S. Aggregate Bond Index declining 0.94%. Positive returns in investment-grade and high-yield corporates were offset by negative performance in U.S. Treasuries.
The Treasury yield curve became more inverted, and yields rose across the board. The Federal Reserve (Fed) consistently raised rates to combat inflation before taking a hawkish pause in June 2023 to evaluate the impact of its prior rate hikes. However, the dot plot projection released with the Fed Minutes implied two incremental rate increases before the end of the year.
Rising investor concerns about an economic hard landing pressured returns in the last six months of 2022. However, these concerns dissipated in 2023 as GDP growth exceeded expectations, inflation moderated, and the labor market consistently showed signs of resilience. As a result, expectations for a soft landing increased and risk assets rallied in the back half of the 12-month period.
The yield on the 10-year U.S. Treasury ended June 2023 at 3.84% relative to 3.01% in June of last year. Over the past 12 months, corporate investment-grade credit spreads tightened 32 basis points to 1.23% and high-yield credit spreads tightened 179 basis points to 3.90%.
PERFORMANCE DISCUSSION
Treasury rates rode the proverbial roller coaster during the period, and we actively managed duration amid the volatility. Our overall interest rate positioning largely balanced the opposing forces of high and sticky inflation and a hawkish Fed with the chances of an economic slowdown. Our consistent duration underweight was a contributor to relative outperformance during the fiscal year. By period end, we believed much of the rise in rates had already occurred and we moved to increase duration in the Fund, though we remained underweight.
Our overall credit spread risk positioning strongly contributed to relative returns. The Fund’s structural overweight allocation to spread risk was the main driver of relative outperformance. Notably, our overweight exposure to securitized sectors contributed, including mortgage-backed securities (MBS), commercial mortgage-backed securities (CMBS), asset-backed securities (ABS), commercial mortgage obligations (CMO), and collateralized loan obligations (CLO). We continue to prefer a higher exposure to securitized credit relative to corporate credit, as we believe spreads on the former are attractively valued and better reflect the risk of a cooling economy. In our view, taking advantage of the yield available at the front end of the yield curve through high-quality, short-duration securitized credit is one of the most attractive spots in fixed income now. While our allocation to corporates remains near cycle lows, high yield contributed strongly. Our underweight allocation to investment-grade corporates detracted, somewhat offsetting relative outperformance.
We continue to be selective and active within the Fund’s exposure to the banking sector and CMBS. Our banking exposure is consolidated in banks we believe are best positioned to navigate a more challenging lending
Janus Henderson Multi-Sector Income Fund (unaudited)
environment. Within CMBS, we have de minimis exposure to the troubled office sector, preferring sectors with strong fundamentals such as multifamily housing, industrial, and hospitality.
DERIVATIVES USAGE
The Fund made use of derivative instruments in the form of Treasury futures contracts to manage interest rate risk and credit swap contracts to manage credit risk, during the period. Use of derivatives detracted for the 12-month period ended June 30, 2023. Please see the Derivative Instruments section in the “Notes to Financial Statements” for a discussion of derivatives used by the Fund.
OUTLOOK
The U.S. economy continues to show resilience in the face of higher interest rates, which is encouraging. As the Fed rate hiking cycle marches deeper into its second year, the recession many predicted is yet to materialize. That said, investors should exercise caution – we believe an economic slowdown remains a distinct possibility. Monetary policy works in long and variable lags and, to a large extent, we are yet to feel the full impact of prior rate hikes. A positive development is the easing of recent stress in the banking sector. Notwithstanding, we do expect tighter lending conditions, which is likely to be an additional headwind.
On the core inflation front, we have seen some promising signs of cooling prices. Still, we think the move from the present level of around 4% to the Fed’s target of 2% might end up being slower and bumpier than markets are expecting. In our view, it seems unlikely that inflation would come back down to 2% without an economic slowdown. So, while the probability thereof has increased, we still think the chance of a soft landing remains low.
Most developed market central banks continue to push in the same upward direction on interest rates, but this is now largely priced into rates markets. We think the risk that interest rates go materially higher from here is slim, while a stronger-for-longer economy is likely to necessitate a higher-for-longer interest rate environment. As such, taking advantage of the yield available at the front end of the yield curve through high-quality, short-duration credit remains one of the most attractive spots in fixed income. At the same time, we are also more comfortable adding duration risk at current levels, thereby providing much-needed defensive characteristics for portfolios.
There are both positive and negative scenarios on the horizon, but it is late in the cycle, so we remain cautious around the overall amount of spread risk in the portfolio. As such, we eschew lower-quality issuers and industries that are more sensitive to tighter lending conditions, while favoring exposure to securitized sectors where spreads better reflect the risks of our outlook. And, as always, we maintain a dynamic and flexible approach that we believe can take advantage of opportunities that present themselves as the environment evolves.
Thank you for investing in the Janus Henderson Multi-Sector Income Fund.
An inverted yield curve occurs when short-term yields are higher than long-term yields.
Credit Spread is the difference in yield between securities with similar maturity but different credit quality. Widening spreads generally indicate deteriorating creditworthiness of corporate borrowers, and narrowing indicate improving.
Basis point (bp) equals 1/100 of a percentage point. 1 bp = 0.01%, 100 bps = 1%.
Duration measures a bond price’s sensitivity to changes in interest rates. The longer a bond’s duration, the higher its sensitivity to changes in interest rates and vice versa.
Important Notice – Tailored Shareholder Reports
Effective January 24, 2023, the Securities and Exchange Commission (the “SEC”) adopted rule and form amendments that require mutual funds and exchange-traded funds to provide shareholders with streamlined annual and semi-annual shareholder reports that highlight key information. Other information, including financial statements, that currently appears in shareholder reports will be made available online, delivered free of charge to shareholders upon request, and filed with the SEC. The first tailored shareholder report for the Fund will be for the reporting period ending June 30, 2024. Currently, management is evaluating the impact of the rule and form amendments on the content of the Fund’s current shareholder reports.
Janus Henderson Multi-Sector Income Fund (unaudited)
Fund At A Glance
June 30, 2023
| | | |
Fund Profile | | |
30-day SEC Yield* | Without
Reimbursement | With
Reimbursement |
Class A Shares NAV | 4.59% | 4.59% |
Class A Shares MOP | 4.37% | 4.37% |
Class C Shares** | 3.82% | 3.82% |
Class D Shares | 4.79% | 4.79% |
Class I Shares | 4.80% | 4.80% |
Class N Shares | 4.92% | 4.92% |
Class S Shares | 4.26% | 4.36% |
Class T Shares | 4.67% | 4.67% |
Weighted Average Maturity | 5.4 Years |
Average Effective Duration*** | 4.1 Years |
* Yield will fluctuate. | |
** Does not include the 1.00% contingent deferred sales charge. |
*** A theoretical measure of price volatility. |
| | |
Ratings† Summary - (% of Total Investments) | |
AAA | 2.7% |
AA | 26.6% |
A | 3.0% |
BBB | 13.4% |
BB | 15.2% |
B | 9.1% |
CCC | 2.6% |
CC | 0.1% |
Not Rated | 45.6% |
Other | -18.3% |
† Credit ratings provided by Standard & Poor's (S&P), an independent credit rating agency. Credit ratings range from AAA (highest) to D (lowest) based on S&P's measures. Further information on S&P's rating methodology may be found at www.standardandpoors.com. Other rating agencies may rate the same securities differently. Ratings are relative and subjective and are not absolute standards of quality. Credit quality does not remove market risk and is subject to change. "Not Rated" securities are not rated by S&P, but may be rated by other rating agencies and do not necessarily indicate low quality. "Other" includes cash equivalents, equity securities, and certain derivative instruments. |
Significant Areas of Investment - (% of Net Assets)
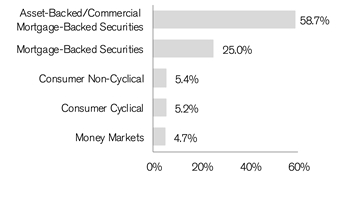
| | | | | | |
Asset Allocation - (% of Net Assets) | |
Asset-Backed/Commercial Mortgage-Backed Securities | | 58.7% | |
Corporate Bonds | | 27.1% | |
Mortgage-Backed Securities | | 25.0% | |
Bank Loans and Mezzanine Loans | | 6.3% | |
Investment Companies | | 4.7% | |
Investments Purchased with Cash Collateral from Securities Lending | | 0.6% | |
Common Stocks | | 0.1% | |
Preferred Stocks | | 0.1% | |
Other | | (22.6)% |
| | | 100.0% |
Janus Henderson Multi-Sector Income Fund (unaudited)
Performance
| |
See important disclosures on the next page. |

| | | | | | | | | | |
| | | | | | | | |
| | | | | | | | |
Average Annual Total Return - for the periods ended June 30, 2023 | | | Prospectus Expense Ratios |
| | One
Year | Five
Year | Since
Inception* | | | Total Annual Fund
Operating Expenses‡ | Net Annual Fund
Operating Expenses‡ |
Class A Shares at NAV | | 2.50% | 2.02% | 3.01% | | | 0.90% | 0.90% |
Class A Shares at MOP | | -2.42% | 1.03% | 2.47% | | | | |
Class C Shares at NAV | | 1.77% | 1.24% | 2.25% | | | 1.68% | 1.68% |
Class C Shares at CDSC | | 0.80% | 1.24% | 2.25% | | | | |
Class D Shares | | 2.67% | 2.17% | 3.17% | | | 0.74% | 0.74% |
Class I Shares | | 2.72% | 2.24% | 3.26% | | | 0.69% | 0.69% |
Class N Shares | | 2.82% | 2.30% | 3.32% | | | 0.59% | 0.59% |
Class S Shares | | 2.28% | 1.93% | 2.93% | | | 1.45% | 1.14% |
Class T Shares | | 2.57% | 2.09% | 3.08% | | | 0.84% | 0.84% |
Bloomberg U.S. Aggregate Bond Index | | -0.94% | 0.77% | 1.36% | | | | |
Morningstar Quartile - Class I Shares | | 3rd | 2nd | 1st | | | | |
Morningstar Ranking - based on total returns for Multisector Bond Funds | | 245/355 | 92/279 | 16/210 | | | | |
Returns quoted are past performance and do not guarantee future results; current performance may be lower or higher. Investment returns and principal value will vary; there may be a gain or loss when shares are sold. For the most recent month-end performance call 800.668.0434 (or 800.525.3713 if you hold shares directly with Janus Henderson) or visit janushenderson.com/performance (or janushenderson.com/allfunds if you hold shares directly with Janus Henderson).
Maximum Offering Price (MOP) returns include the maximum sales charge of 4.75%. Net Asset Value (NAV) returns exclude this charge, which would have reduced returns.
CDSC returns include a 1% contingent deferred sales charge (CDSC) on Shares redeemed within 12 months of purchase. Net Asset Value (NAV) returns exclude this charge, which would have reduced returns.
For certain periods, the Fund’s performance may reflect the effects of expense waivers.
Janus Henderson Multi-Sector Income Fund (unaudited)
Performance
Performance may be affected by risks that include those associated with foreign and emerging markets, fixed income securities, high-yield and high-risk securities, undervalued, overlooked and smaller capitalization companies, real estate related securities including Real Estate Investment Trusts (REITs), Environmental, Social and Governance (ESG) factors, non-diversification, portfolio turnover, derivatives, short sales, initial public offerings (IPOs) and potential conflicts of interest. Each product has different risks. Please see the prospectus for more information about risks, holdings and other details.
Returns include reinvestment of all dividends and distributions and do not reflect the deduction of taxes that a shareholder would pay on Fund distributions or redemptions of Fund shares. The returns do not include adjustments in accordance with generally accepted accounting principles required at the period end for financial reporting purposes.
Ranking is for the share class shown only; other classes may have different performance characteristics. When an expense waiver is in effect, it may have a material effect on the total return, and therefore the ranking for the period.
© 2023 Morningstar, Inc. All Rights Reserved.
There is no assurance that the investment process will consistently lead to successful investing.
See Notes to Schedule of Investments and Other Information for index definitions.
Index performance does not reflect the expenses of managing a portfolio as an index is unmanaged and not available for direct investment.
See “Useful Information About Your Fund Report.”
*The Fund’s inception date – February 28, 2014
‡ As stated in the prospectus. Net expense ratios reflect the expense waiver, if any, contractually agreed to for at least a one-year period commencing on October 28, 2022. This contractual waiver may be terminated or modified only at the discretion of the Board of Trustees. See Financial Highlights for actual expense ratios during the reporting period.
Janus Henderson Multi-Sector Income Fund (unaudited)
Expense Examples
As a shareholder of the Fund, you incur two types of costs: (1) transaction costs, such as sales charges (loads) on purchase payments (applicable to Class A Shares only); and (2) ongoing costs, including management fees; 12b-1 distribution and shareholder servicing fees; transfer agent fees and expenses payable pursuant to the Transfer Agency Agreement; and other Fund expenses. This example is intended to help you understand your ongoing costs (in dollars) of investing in the Fund and to compare these costs with the ongoing costs of investing in other mutual funds. To do so, compare this 5% hypothetical example with the 5% hypothetical examples that appear in the shareholder reports of the other funds. The example is based upon an investment of $1,000 invested at the beginning of the period and held for the six-months indicated, unless noted otherwise in the table and footnotes below.
Actual Expenses
The information in the table under the heading “Actual” provides information about actual account values and actual expenses. You may use the information in these columns, together with the amount you invested, to estimate the expenses that you paid over the period. Simply divide your account value by $1,000 (for example, an $8,600 account value divided by $1,000 = 8.6), then multiply the result by the number in the appropriate column for your share class under the heading entitled “Expenses Paid During Period” to estimate the expenses you paid on your account during the period.
Hypothetical Example for Comparison Purposes
The information in the table under the heading “Hypothetical (5% return before expenses)” provides information about hypothetical account values and hypothetical expenses based upon the Fund’s actual expense ratio and an assumed rate of return of 5% per year before expenses, which is not the Fund’s actual return. The hypothetical account values and expenses may not be used to estimate the actual ending account balance or expenses you paid for the period. You may use this information to compare the ongoing costs of investing in the Fund and other funds. To do so, compare this 5% hypothetical example with the 5% hypothetical examples that appear in the shareholder reports of the other funds. Additionally, for an analysis of the fees associated with an investment in any share class or other similar funds, please visit www.finra.org/fundanalyzer.
Please note that the expenses shown in the table are meant to highlight your ongoing costs only and do not reflect any transaction costs. These fees are fully described in the Fund’s prospectuses. Therefore, the hypothetical examples are useful in comparing ongoing costs only, and will not help you determine the relative total costs of owning different funds. In addition, if these transaction costs were included, your costs would have been higher.
| | | | | | | | | | | |
| | | | | | | | |
| | | Actual | | Hypothetical
(5% return before expenses) | |
| Beginning
Account
Value
(1/1/23) | Ending
Account
Value
(6/30/23) | Expenses
Paid During
Period
(1/1/23 - 6/30/23)† | | Beginning
Account
Value
(1/1/23) | Ending
Account
Value
(6/30/23) | Expenses
Paid During
Period
(1/1/23 - 6/30/23)† | Net Annualized
Expense Ratio
(1/1/23 - 6/30/23) |
Class A Shares | $1,000.00 | $1,045.40 | $4.72 | | $1,000.00 | $1,020.18 | $4.66 | 0.93% |
Class C Shares | $1,000.00 | $1,041.70 | $8.30 | | $1,000.00 | $1,016.66 | $8.20 | 1.64% |
Class D Shares | $1,000.00 | $1,046.30 | $3.86 | | $1,000.00 | $1,021.03 | $3.81 | 0.76% |
Class I Shares | $1,000.00 | $1,046.50 | $3.65 | | $1,000.00 | $1,021.22 | $3.61 | 0.72% |
Class N Shares | $1,000.00 | $1,047.10 | $3.10 | | $1,000.00 | $1,021.77 | $3.06 | 0.61% |
Class S Shares | $1,000.00 | $1,044.40 | $5.83 | | $1,000.00 | $1,019.09 | $5.76 | 1.15% |
Class T Shares | $1,000.00 | $1,045.80 | $4.31 | | $1,000.00 | $1,020.58 | $4.26 | 0.85% |
† | Expenses Paid During Period are equal to the Net Annualized Expense Ratio multiplied by the average account value over the period, multiplied by 181/365 (to reflect the one-half year period). Expenses in the examples include the effect of applicable fee waivers and/or expense reimbursements, if any. Had such waivers and/or reimbursements not been in effect, your expenses would have been higher. Please refer to the Notes to Financial Statements or the Fund’s prospectuses for more information regarding waivers and/or reimbursements. |
Janus Henderson Multi-Sector Income Fund
Schedule of Investments
June 30, 2023
| | | | | | | | |
Shares or
Principal Amounts | | | Value | |
Asset-Backed/Commercial Mortgage-Backed Securities– 58.7% | | | |
| | Aaset 2019-2 Trust, 6.4130%, 10/16/39 (144A) | | $4,723,808 | | | $944,762 | |
| | ACC Auto Trust 2021-A C, 3.7900%, 4/15/27 (144A) | | 6,000,000 | | | 5,861,895 | |
| | ACC Auto Trust 2021-A D, 6.1000%, 6/15/29 (144A) | | 3,700,000 | | | 3,495,586 | |
| | ACHV Trust 2023-1PL D, 8.4700%, 3/18/30 (144A) | | 2,750,000 | | | 2,776,987 | |
| | ACM Auto Trust 2022-1A C, 5.4800%, 4/20/29 (144A) | | 7,419,570 | | | 7,378,860 | |
| | AGL CLO 1 Ltd 2021-10A D, | | | | | | |
| | ICE LIBOR USD 3 Month + 2.9000%, 8.1603%, 4/15/34 (144A)‡ | | 8,000,000 | | | 7,406,616 | |
| | Alaska Airlines 2020-1 Class A Pass Through Trust, 4.8000%, 8/15/27 (144A) | | 6,604,297 | | | 6,342,450 | |
| | AMSR Trust 2023-SFR1 F, 4.0000%, 4/17/40 (144A) | | 5,000,000 | | | 4,071,996 | |
| | Apidos CLO 2013-15A A1RR, | | | | | | |
| | ICE LIBOR USD 3 Month + 1.0100%, 6.2604%, 4/20/31 (144A)‡ | | 4,209,000 | | | 4,175,501 | |
| | Avis Budget Rental Car Funding AESOP LLC 2018-2A D, 3.0400%, 3/20/25 (144A) | | 13,000,000 | | | 12,536,419 | |
| | Avis Budget Rental Car Funding AESOP LLC 2019-2A D, 3.0400%, 9/22/25 (144A) | | 5,000,000 | | | 4,632,589 | |
| | Avis Budget Rental Car Funding AESOP LLC 2021-1A D, 3.7100%, 8/20/27 (144A) | | 6,000,000 | | | 5,016,046 | |
| | BAMLL Commercial Mortgage Securities Trust 2014-FRR4 CK29, | | | | | | |
| | 0%, 1/27/24 (144A) | | 2,046,454 | | | 2,004,133 | |
| | Benefit Street Partners CLO Ltd 2016-10A CRR, | | | | | | |
| | ICE LIBOR USD 3 Month + 3.5000%, 8.7504%, 4/20/34 (144A)‡ | | 6,750,000 | | | 6,232,889 | |
| | BlueMountain CLO XXVI Ltd 2019-25A D2R, | | | | | | |
| | ICE LIBOR USD 3 Month + 4.1500%, 9.4103%, 7/15/36 (144A)‡ | | 6,250,000 | | | 5,536,356 | |
| | BlueMountain CLO XXVI Ltd 2021-28A A, | | | | | | |
| | ICE LIBOR USD 3 Month + 1.2600%, 6.5203%, 4/15/34 (144A)‡ | | 5,000,000 | | | 4,942,040 | |
| | BPR Trust 2022-OANA D, | | | | | | |
| | CME Term SOFR 1 Month + 3.6950%, 8.8420%, 4/15/37 (144A)‡ | | 10,000,000 | | | 9,723,337 | |
| | Business Jet Securities LLC 2020-1A B, 3.9670%, 11/15/35 (144A) | | 2,871,347 | | | 2,687,117 | |
| | Business Jet Securities LLC 2021-1A B, 2.9180%, 4/15/36 (144A) | | 1,768,375 | | | 1,565,701 | |
| | Business Jet Securities LLC 2021-1A C, 5.0670%, 4/15/36 (144A) | | 1,515,181 | | | 1,394,454 | |
| | Business Jet Securities LLC 2022-1A C, 6.4130%, 6/15/37 (144A) | | 3,752,597 | | | 3,452,446 | |
| | BX Commercial Mortgage Trust 2019-MMP F, | | | | | | |
| | ICE LIBOR USD 1 Month + 2.7921%, 7.9851%, 8/15/36 (144A)‡ | | 12,935,269 | | | 11,944,417 | |
| | BX Commercial Mortgage Trust 2019-XL, | | | | | | |
| | CME Term SOFR 1 Month + 2.7645%, 7.9115%, 10/15/36 (144A)‡ | | 19,698,750 | | | 19,040,242 | |
| | BX Commercial Mortgage Trust 2021-ARIA E, | | | | | | |
| | ICE LIBOR USD 1 Month + 2.2445%, 7.4375%, 10/15/36 (144A)‡ | | 10,000,000 | | | 9,467,025 | |
| | BX Commercial Mortgage Trust 2021-ARIA F, | | | | | | |
| | ICE LIBOR USD 1 Month + 2.5935%, 7.7865%, 10/15/36 (144A)‡ | | 10,000,000 | | | 9,283,695 | |
| | BX Commercial Mortgage Trust 2021-BXMF G, | | | | | | |
| | ICE LIBOR USD 1 Month + 3.3495%, 8.5425%, 10/15/26 (144A)‡ | | 14,194,000 | | | 13,018,541 | |
| | BX Commercial Mortgage Trust 2021-SOAR G, | | | | | | |
| | ICE LIBOR USD 1 Month + 2.8000%, 7.9940%, 6/15/38 (144A)‡ | | 6,882,260 | | | 6,512,339 | |
| | BX Commercial Mortgage Trust 2021-SOAR J, | | | | | | |
| | ICE LIBOR USD 1 Month + 3.7500%, 8.9440%, 6/15/38 (144A)‡ | | 9,013,822 | | | 8,475,153 | |
| | BX Commercial Mortgage Trust 2021-VINO G, | | | | | | |
| | ICE LIBOR USD 1 Month + 3.9523%, 9.1453%, 5/15/38 (144A)‡ | | 12,000,000 | | | 11,329,503 | |
| | BX Commercial Mortgage Trust 2021-VOLT F, | | | | | | |
| | ICE LIBOR USD 1 Month + 2.4000%, 7.5933%, 9/15/36 (144A)‡ | | 8,440,000 | | | 7,904,448 | |
| | BX Commercial Mortgage Trust 2021-VOLT G, | | | | | | |
| | ICE LIBOR USD 1 Month + 2.8500%, 8.0433%, 9/15/36 (144A)‡ | | 6,000,000 | | | 5,540,548 | |
| | BX Commercial Mortgage Trust 2022-FOX2 A2, | | | | | | |
| | CME Term SOFR 1 Month + 0.7492%, 5.8962%, 4/15/39 (144A)‡ | | 9,769,280 | | | 9,340,058 | |
| | Carlyle Global Markets Strategies 2022-2A C, | | | | | | |
| | CME Term SOFR 3 Month + 3.5500%, 8.5985%, 4/20/35 (144A)‡ | | 5,000,000 | | | 4,526,810 | |
| | CarMax Auto Owner Trust 2022-3 D, 6.2000%, 1/16/29 | | 6,250,000 | | | 6,070,207 | |
| | Carvana Auto Receivables Trust 2019-2A XS, 0%, 4/15/26 (144A)‡,¤,¢ | | 68,614,375 | | | 375,938 | |
| | Carvana Auto Receivables Trust 2019-4A XS, 0%, 10/15/26 (144A)‡,¤,¢ | | 51,068,359 | | | 493,525 | |
| | Carvana Auto Receivables Trust 2021-N3 E, 3.1600%, 6/12/28 (144A) | | 12,890,000 | | | 11,064,350 | |
| | Castlelake Aircraft Securitization Trust 2018-1, 6.6250%, 6/15/43 (144A) | | 3,830,196 | | | 1,069,334 | |
| | CBAM CLO Management 2020-13A A, | | | | | | |
| | ICE LIBOR USD 3 Month + 1.4300%, 6.6804%, 1/20/34 (144A)‡ | | 6,000,000 | | | 5,931,864 | |
| | | | | | | | |
| | |
See Notes to Schedule of Investments and Other Information and Notes to Financial Statements. |
| |
Janus Investment Fund | 7 |
Janus Henderson Multi-Sector Income Fund
Schedule of Investments
June 30, 2023
| | | | | | | | |
Shares or
Principal Amounts | | | Value | |
Asset-Backed/Commercial Mortgage-Backed Securities– (continued) | | | |
| | CBAM CLO Management 2021-14A A, | | | | | | |
| | ICE LIBOR USD 3 Month + 1.1000%, 6.3504%, 4/20/34 (144A)‡ | | $15,000,000 | | | $14,697,600 | |
| | CBAM CLO Management 2021-14A D, | | | | | | |
| | ICE LIBOR USD 3 Month + 3.1000%, 8.3504%, 4/20/34 (144A)‡ | | 10,000,000 | | | 8,443,960 | |
| | CF Hippolyta Issuer LLC 2022-1A A1, 5.9700%, 8/15/62 (144A) | | 23,189,260 | | | 22,529,502 | |
| | CF Hippolyta Issuer LLC 2022-1A A2, 6.1100%, 8/15/62 (144A) | | 21,702,067 | | | 20,216,672 | |
| | Chase Auto Credit Linked Note 2021-3 E, 2.1020%, 2/26/29 (144A) | | 871,985 | | | 833,908 | |
| | Chase Auto Credit Linked Notes 2021-1 E, 2.3650%, 9/25/28 (144A) | | 856,147 | | | 833,450 | |
| | Chase Auto Credit Linked Notes 2021-1 F, 4.2800%, 9/25/28 (144A) | | 3,337,000 | | | 3,066,476 | |
| | Chase Mortgage Finance Corp 2021-CL1 M4, | | | | | | |
| | US 30 Day Average SOFR + 2.6500%, 7.7166%, 2/25/50 (144A)‡ | | 2,417,984 | | | 2,112,919 | |
| | Chase Mortgage Finance Corp 2021-CL1 M5, | | | | | | |
| | US 30 Day Average SOFR + 3.2500%, 8.3166%, 2/25/50 (144A)‡ | | 967,313 | | | 798,592 | |
| | CHC Commercial Mortgage Trust 2019-CHC D, | | | | | | |
| | ICE LIBOR USD 1 Month + 2.0500%, 7.2430%, 6/15/34 (144A)‡ | | 3,617,828 | | | 3,532,012 | |
| | CIFC Funding Ltd 2015-3A DR, | | | | | | |
| | ICE LIBOR USD 3 Month + 2.5000%, 7.7650%, 4/19/29 (144A)‡ | | 2,097,500 | | | 1,920,633 | |
| | CIFC Funding Ltd 2016-1A D2RR, | | | | | | |
| | ICE LIBOR USD 3 Month + 4.2500%, 9.0653%, 10/21/31 (144A)‡ | | 5,000,000 | | | 4,633,280 | |
| | CIM Trust 2021-NR1 A1, 2.5690%, 7/25/55 (144A)Ç | | 4,163,281 | | | 4,000,287 | |
| | Citigroup Commercial Mortgage Trust 2018-C5, 0.8279%, 6/10/51‡,¤ | | 32,605,980 | | | 921,007 | |
| | Citigroup Commercial Mortgage Trust 2021-PRM2 E, | | | | | | |
| | ICE LIBOR USD 1 Month + 2.4000%, 7.5940%, 10/15/38 (144A)‡ | | 2,000,000 | | | 1,893,265 | |
| | Citigroup Commercial Mortgage Trust 2021-PRM2 F, | | | | | | |
| | ICE LIBOR USD 1 Month + 3.7500%, 8.9440%, 10/15/38 (144A)‡ | | 6,000,000 | | | 5,778,980 | |
| | Citigroup Commercial Mortgage Trust 2021-PRM2 G, | | | | | | |
| | ICE LIBOR USD 1 Month + 4.5000%, 9.6940%, 10/15/38 (144A)‡ | | 6,000,000 | | | 5,587,398 | |
| | Citigroup Commercial Mortgage Trust 2021-PRM2 J, | | | | | | |
| | ICE LIBOR USD 1 Month + 5.4000%, 10.5940%, 10/15/36 (144A)‡ | | 6,000,000 | | | 5,608,742 | |
| | Coinstar Funding LLC 2017-1A A2, 5.2160%, 4/25/47 (144A) | | 12,675,900 | | | 10,758,318 | |
| | Cold Storage Trust 2020-ICE5 F, | | | | | | |
| | ICE LIBOR USD 1 Month + 3.4925%, 8.6858%, 11/15/37 (144A)‡ | | 12,828,026 | | | 12,558,288 | |
| | Cologix Data Centers Issuer LLC 2022-1CAN A2, 4.9400%, 1/25/52 (144A) | | 5,000,000 | CAD | | 3,416,805 | |
| | COLT Funding LLC 2021-3R B1, 3.5630%, 12/25/64 (144A)‡ | | 2,547,000 | | | 1,754,264 | |
| | Commercial Mortgage Pass-through Certificate 2022-LPF2 E, | | | | | | |
| | CME Term SOFR 1 Month + 5.9400%, 11.0870%, 10/15/39 (144A)‡ | | 1,500,000 | | | 1,506,939 | |
| | Commercial Mortgage Pass-through Certificates 2022-LPF2 D, | | | | | | |
| | CME Term SOFR 1 Month + 4.1920%, 9.3390%, 10/15/39 (144A)‡ | | 5,000,000 | | | 4,977,515 | |
| | Conn Funding II LP 2021-A B, 2.8700%, 5/15/26 (144A) | | 352,114 | | | 351,767 | |
| | Connecticut Avenue Securities Trust 2017-C05 1M2C, | | | | | | |
| | ICE LIBOR USD 1 Month + 2.2000%, 7.3504%, 1/25/30‡ | | 11,211,032 | | | 11,231,338 | |
| | Connecticut Avenue Securities Trust 2018-R07 1B1, | | | | | | |
| | ICE LIBOR USD 1 Month + 4.3500%, 9.5004%, 4/25/31 (144A)‡ | | 4,000,000 | | | 4,192,576 | |
| | Connecticut Avenue Securities Trust 2019-R02, | | | | | | |
| | ICE LIBOR USD 1 Month + 2.3000%, 7.4504%, 8/25/31 (144A)‡ | | 19,750 | | | 19,750 | |
| | Connecticut Avenue Securities Trust 2019-R02, | | | | | | |
| | ICE LIBOR USD 1 Month + 4.1500%, 9.3004%, 8/25/31 (144A)‡ | | 26,683,000 | | | 27,800,351 | |
| | Connecticut Avenue Securities Trust 2019-R03 1B1, | | | | | | |
| | ICE LIBOR USD 1 Month + 4.1000%, 9.2504%, 9/25/31 (144A)‡ | | 15,690,995 | | | 16,434,083 | |
| | Connecticut Avenue Securities Trust 2019-R04 2B1, | | | | | | |
| | ICE LIBOR USD 1 Month + 5.2500%, 10.4004%, 6/25/39 (144A)‡ | | 4,895,520 | | | 5,159,972 | |
| | Connecticut Avenue Securities Trust 2019-R05, | | | | | | |
| | ICE LIBOR USD 1 Month + 4.1000%, 9.2504%, 7/25/39 (144A)‡ | | 7,848,685 | | | 8,022,223 | |
| | Connecticut Avenue Securities Trust 2021-R01 1B1, | | | | | | |
| | US 30 Day Average SOFR + 3.1000%, 8.1666%, 10/25/41 (144A)‡ | | 5,000,000 | | | 4,943,716 | |
| | Connecticut Avenue Securities Trust 2021-R01 1M1, | | | | | | |
| | US 30 Day Average SOFR + 0.7500%, 5.8166%, 10/25/41 (144A)‡ | | 570,654 | | | 568,445 | |
| | Connecticut Avenue Securities Trust 2021-R02 2B1, | | | | | | |
| | US 30 Day Average SOFR + 3.3000%, 8.3666%, 11/25/41 (144A)‡ | | 7,600,000 | | | 7,546,490 | |
| | | | | | | | |
| | |
See Notes to Schedule of Investments and Other Information and Notes to Financial Statements. |
| |
8 | JUNE 30, 2023 |
Janus Henderson Multi-Sector Income Fund
Schedule of Investments
June 30, 2023
| | | | | | | | |
Shares or
Principal Amounts | | | Value | |
Asset-Backed/Commercial Mortgage-Backed Securities– (continued) | | | |
| | Connecticut Avenue Securities Trust 2022-R01 1B1, | | | | | | |
| | US 30 Day Average SOFR + 3.1500%, 8.2166%, 12/25/41 (144A)‡ | | $13,477,000 | | | $13,202,772 | |
| | Connecticut Avenue Securities Trust 2022-R02 2B1, | | | | | | |
| | US 30 Day Average SOFR + 4.5000%, 9.5666%, 1/25/42 (144A)‡ | | 17,053,000 | | | 17,099,778 | |
| | Connecticut Avenue Securities Trust 2022-R04 1M1, | | | | | | |
| | US 30 Day Average SOFR + 2.0000%, 7.0666%, 3/25/42 (144A)‡ | | 10,128,410 | | | 10,144,892 | |
| | Credit Suisse Commercial Mortgage Trust 2019-ICE4 F, | | | | | | |
| | ICE LIBOR USD 1 Month + 2.6500%, 7.8430%, 5/15/36 (144A)‡ | | 14,164,760 | | | 13,882,014 | |
| | Credit Suisse Commercial Mortgage Trust 2020-TMIC A, | | | | | | |
| | ICE LIBOR USD 1 Month + 3.5000%, 8.6930%, 12/15/35 (144A)‡ | | 15,000,000 | | | 14,928,131 | |
| | Credit Suisse Commercial Mortgage Trust 2021-WEHO A, | | | | | | |
| | CME Term SOFR 1 Month + 4.0838%, 9.2308%, 4/15/26 (144A)‡ | | 13,358,776 | | | 13,234,389 | |
| | CSAIL 2021-C20 XA, 1.1187%, 3/15/54‡,¤ | | 58,585,989 | | | 3,117,322 | |
| | DBCCRE Mortgage Trust 2014-ARCP D, 5.0990%, 1/10/34 (144A)‡ | | 1,000,000 | | | 953,515 | |
| | DBCCRE Mortgage Trust 2014-ARCP E, 5.0990%, 1/10/34 (144A)‡ | | 2,848,000 | | | 2,688,446 | |
| | DBCCRE Mortgage Trust 2014-ARCP F, 5.0990%, 1/10/34 (144A)‡ | | 11,442,000 | | | 10,643,398 | |
| | DBGS Mortgage Trust 2018-BIOD F, | | | | | | |
| | ICE LIBOR USD 1 Month + 2.2500%, 7.4430%, 5/15/35 (144A)‡ | | 1,414,505 | | | 1,362,307 | |
| | Diamond Infrastructure Funding LLC 2021-1A B, 2.3550%, 4/15/49 (144A) | | 4,000,000 | | | 3,395,289 | |
| | Diamond Infrastructure Funding LLC 2021-1A C, 3.4750%, 4/15/49 (144A) | | 3,420,000 | | | 2,974,160 | |
| | Diamond Issuer LLC 2021-1A C, 3.7870%, 11/20/51 (144A) | | 5,000,000 | | | 3,986,518 | |
| | Diamond Resorts Owner Trust 2021-1A D, 3.8300%, 11/21/33 (144A) | | 504,222 | | | 461,477 | |
| | DROP Mortgage Trust 2021-FILE D, | | | | | | |
| | ICE LIBOR USD 1 Month + 2.7500%, 7.9430%, 10/15/43 (144A)‡ | | 15,000,000 | | | 12,176,483 | |
| | Dryden Senior Loan Fund 2020-83A D, | | | | | | |
| | ICE LIBOR USD 3 Month + 3.5000%, 8.7617%, 1/18/32 (144A)‡ | | 6,000,000 | | | 5,610,294 | |
| | Dryden Senior Loan Fund 2023-105A D, | | | | | | |
| | CME Term SOFR 3 Month + 5.2000%, 10.0586%, 4/18/36 (144A)‡ | | 6,000,000 | | | 5,993,700 | |
| | ECAF I Ltd, 5.8020%, 6/15/40 (144A) | | 3,163,638 | | | 800,603 | |
| | Elmwood CLO VIII Ltd 2021-1A A, | | | | | | |
| | ICE LIBOR USD 3 Month + 1.2400%, 6.4904%, 1/20/34 (144A)‡ | | 5,000,000 | | | 4,932,830 | |
| | Elmwood CLO VIII Ltd 2021-1A D, | | | | | | |
| | ICE LIBOR USD 3 Month + 3.0000%, 8.2504%, 1/20/34 (144A)‡ | | 3,000,000 | | | 2,822,775 | |
| | Exeter Automobile Receivables Trust 2020-2A E, 7.1900%, 9/15/27 (144A) | | 6,794,000 | | | 6,822,153 | |
| | Exeter Automobile Receivables Trust 2023-1A E, 12.0700%, 9/16/30 (144A) | | 3,000,000 | | | 3,183,663 | |
| | Extended Stay America Trust 2021-ESH E, | | | | | | |
| | ICE LIBOR USD 1 Month + 2.8500%, 8.0440%, 7/15/38 (144A)‡ | | 5,098,173 | | | 4,934,874 | |
| | Extended Stay America Trust 2021-ESH F, | | | | | | |
| | ICE LIBOR USD 1 Month + 3.7000%, 8.8940%, 7/15/38 (144A)‡ | | 9,502,456 | | | 9,061,560 | |
| | ExteNet Issuer LLC, 5.2190%, 7/26/49 (144A) | | 4,000,000 | | | 3,777,672 | |
| | Fannie Mae REMICS, ICE LIBOR USD 1 Month + 55.0000%, 0%, 10/25/40‡ | | 588,203 | | | 927,460 | |
| | Fannie Mae REMICS, 3.0000%, 5/25/48 | | 14,453 | | | 13,077 | |
| | Fannie Mae REMICS, ICE LIBOR USD 1 Month + 6.0500%, 0.8996%, 8/25/48‡,¤ | | 6,531,199 | | | 636,119 | |
| | Flagship Credit Auto Trust 2022-4 E, 12.6600%, 1/15/30 (144A) | | 5,000,000 | | | 5,337,663 | |
| | Flagship Credit Auto Trust 2023-1 E, 11.4400%, 4/15/30 (144A) | | 8,000,000 | | | 8,213,020 | |
| | Flagstar Mortgage Trust 2021-13IN A17, 3.0000%, 12/30/51 (144A)‡ | | 15,522,766 | | | 12,671,877 | |
| | Flagstar Mortgage Trust 2021-13IN A2, 3.0000%, 12/30/51 (144A)‡ | | 39,989,137 | | | 33,520,594 | |
| | Foursight Capital Auto Receivables Trust 2020-1 F, 4.6200%, 6/15/27 (144A) | | 1,250,000 | | | 1,241,283 | |
| | Freddie Mac Multifamily Structured Credit Risk 2021-MN3 M2, | | | | | | |
| | US 30 Day Average SOFR + 4.0000%, 9.0666%, 11/25/51 (144A)‡ | | 10,000,000 | | | 9,180,868 | |
| | Freddie Mac Structured Agency Credit Risk Debt Notes 2020-DNA3 B1, | | | | | | |
| | ICE LIBOR USD 1 Month + 5.1000%, 10.2504%, 6/25/50 (144A)‡ | | 5,260,963 | | | 5,664,892 | |
| | Freddie Mac Structured Agency Credit Risk Debt Notes 2020-HQA4 B1, | | | | | | |
| | ICE LIBOR USD 1 Month + 5.2500%, 10.4004%, 9/25/50 (144A)‡ | | 8,400,999 | | | 8,941,020 | |
| | Freddie Mac Structured Agency Credit Risk Debt Notes 2020-HQA5 B1, | | | | | | |
| | US 30 Day Average SOFR + 4.0000%, 9.0666%, 11/25/50 (144A)‡ | | 5,441,430 | | | 5,537,179 | |
| | Freddie Mac Structured Agency Credit Risk Debt Notes 2021-DNA1 B1, | | | | | | |
| | US 30 Day Average SOFR + 2.6500%, 7.7166%, 1/25/51 (144A)‡ | | 7,550,000 | | | 7,236,055 | |
| | Freddie Mac Structured Agency Credit Risk Debt Notes 2021-DNA2 B2, | | | | | | |
| | US 30 Day Average SOFR + 6.0000%, 11.0666%, 8/25/33 (144A)‡ | | 12,308,000 | | | 12,065,569 | |
| | |
See Notes to Schedule of Investments and Other Information and Notes to Financial Statements. |
| |
Janus Investment Fund | 9 |
Janus Henderson Multi-Sector Income Fund
Schedule of Investments
June 30, 2023
| | | | | | | | |
Shares or
Principal Amounts | | | Value | |
Asset-Backed/Commercial Mortgage-Backed Securities– (continued) | | | |
| | Freddie Mac Structured Agency Credit Risk Debt Notes 2021-DNA2 M2, | | | | | | |
| | US 30 Day Average SOFR + 2.3000%, 7.3666%, 8/25/33 (144A)‡ | | $1,437,671 | | | $1,438,404 | |
| | Freddie Mac Structured Agency Credit Risk Debt Notes 2021-DNA3 B2, | | | | | | |
| | US 30 Day Average SOFR + 6.2500%, 11.3166%, 10/25/33 (144A)‡ | | 20,836,000 | | | 20,471,405 | |
| | Freddie Mac Structured Agency Credit Risk Debt Notes 2021-DNA5 B1, | | | | | | |
| | US 30 Day Average SOFR + 3.0500%, 8.1166%, 1/25/34 (144A)‡ | | 6,624,000 | | | 6,437,280 | |
| | FREMF Mortgage Trust 2018-KF45, | | | | | | |
| | ICE LIBOR USD 1 Month + 1.9500%, 7.1430%, 3/25/25 (144A)‡ | | 368,543 | | | 362,795 | |
| | FREMF Mortgage Trust 2018-KL2P BPZ, | | | | | | |
| | ICE LIBOR USD 1 Month + 2.5000%, 7.6930%, 1/25/28 (144A)‡ | | 5,597,272 | | | 5,536,868 | |
| | FREMF Mortgage Trust 2018-KSW4 C, | | | | | | |
| | ICE LIBOR USD 1 Month + 5.0000%, 10.1930%, 10/25/28‡ | | 4,930,706 | | | 4,749,479 | |
| | FREMF Mortgage Trust 2019-KF70 C, | | | | | | |
| | ICE LIBOR USD 1 Month + 6.0000%, 11.1930%, 9/25/29 (144A)‡ | | 16,247,811 | | | 15,745,162 | |
| | FREMF Mortgage Trust 2019-KF72, | | | | | | |
| | ICE LIBOR USD 1 Month + 2.1000%, 7.2930%, 11/25/26 (144A)‡ | | 2,679,587 | | | 2,576,032 | |
| | Gam Resecuritization Trust 2021-FRR2 BK74, 0%, 9/27/51 (144A)◊ | | 11,000,000 | | | 7,271,692 | |
| | Gam Resecuritization Trust 2021-FRR2 CK74, 0%, 9/27/51 (144A)◊ | | 18,068,494 | | | 11,377,221 | |
| | GCAT 2022-INV1 A26, 3.0000%, 12/25/51 (144A)‡ | | 16,823,423 | | | 13,725,947 | |
| | Government National Mortgage Association, | | | | | | |
| | ICE LIBOR USD 1 Month + 5.5500%, 0.4037%, 1/20/44‡,¤ | | 350,606 | | | 25,503 | |
| | Government National Mortgage Association, | | | | | | |
| | ICE LIBOR USD 1 Month + 6.1500%, 0.9919%, 10/16/55‡,¤ | | 489,453 | | | 35,979 | |
| | Government National Mortgage Association, 0.2830%, 1/16/60‡,¤ | | 12,199,788 | | | 325,842 | |
| | Great Wolf Trust, | | | | | | |
| | CME Term SOFR 1 Month + 2.8465%, 7.9935%, 12/15/36 (144A)‡ | | 19,500,000 | | | 18,949,238 | |
| | Great Wolf Trust, | | | | | | |
| | CME Term SOFR 1 Month + 3.2455%, 8.3925%, 12/15/36 (144A)‡ | | 3,899,000 | | | 3,726,855 | |
| | GS Mortgage Securities Trust 2017-SLP G, 4.7443%, 10/10/32 (144A)‡ | | 8,331,000 | | | 7,342,023 | |
| | GS Mortgage Securities Trust 2022-SHIP D, | | | | | | |
| | CME Term SOFR 1 Month + 1.6069%, 6.7539%, 8/15/36 (144A)‡ | | 20,000,000 | | | 19,599,808 | |
| | Hertz Vehicle Financing LLC 2021-1A D, 3.9800%, 12/26/25 (144A) | | 15,000,000 | | | 14,033,985 | |
| | HGI CRE CLO Ltd 2021-FL1 D, | | | | | | |
| | ICE LIBOR USD 1 Month + 2.3500%, 7.4554%, 6/16/36 (144A)‡ | | 5,000,000 | | | 4,578,553 | |
| | Hilton Grand Vacations Trust 2022-1D D, 6.7900%, 6/20/34 (144A) | | 1,980,084 | | | 1,885,547 | |
| | Home Partners of America Trust 2021-2 F, 3.7990%, 12/17/26 (144A) | | 19,287,847 | | | 16,263,864 | |
| | Home Partners of America Trust 2021-3 F, 4.2420%, 1/17/41 (144A) | | 4,621,768 | | | 3,810,974 | |
| | Hotwire Funding LLC 2021-1 C, 4.4590%, 11/20/51 (144A) | | 3,000,000 | | | 2,495,267 | |
| | JP Morgan Chase Commercial Mortgage Sec Trust 2020-ACE A, | | | | | | |
| | 3.2865%, 1/10/37 (144A) | | 10,000,000 | | | 9,314,100 | |
| | JP Morgan Chase Commercial Mortgage Sec Trust 2022-NLP D, | | | | | | |
| | CME Term SOFR 1 Month + 2.1664%, 7.3134%, 4/15/37 (144A)‡ | | 19,210,579 | | | 16,638,671 | |
| | Kayne CLO 10 Ltd 2021-10A A, | | | | | | |
| | ICE LIBOR USD 3 Month + 1.1700%, 6.4427%, 4/23/34 (144A)‡ | | 22,500,000 | | | 22,051,777 | |
| | LCM LP XIV, ICE LIBOR USD 3 Month + 1.0400%, 6.2904%, 7/20/31 (144A)‡ | | 4,640,000 | | | 4,579,156 | |
| | Lendbuzz Securitization Trust 2021-1A A, 4.2200%, 5/17/27 (144A)‡ | | 2,883,881 | | | 2,786,027 | |
| | Lendbuzz Securitization Trust 2021-1A A, 5.9900%, 12/15/28 (144A)‡ | | 5,594,000 | | | 5,380,653 | |
| | Lendbuzz Securitization Trust 2023-2A B, 8.6900%, 6/15/29 (144A) | | 9,826,000 | | | 10,050,607 | |
| | LFS LLC 2022-A B, 8.0000%, 5/15/34 (144A) | | 4,000,000 | | | 3,544,629 | |
| | Life Financial Services Trust 2021-BMR E, | | | | | | |
| | CME Term SOFR 1 Month + 1.8645%, 7.0115%, 3/15/38 (144A)‡ | | 17,693,463 | | | 16,900,426 | |
| | Life Financial Services Trust 2022-BMR2 D, | | | | | | |
| | CME Term SOFR 1 Month + 2.5419%, 7.6889%, 5/15/39 (144A)‡ | | 10,000,000 | | | 9,508,136 | |
| | LoanMe Trust SBL 2019-1, 10.0000%, 8/15/30 (144A)Ç | | 5,291,937 | | | 4,842,601 | |
| | Longfellow Place CLO Ltd 2013-1A DRR, | | | | | | |
| | ICE LIBOR USD 3 Month + 4.5000%, 9.7603%, 4/15/29 (144A)‡ | | 3,000,000 | | | 2,964,456 | |
| | LUXE Commercial Mortgage Trust 2021-TRIP F, | | | | | | |
| | ICE LIBOR USD 1 Month + 3.2500%, 8.4430%, 10/15/38 (144A)‡ | | 8,000,000 | | | 7,705,966 | |
| | Luxury Lease Partners Auto Trust 2021-ARC2 A, 3.0000%, 7/15/27 (144A) | | 722,210 | | | 711,411 | |
| | | | | | | | |
| | |
See Notes to Schedule of Investments and Other Information and Notes to Financial Statements. |
| |
10 | JUNE 30, 2023 |
Janus Henderson Multi-Sector Income Fund
Schedule of Investments
June 30, 2023
| | | | | | | | |
Shares or
Principal Amounts | | | Value | |
Asset-Backed/Commercial Mortgage-Backed Securities– (continued) | | | |
| | Madison Park Funding Ltd 2016-22A DR, | | | | | | |
| | ICE LIBOR USD 3 Month + 3.5000%, 8.7603%, 1/15/33 (144A)‡ | | $8,500,000 | | | $8,030,137 | |
| | Madison Park Funding Ltd 2018-32A A1R, | | | | | | |
| | ICE LIBOR USD 3 Month + 1.0000%, 6.2727%, 1/22/31 (144A)‡ | | 10,000,000 | | | 9,899,000 | |
| | Madison Park Funding Ltd 2018-32A DR, | | | | | | |
| | ICE LIBOR USD 3 Month + 3.2000%, 8.4727%, 1/22/31 (144A)‡ | | 7,000,000 | | | 6,702,206 | |
| | MED Trust 2021-MDLN F, | | | | | | |
| | ICE LIBOR USD 1 Month + 4.0000%, 9.1940%, 11/15/38 (144A)‡ | | 7,696,065 | | | 7,266,594 | |
| | MED Trust 2021-MDLN G, | | | | | | |
| | ICE LIBOR USD 1 Month + 5.2500%, 10.4440%, 11/15/38 (144A)‡ | | 14,928,355 | | | 13,878,188 | |
| | Mello Mortgage Capital Acceptance Trust 2021-INV4 A3, | | | | | | |
| | 2.5000%, 12/25/51 (144A)‡ | | 3,466,486 | | | 2,782,628 | |
| | Mercury Financial Credit Card Master Trust 2023-1A A, | | | | | | |
| | 8.0400%, 9/20/27 (144A) | | 8,000,000 | | | 8,006,603 | |
| | MHC Commercial Mortgage Trust 2021-MHC G, | | | | | | |
| | CME Term SOFR 1 Month + 3.3154%, 8.4624%, 4/15/38 (144A)‡ | | 10,620,000 | | | 10,231,447 | |
| | Mission Lane Credit Card Master Trust 2023-A B, 8.1500%, 7/17/28 (144A) | | 3,000,000 | | | 2,982,717 | |
| | Mission Lane Credit Card Master Trust 2023-A C, 10.0300%, 7/17/28 (144A) | | 3,250,000 | | | 3,231,730 | |
| | Multifamily Connecticut Avenue Securities Trust 2019-01, | | | | | | |
| | ICE LIBOR USD 1 Month + 3.2500%, 8.4004%, 10/25/49 (144A)‡ | | 27,404,593 | | | 26,836,348 | |
| | Multifamily Connecticut Avenue Securities Trust 2020-01, | | | | | | |
| | ICE LIBOR USD 1 Month + 3.7500%, 8.9004%, 3/25/50 (144A)‡ | | 15,446,000 | | | 14,959,763 | |
| | Multifamily Connecticut Avenue Securities Trust 2020-01 CE, | | | | | | |
| | ICE LIBOR USD 1 Month + 7.5000%, 12.6504%, 3/25/50 (144A)‡ | | 2,000,000 | | | 1,915,652 | |
| | MVW Owner Trust 2021-1WA D, 3.1700%, 1/22/41 (144A) | | 1,798,133 | | | 1,565,198 | |
| | Nassau Ltd 2019-IA BR, | | | | | | |
| | ICE LIBOR USD 3 Month + 2.6000%, 7.8603%, 4/15/31 (144A)‡ | | 8,500,000 | | | 8,112,349 | |
| | NBC Funding LLC 2021-1 B, 4.9700%, 7/30/51 (144A) | | 3,000,000 | | | 2,496,343 | |
| | Neuberger Berman CLO Ltd, | | | | | | |
| | ICE LIBOR USD 3 Month + 2.8000%, 7.6024%, 1/28/30 (144A)‡ | | 6,000,000 | | | 5,487,798 | |
| | New Residential Mortgage Loan Trust 2022-SFR1 F, 4.4430%, 2/17/39 (144A) | | 10,500,000 | | | 8,970,594 | |
| | NW Re-Remic Trust 2021-FRR1 BK88, 2.6610%, 12/18/51 (144A)‡ | | 20,000,000 | | | 15,349,726 | |
| | Oak Hill Credit Partners 2012-7A AR3, | | | | | | |
| | ICE LIBOR USD 3 Month + 1.0700%, 6.4491%, 2/20/34 (144A)‡ | | 5,000,000 | | | 4,921,460 | |
| | Oak Street Investment Grade Net Lease Fund 2020-1A B1, | | | | | | |
| | 5.1100%, 11/20/50 (144A) | | 4,499,000 | | | 3,809,786 | |
| | Oak Street Investment Grade Net Lease Fund 2021-1A B1, | | | | | | |
| | 4.2300%, 1/20/51 (144A) | | 2,400,000 | | | 2,029,189 | |
| | Oasis Securitization 2021-2A A, 2.1430%, 10/15/33 (144A) | | 2,639,960 | | | 2,598,527 | |
| | Oasis Securitization 2021-2A B, 5.1470%, 10/15/33 (144A) | | 2,640,975 | | | 2,598,855 | |
| | Oasis Securitization 2022-2A B, 8.8500%, 10/15/34 (144A) | | 6,828,965 | | | 6,760,686 | |
| | Oasis Securitization 2023-1A B, 10.2500%, 2/15/35 (144A) | | 6,038,643 | | | 6,344,545 | |
| | OCP CLO Ltd, ICE LIBOR USD 3 Month + 3.0000%, 7.8156%, 4/24/29 (144A)‡ | | 6,000,000 | | | 5,884,944 | |
| | Octagon 61 Ltd 2023-2A D, | | | | | | |
| | CME Term SOFR 3 Month + 5.5000%, 10.5688%, 4/20/36 (144A)‡ | | 7,100,000 | | | 7,105,439 | |
| | Octagon Investment Partners 42 Ltd 2019-3A AR, | | | | | | |
| | ICE LIBOR USD 3 Month + 1.1400%, 6.4003%, 7/15/34 (144A)‡ | | 10,000,000 | | | 9,823,780 | |
| | Octagon Investment Partners 58 Ltd 2022-1A D, | | | | | | |
| | CME Term SOFR 3 Month + 3.5500%, 8.5363%, 7/15/37 (144A)‡ | | 7,750,000 | | | 7,136,557 | |
| | Ondeck Asset Securitization Trust LLC 2021-1A C, 2.9700%, 5/17/27 (144A) | | 3,000,000 | | | 2,755,917 | |
| | Onslow Bay Financial LLC 2021-INV3 A3, 2.5000%, 10/25/51 (144A)‡ | | 5,225,803 | | | 4,191,111 | |
| | Pagaya AI Debt Selection Trust 2021-1 B, 2.1300%, 11/15/27 (144A) | | 9,995,879 | | | 9,797,654 | |
| | Pagaya AI Debt Selection Trust 2021-1 CERT, 0%, 11/15/27 (144A)‡,¤ | | 1,846,154 | | | 55,385 | |
| | Pagaya AI Debt Selection Trust 2022-1 C, 4.8880%, 10/15/29 (144A) | | 3,679,513 | | | 3,051,643 | |
| | Palmer Square European Loan Funding 2023-1A D, | | | | | | |
| | EURIBOR 3 Month + 5.7500%, 8.8770%, 11/15/32 (144A)‡ | | 6,941,000 | EUR | | 7,571,371 | |
| | Palmer Square Loan Funding 2022-5A C, | | | | | | |
| | CME Term SOFR 3 Month + 3.9100%, 8.5676%, 1/15/31 (144A)‡ | | 7,000,000 | | | 6,770,421 | |
| | Pawnee Equipment Receivables 2022-1 D, 7.2300%, 7/17/28 (144A) | | 5,000,000 | | | 4,885,872 | |
| | Pawnee Equipment Receivables 2022-1 E, 9.5000%, 9/17/29 (144A) | | 5,379,000 | | | 5,247,584 | |
| | |
See Notes to Schedule of Investments and Other Information and Notes to Financial Statements. |
| |
Janus Investment Fund | 11 |
Janus Henderson Multi-Sector Income Fund
Schedule of Investments
June 30, 2023
| | | | | | | | |
Shares or
Principal Amounts | | | Value | |
Asset-Backed/Commercial Mortgage-Backed Securities– (continued) | | | |
| | Pawnee Equipment Receivables Series 2020-1 LLC, 5.4300%, 7/15/27 (144A) | | $6,165,000 | | | $5,994,990 | |
| | Perimeter Master Note Business Trust, 5.2100%, 5/15/24 (144A) | | 2,250,000 | | | 2,202,213 | |
| | Point Securitization Trust 2021-1 A1, 3.2282%, 2/25/52 (144A)‡ | | 5,244,786 | | | 4,936,028 | |
| | Prestige Auto Receivables Trust 2023-1A E, 9.8800%, 5/15/30 (144A) | | 6,000,000 | | | 5,889,552 | |
| | Preston Ridge Partners Mortgage Trust 2021-10 A1, 2.4870%, 10/25/26 (144A)Ç | | 8,627,739 | | | 7,947,503 | |
| | Preston Ridge Partners Mortgage Trust 2021-9 A1, 2.3630%, 10/25/26 (144A)Ç | | 10,461,373 | | | 9,700,443 | |
| | Preston Ridge Partners Mortgage Trust 2022-2 A1, 5.0000%, 3/25/27 (144A)Ç | | 7,152,716 | | | 6,877,400 | |
| | Pretium Mortgage Credit Partners LLC 2021-RN4 A1, 2.4871%, 10/25/51 (144A)‡ | | 16,299,634 | | | 14,422,746 | |
| | PRIMA Capital Ltd, 4.2500%, 12/25/50 (144A) | | 10,500,000 | | | 8,490,908 | |
| | PRIMA Capital Ltd 2021-9A C, | | | | | | |
| | ICE LIBOR USD 1 Month + 2.3500%, 7.5066%, 12/15/37 (144A)‡ | | 15,000,000 | | | 14,118,195 | |
| | Progress Residential Trust 2021-SFR11 F, 4.4200%, 1/17/39 (144A) | | 4,885,000 | | | 3,904,972 | |
| | Progress Residential Trust 2022-SFR1 F, 4.8800%, 2/17/41 (144A) | | 9,000,000 | | | 7,361,982 | |
| | Progress Residential Trust 2022-SFR3 F, 6.6000%, 4/17/39 (144A) | | 2,500,000 | | | 2,312,186 | |
| | Project Silver, 6.9000%, 7/15/44 (144A)‡ | | 898,315 | | | 167,329 | |
| | Rad CLO Ltd 2023-18A D, | | | | | | |
| | CME Term SOFR 3 Month + 5.2500%, 9.9652%, 4/15/36 (144A)‡ | | 6,588,000 | | | 6,617,574 | |
| | Rad CLO Ltd 2023-19A D, | | | | | | |
| | CME Term SOFR 3 Month + 5.7500%, 10.8450%, 4/20/35 (144A)‡ | | 7,000,000 | | | 6,996,969 | |
| | Raptor Aircraft Finance I LLC, 4.2130%, 8/23/44 (144A) | | 10,163,093 | | | 8,055,890 | |
| | Reach Financial LLC 2022-2A D, 9.0000%, 5/15/30 (144A) | | 8,000,000 | | | 7,600,964 | |
| | Sand Trust 2021-1A D, | | | | | | |
| | ICE LIBOR USD 3 Month + 3.5500%, 8.8103%, 10/15/34 (144A)‡ | | 8,000,000 | | | 7,294,784 | |
| | Sand Trust 2023-1A D, CME Term SOFR 3 Month + 6.0200%, 0%, 7/20/36 (144A)‡ | | 5,000,000 | | | 4,974,635 | |
| | Santander Bank Auto Credit-Linked Notes 2022-B E, 8.6810%, 8/16/32 (144A) | | 3,245,460 | | | 3,181,730 | |
| | Santander Bank Auto Credit-Linked Notes 2022-C E, 11.3660%, 12/15/32 (144A) | | 3,372,320 | | | 3,355,962 | |
| | Santander Bank Auto Credit-Linked Notes 2023-A E, 10.0680%, 6/15/33 (144A) | | 1,000,000 | | | 997,083 | |
| | Santander Consumer Auto Receivables Trust 2020-BA, 4.1300%, 1/15/27 (144A) | | 1,500,000 | | | 1,446,047 | |
| | Santander Consumer Auto Receivables Trust 2021-AA E, | | | | | | |
| | 3.2800%, 3/15/27 (144A) | | 1,750,000 | | | 1,617,422 | |
| | SB Multifamily Repack Trust 2020-FRR2 A2, 6.7428%, 12/27/39 (144A)‡ | | 18,551,319 | | | 17,594,373 | |
| | SEB Funding LLC 2021-1A A2, 4.9690%, 1/30/52 (144A) | | 18,700,133 | | | 16,406,675 | |
| | Sierra Receivables Funding Co LLC 2020-2A D, 6.5900%, 7/20/37 (144A) | | 1,798,598 | | | 1,736,337 | |
| | Sierra Receivables Funding Co LLC 2021-1A D, 3.1700%, 11/20/37 (144A) | | 3,822,145 | | | 3,486,112 | |
| | Sierra Receivables Funding Co LLC 2022-3A C, 7.6300%, 7/20/39 (144A) | | 1,650,517 | | | 1,625,748 | |
| | Sierra Receivables Funding Co LLC 2023-1A C, 7.0000%, 1/20/40 (144A) | | 2,196,969 | | | 2,123,525 | |
| | Sierra Timeshare 2019-1 Receivables Funding LLC, 4.7500%, 1/20/36 (144A) | | 1,055,029 | | | 979,327 | |
| | Sierra Timeshare 2019-2 Receivables Funding LLC, 4.5400%, 5/20/36 (144A) | | 1,843,150 | | | 1,724,278 | |
| | SMRT 2022-MINI E, CME Term SOFR 1 Month + 2.7000%, 7.8470%, 1/15/39 (144A)‡ | | 7,000,000 | | | 6,529,594 | |
| | Sprite Limited 2021-1 B, 5.1000%, 11/15/46 (144A) | | 4,804,908 | | | 3,951,921 | |
| | Sprite Limited 2021-1 C, 8.8350%, 11/15/46 (144A) | | 4,679,954 | | | 3,907,936 | |
| | Summit Issuer LLC 2020-1A B, 3.1790%, 12/20/50 (144A) | | 2,500,000 | | | 2,182,976 | |
| | Tesla Auto Lease Trust 2021-A E, 2.6400%, 3/20/25 (144A) | | 14,850,000 | | | 14,385,853 | |
| | Theorem Funding Trust 2022-3A A, 7.6000%, 4/15/29 (144A) | | 6,946,016 | | | 6,964,399 | |
| | Thrust Engine Leasing 2021-1A A, 4.1630%, 7/15/40 (144A) | | 9,050,918 | | | 7,593,992 | |
| | Thunderbolt Aircraft Lease Ltd 2017-A B, 5.7500%, 5/17/32 (144A)Ç | | 2,345,719 | | | 1,706,392 | |
| | TPI Re-Remic Trust 2022-FRR1 DK33, 0%, 7/25/46 (144A)◊ | | 2,237,000 | | | 2,197,207 | |
| | TPI Re-Remic Trust 2022-FRR1 DK34, 0%, 7/25/46 (144A)◊ | | 5,124,000 | | | 5,032,852 | |
| | TPI Re-Remic Trust 2022-FRR1 DK35, 0%, 8/25/46 (144A)◊ | | 2,639,000 | | | 2,592,056 | |
| | TPI Re-Remic Trust 2022-FRR1 EK34, 0%, 7/25/46 (144A)◊ | | 5,000,000 | | | 4,900,632 | |
| | Tricolor Auto Securitization Trust 2022-1A E, 7.7900%, 8/16/27 (144A) | | 10,870,000 | | | 10,800,492 | |
| | Tricolor Auto Securitization Trust 2023-1A D, 8.5600%, 7/15/27 (144A) | | 5,750,000 | | | 5,840,909 | |
| | TVEST LLC 2021-A B, 0%, 9/15/33 (144A) | | 6,550,000 | | | 5,088,695 | |
| | Upstart Securitization Trust 2019-2 C, 4.7830%, 9/20/29 (144A) | | 2,525,590 | | | 2,516,779 | |
| | Upstart Securitization Trust 2019-3 C, 5.3810%, 1/21/30 (144A) | | 6,917,312 | | | 6,907,200 | |
| | Upstart Securitization Trust 2020-3 C, 6.2500%, 11/20/30 (144A) | | 19,500,957 | | | 19,347,532 | |
| | Upstart Securitization Trust 2021-1 B, 1.8900%, 3/20/31 (144A) | | 2,024,821 | | | 2,014,320 | |
| | Upstart Securitization Trust 2021-1 C, 4.0600%, 3/20/31 (144A) | | 10,250,000 | | | 9,753,917 | |
| | |
See Notes to Schedule of Investments and Other Information and Notes to Financial Statements. |
| |
12 | JUNE 30, 2023 |
Janus Henderson Multi-Sector Income Fund
Schedule of Investments
June 30, 2023
| | | | | | | | |
Shares or
Principal Amounts | | | Value | |
Asset-Backed/Commercial Mortgage-Backed Securities– (continued) | | | |
| | Upstart Securitization Trust 2023-1 B, 8.3500%, 2/20/33 (144A) | | $6,235,000 | | | $6,183,776 | |
| | VASA Trust 2021-VASA D, | | | | | | |
| | ICE LIBOR USD 1 Month + 2.1000%, 7.2930%, 7/15/39 (144A)‡ | | 7,000,000 | | | 5,329,924 | |
| | VASA Trust 2021-VASA F, | | | | | | |
| | ICE LIBOR USD 1 Month + 3.9000%, 9.0930%, 7/15/39 (144A)‡ | | 5,500,000 | | | 2,775,848 | |
| | VB-S1 Issuer LLC 2020-2A B, 3.2290%, 9/15/50 (144A) | | 5,750,000 | | | 5,260,045 | |
| | VB-S1 Issuer LLC 2020-2A C, 4.4590%, 9/15/50 (144A) | | 12,000,000 | | | 10,966,685 | |
| | Wells Fargo Commercial Mortgage Trust 2021-C61 XA, 1.4943%, 11/15/54‡,¤ | | 81,123,056 | | | 5,587,613 | |
| | Westgate Resorts 2018-4A C, | | | | | | |
| | ICE LIBOR USD 3 Month + 3.3000%, 8.5551%, 10/25/31 (144A)‡ | | 2,000,000 | | | 1,912,262 | |
| | Westgate Resorts 2022-1A D, 3.8380%, 8/20/36 (144A) | | 2,476,908 | | | 2,313,744 | |
| | Westlake Automobile Receivable Trust 2020-3A F, 5.1100%, 5/17/27 (144A) | | 7,000,000 | | | 6,746,116 | |
| | Westlake Automobile Receivable Trust 2021-3A E, 3.4200%, 4/15/27 (144A) | | 5,000,000 | | | 4,574,948 | |
| | Willis Engine Securitization Trust 2020-A B, 4.2120%, 3/15/45 (144A) | | 5,342,081 | | | 3,899,719 | |
| | Willis Engine Securitization Trust 2020-A C, 6.6570%, 3/15/45 (144A) | | 1,426,007 | | | 891,255 | |
| | Woodward Capital Management 2017-280P B, | | | | | | |
| | ICE LIBOR USD 1 Month + 1.0800%, 6.2620%, 9/15/34 (144A)‡ | | 5,400,000 | | | 5,028,646 | |
| | Worldwide Plaza Trust 2017-WWP F, 3.7154%, 11/10/36 (144A)‡ | | 4,305,008 | | | 1,221,869 | |
| | Z Capital Credit Partners CLO 2018-1 Ltd, | | | | | | |
| | ICE LIBOR USD 3 Month + 2.4500%, 7.7103%, 1/16/31 (144A)‡ | | 1,250,000 | | | 1,236,071 | |
| | Z Capital Credit Partners CLO 2018-1A A2 Ltd, | | | | | | |
| | ICE LIBOR USD 3 Month + 1.5600%, 6.8203%, 1/16/31 (144A)‡ | | 2,703,433 | | | 2,688,645 | |
Total Asset-Backed/Commercial Mortgage-Backed Securities (cost $1,814,878,508) | | 1,700,360,179 | |
Bank Loans and Mezzanine Loans– 6.3% | | | |
Basic Industry – 0.4% | | | |
| | Aruba Investments Holdings LLC, | | | | | | |
| | ICE LIBOR USD 1 Month + 7.7500%, 12.9430%, 11/24/28‡ | | 5,786,000 | | | 5,091,680 | |
| | Herens US Holdco Corp, CME Term SOFR 3 Month + 3.9250%, 9.2669%, 7/3/28‡ | | 7,539,754 | | | 6,354,354 | |
| | | 11,446,034 | |
Brokerage – 0.4% | | | |
| | Advisor Group Holdings Inc, | | | | | | |
| | ICE LIBOR USD 1 Month + 4.5000%, 9.6930%, 7/31/26‡ | | 1,840,066 | | | 1,845,036 | |
| | Aretec Group Inc, CME Term SOFR 1 Month + 4.6000%, 9.1048%, 3/8/30ƒ,‡ | | 3,927,000 | | | 3,914,748 | |
| | Citadel Securities LP, CME Term SOFR 1 Month + 2.5000%, 7.7170%, 2/2/28‡ | | 7,274,019 | | | 7,277,818 | |
| | | 13,037,602 | |
Capital Goods – 0.5% | | | |
| | Arcline FM Holdings LLC, | | | | | | |
| | CME Term SOFR 3 Month + 8.2500%, 13.7535%, 6/25/29‡ | | 8,009,010 | | | 7,288,199 | |
| | Standard Industries Inc, CME Term SOFR 1 Month + 2.5000%, 7.6916%, 9/22/28‡ | | 7,851,082 | | | 7,871,517 | |
| | Summit Materials LLC, CME Term SOFR 6 Month + 3.0000%, 8.4915%, 12/14/27‡ | | 707,445 | | | 710,763 | |
| | | 15,870,479 | |
Communications – 0.2% | | | |
| | Directv Financing LLC, CME Term SOFR 1 Month + 5.0000%, 10.2170%, 8/2/27‡ | | 5,712,000 | | | 5,577,939 | |
Consumer Cyclical – 2.5% | | | |
| | Arches Buyer Inc, ICE LIBOR USD 1 Month + 3.2500%, 3.7500%, 12/6/27ƒ,‡ | | 7,436,588 | | | 7,164,706 | |
| | Boardriders Inc, ICE LIBOR USD 3 Month + 6.5000%, 11.7727%, 4/23/24‡ | | 4,409,192 | | | 2,733,699 | |
| | Boardriders Inc, | | | | | | |
| | ICE LIBOR USD 3 Month + 8.0000%, 13.3369% (13.22% Cash or 13.34% PIK), 4/23/24‡,Ø,¢ | | 1,613 | | | 1,613 | |
| | Entain Holdings Gibraltar Ltd, | | | | | | |
| | EURIBOR 3 Month + 3.7500%, 7.3010%, 6/30/28ƒ,‡ | | 4,770,000 | EUR | | 5,168,771 | |
| | Entain Holdings Gibraltar Ltd, | | | | | | |
| | CME Term SOFR 1 Month + 3.6000%, 8.6763%, 10/31/29ƒ,‡ | | 1,800,000 | | | 1,791,450 | |
| | Flutter Financing BV, CME Term SOFR 3 Month + 3.2500%, 8.7535%, 7/22/28‡ | | 8,648,162 | | | 8,654,042 | |
| | Loire Finco Luxembourg, EURIBOR 12 Month + 2.7500%, 6.1680%, 4/21/27‡ | | 2,660,000 | EUR | | 2,759,259 | |
| | LSF9 Atlantis Holdings LLC, | | | | | | |
| | CME Term SOFR 3 Month + 7.2500%, 12.4919%, 3/31/29‡ | | 8,343,750 | | | 8,229,023 | |
| | Mic Glen LLC, CME Term SOFR 1 Month + 6.7500%, 11.9525%, 7/20/29‡ | | 7,907,942 | | | 7,275,307 | |
| | Olaplex Inc, CME Term SOFR 1 Month + 3.5000%, 8.7025%, 2/23/29‡ | | 6,221,250 | | | 5,816,003 | |
| | |
See Notes to Schedule of Investments and Other Information and Notes to Financial Statements. |
| |
Janus Investment Fund | 13 |
Janus Henderson Multi-Sector Income Fund
Schedule of Investments
June 30, 2023
| | | | | | | | |
Shares or
Principal Amounts | | | Value | |
Bank Loans and Mezzanine Loans– (continued) | | | |
Consumer Cyclical– (continued) | | | |
| | Rent-A-Center Inc, ICE LIBOR USD 3 Month + 3.2500%, 8.5625%, 2/17/28‡ | | $4,660,795 | | | $4,667,485 | |
| | Sovos Brands Intermediate Inc, | | | | | | |
| | ICE LIBOR USD 3 Month + 3.5000%, 8.7727%, 6/8/28‡ | | 3,495,764 | | | 3,452,067 | |
| | Stars Group Holdings BV, CME Term SOFR 3 Month + 2.2500%, 7.7535%, 7/21/26‡ | | 5,320,865 | | | 5,316,236 | |
| | Tacala Investment Corp, ICE LIBOR USD 1 Month + 7.5000%, 12.6537%, 2/4/28‡ | | 5,683,991 | | | 5,328,742 | |
| | Wyndham Worldwide Corp, CME Term SOFR 3 Month + 4.0000%, 9.3543%, 12/14/29‡ | | 4,477,500 | | | 4,470,023 | |
| | | 72,828,426 | |
Consumer Non-Cyclical – 0.8% | | | |
| | Eyecare Partners LLC, CME Term SOFR 3 Month + 6.7500%, 12.2535%, 11/15/29‡ | | 7,500,000 | | | 4,980,000 | |
| | Fortrea Inc, CME Term SOFR 1 Month + 3.7500%, 8.9223%, 6/12/30ƒ,‡ | | 1,543,000 | | | 1,542,229 | |
| | Journey Personal Care Corp, | | | | | | |
| | ICE LIBOR USD 3 Month + 4.2500%, 9.9810%, 3/1/28‡ | | 3,359,525 | | | 2,863,995 | |
| | Mamba Purchaser Inc, CME Term SOFR 1 Month + 6.5000%, 11.7170%, 10/15/29‡ | | 4,000,000 | | | 3,760,000 | |
| | Perrigo Investments LLC, CME Term SOFR 1 Month + 2.2500%, 7.4525%, 4/20/29‡ | | 4,950,000 | | | 4,906,688 | |
| | Surgery Center Holdings Inc, | | | | | | |
| | ICE LIBOR USD 1 Month + 3.7500%, 8.8963%, 8/31/26‡ | | 2,380,784 | | | 2,376,189 | |
| | Topgolf Callaway Brands Corp, | | | | | | |
| | CME Term SOFR 1 Month + 3.5000%, 8.7025%, 3/15/30‡ | | 2,762,956 | | | 2,765,272 | |
| | | 23,194,373 | |
Diversified Consumer Services – 0.2% | | | |
| | Driven Holdings LLC, ICE LIBOR USD 1 Month + 3.0000%, 8.1541%, 12/17/28‡ | | 4,567,872 | | | 4,465,095 | |
Diversified Financial Services – 0.4% | | | |
| | Delta 2 Lux Sarl, CME Term SOFR 1 Month + 3.0000%, 8.1025%, 1/15/30‡ | | 6,300,000 | | | 6,296,850 | |
| | Luxembourg Investment Co 428 Sarl, | | | | | | |
| | CME Term SOFR 3 Month + 5.0000%, 10.0483%, 1/3/29‡ | | 7,944,280 | | | 5,779,464 | |
| | | 12,076,314 | |
Energy – 0.1% | | | |
| | Covanta Holding Corp, CME Term SOFR 3 Month + 3.0000%, 8.1476%, 11/30/28‡ | | 1,662,981 | | | 1,653,635 | |
| | Covanta Holding Corp, CME Term SOFR 3 Month + 3.0000%, 8.1476%, 11/30/28‡ | | 130,730 | | | 129,995 | |
| | | 1,783,630 | |
Technology – 0.5% | | | |
| | Magenta Buyer LLC, ICE LIBOR USD 1 Month + 8.2500%, 13.5300%, 7/27/29‡ | | 8,900,000 | | | 5,740,500 | |
| | Mitchell International Inc, | | | | | | |
| | ICE LIBOR USD 1 Month + 3.7500%, 8.9430%, 10/15/28‡ | | 7,742,000 | | | 7,552,321 | |
| | | 13,292,821 | |
Transportation – 0.3% | | | |
| | First Student Bidco Inc, ICE LIBOR USD 3 Month + 3.0000%, 8.1431%, 7/21/28‡ | | 7,192,822 | | | 6,965,985 | |
| | First Student Bidco Inc, ICE LIBOR USD 3 Month + 3.0000%, 8.1431%, 7/21/28‡ | | 2,696,078 | | | 2,603,953 | |
| | | 9,569,938 | |
Total Bank Loans and Mezzanine Loans (cost $196,773,145) | | 183,142,651 | |
Corporate Bonds– 27.1% | | | |
Banking – 2.1% | | | |
| | American Express Co, | | | | | | |
| | US Treasury Yield Curve Rate 5 Year + 2.8540%, 3.5500%‡,µ | | 2,697,000 | | | 2,238,510 | |
| | Bank of Montreal, | | | | | | |
| | US Treasury Yield Curve Rate 5 Year + 1.4000%, 3.0880%, 1/10/37‡ | | 5,537,000 | | | 4,348,687 | |
| | BNP Paribas SA, | | | | | | |
| | US Treasury Yield Curve Rate 1 Year + 1.4500%, 5.1250%, 1/13/29 (144A)‡ | | 6,932,000 | | | 6,783,026 | |
| | BNP Paribas SA, | | | | | | |
| | US Treasury Yield Curve Rate 5 Year + 4.9690%, 9.2500% (144A)‡,µ | | 4,267,000 | | | 4,397,625 | |
| | Citigroup Inc, US Treasury Yield Curve Rate 5 Year + 3.5970%, 4.0000%‡,µ | | 5,000,000 | | | 4,268,750 | |
| | Citigroup Inc, US Treasury Yield Curve Rate 5 Year + 3.4170%, 3.8750%‡,µ | | 5,310,000 | | | 4,447,125 | |
| | Commonwealth Bank of Australia, 3.7840%, 3/14/32 (144A) | | 7,269,000 | | | 6,089,191 | |
| | Credit Suisse Group AG, SOFR + 3.7300%, 4.1940%, 4/1/31 (144A)‡ | | 3,186,000 | | | 2,835,729 | |
| | JPMorgan Chase & Co, SOFR + 1.0150%, 2.0690%, 6/1/29‡ | | 4,309,000 | | | 3,695,525 | |
| | |
See Notes to Schedule of Investments and Other Information and Notes to Financial Statements. |
| |
14 | JUNE 30, 2023 |
Janus Henderson Multi-Sector Income Fund
Schedule of Investments
June 30, 2023
| | | | | | | | |
Shares or
Principal Amounts | | | Value | |
Corporate Bonds– (continued) | | | |
Banking– (continued) | | | |
| | JPMorgan Chase & Co, CME Term SOFR 3 Month + 3.3800%, 5.0000%‡,µ | | $2,163,000 | | | $2,112,981 | |
| | JPMorgan Chase & Co, | | | | | | |
| | US Treasury Yield Curve Rate 5 Year + 2.8500%, 3.6500%‡,µ | | 2,501,000 | | | 2,201,255 | |
| | Morgan Stanley, CME Term SOFR 3 Month + 1.8896%, 4.4310%, 1/23/30‡ | | 2,117,000 | | | 2,014,189 | |
| | Morgan Stanley, SOFR + 3.1200%, 3.6220%, 4/1/31‡ | | 3,996,000 | | | 3,600,759 | |
| | Morgan Stanley, | | | | | | |
| | US Treasury Yield Curve Rate 5 Year + 2.4300%, 5.9480%, 1/19/38‡ | | 1,574,000 | | | 1,553,604 | |
| | Royal Bank of Canada, 5.0000%, 5/2/33 | | 11,100,000 | | | 10,831,603 | |
| | | 61,418,559 | |
Basic Industry – 1.0% | | | |
| | Celanese US Holdings LLC, 6.3300%, 7/15/29 | | 1,443,000 | | | 1,433,070 | |
| | Celanese US Holdings LLC, 6.3790%, 7/15/32# | | 2,119,000 | | | 2,137,379 | |
| | Hudbay Minerals Inc, 4.5000%, 4/1/26 (144A)# | | 6,918,000 | | | 6,441,622 | |
| | Hudbay Minerals Inc, 6.1250%, 4/1/29 (144A) | | 6,957,000 | | | 6,405,797 | |
| | IAMGOLD Corp, 5.7500%, 10/15/28 (144A) | | 3,491,000 | | | 2,611,810 | |
| | Kaiser Aluminum Corp, 4.5000%, 6/1/31 (144A) | | 9,000,000 | | | 7,174,620 | |
| | Neon Holdings Inc, 10.1250%, 4/1/26 (144A) | | 3,021,000 | | | 2,779,291 | |
| | | 28,983,589 | |
Brokerage – 0.1% | | | |
| | Nasdaq Inc, 5.5500%, 2/15/34 | | 1,970,000 | | | 1,977,748 | |
| | Nasdaq Inc, 5.9500%, 8/15/53 | | 1,966,000 | | | 2,012,968 | |
| | | 3,990,716 | |
Capital Goods – 1.5% | | | |
| | ARD Finance SA, 5.0000% (5.00% Cash or 5.75% PIK), 6/30/27Ø | | 9,468,244 | EUR | | 7,957,164 | |
| | ARD Finance SA, 5.0000% (5.00% Cash or 5.75% PIK), 6/30/27 (144A)Ø | | 1,468,400 | EUR | | 1,234,051 | |
| | ARD Finance SA, 6.5000% (6.50% Cash or 7.25% PIK), 6/30/27 (144A)Ø | | 3,388,380 | | | 2,745,083 | |
| | General Electric Co, ICE LIBOR USD 3 Month + 3.3300%, 8.8820%‡,µ | | 3,149,000 | | | 3,148,996 | |
| | HT Troplast GmbH, 9.2500%, 7/15/25 (144A) | | 2,790,000 | EUR | | 3,087,627 | |
| | Knife River Corp, 7.7500%, 5/1/31 (144A) | | 3,706,000 | | | 3,752,401 | |
| | LABL Inc, 8.2500%, 11/1/29 (144A) | | 8,536,000 | | | 7,138,230 | |
| | Regal Rexnord Corp, 6.3000%, 2/15/30 (144A) | | 2,843,000 | | | 2,834,585 | |
| | Regal Rexnord Corp, 6.4000%, 4/15/33 (144A) | | 1,897,000 | | | 1,895,401 | |
| | Trinity Industries Inc, 7.7500%, 7/15/28 (144A) | | 10,829,000 | | | 10,896,681 | |
| | | 44,690,219 | |
Communications – 1.4% | | | |
| | Altice Financing SA, 5.0000%, 1/15/28 (144A) | | 6,822,000 | | | 5,451,895 | |
| | AT&T Inc, EURIBOR ICE SWAP Rate + 3.1400%, 2.8750%‡,µ | | 5,300,000 | EUR | | 5,326,959 | |
| | Block Communications Inc, 4.8750%, 3/1/28 (144A) | | 7,120,000 | | | 5,891,800 | |
| | Gray Television Inc, 4.7500%, 10/15/30 (144A) | | 5,500,000 | | | 3,729,715 | |
| | Netflix Inc, 3.6250%, 6/15/30 | | 8,071,000 | EUR | | 8,369,003 | |
| | Scripps Escrow II Inc, 5.3750%, 1/15/31 (144A) | | 5,804,000 | | | 4,090,650 | |
| | T-Mobile USA Inc, 3.3750%, 4/15/29 | | 4,899,000 | | | 4,424,032 | |
| | Windstream Escrow LLC, 7.7500%, 8/15/28 (144A) | | 4,728,000 | | | 3,923,794 | |
| | | 41,207,848 | |
Consumer Cyclical – 2.7% | | | |
| | Adler Pelzer Holding GmbH, 9.5000%, 4/1/27 (144A) | | 6,450,000 | EUR | | 6,500,952 | |
| | Carnival Corp, 7.6250%, 3/1/26 (144A)# | | 7,567,000 | | | 7,411,111 | |
| | Carnival Corp, 6.0000%, 5/1/29 (144A) | | 6,514,000 | | | 5,815,923 | |
| | CBRE Services Inc, 5.9500%, 8/15/34 | | 7,979,000 | | | 7,878,663 | |
| | Ford Motor Credit Co LLC, 7.3500%, 11/4/27 | | 5,197,000 | | | 5,306,761 | |
| | Full House Resorts Inc, 8.2500%, 2/15/28 (144A)# | | 10,378,000 | | | 9,713,600 | |
| | GLP Capital LP / GLP Financing II Inc, 4.0000%, 1/15/31 | | 3,218,000 | | | 2,782,155 | |
| | Kohl's Corp, 4.6250%, 5/1/31Ç | | 7,649,000 | | | 5,322,021 | |
| | Lithia Motors Inc, 3.8750%, 6/1/29 (144A) | | 3,700,000 | | | 3,214,764 | |
| | Lithia Motors Inc, 4.3750%, 1/15/31 (144A) | | 6,689,000 | | | 5,773,927 | |
| | LKQ Corp, 6.2500%, 6/15/33 (144A) | | 5,850,000 | | | 5,894,102 | |
| | Royal Caribbean Cruises Ltd, 7.2500%, 1/15/30 (144A) | | 1,800,000 | | | 1,823,119 | |
| | VICI Properties LP, 4.9500%, 2/15/30 | | 4,993,000 | | | 4,683,833 | |
| | VICI Properties LP, 5.1250%, 5/15/32 | | 1,932,000 | | | 1,807,665 | |
| | |
See Notes to Schedule of Investments and Other Information and Notes to Financial Statements. |
| |
Janus Investment Fund | 15 |
Janus Henderson Multi-Sector Income Fund
Schedule of Investments
June 30, 2023
| | | | | | | | |
Shares or
Principal Amounts | | | Value | |
Corporate Bonds– (continued) | | | |
Consumer Cyclical– (continued) | | | |
| | Victoria's Secret & Co, 4.6250%, 7/15/29 (144A)# | | $5,339,000 | | | $3,902,208 | |
| | | 77,830,804 | |
Consumer Non-Cyclical – 4.6% | | | |
| | AdaptHealth LLC, 6.1250%, 8/1/28 (144A) | | 8,398,000 | | | 7,274,561 | |
| | AMN Healthcare Inc, 4.0000%, 4/15/29 (144A) | | 4,005,000 | | | 3,492,600 | |
| | B&G Foods Inc, 5.2500%, 4/1/25 | | 6,486,000 | | | 6,192,117 | |
| | Catalent Pharma Solutions Inc, 2.3750%, 3/1/28 | | 5,060,000 | EUR | | 4,438,044 | |
| | Cheplapharm Arzneimittel GmbH, 7.5000%, 5/15/30 (144A) | | 6,760,000 | EUR | | 7,399,792 | |
| | Fortrea Holdings Inc, 7.5000%, 7/1/30 (144A) | | 3,600,000 | | | 3,686,292 | |
| | HCA Inc, 3.6250%, 3/15/32 (144A) | | 682,000 | | | 591,982 | |
| | HCA Inc, 5.5000%, 6/1/33 | | 6,949,000 | | | 6,937,197 | |
| | Heartland Dental LLC / Heartland Dental Finance Corp, | | | | | | |
| | 10.5000%, 4/30/28 (144A)# | | 11,834,000 | | | 11,760,037 | |
| | HLF Financing Sarl LLC / Herbalife International Inc, | | | | | | |
| | 4.8750%, 6/1/29 (144A) | | 7,721,000 | | | 5,503,297 | |
| | IQVIA Inc, 2.2500%, 3/15/29 | | 4,650,000 | EUR | | 4,331,855 | |
| | IQVIA Inc, 6.5000%, 5/15/30 (144A) | | 3,109,000 | | | 3,139,696 | |
| | Mattel Inc, 5.4500%, 11/1/41# | | 3,250,000 | | | 2,694,342 | |
| | Organon Finance 1 LLC, 5.1250%, 4/30/31 (144A) | | 7,824,000 | | | 6,454,990 | |
| | Owens & Minor Inc, 6.6250%, 4/1/30 (144A)# | | 7,828,000 | | | 7,102,031 | |
| | Pediatrix Medical Group Inc, 5.3750%, 2/15/30 (144A)# | | 7,533,000 | | | 6,930,360 | |
| | Pfizer Investment Enterprises Pte Ltd, 4.7500%, 5/19/33 | | 4,607,000 | | | 4,589,642 | |
| | Pilgrim's Pride Corp, 5.8750%, 9/30/27 (144A) | | 9,658,000 | | | 9,542,127 | |
| | Pilgrim's Pride Corp, 6.2500%, 7/1/33 | | 10,977,000 | | | 10,632,234 | |
| | Teva Pharmaceutical Finance Netherlands III BV, 7.8750%, 9/15/29 | | 4,975,000 | | | 5,126,897 | |
| | Teva Pharmaceutical Industries Ltd, 4.7500%, 5/9/27 | | 8,753,000 | | | 8,097,159 | |
| | Universal Health Services Inc, 2.6500%, 1/15/32 | | 7,779,000 | | | 6,131,856 | |
| | | 132,049,108 | |
Electric – 1.5% | | | |
| | Algonquin Power & Utilities Corp, | | | | | | |
| | US Treasury Yield Curve Rate 5 Year + 3.2490%, 4.7500%, 1/18/82‡ | | 8,480,000 | | | 6,741,600 | |
| | American Electric Power Co Inc, 5.6250%, 3/1/33 | | 3,096,000 | | | 3,147,577 | |
| | American Electric Power Co Inc, | | | | | | |
| | US Treasury Yield Curve Rate 5 Year + 2.6750%, 3.8750%, 2/15/62‡,# | | 5,517,000 | | | 4,381,767 | |
| | CMS Energy Corp, | | | | | | |
| | US Treasury Yield Curve Rate 5 Year + 4.1160%, 4.7500%, 6/1/50‡ | | 3,354,000 | | | 2,883,534 | |
| | Duquesne Light Holdings Inc, 2.5320%, 10/1/30 (144A) | | 3,072,000 | | | 2,454,938 | |
| | IPALCO Enterprises Inc, 4.2500%, 5/1/30 | | 4,008,000 | | | 3,626,159 | |
| | NRG Energy Inc, 3.6250%, 2/15/31 (144A) | | 1,933,000 | | | 1,508,987 | |
| | NRG Energy Inc, 3.8750%, 2/15/32 (144A) | | 5,418,000 | | | 4,174,490 | |
| | NRG Energy Inc, 7.0000%, 3/15/33 (144A) | | 9,733,000 | | | 9,813,638 | |
| | Xcel Energy Inc, 4.6000%, 6/1/32 | | 4,725,000 | | | 4,461,840 | |
| | | 43,194,530 | |
Energy – 3.9% | | | |
| | AmeriGas Partners LP / AmeriGas Finance Corp, 5.7500%, 5/20/27 | | 7,888,000 | | | 7,250,873 | |
| | Antero Resources Corp, 5.3750%, 3/1/30 (144A) | | 5,752,000 | | | 5,324,887 | |
| | Civitas Resources Inc, 8.3750%, 7/1/28 (144A) | | 9,000,000 | | | 9,101,700 | |
| | DT Midstream Inc, 4.1250%, 6/15/29 (144A) | | 7,432,000 | | | 6,522,139 | |
| | Enerflex Ltd, 9.0000%, 10/15/27 (144A) | | 4,645,000 | | | 4,519,446 | |
| | EnLink Midstream LLC, 5.6250%, 1/15/28 (144A) | | 6,183,000 | | | 5,983,185 | |
| | EnLink Midstream Partners LP, ICE LIBOR USD 3 Month + 4.1100%, 9.6184%‡,µ | | 7,858,000 | | | 6,465,200 | |
| | EQM Midstream Partners LP, 4.7500%, 1/15/31 (144A) | | 3,318,000 | | | 2,906,515 | |
| | FTAI Infra Escrow Holdings LLC, 10.5000%, 6/1/27 (144A) | | 13,378,000 | | | 13,138,586 | |
| | Hess Midstream Operations LP, 4.2500%, 2/15/30 (144A) | | 5,561,000 | | | 4,851,973 | |
| | Howard Midstream Energy Partners LLC, 6.7500%, 1/15/27 (144A) | | 9,769,000 | | | 9,304,973 | |
| | Occidental Petroleum Corp, 7.8750%, 9/15/31 | | 4,784,000 | | | 5,333,216 | |
| | Rockies Express Pipeline LLC, 4.9500%, 7/15/29 (144A) | | 1,462,000 | | | 1,337,730 | |
| | SM Energy Co, 5.6250%, 6/1/25 | | 8,923,000 | | | 8,719,466 | |
| | Tallgrass Energy Partners LP / Tallgrass Energy Finance Corp, | | | | | | |
| | |
See Notes to Schedule of Investments and Other Information and Notes to Financial Statements. |
| |
16 | JUNE 30, 2023 |
Janus Henderson Multi-Sector Income Fund
Schedule of Investments
June 30, 2023
| | | | | | | | |
Shares or
Principal Amounts | | | Value | |
Corporate Bonds– (continued) | | | |
Energy– (continued) | | | |
| | 5.5000%, 1/15/28 (144A) | | $5,739,000 | | | $5,245,346 | |
| | Tallgrass Energy Partners LP / Tallgrass Energy Finance Corp, | | | | | | |
| | 6.0000%, 9/1/31 (144A) | | 1,155,000 | | | 993,801 | |
| | Venture Global Calcasieu Pass LLC, 6.2500%, 1/15/30 (144A) | | 7,655,000 | | | 7,593,279 | |
| | Viper Energy Partners LP, 5.3750%, 11/1/27 (144A) | | 8,166,000 | | | 7,837,054 | |
| | | 112,429,369 | |
Finance Companies – 1.9% | | | |
| | FirstCash Inc, 4.6250%, 9/1/28 (144A) | | 5,509,000 | | | 4,920,655 | |
| | FirstCash Inc, 5.6250%, 1/1/30 (144A) | | 5,664,000 | | | 5,119,260 | |
| | Fortress Transportation and Infrastructure Investors LLC, | | | | | | |
| | 6.5000%, 10/1/25 (144A) | | 2,318,000 | | | 2,283,609 | |
| | Fortress Transportation and Infrastructure Investors LLC, | | | | | | |
| | 9.7500%, 8/1/27 (144A) | | 3,509,000 | | | 3,623,994 | |
| | Navient Corp, 9.3750%, 7/25/30 | | 13,750,000 | | | 13,676,437 | |
| | OWL Rock Core Income Corp, 4.7000%, 2/8/27 | | 8,032,000 | | | 7,288,410 | |
| | PennyMac Financial Services Inc, 5.7500%, 9/15/31 (144A) | | 8,000,000 | | | 6,524,708 | |
| | Quicken Loans LLC, 3.8750%, 3/1/31 (144A) | | 4,499,000 | | | 3,648,048 | |
| | Springleaf Finance Corp, 6.8750%, 3/15/25 | | 8,426,000 | | | 8,342,848 | |
| | | 55,427,969 | |
Financial Institutions – 0.9% | | | |
| | AT Securities BV, USD SWAP SEMI 30/360 5YR + 3.5460%, 5.2500%‡,µ | | 5,000,000 | | | 1,950,000 | |
| | Burford Capital Global Finance LLC, 6.2500%, 4/15/28 (144A) | | 4,962,000 | | | 4,565,040 | |
| | Burford Capital Global Finance LLC, 6.8750%, 4/15/30 (144A) | | 4,025,000 | | | 3,668,865 | |
| | CPI Property Group SA, EUR SWAP ANNUAL 5 YR + 4.9440%, 4.8750%‡,µ | | 5,589,000 | EUR | | 2,123,980 | |
| | GGAM Finance Ltd, 8.0000%, 6/15/28 (144A) | | 12,600,000 | | | 12,606,426 | |
| | | 24,914,311 | |
Government Sponsored – 0.1% | | | |
| | Electricite de France SA, 5.7000%, 5/23/28 (144A) | | 2,193,000 | | | 2,189,689 | |
Insurance – 1.1% | | | |
| | Athene Global Funding, 2.6460%, 10/4/31 (144A) | | 8,600,000 | | | 6,510,110 | |
| | Broadstreet Partners Inc, 5.8750%, 4/15/29 (144A) | | 7,633,000 | | | 6,621,927 | |
| | Brown & Brown Inc, 4.9500%, 3/17/52 | | 3,218,000 | | | 2,754,245 | |
| | Centene Corp, 3.3750%, 2/15/30 | | 14,292,000 | | | 12,283,116 | |
| | Prudential Financial Inc, 3.7000%, 3/13/51 | | 3,673,000 | | | 2,813,670 | |
| | | 30,983,068 | |
Mortgage Assets – 0.4% | | | |
| | Banco La Hipotecaria SA, 5.5000%, 9/15/23 (144A) | | 5,700,000 | | | 5,678,001 | |
| | Banco La Hipotecaria SA, 4.1250%, 12/15/24 (144A) | | 5,000,000 | | | 4,807,340 | |
| | | 10,485,341 | |
Real Estate Investment Trusts (REITs) – 0.7% | | | |
| | Alexandria Real Estate Equities Inc, 4.7500%, 4/15/35 | | 5,706,000 | | | 5,294,218 | |
| | Broadstone Net Lease LLC, 2.6000%, 9/15/31 | | 2,870,000 | | | 2,056,440 | |
| | Global Net Lease Inc / Global Net Lease Operating Partnership LP, | | | | | | |
| | 3.7500%, 12/15/27 (144A) | | 8,400,000 | | | 6,162,250 | |
| | Lexington Realty Trust, 2.7000%, 9/15/30 | | 3,324,000 | | | 2,654,568 | |
| | Safehold Operating Partnership LP, 2.8000%, 6/15/31 | | 5,556,000 | | | 4,309,454 | |
| | | 20,476,930 | |
Technology – 2.4% | | | |
| | Acuris Finance US Inc / Acuris Finance SARL, 5.0000%, 5/1/28 (144A) | | 2,685,000 | | | 2,078,152 | |
| | Austin BidCo Inc, 7.1250%, 12/15/28 (144A) | | 8,552,000 | | | 6,964,687 | |
| | CA Magnum Holdings, 5.3750%, 10/31/26 (144A) | | 6,237,000 | | | 5,584,378 | |
| | Entegris Inc, 3.6250%, 5/1/29 (144A) | | 8,081,000 | | | 6,964,044 | |
| | Equinix Inc, 2.5000%, 5/15/31 | | 8,726,000 | | | 7,104,667 | |
| | Fiserv Inc, 5.6000%, 3/2/33 | | 4,500,000 | | | 4,580,157 | |
| | Foundry JV Holdco LLC, 5.8750%, 1/25/34 (144A) | | 9,000,000 | | | 8,964,421 | |
| | Iron Mountain Inc, 5.2500%, 7/15/30 (144A) | | 5,631,000 | | | 5,073,840 | |
| | Iron Mountain Inc, 4.5000%, 2/15/31 (144A) | | 3,754,000 | | | 3,225,544 | |
| | Leidos Inc, 5.7500%, 3/15/33 | | 3,278,000 | | | 3,256,509 | |
| | Seagate HDD Cayman, 8.2500%, 12/15/29 (144A) | | 3,000,000 | | | 3,133,410 | |
| | |
See Notes to Schedule of Investments and Other Information and Notes to Financial Statements. |
| |
Janus Investment Fund | 17 |
Janus Henderson Multi-Sector Income Fund
Schedule of Investments
June 30, 2023
| | | | | | | | |
Shares or
Principal Amounts | | | Value | |
Corporate Bonds– (continued) | | | |
Technology– (continued) | | | |
| | Seagate HDD Cayman, 9.6250%, 12/1/32 (144A) | | $5,969,237 | | | $6,586,683 | |
| | Trimble Inc, 6.1000%, 3/15/33 | | 7,117,000 | | | 7,211,159 | |
| | | 70,727,651 | |
Transportation – 0.8% | | | |
| | Cargo Aircraft Management Inc, 4.7500%, 2/1/28 (144A) | | 6,400,000 | | | 5,606,848 | |
| | Rand Parent LLC, 8.5000%, 2/15/30 (144A)# | | 18,427,000 | | | 16,682,934 | |
| | | 22,289,782 | |
Total Corporate Bonds (cost $831,090,964) | | 783,289,483 | |
Mortgage-Backed Securities– 25.0% | | | |
Fannie Mae: | | | |
| | 3.0000%, TBA, 15 Year Maturity | | 16,732,212 | | | 15,613,898 | |
| | 3.5000%, TBA, 15 Year Maturity | | 15,731,117 | | | 14,960,277 | |
| | 4.0000%, TBA, 15 Year Maturity | | 24,687,000 | | | 23,836,360 | |
| | 3.0000%, TBA, 30 Year Maturity | | 31,587,142 | | | 27,826,187 | |
| | 3.5000%, TBA, 30 Year Maturity | | 121,753,696 | | | 111,027,926 | |
| | 4.0000%, TBA, 30 Year Maturity | | 152,830,871 | | | 143,567,829 | |
| | 4.5000%, TBA, 30 Year Maturity | | 100,287,498 | | | 96,462,332 | |
| | 5.0000%, TBA, 30 Year Maturity | | 91,178,023 | | | 89,342,974 | |
| | | 522,637,783 | |
Fannie Mae Pool: | | | |
| | 3.0000%, 10/1/34 | | 135,027 | | | 126,599 | |
| | 6.0000%, 2/1/37 | | 610 | | | 640 | |
| | 3.0000%, 9/1/42 | | 998,975 | | | 903,113 | |
| | 3.0000%, 1/1/43 | | 1,294,878 | | | 1,170,621 | |
| | 3.0000%, 2/1/43 | | 3,921,804 | | | 3,545,467 | |
| | 3.0000%, 2/1/43 | | 513,963 | | | 464,643 | |
| | 3.0000%, 2/1/43 | | 33,761 | | | 30,519 | |
| | 3.0000%, 3/1/43 | | 1,665,132 | | | 1,505,200 | |
| | 3.0000%, 3/1/43 | | 465,425 | | | 420,722 | |
| | 3.0000%, 5/1/43 | | 388,219 | | | 350,931 | |
| | 3.0000%, 5/1/43 | | 1,892 | | | 1,710 | |
| | 5.0000%, 7/1/44 | | 5,226 | | | 5,258 | |
| | 4.5000%, 10/1/44 | | 3,581 | | | 3,537 | |
| | 4.5000%, 3/1/45 | | 5,430 | | | 5,362 | |
| | 3.0000%, 7/1/45 | | 2,110,525 | | | 1,907,815 | |
| | 3.5000%, 12/1/45 | | 256,776 | | | 238,170 | |
| | 4.5000%, 2/1/46 | | 7,696 | | | 7,588 | |
| | 3.5000%, 7/1/46 | | 12,498 | | | 11,601 | |
| | 3.0000%, 9/1/46 | | 935,379 | | | 845,620 | |
| | 3.0000%, 11/1/46 | | 307,655 | | | 276,564 | |
| | 3.0000%, 1/1/47 | | 52,658 | | | 47,336 | |
| | 3.5000%, 3/1/47 | | 225,465 | | | 209,128 | |
| | 4.0000%, 5/1/47 | | 831,315 | | | 797,989 | |
| | 3.5000%, 7/1/47 | | 199,317 | | | 184,875 | |
| | 3.5000%, 8/1/47 | | 2,455 | | | 2,266 | |
| | 3.5000%, 1/1/48 | | 3,022 | | | 2,798 | |
| | 4.0000%, 1/1/48 | | 11,305 | | | 10,836 | |
| | 3.5000%, 3/1/48 | | 3,050,863 | | | 2,815,257 | |
| | 4.0000%, 3/1/48 | | 3,503 | | | 3,357 | |
| | 3.5000%, 7/1/48 | | 5,071,795 | | | 4,682,737 | |
| | 4.5000%, 12/1/48 | | 544,123 | | | 532,354 | |
| | 3.0000%, 9/1/49 | | 356,805 | | | 319,858 | |
| | 4.0000%, 10/1/51 | | 27,212,117 | | | 25,805,507 | |
| | 5.5000%, 10/1/52 | | 13,155,237 | | | 13,110,272 | |
| | 5.5000%, 10/1/52 | | 9,643,813 | | | 9,721,630 | |
| | 3.0000%, 2/1/57 | | 5,101,615 | | | 4,494,829 | |
| | 3.0000%, 6/1/57 | | 22,007 | | | 19,387 | |
| | | 74,582,096 | |
| | |
See Notes to Schedule of Investments and Other Information and Notes to Financial Statements. |
| |
18 | JUNE 30, 2023 |
Janus Henderson Multi-Sector Income Fund
Schedule of Investments
June 30, 2023
| | | | | | | | |
Shares or
Principal Amounts | | | Value | |
Mortgage-Backed Securities– (continued) | | | |
Freddie Mac Gold Pool: | | | |
| | 3.5000%, 1/1/47 | | $151,829 | | | $141,997 | |
Freddie Mac Pool: | | | |
| | 3.0000%, 5/1/31 | | 1,285,066 | | | 1,219,993 | |
| | 3.0000%, 9/1/32 | | 195,381 | | | 184,327 | |
| | 3.0000%, 1/1/33 | | 109,195 | | | 103,018 | |
| | 3.0000%, 10/1/34 | | 339,153 | | | 317,969 | |
| | 3.0000%, 10/1/34 | | 148,996 | | | 139,690 | |
| | 6.0000%, 4/1/40 | | 13,416 | | | 14,117 | |
| | 3.0000%, 2/1/43 | | 3,700 | | | 3,344 | |
| | 3.5000%, 2/1/43 | | 3,181 | | | 2,970 | |
| | 3.0000%, 3/1/43 | | 84,861 | | | 76,707 | |
| | 3.0000%, 6/1/43 | | 131,492 | | | 116,883 | |
| | 3.0000%, 11/1/43 | | 4,168,273 | | | 3,768,106 | |
| | 3.5000%, 2/1/44 | | 10,706 | | | 9,995 | |
| | 4.5000%, 5/1/44 | | 2,623 | | | 2,588 | |
| | 3.5000%, 12/1/44 | | 198,954 | | | 185,733 | |
| | 3.0000%, 1/1/45 | | 2,409 | | | 2,172 | |
| | 3.5000%, 7/1/46 | | 2,289 | | | 2,120 | |
| | 4.0000%, 3/1/47 | | 6,643 | | | 6,364 | |
| | 3.5000%, 9/1/47 | | 4,045 | | | 3,733 | |
| | 3.5000%, 12/1/47 | | 40,106 | | | 37,208 | |
| | 3.5000%, 2/1/48 | | 2,463 | | | 2,279 | |
| | 4.0000%, 4/1/48 | | 1,440 | | | 1,377 | |
| | 4.5000%, 4/1/49 | | 1,103,033 | | | 1,075,066 | |
| | 4.0000%, 5/1/49 | | 4,424,797 | | | 4,196,776 | |
| | 3.5000%, 8/1/49 | | 1,999,098 | | | 1,838,512 | |
| | 3.0000%, 12/1/49 | | 573,094 | | | 508,944 | |
| | 3.0000%, 12/1/49 | | 329,298 | | | 292,438 | |
| | | 14,112,429 | |
Ginnie Mae: | | | |
| | 3.5000%, TBA, 30 Year Maturity | | 98,660,539 | | | 91,052,726 | |
| | 4.0000%, TBA, 30 Year Maturity | | 16,054,402 | | | 15,173,336 | |
| | 5.0000%, TBA, 30 Year Maturity | | 7,343,765 | | | 7,212,649 | |
| | | 113,438,711 | |
Ginnie Mae I Pool: | | | |
| | 4.5000%, 8/15/46 | | 10,432 | | | 10,155 | |
| | 4.0000%, 7/15/47 | | 2,993 | | | 2,859 | |
| | 4.0000%, 8/15/47 | | 345 | | | 330 | |
| | 4.0000%, 11/15/47 | | 591 | | | 565 | |
| | 4.0000%, 12/15/47 | | 1,918 | | | 1,832 | |
| | | 15,741 | |
Ginnie Mae II Pool: | | | |
| | 4.5000%, 2/20/48 | | 101,397 | | | 99,207 | |
| | 4.5000%, 5/20/48 | | 2,493 | | | 2,438 | |
| | 4.5000%, 5/20/48 | | 938 | | | 917 | |
| | | 102,562 | |
Total Mortgage-Backed Securities (cost $734,123,070) | | 725,031,319 | |
Common Stocks– 0.1% | | | |
Metals & Mining – 0.1% | | | |
| | Hudbay Minerals Inc | | 546,362 | | | 2,622,538 | |
Professional Services – 0% | | | |
| | Clarivate Analytics PLC* | | 4,217 | | | 40,188 | |
Total Common Stocks (cost $2,918,742) | | 2,662,726 | |
Preferred Stocks– 0.1% | | | |
Consumer Cyclical – 0% | | | |
| | Quiksilver Inc¢ | | 12,688 | | | 10,785 | |
Finance Companies – 0.1% | | | |
| | Castlelake Aircraft Securitization Trust 2018-1, 6/15/43 (144A)‡ | | 1,000,000 | | | 100,000 | |
| | |
See Notes to Schedule of Investments and Other Information and Notes to Financial Statements. |
| |
Janus Investment Fund | 19 |
Janus Henderson Multi-Sector Income Fund
Schedule of Investments
June 30, 2023
| | | | | | | | |
Shares or
Principal Amounts | | | Value | |
Preferred Stocks– (continued) | | | |
Finance Companies– (continued) | | | |
| | Upstart Securitization Trust 2019-3, 1/21/30 (144A) | | 8,250 | | | $482,625 | |
| | | 582,625 | |
Industrial – 0% | | | |
| | Project Silver, 3/15/44 (144A)‡ | | 1,500,000 | | | 187,500 | |
| | START Ireland, 3/15/44 (144A)‡ | | 1,500,000 | | | 180,000 | |
| | Thunderbolt II Aircraft Lease Ltd, 9/15/38 (144A) | | 10 | | | 43,238 | |
| | Thunderbolt III Aircraft Lease Ltd, 11/15/39 (144A)‡ | | 5,000,000 | | | 100,000 | |
| | | 510,738 | |
Total Preferred Stocks (cost $16,005,046) | | 1,104,148 | |
Investment Companies– 4.7% | | | |
Money Markets – 4.7% | | | |
| | Janus Henderson Cash Liquidity Fund LLC, 5.1900%ºº,£((cost $136,329,275) | | 136,301,661 | | | 136,328,921 | |
Investments Purchased with Cash Collateral from Securities Lending– 0.6% | | | |
Investment Companies – 0.5% | | | |
| | Janus Henderson Cash Collateral Fund LLC, 4.9971%ºº,£ | | 14,706,842 | | | 14,706,842 | |
Time Deposits – 0.1% | | | |
| | Royal Bank of Canada, 5.0600%, 7/3/23 | �� | $3,676,710 | | | 3,676,710 | |
Total Investments Purchased with Cash Collateral from Securities Lending (cost $18,383,552) | | 18,383,552 | |
Total Investments (total cost $3,750,502,302) – 122.6% | | 3,550,302,979 | |
Liabilities, net of Cash, Receivables and Other Assets – (22.6)% | | (654,151,975) | |
Net Assets – 100% | | $2,896,151,004 | |
| | | | | | |
Summary of Investments by Country - (Long Positions) (unaudited) |
| |
| | | | | % of | |
| | | | | Investment | |
Country | | Value | | Securities | |
United States | | $3,329,380,565 | | 93.8 | % |
Canada | | 37,796,915 | | 1.1 | |
Ireland | | 29,632,442 | | 0.8 | |
Luxembourg | | 29,464,507 | | 0.8 | |
Cayman Islands | | 26,018,455 | | 0.7 | |
Germany | | 18,938,371 | | 0.5 | |
France | | 13,370,340 | | 0.4 | |
Israel | | 13,224,056 | | 0.4 | |
Peru | | 12,847,419 | | 0.4 | |
Panama | | 10,485,341 | | 0.3 | |
United Kingdom | | 9,719,480 | | 0.3 | |
Australia | | 6,089,191 | | 0.2 | |
India | | 5,584,378 | | 0.1 | |
Switzerland | | 2,835,729 | | 0.1 | |
Burkina Faso | | 2,611,810 | | 0.1 | |
Czech Republic | | 2,123,980 | | 0.0 | |
Bermuda | | 180,000 | | 0.0 | |
| | | | | | |
| | | | | | |
Total | | $3,550,302,979 | | 100.0 | % |
| | |
See Notes to Schedule of Investments and Other Information and Notes to Financial Statements. |
| |
20 | JUNE 30, 2023 |
Janus Henderson Multi-Sector Income Fund
Schedule of Investments
June 30, 2023
Schedules of Affiliated Investments – (% of Net Assets)
| | | | | | | | | | | |
| | Dividend Income | Realized Gain/(Loss) | Change in Unrealized Appreciation/ Depreciation | Value at 6/30/23 |
Investment Companies - 4.7% |
Money Markets - 4.7% | |
| | Janus Henderson Cash Liquidity Fund LLC, 5.1900%ºº | $ | 2,560,360 | $ | 11,756 | $ | (3,146) | $ | 136,328,921 |
Investments Purchased with Cash Collateral from Securities Lending - 0.5% |
Investment Companies - 0.5% | |
| | Janus Henderson Cash Collateral Fund LLC, 4.9971%ºº | | 118,831∆ | | - | | - | | 14,706,842 |
Total Affiliated Investments - 5.2% | $ | 2,679,191 | $ | 11,756 | $ | (3,146) | $ | 151,035,763 |
| | | | | | | | | | | |
| | Value at 6/30/22 | Purchases | Sales Proceeds | Value at 6/30/23 |
Investment Companies - 4.7% |
Money Markets - 4.7% | |
| | Janus Henderson Cash Liquidity Fund LLC, 5.1900%ºº | | 27,922,135 | | 1,301,560,670 | | (1,193,162,494) | | 136,328,921 |
Investments Purchased with Cash Collateral from Securities Lending - 0.5% |
Investment Companies - 0.5% | |
| | Janus Henderson Cash Collateral Fund LLC, 4.9971%ºº | | 14,134,115 | | 129,562,451 | | (128,989,724) | | 14,706,842 |
| | |
See Notes to Schedule of Investments and Other Information and Notes to Financial Statements. |
| |
Janus Investment Fund | 21 |
Janus Henderson Multi-Sector Income Fund
Schedule of Investments
June 30, 2023
| | | | | | | |
Schedule of Forward Foreign Currency Exchange Contracts | | | | | | |
| | | | | | | | | |
Counterparty/ Foreign Currency | Settlement Date | Foreign Currency Amount (Sold)/ Purchased | | USD Currency Amount (Sold)/ Purchased | | Market Value and Unrealized Appreciation/ (Depreciation) | |
Citibank, National Association: | | | | | | | | |
Canadian Dollar | 9/21/23 | (4,998,100) | $ | 3,793,074 | | 14,758 | | |
JPMorgan Chase Bank, National Association: | | | | | | | | |
Euro | 9/21/23 | (57,688,000) | | 63,109,380 | | (89,107) | | |
State Street Bank and Trust Company: | | | | | | | | |
Euro | 9/21/23 | (4,722,300) | | 5,197,017 | | 23,632 | | |
Total | | | | | $ | (50,717) | | |
Schedule of Futures
| | | | | | | | | | | | | | | |
Description | | Number of Contracts | | Expiration Date | | Notional Amount | | Value and Unrealized Appreciation/(Depreciation) | | |
Futures Long: | | | | | | | | | | |
10 Year US Treasury Note | | 3,492 | | 9/29/23 | $ | 392,031,563 | $ | (7,445,810) | |
5 Year US Treasury Note | | 1,894 | | 10/4/23 | | 202,835,563 | | (3,719,824) | |
Total - Futures Long | | | | | | | | (11,165,634) | |
Futures Short: | | | | | | | | | | |
2 Year US Treasury Note | | 1,138 | | 10/4/23 | | (231,405,188) | | 2,933,907 | |
Ultra 10-Year Treasury Note | | 99 | | 9/29/23 | | (11,725,313) | | (11,920) | |
Ultra Long Term US Treasury Bond | | 87 | | 9/29/23 | | (11,851,031) | | (96,163) | |
US Treasury Long Bond | | 60 | | 9/29/23 | | (7,614,375) | | 17,344 | |
Total - Futures Short | | | | | | | | 2,843,168 | |
Total | | | | | | | $ | (8,322,466) | | |
| | |
See Notes to Schedule of Investments and Other Information and Notes to Financial Statements. |
| |
22 | JUNE 30, 2023 |
Janus Henderson Multi-Sector Income Fund
Schedule of Investments
June 30, 2023
The following table, grouped by derivative type, provides information about the fair value and location of derivatives within the Statement of Assets and Liabilities as of June 30, 2023.
| | | | | | | | | | |
Fair Value of Derivative Instruments (not accounted for as hedging instruments) as of June 30, 2023 |
| | | | | | | | | |
| | | | | Currency
Contracts | | Interest Rate
Contracts | | Total |
Asset Derivatives: | | | | | | | |
Forward foreign currency exchange contracts | | | $ 38,390 | | $ - | | $ 38,390 |
*Futures contracts | | | - | | 2,951,251 | | $ 2,951,251 |
| | | | | | | | |
Total Asset Derivatives | | | $ 38,390 | | $ 2,951,251 | | $ 2,989,641 |
Liability Derivatives: | | | | | | | |
Forward foreign currency exchange contracts | | | $ 89,107 | | $ - | | $ 89,107 |
*Futures contracts | | | - | | 11,273,717 | | $11,273,717 |
| | | | | | | | |
Total Liability Derivatives | | | $ 89,107 | | $11,273,717 | | $11,362,824 |
*The fair value presented includes net cumulative unrealized appreciation (depreciation) on futures contracts and centrally cleared swaps. In the Statement of Assets and Liabilities, only current day's variation margin is reported in receivables or payables and the net cumulative unrealized appreciation (depreciation) is included in total distributable earnings (loss). |
The following tables provide information about the effect of derivatives and hedging activities on the Fund’s Statement of Operations for the year ended June 30, 2023.
| | | | | | | | | | | |
The effect of Derivative Instruments (not accounted for as hedging instruments) on the Statement of Operations for the year ended June 30, 2023 |
| | | | | | | | | | |
Amount of Realized Gain/(Loss) Recognized on Derivatives |
Derivative | | Credit
Contracts | | Currency
Contracts | | Interest Rate
Contracts | | Total |
Futures contracts | | $ - | | $ - | | $(47,514,830) | | $(47,514,830) |
Forward foreign currency exchange contracts | | - | | (764,206) | | - | | $ (764,206) |
Swap contracts | | (3,704,481) | | - | | - | | $ (3,704,481) |
| | | | | | | | | | | |
Total | | $ (3,704,481) | | $(764,206) | | $(47,514,830) | | $(51,983,517) |
| | | | | | | | | | | |
| | | | | | | | | | | |
Amount of Change in Unrealized Appreciation/Depreciation Recognized on Derivatives |
Derivative | | Credit
Contracts | | Currency
Contracts | | Interest Rate
Contracts | | Total |
Futures contracts | | $ - | | $ - | | $ (4,976,083) | | $ (4,976,083) |
Forward foreign currency exchange contracts | | - | | (311,909) | | - | | $ (311,909) |
Swap contracts | | (10,045,111) | | - | | - | | $(10,045,111) |
| | | | | | | | | | | |
Total | | $(10,045,111) | | $(311,909) | | $ (4,976,083) | | $(15,333,103) |
Please see the "Net Realized Gain/(Loss) on Investments" "Change in Unrealized Net Appreciation/Depreciation" sections of the Fund’s Statement of Operations.
| | |
See Notes to Schedule of Investments and Other Information and Notes to Financial Statements. |
| |
Janus Investment Fund | 23 |
Janus Henderson Multi-Sector Income Fund
Schedule of Investments
June 30, 2023
| | |
Average Ending Monthly Value of Derivative Instruments During the Year Ended June 30, 2023 |
| |
| |
Credit default swaps: | |
Average notional amount - buy protection | $ 124,379,115 |
Forward foreign currency exchange contracts: | |
Average amounts purchased - in USD | 9,775,126 |
Average amounts sold - in USD | 63,720,428 |
Futures contracts: | |
Average notional amount of contracts - long | 1,161,712,508 |
Average notional amount of contracts - short | 415,328,912 |
| | |
| |
| |
| |
| | |
See Notes to Schedule of Investments and Other Information and Notes to Financial Statements. |
| |
24 | JUNE 30, 2023 |
Janus Henderson Multi-Sector Income Fund
Schedule of Investments
June 30, 2023
| | | | | | | | | | |
Offsetting of Financial Assets and Derivative Assets |
| |
| | | Gross Amounts | | | | | | |
| | | of Recognized | | Offsetting Asset | | Collateral | | |
Counterparty | | Assets | | or Liability(a) | | Pledged(b) | | Net Amount |
| | | | | | | | | |
Citibank, National Association | $ | 14,758 | $ | — | $ | — | $ | 14,758 |
JPMorgan Chase Bank, National Association | | 17,556,969 | | — | | (17,556,969) | | — |
State Street Bank and Trust Company | | 23,632 | | — | | — | | 23,632 |
| | | | | | | | | |
Total | $ | 17,595,359 | $ | — | $ | (17,556,969) | $ | 38,390 |
Offsetting of Financial Liabilities and Derivative Liabilities |
| |
| | | Gross Amounts | | | | | | |
| | | of Recognized | | Offsetting Asset | | Collateral | | |
Counterparty | | Liabilities | | or Liability(a) | | Pledged(b) | | Net Amount |
| | | | | | | | | |
JPMorgan Chase Bank, National Association | $ | 89,107 | $ | — | $ | — | $ | 89,107 |
| | | | | | | | | |
(a) | Represents the amount of assets or liabilities that could be offset with the same counterparty under master netting or similar agreements that management elects not to offset on the Statement of Assets and Liabilities. |
(b) | Collateral pledged is limited to the net outstanding amount due to/from an individual counterparty. The actual collateral amounts pledged may exceed these amounts and may fluctuate in value. |
| | |
See Notes to Schedule of Investments and Other Information and Notes to Financial Statements. |
| |
Janus Investment Fund | 25 |
Janus Henderson Multi-Sector Income Fund
Notes to Schedule of Investments and Other Information
| | |
Bloomberg U.S. Aggregate Bond Index | Bloomberg U.S. Aggregate Bond Index is a broad-based measure of the investment grade, US dollar-denominated, fixed-rate taxable bond market. |
| | |
EURIBOR | Euro Interbank Offered Rate |
ICE | Intercontinental Exchange |
LIBOR | London Interbank Offered Rate |
LLC | Limited Liability Company |
LP | Limited Partnership |
PIK | Pay-in-kind (PIK) bonds give the issuer an option to make the interest payment in cash or additional securities. |
PLC | Public Limited Company |
SOFR | Secured Overnight Financing Rate |
TBA | (To Be Announced) Securities are purchased/sold on a forward commitment basis with an approximate principal amount and no defined maturity date. The actual principal and maturity date will be determined upon settlement when specific mortgage pools are assigned. |
| | |
144A | Securities sold under Rule 144A of the Securities Act of 1933, as amended, are subject to legal and/or contractual restrictions on resale and may not be publicly sold without registration under the 1933 Act. Unless otherwise noted, these securities have been determined to be liquid under guidelines established by the Board of Trustees. The total value of 144A securities as of the year ended June 30, 2023 is $2,145,338,221, which represents 74.1% of net assets. |
| | |
* | Non-income producing security. |
| | |
ƒ | All or a portion of this position is not funded, or has been purchased on a delayed delivery or when-issued basis. If applicable, interest rates will be determined and interest will begin to accrue at a future date. See Notes to Financial Statements. |
| | |
‡ | Variable or floating rate security. Rate shown is the current rate as of June 30, 2023. Certain variable rate securities are not based on a published reference rate and spread; they are determined by the issuer or agent and current market conditions. Reference rate is as of reset date and may vary by security, which may not indicate a reference rate and/or spread in their description. |
| | |
ºº | Rate shown is the 7-day yield as of June 30, 2023. |
| | |
# | Loaned security; a portion of the security is on loan at June 30, 2023. |
| | |
µ | Perpetual security. Perpetual securities have no stated maturity date, but they may be called/redeemed by the issuer. The date indicated, if any, represents the next call date. |
| | |
Ç | Step bond. The coupon rate will increase or decrease periodically based upon a predetermined schedule. The rate shown reflects the current rate. |
| | |
¤ | Interest only security. An interest only security represents the interest only portion of a pool of underlying mortgages or mortgage-backed securities which are separated and sold individually from the principal portion of the securities. Principal amount shown represents the par value on which interest payments are based. |
| | |
Ø | Payment-in-kind security which may pay interest/dividends in additional par/shares and/or in cash. Rates shown are the current rate and possible payment rates. |
| | |
¢ | Security is valued using significant unobservable inputs. The total value of Level 3 securities as of the year ended June 30, 2023 is $881,861, which represents 0.0% of net assets. |
| | |
£ | The Fund may invest in certain securities that are considered affiliated companies. As defined by the Investment Company Act of 1940, as amended, an affiliated company is one in which the Fund owns 5% or more of the outstanding voting securities, or a company which is |
Janus Henderson Multi-Sector Income Fund
Notes to Schedule of Investments and Other Information
| | |
| | under common ownership or control. |
| | |
∆ | Net of income paid to the securities lending agent and rebates paid to the borrowing counterparties. |
| | | | | | | | | | | | | | |
The following is a summary of the inputs that were used to value the Fund’s investments in securities and other financial instruments as of June 30, 2023. See Notes to Financial Statements for more information. |
| |
Valuation Inputs Summary |
| | | | | | | |
| | | | | Level 2 - | | Level 3 - |
| | | Level 1 - | | Other Significant | | Significant |
| | | Quoted Prices | | Observable Inputs | | Unobservable Inputs |
| | | | | | | |
Assets | | | | | | |
Investments In Securities: | | | | | | |
Asset-Backed/Commercial Mortgage-Backed Securities | $ | - | $ | 1,699,490,716 | $ | 869,463 |
Bank Loans and Mezzanine Loans | | - | | 183,141,038 | | 1,613 |
Corporate Bonds | | - | | 783,289,483 | | - |
Mortgage-Backed Securities | | - | | 725,031,319 | | - |
Common Stocks | | 2,662,726 | | - | | - |
Preferred Stocks | | - | | 1,093,363 | | 10,785 |
Investment Companies | | - | | 136,328,921 | | - |
Investments Purchased with Cash Collateral from Securities Lending | | - | | 18,383,552 | | - |
Total Investments in Securities | $ | 2,662,726 | $ | 3,546,758,392 | $ | 881,861 |
Other Financial Instruments(a): | | | | | | |
Forward Foreign Currency Exchange Contracts | | - | | 38,390 | | - |
Futures Contracts | | 2,951,251 | | - | | - |
Total Assets | $ | 5,613,977 | $ | 3,546,796,782 | $ | 881,861 |
Liabilities | | | | | | |
Other Financial Instruments(a): | | | | | | |
Forward Foreign Currency Exchange Contracts | $ | - | $ | 89,107 | $ | - |
Futures Contracts | | 11,273,717 | | - | | - |
Total Liabilities | $ | 11,273,717 | $ | 89,107 | $ | - |
| | | | | | | |
(a) | Other financial instruments may include forward foreign currency exchange contracts, futures, written options, written swaptions, and swap contracts. Forward foreign currency exchange contracts, futures contracts, and swap contracts are reported at their unrealized appreciation/(depreciation) at measurement date, which represents the change in the contract's value from trade date. Written options and written swaptions are reported at their market value at measurement date. |
Janus Henderson Multi-Sector Income Fund
Statement of Assets and Liabilities
June 30, 2023
| |
See footnotes at the end of the Statement. |
| | | | | | | |
| | | | | | |
Assets: | | | | |
| Unaffiliated investments, at value (cost $3,599,466,185)(1) | | $ | 3,399,267,216 | |
| Affiliated investments, at value (cost $151,036,117) | | | 151,035,763 | |
| Deposits with brokers for futures | | | 13,376,296 | |
| Forward foreign currency exchange contracts | | | 38,390 | |
| Closed foreign currency contracts | | | 8,568,747 | |
| Variation margin receivable on futures contracts | | | 612,896 | |
| Trustees' deferred compensation | | | 73,278 | |
| Receivables: | | | | |
| | Interest | | | 24,531,199 | |
| | Investments sold | | | 6,573,865 | |
| | Fund shares sold | | | 4,284,882 | |
| | Dividends from affiliates | | | 487,924 | |
| Other assets | | | 31,980 | |
Total Assets | | | 3,608,882,436 | |
Liabilities: | | | | |
| Due to custodian | | | 4,779,528 | |
| Foreign cash due to custodian | | | 4,303,333 | |
| Collateral for securities loaned (Note 3) | | | 18,383,552 | |
| Forward foreign currency exchange contracts | | | 89,107 | |
| Variation margin payable on futures contracts | | | 164,990 | |
| Payables: | | | — | |
| | TBA investments purchased | | | 637,179,547 | |
| | Investments purchased | | | 36,787,991 | |
| | Fund shares repurchased | | | 8,181,366 | |
| | Advisory fees | | | 1,392,646 | |
| | Dividends | | | 456,388 | |
| | Transfer agent fees and expenses | | | 385,571 | |
| | Professional fees | | | 86,209 | |
| | Trustees' deferred compensation fees | | | 73,278 | |
| | 12b-1 Distribution and shareholder servicing fees | | | 56,524 | |
| | Trustees' fees and expenses | | | 16,966 | |
| | Affiliated fund administration fees payable | | | 6,251 | |
| | Custodian fees | | | 4,492 | |
| | Accrued expenses and other payables | | | 383,693 | |
Total Liabilities | | | 712,731,432 | |
Net Assets | | $ | 2,896,151,004 | |
| | |
See Notes to Financial Statements. |
| |
28 | JUNE 30, 2023 |
Janus Henderson Multi-Sector Income Fund
Statement of Assets and Liabilities
June 30, 2023
| | | | | | | |
| | | | | | |
| | | | | | | |
Net Assets Consist of: | | | | |
| Capital (par value and paid-in surplus) | | $ | 3,425,174,499 | |
| Total distributable earnings (loss) | | | (529,023,495) | |
Total Net Assets | | $ | 2,896,151,004 | |
Net Assets - Class A Shares | | $ | 34,132,466 | |
| Shares Outstanding, $0.01 Par Value (unlimited shares authorized) | | | 4,046,486 | |
Net Asset Value Per Share(2) | | $ | 8.44 | |
Maximum Offering Price Per Share(3) | | $ | 8.86 | |
Net Assets - Class C Shares | | $ | 55,343,208 | |
| Shares Outstanding, $0.01 Par Value (unlimited shares authorized) | | | 6,558,986 | |
Net Asset Value Per Share(2) | | $ | 8.44 | |
Net Assets - Class D Shares | | $ | 85,805,993 | |
| Shares Outstanding, $0.01 Par Value (unlimited shares authorized) | | | 10,168,985 | |
Net Asset Value Per Share | | $ | 8.44 | |
Net Assets - Class I Shares | | $ | 2,550,145,030 | |
| Shares Outstanding, $0.01 Par Value (unlimited shares authorized) | | | 302,299,629 | |
Net Asset Value Per Share | | $ | 8.44 | |
Net Assets - Class N Shares | | $ | 73,778,820 | |
| Shares Outstanding, $0.01 Par Value (unlimited shares authorized) | | | 8,743,634 | |
Net Asset Value Per Share | | $ | 8.44 | |
Net Assets - Class S Shares | | $ | 2,029,590 | |
| Shares Outstanding, $0.01 Par Value (unlimited shares authorized) | | | 240,682 | |
Net Asset Value Per Share | | $ | 8.43 | |
Net Assets - Class T Shares | | $ | 94,915,897 | |
| Shares Outstanding, $0.01 Par Value (unlimited shares authorized) | | | 11,254,266 | |
Net Asset Value Per Share | | $ | 8.43 | |
| |
(1) Includes $17,556,969 of securities on loan. See Note 3 in Notes to Financial Statements. (2) Redemption price per share may be reduced for any applicable contingent deferred sales charge. (3) Maximum offering price is computed at 100/95.25 of net asset value. |
| | |
See Notes to Financial Statements. |
| |
Janus Investment Fund | 29 |
Janus Henderson Multi-Sector Income Fund
Statement of Operations
For the year ended June 30, 2023
| | | | | | |
| | | | | |
Investment Income: | | | |
| Interest | $ | 181,045,610 | |
| Dividends from affiliates | | 2,560,360 | |
| Dividends | | 1,872,271 | |
| Affiliated securities lending income, net | | 118,831 | |
| Unaffiliated securities lending income, net | | 36,365 | |
| Other income | | 927,769 | |
Total Investment Income | | 186,561,206 | |
Expenses: | | | |
| Advisory fees | | 15,700,507 | |
| 12b-1 Distribution and shareholder servicing fees: | | | |
| | Class A Shares | | 105,678 | |
| | Class C Shares | | 546,010 | |
| | Class S Shares | | 3,527 | |
| Transfer agent administrative fees and expenses: | | | |
| | Class D Shares | | 102,824 | |
| | Class S Shares | | 3,527 | |
| | Class T Shares | | 305,871 | |
| Transfer agent networking and omnibus fees: | | | |
| | Class A Shares | | 23,623 | |
| | Class C Shares | | 45,044 | |
| | Class I Shares | | 2,420,455 | |
| Other transfer agent fees and expenses: | | | |
| | Class A Shares | | 2,891 | |
| | Class C Shares | | 2,715 | |
| | Class D Shares | | 13,026 | |
| | Class I Shares | | 127,308 | |
| | Class N Shares | | 3,378 | |
| | Class S Shares | | 48 | |
| | Class T Shares | | 1,550 | |
| Shareholder reports expense | | 235,819 | |
| Professional fees | | 201,841 | |
| Custodian fees | | 166,321 | |
| Registration fees | | 130,563 | |
| Affiliated fund administration fees | | 90,477 | |
| Trustees’ fees and expenses | | 78,092 | |
| Other expenses | | 559,951 | |
Total Expenses | | 20,871,046 | |
Less: Excess Expense Reimbursement and Waivers | | (12,103) | |
Net Expenses | | 20,858,943 | |
Net Investment Income/(Loss) | | 165,702,263 | |
| | | | | |
| | |
See Notes to Financial Statements. |
| |
30 | JUNE 30, 2023 |
Janus Henderson Multi-Sector Income Fund
Statement of Operations
For the year ended June 30, 2023
| | | | | | |
| | | | | |
Net Realized Gain/(Loss) on Investments: | | | |
| Investments and foreign currency transactions | $ | (182,714,656) | |
| Investments in affiliates | | 11,756 | |
| Forward foreign currency exchange contracts | | (764,206) | |
| Futures contracts | | (47,514,830) | |
| Swap contracts | | (3,704,481) | |
Total Net Realized Gain/(Loss) on Investments | | (234,686,417) | |
Change in Unrealized Net Appreciation/Depreciation: | | | |
| Investments, foreign currency translations and Trustees’ deferred compensation | | 153,985,327 | |
| Investments in affiliates | | (3,146) | |
| Forward foreign currency exchange contracts | | (311,909) | |
| Futures contracts | | (4,976,083) | |
| Swap contracts | | (10,045,111) | |
Total Change in Unrealized Net Appreciation/Depreciation | | 138,649,078 | |
Net Increase/(Decrease) in Net Assets Resulting from Operations | $ | 69,664,924 | |
| | | | | |
| | |
See Notes to Financial Statements. |
| |
Janus Investment Fund | 31 |
Janus Henderson Multi-Sector Income Fund
Statements of Changes in Net Assets
| | | | | | | | | |
| | | | | | | | |
| | | Year ended
June 30, 2023 | | Year ended
June 30, 2022 | |
| | | | | | | | | |
Operations: | | | | | | |
| Net investment income/(loss) | $ | 165,702,263 | | $ | 121,994,343 | |
| Net realized gain/(loss) on investments | | (234,686,417) | | | (93,415,323) | |
| Change in unrealized net appreciation/depreciation | | 138,649,078 | | | (375,719,935) | |
Net Increase/(Decrease) in Net Assets Resulting from Operations | | 69,664,924 | | | (347,140,915) | |
Dividends and Distributions to Shareholders: | | | | | | |
| | Class A Shares | | (2,385,795) | | | (2,535,097) | |
| | Class C Shares | �� | (2,901,630) | | | (2,360,641) | |
| | Class D Shares | | (5,127,265) | | | (4,349,450) | |
| | Class I Shares | | (144,264,596) | | | (117,851,696) | |
| | Class N Shares | | (4,351,757) | | | (4,378,152) | |
| | Class S Shares | | (78,993) | | | (33,689) | |
| | Class T Shares | | (6,949,103) | | | (8,153,049) | |
| Total Dividends and Distributions to Shareholders | | (166,059,139) | | | (139,661,774) | |
| Return of Capital on Dividends and Distributions | | | | | | |
| | Class A Shares | | (38,203) | | | (31,545) | |
| | Class C Shares | | (46,463) | | | (35,270) | |
| | Class D Shares | | (82,101) | | | (50,890) | |
| | Class I Shares | | (2,310,054) | | | (1,333,778) | |
| | Class N Shares | | (69,683) | | | (52,643) | |
| | Class S Shares | | (1,265) | | | (379) | |
| | Class T Shares | | (111,273) | | | (100,119) | |
| Total Return of Capital Dividends and Distributions | | (2,659,042) | | | (1,604,624) | |
Net Decrease from Dividends and Distributions to Shareholders | | (168,718,181) | | | (141,266,398) | |
Capital Share Transactions: | | | | | | |
| | Class A Shares | | (13,711,287) | | | (8,643,788) | |
| | Class C Shares | | (5,080,081) | | | 2,009,650 | |
| | Class D Shares | | (2,303,288) | | | (2,175,198) | |
| | Class I Shares | | 111,338,742 | | | 366,961,875 | |
| | Class N Shares | | 7,846,063 | | | (41,998,008) | |
| | Class S Shares | | 867,431 | | | 605,584 | |
| | Class T Shares | | (58,394,849) | | | (43,085,492) | |
Net Increase/(Decrease) from Capital Share Transactions | | 40,562,731 | | | 273,674,623 | |
Net Increase/(Decrease) in Net Assets | | (58,490,526) | | | (214,732,690) | |
Net Assets: | | | | | | |
| Beginning of period | | 2,954,641,530 | | | 3,169,374,220 | |
| End of period | $ | 2,896,151,004 | | $ | 2,954,641,530 | |
| | | | | | | | |
| | |
See Notes to Financial Statements. |
| |
32 | JUNE 30, 2023 |
Janus Henderson Multi-Sector Income Fund
Financial Highlights
| | | | | | | | | | | | | | | | | | | |
Class A Shares | | | | | | | | | | | | | | | |
For a share outstanding during the year ended June 30 | | 2023 | | | 2022 | | | 2021 | | | 2020 | | | 2019 | |
| Net Asset Value, Beginning of Period | | $8.73 | | | $10.12 | | | $9.47 | | | $9.89 | | | $9.66 | |
| Income/(Loss) from Investment Operations: | | | | | | | | | | | | | | | |
| | Net investment income/(loss)(1) | | 0.48 | | | 0.33 | | | 0.39 | | | 0.40 | | | 0.42 | |
| | Net realized and unrealized gain/(loss) | | (0.27) | | | (1.33) | | | 0.67 | | | (0.34) | | | 0.25 | |
| Total from Investment Operations | | 0.21 | | | (1.00) | | | 1.06 | | | 0.06 | | | 0.67 | |
| Less Dividends and Distributions: | | | | | | | | | | | | | | | |
| | Dividends (from net investment income) | | (0.49) | | | (0.36) | | | (0.41) | | | (0.40) | | | (0.44) | |
| | Distributions (from capital gains) | | — | | | (0.03) | | | — | | | (0.05) | | | — | |
| | Return of capital | | (0.01) | | | —(2) | | | — | | | (0.03) | | | — | |
| Total Dividends and Distributions | | (0.50) | | | (0.39) | | | (0.41) | | | (0.48) | | | (0.44) | |
| Net Asset Value, End of Period | | $8.44 | | | $8.73 | | | $10.12 | | | $9.47 | | | $9.89 | |
| Total Return* | | 2.50% | | | (10.18)% | | | 11.38%(3) | | | 0.61% | | | 7.11% | |
| Net Assets, End of Period (in thousands) | | $34,132 | | | $49,566 | | | $67,032 | | | $49,168 | | | $20,276 | |
| Average Net Assets for the Period (in thousands) | | $42,121 | | | $63,735 | | | $57,669 | | | $40,103 | | | $14,907 | |
| Ratios to Average Net Assets**: | | | | | | | | | | | | | | | |
| | Ratio of Gross Expenses | | 0.93% | | | 0.90% | | | 0.91% | | | 0.92% | | | 1.05% | |
| | Ratio of Net Expenses (After Waivers and Expense Offsets) | | 0.93% | | | 0.90% | | | 0.91% | | | 0.92% | | | 1.00% | |
| | Ratio of Net Investment Income/(Loss) | | 5.64% | | | 3.43% | | | 3.91% | | | 4.19% | | | 4.35% | |
| Portfolio Turnover Rate(4) | | 62% | | | 75% | | | 119% | | | 188% | | | 142% | |
| | | | | | | | | | | | | | | | | | | |
| |
* Total return includes adjustments in accordance with generally accepted accounting principles required at the year or period end and are not annualized for periods of less than one full year. ** Annualized for periods of less than one full year. (1) Per share amounts are calculated based on average shares outstanding during the year or period. (2) Less than $0.005 on a per share basis. (3) 0.01% of the Fund’s total return consists of a voluntary reimbursement by the Adviser for realized investment losses and another 0.04% consists of a gain on an investment not meeting the investment guidelines of the Fund. Excluding these items, total return would have been 11.33%. (4) Portfolio Turnover Rate excludes TBA (to be announced) purchase and sales commitments. |
| | |
See Notes to Financial Statements. |
| |
Janus Investment Fund | 33 |
Janus Henderson Multi-Sector Income Fund
Financial Highlights
| | | | | | | | | | | | | | | | | | | |
Class C Shares | | | | | | | | | | | | | | | |
For a share outstanding during the year ended June 30 | | 2023 | | | 2022 | | | 2021 | | | 2020 | | | 2019 | |
| Net Asset Value, Beginning of Period | | $8.74 | | | $10.12 | | | $9.47 | | | $9.89 | | | $9.67 | |
| Income/(Loss) from Investment Operations: | | | | | | | | | | | | | | | |
| | Net investment income/(loss)(1) | | 0.43 | | | 0.26 | | | 0.32 | | | 0.33 | | | 0.35 | |
| | Net realized and unrealized gain/(loss) | | (0.29) | | | (1.33) | | | 0.67 | | | (0.35) | | | 0.23 | |
| Total from Investment Operations | | 0.14 | | | (1.07) | | | 0.99 | | | (0.02) | | | 0.58 | |
| Less Dividends and Distributions: | | | | | | | | | | | | | | | |
| | Dividends (from net investment income) | | (0.43) | | | (0.28) | | | (0.34) | | | (0.33) | | | (0.36) | |
| | Distributions (from capital gains) | | — | | | (0.03) | | | — | | | (0.05) | | | — | |
| | Return of capital | | (0.01) | | | —(2) | | | — | | | (0.02) | | | — | |
| Total Dividends and Distributions | | (0.44) | | | (0.31) | | | (0.34) | | | (0.40) | | | (0.36) | |
| Net Asset Value, End of Period | | $8.44 | | | $8.74 | | | $10.12 | | | $9.47 | | | $9.89 | |
| Total Return* | | 1.65% | | | (10.75)% | | | 10.58%(3) | | | (0.18)% | | | 6.20% | |
| Net Assets, End of Period (in thousands) | | $55,343 | | | $62,504 | | | $71,133 | | | $63,574 | | | $30,350 | |
| Average Net Assets for the Period (in thousands) | | $57,811 | | | $73,171 | | | $67,010 | | | $50,662 | | | $20,980 | |
| Ratios to Average Net Assets**: | | | | | | | | | | | | | | | |
| | Ratio of Gross Expenses | | 1.64% | | | 1.66% | | | 1.64% | | | 1.71% | | | 1.79% | |
| | Ratio of Net Expenses (After Waivers and Expense Offsets) | | 1.64% | | | 1.66% | | | 1.64% | | | 1.71% | | | 1.76% | |
| | Ratio of Net Investment Income/(Loss) | | 4.99% | | | 2.70% | | | 3.19% | | | 3.43% | | | 3.60% | |
| Portfolio Turnover Rate(4) | | 62% | | | 75% | | | 119% | | | 188% | | | 142% | |
| | | | | | | | | | | | | | | | | | | |
| |
* Total return includes adjustments in accordance with generally accepted accounting principles required at the year or period end and are not annualized for periods of less than one full year. ** Annualized for periods of less than one full year. (1) Per share amounts are calculated based on average shares outstanding during the year or period. (2) Less than $0.005 on a per share basis. (3) 0.01% of the Fund’s total return consists of a voluntary reimbursement by the Adviser for realized investment losses and another 0.04% consists of a gain on an investment not meeting the investment guidelines of the Fund. Excluding these items, total return would have been 10.53%. (4) Portfolio Turnover Rate excludes TBA (to be announced) purchase and sales commitments. |
| | |
See Notes to Financial Statements. |
| |
34 | JUNE 30, 2023 |
Janus Henderson Multi-Sector Income Fund
Financial Highlights
| | | | | | | | | | | | | | | | | | | |
Class D Shares | | | | | | | | | | | | | | | |
For a share outstanding during the year ended June 30 | | 2023 | | | 2022 | | | 2021 | | | 2020 | | | 2019 | |
| Net Asset Value, Beginning of Period | | $8.74 | | | $10.12 | | | $9.47 | | | $9.89 | | | $9.67 | |
| Income/(Loss) from Investment Operations: | | | | | | | | | | | | | | | |
| | Net investment income/(loss)(1) | | 0.50 | | | 0.35 | | | 0.40 | | | 0.42 | | | 0.44 | |
| | Net realized and unrealized gain/(loss) | | (0.29) | | | (1.33) | | | 0.68 | | | (0.35) | | | 0.23 | |
| Total from Investment Operations | | 0.21 | | | (0.98) | | | 1.08 | | | 0.07 | | | 0.67 | |
| Less Dividends and Distributions: | | | | | | | | | | | | | | | |
| | Dividends (from net investment income) | | (0.50) | | | (0.37) | | | (0.43) | | | (0.41) | | | (0.45) | |
| | Distributions (from capital gains) | | — | | | (0.03) | | | — | | | (0.05) | | | — | |
| | Return of capital | | (0.01) | | | —(2) | | | — | | | (0.03) | | | — | |
| Total Dividends and Distributions | | (0.51) | | | (0.40) | | | (0.43) | | | (0.49) | | | (0.45) | |
| Net Asset Value, End of Period | | $8.44 | | | $8.74 | | | $10.12 | | | $9.47 | | | $9.89 | |
| Total Return* | | 2.55% | | | (9.93)% | | | 11.57%(3) | | | 0.77% | | | 7.18% | |
| Net Assets, End of Period (in thousands) | | $85,806 | | | $91,299 | | | $108,418 | | | $78,091 | | | $57,522 | |
| Average Net Assets for the Period (in thousands) | | $86,965 | | | $104,991 | | | $91,918 | | | $79,433 | | | $42,770 | |
| Ratios to Average Net Assets**: | | | | | | | | | | | | | | | |
| | Ratio of Gross Expenses | | 0.76% | | | 0.73% | | | 0.74% | | | 0.76% | | | 0.88% | |
| | Ratio of Net Expenses (After Waivers and Expense Offsets) | | 0.76% | | | 0.73% | | | 0.74% | | | 0.76% | | | 0.84% | |
| | Ratio of Net Investment Income/(Loss) | | 5.88% | | | 3.61% | | | 4.07% | | | 4.30% | | | 4.54% | |
| Portfolio Turnover Rate(4) | | 62% | | | 75% | | | 119% | | | 188% | | | 142% | |
| | | | | | | | | | | | | | | | | | | |
| |
* Total return includes adjustments in accordance with generally accepted accounting principles required at the year or period end and are not annualized for periods of less than one full year. ** Annualized for periods of less than one full year. (1) Per share amounts are calculated based on average shares outstanding during the year or period. (2) Less than $0.005 on a per share basis. (3) 0.01% of the Fund’s total return consists of a voluntary reimbursement by the Adviser for realized investment losses and another 0.04% consists of a gain on an investment not meeting the investment guidelines of the Fund. Excluding these items, total return would have been 11.52%. (4) Portfolio Turnover Rate excludes TBA (to be announced) purchase and sales commitments. |
| | |
See Notes to Financial Statements. |
| |
Janus Investment Fund | 35 |
Janus Henderson Multi-Sector Income Fund
Financial Highlights
| | | | | | | | | | | | | | | | | | | |
Class I Shares | | | | | | | | | | | | | | | |
For a share outstanding during the year ended June 30 | | 2023 | | | 2022 | | | 2021 | | | 2020 | | | 2019 | |
| Net Asset Value, Beginning of Period | | $8.73 | | | $10.12 | | | $9.47 | | | $9.88 | | | $9.66 | |
| Income/(Loss) from Investment Operations: | | | | | | | | | | | | | | | |
| | Net investment income/(loss)(1) | | 0.51 | | | 0.36 | | | 0.41 | | | 0.43 | | | 0.44 | |
| | Net realized and unrealized gain/(loss) | | (0.29) | | | (1.34) | | | 0.67 | | | (0.34) | | | 0.24 | |
| Total from Investment Operations | | 0.22 | | | (0.98) | | | 1.08 | | | 0.09 | | | 0.68 | |
| Less Dividends and Distributions: | | | | | | | | | | | | | | | |
| | Dividends (from net investment income) | | (0.50) | | | (0.38) | | | (0.43) | | | (0.42) | | | (0.46) | |
| | Distributions (from capital gains) | | — | | | (0.03) | | | — | | | (0.05) | | | — | |
| | Return of capital | | (0.01) | | | —(2) | | | — | | | (0.03) | | | — | |
| Total Dividends and Distributions | | (0.51) | | | (0.41) | | | (0.43) | | | (0.50) | | | (0.46) | |
| Net Asset Value, End of Period | | $8.44 | | | $8.73 | | | $10.12 | | | $9.47 | | | $9.88 | |
| Total Return* | | 2.72% | | | (9.99)% | | | 11.63%(3) | | | 0.93% | | | 7.25% | |
| Net Assets, End of Period (in thousands) | | $2,550,145 | | | $2,522,907 | | | $2,570,289 | | | $1,805,985 | | | $909,014 | |
| Average Net Assets for the Period (in thousands) | | $2,420,274 | | | $2,803,141 | | | $2,061,334 | | | $1,542,112 | | | $476,391 | |
| Ratios to Average Net Assets**: | | | | | | | | | | | | | | | |
| | Ratio of Gross Expenses | | 0.72% | | | 0.69% | | | 0.69% | | | 0.70% | | | 0.80% | |
| | Ratio of Net Expenses (After Waivers and Expense Offsets) | | 0.72% | | | 0.69% | | | 0.69% | | | 0.70% | | | 0.78% | |
| | Ratio of Net Investment Income/(Loss) | | 5.95% | | | 3.68% | | | 4.13% | | | 4.42% | | | 4.59% | |
| Portfolio Turnover Rate(4) | | 62% | | | 75% | | | 119% | | | 188% | | | 142% | |
| | | | | | | | | | | | | | | | | | | |
| |
* Total return includes adjustments in accordance with generally accepted accounting principles required at the year or period end and are not annualized for periods of less than one full year. ** Annualized for periods of less than one full year. (1) Per share amounts are calculated based on average shares outstanding during the year or period. (2) Less than $0.005 on a per share basis. (3) 0.01% of the Fund’s total return consists of a voluntary reimbursement by the Adviser for realized investment losses and another 0.04% consists of a gain on an investment not meeting the investment guidelines of the Fund. Excluding these items, total return would have been 11.58%. (4) Portfolio Turnover Rate excludes TBA (to be announced) purchase and sales commitments. |
| | |
See Notes to Financial Statements. |
| |
36 | JUNE 30, 2023 |
Janus Henderson Multi-Sector Income Fund
Financial Highlights
| | | | | | | | | | | | | | | | | | | |
Class N Shares | | | | | | | | | | | | | | | |
For a share outstanding during the year ended June 30 | | 2023 | | | 2022 | | | 2021 | | | 2020 | | | 2019 | |
| Net Asset Value, Beginning of Period | | $8.74 | | | $10.12 | �� | | $9.47 | | | $9.89 | | | $9.67 | |
| Income/(Loss) from Investment Operations: | | | | | | | | | | | | | | | |
| | Net investment income/(loss)(1) | | 0.51 | | | 0.37 | | | 0.42 | | | 0.44 | | | 0.45 | |
| | Net realized and unrealized gain/(loss) | | (0.29) | | | (1.33) | | | 0.67 | | | (0.36) | | | 0.24 | |
| Total from Investment Operations | | 0.22 | | | (0.96) | | | 1.09 | | | 0.08 | | | 0.69 | |
| Less Dividends and Distributions: | | | | | | | | | | | | | | | |
| | Dividends (from net investment income) | | (0.51) | | | (0.39) | | | (0.44) | | | (0.42) | | | (0.47) | |
| | Distributions (from capital gains) | | — | | | (0.03) | | | — | | | (0.05) | | | — | |
| | Return of capital | | (0.01) | | | —(2) | | | — | | | (0.03) | | | — | |
| Total Dividends and Distributions | | (0.52) | | | (0.42) | | | (0.44) | | | (0.50) | | | (0.47) | |
| Net Asset Value, End of Period | | $8.44 | | | $8.74 | | | $10.12 | | | $9.47 | | | $9.89 | |
| Total Return* | | 2.70% | | | (9.80)% | | | 11.73%(3) | | | 0.90% | | | 7.32% | |
| Net Assets, End of Period (in thousands) | | $73,779 | | | $68,120 | | | $121,983 | | | $88,092 | | | $6,763 | |
| Average Net Assets for the Period (in thousands) | | $71,508 | | | $101,875 | | | $104,964 | | | $20,729 | | | $3,933 | |
| Ratios to Average Net Assets**: | | | | | | | | | | | | | | | |
| | Ratio of Gross Expenses | | 0.62% | | | 0.59% | | | 0.60% | | | 0.63% | | | 0.80% | |
| | Ratio of Net Expenses (After Waivers and Expense Offsets) | | 0.62% | | | 0.59% | | | 0.60% | | | 0.63% | | | 0.71% | |
| | Ratio of Net Investment Income/(Loss) | | 6.06% | | | 3.73% | | | 4.21% | | | 4.68% | | | 4.67% | |
| Portfolio Turnover Rate(4) | | 62% | | | 75% | | | 119% | | | 188% | | | 142% | |
| | | | | | | | | | | | | | | | | | | |
| |
* Total return includes adjustments in accordance with generally accepted accounting principles required at the year or period end and are not annualized for periods of less than one full year. ** Annualized for periods of less than one full year. (1) Per share amounts are calculated based on average shares outstanding during the year or period. (2) Less than $0.005 on a per share basis. (3) 0.01% of the Fund’s total return consists of a voluntary reimbursement by the Adviser for realized investment losses and another 0.04% consists of a gain on an investment not meeting the investment guidelines of the Fund. Excluding these items, total return would have been 11.68%. (4) Portfolio Turnover Rate excludes TBA (to be announced) purchase and sales commitments. |
| | |
See Notes to Financial Statements. |
| |
Janus Investment Fund | 37 |
Janus Henderson Multi-Sector Income Fund
Financial Highlights
| | | | | | | | | | | | | | | | | | | |
Class S Shares | | | | | | | | | | | | | | | |
For a share outstanding during the year ended June 30 | | 2023 | | | 2022 | | | 2021 | | | 2020 | | | 2019 | |
| Net Asset Value, Beginning of Period | | $8.73 | | | $10.11 | | | $9.46 | | | $9.91 | | | $9.67 | |
| Income/(Loss) from Investment Operations: | | | | | | | | | | | | | | | |
| | Net investment income/(loss)(1) | | 0.48 | | | 0.32 | | | 0.39 | | | 0.39 | | | 0.43 | |
| | Net realized and unrealized gain/(loss) | | (0.30) | | | (1.34) | | | 0.67 | | | (0.37) | | | 0.27 | |
| Total from Investment Operations | | 0.18 | | | (1.02) | | | 1.06 | | | 0.02 | | | 0.70 | |
| Less Dividends and Distributions: | | | | | | | | | | | | | | | |
| | Dividends (from net investment income) | | (0.47) | | | (0.33) | | | (0.41) | | | (0.39) | | | (0.46) | |
| | Distributions (from capital gains) | | — | | | (0.03) | | | — | | | (0.05) | | | — | |
| | Return of capital | | (0.01) | | | —(2) | | | — | | | (0.03) | | | — | |
| Total Dividends and Distributions | | (0.48) | | | (0.36) | | | (0.41) | | | (0.47) | | | (0.46) | |
| Net Asset Value, End of Period | | $8.43 | | | $8.73 | | | $10.11 | | | $9.46 | | | $9.91 | |
| Total Return* | | 2.16% | | | (10.30)% | | | 11.32%(3) | | | 0.19% | | | 7.51% | |
| Net Assets, End of Period (in thousands) | | $2,030 | | | $1,202 | | | $745 | | | $987 | | | $652 | |
| Average Net Assets for the Period (in thousands) | | $1,396 | | | $890 | | | $898 | | | $775 | | | $908 | |
| Ratios to Average Net Assets**: | | | | | | | | | | | | | | | |
| | Ratio of Gross Expenses | | 1.34% | | | 1.45% | | | 1.33% | | | 1.43% | | | 1.36% | |
| | Ratio of Net Expenses (After Waivers and Expense Offsets) | | 1.15% | | | 1.15% | | | 0.98% | | | 1.03% | | | 0.89% | |
| | Ratio of Net Investment Income/(Loss) | | 5.66% | | | 3.33% | | | 3.88% | | | 4.05% | | | 4.47% | |
| Portfolio Turnover Rate(4) | | 62% | | | 75% | | | 119% | | | 188% | | | 142% | |
| | | | | | | | | | | | | | | | | | | |
| |
* Total return includes adjustments in accordance with generally accepted accounting principles required at the year or period end and are not annualized for periods of less than one full year. ** Annualized for periods of less than one full year. (1) Per share amounts are calculated based on average shares outstanding during the year or period. (2) Less than $0.005 on a per share basis. (3) 0.01% of the Fund’s total return consists of a voluntary reimbursement by the Adviser for realized investment losses and another 0.04% consists of a gain on an investment not meeting the investment guidelines of the Fund. Excluding these items, total return would have been 11.27%. (4) Portfolio Turnover Rate excludes TBA (to be announced) purchase and sales commitments. |
| | |
See Notes to Financial Statements. |
| |
38 | JUNE 30, 2023 |
Janus Henderson Multi-Sector Income Fund
Financial Highlights
| | | | | | | | | | | | | | | | | | | |
Class T Shares | | | | | | | | | | | | | | | |
For a share outstanding during the year ended June 30 | | 2023 | | | 2022 | | | 2021 | | | 2020 | | | 2019 | |
| Net Asset Value, Beginning of Period | | $8.73 | | | $10.12 | | | $9.47 | | | $9.89 | | | $9.66 | |
| Income/(Loss) from Investment Operations: | | | | | | | | | | | | | | | |
| | Net investment income/(loss)(1) | | 0.49 | | | 0.34 | | | 0.40 | | | 0.41 | | | 0.42 | |
| | Net realized and unrealized gain/(loss) | | (0.29) | | | (1.34) | | | 0.67 | | | (0.35) | | | 0.25 | |
| Total from Investment Operations | | 0.20 | | | (1.00) | | | 1.07 | | | 0.06 | | | 0.67 | |
| Less Dividends and Distributions: | | | | | | | | | | | | | | | |
| | Dividends (from net investment income) | | (0.49) | | | (0.36) | | | (0.42) | | | (0.40) | | | (0.44) | |
| | Distributions (from capital gains) | | — | | | (0.03) | | | — | | | (0.05) | | | — | |
| | Return of capital | | (0.01) | | | —(2) | | | — | | | (0.03) | | | — | |
| Total Dividends and Distributions | | (0.50) | | | (0.39) | | | (0.42) | | | (0.48) | | | (0.44) | |
| Net Asset Value, End of Period | | $8.43 | | | $8.73 | | | $10.12 | | | $9.47 | | | $9.89 | |
| Total Return* | | 2.45% | | | (10.12)% | | | 11.47%(3) | | | 0.67% | | | 7.17% | |
| Net Assets, End of Period (in thousands) | | $94,916 | | | $159,043 | | | $229,774 | | | $285,912 | | | $149,662 | |
| Average Net Assets for the Period (in thousands) | | $122,278 | | | $202,714 | | | $291,205 | | | $250,371 | | | $105,637 | |
| Ratios to Average Net Assets**: | | | | | | | | | | | | | | | |
| | Ratio of Gross Expenses | | 0.86% | | | 0.84% | | | 0.85% | | | 0.86% | | | 0.98% | |
| | Ratio of Net Expenses (After Waivers and Expense Offsets) | | 0.85% | | | 0.83% | | | 0.83% | | | 0.86% | | | 0.95% | |
| | Ratio of Net Investment Income/(Loss) | | 5.65% | | | 3.50% | | | 4.01% | | | 4.27% | | | 4.42% | |
| Portfolio Turnover Rate(4) | | 62% | | | 75% | | | 119% | | | 188% | | | 142% | |
| | | | | | | | | | | | | | | | | | | |
| |
* Total return includes adjustments in accordance with generally accepted accounting principles required at the year or period end and are not annualized for periods of less than one full year. ** Annualized for periods of less than one full year. (1) Per share amounts are calculated based on average shares outstanding during the year or period. (2) Less than $0.005 on a per share basis. (3) 0.01% of the Fund’s total return consists of a voluntary reimbursement by the Adviser for realized investment losses and another 0.04% consists of a gain on an investment not meeting the investment guidelines of the Fund. Excluding these items, total return would have been 11.42%. (4) Portfolio Turnover Rate excludes TBA (to be announced) purchase and sales commitments. |
| | |
See Notes to Financial Statements. |
| |
Janus Investment Fund | 39 |
Janus Henderson Multi-Sector Income Fund
Notes to Financial Statements
1. Organization and Significant Accounting Policies
Janus Henderson Multi-Sector Income Fund (the “Fund”) is a series of Janus Investment Fund (the “Trust”), which is organized as a Massachusetts business trust and is registered under the Investment Company Act of 1940, as amended (the “1940 Act”), as an open-end management investment company, and therefore has applied the specialized accounting and reporting guidance in Financial Accounting Standards Board (“FASB”) Accounting Standards Codification (“ASC”) Topic 946. The Trust offers 39 funds, each of which offers multiple share classes, with differing investment objectives and policies. The Fund seeks high current income with a secondary focus on capital appreciation. The Fund is classified as diversified, as defined in the 1940 Act. Janus Henderson Investors US LLC is the investment adviser (the “Adviser”) to the Fund.
The Fund offers multiple classes of shares in order to meet the needs of various types of investors. Each class represents an interest in the same portfolio of investments. Certain financial intermediaries may not offer all classes of shares.
Shareholders, including individuals, accounts, as well as the Fund’s portfolio manager(s) and/or investment personnel, may from time to time own (beneficially or of record) a significant percentage of the Fund’s Shares and can be considered to “control” the Fund when that ownership exceeds 25% of the Fund’s assets (and which may differ from control as determined in accordance with United States of America generally accepted accounting principles ("US GAAP")).
Class A Shares are offered through financial intermediary platforms including, but not limited to, traditional brokerage platforms, mutual fund wrap fee programs, bank trust platforms, and retirement platforms.
Class C Shares are offered through financial intermediary platforms including, but not limited to, traditional brokerage platforms, mutual fund wrap fee programs, and bank trust platforms.
Class C Shares are closed to investments by new employer-sponsored retirement plans and existing employer-sponsored retirement plans are no longer able to make additional purchases or exchanges into Class C Shares.
The Fund currently implements an automatic conversion feature pursuant to which Class C Shares that have been held for eight years are automatically converted to Class A Shares without the imposition of any sales charge, fee or other charge. The conversion will generally occur no later than ten business days in the month following the month of the eighth anniversary of the date of purchase. Class C Shares purchased through the reinvestment of dividends and other distributions on Class C Shares will convert to Class A Shares at the same time as the original Class C Shares with respect to which they were purchased. For Class C Shares held in omnibus accounts on intermediary platforms, the Fund relies on these intermediaries to implement this conversion feature. Your financial intermediary may have separate policies and procedures as to when and how Class C Shares may be converted to Class A Shares.
Effective July 6, 2020, Class D Shares are available to new investors, subject to any closed fund policies for a Fund, as applicable. Previously, Class D Shares were only available to investors who already had a direct account with the Janus Henderson funds; immediate family members or members of the same household of an eligible individual investor; and existing beneficial owners of sole proprietorships or partnerships that hold accounts directly with the Janus Henderson funds.
Class I Shares are available through certain financial intermediary platforms including, but not limited to, mutual fund wrap fee programs, managed account programs, asset allocation programs, bank trust platforms, as well as certain retirement platforms. Class I Shares are also available to certain direct institutional investors including, but not limited to, corporations, certain retirement plans, public plans, and foundations/endowments, who established Class I Share accounts before August 4, 2017.
Class N Shares are generally available only to financial intermediaries purchasing on behalf of: 1) certain adviser-assisted, employer-sponsored retirement plans, including 401(k) plans, 457 plans, 403(b) plans, Taft-Hartley multi-employer plans, profit-sharing and money purchase pension plans, defined benefit plans and certain welfare benefit plans, such as health savings accounts, and nonqualified deferred compensation plans; and 2) retail investors purchasing in qualified or nonqualified accounts, whose accounts are held through an omnibus account at their financial intermediary, and where the financial intermediary requires no payment or reimbursement from the Fund, the Adviser, or its affiliates. Class N Shares are also available to Janus Henderson proprietary products and to certain direct institutional investors approved by Janus Henderson Distributors US LLC (the “Distributor”) including, but not limited to,
Janus Henderson Multi-Sector Income Fund
Notes to Financial Statements
corporations, certain retirement plans, public plans, and foundations and endowments, subject to minimum investment requirements.
Class S Shares are offered through financial intermediary platforms including, but not limited to, retirement platforms and asset allocation, mutual fund wrap, or other discretionary or nondiscretionary fee-based investment advisory programs. In addition, Class S Shares may be available through certain financial intermediaries who have an agreement with the Adviser or its affiliates to offer Class S Shares on their supermarket platforms.
Class T Shares are available through certain financial intermediary platforms including, but not limited to, mutual fund wrap fee programs, managed account programs, asset allocation programs, bank trust platforms, as well as certain retirement platforms. In addition, Class T Shares may be available through certain financial intermediaries who have an agreement with the Adviser or its affiliates to offer Class T Shares on their supermarket platforms.
The following accounting policies have been followed by the Fund and are in conformity with US GAAP.
Investment Valuation
Fund holdings are valued in accordance with policies and procedures established by the Adviser pursuant to Rule 2a-5 under the 1940 Act and approved by and subject to the oversight of the Trustees (the “Valuation Procedures”). Equity securities traded on a domestic securities exchange are generally valued at readily available market quotations, which are (i) the official close prices or (ii) last sale prices on the primary market or exchange in which the securities trade. If such price is lacking for the trading period immediately preceding the time of determination, such securities are generally valued at their current bid price. Equity securities that are traded on a foreign exchange are generally valued at the closing prices on such markets. In the event that there is no current trading volume on a particular security in such foreign exchange, the bid price from the primary exchange is generally used to value the security. Foreign securities and currencies are converted to U.S. dollars using the current spot USD dollar exchange rate in effect at the close of the New York Stock Exchange (“NYSE”). The Adviser will determine the market value of individual securities held by it by using prices provided by one or more Adviser-approved professional pricing services or, as needed, by obtaining market quotations from independent broker-dealers. Most debt securities are valued in accordance with the evaluated bid price supplied by the pricing service that is intended to reflect market value. The evaluated bid price supplied by the pricing service is an evaluation that may consider factors such as security prices, yields, maturities and ratings. Certain short-term securities maturing within 60 days or less may be evaluated and valued on an amortized cost basis provided that the amortized cost determined approximates market value. Securities for which market quotations or evaluated prices are not readily available or deemed unreliable are valued at fair value determined in good faith by the Adviser pursuant to the Valuation Procedures. Circumstances in which fair valuation may be utilized include, but are not limited to: (i) a significant event that may affect the securities of a single issuer, such as a merger, bankruptcy, or significant issuer-specific development; (ii) an event that may affect an entire market, such as a natural disaster or significant governmental action; (iii) a nonsignificant event such as a market closing early or not opening, or a security trading halt; and (iv) pricing of a nonvalued security and a restricted or nonpublic security. Special valuation considerations may apply with respect to “odd-lot” fixed-income transactions which, due to their small size, may receive evaluated prices by pricing services which reflect a large block trade and not what actually could be obtained for the odd-lot position. The value of the securities of other mutual funds held by the Fund, if any, will be calculated using the NAV of such mutual funds, and the prospectuses for such mutual funds explain the circumstances under which they use fair valuation and the effects of using fair valuation. The value of the securities of any cash management pooled investment vehicles that operate as money market funds held by the Fund, if any, will be calculated using the NAV of such funds.
Valuation Inputs Summary
FASB ASC 820, Fair Value Measurements and Disclosures (“ASC 820”), defines fair value, establishes a framework for measuring fair value, and expands disclosure requirements regarding fair value measurements. This standard emphasizes that fair value is a market-based measurement that should be determined based on the assumptions that market participants would use in pricing an asset or liability and establishes a hierarchy that prioritizes inputs to valuation techniques used to measure fair value. These inputs are summarized into three broad levels:
Level 1 – Unadjusted quoted prices in active markets the Fund has the ability to access for identical assets or liabilities.
Level 2 – Observable inputs other than unadjusted quoted prices included in Level 1 that are observable for the asset or liability either directly or indirectly. These inputs may include quoted prices for the identical instrument on
Janus Henderson Multi-Sector Income Fund
Notes to Financial Statements
an inactive market, prices for similar instruments, interest rates, prepayment speeds, credit risk, yield curves, default rates and similar data.
Assets or liabilities categorized as Level 2 in the hierarchy generally include: debt securities fair valued in accordance with the evaluated bid or ask prices supplied by a pricing service; securities traded on OTC markets and listed securities for which no sales are reported that are fair valued at the latest bid price (or yield equivalent thereof) obtained from one or more dealers transacting in a market for such securities or by a pricing service approved by the Fund’s Trustees; certain short-term debt securities with maturities of 60 days or less that are fair valued at amortized cost; and equity securities of foreign issuers whose fair value is determined by using systematic fair valuation models provided by independent third parties in order to adjust for stale pricing which may occur between the close of certain foreign exchanges and the close of the NYSE. Other securities that may be categorized as Level 2 in the hierarchy include, but are not limited to, preferred stocks, bank loans, swaps, investments in unregistered investment companies, options, and forward contracts.
Level 3 – Unobservable inputs for the asset or liability to the extent that relevant observable inputs are not available, representing the Fund’s own assumptions about the assumptions that a market participant would use in valuing the asset or liability, and that would be based on the best information available.
There have been no significant changes in valuation techniques used in valuing any such positions held by the Fund since the beginning of the fiscal year.
The inputs or methodology used for fair valuing securities are not necessarily an indication of the risk associated with investing in those securities. The summary of inputs used as of June 30, 2023 to fair value the Fund’s investments in securities and other financial instruments is included in the “Valuation Inputs Summary” in the Notes to Schedule of Investments and Other Information.
The following describes the amounts of transfers into or out of Level 3 of the fair value hierarchy during the year.
Financial assets of $801,719 were transferred out of Level 2 to Level 3 since certain security’s prices were determined using significant unobservable inputs at the end of the current fiscal year and other significant observable inputs at the end of the prior fiscal year.
The Fund did not hold a significant amount of Level 3 securities as of June 30, 2023.
Investment Transactions and Investment Income
Investment transactions are accounted for as of the date purchased or sold (trade date). Dividend income is recorded on the ex-dividend date. Certain dividends from foreign securities will be recorded as soon as the Fund is informed of the dividend, if such information is obtained subsequent to the ex-dividend date. Dividends from foreign securities may be subject to withholding taxes in foreign jurisdictions. Non-cash dividends, if any, are recorded on the ex-dividend date at fair value. Interest income is recorded daily on the accrual basis and includes amortization of premiums and accretion of discounts. The Fund classifies gains and losses on prepayments received as an adjustment to interest income. Debt securities may be placed in non-accrual status and related interest income may be reduced by stopping current accruals and writing off interest receivables when collection of all or a portion of interest has become doubtful. Gains and losses are determined on the identified cost basis, which is the same basis used for federal income tax purposes. Income, as well as gains and losses, both realized and unrealized, are allocated daily to each class of shares based upon the ratio of net assets represented by each class as a percentage of total net assets.
Expenses
The Fund bears expenses incurred specifically on its behalf. Each class of shares bears a portion of general expenses, which are allocated daily to each class of shares based upon the ratio of net assets represented by each class as a percentage of total net assets. Expenses directly attributable to a specific class of shares are charged against the operations of such class.
Estimates
The preparation of financial statements in conformity with US GAAP requires management to make estimates and assumptions that affect the reported amount of assets and liabilities and disclosure of contingent assets and liabilities at the date of the financial statements, and the reported amounts of income and expenses during the reporting period. Actual results could differ from those estimates.
Janus Henderson Multi-Sector Income Fund
Notes to Financial Statements
Indemnifications
In the normal course of business, the Fund may enter into contracts that contain provisions for indemnification of other parties against certain potential liabilities. The Fund’s maximum exposure under these arrangements is unknown, and would involve future claims that may be made against the Fund that have not yet occurred. Currently, the risk of material loss from such claims is considered remote.
Foreign Currency Translations
The Fund does not isolate that portion of the results of operations resulting from the effect of changes in foreign exchange rates on investments from the fluctuations arising from changes in market prices of securities held at the date of the financial statements. Net unrealized appreciation or depreciation of investments and foreign currency translations arise from changes in the value of assets and liabilities, including investments in securities held at the date of the financial statements, resulting from changes in the exchange rates and changes in market prices of securities held.
Currency gains and losses are also calculated on payables and receivables that are denominated in foreign currencies. The payables and receivables are generally related to foreign security transactions and income translations.
Foreign currency-denominated assets and forward currency contracts may involve more risks than domestic transactions, including currency risk, counterparty risk, political and economic risk, regulatory risk and equity risk. Risks may arise from unanticipated movements in the value of foreign currencies relative to the U.S. dollar.
Dividends and Distributions
Dividends are declared daily and distributed monthly for the Fund. Realized capital gains, if any, are declared and distributed in December. The Fund may treat a portion of the amount paid to redeem shares as a distribution of investment company taxable income and realized capital gains that are reflected in the net asset value. This practice, commonly referred to as “equalization,” has no effect on the redeeming shareholder or a Fund’s total return, but may reduce the amounts that would otherwise be required to be paid as taxable dividends to the remaining shareholders. It is possible that the Internal Revenue Service (IRS) could challenge the Fund's equalization methodology or calculations, and any such challenge could result in additional tax, interest, or penalties to be paid by the Fund.
The Fund may make certain investments in real estate investment trusts (“REITs”) which pay dividends to their shareholders based upon funds available from operations. It is quite common for these dividends to exceed the REITs’ taxable earnings and profits, resulting in the excess portion of such dividends being designated as a return of capital. If the Fund distributes such amounts, such distributions could constitute a return of capital to shareholders for federal income tax purposes.
Federal Income Taxes
The Fund intends to continue to qualify as a regulated investment company and distribute all of its taxable income in accordance with the requirements of Subchapter M of the Internal Revenue Code. Management has analyzed the Fund’s tax positions taken for all open federal income tax years, generally a three-year period, and has concluded that no provision for federal income tax is required in the Fund’s financial statements. The Fund is not aware of any tax positions for which it is reasonably possible that the total amounts of unrecognized tax benefits will significantly change in the next twelve months.
2. Derivative Instruments
The Fund may invest in various types of derivatives, which may at times result in significant derivative exposure. A derivative is a financial instrument whose performance is derived from the performance of another asset. The Fund may invest in derivative instruments including, but not limited to: futures contracts, put options, call options, options on futures contracts, options on foreign currencies, options on recovery locks, options on security and commodity indices, swaps, forward contracts, structured investments, and other equity-linked derivatives. Each derivative instrument that was held by the Fund during the year ended June 30, 2023 is discussed in further detail below. A summary of derivative activity by the Fund is reflected in the tables at the end of the Schedule of Investments.
The Fund may use derivative instruments for hedging purposes (to offset risks associated with an investment, currency exposure, or market conditions), to adjust currency exposure relative to a benchmark index, or for speculative purposes (to earn income and seek to enhance returns). When the Fund invests in a derivative for speculative purposes, the Fund will be fully exposed to the risks of loss of that derivative, which may sometimes be greater than the derivative’s cost. The Fund may not use any derivative to gain exposure to an asset or class of assets that it would be prohibited by its
Janus Henderson Multi-Sector Income Fund
Notes to Financial Statements
investment restrictions from purchasing directly. The Fund’s ability to use derivative instruments may also be limited by tax considerations.
Investments in derivatives in general are subject to market risks that may cause their prices to fluctuate over time. Investments in derivatives may not directly correlate with the price movements of the underlying instrument. As a result, the use of derivatives may expose the Fund to additional risks that it would not be subject to if it invested directly in the securities underlying those derivatives. The use of derivatives may result in larger losses or smaller gains than otherwise would be the case. Derivatives can be volatile and may involve significant risks.
In pursuit of its investment objective, the Fund may seek to use derivatives to increase or decrease exposure to the following market risk factors:
· Commodity Risk – the risk related to the change in value of commodities or commodity-linked investments due to changes in the overall market movements, volatility of the underlying benchmark, changes in interest rates, or other factors affecting a particular industry or commodity such as drought, floods, weather, livestock disease, embargoes, tariffs, and international economic, political, and regulatory developments.
· Counterparty Risk – the risk that the counterparty (the party on the other side of the transaction) on a derivative transaction will be unable to honor its financial obligation to the Fund.
· Credit Risk – the risk an issuer will be unable to make principal and interest payments when due, or will default on its obligations.
· Currency Risk – the risk that changes in the exchange rate between currencies will adversely affect the value (in U.S. dollar terms) of an investment.
· Equity Risk – the risk related to the change in value of equity securities as they relate to increases or decreases in the general market.
· Index Risk – if the derivative is linked to the performance of an index, it will be subject to the risks associated with changes in that index. If the index changes, the Fund could receive lower interest payments or experience a reduction in the value of the derivative to below what the Fund paid. Certain indexed securities, including inverse securities (which move in an opposite direction to the index), may create leverage, to the extent that they increase or decrease in value at a rate that is a multiple of the changes in the applicable index.
· Interest Rate Risk – the risk that the value of fixed-income securities will generally decline as prevailing interest rates rise, which may cause the Fund’s NAV to likewise decrease.
· Leverage Risk – the risk associated with certain types of leveraged investments or trading strategies pursuant to which relatively small market movements may result in large changes in the value of an investment. The Fund creates leverage by investing in instruments, including derivatives, where the investment loss can exceed the original amount invested. Certain investments or trading strategies, such as short sales, that involve leverage can result in losses that greatly exceed the amount originally invested.
· Liquidity Risk – the risk that certain securities may be difficult or impossible to sell at the time that the seller would like or at the price that the seller believes the security is currently worth.
Derivatives may generally be traded OTC or on an exchange. Derivatives traded OTC are agreements that are individually negotiated between parties and can be tailored to meet a purchaser’s needs. OTC derivatives are not guaranteed by a clearing agency and may be subject to increased credit risk.
In an effort to mitigate credit risk associated with derivatives traded OTC, the Fund may enter into collateral agreements with certain counterparties whereby, subject to certain minimum exposure requirements, the Fund may require the counterparty to post collateral if the Fund has a net aggregate unrealized gain on all OTC derivative contracts with a particular counterparty. Additionally, the Fund may deposit cash and/or treasuries as collateral with the counterparty and/or custodian daily (based on the daily valuation of the financial asset) if the Fund has a net aggregate unrealized loss on OTC derivative contracts with a particular counterparty. All liquid securities and restricted cash are considered to cover in an amount at all times equal to or greater than the Fund’s commitment with respect to certain exchange-traded derivatives, centrally cleared derivatives, forward foreign currency exchange contracts, short sales, and/or securities
Janus Henderson Multi-Sector Income Fund
Notes to Financial Statements
with extended settlement dates. There is no guarantee that counterparty exposure is reduced and these arrangements are dependent on the Adviser’s ability to establish and maintain appropriate systems and trading.
Forward Foreign Currency Exchange Contracts
A forward foreign currency exchange contract (“forward currency contract”) is an obligation to buy or sell a specified currency at a future date at a negotiated rate (which may be U.S. dollars or a foreign currency). The Fund may enter into forward currency contracts for hedging purposes, including, but not limited to, reducing exposure to changes in foreign currency exchange rates on foreign portfolio holdings and locking in the U.S. dollar cost of firm purchase and sale commitments for securities denominated in or exposed to foreign currencies. The Fund may also invest in forward currency contracts for non-hedging purposes such as seeking to enhance returns. The Fund is subject to currency risk and counterparty risk in the normal course of pursuing its investment objective through its investments in forward currency contracts.
Forward currency contracts are valued by converting the foreign value to U.S. dollars by using the current spot U.S. dollar exchange rate and/or forward rate for that currency. Exchange and forward rates as of the close of the NYSE are used to value the forward currency contracts. The unrealized appreciation/(depreciation) for forward currency contracts is reported in the Statement of Assets and Liabilities as a receivable or payable and in the Statement of Operations for the change in unrealized net appreciation/depreciation (if applicable). The realized gain or loss arising from the difference between the U.S. dollar cost of the original contract and the value of the foreign currency in U.S. dollars upon closing a forward currency contract is reported on the Statement of Operations (if applicable).
During the year, the Fund entered into forward currency contracts with the obligation to purchase foreign currencies in the future at an agreed upon rate in order to decrease exposure to currency risk associated with foreign currency denominated securities held by the Fund.
During the year, the Fund entered into forward currency contracts with the obligation to sell foreign currencies in the future at an agreed upon rate in order to decrease exposure to currency risk associated with foreign currency denominated securities held by the Fund.
Futures Contracts
A futures contract is an exchange-traded agreement to take or make delivery of an underlying asset at a specific time in the future for a specific predetermined negotiated price. The Fund may enter into futures contracts to gain exposure to the stock market or other markets pending investment of cash balances or to meet liquidity needs. The Fund is subject to interest rate risk, equity risk, and currency risk in the normal course of pursuing its investment objective through its investments in futures contracts. The Fund may also use such derivative instruments to hedge or protect from adverse movements in securities prices, currency rates or interest rates. The use of futures contracts may involve risks such as the possibility of illiquid markets or imperfect correlation between the values of the contracts and the underlying securities, or that the counterparty will fail to perform its obligations.
Futures contracts are valued at the settlement price on valuation date on the exchange as reported by an approved vendor. Mini contracts, as defined in the description of the contract, shall be valued using the Actual Settlement Price or “ASET” price type as reported by an approved vendor. In the event that foreign futures trade when the foreign equity markets are closed, the last foreign futures trade price shall be used. Futures contracts are marked-to-market daily, and the daily variation margin is recorded as a receivable or payable on the Statement of Assets and Liabilities (if applicable). The change in unrealized net appreciation/depreciation is reported on the Statement of Operations (if applicable). When a contract is closed, a realized gain or loss is reported on the Statement of Operations (if applicable), equal to the difference between the opening and closing value of the contract. Securities held by the Fund that are designated as collateral for market value on futures contracts are noted on the Schedule of Investments (if applicable). Such collateral is in the possession of the Fund’s futures commission merchant.
With futures, there is minimal counterparty credit risk to the Fund since futures are exchange-traded and the exchange’s clearinghouse, as counterparty to all exchange-traded futures, guarantees the futures against default.
During the year, the Fund purchased interest rate futures to increase exposure to interest rate risk.
During the year, the Fund sold interest rate futures to decrease exposure to interest rate risk.
Janus Henderson Multi-Sector Income Fund
Notes to Financial Statements
Swaps
Swap agreements are two-party contracts entered into primarily by institutional investors for periods ranging from a day to more than one year to exchange one set of cash flows for another. The most significant factor in the performance of swap agreements is the change in value of the specific index, security, or currency, or other factors that determine the amounts of payments due to and from the Fund. The use of swaps is a highly specialized activity which involves investment techniques and risks different from those associated with ordinary portfolio securities transactions. Swap transactions may in some instances involve the delivery of securities or other underlying assets by the Fund or its counterparty to collateralize obligations under the swap. If the other party to a swap that is not collateralized defaults, the Fund would risk the loss of the net amount of the payments that it contractually is entitled to receive. Swap agreements entail the risk that a party will default on its payment obligations to the Fund. If the other party to a swap defaults, the Fund would risk the loss of the net amount of the payments that it contractually is entitled to receive. If the Fund utilizes a swap at the wrong time or judges market conditions incorrectly, the swap may result in a loss to the Fund and reduce the Fund’s total return.
Swap agreements also bear the risk that the Fund will not be able to meet its obligation to the counterparty. Swap agreements are typically privately negotiated and entered into in the OTC market. However, certain swap agreements are required to be cleared through a clearinghouse and traded on an exchange or swap execution facility. Swaps that are required to be cleared are required to post initial and variation margins in accordance with the exchange requirements. Regulations enacted require the Fund to centrally clear certain interest rate and credit default index swaps through a clearinghouse or central counterparty (“CCP”). To clear a swap with a CCP, the Fund will submit the swap to, and post collateral with, a futures clearing merchant (“FCM”) that is a clearinghouse member. Alternatively, the Fund may enter into a swap with a financial institution other than the FCM (the “Executing Dealer”) and arrange for the swap to be transferred to the FCM for clearing. The Fund may also enter into a swap with the FCM itself. The CCP, the FCM, and the Executing Dealer are all subject to regulatory oversight by the U.S. Commodity Futures Trading Commission (“CFTC”). A default or failure by a CCP or an FCM, or the failure of a swap to be transferred from an Executing Dealer to the FCM for clearing, may expose the Fund to losses, increase its costs, or prevent the Fund from entering or exiting swap positions, accessing collateral, or fully implementing its investment strategies. The regulatory requirement to clear certain swaps could, either temporarily or permanently, reduce the liquidity of cleared swaps or increase the costs of entering into those swaps.
Index swaps, interest rate swaps, inflation swaps and credit default swaps are valued using an approved vendor supplied price. Basket swaps are valued using a broker supplied price. Equity swaps that consist of a single underlying equity are valued either at the closing price, the latest bid price, or the last sale price on the primary market or exchange it trades. The market value of swap contracts are aggregated by positive and negative values and are disclosed separately as an asset or liability on the Fund’s Statement of Assets and Liabilities (if applicable). Realized gains and losses are reported on the Fund’s Statement of Operations (if applicable). The change in unrealized net appreciation or depreciation during the year is included in the Statement of Operations (if applicable).
The Fund’s maximum risk of loss from counterparty risk or credit risk is the discounted value of the payments to be received from/paid to the counterparty over the contract’s remaining life, to the extent that the amount is positive. The risk is mitigated by having a netting arrangement between the Fund and the counterparty and by the posting of collateral by the counterparty to cover the Fund’s exposure to the counterparty.
The Fund may enter into various types of credit default swap agreements, including OTC credit default swap agreements, for investment purposes, to add leverage to its Fund, or to hedge against widening credit spreads on high-yield/high-risk bonds. Credit default swaps are a specific kind of counterparty agreement that allow the transfer of third party credit risk from one party to the other. One party in the swap is a lender and faces credit risk from a third party, and the counterparty in the credit default swap agrees to insure this risk in exchange for regular periodic payments. Credit default swaps could result in losses if the Fund does not correctly evaluate the creditworthiness of the company or companies on which the credit default swap is based. Credit default swap agreements may involve greater risks than if the Fund had invested in the reference obligation directly since, in addition to risks relating to the reference obligation, credit default swaps are subject to illiquidity risk, counterparty risk, and credit risk. The Fund will generally incur a greater degree of risk when it sells a credit default swap than when it purchases a credit default swap. As a buyer of a credit default swap, the Fund may lose its investment and recover nothing should no credit event occur and the swap is held to its termination date. As seller of a credit default swap, if a credit event were to occur, the value of any deliverable
Janus Henderson Multi-Sector Income Fund
Notes to Financial Statements
obligation received by the Fund, coupled with the upfront or periodic payments previously received, may be less than what it pays to the buyer, resulting in a loss of value to the Fund.
As a buyer of credit protection, the Fund is entitled to receive the par (or other agreed-upon) value of a referenced debt obligation from the counterparty to the contract in the event of a default or other credit event by a third party, such as a U.S. or foreign issuer, on the debt obligation. In return, the Fund as buyer would pay to the counterparty a periodic stream of payments over the term of the contract provided that no credit event has occurred. If no credit event occurs, the Fund would have spent the stream of payments and potentially received no benefit from the contract.
If the Fund is the seller of credit protection against a particular security, the Fund would receive an up-front or periodic payment to compensate against potential credit events. As the seller in a credit default swap contract, the Fund would be required to pay the par value (the “notional value”) (or other agreed-upon value) of a referenced debt obligation to the counterparty in the event of a default by a third party, such as a U.S. or foreign corporate issuer, on the debt obligation. In return, the Fund would receive from the counterparty a periodic stream of payments over the term of the contract provided that no event of default has occurred. If no default occurs, the Fund would keep the stream of payments and would have no payment obligations. As the seller, the Fund would effectively add leverage to its portfolio because, in addition to its total net assets, the Fund would be subject to investment exposure on the notional value of the swap. The maximum potential amount of future payments (undiscounted) that the Fund as a seller could be required to make in a credit default transaction would be the notional amount of the agreement.
The Fund may invest in CDXs. A CDX is a swap on an index of credit default swaps. CDXs allow an investor to manage credit risk or take a position on a basket of credit entities (such as credit default swaps or commercial mortgage-backed securities) in a more efficient manner than transacting in a single-name CDS. If a credit event occurs in one of the underlying companies, the protection is paid out via the delivery of the defaulted bond by the buyer of protection in return for a payment of notional value of the defaulted bond by the seller of protection or it may be settled through a cash settlement between the two parties. The underlying company is then removed from the index. If the Fund holds a long position in a CDX, the Fund would indirectly bear its proportionate share of any expenses paid by a CDX. A Fund holding a long position in CDXs typically receives income from principal or interest paid on the underlying securities. By investing in CDXs, the Fund could be exposed to illiquidity risk, counterparty risk, and credit risk of the issuers of the underlying loan obligations and of the CDX markets. If there is a default by the CDX counterparty, the Fund will have contractual remedies pursuant to the agreements related to the transaction. CDXs also bear the risk that the Fund will not be able to meet its obligation to the counterparty.
During the year, the Fund purchased protection via the credit default swap market in order to reduce credit risk exposure to individual corporates, countries and/or credit indices where reducing this exposure via the cash bond market was less attractive.
There were no credit default swaps held at June 30, 2023.
3. Other Investments and Strategies
Market Risk
The Fund may be invested in lower-rated debt securities that have a higher risk of default or loss of value since these securities may be sensitive to economic changes, political changes, or adverse developments specific to the issuer.
The value of the Fund’s portfolio may decrease if the value of one or more issuers in the Fund’s portfolio decreases. Further, regardless of how well individual companies or securities perform, the value of the Fund’s portfolio could also decrease if there are deteriorating economic or market conditions, including, but not limited to, a general decline in prices on the stock markets, a general decline in real estate markets, a decline in commodities prices, or if the market favors different types of securities than the types of securities in which the Fund invests. If the value of the Fund’s portfolio decreases, the Fund’s NAV will also decrease, which means if you sell your shares in the Fund you may lose money. Market risk may affect a single issuer, industry, economic sector, or the market as a whole. The increasing interconnectivity between global economies and financial markets increases the likelihood that events or conditions in one region or financial market may adversely impact issuers in a different country, region or financial market. Social, political, economic and other conditions and events, such as natural disasters, health emergencies (e.g., epidemics and pandemics), terrorism, conflicts, including related sanctions, and social unrest, could reduce consumer demand or economic output, result in market closures, travel restrictions and/or quarantines, and generally have a significant impact on the global economies and financial markets.
Janus Henderson Multi-Sector Income Fund
Notes to Financial Statements
• COVID-19 Pandemic. The effects of COVID-19 have contributed to increased volatility in global financial markets and have affected and may continue to affect certain countries, regions, issuers, industries and market sectors more dramatically than others. These conditions and events could have a significant impact on the Fund and its investments, the Fund’s ability to meet redemption requests, and the processes and operations of the Fund’s service providers, including the Adviser.
• Russia/Ukraine Invasion. Russia launched a large-scale invasion of Ukraine on February 24, 2022. The extent and duration of the military action, resulting sanctions and resulting future market disruptions in the region are impossible to predict, but could be significant and have a severe adverse effect on the region, including significant negative impacts on the economy and the markets for certain securities and commodities, such as oil and natural gas, as well as other sectors.
LIBOR Replacement Risk
The Fund may invest in certain debt securities, derivatives or other financial instruments that utilize the London Interbank Offered Rate (“LIBOR”) or other interbank offered rates as a reference rate for various rate calculations. The U.K. Financial Conduct Authority has announced that it intends to stop compelling or inducing banks to submit rates for many LIBOR settings after December 31, 2021, and for certain other commonly used U.S. dollar LIBOR settings after June 30, 2023. The elimination of LIBOR or other reference rates and the transition process away from LIBOR could adversely impact (i) volatility and liquidity in markets that are tied to those reference rates, (ii) the market for, or value of, specific securities or payments linked to those reference rates, (iii) availability or terms of borrowing or refinancing, or (iv) the effectiveness of hedging strategies. For these and other reasons, the elimination of LIBOR or changes to other reference rates may adversely affect the Fund’s performance and/or net asset value. Alternatives to LIBOR are established or in development in most major currencies, including the Secured Overnight Financing Rate (“SOFR”) that is intended to replace the U.S. dollar LIBOR. The effect of the discontinuation of, LIBOR or other reference rates will depend on (1) existing fallback or termination provisions in individual contracts and (2) whether, how, and when industry participants develop and adopt new reference rates and fallbacks for both legacy and new products and instruments. Accordingly, it is difficult to predict the full impact of the transition away from LIBOR or other reference rates on the Fund until new reference rates and fallbacks for both legacy and new products, instruments and contracts are commercially accepted.
Loans
The Fund may invest in various commercial loans, including bank loans, bridge loans, debtor-in-possession (“DIP”) loans, mezzanine loans, and other fixed and floating rate loans. These loans may be acquired through loan participations and assignments or on a when-issued basis. Commercial loans will comprise no more than 50% of the Fund’s total assets. Below are descriptions of the types of loans held by the Fund as of June 30, 2023.
· Bank Loans - Bank loans are obligations of companies or other entities entered into in connection with recapitalizations, acquisitions, and refinancings. The Fund’s investments in bank loans are generally acquired as a participation interest in, or assignment of, loans originated by a lender or other financial institution. These investments may include institutionally-traded floating and fixed-rate debt securities.
· Floating Rate Loans – Floating rate loans are debt securities that have floating interest rates, that adjust periodically, and are tied to a benchmark lending rate, such as London Interbank Offered Rate (“LIBOR”). In other cases, the lending rate could be tied to the prime rate offered by one or more major U.S. banks or the rate paid on large certificates of deposit traded in the secondary markets. If the benchmark lending rate changes, the rate payable to lenders under the loan will change at the next scheduled adjustment date specified in the loan agreement. Floating rate loans are typically issued to companies (‘‘borrowers’’) in connection with recapitalizations, acquisitions, and refinancings. Floating rate loan investments are generally below investment grade. Senior floating rate loans are secured by specific collateral of a borrower and are senior in the borrower’s capital structure. The senior position in the borrower’s capital structure generally gives holders of senior loans a claim on certain of the borrower’s assets that is senior to subordinated debt and preferred and common stock in the case of a borrower’s default. Floating rate loan investments may involve foreign borrowers, and investments may be denominated in foreign currencies. Floating rate loans often involve borrowers whose financial condition is troubled or uncertain and companies that are highly leveraged. The Fund may invest in obligations of borrowers who are in bankruptcy proceedings. While the Fund generally expects to invest in fully funded term loans, certain of the loans in which the Fund may invest include revolving loans, bridge loans, and delayed draw term loans.
Janus Henderson Multi-Sector Income Fund
Notes to Financial Statements
Purchasers of floating rate loans may pay and/or receive certain fees. The Fund may receive fees such as covenant waiver fees or prepayment penalty fees. The Fund may pay fees such as facility fees. Such fees may affect the Fund’s return.
· Mezzanine Loans - Mezzanine loans are secured by the stock of the company that owns the assets. Mezzanine loans are a hybrid of debt and equity financing that is typically used to fund the expansion of existing companies. A mezzanine loan is composed of debt capital that gives the lender the right to convert to an ownership or equity interest in the company if the loan is not paid back in time and in full. Mezzanine loans typically are the most subordinated debt obligation in an issuer’s capital structure.
Mortgage- and Asset-Backed Securities
Mortgage- and asset-backed securities represent interests in “pools” of commercial or residential mortgages or other assets, including consumer and commercial loans or receivables. The Fund may purchase fixed or variable rate commercial or residential mortgage-backed securities issued by the Government National Mortgage Association (“Ginnie Mae”), the Federal National Mortgage Association (“Fannie Mae”), the Federal Home Loan Mortgage Corporation (“Freddie Mac”), or other governmental or government-related entities. Ginnie Mae’s guarantees are backed as to the timely payment of principal and interest by the full faith and credit of the U.S. Government. Fannie Mae and Freddie Mac securities are not backed by the full faith and credit of the U.S. Government. In September 2008, the Federal Housing Finance Agency (“FHFA”), an agency of the U.S. Government, placed Fannie Mae and Freddie Mac under conservatorship. Since that time, Fannie Mae and Freddie Mac have received capital support through U.S. Treasury preferred stock purchases and Treasury and Federal Reserve purchases of their mortgage-backed securities. The FHFA and the U.S. Treasury have imposed strict limits on the size of these entities’ mortgage portfolios. The FHFA has the power to cancel any contract entered into by Fannie Mae and Freddie Mac prior to FHFA’s appointment as conservator or receiver, including the guarantee obligations of Fannie Mae and Freddie Mac.
The Fund may also purchase other mortgage- and asset-backed securities through single- and multi-seller conduits, collateralized debt obligations, structured investment vehicles, and other similar securities. Asset-backed securities may be backed by various consumer obligations, including automobile loans, equipment leases, credit card receivables, or other collateral. In the event the underlying loans are not paid, the securities’ issuer could be forced to sell the assets and recognize losses on such assets, which could impact your return. Unlike traditional debt instruments, payments on these securities include both interest and a partial payment of principal. Mortgage- and asset-backed securities are subject to both extension risk, where borrowers pay off their debt obligations more slowly in times of rising interest rates, and prepayment risk, where borrowers pay off their debt obligations sooner than expected in times of declining interest rates. These risks may reduce the Fund’s returns. In addition, investments in mortgage- and asset-backed securities, including those comprised of subprime mortgages, may be subject to a higher degree of credit risk, valuation risk, extension risk (if interest rates rise), and liquidity risk than various other types of fixed-income securities. Additionally, although mortgage-backed securities are generally supported by some form of government or private guarantee and/or insurance, there is no assurance that guarantors or insurers will meet their obligations.
TBA Commitments
The Fund may enter into “to be announced” or “TBA” commitments. TBAs are forward agreements for the purchase or sale of securities, including mortgage-backed securities, for a fixed price, with payment and delivery on an agreed upon future settlement date. The specific securities to be delivered are not identified at the trade date. However, delivered securities must meet specified terms, including issuer, rate, and mortgage terms. Although TBA securities must meet industry-accepted “good delivery” standards, there can be no assurance that a security purchased on forward commitment basis will ultimately be issued or delivered by the counterparty. During the settlement period, the Fund will still bear the risk of any decline in the value of the security to be delivered. Because TBA commitments do not require the delivery of a specific security, the characteristics of the security delivered to the Fund may be less favorable than expected. If the counterparty to a transaction fails to deliver the security, the Fund could suffer a loss. Cash collateral that has been pledged to cover the obligations of a Fund and cash collateral received from the counterparty, if any, is reported separately in the Statement of Assets and Liabilities as Collateral for To Be Announced Transactions.
When-Issued, Delayed Delivery and Forward Commitment Transactions
The Fund may purchase or sell securities on a when-issued, delayed delivery, or forward commitment basis. When purchasing a security on a when-issued, delayed delivery, or forward commitment basis, the Fund assumes the rights and risks of ownership of the security, including the risk of price and yield fluctuations, and takes such fluctuations into account when determining its net asset value. Typically, no income accrues on securities the Fund has committed to
Janus Henderson Multi-Sector Income Fund
Notes to Financial Statements
purchase prior to the time delivery of the securities is made. Because the Fund is not required to pay for the security until the delivery date, these risks are in addition to the risks associated with the Fund’s other investments. If the other party to a transaction fails to deliver the securities, the Fund could miss a favorable price or yield opportunity. If the Fund remains substantially fully invested at a time when when-issued, delayed delivery, or forward commitment purchases are outstanding, the purchases may result in a form of leverage. If the Fund remains substantially fully invested at a time when when-issued, delayed delivery, or forward commitment purchases (including TBA commitments) are outstanding, the purchases may result in a form of leverage.
When the Fund has sold a security on a when-issued, delayed delivery, or forward commitment basis, the Fund does not participate in future gains or losses with respect to the security. If the other party to a transaction fails to pay for the securities, the Fund could suffer a loss. Additionally, when selling a security on a when-issued, delayed delivery, or forward commitment basis without owning the security, the Fund will incur a loss if the security’s price appreciates in value such that the security’s price is above the agreed upon price on the settlement date. The Fund may dispose of or renegotiate a transaction after it is entered into, and may purchase or sell when-issued, delayed delivery or forward commitment securities before the settlement date, which may result in a gain or loss.
Counterparties
Fund transactions involving a counterparty are subject to the risk that the counterparty or a third party will not fulfill its obligation to the Fund (“counterparty risk”). Counterparty risk may arise because of the counterparty’s financial condition (i.e., financial difficulties, bankruptcy, or insolvency), market activities and developments, or other reasons, whether foreseen or not. A counterparty’s inability to fulfill its obligation may result in significant financial loss to the Fund. The Fund may be unable to recover its investment from the counterparty or may obtain a limited recovery, and/or recovery may be delayed. The extent of the Fund’s exposure to counterparty risk with respect to financial assets and liabilities approximates its carrying value. See the "Offsetting Assets and Liabilities" section of this Note for further details.
The Fund may be exposed to counterparty risk through participation in various programs, including, but not limited to, lending its securities to third parties, cash sweep arrangements whereby the Fund’s cash balance is invested in one or more types of cash management vehicles, as well as investments in, but not limited to, repurchase agreements, debt securities, and derivatives, including various types of swaps, futures and options. The Fund intends to enter into financial transactions with counterparties that the Adviser believes to be creditworthy at the time of the transaction. There is always the risk that the Adviser’s analysis of a counterparty’s creditworthiness is incorrect or may change due to market conditions. To the extent that the Fund focuses its transactions with a limited number of counterparties, it will have greater exposure to the risks associated with one or more counterparties.
Securities Lending
Under procedures adopted by the Trustees, the Fund may seek to earn additional income by lending securities to certain qualified broker-dealers and institutions. JPMorgan Chase Bank, National Association acts as securities lending agent and a limited purpose custodian or subcustodian to receive and disburse cash balances and cash collateral, hold short-term investments, hold collateral, and perform other custodial functions in accordance with the Non-Custodial Securities Lending Agreement. For financial reporting purposes, the Fund does not offset financial instruments’ payables and receivables and related collateral on the Statement of Assets and Liabilities. The Fund may lend fund securities in an amount equal to up to 1/3 of its total assets as determined at the time of the loan origination. There is the risk of delay in recovering a loaned security or the risk of loss in collateral rights if the borrower fails financially. In addition, the Adviser makes efforts to balance the benefits and risks from granting such loans. All loans will be continuously secured by collateral which may consist of cash, U.S. Government securities, domestic and foreign short-term debt instruments, letters of credit, time deposits, repurchase agreements, money market mutual funds or other money market accounts, or such other collateral as permitted by the SEC. If the Fund is unable to recover a security on loan, the Fund may use the collateral to purchase replacement securities in the market. There is a risk that the value of the collateral could decrease below the cost of the replacement security by the time the replacement investment is made, resulting in a loss to the Fund. In certain circumstances individual loan transactions could yield negative returns.
Upon receipt of cash collateral, the Adviser may invest it in affiliated or non-affiliated cash management vehicles, whether registered or unregistered entities, as permitted by the 1940 Act and rules promulgated thereunder. The Adviser currently intends to primarily invest the cash collateral in a cash management vehicle for which the Adviser serves as investment adviser, Janus Henderson Cash Collateral Fund LLC, or in time deposits. An investment in Janus Henderson Cash Collateral Fund LLC is generally subject to the same risks that shareholders experience when investing in similarly structured vehicles, such as the potential for significant fluctuations in assets as a result of the
Janus Henderson Multi-Sector Income Fund
Notes to Financial Statements
purchase and redemption activity of the securities lending program, a decline in the value of the collateral, and possible liquidity issues. Such risks may delay the return of the cash collateral and cause the Fund to violate its agreement to return the cash collateral to a borrower in a timely manner. As adviser to the Fund and Janus Henderson Cash Collateral Fund LLC, the Adviser has an inherent conflict of interest as a result of its fiduciary duties to both the Fund and Janus Henderson Cash Collateral Fund LLC. Additionally, the Adviser receives an investment advisory fee of 0.05% for managing Janus Henderson Cash Collateral Fund LLC, but it may not receive a fee for managing certain other affiliated cash management vehicles in which the Fund may invest, and therefore may have an incentive to allocate preferred investment opportunities to investment vehicles for which it is receiving a fee.
The value of the collateral must be at least 102% of the market value of the loaned securities that are denominated in U.S. dollars and 105% of the market value of the loaned securities that are not denominated in U.S. dollars. Loaned securities and related collateral are marked-to-market each business day based upon the market value of the loaned securities at the close of business, employing the most recent available pricing information. Collateral levels are then adjusted based on this mark-to-market evaluation. Additional required collateral, or excess collateral returned, is delivered on the next business day. Therefore, the value of the collateral held may be temporarily less than 102% or 105% value of the securities on loan. The cash collateral invested by the Adviser is disclosed in the Schedule of Investments (if applicable).
Income earned from the investment of the cash collateral, net of rebates paid to, or fees paid by, borrowers and less the fees paid to the lending agent are included as “Affiliated securities lending income, net” on the Statement of Operations. As of June 30, 2023, securities lending transactions accounted for as secured borrowings with an overnight and continuous contractual maturity are $17,556,969. Gross amounts of recognized liabilities for securities lending (collateral received) as of June 30, 2023 is $18,383,552, resulting in the net amount due from the counterparty of $826,583.
Offsetting Assets and Liabilities
The Fund presents gross and net information about transactions that are either offset in the financial statements or subject to an enforceable master netting arrangement or similar agreement with a designated counterparty, regardless of whether the transactions are actually offset in the Statement of Assets and Liabilities.
In order to better define its contractual rights and to secure rights that will help the Fund mitigate its counterparty risk, the Fund has entered into an International Swaps and Derivatives Association, Inc. Master Agreement (“ISDA Master Agreement”) or similar agreement with its derivative contract counterparties. An ISDA Master Agreement is a bilateral agreement between the Fund and a counterparty that governs OTC derivatives and forward foreign currency exchange contracts and typically contains, among other things, collateral posting terms and netting provisions in the event of a default and/or termination event. Under an ISDA Master Agreement, in the event of a default and/or termination event, the Fund may offset with each counterparty certain derivative financial instruments’ payables and/or receivables with collateral held and/or posted and create one single net payment.
The Offsetting Assets and Liabilities tables located in the Schedule of Investments present gross amounts of recognized assets and/or liabilities and the net amounts after deducting collateral that has been pledged by counterparties or has been pledged to counterparties (if applicable). For corresponding information grouped by type of instrument, see the “Fair Value of Derivative Instruments (not accounted for as hedging instruments) as of June 30, 2023” table located in the Fund’s Schedule of Investments.
The Fund generally does not exchange collateral on its forward foreign currency contracts with its counterparties; however, all liquid securities and restricted cash are considered to cover in an amount at all times equal to or greater than the Fund’s commitment with respect to these contracts. Certain securities may be segregated at the Fund’s custodian. These segregated securities are denoted on the accompanying Schedule of Investments and are evaluated daily to ensure their cover and/or market value equals or exceeds the Fund’s corresponding forward foreign currency exchange contract's obligation value.
4. Investment Advisory Agreements and Other Transactions with Affiliates
The Fund pays the Adviser an investment advisory fee which is calculated daily and paid monthly. The following table reflects the Fund’s contractual investment advisory fee rate (expressed as an annual rate).
Janus Henderson Multi-Sector Income Fund
Notes to Financial Statements
| | |
Average Daily Net Assets of the Fund | Contractual Investment Advisory Fee (%) |
First $200 Million | 0.60 |
Next $500 Million | 0.57 |
Over $700 Million | 0.55 |
The Fund’s actual investment advisory fee rate for the reporting period was 0.56% of average annual net assets before any applicable waivers.
The Adviser has contractually agreed to waive the investment advisory fee and/or reimburse operating expenses to the extent that the Fund’s total annual fund operating expenses, excluding the fees payable pursuant to a Rule 12b-1 plan, shareholder servicing fees, such as transfer agency fees (including out-of-pocket costs), administrative services fees and any networking/omnibus payable by any share class, brokerage commissions, interest, dividends, taxes, acquired fund fees and expenses, and extraordinary expenses, exceed the annual rate of 0.64% of the Fund’s average daily net assets. The Adviser has agreed to continue the waivers for at least a one-year period commencing October 28, 2022. If applicable, amounts waived and/or reimbursed to the Fund by the Adviser are disclosed as “Excess Expense Reimbursement and Waivers” on the Statement of Operations.
The Adviser serves as administrator to the Fund pursuant to an administration agreement between the Adviser and the Trust. Under the administration agreement, the Adviser is authorized to perform, or cause others to perform certain administration, compliance, and accounting services to the Fund, including providing office space for the Fund, and is reimbursed by the Fund for certain of its costs in providing these services (to the extent the Adviser seeks reimbursement and such costs are not otherwise waived). In addition, employees of the Adviser and/or its affiliates may serve as officers of the Trust. The Fund pays for some or all of the salaries, fees, and expenses of the Adviser employees and Fund officers, with respect to certain specified administration functions they perform on behalf of the Fund. The Fund pays these costs based on out-of-pocket expenses incurred by the Adviser, and these costs are separate and apart from advisory fees and other expenses paid in connection with the investment advisory services the Adviser (or any subadvisor, as applicable) provides to the Fund. These amounts are disclosed as “Affiliated fund administration fees” on the Statement of Operations. In addition, some expenses related to compensation payable to the Fund’s Chief Compliance Officer and certain compliance staff, all of whom are employees of the Adviser and/or its affiliates, are shared with the Fund. Total compensation of $343,237 was paid to the Chief Compliance Officer and certain compliance staff by the Trust during the year ended June 30, 2023. The Fund's portion is reported as part of “Other expenses” on the Statement of Operations.
Janus Henderson Services US LLC (the “Transfer Agent”), a wholly-owned subsidiary of the Adviser, is the Fund’s transfer agent. The Transfer Agent provides or arranges for the provision of shareholder services including, but not limited to, recordkeeping, subaccounting, answering inquiries regarding accounts, order processing, transaction confirmations, the mailing of prospectuses and shareholder reports, and other shareholder services provided to or on behalf of shareholders. These amounts are disclosed as “Transfer agent administrative fees and expenses” on the Statement of Operations.
Class D Shares of the Fund pay the Transfer Agent an annual administrative services fee based on the average daily net assets of Class D Shares as detailed below.
| | |
Average Daily Net Assets of Class D Shares of the Janus Henderson funds | Administrative Services Fee |
Under $40 billion | 0.12% |
$40 billion – $49.9 billion | 0.10% |
Over $49.9 billion | 0.08% |
During the reporting period, the administrative services fee rate was 0.12%.
The Transfer Agent receives an administrative services fee at an annual rate of up to 0.25% of the average daily net assets of the Fund’s Class S Shares and Class T Shares for providing or procuring administrative services to investors in Class S Shares and Class T Shares of the Fund. The Transfer Agent expects to use all or a significant portion of this fee to compensate retirement plan service providers, broker-dealers, bank trust departments, financial advisors, and other financial intermediaries for providing these services. The Transfer Agent may keep certain amounts retained for reimbursement of out-of-pocket costs incurred for servicing clients of Class S Shares and Class T Shares.
Janus Henderson Multi-Sector Income Fund
Notes to Financial Statements
Shareholder Services provided by these financial intermediaries may include, but are not limited to, recordkeeping, subaccounting, order processing, providing order confirmations, periodic statements, forwarding prospectuses, shareholder reports, and other materials to existing customers, answering inquiries regarding accounts, and other administrative services. Order processing includes the submission of transactions through the National Securities Clearing Corporation (“NSCC”) or similar systems, or those processed on a manual basis with the Adviser. For all share classes, the Transfer Agent also seeks reimbursement for costs it incurs as transfer agent and for providing servicing.
Certain, but not all, intermediaries may charge administrative fees to investors in Class A Shares, Class C Shares, and Class I Shares for administrative services provided on behalf of such investors. These administrative fees are paid by the Class A Shares, Class C Shares, and Class I Shares of the Fund to the Transfer Agent, which uses such fees to reimburse intermediaries. Consistent with the Transfer Agency Agreement between the Transfer Agent and the Fund, the Transfer Agent may negotiate the level, structure, and/or terms of the administrative fees with intermediaries requiring such fees on behalf of the Fund. The Adviser and its affiliates benefit from an increase in assets that may result from such relationships. The Adviser has agreed to limit these fees up to 0.20% for Class A Shares and Class C Shares, and up to 0.15% for Class I Shares on an annual basis based on the daily net assets of each share class. Such limits are subject to change by the Trustees in the future. These amounts are disclosed as “Transfer agent networking and omnibus fees” on the Statement of Operations.
The Transfer Agent is not compensated for its services related to the shares, except for out-of-pocket costs, although the Transfer Agent is compensated for its services related to Fund’s Class D Shares. These amounts are disclosed as “Other transfer agent fees and expenses” on the Statement of Operations.
Under distribution and shareholder servicing plans (the “Plans”) adopted in accordance with Rule 12b-1 under the 1940 Act, the Fund pays the Trust’s distributor, the Distributor, a wholly-owned subsidiary of the Adviser, a fee for the sale and distribution and/or shareholder servicing of the shares based on the average daily net assets for each share class at an annual rate of up to 0.25% for Class A Shares, up to 1.00% for Class C Shares, and up to 0.25% for Class S Shares. Under the terms of the Plans, the Trust is authorized to make payments to the Distributor for remittance to retirement plan service providers, broker-dealers, bank trust departments, financial advisors, and other financial intermediaries, as compensation for distribution and/or shareholder services performed by such entities for their customers who are investors in the Fund. These amounts are disclosed as “12b-1 Distribution and shareholder servicing fees” on the Statement of Operations.
Class A Shares include a 4.75% upfront sales charge of the offering price of the Fund. The sales charge is allocated between the Distributor and financial intermediaries. During the year ended June 30, 2023, the Distributor retained upfront sales charges of $5,199.
A contingent deferred sales charge (“CDSC”) of 1.00% will be deducted with respect to Class A Shares purchased without a sales load and redeemed within 12 months of purchase, unless waived. Any applicable CDSC will be 1.00% of the lesser of the original purchase price or the value of the redemption of the Class A Shares redeemed. There were no CDSCs paid by redeeming shareholders of Class A Shares to the Distributor during the year ended June 30, 2023.
A CDSC of 1.00% will be deducted with respect to Class C Shares redeemed within 12 months of purchase, unless waived. Any applicable CDSC will be 1.00% of the lesser of the original purchase price or the value of the redemption of the Class C Shares redeemed. During the year ended June 30, 2023, redeeming shareholders of Class C Shares paid CDSCs of $6,497.
The Board of Trustees has adopted a deferred compensation plan (the “Deferred Plan”) for independent Trustees to elect to defer receipt of all or a portion of the annual compensation they are entitled to receive from the Fund. All deferred fees are credited to an account established in the name of the Trustees. The amounts credited to the account then increase or decrease, as the case may be, in accordance with the performance of one or more of the Janus Henderson funds that are selected by the Trustees. The account balance continues to fluctuate in accordance with the performance of the selected fund or funds until final payment of all amounts are credited to the account. The fluctuation of the account balance is recorded by the Fund as unrealized appreciation/(depreciation) and is included as of June 30, 2023 on the Statement of Assets and Liabilities in the asset, “Trustees’ deferred compensation,” and liability, “Trustees’ deferred compensation fees.” Additionally, the recorded unrealized appreciation/(depreciation) is included in “Total distributable earnings (loss)” on the Statement of Assets and Liabilities. Deferred compensation expenses for the year ended June 30, 2023 are included in “Trustees’ fees and expenses” on the Statement of Operations. Trustees are allowed to change their designation of mutual funds from time to time. Amounts will be deferred until distributed in
Janus Henderson Multi-Sector Income Fund
Notes to Financial Statements
accordance with the Deferred Plan. Deferred fees of $426,025 were paid by the Trust to the Trustees under the Deferred Plan during the year ended June 30, 2023.
Pursuant to the provisions of the 1940 Act and related rules, the Fund may participate in an affiliated or non-affiliated cash sweep program. In the cash sweep program, uninvested cash balances of the Fund may be used to purchase shares of affiliated or non-affiliated money market funds or cash management pooled investment vehicles that operate as money market funds. The Fund is eligible to participate in the cash sweep program (the “Investing Funds”). The Adviser has an inherent conflict of interest because of its fiduciary duties to the affiliated money market funds or cash management pooled investment vehicles and the Investing Funds. Janus Henderson Cash Liquidity Fund LLC (the “Sweep Vehicle”) is an affiliated unregistered cash management pooled investment vehicle that invests primarily in highly-rated short-term fixed-income securities. The Sweep Vehicle operates pursuant to the provisions of the 1940 Act that govern the operation of money market funds and prices its shares at NAV reflecting market-based values of its portfolio securities (i.e., a “floating” NAV) rounded to the fourth decimal place (e.g., $1.0000). The Sweep Vehicle is permitted to impose a liquidity fee (of up to 2%) on redemptions from the Sweep Vehicle or a redemption gate that temporarily suspends redemptions from the Sweep Vehicle for up to 10 business days during a 90 day period. There are no restrictions on the Fund's ability to withdraw investments from the Sweep Vehicle at will, and there are no unfunded capital commitments due from the Fund to the Sweep Vehicle. The Sweep Vehicle does not charge any management fee, sales charge or service fee.
Any purchases and sales, realized gains/losses and recorded dividends from affiliated investments during the year ended June 30, 2023 can be found in the “Schedules of Affiliated Investments” located in the Schedule of Investments.
The Fund is permitted to purchase or sell securities (“cross-trade”) between itself and other funds or accounts managed by the Adviser in accordance with Rule 17a-7 under the Investment Company Act of 1940 (“Rule 17a-7”), when the transaction is consistent with the investment objectives and policies of the Fund and in accordance with the Internal Cross Trade Procedures adopted by the Trust’s Board of Trustees. These procedures have been designed to ensure that any cross-trade of securities by the Fund from or to another fund or account that is or could be considered an affiliate of the Fund under certain limited circumstances by virtue of having a common investment adviser, common Officer, or common Trustee complies with Rule 17a-7. Under these procedures, each cross-trade is effected at the current market price to save costs where allowed. During the year ended June 30, 2023, the Fund engaged in cross trades amounting to $2,388,811 in purchases $25,406,781 in sales, resulting in a net realized loss of $3,378,163. The net realized loss is included within the “Net Realized Gain/(Loss) on Investments” section of the Fund’s Statement of Operations.
5. Federal Income Tax
The tax components of capital shown in the table below represent: (1) distribution requirements the Fund must satisfy under the income tax regulations; (2) losses or deductions the Fund may be able to offset against income and gains realized in future years; and (3) unrealized appreciation or depreciation of investments for federal income tax purposes.
Other book to tax differences primarily consist of deferred compensation, derivatives, and foreign currency contract adjustments. The Fund has elected to treat gains and losses on forward foreign currency contracts as capital gains and losses, if applicable. Other foreign currency gains and losses on debt instruments are treated as ordinary income for federal income tax purposes pursuant to Section 988 of the Internal Revenue Code.
| | | | | | | |
| | | | Other Book | Net Tax | |
Undistributed
Ordinary Income | Undistributed
Long-Term Gains | Accumulated
Capital Losses | Loss Deferrals | to Tax
Differences | Appreciation/
(Depreciation) | |
$ - | $ - | $(332,867,211) | $ (597,025) | $ (80,811) | $(195,478,448) | |
The Fund has elected to defer qualified late-year losses. These losses will be deferred for tax purposes and recognized during the next fiscal year.
Accumulated capital losses noted below represent net capital loss carryovers, as of June 30, 2023, that may be available to offset future realized capital gains and thereby reduce future taxable gains distributions. The following table shows these capital loss carryovers.
Janus Henderson Multi-Sector Income Fund
Notes to Financial Statements
| | | | | | |
Capital Loss Carryover Schedule | | |
For the year ended June 30, 2023 | | |
| No Expiration | | | |
| Short-Term | Long-Term | Accumulated
Capital Losses | | |
| $(186,473,565) | $(146,393,646) | $ (332,867,211) | | |
The aggregate cost of investments and the composition of unrealized appreciation and depreciation of investment securities for federal income tax purposes as of June 30, 2023 are noted below. The primary differences between book and tax appreciation or depreciation of investments are wash sale loss deferrals, investments in partnerships, and investments in passive foreign investment companies.
| | | | |
Federal Tax Cost | Unrealized
Appreciation | Unrealized
(Depreciation) | Net Tax Appreciation/
(Depreciation) |
$ 3,745,781,427 | $19,689,862 | $(215,168,310) | $ (195,478,448) |
Information on the tax components of derivatives as of June 30, 2023 is as follows:
| | | | |
Federal Tax Cost | Unrealized
Appreciation | Unrealized
(Depreciation) | Net Tax Appreciation/
(Depreciation) |
$ (8,373,183) | $ - | $ - | $ - |
Tax cost of investments and unrealized appreciation/(depreciation) may also include timing differences that do not constitute adjustments to tax basis.
Income and capital gains distributions are determined in accordance with income tax regulations that may differ from US GAAP. These differences are due to differing treatments for items such as net short-term gains, deferral of wash sale losses, foreign currency transactions, and capital loss carryovers. Certain permanent differences such as tax returns of capital and net investment losses noted below have been reclassified to capital.
| | | | | |
For the year ended June 30, 2023 | |
Distributions | | |
From Ordinary Income | From Long-Term Capital Gains | Tax Return of Capital | Net Investment Loss | |
$ 166,059,139 | $ - | $ 2,659,042 | $ - | |
| | | | | |
For the year ended June 30, 2022 | |
Distributions | | |
From Ordinary Income | From Long-Term Capital Gains | Tax Return of Capital | Net Investment Loss | |
$ 133,372,182 | $ 6,289,592 | $ 1,604,624 | $ - | |
Permanent book to tax basis differences may result in reclassifications between the components of net assets. These differences have no impact on the results of operations or net assets.
Janus Henderson Multi-Sector Income Fund
Notes to Financial Statements
6. Capital Share Transactions
| | | | | | | |
| | | | | | |
| | Year ended June 30, 2023 | | Year ended June 30, 2022 |
| | Shares | Amount | | Shares | Amount |
| | | | | | | |
Class A Shares: | | | | | |
Shares sold | 1,597,155 | $ 13,653,908 | | 3,512,155 | $ 34,685,238 |
Reinvested dividends and distributions | 277,849 | 2,354,715 | | 259,890 | 2,514,847 |
Shares repurchased | (3,504,055) | (29,719,910) | | (4,721,195) | (45,843,873) |
Net Increase/(Decrease) | (1,629,051) | $ (13,711,287) | | (949,150) | $ (8,643,788) |
Class C Shares: | | | | | |
Shares sold | 890,839 | $ 7,555,783 | | 2,219,963 | $ 21,892,520 |
Reinvested dividends and distributions | 344,568 | 2,919,683 | | 246,899 | 2,381,260 |
Shares repurchased | (1,831,842) | (15,555,547) | | (2,339,517) | (22,264,130) |
Net Increase/(Decrease) | (596,435) | $ (5,080,081) | | 127,345 | $ 2,009,650 |
Class D Shares: | | | | | |
Shares sold | 1,536,322 | $ 13,099,257 | | 3,410,009 | $ 33,432,311 |
Reinvested dividends and distributions | 565,428 | 4,792,347 | | 426,998 | 4,125,281 |
Shares repurchased | (2,384,484) | (20,194,892) | | (4,096,910) | (39,732,790) |
Net Increase/(Decrease) | (282,734) | $ (2,303,288) | | (259,903) | $ (2,175,198) |
Class I Shares: | | | | | |
Shares sold | 153,087,255 | $1,298,871,566 | | 149,981,113 | $1,463,410,864 |
Reinvested dividends and distributions | 16,912,083 | 143,268,553 | | 11,822,831 | 113,937,965 |
Shares repurchased | (156,597,238) | (1,330,801,377) | | (126,898,055) | (1,210,386,954) |
Net Increase/(Decrease) | 13,402,100 | $ 111,338,742 | | 34,905,889 | $ 366,961,875 |
Class N Shares: | | | | | |
Shares sold | 3,681,449 | $ 31,124,939 | | 4,626,991 | $ 44,871,422 |
Reinvested dividends and distributions | 456,474 | 3,865,951 | | 393,069 | 3,835,550 |
Shares repurchased | (3,191,730) | (27,144,827) | | (9,276,670) | (90,704,980) |
Net Increase/(Decrease) | 946,193 | $ 7,846,063 | | (4,256,610) | $ (41,998,008) |
Class S Shares: | | | | | |
Shares sold | 164,764 | $ 1,400,868 | | 79,987 | $ 756,904 |
Reinvested dividends and distributions | 9,470 | 80,162 | | 3,575 | 34,068 |
Shares repurchased | (71,246) | (613,599) | | (19,572) | (185,388) |
Net Increase/(Decrease) | 102,988 | $ 867,431 | | 63,990 | $ 605,584 |
Class T Shares: | | | | | |
Shares sold | 4,138,666 | $ 35,370,261 | | 7,538,261 | $ 73,701,449 |
Reinvested dividends and distributions | 829,823 | 7,036,060 | | 847,371 | 8,196,736 |
Shares repurchased | (11,930,238) | (100,801,170) | | (12,885,155) | (124,983,677) |
Net Increase/(Decrease) | (6,961,749) | $ (58,394,849) | | (4,499,523) | $ (43,085,492) |
7. Purchases and Sales of Investment Securities
For the year ended June 30, 2023, the aggregate cost of purchases and proceeds from sales of investment securities (excluding any short-term securities, short-term options contracts, TBAs, and in-kind transactions, as applicable) was as follows:
| | | | |
Purchases of
Securities | Proceeds from Sales
of Securities | Purchases of Long-
Term U.S. Government
Obligations | Proceeds from Sales
of Long-Term U.S.
Government Obligations |
$1,690,462,357 | $1,828,211,597 | $ - | $ - |
8. Recent Accounting Pronouncements
The FASB issued Accounting Standards Update 2020-04 Reference Rate Reform: Facilitation of the Effects of Reference Rate Reform on Financial Reporting (“ASU 2020-04”) in March 2020. The new guidance in the ASU
Janus Henderson Multi-Sector Income Fund
Notes to Financial Statements
provides optional temporary financial reporting relief from the effect of certain types of contract modifications due to the planned discontinuation of the LIBOR or other interbank-offered based reference rates as of the end of 2021. For new and existing contracts, Funds may elect to apply the guidance as of March 12, 2020 through December 31, 2022. FASB has deferred the sunset date to December 31, 2024. Management is currently evaluating the impact, if any, of the ASU’s adoption to the Fund’s financial statements.
9. Subsequent Event
Management has evaluated whether any events or transactions occurred subsequent to June 30, 2023 and through the date of issuance of the Fund’s financial statements and determined that there were no material events or transactions that would require recognition or disclosure in the Fund’s financial statements.
Janus Henderson Multi-Sector Income Fund
Report of Independent Registered Public Accounting Firm
To the Board of Trustees of Janus Investment Fund and Shareholders of Janus Henderson Multi-Sector Income Fund
Opinion on the Financial Statements
We have audited the accompanying statement of assets and liabilities, including the schedule of investments, of Janus Henderson Multi-Sector Income Fund (one of the funds constituting Janus Investment Fund, referred to hereafter as the "Fund") as of June 30, 2023, the related statement of operations for the year ended June 30, 2023, the statements of changes in net assets for each of the two years in the period ended June 30, 2023, including the related notes, and the financial highlights for each of the five years in the period ended June 30, 2023 (collectively referred to as the “financial statements”). In our opinion, the financial statements present fairly, in all material respects, the financial position of the Fund as of June 30, 2023, the results of its operations for the year then ended, the changes in its net assets for each of the two years in the period ended June 30, 2023 and the financial highlights for each of the five years in the period ended June 30, 2023 in conformity with accounting principles generally accepted in the United States of America.
Basis for Opinion
These financial statements are the responsibility of the Fund’s management. Our responsibility is to express an opinion on the Fund’s financial statements based on our audits. We are a public accounting firm registered with the Public Company Accounting Oversight Board (United States) (PCAOB) and are required to be independent with respect to the Fund in accordance with the U.S. federal securities laws and the applicable rules and regulations of the Securities and Exchange Commission and the PCAOB.
We conducted our audits of these financial statements in accordance with the standards of the PCAOB. Those standards require that we plan and perform the audit to obtain reasonable assurance about whether the financial statements are free of material misstatement, whether due to error or fraud.
Our audits included performing procedures to assess the risks of material misstatement of the financial statements, whether due to error or fraud, and performing procedures that respond to those risks. Such procedures included examining, on a test basis, evidence regarding the amounts and disclosures in the financial statements. Our audits also included evaluating the accounting principles used and significant estimates made by management, as well as evaluating the overall presentation of the financial statements. Our procedures included confirmation of securities owned as of June 30, 2023 by correspondence with the custodian, transfer agent and brokers; when replies were not received from brokers, we performed other auditing procedures. We believe that our audits provide a reasonable basis for our opinion.

Denver, Colorado
August 21, 2023
We have served as the auditor of one or more investment companies in Janus Henderson Funds since 1990.
Janus Henderson Multi-Sector Income Fund
Additional Information (unaudited)
Proxy Voting Policies and Voting Record
A description of the policies and procedures that the Fund uses to determine how to vote proxies relating to its portfolio securities is available without charge: (i) upon request, by calling 1-800-525-1093; (ii) on the Fund’s website at janushenderson.com/proxyvoting; and (iii) on the SEC’s website at http://www.sec.gov. Additionally, information regarding the Fund’s proxy voting record for the most recent twelve-month period ended June 30 is also available, free of charge, through janushenderson.com/proxyvoting and from the SEC’s website at http://www.sec.gov.
Full Holdings
The Fund files its complete portfolio holdings (schedule of investments) with the SEC as an exhibit to Form N-PORT within 60 days of the end of the first and third fiscal quarters, and in the annual report and semiannual report to shareholders. The Fund’s Form N-PORT filings and annual and semiannual reports: (i) are available on the SEC’s website at http://www.sec.gov; and (ii) are available without charge, upon request, by calling a Janus Henderson representative at 1-877-335-2687 (toll free) (or 1-800-525-3713 if you hold Class D shares). Portfolio holdings consisting of at least the names of the holdings are generally available on a monthly basis with a 30-day lag under Full Holdings for the Fund at janushenderson.com/info (or janushenderson.com/reports if you hold Class D Shares).
APPROVAL OF ADVISORY AGREEMENTS DURING THE PERIOD
The Trustees of Janus Aspen Series, each of whom serves as an “independent” Trustee (the “Trustees”), oversee the management of each portfolio of Janus Aspen Series (each, a “VIT Portfolio,” and collectively, the “VIT Portfolios”), as well as each fund of Janus Investment Fund (each, a “Fund,” and collectively, the “Funds” and together with the VIT Portfolios, the “Janus Henderson Funds,” and each, a “Janus Henderson Fund”). As required by law, the Trustees determine annually whether to continue the investment advisory agreement for each Janus Henderson Fund.
In connection with their most recent consideration of those agreements for each Janus Henderson Fund, the Trustees received and reviewed information provided by Janus Henderson Investors US LLC (the “Adviser”) in response to requests of the Trustees and their independent legal counsel. They also received and reviewed information and analysis provided by, and in response to requests of, their independent fee consultant. Throughout their consideration of the agreements, the Trustees were advised by their independent legal counsel. The Trustees met with management to consider the agreements, and also met separately in executive session with their independent legal counsel and their independent fee consultant.
At meetings held on November 9-10, 2022 and December 13-14, 2022, the Trustees evaluated the information provided by the Adviser and the independent fee consultant, as well as other information provided by the Adviser and the independent fee consultant during the year. Following such evaluation, the Trustees determined that the overall arrangements between each Janus Henderson Fund and the Adviser were fair and reasonable in light of the nature, extent, and quality of the services provided by the Adviser and its affiliates, the fees charged for those services, and other matters that the Trustees considered relevant in the exercise of their business judgment, and unanimously approved the continuation of the investment advisory agreement for each Janus Henderson Fund for the period from February 1, 2023 through February 1, 2024, subject to earlier termination as provided for in each agreement.
In considering the continuation of those agreements, the Trustees reviewed and analyzed various factors that they determined were relevant, including the factors described below, none of which by itself was considered dispositive. However, the material factors and conclusions that formed the basis for the Trustees’ determination to approve the continuation of the agreements are discussed separately below. Also included is a summary of the independent fee consultant’s conclusions and opinions that arose during, and were included as part of, the Trustees’ consideration of the agreements. “Management fees,” as used herein, reflect actual annual advisory fees and, for the purpose of peer comparisons any administration fees (excluding out of pocket costs), net of any waivers, paid by a fund as a percentage of average net assets.
Nature, Extent and Quality of Services
The Trustees reviewed the nature, extent, and quality of the services provided by the Adviser to the Janus Henderson Funds, taking into account the investment objective, strategies, and policies of each Janus Henderson Fund, and the knowledge the Trustees gained from their regular meetings with management on at least a quarterly basis and their ongoing review of information related to the Janus Henderson Funds. In addition, the Trustees reviewed the resources and key personnel of the Adviser, particularly noting those employees who provide investment and risk management services to the Janus Henderson Funds. The Trustees also considered other services provided to the Janus Henderson
Janus Henderson Multi-Sector Income Fund
Additional Information (unaudited)
Funds by the Adviser, such as managing the execution of portfolio transactions and the selection of broker-dealers for those transactions. The Trustees considered the Adviser’s role as administrator to the Janus Henderson Funds, noting that the Adviser generally does not receive a fee for its services as administrator, but is reimbursed for its out-of-pocket costs. The Trustees considered the role of the Adviser in monitoring adherence to the Janus Henderson Funds’ investment restrictions, providing support services for the Trustees and Trustee committees, and overseeing communications with Janus Henderson Fund shareholders and the activities of other service providers, including monitoring compliance with various policies and procedures of the Janus Henderson Funds and with applicable securities laws and regulations.
In this regard, the independent fee consultant noted that the Adviser provides a number of different services for the Janus Henderson Funds and their shareholders, ranging from investment management services to various other servicing functions, and that, in its view, the Adviser is a capable provider of those services. The independent fee consultant also provided its belief that the Adviser has developed a number of institutional competitive advantages that should enable it to provide superior investment and service performance over the long term.
The Trustees concluded that the nature, extent, and quality of the services provided by the Adviser to each Janus Henderson Fund were appropriate and consistent with the terms of the respective advisory agreements, and that, taking into account steps taken to address those Janus Henderson Funds whose performance lagged that of their peers for certain periods, the Janus Henderson Funds were likely to benefit from the continued provision of those services. They also concluded that the Adviser had sufficient personnel, with the appropriate education and experience, to serve the Janus Henderson Funds effectively and had demonstrated its ability to attract well-qualified personnel.
Performance of the Funds
The Trustees considered the performance results of each Janus Henderson Fund over various time periods. They noted that they considered Janus Henderson Fund performance data throughout the year, including periodic meetings with each Janus Henderson Fund’s portfolio manager(s), and also reviewed information comparing each Janus Henderson Fund’s performance with the performance of comparable fund peer groups identified by Broadridge Financial Solutions, Inc. (“Broadridge”), an independent data provider, and with the Janus Henderson Fund’s benchmark index. In this regard, the independent fee consultant found that the overall Janus Henderson Funds’ performance has been reasonable, noting that: (i) for the 36 months ended May 31, 2022, approximately 38% of the Janus Henderson Funds were in the top two quartiles of their Broadridge peer groups; (ii) for the 36 months ended September 30, 2022, approximately 45% of the Janus Henderson Funds were in the top two quartiles of performance as reported by Morningstar, and (iii) for the 12 months ended September 30, 2022, approximately 55% of the Janus Henderson Funds were in the top two quartiles of performance as reported by Morningstar.
The Trustees considered the performance of each Janus Henderson Fund, noting that performance may vary by share class, and noted the following with respect to the Funds:
Asset Allocation Funds
· For Janus Henderson Global Allocation Fund – Conservative, the Trustees noted that the Fund’s performance was in the third Broadridge quartile for the 36 months ended May 31, 2022 and the bottom Broadridge quartile for the 12 months ended May 31, 2022. The Trustees noted the reasons for the Fund’s underperformance and the steps the Adviser had taken or was taking to improve performance.
· For Janus Henderson Global Allocation Fund – Growth, the Trustees noted that the Fund’s performance was in the bottom Broadridge quartile for the 36 months ended May 31, 2022 and the bottom Broadridge quartile for the 12 months ended May 31, 2022. The Trustees noted the reasons for the Fund’s underperformance and the steps the Adviser had taken or was taking to improve performance.
· For Janus Henderson Global Allocation Fund – Moderate, the Trustees noted that the Fund’s performance was in the bottom Broadridge quartile for the 36 months ended May 31, 2022 and the bottom Broadridge quartile for the 12 months ended May 31, 2022. The Trustees noted the reasons for the Fund’s underperformance and the steps the Adviser had taken or was taking to improve performance.
Fixed-Income Funds
· For Janus Henderson Absolute Return Income Opportunities Fund, the Trustees noted that the Fund’s performance was in the third Broadridge quartile for the 36 months ended May 31, 2022 and the first Broadridge
Janus Henderson Multi-Sector Income Fund
Additional Information (unaudited)
quartile for the 12 months ended May 31, 2022. The Trustees noted the reasons for the Fund’s underperformance, the steps the Adviser had taken or was taking to improve performance, and that the performance trend was improving.
· For Janus Developed World Bond Fund, the Trustees noted that the Fund’s performance was in the bottom Broadridge quartile for the 36 months ended May 31, 2022 and the bottom Broadridge quartile for the 12 months ended May 31, 2022. The Trustees noted the reasons for the Fund’s underperformance and the steps the Adviser had taken or was taking to improve performance.
· For Janus Henderson Flexible Bond Fund, the Trustees noted that the Fund’s performance was in the first Broadridge quartile for the 36 months ended May 31, 2022 and the second Broadridge quartile for the 12 months ended May 31, 2022.
· For Janus Henderson Global Bond Fund, the Trustees noted that the Fund’s performance was in the third Broadridge quartile for the 36 months ended May 31, 2022 and the bottom Broadridge quartile for the 12 months ended May 31, 2022. The Trustees noted the reasons for the Fund’s underperformance and the steps the Adviser had taken or was taking to improve performance.
· For Janus Henderson High-Yield Fund, the Trustees noted that the Fund’s performance was in the third Broadridge quartile for the 36 months ended May 31, 2022 and the bottom Broadridge quartile for the 12 months ended May 31, 2022. The Trustees noted the reasons for the Fund’s underperformance and the steps the Adviser had taken or was taking to improve performance.
· For Janus Henderson Multi-Sector Income Fund, the Trustees noted that the Fund’s performance was in the second Broadridge quartile for the 36 months ended May 31, 2022 and the third Broadridge quartile for the 12 months ended May 31, 2022.
· For Janus Henderson Short Duration Flexible Bond Fund, the Trustees noted that the Fund’s performance was in the third Broadridge quartile for the 36 months ended May 31, 2022 and the bottom Broadridge quartile for the 12 months ended May 31, 2022. The Trustees noted the reasons for the Fund’s underperformance and the steps the Adviser had taken or was taking to improve performance.
Global and International Equity Funds
· For Janus Henderson Asia Equity Fund, the Trustees noted that the Fund’s performance was in the third Broadridge quartile for the 36 months ended May 31, 2022 and the third Broadridge quartile for the 12 months ended May 31, 2022. The Trustees noted the reasons for the Fund’s underperformance, while also noting that the Fund has a performance fee structure that results in lower management fees during periods of underperformance, and the steps the Adviser had taken or was taking to improve performance.
· For Janus Henderson Emerging Markets Fund, the Trustees noted that the Fund’s performance was in the third Broadridge quartile for the 36 months ended May 31, 2022 and the third Broadridge quartile for the 12 months ended May 31, 2022. The Trustees noted the reasons for the Fund’s underperformance and the steps the Adviser had taken or was taking to improve performance.
· For Janus Henderson European Focus Fund, the Trustees noted that the Fund’s performance was in the first Broadridge quartile for the 36 months ended May 31, 2022 and the second Broadridge quartile for the 12 months ended May 31, 2022.
· For Janus Henderson Global Equity Income Fund, the Trustees noted that the Fund’s performance was in the third Broadridge quartile for the 36 months ended May 31, 2022 and the first Broadridge quartile for the 12 months ended May 31, 2022. The Trustees noted the reasons for the Fund’s underperformance, the steps the Adviser had taken or was taking to improve performance, and that the performance trend was improving.
· For Janus Henderson Global Life Sciences Fund, the Trustees noted that the Fund’s performance was in the third Broadridge quartile for the 36 months ended May 31, 2022 and the second Broadridge quartile for the 12 months ended May 31, 2022. The Trustees noted the reasons for the Fund’s underperformance, the steps the Adviser had taken or was taking to improve performance, and that the performance trend was improving.
Janus Henderson Multi-Sector Income Fund
Additional Information (unaudited)
· For Janus Henderson Global Sustainable Equity Fund, the Trustees noted that the Fund’s performance was in the second Broadridge quartile for the 12 months ended May 31, 2022. The Trustees noted that 36 month-end performance was not yet available.
· For Janus Henderson Global Real Estate Fund, the Trustees noted that the Fund’s performance was in the second Broadridge quartile for the 36 months ended May 31, 2022 and the bottom Broadridge quartile for the 12 months ended May 31, 2022.
· For Janus Henderson Global Research Fund, the Trustees noted that the Fund’s performance was in the second Broadridge quartile for the 36 months ended May 31, 2022 and the first Broadridge quartile for the 12 months ended May 31, 2022.
· For Janus Henderson Global Select Fund, the Trustees noted that the Fund’s performance was in the first Broadridge quartile for the 36 months ended May 31, 2022 and the first Broadridge quartile for the 12 months ended May 31, 2022.
· For Janus Henderson Global Technology and Innovation Fund, the Trustees noted that the Fund’s performance was in the second Broadridge quartile for the 36 months ended May 31, 2022 and the second Broadridge quartile for the 12 months ended May 31, 2022.
· For Janus Henderson International Opportunities Fund, the Trustees noted that the Fund’s performance was in the bottom Broadridge quartile for the 36 months ended May 31, 2022 and the third Broadridge quartile for the 12 months ended May 31, 2022. The Trustees noted the reasons for the Fund’s underperformance and the steps the Adviser had taken or was taking to improve performance.
· For Janus Henderson Overseas Fund, the Trustees noted that the Fund’s performance was in the first Broadridge quartile for the 36 months ended May 31, 2022 and the first Broadridge quartile for the 12 months ended May 31, 2022.
· For Janus Henderson Responsible International Dividend Fund (formerly the Janus Henderson Dividend & Income Builder Fund), the Trustees noted that the Fund’s performance was in the bottom Broadridge quartile for the 36 months ended May 31, 2022 and the bottom Broadridge quartile for the 12 months ended May 31, 2022. The Trustees noted the reasons for the Fund’s underperformance and the steps the Adviser had taken or was taking to improve performance.
Money Market Funds
· For Janus Henderson Government Money Market Fund, the Trustees noted that the Fund’s performance was in the third Broadridge quartile for the 36 months ended May 31, 2022 and the bottom Broadridge quartile for the 12 months ended May 31, 2022. The Trustees noted the reasons for the Fund’s underperformance and the steps the Adviser had taken or was taking to improve performance.
· For Janus Henderson Money Market Fund, the Trustees noted that the Fund’s performance was in the third Broadridge quartile for the 36 months ended May 31, 2022 and the bottom Broadridge quartile for the 12 months ended May 31, 2022. The Trustees noted the reasons for the Fund’s underperformance and the steps the Adviser had taken or was taking to improve performance.
Multi-Asset Funds
· For Janus Henderson Adaptive Global Allocation Fund, the Trustees noted that the Fund’s performance was in bottom Broadridge quartile for the 36 months ended May 31, 2022 and the second Broadridge quartile for the 12 months ended May 31, 2022. The Trustees noted the reasons for the Fund’s underperformance, the steps the Adviser had taken or was taking to improve performance, and that the performance trend was improving.
· For Janus Henderson Balanced Fund, the Trustees noted that the Fund’s performance was in the first Broadridge quartile for the 36 months ended May 31, 2022 and the first Broadridge quartile for the 12 months ended May 31, 2022.
Janus Henderson Multi-Sector Income Fund
Additional Information (unaudited)
U.S. Equity Funds
· For Janus Henderson Adaptive Risk Managed U.S. Equity Fund, the Trustees noted that the Fund’s performance was in the bottom Broadridge quartile for the 36 months ended May 31, 2022 and the second Broadridge quartile for the 12 months ended May 31, 2022. The Trustees noted the reasons for the Fund’s underperformance, the steps the Adviser had taken or were taking to improve performance, and that the performance trend was improving.
· For Janus Henderson Contrarian Fund, the Trustees noted that the Fund’s performance was in the first Broadridge quartile for the 36 months ended May 31, 2022 and the bottom Broadridge quartile for the 12 months ended May 31, 2022.
· For Janus Henderson Enterprise Fund, the Trustees noted that the Fund’s performance was in the second Broadridge quartile for the 36 months ended May 31, 2022 and the first Broadridge quartile for the 12 months ended May 31, 2022.
· For Janus Henderson Forty Fund, the Trustees noted that the Fund’s performance was in the third Broadridge quartile for the 36 months ended May 31, 2022 and the bottom Broadridge quartile for the 12 months ended May 31, 2022. The Trustees noted the reasons for the Fund’s underperformance and the steps the Adviser had taken or was taking to improve performance.
· For Janus Henderson Growth and Income Fund, the Trustees noted that the Fund’s performance was in the bottom Broadridge quartile for the 36 months ended May 31, 2022 and the first Broadridge quartile for the 12 months ended May 31, 2022. The Trustees noted the reasons for the Fund’s underperformance, the steps the Adviser had taken or was taking to improve performance, and that the performance trend was improving.
· For Janus Henderson Mid Cap Value Fund, the Trustees noted that the Fund’s performance was in the bottom Broadridge quartile for the 36 months ended May 31, 2022 and the second Broadridge quartile for the 12 months ended May 31, 2022. The Trustees noted the reasons for the Fund’s underperformance, while also noting that the Fund has a performance fee structure that results in lower management fees during periods of underperformance, the steps the Adviser had taken or was taking to improve performance, and that the performance trend was improving.
· For Janus Henderson Research Fund, the Trustees noted that the Fund’s performance was in the third Broadridge quartile for the 36 months ended May 31, 2022 and the third Broadridge quartile for the 12 months ended May 31, 2022. The Trustees noted the reasons for the Fund’s underperformance, while also noting that the Fund has a performance fee structure that results in lower management fees during periods of underperformance and the steps the Adviser had taken or was taking to improve performance.
· For Janus Henderson Small Cap Value Fund, the Trustees noted that the Fund’s performance was in the bottom Broadridge quartile for the 36 months ended May 31, 2022 and the second Broadridge quartile for the 12 months ended May 31, 2022. The Trustees noted the reasons for the Fund’s underperformance, while also noting that the Fund has a performance fee structure that results in lower management fees during periods of underperformance, the steps the Adviser had taken or was taking to improve performance, and that the performance trend was improving.
· For Janus Henderson Small-Mid Cap Value Fund, the Trustees noted that the Fund’s performance was in the bottom Broadridge quartile for the 36 months ended May 31, 2022 and the second Broadridge quartile for the 12 months ended May 31, 2022. The Trustees noted the reasons for the Fund’s underperformance, while also noting that the Fund has a performance fee structure that results in lower management fees during periods of underperformance, the steps the Adviser had taken or was taking to improve performance, and that the performance trend is improving.
· For Janus Henderson Triton Fund, the Trustees noted that the Fund’s performance was in the bottom Broadridge quartile for the 36 months ended May 31, 2022 and the second Broadridge quartile for the 12 months ended May 31, 2022. The Trustees noted the reasons for the Fund’s underperformance, the steps the Adviser had taken or was taking to improve performance, and that the performance trend was improving.
· For Janus Henderson Venture Fund, the Trustees noted that the Fund’s performance was in the bottom Broadridge quartile for the 36 months ended May 31, 2022 and the second Broadridge quartile for the 12 months ended May
Janus Henderson Multi-Sector Income Fund
Additional Information (unaudited)
31, 2022. The Trustees noted the reasons for the Fund’s underperformance, the steps the Adviser had taken or was taking to improve performance, and that the performance trend was improving.
In consideration of each Janus Henderson Fund’s performance, the Trustees concluded that, taking into account the factors relevant to performance, as well as other considerations, including steps taken to improve performance, as applicable, the Janus Henderson Fund’s performance warranted continuation of such Janus Henderson Fund’s investment advisory agreement.
Costs of Services Provided
The Trustees examined information regarding the fees and expenses of each Janus Henderson Fund in comparison to similar information for other comparable funds as provided by Broadridge, an independent data provider. They also reviewed an analysis of that information provided by their independent fee consultant. The independent fee consultant provided its belief that the management fees charged by the Adviser to each of the Janus Henderson Funds under the current investment advisory and administration agreements are reasonable in relation to the services provided by the Adviser. The independent fee consultant found: (1) the total expenses and management fees of the Janus Henderson Funds to be reasonable relative to other comparable mutual funds; (2) the total expenses, on average, were 6% under the average total expenses of the respective Broadridge peer group; and (3) the management fees for the Janus Henderson Funds, on average, were 5% under the average management fees for the respective Broadridge peer group. The Trustees also considered the total expenses for each share class of each Janus Henderson Fund compared to the average total expenses for its Broadridge Expense Group and to average total expenses for its Broadridge Expense Universe.
For Janus Henderson Funds with three or more years of performance history, the independent fee consultant also performed a systematic “focus list” analysis of expenses which assessed fund fees in the context of fund performance being delivered. Based on this analysis, the independent fee consultant found that the combination of service quality/performance and expenses on these individual Janus Henderson Funds was reasonable in light of performance trends, performance histories, changes in portfolio management, relative average net asset levels, and the existence of performance fees, breakpoints, and/or expense waivers on such Janus Henderson Funds.
The Trustees considered the methodology used by the Adviser in determining compensation payable to portfolio managers, the competitive environment for investment management talent, and the competitive market for mutual funds in different distribution channels.
The Trustees also reviewed management fees charged by the Adviser to comparable separate account clients and to comparable non-affiliated funds subadvised by the Adviser (for which the Adviser provides only or primarily portfolio management services). Although in most instances subadvisory and separate account fee rates for various investment strategies were lower than management fee rates for Janus Henderson Funds having a similar strategy, the Trustees considered that the Adviser noted that, under the terms of the management agreements with the Janus Henderson Funds, the Adviser performs significant additional services for the Janus Henderson Funds that it does not provide to those other clients, including administration services, oversight of the Janus Henderson Funds’ other service providers, Trustee support, regulatory compliance and numerous other services, and that, in serving the Janus Henderson Funds, the Adviser assumes many legal risks and other costs that it does not assume in servicing its other clients. Moreover, the Trustees noted that the independent fee consultant found that: (1) the management fees the Adviser charges to the Janus Henderson Funds are reasonable in relation to the management fees the Adviser charges to funds subadvised by the Adviser and to the fees the Adviser charges to its institutional separate account clients; (2) these subadvised and institutional separate accounts have different service and infrastructure needs and operate in markets very different from the retail fund market; (3) Janus Henderson mutual fund investors enjoy reasonable fees relative to the fees charged in these other markets; and (4) as part of its 2022 review, 9 of 11 Janus Henderson Funds have lower management fees than similar funds subadvised by the Adviser. The Trustees noted that for the two Janus Henderson Funds that did not, management fees for each were under the average of its 15(c) peer group.
The Trustees considered the fees for each Janus Henderson Fund for its fiscal year ended in 2021 and noted the following with regard to each Janus Henderson Fund’s total expenses, net of applicable fee waivers (the Fund’s “total expenses”) as reflected in the comparative information provided by Broadridge:
Janus Henderson Multi-Sector Income Fund
Additional Information (unaudited)
Asset Allocation Funds
· For Janus Henderson Global Allocation Fund – Conservative, the Trustees noted that, although the Fund’s total expenses exceeded the peer group average for certain share classes, overall the Fund’s total expenses were reasonable. The Trustees also noted that the Adviser has contractually agreed to limit the Fund’s expenses.
· For Janus Henderson Global Allocation Fund – Growth, the Trustees noted that, although the Fund’s total expenses exceeded the peer group average for certain share classes, overall the Fund’s total expenses were reasonable. The Trustees also noted that the Adviser has contractually agreed to limit the Fund’s expenses, although this limit did not apply because the Fund’s total expenses as shown were below the applicable fee limit.
· For Janus Henderson Global Allocation Fund – Moderate, the Trustees noted that, although the Fund’s total expenses exceeded the peer group average for one share class, overall the Fund’s total expenses were reasonable. The Trustees also noted that the Adviser has contractually agreed to limit the Fund’s expenses.
Fixed-Income Funds
· For Janus Henderson Absolute Return Income Opportunities Fund, the Trustees noted that, although the Fund’s total expenses exceeded the peer group average for certain share classes, overall the Fund’s total expenses were reasonable. The Trustees also noted that the Adviser has contractually agreed to limit the Fund’s expenses.
· For Janus Henderson Developed World Bond Fund, the Trustees noted that, although the Fund’s total expenses exceeded the peer group average for one share class, overall the Fund’s total expenses were reasonable. The Trustees also noted that the Adviser has contractually agreed to limit the Fund’s expenses.
· For Janus Henderson Flexible Bond Fund, the Trustees noted that, although the Fund’s total expenses exceeded the peer group average for certain share classes, overall the Fund’s total expenses were reasonable. The Trustees also noted that the Adviser has contractually agreed to limit the Fund’s expenses, although this limit did not apply because the Fund’s total expenses as shown were below the applicable fee limit.
· For Janus Henderson Global Bond Fund, the Trustees noted that, although the Fund’s total expenses exceeded the peer group average for certain share classes, overall the Fund’s total expenses were reasonable. The Trustees also noted that the Adviser has contractually agreed to limit the Fund’s expenses.
· For Janus Henderson High-Yield Fund, the Trustees noted that, although the Fund’s total expenses exceeded the peer group average for certain share classes, overall the Fund’s total expenses were reasonable. The Trustees also noted that the Adviser has contractually agreed to limit the Fund’s expenses.
· For Janus Henderson Multi-Sector Income Fund, the Trustees noted that, although the Fund’s total expenses exceeded the peer group average for certain share classes, overall the Fund’s total expenses were reasonable. The Trustees also noted that the Adviser has contractually agreed to limit the Fund’s expenses.
· For Janus Henderson Short Duration Flexible Bond Fund, the Trustees noted that, although the Fund’s total expenses exceeded the peer group average for certain share classes, overall the Fund’s total expenses were reasonable. The Trustees also noted that the Adviser has contractually agreed to limit the Fund’s expenses.
Global and International Equity Funds
· For Janus Henderson Asia Equity Fund, the Trustees noted that, although the Fund’s total expenses exceeded the peer group average for certain share classes, overall the Fund’s total expenses were reasonable. The Trustees also noted that the Adviser has contractually agreed to limit the Fund’s expenses.
· For Janus Henderson Emerging Markets Fund, the Trustees noted that, although the Fund’s total expenses exceeded the peer group average for certain share classes, overall the Fund’s total expenses were reasonable. The Trustees also noted that the Adviser has contractually agreed to limit the Fund’s expenses.
· For Janus Henderson European Focus Fund, the Trustees noted that, although the Fund’s total expenses exceeded the peer group average for one share class, overall the Fund’s expenses were reasonable. The Trustees also noted that the Adviser has contractually agreed to limit the Fund’s expenses.
· For Janus Henderson Global Equity Income Fund, the Trustees noted that, although the Fund’s total expenses exceeded the peer group average for one share class, overall the Fund’s total expenses were reasonable. The
Janus Henderson Multi-Sector Income Fund
Additional Information (unaudited)
Trustees also noted that the Adviser has contractually agreed to limit the Fund’s expenses, although this limit did not apply because the Fund’s total expenses as shown were below the applicable fee limit.
· For Janus Henderson Global Life Sciences Fund, the Trustees noted that the Fund’s total expenses were below the peer group average for all share classes.
· For Janus Henderson Global Real Estate Fund, the Trustees noted that, although the Fund’s total expenses exceeded the peer group average for certain share classes, overall the Fund’s total expenses were reasonable. The Trustees also noted that the Adviser has contractually agreed to limit the Fund’s expenses, although this limit did not apply because the Fund’s total expenses as shown were below the applicable fee limit.
· For Janus Henderson Global Research Fund, the Trustees noted that, although the Fund’s total expenses exceeded the peer group average for one share class, overall the Fund’s total expenses were reasonable. The Trustees also noted that the Adviser has contractually agreed to limit the Fund’s expenses, although this limit did not apply because the Fund’s total expenses as shown were below the applicable fee limit.
· For Janus Henderson Global Select Fund, the Trustees noted that, although the Fund’s total expenses exceeded the peer group average for certain share classes, overall the Fund’s total expenses were reasonable. The Trustees also noted that the Adviser has contractually agreed to limit the Fund’s expenses.
· For Janus Henderson Global Sustainable Equity Fund, the Trustees noted that, although the Fund’s total expenses exceeded the peer group average for certain share classes, overall the Fund’s expenses were reasonable. The Trustees also noted that the Adviser has contractually agreed to limit the Fund’s expenses.
· For Janus Henderson Global Technology and Innovation Fund, the Trustees noted that the Fund’s total expenses were below the peer group average for all share classes.
· For Janus Henderson International Opportunities Fund, the Trustees noted that, although the Fund’s total expenses exceeded the peer group average for certain share classes, overall the Fund’s expenses were reasonable. The Trustees also noted that the Adviser has contractually agreed to limit the Fund’s expenses.
· For Janus Henderson Overseas Fund, the Trustees noted that although the Fund’s total expenses exceeded the peer group average for certain share classes, overall the Fund’s total expenses were reasonable. The Trustees also noted that the Adviser has contractually agreed to limit the Fund’s expenses, although this limit did not apply because the Fund’s total expenses as shown were below the applicable fee limit.
· For Janus Henderson Responsible International Dividend Fund (formerly the Janus Henderson Dividend & Income Builder Fund), the Trustees noted that, although the Fund’s total expenses exceeded the peer group for one share class, overall the Fund’s total expenses were reasonable. The Trustees also noted that the Adviser has contractually agreed to limit the Fund’s expenses.
Money Market Funds
· For Janus Henderson Government Money Market Fund, the Trustees noted that the Fund’s total expenses were below the peer group average for all share classes.
· For Janus Henderson Money Market Fund, the Trustees noted that the Fund’s total expenses were below the peer group average for all share classes.
Multi-Asset Funds
· For Janus Henderson Adaptive Global Allocation Fund, the Trustees noted that the Fund’s total expenses were below the peer group average for all share classes.
· For Janus Henderson Balanced Fund, the Trustees noted that, although the Fund’s total expenses exceeded the peer group average for certain share classes, overall the Fund’s total expenses were reasonable. The Trustees also noted that the Adviser has contractually agreed to limit the Fund’s expenses, although this limit did not apply because the Fund’s total expenses as shown were below the applicable fee limit.
Janus Henderson Multi-Sector Income Fund
Additional Information (unaudited)
U.S. Equity Funds
· For Janus Henderson Adaptive Risk Managed U.S. Equity Fund, the Trustees noted that, although the Fund’s total expenses exceeded the peer group average for certain share classes, overall the Fund’s total expenses were reasonable. The Trustees also noted that the Adviser has contractually agreed to limit the Fund’s expenses, although this limit did not apply because the Fund’s total expenses as shown were below the applicable fee limit.
· For Janus Henderson Contrarian Fund, the Trustees noted that, although the Fund’s total expenses exceeded the peer group average for all share classes, overall the Fund’s total expenses were reasonable. The Trustees also noted that the Adviser had contractually agreed to limit the Fund’s expenses.
· For Janus Henderson Enterprise Fund, the Trustees noted that, although the Fund’s total expenses exceeded the peer group average for certain share classes, overall the Fund’s total expenses were reasonable. The Trustees also noted that the Adviser has contractually agreed to limit the Fund’s expenses, although this limit did not apply because the Fund’s total expenses as shown were below the applicable fee limit.
· For Janus Henderson Forty Fund, the Trustees noted that, although the Fund’s total expenses exceeded the peer group average for certain share classes, overall the Fund’s total expenses were reasonable. The Trustees also noted that the Adviser has contractually agreed to limit the Fund’s expenses, although this limit did not apply because the Fund’s total expenses as shown were below the applicable fee limit.
· For Janus Henderson Growth and Income Fund, the Trustees noted that, although the Fund’s total expenses exceeded the peer group average for certain share classes, overall the Fund’s total expenses were reasonable. The Trustees also noted that the Adviser has contractually agreed to limit the Fund’s expenses, although this limit did not apply because the Fund’s total expenses as shown were below the applicable fee limit.
· For Janus Henderson Mid Cap Value Fund, the Trustees noted that the Fund’s total expenses were below the peer group average for all share classes.
· For Janus Henderson Research Fund, the Trustees noted that, although the Fund’s total expenses exceeded the peer group average for certain share classes, overall the Fund’s total expenses were reasonable. The Trustees also noted that the Adviser has contractually agreed to limit the Fund’s expenses.
· For Janus Henderson Small Cap Value Fund, the Trustees noted that, although the Fund’s total expenses exceeded the peer group average for one share class, overall the Fund’s total expenses were reasonable. The Trustees also noted that the Adviser has contractually agreed to limit the Fund’s expenses, although this limit did not apply because the Fund’s total expenses as shown were below the applicable fee limit.
· For Janus Henderson Small-Mid Cap Value Fund, the Trustees noted that the Fund’s total expenses were below the peer group average for all share classes.
· For Janus Henderson Triton Fund, the Trustees noted that, although the Fund’s total expenses exceeded the peer group average for one share class, overall the Fund’s total expenses were reasonable. The Trustees also noted that the Adviser has contractually agreed to limit the Fund’s expenses, although this limit did not apply because the Fund’s total expenses as shown were below the applicable fee limit.
· For Janus Henderson Venture Fund, the Trustees noted that although the Fund’s total expenses exceeded the peer group average for one share class, overall the Fund’s total expenses were reasonable. The Trustees also noted that the Adviser has contractually agreed to limit the Fund’s expenses, although this limit did not apply because the Fund’s total expenses as shown were below the applicable fee limit.
The Trustees reviewed information on the overall profitability to the Adviser and its affiliates from their relationships with the Janus Henderson Funds, and considered profitability data of other publicly traded mutual fund advisers. The Trustees recognized that profitability comparisons among fund managers are difficult because of the variation in the type of comparative information that is publicly available, and the profitability of any fund manager is affected by numerous factors, including the organizational structure of the particular fund manager, differences in complex size, difference in product mix, difference in types of business (mutual fund, institutional and other), differences in the types of funds and other accounts it manages, possible other lines of business, the methodology for allocating expenses and the fund manager’s capital structure and cost of capital.
Janus Henderson Multi-Sector Income Fund
Additional Information (unaudited)
Additionally, the Trustees considered the estimated profitability to the Adviser from the investment management services it provided to each Janus Henderson Fund. In their review, the Trustees considered whether the Adviser receive adequate incentives and resources to manage the Janus Henderson Funds effectively. In reviewing profitability, the Trustees noted that the estimated profitability for an individual Janus Henderson Fund is necessarily a product of the allocation methodology utilized by the Adviser to allocate its expenses as part of the estimated profitability calculation. In this regard, the Trustees noted that the independent fee consultant found as part of its 2022 review that (1) the expense allocation methodology and rationales utilized by the Adviser were reasonable and (2) no clear correlation exists between expense allocations and operating margins. The Trustees also considered that the estimated profitability for an individual Janus Henderson Fund was influenced by a number of factors, including not only the allocation methodology selected, but also the presence of fee waivers and expense caps, and whether the Janus Henderson Fund’s investment management agreement contained breakpoints or a performance fee component. The Trustees determined, after taking into account these factors, among others, that the Adviser’s estimated profitability with respect to each Janus Henderson Fund was not unreasonable in relation to the services provided, and that the variation in the range of such estimated profitability among the Janus Henderson Funds was not a material factor in the Board’s approval of the reasonableness of any Janus Henderson Fund’s investment management fees.
The Trustees concluded that the management fees payable by each Janus Henderson Fund to the Adviser were reasonable in relation to the nature, extent, and quality of the services provided, taking into account the fees charged by other advisers for managing comparable mutual funds with similar strategies, the fees the Adviser charges to other clients, and, as applicable, the impact of fund performance on management fees payable by the Janus Henderson Funds. The Trustees also concluded that each Janus Henderson Fund’s total expenses were reasonable, taking into account the size of the Janus Henderson Fund, the quality of services provided by the Adviser, the investment performance of the Janus Henderson Fund, and any expense limitations agreed to or provided by the Adviser.
Economies of Scale
The Trustees considered information about the potential for the Adviser to realize economies of scale as the assets of the Janus Henderson Funds increase. They noted that their independent fee consultant published a report to the Trustees in June 2022 which provided its research and analysis into economies of scale. They also noted that, although many Janus Henderson Funds pay advisory fees at a fixed base rate as a percentage of net assets, without any breakpoints or performance fees, their independent fee consultant concluded that 75% of these Janus Henderson Funds’ have contractual management fees (gross of waivers) below their Broadridge Expense Group averages. The Trustees also noted the following from the independent fee consultant’s report: (1) that 31% of Janus Henderson Funds had management fee breakpoints in place whereby investors pay lower management fees as fund AUM increases; (2) that 29% of Janus Henderson Funds have low flat-rate fees and performance fees where the Adviser is incentivized to invest in resources which drive Janus Henderson Fund performance; and (3) that 39% of Janus Henderson Funds have low flat-rate fees versus peers where investors pay low fixed fees when the Janus Henderson Fund is small/midsized and higher fees when the Janus Henderson Fund grows in assets. The Trustees also noted that the Janus Henderson Funds share directly in economies of scale through the significant investments made by the Adviser and its affiliates related to services provided to the Funds and the lower charges of third-party service providers that are based in part on the combined scale of all of the Janus Henderson Funds.
The Trustees also considered the independent fee consultant’s conclusion that, given the limitations of various analytical approaches to economies of scale and their conflicting results, it is difficult to analytically confirm or deny the existence of economies of scale in the Janus Henderson complex. In this regard, the independent consultant concluded that (1) to the extent there were economies of scale at the Adviser, the Adviser’s general strategy of setting fixed management fees below peers appeared to share any such economies with investors even on smaller Janus Henderson Funds which have not yet achieved those economies and (2) by setting lower fixed fees from the start on these Janus Henderson Funds, the Adviser appeared to be investing to increase the likelihood that these Janus Henderson Funds will grow to a level to achieve any economies of scale that may exist. Further, the independent fee consultant provided its belief that Janus Henderson Fund investors are well-served by the fee levels and performance fee structures in place on the Janus Henderson Funds in light of any economies of scale that may be present at the Adviser.
Based on all of the information reviewed, including the recent and past research and analysis conducted by the Trustees’ independent fee consultant, the Trustees concluded that the current fee structure of each Janus Henderson Fund was reasonable and that the current rates of fees do reflect a sharing between the Adviser and the Janus
Janus Henderson Multi-Sector Income Fund
Additional Information (unaudited)
Henderson Fund of any economies of scale that may be present at the current asset level of the Janus Henderson Fund.
Other Benefits to the Adviser
The Trustees also considered benefits that accrue to the Adviser and its affiliates from their relationships with the Janus Henderson Funds. They recognized that two affiliates of the Adviser separately serve the Janus Henderson Funds as transfer agent and distributor, respectively, and the transfer agent receives compensation directly from the non-money market Janus Henderson Funds for services provided, and that such compensation contributes to the overall profitability of the Adviser and its affiliates that results from their relationship with the Janus Henderson Funds. The Trustees also considered the Adviser’s past and proposed use of commissions paid by the Janus Henderson Funds on portfolio brokerage transactions to obtain proprietary and third-party research products and services benefiting the Janus Henderson Fund and/or other clients of the Adviser and/or the Adviser. The Trustees concluded that the Adviser’s use of these types of client commission arrangements to obtain proprietary and third-party research products and services was consistent with regulatory requirements and guidelines and was likely to benefit each Janus Henderson Fund. The Trustees also concluded that, other than the services provided by the Adviser and its affiliates pursuant to the agreements and the fees to be paid by each Janus Henderson Fund therefor, the Janus Henderson Funds and the Adviser may potentially benefit from their relationship with each other in other ways. They concluded that the Adviser and its affiliates share directly in economies of scale through the lower charges of third-party service providers that are based in part on the combined scale of the Janus Henderson Funds and other clients serviced by the Adviser and its affiliates. They also concluded that the Adviser benefits from the receipt of research products and services acquired through commissions paid on portfolio transactions of the Janus Henderson Funds and that the Janus Henderson Funds benefit from the Adviser’s receipt of those products and services as well as research products and services acquired through commissions paid by other clients of the Adviser. They further concluded that the success of any Janus Henderson Fund could attract other business to the Adviser or other Janus Henderson Funds, and that the success of the Adviser could enhance the Adviser’s ability to serve the Janus Henderson Funds.
Janus Henderson Multi-Sector Income Fund
Liquidity Risk Management Program (unaudited)
Liquidity Risk Management Program
Rule 22e-4 under the Investment Company Act of 1940, as amended (the “Liquidity Rule”), requires open-end funds (but not money market funds) to adopt and implement a written liquidity risk management program (the “LRMP”) that is reasonably designed to assess and manage liquidity risk, which is the risk that a fund could not meet redemption requests without significant dilution of remaining investors’ interest in the fund. The Fund has implemented a LRMP, which incorporates the following elements: (i) assessment, management, and periodic review of liquidity risk; (ii) classification of portfolio holdings; (iii) the establishment and monitoring of a highly liquid investment minimum, as applicable; (iv) a 15% limitation on a Fund’s illiquid investments; (v) redemptions in-kind; and (vi) board oversight.
The Trustees of the Fund (the “Trustees”) have designated Janus Henderson Investors US LLC, the Fund’s investment adviser (the “Adviser”), as the Program Administrator for the LRMP responsible for administering the LRMP and carrying out the specific responsibilities of the LRMP. A working group comprised of various teams within the Adviser’s business is responsible for administering the LRMP and carrying out the specific responsibilities of different aspects of the LRMP (the “Liquidity Risk Working Group”). In assessing each Fund’s liquidity risk, the Liquidity Risk Working Group periodically considers, as relevant, factors including (i) the liquidity of a Fund’s portfolio investments during normal and reasonably foreseeable stressed conditions; (ii) whether a Fund’s investment strategy is appropriate for an open-end fund; (iii) the extent to which a Fund’s strategy involves a relatively concentrated portfolio or large positions in any issuer; (iv) a Fund’s use of borrowing for investment purposes; and (v) a Fund’s use of derivatives.
The Liquidity Rule requires the Trustees to review at least annually a written report provided by the Program Administrator that addresses the operation of the LRMP and assesses its adequacy and the effectiveness of its implementation, including, if applicable, the operation of the highly liquid investment minimum, and any material changes to the LRMP (the “Program Administrator Report”). At a meeting held on March 15, 2023, the Adviser provided the Program Administrator Report to the Trustees which covered the operation of the LRMP from January 1, 2022 through December 31, 2022 (the “Reporting Period”).
The Program Administrator Report discussed the operation and effectiveness of the LRMP during the Reporting Period. Among other things, the Program Administrator Report indicated that there were no material changes to the LRMP during the Reporting Period, although there were certain methodology adjustments implemented relating to a change in data provider. Additionally, the findings presented in the Program Administrator Report indicated that the LRMP operated adequately during the Reporting Period. These findings included that the Fund was able to meet redemptions during the normal course of business during the Reporting Period. The Program Administrator Report also stated that the Fund did not exceed the 15% limit on illiquid assets during the Reporting Period, that the Fund held primarily highly liquid assets, and was considered to be a primarily highly liquid fund during the Reporting Period. Also included among the Program Administrator Report’s findings was the determination that the Fund’s investment strategy remains appropriate for an open-end fund. In addition, the Adviser expressed its belief in the Program Administrator Report that the LRMP is reasonably designed and adequate to assess and manage the Fund’s liquidity risk, considering the Fund’s particular risks and circumstances, and includes policies and procedures reasonably designed to implement each required component of the Liquidity Rule.
There can be no assurance that the LRMP will achieve its objectives in the future. Please refer to your Fund’s prospectus for more information regarding the risks to which an investment in the Fund may be subject.
Janus Henderson Multi-Sector Income Fund
Useful Information About Your Fund Report (unaudited)
Management Commentary
The Management Commentary in this report includes valuable insight as well as statistical information to help you understand how your Fund’s performance and characteristics stack up against those of comparable indices.
If the Fund invests in foreign securities, this report may include information about country exposure. Country exposure is based primarily on the country of risk. A company may be allocated to a country based on other factors such as location of the company’s principal office, the location of the principal trading market for the company’s securities, or the country where a majority of the company’s revenues are derived.
Please keep in mind that the opinions expressed in the Management Commentary are just that: opinions. They are a reflection based on best judgment at the time this report was compiled, which was June 30, 2023. As the investing environment changes, so could opinions. These views are unique and are not necessarily shared by fellow employees or by Janus Henderson in general.
Performance Overviews
Performance overview graphs compare the performance of a hypothetical $10,000 investment in the Fund with one or more widely used market indices. When comparing the performance of the Fund with an index, keep in mind that market indices are not available for investment and do not reflect deduction of expenses.
Average annual total returns are quoted for a Fund with more than one year of performance history. Average annual total return is calculated by taking the growth or decline in value of an investment over a period of time, including reinvestment of dividends and distributions, then calculating the annual compounded percentage rate that would have produced the same result had the rate of growth been constant throughout the period. Average annual total return does not reflect the deduction of taxes that a shareholder would pay on Fund distributions or redemptions of Fund shares.
Cumulative total returns are quoted for a Fund with less than one year of performance history. Cumulative total return is the growth or decline in value of an investment over time, independent of the period of time involved. Cumulative total return does not reflect the deduction of taxes that a shareholder would pay on Fund distributions or redemptions of Fund shares.
Pursuant to federal securities rules, expense ratios shown in the performance chart reflect subsidized (if applicable) and unsubsidized ratios. The total annual fund operating expenses ratio is gross of any fee waivers, reflecting the Fund’s unsubsidized expense ratio. The net annual fund operating expenses ratio (if applicable) includes contractual waivers of the Adviser and reflects the Fund’s subsidized expense ratio. Ratios may be higher or lower than those shown in the “Financial Highlights” in this report.
Schedule of Investments
Following the performance overview section is the Fund’s Schedule of Investments. This schedule reports the types of securities held in the Fund on the last day of the reporting period. Securities are usually listed by type (common stock, corporate bonds, U.S. Government obligations, etc.) and by industry classification (banking, communications, insurance, etc.). Holdings are subject to change without notice.
The value of each security is quoted as of the last day of the reporting period. The value of securities denominated in foreign currencies is converted into U.S. dollars.
If the Fund invests in foreign securities, it will also provide a summary of investments by country. This summary reports the Fund exposure to different countries by providing the percentage of securities invested in each country. The country of each security represents the country of risk. The Fund’s Schedule of Investments relies upon the industry group and country classifications published by Bloomberg and/or MSCI Inc.
Tables listing details of individual forward currency contracts, futures, written options, swaptions, and swaps follow the Fund’s Schedule of Investments (if applicable).
Statement of Assets and Liabilities
This statement is often referred to as the “balance sheet.” It lists the assets and liabilities of the Fund on the last day of the reporting period.
Janus Henderson Multi-Sector Income Fund
Useful Information About Your Fund Report (unaudited)
The Fund’s assets are calculated by adding the value of the securities owned, the receivable for securities sold but not yet settled, the receivable for dividends declared but not yet received on securities owned, and the receivable for Fund shares sold to investors but not yet settled. The Fund’s liabilities include payables for securities purchased but not yet settled, Fund shares redeemed but not yet paid, and expenses owed but not yet paid. Additionally, there may be other assets and liabilities such as unrealized gain or loss on forward currency contracts.
The section entitled “Net Assets Consist of” breaks down the components of the Fund’s net assets. Because the Fund must distribute substantially all earnings, you will notice that a significant portion of net assets is shareholder capital.
The last section of this statement reports the net asset value (“NAV”) per share on the last day of the reporting period. The NAV is calculated by dividing the Fund’s net assets for each share class (assets minus liabilities) by the number of shares outstanding.
Statement of Operations
This statement details the Fund’s income, expenses, realized gains and losses on securities and currency transactions, and changes in unrealized appreciation or depreciation of Fund holdings.
The first section in this statement, entitled “Investment Income,” reports the dividends earned from securities and interest earned from interest-bearing securities in the Fund.
The next section reports the expenses incurred by the Fund, including the advisory fee paid to the investment adviser, transfer agent fees and expenses, and printing and postage for mailing statements, financial reports and prospectuses. Expense offsets and expense reimbursements, if any, are also shown.
The last section lists the amounts of realized gains or losses from investment and foreign currency transactions, and changes in unrealized appreciation or depreciation of investments and foreign currency-denominated assets and liabilities. The Fund will realize a gain (or loss) when it sells its position in a particular security. A change in unrealized gain (or loss) refers to the change in net appreciation or depreciation of the Fund during the reporting period. “Net Realized and Unrealized Gain/(Loss) on Investments” is affected both by changes in the market value of Fund holdings and by gains (or losses) realized during the reporting period.
Statements of Changes in Net Assets
These statements report the increase or decrease in the Fund’s net assets during the reporting period. Changes in the Fund’s net assets are attributable to investment operations, dividends and distributions to investors, and capital share transactions. This is important to investors because it shows exactly what caused the Fund’s net asset size to change during the period.
The first section summarizes the information from the Statement of Operations regarding changes in net assets due to the Fund’s investment operations. The Fund’s net assets may also change as a result of dividend and capital gains distributions to investors. If investors receive their dividends and/or distributions in cash, money is taken out of the Fund to pay the dividend and/or distribution. If investors reinvest their dividends and/or distributions, the Fund’s net assets will not be affected.
The reinvestment of dividends and distributions is included under “Capital Share Transactions.” “Capital Shares” refers to the money investors contribute to the Fund through purchases or withdrawals via redemptions. The Fund’s net assets will increase and decrease in value as investors purchase and redeem shares from the Fund.
Financial Highlights
This schedule provides a per-share breakdown of the components that affect the Fund’s NAV for current and past reporting periods as well as total return, asset size, ratios, and portfolio turnover rate.
The first line in the table reflects the NAV per share at the beginning of the reporting period. The next line reports the net investment income/(loss) per share. Following is the per share total of net gains/(losses), realized and unrealized. Per share dividends and distributions to investors are then subtracted to arrive at the NAV per share at the end of the period. The next line reflects the total return for the period. The total return may include adjustments in accordance with generally accepted accounting principles required at the period end for financial reporting purposes. As a result, the total return may differ from the total return reflected for individual shareholder transactions. Also included are ratios of expenses and net investment income to average net assets.
Janus Henderson Multi-Sector Income Fund
Useful Information About Your Fund Report (unaudited)
The Fund’s expenses may be reduced through expense offsets and expense reimbursements. The ratios shown reflect expenses before and after any such offsets and reimbursements.
The ratio of net investment income/(loss) summarizes the income earned less expenses, divided by the average net assets of the Fund during the reporting period. Do not confuse this ratio with the Fund’s yield. The net investment income ratio is not a true measure of the Fund’s yield because it does not take into account the dividends distributed to the Fund’s investors.
The next figure is the portfolio turnover rate, which measures the buying and selling activity in the Fund. Portfolio turnover is affected by market conditions, changes in the asset size of the Fund, fluctuating volume of shareholder purchase and redemption orders, the nature of the Fund’s investments, and the investment style and/or outlook of the portfolio manager(s) and/or investment personnel. A 100% rate implies that an amount equal to the value of the entire portfolio was replaced once during the fiscal year; a 50% rate means that an amount equal to the value of half the portfolio is traded in a year; and a 200% rate means that an amount equal to the value of the entire portfolio is traded every six months.
Janus Henderson Multi-Sector Income Fund
Designation Requirements (unaudited)
For federal income tax purposes, the Fund designated the following for the year ended June 30, 2023:
| | |
| | |
Section 163(j) Interest Dividend | 93% |
Return of Capital Distributions | $2,659,042 |
Janus Henderson Multi-Sector Income Fund
Trustees and Officers (unaudited)
The following are the Trustees and officers of the Trust, together with a brief description of their principal occupations during the last five years (principal occupations for certain Trustees may include periods over five years). The Fund’s Statement of Additional Information includes additional information about the Trustees and officers and is available, without charge, by calling 1-877-335-2687.
Each Trustee has served in that capacity since he or she was originally elected or appointed. The Trustees do not serve a specified term of office. Each Trustee will hold office until the termination of the Trust or his or her earlier death, resignation, retirement, incapacity, or removal. Under the Fund’s Governance Procedures and Guidelines, the policy is for Trustees to retire no later than the end of the calendar year in which the Trustee turns 75. The Trustees review the Fund’s Governance Procedures and Guidelines from time to time and may make changes they deem appropriate. The Fund’s Nominating and Governance Committee will consider nominees for the position of Trustee recommended by shareholders. Shareholders may submit the name of a candidate for consideration by the Committee by submitting their recommendations to the Trust’s Secretary. Each Trustee is currently a Trustee of one other registered investment company advised by the Adviser: Janus Aspen Series. Collectively, these two registered investment companies consist of 49 series or funds referred to herein as the Fund Complex.
The Trust’s officers are elected annually by the Trustees for a one-year term. Certain officers also serve as officers of Janus Aspen Series. Certain officers of the Fund may also be officers and/or directors of the Adviser. Except as otherwise disclosed, Fund officers receive no compensation from the Fund, except for the Fund’s Chief Compliance Officer, as authorized by the Trustees.
| | | | | | |
TRUSTEES |
Name, Address, and Age | Positions Held with the Trust | Length of Time Served | Principal Occupations During the Past Five Years | Number of Portfolios/Funds in Fund Complex Overseen by Trustee | Other Directorships Held by Trustee During the Past Five Years |
Independent Trustees | | | | |
Alan A. Brown
151 Detroit Street
Denver, CO 80206
DOB: 1962 | Chairman
Trustee | 5/22-Present
1/13-Present | Principal, Curam Holdings LLC (since 2018). Formerly, Executive Vice President, Institutional Markets, of Black Creek Group (private equity real estate investment management firm) (2012-2018), Executive Vice President and Co-Head, Global Private Client Group (2007-2010), Executive Vice President, Mutual Funds (2005-2007), and Chief Marketing Officer (2001-2005) of Nuveen Investments, Inc. (asset management). | 49 | Advisory Board Member of AEW Core Property Trust (open-end property fund) (since 2020), and Director of WTTW (PBS affiliate) (since 2003). Formerly, Director of MotiveQuest LLC (strategic social market research company) (2003-2016), Director of Nuveen Global Investors LLC (2007-2011), Director of Communities in Schools (2004-2010), and Director of Mutual Fund Education Alliance (until 2010). |
Janus Henderson Multi-Sector Income Fund
Trustees and Officers (unaudited)
| | | | | | |
TRUSTEES |
Name, Address, and Age | Positions Held with the Trust | Length of Time Served | Principal Occupations During the Past Five Years | Number of Portfolios/Funds in Fund Complex Overseen by Trustee | Other Directorships Held by Trustee During the Past Five Years |
Independent Trustees | | | | |
Cheryl D. Alston
151 Detroit Street
Denver, CO 80206
DOB: 1966 | Trustee | 8/22-Present | Executive Director and Chief Investment Officer, Employees’ Retirement Fund of the City of Dallas (since 2004). | 49 | Director of Blue Cross Blue Shield of Kansas City (a not-for-profit health insurance provider) (since 2016) and Director of Global Life Insurance (life and supplemental health insurance provider) (since 2017). Formerly, Director of Federal Home Loan Bank of Dallas (2017-2021). |
Janus Henderson Multi-Sector Income Fund
Trustees and Officers (unaudited)
| | | | | | |
TRUSTEES |
Name, Address, and Age | Positions Held with the Trust | Length of Time Served | Principal Occupations During the Past Five Years | Number of Portfolios/Funds in Fund Complex Overseen by Trustee | Other Directorships Held by Trustee During the Past Five Years |
Independent Trustees | | | | |
Janus Henderson Multi-Sector Income Fund
Trustees and Officers (unaudited)
| | | | | | |
William D. Cvengros
151 Detroit Street
Denver, CO 80206
DOB: 1948 | Trustee | 1/11-Present | Chief Executive Officer of SJC Capital, LLC (a personal investment company and consulting firm) (since 2002). Formerly, Chief Executive Officer and President of PIMCO Advisors Holdings L.P. (a publicly traded investment management firm) (1994-2000), and Chief Investment Officer (1987-1994) and Vice Chairman and Director (1990-1994) of Pacific Life Insurance Company (a mutual life insurance and annuity company) (1987-1994). | 49 | Member, Limited Partner Advisory Committee, Karmel Capital Fund III (later stage growth fund) (since 2022), Member of the Investment Committee for the Orange County Community Foundation (a grantmaking foundation) (since 2020), Advisory Board Member, RevOZ Fund LP and related funds (real estate investments for opportunity zones) (since 2020), and Advisory Board Member, Innovate Partners Emerging Growth and Equity Fund I (early stage venture capital fund) (since 2014). Formerly, Managing Trustee of National Retirement Partners Liquidating Trust (2013-2016), Chairman, National Retirement Partners, Inc. (formerly a network of advisors to 401(k) plans) (2005-2013), Director of Prospect Acquisition Corp. (a special purpose acquisition corporation) (2007-2009), Director of RemedyTemp, Inc. (temporary help services company) (1996-2006), and Trustee of PIMCO Funds Multi-Manager Series (1990-2000) and Pacific Life Variable Life & Annuity Trusts (1987-1994). |
Janus Henderson Multi-Sector Income Fund
Trustees and Officers (unaudited)
| | | | | | |
TRUSTEES |
Name, Address, and Age | Positions Held with the Trust | Length of Time Served | Principal Occupations During the Past Five Years | Number of Portfolios/Funds in Fund Complex Overseen by Trustee | Other Directorships Held by Trustee During the Past Five Years |
Independent Trustees | | | | |
Raudline Etienne
151 Detroit Street
Denver, CO 80206
DOB: 1965 | Trustee | 6/16-Present | Founder, Daraja Capital (advisory and investment firm) (since 2016). Formerly, Senior Vice President and Senior Advisor, Albright Stonebridge Group LLC (global strategy firm) (2011-2021), and Deputy Comptroller and Chief Investment Officer, New York State Common Retirement Fund (public pension fund) (2008-2011). | 49 | Member of the Investment Committee for Cooper Union (private college) (since 2021) and Director of Brightwood Capital Advisors, LLC (since 2014). Formerly, Board Member, Van Alen Institute (nonprofit architectural and design organization) (2019-2022). |
Darrell B. Jackson
151 Detroit Street
Denver, CO 80206
DOB: 1958 | Trustee | 8/22-Present | President and Chief Executive Officer, The Efficace Group Inc. (since 2018). Formerly, President and Chief Executive Officer, Seaway Bank and Trust Company (community bank) (2014-2015), and Executive Vice President and Co-President, Wealth Management (2009-2014), and several senior positions, including Group Executive, Senior Vice President, and Vice President (1995-2009) of Northern Trust Company (financial services company) (1995-2014). | 49 | Director of Amalgamated Financial Corp (bank) (since August 2021), Director of YR Media (a not-for-profit production company) (since 2021), and Director of Gray-Bowen-Scott (transportation project consulting firm) (since April 2020). Formerly, Director of Delaware Place Bank (closely held commercial bank) (2016-2018) and Director of Seaway Bank and Trust Company (2014-2015). |
Janus Henderson Multi-Sector Income Fund
Trustees and Officers (unaudited)
| | | | | | |
TRUSTEES |
Name, Address, and Age | Positions Held with the Trust | Length of Time Served | Principal Occupations During the Past Five Years | Number of Portfolios/Funds in Fund Complex Overseen by Trustee | Other Directorships Held by Trustee During the Past Five Years |
Independent Trustees | | | | |
William F. McCalpin
151 Detroit Street
Denver, CO 80206
DOB: 1957 | Trustee | 6/02-Present | Chief Executive Officer, muun chi LLC (organic food business) (since 2022) and Independent Consultant (since 2019). Formerly, Chief Operating Officer, muun chi LLC (2020-2022), Managing Partner, Impact Investments, Athena Capital Advisors LLC (independent registered investment advisor) (2016-2019), Managing Director, Holos Consulting LLC (provides consulting services to foundations and other nonprofit organizations) (2009-2016), Chief Executive Officer, Imprint Capital Advisors (impact investment firm) (2013-2015), and Executive Vice President and Chief Operating Officer of The Rockefeller Brothers Fund (a private family foundation) (1998-2006). | 49 | Chairman of the Board and Trustee of The Investment Fund for Foundations Investment Program (TIP) (consisting of 1 fund) (since 2008). Formerly, Director of the F.B. Heron Foundation (a private grantmaking foundation) (2006-2022), and Director of Mutual Fund Directors Forum (a non-profit organization serving independent directors of U.S. mutual funds) (2016-2021). |
Janus Henderson Multi-Sector Income Fund
Trustees and Officers (unaudited)
| | | | | | |
TRUSTEES |
Name, Address, and Age | Positions Held with the Trust | Length of Time Served | Principal Occupations During the Past Five Years | Number of Portfolios/Funds in Fund Complex Overseen by Trustee | Other Directorships Held by Trustee During the Past Five Years |
Independent Trustees | | | | |
Gary A. Poliner
151 Detroit Street
Denver, CO 80206
DOB: 1953 | Trustee | 6/16-Present | Retired. Formerly, President (2010-2013) of Northwestern Mutual Life Insurance Company. | 49 | Director of MGIC Investment Corporation (private mortgage insurance) (since 2013). Formerly, Director, West Bend Mutual Insurance Company (property/casualty insurance) (2013-2021), Trustee of Northwestern Mutual Life Insurance Company (2010-2013) and Director of Frank Russell Company (global asset management firm) (2008-2013). |
Diane L. Wallace
151 Detroit Street
Denver, CO 80206
DOB: 1958 | Trustee | 6/17-Present | Retired. Formerly, Chief Operating Officer, Senior Vice President-Operations, and Chief Financial Officer for Driehaus Capital Management, LLC (1988-2006) and Treasurer for Driehaus Mutual Funds (1996-2002). | 49 | Formerly, Director of Family Service of Lake County (2019-2021), Independent Trustee, Henderson Global Funds (13 portfolios) (2015-2017), Independent Trustee, State Farm Associates’ Funds Trust, State Farm Mutual Fund Trust, and State Farm Variable Product Trust (28 portfolios) (2013-2017). |
Janus Henderson Multi-Sector Income Fund
Trustees and Officers (unaudited)
| | | | |
OFFICERS |
Name, Address, and Age | Positions Held with the Trust | Term of Office* and Length of Time Served | Principal Occupations During the Past Five Years |
John Kerschner
151 Detroit Street
Denver, CO 80206
DOB: 1967 | Executive Vice President and Co-Portfolio Manager
Janus Henderson Multi-Sector Income Fund | 2/14-Present | Head of U.S. Securitized Products of Janus Henderson Investors and Portfolio Manager for other Janus Henderson accounts. |
John Lloyd
151 Detroit Street
Denver, CO 80206
DOB: 1975 | Executive Vice President and Co-Portfolio Manager
Janus Henderson Multi-Sector Income Fund | 2/14-Present | Lead, Multi-Sector Credit Strategies of Janus Henderson Investors and Portfolio Manager for other Janus Henderson accounts. |
Seth Meyer
151 Detroit Street
Denver, CO 80206
DOB: 1976 | Executive Vice President and Co-Portfolio Manager
Janus Henderson Multi-Sector Income Fund | 2/14-Present | Head of Fixed-Income Strategy of Janus Henderson Investors and Portfolio Manager for other Janus Henderson accounts. |
Michelle Rosenberg
151 Detroit Street
Denver, CO 80206
DOB: 1973 | President and Chief Executive Officer | 9/22-Present | General Counsel and Corporate Secretary of Janus Henderson Investors (since 2018). Formerly, Interim President and Chief Executive Officer of the Trust and Janus Aspen Series (2022), Senior Vice President and Head of Legal, North America of Janus Henderson Investors (2017-2018) and Deputy General Counsel of Janus Henderson US (Holdings) Inc. (2015-2018). |
Janus Henderson Multi-Sector Income Fund
Trustees and Officers (unaudited)
| | | | |
OFFICERS |
Name, Address, and Age | Positions Held with the Trust | Term of Office* and Length of Time Served | Principal Occupations During the Past Five Years |
Kristin Mariani
151 Detroit Street
Denver, CO 80206
DOB: 1966 | Vice President and Chief Compliance Officer | 7/20-Present | Head of Compliance, North America at Janus Henderson Investors (since September 2020) and Chief Compliance Officer at Janus Henderson Investors US LLC (since September 2017). Formerly, Anti-Money Laundering Officer for the Trust and Janus Aspen Series (July 2020-December 2022), Global Head of Investment Management Compliance at Janus Henderson Investors (February 2019-August 2020), Vice President, Head of Global Distribution Compliance and Chief Compliance Officer at Janus Henderson Distributors US LLC (May 2017-September 2017), Vice President, Compliance at Janus Henderson US (Holdings) Inc., Janus Henderson Investors US LLC, and Janus Henderson Distributors US LLC (2009-2017). |
Jesper Nergaard
151 Detroit Street
Denver, CO 80206
DOB: 1962 | Chief Financial Officer
Vice President, Treasurer, and Principal Accounting Officer | 3/05-Present
2/05-Present | Head of U.S. Fund Administration, Janus Henderson Investors and Janus Henderson Services US LLC. |
Abigail J. Murray
151 Detroit Street
Denver, CO 80206
DOB: 1975 | Vice President, Chief Legal Counsel, and Secretary | 12/20-Present | Managing Counsel (since 2020). Formerly, Senior Counsel for Invesco Ltd. (2017-2020), and Vice President and Senior Counsel, ALPS Fund Services, Inc. and Assistant General Counsel, ALPS Advisors, Inc. (2015-2017). |
Ciaran Askin
151 Detroit Street
Denver, CO 80206
DOB: 1978 | Anti-Money Laundering Officer | 12/22-Present | Global Head of Financial Crime, Janus Henderson Investors (since 2022). Formerly, Global Head of Financial Crime for Invesco Ltd. (2017-2022). |
* Officers are elected at least annually by the Trustees for a one-year term and may also be elected from time to time by the Trustees for an interim period. |
Janus Henderson Multi-Sector Income Fund
Notes
NotesPage1
Janus Henderson Multi-Sector Income Fund
Notes
NotesPage2
Janus Henderson Multi-Sector Income Fund
Notes
NotesPage3
| | | | | | | | |
| | | | | |

| | | | |
This report is submitted for the general information of shareholders of the Fund. It is not an offer or solicitation for the Fund and is not authorized for distribution to prospective investors unless preceded or accompanied by an effective prospectus. |
Janus Henderson is a trademark of Janus Henderson Group plc or one of its subsidiaries. © Janus Henderson Group plc Janus Henderson Distributors US LLC Janus Henderson Group is the ultimate parent of Janus Henderson Distributors US LLC |
| | | | 125-02-93028 08-23 |
| | | |
| | | |
| | | ANNUAL REPORT June 30, 2023 |
| | |
| | Janus Henderson Responsible International Dividend Fund (Formerly Janus Henderson Dividend & Income Builder Fund) |
| | |
| | Janus Investment Fund |
| |
| | | |
| | | HIGHLIGHTS · Portfolio management perspective · Investment strategy behind your fund · Fund performance, characteristics
and holdings |
Table of Contents
Janus Henderson Responsible International Dividend Fund
Janus Henderson Responsible International Dividend Fund (unaudited)
| | | | | | | |
| | | | | 
Ben Lofthouse co-portfolio manager | 
Faizan Baig co-portfolio manager |
| | | | |
PERFORMANCE OVERVIEW
For the 12-month period ended June 30, 2023, the Janus Henderson Responsible International Dividend Fund Class I shares returned 17.70%. The Fund’s primary benchmark, the MSCI World ex-USA IndexSM, returned 17.41%.
Please note that the Fund’s name was changed from the Dividend & Income Builder Fund to the Responsible International Dividend Fund on October 28, 2022. This overview and the performance discussion reflect the period as a whole.
INVESTMENT ENVIRONMENT
Equity markets rose over the period as inflationary pressures began to ease, suggesting a higher likelihood of central banks around the world slowing the pace of interest rate hikes. Leading indicators of economic activity improved marginally from depressed levels, while corporate profit results were broadly above expectations. Financial markets were adversely impacted by the collapse of two U.S. regional banks, which raised fears about a potential global banking crisis. However, the rescue of Swiss bank Credit Suisse by rival UBS assured investors that governments would intervene to avert such an outcome, leading to a quick recovery in share prices. At the end of the period, equity markets were given a boost led by information technology (IT) companies that had exposure to artificial intelligence (AI), a phenomenon that some say could revolutionize the IT sector.
PERFORMANCE DISCUSSION
The Fund’s moderate outperformance over the 12-month period was led by strong stock selection and positioning.
The largest contributor to relative performance was the Fund’s underweight allocation to the energy sector, one of the lowest-performing sectors in the index during the period. Industrials holdings Schneider Electric and nVent Electric benefited relative returns, as did the Fund’s stock selection in consumer discretionary, where our holding in Swiss jewelry-maker Compagnie Financière Richemont was one of the top individual contributors.
Stock selection in communication services detracted on a relative basis due to the disappointing performance of telecommunications holding Tele2 AB. In IT, while the Fund’s stock selection weighed on performance, our overweight allocation in the sector contributed. The Fund’s fixed income allocation (pre-October 28, 2022) also detracted from relative returns as global bonds experienced a disappointing period on the back of rising inflation expectations.
OUTLOOK
It is a difficult time to make predictions. Interest rates are being raised into a slowing growth environment, so in the short term, the outlook for economic growth is more negative than expected last year. However, there have been some more positive recent developments. First, recent inflation data has been easing, supporting our view that we are a fair way through the interest rate hike cycle – a positive for market sentiment. Second, China’s reversal of its zero-COVID policy should accelerate economic growth in that country and be supportive of the Chinese-exposed names in the portfolio, as well as global growth in general.
We are confident that the companies held in the portfolio have the ability to successfully weather the current conditions and that a great deal of bad news is priced in. We continue to be positively surprised by the shareholder returns being announced in terms of dividends and share buybacks, suggesting management teams, too, are confident about the long-term outlooks for their companies.
Thank you for your investment in the Janus Henderson Responsible International Dividend Fund.
Janus Henderson Responsible International Dividend Fund (unaudited)
Important Notice – Tailored Shareholder Reports
Effective January 24, 2023, the Securities and Exchange Commission (the “SEC”) adopted rule and form amendments that require mutual funds and exchange-traded funds to provide shareholders with streamlined annual and semi-annual shareholder reports that highlight key information. Other information, including financial statements, that currently appears in shareholder reports will be made available online, delivered free of charge to shareholders upon request, and filed with the SEC. The first tailored shareholder report for the Fund will be for the reporting period ending June 30, 2024. Currently, management is evaluating the impact of the rule and form amendments on the content of the Fund’s current shareholder reports.
Janus Henderson Responsible International Dividend Fund (unaudited)
Fund At A Glance
June 30, 2023
| | | | | | | | | | |
| | | | | | | | | |
| | | | | | | | | |
| | | | | | | | | |
| 5 Top Contributors - Equity Sleeve Holdings | 5 Top Detractors - Equity Sleeve Holdings |
| | Average
Weight | | Relative
Contribution | | | Average
Weight | | Relative
Contribution |
| Cie Financiere Richemont SA (REG) | 2.51% | | 1.12% | | Fidelity National Information Services Inc | 1.25% | | -0.86% |
| Schneider Electric SE | 2.61% | | 0.64% | | Crown Castle International Corp | 1.32% | | -0.80% |
| nVent Electric PLC | 1.19% | | 0.59% | | Tele2 AB | 2.01% | | -0.73% |
| Tokyo Electron Ltd | 1.59% | | 0.57% | | GSK PLC | 2.17% | | -0.68% |
| Taiwan Semiconductor Manufacturing Co Ltd (ADR) | 2.71% | | 0.53% | | Direct Line Insurance Group PLC | 0.80% | | -0.67% |
| | | | | | | |
| 5 Top Contributors - Equity Sleeve Sectors* | | | | | |
| | | Relative | | Equity Sleeve | MSCI World ex-USA Index |
| | | Contribution | | Average Weight | Average Weight |
| Energy | | 1.44% | | 1.95% | 6.26% |
| Industrials | | 1.06% | | 13.26% | 15.02% |
| Consumer Discretionary | | 0.39% | | 6.43% | 10.79% |
| Consumer Staples | | 0.19% | | 10.53% | 9.92% |
| Health Care | | 0.16% | | 18.89% | 11.91% |
| | | | | | |
| | | | | | |
| 5 Top Detractors - Equity Sleeve Sectors* | | | | | |
| | | Relative | | Equity Sleeve | MSCI World ex-USA Index |
| | | Contribution | | Average Weight | Average Weight |
| Communication Services | | -1.57% | | 7.32% | 4.35% |
| Other** | | -0.46% | | 2.68% | 0.00% |
| Real Estate | | -0.16% | | 1.32% | 2.38% |
| Materials | | 0.04% | | 4.11% | 7.96% |
| Information Technology | | 0.06% | | 17.32% | 7.88% |
| | | | | | | |
| Relative contribution reflects how the portolio's holdings impacted return relative to the benchmark. Cash and securities not held in the portfolio are not shown. For equity portfolios, relative contribution compares the performance of a security in the portfolio to the benchmark's total return, factoring in the difference in weight of that security in the benchmark. Returns are calculated using daily returns and previous day ending weights rolled up by ticker, excluding fixed income securities, gross of advisory fees, may exclude certain derivatives and will differ from actual performance.
Performance attribution reflects returns gross of advisory fees and may differ from actual returns as they are based on end of day holdings. Attribution is calculated by geometrically linking daily returns for the portfolio and index. |
* | Based on sector classification according to the Global Industry Classification Standard (“GICS”) codes, which are the exclusive property and a service mark of MSCI Inc. and Standard & Poor’s. |
** | Not a GICS classified sector. |
Janus Henderson Responsible International Dividend Fund (unaudited)
Fund At A Glance
June 30, 2023
| | |
5 Largest Equity Holdings - (% of Net Assets) |
RELX PLC | |
Professional Services | 4.3% |
Nestle SA (REG) | |
Food Products | 4.2% |
Unilever PLC | |
Personal Products | 3.7% |
Schneider Electric SE | |
Electrical Equipment | 3.5% |
Taiwan Semiconductor Manufacturing Co Ltd (ADR) | |
Semiconductor & Semiconductor Equipment | 3.4% |
| | 19.1% |
| | | | | | |
Asset Allocation - (% of Net Assets) | |
Common Stocks | | 91.8% | |
Investment Companies | | 3.3% | |
Preferred Stocks | | 2.7% | |
Other | | 2.2% |
| | | 100.0% |
Emerging markets comprised 7.6% of total net assets.
| | |
Top Country Allocations - Long Positions - (% of Investment Securities) |
As of June 30, 2023 
| As of June 30, 2022 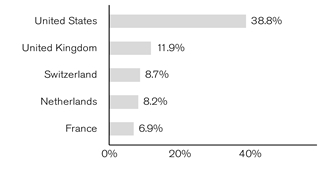
|
Janus Henderson Responsible International Dividend Fund (unaudited)
Performance
| |
See important disclosures on the next page. |
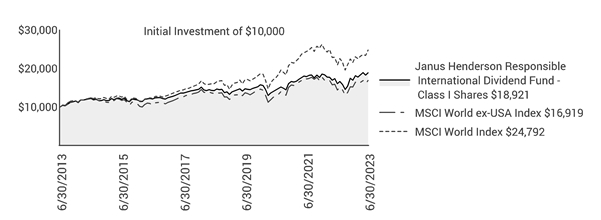
| | | | | | | | | | | |
| | | | | | | | | |
| | | | | | | | | |
Average Annual Total Return - for the periods ended June 30, 2023 | | | Prospectus Expense Ratios |
| | One
Year | Five
Year | Ten
Year | Since
Inception* | | | Total Annual Fund
Operating Expenses‡ | Net Annual Fund
Operating Expenses‡ |
Class A Shares at NAV | | 17.51% | 5.57% | 6.35% | 6.88% | | | 1.27% | 1.16% |
Class A Shares at MOP | | 10.77% | 4.34% | 5.81% | 6.37% | | | | |
Class C Shares at NAV | | 16.67% | 4.78% | 5.54% | 6.07% | | | 2.04% | 1.92% |
Class C Shares at CDSC | | 15.67% | 4.78% | 5.54% | 6.07% | | | | |
Class D Shares | | 17.71% | 5.75% | 6.50% | 7.03% | | | 1.14% | 0.99% |
Class I Shares | | 17.70% | 5.80% | 6.58% | 7.11% | | | 1.04% | 0.93% |
Class N Shares | | 17.82% | 5.89% | 6.59% | 7.11% | | | 1.08% | 0.84% |
Class S Shares | | 17.75% | 5.75% | 6.33% | 6.84% | | | 6.12% | 1.35% |
Class T Shares | | 17.53% | 5.64% | 6.39% | 6.92% | | | 1.21% | 1.09% |
MSCI World ex-USA Index | | 17.41% | 4.58% | 5.40% | 6.35% | | | | |
MSCI World Index | | 18.51% | 9.07% | 9.50% | 10.28% | | | | |
Morningstar Quartile - Class I Shares | | 2nd | 1st | 1st | 1st | | | | |
Morningstar Ranking - based on total returns for Foreign Large Value | | 176/375 | 29/327 | 7/273 | 20/258 | | | | |
Returns quoted are past performance and do not guarantee future results; current performance may be lower or higher. Investment returns and principal value will vary; there may be a gain or loss when shares are sold. For the most recent month-end performance call 800.668.0434 (or 800.525.3713 if you hold shares directly with Janus Henderson) or visit janushenderson.com/performance (or janushenderson.com/allfunds if you hold shares directly with Janus Henderson).
Maximum Offering Price (MOP) returns include the maximum sales charge of 5.75%. Net Asset Value (NAV) returns exclude this charge, which would have reduced returns.
CDSC returns include a 1% contingent deferred sales charge (CDSC) on Shares redeemed within 12 months of purchase. Net Asset Value (NAV) returns exclude this charge, which would have reduced returns.
For certain periods, the Fund’s performance may reflect the effects of expense waivers.
Janus Henderson Responsible International Dividend Fund (unaudited)
Performance
Performance may be affected by risks that include those associated with foreign and emerging markets, fixed income securities, high-yield and high-risk securities, undervalued, overlooked and smaller capitalization companies, real estate related securities including Real Estate Investment Trusts (REITs), Environmental, Social and Governance (ESG) factors, non-diversification, portfolio turnover, derivatives, short sales, initial public offerings (IPOs) and potential conflicts of interest. Each product has different risks. Please see the prospectus for more information about risks, holdings and other details.
Returns include reinvestment of all dividends and distributions and do not reflect the deduction of taxes that a shareholder would pay on Fund distributions or redemptions of Fund shares. The returns do not include adjustments in accordance with generally accepted accounting principles required at the period end for financial reporting purposes.
Returns of the Fund shown prior to June 5, 2017, are those for Henderson Dividend & Income Builder Fund (the “Predecessor Fund”), which merged into the Fund after the close of business on June 2, 2017. The Predecessor Fund was advised by Henderson Global Investors (North America) Inc. and subadvised by Henderson Investment Management Limited. Class A Shares, Class C Shares, Class I Shares, and Class R6 Shares of the Predecessor Fund were reorganized into Class A Shares, Class C Shares, Class I Shares, and Class N Shares, respectively, of the Fund. In connection with this reorganization, certain shareholders of the Predecessor Fund who held shares directly with the Predecessor Fund and not through an intermediary had the Class A Shares, Class C Shares, Class I Shares, and Class N Shares of the Fund received in the reorganization automatically exchanged for Class D Shares of the Fund following the reorganization. Class A Shares, Class C Shares, and Class I Shares of the Predecessor Fund commenced operations with the Predecessor Fund’s inception on August 1, 2012. Class R6 Shares of the Predecessor Fund commenced operations on November 30, 2015. Class D Shares, Class S Shares, and Class T Shares commenced operations on June 5, 2017.
Performance of Class A Shares shown for periods prior to June 5, 2017, reflects the performance of Class A Shares of the Predecessor Fund, calculated using the fees and expenses of Class A Shares of the Predecessor Fund, in effect during the periods shown, net of any applicable fee and expense limitations or waivers.
Performance of Class C Shares shown for periods prior to June 5, 2017, reflects the performance of Class C Shares of the Predecessor Fund, calculated using the fees and expenses of Class C Shares of the Predecessor Fund, in effect during the periods shown, net of any applicable fee and expense limitations or waivers.
Performance of Class I Shares shown for periods prior to June 5, 2017, reflects the performance of Class I Shares of the Predecessor Fund, calculated using the fees and expenses of Class I Shares of the Predecessor Fund, in effect during the periods shown, net of any applicable fee and expense limitations or waivers.
Performance of Class N Shares shown for periods prior to June 5, 2017, reflects the performance of Class R6 Shares of the Predecessor Fund, calculated using the fees and expenses of Class R6 Shares of the Predecessor Fund, in effect during the periods shown, net of any applicable fee and expense limitations or waivers, except that for periods prior to November 30, 2015, performance for Class N Shares reflects the performance of Class I Shares of the Predecessor Fund, calculated using the estimated fees and expenses of Class N Shares, net of any applicable fee and expense limitations or waivers.
Performance of Class S Shares shown for periods prior to June 5, 2017, reflects the performance of Class I Shares of the Predecessor Fund, calculated using the estimated fees and expenses of Class S Shares, net of any applicable fee and expense limitations or waivers.
Performance of Class T Shares shown for periods prior to June 5, 2017, reflects the performance of Class I Shares of the Predecessor Fund, calculated using the estimated fees and expenses of Class T Shares, net of any applicable fee and expense limitations or waivers.
Performance of Class D Shares shown for periods prior to June 5, 2017, reflects the performance of Class I Shares of the Predecessor Fund, calculated using the estimated fees and expenses of Class D Shares, net of any applicable fee and expense limitations or waivers.
If each share class of the Fund had been available during periods prior to its commencement, the performance shown may have been different. The performance shown for periods following the Fund’s commencement of each share class reflects the fees and expenses of each respective share class, net of any applicable fee and expense limitations or waivers. Please refer to the Fund’s prospectuses for further details concerning historical performance.
Ranking is for the share class shown only; other classes may have different performance characteristics. When an expense waiver is in effect, it may have a material effect on the total return, and therefore the ranking for the period.
© 2023 Morningstar, Inc. All Rights Reserved.
There is no assurance that the investment process will consistently lead to successful investing.
See Notes to Schedule of Investments and Other Information for index definitions.
Index performance does not reflect the expenses of managing a portfolio as an index is unmanaged and not available for direct investment.
See “Useful Information About Your Fund Report.”
*The Predecessor Fund’s inception date – August 1, 2012
‡ As stated in the prospectus. Net expense ratios reflect the expense waiver, if any, contractually agreed to for at least a one-year period commencing on October 28, 2022. This contractual waiver may be terminated or modified only at the discretion of the Board of Trustees. See Financial Highlights for actual expense ratios during the reporting period.
Janus Henderson Responsible International Dividend Fund (unaudited)
Expense Examples
As a shareholder of the Fund, you incur two types of costs: (1) transaction costs, such as sales charges (loads) on purchase payments (applicable to Class A Shares only); and (2) ongoing costs, including management fees; 12b-1 distribution and shareholder servicing fees; transfer agent fees and expenses payable pursuant to the Transfer Agency Agreement; and other Fund expenses. This example is intended to help you understand your ongoing costs (in dollars) of investing in the Fund and to compare these costs with the ongoing costs of investing in other mutual funds. To do so, compare this 5% hypothetical example with the 5% hypothetical examples that appear in the shareholder reports of the other funds. The example is based upon an investment of $1,000 invested at the beginning of the period and held for the six-months indicated, unless noted otherwise in the table and footnotes below.
Actual Expenses
The information in the table under the heading “Actual” provides information about actual account values and actual expenses. You may use the information in these columns, together with the amount you invested, to estimate the expenses that you paid over the period. Simply divide your account value by $1,000 (for example, an $8,600 account value divided by $1,000 = 8.6), then multiply the result by the number in the appropriate column for your share class under the heading entitled “Expenses Paid During Period” to estimate the expenses you paid on your account during the period.
Hypothetical Example for Comparison Purposes
The information in the table under the heading “Hypothetical (5% return before expenses)” provides information about hypothetical account values and hypothetical expenses based upon the Fund’s actual expense ratio and an assumed rate of return of 5% per year before expenses, which is not the Fund’s actual return. The hypothetical account values and expenses may not be used to estimate the actual ending account balance or expenses you paid for the period. You may use this information to compare the ongoing costs of investing in the Fund and other funds. To do so, compare this 5% hypothetical example with the 5% hypothetical examples that appear in the shareholder reports of the other funds. Additionally, for an analysis of the fees associated with an investment in any share class or other similar funds, please visit www.finra.org/fundanalyzer.
Please note that the expenses shown in the table are meant to highlight your ongoing costs only and do not reflect any transaction costs. These fees are fully described in the Fund’s prospectuses. Therefore, the hypothetical examples are useful in comparing ongoing costs only, and will not help you determine the relative total costs of owning different funds. In addition, if these transaction costs were included, your costs would have been higher.
| | | | | | | | | | | |
| | | | | | | | |
| | | Actual | | Hypothetical
(5% return before expenses) | |
| Beginning
Account
Value
(1/1/23) | Ending
Account
Value
(6/30/23) | Expenses
Paid During
Period
(1/1/23 - 6/30/23)† | | Beginning
Account
Value
(1/1/23) | Ending
Account
Value
(6/30/23) | Expenses
Paid During
Period
(1/1/23 - 6/30/23)† | Net Annualized
Expense Ratio
(1/1/23 - 6/30/23) |
Class A Shares | $1,000.00 | $1,114.30 | $6.24 | | $1,000.00 | $1,018.89 | $5.96 | 1.19% |
Class C Shares | $1,000.00 | $1,110.70 | $9.89 | | $1,000.00 | $1,015.42 | $9.44 | 1.89% |
Class D Shares | $1,000.00 | $1,115.30 | $5.35 | | $1,000.00 | $1,019.74 | $5.11 | 1.02% |
Class I Shares | $1,000.00 | $1,116.00 | $5.09 | | $1,000.00 | $1,019.98 | $4.86 | 0.97% |
Class N Shares | $1,000.00 | $1,116.50 | $4.62 | | $1,000.00 | $1,020.43 | $4.41 | 0.88% |
Class S Shares | $1,000.00 | $1,116.20 | $5.30 | | $1,000.00 | $1,019.79 | $5.06 | 1.01% |
Class T Shares | $1,000.00 | $1,114.60 | $5.82 | | $1,000.00 | $1,019.29 | $5.56 | 1.11% |
† | Expenses Paid During Period are equal to the Net Annualized Expense Ratio multiplied by the average account value over the period, multiplied by 181/365 (to reflect the one-half year period). Expenses in the examples include the effect of applicable fee waivers and/or expense reimbursements, if any. Had such waivers and/or reimbursements not been in effect, your expenses would have been higher. Please refer to the Notes to Financial Statements or the Fund’s prospectuses for more information regarding waivers and/or reimbursements. |
Janus Henderson Responsible International Dividend Fund
Schedule of Investments
June 30, 2023
| | | | | | | | |
Shares
| | | Value | |
Common Stocks– 91.8% | | | |
Automobiles – 2.2% | | | |
| | Bayerische Motoren Werke AG | | 20,900 | | | $2,565,895 | |
Banks – 2.3% | | | |
| | ING Groep NV | | 195,814 | | | 2,636,036 | |
Beverages – 1.5% | | | |
| | Coca-Cola Co | | 29,548 | | | 1,779,381 | |
Capital Markets – 1.0% | | | |
| | CME Group Inc | | 6,059 | | | 1,122,672 | |
Chemicals – 1.5% | | | |
| | Air Products & Chemicals Inc | | 6,037 | | | 1,808,263 | |
Communications Equipment – 1.1% | | | |
| | Cisco Systems Inc | | 24,142 | | | 1,249,107 | |
Diversified Financial Services – 1.1% | | | |
| | Fidelity National Information Services Inc | | 23,110 | | | 1,264,117 | |
Diversified Telecommunication Services – 4.7% | | | |
| | Deutsche Telekom AG | | 154,461 | | | 3,366,589 | |
| | TELUS Corp | | 106,172 | | | 2,066,370 | |
| | | 5,432,959 | |
Electrical Equipment – 4.7% | | | |
| | nVent Electric PLC | | 26,699 | | | 1,379,537 | |
| | Schneider Electric SE | | 22,419 | | | 4,071,823 | |
| | | 5,451,360 | |
Food Products – 4.2% | | | |
| | Nestle SA (REG) | | 40,253 | | | 4,840,434 | |
Health Care Equipment & Supplies – 1.6% | | | |
| | Medtronic PLC | | 21,281 | | | 1,874,856 | |
Household Durables – 2.0% | | | |
| | Sony Corp | | 25,500 | | | 2,291,430 | |
Insurance – 9.4% | | | |
| | AIA Group Ltd | | 290,200 | | | 2,929,517 | |
| | AXA SA | | 110,903 | | | 3,270,181 | |
| | Direct Line Insurance Group PLC | | 416,156 | | | 718,403 | |
| | NN Group NV | | 31,727 | | | 1,173,869 | |
| | Zurich Insurance Group AG | | 6,112 | | | 2,902,312 | |
| | | 10,994,282 | |
Machinery – 5.6% | | | |
| | Daimler Truck Holding AG | | 96,671 | | | 3,480,751 | |
| | Sandvik AB | | 157,105 | | | 3,062,976 | |
| | | 6,543,727 | |
Multi-Utilities – 2.0% | | | |
| | National Grid PLC | | 172,911 | | | 2,284,534 | |
Paper & Forest Products – 0.8% | | | |
| | UPM-Kymmene Oyj | | 33,223 | | | 988,523 | |
Personal Products – 3.7% | | | |
| | Unilever PLC | | 81,955 | | | 4,266,263 | |
Pharmaceuticals – 18.4% | | | |
| | AstraZeneca PLC | | 27,637 | | | 3,957,117 | |
| | GSK PLC | | 128,763 | | | 2,270,721 | |
| | Merck & Co Inc | | 15,521 | | | 1,790,968 | |
| | Novartis AG | | 31,213 | | | 3,139,439 | |
| | Novo Nordisk A/S | | 23,793 | | | 3,834,082 | |
| | Roche Holding AG | | 9,513 | | | 2,907,695 | |
| | Sanofi | | 32,232 | | | 3,453,516 | |
| | | 21,353,538 | |
Professional Services – 4.3% | | | |
| | RELX PLC | | 149,529 | | | 4,982,614 | |
Semiconductor & Semiconductor Equipment – 6.8% | | | |
| | MediaTek Inc | | 77,000 | | | 1,701,330 | |
| | Taiwan Semiconductor Manufacturing Co Ltd (ADR) | | 39,745 | | | 4,011,065 | |
| | |
See Notes to Schedule of Investments and Other Information and Notes to Financial Statements. |
| |
8 | JUNE 30, 2023 |
Janus Henderson Responsible International Dividend Fund
Schedule of Investments
June 30, 2023
| | | | | | | | |
Shares
| | | Value | |
Common Stocks– (continued) | | | |
Semiconductor & Semiconductor Equipment– (continued) | | | |
| | Tokyo Electron Ltd | | 15,400 | | | $2,194,511 | |
| | | 7,906,906 | |
Software – 5.9% | | | |
| | Microsoft Corp | | 10,298 | | | 3,506,881 | |
| | SAP SE | | 24,864 | | | 3,394,923 | |
| | | 6,901,804 | |
Specialized Real Estate Investment Trusts (REITs) – 1.5% | | | |
| | Crown Castle International Corp | | 15,309 | | | 1,744,307 | |
Textiles, Apparel & Luxury Goods – 3.3% | | | |
| | Cie Financiere Richemont SA (REG) | | 22,465 | | | 3,807,351 | |
Wireless Telecommunication Services – 2.2% | | | |
| | Tele2 AB | | 306,761 | | | 2,535,690 | |
Total Common Stocks (cost $85,894,801) | | 106,626,049 | |
Preferred Stocks– 2.7% | | | |
Technology Hardware, Storage & Peripherals – 2.7% | | | |
| | Samsung Electronics Co Ltd((cost $2,598,004) | | 69,316 | | | 3,130,162 | |
Investment Companies– 3.3% | | | |
Money Markets – 3.3% | | | |
| | Janus Henderson Cash Liquidity Fund LLC, 5.1900%ºº,£((cost $3,805,478) | | 3,804,717 | | | 3,805,478 | |
Total Investments (total cost $92,298,283) – 97.8% | | 113,561,689 | |
Cash, Receivables and Other Assets, net of Liabilities – 2.2% | | 2,582,715 | |
Net Assets – 100% | | $116,144,404 | |
| | | | | | |
Summary of Investments by Country - (Long Positions) (unaudited) |
| |
| | | | | % of | |
| | | | | Investment | |
Country | | Value | | Securities | |
United States | | $23,596,288 | | 20.8 | % |
Switzerland | | 17,597,231 | | 15.5 | |
Netherlands | | 13,058,782 | | 11.5 | |
Germany | | 12,808,158 | | 11.3 | |
France | | 10,795,520 | | 9.5 | |
United Kingdom | | 6,960,054 | | 6.1 | |
Taiwan | | 5,712,395 | | 5.0 | |
Sweden | | 5,598,666 | | 4.9 | |
Japan | | 4,485,941 | | 3.9 | |
Denmark | | 3,834,082 | | 3.4 | |
South Korea | | 3,130,162 | | 2.8 | |
Hong Kong | | 2,929,517 | | 2.6 | |
Canada | | 2,066,370 | | 1.8 | |
Finland | | 988,523 | | 0.9 | |
| | | | | | |
| | | | | | |
Total | | $113,561,689 | | 100.0 | % |
| | |
See Notes to Schedule of Investments and Other Information and Notes to Financial Statements. |
| |
Janus Investment Fund | 9 |
Janus Henderson Responsible International Dividend Fund
Schedule of Investments
June 30, 2023
Schedules of Affiliated Investments – (% of Net Assets)
| | | | | | | | | | | |
| | Dividend Income | Realized Gain/(Loss) | Change in Unrealized Appreciation/ Depreciation | Value at 6/30/23 |
Investment Companies - 3.3% |
Money Markets - 3.3% | |
| | Janus Henderson Cash Liquidity Fund LLC, 5.1900%ºº | $ | 122,850 | $ | 338 | $ | (385) | $ | 3,805,478 |
| |
| | | | | | | | | | | |
| | Value at 6/30/22 | Purchases | Sales Proceeds | Value at 6/30/23 |
Investment Companies - 3.3% |
Money Markets - 3.3% | |
| | Janus Henderson Cash Liquidity Fund LLC, 5.1900%ºº | | 4,362,647 | | 44,030,696 | | (44,587,818) | | 3,805,478 |
| | |
See Notes to Schedule of Investments and Other Information and Notes to Financial Statements. |
| |
10 | JUNE 30, 2023 |
Janus Henderson Responsible International Dividend Fund
Notes to Schedule of Investments and Other Information
| | |
MSCI World ex-USA IndexSM | MSCI World ex-USA IndexSM is designed to measure the equity market performance of developed market countries in North America, Europe, and the Asia/Pacific Region, excluding the United States. |
MSCI World IndexSM | MSCI World IndexSM reflects the equity market performance of global developed markets. |
| | |
ADR | American Depositary Receipt |
LLC | Limited Liability Company |
PLC | Public Limited Company |
REG | Registered |
| | |
ºº | Rate shown is the 7-day yield as of June 30, 2023. |
| | |
£ | The Fund may invest in certain securities that are considered affiliated companies. As defined by the Investment Company Act of 1940, as amended, an affiliated company is one in which the Fund owns 5% or more of the outstanding voting securities, or a company which is under common ownership or control. |
| | | | | | | | | | | | | |
The following is a summary of the inputs that were used to value the Fund’s investments in securities and other financial instruments as of June 30, 2023. See Notes to Financial Statements for more information. |
| |
Valuation Inputs Summary |
| | | | | | | |
| | | | | Level 2 - | | Level 3 - |
| | | Level 1 - | | Other Significant | | Significant |
| | | Quoted Prices | | Observable Inputs | | Unobservable Inputs |
| | | | | | | |
Assets | | | | | | |
Investments In Securities: | | | | | | |
Common Stocks | $ | 106,626,049 | $ | - | $ | - |
Preferred Stocks | | 3,130,162 | | - | | - |
Investment Companies | | - | | 3,805,478 | | - |
Total Assets | $ | 109,756,211 | $ | 3,805,478 | $ | - |
| | | | | | | |
Janus Henderson Responsible International Dividend Fund
Statement of Assets and Liabilities
June 30, 2023
| |
See footnotes at the end of the Statement. |
| | | | | | | |
| | | | | | |
Assets: | | | | |
| Unaffiliated investments, at value (cost $88,492,805) | | $ | 109,756,211 | |
| Affiliated investments, at value (cost $3,805,478) | | | 3,805,478 | |
| Cash denominated in foreign currency (cost $15,610) | | | 15,610 | |
| Trustees' deferred compensation | | | 2,937 | |
| Receivables: | | | | |
| | Investments sold | | | 2,001,099 | |
| | Foreign tax reclaims | | | 878,805 | |
| | Dividends | | | 353,553 | |
| | Fund shares sold | | | 179,231 | |
| | Dividends from affiliates | | | 15,848 | |
| Other assets | | | 17,067 | |
Total Assets | | | 117,025,839 | |
Liabilities: | | | | |
| Payables: | | | — | |
| | Fund shares repurchased | | | 615,664 | |
| | Professional fees | | | 61,731 | |
| | Advisory fees | | | 37,793 | |
| | Dividends | | | 23,866 | |
| | 12b-1 Distribution and shareholder servicing fees | | | 13,878 | |
| | Transfer agent fees and expenses | | | 13,326 | |
| | Custodian fees | | | 3,184 | |
| | Trustees' deferred compensation fees | | | 2,937 | |
| | Trustees' fees and expenses | | | 677 | |
| | Affiliated fund administration fees payable | | | 253 | |
| | Accrued expenses and other payables | | | 108,126 | |
Total Liabilities | | | 881,435 | |
Net Assets | | $ | 116,144,404 | |
| | |
See Notes to Financial Statements. |
| |
12 | JUNE 30, 2023 |
Janus Henderson Responsible International Dividend Fund
Statement of Assets and Liabilities
June 30, 2023
| | | | | | | |
| | | | | | |
| | | | | | | |
Net Assets Consist of: | | | | |
| Capital (par value and paid-in surplus) | | $ | 95,994,799 | |
| Total distributable earnings (loss) | | | 20,149,605 | |
Total Net Assets | | $ | 116,144,404 | |
Net Assets - Class A Shares | | $ | 33,194,748 | |
| Shares Outstanding, $0.01 Par Value (unlimited shares authorized) | | | 2,326,248 | |
Net Asset Value Per Share(1) | | $ | 14.27 | |
Maximum Offering Price Per Share(2) | | $ | 15.14 | |
Net Assets - Class C Shares | | $ | 7,572,583 | |
| Shares Outstanding, $0.01 Par Value (unlimited shares authorized) | | | 546,989 | |
Net Asset Value Per Share(1) | | $ | 13.84 | |
Net Assets - Class D Shares | | $ | 17,311,043 | |
| Shares Outstanding, $0.01 Par Value (unlimited shares authorized) | | | 1,211,010 | |
Net Asset Value Per Share | | $ | 14.29 | |
Net Assets - Class I Shares | | $ | 42,375,780 | |
| Shares Outstanding, $0.01 Par Value (unlimited shares authorized) | | | 2,957,800 | |
Net Asset Value Per Share | | $ | 14.33 | |
Net Assets - Class N Shares | | $ | 10,258,739 | |
| Shares Outstanding, $0.01 Par Value (unlimited shares authorized) | | | 717,114 | |
Net Asset Value Per Share | | $ | 14.31 | |
Net Assets - Class S Shares | | $ | 68,118 | |
| Shares Outstanding, $0.01 Par Value (unlimited shares authorized) | | | 4,786 | |
Net Asset Value Per Share | | $ | 14.23 | |
Net Assets - Class T Shares | | $ | 5,363,393 | |
| Shares Outstanding, $0.01 Par Value (unlimited shares authorized) | | | 376,215 | |
Net Asset Value Per Share | | $ | 14.26 | |
| |
(1) Redemption price per share may be reduced for any applicable contingent deferred sales charge. (2) Maximum offering price is computed at 100/94.25 of net asset value. |
| | |
See Notes to Financial Statements. |
| |
Janus Investment Fund | 13 |
Janus Henderson Responsible International Dividend Fund
Statement of Operations
For the year ended June 30, 2023
| | | | | | |
| | | | | |
Investment Income: | | | |
| Dividends | $ | 4,865,109 | |
| Interest | | 223,177 | |
| Dividends from affiliates | | 122,850 | |
| Other income | | 97,033 | |
| Foreign tax withheld | | (422,637) | |
Total Investment Income | | 4,885,532 | |
Expenses: | | | |
| Advisory fees | | 906,455 | |
| 12b-1 Distribution and shareholder servicing fees: | | | |
| | Class A Shares | | 77,710 | |
| | Class C Shares | | 87,595 | |
| | Class S Shares | | 3 | |
| Transfer agent administrative fees and expenses: | | | |
| | Class D Shares | | 18,330 | |
| | Class S Shares | | 156 | |
| | Class T Shares | | 22,645 | |
| Transfer agent networking and omnibus fees: | | | |
| | Class A Shares | | 19,217 | |
| | Class C Shares | | 6,654 | |
| | Class I Shares | | 42,546 | |
| Other transfer agent fees and expenses: | | | |
| | Class A Shares | | 2,263 | |
| | Class C Shares | | 497 | |
| | Class D Shares | | 4,368 | |
| | Class I Shares | | 2,707 | |
| | Class N Shares | | 364 | |
| | Class S Shares | | 3 | |
| | Class T Shares | | 175 | |
| Registration fees | | 131,428 | |
| Professional fees | | 67,084 | |
| Non-affiliated fund administration fees | | 64,018 | |
| Shareholder reports expense | | 25,060 | |
| Custodian fees | | 19,925 | |
| Affiliated fund administration fees | | 3,827 | |
| Trustees’ fees and expenses | | 3,220 | |
| Other expenses | | 54,200 | |
Total Expenses | | 1,560,450 | |
Less: Excess Expense Reimbursement and Waivers | | (243,026) | |
Net Expenses | | 1,317,424 | |
Net Investment Income/(Loss) | | 3,568,108 | |
| | | | | |
| | |
See Notes to Financial Statements. |
| |
14 | JUNE 30, 2023 |
Janus Henderson Responsible International Dividend Fund
Statement of Operations
For the year ended June 30, 2023
| | | | | | |
| | | | | |
Net Realized Gain/(Loss) on Investments: | | | |
| Investments and foreign currency transactions | $ | (1,328,007) | |
| Investments in affiliates | | 338 | |
Total Net Realized Gain/(Loss) on Investments | | (1,327,669) | |
Change in Unrealized Net Appreciation/Depreciation: | | | |
| Investments, foreign currency translations and Trustees’ deferred compensation | | 16,457,717 | |
| Investments in affiliates | | (385) | |
Total Change in Unrealized Net Appreciation/Depreciation | | 16,457,332 | |
Net Increase/(Decrease) in Net Assets Resulting from Operations | $ | 18,697,771 | |
| | | | | |
| | |
See Notes to Financial Statements. |
| |
Janus Investment Fund | 15 |
Janus Henderson Responsible International Dividend Fund
Statements of Changes in Net Assets
| | | | | | | | | |
| | | | | | | | |
| | | Year ended
June 30, 2023 | | Year ended
June 30, 2022 | |
| | | | | | | | | |
Operations: | | | | | | |
| Net investment income/(loss) | $ | 3,568,108 | | $ | 5,015,746 | |
| Net realized gain/(loss) on investments | | (1,327,669) | | | 1,711,019 | |
| Change in unrealized net appreciation/depreciation | | 16,457,332 | | | (23,141,230) | |
Net Increase/(Decrease) in Net Assets Resulting from Operations | | 18,697,771 | | | (16,414,465) | |
Dividends and Distributions to Shareholders: | | | | | | |
| | Class A Shares | | (1,195,350) | | | (1,595,453) | |
| | Class C Shares | | (301,901) | | | (625,376) | |
| | Class D Shares | | (624,019) | | | (661,488) | |
| | Class I Shares | | (1,848,604) | | | (3,107,265) | |
| | Class N Shares | | (299,549) | | | (209,921) | |
| | Class S Shares | | (2,524) | | | (3,069) | |
| | Class T Shares | | (425,938) | | | (1,102,718) | |
Net Decrease from Dividends and Distributions to Shareholders | | (4,697,885) | | | (7,305,290) | |
Capital Share Transactions: | | | | | | |
| | Class A Shares | | (2,285,789) | | | 3,752,398 | |
| | Class C Shares | | (4,111,325) | | | (5,004,143) | |
| | Class D Shares | | 811,931 | | | 5,086,472 | |
| | Class I Shares | | (20,129,493) | | | (3,327,373) | |
| | Class N Shares | | 2,829,502 | | | 6,696,382 | |
| | Class S Shares | | 2,524 | | | 3,069 | |
| | Class T Shares | | (14,219,877) | | | (4,754,543) | |
Net Increase/(Decrease) from Capital Share Transactions | | (37,102,527) | | | 2,452,262 | |
Net Increase/(Decrease) in Net Assets | | (23,102,641) | | | (21,267,493) | |
Net Assets: | | | | | | |
| Beginning of period | | 139,247,045 | | | 160,514,538 | |
| End of period | $ | 116,144,404 | | $ | 139,247,045 | |
| | | | | | | | |
| | |
See Notes to Financial Statements. |
| |
16 | JUNE 30, 2023 |
Janus Henderson Responsible International Dividend Fund
Financial Highlights
| | | | | | | | | | | | | | | | | | | |
Class A Shares | | | | | | | | | | | | | | | |
For a share outstanding during the year ended June 30 | | 2023 | | | 2022 | | | 2021 | | | 2020 | | | 2019 | |
| Net Asset Value, Beginning of Period | | $12.66 | | | $14.83 | | | $12.31 | | | $13.09 | | | $13.18 | |
| Income/(Loss) from Investment Operations: | | | | | | | | | | | | | | | |
| | Net investment income/(loss)(1) | | 0.39 | | | 0.45 | | | 0.56 | | | 0.36 | | | 0.42 | |
| | Net realized and unrealized gain/(loss) | | 1.74 | | | (1.95) | | | 2.40 | | | (0.72) | | | (0.03) | |
| Total from Investment Operations | | 2.13 | | | (1.50) | | | 2.96 | | | (0.36) | | | 0.39 | |
| Less Dividends and Distributions: | | | | | | | | | | | | | | | |
| | Dividends (from net investment income) | | (0.52) | | | (0.48) | | | (0.44) | | | (0.42) | | | (0.37) | |
| | Distributions (from capital gains) | | — | | | (0.19) | | | — | | | — | | | (0.11) | |
| Total Dividends and Distributions | | (0.52) | | | (0.67) | | | (0.44) | | | (0.42) | | | (0.48) | |
| Net Asset Value, End of Period | | $14.27 | | | $12.66 | | | $14.83 | | | $12.31 | | | $13.09 | |
| Total Return* | | 17.42% | | | (10.49)% | | | 24.38% | | | (2.79)% | | | 3.14% | |
| Net Assets, End of Period (in thousands) | | $33,195 | | | $31,754 | | | $33,270 | | | $25,517 | | | $32,262 | |
| Average Net Assets for the Period (in thousands) | | $30,903 | | | $34,299 | | | $28,797 | | | $30,893 | | | $30,675 | |
| Ratios to Average Net Assets**: | | | | | | | | | | | | | | | |
| | Ratio of Gross Expenses | | 1.38% | | | 1.27% | | | 1.24% | | | 1.25% | | | 1.32% | |
| | Ratio of Net Expenses (After Waivers and Expense Offsets) | | 1.18% | | | 1.18% | | | 1.15% | | | 1.16% | | | 1.17% | |
| | Ratio of Net Investment Income/(Loss) | | 2.94% | | | 3.14% | | | 4.06% | | | 2.83% | | | 3.23% | |
| Portfolio Turnover Rate | | 62% | | | 34% | | | 52% | | | 59% | | | 44% | |
| | | | | | | | | | | | | | | | | | | |
| |
* Total return includes adjustments in accordance with generally accepted accounting principles required at the year or period end and are not annualized for periods of less than one full year. ** Annualized for periods of less than one full year. (1) Per share amounts are calculated based on average shares outstanding during the year or period. |
| | |
See Notes to Financial Statements. |
| |
Janus Investment Fund | 17 |
Janus Henderson Responsible International Dividend Fund
Financial Highlights
| | | | | | | | | | | | | | | | | | | |
Class C Shares | | | | | | | | | | | | | | | |
For a share outstanding during the year ended June 30 | | 2023 | | | 2022 | | | 2021 | | | 2020 | | | 2019 | |
| Net Asset Value, Beginning of Period | | $12.32 | | | $14.49 | | | $12.07 | | | $12.89 | | | $13.01 | |
| Income/(Loss) from Investment Operations: | | | | | | | | | | | | | | | |
| | Net investment income/(loss)(1) | | 0.26 | | | 0.32 | | | 0.44 | | | 0.27 | | | 0.31 | |
| | Net realized and unrealized gain/(loss) | | 1.71 | | | (1.88) | | | 2.36 | | | (0.74) | | | (0.01) | |
| Total from Investment Operations | | 1.97 | | | (1.56) | | | 2.80 | | | (0.47) | | | 0.30 | |
| Less Dividends and Distributions: | | | | | | | | | | | | | | | |
| | Dividends (from net investment income) | | (0.45) | | | (0.42) | | | (0.38) | | | (0.35) | | | (0.31) | |
| | Distributions (from capital gains) | | — | | | (0.19) | | | — | | | — | | | (0.11) | |
| Total Dividends and Distributions | | (0.45) | | | (0.61) | | | (0.38) | | | (0.35) | | | (0.42) | |
| Net Asset Value, End of Period | | $13.84 | | | $12.32 | | | $14.49 | | | $12.07 | | | $12.89 | |
| Total Return* | | 16.50% | | | (11.11)% | | | 23.48% | | | (3.68)% | | | 2.41% | |
| Net Assets, End of Period (in thousands) | | $7,573 | | | $10,653 | | | $17,760 | | | $21,018 | | | $30,356 | |
| Average Net Assets for the Period (in thousands) | | $8,950 | | | $15,068 | | | $19,671 | | | $25,897 | | | $30,095 | |
| Ratios to Average Net Assets**: | | | | | | | | | | | | | | | |
| | Ratio of Gross Expenses | | 2.12% | | | 2.01% | | | 1.96% | | | 1.98% | | | 2.06% | |
| | Ratio of Net Expenses (After Waivers and Expense Offsets) | | 1.92% | | | 1.91% | | | 1.87% | | | 1.89% | | | 1.91% | |
| | Ratio of Net Investment Income/(Loss) | | 2.00% | | | 2.27% | | | 3.24% | | | 2.15% | | | 2.48% | |
| Portfolio Turnover Rate | | 62% | | | 34% | | | 52% | | | 59% | | | 44% | |
| | | | | | | | | | | | | | | | | | | |
| |
* Total return includes adjustments in accordance with generally accepted accounting principles required at the year or period end and are not annualized for periods of less than one full year. ** Annualized for periods of less than one full year. (1) Per share amounts are calculated based on average shares outstanding during the year or period. |
| | |
See Notes to Financial Statements. |
| |
18 | JUNE 30, 2023 |
Janus Henderson Responsible International Dividend Fund
Financial Highlights
| | | | | | | | | | | | | | | | | | | |
Class D Shares | | | | | | | | | | | | | | | |
For a share outstanding during the year ended June 30 | | 2023 | | | 2022 | | | 2021 | | | 2020 | | | 2019 | |
| Net Asset Value, Beginning of Period | | $12.68 | | | $14.84 | | | $12.31 | | | $13.09 | | | $13.17 | |
| Income/(Loss) from Investment Operations: | | | | | | | | | | | | | | | |
| | Net investment income/(loss)(1) | | 0.41 | | | 0.49 | | | 0.60 | | | 0.41 | | | 0.42 | |
| | Net realized and unrealized gain/(loss) | | 1.74 | | | (1.97) | | | 2.38 | | | (0.75) | | | —(2) | |
| Total from Investment Operations | | 2.15 | | | (1.48) | | | 2.98 | | | (0.34) | | | 0.42 | |
| Less Dividends and Distributions: | | | | | | | | | | | | | | | |
| | Dividends (from net investment income) | | (0.54) | | | (0.49) | | | (0.45) | | | (0.44) | | | (0.39) | |
| | Distributions (from capital gains) | | — | | | (0.19) | | | — | | | — | | | (0.11) | |
| Total Dividends and Distributions | | (0.54) | | | (0.68) | | | (0.45) | | | (0.44) | | | (0.50) | |
| Net Asset Value, End of Period | | $14.29 | | | $12.68 | | | $14.84 | | | $12.31 | | | $13.09 | |
| Total Return* | | 17.55% | | | (10.33)% | | | 24.58% | | | (2.66)% | | | 3.34% | |
| Net Assets, End of Period (in thousands) | | $17,311 | | | $14,580 | | | $11,877 | | | $6,861 | | | $6,889 | |
| Average Net Assets for the Period (in thousands) | | $15,496 | | | $13,972 | | | $8,639 | | | $7,041 | | | $7,362 | |
| Ratios to Average Net Assets**: | | | | | | | | | | | | | | | |
| | Ratio of Gross Expenses | | 1.27% | | | 1.14% | | | 1.12% | | | 1.20% | | | 1.31% | |
| | Ratio of Net Expenses (After Waivers and Expense Offsets) | | 1.01% | | | 1.01% | | | 0.98% | | | 0.99% | | | 1.01% | |
| | Ratio of Net Investment Income/(Loss) | | 3.12% | | | 3.43% | | | 4.29% | | | 3.20% | | | 3.26% | |
| Portfolio Turnover Rate | | 62% | | | 34% | | | 52% | | | 59% | | | 44% | |
| | | | | | | | | | | | | | | | | | | |
| |
* Total return includes adjustments in accordance with generally accepted accounting principles required at the year or period end and are not annualized for periods of less than one full year. ** Annualized for periods of less than one full year. (1) Per share amounts are calculated based on average shares outstanding during the year or period. (2) Less than $0.005 on a per share basis. |
| | |
See Notes to Financial Statements. |
| |
Janus Investment Fund | 19 |
Janus Henderson Responsible International Dividend Fund
Financial Highlights
| | | | | | | | | | | | | | | | | | | |
Class I Shares | | | | | | | | | | | | | | | |
For a share outstanding during the year ended June 30 | | 2023 | | | 2022 | | | 2021 | | | 2020 | | | 2019 | |
| Net Asset Value, Beginning of Period | | $12.71 | | | $14.86 | | | $12.32 | | | $13.11 | | | $13.19 | |
| Income/(Loss) from Investment Operations: | | | | | | | | | | | | | | | |
| | Net investment income/(loss)(1) | | 0.39 | | | 0.48 | | | 0.59 | | | 0.41 | | | 0.43 | |
| | Net realized and unrealized gain/(loss) | | 1.77 | | | (1.94) | | | 2.40 | | | (0.76) | | | —(2) | |
| Total from Investment Operations | | 2.16 | | | (1.46) | | | 2.99 | | | (0.35) | | | 0.43 | |
| Less Dividends and Distributions: | | | | | | | | | | | | | | | |
| | Dividends (from net investment income) | | (0.54) | | | (0.50) | | | (0.45) | | | (0.44) | | | (0.40) | |
| | Distributions (from capital gains) | | — | | | (0.19) | | | — | | | — | | | (0.11) | |
| Total Dividends and Distributions | | (0.54) | | | (0.69) | | | (0.45) | | | (0.44) | | | (0.51) | |
| Net Asset Value, End of Period | | $14.33 | | | $12.71 | | | $14.86 | | | $12.32 | | | $13.11 | |
| Total Return* | | 17.62% | | | (10.23)% | | | 24.68% | | | (2.68)% | | | 3.41% | |
| Net Assets, End of Period (in thousands) | | $42,376 | | | $55,559 | | | $68,416 | | | $74,386 | | | $88,458 | |
| Average Net Assets for the Period (in thousands) | | $47,935 | | | $66,229 | | | $78,344 | | | $81,753 | | | $97,766 | |
| Ratios to Average Net Assets**: | | | | | | | | | | | | | | | |
| | Ratio of Gross Expenses | | 1.13% | | | 1.04% | | | 0.99% | | | 1.00% | | | 1.06% | |
| | Ratio of Net Expenses (After Waivers and Expense Offsets) | | 0.95% | | | 0.95% | | | 0.91% | | | 0.91% | | | 0.92% | |
| | Ratio of Net Investment Income/(Loss) | | 2.98% | | | 3.30% | | | 4.27% | | | 3.19% | | | 3.35% | |
| Portfolio Turnover Rate | | 62% | | | 34% | | | 52% | | | 59% | | | 44% | |
| | | | | | | | | | | | | | | | | | | |
| |
* Total return includes adjustments in accordance with generally accepted accounting principles required at the year or period end and are not annualized for periods of less than one full year. ** Annualized for periods of less than one full year. (1) Per share amounts are calculated based on average shares outstanding during the year or period. (2) Less than $0.005 on a per share basis. |
| | |
See Notes to Financial Statements. |
| |
20 | JUNE 30, 2023 |
Janus Henderson Responsible International Dividend Fund
Financial Highlights
| | | | | | | | | | | | | | | | | | | |
Class N Shares | | | | | | | | | | | | | | | |
For a share outstanding during the year ended June 30 | | 2023 | | | 2022 | | | 2021 | | | 2020 | | | 2019 | |
| Net Asset Value, Beginning of Period | | $12.69 | | | $14.83 | | | $12.30 | | | $13.08 | | | $13.16 | |
| Income/(Loss) from Investment Operations: | | | | | | | | | | | | | | | |
| | Net investment income/(loss)(1) | | 0.47 | | | 0.60 | | | 0.61 | | | 0.41 | | | 0.42 | |
| | Net realized and unrealized gain/(loss) | | 1.70 | | | (2.05) | | | 2.38 | | | (0.74) | | | 0.01 | |
| Total from Investment Operations | | 2.17 | | | (1.45) | | | 2.99 | | | (0.33) | | | 0.43 | |
| Less Dividends and Distributions: | | | | | | | | | | | | | | | |
| | Dividends (from net investment income) | | (0.55) | | | (0.50) | | | (0.46) | | | (0.45) | | | (0.40) | |
| | Distributions (from capital gains) | | — | | | (0.19) | | | — | | | — | | | (0.11) | |
| Total Dividends and Distributions | | (0.55) | | | (0.69) | | | (0.46) | | | (0.45) | | | (0.51) | |
| Net Asset Value, End of Period | | $14.31 | | | $12.69 | | | $14.83 | | | $12.30 | | | $13.08 | |
| Total Return* | | 17.73% | | | (10.14)% | | | 24.71% | | | (2.56)% | | | 3.48% | |
| Net Assets, End of Period (in thousands) | | $10,259 | | | $6,384 | | | $688 | | | $477 | | | $590 | |
| Average Net Assets for the Period (in thousands) | | $7,853 | | | $3,798 | | | $582 | | | $518 | | | $723 | |
| Ratios to Average Net Assets**: | | | | | | | | | | | | | | | |
| | Ratio of Gross Expenses | | 1.12% | | | 1.08% | | | 1.44% | | | 1.51% | | | 1.39% | |
| | Ratio of Net Expenses (After Waivers and Expense Offsets) | | 0.87% | | | 0.88% | | | 0.84% | | | 0.85% | | | 0.85% | |
| | Ratio of Net Investment Income/(Loss) | | 3.51% | | | 4.30% | | | 4.41% | | | 3.22% | | | 3.28% | |
| Portfolio Turnover Rate | | 62% | | | 34% | | | 52% | | | 59% | | | 44% | |
| | | | | | | | | | | | | | | | | | | |
| |
* Total return includes adjustments in accordance with generally accepted accounting principles required at the year or period end and are not annualized for periods of less than one full year. ** Annualized for periods of less than one full year. (1) Per share amounts are calculated based on average shares outstanding during the year or period. |
| | |
See Notes to Financial Statements. |
| |
Janus Investment Fund | 21 |
Janus Henderson Responsible International Dividend Fund
Financial Highlights
| | | | | | | | | | | | | | | | | | | |
Class S Shares | | | | | | | | | | | | | | | |
For a share outstanding during the year ended June 30 | | 2023 | | | 2022 | | | 2021 | | | 2020 | | | 2019 | |
| Net Asset Value, Beginning of Period | | $12.63 | | | $14.78 | | | $12.27 | | | $13.06 | | | $13.17 | |
| Income/(Loss) from Investment Operations: | | | | | | | | | | | | | | | |
| | Net investment income/(loss)(1) | | 0.41 | | | 0.48 | | | 0.59 | | | 0.39 | | | 0.43 | |
| | Net realized and unrealized gain/(loss) | | 1.73 | | | (1.94) | | | 2.39 | | | (0.75) | | | (0.02) | |
| Total from Investment Operations | | 2.14 | | | (1.46) | | | 2.98 | | | (0.36) | | | 0.41 | |
| Less Dividends and Distributions: | | | | | | | | | | | | | | | |
| | Dividends (from net investment income) | | (0.54) | | | (0.50) | | | (0.47) | | | (0.43) | | | (0.41) | |
| | Distributions (from capital gains) | | — | | | (0.19) | | | — | | | — | | | (0.11) | |
| Total Dividends and Distributions | | (0.54) | | | (0.69) | | | (0.47) | | | (0.43) | | | (0.52) | |
| Net Asset Value, End of Period | | $14.23 | | | $12.63 | | | $14.78 | | | $12.27 | | | $13.06 | |
| Total Return* | | 17.58% | | | (10.27)% | | | 24.68% | | | (2.80)% | | | 3.28% | |
| Net Assets, End of Period (in thousands) | | $68 | | | $58 | | | $65 | | | $52 | | | $53 | |
| Average Net Assets for the Period (in thousands) | | $62 | | | $64 | | | $59 | | | $53 | | | $51 | |
| Ratios to Average Net Assets**: | | | | | | | | | | | | | | | |
| | Ratio of Gross Expenses | | 6.18% | | | 5.83% | | | 6.21% | | | 6.96% | | | 7.11% | |
| | Ratio of Net Expenses (After Waivers and Expense Offsets) | | 1.00% | | | 0.95% | | | 0.91% | | | 1.08% | | | 1.04% | |
| | Ratio of Net Investment Income/(Loss) | | 3.12% | | | 3.36% | | | 4.27% | | | 3.04% | | | 3.32% | |
| Portfolio Turnover Rate | | 62% | | | 34% | | | 52% | | | 59% | | | 44% | |
| | | | | | | | | | | | | | | | | | | |
| |
* Total return includes adjustments in accordance with generally accepted accounting principles required at the year or period end and are not annualized for periods of less than one full year. ** Annualized for periods of less than one full year. (1) Per share amounts are calculated based on average shares outstanding during the year or period. |
| | |
See Notes to Financial Statements. |
| |
22 | JUNE 30, 2023 |
Janus Henderson Responsible International Dividend Fund
Financial Highlights
| | | | | | | | | | | | | | | | | | | |
Class T Shares | | | | | | | | | | | | | | | |
For a share outstanding during the year ended June 30 | | 2023 | | | 2022 | | | 2021 | | | 2020 | | | 2019 | |
| Net Asset Value, Beginning of Period | | $12.65 | | | $14.81 | | | $12.29 | | | $13.08 | | | $13.16 | |
| Income/(Loss) from Investment Operations: | | | | | | | | | | | | | | | |
| | Net investment income/(loss)(1) | | 0.43 | | | 0.46 | | | 0.56 | | | 0.41 | | | 0.43 | |
| | Net realized and unrealized gain/(loss) | | 1.70 | | | (1.95) | | | 2.40 | | | (0.77) | | | (0.02) | |
| Total from Investment Operations | | 2.13 | | | (1.49) | | | 2.96 | | | (0.36) | | | 0.41 | |
| Less Dividends and Distributions: | | | | | | | | | | | | | | | |
| | Dividends (from net investment income) | | (0.52) | | | (0.48) | | | (0.44) | | | (0.43) | | | (0.38) | |
| | Distributions (from capital gains) | | — | | | (0.19) | | | — | | | — | | | (0.11) | |
| Total Dividends and Distributions | | (0.52) | | | (0.67) | | | (0.44) | | | (0.43) | | | (0.49) | |
| Net Asset Value, End of Period | | $14.26 | | | $12.65 | | | $14.81 | | | $12.29 | | | $13.08 | |
| Total Return* | | 17.45% | | | (10.41)% | | | 24.45% | | | (2.80)% | | | 3.29% | |
| Net Assets, End of Period (in thousands) | | $5,363 | | | $20,258 | | | $28,439 | | | $26,296 | | | $15,553 | |
| Average Net Assets for the Period (in thousands) | | $9,029 | | | $24,255 | | | $26,581 | | | $19,478 | | | $11,844 | |
| Ratios to Average Net Assets**: | | | | | | | | | | | | | | | |
| | Ratio of Gross Expenses | | 1.27% | | | 1.21% | | | 1.18% | | | 1.21% | | | 1.28% | |
| | Ratio of Net Expenses (After Waivers and Expense Offsets) | | 1.10% | | | 1.11% | | | 1.09% | | | 1.09% | | | 1.10% | |
| | Ratio of Net Investment Income/(Loss) | | 3.22% | | | 3.16% | | | 4.06% | | | 3.29% | | | 3.36% | |
| Portfolio Turnover Rate | | 62% | | | 34% | | | 52% | | | 59% | | | 44% | |
| | | | | | | | | | | | | | | | | | | |
| |
* Total return includes adjustments in accordance with generally accepted accounting principles required at the year or period end and are not annualized for periods of less than one full year. ** Annualized for periods of less than one full year. (1) Per share amounts are calculated based on average shares outstanding during the year or period. |
| | |
See Notes to Financial Statements. |
| |
Janus Investment Fund | 23 |
Janus Henderson Responsible International Dividend Fund
Notes to Financial Statements
1. Organization and Significant Accounting Policies
Janus Henderson Responsible International Dividend Fund (formerly named Janus Henderson Dividend & Income Builder Fund) (the “Fund”) is a series of Janus Investment Fund (the “Trust”), which is organized as a Massachusetts business trust and is registered under the Investment Company Act of 1940, as amended (the “1940 Act”), as an open-end management investment company, and therefore has applied the specialized accounting and reporting guidance in Financial Accounting Standards Board (“FASB”) Accounting Standards Codification (“ASC”) Topic 946. The Trust offers 39 funds, each of which offers multiple share classes, with differing investment objectives and policies. The Fund seeks income with the potential for capital growth over the long-term. The Fund is classified as diversified, as defined in the 1940 Act. Janus Henderson Investors US LLC is the investment adviser (the “Adviser”) to the Fund.
The Fund offers multiple classes of shares in order to meet the needs of various types of investors. Each class represents an interest in the same portfolio of investments. Certain financial intermediaries may not offer all classes of shares.
Shareholders, including individuals, accounts, as well as the Fund’s portfolio manager(s) and/or investment personnel, may from time to time own (beneficially or of record) a significant percentage of the Fund’s Shares and can be considered to “control” the Fund when that ownership exceeds 25% of the Fund��s assets (and which may differ from control as determined in accordance with United States of America generally accepted accounting principles ("US GAAP")).
Class A Shares are offered through financial intermediary platforms including, but not limited to, traditional brokerage platforms, mutual fund wrap fee programs, bank trust platforms, and retirement platforms.
Class C Shares are offered through financial intermediary platforms including, but not limited to, traditional brokerage platforms, mutual fund wrap fee programs, and bank trust platforms.
Class C Shares are closed to investments by new employer-sponsored retirement plans and existing employer-sponsored retirement plans are no longer able to make additional purchases or exchanges into Class C Shares.
The Fund currently implements an automatic conversion feature pursuant to which Class C Shares that have been held for eight years are automatically converted to Class A Shares without the imposition of any sales charge, fee or other charge. The conversion will generally occur no later than ten business days in the month following the month of the eighth anniversary of the date of purchase. Class C Shares purchased through the reinvestment of dividends and other distributions on Class C Shares will convert to Class A Shares at the same time as the original Class C Shares with respect to which they were purchased. For Class C Shares held in omnibus accounts on intermediary platforms, the Fund relies on these intermediaries to implement this conversion feature. Your financial intermediary may have separate policies and procedures as to when and how Class C Shares may be converted to Class A Shares.
Effective July 6, 2020, Class D Shares are available to new investors, subject to any closed fund policies for a Fund, as applicable. Previously, Class D Shares were only available to investors who already had a direct account with the Janus Henderson funds; immediate family members or members of the same household of an eligible individual investor; and existing beneficial owners of sole proprietorships or partnerships that hold accounts directly with the Janus Henderson funds.
Class I Shares are available through certain financial intermediary platforms including, but not limited to, mutual fund wrap fee programs, managed account programs, asset allocation programs, bank trust platforms, as well as certain retirement platforms. Class I Shares are also available to certain direct institutional investors including, but not limited to, corporations, certain retirement plans, public plans, and foundations/endowments, who established Class I Share accounts before August 4, 2017.
Class N Shares are generally available only to financial intermediaries purchasing on behalf of: 1) certain adviser-assisted, employer-sponsored retirement plans, including 401(k) plans, 457 plans, 403(b) plans, Taft-Hartley multi-employer plans, profit-sharing and money purchase pension plans, defined benefit plans and certain welfare benefit plans, such as health savings accounts, and nonqualified deferred compensation plans; and 2) retail investors purchasing in qualified or nonqualified accounts, whose accounts are held through an omnibus account at their financial intermediary, and where the financial intermediary requires no payment or reimbursement from the Fund, the Adviser, or its affiliates. Class N Shares are also available to Janus Henderson proprietary products and to certain direct institutional investors approved by Janus Henderson Distributors US LLC (the “Distributor”) including, but not limited to,
Janus Henderson Responsible International Dividend Fund
Notes to Financial Statements
corporations, certain retirement plans, public plans, and foundations and endowments, subject to minimum investment requirements.
Class S Shares are offered through financial intermediary platforms including, but not limited to, retirement platforms and asset allocation, mutual fund wrap, or other discretionary or nondiscretionary fee-based investment advisory programs. In addition, Class S Shares may be available through certain financial intermediaries who have an agreement with the Adviser or its affiliates to offer Class S Shares on their supermarket platforms.
Class T Shares are available through certain financial intermediary platforms including, but not limited to, mutual fund wrap fee programs, managed account programs, asset allocation programs, bank trust platforms, as well as certain retirement platforms. In addition, Class T Shares may be available through certain financial intermediaries who have an agreement with the Adviser or its affiliates to offer Class T Shares on their supermarket platforms.
The following accounting policies have been followed by the Fund and are in conformity with US GAAP.
Investment Valuation
Fund holdings are valued in accordance with policies and procedures established by the Adviser pursuant to Rule 2a-5 under the 1940 Act and approved by and subject to the oversight of the Trustees (the “Valuation Procedures”). Equity securities traded on a domestic securities exchange are generally valued at readily available market quotations, which are (i) the official close prices or (ii) last sale prices on the primary market or exchange in which the securities trade. If such price is lacking for the trading period immediately preceding the time of determination, such securities are generally valued at their current bid price. Equity securities that are traded on a foreign exchange are generally valued at the closing prices on such markets. In the event that there is no current trading volume on a particular security in such foreign exchange, the bid price from the primary exchange is generally used to value the security. Foreign securities and currencies are converted to U.S. dollars using the current spot USD dollar exchange rate in effect at the close of the New York Stock Exchange (“NYSE”). The Adviser will determine the market value of individual securities held by it by using prices provided by one or more Adviser-approved professional pricing services or, as needed, by obtaining market quotations from independent broker-dealers. Most debt securities are valued in accordance with the evaluated bid price supplied by the pricing service that is intended to reflect market value. The evaluated bid price supplied by the pricing service is an evaluation that may consider factors such as security prices, yields, maturities and ratings. Certain short-term securities maturing within 60 days or less may be evaluated and valued on an amortized cost basis provided that the amortized cost determined approximates market value. Securities for which market quotations or evaluated prices are not readily available or deemed unreliable are valued at fair value determined in good faith by the Adviser pursuant to the Valuation Procedures. Circumstances in which fair valuation may be utilized include, but are not limited to: (i) a significant event that may affect the securities of a single issuer, such as a merger, bankruptcy, or significant issuer-specific development; (ii) an event that may affect an entire market, such as a natural disaster or significant governmental action; (iii) a nonsignificant event such as a market closing early or not opening, or a security trading halt; and (iv) pricing of a nonvalued security and a restricted or nonpublic security. Special valuation considerations may apply with respect to “odd-lot” fixed-income transactions which, due to their small size, may receive evaluated prices by pricing services which reflect a large block trade and not what actually could be obtained for the odd-lot position. The value of the securities of other mutual funds held by the Fund, if any, will be calculated using the NAV of such mutual funds, and the prospectuses for such mutual funds explain the circumstances under which they use fair valuation and the effects of using fair valuation. The value of the securities of any cash management pooled investment vehicles that operate as money market funds held by the Fund, if any, will be calculated using the NAV of such funds.
Valuation Inputs Summary
FASB ASC 820, Fair Value Measurements and Disclosures (“ASC 820”), defines fair value, establishes a framework for measuring fair value, and expands disclosure requirements regarding fair value measurements. This standard emphasizes that fair value is a market-based measurement that should be determined based on the assumptions that market participants would use in pricing an asset or liability and establishes a hierarchy that prioritizes inputs to valuation techniques used to measure fair value. These inputs are summarized into three broad levels:
Level 1 – Unadjusted quoted prices in active markets the Fund has the ability to access for identical assets or liabilities.
Level 2 – Observable inputs other than unadjusted quoted prices included in Level 1 that are observable for the asset or liability either directly or indirectly. These inputs may include quoted prices for the identical instrument on
Janus Henderson Responsible International Dividend Fund
Notes to Financial Statements
an inactive market, prices for similar instruments, interest rates, prepayment speeds, credit risk, yield curves, default rates and similar data.
Assets or liabilities categorized as Level 2 in the hierarchy generally include: debt securities fair valued in accordance with the evaluated bid or ask prices supplied by a pricing service; securities traded on OTC markets and listed securities for which no sales are reported that are fair valued at the latest bid price (or yield equivalent thereof) obtained from one or more dealers transacting in a market for such securities or by a pricing service approved by the Fund’s Trustees; certain short-term debt securities with maturities of 60 days or less that are fair valued at amortized cost; and equity securities of foreign issuers whose fair value is determined by using systematic fair valuation models provided by independent third parties in order to adjust for stale pricing which may occur between the close of certain foreign exchanges and the close of the NYSE. Other securities that may be categorized as Level 2 in the hierarchy include, but are not limited to, preferred stocks, bank loans, swaps, investments in unregistered investment companies, options, and forward contracts.
Level 3 – Unobservable inputs for the asset or liability to the extent that relevant observable inputs are not available, representing the Fund’s own assumptions about the assumptions that a market participant would use in valuing the asset or liability, and that would be based on the best information available.
There have been no significant changes in valuation techniques used in valuing any such positions held by the Fund since the beginning of the fiscal year.
The inputs or methodology used for fair valuing securities are not necessarily an indication of the risk associated with investing in those securities. The summary of inputs used as of June 30, 2023 to fair value the Fund’s investments in securities and other financial instruments is included in the “Valuation Inputs Summary” in the Notes to Schedule of Investments and Other Information.
Investment Transactions and Investment Income
Investment transactions are accounted for as of the date purchased or sold (trade date). Dividend income is recorded on the ex-dividend date. Certain dividends from foreign securities will be recorded as soon as the Fund is informed of the dividend, if such information is obtained subsequent to the ex-dividend date. Dividends from foreign securities may be subject to withholding taxes in foreign jurisdictions. Non-cash dividends, if any, are recorded on the ex-dividend date at fair value. Interest income is recorded daily on the accrual basis and includes amortization of premiums and accretion of discounts. The Fund classifies gains and losses on prepayments received as an adjustment to interest income. Debt securities may be placed in non-accrual status and related interest income may be reduced by stopping current accruals and writing off interest receivables when collection of all or a portion of interest has become doubtful. Gains and losses are determined on the identified cost basis, which is the same basis used for federal income tax purposes. Income, as well as gains and losses, both realized and unrealized, are allocated daily to each class of shares based upon the ratio of net assets represented by each class as a percentage of total net assets.
Expenses
The Fund bears expenses incurred specifically on its behalf. Each class of shares bears a portion of general expenses, which are allocated daily to each class of shares based upon the ratio of net assets represented by each class as a percentage of total net assets. Expenses directly attributable to a specific class of shares are charged against the operations of such class.
Estimates
The preparation of financial statements in conformity with US GAAP requires management to make estimates and assumptions that affect the reported amount of assets and liabilities and disclosure of contingent assets and liabilities at the date of the financial statements, and the reported amounts of income and expenses during the reporting period. Actual results could differ from those estimates.
Indemnifications
In the normal course of business, the Fund may enter into contracts that contain provisions for indemnification of other parties against certain potential liabilities. The Fund’s maximum exposure under these arrangements is unknown, and would involve future claims that may be made against the Fund that have not yet occurred. Currently, the risk of material loss from such claims is considered remote.
Janus Henderson Responsible International Dividend Fund
Notes to Financial Statements
Foreign Currency Translations
The Fund does not isolate that portion of the results of operations resulting from the effect of changes in foreign exchange rates on investments from the fluctuations arising from changes in market prices of securities held at the date of the financial statements. Net unrealized appreciation or depreciation of investments and foreign currency translations arise from changes in the value of assets and liabilities, including investments in securities held at the date of the financial statements, resulting from changes in the exchange rates and changes in market prices of securities held.
Currency gains and losses are also calculated on payables and receivables that are denominated in foreign currencies. The payables and receivables are generally related to foreign security transactions and income translations.
Foreign currency-denominated assets and forward currency contracts may involve more risks than domestic transactions, including currency risk, counterparty risk, political and economic risk, regulatory risk and equity risk. Risks may arise from unanticipated movements in the value of foreign currencies relative to the U.S. dollar.
Dividends and Distributions
Dividends are declared and distributed quarterly for the fund. Realized capital gains, if any, are declared and distributed in December. The Fund may treat a portion of the amount paid to redeem shares as a distribution of investment company taxable income and realized capital gains that are reflected in the net asset value. This practice, commonly referred to as “equalization,” has no effect on the redeeming shareholder or a Fund’s total return, but may reduce the amounts that would otherwise be required to be paid as taxable dividends to the remaining shareholders. It is possible that the Internal Revenue Service (IRS) could challenge the Fund's equalization methodology or calculations, and any such challenge could result in additional tax, interest, or penalties to be paid by the Fund.
The Fund may make certain investments in real estate investment trusts (“REITs”) which pay dividends to their shareholders based upon funds available from operations. It is quite common for these dividends to exceed the REITs’ taxable earnings and profits, resulting in the excess portion of such dividends being designated as a return of capital. If the Fund distributes such amounts, such distributions could constitute a return of capital to shareholders for federal income tax purposes.
Federal Income Taxes
The Fund intends to continue to qualify as a regulated investment company and distribute all of its taxable income in accordance with the requirements of Subchapter M of the Internal Revenue Code. Management has analyzed the Fund’s tax positions taken for all open federal income tax years, generally a three-year period, and has concluded that no provision for federal income tax is required in the Fund’s financial statements. The Fund is not aware of any tax positions for which it is reasonably possible that the total amounts of unrecognized tax benefits will significantly change in the next twelve months.
2. Other Investments and Strategies
Market Risk
The value of the Fund’s portfolio may decrease if the value of one or more issuers in the Fund’s portfolio decreases. Further, regardless of how well individual companies or securities perform, the value of the Fund’s portfolio could also decrease if there are deteriorating economic or market conditions, including, but not limited to, a general decline in prices on the stock markets, a general decline in real estate markets, a decline in commodities prices, or if the market favors different types of securities than the types of securities in which the Fund invests. If the value of the Fund’s portfolio decreases, the Fund’s NAV will also decrease, which means if you sell your shares in the Fund you may lose money. Market risk may affect a single issuer, industry, economic sector, or the market as a whole. The increasing interconnectivity between global economies and financial markets increases the likelihood that events or conditions in one region or financial market may adversely impact issuers in a different country, region or financial market. Social, political, economic and other conditions and events, such as natural disasters, health emergencies (e.g., epidemics and pandemics), terrorism, conflicts, including related sanctions, and social unrest, could reduce consumer demand or economic output, result in market closures, travel restrictions and/or quarantines, and generally have a significant impact on the global economies and financial markets.
• COVID-19 Pandemic. The effects of COVID-19 have contributed to increased volatility in global financial markets and have affected and may continue to affect certain countries, regions, issuers, industries and market sectors more dramatically than others. These conditions and events could have a significant impact on the Fund and its investments,
Janus Henderson Responsible International Dividend Fund
Notes to Financial Statements
the Fund’s ability to meet redemption requests, and the processes and operations of the Fund’s service providers, including the Adviser.
• Russia/Ukraine Invasion. Russia launched a large-scale invasion of Ukraine on February 24, 2022. The extent and duration of the military action, resulting sanctions and resulting future market disruptions in the region are impossible to predict, but could be significant and have a severe adverse effect on the region, including significant negative impacts on the economy and the markets for certain securities and commodities, such as oil and natural gas, as well as other sectors.
Emerging Market Investing
Within the parameters of its specific investment policies, the Fund may invest in securities of issuers or companies from or with exposure to one or more “developing countries” or “emerging market countries.” Such countries include but are not limited to countries included in the MSCI Emerging Markets IndexSM. Emerging market countries in which the Fund may invest include frontier market countries, the economies of which are less developed than other emerging market countries. To the extent that the Fund invests a significant amount of its assets in one or more of these countries, its returns and net asset value may be affected to a large degree by events and economic conditions in such countries. The risks of foreign investing are heightened when investing in emerging markets, which may result in the price of investments in emerging markets experiencing sudden and sharp price swings. In many developing markets, there is less government supervision and regulation of stock exchanges, brokers, and listed companies, making these investments potentially more volatile in price and less liquid than investments in developed securities markets, resulting in greater risk to investors. Similarly, issuers in such markets may not be subject to regulatory, accounting, auditing, and financial reporting and recordkeeping standards comparable to those to which U.S. companies are subject. There is a risk in developing countries that a current or future economic or political crisis could lead to price controls, forced mergers of companies, expropriation or confiscatory taxation, imposition or enforcement of foreign ownership limits, seizure, nationalization, sanctions or imposition of restrictions by various governmental entities on investment and trading, or creation of government monopolies, any of which may have a detrimental effect on the Fund’s investments. In addition, the Fund’s investments may be denominated in foreign currencies and therefore, changes in the value of a country’s currency compared to the U.S. dollar may affect the value of the Fund’s investments. To the extent that the Fund invests a significant portion of its assets in the securities of issuers in or companies of a single country or region, it is more likely to be impacted by events or conditions affecting that country or region, which could have a negative impact on the Fund’s performance. Developing countries may also experience a higher level of exposure and vulnerability to the adverse effects of climate change. This can be attributed to both the geographic location of emerging market countries and/or a country’s lack of access to technology or resources to adjust and adapt to its effects. An increased occurrence and severity of natural disasters and extreme weather events such as droughts and decreased crop yields, heat waves, flooding and rising sea levels, and increased spread of disease, could cause harmful effects to the performance of affected economies. Additionally, foreign and emerging market risks, including, but not limited to, price controls, expropriation or confiscatory taxation, imposition or enforcement of foreign ownership limits, nationalization, and restrictions on repatriation of assets may be heightened to the extent the Fund invests in Chinese local market securities.
3. Investment Advisory Agreements and Other Transactions with Affiliates
The Fund pays the Adviser an investment advisory fee which is calculated daily and paid monthly. The following table reflects the Fund’s contractual investment advisory fee rate (expressed as an annual rate).
| | |
Average Daily Net Assets of the Portfolio | Contractual Investment Advisory Fee (%) |
First $1 Billion | 0.75 |
Next $1 Billion | 0.65 |
Above $2 Billion | 0.55 |
The Fund’s actual investment advisory fee rate for the reporting period was 0.75% of average annual net assets before any applicable waivers.
The Adviser has entered into a personnel-sharing arrangement with its foreign (non-U.S.) affiliates, Henderson Global Investors Limited, Henderson Global Investors (Japan) Ltd., and Henderson Global Investors (Singapore) Ltd. (collectively, “HGIL”), pursuant to which HGIL and certain employees of HGIL serve as “associated persons” of the
Janus Henderson Responsible International Dividend Fund
Notes to Financial Statements
Adviser. In this capacity, such employees of HGIL are subject to the oversight and supervision of the Adviser and may provide portfolio management, research, and related services to the Fund on behalf of the Adviser.
The Adviser has contractually agreed to waive the investment advisory fee and/or reimburse operating expenses to the extent that the Fund’s total annual fund operating expenses, excluding the fees payable pursuant to a Rule 12b-1 plan, shareholder servicing fees, such as transfer agency fees (including out-of-pocket costs), administrative services fees and any networking/omnibus payable by any share class, brokerage commissions, interest, dividends, taxes, acquired fund fees and expenses, and extraordinary expenses, exceed the annual rate of 0.84% of the Fund’s average daily net assets. The Adviser has agreed to continue the waivers for at least a one-year period commencing October 28, 2022. If applicable, amounts waived and/or reimbursed to the Fund by the Adviser are disclosed as “Excess Expense Reimbursement and Waivers” on the Statement of Operations.
The Adviser serves as administrator to the Fund pursuant to an administration agreement between the Adviser and the Trust. Under the administration agreement, the Adviser is authorized to perform, or cause others to perform certain administration, compliance, and accounting services to the Fund, including providing office space for the Fund, and is reimbursed by the Fund for certain of its costs in providing these services (to the extent the Adviser seeks reimbursement and such costs are not otherwise waived). In addition, employees of the Adviser and/or its affiliates may serve as officers of the Trust. The Fund pays for some or all of the salaries, fees, and expenses of the Adviser employees and Fund officers, with respect to certain specified administration functions they perform on behalf of the Fund. The Fund pays these costs based on out-of-pocket expenses incurred by the Adviser, and these costs are separate and apart from advisory fees and other expenses paid in connection with the investment advisory services the Adviser (or any subadvisor, as applicable) provides to the Fund. These amounts are disclosed as “Affiliated fund administration fees” on the Statement of Operations. In addition, some expenses related to compensation payable to the Fund’s Chief Compliance Officer and certain compliance staff, all of whom are employees of the Adviser and/or its affiliates, are shared with the Fund. Total compensation of $343,237 was paid to the Chief Compliance Officer and certain compliance staff by the Trust during the year ended June 30, 2023. The Fund's portion is reported as part of “Other expenses” on the Statement of Operations.
Janus Henderson Services US LLC (the “Transfer Agent”), a wholly-owned subsidiary of the Adviser, is the Fund’s transfer agent. The Transfer Agent provides or arranges for the provision of shareholder services including, but not limited to, recordkeeping, subaccounting, answering inquiries regarding accounts, order processing, transaction confirmations, the mailing of prospectuses and shareholder reports, and other shareholder services provided to or on behalf of shareholders. These amounts are disclosed as “Transfer agent administrative fees and expenses” on the Statement of Operations.
Class D Shares of the Fund pay the Transfer Agent an annual administrative services fee based on the average daily net assets of Class D Shares as detailed below.
| | |
Average Daily Net Assets of Class D Shares of the Janus Henderson funds | Administrative Services Fee |
Under $40 billion | 0.12% |
$40 billion – $49.9 billion | 0.10% |
Over $49.9 billion | 0.08% |
During the reporting period, the administrative services fee rate was 0.12%.
The Transfer Agent receives an administrative services fee at an annual rate of up to 0.25% of the average daily net assets of the Fund’s Class S Shares and Class T Shares for providing or procuring administrative services to investors in Class S Shares and Class T Shares of the Fund. The Transfer Agent expects to use all or a significant portion of this fee to compensate retirement plan service providers, broker-dealers, bank trust departments, financial advisors, and other financial intermediaries for providing these services. The Transfer Agent may keep certain amounts retained for reimbursement of out-of-pocket costs incurred for servicing clients of Class S Shares and Class T Shares.
Shareholder Services provided by these financial intermediaries may include, but are not limited to, recordkeeping, subaccounting, order processing, providing order confirmations, periodic statements, forwarding prospectuses, shareholder reports, and other materials to existing customers, answering inquiries regarding accounts, and other administrative services. Order processing includes the submission of transactions through the National Securities Clearing Corporation (“NSCC”) or similar systems, or those processed on a manual basis with the Adviser. For all share classes, the Transfer Agent also seeks reimbursement for costs it incurs as transfer agent and for providing servicing.
Janus Henderson Responsible International Dividend Fund
Notes to Financial Statements
Certain, but not all, intermediaries may charge administrative fees to investors in Class A Shares, Class C Shares, and Class I Shares for administrative services provided on behalf of such investors. These administrative fees are paid by the Class A Shares, Class C Shares, and Class I Shares of the Fund to the Transfer Agent, which uses such fees to reimburse intermediaries. Consistent with the Transfer Agency Agreement between the Transfer Agent and the Fund, the Transfer Agent may negotiate the level, structure, and/or terms of the administrative fees with intermediaries requiring such fees on behalf of the Fund. The Adviser and its affiliates benefit from an increase in assets that may result from such relationships. The Adviser has agreed to limit these fees up to 0.20% for Class A Shares and Class C Shares, and up to 0.15% for Class I Shares on an annual basis based on the daily net assets of each share class. Such limits are subject to change by the Trustees in the future. These amounts are disclosed as “Transfer agent networking and omnibus fees” on the Statement of Operations.
The Transfer Agent is not compensated for its services related to the shares, except for out-of-pocket costs, although the Transfer Agent is compensated for its services related to Fund’s Class D Shares. These amounts are disclosed as “Other transfer agent fees and expenses” on the Statement of Operations.
Under distribution and shareholder servicing plans (the “Plans”) adopted in accordance with Rule 12b-1 under the 1940 Act, the Fund pays the Trust’s distributor, the Distributor, a wholly-owned subsidiary of the Adviser, a fee for the sale and distribution and/or shareholder servicing of the shares based on the average daily net assets for each share class at an annual rate of up to 0.25% for Class A Shares, up to 1.00% for Class C Shares, and up to 0.25% for Class S Shares. Under the terms of the Plans, the Trust is authorized to make payments to the Distributor for remittance to retirement plan service providers, broker-dealers, bank trust departments, financial advisors, and other financial intermediaries, as compensation for distribution and/or shareholder services performed by such entities for their customers who are investors in the Fund. These amounts are disclosed as “12b-1 Distribution and shareholder servicing fees” on the Statement of Operations.
Class A Shares include a 5.75% upfront sales charge of the offering price of the Fund. The sales charge is allocated between the Distributor and financial intermediaries. During the year ended June 30, 2023, the Distributor retained upfront sales charges of $1,033.
A contingent deferred sales charge (“CDSC”) of 1.00% will be deducted with respect to Class A Shares purchased without a sales load and redeemed within 12 months of purchase, unless waived. Any applicable CDSC will be 1.00% of the lesser of the original purchase price or the value of the redemption of the Class A Shares redeemed. There were no CDSCs paid by redeeming shareholders of Class A Shares to the Distributor during the year ended June 30, 2023.
A CDSC of 1.00% will be deducted with respect to Class C Shares redeemed within 12 months of purchase, unless waived. Any applicable CDSC will be 1.00% of the lesser of the original purchase price or the value of the redemption of the Class C Shares redeemed. During the year ended June 30, 2023, redeeming shareholders of Class C Shares paid CDSCs of $197.
The Board of Trustees has adopted a deferred compensation plan (the “Deferred Plan”) for independent Trustees to elect to defer receipt of all or a portion of the annual compensation they are entitled to receive from the Fund. All deferred fees are credited to an account established in the name of the Trustees. The amounts credited to the account then increase or decrease, as the case may be, in accordance with the performance of one or more of the Janus Henderson funds that are selected by the Trustees. The account balance continues to fluctuate in accordance with the performance of the selected fund or funds until final payment of all amounts are credited to the account. The fluctuation of the account balance is recorded by the Fund as unrealized appreciation/(depreciation) and is included as of June 30, 2023 on the Statement of Assets and Liabilities in the asset, “Trustees’ deferred compensation,” and liability, “Trustees’ deferred compensation fees.” Additionally, the recorded unrealized appreciation/(depreciation) is included in “Total distributable earnings (loss)” on the Statement of Assets and Liabilities. Deferred compensation expenses for the year ended June 30, 2023 are included in “Trustees’ fees and expenses” on the Statement of Operations. Trustees are allowed to change their designation of mutual funds from time to time. Amounts will be deferred until distributed in accordance with the Deferred Plan. Deferred fees of $426,025 were paid by the Trust to the Trustees under the Deferred Plan during the year ended June 30, 2023.
Pursuant to the provisions of the 1940 Act and related rules, the Fund may participate in an affiliated or non-affiliated cash sweep program. In the cash sweep program, uninvested cash balances of the Fund may be used to purchase shares of affiliated or non-affiliated money market funds or cash management pooled investment vehicles that operate as money market funds. The Fund is eligible to participate in the cash sweep program (the “Investing Funds”). The
Janus Henderson Responsible International Dividend Fund
Notes to Financial Statements
Adviser has an inherent conflict of interest because of its fiduciary duties to the affiliated money market funds or cash management pooled investment vehicles and the Investing Funds. Janus Henderson Cash Liquidity Fund LLC (the “Sweep Vehicle”) is an affiliated unregistered cash management pooled investment vehicle that invests primarily in highly-rated short-term fixed-income securities. The Sweep Vehicle operates pursuant to the provisions of the 1940 Act that govern the operation of money market funds and prices its shares at NAV reflecting market-based values of its portfolio securities (i.e., a “floating” NAV) rounded to the fourth decimal place (e.g., $1.0000). The Sweep Vehicle is permitted to impose a liquidity fee (of up to 2%) on redemptions from the Sweep Vehicle or a redemption gate that temporarily suspends redemptions from the Sweep Vehicle for up to 10 business days during a 90 day period. There are no restrictions on the Fund's ability to withdraw investments from the Sweep Vehicle at will, and there are no unfunded capital commitments due from the Fund to the Sweep Vehicle. The Sweep Vehicle does not charge any management fee, sales charge or service fee.
Any purchases and sales, realized gains/losses and recorded dividends from affiliated investments during the year ended June 30, 2023 can be found in the “Schedules of Affiliated Investments” located in the Schedule of Investments.
As of June 30, 2023, shares of the Fund were owned by affiliates of the Adviser, and/or other funds advised by the Adviser, as indicated in the table below:
| | | | | | | |
Class | % of Class Owned | | % of Fund Owned | | |
Class A Shares | - | % | - | % | |
Class C Shares | - | | - | | |
Class D Shares | - | | - | | |
Class I Shares | - | | - | | |
Class N Shares | 1 | | -* | | |
Class S Shares | 100 | | -* | | |
Class T Shares | - | | - | | |
| | | | | | |
* | Less than 0.50% | | | | | |
4. Federal Income Tax
The tax components of capital shown in the table below represent: (1) distribution requirements the Fund must satisfy under the income tax regulations; (2) losses or deductions the Fund may be able to offset against income and gains realized in future years; and (3) unrealized appreciation or depreciation of investments for federal income tax purposes.
Other book to tax differences primarily consist of deferred compensation and foreign currency contract adjustments. The Fund has elected to treat gains and losses on forward foreign currency contracts as capital gains and losses, if applicable. Other foreign currency gains and losses on debt instruments are treated as ordinary income for federal income tax purposes pursuant to Section 988 of the Internal Revenue Code.
| | | | | | | |
| | | | Other Book | Net Tax | |
Undistributed
Ordinary Income | Undistributed
Long-Term Gains | Accumulated
Capital Losses | Loss Deferrals | to Tax
Differences | Appreciation/
(Depreciation) | |
$ 1,567,398 | $ - | $ (1,598,701) | $ - | $ 13,758 | $ 20,167,150 | |
Janus Henderson Responsible International Dividend Fund
Notes to Financial Statements
Accumulated capital losses noted below represent net capital loss carryovers, as of June 30, 2023, that may be available to offset future realized capital gains and thereby reduce future taxable gains distributions. The following table shows these capital loss carryovers.
| | | | | | |
| | | | | |
Capital Loss Carryover Schedule | | |
For the year ended June 30, 2023 | | |
| No Expiration | | | |
| Short-Term | Long-Term | Accumulated
Capital Losses | | |
| $(1,598,701) | $ - | $ (1,598,701) | | |
The aggregate cost of investments and the composition of unrealized appreciation and depreciation of investment securities for federal income tax purposes as of June 30, 2023 are noted below. The primary differences between book and tax appreciation or depreciation of investments are wash sale loss deferrals and investments in partnerships.
| | | | |
Federal Tax Cost | Unrealized
Appreciation | Unrealized
(Depreciation) | Net Tax Appreciation/
(Depreciation) |
$ 93,394,539 | $22,888,420 | $ (2,721,270) | $ 20,167,150 |
Income and capital gains distributions are determined in accordance with income tax regulations that may differ from US GAAP. These differences are due to differing treatments for items such as net short-term gains, deferral of wash sale losses, foreign currency transactions, and capital loss carryovers. Certain permanent differences such as tax returns of capital and net investment losses noted below have been reclassified to capital.
| | | | | |
For the year ended June 30, 2023 | |
Distributions | | |
From Ordinary Income | From Long-Term Capital Gains | Tax Return of Capital | Net Investment Loss | |
$ 4,697,885 | $ - | $ - | $ - | |
| | | | | |
For the year ended June 30, 2022 | |
Distributions | | |
From Ordinary Income | From Long-Term Capital Gains | Tax Return of Capital | Net Investment Loss | |
$ 5,209,071 | $ 2,096,219 | $ - | $ - | |
Permanent book to tax basis differences may result in reclassifications between the components of net assets. These differences have no impact on the results of operations or net assets.
Janus Henderson Responsible International Dividend Fund
Notes to Financial Statements
5. Capital Share Transactions
| | | | | | | |
| | | | | | |
| | Year ended June 30, 2023 | | Year ended June 30, 2022 |
| | Shares | Amount | | Shares | Amount |
| | | | | | | |
Class A Shares: | | | | | |
Shares sold | 422,765 | $ 5,619,267 | | 459,828 | $ 6,635,416 |
Reinvested dividends and distributions | 91,268 | 1,153,590 | | 109,704 | 1,542,992 |
Shares repurchased | (695,081) | (9,058,646) | | (305,520) | (4,426,010) |
Net Increase/(Decrease) | (181,048) | $ (2,285,789) | | 264,012 | $ 3,752,398 |
Class C Shares: | | | | | |
Shares sold | 48,140 | $ 592,045 | | 113,623 | $ 1,630,546 |
Reinvested dividends and distributions | 24,431 | 294,810 | | 44,603 | 615,637 |
Shares repurchased | (390,147) | (4,998,180) | | (519,115) | (7,250,326) |
Net Increase/(Decrease) | (317,576) | $ (4,111,325) | | (360,889) | $ (5,004,143) |
Class D Shares: | | | | | |
Shares sold | 287,663 | $ 3,884,555 | | 607,184 | $ 8,834,472 |
Reinvested dividends and distributions | 47,822 | 606,039 | | 45,858 | 643,416 |
Shares repurchased | (274,281) | (3,678,663) | | (303,717) | (4,391,416) |
Net Increase/(Decrease) | 61,204 | $ 811,931 | | 349,325 | $ 5,086,472 |
Class I Shares: | | | | | |
Shares sold | 1,743,365 | $ 21,268,990 | | 704,857 | $10,313,050 |
Reinvested dividends and distributions | 146,751 | 1,830,415 | | 218,121 | 3,084,835 |
Shares repurchased | (3,303,997) | (43,228,898) | | (1,153,891) | (16,725,258) |
Net Increase/(Decrease) | (1,413,881) | $(20,129,493) | | (230,913) | $ (3,327,373) |
Class N Shares: | | | | | |
Shares sold | 357,128 | $ 4,720,695 | | 489,624 | $ 7,162,912 |
Reinvested dividends and distributions | 23,217 | 299,549 | | 15,140 | 209,921 |
Shares repurchased | (166,504) | (2,190,742) | | (47,879) | (676,451) |
Net Increase/(Decrease) | 213,841 | $ 2,829,502 | | 456,885 | $ 6,696,382 |
Class S Shares: | | | | | |
Shares sold | - | $ - | | - | $ - |
Reinvested dividends and distributions | 200 | 2,524 | | 219 | 3,069 |
Shares repurchased | - | - | | - | - |
Net Increase/(Decrease) | 200 | $ 2,524 | | 219 | $ 3,069 |
Class T Shares: | | | | | |
Shares sold | 97,585 | $ 1,292,370 | | 256,794 | $ 3,735,444 |
Reinvested dividends and distributions | 35,817 | 423,508 | | 77,887 | 1,096,439 |
Shares repurchased | (1,358,505) | (15,935,755) | | (653,416) | (9,586,426) |
Net Increase/(Decrease) | (1,225,103) | $(14,219,877) | | (318,735) | $ (4,754,543) |
6. Purchases and Sales of Investment Securities
For the year ended June 30, 2023, the aggregate cost of purchases and proceeds from sales of investment securities (excluding any short-term securities, short-term options contracts, TBAs, and in-kind transactions, as applicable) was as follows:
| | | | |
Purchases of
Securities | Proceeds from Sales
of Securities | Purchases of Long-
Term U.S. Government
Obligations | Proceeds from Sales
of Long-Term U.S.
Government Obligations |
$70,923,687 | $ 109,767,728 | $ - | $ - |
Janus Henderson Responsible International Dividend Fund
Notes to Financial Statements
7. Subsequent Event
Management has evaluated whether any events or transactions occurred subsequent to June 30, 2023 and through the date of issuance of the Fund’s financial statements and determined that there were no material events or transactions that would require recognition or disclosure in the Fund’s financial statements.
Janus Henderson Responsible International Dividend Fund
Report of Independent Registered Public Accounting Firm
To the Board of Trustees of Janus Investment Fund and Shareholders of Janus Henderson Responsible International Dividend Fund
Opinion on the Financial Statements
We have audited the accompanying statement of assets and liabilities, including the schedule of investments, of Janus Henderson Responsible International Dividend Fund (one of the funds constituting Janus Investment Fund, referred to hereafter as the "Fund") as of June 30, 2023, the related statement of operations for the year ended June 30, 2023, the statements of changes in net assets for each of the two years in the period ended June 30, 2023, including the related notes, and the financial highlights for each of the five years in the period ended June 30, 2023 (collectively referred to as the “financial statements”). In our opinion, the financial statements present fairly, in all material respects, the financial position of the Fund as of June 30, 2023, the results of its operations for the year then ended, the changes in its net assets for each of the two years in the period ended June 30, 2023 and the financial highlights for each of the five years in the period ended June 30, 2023 in conformity with accounting principles generally accepted in the United States of America.
Basis for Opinion
These financial statements are the responsibility of the Fund’s management. Our responsibility is to express an opinion on the Fund’s financial statements based on our audits. We are a public accounting firm registered with the Public Company Accounting Oversight Board (United States) (PCAOB) and are required to be independent with respect to the Fund in accordance with the U.S. federal securities laws and the applicable rules and regulations of the Securities and Exchange Commission and the PCAOB.
We conducted our audits of these financial statements in accordance with the standards of the PCAOB. Those standards require that we plan and perform the audit to obtain reasonable assurance about whether the financial statements are free of material misstatement, whether due to error or fraud.
Our audits included performing procedures to assess the risks of material misstatement of the financial statements, whether due to error or fraud, and performing procedures that respond to those risks. Such procedures included examining, on a test basis, evidence regarding the amounts and disclosures in the financial statements. Our audits also included evaluating the accounting principles used and significant estimates made by management, as well as evaluating the overall presentation of the financial statements. Our procedures included confirmation of securities owned as of June 30, 2023 by correspondence with the custodian and transfer agent. We believe that our audits provide a reasonable basis for our opinion.

Denver, Colorado
August 21, 2023
We have served as the auditor of one or more investment companies in Janus Henderson Funds since 1990.
Janus Henderson Responsible International Dividend Fund
Additional Information (unaudited)
Proxy Voting Policies and Voting Record
A description of the policies and procedures that the Fund uses to determine how to vote proxies relating to its portfolio securities is available without charge: (i) upon request, by calling 1-800-525-1093; (ii) on the Fund’s website at janushenderson.com/proxyvoting; and (iii) on the SEC’s website at http://www.sec.gov. Additionally, information regarding the Fund’s proxy voting record for the most recent twelve-month period ended June 30 is also available, free of charge, through janushenderson.com/proxyvoting and from the SEC’s website at http://www.sec.gov.
Full Holdings
The Fund files its complete portfolio holdings (schedule of investments) with the SEC as an exhibit to Form N-PORT within 60 days of the end of the first and third fiscal quarters, and in the annual report and semiannual report to shareholders. The Fund’s Form N-PORT filings and annual and semiannual reports: (i) are available on the SEC’s website at http://www.sec.gov; and (ii) are available without charge, upon request, by calling a Janus Henderson representative at 1-877-335-2687 (toll free) (or 1-800-525-3713 if you hold Class D shares). Portfolio holdings consisting of at least the names of the holdings are generally available on a monthly basis with a 30-day lag under Full Holdings for the Fund at janushenderson.com/info (or janushenderson.com/reports if you hold Class D Shares).
APPROVAL OF ADVISORY AGREEMENTS DURING THE PERIOD
The Trustees of Janus Aspen Series, each of whom serves as an “independent” Trustee (the “Trustees”), oversee the management of each portfolio of Janus Aspen Series (each, a “VIT Portfolio,” and collectively, the “VIT Portfolios”), as well as each fund of Janus Investment Fund (each, a “Fund,” and collectively, the “Funds” and together with the VIT Portfolios, the “Janus Henderson Funds,” and each, a “Janus Henderson Fund”). As required by law, the Trustees determine annually whether to continue the investment advisory agreement for each Janus Henderson Fund.
In connection with their most recent consideration of those agreements for each Janus Henderson Fund, the Trustees received and reviewed information provided by Janus Henderson Investors US LLC (the “Adviser”) in response to requests of the Trustees and their independent legal counsel. They also received and reviewed information and analysis provided by, and in response to requests of, their independent fee consultant. Throughout their consideration of the agreements, the Trustees were advised by their independent legal counsel. The Trustees met with management to consider the agreements, and also met separately in executive session with their independent legal counsel and their independent fee consultant.
At meetings held on November 9-10, 2022 and December 13-14, 2022, the Trustees evaluated the information provided by the Adviser and the independent fee consultant, as well as other information provided by the Adviser and the independent fee consultant during the year. Following such evaluation, the Trustees determined that the overall arrangements between each Janus Henderson Fund and the Adviser were fair and reasonable in light of the nature, extent, and quality of the services provided by the Adviser and its affiliates, the fees charged for those services, and other matters that the Trustees considered relevant in the exercise of their business judgment, and unanimously approved the continuation of the investment advisory agreement for each Janus Henderson Fund for the period from February 1, 2023 through February 1, 2024, subject to earlier termination as provided for in each agreement.
In considering the continuation of those agreements, the Trustees reviewed and analyzed various factors that they determined were relevant, including the factors described below, none of which by itself was considered dispositive. However, the material factors and conclusions that formed the basis for the Trustees’ determination to approve the continuation of the agreements are discussed separately below. Also included is a summary of the independent fee consultant’s conclusions and opinions that arose during, and were included as part of, the Trustees’ consideration of the agreements. “Management fees,” as used herein, reflect actual annual advisory fees and, for the purpose of peer comparisons any administration fees (excluding out of pocket costs), net of any waivers, paid by a fund as a percentage of average net assets.
Nature, Extent and Quality of Services
The Trustees reviewed the nature, extent, and quality of the services provided by the Adviser to the Janus Henderson Funds, taking into account the investment objective, strategies, and policies of each Janus Henderson Fund, and the knowledge the Trustees gained from their regular meetings with management on at least a quarterly basis and their ongoing review of information related to the Janus Henderson Funds. In addition, the Trustees reviewed the resources and key personnel of the Adviser, particularly noting those employees who provide investment and risk management services to the Janus Henderson Funds. The Trustees also considered other services provided to the Janus Henderson
Janus Henderson Responsible International Dividend Fund
Additional Information (unaudited)
Funds by the Adviser, such as managing the execution of portfolio transactions and the selection of broker-dealers for those transactions. The Trustees considered the Adviser’s role as administrator to the Janus Henderson Funds, noting that the Adviser generally does not receive a fee for its services as administrator, but is reimbursed for its out-of-pocket costs. The Trustees considered the role of the Adviser in monitoring adherence to the Janus Henderson Funds’ investment restrictions, providing support services for the Trustees and Trustee committees, and overseeing communications with Janus Henderson Fund shareholders and the activities of other service providers, including monitoring compliance with various policies and procedures of the Janus Henderson Funds and with applicable securities laws and regulations.
In this regard, the independent fee consultant noted that the Adviser provides a number of different services for the Janus Henderson Funds and their shareholders, ranging from investment management services to various other servicing functions, and that, in its view, the Adviser is a capable provider of those services. The independent fee consultant also provided its belief that the Adviser has developed a number of institutional competitive advantages that should enable it to provide superior investment and service performance over the long term.
The Trustees concluded that the nature, extent, and quality of the services provided by the Adviser to each Janus Henderson Fund were appropriate and consistent with the terms of the respective advisory agreements, and that, taking into account steps taken to address those Janus Henderson Funds whose performance lagged that of their peers for certain periods, the Janus Henderson Funds were likely to benefit from the continued provision of those services. They also concluded that the Adviser had sufficient personnel, with the appropriate education and experience, to serve the Janus Henderson Funds effectively and had demonstrated its ability to attract well-qualified personnel.
Performance of the Funds
The Trustees considered the performance results of each Janus Henderson Fund over various time periods. They noted that they considered Janus Henderson Fund performance data throughout the year, including periodic meetings with each Janus Henderson Fund’s portfolio manager(s), and also reviewed information comparing each Janus Henderson Fund’s performance with the performance of comparable fund peer groups identified by Broadridge Financial Solutions, Inc. (“Broadridge”), an independent data provider, and with the Janus Henderson Fund’s benchmark index. In this regard, the independent fee consultant found that the overall Janus Henderson Funds’ performance has been reasonable, noting that: (i) for the 36 months ended May 31, 2022, approximately 38% of the Janus Henderson Funds were in the top two quartiles of their Broadridge peer groups; (ii) for the 36 months ended September 30, 2022, approximately 45% of the Janus Henderson Funds were in the top two quartiles of performance as reported by Morningstar, and (iii) for the 12 months ended September 30, 2022, approximately 55% of the Janus Henderson Funds were in the top two quartiles of performance as reported by Morningstar.
The Trustees considered the performance of each Janus Henderson Fund, noting that performance may vary by share class, and noted the following with respect to the Funds:
Asset Allocation Funds
· For Janus Henderson Global Allocation Fund – Conservative, the Trustees noted that the Fund’s performance was in the third Broadridge quartile for the 36 months ended May 31, 2022 and the bottom Broadridge quartile for the 12 months ended May 31, 2022. The Trustees noted the reasons for the Fund’s underperformance and the steps the Adviser had taken or was taking to improve performance.
· For Janus Henderson Global Allocation Fund – Growth, the Trustees noted that the Fund’s performance was in the bottom Broadridge quartile for the 36 months ended May 31, 2022 and the bottom Broadridge quartile for the 12 months ended May 31, 2022. The Trustees noted the reasons for the Fund’s underperformance and the steps the Adviser had taken or was taking to improve performance.
· For Janus Henderson Global Allocation Fund – Moderate, the Trustees noted that the Fund’s performance was in the bottom Broadridge quartile for the 36 months ended May 31, 2022 and the bottom Broadridge quartile for the 12 months ended May 31, 2022. The Trustees noted the reasons for the Fund’s underperformance and the steps the Adviser had taken or was taking to improve performance.
Fixed-Income Funds
· For Janus Henderson Absolute Return Income Opportunities Fund, the Trustees noted that the Fund’s performance was in the third Broadridge quartile for the 36 months ended May 31, 2022 and the first Broadridge
Janus Henderson Responsible International Dividend Fund
Additional Information (unaudited)
quartile for the 12 months ended May 31, 2022. The Trustees noted the reasons for the Fund’s underperformance, the steps the Adviser had taken or was taking to improve performance, and that the performance trend was improving.
· For Janus Developed World Bond Fund, the Trustees noted that the Fund’s performance was in the bottom Broadridge quartile for the 36 months ended May 31, 2022 and the bottom Broadridge quartile for the 12 months ended May 31, 2022. The Trustees noted the reasons for the Fund’s underperformance and the steps the Adviser had taken or was taking to improve performance.
· For Janus Henderson Flexible Bond Fund, the Trustees noted that the Fund’s performance was in the first Broadridge quartile for the 36 months ended May 31, 2022 and the second Broadridge quartile for the 12 months ended May 31, 2022.
· For Janus Henderson Global Bond Fund, the Trustees noted that the Fund’s performance was in the third Broadridge quartile for the 36 months ended May 31, 2022 and the bottom Broadridge quartile for the 12 months ended May 31, 2022. The Trustees noted the reasons for the Fund’s underperformance and the steps the Adviser had taken or was taking to improve performance.
· For Janus Henderson High-Yield Fund, the Trustees noted that the Fund’s performance was in the third Broadridge quartile for the 36 months ended May 31, 2022 and the bottom Broadridge quartile for the 12 months ended May 31, 2022. The Trustees noted the reasons for the Fund’s underperformance and the steps the Adviser had taken or was taking to improve performance.
· For Janus Henderson Multi-Sector Income Fund, the Trustees noted that the Fund’s performance was in the second Broadridge quartile for the 36 months ended May 31, 2022 and the third Broadridge quartile for the 12 months ended May 31, 2022.
· For Janus Henderson Short Duration Flexible Bond Fund, the Trustees noted that the Fund’s performance was in the third Broadridge quartile for the 36 months ended May 31, 2022 and the bottom Broadridge quartile for the 12 months ended May 31, 2022. The Trustees noted the reasons for the Fund’s underperformance and the steps the Adviser had taken or was taking to improve performance.
Global and International Equity Funds
· For Janus Henderson Asia Equity Fund, the Trustees noted that the Fund’s performance was in the third Broadridge quartile for the 36 months ended May 31, 2022 and the third Broadridge quartile for the 12 months ended May 31, 2022. The Trustees noted the reasons for the Fund’s underperformance, while also noting that the Fund has a performance fee structure that results in lower management fees during periods of underperformance, and the steps the Adviser had taken or was taking to improve performance.
· For Janus Henderson Emerging Markets Fund, the Trustees noted that the Fund’s performance was in the third Broadridge quartile for the 36 months ended May 31, 2022 and the third Broadridge quartile for the 12 months ended May 31, 2022. The Trustees noted the reasons for the Fund’s underperformance and the steps the Adviser had taken or was taking to improve performance.
· For Janus Henderson European Focus Fund, the Trustees noted that the Fund’s performance was in the first Broadridge quartile for the 36 months ended May 31, 2022 and the second Broadridge quartile for the 12 months ended May 31, 2022.
· For Janus Henderson Global Equity Income Fund, the Trustees noted that the Fund’s performance was in the third Broadridge quartile for the 36 months ended May 31, 2022 and the first Broadridge quartile for the 12 months ended May 31, 2022. The Trustees noted the reasons for the Fund’s underperformance, the steps the Adviser had taken or was taking to improve performance, and that the performance trend was improving.
· For Janus Henderson Global Life Sciences Fund, the Trustees noted that the Fund’s performance was in the third Broadridge quartile for the 36 months ended May 31, 2022 and the second Broadridge quartile for the 12 months ended May 31, 2022. The Trustees noted the reasons for the Fund’s underperformance, the steps the Adviser had taken or was taking to improve performance, and that the performance trend was improving.
Janus Henderson Responsible International Dividend Fund
Additional Information (unaudited)
· For Janus Henderson Global Sustainable Equity Fund, the Trustees noted that the Fund’s performance was in the second Broadridge quartile for the 12 months ended May 31, 2022. The Trustees noted that 36 month-end performance was not yet available.
· For Janus Henderson Global Real Estate Fund, the Trustees noted that the Fund’s performance was in the second Broadridge quartile for the 36 months ended May 31, 2022 and the bottom Broadridge quartile for the 12 months ended May 31, 2022.
· For Janus Henderson Global Research Fund, the Trustees noted that the Fund’s performance was in the second Broadridge quartile for the 36 months ended May 31, 2022 and the first Broadridge quartile for the 12 months ended May 31, 2022.
· For Janus Henderson Global Select Fund, the Trustees noted that the Fund’s performance was in the first Broadridge quartile for the 36 months ended May 31, 2022 and the first Broadridge quartile for the 12 months ended May 31, 2022.
· For Janus Henderson Global Technology and Innovation Fund, the Trustees noted that the Fund’s performance was in the second Broadridge quartile for the 36 months ended May 31, 2022 and the second Broadridge quartile for the 12 months ended May 31, 2022.
· For Janus Henderson International Opportunities Fund, the Trustees noted that the Fund’s performance was in the bottom Broadridge quartile for the 36 months ended May 31, 2022 and the third Broadridge quartile for the 12 months ended May 31, 2022. The Trustees noted the reasons for the Fund’s underperformance and the steps the Adviser had taken or was taking to improve performance.
· For Janus Henderson Overseas Fund, the Trustees noted that the Fund’s performance was in the first Broadridge quartile for the 36 months ended May 31, 2022 and the first Broadridge quartile for the 12 months ended May 31, 2022.
· For Janus Henderson Responsible International Dividend Fund (formerly the Janus Henderson Dividend & Income Builder Fund), the Trustees noted that the Fund’s performance was in the bottom Broadridge quartile for the 36 months ended May 31, 2022 and the bottom Broadridge quartile for the 12 months ended May 31, 2022. The Trustees noted the reasons for the Fund’s underperformance and the steps the Adviser had taken or was taking to improve performance.
Money Market Funds
· For Janus Henderson Government Money Market Fund, the Trustees noted that the Fund’s performance was in the third Broadridge quartile for the 36 months ended May 31, 2022 and the bottom Broadridge quartile for the 12 months ended May 31, 2022. The Trustees noted the reasons for the Fund’s underperformance and the steps the Adviser had taken or was taking to improve performance.
· For Janus Henderson Money Market Fund, the Trustees noted that the Fund’s performance was in the third Broadridge quartile for the 36 months ended May 31, 2022 and the bottom Broadridge quartile for the 12 months ended May 31, 2022. The Trustees noted the reasons for the Fund’s underperformance and the steps the Adviser had taken or was taking to improve performance.
Multi-Asset Funds
· For Janus Henderson Adaptive Global Allocation Fund, the Trustees noted that the Fund’s performance was in bottom Broadridge quartile for the 36 months ended May 31, 2022 and the second Broadridge quartile for the 12 months ended May 31, 2022. The Trustees noted the reasons for the Fund’s underperformance, the steps the Adviser had taken or was taking to improve performance, and that the performance trend was improving.
· For Janus Henderson Balanced Fund, the Trustees noted that the Fund’s performance was in the first Broadridge quartile for the 36 months ended May 31, 2022 and the first Broadridge quartile for the 12 months ended May 31, 2022.
Janus Henderson Responsible International Dividend Fund
Additional Information (unaudited)
U.S. Equity Funds
· For Janus Henderson Adaptive Risk Managed U.S. Equity Fund, the Trustees noted that the Fund’s performance was in the bottom Broadridge quartile for the 36 months ended May 31, 2022 and the second Broadridge quartile for the 12 months ended May 31, 2022. The Trustees noted the reasons for the Fund’s underperformance, the steps the Adviser had taken or were taking to improve performance, and that the performance trend was improving.
· For Janus Henderson Contrarian Fund, the Trustees noted that the Fund’s performance was in the first Broadridge quartile for the 36 months ended May 31, 2022 and the bottom Broadridge quartile for the 12 months ended May 31, 2022.
· For Janus Henderson Enterprise Fund, the Trustees noted that the Fund’s performance was in the second Broadridge quartile for the 36 months ended May 31, 2022 and the first Broadridge quartile for the 12 months ended May 31, 2022.
· For Janus Henderson Forty Fund, the Trustees noted that the Fund’s performance was in the third Broadridge quartile for the 36 months ended May 31, 2022 and the bottom Broadridge quartile for the 12 months ended May 31, 2022. The Trustees noted the reasons for the Fund’s underperformance and the steps the Adviser had taken or was taking to improve performance.
· For Janus Henderson Growth and Income Fund, the Trustees noted that the Fund’s performance was in the bottom Broadridge quartile for the 36 months ended May 31, 2022 and the first Broadridge quartile for the 12 months ended May 31, 2022. The Trustees noted the reasons for the Fund’s underperformance, the steps the Adviser had taken or was taking to improve performance, and that the performance trend was improving.
· For Janus Henderson Mid Cap Value Fund, the Trustees noted that the Fund’s performance was in the bottom Broadridge quartile for the 36 months ended May 31, 2022 and the second Broadridge quartile for the 12 months ended May 31, 2022. The Trustees noted the reasons for the Fund’s underperformance, while also noting that the Fund has a performance fee structure that results in lower management fees during periods of underperformance, the steps the Adviser had taken or was taking to improve performance, and that the performance trend was improving.
· For Janus Henderson Research Fund, the Trustees noted that the Fund’s performance was in the third Broadridge quartile for the 36 months ended May 31, 2022 and the third Broadridge quartile for the 12 months ended May 31, 2022. The Trustees noted the reasons for the Fund’s underperformance, while also noting that the Fund has a performance fee structure that results in lower management fees during periods of underperformance and the steps the Adviser had taken or was taking to improve performance.
· For Janus Henderson Small Cap Value Fund, the Trustees noted that the Fund’s performance was in the bottom Broadridge quartile for the 36 months ended May 31, 2022 and the second Broadridge quartile for the 12 months ended May 31, 2022. The Trustees noted the reasons for the Fund’s underperformance, while also noting that the Fund has a performance fee structure that results in lower management fees during periods of underperformance, the steps the Adviser had taken or was taking to improve performance, and that the performance trend was improving.
· For Janus Henderson Small-Mid Cap Value Fund, the Trustees noted that the Fund’s performance was in the bottom Broadridge quartile for the 36 months ended May 31, 2022 and the second Broadridge quartile for the 12 months ended May 31, 2022. The Trustees noted the reasons for the Fund’s underperformance, while also noting that the Fund has a performance fee structure that results in lower management fees during periods of underperformance, the steps the Adviser had taken or was taking to improve performance, and that the performance trend is improving.
· For Janus Henderson Triton Fund, the Trustees noted that the Fund’s performance was in the bottom Broadridge quartile for the 36 months ended May 31, 2022 and the second Broadridge quartile for the 12 months ended May 31, 2022. The Trustees noted the reasons for the Fund’s underperformance, the steps the Adviser had taken or was taking to improve performance, and that the performance trend was improving.
· For Janus Henderson Venture Fund, the Trustees noted that the Fund’s performance was in the bottom Broadridge quartile for the 36 months ended May 31, 2022 and the second Broadridge quartile for the 12 months ended May
Janus Henderson Responsible International Dividend Fund
Additional Information (unaudited)
31, 2022. The Trustees noted the reasons for the Fund’s underperformance, the steps the Adviser had taken or was taking to improve performance, and that the performance trend was improving.
In consideration of each Janus Henderson Fund’s performance, the Trustees concluded that, taking into account the factors relevant to performance, as well as other considerations, including steps taken to improve performance, as applicable, the Janus Henderson Fund’s performance warranted continuation of such Janus Henderson Fund’s investment advisory agreement.
Costs of Services Provided
The Trustees examined information regarding the fees and expenses of each Janus Henderson Fund in comparison to similar information for other comparable funds as provided by Broadridge, an independent data provider. They also reviewed an analysis of that information provided by their independent fee consultant. The independent fee consultant provided its belief that the management fees charged by the Adviser to each of the Janus Henderson Funds under the current investment advisory and administration agreements are reasonable in relation to the services provided by the Adviser. The independent fee consultant found: (1) the total expenses and management fees of the Janus Henderson Funds to be reasonable relative to other comparable mutual funds; (2) the total expenses, on average, were 6% under the average total expenses of the respective Broadridge peer group; and (3) the management fees for the Janus Henderson Funds, on average, were 5% under the average management fees for the respective Broadridge peer group. The Trustees also considered the total expenses for each share class of each Janus Henderson Fund compared to the average total expenses for its Broadridge Expense Group and to average total expenses for its Broadridge Expense Universe.
For Janus Henderson Funds with three or more years of performance history, the independent fee consultant also performed a systematic “focus list” analysis of expenses which assessed fund fees in the context of fund performance being delivered. Based on this analysis, the independent fee consultant found that the combination of service quality/performance and expenses on these individual Janus Henderson Funds was reasonable in light of performance trends, performance histories, changes in portfolio management, relative average net asset levels, and the existence of performance fees, breakpoints, and/or expense waivers on such Janus Henderson Funds.
The Trustees considered the methodology used by the Adviser in determining compensation payable to portfolio managers, the competitive environment for investment management talent, and the competitive market for mutual funds in different distribution channels.
The Trustees also reviewed management fees charged by the Adviser to comparable separate account clients and to comparable non-affiliated funds subadvised by the Adviser (for which the Adviser provides only or primarily portfolio management services). Although in most instances subadvisory and separate account fee rates for various investment strategies were lower than management fee rates for Janus Henderson Funds having a similar strategy, the Trustees considered that the Adviser noted that, under the terms of the management agreements with the Janus Henderson Funds, the Adviser performs significant additional services for the Janus Henderson Funds that it does not provide to those other clients, including administration services, oversight of the Janus Henderson Funds’ other service providers, Trustee support, regulatory compliance and numerous other services, and that, in serving the Janus Henderson Funds, the Adviser assumes many legal risks and other costs that it does not assume in servicing its other clients. Moreover, the Trustees noted that the independent fee consultant found that: (1) the management fees the Adviser charges to the Janus Henderson Funds are reasonable in relation to the management fees the Adviser charges to funds subadvised by the Adviser and to the fees the Adviser charges to its institutional separate account clients; (2) these subadvised and institutional separate accounts have different service and infrastructure needs and operate in markets very different from the retail fund market; (3) Janus Henderson mutual fund investors enjoy reasonable fees relative to the fees charged in these other markets; and (4) as part of its 2022 review, 9 of 11 Janus Henderson Funds have lower management fees than similar funds subadvised by the Adviser. The Trustees noted that for the two Janus Henderson Funds that did not, management fees for each were under the average of its 15(c) peer group.
The Trustees considered the fees for each Janus Henderson Fund for its fiscal year ended in 2021 and noted the following with regard to each Janus Henderson Fund’s total expenses, net of applicable fee waivers (the Fund’s “total expenses”) as reflected in the comparative information provided by Broadridge:
Janus Henderson Responsible International Dividend Fund
Additional Information (unaudited)
Asset Allocation Funds
· For Janus Henderson Global Allocation Fund – Conservative, the Trustees noted that, although the Fund’s total expenses exceeded the peer group average for certain share classes, overall the Fund’s total expenses were reasonable. The Trustees also noted that the Adviser has contractually agreed to limit the Fund’s expenses.
· For Janus Henderson Global Allocation Fund – Growth, the Trustees noted that, although the Fund’s total expenses exceeded the peer group average for certain share classes, overall the Fund’s total expenses were reasonable. The Trustees also noted that the Adviser has contractually agreed to limit the Fund’s expenses, although this limit did not apply because the Fund’s total expenses as shown were below the applicable fee limit.
· For Janus Henderson Global Allocation Fund – Moderate, the Trustees noted that, although the Fund’s total expenses exceeded the peer group average for one share class, overall the Fund’s total expenses were reasonable. The Trustees also noted that the Adviser has contractually agreed to limit the Fund’s expenses.
Fixed-Income Funds
· For Janus Henderson Absolute Return Income Opportunities Fund, the Trustees noted that, although the Fund’s total expenses exceeded the peer group average for certain share classes, overall the Fund’s total expenses were reasonable. The Trustees also noted that the Adviser has contractually agreed to limit the Fund’s expenses.
· For Janus Henderson Developed World Bond Fund, the Trustees noted that, although the Fund’s total expenses exceeded the peer group average for one share class, overall the Fund’s total expenses were reasonable. The Trustees also noted that the Adviser has contractually agreed to limit the Fund’s expenses.
· For Janus Henderson Flexible Bond Fund, the Trustees noted that, although the Fund’s total expenses exceeded the peer group average for certain share classes, overall the Fund’s total expenses were reasonable. The Trustees also noted that the Adviser has contractually agreed to limit the Fund’s expenses, although this limit did not apply because the Fund’s total expenses as shown were below the applicable fee limit.
· For Janus Henderson Global Bond Fund, the Trustees noted that, although the Fund’s total expenses exceeded the peer group average for certain share classes, overall the Fund’s total expenses were reasonable. The Trustees also noted that the Adviser has contractually agreed to limit the Fund’s expenses.
· For Janus Henderson High-Yield Fund, the Trustees noted that, although the Fund’s total expenses exceeded the peer group average for certain share classes, overall the Fund’s total expenses were reasonable. The Trustees also noted that the Adviser has contractually agreed to limit the Fund’s expenses.
· For Janus Henderson Multi-Sector Income Fund, the Trustees noted that, although the Fund’s total expenses exceeded the peer group average for certain share classes, overall the Fund’s total expenses were reasonable. The Trustees also noted that the Adviser has contractually agreed to limit the Fund’s expenses.
· For Janus Henderson Short Duration Flexible Bond Fund, the Trustees noted that, although the Fund’s total expenses exceeded the peer group average for certain share classes, overall the Fund’s total expenses were reasonable. The Trustees also noted that the Adviser has contractually agreed to limit the Fund’s expenses.
Global and International Equity Funds
· For Janus Henderson Asia Equity Fund, the Trustees noted that, although the Fund’s total expenses exceeded the peer group average for certain share classes, overall the Fund’s total expenses were reasonable. The Trustees also noted that the Adviser has contractually agreed to limit the Fund’s expenses.
· For Janus Henderson Emerging Markets Fund, the Trustees noted that, although the Fund’s total expenses exceeded the peer group average for certain share classes, overall the Fund’s total expenses were reasonable. The Trustees also noted that the Adviser has contractually agreed to limit the Fund’s expenses.
· For Janus Henderson European Focus Fund, the Trustees noted that, although the Fund’s total expenses exceeded the peer group average for one share class, overall the Fund’s expenses were reasonable. The Trustees also noted that the Adviser has contractually agreed to limit the Fund’s expenses.
· For Janus Henderson Global Equity Income Fund, the Trustees noted that, although the Fund’s total expenses exceeded the peer group average for one share class, overall the Fund’s total expenses were reasonable. The
Janus Henderson Responsible International Dividend Fund
Additional Information (unaudited)
Trustees also noted that the Adviser has contractually agreed to limit the Fund’s expenses, although this limit did not apply because the Fund’s total expenses as shown were below the applicable fee limit.
· For Janus Henderson Global Life Sciences Fund, the Trustees noted that the Fund’s total expenses were below the peer group average for all share classes.
· For Janus Henderson Global Real Estate Fund, the Trustees noted that, although the Fund’s total expenses exceeded the peer group average for certain share classes, overall the Fund’s total expenses were reasonable. The Trustees also noted that the Adviser has contractually agreed to limit the Fund’s expenses, although this limit did not apply because the Fund’s total expenses as shown were below the applicable fee limit.
· For Janus Henderson Global Research Fund, the Trustees noted that, although the Fund’s total expenses exceeded the peer group average for one share class, overall the Fund’s total expenses were reasonable. The Trustees also noted that the Adviser has contractually agreed to limit the Fund’s expenses, although this limit did not apply because the Fund’s total expenses as shown were below the applicable fee limit.
· For Janus Henderson Global Select Fund, the Trustees noted that, although the Fund’s total expenses exceeded the peer group average for certain share classes, overall the Fund’s total expenses were reasonable. The Trustees also noted that the Adviser has contractually agreed to limit the Fund’s expenses.
· For Janus Henderson Global Sustainable Equity Fund, the Trustees noted that, although the Fund’s total expenses exceeded the peer group average for certain share classes, overall the Fund’s expenses were reasonable. The Trustees also noted that the Adviser has contractually agreed to limit the Fund’s expenses.
· For Janus Henderson Global Technology and Innovation Fund, the Trustees noted that the Fund’s total expenses were below the peer group average for all share classes.
· For Janus Henderson International Opportunities Fund, the Trustees noted that, although the Fund’s total expenses exceeded the peer group average for certain share classes, overall the Fund’s expenses were reasonable. The Trustees also noted that the Adviser has contractually agreed to limit the Fund’s expenses.
· For Janus Henderson Overseas Fund, the Trustees noted that although the Fund’s total expenses exceeded the peer group average for certain share classes, overall the Fund’s total expenses were reasonable. The Trustees also noted that the Adviser has contractually agreed to limit the Fund’s expenses, although this limit did not apply because the Fund’s total expenses as shown were below the applicable fee limit.
· For Janus Henderson Responsible International Dividend Fund (formerly the Janus Henderson Dividend & Income Builder Fund), the Trustees noted that, although the Fund’s total expenses exceeded the peer group for one share class, overall the Fund’s total expenses were reasonable. The Trustees also noted that the Adviser has contractually agreed to limit the Fund’s expenses.
Money Market Funds
· For Janus Henderson Government Money Market Fund, the Trustees noted that the Fund’s total expenses were below the peer group average for all share classes.
· For Janus Henderson Money Market Fund, the Trustees noted that the Fund’s total expenses were below the peer group average for all share classes.
Multi-Asset Funds
· For Janus Henderson Adaptive Global Allocation Fund, the Trustees noted that the Fund’s total expenses were below the peer group average for all share classes.
· For Janus Henderson Balanced Fund, the Trustees noted that, although the Fund’s total expenses exceeded the peer group average for certain share classes, overall the Fund’s total expenses were reasonable. The Trustees also noted that the Adviser has contractually agreed to limit the Fund’s expenses, although this limit did not apply because the Fund’s total expenses as shown were below the applicable fee limit.
Janus Henderson Responsible International Dividend Fund
Additional Information (unaudited)
U.S. Equity Funds
· For Janus Henderson Adaptive Risk Managed U.S. Equity Fund, the Trustees noted that, although the Fund’s total expenses exceeded the peer group average for certain share classes, overall the Fund’s total expenses were reasonable. The Trustees also noted that the Adviser has contractually agreed to limit the Fund’s expenses, although this limit did not apply because the Fund’s total expenses as shown were below the applicable fee limit.
· For Janus Henderson Contrarian Fund, the Trustees noted that, although the Fund’s total expenses exceeded the peer group average for all share classes, overall the Fund’s total expenses were reasonable. The Trustees also noted that the Adviser had contractually agreed to limit the Fund’s expenses.
· For Janus Henderson Enterprise Fund, the Trustees noted that, although the Fund’s total expenses exceeded the peer group average for certain share classes, overall the Fund’s total expenses were reasonable. The Trustees also noted that the Adviser has contractually agreed to limit the Fund’s expenses, although this limit did not apply because the Fund’s total expenses as shown were below the applicable fee limit.
· For Janus Henderson Forty Fund, the Trustees noted that, although the Fund’s total expenses exceeded the peer group average for certain share classes, overall the Fund’s total expenses were reasonable. The Trustees also noted that the Adviser has contractually agreed to limit the Fund’s expenses, although this limit did not apply because the Fund’s total expenses as shown were below the applicable fee limit.
· For Janus Henderson Growth and Income Fund, the Trustees noted that, although the Fund’s total expenses exceeded the peer group average for certain share classes, overall the Fund’s total expenses were reasonable. The Trustees also noted that the Adviser has contractually agreed to limit the Fund’s expenses, although this limit did not apply because the Fund’s total expenses as shown were below the applicable fee limit.
· For Janus Henderson Mid Cap Value Fund, the Trustees noted that the Fund’s total expenses were below the peer group average for all share classes.
· For Janus Henderson Research Fund, the Trustees noted that, although the Fund’s total expenses exceeded the peer group average for certain share classes, overall the Fund’s total expenses were reasonable. The Trustees also noted that the Adviser has contractually agreed to limit the Fund’s expenses.
· For Janus Henderson Small Cap Value Fund, the Trustees noted that, although the Fund’s total expenses exceeded the peer group average for one share class, overall the Fund’s total expenses were reasonable. The Trustees also noted that the Adviser has contractually agreed to limit the Fund’s expenses, although this limit did not apply because the Fund’s total expenses as shown were below the applicable fee limit.
· For Janus Henderson Small-Mid Cap Value Fund, the Trustees noted that the Fund’s total expenses were below the peer group average for all share classes.
· For Janus Henderson Triton Fund, the Trustees noted that, although the Fund’s total expenses exceeded the peer group average for one share class, overall the Fund’s total expenses were reasonable. The Trustees also noted that the Adviser has contractually agreed to limit the Fund’s expenses, although this limit did not apply because the Fund’s total expenses as shown were below the applicable fee limit.
· For Janus Henderson Venture Fund, the Trustees noted that although the Fund’s total expenses exceeded the peer group average for one share class, overall the Fund’s total expenses were reasonable. The Trustees also noted that the Adviser has contractually agreed to limit the Fund’s expenses, although this limit did not apply because the Fund’s total expenses as shown were below the applicable fee limit.
The Trustees reviewed information on the overall profitability to the Adviser and its affiliates from their relationships with the Janus Henderson Funds, and considered profitability data of other publicly traded mutual fund advisers. The Trustees recognized that profitability comparisons among fund managers are difficult because of the variation in the type of comparative information that is publicly available, and the profitability of any fund manager is affected by numerous factors, including the organizational structure of the particular fund manager, differences in complex size, difference in product mix, difference in types of business (mutual fund, institutional and other), differences in the types of funds and other accounts it manages, possible other lines of business, the methodology for allocating expenses and the fund manager’s capital structure and cost of capital.
Janus Henderson Responsible International Dividend Fund
Additional Information (unaudited)
Additionally, the Trustees considered the estimated profitability to the Adviser from the investment management services it provided to each Janus Henderson Fund. In their review, the Trustees considered whether the Adviser receive adequate incentives and resources to manage the Janus Henderson Funds effectively. In reviewing profitability, the Trustees noted that the estimated profitability for an individual Janus Henderson Fund is necessarily a product of the allocation methodology utilized by the Adviser to allocate its expenses as part of the estimated profitability calculation. In this regard, the Trustees noted that the independent fee consultant found as part of its 2022 review that (1) the expense allocation methodology and rationales utilized by the Adviser were reasonable and (2) no clear correlation exists between expense allocations and operating margins. The Trustees also considered that the estimated profitability for an individual Janus Henderson Fund was influenced by a number of factors, including not only the allocation methodology selected, but also the presence of fee waivers and expense caps, and whether the Janus Henderson Fund’s investment management agreement contained breakpoints or a performance fee component. The Trustees determined, after taking into account these factors, among others, that the Adviser’s estimated profitability with respect to each Janus Henderson Fund was not unreasonable in relation to the services provided, and that the variation in the range of such estimated profitability among the Janus Henderson Funds was not a material factor in the Board’s approval of the reasonableness of any Janus Henderson Fund’s investment management fees.
The Trustees concluded that the management fees payable by each Janus Henderson Fund to the Adviser were reasonable in relation to the nature, extent, and quality of the services provided, taking into account the fees charged by other advisers for managing comparable mutual funds with similar strategies, the fees the Adviser charges to other clients, and, as applicable, the impact of fund performance on management fees payable by the Janus Henderson Funds. The Trustees also concluded that each Janus Henderson Fund’s total expenses were reasonable, taking into account the size of the Janus Henderson Fund, the quality of services provided by the Adviser, the investment performance of the Janus Henderson Fund, and any expense limitations agreed to or provided by the Adviser.
Economies of Scale
The Trustees considered information about the potential for the Adviser to realize economies of scale as the assets of the Janus Henderson Funds increase. They noted that their independent fee consultant published a report to the Trustees in June 2022 which provided its research and analysis into economies of scale. They also noted that, although many Janus Henderson Funds pay advisory fees at a fixed base rate as a percentage of net assets, without any breakpoints or performance fees, their independent fee consultant concluded that 75% of these Janus Henderson Funds’ have contractual management fees (gross of waivers) below their Broadridge Expense Group averages. The Trustees also noted the following from the independent fee consultant’s report: (1) that 31% of Janus Henderson Funds had management fee breakpoints in place whereby investors pay lower management fees as fund AUM increases; (2) that 29% of Janus Henderson Funds have low flat-rate fees and performance fees where the Adviser is incentivized to invest in resources which drive Janus Henderson Fund performance; and (3) that 39% of Janus Henderson Funds have low flat-rate fees versus peers where investors pay low fixed fees when the Janus Henderson Fund is small/midsized and higher fees when the Janus Henderson Fund grows in assets. The Trustees also noted that the Janus Henderson Funds share directly in economies of scale through the significant investments made by the Adviser and its affiliates related to services provided to the Funds and the lower charges of third-party service providers that are based in part on the combined scale of all of the Janus Henderson Funds.
The Trustees also considered the independent fee consultant’s conclusion that, given the limitations of various analytical approaches to economies of scale and their conflicting results, it is difficult to analytically confirm or deny the existence of economies of scale in the Janus Henderson complex. In this regard, the independent consultant concluded that (1) to the extent there were economies of scale at the Adviser, the Adviser’s general strategy of setting fixed management fees below peers appeared to share any such economies with investors even on smaller Janus Henderson Funds which have not yet achieved those economies and (2) by setting lower fixed fees from the start on these Janus Henderson Funds, the Adviser appeared to be investing to increase the likelihood that these Janus Henderson Funds will grow to a level to achieve any economies of scale that may exist. Further, the independent fee consultant provided its belief that Janus Henderson Fund investors are well-served by the fee levels and performance fee structures in place on the Janus Henderson Funds in light of any economies of scale that may be present at the Adviser.
Based on all of the information reviewed, including the recent and past research and analysis conducted by the Trustees’ independent fee consultant, the Trustees concluded that the current fee structure of each Janus Henderson Fund was reasonable and that the current rates of fees do reflect a sharing between the Adviser and the Janus
Janus Henderson Responsible International Dividend Fund
Additional Information (unaudited)
Henderson Fund of any economies of scale that may be present at the current asset level of the Janus Henderson Fund.
Other Benefits to the Adviser
The Trustees also considered benefits that accrue to the Adviser and its affiliates from their relationships with the Janus Henderson Funds. They recognized that two affiliates of the Adviser separately serve the Janus Henderson Funds as transfer agent and distributor, respectively, and the transfer agent receives compensation directly from the non-money market Janus Henderson Funds for services provided, and that such compensation contributes to the overall profitability of the Adviser and its affiliates that results from their relationship with the Janus Henderson Funds. The Trustees also considered the Adviser’s past and proposed use of commissions paid by the Janus Henderson Funds on portfolio brokerage transactions to obtain proprietary and third-party research products and services benefiting the Janus Henderson Fund and/or other clients of the Adviser and/or the Adviser. The Trustees concluded that the Adviser’s use of these types of client commission arrangements to obtain proprietary and third-party research products and services was consistent with regulatory requirements and guidelines and was likely to benefit each Janus Henderson Fund. The Trustees also concluded that, other than the services provided by the Adviser and its affiliates pursuant to the agreements and the fees to be paid by each Janus Henderson Fund therefor, the Janus Henderson Funds and the Adviser may potentially benefit from their relationship with each other in other ways. They concluded that the Adviser and its affiliates share directly in economies of scale through the lower charges of third-party service providers that are based in part on the combined scale of the Janus Henderson Funds and other clients serviced by the Adviser and its affiliates. They also concluded that the Adviser benefits from the receipt of research products and services acquired through commissions paid on portfolio transactions of the Janus Henderson Funds and that the Janus Henderson Funds benefit from the Adviser’s receipt of those products and services as well as research products and services acquired through commissions paid by other clients of the Adviser. They further concluded that the success of any Janus Henderson Fund could attract other business to the Adviser or other Janus Henderson Funds, and that the success of the Adviser could enhance the Adviser’s ability to serve the Janus Henderson Funds.
Janus Henderson Responsible International Dividend Fund
Liquidity Risk Management Program (unaudited)
Liquidity Risk Management Program
Rule 22e-4 under the Investment Company Act of 1940, as amended (the “Liquidity Rule”), requires open-end funds (but not money market funds) to adopt and implement a written liquidity risk management program (the “LRMP”) that is reasonably designed to assess and manage liquidity risk, which is the risk that a fund could not meet redemption requests without significant dilution of remaining investors’ interest in the fund. The Fund has implemented a LRMP, which incorporates the following elements: (i) assessment, management, and periodic review of liquidity risk; (ii) classification of portfolio holdings; (iii) the establishment and monitoring of a highly liquid investment minimum, as applicable; (iv) a 15% limitation on a Fund’s illiquid investments; (v) redemptions in-kind; and (vi) board oversight.
The Trustees of the Fund (the “Trustees”) have designated Janus Henderson Investors US LLC, the Fund’s investment adviser (the “Adviser”), as the Program Administrator for the LRMP responsible for administering the LRMP and carrying out the specific responsibilities of the LRMP. A working group comprised of various teams within the Adviser’s business is responsible for administering the LRMP and carrying out the specific responsibilities of different aspects of the LRMP (the “Liquidity Risk Working Group”). In assessing each Fund’s liquidity risk, the Liquidity Risk Working Group periodically considers, as relevant, factors including (i) the liquidity of a Fund’s portfolio investments during normal and reasonably foreseeable stressed conditions; (ii) whether a Fund’s investment strategy is appropriate for an open-end fund; (iii) the extent to which a Fund’s strategy involves a relatively concentrated portfolio or large positions in any issuer; (iv) a Fund’s use of borrowing for investment purposes; and (v) a Fund’s use of derivatives.
The Liquidity Rule requires the Trustees to review at least annually a written report provided by the Program Administrator that addresses the operation of the LRMP and assesses its adequacy and the effectiveness of its implementation, including, if applicable, the operation of the highly liquid investment minimum, and any material changes to the LRMP (the “Program Administrator Report”). At a meeting held on March 15, 2023, the Adviser provided the Program Administrator Report to the Trustees which covered the operation of the LRMP from January 1, 2022 through December 31, 2022 (the “Reporting Period”).
The Program Administrator Report discussed the operation and effectiveness of the LRMP during the Reporting Period. Among other things, the Program Administrator Report indicated that there were no material changes to the LRMP during the Reporting Period, although there were certain methodology adjustments implemented relating to a change in data provider. Additionally, the findings presented in the Program Administrator Report indicated that the LRMP operated adequately during the Reporting Period. These findings included that the Fund was able to meet redemptions during the normal course of business during the Reporting Period. The Program Administrator Report also stated that the Fund did not exceed the 15% limit on illiquid assets during the Reporting Period, that the Fund held primarily highly liquid assets, and was considered to be a primarily highly liquid fund during the Reporting Period. Also included among the Program Administrator Report’s findings was the determination that the Fund’s investment strategy remains appropriate for an open-end fund. In addition, the Adviser expressed its belief in the Program Administrator Report that the LRMP is reasonably designed and adequate to assess and manage the Fund’s liquidity risk, considering the Fund’s particular risks and circumstances, and includes policies and procedures reasonably designed to implement each required component of the Liquidity Rule.
There can be no assurance that the LRMP will achieve its objectives in the future. Please refer to your Fund’s prospectus for more information regarding the risks to which an investment in the Fund may be subject.
Janus Henderson Responsible International Dividend Fund
Useful Information About Your Fund Report (unaudited)
Management Commentary
The Management Commentary in this report includes valuable insight as well as statistical information to help you understand how your Fund’s performance and characteristics stack up against those of comparable indices.
If the Fund invests in foreign securities, this report may include information about country exposure. Country exposure is based primarily on the country of risk. A company may be allocated to a country based on other factors such as location of the company’s principal office, the location of the principal trading market for the company’s securities, or the country where a majority of the company’s revenues are derived.
Please keep in mind that the opinions expressed in the Management Commentary are just that: opinions. They are a reflection based on best judgment at the time this report was compiled, which was June 30, 2023. As the investing environment changes, so could opinions. These views are unique and are not necessarily shared by fellow employees or by Janus Henderson in general.
Performance Overviews
Performance overview graphs compare the performance of a hypothetical $10,000 investment in the Fund with one or more widely used market indices. When comparing the performance of the Fund with an index, keep in mind that market indices are not available for investment and do not reflect deduction of expenses.
Average annual total returns are quoted for a Fund with more than one year of performance history. Average annual total return is calculated by taking the growth or decline in value of an investment over a period of time, including reinvestment of dividends and distributions, then calculating the annual compounded percentage rate that would have produced the same result had the rate of growth been constant throughout the period. Average annual total return does not reflect the deduction of taxes that a shareholder would pay on Fund distributions or redemptions of Fund shares.
Cumulative total returns are quoted for a Fund with less than one year of performance history. Cumulative total return is the growth or decline in value of an investment over time, independent of the period of time involved. Cumulative total return does not reflect the deduction of taxes that a shareholder would pay on Fund distributions or redemptions of Fund shares.
Pursuant to federal securities rules, expense ratios shown in the performance chart reflect subsidized (if applicable) and unsubsidized ratios. The total annual fund operating expenses ratio is gross of any fee waivers, reflecting the Fund’s unsubsidized expense ratio. The net annual fund operating expenses ratio (if applicable) includes contractual waivers of the Adviser and reflects the Fund’s subsidized expense ratio. Ratios may be higher or lower than those shown in the “Financial Highlights” in this report.
Schedule of Investments
Following the performance overview section is the Fund’s Schedule of Investments. This schedule reports the types of securities held in the Fund on the last day of the reporting period. Securities are usually listed by type (common stock, corporate bonds, U.S. Government obligations, etc.) and by industry classification (banking, communications, insurance, etc.). Holdings are subject to change without notice.
The value of each security is quoted as of the last day of the reporting period. The value of securities denominated in foreign currencies is converted into U.S. dollars.
If the Fund invests in foreign securities, it will also provide a summary of investments by country. This summary reports the Fund exposure to different countries by providing the percentage of securities invested in each country. The country of each security represents the country of risk. The Fund’s Schedule of Investments relies upon the industry group and country classifications published by Bloomberg and/or MSCI Inc.
Tables listing details of individual forward currency contracts, futures, written options, swaptions, and swaps follow the Fund’s Schedule of Investments (if applicable).
Statement of Assets and Liabilities
This statement is often referred to as the “balance sheet.” It lists the assets and liabilities of the Fund on the last day of the reporting period.
Janus Henderson Responsible International Dividend Fund
Useful Information About Your Fund Report (unaudited)
The Fund’s assets are calculated by adding the value of the securities owned, the receivable for securities sold but not yet settled, the receivable for dividends declared but not yet received on securities owned, and the receivable for Fund shares sold to investors but not yet settled. The Fund’s liabilities include payables for securities purchased but not yet settled, Fund shares redeemed but not yet paid, and expenses owed but not yet paid. Additionally, there may be other assets and liabilities such as unrealized gain or loss on forward currency contracts.
The section entitled “Net Assets Consist of” breaks down the components of the Fund’s net assets. Because the Fund must distribute substantially all earnings, you will notice that a significant portion of net assets is shareholder capital.
The last section of this statement reports the net asset value (“NAV”) per share on the last day of the reporting period. The NAV is calculated by dividing the Fund’s net assets for each share class (assets minus liabilities) by the number of shares outstanding.
Statement of Operations
This statement details the Fund’s income, expenses, realized gains and losses on securities and currency transactions, and changes in unrealized appreciation or depreciation of Fund holdings.
The first section in this statement, entitled “Investment Income,” reports the dividends earned from securities and interest earned from interest-bearing securities in the Fund.
The next section reports the expenses incurred by the Fund, including the advisory fee paid to the investment adviser, transfer agent fees and expenses, and printing and postage for mailing statements, financial reports and prospectuses. Expense offsets and expense reimbursements, if any, are also shown.
The last section lists the amounts of realized gains or losses from investment and foreign currency transactions, and changes in unrealized appreciation or depreciation of investments and foreign currency-denominated assets and liabilities. The Fund will realize a gain (or loss) when it sells its position in a particular security. A change in unrealized gain (or loss) refers to the change in net appreciation or depreciation of the Fund during the reporting period. “Net Realized and Unrealized Gain/(Loss) on Investments” is affected both by changes in the market value of Fund holdings and by gains (or losses) realized during the reporting period.
Statements of Changes in Net Assets
These statements report the increase or decrease in the Fund’s net assets during the reporting period. Changes in the Fund’s net assets are attributable to investment operations, dividends and distributions to investors, and capital share transactions. This is important to investors because it shows exactly what caused the Fund’s net asset size to change during the period.
The first section summarizes the information from the Statement of Operations regarding changes in net assets due to the Fund’s investment operations. The Fund’s net assets may also change as a result of dividend and capital gains distributions to investors. If investors receive their dividends and/or distributions in cash, money is taken out of the Fund to pay the dividend and/or distribution. If investors reinvest their dividends and/or distributions, the Fund’s net assets will not be affected.
The reinvestment of dividends and distributions is included under “Capital Share Transactions.” “Capital Shares” refers to the money investors contribute to the Fund through purchases or withdrawals via redemptions. The Fund’s net assets will increase and decrease in value as investors purchase and redeem shares from the Fund.
Financial Highlights
This schedule provides a per-share breakdown of the components that affect the Fund’s NAV for current and past reporting periods as well as total return, asset size, ratios, and portfolio turnover rate.
The first line in the table reflects the NAV per share at the beginning of the reporting period. The next line reports the net investment income/(loss) per share. Following is the per share total of net gains/(losses), realized and unrealized. Per share dividends and distributions to investors are then subtracted to arrive at the NAV per share at the end of the period. The next line reflects the total return for the period. The total return may include adjustments in accordance with generally accepted accounting principles required at the period end for financial reporting purposes. As a result, the total return may differ from the total return reflected for individual shareholder transactions. Also included are ratios of expenses and net investment income to average net assets.
Janus Henderson Responsible International Dividend Fund
Useful Information About Your Fund Report (unaudited)
The Fund’s expenses may be reduced through expense offsets and expense reimbursements. The ratios shown reflect expenses before and after any such offsets and reimbursements.
The ratio of net investment income/(loss) summarizes the income earned less expenses, divided by the average net assets of the Fund during the reporting period. Do not confuse this ratio with the Fund’s yield. The net investment income ratio is not a true measure of the Fund’s yield because it does not take into account the dividends distributed to the Fund’s investors.
The next figure is the portfolio turnover rate, which measures the buying and selling activity in the Fund. Portfolio turnover is affected by market conditions, changes in the asset size of the Fund, fluctuating volume of shareholder purchase and redemption orders, the nature of the Fund’s investments, and the investment style and/or outlook of the portfolio manager(s) and/or investment personnel. A 100% rate implies that an amount equal to the value of the entire portfolio was replaced once during the fiscal year; a 50% rate means that an amount equal to the value of half the portfolio is traded in a year; and a 200% rate means that an amount equal to the value of the entire portfolio is traded every six months.
Janus Henderson Responsible International Dividend Fund
Designation Requirements (unaudited)
For federal income tax purposes, the Fund designated the following for the year ended June 30, 2023:
| | |
| | |
Section 163(j) Interest Dividend | 4% |
Foreign Taxes Paid | $423,362 |
Foreign Source Income | $3,574,312 |
Qualified Dividend Income Percentage | 90% |
Janus Henderson Responsible International Dividend Fund
Trustees and Officers (unaudited)
The following are the Trustees and officers of the Trust, together with a brief description of their principal occupations during the last five years (principal occupations for certain Trustees may include periods over five years). The Fund’s Statement of Additional Information includes additional information about the Trustees and officers and is available, without charge, by calling 1-877-335-2687.
Each Trustee has served in that capacity since he or she was originally elected or appointed. The Trustees do not serve a specified term of office. Each Trustee will hold office until the termination of the Trust or his or her earlier death, resignation, retirement, incapacity, or removal. Under the Fund’s Governance Procedures and Guidelines, the policy is for Trustees to retire no later than the end of the calendar year in which the Trustee turns 75. The Trustees review the Fund’s Governance Procedures and Guidelines from time to time and may make changes they deem appropriate. The Fund’s Nominating and Governance Committee will consider nominees for the position of Trustee recommended by shareholders. Shareholders may submit the name of a candidate for consideration by the Committee by submitting their recommendations to the Trust’s Secretary. Each Trustee is currently a Trustee of one other registered investment company advised by the Adviser: Janus Aspen Series. Collectively, these two registered investment companies consist of 49 series or funds referred to herein as the Fund Complex.
The Trust’s officers are elected annually by the Trustees for a one-year term. Certain officers also serve as officers of Janus Aspen Series. Certain officers of the Fund may also be officers and/or directors of the Adviser. Except as otherwise disclosed, Fund officers receive no compensation from the Fund, except for the Fund’s Chief Compliance Officer, as authorized by the Trustees.
| | | | | | |
TRUSTEES |
Name, Address, and Age | Positions Held with the Trust | Length of Time Served | Principal Occupations During the Past Five Years | Number of Portfolios/Funds in Fund Complex Overseen by Trustee | Other Directorships Held by Trustee During the Past Five Years |
Independent Trustees | | | | |
Alan A. Brown
151 Detroit Street
Denver, CO 80206
DOB: 1962 | Chairman
Trustee | 5/22-Present
1/13-Present | Principal, Curam Holdings LLC (since 2018). Formerly, Executive Vice President, Institutional Markets, of Black Creek Group (private equity real estate investment management firm) (2012-2018), Executive Vice President and Co-Head, Global Private Client Group (2007-2010), Executive Vice President, Mutual Funds (2005-2007), and Chief Marketing Officer (2001-2005) of Nuveen Investments, Inc. (asset management). | 49 | Advisory Board Member of AEW Core Property Trust (open-end property fund) (since 2020), and Director of WTTW (PBS affiliate) (since 2003). Formerly, Director of MotiveQuest LLC (strategic social market research company) (2003-2016), Director of Nuveen Global Investors LLC (2007-2011), Director of Communities in Schools (2004-2010), and Director of Mutual Fund Education Alliance (until 2010). |
Janus Henderson Responsible International Dividend Fund
Trustees and Officers (unaudited)
| | | | | | |
TRUSTEES |
Name, Address, and Age | Positions Held with the Trust | Length of Time Served | Principal Occupations During the Past Five Years | Number of Portfolios/Funds in Fund Complex Overseen by Trustee | Other Directorships Held by Trustee During the Past Five Years |
Independent Trustees | | | | |
Cheryl D. Alston
151 Detroit Street
Denver, CO 80206
DOB: 1966 | Trustee | 8/22-Present | Executive Director and Chief Investment Officer, Employees’ Retirement Fund of the City of Dallas (since 2004). | 49 | Director of Blue Cross Blue Shield of Kansas City (a not-for-profit health insurance provider) (since 2016) and Director of Global Life Insurance (life and supplemental health insurance provider) (since 2017). Formerly, Director of Federal Home Loan Bank of Dallas (2017-2021). |
Janus Henderson Responsible International Dividend Fund
Trustees and Officers (unaudited)
| | | | | | |
TRUSTEES |
Name, Address, and Age | Positions Held with the Trust | Length of Time Served | Principal Occupations During the Past Five Years | Number of Portfolios/Funds in Fund Complex Overseen by Trustee | Other Directorships Held by Trustee During the Past Five Years |
Independent Trustees | | | | |
Janus Henderson Responsible International Dividend Fund
Trustees and Officers (unaudited)
| | | | | | |
William D. Cvengros
151 Detroit Street
Denver, CO 80206
DOB: 1948 | Trustee | 1/11-Present | Chief Executive Officer of SJC Capital, LLC (a personal investment company and consulting firm) (since 2002). Formerly, Chief Executive Officer and President of PIMCO Advisors Holdings L.P. (a publicly traded investment management firm) (1994-2000), and Chief Investment Officer (1987-1994) and Vice Chairman and Director (1990-1994) of Pacific Life Insurance Company (a mutual life insurance and annuity company) (1987-1994). | 49 | Member, Limited Partner Advisory Committee, Karmel Capital Fund III (later stage growth fund) (since 2022), Member of the Investment Committee for the Orange County Community Foundation (a grantmaking foundation) (since 2020), Advisory Board Member, RevOZ Fund LP and related funds (real estate investments for opportunity zones) (since 2020), and Advisory Board Member, Innovate Partners Emerging Growth and Equity Fund I (early stage venture capital fund) (since 2014). Formerly, Managing Trustee of National Retirement Partners Liquidating Trust (2013-2016), Chairman, National Retirement Partners, Inc. (formerly a network of advisors to 401(k) plans) (2005-2013), Director of Prospect Acquisition Corp. (a special purpose acquisition corporation) (2007-2009), Director of RemedyTemp, Inc. (temporary help services company) (1996-2006), and Trustee of PIMCO Funds Multi-Manager Series (1990-2000) and Pacific Life Variable Life & Annuity Trusts (1987-1994). |
Janus Henderson Responsible International Dividend Fund
Trustees and Officers (unaudited)
| | | | | | |
TRUSTEES |
Name, Address, and Age | Positions Held with the Trust | Length of Time Served | Principal Occupations During the Past Five Years | Number of Portfolios/Funds in Fund Complex Overseen by Trustee | Other Directorships Held by Trustee During the Past Five Years |
Independent Trustees | | | | |
Raudline Etienne
151 Detroit Street
Denver, CO 80206
DOB: 1965 | Trustee | 6/16-Present | Founder, Daraja Capital (advisory and investment firm) (since 2016). Formerly, Senior Vice President and Senior Advisor, Albright Stonebridge Group LLC (global strategy firm) (2011-2021), and Deputy Comptroller and Chief Investment Officer, New York State Common Retirement Fund (public pension fund) (2008-2011). | 49 | Member of the Investment Committee for Cooper Union (private college) (since 2021) and Director of Brightwood Capital Advisors, LLC (since 2014). Formerly, Board Member, Van Alen Institute (nonprofit architectural and design organization) (2019-2022). |
Darrell B. Jackson
151 Detroit Street
Denver, CO 80206
DOB: 1958 | Trustee | 8/22-Present | President and Chief Executive Officer, The Efficace Group Inc. (since 2018). Formerly, President and Chief Executive Officer, Seaway Bank and Trust Company (community bank) (2014-2015), and Executive Vice President and Co-President, Wealth Management (2009-2014), and several senior positions, including Group Executive, Senior Vice President, and Vice President (1995-2009) of Northern Trust Company (financial services company) (1995-2014). | 49 | Director of Amalgamated Financial Corp (bank) (since August 2021), Director of YR Media (a not-for-profit production company) (since 2021), and Director of Gray-Bowen-Scott (transportation project consulting firm) (since April 2020). Formerly, Director of Delaware Place Bank (closely held commercial bank) (2016-2018) and Director of Seaway Bank and Trust Company (2014-2015). |
Janus Henderson Responsible International Dividend Fund
Trustees and Officers (unaudited)
| | | | | | |
TRUSTEES |
Name, Address, and Age | Positions Held with the Trust | Length of Time Served | Principal Occupations During the Past Five Years | Number of Portfolios/Funds in Fund Complex Overseen by Trustee | Other Directorships Held by Trustee During the Past Five Years |
Independent Trustees | | | | |
William F. McCalpin
151 Detroit Street
Denver, CO 80206
DOB: 1957 | Trustee | 6/02-Present | Chief Executive Officer, muun chi LLC (organic food business) (since 2022) and Independent Consultant (since 2019). Formerly, Chief Operating Officer, muun chi LLC (2020-2022), Managing Partner, Impact Investments, Athena Capital Advisors LLC (independent registered investment advisor) (2016-2019), Managing Director, Holos Consulting LLC (provides consulting services to foundations and other nonprofit organizations) (2009-2016), Chief Executive Officer, Imprint Capital Advisors (impact investment firm) (2013-2015), and Executive Vice President and Chief Operating Officer of The Rockefeller Brothers Fund (a private family foundation) (1998-2006). | 49 | Chairman of the Board and Trustee of The Investment Fund for Foundations Investment Program (TIP) (consisting of 1 fund) (since 2008). Formerly, Director of the F.B. Heron Foundation (a private grantmaking foundation) (2006-2022), and Director of Mutual Fund Directors Forum (a non-profit organization serving independent directors of U.S. mutual funds) (2016-2021). |
Janus Henderson Responsible International Dividend Fund
Trustees and Officers (unaudited)
| | | | | | |
TRUSTEES |
Name, Address, and Age | Positions Held with the Trust | Length of Time Served | Principal Occupations During the Past Five Years | Number of Portfolios/Funds in Fund Complex Overseen by Trustee | Other Directorships Held by Trustee During the Past Five Years |
Independent Trustees | | | | |
Gary A. Poliner
151 Detroit Street
Denver, CO 80206
DOB: 1953 | Trustee | 6/16-Present | Retired. Formerly, President (2010-2013) of Northwestern Mutual Life Insurance Company. | 49 | Director of MGIC Investment Corporation (private mortgage insurance) (since 2013). Formerly, Director, West Bend Mutual Insurance Company (property/casualty insurance) (2013-2021), Trustee of Northwestern Mutual Life Insurance Company (2010-2013) and Director of Frank Russell Company (global asset management firm) (2008-2013). |
Diane L. Wallace
151 Detroit Street
Denver, CO 80206
DOB: 1958 | Trustee | 6/17-Present | Retired. Formerly, Chief Operating Officer, Senior Vice President-Operations, and Chief Financial Officer for Driehaus Capital Management, LLC (1988-2006) and Treasurer for Driehaus Mutual Funds (1996-2002). | 49 | Formerly, Director of Family Service of Lake County (2019-2021), Independent Trustee, Henderson Global Funds (13 portfolios) (2015-2017), Independent Trustee, State Farm Associates’ Funds Trust, State Farm Mutual Fund Trust, and State Farm Variable Product Trust (28 portfolios) (2013-2017). |
Janus Henderson Responsible International Dividend Fund
Trustees and Officers (unaudited)
| | | | | |
OFFICERS | | | |
Name, Address, and Age | Positions Held with the Trust | Term of Office* and Length of Time Served | Principal Occupations During the Past Five Years |
Faizan Baig
151 Detroit Street
Denver, CO 80206
DOB: 1969 | Executive Vice President and Co-Portfolio Manager
Janus Henderson Responsible International Dividend Fund | 10/20-Present | Portfolio Manager for other Janus Henderson accounts. |
Ben Lofthouse
151 Detroit Street
Denver, CO 80206
DOB: 1976 | Executive Vice President and Co-Portfolio Manager Janus Henderson Responsible International Dividend Fund | 6/17-Present (predecessor fund: since 11/14) | Head of Global Equity Income of Janus Henderson Investors and Portfolio Manager for other Janus Henderson accounts. |
Michelle Rosenberg
151 Detroit Street
Denver, CO 80206
DOB: 1973 | President and Chief Executive Officer | 9/22-Present | General Counsel and Corporate Secretary of Janus Henderson Investors (since 2018). Formerly, Interim President and Chief Executive Officer of the Trust and Janus Aspen Series (2022), Senior Vice President and Head of Legal, North America of Janus Henderson Investors (2017-2018) and Deputy General Counsel of Janus Henderson US (Holdings) Inc. (2015-2018). |
Kristin Mariani
151 Detroit Street
Denver, CO 80206
DOB: 1966 | Vice President and Chief Compliance Officer | 7/20-Present | Head of Compliance, North America at Janus Henderson Investors (since September 2020) and Chief Compliance Officer at Janus Henderson Investors US LLC (since September 2017). Formerly, Anti-Money Laundering Officer for the Trust and Janus Aspen Series (July 2020-December 2022), Global Head of Investment Management Compliance at Janus Henderson Investors (February 2019-August 2020), Vice President, Head of Global Distribution Compliance and Chief Compliance Officer at Janus Henderson Distributors US LLC (May 2017-September 2017), Vice President, Compliance at Janus Henderson US (Holdings) Inc., Janus Henderson Investors US LLC, and Janus Henderson Distributors US LLC (2009-2017). |
Janus Henderson Responsible International Dividend Fund
Trustees and Officers (unaudited)
| | | | | |
OFFICERS | | | |
Name, Address, and Age | Positions Held with the Trust | Term of Office* and Length of Time Served | Principal Occupations During the Past Five Years |
Jesper Nergaard
151 Detroit Street
Denver, CO 80206
DOB: 1962 | Chief Financial Officer
Vice President, Treasurer, and Principal Accounting Officer | 3/05-Present
2/05-Present | Head of U.S. Fund Administration, Janus Henderson Investors and Janus Henderson Services US LLC. |
Abigail J. Murray
151 Detroit Street
Denver, CO 80206
DOB: 1975 | Vice President, Chief Legal Counsel, and Secretary | 12/20-Present | Managing Counsel (since 2020). Formerly, Senior Counsel for Invesco Ltd. (2017-2020), and Vice President and Senior Counsel, ALPS Fund Services, Inc. and Assistant General Counsel, ALPS Advisors, Inc. (2015-2017). |
Ciaran Askin
151 Detroit Street
Denver, CO 80206
DOB: 1978 | Anti-Money Laundering Officer | 12/22-Present | Global Head of Financial Crime, Janus Henderson Investors (since 2022). Formerly, Global Head of Financial Crime for Invesco Ltd. (2017-2022). |
* Officers are elected at least annually by the Trustees for a one-year term and may also be elected from time to time by the Trustees for an interim period. |
Janus Henderson Responsible International Dividend Fund
Notes
NotesPage1
Janus Henderson Responsible International Dividend Fund
Notes
NotesPage2
| | | | | | | | |
| | | | | |

| | | | |
This report is submitted for the general information of shareholders of the Fund. It is not an offer or solicitation for the Fund and is not authorized for distribution to prospective investors unless preceded or accompanied by an effective prospectus. |
Janus Henderson is a trademark of Janus Henderson Group plc or one of its subsidiaries. © Janus Henderson Group plc Janus Henderson Distributors US LLC Janus Henderson Group is the ultimate parent of Janus Henderson Distributors US LLC |
| | | | 125-02-93075 08-23 |
| | | |
| | | |
| | | ANNUAL REPORT June 30, 2023 |
| | |
| | Janus Henderson Short Duration Flexible Bond Fund |
| | |
| | Janus Investment Fund |
| |
| | | |
| | | HIGHLIGHTS · Portfolio management perspective · Investment strategy behind your fund · Fund performance, characteristics
and holdings |
Table of Contents
Janus Henderson Short Duration Flexible Bond Fund
Janus Henderson Short Duration Flexible Bond Fund (unaudited)
| | | | | | |
| | | | 
Greg Wilensky co-portfolio manager | 
Michael Keough co-portfolio manager |
| | | |
PERFORMANCE SUMMARY
For the 12-month period ended June 30, 2023, the Janus Henderson Short-Duration Flexible Bond Fund’s Class I shares returned 1.63% compared with 0.52% for the Fund’s benchmark, the Bloomberg 1-3 Year U.S. Government/Credit Index.
MARKET ENVIRONMENT
While the Bloomberg U.S. Aggregate Bond Index declined 0.94%, it was a different story in short-duration fixed income, as the Bloomberg 1-3 Year U.S. Government/Credit Index rose 0.52% in the 12-month period.
The Treasury yield curve became more inverted, and yields rose across the board. The Federal Reserve (Fed) consistently raised rates to combat inflation before taking a hawkish pause in June 2023 to evaluate the impact of its prior rate hikes. However, the dot plot projection released with the Fed Minutes implied two incremental rate increases before the end of the year.
Rising investor concerns about an economic hard landing pressured returns in the last six months of 2022. However, these concerns dissipated in 2023 as GDP growth exceeded expectations, inflation moderated, and the labor market consistently showed signs of resilience. As a result, expectations for a soft landing increased and risk assets rallied in the back half of the 12-month period.
The yield on the 2-year U.S. Treasury ended June 2023 at 4.90% relative to 2.95% in June of last year. Over the past 12 months, corporate investment-grade credit spreads tightened 32 basis points to 1.23% and high-yield credit spreads tightened 179 basis points to 3.90%.
PERFORMANCE DISCUSSION
Our objective is to generate moderate income from credit spread sectors while limiting drawdowns. To do this, we construct the portfolio with credit risk and a modest amount of interest rate risk.
The portfolio’s structural overweight allocation to credit spread risk was the main driver of relative outperformance. Notably, our overweight exposure to securitized sectors contributed, including mortgage-backed securities (MBS), commercial mortgage-backed securities (CMBS), asset-backed securities (ABS), commercial mortgage obligations (CMO), and collateralized loan obligations (CLO). We continue to prefer a higher exposure to securitized credit relative to corporate credit, as we believe spreads on the former are attractively valued and better reflect the risk of a cooling economy. In our view, taking advantage of the yield available at the front end of the yield curve through high-quality, short-duration securitized credit is one of the most attractive spots in fixed income now. While our allocation to corporates remains near cycle lows, investment grade and high yield contributed on a security selection and asset allocation basis, respectively.
We remain selective and active within the Fund’s exposure to the banking sector and CMBS. Our banking exposure is consolidated in banks we believe are best positioned to navigate a more challenging lending environment. Within CMBS, we have de minimis exposure to the troubled office sector, preferring sectors with strong fundamentals such as multifamily housing, industrial, and hospitality.
We entered the period with more duration than the index, consistent with the structural bias noted above. Treasury rates were highly volatile during the period, and we actively managed duration amid the volatility. While the
Janus Henderson Short Duration Flexible Bond Fund (unaudited)
portfolio’s interest rate positioning detracted, we believe we are currently well placed for yield-curve steepening, considering the Fed is close to the end of its hiking cycle and yield-curve inversion is near multi-decade highs. We are presently also more comfortable with an overweight allocation to duration risk versus the benchmark, following the rapid rise in Treasury yields late in the period.
DERIVATIVES USAGE
The portfolio made use of derivative instruments in the form of Treasury futures contracts to manage interest rate risk during the period. Use of derivative instruments detracted for the 12-month period ended June 30, 2023. Please see the Derivative Instruments section in the “Notes to Financial Statements” for a discussion of derivatives used by the portfolio.
OUTLOOK
The U.S. economy continues to show resilience in the face of higher interest rates, which is encouraging. As the Fed hiking cycle marches deeper into its second year, the recession many predicted is yet to materialize. That said, investors should exercise caution – we believe an economic slowdown remains a distinct possibility. Monetary policy works in long and variable lags and, to a large extent, we are yet to feel the full impact of prior rate hikes. A positive development is the easing of recent stress in the banking sector. Notwithstanding, we do expect tighter lending conditions, which is likely to be an additional headwind.
On the core inflation front, we have seen some promising signs of cooling prices while the labor market remains strong. Still, we think the move from the present level of around 4% to the Fed’s target of 2% might end up being slower and bumpier than markets are expecting. In our view, it seems unlikely that inflation would come back down to 2% without an economic slowdown. So, while the progress on inflation has increased the probability of a soft landing, it is not our base case.
Most developed market central banks continue to push in the same upward direction on interest rates, but this is now largely priced into rates markets. While a stronger-for-longer economy is likely to necessitate a higher-for-longer interest rate environment, we think the risk that interest rates go materially higher from here is slim. As such, taking advantage of the yield available at the front end of the yield curve through high-quality, short-duration credit remains one of the most attractive spots in fixed income.
There are both positive and negative scenarios on the horizon, but it is late in the cycle, so while the portfolio maintains a large exposure to spread sectors to generate income, we remain cautious around the overall amount of spread risk in the portfolio. As such, we focus on high-quality bonds that we believe can withstand an economic downturn and eschew lower-quality issuers and industries that are more sensitive to tighter lending conditions, while favoring exposure to securitized sectors where spreads better reflect the risks of our outlook. And, as always, we maintain a dynamic and flexible approach that we believe can take advantage of opportunities that present themselves as the environment evolves.
Thank you for your investment in the Janus Henderson Short-Duration Flexible Bond Fund.
An inverted yield curve occurs when short-term yields are higher than long-term yields.
Basis point (bp) equals 1/100 of a percentage point. 1 bp = 0.01%, 100 bps = 1%.
Credit spread is the difference in yield between securities with similar maturity but different credit quality. Widening spreads generally indicate deteriorating creditworthiness of corporate borrowers and narrowing indicates improving.
Duration measures a bond price’s sensitivity to changes in interest rates. The longer a bond’s duration, the higher its sensitivity to changes in interest rates and vice versa.
Important Notice – Tailored Shareholder Reports
Effective January 24, 2023, the Securities and Exchange Commission (the “SEC”) adopted rule and form amendments that require mutual funds and exchange-traded funds to provide shareholders with streamlined annual and semi-annual shareholder reports that highlight key information. Other information, including financial statements, that currently appears in shareholder reports will be made available online, delivered free of charge to shareholders upon request, and filed with the SEC. The first tailored shareholder report for the Fund will be for the reporting period ending June 30, 2024. Currently, management is evaluating the impact of the rule and form amendments on the content of the Fund’s current shareholder reports.
Janus Henderson Short Duration Flexible Bond Fund (unaudited)
Fund At A Glance
June 30, 2023
| | | |
Fund Profile | | |
30-day SEC Yield* | Without
Reimbursement | With
Reimbursement |
Class A Shares NAV | 3.29% | 3.43% |
Class A Shares MOP | 3.21% | 3.35% |
Class C Shares** | 2.51% | 2.67% |
Class D Shares | 3.48% | 3.63% |
Class I Shares | 3.44% | 3.58% |
Class N Shares | 3.60% | 3.74% |
Class S Shares | 2.32% | 3.24% |
Class T Shares | 3.36% | 3.49% |
Weighted Average Maturity | 2.9 Years |
Average Effective Duration*** | 2.4 Years |
* Yield will fluctuate. | | |
** Does not include the 1.00% contingent deferred sales charge. |
*** A theoretical measure of price volatility. | |
| | |
Ratings† Summary - (% of Total Investments) | |
AAA | 2.3% |
AA | 44.3% |
A | 6.6% |
BBB | 10.5% |
BB | 2.1% |
B | 0.6% |
Not Rated | 30.1% |
Other | 3.5% |
† Credit ratings provided by Standard & Poor's (S&P), an independent credit rating agency. Credit ratings range from AAA (highest) to D (lowest) based on S&P's measures. Further information on S&P's rating methodology may be found at www.standardandpoors.com. Other rating agencies may rate the same securities differently. Ratings are relative and subjective and are not absolute standards of quality. Credit quality does not remove market risk and is subject to change. "Not Rated" securities are not rated by S&P, but may be rated by other rating agencies and do not necessarily indicate low quality. "Other" includes cash equivalents, equity securities, and certain derivative instruments. |
Significant Areas of Investment - (% of Net Assets)

| | | | | | |
Asset Allocation - (% of Net Assets) | |
Asset-Backed/Commercial Mortgage-Backed Securities | | 39.5% | |
United States Treasury Notes/Bonds | | 36.0% | |
Corporate Bonds | | 15.4% | |
Mortgage-Backed Securities | | 5.2% | |
Investment Companies | | 3.3% | |
Other | | 0.6% |
| | | 100.0% |
Janus Henderson Short Duration Flexible Bond Fund (unaudited)
Performance
| |
See important disclosures on the next page. |
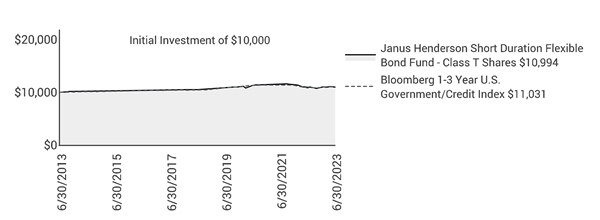
| | | | | | | | | | | |
| | | | | | | | | |
| | | | | | | | | |
Average Annual Total Return - for the periods ended June 30, 2023 | | | Prospectus Expense Ratios |
| | One
Year | Five
Year | Ten
Year | Since
Inception* | | | Total Annual Fund
Operating Expenses‡ | Net Annual Fund
Operating Expenses‡ |
Class A Shares at NAV | | 1.39% | 0.85% | 0.90% | 3.04% | | | 0.79% | 0.70% |
Class A Shares at MOP | | -1.04% | 0.32% | 0.64% | 2.88% | | | | |
Class C Shares at NAV | | 0.75% | 0.17% | 0.15% | 2.34% | | | 1.57% | 1.45% |
Class C Shares at CDSC | | -0.24% | 0.17% | 0.15% | 2.34% | | | | |
Class D Shares | | 1.56% | 1.02% | 1.06% | 3.36% | | | 0.63% | 0.53% |
Class I Shares | | 1.63% | 1.13% | 1.12% | 3.27% | | | 0.61% | 0.45% |
Class N Shares | | 1.33% | 1.08% | 1.13% | 3.37% | | | 0.50% | 0.39% |
Class S Shares | | 0.84% | 0.66% | 0.69% | 2.86% | | | 1.46% | 0.90% |
Class T Shares | | 1.45% | 0.91% | 0.95% | 3.31% | | | 0.73% | 0.64% |
Bloomberg 1-3 Year U.S. Government/Credit Index | | 0.52% | 1.13% | 0.99% | 3.36%** | | | | |
Morningstar Quartile - Class T Shares | | 3rd | 4th | 3rd | 2nd | | | | |
Morningstar Ranking - based on total returns for Short-Term Bond Funds | | 273/579 | 373/520 | 301/444 | 68/154 | | | | |
Returns quoted are past performance and do not guarantee future results; current performance may be lower or higher. Investment returns and principal value will vary; there may be a gain or loss when shares are sold. For the most recent month-end performance call 800.668.0434 (or 800.525.3713 if you hold shares directly with Janus Henderson) or visit janushenderson.com/performance (or janushenderson.com/allfunds if you hold shares directly with Janus Henderson).
Maximum Offering Price (MOP) returns include the maximum sales charge of 2.50%. Net Asset Value (NAV) returns exclude this charge, which would have reduced returns.
CDSC returns include a 1% contingent deferred sales charge (CDSC) on Shares redeemed within 12 months of purchase. Net Asset Value (NAV) returns exclude this charge, which would have reduced returns.
For certain periods, the Fund’s performance may reflect the effects of expense waivers.
Janus Henderson Short Duration Flexible Bond Fund (unaudited)
Performance
Performance may be affected by risks that include those associated with foreign and emerging markets, fixed income securities, high-yield and high-risk securities, undervalued, overlooked and smaller capitalization companies, real estate related securities including Real Estate Investment Trusts (REITs), Environmental, Social and Governance (ESG) factors, non-diversification, portfolio turnover, derivatives, short sales, initial public offerings (IPOs) and potential conflicts of interest. Each product has different risks. Please see the prospectus for more information about risks, holdings and other details.
Returns include reinvestment of all dividends and distributions and do not reflect the deduction of taxes that a shareholder would pay on Fund distributions or redemptions of Fund shares. The returns do not include adjustments in accordance with generally accepted accounting principles required at the period end for financial reporting purposes.
Class A Shares, Class C Shares, Class I Shares, and Class S Shares commenced operations on July 6, 2009. Performance shown for each class for periods prior to July 6, 2009, reflects the performance of the Fund’s Class J Shares, the initial share class (renamed Class T Shares effective February 16, 2010), calculated using the fees and expenses of each respective share class, without the effect of any fee and expense limitations or waivers.
Class D Shares commenced operations on February 16, 2010. Performance shown for periods prior to February 16, 2010, reflects the performance of the Fund’s former Class J Shares, calculated using the fees and expenses in effect during the periods shown, net of any applicable fee and expense limitations or waivers.
Class N Shares commenced operations on May 31, 2012. Performance shown for periods prior to May 31, 2012, reflects the performance of the Fund’s Class T Shares, calculated using the fees and expenses of Class T Shares, net of any applicable fee and expense limitations or waivers.
If each share class of the Fund had been available during periods prior to its commencement, the performance shown may have been different. The performance shown for periods following the Fund’s commencement of each share class reflects the fees and expenses of each respective share class, net of any applicable fee and expense limitations or waivers. Please refer to the Fund’s prospectuses for further details concerning historical performance.
Ranking is for the share class shown only; other classes may have different performance characteristics. When an expense waiver is in effect, it may have a material effect on the total return, and therefore the ranking for the period.
© 2023 Morningstar, Inc. All Rights Reserved.
There is no assurance that the investment process will consistently lead to successful investing.
See Notes to Schedule of Investments and Other Information for index definitions.
Index performance does not reflect the expenses of managing a portfolio as an index is unmanaged and not available for direct investment.
See “Useful Information About Your Fund Report.”
*The Fund’s inception date – September 1, 1992
** The Bloomberg 1-3 Year U.S. Government/Credit Index’s since inception returns are calculated from August 31, 1992.
‡ As stated in the prospectus. Net expense ratios reflect the expense waiver, if any, contractually agreed to for at least a one-year period commencing on October 28, 2022. This contractual waiver may be terminated or modified only at the discretion of the Board of Trustees. See Financial Highlights for actual expense ratios during the reporting period.
Janus Henderson Short Duration Flexible Bond Fund (unaudited)
Expense Examples
As a shareholder of the Fund, you incur two types of costs: (1) transaction costs, such as sales charges (loads) on purchase payments (applicable to Class A Shares only); and (2) ongoing costs, including management fees; 12b-1 distribution and shareholder servicing fees; transfer agent fees and expenses payable pursuant to the Transfer Agency Agreement; and other Fund expenses. This example is intended to help you understand your ongoing costs (in dollars) of investing in the Fund and to compare these costs with the ongoing costs of investing in other mutual funds. To do so, compare this 5% hypothetical example with the 5% hypothetical examples that appear in the shareholder reports of the other funds. The example is based upon an investment of $1,000 invested at the beginning of the period and held for the six-months indicated, unless noted otherwise in the table and footnotes below.
Actual Expenses
The information in the table under the heading “Actual” provides information about actual account values and actual expenses. You may use the information in these columns, together with the amount you invested, to estimate the expenses that you paid over the period. Simply divide your account value by $1,000 (for example, an $8,600 account value divided by $1,000 = 8.6), then multiply the result by the number in the appropriate column for your share class under the heading entitled “Expenses Paid During Period” to estimate the expenses you paid on your account during the period.
Hypothetical Example for Comparison Purposes
The information in the table under the heading “Hypothetical (5% return before expenses)” provides information about hypothetical account values and hypothetical expenses based upon the Fund’s actual expense ratio and an assumed rate of return of 5% per year before expenses, which is not the Fund’s actual return. The hypothetical account values and expenses may not be used to estimate the actual ending account balance or expenses you paid for the period. You may use this information to compare the ongoing costs of investing in the Fund and other funds. To do so, compare this 5% hypothetical example with the 5% hypothetical examples that appear in the shareholder reports of the other funds. Additionally, for an analysis of the fees associated with an investment in any share class or other similar funds, please visit www.finra.org/fundanalyzer.
Please note that the expenses shown in the table are meant to highlight your ongoing costs only and do not reflect any transaction costs. These fees are fully described in the Fund’s prospectuses. Therefore, the hypothetical examples are useful in comparing ongoing costs only, and will not help you determine the relative total costs of owning different funds. In addition, if these transaction costs were included, your costs would have been higher.
| | | | | | | | | | | |
| | | | | | | | |
| | | Actual | | Hypothetical
(5% return before expenses) | |
| Beginning
Account
Value
(1/1/23) | Ending
Account
Value
(6/30/23) | Expenses
Paid During
Period
(1/1/23 - 6/30/23)† | | Beginning
Account
Value
(1/1/23) | Ending
Account
Value
(6/30/23) | Expenses
Paid During
Period
(1/1/23 - 6/30/23)† | Net Annualized
Expense Ratio
(1/1/23 - 6/30/23) |
Class A Shares | $1,000.00 | $1,012.70 | $3.49 | | $1,000.00 | $1,021.32 | $3.51 | 0.70% |
Class C Shares | $1,000.00 | $1,005.80 | $6.76 | | $1,000.00 | $1,018.05 | $6.80 | 1.36% |
Class D Shares | $1,000.00 | $1,010.00 | $2.59 | | $1,000.00 | $1,022.22 | $2.61 | 0.52% |
Class I Shares | $1,000.00 | $1,013.90 | $2.30 | | $1,000.00 | $1,022.51 | $2.31 | 0.46% |
Class N Shares | $1,000.00 | $1,010.60 | $1.99 | | $1,000.00 | $1,022.81 | $2.01 | 0.40% |
Class S Shares | $1,000.00 | $1,008.20 | $4.38 | | $1,000.00 | $1,020.43 | $4.41 | 0.88% |
Class T Shares | $1,000.00 | $1,009.50 | $3.14 | | $1,000.00 | $1,021.67 | $3.16 | 0.63% |
† | Expenses Paid During Period are equal to the Net Annualized Expense Ratio multiplied by the average account value over the period, multiplied by 181/365 (to reflect the one-half year period). Expenses in the examples include the effect of applicable fee waivers and/or expense reimbursements, if any. Had such waivers and/or reimbursements not been in effect, your expenses would have been higher. Please refer to the Notes to Financial Statements or the Fund’s prospectuses for more information regarding waivers and/or reimbursements. |
Janus Henderson Short Duration Flexible Bond Fund
Schedule of Investments
June 30, 2023
| | | | | | | | |
Shares or
Principal Amounts | | | Value | |
Asset-Backed/Commercial Mortgage-Backed Securities– 39.5% | | | |
| | 208 Park Avenue Mortgage Trust 2017-280P, | | | | | | |
| | ICE LIBOR USD 1 Month + 0.8800%, 6.0620%, 9/15/34 (144A)‡ | | $2,890,000 | | | $2,805,777 | |
| | A&D Mortgage Trust 2023-NQM2 A1, 6.1320%, 5/25/68 (144A)Ç | | 2,087,737 | | | 2,054,571 | |
| | ACC Auto Trust 2021-A A, 1.0800%, 4/15/27 (144A) | | 34,278 | | | 34,228 | |
| | ACC Auto Trust 2022-A A, 4.5800%, 7/15/26 (144A) | | 1,028,507 | | | 1,014,154 | |
| | ACHV ABS Trust 2023-2PL A, 6.4200%, 5/20/30 (144A) | | 1,076,388 | | | 1,076,094 | |
| | ACHV Trust 2023-1PL A, 6.4200%, 3/18/30 (144A) | | 527,492 | | | 527,443 | |
| | ACM Auto Trust 2023-1A A, 6.6100%, 1/22/30 (144A) | | 1,993,527 | | | 1,993,241 | |
| | Affirm Asset Securitization Trust 2021-B A, 1.0300%, 8/17/26 (144A) | | 1,402,000 | | | 1,363,829 | |
| | Angel Oak Mortgage Trust I LLC 2019-5, 2.5930%, 10/25/49 (144A)‡ | | 140,895 | | | 134,703 | |
| | Angel Oak Mortgage Trust I LLC 2019-6, | | | | | | |
| | ICE LIBOR USD 12 Month + 0.9500%, 2.6200%, 11/25/59 (144A)‡ | | 127,435 | | | 120,438 | |
| | Aqua Finance Trust 2021-A A, 1.5400%, 7/17/46 (144A) | | 591,844 | | | 523,512 | |
| | ARES CLO Ltd 2021-60A A, | | | | | | |
| | ICE LIBOR USD 3 Month + 1.1200%, 6.3817%, 7/18/34 (144A)‡ | | 491,000 | | | 479,857 | |
| | Arivo Acceptance Auto Loan Receivables 2022-1A A, 3.9300%, 5/15/28 (144A) | | 1,724,846 | | | 1,669,541 | |
| | Atalaya Equipment Leasing Fund I LP 2021-1A A2, 1.2300%, 5/15/26 (144A) | | 507,182 | | | 496,945 | |
| | BPR Trust 2022-OANA A, | | | | | | |
| | CME Term SOFR 1 Month + 1.8980%, 7.0450%, 4/15/37 (144A)‡ | | 3,717,000 | | | 3,618,860 | |
| | BX Commercial Mortgage Trust 2019-XL, | | | | | | |
| | CME Term SOFR 1 Month + 1.0345%, 6.1815%, 10/15/36 (144A)‡ | | 3,623,932 | | | 3,599,918 | |
| | BX Commercial Mortgage Trust 2019-XL, | | | | | | |
| | CME Term SOFR 1 Month + 1.1945%, 6.3415%, 10/15/36 (144A)‡ | | 850,000 | | | 841,468 | |
| | BX Commercial Mortgage Trust 2021-21M A, | | | | | | |
| | ICE LIBOR USD 1 Month + 0.7300%, 5.9230%, 10/15/36 (144A)‡ | | 1,868,489 | | | 1,807,897 | |
| | BX Commercial Mortgage Trust 2021-LBA AJV, | | | | | | |
| | CME Term SOFR 1 Month + 0.9145%, 6.0615%, 2/15/36 (144A)‡ | | 1,598,000 | | | 1,546,651 | |
| | BX Commercial Mortgage Trust 2021-LBA AV, | | | | | | |
| | CME Term SOFR 1 Month + 0.9145%, 6.0615%, 2/15/36 (144A)‡ | | 1,817,000 | | | 1,759,670 | |
| | BX Commercial Mortgage Trust 2021-VOLT F, | | | | | | |
| | ICE LIBOR USD 1 Month + 2.4000%, 7.5933%, 9/15/36 (144A)‡ | | 3,235,000 | | | 3,029,726 | |
| | BX Commercial Mortgage Trust 2022-FOX2 A2, | | | | | | |
| | CME Term SOFR 1 Month + 0.7492%, 5.8962%, 4/15/39 (144A)‡ | | 1,958,741 | | | 1,872,682 | |
| | Carvana Auto Receivables Trust 2021-P4 A2, 0.8200%, 4/10/25 | | 98,432 | | | 98,296 | |
| | CBAM CLO Management 2019-11RA A2, | | | | | | |
| | ICE LIBOR USD 3 Month + 1.5000%, 6.7504%, 1/20/35 (144A)‡ | | 4,325,000 | | | 4,169,884 | |
| | CF Hippolyta Issuer LLC 2021-1A A1, 1.5300%, 3/15/61 (144A) | | 2,170,457 | | | 1,876,435 | |
| | CF Hippolyta Issuer LLC 2021-1A B1, 1.9800%, 3/15/61 (144A) | | 796,368 | | | 671,045 | |
| | CF Hippolyta Issuer LLC 2022-1A A1, 5.9700%, 8/15/62 (144A) | | 12,308,912 | | | 11,953,360 | |
| | Chase Auto Credit Linked Notes 2020-1 B, 0.9910%, 1/25/28 (144A) | | 185,866 | | | 184,745 | |
| | Chase Auto Credit Linked Notes 2020-2 B, 0.8400%, 2/25/28 (144A) | | 224,534 | | | 221,063 | |
| | Chase Auto Credit Linked Notes 2021-1 B, 0.8750%, 9/25/28 (144A) | | 667,334 | | | 646,789 | |
| | Chase Auto Credit Linked Notes 2021-2 B, 0.8890%, 12/26/28 (144A) | | 533,086 | | | 515,094 | |
| | Chase Mortgage Finance Corp 2020-CL1 M1, | | | | | | |
| | ICE LIBOR USD 1 Month + 2.2500%, 7.4004%, 10/25/57 (144A)‡ | | 3,076,660 | | | 3,018,191 | |
| | CIFC Funding Ltd 2016-1A BRR, | | | | | | |
| | ICE LIBOR USD 3 Month + 1.7000%, 6.5153%, 10/21/31 (144A)‡ | | 1,278,000 | | | 1,246,394 | |
| | CIFC Funding Ltd 2021-7A B, | | | | | | |
| | ICE LIBOR USD 3 Month + 1.6000%, 6.8727%, 1/23/35 (144A)‡ | | 1,432,000 | | | 1,386,169 | |
| | CIM Trust 2021-NR1 A1, 2.5690%, 7/25/55 (144A)Ç | | 909,090 | | | 873,499 | |
| | Cold Storage Trust 2020-ICE5 A, | | | | | | |
| | ICE LIBOR USD 1 Month + 0.9000%, 6.0933%, 11/15/37 (144A)‡ | | 3,282,205 | | | 3,224,027 | |
| | Cold Storage Trust 2020-ICE5 B, | | | | | | |
| | ICE LIBOR USD 1 Month + 1.3000%, 6.4933%, 11/15/37 (144A)‡ | | 1,683,863 | | | 1,653,428 | |
| | Cold Storage Trust 2020-ICE5 C, | | | | | | |
| | ICE LIBOR USD 1 Month + 1.6500%, 6.8433%, 11/15/37 (144A)‡ | | 1,690,744 | | | 1,658,137 | |
| | COLEM Mortgage Trust 2022-HLNE A, 2.5430%, 4/12/42 (144A)‡ | | 4,914,000 | | | 3,792,203 | |
| | Conn Funding II LP 2022-A A, 5.8700%, 12/15/26 (144A) | | 106,619 | | | 106,601 | |
| | Connecticut Avenue Securities Trust 2018-R07, | | | | | | |
| | ICE LIBOR USD 1 Month + 2.4000%, 7.5504%, 4/25/31 (144A)‡ | | 32,485 | | | 32,586 | |
| | |
See Notes to Schedule of Investments and Other Information and Notes to Financial Statements. |
| |
Janus Investment Fund | 7 |
Janus Henderson Short Duration Flexible Bond Fund
Schedule of Investments
June 30, 2023
| | | | | | | | |
Shares or
Principal Amounts | | | Value | |
Asset-Backed/Commercial Mortgage-Backed Securities– (continued) | | | |
| | Connecticut Avenue Securities Trust 2019-R02, | | | | | | |
| | ICE LIBOR USD 1 Month + 2.3000%, 7.4504%, 8/25/31 (144A)‡ | | $5,066 | | | $5,066 | |
| | Connecticut Avenue Securities Trust 2019-R03, | | | | | | |
| | ICE LIBOR USD 1 Month + 2.1500%, 7.3004%, 9/25/31 (144A)‡ | | 129,871 | | | 130,054 | |
| | Connecticut Avenue Securities Trust 2019-R07, | | | | | | |
| | ICE LIBOR USD 1 Month + 2.1000%, 7.2504%, 10/25/39 (144A)‡ | | 2,242 | | | 2,246 | |
| | Connecticut Avenue Securities Trust 2021-R02 2M1, | | | | | | |
| | US 30 Day Average SOFR + 0.9000%, 5.9666%, 11/25/41 (144A)‡ | | 1,591,945 | | | 1,579,030 | |
| | Connecticut Avenue Securities Trust 2021-R02 2M2, | | | | | | |
| | US 30 Day Average SOFR + 2.0000%, 7.0666%, 11/25/41 (144A)‡ | | 2,548,000 | | | 2,480,731 | |
| | Connecticut Avenue Securities Trust 2021-R03 1M2, | | | | | | |
| | US 30 Day Average SOFR + 1.6500%, 6.7166%, 12/25/41 (144A)‡ | | 951,000 | | | 918,973 | |
| | Connecticut Avenue Securities Trust 2022-R01 1B1, | | | | | | |
| | US 30 Day Average SOFR + 3.1500%, 8.2166%, 12/25/41 (144A)‡ | | 1,759,000 | | | 1,723,208 | |
| | Connecticut Avenue Securities Trust 2022-R01 1M2, | | | | | | |
| | US 30 Day Average SOFR + 1.9000%, 6.9666%, 12/25/41 (144A)‡ | | 1,997,000 | | | 1,944,836 | |
| | Connecticut Avenue Securities Trust 2022-R03 1M1, | | | | | | |
| | US 30 Day Average SOFR + 2.1000%, 7.1666%, 3/25/42 (144A)‡ | | 1,755,801 | | | 1,760,051 | |
| | Connecticut Avenue Securities Trust 2022-R04 1M1, | | | | | | |
| | US 30 Day Average SOFR + 2.0000%, 7.0666%, 3/25/42 (144A)‡ | | 791,452 | | | 792,740 | |
| | Connecticut Avenue Securities Trust 2022-R06 1M1, | | | | | | |
| | US 30 Day Average SOFR + 2.7500%, 7.8166%, 5/25/42 (144A)‡ | | 700,652 | | | 713,349 | |
| | Connecticut Avenue Securities Trust 2022-R08 1M1, | | | | | | |
| | US 30 Day Average SOFR + 2.5500%, 7.6166%, 7/25/42 (144A)‡ | | 869,667 | | | 880,335 | |
| | Connecticut Avenue Securities Trust 2023-R01 1M1, | | | | | | |
| | US 30 Day Average SOFR + 2.4000%, 7.4666%, 12/25/42 (144A)‡ | | 884,952 | | | 889,167 | |
| | Connecticut Avenue Securities Trust 2023-R03 2M1, | | | | | | |
| | US 30 Day Average SOFR + 2.5000%, 7.5666%, 4/25/43 (144A)‡ | | 2,053,167 | | | 2,070,814 | |
| | Consumer Loan Underlying Bond Credit Trust 2019-P2 C, | | | | | | |
| | 4.4100%, 10/15/26 (144A) | | 84,998 | | | 84,944 | |
| | CP EF Asset Securitization I LLC 2002-1A A, 5.9600%, 4/15/30 (144A) | | 2,236,715 | | | 2,198,769 | |
| | Credit Suisse Commercial Mortgage Trust 2019-ICE4, | | | | | | |
| | ICE LIBOR USD 1 Month + 0.9800%, 6.1730%, 5/15/36 (144A)‡ | | 3,693,810 | | | 3,670,075 | |
| | Credit Suisse Commercial Mortgage Trust 2019-ICE4 C, | | | | | | |
| | ICE LIBOR USD 1 Month + 1.4300%, 6.6230%, 5/15/36 (144A)‡ | | 4,095,810 | | | 4,049,670 | |
| | Credit Suisse Commercial Mortgage Trust 2020-TMIC A, | | | | | | |
| | ICE LIBOR USD 1 Month + 3.5000%, 8.6930%, 12/15/35 (144A)‡ | | 2,743,000 | | | 2,729,858 | |
| | Credit Suisse Commercial Mortgage Trust 2021-WEHO A, | | | | | | |
| | CME Term SOFR 1 Month + 4.0838%, 9.2308%, 4/15/26 (144A)‡ | | 1,408,948 | | | 1,395,829 | |
| | DB Master Finance LLC 2017-1A A2II, 4.0300%, 11/20/47 (144A) | | 4,854,990 | | | 4,431,523 | |
| | DBCCRE Mortgage Trust 2014-ARCP E, 5.0990%, 1/10/34 (144A)‡ | | 4,240,000 | | | 4,002,461 | |
| | Diamond Infrastructure Funding LLC 2021-1A A, 1.7600%, 4/15/49 (144A) | | 2,114,000 | | | 1,814,760 | |
| | Diamond Resorts Owner Trust 2021-1A A, 1.5100%, 11/21/33 (144A) | | 565,065 | | | 517,952 | |
| | Donlen Fleet Lease Funding 2021-2 B, 0.9800%, 12/11/34 (144A) | | 1,572,000 | | | 1,491,310 | |
| | Donlen Fleet Lease Funding 2021-2 C, 1.2000%, 12/11/34 (144A) | | 1,471,000 | | | 1,387,459 | |
| | Drive Auto Receivables Trust 2020-1, 2.7000%, 5/17/27 | | 1,918,882 | | | 1,879,752 | |
| | DROP Mortgage Trust 2021-FILE A, | | | | | | |
| | ICE LIBOR USD 1 Month + 1.1500%, 6.3430%, 10/15/43 (144A)‡ | | 3,929,000 | | | 3,577,551 | |
| | Elmwood CLO VIII Ltd 2019-2A AR, | | | | | | |
| | ICE LIBOR USD 3 Month + 1.1500%, 5.9577%, 4/20/34 (144A)‡ | | 740,000 | | | 728,722 | |
| | Exeter Automobile Receivables Trust 2019-1, 5.2000%, 1/15/26 (144A) | | 2,895,000 | | | 2,885,494 | |
| | Exeter Automobile Receivables Trust 2020-2A E, 7.1900%, 9/15/27 (144A) | | 2,687,000 | | | 2,698,135 | |
| | Exeter Automobile Receivables Trust 2021-1A D, 1.0800%, 11/16/26 | | 1,081,000 | | | 1,015,032 | |
| | Extended Stay America Trust 2021-ESH E, | | | | | | |
| | ICE LIBOR USD 1 Month + 2.8500%, 8.0440%, 7/15/38 (144A)‡ | | 3,264,180 | | | 3,159,626 | |
| | First Investors Auto Owner Trust 2022-1A A, 2.0300%, 1/15/27 (144A) | | 1,831,053 | | | 1,779,795 | |
| | Flagstar Mortgage Trust 2021-13IN A2, 3.0000%, 12/30/51 (144A)‡ | | 5,430,889 | | | 4,552,402 | |
| | Foursight Capital Auto Receivables Trust 2021-1 B, 0.8700%, 1/15/26 (144A) | | 1,221,950 | | | 1,214,279 | |
| | Freddie Mac Structured Agency Credit Risk Debt Notes 2019-DNA4 M2, | | | | | | |
| | ICE LIBOR USD 1 Month + 1.9500%, 7.1004%, 10/25/49 (144A)‡ | | 109,754 | | | 109,906 | |
| | |
See Notes to Schedule of Investments and Other Information and Notes to Financial Statements. |
| |
8 | JUNE 30, 2023 |
Janus Henderson Short Duration Flexible Bond Fund
Schedule of Investments
June 30, 2023
| | | | | | | | |
Shares or
Principal Amounts | | | Value | |
Asset-Backed/Commercial Mortgage-Backed Securities– (continued) | | | |
| | Freddie Mac Structured Agency Credit Risk Debt Notes 2020-DNA6 M2, | | | | | | |
| | US 30 Day Average SOFR + 2.0000%, 7.0666%, 12/25/50 (144A)‡ | | $1,024,022 | | | $1,033,592 | |
| | Freddie Mac Structured Agency Credit Risk Debt Notes 2020-HQA2 M2, | | | | | | |
| | ICE LIBOR USD 1 Month + 3.1000%, 8.2504%, 3/25/50 (144A)‡ | | 1,735,238 | | | 1,779,537 | |
| | Freddie Mac Structured Agency Credit Risk Debt Notes 2020-HQA5 M2, | | | | | | |
| | US 30 Day Average SOFR + 2.6000%, 7.6666%, 11/25/50 (144A)‡ | | 1,109,365 | | | 1,125,212 | |
| | Freddie Mac Structured Agency Credit Risk Debt Notes 2021-DNA2 M2, | | | | | | |
| | US 30 Day Average SOFR + 2.3000%, 7.3666%, 8/25/33 (144A)‡ | | 1,588,902 | | | 1,589,713 | |
| | Freddie Mac Structured Agency Credit Risk Debt Notes 2021-HQA1 M2, | | | | | | |
| | US 30 Day Average SOFR + 2.2500%, 7.3166%, 8/25/33 (144A)‡ | | 654,965 | | | 644,508 | |
| | Freddie Mac Structured Agency Credit Risk Debt Notes 2021-HQA2 M2, | | | | | | |
| | US 30 Day Average SOFR + 2.0500%, 7.1166%, 12/25/33 (144A)‡ | | 2,592,000 | | | 2,481,394 | |
| | Freddie Mac Structured Agency Credit Risk Debt Notes 2022-DNA5 M1A, | | | | | | |
| | US 30 Day Average SOFR + 2.9500%, 8.0166%, 6/25/42 (144A)‡ | | 1,149,920 | | | 1,168,777 | |
| | Freddie Mac Structured Agency Credit Risk Debt Notes 2022-HQA1 M1A, | | | | | | |
| | US 30 Day Average SOFR + 2.1000%, 7.1666%, 3/25/42 (144A)‡ | | 799,817 | | | 800,735 | |
| | Freddie Mac Structured Agency Credit Risk Debt Notes 2022-HQA3 M1A, | | | | | | |
| | US 30 Day Average SOFR + 2.3000%, 7.3666%, 8/25/42 (144A)‡ | | 734,821 | | | 739,239 | |
| | Freddie Mac Structured Agency Credit Risk Debt Notes 2023-DNA2 M1A, | | | | | | |
| | US 30 Day Average SOFR + 2.1000%, 7.1666%, 4/25/43 (144A)‡ | | 1,627,649 | | | 1,632,395 | |
| | Freddie Mac Structured Agency Credit Risk Debt Notes 2023-HQA2 M1A, | | | | | | |
| | US 30 Day Average SOFR + 2.0000%, 7.0666%, 6/25/43 (144A)‡ | | 1,939,000 | | | 1,945,059 | |
| | FREED ABS Trust 2022-2CP B, 4.4900%, 5/18/29 (144A) | | 6,317,000 | | | 6,263,086 | |
| | GCAT 2022-INV1 A1, 3.0000%, 12/25/51 (144A)‡ | | 4,738,007 | | | 3,974,879 | |
| | Great Wolf Trust, | | | | | | |
| | CME Term SOFR 1 Month + 1.1485%, 6.2955%, 12/15/36 (144A)‡ | | 5,929,000 | | | 5,858,703 | |
| | Hilton Grand Vacations Trust 2020-AA, 2.7400%, 2/25/39 (144A) | | 1,531,685 | | | 1,437,315 | |
| | JP Morgan Chase Commercial Mortgage Sec Trust 2020-ACE A, | | | | | | |
| | 3.2865%, 1/10/37 (144A) | | 991,000 | | | 923,027 | |
| | JP Morgan Chase Commercial Mortgage Sec Trust 2020-ACE B, | | | | | | |
| | 3.6401%, 1/10/37 (144A) | | 2,560,000 | | | 2,336,514 | |
| | JP Morgan Mortgage Trust 2019-LTV2, 3.5000%, 12/25/49 (144A)‡ | | 12,347 | | | 12,223 | |
| | KNDL Mortgage Trust 2019-KNSQ A, | | | | | | |
| | ICE LIBOR USD 1 Month + 0.9500%, 6.1430%, 5/15/36 (144A)‡ | | 3,838,000 | | | 3,813,279 | |
| | LAD Auto Receivables Trust 2021-1A A, 1.3000%, 8/17/26 (144A) | | 438,600 | | | 427,190 | |
| | LAD Auto Receivables Trust 2022-1A A, 5.2100%, 6/15/27 (144A) | | 2,563,330 | | | 2,533,434 | |
| | Lendbuzz Securitization Trust 2021-1A A, 1.4600%, 6/15/26 (144A) | | 2,034,845 | | | 1,948,651 | |
| | Lendbuzz Securitization Trust 2021-1A A, 4.2200%, 5/17/27 (144A)‡ | | 1,894,710 | | | 1,830,420 | |
| | Lendbuzz Securitization Trust 2023-1A A2, 6.9200%, 8/15/28 (144A) | | 3,096,000 | | | 3,080,809 | |
| | Life Financial Services Trust 2021-BMR A, | | | | | | |
| | CME Term SOFR 1 Month + 0.8145%, 5.9615%, 3/15/38 (144A)‡ | | 3,554,420 | | | 3,462,083 | |
| | Life Financial Services Trust 2021-BMR C, | | | | | | |
| | CME Term SOFR 1 Month + 1.2145%, 6.3615%, 3/15/38 (144A)‡ | | 1,980,685 | | | 1,906,923 | |
| | Life Financial Services Trust 2022-BMR2 A1, | | | | | | |
| | CME Term SOFR 1 Month + 1.2952%, 6.4422%, 5/15/39 (144A)‡ | | 2,823,000 | | | 2,757,388 | |
| | Life Financial Services Trust 2022-BMR2 B, | | | | | | |
| | CME Term SOFR 1 Month + 1.7939%, 6.9409%, 5/15/39 (144A)‡ | | 1,059,000 | | | 1,033,970 | |
| | Marlette Funding Trust 2021-3A A, 0.6500%, 12/15/31 (144A) | | 54,222 | | | 54,137 | |
| | Marlette Funding Trust 2023-1A A, 6.0700%, 4/15/33 (144A) | | 2,433,048 | | | 2,422,849 | |
| | Marlette Funding Trust 2023-2A B, 6.5400%, 6/15/33 (144A) | | 1,275,000 | | | 1,273,107 | |
| | MED Trust 2021-MDLN E, | | | | | | |
| | ICE LIBOR USD 1 Month + 3.1500%, 8.3440%, 11/15/38 (144A)‡ | | 2,634,357 | | | 2,489,330 | |
| | Mello Mortgage Capital Acceptance Trust 2021-INV3 A11, | | | | | | |
| | US 30 Day Average SOFR + 0.9500%, 5.0000%, 10/25/51 (144A)‡ | | 1,714,694 | | | 1,572,905 | |
| | Mello Mortgage Capital Acceptance Trust 2021-INV4 A3, | | | | | | |
| | 2.5000%, 12/25/51 (144A)‡ | | 1,812,551 | | | 1,454,976 | |
| | Mello Mortgage Capital Acceptance Trust 2022-INV1 A2, | | | | | | |
| | 3.0000%, 3/25/52 (144A)‡ | | 3,257,019 | | | 2,734,990 | |
| | Mercury Financial Credit Card Master Trust 2023-1A A, | | | | | | |
| | 8.0400%, 9/20/27 (144A) | | 2,674,000 | | | 2,676,207 | |
| | |
See Notes to Schedule of Investments and Other Information and Notes to Financial Statements. |
| |
Janus Investment Fund | 9 |
Janus Henderson Short Duration Flexible Bond Fund
Schedule of Investments
June 30, 2023
| | | | | | | | |
Shares or
Principal Amounts | | | Value | |
Asset-Backed/Commercial Mortgage-Backed Securities– (continued) | | | |
| | MHC Commercial Mortgage Trust 2021-MHC A, | | | | | | |
| | CME Term SOFR 1 Month + 0.9154%, 6.0624%, 4/15/38 (144A)‡ | | $3,182,956 | | | $3,125,581 | |
| | MHC Commercial Mortgage Trust 2021-MHC C, | | | | | | |
| | CME Term SOFR 1 Month + 1.4654%, 6.6124%, 4/15/38 (144A)‡ | | 1,797,068 | | | 1,750,679 | |
| | Mission Lane Credit Card Master Trust 2023-A A, 7.2300%, 7/17/28 (144A) | | 2,136,000 | | | 2,126,850 | |
| | Neuberger Berman CLO Ltd 2019-33A BR, | | | | | | |
| | ICE LIBOR USD 3 Month + 1.6000%, 6.8603%, 10/16/33 (144A)‡ | | 3,800,000 | | | 3,709,397 | |
| | NMEF Funding LLC 2022-A A2, 2.5800%, 10/16/28 (144A) | | 2,483,980 | | | 2,427,122 | |
| | NRZ Excess Spread Collateralized Notes 2020-PLS1 A, | | | | | | |
| | 3.8440%, 12/25/25 (144A) | | 338,790 | | | 313,595 | |
| | NRZ Excess Spread Collateralized Notes 2021-FHT1 A, 3.1040%, 7/25/26 (144A) | | 694,801 | | | 621,873 | |
| | Oak Street Investment Grade Net Lease Fund 2020-1A A1, | | | | | | |
| | 1.8500%, 11/20/50 (144A) | | 1,058,084 | | | 954,896 | |
| | Oasis Securitization 2021-2A A, 2.1430%, 10/15/33 (144A) | | 779,316 | | | 767,085 | |
| | Oasis Securitization 2022-1A A, 4.7500%, 5/15/34 (144A) | | 1,114,429 | | | 1,096,933 | |
| | Oasis Securitization 2022-2A A, 6.8500%, 10/15/34 (144A) | | 1,711,709 | | | 1,694,773 | |
| | Oasis Securitization 2023-1A A, 7.0000%, 2/15/35 (144A) | | 3,585,229 | | | 3,567,436 | |
| | Oceanview Mortgage Trust 2021-4 A11, | | | | | | |
| | US 30 Day Average SOFR + 0.8500%, 5.0000%, 10/25/51 (144A)‡ | | 1,874,998 | | | 1,705,111 | |
| | Oceanview Mortgage Trust 2021-5 AF, | | | | | | |
| | US 30 Day Average SOFR + 0.8500%, 5.0000%, 11/25/51 (144A)‡ | | 1,835,340 | | | 1,669,802 | |
| | Oceanview Mortgage Trust 2022-1 A1, 3.0000%, 12/25/51 (144A)‡ | | 1,917,847 | | | 1,609,083 | |
| | Oceanview Mortgage Trust 2022-2 A1, 3.0000%, 12/25/51 (144A)‡ | | 3,780,859 | | | 3,172,165 | |
| | OCP CLO Ltd 2015-10A BR2, | | | | | | |
| | ICE LIBOR USD 3 Month + 1.6500%, 6.9181%, 1/26/34 (144A)‡ | | 2,686,000 | | | 2,607,056 | |
| | Octagon Investment Partners 48 Ltd 2020-3A BR, | | | | | | |
| | ICE LIBOR USD 3 Month + 1.6000%, 6.8504%, 10/20/34 (144A)‡ | | 527,000 | | | 510,320 | |
| | Ondeck Asset Securitization Trust LLC 2021-1A A, 1.5900%, 5/17/27 (144A) | | 1,807,000 | | | 1,725,455 | |
| | Onslow Bay Financial LLC 2021-INV3 A3, 2.5000%, 10/25/51 (144A)‡ | | 2,813,848 | | | 2,256,715 | |
| | Onslow Bay Financial LLC 2022-INV1 A1, 3.0000%, 12/25/51 (144A)‡ | | 3,828,413 | | | 3,211,608 | |
| | Onslow Bay Financial LLC 2022-INV1 A18, 3.0000%, 12/25/51 (144A)‡ | | 1,623,710 | | | 1,324,583 | |
| | Oscar US Funding Trust 2021-1A A3, 0.7000%, 4/10/25 (144A) | | 1,437,144 | | | 1,413,752 | |
| | Pagaya AI Debt Selection Trust 2022-1 A, 2.0300%, 10/15/29 (144A) | | 613,689 | | | 596,877 | |
| | Palmer Square Loan Funding 2020-1A A2, | | | | | | |
| | ICE LIBOR USD 3 Month + 1.3500%, 6.7291%, 2/20/28 (144A)‡ | | 3,093,334 | | | 3,083,974 | |
| | Pawnee Equipment Receivables 2021-1 A2, 1.1000%, 7/15/27 (144A) | | 2,053,766 | | | 1,979,078 | |
| | Pear LLC 2022-1 A1, 6.5000%, 10/15/34 (144A) | | 728,845 | | | 727,957 | |
| | Preston Ridge Partners Mortgage Trust 2021-10 A1, 2.4870%, 10/25/26 (144A)Ç | | 1,760,673 | | | 1,621,857 | |
| | Preston Ridge Partners Mortgage Trust 2021-9 A1, 2.3630%, 10/25/26 (144A)Ç | | 1,751,234 | | | 1,623,855 | |
| | Preston Ridge Partners Mortgage Trust 2022-2 A1, 5.0000%, 3/25/27 (144A)Ç | | 2,357,844 | | | 2,267,088 | |
| | Provident Funding Mortgage Trust 2021-INV1 A1, 2.5000%, 8/25/51 (144A)‡ | | 1,592,530 | | | 1,277,624 | |
| | Reach Financial LLC 2021-1A B, 2.1700%, 5/15/29 (144A) | | 2,110,000 | | | 1,956,978 | |
| | Reach Financial LLC 2022-2A A, 6.6300%, 5/15/30 (144A) | | 1,096,758 | | | 1,097,267 | |
| | Saluda Grade Alternative Mortgage Trust 2023-SEQ3 A1, | | | | | | |
| | 7.1620%, 6/1/53 (144A)‡ | | 2,060,548 | | | 2,054,994 | |
| | Santander Bank Auto Credit-Linked Notes 2021-1A C, 3.2680%, 12/15/31 (144A) | | 536,549 | | | 517,020 | |
| | Santander Bank Auto Credit-Linked Notes 2022-A B, 5.2810%, 5/15/32 (144A) | | 1,367,803 | | | 1,347,225 | |
| | Santander Drive Auto Receivables Trust 2021-1 D, 1.1300%, 11/16/26 | | 4,581,000 | | | 4,380,059 | |
| | Sierra Receivables Funding Co LLC 2021-1A A, 0.9900%, 11/20/37 (144A) | | 881,622 | | | 808,847 | |
| | SMRT 2022-MINI A, CME Term SOFR 1 Month + 1.0000%, 6.1470%, 1/15/39 (144A)‡ | | 2,805,000 | | | 2,722,039 | |
| | SoFi Consumer Loan Program Trust 2022-1S A, 6.2100%, 4/15/31 (144A) | | 1,964,890 | | | 1,963,413 | |
| | SoFi Professional Loan Program 2020-C Trust, 1.9500%, 2/15/46 (144A) | | 1,558,548 | | | 1,392,505 | |
| | Sound Point CLO Ltd 2019-1A AR, | | | | | | |
| | ICE LIBOR USD 3 Month + 1.0800%, 5.8877%, 1/20/32 (144A)‡ | | 2,136,000 | | | 2,099,357 | |
| | SREIT Trust 2021-MFP A, | | | | | | |
| | ICE LIBOR USD 1 Month + 0.7308%, 5.9241%, 11/15/38 (144A)‡ | | 3,236,000 | | | 3,140,996 | |
| | Tesla Auto Lease Trust 2021-B A3, 0.6000%, 9/22/25 (144A) | | 1,050,000 | | | 1,010,578 | |
| | Tesla Auto Lease Trust 2021-B B, 0.9100%, 9/22/25 (144A) | | 538,000 | | | 509,216 | |
| | Theorem Funding Trust 2021-1A A, 1.2100%, 12/15/27 (144A) | | 716,367 | | | 713,089 | |
| | |
See Notes to Schedule of Investments and Other Information and Notes to Financial Statements. |
| |
10 | JUNE 30, 2023 |
Janus Henderson Short Duration Flexible Bond Fund
Schedule of Investments
June 30, 2023
| | | | | | | | |
Shares or
Principal Amounts | | | Value | |
Asset-Backed/Commercial Mortgage-Backed Securities– (continued) | | | |
| | Theorem Funding Trust 2022-3A A, 7.6000%, 4/15/29 (144A) | | $2,409,573 | | | $2,415,950 | |
| | THL Credit Wind River CLO Ltd 2014-1A ARR, | | | | | | |
| | ICE LIBOR USD 3 Month + 1.0500%, 6.3117%, 7/18/31 (144A)‡ | | 5,118,934 | | | 5,050,975 | |
| | TPI Re-Remic Trust 2022-FRR1 AK33, 0%, 7/25/46 (144A)◊ | | 994,000 | | | 988,957 | |
| | TPI Re-Remic Trust 2022-FRR1 AK34, 0%, 7/25/46 (144A)◊ | | 819,000 | | | 814,845 | |
| | TPI Re-Remic Trust 2022-FRR1 AK35, 0%, 8/25/46 (144A)◊ | | 1,109,000 | | | 1,096,756 | |
| | Tricolor Auto Securitization Trust 2022-1A A, 3.3000%, 2/18/25 (144A) | | 618,363 | | | 614,880 | |
| | Tricolor Auto Securitization Trust 2023-1A A, 6.4800%, 8/17/26 (144A) | | 2,100,892 | | | 2,094,472 | |
| | TTAN 2021-MHC A, ICE LIBOR USD 1 Month + 0.8500%, 6.0440%, 3/15/38 (144A)‡ | | 1,470,315 | | | 1,434,889 | |
| | UNIFY Auto Receivables Trust 2021-1A A4, 0.9800%, 7/15/26 (144A) | | 2,930,000 | | | 2,842,494 | |
| | United Wholesale Mortgage LLC 2021-INV4 A3, 2.5000%, 12/25/51 (144A)‡ | | 1,393,662 | | | 1,118,724 | |
| | Upstart Securitization Trust 2021-3 A, 0.8300%, 7/20/31 (144A) | | 292,976 | | | 290,462 | |
| | Upstart Securitization Trust 2021-4 A, 0.8400%, 9/20/31 (144A) | | 656,748 | | | 646,616 | |
| | Upstart Securitization Trust 2021-5 A, 1.3100%, 11/20/31 (144A) | | 249,472 | | | 244,234 | |
| | Upstart Securitization Trust 2022-1 A, 3.1200%, 3/20/32 (144A) | | 2,210,597 | | | 2,164,575 | |
| | Upstart Securitization Trust 2022-2 A, 4.3700%, 5/20/32 (144A) | | 1,602,378 | | | 1,584,404 | |
| | USASF Receivables LLC 2021-1A C, 2.2000%, 5/15/26 (144A) | | 3,000,000 | | | 2,936,065 | |
| | Vantage Data Centers LLC 2020-1A A2, 1.6450%, 9/15/45 (144A) | | 2,652,000 | | | 2,376,534 | |
| | VASA Trust 2021-VASA A, | | | | | | |
| | ICE LIBOR USD 1 Month + 0.9000%, 6.0930%, 7/15/39 (144A)‡ | | 1,260,000 | | | 1,106,895 | |
| | Verus Securitization Trust 2020-1, 2.6420%, 1/25/60 (144A)Ç | | 2,595,076 | | | 2,434,327 | |
| | VMC Finance LLC 2021-HT1 A, | | | | | | |
| | ICE LIBOR USD 1 Month + 1.6500%, 6.8066%, 1/18/37 (144A)‡ | | 1,233,677 | | | 1,194,187 | |
| | Westgate Resorts 2022-1A A, 1.7880%, 8/20/36 (144A) | | 535,012 | | | 503,032 | |
| | Woodward Capital Management 2021-3 A21, | | | | | | |
| | US 30 Day Average SOFR + 0.8000%, 5.0000%, 7/25/51 (144A)‡ | | 1,204,291 | | | 1,100,395 | |
| | Woodward Capital Management 2023-CES1 A1A, 6.5150%, 6/25/43 (144A)‡ | | 1,238,000 | | | 1,232,853 | |
Total Asset-Backed/Commercial Mortgage-Backed Securities (cost $343,639,266) | | 328,724,895 | |
Corporate Bonds– 15.4% | | | |
Banking – 4.9% | | | |
| | Bank of America Corp, SOFR + 1.9900%, 6.2040%, 11/10/28‡ | | 2,851,000 | | | 2,930,397 | |
| | BNP Paribas SA, ICE LIBOR USD 3 Month + 2.2350%, 4.7050%, 1/10/25 (144A)‡ | | 3,253,000 | | | 3,224,002 | |
| | BNP Paribas SA, USD SWAP SEMI 30/360 5YR + 5.1500%, 7.3750% (144A)‡,µ | | 5,148,000 | | | 4,991,363 | |
| | Capital One Financial Corp, SOFR + 2.6400%, 6.3120%, 6/8/29‡ | | 2,533,000 | | | 2,515,936 | |
| | Danske Bank A/S, | | | | | | |
| | US Treasury Yield Curve Rate 1 Year + 2.1000%, 6.4660%, 1/9/26 (144A)‡ | | 6,589,000 | | | 6,573,288 | |
| | JPMorgan Chase & Co, SOFR + 1.3200%, 4.0800%, 4/26/26‡ | | 6,763,000 | | | 6,572,044 | |
| | Morgan Stanley, SOFR + 1.5900%, 5.1640%, 4/20/29‡ | | 1,918,000 | | | 1,894,573 | |
| | Morgan Stanley Bank N.A., 4.7540%, 4/21/26 | | 2,138,000 | | | 2,106,512 | |
| | PNC Financial Services Group Inc/The, SOFR + 1.8410%, 5.5820%, 6/12/29‡ | | 2,638,000 | | | 2,625,586 | |
| | Truist Financial Corp, SOFR + 2.0500%, 6.0470%, 6/8/27‡ | | 2,484,000 | | | 2,485,031 | |
| | US Bancorp, SOFR + 2.0200%, 5.7750%, 6/12/29‡ | | 2,260,000 | | | 2,259,324 | |
| | Wells Fargo & Co, SOFR + 1.5100%, 3.5260%, 3/24/28‡ | | 3,116,000 | | | 2,908,317 | |
| | | 41,086,373 | |
Brokerage – 0.7% | | | |
| | Nasdaq Inc, 5.3500%, 6/28/28 | | 5,925,000 | | | 5,933,548 | |
Capital Goods – 0.4% | | | |
| | Regal Rexnord Corp, 6.0500%, 2/15/26 (144A) | | 1,890,000 | | | 1,892,399 | |
| | Regal Rexnord Corp, 6.0500%, 4/15/28 (144A) | | 1,518,000 | | | 1,506,930 | |
| | | 3,399,329 | |
Communications – 0.3% | | | |
| | Sprint Corp, 7.8750%, 9/15/23 | | 2,254,000 | | | 2,259,443 | |
Consumer Cyclical – 0.8% | | | |
| | LKQ Corp, 5.7500%, 6/15/28 (144A) | | 4,169,000 | | | 4,155,439 | |
| | Lowe's Cos Inc, 3.3500%, 4/1/27 | | 916,000 | | | 865,069 | |
| | Wyndham Destinations Inc, 5.6500%, 4/1/24 | | 1,763,000 | | | 1,742,802 | |
| | | 6,763,310 | |
| | |
See Notes to Schedule of Investments and Other Information and Notes to Financial Statements. |
| |
Janus Investment Fund | 11 |
Janus Henderson Short Duration Flexible Bond Fund
Schedule of Investments
June 30, 2023
| | | | | | | | |
Shares or
Principal Amounts | | | Value | |
Corporate Bonds– (continued) | | | |
Consumer Non-Cyclical – 2.5% | | | |
| | Albertsons Cos Inc / Safeway Inc / New Albertsons LP / Albertsons LLC, | | | | | | |
| | 6.5000%, 2/15/28 (144A) | | $1,938,000 | | | $1,941,217 | |
| | GE HealthCare Technologies Inc, 5.6000%, 11/15/25 | | 3,053,000 | | | 3,054,975 | |
| | HCA Inc, 5.3750%, 2/1/25 | | 1,308,000 | | | 1,296,532 | |
| | HCA Inc, 5.8750%, 2/15/26 | | 684,000 | | | 684,433 | |
| | HCA Inc, 5.2000%, 6/1/28 | | 1,262,000 | | | 1,251,737 | |
| | Illumina Inc, 5.8000%, 12/12/25 | | 2,951,000 | | | 2,958,385 | |
| | JBS USA LUX SA / JBS USA Food Co / JBS USA Finance Inc, | | | | | | |
| | 2.5000%, 1/15/27 (144A) | | 4,222,000 | | | 3,698,894 | |
| | Pfizer Investment Enterprises Pte Ltd, 4.4500%, 5/19/28 | | 4,280,000 | | | 4,206,774 | |
| | Providence Service Corp, 5.8750%, 11/15/25 (144A) | | 1,734,000 | | | 1,605,929 | |
| | | 20,698,876 | |
Electric – 0.8% | | | |
| | Georgia Power Co, 4.6500%, 5/16/28 | | 2,005,000 | | | 1,964,467 | |
| | National Grid PLC, 5.6020%, 6/12/28 | | 1,558,000 | | | 1,564,526 | |
| | NextEra Energy Operating Partners LP, 4.2500%, 7/15/24 (144A) | | 1,229,000 | | | 1,202,004 | |
| | Southern California Edison Co, 5.8500%, 11/1/27 | | 2,077,000 | | | 2,123,894 | |
| | | 6,854,891 | |
Energy – 0.2% | | | |
| | Targa Resources Partners LP / Targa Resources Partners Finance Corp, | | | | | | |
| | 6.5000%, 7/15/27 | | 1,643,000 | | | 1,631,100 | |
Finance Companies – 1.8% | | | |
| | Air Lease Corp, 0.8000%, 8/18/24 | | 3,072,000 | | | 2,893,564 | |
| | Avolon Holdings Funding Ltd, 4.2500%, 4/15/26 (144A) | | 2,351,000 | | | 2,190,228 | |
| | Avolon Holdings Funding Ltd, 2.1250%, 2/21/26 (144A) | | 3,354,000 | | | 2,980,931 | |
| | Castlelake Aviation Finance DAC, 5.0000%, 4/15/27 (144A) | | 2,999,000 | | | 2,655,332 | |
| | Owl Rock Capital Corp, 3.1250%, 4/13/27 | | 4,908,000 | | | 4,159,996 | |
| | | 14,880,051 | |
Government Sponsored – 0.6% | | | |
| | DAE Funding LLC, 1.5500%, 8/1/24 (144A) | | 1,642,000 | | | 1,558,632 | |
| | Electricite de France SA, 5.7000%, 5/23/28 (144A) | | 1,520,000 | | | 1,517,705 | |
| | NOVA Chemicals Corp, 4.8750%, 6/1/24 (144A) | | 1,707,000 | | | 1,667,705 | |
| | | 4,744,042 | |
Insurance – 1.9% | | | |
| | Centene Corp, 4.2500%, 12/15/27 | | 13,752,000 | | | 12,857,501 | |
| | Corebridge Financial Inc, 3.5000%, 4/4/25 | | 2,625,000 | | | 2,500,785 | |
| | | 15,358,286 | |
Real Estate Investment Trusts (REITs) – 0.5% | | | |
| | American Tower Trust I, 5.4900%, 3/15/28 (144A) | | 4,241,000 | | | 4,231,706 | |
Total Corporate Bonds (cost $132,545,751) | | 127,840,955 | |
Mortgage-Backed Securities– 5.2% | | | |
Fannie Mae: | | | |
| | 4.5000%, TBA, 30 Year Maturity | | 1,878,033 | | | 1,806,401 | |
Fannie Mae Pool: | | | |
| | 4.0000%, 10/1/47 | | 402,729 | | | 383,399 | |
| | 4.0000%, 1/1/48 | | 251,095 | | | 239,044 | |
| | 4.5000%, 6/1/48 | | 378,966 | | | 369,845 | |
| | 4.0000%, 7/1/48 | | 493,488 | | | 469,483 | |
| | 4.0000%, 8/1/48 | | 168,531 | | | 160,333 | |
| | 4.0000%, 9/1/48 | | 402,216 | | | 382,911 | |
| | 4.0000%, 11/1/48 | | 575,922 | | | 547,907 | |
| | 4.0000%, 12/1/48 | | 91,375 | | | 86,930 | |
| | 4.0000%, 6/1/49 | | 72,897 | | | 69,129 | |
| | 4.5000%, 6/1/49 | | 32,530 | | | 31,704 | |
| | 4.5000%, 8/1/49 | | 48,860 | | | 47,620 | |
| | 4.0000%, 11/1/49 | | 1,190,531 | | | 1,132,619 | |
| | 4.5000%, 1/1/50 | | 960,796 | | | 937,672 | |
| | 4.5000%, 1/1/50 | | 64,071 | | | 62,446 | |
| | |
See Notes to Schedule of Investments and Other Information and Notes to Financial Statements. |
| |
12 | JUNE 30, 2023 |
Janus Henderson Short Duration Flexible Bond Fund
Schedule of Investments
June 30, 2023
| | | | | | | | |
Shares or
Principal Amounts | | | Value | |
Mortgage-Backed Securities– (continued) | | | |
Fannie Mae Pool– (continued) | | | |
| | 4.0000%, 9/1/50 | | $1,830,877 | | | $1,736,238 | |
| | 3.5000%, 2/1/51 | | 607,421 | | | 558,693 | |
| | 4.0000%, 3/1/51 | | 4,881,983 | | | 4,629,631 | |
| | 4.0000%, 3/1/51 | | 94,324 | | | 89,448 | |
| | 4.0000%, 3/1/51 | | 46,869 | | | 44,589 | |
| | 4.0000%, 10/1/51 | | 699,761 | | | 663,590 | |
| | 3.0000%, 3/1/52 | | 1,008,783 | | | 895,358 | |
| | 3.0000%, 4/1/52 | | 862,288 | | | 767,215 | |
| | 3.0000%, 4/1/52 | | 736,717 | | | 653,734 | |
| | 3.5000%, 4/1/52 | | 762,489 | | | 698,961 | |
| | 3.5000%, 4/1/52 | | 417,376 | | | 382,275 | |
| | 3.5000%, 4/1/52 | | 243,332 | | �� | 223,058 | |
| | 3.5000%, 4/1/52 | | 150,774 | | | 138,112 | |
| | 3.5000%, 4/1/52 | | 115,254 | | | 105,562 | |
| | 4.0000%, 4/1/52 | | 547,479 | | | 520,068 | |
| | 4.5000%, 4/1/52 | | 133,113 | | | 127,964 | |
| | 4.5000%, 4/1/52 | | 112,578 | | | 108,223 | |
| | 4.5000%, 4/1/52 | | 64,551 | | | 62,054 | |
| | 4.5000%, 4/1/52 | | 58,605 | | | 56,338 | |
| | 4.5000%, 4/1/52 | | 51,246 | | | 49,264 | |
| | 4.5000%, 4/1/52 | | 32,999 | | | 31,717 | |
| | 4.5000%, 5/1/52 | | 178,607 | | | 171,698 | |
| | 4.0000%, 6/1/52 | | 432,978 | | | 406,749 | |
| | 4.0000%, 6/1/52 | | 115,353 | | | 108,365 | |
| | 3.5000%, 7/1/52 | | 2,845,995 | | | 2,617,898 | |
| | 4.0000%, 7/1/52 | | 206,616 | | | 194,099 | |
| | 4.5000%, 8/1/52 | | 1,925,375 | | | 1,852,884 | |
| | 5.0000%, 10/1/52 | | 568,043 | | | 561,181 | |
| | 5.0000%, 10/1/52 | | 249,750 | | | 246,734 | |
| | 5.5000%, 10/1/52 | | 4,754,135 | | | 4,792,497 | |
| | 4.5000%, 11/1/52 | | 1,903,264 | | | 1,848,955 | |
| | 5.0000%, 1/1/53 | | 902,667 | | | 887,272 | |
| | | 31,151,466 | |
Freddie Mac Pool: | | | |
| | 4.0000%, 4/1/48 | | 32,275 | | | 30,705 | |
| | 4.0000%, 11/1/48 | | 51,885 | | | 49,361 | |
| | 4.5000%, 6/1/49 | | 36,232 | | | 35,313 | |
| | 4.5000%, 7/1/49 | | 323,230 | | | 315,034 | |
| | 4.5000%, 7/1/49 | | 45,890 | | | 44,726 | |
| | 4.5000%, 8/1/49 | | 277,740 | | | 270,698 | |
| | 4.5000%, 1/1/50 | | 183,866 | | | 179,204 | |
| | 4.5000%, 1/1/50 | | 51,318 | | | 50,017 | |
| | 4.0000%, 3/1/50 | | 617,255 | | | 587,222 | |
| | 4.5000%, 9/1/50 | | 1,798,185 | | | 1,754,864 | |
| | 4.0000%, 10/1/50 | | 169,250 | | | 160,501 | |
| | 4.5000%, 3/1/52 | | 27,751 | | | 26,677 | |
| | 3.5000%, 4/1/52 | | 107,799 | | | 98,745 | |
| | 3.5000%, 4/1/52 | | 94,518 | | | 86,568 | |
| | 3.5000%, 7/1/52 | | 1,107,432 | | | 1,018,665 | |
| | 4.0000%, 7/1/52 | | 453,250 | | | 425,783 | |
| | 4.0000%, 8/1/52 | | 508,286 | | | 478,172 | |
| | 4.0000%, 9/1/52 | | 353,331 | | | 332,397 | |
| | 4.5000%, 10/1/52 | | 1,138,505 | | | 1,106,012 | |
| | 5.0000%, 10/1/52 | | 1,718,022 | | | 1,697,265 | |
| | 5.0000%, 10/1/52 | | 1,131,393 | | | 1,117,723 | |
| | 5.0000%, 10/1/52 | | 34,339 | | | 33,924 | |
| | | 9,899,576 | |
Total Mortgage-Backed Securities (cost $44,052,801) | | 42,857,443 | |
| | |
See Notes to Schedule of Investments and Other Information and Notes to Financial Statements. |
| |
Janus Investment Fund | 13 |
Janus Henderson Short Duration Flexible Bond Fund
Schedule of Investments
June 30, 2023
| | | | | | | | |
Shares or
Principal Amounts | | | Value | |
United States Treasury Notes/Bonds– 36.0% | | | |
| | 0.1250%, 8/31/23 | | $20,363,000 | | | $20,196,105 | |
| | 0.3750%, 10/31/23 | | 44,134,000 | | | 43,440,959 | |
| | 0.8750%, 1/31/24 | | 12,392,000 | | | 12,072,035 | |
| | 3.0000%, 7/31/24 | | 31,561,000 | | | 30,760,879 | |
| | 4.2500%, 9/30/24 | | 19,165,900 | | | 18,914,348 | |
| | 4.2500%, 12/31/24 | | 24,496,000 | | | 24,153,439 | |
| | 1.5000%, 2/15/25 | | 361,000 | | | 340,722 | |
| | 4.6250%, 2/28/25 | | 1,583,000 | | | 1,570,695 | |
| | 4.6250%, 6/30/25 | | 60,346,000 | | | 60,070,200 | |
| | 3.1250%, 8/15/25 | | 12,236,000 | | | 11,817,777 | |
| | 4.1250%, 6/15/26 | | 30,336,000 | | | 30,030,270 | |
| | 3.5000%, 4/30/28 | | 28,306,200 | | | 27,505,665 | |
| | 3.6250%, 5/31/28 | | 8,474,500 | | | 8,289,120 | |
| | 4.0000%, 6/30/28 | | 8,990,000 | | | 8,940,836 | |
| | 3.7500%, 6/30/30 | | 1,225,000 | | | 1,208,730 | |
Total United States Treasury Notes/Bonds (cost $303,089,069) | | 299,311,780 | |
Investment Companies– 3.3% | | | |
Money Markets – 3.3% | | | |
| | Janus Henderson Cash Liquidity Fund LLC, 5.1900%ºº,£((cost $27,396,005) | | 27,391,190 | | | 27,396,668 | |
Total Investments (total cost $850,722,892) – 99.4% | | 826,131,741 | |
Cash, Receivables and Other Assets, net of Liabilities – 0.6% | | 5,040,797 | |
Net Assets – 100% | | $831,172,538 | |
| | | | | | |
Summary of Investments by Country - (Long Positions) (unaudited) |
| |
| | | | | % of | |
| | | | | Investment | |
Country | | Value | | Securities | |
United States | | $798,449,609 | | 96.6 | % |
France | | 9,733,070 | | 1.2 | |
Denmark | | 6,573,288 | | 0.8 | |
Ireland | | 5,171,159 | | 0.6 | |
Canada | | 1,667,705 | | 0.2 | |
United Kingdom | | 1,564,526 | | 0.2 | |
United Arab Emirates | | 1,558,632 | | 0.2 | |
Japan | | 1,413,752 | | 0.2 | |
| | | | | | |
| | | | | | |
Total | | $826,131,741 | | 100.0 | % |
| | |
See Notes to Schedule of Investments and Other Information and Notes to Financial Statements. |
| |
14 | JUNE 30, 2023 |
Janus Henderson Short Duration Flexible Bond Fund
Schedule of Investments
June 30, 2023
Schedules of Affiliated Investments – (% of Net Assets)
| | | | | | | | | | | |
| | Dividend Income | Realized Gain/(Loss) | Change in Unrealized Appreciation/ Depreciation | Value at 6/30/23 |
Investment Companies - 3.3% |
Money Markets - 3.3% | |
| | Janus Henderson Cash Liquidity Fund LLC, 5.1900%ºº | $ | 1,183,429 | $ | 448 | $ | (899) | $ | 27,396,668 |
Investments Purchased with Cash Collateral from Securities Lending - N/A |
Investment Companies - N/A | |
| | Janus Henderson Cash Collateral Fund LLC, 4.9971%ºº | | 22,281∆ | | - | | - | | - |
Total Affiliated Investments - 3.3% | $ | 1,205,710 | $ | 448 | $ | (899) | $ | 27,396,668 |
| | | | | | | | | | | |
| | Value at 6/30/22 | Purchases | Sales Proceeds | Value at 6/30/23 |
Investment Companies - 3.3% |
Money Markets - 3.3% | |
| | Janus Henderson Cash Liquidity Fund LLC, 5.1900%ºº | | 40,688,230 | | 442,953,979 | | (456,245,090) | | 27,396,668 |
Investments Purchased with Cash Collateral from Securities Lending - N/A |
Investment Companies - N/A | |
| | Janus Henderson Cash Collateral Fund LLC, 4.9971%ºº | | 1,022,250 | | 116,133,240 | | (117,155,490) | | - |
| | |
See Notes to Schedule of Investments and Other Information and Notes to Financial Statements. |
| |
Janus Investment Fund | 15 |
Janus Henderson Short Duration Flexible Bond Fund
Schedule of Investments
June 30, 2023
Schedule of Futures
| | | | | | | | | | | | | | | |
Description | | Number of Contracts | | Expiration Date | | Notional Amount | | Value and Unrealized Appreciation/(Depreciation) | | |
Futures Long: | | | | | | | | | | |
2 Year US Treasury Note | | 2,381 | | 10/4/23 | $ | 484,161,469 | $ | (6,102,274) | |
Ultra 10-Year Treasury Note | | 37 | | 9/29/23 | | 4,382,188 | | (52,814) | |
Total - Futures Long | | | | | | | | (6,155,088) | |
Futures Short: | | | | | | | | | | |
10 Year US Treasury Note | | 104 | | 9/29/23 | | (11,675,625) | | 221,813 | |
5 Year US Treasury Note | | 555 | | 10/4/23 | | (59,437,031) | | 1,073,687 | |
US Treasury Long Bond | | 150 | | 9/29/23 | | (19,035,938) | | 43,359 | |
Total - Futures Short | | | | | | | | 1,338,859 | |
Total | | | | | | | $ | (4,816,229) | | |
The following table, grouped by derivative type, provides information about the fair value and location of derivatives within the Statement of Assets and Liabilities as of June 30, 2023.
| | | | | | |
Fair Value of Derivative Instruments (not accounted for as hedging instruments) as of June 30, 2023 |
| | | | | |
| | | | | Interest Rate
Contracts |
Asset Derivatives: | | | |
*Futures contracts | | | $ 1,338,859 |
| | | | |
Liability Derivatives: | | | |
*Futures contracts | | | $ 6,155,088 |
| | | | |
*The fair value presented includes net cumulative unrealized appreciation (depreciation) on futures contracts and centrally cleared swaps. In the Statement of Assets and Liabilities, only current day's variation margin is reported in receivables or payables and the net cumulative unrealized appreciation (depreciation) is included in total distributable earnings (loss). |
| | |
See Notes to Schedule of Investments and Other Information and Notes to Financial Statements. |
| |
16 | JUNE 30, 2023 |
Janus Henderson Short Duration Flexible Bond Fund
Schedule of Investments
June 30, 2023
The following tables provide information about the effect of derivatives and hedging activities on the Fund’s Statement of Operations for the year ended June 30, 2023.
| | | | | | | | | |
The effect of Derivative Instruments (not accounted for as hedging instruments) on the Statement of Operations for the year ended June 30, 2023 |
| | | | | | | | |
Amount of Realized Gain/(Loss) Recognized on Derivatives |
Derivative | | Credit
Contracts | | Interest Rate
Contracts | | Total |
Futures contracts | | $ - | | $ (7,011,948) | | $(7,011,948) |
Swap contracts | | (454,415) | | - | | $ (454,415) |
| | | | | | | | | |
Total | | $(454,415) | | $ (7,011,948) | | $(7,466,363) |
| | | | | | | | | |
| | | | | | | | | |
Amount of Change in Unrealized Appreciation/Depreciation Recognized on Derivatives |
Derivative | | | | Interest Rate
Contracts | | Total |
Futures contracts | | | | $ (3,418,363) | | $(3,418,363) |
| | | | | | | | | |
Please see the "Net Realized Gain/(Loss) on Investments" and "Change in Unrealized Net Appreciation/Depreciation" sections of the Fund’s Statement of Operations.
| | |
Average Ending Monthly Value of Derivative Instruments During the Year Ended June 30, 2023 |
| |
| |
Credit default swaps: | |
Average notional amount - buy protection | $ 1,298,423 |
Futures contracts: | |
Average notional amount of contracts - long | 316,424,796 |
Average notional amount of contracts - short | 88,294,664 |
| | |
| |
| |
| |
| | |
See Notes to Schedule of Investments and Other Information and Notes to Financial Statements. |
| |
Janus Investment Fund | 17 |
Janus Henderson Short Duration Flexible Bond Fund
Notes to Schedule of Investments and Other Information
| | |
Bloomberg 1-3 Year U.S. Government/Credit Index | Bloomberg 1-3 Year U.S. Government/Credit Index measures Treasuries, government-related issues and corporates with maturity between 1-3 years. |
| | |
ICE | Intercontinental Exchange |
LIBOR | London Interbank Offered Rate |
LLC | Limited Liability Company |
LP | Limited Partnership |
PLC | Public Limited Company |
SOFR | Secured Overnight Financing Rate |
TBA | (To Be Announced) Securities are purchased/sold on a forward commitment basis with an approximate principal amount and no defined maturity date. The actual principal and maturity date will be determined upon settlement when specific mortgage pools are assigned. |
| | |
144A | Securities sold under Rule 144A of the Securities Act of 1933, as amended, are subject to legal and/or contractual restrictions on resale and may not be publicly sold without registration under the 1933 Act. Unless otherwise noted, these securities have been determined to be liquid under guidelines established by the Board of Trustees. The total value of 144A securities as of the year ended June 30, 2023 is $368,945,460, which represents 44.4% of net assets. |
| | |
‡ | Variable or floating rate security. Rate shown is the current rate as of June 30, 2023. Certain variable rate securities are not based on a published reference rate and spread; they are determined by the issuer or agent and current market conditions. Reference rate is as of reset date and may vary by security, which may not indicate a reference rate and/or spread in their description. |
| | |
ºº | Rate shown is the 7-day yield as of June 30, 2023. |
| | |
µ | Perpetual security. Perpetual securities have no stated maturity date, but they may be called/redeemed by the issuer. The date indicated, if any, represents the next call date. |
| | |
Ç | Step bond. The coupon rate will increase or decrease periodically based upon a predetermined schedule. The rate shown reflects the current rate. |
| | |
£ | The Fund may invest in certain securities that are considered affiliated companies. As defined by the Investment Company Act of 1940, as amended, an affiliated company is one in which the Fund owns 5% or more of the outstanding voting securities, or a company which is under common ownership or control. |
| | |
∆ | Net of income paid to the securities lending agent and rebates paid to the borrowing counterparties. |
Janus Henderson Short Duration Flexible Bond Fund
Notes to Schedule of Investments and Other Information
| | | | | | | | | | | | | | |
The following is a summary of the inputs that were used to value the Fund’s investments in securities and other financial instruments as of June 30, 2023. See Notes to Financial Statements for more information. |
| |
Valuation Inputs Summary |
| | | | | | | |
| | | | | Level 2 - | | Level 3 - |
| | | Level 1 - | | Other Significant | | Significant |
| | | Quoted Prices | | Observable Inputs | | Unobservable Inputs |
| | | | | | | |
Assets | | | | | | |
Investments In Securities: | | | | | | |
Asset-Backed/Commercial Mortgage-Backed Securities | $ | - | $ | 328,724,895 | $ | - |
Corporate Bonds | | - | | 127,840,955 | | - |
Mortgage-Backed Securities | | - | | 42,857,443 | | - |
United States Treasury Notes/Bonds | | - | | 299,311,780 | | - |
Investment Companies | | - | | 27,396,668 | | - |
Total Investments in Securities | $ | - | $ | 826,131,741 | $ | - |
Other Financial Instruments(a): | | | | | | |
Futures Contracts | | 1,338,859 | | - | | - |
Total Assets | $ | 1,338,859 | $ | 826,131,741 | $ | - |
Liabilities | | | | | | |
Other Financial Instruments(a): | | | | | | |
Futures Contracts | $ | 6,155,088 | $ | - | $ | - |
| | | | | | | |
(a) | Other financial instruments may include forward foreign currency exchange contracts, futures, written options, written swaptions, and swap contracts. Forward foreign currency exchange contracts, futures contracts, and swap contracts are reported at their unrealized appreciation/(depreciation) at measurement date, which represents the change in the contract's value from trade date. Written options and written swaptions are reported at their market value at measurement date. |
Janus Henderson Short Duration Flexible Bond Fund
Statement of Assets and Liabilities
June 30, 2023
| |
See footnotes at the end of the Statement. |
| | | | | | | |
| | | | | | |
Assets: | | | | |
| Unaffiliated investments, at value (cost $823,326,887) | | $ | 798,735,073 | |
| Affiliated investments, at value (cost $27,396,005) | | | 27,396,668 | |
| Deposits with brokers for futures | | | 3,289,000 | |
| Variation margin receivable on futures contracts | | | 10,958 | |
| Trustees' deferred compensation | | | 21,025 | |
| Receivables: | | | | |
| | Investments sold | | | 10,609,530 | |
| | Interest | | | 3,762,854 | |
| | Fund shares sold | | | 1,767,354 | |
| | Dividends from affiliates | | | 186,692 | |
| Other assets | | | 4,183 | |
Total Assets | | | 845,783,337 | |
Liabilities: | | | | |
| Due to custodian | | | 710,641 | |
| Variation margin payable on futures contracts | | | 201,531 | |
| Payables: | | | — | |
| | Investments purchased | | | 10,148,739 | |
| | TBA investments purchased | | | 1,807,497 | |
| | Fund shares repurchased | | | 1,040,606 | |
| | Advisory fees | | | 183,163 | |
| | Transfer agent fees and expenses | | | 135,761 | |
| | Dividends | | | 96,846 | |
| | Professional fees | | | 61,676 | |
| | 12b-1 Distribution and shareholder servicing fees | | | 21,654 | |
| | Trustees' deferred compensation fees | | | 21,025 | |
| | Trustees' fees and expenses | | | 5,425 | |
| | Custodian fees | | | 2,374 | |
| | Affiliated fund administration fees payable | | | 1,847 | |
| | Accrued expenses and other payables | | | 172,014 | |
Total Liabilities | | | 14,610,799 | |
Net Assets | | $ | 831,172,538 | |
| | |
See Notes to Financial Statements. |
| |
20 | JUNE 30, 2023 |
Janus Henderson Short Duration Flexible Bond Fund
Statement of Assets and Liabilities
June 30, 2023
| | | | | | | |
| | | | | | |
| | | | | | | |
Net Assets Consist of: | | | | |
| Capital (par value and paid-in surplus) | | $ | 938,354,064 | |
| Total distributable earnings (loss) | | | (107,181,526) | |
Total Net Assets | | $ | 831,172,538 | |
Net Assets - Class A Shares | | $ | 45,842,000 | |
| Shares Outstanding, $0.01 Par Value (unlimited shares authorized) | | | 16,321,787 | |
Net Asset Value Per Share(1) | | $ | 2.81 | |
Maximum Offering Price Per Share(2) | | $ | 2.88 | |
Net Assets - Class C Shares | | $ | 12,886,115 | |
| Shares Outstanding, $0.01 Par Value (unlimited shares authorized) | | | 4,596,946 | |
Net Asset Value Per Share(1) | | $ | 2.80 | |
Net Assets - Class D Shares | | $ | 146,434,584 | |
| Shares Outstanding, $0.01 Par Value (unlimited shares authorized) | | | 52,098,658 | |
Net Asset Value Per Share | | $ | 2.81 | |
Net Assets - Class I Shares | | $ | 368,402,427 | |
| Shares Outstanding, $0.01 Par Value (unlimited shares authorized) | | | 131,239,857 | |
Net Asset Value Per Share | | $ | 2.81 | |
Net Assets - Class N Shares | | $ | 25,912,178 | |
| Shares Outstanding, $0.01 Par Value (unlimited shares authorized) | | | 9,283,654 | |
Net Asset Value Per Share | | $ | 2.79 | |
Net Assets - Class S Shares | | $ | 381,266 | |
| Shares Outstanding, $0.01 Par Value (unlimited shares authorized) | | | 135,932 | |
Net Asset Value Per Share | | $ | 2.80 | |
Net Assets - Class T Shares | | $ | 231,313,968 | |
| Shares Outstanding, $0.01 Par Value (unlimited shares authorized) | | | 82,276,057 | |
Net Asset Value Per Share | | $ | 2.81 | |
| |
(1) Redemption price per share may be reduced for any applicable contingent deferred sales charge. (2) Maximum offering price is computed at 100/97.5 of net asset value. |
| | |
See Notes to Financial Statements. |
| |
Janus Investment Fund | 21 |
Janus Henderson Short Duration Flexible Bond Fund
Statement of Operations
For the year ended June 30, 2023
| | | | | | |
| | | | | |
Investment Income: | | | |
| Interest | $ | 30,114,537 | |
| Dividends from affiliates | | 1,183,429 | |
| Affiliated securities lending income, net | | 22,281 | |
| Unaffiliated securities lending income, net | | 6,956 | |
| Other income | | 74,734 | |
Total Investment Income | | 31,401,937 | |
Expenses: | | | |
| Advisory fees | | 4,094,628 | |
| 12b-1 Distribution and shareholder servicing fees: | | | |
| | Class A Shares | | 140,393 | |
| | Class C Shares | | 126,567 | |
| | Class S Shares | | 954 | |
| Transfer agent administrative fees and expenses: | | | |
| | Class D Shares | | 187,834 | |
| | Class S Shares | | 956 | |
| | Class T Shares | | 665,252 | |
| Transfer agent networking and omnibus fees: | | | |
| | Class A Shares | | 26,359 | |
| | Class C Shares | | 10,100 | |
| | Class I Shares | | 552,675 | |
| Other transfer agent fees and expenses: | | | |
| | Class A Shares | | 4,068 | |
| | Class C Shares | | 767 | |
| | Class D Shares | | 29,733 | |
| | Class I Shares | | 23,521 | |
| | Class N Shares | | 1,285 | |
| | Class S Shares | | 32 | |
| | Class T Shares | | 4,321 | |
| Shareholder reports expense | | 159,991 | |
| Registration fees | | 144,216 | |
| Professional fees | | 70,015 | |
| Affiliated fund administration fees | | 29,425 | |
| Trustees’ fees and expenses | | 26,236 | |
| Custodian fees | | 12,867 | |
| Other expenses | | 299,961 | |
Total Expenses | | 6,612,156 | |
Less: Excess Expense Reimbursement and Waivers | | (1,530,941) | |
Net Expenses | | 5,081,215 | |
Net Investment Income/(Loss) | | 26,320,722 | |
| | | | | |
| | |
See Notes to Financial Statements. |
| |
22 | JUNE 30, 2023 |
Janus Henderson Short Duration Flexible Bond Fund
Statement of Operations
For the year ended June 30, 2023
| | | | | | |
| | | | | |
Net Realized Gain/(Loss) on Investments: | | | |
| Investments | $ | (29,388,313) | |
| Investments in affiliates | | 448 | |
| Futures contracts | | (7,011,948) | |
| Swap contracts | | (454,415) | |
Total Net Realized Gain/(Loss) on Investments | | (36,854,228) | |
Change in Unrealized Net Appreciation/Depreciation: | | | |
| Investments and Trustees’ deferred compensation | | 27,096,665 | |
| Investments in affiliates | | (899) | |
| Futures contracts | | (3,418,363) | |
Total Change in Unrealized Net Appreciation/Depreciation | | 23,677,403 | |
Net Increase/(Decrease) in Net Assets Resulting from Operations | $ | 13,143,897 | |
| | | | | |
| | |
See Notes to Financial Statements. |
| |
Janus Investment Fund | 23 |
Janus Henderson Short Duration Flexible Bond Fund
Statements of Changes in Net Assets
| | | | | | | | | |
| | | | | | | | |
| | | Year ended
June 30, 2023 | | Year ended
June 30, 2022 | |
| | | | | | | | | |
Operations: | | | | | | |
| Net investment income/(loss) | $ | 26,320,722 | | $ | 13,833,586 | |
| Net realized gain/(loss) on investments | | (36,854,228) | | | (23,041,341) | |
| Change in unrealized net appreciation/depreciation | | 23,677,403 | | | (62,894,052) | |
Net Increase/(Decrease) in Net Assets Resulting from Operations | | 13,143,897 | | | (72,101,807) | |
Dividends and Distributions to Shareholders: | | | | | | |
| | Class A Shares | | (1,529,388) | | | (939,007) | |
| | Class C Shares | | (312,077) | | | (110,941) | |
| | Class D Shares | | (4,662,092) | | | (2,783,229) | |
| | Class I Shares | | (12,057,650) | | | (7,234,654) | |
| | Class N Shares | | (824,681) | | | (464,174) | |
| | Class S Shares | | (9,940) | | | (6,770) | |
| | Class T Shares | | (7,453,470) | | | (4,613,466) | |
Net Decrease from Dividends and Distributions to Shareholders | | (26,849,298) | | | (16,152,241) | |
Capital Share Transactions: | | | | | | |
| | Class A Shares | | (19,681,125) | | | (5,724,778) | |
| | Class C Shares | | (3,910,070) | | | (5,185,205) | |
| | Class D Shares | | (23,774,024) | | | (20,358,158) | |
| | Class I Shares | | (68,623,946) | | | 59,461,565 | |
| | Class N Shares | | (18,450,692) | | | 31,568,304 | |
| | Class S Shares | | 15,663 | | | (240,057) | |
| | Class T Shares | | (59,379,905) | | | (83,079,366) | |
Net Increase/(Decrease) from Capital Share Transactions | | (193,804,099) | | | (23,557,695) | |
Net Increase/(Decrease) in Net Assets | | (207,509,500) | | | (111,811,743) | |
Net Assets: | | | | | | |
| Beginning of period | | 1,038,682,038 | | | 1,150,493,781 | |
| End of period | $ | 831,172,538 | | $ | 1,038,682,038 | |
| | | | | | | | |
| | |
See Notes to Financial Statements. |
| |
24 | JUNE 30, 2023 |
Janus Henderson Short Duration Flexible Bond Fund
Financial Highlights
| | | | | | | | | | | | | | | | | | | |
Class A Shares | | | | | | | | | | | | | | | |
For a share outstanding during the year ended June 30 | | 2023 | | | 2022 | | | 2021 | | | 2020 | | | 2019 | |
| Net Asset Value, Beginning of Period | | $2.85 | | | $3.08 | | | $3.06 | | | $3.02 | | | $2.98 | |
| Income/(Loss) from Investment Operations: | | | | | | | | | | | | | | | |
| | Net investment income/(loss)(1) | | 0.08 | | | 0.03 | | | 0.05 | | | 0.06 | | | 0.07 | |
| | Net realized and unrealized gain/(loss) | | (0.04) | | | (0.22) | | | 0.02 | | | 0.05 | | | 0.04 | |
| Total from Investment Operations | | 0.04 | | | (0.19) | | | 0.07 | | | 0.11 | | | 0.11 | |
| Less Dividends and Distributions: | | | | | | | | | | | | | | | |
| | Dividends (from net investment income) | | (0.08) | | | (0.04) | | | (0.05) | | | (0.07) | | | (0.07) | |
| Total Dividends and Distributions | | (0.08) | | | (0.04) | | | (0.05) | | | (0.07) | | | (0.07) | |
| Net Asset Value, End of Period | | $2.81 | | | $2.85 | | | $3.08 | | | $3.06 | | | $3.02 | |
| Total Return* | | 1.39% | | | (6.28)% | | | 2.30% | | | 3.57% | | | 3.64% | |
| Net Assets, End of Period (in thousands) | | $45,842 | | | $66,254 | | | $77,673 | | | $65,066 | | | $57,815 | |
| Average Net Assets for the Period (in thousands) | | $55,949 | | | $74,703 | | | $76,534 | | | $56,628 | | | $57,158 | |
| Ratios to Average Net Assets**: | | | | | | | | | | | | | | | |
| | Ratio of Gross Expenses | | 0.83% | | | 0.78% | | | 0.78% | | | 0.79% | | | 0.85% | |
| | Ratio of Net Expenses (After Waivers and Expense Offsets) | | 0.70% | | | 0.71% | | | 0.74% | | | 0.74% | | | 0.77% | |
| | Ratio of Net Investment Income/(Loss) | | 2.68% | | | 1.06% | | | 1.51% | | | 2.10% | | | 2.25% | |
| Portfolio Turnover Rate | | 118%(2) | | | 94%(2) | | | 112%(2) | | | 121% | | | 79% | |
| | | | | | | | | | | | | | | | | | | |
| |
* Total return includes adjustments in accordance with generally accepted accounting principles required at the year or period end and are not annualized for periods of less than one full year. ** Annualized for periods of less than one full year. (1) Per share amounts are calculated based on average shares outstanding during the year or period. (2) Portfolio Turnover Rate excludes TBA (to be announced) purchase and sales commitments. |
| | |
See Notes to Financial Statements. |
| |
Janus Investment Fund | 25 |
Janus Henderson Short Duration Flexible Bond Fund
Financial Highlights
| | | | | | | | | | | | | | | | | | | |
Class C Shares | | | | | | | | | | | | | | | |
For a share outstanding during the year ended June 30 | | 2023 | | | 2022 | | | 2021 | | | 2020 | | | 2019 | |
| Net Asset Value, Beginning of Period | | $2.84 | | | $3.08 | | | $3.05 | | | $3.01 | | | $2.97 | |
| Income/(Loss) from Investment Operations: | | | | | | | | | | | | | | | |
| | Net investment income/(loss)(1) | | 0.06 | | | 0.01 | | | 0.03 | | | 0.04 | | | 0.05 | |
| | Net realized and unrealized gain/(loss) | | (0.04) | | | (0.23) | | | 0.03 | | | 0.04 | | | 0.04 | |
| Total from Investment Operations | | 0.02 | | | (0.22) | | | 0.06 | | | 0.08 | | | 0.09 | |
| Less Dividends and Distributions: | | | | | | | | | | | | | | | |
| | Dividends (from net investment income) | | (0.06) | | | (0.02) | | | (0.03) | | | (0.04) | | | (0.05) | |
| Total Dividends and Distributions | | (0.06) | | | (0.02) | | | (0.03) | | | (0.04) | | | (0.05) | |
| Net Asset Value, End of Period | | $2.80 | | | $2.84 | | | $3.08 | | | $3.05 | | | $3.01 | |
| Total Return* | | 0.75% | | | (7.27)% | | | 2.04% | | | 2.84% | | | 2.90% | |
| Net Assets, End of Period (in thousands) | | $12,886 | | | $16,947 | | | $23,656 | | | $27,296 | | | $29,434 | |
| Average Net Assets for the Period (in thousands) | | $14,596 | | | $20,412 | | | $28,272 | | | $26,387 | | | $30,443 | |
| Ratios to Average Net Assets**: | | | | | | | | | | | | | | | |
| | Ratio of Gross Expenses | | 1.48% | | | 1.51% | | | 1.37% | | | 1.53% | | | 1.58% | |
| | Ratio of Net Expenses (After Waivers and Expense Offsets) | | 1.33% | | | 1.42% | | | 1.32% | | | 1.47% | | | 1.49% | |
| | Ratio of Net Investment Income/(Loss) | | 2.08% | | | 0.34% | | | 0.93% | | | 1.37% | | | 1.52% | |
| Portfolio Turnover Rate | | 118%(2) | | | 94%(2) | | | 112%(2) | | | 121% | | | 79% | |
| | | | | | | | | | | | | | | | | | | |
| |
* Total return includes adjustments in accordance with generally accepted accounting principles required at the year or period end and are not annualized for periods of less than one full year. ** Annualized for periods of less than one full year. (1) Per share amounts are calculated based on average shares outstanding during the year or period. (2) Portfolio Turnover Rate excludes TBA (to be announced) purchase and sales commitments. |
| | |
See Notes to Financial Statements. |
| |
26 | JUNE 30, 2023 |
Janus Henderson Short Duration Flexible Bond Fund
Financial Highlights
| | | | | | | | | | | | | | | | | | | |
Class D Shares | | | | | | | | | | | | | | | |
For a share outstanding during the year ended June 30 | | 2023 | | | 2022 | | | 2021 | | | 2020 | | | 2019 | |
| Net Asset Value, Beginning of Period | | $2.85 | | | $3.08 | | | $3.06 | | | $3.02 | | | $2.98 | |
| Income/(Loss) from Investment Operations: | | | | | | | | | | | | | | | |
| | Net investment income/(loss)(1) | | 0.08 | | | 0.04 | | | 0.05 | | | 0.07 | | | 0.07 | |
| | Net realized and unrealized gain/(loss) | | (0.04) | | | (0.23) | | | 0.03 | | | 0.04 | | | 0.04 | |
| Total from Investment Operations | | 0.04 | | | (0.19) | | | 0.08 | | | 0.11 | | | 0.11 | |
| Less Dividends and Distributions: | | | | | | | | | | | | | | | |
| | Dividends (from net investment income) | | (0.08) | | | (0.04) | | | (0.06) | | | (0.07) | | | (0.07) | |
| Total Dividends and Distributions | | (0.08) | | | (0.04) | | | (0.06) | | | (0.07) | | | (0.07) | |
| Net Asset Value, End of Period | | $2.81 | | | $2.85 | | | $3.08 | | | $3.06 | | | $3.02 | |
| Total Return* | | 1.56% | | | (6.12)% | | | 2.47% | | | 3.74% | | | 3.81% | |
| Net Assets, End of Period (in thousands) | | $146,435 | | | $172,562 | | | $207,596 | | | $191,666 | | | $178,483 | |
| Average Net Assets for the Period (in thousands) | | $158,964 | | | $195,168 | | | $207,465 | | | $182,265 | | | $172,435 | |
| Ratios to Average Net Assets**: | | | | | | | | | | | | | | | |
| | Ratio of Gross Expenses | | 0.67% | | | 0.63% | | | 0.63% | | | 0.64% | | | 0.70% | |
| | Ratio of Net Expenses (After Waivers and Expense Offsets) | | 0.53% | | | 0.54% | | | 0.57% | | | 0.58% | | | 0.60% | |
| | Ratio of Net Investment Income/(Loss) | | 2.88% | | | 1.23% | | | 1.68% | | | 2.25% | | | 2.40% | |
| Portfolio Turnover Rate | | 118%(2) | | | 94%(2) | | | 112%(2) | | | 121% | | | 79% | |
| | | | | | | | | | | | | | | | | | | |
| |
* Total return includes adjustments in accordance with generally accepted accounting principles required at the year or period end and are not annualized for periods of less than one full year. ** Annualized for periods of less than one full year. (1) Per share amounts are calculated based on average shares outstanding during the year or period. (2) Portfolio Turnover Rate excludes TBA (to be announced) purchase and sales commitments. |
| | |
See Notes to Financial Statements. |
| |
Janus Investment Fund | 27 |
Janus Henderson Short Duration Flexible Bond Fund
Financial Highlights
| | | | | | | | | | | | | | | | | | | |
Class I Shares | | | | | | | | | | | | | | | |
For a share outstanding during the year ended June 30 | | 2023 | | | 2022 | | | 2021 | | | 2020 | | | 2019 | |
| Net Asset Value, Beginning of Period | | $2.85 | | | $3.08 | | | $3.05 | | | $3.02 | | | $2.97 | |
| Income/(Loss) from Investment Operations: | | | | | | | | | | | | | | | |
| | Net investment income/(loss)(1) | | 0.08 | | | 0.04 | | | 0.05 | | | 0.07 | | | 0.07 | |
| | Net realized and unrealized gain/(loss) | | (0.03) | | | (0.23) | | | 0.04 | | | 0.03 | | | 0.05 | |
| Total from Investment Operations | | 0.05 | | | (0.19) | | | 0.09 | | | 0.10 | | | 0.12 | |
| Less Dividends and Distributions: | | | | | | | | | | | | | | | |
| | Dividends (from net investment income) | | (0.09) | | | (0.04) | | | (0.06) | | | (0.07) | | | (0.07) | |
| Total Dividends and Distributions | | (0.09) | | | (0.04) | | | (0.06) | | | (0.07) | | | (0.07) | |
| Net Asset Value, End of Period | | $2.81 | | | $2.85 | | | $3.08 | | | $3.05 | | | $3.02 | |
| Total Return* | | 1.63% | | | (6.08)% | | | 2.82% | | | 3.42% | | | 4.19% | |
| Net Assets, End of Period (in thousands) | | $368,402 | | | $442,881 | | | $421,533 | | | $380,901 | | | $392,758 | |
| Average Net Assets for the Period (in thousands) | | $402,417 | | | $490,490 | | | $412,021 | | | $383,912 | | | $414,017 | |
| Ratios to Average Net Assets**: | | | | | | | | | | | | | | | |
| | Ratio of Gross Expenses | | 0.66% | | | 0.61% | | | 0.60% | | | 0.61% | | | 0.65% | |
| | Ratio of Net Expenses (After Waivers and Expense Offsets) | | 0.46% | | | 0.49% | | | 0.56% | | | 0.56% | | | 0.57% | |
| | Ratio of Net Investment Income/(Loss) | | 2.94% | | | 1.28% | | | 1.69% | | | 2.27% | | | 2.43% | |
| Portfolio Turnover Rate | | 118%(2) | | | 94%(2) | | | 112%(2) | | | 121% | | | 79% | |
| | | | | | | | | | | | | | | | | | | |
| |
* Total return includes adjustments in accordance with generally accepted accounting principles required at the year or period end and are not annualized for periods of less than one full year. ** Annualized for periods of less than one full year. (1) Per share amounts are calculated based on average shares outstanding during the year or period. (2) Portfolio Turnover Rate excludes TBA (to be announced) purchase and sales commitments. |
| | |
See Notes to Financial Statements. |
| |
28 | JUNE 30, 2023 |
Janus Henderson Short Duration Flexible Bond Fund
Financial Highlights
| | | | | | | | | | | | | | | | | | | |
Class N Shares | | | | | | | | | | | | | | | |
For a share outstanding during the year ended June 30 | | 2023 | | | 2022 | | | 2021 | | | 2020 | | | 2019 | |
| Net Asset Value, Beginning of Period | | $2.84 | | | $3.07 | | | $3.05 | | | $3.01 | | | $2.97 | |
| Income/(Loss) from Investment Operations: | | | | | | | | | | | | | | | |
| | Net investment income/(loss)(1) | | 0.08 | | | 0.04 | | | 0.06 | | | 0.07 | | | 0.08 | |
| | Net realized and unrealized gain/(loss) | | (0.04) | | | (0.22) | | | 0.02 | | | 0.05 | | | 0.04 | |
| Total from Investment Operations | | 0.04 | | | (0.18) | | | 0.08 | | | 0.12 | | | 0.12 | |
| Less Dividends and Distributions: | | | | | | | | | | | | | | | |
| | Dividends (from net investment income) | | (0.09) | | | (0.05) | | | (0.06) | | | (0.08) | | | (0.08) | |
| Total Dividends and Distributions | | (0.09) | | | (0.05) | | | (0.06) | | | (0.08) | | | (0.08) | |
| Net Asset Value, End of Period | | $2.79 | | | $2.84 | | | $3.07 | | | $3.05 | | | $3.01 | |
| Total Return* | | 1.33% | | | (6.03)% | | | 2.61% | | | 3.89% | | | 3.95% | |
| Net Assets, End of Period (in thousands) | | $25,912 | | | $45,088 | | | $15,816 | | | $17,144 | | | $37,464 | |
| Average Net Assets for the Period (in thousands) | | $28,657 | | | $29,059 | | | $16,326 | | | $41,174 | | | $64,559 | |
| Ratios to Average Net Assets**: | | | | | | | | | | | | | | | |
| | Ratio of Gross Expenses | | 0.53% | | | 0.50% | | | 0.50% | | | 0.49% | | | 0.55% | |
| | Ratio of Net Expenses (After Waivers and Expense Offsets) | | 0.40% | | | 0.41% | | | 0.44% | | | 0.44% | | | 0.47% | |
| | Ratio of Net Investment Income/(Loss) | | 2.83% | | | 1.39% | | | 1.80% | | | 2.34% | | | 2.53% | |
| Portfolio Turnover Rate | | 118%(2) | | | 94%(2) | | | 112%(2) | | | 121% | | | 79% | |
| | | | | | | | | | | | | | | | | | | |
| |
* Total return includes adjustments in accordance with generally accepted accounting principles required at the year or period end and are not annualized for periods of less than one full year. ** Annualized for periods of less than one full year. (1) Per share amounts are calculated based on average shares outstanding during the year or period. (2) Portfolio Turnover Rate excludes TBA (to be announced) purchase and sales commitments. |
| | |
See Notes to Financial Statements. |
| |
Janus Investment Fund | 29 |
Janus Henderson Short Duration Flexible Bond Fund
Financial Highlights
| | | | | | | | | | | | | | | | | | | |
Class S Shares | | | | | | | | | | | | | | | |
For a share outstanding during the year ended June 30 | | 2023 | | | 2022 | | | 2021 | | | 2020 | | | 2019 | |
| Net Asset Value, Beginning of Period | | $2.85 | | | $3.07 | | | $3.05 | | | $3.01 | | | $2.97 | |
| Income/(Loss) from Investment Operations: | | | | | | | | | | | | | | | |
| | Net investment income/(loss)(1) | | 0.07 | | | 0.03 | | | 0.04 | | | 0.06 | | | 0.06 | |
| | Net realized and unrealized gain/(loss) | | (0.05) | | | (0.22) | | | 0.02 | | | 0.04 | | | 0.04 | |
| Total from Investment Operations | | 0.02 | | | (0.19) | | | 0.06 | | | 0.10 | | | 0.10 | |
| Less Dividends and Distributions: | | | | | | | | | | | | | | | |
| | Dividends (from net investment income) | | (0.07) | | | (0.03) | | | (0.04) | | | (0.06) | | | (0.06) | |
| Total Dividends and Distributions | | (0.07) | | | (0.03) | | | (0.04) | | | (0.06) | | | (0.06) | |
| Net Asset Value, End of Period | | $2.80 | | | $2.85 | | | $3.07 | | | $3.05 | | | $3.01 | |
| Total Return* | | 0.84% | | | (6.16)% | | | 2.12% | | | 3.39% | | | 3.46% | |
| Net Assets, End of Period (in thousands) | | $381 | | | $371 | | | $660 | | | $791 | | | $1,162 | |
| Average Net Assets for the Period (in thousands) | | $380 | | | $635 | | | $674 | | | $1,085 | | | $1,322 | |
| Ratios to Average Net Assets**: | | | | | | | | | | | | | | | |
| | Ratio of Gross Expenses | | 1.82% | | | 1.46% | | | 1.43% | | | 1.26% | | | 1.27% | |
| | Ratio of Net Expenses (After Waivers and Expense Offsets) | | 0.88% | | | 0.90% | | | 0.92% | | | 0.93% | | | 0.95% | |
| | Ratio of Net Investment Income/(Loss) | | 2.55% | | | 0.87% | | | 1.32% | | | 1.88% | | | 2.04% | |
| Portfolio Turnover Rate | | 118%(2) | | | 94%(2) | | | 112%(2) | | | 121% | | | 79% | |
| | | | | | | | | | | | | | | | | | | |
| |
* Total return includes adjustments in accordance with generally accepted accounting principles required at the year or period end and are not annualized for periods of less than one full year. ** Annualized for periods of less than one full year. (1) Per share amounts are calculated based on average shares outstanding during the year or period. (2) Portfolio Turnover Rate excludes TBA (to be announced) purchase and sales commitments. |
| | |
See Notes to Financial Statements. |
| |
30 | JUNE 30, 2023 |
Janus Henderson Short Duration Flexible Bond Fund
Financial Highlights
| | | | | | | | | | | | | | | | | | | |
Class T Shares | | | | | | | | | | | | | | | |
For a share outstanding during the year ended June 30 | | 2023 | | | 2022 | | | 2021 | | | 2020 | | | 2019 | |
| Net Asset Value, Beginning of Period | | $2.85 | | | $3.08 | | | $3.06 | | | $3.02 | | | $2.98 | |
| Income/(Loss) from Investment Operations: | | | | | | | | | | | | | | | |
| | Net investment income/(loss)(1) | | 0.08 | | | 0.03 | | | 0.05 | | | 0.06 | | | 0.07 | |
| | Net realized and unrealized gain/(loss) | | (0.04) | | | (0.22) | | | 0.02 | | | 0.05 | | | 0.04 | |
| Total from Investment Operations | | 0.04 | | | (0.19) | | | 0.07 | | | 0.11 | | | 0.11 | |
| Less Dividends and Distributions: | | | | | | | | | | | | | | | |
| | Dividends (from net investment income) | | (0.08) | | | (0.04) | | | (0.05) | | | (0.07) | | | (0.07) | |
| Total Dividends and Distributions | | (0.08) | | | (0.04) | | | (0.05) | | | (0.07) | | | (0.07) | |
| Net Asset Value, End of Period | | $2.81 | | | $2.85 | | | $3.08 | | | $3.06 | | | $3.02 | |
| Total Return* | | 1.45% | | | (6.23)% | | | 2.36% | | | 3.63% | | | 3.70% | |
| Net Assets, End of Period (in thousands) | | $231,314 | | | $294,579 | | | $403,560 | | | $427,052 | | | $521,348 | |
| Average Net Assets for the Period (in thousands) | | $265,112 | | | $353,907 | | | $424,193 | | | $473,636 | | | $628,515 | |
| Ratios to Average Net Assets**: | | | | | | | | | | | | | | | |
| | Ratio of Gross Expenses | | 0.77% | | | 0.73% | | | 0.73% | | | 0.74% | | | 0.80% | |
| | Ratio of Net Expenses (After Waivers and Expense Offsets) | | 0.64% | | | 0.65% | | | 0.69% | | | 0.69% | | | 0.71% | |
| | Ratio of Net Investment Income/(Loss) | | 2.75% | | | 1.10% | | | 1.56% | | | 2.14% | | | 2.27% | |
| Portfolio Turnover Rate | | 118%(2) | | | 94%(2) | | | 112%(2) | | | 121% | | | 79% | |
| | | | | | | | | | | | | | | | | | | |
| |
* Total return includes adjustments in accordance with generally accepted accounting principles required at the year or period end and are not annualized for periods of less than one full year. ** Annualized for periods of less than one full year. (1) Per share amounts are calculated based on average shares outstanding during the year or period. (2) Portfolio Turnover Rate excludes TBA (to be announced) purchase and sales commitments. |
| | |
See Notes to Financial Statements. |
| |
Janus Investment Fund | 31 |
Janus Henderson Short Duration Flexible Bond Fund
Notes to Financial Statements
1. Organization and Significant Accounting Policies
Janus Henderson Short Duration Flexible Bond Fund (the “Fund”) is a series of Janus Investment Fund (the “Trust”), which is organized as a Massachusetts business trust and is registered under the Investment Company Act of 1940, as amended (the “1940 Act”), as an open-end management investment company, and therefore has applied the specialized accounting and reporting guidance in Financial Accounting Standards Board (“FASB”) Accounting Standards Codification (“ASC”) Topic 946. The Trust offers 39 funds, each of which offers multiple share classes, with differing investment objectives and policies. The Fund seeks as high a level of current income as is consistent with preservation of capital. The Fund is classified as diversified, as defined in the 1940 Act. Janus Henderson Investors US LLC is the investment adviser (the “Adviser”) to the Fund.
The Fund offers multiple classes of shares in order to meet the needs of various types of investors. Each class represents an interest in the same portfolio of investments. Certain financial intermediaries may not offer all classes of shares.
Shareholders, including other funds, individuals, accounts, as well as the Fund’s portfolio manager(s) and/or investment personnel, may from time to time own (beneficially or of record) a significant percentage of the Fund’s Shares and can be considered to “control” the Fund when that ownership exceeds 25% of the Fund’s assets (and which may differ from control as determined in accordance with United States of America generally accepted accounting principles ("US GAAP")).
Class A Shares are offered through financial intermediary platforms including, but not limited to, traditional brokerage platforms, mutual fund wrap fee programs, bank trust platforms, and retirement platforms.
Class C Shares are offered through financial intermediary platforms including, but not limited to, traditional brokerage platforms, mutual fund wrap fee programs, and bank trust platforms.
Class C Shares are closed to investments by new employer-sponsored retirement plans and existing employer-sponsored retirement plans are no longer able to make additional purchases or exchanges into Class C Shares.
The Fund currently implements an automatic conversion feature pursuant to which Class C Shares that have been held for eight years are automatically converted to Class A Shares without the imposition of any sales charge, fee or other charge. The conversion will generally occur no later than ten business days in the month following the month of the eighth anniversary of the date of purchase. Class C Shares purchased through the reinvestment of dividends and other distributions on Class C Shares will convert to Class A Shares at the same time as the original Class C Shares with respect to which they were purchased. For Class C Shares held in omnibus accounts on intermediary platforms, the Fund relies on these intermediaries to implement this conversion feature. Your financial intermediary may have separate policies and procedures as to when and how Class C Shares may be converted to Class A Shares.
Effective July 6, 2020, Class D Shares are available to new investors, subject to any closed fund policies for a Fund, as applicable. Previously, Class D Shares were only available to investors who already had a direct account with the Janus Henderson funds; immediate family members or members of the same household of an eligible individual investor; and existing beneficial owners of sole proprietorships or partnerships that hold accounts directly with the Janus Henderson funds.
Class I Shares are available through certain financial intermediary platforms including, but not limited to, mutual fund wrap fee programs, managed account programs, asset allocation programs, bank trust platforms, as well as certain retirement platforms. Class I Shares are also available to certain direct institutional investors including, but not limited to, corporations, certain retirement plans, public plans, and foundations/endowments, who established Class I Share accounts before August 4, 2017.
Class N Shares are generally available only to financial intermediaries purchasing on behalf of: 1) certain adviser-assisted, employer-sponsored retirement plans, including 401(k) plans, 457 plans, 403(b) plans, Taft-Hartley multi-employer plans, profit-sharing and money purchase pension plans, defined benefit plans and certain welfare benefit plans, such as health savings accounts, and nonqualified deferred compensation plans; and 2) retail investors purchasing in qualified or nonqualified accounts, whose accounts are held through an omnibus account at their financial intermediary, and where the financial intermediary requires no payment or reimbursement from the Fund, the Adviser, or its affiliates. Class N Shares are also available to Janus Henderson proprietary products and to certain direct institutional investors approved by Janus Henderson Distributors US LLC (the “Distributor”) including, but not limited to,
Janus Henderson Short Duration Flexible Bond Fund
Notes to Financial Statements
corporations, certain retirement plans, public plans, and foundations and endowments, subject to minimum investment requirements.
Class S Shares are offered through financial intermediary platforms including, but not limited to, retirement platforms and asset allocation, mutual fund wrap, or other discretionary or nondiscretionary fee-based investment advisory programs. In addition, Class S Shares may be available through certain financial intermediaries who have an agreement with the Adviser or its affiliates to offer Class S Shares on their supermarket platforms.
Class T Shares are available through certain financial intermediary platforms including, but not limited to, mutual fund wrap fee programs, managed account programs, asset allocation programs, bank trust platforms, as well as certain retirement platforms. In addition, Class T Shares may be available through certain financial intermediaries who have an agreement with the Adviser or its affiliates to offer Class T Shares on their supermarket platforms.
The following accounting policies have been followed by the Fund and are in conformity with US GAAP.
Investment Valuation
Fund holdings are valued in accordance with policies and procedures established by the Adviser pursuant to Rule 2a-5 under the 1940 Act and approved by and subject to the oversight of the Trustees (the “Valuation Procedures”). Equity securities traded on a domestic securities exchange are generally valued at readily available market quotations, which are (i) the official close prices or (ii) last sale prices on the primary market or exchange in which the securities trade. If such price is lacking for the trading period immediately preceding the time of determination, such securities are generally valued at their current bid price. Equity securities that are traded on a foreign exchange are generally valued at the closing prices on such markets. In the event that there is no current trading volume on a particular security in such foreign exchange, the bid price from the primary exchange is generally used to value the security. Foreign securities and currencies are converted to U.S. dollars using the current spot USD dollar exchange rate in effect at the close of the New York Stock Exchange (“NYSE”). The Adviser will determine the market value of individual securities held by it by using prices provided by one or more Adviser-approved professional pricing services or, as needed, by obtaining market quotations from independent broker-dealers. Most debt securities are valued in accordance with the evaluated bid price supplied by the pricing service that is intended to reflect market value. The evaluated bid price supplied by the pricing service is an evaluation that may consider factors such as security prices, yields, maturities and ratings. Certain short-term securities maturing within 60 days or less may be evaluated and valued on an amortized cost basis provided that the amortized cost determined approximates market value. Securities for which market quotations or evaluated prices are not readily available or deemed unreliable are valued at fair value determined in good faith by the Adviser pursuant to the Valuation Procedures. Circumstances in which fair valuation may be utilized include, but are not limited to: (i) a significant event that may affect the securities of a single issuer, such as a merger, bankruptcy, or significant issuer-specific development; (ii) an event that may affect an entire market, such as a natural disaster or significant governmental action; (iii) a nonsignificant event such as a market closing early or not opening, or a security trading halt; and (iv) pricing of a nonvalued security and a restricted or nonpublic security. Special valuation considerations may apply with respect to “odd-lot” fixed-income transactions which, due to their small size, may receive evaluated prices by pricing services which reflect a large block trade and not what actually could be obtained for the odd-lot position. The value of the securities of other mutual funds held by the Fund, if any, will be calculated using the NAV of such mutual funds, and the prospectuses for such mutual funds explain the circumstances under which they use fair valuation and the effects of using fair valuation. The value of the securities of any cash management pooled investment vehicles that operate as money market funds held by the Fund, if any, will be calculated using the NAV of such funds.
Valuation Inputs Summary
FASB ASC 820, Fair Value Measurements and Disclosures (“ASC 820”), defines fair value, establishes a framework for measuring fair value, and expands disclosure requirements regarding fair value measurements. This standard emphasizes that fair value is a market-based measurement that should be determined based on the assumptions that market participants would use in pricing an asset or liability and establishes a hierarchy that prioritizes inputs to valuation techniques used to measure fair value. These inputs are summarized into three broad levels:
Level 1 – Unadjusted quoted prices in active markets the Fund has the ability to access for identical assets or liabilities.
Level 2 – Observable inputs other than unadjusted quoted prices included in Level 1 that are observable for the asset or liability either directly or indirectly. These inputs may include quoted prices for the identical instrument on
Janus Henderson Short Duration Flexible Bond Fund
Notes to Financial Statements
an inactive market, prices for similar instruments, interest rates, prepayment speeds, credit risk, yield curves, default rates and similar data.
Assets or liabilities categorized as Level 2 in the hierarchy generally include: debt securities fair valued in accordance with the evaluated bid or ask prices supplied by a pricing service; securities traded on OTC markets and listed securities for which no sales are reported that are fair valued at the latest bid price (or yield equivalent thereof) obtained from one or more dealers transacting in a market for such securities or by a pricing service approved by the Fund’s Trustees; certain short-term debt securities with maturities of 60 days or less that are fair valued at amortized cost; and equity securities of foreign issuers whose fair value is determined by using systematic fair valuation models provided by independent third parties in order to adjust for stale pricing which may occur between the close of certain foreign exchanges and the close of the NYSE. Other securities that may be categorized as Level 2 in the hierarchy include, but are not limited to, preferred stocks, bank loans, swaps, investments in unregistered investment companies, options, and forward contracts.
Level 3 – Unobservable inputs for the asset or liability to the extent that relevant observable inputs are not available, representing the Fund’s own assumptions about the assumptions that a market participant would use in valuing the asset or liability, and that would be based on the best information available.
There have been no significant changes in valuation techniques used in valuing any such positions held by the Fund since the beginning of the fiscal year.
The inputs or methodology used for fair valuing securities are not necessarily an indication of the risk associated with investing in those securities. The summary of inputs used as of June 30, 2023 to fair value the Fund’s investments in securities and other financial instruments is included in the “Valuation Inputs Summary” in the Notes to Schedule of Investments and Other Information.
Investment Transactions and Investment Income
Investment transactions are accounted for as of the date purchased or sold (trade date). Dividend income is recorded on the ex-dividend date. Certain dividends from foreign securities will be recorded as soon as the Fund is informed of the dividend, if such information is obtained subsequent to the ex-dividend date. Dividends from foreign securities may be subject to withholding taxes in foreign jurisdictions. Non-cash dividends, if any, are recorded on the ex-dividend date at fair value. Interest income is recorded daily on the accrual basis and includes amortization of premiums and accretion of discounts. The Fund classifies gains and losses on prepayments received as an adjustment to interest income. Debt securities may be placed in non-accrual status and related interest income may be reduced by stopping current accruals and writing off interest receivables when collection of all or a portion of interest has become doubtful. Gains and losses are determined on the identified cost basis, which is the same basis used for federal income tax purposes. Income, as well as gains and losses, both realized and unrealized, are allocated daily to each class of shares based upon the ratio of net assets represented by each class as a percentage of total net assets.
Expenses
The Fund bears expenses incurred specifically on its behalf. Each class of shares bears a portion of general expenses, which are allocated daily to each class of shares based upon the ratio of net assets represented by each class as a percentage of total net assets. Expenses directly attributable to a specific class of shares are charged against the operations of such class.
Estimates
The preparation of financial statements in conformity with US GAAP requires management to make estimates and assumptions that affect the reported amount of assets and liabilities and disclosure of contingent assets and liabilities at the date of the financial statements, and the reported amounts of income and expenses during the reporting period. Actual results could differ from those estimates.
Indemnifications
In the normal course of business, the Fund may enter into contracts that contain provisions for indemnification of other parties against certain potential liabilities. The Fund’s maximum exposure under these arrangements is unknown, and would involve future claims that may be made against the Fund that have not yet occurred. Currently, the risk of material loss from such claims is considered remote.
Janus Henderson Short Duration Flexible Bond Fund
Notes to Financial Statements
Dividends and Distributions
Dividends are declared daily and distributed monthly for the Fund. Realized capital gains, if any, are declared and distributed in December. The Fund may treat a portion of the amount paid to redeem shares as a distribution of investment company taxable income and realized capital gains that are reflected in the net asset value. This practice, commonly referred to as “equalization,” has no effect on the redeeming shareholder or a Fund’s total return, but may reduce the amounts that would otherwise be required to be paid as taxable dividends to the remaining shareholders. It is possible that the Internal Revenue Service (IRS) could challenge the Fund's equalization methodology or calculations, and any such challenge could result in additional tax, interest, or penalties to be paid by the Fund.
The Fund may make certain investments in real estate investment trusts (“REITs”) which pay dividends to their shareholders based upon funds available from operations. It is quite common for these dividends to exceed the REITs’ taxable earnings and profits, resulting in the excess portion of such dividends being designated as a return of capital. If the Fund distributes such amounts, such distributions could constitute a return of capital to shareholders for federal income tax purposes.
Federal Income Taxes
The Fund intends to continue to qualify as a regulated investment company and distribute all of its taxable income in accordance with the requirements of Subchapter M of the Internal Revenue Code. Management has analyzed the Fund’s tax positions taken for all open federal income tax years, generally a three-year period, and has concluded that no provision for federal income tax is required in the Fund’s financial statements. The Fund is not aware of any tax positions for which it is reasonably possible that the total amounts of unrecognized tax benefits will significantly change in the next twelve months.
2. Derivative Instruments
The Fund may invest in various types of derivatives, which may at times result in significant derivative exposure. A derivative is a financial instrument whose performance is derived from the performance of another asset. The Fund may invest in derivative instruments including, but not limited to: futures contracts, put options, call options, options on futures contracts, options on foreign currencies, options on recovery locks, options on security and commodity indices, swaps, forward contracts, structured investments, and other equity-linked derivatives. Each derivative instrument that was held by the Fund during the year ended June 30, 2023 is discussed in further detail below. A summary of derivative activity by the Fund is reflected in the tables at the end of the Schedule of Investments.
The Fund may use derivative instruments for hedging purposes (to offset risks associated with an investment, currency exposure, or market conditions), to adjust currency exposure relative to a benchmark index, or for speculative purposes (to earn income and seek to enhance returns). When the Fund invests in a derivative for speculative purposes, the Fund will be fully exposed to the risks of loss of that derivative, which may sometimes be greater than the derivative’s cost. The Fund may not use any derivative to gain exposure to an asset or class of assets that it would be prohibited by its investment restrictions from purchasing directly. The Fund’s ability to use derivative instruments may also be limited by tax considerations.
Investments in derivatives in general are subject to market risks that may cause their prices to fluctuate over time. Investments in derivatives may not directly correlate with the price movements of the underlying instrument. As a result, the use of derivatives may expose the Fund to additional risks that it would not be subject to if it invested directly in the securities underlying those derivatives. The use of derivatives may result in larger losses or smaller gains than otherwise would be the case. Derivatives can be volatile and may involve significant risks.
In pursuit of its investment objective, the Fund may seek to use derivatives to increase or decrease exposure to the following market risk factors:
· Commodity Risk – the risk related to the change in value of commodities or commodity-linked investments due to changes in the overall market movements, volatility of the underlying benchmark, changes in interest rates, or other factors affecting a particular industry or commodity such as drought, floods, weather, livestock disease, embargoes, tariffs, and international economic, political, and regulatory developments.
· Counterparty Risk – the risk that the counterparty (the party on the other side of the transaction) on a derivative transaction will be unable to honor its financial obligation to the Fund.
Janus Henderson Short Duration Flexible Bond Fund
Notes to Financial Statements
· Credit Risk – the risk an issuer will be unable to make principal and interest payments when due, or will default on its obligations.
· Currency Risk – the risk that changes in the exchange rate between currencies will adversely affect the value (in U.S. dollar terms) of an investment.
· Equity Risk – the risk related to the change in value of equity securities as they relate to increases or decreases in the general market.
· Index Risk – if the derivative is linked to the performance of an index, it will be subject to the risks associated with changes in that index. If the index changes, the Fund could receive lower interest payments or experience a reduction in the value of the derivative to below what the Fund paid. Certain indexed securities, including inverse securities (which move in an opposite direction to the index), may create leverage, to the extent that they increase or decrease in value at a rate that is a multiple of the changes in the applicable index.
· Interest Rate Risk – the risk that the value of fixed-income securities will generally decline as prevailing interest rates rise, which may cause the Fund’s NAV to likewise decrease.
· Leverage Risk – the risk associated with certain types of leveraged investments or trading strategies pursuant to which relatively small market movements may result in large changes in the value of an investment. The Fund creates leverage by investing in instruments, including derivatives, where the investment loss can exceed the original amount invested. Certain investments or trading strategies, such as short sales, that involve leverage can result in losses that greatly exceed the amount originally invested.
· Liquidity Risk – the risk that certain securities may be difficult or impossible to sell at the time that the seller would like or at the price that the seller believes the security is currently worth.
Derivatives may generally be traded OTC or on an exchange. Derivatives traded OTC are agreements that are individually negotiated between parties and can be tailored to meet a purchaser’s needs. OTC derivatives are not guaranteed by a clearing agency and may be subject to increased credit risk.
In an effort to mitigate credit risk associated with derivatives traded OTC, the Fund may enter into collateral agreements with certain counterparties whereby, subject to certain minimum exposure requirements, the Fund may require the counterparty to post collateral if the Fund has a net aggregate unrealized gain on all OTC derivative contracts with a particular counterparty. Additionally, the Fund may deposit cash and/or treasuries as collateral with the counterparty and/or custodian daily (based on the daily valuation of the financial asset) if the Fund has a net aggregate unrealized loss on OTC derivative contracts with a particular counterparty. All liquid securities and restricted cash are considered to cover in an amount at all times equal to or greater than the Fund’s commitment with respect to certain exchange-traded derivatives, centrally cleared derivatives, forward foreign currency exchange contracts, short sales, and/or securities with extended settlement dates. There is no guarantee that counterparty exposure is reduced and these arrangements are dependent on the Adviser’s ability to establish and maintain appropriate systems and trading.
Futures Contracts
A futures contract is an exchange-traded agreement to take or make delivery of an underlying asset at a specific time in the future for a specific predetermined negotiated price. The Fund may enter into futures contracts to gain exposure to the stock market or other markets pending investment of cash balances or to meet liquidity needs. The Fund is subject to interest rate risk, equity risk, and currency risk in the normal course of pursuing its investment objective through its investments in futures contracts. The Fund may also use such derivative instruments to hedge or protect from adverse movements in securities prices, currency rates or interest rates. The use of futures contracts may involve risks such as the possibility of illiquid markets or imperfect correlation between the values of the contracts and the underlying securities, or that the counterparty will fail to perform its obligations.
Futures contracts are valued at the settlement price on valuation date on the exchange as reported by an approved vendor. Mini contracts, as defined in the description of the contract, shall be valued using the Actual Settlement Price or “ASET” price type as reported by an approved vendor. In the event that foreign futures trade when the foreign equity markets are closed, the last foreign futures trade price shall be used.
Futures contracts are marked-to-market daily, and the daily variation margin is recorded as a receivable or payable on the Statement of Assets and Liabilities (if applicable). The change in unrealized net appreciation/depreciation is reported on the Statement of Operations (if applicable). When a contract is closed, a realized gain or loss is reported on
Janus Henderson Short Duration Flexible Bond Fund
Notes to Financial Statements
the Statement of Operations (if applicable), equal to the difference between the opening and closing value of the contract.
Securities held by the Fund that are designated as collateral for market value on futures contracts are noted on the Schedule of Investments (if applicable). Such collateral is in the possession of the Fund’s futures commission merchant.
With futures, there is minimal counterparty credit risk to the Fund since futures are exchange-traded and the exchange’s clearinghouse, as counterparty to all exchange-traded futures, guarantees the futures against default.
During the year, the Fund purchased interest rate futures to increase exposure to interest rate risk.
During the year, the Fund sold interest rate futures to decrease exposure to interest rate risk.
Swaps
Swap agreements are two-party contracts entered into primarily by institutional investors for periods ranging from a day to more than one year to exchange one set of cash flows for another. The most significant factor in the performance of swap agreements is the change in value of the specific index, security, or currency, or other factors that determine the amounts of payments due to and from the Fund. The use of swaps is a highly specialized activity which involves investment techniques and risks different from those associated with ordinary portfolio securities transactions. Swap transactions may in some instances involve the delivery of securities or other underlying assets by the Fund or its counterparty to collateralize obligations under the swap. If the other party to a swap that is not collateralized defaults, the Fund would risk the loss of the net amount of the payments that it contractually is entitled to receive. Swap agreements entail the risk that a party will default on its payment obligations to the Fund. If the other party to a swap defaults, the Fund would risk the loss of the net amount of the payments that it contractually is entitled to receive. If the Fund utilizes a swap at the wrong time or judges market conditions incorrectly, the swap may result in a loss to the Fund and reduce the Fund’s total return.
Swap agreements also bear the risk that the Fund will not be able to meet its obligation to the counterparty. Swap agreements are typically privately negotiated and entered into in the OTC market. However, certain swap agreements are required to be cleared through a clearinghouse and traded on an exchange or swap execution facility. Swaps that are required to be cleared are required to post initial and variation margins in accordance with the exchange requirements. Regulations enacted require the Fund to centrally clear certain interest rate and credit default index swaps through a clearinghouse or central counterparty (“CCP”). To clear a swap with a CCP, the Fund will submit the swap to, and post collateral with, a futures clearing merchant (“FCM”) that is a clearinghouse member. Alternatively, the Fund may enter into a swap with a financial institution other than the FCM (the “Executing Dealer”) and arrange for the swap to be transferred to the FCM for clearing. The Fund may also enter into a swap with the FCM itself. The CCP, the FCM, and the Executing Dealer are all subject to regulatory oversight by the U.S. Commodity Futures Trading Commission (“CFTC”). A default or failure by a CCP or an FCM, or the failure of a swap to be transferred from an Executing Dealer to the FCM for clearing, may expose the Fund to losses, increase its costs, or prevent the Fund from entering or exiting swap positions, accessing collateral, or fully implementing its investment strategies. The regulatory requirement to clear certain swaps could, either temporarily or permanently, reduce the liquidity of cleared swaps or increase the costs of entering into those swaps.
Index swaps, interest rate swaps, inflation swaps and credit default swaps are valued using an approved vendor supplied price. Basket swaps are valued using a broker supplied price. Equity swaps that consist of a single underlying equity are valued either at the closing price, the latest bid price, or the last sale price on the primary market or exchange it trades.
The market value of swap contracts are aggregated by positive and negative values and are disclosed separately as an asset or liability on the Fund’s Statement of Assets and Liabilities (if applicable). Realized gains and losses are reported on the Fund’s Statement of Operations (if applicable). The change in unrealized net appreciation or depreciation during the year is included in the Statement of Operations (if applicable).
The Fund’s maximum risk of loss from counterparty risk or credit risk is the discounted value of the payments to be received from/paid to the counterparty over the contract’s remaining life, to the extent that the amount is positive. The risk is mitigated by having a netting arrangement between the Fund and the counterparty and by the posting of collateral by the counterparty to cover the Fund’s exposure to the counterparty.
Janus Henderson Short Duration Flexible Bond Fund
Notes to Financial Statements
The Fund may enter into various types of credit default swap agreements, including OTC credit default swap agreements, for investment purposes, to add leverage to its Fund, or to hedge against widening credit spreads on high-yield/high-risk bonds. Credit default swaps are a specific kind of counterparty agreement that allow the transfer of third party credit risk from one party to the other. One party in the swap is a lender and faces credit risk from a third party, and the counterparty in the credit default swap agrees to insure this risk in exchange for regular periodic payments. Credit default swaps could result in losses if the Fund does not correctly evaluate the creditworthiness of the company or companies on which the credit default swap is based. Credit default swap agreements may involve greater risks than if the Fund had invested in the reference obligation directly since, in addition to risks relating to the reference obligation, credit default swaps are subject to illiquidity risk, counterparty risk, and credit risk. The Fund will generally incur a greater degree of risk when it sells a credit default swap than when it purchases a credit default swap. As a buyer of a credit default swap, the Fund may lose its investment and recover nothing should no credit event occur and the swap is held to its termination date. As seller of a credit default swap, if a credit event were to occur, the value of any deliverable obligation received by the Fund, coupled with the upfront or periodic payments previously received, may be less than what it pays to the buyer, resulting in a loss of value to the Fund.
As a buyer of credit protection, the Fund is entitled to receive the par (or other agreed-upon) value of a referenced debt obligation from the counterparty to the contract in the event of a default or other credit event by a third party, such as a U.S. or foreign issuer, on the debt obligation. In return, the Fund as buyer would pay to the counterparty a periodic stream of payments over the term of the contract provided that no credit event has occurred. If no credit event occurs, the Fund would have spent the stream of payments and potentially received no benefit from the contract.
If the Fund is the seller of credit protection against a particular security, the Fund would receive an up-front or periodic payment to compensate against potential credit events. As the seller in a credit default swap contract, the Fund would be required to pay the par value (the “notional value”) (or other agreed-upon value) of a referenced debt obligation to the counterparty in the event of a default by a third party, such as a U.S. or foreign corporate issuer, on the debt obligation. In return, the Fund would receive from the counterparty a periodic stream of payments over the term of the contract provided that no event of default has occurred. If no default occurs, the Fund would keep the stream of payments and would have no payment obligations. As the seller, the Fund would effectively add leverage to its portfolio because, in addition to its total net assets, the Fund would be subject to investment exposure on the notional value of the swap. The maximum potential amount of future payments (undiscounted) that the Fund as a seller could be required to make in a credit default transaction would be the notional amount of the agreement.
The Fund may invest in single-name credit default swaps (“CDS”) to buy or sell credit protection to hedge its credit exposure, gain issuer exposure without owning the underlying security, or increase the Fund’s total return. Single-name CDS enable the Fund to buy or sell protection against a credit event of a specific issuer. When the Fund buys a single-name CDS, the Fund will receive a return on its investment only in the event of a credit event, such as default by the issuer of the underlying obligation (as opposed to a credit downgrade or other indication of financial difficulty). If a single-name CDS transaction is particularly large, or if the relevant market is illiquid, it may not be possible for the Fund to initiate a single-name CDS transaction or to liquidate its position at an advantageous time or price, which may result in significant losses. Moreover, the Fund bears the risk of loss of the amount expected to be received under a single-name CDS in the event of the default or bankruptcy of the counterparty. The risks associated with cleared single-name CDS may be lower than that for uncleared single-name CDS because for cleared single-name CDS, the counterparty is a clearinghouse (to the extent such a trading market is available). However, there can be no assurance that a clearinghouse or its members will satisfy their obligations to the Fund.
The Fund may invest in CDXs. A CDX is a swap on an index of credit default swaps. CDXs allow an investor to manage credit risk or take a position on a basket of credit entities (such as credit default swaps or commercial mortgage-backed securities) in a more efficient manner than transacting in a single-name CDS. If a credit event occurs in one of the underlying companies, the protection is paid out via the delivery of the defaulted bond by the buyer of protection in return for a payment of notional value of the defaulted bond by the seller of protection or it may be settled through a cash settlement between the two parties. The underlying company is then removed from the index. If the Fund holds a long position in a CDX, the Fund would indirectly bear its proportionate share of any expenses paid by a CDX. A Fund holding a long position in CDXs typically receives income from principal or interest paid on the underlying securities. By investing in CDXs, the Fund could be exposed to illiquidity risk, counterparty risk, and credit risk of the issuers of the underlying loan obligations and of the CDX markets. If there is a default by the CDX counterparty, the Fund will have
Janus Henderson Short Duration Flexible Bond Fund
Notes to Financial Statements
contractual remedies pursuant to the agreements related to the transaction. CDXs also bear the risk that the Fund will not be able to meet its obligation to the counterparty.
During the year, the Fund purchased protection via the credit default swap market in order to reduce credit risk exposure to individual corporates, countries and/or credit indices where reducing this exposure via the cash bond market was less attractive.
There were no credit default swaps held at June 30, 2023.
3. Other Investments and Strategies
Market Risk
The Fund may be invested in lower-rated debt securities that have a higher risk of default or loss of value since these securities may be sensitive to economic changes, political changes, or adverse developments specific to the issuer.
The value of the Fund’s portfolio may decrease if the value of one or more issuers in the Fund’s portfolio decreases. Further, regardless of how well individual companies or securities perform, the value of the Fund’s portfolio could also decrease if there are deteriorating economic or market conditions, including, but not limited to, a general decline in prices on the stock markets, a general decline in real estate markets, a decline in commodities prices, or if the market favors different types of securities than the types of securities in which the Fund invests. If the value of the Fund’s portfolio decreases, the Fund’s NAV will also decrease, which means if you sell your shares in the Fund you may lose money. Market risk may affect a single issuer, industry, economic sector, or the market as a whole. The increasing interconnectivity between global economies and financial markets increases the likelihood that events or conditions in one region or financial market may adversely impact issuers in a different country, region or financial market. Social, political, economic and other conditions and events, such as natural disasters, health emergencies (e.g., epidemics and pandemics), terrorism, conflicts, including related sanctions, and social unrest, could reduce consumer demand or economic output, result in market closures, travel restrictions and/or quarantines, and generally have a significant impact on the global economies and financial markets.
• COVID-19 Pandemic. The effects of COVID-19 have contributed to increased volatility in global financial markets and have affected and may continue to affect certain countries, regions, issuers, industries and market sectors more dramatically than others. These conditions and events could have a significant impact on the Fund and its investments, the Fund’s ability to meet redemption requests, and the processes and operations of the Fund’s service providers, including the Adviser.
• Russia/Ukraine Invasion. Russia launched a large-scale invasion of Ukraine on February 24, 2022. The extent and duration of the military action, resulting sanctions and resulting future market disruptions in the region are impossible to predict, but could be significant and have a severe adverse effect on the region, including significant negative impacts on the economy and the markets for certain securities and commodities, such as oil and natural gas, as well as other sectors.
LIBOR Replacement Risk
The Fund may invest in certain debt securities, derivatives or other financial instruments that utilize the London Interbank Offered Rate (“LIBOR”) or other interbank offered rates as a reference rate for various rate calculations. The U.K. Financial Conduct Authority has announced that it intends to stop compelling or inducing banks to submit rates for many LIBOR settings after December 31, 2021, and for certain other commonly used U.S. dollar LIBOR settings after June 30, 2023. The elimination of LIBOR or other reference rates and the transition process away from LIBOR could adversely impact (i) volatility and liquidity in markets that are tied to those reference rates, (ii) the market for, or value of, specific securities or payments linked to those reference rates, (iii) availability or terms of borrowing or refinancing, or (iv) the effectiveness of hedging strategies. For these and other reasons, the elimination of LIBOR or changes to other reference rates may adversely affect the Fund’s performance and/or net asset value. Alternatives to LIBOR are established or in development in most major currencies, including the Secured Overnight Financing Rate (“SOFR”) that is intended to replace the U.S. dollar LIBOR. The effect of the discontinuation of, LIBOR or other reference rates will depend on (1) existing fallback or termination provisions in individual contracts and (2) whether, how, and when industry participants develop and adopt new reference rates and fallbacks for both legacy and new products and instruments. Accordingly, it is difficult to predict the full impact of the transition away from LIBOR or other reference rates on the Fund until new reference rates and fallbacks for both legacy and new products, instruments and contracts are commercially accepted.
Janus Henderson Short Duration Flexible Bond Fund
Notes to Financial Statements
Mortgage- and Asset-Backed Securities
Mortgage- and asset-backed securities represent interests in “pools” of commercial or residential mortgages or other assets, including consumer and commercial loans or receivables. The Fund may purchase fixed or variable rate commercial or residential mortgage-backed securities issued by the Government National Mortgage Association (“Ginnie Mae”), the Federal National Mortgage Association (“Fannie Mae”), the Federal Home Loan Mortgage Corporation (“Freddie Mac”), or other governmental or government-related entities. Ginnie Mae’s guarantees are backed as to the timely payment of principal and interest by the full faith and credit of the U.S. Government. Fannie Mae and Freddie Mac securities are not backed by the full faith and credit of the U.S. Government. In September 2008, the Federal Housing Finance Agency (“FHFA”), an agency of the U.S. Government, placed Fannie Mae and Freddie Mac under conservatorship. Since that time, Fannie Mae and Freddie Mac have received capital support through U.S. Treasury preferred stock purchases and Treasury and Federal Reserve purchases of their mortgage-backed securities. The FHFA and the U.S. Treasury have imposed strict limits on the size of these entities’ mortgage portfolios. The FHFA has the power to cancel any contract entered into by Fannie Mae and Freddie Mac prior to FHFA’s appointment as conservator or receiver, including the guarantee obligations of Fannie Mae and Freddie Mac.
The Fund may also purchase other mortgage- and asset-backed securities through single- and multi-seller conduits, collateralized debt obligations, structured investment vehicles, and other similar securities. Asset-backed securities may be backed by various consumer obligations, including automobile loans, equipment leases, credit card receivables, or other collateral. In the event the underlying loans are not paid, the securities’ issuer could be forced to sell the assets and recognize losses on such assets, which could impact your return. Unlike traditional debt instruments, payments on these securities include both interest and a partial payment of principal. Mortgage- and asset-backed securities are subject to both extension risk, where borrowers pay off their debt obligations more slowly in times of rising interest rates, and prepayment risk, where borrowers pay off their debt obligations sooner than expected in times of declining interest rates. These risks may reduce the Fund’s returns. In addition, investments in mortgage- and asset-backed securities, including those comprised of subprime mortgages, may be subject to a higher degree of credit risk, valuation risk, extension risk (if interest rates rise), and liquidity risk than various other types of fixed-income securities. Additionally, although mortgage-backed securities are generally supported by some form of government or private guarantee and/or insurance, there is no assurance that guarantors or insurers will meet their obligations.
Sovereign Debt
The Fund may invest in U.S. and non-U.S. government debt securities (“sovereign debt”). Some investments in sovereign debt, such as U.S. sovereign debt, are considered low risk. However, investments in sovereign debt, especially the debt of less developed countries, can involve a high degree of risk, including the risk that the governmental entity that controls the repayment of sovereign debt may not be willing or able to repay the principal and/or to pay the interest on its sovereign debt in a timely manner. A sovereign debtor’s willingness or ability to satisfy its debt obligation may be affected by various factors including, but not limited to, its cash flow situation, the extent of its foreign currency reserves, the availability of foreign exchange when a payment is due, the relative size of its debt position in relation to its economy as a whole, the sovereign debtor’s policy toward international lenders, and local political constraints to which the governmental entity may be subject. Sovereign debtors may also be dependent on expected disbursements from foreign governments, multilateral agencies, and other entities. The failure of a sovereign debtor to implement economic reforms, achieve specified levels of economic performance, or repay principal or interest when due may result in the cancellation of third party commitments to lend funds to the sovereign debtor, which may further impair such debtor’s ability or willingness to timely service its debts. The Fund may be requested to participate in the rescheduling of such sovereign debt and to extend further loans to governmental entities, which may adversely affect the Fund’s holdings. In the event of default, there may be limited or no legal remedies for collecting sovereign debt and there may be no bankruptcy proceedings through which the Fund may collect all or part of the sovereign debt that a governmental entity has not repaid. In addition, to the extent the Fund invests in non-U.S. sovereign debt, it may be subject to currency risk.
TBA Commitments
The Fund may enter into “to be announced” or “TBA” commitments. TBAs are forward agreements for the purchase or sale of securities, including mortgage-backed securities, for a fixed price, with payment and delivery on an agreed upon future settlement date. The specific securities to be delivered are not identified at the trade date. However, delivered securities must meet specified terms, including issuer, rate, and mortgage terms. Although TBA securities must meet industry-accepted “good delivery” standards, there can be no assurance that a security purchased on forward commitment basis will ultimately be issued or delivered by the counterparty. During the settlement period, the Fund will still bear the risk of any decline in the value of the security to be delivered. Because TBA commitments do not require
Janus Henderson Short Duration Flexible Bond Fund
Notes to Financial Statements
the delivery of a specific security, the characteristics of the security delivered to the Fund may be less favorable than expected. If the counterparty to a transaction fails to deliver the security, the Fund could suffer a loss. Cash collateral that has been pledged to cover the obligations of a Fund and cash collateral received from the counterparty, if any, is reported separately in the Statement of Assets and Liabilities as Collateral for To Be Announced Transactions.
When-Issued, Delayed Delivery and Forward Commitment Transactions
The Fund may purchase or sell securities on a when-issued, delayed delivery, or forward commitment basis. When purchasing a security on a when-issued, delayed delivery, or forward commitment basis, the Fund assumes the rights and risks of ownership of the security, including the risk of price and yield fluctuations, and takes such fluctuations into account when determining its net asset value. Typically, no income accrues on securities the Fund has committed to purchase prior to the time delivery of the securities is made. Because the Fund is not required to pay for the security until the delivery date, these risks are in addition to the risks associated with the Fund’s other investments. If the other party to a transaction fails to deliver the securities, the Fund could miss a favorable price or yield opportunity. If the Fund remains substantially fully invested at a time when when-issued, delayed delivery, or forward commitment purchases are outstanding, the purchases may result in a form of leverage. If the Fund remains substantially fully invested at a time when when-issued, delayed delivery, or forward commitment purchases (including TBA commitments) are outstanding, the purchases may result in a form of leverage.
When the Fund has sold a security on a when-issued, delayed delivery, or forward commitment basis, the Fund does not participate in future gains or losses with respect to the security. If the other party to a transaction fails to pay for the securities, the Fund could suffer a loss. Additionally, when selling a security on a when-issued, delayed delivery, or forward commitment basis without owning the security, the Fund will incur a loss if the security’s price appreciates in value such that the security’s price is above the agreed upon price on the settlement date. The Fund may dispose of or renegotiate a transaction after it is entered into, and may purchase or sell when-issued, delayed delivery or forward commitment securities before the settlement date, which may result in a gain or loss.
Counterparties
Fund transactions involving a counterparty are subject to the risk that the counterparty or a third party will not fulfill its obligation to the Fund (“counterparty risk”). Counterparty risk may arise because of the counterparty’s financial condition (i.e., financial difficulties, bankruptcy, or insolvency), market activities and developments, or other reasons, whether foreseen or not. A counterparty’s inability to fulfill its obligation may result in significant financial loss to the Fund. The Fund may be unable to recover its investment from the counterparty or may obtain a limited recovery, and/or recovery may be delayed. The extent of the Fund’s exposure to counterparty risk with respect to financial assets and liabilities approximates its carrying value.
The Fund may be exposed to counterparty risk through participation in various programs, including, but not limited to, lending its securities to third parties, cash sweep arrangements whereby the Fund’s cash balance is invested in one or more types of cash management vehicles, as well as investments in, but not limited to, repurchase agreements, debt securities, and derivatives, including various types of swaps, futures and options. The Fund intends to enter into financial transactions with counterparties that the Adviser believes to be creditworthy at the time of the transaction. There is always the risk that the Adviser’s analysis of a counterparty’s creditworthiness is incorrect or may change due to market conditions. To the extent that the Fund focuses its transactions with a limited number of counterparties, it will have greater exposure to the risks associated with one or more counterparties.
Securities Lending
Under procedures adopted by the Trustees, the Fund may seek to earn additional income by lending securities to certain qualified broker-dealers and institutions. JPMorgan Chase Bank, National Association acts as securities lending agent and a limited purpose custodian or subcustodian to receive and disburse cash balances and cash collateral, hold short-term investments, hold collateral, and perform other custodial functions in accordance with the Non-Custodial Securities Lending Agreement. For financial reporting purposes, the Fund does not offset financial instruments’ payables and receivables and related collateral on the Statement of Assets and Liabilities. The Fund may lend fund securities in an amount equal to up to 1/3 of its total assets as determined at the time of the loan origination. There is the risk of delay in recovering a loaned security or the risk of loss in collateral rights if the borrower fails financially. In addition, the Adviser makes efforts to balance the benefits and risks from granting such loans. All loans will be continuously secured by collateral which may consist of cash, U.S. Government securities, domestic and foreign short-term debt instruments, letters of credit, time deposits, repurchase agreements, money market mutual funds or other money market accounts, or such other collateral as permitted by the Securities and Exchange Commission (the "SEC").
Janus Henderson Short Duration Flexible Bond Fund
Notes to Financial Statements
If the Fund is unable to recover a security on loan, the Fund may use the collateral to purchase replacement securities in the market. There is a risk that the value of the collateral could decrease below the cost of the replacement security by the time the replacement investment is made, resulting in a loss to the Fund. In certain circumstances individual loan transactions could yield negative returns.
Upon receipt of cash collateral, the Adviser may invest it in affiliated or non-affiliated cash management vehicles, whether registered or unregistered entities, as permitted by the 1940 Act and rules promulgated thereunder. The Adviser currently intends to primarily invest the cash collateral in a cash management vehicle for which the Adviser serves as investment adviser, Janus Henderson Cash Collateral Fund LLC, or in time deposits. An investment in Janus Henderson Cash Collateral Fund LLC is generally subject to the same risks that shareholders experience when investing in similarly structured vehicles, such as the potential for significant fluctuations in assets as a result of the purchase and redemption activity of the securities lending program, a decline in the value of the collateral, and possible liquidity issues. Such risks may delay the return of the cash collateral and cause the Fund to violate its agreement to return the cash collateral to a borrower in a timely manner. As adviser to the Fund and Janus Henderson Cash Collateral Fund LLC, the Adviser has an inherent conflict of interest as a result of its fiduciary duties to both the Fund and Janus Henderson Cash Collateral Fund LLC. Additionally, the Adviser receives an investment advisory fee of 0.05% for managing Janus Henderson Cash Collateral Fund LLC, but it may not receive a fee for managing certain other affiliated cash management vehicles in which the Fund may invest, and therefore may have an incentive to allocate preferred investment opportunities to investment vehicles for which it is receiving a fee.
The value of the collateral must be at least 102% of the market value of the loaned securities that are denominated in U.S. dollars and 105% of the market value of the loaned securities that are not denominated in U.S. dollars. Loaned securities and related collateral are marked-to-market each business day based upon the market value of the loaned securities at the close of business, employing the most recent available pricing information. Collateral levels are then adjusted based on this mark-to-market evaluation. Additional required collateral, or excess collateral returned, is delivered on the next business day. Therefore, the value of the collateral held may be temporarily less than 102% or 105% value of the securities on loan. The cash collateral invested by the Adviser is disclosed in the Schedule of Investments (if applicable).
Income earned from the investment of the cash collateral, net of rebates paid to, or fees paid by, borrowers and less the fees paid to the lending agent are included as “Affiliated securities lending income, net” on the Statement of Operations.
There were no securities on loan as of June 30, 2023.
4. Investment Advisory Agreements and Other Transactions with Affiliates
The Fund pays the Adviser an investment advisory fee which is calculated daily and paid monthly. The Fund’s contractual investment advisory fee rate (expressed as an annual rate) is 0.44% of its average daily net assets.
The Adviser has contractually agreed to waive the investment advisory fee and/or reimburse operating expenses to the extent that the Fund’s total annual fund operating expenses, excluding the fees payable pursuant to a Rule 12b-1 plan, shareholder servicing fees, such as transfer agency fees (including out-of-pocket costs), administrative services fees and any networking/omnibus payable by any share class, brokerage commissions, interest, dividends, taxes, acquired fund fees and expenses, and extraordinary expenses, exceed the annual rate of 0.39% of the Fund’s average daily net assets. The Adviser shall reimburse or waive networking/omnibus fees and out-of-pocket transfer agency costs payable by any share class so that such fees, in the aggregate, do not exceed 0.06% of a share class' average daily net assets. The Adviser has agreed to continue the waivers for at least one-year commencing October 28, 2022. If applicable, amounts waived and/or reimbursed to the Fund by the Adviser are disclosed as “Excess Expense Reimbursement and Waivers” on the Statement of Operations.
The Adviser serves as administrator to the Fund pursuant to an administration agreement between the Adviser and the Trust. Under the administration agreement, the Adviser is authorized to perform, or cause others to perform certain administration, compliance, and accounting services to the Fund, including providing office space for the Fund, and is reimbursed by the Fund for certain of its costs in providing these services (to the extent the Adviser seeks reimbursement and such costs are not otherwise waived). In addition, employees of the Adviser and/or its affiliates may serve as officers of the Trust. The Fund pays for some or all of the salaries, fees, and expenses of the Adviser employees and Fund officers, with respect to certain specified administration functions they perform on behalf of the Fund. The Fund pays these costs based on out-of-pocket expenses incurred by the Adviser, and these costs are
Janus Henderson Short Duration Flexible Bond Fund
Notes to Financial Statements
separate and apart from advisory fees and other expenses paid in connection with the investment advisory services the Adviser (or any subadvisor, as applicable) provides to the Fund. These amounts are disclosed as “Affiliated fund administration fees” on the Statement of Operations. In addition, some expenses related to compensation payable to the Fund’s Chief Compliance Officer and certain compliance staff, all of whom are employees of the Adviser and/or its affiliates, are shared with the Fund. Total compensation of $343,237 was paid to the Chief Compliance Officer and certain compliance staff by the Trust during the year ended June 30, 2023. The Fund's portion is reported as part of “Other expenses” on the Statement of Operations.
Janus Henderson Services US LLC (the “Transfer Agent”), a wholly-owned subsidiary of the Adviser, is the Fund’s transfer agent. The Transfer Agent provides or arranges for the provision of shareholder services including, but not limited to, recordkeeping, subaccounting, answering inquiries regarding accounts, order processing, transaction confirmations, the mailing of prospectuses and shareholder reports, and other shareholder services provided to or on behalf of shareholders. These amounts are disclosed as “Transfer agent administrative fees and expenses” on the Statement of Operations.
Class D Shares of the Fund pay the Transfer Agent an annual administrative services fee based on the average daily net assets of Class D Shares as detailed below.
| | |
Average Daily Net Assets of Class D Shares of the Janus Henderson funds | Administrative Services Fee |
Under $40 billion | 0.12% |
$40 billion – $49.9 billion | 0.10% |
Over $49.9 billion | 0.08% |
During the reporting period, the administrative services fee rate was 0.12%.
The Transfer Agent receives an administrative services fee at an annual rate of up to 0.25% of the average daily net assets of the Fund’s Class S Shares and Class T Shares for providing or procuring administrative services to investors in Class S Shares and Class T Shares of the Fund. The Transfer Agent expects to use all or a significant portion of this fee to compensate retirement plan service providers, broker-dealers, bank trust departments, financial advisors, and other financial intermediaries for providing these services. The Transfer Agent may keep certain amounts retained for reimbursement of out-of-pocket costs incurred for servicing clients of Class S Shares and Class T Shares.
Shareholder Services provided by these financial intermediaries may include, but are not limited to, recordkeeping, subaccounting, order processing, providing order confirmations, periodic statements, forwarding prospectuses, shareholder reports, and other materials to existing customers, answering inquiries regarding accounts, and other administrative services. Order processing includes the submission of transactions through the National Securities Clearing Corporation (“NSCC”) or similar systems, or those processed on a manual basis with the Adviser. For all share classes, the Transfer Agent also seeks reimbursement for costs it incurs as transfer agent and for providing servicing.
Certain, but not all, intermediaries may charge administrative fees to investors in Class A Shares, Class C Shares, and Class I Shares for administrative services provided on behalf of such investors. These administrative fees are paid by the Class A Shares, Class C Shares, and Class I Shares of the Fund to the Transfer Agent, which uses such fees to reimburse intermediaries. Consistent with the Transfer Agency Agreement between the Transfer Agent and the Fund, the Transfer Agent may negotiate the level, structure, and/or terms of the administrative fees with intermediaries requiring such fees on behalf of the Fund. The Adviser and its affiliates benefit from an increase in assets that may result from such relationships. The Adviser has agreed to limit these fees up to 0.20% for Class A Shares and Class C Shares, and up to 0.15% for Class I Shares on an annual basis based on the daily net assets of each share class. Such limits are subject to change by the Trustees in the future. These amounts are disclosed as “Transfer agent networking and omnibus fees” on the Statement of Operations.
The Transfer Agent is not compensated for its services related to the shares, except for out-of-pocket costs, although the Transfer Agent is compensated for its services related to Fund’s Class D Shares. These amounts are disclosed as “Other transfer agent fees and expenses” on the Statement of Operations.
Under distribution and shareholder servicing plans (the “Plans”) adopted in accordance with Rule 12b-1 under the 1940 Act, the Fund pays the Trust’s distributor, the Distributor, a wholly-owned subsidiary of the Adviser, a fee for the sale and distribution and/or shareholder servicing of the shares based on the average daily net assets for each share class at an annual rate of up to 0.25% for Class A Shares, up to 1.00% for Class C Shares, and up to 0.25% for Class
Janus Henderson Short Duration Flexible Bond Fund
Notes to Financial Statements
S Shares. Under the terms of the Plans, the Trust is authorized to make payments to the Distributor for remittance to retirement plan service providers, broker-dealers, bank trust departments, financial advisors, and other financial intermediaries, as compensation for distribution and/or shareholder services performed by such entities for their customers who are investors in the Fund. These amounts are disclosed as “12b-1 Distribution and shareholder servicing fees” on the Statement of Operations.
Class A Shares include a 2.50% upfront sales charge of the offering price of the Fund. The sales charge is allocated between the Distributor and financial intermediaries. During the year ended June 30, 2023, the Distributor retained upfront sales charges of $2,545.
A contingent deferred sales charge (“CDSC”) of 1.00% will be deducted with respect to Class A Shares purchased without a sales load and redeemed within 12 months of purchase, unless waived. Any applicable CDSC will be 1.00% of the lesser of the original purchase price or the value of the redemption of the Class A Shares redeemed. During the year ended June 30, 2023, redeeming shareholders of Class A Shares paid CDSCs of $13,092 to the Distributor.
A CDSC of 1.00% will be deducted with respect to Class C Shares redeemed within 12 months of purchase, unless waived. Any applicable CDSC will be 1.00% of the lesser of the original purchase price or the value of the redemption of the Class C Shares redeemed. During the year ended June 30, 2023, redeeming shareholders of Class C Shares paid CDSCs of $3,798.
The Board of Trustees has adopted a deferred compensation plan (the “Deferred Plan”) for independent Trustees to elect to defer receipt of all or a portion of the annual compensation they are entitled to receive from the Fund. All deferred fees are credited to an account established in the name of the Trustees. The amounts credited to the account then increase or decrease, as the case may be, in accordance with the performance of one or more of the Janus Henderson funds that are selected by the Trustees. The account balance continues to fluctuate in accordance with the performance of the selected fund or funds until final payment of all amounts are credited to the account. The fluctuation of the account balance is recorded by the Fund as unrealized appreciation/(depreciation) and is included as of June 30, 2023 on the Statement of Assets and Liabilities in the asset, “Trustees’ deferred compensation,” and liability, “Trustees’ deferred compensation fees.” Additionally, the recorded unrealized appreciation/(depreciation) is included in “Total distributable earnings (loss)” on the Statement of Assets and Liabilities. Deferred compensation expenses for the year ended June 30, 2023 are included in “Trustees’ fees and expenses” on the Statement of Operations. Trustees are allowed to change their designation of mutual funds from time to time. Amounts will be deferred until distributed in accordance with the Deferred Plan. Deferred fees of $426,025 were paid by the Trust to the Trustees under the Deferred Plan during the year ended June 30, 2023.
Pursuant to the provisions of the 1940 Act and related rules, the Fund may participate in an affiliated or non-affiliated cash sweep program. In the cash sweep program, uninvested cash balances of the Fund may be used to purchase shares of affiliated or non-affiliated money market funds or cash management pooled investment vehicles that operate as money market funds. The Fund is eligible to participate in the cash sweep program (the “Investing Funds”). The Adviser has an inherent conflict of interest because of its fiduciary duties to the affiliated money market funds or cash management pooled investment vehicles and the Investing Funds. Janus Henderson Cash Liquidity Fund LLC (the “Sweep Vehicle”) is an affiliated unregistered cash management pooled investment vehicle that invests primarily in highly-rated short-term fixed-income securities. The Sweep Vehicle operates pursuant to the provisions of the 1940 Act that govern the operation of money market funds and prices its shares at NAV reflecting market-based values of its portfolio securities (i.e., a “floating” NAV) rounded to the fourth decimal place (e.g., $1.0000). The Sweep Vehicle is permitted to impose a liquidity fee (of up to 2%) on redemptions from the Sweep Vehicle or a redemption gate that temporarily suspends redemptions from the Sweep Vehicle for up to 10 business days during a 90 day period. There are no restrictions on the Fund's ability to withdraw investments from the Sweep Vehicle at will, and there are no unfunded capital commitments due from the Fund to the Sweep Vehicle. The Sweep Vehicle does not charge any management fee, sales charge or service fee.
Any purchases and sales, realized gains/losses and recorded dividends from affiliated investments during the year ended June 30, 2023 can be found in the “Schedules of Affiliated Investments” located in the Schedule of Investments.
Janus Henderson Short Duration Flexible Bond Fund
Notes to Financial Statements
As of June 30, 2023, shares of the Fund were owned by affiliates of the Adviser, and/or other funds advised by the Adviser, as indicated in the table below:
| | | | | | |
Class | % of Class Owned | | % of Fund Owned | | |
Class A Shares | - | % | - | % | |
Class C Shares | - | | - | | |
Class D Shares | - | | - | | |
Class I Shares | - | | - | | |
Class N Shares | 61 | | 2 | | |
Class S Shares | - | | - | | |
Class T Shares | - | | - | | |
| | | | | | |
The Fund is permitted to purchase or sell securities (“cross-trade”) between itself and other funds or accounts managed by the Adviser in accordance with Rule 17a-7 under the Investment Company Act of 1940 (“Rule 17a-7”), when the transaction is consistent with the investment objectives and policies of the Fund and in accordance with the Internal Cross Trade Procedures adopted by the Trust’s Board of Trustees. These procedures have been designed to ensure that any cross-trade of securities by the Fund from or to another fund or account that is or could be considered an affiliate of the Fund under certain limited circumstances by virtue of having a common investment adviser, common Officer, or common Trustee complies with Rule 17a-7. Under these procedures, each cross-trade is effected at the current market price to save costs where allowed. During the year ended June 30, 2023, the Fund engaged in cross trades amounting to $19,066,502 in sales, resulting in a net realized loss of $469,700. The net realized loss is included within the “Net Realized Gain/(Loss) on Investments” section of the Fund’s Statement of Operations.
5. Federal Income Tax
The tax components of capital shown in the table below represent: (1) distribution requirements the Fund must satisfy under the income tax regulations; (2) losses or deductions the Fund may be able to offset against income and gains realized in future years; and (3) unrealized appreciation or depreciation of investments for federal income tax purposes.
Other book to tax differences primarily consist of deferred compensation and derivatives. The Fund has elected to treat gains and losses on forward foreign currency contracts as capital gains and losses, if applicable. Other foreign currency gains and losses on debt instruments are treated as ordinary income for federal income tax purposes pursuant to Section 988 of the Internal Revenue Code.
| | | | | | | |
| | | | Other Book | Net Tax | |
Undistributed
Ordinary Income | Undistributed
Long-Term Gains | Accumulated
Capital Losses | Loss Deferrals | to Tax
Differences | Appreciation/
(Depreciation) | |
$ - | $ - | $ (81,132,049) | $ - | $ (21,023) | $(26,028,454) | |
Accumulated capital losses noted below represent net capital loss carryovers, as of June 30, 2023, that may be available to offset future realized capital gains and thereby reduce future taxable gains distributions. The following table shows these capital loss carryovers.
| | | | | | |
| | | | | |
Capital Loss Carryover Schedule | | |
For the year ended June 30, 2023 | | |
| No Expiration | | | |
| Short-Term | Long-Term | Accumulated
Capital Losses | | |
| $(46,371,791) | $(34,760,258) | $ (81,132,049) | | |
Janus Henderson Short Duration Flexible Bond Fund
Notes to Financial Statements
The aggregate cost of investments and the composition of unrealized appreciation and depreciation of investment securities for federal income tax purposes as of June 30, 2023 are noted below. The primary differences between book and tax appreciation or depreciation of investments are wash sale loss deferrals and investments in partnerships.
| | | | |
Federal Tax Cost | Unrealized
Appreciation | Unrealized
(Depreciation) | Net Tax Appreciation/
(Depreciation) |
$852,160,195 | $ 128,801 | $ (26,157,255) | $ (26,028,454) |
Information on the tax components of derivatives as of June 30, 2023 is as follows:
| | | | |
Federal Tax Cost | Unrealized
Appreciation | Unrealized
(Depreciation) | Net Tax Appreciation/
(Depreciation) |
$(4,816,229) | $ - | $ - | $ - |
Tax cost of investments and unrealized appreciation/(depreciation) may also include timing differences that do not constitute adjustments to tax basis.
Income and capital gains distributions are determined in accordance with income tax regulations that may differ from US GAAP. These differences are due to differing treatments for items such as net short-term gains, deferral of wash sale losses, and capital loss carryovers. Certain permanent differences such as tax returns of capital and net investment losses noted below have been reclassified to capital.
| | | | | |
For the year ended June 30, 2023 | |
Distributions | | |
From Ordinary Income | From Long-Term Capital Gains | Tax Return of Capital | Net Investment Loss | |
$ 26,849,298 | $ - | $ - | $ - | |
| | | | | |
For the year ended June 30, 2022 | |
Distributions | | |
From Ordinary Income | From Long-Term Capital Gains | Tax Return of Capital | Net Investment Loss | |
$ 16,152,241 | $ - | $ - | $ - | |
Permanent book to tax basis differences may result in reclassifications between the components of net assets. These differences have no impact on the results of operations or net assets.
Janus Henderson Short Duration Flexible Bond Fund
Notes to Financial Statements
6. Capital Share Transactions
| | | | | | | |
| | | | | | |
| | Year ended June 30, 2023 | | Year ended June 30, 2022 |
| | Shares | Amount | | Shares | Amount |
| | | | | | | |
Class A Shares: | | | | | |
Shares sold | 4,927,559 | $ 13,955,715 | | 6,103,315 | $ 18,445,802 |
Reinvested dividends and distributions | 451,629 | 1,279,551 | | 274,134 | 819,202 |
Shares repurchased | (12,302,306) | (34,916,391) | | (8,342,036) | (24,989,782) |
Net Increase/(Decrease) | (6,923,118) | $(19,681,125) | | (1,964,587) | $ (5,724,778) |
Class C Shares: | | | | | |
Shares sold | 2,781,745 | $ 7,842,642 | | 4,292,448 | $ 12,734,788 |
Reinvested dividends and distributions | 104,725 | 296,109 | | 34,482 | 102,292 |
Shares repurchased | (4,246,434) | (12,048,821) | | (6,063,009) | (18,022,285) |
Net Increase/(Decrease) | (1,359,964) | $ (3,910,070) | | (1,736,079) | $ (5,185,205) |
Class D Shares: | | | | | |
Shares sold | 4,940,410 | $ 14,021,646 | | 11,917,807 | $ 35,906,077 |
Reinvested dividends and distributions | 1,591,642 | 4,513,086 | | 905,441 | 2,710,465 |
Shares repurchased | (14,930,024) | (42,308,756) | | (19,658,291) | (58,974,700) |
Net Increase/(Decrease) | (8,397,972) | $(23,774,024) | | (6,835,043) | $ (20,358,158) |
Class I Shares: | | | | | |
Shares sold | 31,934,370 | $ 90,429,441 | | 73,919,598 | $224,736,454 |
Reinvested dividends and distributions | 4,069,555 | 11,528,791 | | 2,314,486 | 6,911,116 |
Shares repurchased | (60,224,738) | (170,582,178) | | (57,678,560) | (172,186,005) |
Net Increase/(Decrease) | (24,220,813) | $(68,623,946) | | 18,555,524 | $ 59,461,565 |
Class N Shares: | | | | | |
Shares sold | 4,787,805 | $ 13,543,586 | | 14,278,921 | $ 42,161,680 |
Reinvested dividends and distributions | 292,647 | 824,510 | | 156,160 | 462,994 |
Shares repurchased | (11,670,942) | (32,818,788) | | (3,713,697) | (11,056,370) |
Net Increase/(Decrease) | (6,590,490) | $(18,450,692) | | 10,721,384 | $ 31,568,304 |
Class S Shares: | | | | | |
Shares sold | 9,909 | $ 27,923 | | 8,311 | $ 25,440 |
Reinvested dividends and distributions | 3,513 | 9,940 | | 2,270 | 6,770 |
Shares repurchased | (7,824) | (22,200) | | (94,996) | (272,267) |
Net Increase/(Decrease) | 5,598 | $ 15,663 | | (84,415) | $ (240,057) |
Class T Shares: | | | | | |
Shares sold | 3,509,789 | $ 9,965,967 | | 6,699,468 | $ 20,273,024 |
Reinvested dividends and distributions | 2,604,951 | 7,386,314 | | 1,522,835 | 4,560,703 |
Shares repurchased | (27,082,150) | (76,732,186) | | (35,879,119) | (107,913,093) |
Net Increase/(Decrease) | (20,967,410) | $(59,379,905) | | (27,656,816) | $ (83,079,366) |
7. Purchases and Sales of Investment Securities
For the year ended June 30, 2023, the aggregate cost of purchases and proceeds from sales of investment securities (excluding any short-term securities, short-term options contracts, TBAs, and in-kind transactions, as applicable) was as follows:
| | | | |
Purchases of
Securities | Proceeds from Sales
of Securities | Purchases of Long-
Term U.S. Government
Obligations | Proceeds from Sales
of Long-Term U.S.
Government Obligations |
$ 272,700,055 | $ 664,150,832 | $ 779,678,749 | $ 585,288,417 |
8. Recent Accounting Pronouncements
The FASB issued Accounting Standards Update 2020-04 Reference Rate Reform: Facilitation of the Effects of Reference Rate Reform on Financial Reporting (“ASU 2020-04”) in March 2020. The new guidance in the ASU
Janus Henderson Short Duration Flexible Bond Fund
Notes to Financial Statements
provides optional temporary financial reporting relief from the effect of certain types of contract modifications due to the planned discontinuation of the LIBOR or other interbank-offered based reference rates as of the end of 2021. For new and existing contracts, Funds may elect to apply the guidance as of March 12, 2020 through December 31, 2022. FASB has deferred the sunset date to December 31, 2024. Management is currently evaluating the impact, if any, of the ASU’s adoption to the Fund’s financial statements.
9. Subsequent Event
Management has evaluated whether any events or transactions occurred subsequent to June 30, 2023 and through the date of issuance of the Fund’s financial statements and determined that there were no material events or transactions that would require recognition or disclosure in the Fund’s financial statements.
Janus Henderson Short Duration Flexible Bond Fund
Report of Independent Registered Public Accounting Firm
To the Board of Trustees of Janus Investment Fund and Shareholders of Janus Henderson Short Duration Flexible Bond Fund
Opinion on the Financial Statements
We have audited the accompanying statement of assets and liabilities, including the schedule of investments, of Janus Henderson Short Duration Flexible Bond Fund (one of the funds constituting Janus Investment Fund, referred to hereafter as the "Fund") as of June 30, 2023, the related statement of operations for the year ended June 30, 2023, the statements of changes in net assets for each of the two years in the period ended June 30, 2023, including the related notes, and the financial highlights for each of the five years in the period ended June 30, 2023 (collectively referred to as the “financial statements”). In our opinion, the financial statements present fairly, in all material respects, the financial position of the Fund as of June 30, 2023, the results of its operations for the year then ended, the changes in its net assets for each of the two years in the period ended June 30, 2023 and the financial highlights for each of the five years in the period ended June 30, 2023 in conformity with accounting principles generally accepted in the United States of America.
Basis for Opinion
These financial statements are the responsibility of the Fund’s management. Our responsibility is to express an opinion on the Fund’s financial statements based on our audits. We are a public accounting firm registered with the Public Company Accounting Oversight Board (United States) (PCAOB) and are required to be independent with respect to the Fund in accordance with the U.S. federal securities laws and the applicable rules and regulations of the Securities and Exchange Commission and the PCAOB.
We conducted our audits of these financial statements in accordance with the standards of the PCAOB. Those standards require that we plan and perform the audit to obtain reasonable assurance about whether the financial statements are free of material misstatement, whether due to error or fraud.
Our audits included performing procedures to assess the risks of material misstatement of the financial statements, whether due to error or fraud, and performing procedures that respond to those risks. Such procedures included examining, on a test basis, evidence regarding the amounts and disclosures in the financial statements. Our audits also included evaluating the accounting principles used and significant estimates made by management, as well as evaluating the overall presentation of the financial statements. Our procedures included confirmation of securities owned as of June 30, 2023 by correspondence with the custodian, transfer agent and brokers; when replies were not received from brokers, we performed other auditing procedures. We believe that our audits provide a reasonable basis for our opinion.

Denver, Colorado
August 21, 2023
We have served as the auditor of one or more investment companies in Janus Henderson Funds since 1990.
Janus Henderson Short Duration Flexible Bond Fund
Additional Information (unaudited)
Proxy Voting Policies and Voting Record
A description of the policies and procedures that the Fund uses to determine how to vote proxies relating to its portfolio securities is available without charge: (i) upon request, by calling 1-800-525-1093; (ii) on the Fund’s website at janushenderson.com/proxyvoting; and (iii) on the SEC’s website at http://www.sec.gov. Additionally, information regarding the Fund’s proxy voting record for the most recent twelve-month period ended June 30 is also available, free of charge, through janushenderson.com/proxyvoting and from the SEC’s website at http://www.sec.gov.
Full Holdings
The Fund files its complete portfolio holdings (schedule of investments) with the SEC as an exhibit to Form N-PORT within 60 days of the end of the first and third fiscal quarters, and in the annual report and semiannual report to shareholders. The Fund’s Form N-PORT filings and annual and semiannual reports: (i) are available on the SEC’s website at http://www.sec.gov; and (ii) are available without charge, upon request, by calling a Janus Henderson representative at 1-877-335-2687 (toll free) (or 1-800-525-3713 if you hold Class D shares). Portfolio holdings consisting of at least the names of the holdings are generally available on a monthly basis with a 30-day lag under Full Holdings for the Fund at janushenderson.com/info (or janushenderson.com/reports if you hold Class D Shares).
APPROVAL OF ADVISORY AGREEMENTS DURING THE PERIOD
The Trustees of Janus Aspen Series, each of whom serves as an “independent” Trustee (the “Trustees”), oversee the management of each portfolio of Janus Aspen Series (each, a “VIT Portfolio,” and collectively, the “VIT Portfolios”), as well as each fund of Janus Investment Fund (each, a “Fund,” and collectively, the “Funds” and together with the VIT Portfolios, the “Janus Henderson Funds,” and each, a “Janus Henderson Fund”). As required by law, the Trustees determine annually whether to continue the investment advisory agreement for each Janus Henderson Fund.
In connection with their most recent consideration of those agreements for each Janus Henderson Fund, the Trustees received and reviewed information provided by Janus Henderson Investors US LLC (the “Adviser”) in response to requests of the Trustees and their independent legal counsel. They also received and reviewed information and analysis provided by, and in response to requests of, their independent fee consultant. Throughout their consideration of the agreements, the Trustees were advised by their independent legal counsel. The Trustees met with management to consider the agreements, and also met separately in executive session with their independent legal counsel and their independent fee consultant.
At meetings held on November 9-10, 2022 and December 13-14, 2022, the Trustees evaluated the information provided by the Adviser and the independent fee consultant, as well as other information provided by the Adviser and the independent fee consultant during the year. Following such evaluation, the Trustees determined that the overall arrangements between each Janus Henderson Fund and the Adviser were fair and reasonable in light of the nature, extent, and quality of the services provided by the Adviser and its affiliates, the fees charged for those services, and other matters that the Trustees considered relevant in the exercise of their business judgment, and unanimously approved the continuation of the investment advisory agreement for each Janus Henderson Fund for the period from February 1, 2023 through February 1, 2024, subject to earlier termination as provided for in each agreement.
In considering the continuation of those agreements, the Trustees reviewed and analyzed various factors that they determined were relevant, including the factors described below, none of which by itself was considered dispositive. However, the material factors and conclusions that formed the basis for the Trustees’ determination to approve the continuation of the agreements are discussed separately below. Also included is a summary of the independent fee consultant’s conclusions and opinions that arose during, and were included as part of, the Trustees’ consideration of the agreements. “Management fees,” as used herein, reflect actual annual advisory fees and, for the purpose of peer comparisons any administration fees (excluding out of pocket costs), net of any waivers, paid by a fund as a percentage of average net assets.
Nature, Extent and Quality of Services
The Trustees reviewed the nature, extent, and quality of the services provided by the Adviser to the Janus Henderson Funds, taking into account the investment objective, strategies, and policies of each Janus Henderson Fund, and the knowledge the Trustees gained from their regular meetings with management on at least a quarterly basis and their ongoing review of information related to the Janus Henderson Funds. In addition, the Trustees reviewed the resources and key personnel of the Adviser, particularly noting those employees who provide investment and risk management services to the Janus Henderson Funds. The Trustees also considered other services provided to the Janus Henderson
Janus Henderson Short Duration Flexible Bond Fund
Additional Information (unaudited)
Funds by the Adviser, such as managing the execution of portfolio transactions and the selection of broker-dealers for those transactions. The Trustees considered the Adviser’s role as administrator to the Janus Henderson Funds, noting that the Adviser generally does not receive a fee for its services as administrator, but is reimbursed for its out-of-pocket costs. The Trustees considered the role of the Adviser in monitoring adherence to the Janus Henderson Funds’ investment restrictions, providing support services for the Trustees and Trustee committees, and overseeing communications with Janus Henderson Fund shareholders and the activities of other service providers, including monitoring compliance with various policies and procedures of the Janus Henderson Funds and with applicable securities laws and regulations.
In this regard, the independent fee consultant noted that the Adviser provides a number of different services for the Janus Henderson Funds and their shareholders, ranging from investment management services to various other servicing functions, and that, in its view, the Adviser is a capable provider of those services. The independent fee consultant also provided its belief that the Adviser has developed a number of institutional competitive advantages that should enable it to provide superior investment and service performance over the long term.
The Trustees concluded that the nature, extent, and quality of the services provided by the Adviser to each Janus Henderson Fund were appropriate and consistent with the terms of the respective advisory agreements, and that, taking into account steps taken to address those Janus Henderson Funds whose performance lagged that of their peers for certain periods, the Janus Henderson Funds were likely to benefit from the continued provision of those services. They also concluded that the Adviser had sufficient personnel, with the appropriate education and experience, to serve the Janus Henderson Funds effectively and had demonstrated its ability to attract well-qualified personnel.
Performance of the Funds
The Trustees considered the performance results of each Janus Henderson Fund over various time periods. They noted that they considered Janus Henderson Fund performance data throughout the year, including periodic meetings with each Janus Henderson Fund’s portfolio manager(s), and also reviewed information comparing each Janus Henderson Fund’s performance with the performance of comparable fund peer groups identified by Broadridge Financial Solutions, Inc. (“Broadridge”), an independent data provider, and with the Janus Henderson Fund’s benchmark index. In this regard, the independent fee consultant found that the overall Janus Henderson Funds’ performance has been reasonable, noting that: (i) for the 36 months ended May 31, 2022, approximately 38% of the Janus Henderson Funds were in the top two quartiles of their Broadridge peer groups; (ii) for the 36 months ended September 30, 2022, approximately 45% of the Janus Henderson Funds were in the top two quartiles of performance as reported by Morningstar, and (iii) for the 12 months ended September 30, 2022, approximately 55% of the Janus Henderson Funds were in the top two quartiles of performance as reported by Morningstar.
The Trustees considered the performance of each Janus Henderson Fund, noting that performance may vary by share class, and noted the following with respect to the Funds:
Asset Allocation Funds
· For Janus Henderson Global Allocation Fund – Conservative, the Trustees noted that the Fund’s performance was in the third Broadridge quartile for the 36 months ended May 31, 2022 and the bottom Broadridge quartile for the 12 months ended May 31, 2022. The Trustees noted the reasons for the Fund’s underperformance and the steps the Adviser had taken or was taking to improve performance.
· For Janus Henderson Global Allocation Fund – Growth, the Trustees noted that the Fund’s performance was in the bottom Broadridge quartile for the 36 months ended May 31, 2022 and the bottom Broadridge quartile for the 12 months ended May 31, 2022. The Trustees noted the reasons for the Fund’s underperformance and the steps the Adviser had taken or was taking to improve performance.
· For Janus Henderson Global Allocation Fund – Moderate, the Trustees noted that the Fund’s performance was in the bottom Broadridge quartile for the 36 months ended May 31, 2022 and the bottom Broadridge quartile for the 12 months ended May 31, 2022. The Trustees noted the reasons for the Fund’s underperformance and the steps the Adviser had taken or was taking to improve performance.
Fixed-Income Funds
· For Janus Henderson Absolute Return Income Opportunities Fund, the Trustees noted that the Fund’s performance was in the third Broadridge quartile for the 36 months ended May 31, 2022 and the first Broadridge
Janus Henderson Short Duration Flexible Bond Fund
Additional Information (unaudited)
quartile for the 12 months ended May 31, 2022. The Trustees noted the reasons for the Fund’s underperformance, the steps the Adviser had taken or was taking to improve performance, and that the performance trend was improving.
· For Janus Developed World Bond Fund, the Trustees noted that the Fund’s performance was in the bottom Broadridge quartile for the 36 months ended May 31, 2022 and the bottom Broadridge quartile for the 12 months ended May 31, 2022. The Trustees noted the reasons for the Fund’s underperformance and the steps the Adviser had taken or was taking to improve performance.
· For Janus Henderson Flexible Bond Fund, the Trustees noted that the Fund’s performance was in the first Broadridge quartile for the 36 months ended May 31, 2022 and the second Broadridge quartile for the 12 months ended May 31, 2022.
· For Janus Henderson Global Bond Fund, the Trustees noted that the Fund’s performance was in the third Broadridge quartile for the 36 months ended May 31, 2022 and the bottom Broadridge quartile for the 12 months ended May 31, 2022. The Trustees noted the reasons for the Fund’s underperformance and the steps the Adviser had taken or was taking to improve performance.
· For Janus Henderson High-Yield Fund, the Trustees noted that the Fund’s performance was in the third Broadridge quartile for the 36 months ended May 31, 2022 and the bottom Broadridge quartile for the 12 months ended May 31, 2022. The Trustees noted the reasons for the Fund’s underperformance and the steps the Adviser had taken or was taking to improve performance.
· For Janus Henderson Multi-Sector Income Fund, the Trustees noted that the Fund’s performance was in the second Broadridge quartile for the 36 months ended May 31, 2022 and the third Broadridge quartile for the 12 months ended May 31, 2022.
· For Janus Henderson Short Duration Flexible Bond Fund, the Trustees noted that the Fund’s performance was in the third Broadridge quartile for the 36 months ended May 31, 2022 and the bottom Broadridge quartile for the 12 months ended May 31, 2022. The Trustees noted the reasons for the Fund’s underperformance and the steps the Adviser had taken or was taking to improve performance.
Global and International Equity Funds
· For Janus Henderson Asia Equity Fund, the Trustees noted that the Fund’s performance was in the third Broadridge quartile for the 36 months ended May 31, 2022 and the third Broadridge quartile for the 12 months ended May 31, 2022. The Trustees noted the reasons for the Fund’s underperformance, while also noting that the Fund has a performance fee structure that results in lower management fees during periods of underperformance, and the steps the Adviser had taken or was taking to improve performance.
· For Janus Henderson Emerging Markets Fund, the Trustees noted that the Fund’s performance was in the third Broadridge quartile for the 36 months ended May 31, 2022 and the third Broadridge quartile for the 12 months ended May 31, 2022. The Trustees noted the reasons for the Fund’s underperformance and the steps the Adviser had taken or was taking to improve performance.
· For Janus Henderson European Focus Fund, the Trustees noted that the Fund’s performance was in the first Broadridge quartile for the 36 months ended May 31, 2022 and the second Broadridge quartile for the 12 months ended May 31, 2022.
· For Janus Henderson Global Equity Income Fund, the Trustees noted that the Fund’s performance was in the third Broadridge quartile for the 36 months ended May 31, 2022 and the first Broadridge quartile for the 12 months ended May 31, 2022. The Trustees noted the reasons for the Fund’s underperformance, the steps the Adviser had taken or was taking to improve performance, and that the performance trend was improving.
· For Janus Henderson Global Life Sciences Fund, the Trustees noted that the Fund’s performance was in the third Broadridge quartile for the 36 months ended May 31, 2022 and the second Broadridge quartile for the 12 months ended May 31, 2022. The Trustees noted the reasons for the Fund’s underperformance, the steps the Adviser had taken or was taking to improve performance, and that the performance trend was improving.
Janus Henderson Short Duration Flexible Bond Fund
Additional Information (unaudited)
· For Janus Henderson Global Sustainable Equity Fund, the Trustees noted that the Fund’s performance was in the second Broadridge quartile for the 12 months ended May 31, 2022. The Trustees noted that 36 month-end performance was not yet available.
· For Janus Henderson Global Real Estate Fund, the Trustees noted that the Fund’s performance was in the second Broadridge quartile for the 36 months ended May 31, 2022 and the bottom Broadridge quartile for the 12 months ended May 31, 2022.
· For Janus Henderson Global Research Fund, the Trustees noted that the Fund’s performance was in the second Broadridge quartile for the 36 months ended May 31, 2022 and the first Broadridge quartile for the 12 months ended May 31, 2022.
· For Janus Henderson Global Select Fund, the Trustees noted that the Fund’s performance was in the first Broadridge quartile for the 36 months ended May 31, 2022 and the first Broadridge quartile for the 12 months ended May 31, 2022.
· For Janus Henderson Global Technology and Innovation Fund, the Trustees noted that the Fund’s performance was in the second Broadridge quartile for the 36 months ended May 31, 2022 and the second Broadridge quartile for the 12 months ended May 31, 2022.
· For Janus Henderson International Opportunities Fund, the Trustees noted that the Fund’s performance was in the bottom Broadridge quartile for the 36 months ended May 31, 2022 and the third Broadridge quartile for the 12 months ended May 31, 2022. The Trustees noted the reasons for the Fund’s underperformance and the steps the Adviser had taken or was taking to improve performance.
· For Janus Henderson Overseas Fund, the Trustees noted that the Fund’s performance was in the first Broadridge quartile for the 36 months ended May 31, 2022 and the first Broadridge quartile for the 12 months ended May 31, 2022.
· For Janus Henderson Responsible International Dividend Fund (formerly the Janus Henderson Dividend & Income Builder Fund), the Trustees noted that the Fund’s performance was in the bottom Broadridge quartile for the 36 months ended May 31, 2022 and the bottom Broadridge quartile for the 12 months ended May 31, 2022. The Trustees noted the reasons for the Fund’s underperformance and the steps the Adviser had taken or was taking to improve performance.
Money Market Funds
· For Janus Henderson Government Money Market Fund, the Trustees noted that the Fund’s performance was in the third Broadridge quartile for the 36 months ended May 31, 2022 and the bottom Broadridge quartile for the 12 months ended May 31, 2022. The Trustees noted the reasons for the Fund’s underperformance and the steps the Adviser had taken or was taking to improve performance.
· For Janus Henderson Money Market Fund, the Trustees noted that the Fund’s performance was in the third Broadridge quartile for the 36 months ended May 31, 2022 and the bottom Broadridge quartile for the 12 months ended May 31, 2022. The Trustees noted the reasons for the Fund’s underperformance and the steps the Adviser had taken or was taking to improve performance.
Multi-Asset Funds
· For Janus Henderson Adaptive Global Allocation Fund, the Trustees noted that the Fund’s performance was in bottom Broadridge quartile for the 36 months ended May 31, 2022 and the second Broadridge quartile for the 12 months ended May 31, 2022. The Trustees noted the reasons for the Fund’s underperformance, the steps the Adviser had taken or was taking to improve performance, and that the performance trend was improving.
· For Janus Henderson Balanced Fund, the Trustees noted that the Fund’s performance was in the first Broadridge quartile for the 36 months ended May 31, 2022 and the first Broadridge quartile for the 12 months ended May 31, 2022.
Janus Henderson Short Duration Flexible Bond Fund
Additional Information (unaudited)
U.S. Equity Funds
· For Janus Henderson Adaptive Risk Managed U.S. Equity Fund, the Trustees noted that the Fund’s performance was in the bottom Broadridge quartile for the 36 months ended May 31, 2022 and the second Broadridge quartile for the 12 months ended May 31, 2022. The Trustees noted the reasons for the Fund’s underperformance, the steps the Adviser had taken or were taking to improve performance, and that the performance trend was improving.
· For Janus Henderson Contrarian Fund, the Trustees noted that the Fund’s performance was in the first Broadridge quartile for the 36 months ended May 31, 2022 and the bottom Broadridge quartile for the 12 months ended May 31, 2022.
· For Janus Henderson Enterprise Fund, the Trustees noted that the Fund’s performance was in the second Broadridge quartile for the 36 months ended May 31, 2022 and the first Broadridge quartile for the 12 months ended May 31, 2022.
· For Janus Henderson Forty Fund, the Trustees noted that the Fund’s performance was in the third Broadridge quartile for the 36 months ended May 31, 2022 and the bottom Broadridge quartile for the 12 months ended May 31, 2022. The Trustees noted the reasons for the Fund’s underperformance and the steps the Adviser had taken or was taking to improve performance.
· For Janus Henderson Growth and Income Fund, the Trustees noted that the Fund’s performance was in the bottom Broadridge quartile for the 36 months ended May 31, 2022 and the first Broadridge quartile for the 12 months ended May 31, 2022. The Trustees noted the reasons for the Fund’s underperformance, the steps the Adviser had taken or was taking to improve performance, and that the performance trend was improving.
· For Janus Henderson Mid Cap Value Fund, the Trustees noted that the Fund’s performance was in the bottom Broadridge quartile for the 36 months ended May 31, 2022 and the second Broadridge quartile for the 12 months ended May 31, 2022. The Trustees noted the reasons for the Fund’s underperformance, while also noting that the Fund has a performance fee structure that results in lower management fees during periods of underperformance, the steps the Adviser had taken or was taking to improve performance, and that the performance trend was improving.
· For Janus Henderson Research Fund, the Trustees noted that the Fund’s performance was in the third Broadridge quartile for the 36 months ended May 31, 2022 and the third Broadridge quartile for the 12 months ended May 31, 2022. The Trustees noted the reasons for the Fund’s underperformance, while also noting that the Fund has a performance fee structure that results in lower management fees during periods of underperformance and the steps the Adviser had taken or was taking to improve performance.
· For Janus Henderson Small Cap Value Fund, the Trustees noted that the Fund’s performance was in the bottom Broadridge quartile for the 36 months ended May 31, 2022 and the second Broadridge quartile for the 12 months ended May 31, 2022. The Trustees noted the reasons for the Fund’s underperformance, while also noting that the Fund has a performance fee structure that results in lower management fees during periods of underperformance, the steps the Adviser had taken or was taking to improve performance, and that the performance trend was improving.
· For Janus Henderson Small-Mid Cap Value Fund, the Trustees noted that the Fund’s performance was in the bottom Broadridge quartile for the 36 months ended May 31, 2022 and the second Broadridge quartile for the 12 months ended May 31, 2022. The Trustees noted the reasons for the Fund’s underperformance, while also noting that the Fund has a performance fee structure that results in lower management fees during periods of underperformance, the steps the Adviser had taken or was taking to improve performance, and that the performance trend is improving.
· For Janus Henderson Triton Fund, the Trustees noted that the Fund’s performance was in the bottom Broadridge quartile for the 36 months ended May 31, 2022 and the second Broadridge quartile for the 12 months ended May 31, 2022. The Trustees noted the reasons for the Fund’s underperformance, the steps the Adviser had taken or was taking to improve performance, and that the performance trend was improving.
· For Janus Henderson Venture Fund, the Trustees noted that the Fund’s performance was in the bottom Broadridge quartile for the 36 months ended May 31, 2022 and the second Broadridge quartile for the 12 months ended May
Janus Henderson Short Duration Flexible Bond Fund
Additional Information (unaudited)
31, 2022. The Trustees noted the reasons for the Fund’s underperformance, the steps the Adviser had taken or was taking to improve performance, and that the performance trend was improving.
In consideration of each Janus Henderson Fund’s performance, the Trustees concluded that, taking into account the factors relevant to performance, as well as other considerations, including steps taken to improve performance, as applicable, the Janus Henderson Fund’s performance warranted continuation of such Janus Henderson Fund’s investment advisory agreement.
Costs of Services Provided
The Trustees examined information regarding the fees and expenses of each Janus Henderson Fund in comparison to similar information for other comparable funds as provided by Broadridge, an independent data provider. They also reviewed an analysis of that information provided by their independent fee consultant. The independent fee consultant provided its belief that the management fees charged by the Adviser to each of the Janus Henderson Funds under the current investment advisory and administration agreements are reasonable in relation to the services provided by the Adviser. The independent fee consultant found: (1) the total expenses and management fees of the Janus Henderson Funds to be reasonable relative to other comparable mutual funds; (2) the total expenses, on average, were 6% under the average total expenses of the respective Broadridge peer group; and (3) the management fees for the Janus Henderson Funds, on average, were 5% under the average management fees for the respective Broadridge peer group. The Trustees also considered the total expenses for each share class of each Janus Henderson Fund compared to the average total expenses for its Broadridge Expense Group and to average total expenses for its Broadridge Expense Universe.
For Janus Henderson Funds with three or more years of performance history, the independent fee consultant also performed a systematic “focus list” analysis of expenses which assessed fund fees in the context of fund performance being delivered. Based on this analysis, the independent fee consultant found that the combination of service quality/performance and expenses on these individual Janus Henderson Funds was reasonable in light of performance trends, performance histories, changes in portfolio management, relative average net asset levels, and the existence of performance fees, breakpoints, and/or expense waivers on such Janus Henderson Funds.
The Trustees considered the methodology used by the Adviser in determining compensation payable to portfolio managers, the competitive environment for investment management talent, and the competitive market for mutual funds in different distribution channels.
The Trustees also reviewed management fees charged by the Adviser to comparable separate account clients and to comparable non-affiliated funds subadvised by the Adviser (for which the Adviser provides only or primarily portfolio management services). Although in most instances subadvisory and separate account fee rates for various investment strategies were lower than management fee rates for Janus Henderson Funds having a similar strategy, the Trustees considered that the Adviser noted that, under the terms of the management agreements with the Janus Henderson Funds, the Adviser performs significant additional services for the Janus Henderson Funds that it does not provide to those other clients, including administration services, oversight of the Janus Henderson Funds’ other service providers, Trustee support, regulatory compliance and numerous other services, and that, in serving the Janus Henderson Funds, the Adviser assumes many legal risks and other costs that it does not assume in servicing its other clients. Moreover, the Trustees noted that the independent fee consultant found that: (1) the management fees the Adviser charges to the Janus Henderson Funds are reasonable in relation to the management fees the Adviser charges to funds subadvised by the Adviser and to the fees the Adviser charges to its institutional separate account clients; (2) these subadvised and institutional separate accounts have different service and infrastructure needs and operate in markets very different from the retail fund market; (3) Janus Henderson mutual fund investors enjoy reasonable fees relative to the fees charged in these other markets; and (4) as part of its 2022 review, 9 of 11 Janus Henderson Funds have lower management fees than similar funds subadvised by the Adviser. The Trustees noted that for the two Janus Henderson Funds that did not, management fees for each were under the average of its 15(c) peer group.
The Trustees considered the fees for each Janus Henderson Fund for its fiscal year ended in 2021 and noted the following with regard to each Janus Henderson Fund’s total expenses, net of applicable fee waivers (the Fund’s “total expenses”) as reflected in the comparative information provided by Broadridge:
Janus Henderson Short Duration Flexible Bond Fund
Additional Information (unaudited)
Asset Allocation Funds
· For Janus Henderson Global Allocation Fund – Conservative, the Trustees noted that, although the Fund’s total expenses exceeded the peer group average for certain share classes, overall the Fund’s total expenses were reasonable. The Trustees also noted that the Adviser has contractually agreed to limit the Fund’s expenses.
· For Janus Henderson Global Allocation Fund – Growth, the Trustees noted that, although the Fund’s total expenses exceeded the peer group average for certain share classes, overall the Fund’s total expenses were reasonable. The Trustees also noted that the Adviser has contractually agreed to limit the Fund’s expenses, although this limit did not apply because the Fund’s total expenses as shown were below the applicable fee limit.
· For Janus Henderson Global Allocation Fund – Moderate, the Trustees noted that, although the Fund’s total expenses exceeded the peer group average for one share class, overall the Fund’s total expenses were reasonable. The Trustees also noted that the Adviser has contractually agreed to limit the Fund’s expenses.
Fixed-Income Funds
· For Janus Henderson Absolute Return Income Opportunities Fund, the Trustees noted that, although the Fund’s total expenses exceeded the peer group average for certain share classes, overall the Fund’s total expenses were reasonable. The Trustees also noted that the Adviser has contractually agreed to limit the Fund’s expenses.
· For Janus Henderson Developed World Bond Fund, the Trustees noted that, although the Fund’s total expenses exceeded the peer group average for one share class, overall the Fund’s total expenses were reasonable. The Trustees also noted that the Adviser has contractually agreed to limit the Fund’s expenses.
· For Janus Henderson Flexible Bond Fund, the Trustees noted that, although the Fund’s total expenses exceeded the peer group average for certain share classes, overall the Fund’s total expenses were reasonable. The Trustees also noted that the Adviser has contractually agreed to limit the Fund’s expenses, although this limit did not apply because the Fund’s total expenses as shown were below the applicable fee limit.
· For Janus Henderson Global Bond Fund, the Trustees noted that, although the Fund’s total expenses exceeded the peer group average for certain share classes, overall the Fund’s total expenses were reasonable. The Trustees also noted that the Adviser has contractually agreed to limit the Fund’s expenses.
· For Janus Henderson High-Yield Fund, the Trustees noted that, although the Fund’s total expenses exceeded the peer group average for certain share classes, overall the Fund’s total expenses were reasonable. The Trustees also noted that the Adviser has contractually agreed to limit the Fund’s expenses.
· For Janus Henderson Multi-Sector Income Fund, the Trustees noted that, although the Fund’s total expenses exceeded the peer group average for certain share classes, overall the Fund’s total expenses were reasonable. The Trustees also noted that the Adviser has contractually agreed to limit the Fund’s expenses.
· For Janus Henderson Short Duration Flexible Bond Fund, the Trustees noted that, although the Fund’s total expenses exceeded the peer group average for certain share classes, overall the Fund’s total expenses were reasonable. The Trustees also noted that the Adviser has contractually agreed to limit the Fund’s expenses.
Global and International Equity Funds
· For Janus Henderson Asia Equity Fund, the Trustees noted that, although the Fund’s total expenses exceeded the peer group average for certain share classes, overall the Fund’s total expenses were reasonable. The Trustees also noted that the Adviser has contractually agreed to limit the Fund’s expenses.
· For Janus Henderson Emerging Markets Fund, the Trustees noted that, although the Fund’s total expenses exceeded the peer group average for certain share classes, overall the Fund’s total expenses were reasonable. The Trustees also noted that the Adviser has contractually agreed to limit the Fund’s expenses.
· For Janus Henderson European Focus Fund, the Trustees noted that, although the Fund’s total expenses exceeded the peer group average for one share class, overall the Fund’s expenses were reasonable. The Trustees also noted that the Adviser has contractually agreed to limit the Fund’s expenses.
· For Janus Henderson Global Equity Income Fund, the Trustees noted that, although the Fund’s total expenses exceeded the peer group average for one share class, overall the Fund’s total expenses were reasonable. The
Janus Henderson Short Duration Flexible Bond Fund
Additional Information (unaudited)
Trustees also noted that the Adviser has contractually agreed to limit the Fund’s expenses, although this limit did not apply because the Fund’s total expenses as shown were below the applicable fee limit.
· For Janus Henderson Global Life Sciences Fund, the Trustees noted that the Fund’s total expenses were below the peer group average for all share classes.
· For Janus Henderson Global Real Estate Fund, the Trustees noted that, although the Fund’s total expenses exceeded the peer group average for certain share classes, overall the Fund’s total expenses were reasonable. The Trustees also noted that the Adviser has contractually agreed to limit the Fund’s expenses, although this limit did not apply because the Fund’s total expenses as shown were below the applicable fee limit.
· For Janus Henderson Global Research Fund, the Trustees noted that, although the Fund’s total expenses exceeded the peer group average for one share class, overall the Fund’s total expenses were reasonable. The Trustees also noted that the Adviser has contractually agreed to limit the Fund’s expenses, although this limit did not apply because the Fund’s total expenses as shown were below the applicable fee limit.
· For Janus Henderson Global Select Fund, the Trustees noted that, although the Fund’s total expenses exceeded the peer group average for certain share classes, overall the Fund’s total expenses were reasonable. The Trustees also noted that the Adviser has contractually agreed to limit the Fund’s expenses.
· For Janus Henderson Global Sustainable Equity Fund, the Trustees noted that, although the Fund’s total expenses exceeded the peer group average for certain share classes, overall the Fund’s expenses were reasonable. The Trustees also noted that the Adviser has contractually agreed to limit the Fund’s expenses.
· For Janus Henderson Global Technology and Innovation Fund, the Trustees noted that the Fund’s total expenses were below the peer group average for all share classes.
· For Janus Henderson International Opportunities Fund, the Trustees noted that, although the Fund’s total expenses exceeded the peer group average for certain share classes, overall the Fund’s expenses were reasonable. The Trustees also noted that the Adviser has contractually agreed to limit the Fund’s expenses.
· For Janus Henderson Overseas Fund, the Trustees noted that although the Fund’s total expenses exceeded the peer group average for certain share classes, overall the Fund’s total expenses were reasonable. The Trustees also noted that the Adviser has contractually agreed to limit the Fund’s expenses, although this limit did not apply because the Fund’s total expenses as shown were below the applicable fee limit.
· For Janus Henderson Responsible International Dividend Fund (formerly the Janus Henderson Dividend & Income Builder Fund), the Trustees noted that, although the Fund’s total expenses exceeded the peer group for one share class, overall the Fund’s total expenses were reasonable. The Trustees also noted that the Adviser has contractually agreed to limit the Fund’s expenses.
Money Market Funds
· For Janus Henderson Government Money Market Fund, the Trustees noted that the Fund’s total expenses were below the peer group average for all share classes.
· For Janus Henderson Money Market Fund, the Trustees noted that the Fund’s total expenses were below the peer group average for all share classes.
Multi-Asset Funds
· For Janus Henderson Adaptive Global Allocation Fund, the Trustees noted that the Fund’s total expenses were below the peer group average for all share classes.
· For Janus Henderson Balanced Fund, the Trustees noted that, although the Fund’s total expenses exceeded the peer group average for certain share classes, overall the Fund’s total expenses were reasonable. The Trustees also noted that the Adviser has contractually agreed to limit the Fund’s expenses, although this limit did not apply because the Fund’s total expenses as shown were below the applicable fee limit.
Janus Henderson Short Duration Flexible Bond Fund
Additional Information (unaudited)
U.S. Equity Funds
· For Janus Henderson Adaptive Risk Managed U.S. Equity Fund, the Trustees noted that, although the Fund’s total expenses exceeded the peer group average for certain share classes, overall the Fund’s total expenses were reasonable. The Trustees also noted that the Adviser has contractually agreed to limit the Fund’s expenses, although this limit did not apply because the Fund’s total expenses as shown were below the applicable fee limit.
· For Janus Henderson Contrarian Fund, the Trustees noted that, although the Fund’s total expenses exceeded the peer group average for all share classes, overall the Fund’s total expenses were reasonable. The Trustees also noted that the Adviser had contractually agreed to limit the Fund’s expenses.
· For Janus Henderson Enterprise Fund, the Trustees noted that, although the Fund’s total expenses exceeded the peer group average for certain share classes, overall the Fund’s total expenses were reasonable. The Trustees also noted that the Adviser has contractually agreed to limit the Fund’s expenses, although this limit did not apply because the Fund’s total expenses as shown were below the applicable fee limit.
· For Janus Henderson Forty Fund, the Trustees noted that, although the Fund’s total expenses exceeded the peer group average for certain share classes, overall the Fund’s total expenses were reasonable. The Trustees also noted that the Adviser has contractually agreed to limit the Fund’s expenses, although this limit did not apply because the Fund’s total expenses as shown were below the applicable fee limit.
· For Janus Henderson Growth and Income Fund, the Trustees noted that, although the Fund’s total expenses exceeded the peer group average for certain share classes, overall the Fund’s total expenses were reasonable. The Trustees also noted that the Adviser has contractually agreed to limit the Fund’s expenses, although this limit did not apply because the Fund’s total expenses as shown were below the applicable fee limit.
· For Janus Henderson Mid Cap Value Fund, the Trustees noted that the Fund’s total expenses were below the peer group average for all share classes.
· For Janus Henderson Research Fund, the Trustees noted that, although the Fund’s total expenses exceeded the peer group average for certain share classes, overall the Fund’s total expenses were reasonable. The Trustees also noted that the Adviser has contractually agreed to limit the Fund’s expenses.
· For Janus Henderson Small Cap Value Fund, the Trustees noted that, although the Fund’s total expenses exceeded the peer group average for one share class, overall the Fund’s total expenses were reasonable. The Trustees also noted that the Adviser has contractually agreed to limit the Fund’s expenses, although this limit did not apply because the Fund’s total expenses as shown were below the applicable fee limit.
· For Janus Henderson Small-Mid Cap Value Fund, the Trustees noted that the Fund’s total expenses were below the peer group average for all share classes.
· For Janus Henderson Triton Fund, the Trustees noted that, although the Fund’s total expenses exceeded the peer group average for one share class, overall the Fund’s total expenses were reasonable. The Trustees also noted that the Adviser has contractually agreed to limit the Fund’s expenses, although this limit did not apply because the Fund’s total expenses as shown were below the applicable fee limit.
· For Janus Henderson Venture Fund, the Trustees noted that although the Fund’s total expenses exceeded the peer group average for one share class, overall the Fund’s total expenses were reasonable. The Trustees also noted that the Adviser has contractually agreed to limit the Fund’s expenses, although this limit did not apply because the Fund’s total expenses as shown were below the applicable fee limit.
The Trustees reviewed information on the overall profitability to the Adviser and its affiliates from their relationships with the Janus Henderson Funds, and considered profitability data of other publicly traded mutual fund advisers. The Trustees recognized that profitability comparisons among fund managers are difficult because of the variation in the type of comparative information that is publicly available, and the profitability of any fund manager is affected by numerous factors, including the organizational structure of the particular fund manager, differences in complex size, difference in product mix, difference in types of business (mutual fund, institutional and other), differences in the types of funds and other accounts it manages, possible other lines of business, the methodology for allocating expenses and the fund manager’s capital structure and cost of capital.
Janus Henderson Short Duration Flexible Bond Fund
Additional Information (unaudited)
Additionally, the Trustees considered the estimated profitability to the Adviser from the investment management services it provided to each Janus Henderson Fund. In their review, the Trustees considered whether the Adviser receive adequate incentives and resources to manage the Janus Henderson Funds effectively. In reviewing profitability, the Trustees noted that the estimated profitability for an individual Janus Henderson Fund is necessarily a product of the allocation methodology utilized by the Adviser to allocate its expenses as part of the estimated profitability calculation. In this regard, the Trustees noted that the independent fee consultant found as part of its 2022 review that (1) the expense allocation methodology and rationales utilized by the Adviser were reasonable and (2) no clear correlation exists between expense allocations and operating margins. The Trustees also considered that the estimated profitability for an individual Janus Henderson Fund was influenced by a number of factors, including not only the allocation methodology selected, but also the presence of fee waivers and expense caps, and whether the Janus Henderson Fund’s investment management agreement contained breakpoints or a performance fee component. The Trustees determined, after taking into account these factors, among others, that the Adviser’s estimated profitability with respect to each Janus Henderson Fund was not unreasonable in relation to the services provided, and that the variation in the range of such estimated profitability among the Janus Henderson Funds was not a material factor in the Board’s approval of the reasonableness of any Janus Henderson Fund’s investment management fees.
The Trustees concluded that the management fees payable by each Janus Henderson Fund to the Adviser were reasonable in relation to the nature, extent, and quality of the services provided, taking into account the fees charged by other advisers for managing comparable mutual funds with similar strategies, the fees the Adviser charges to other clients, and, as applicable, the impact of fund performance on management fees payable by the Janus Henderson Funds. The Trustees also concluded that each Janus Henderson Fund’s total expenses were reasonable, taking into account the size of the Janus Henderson Fund, the quality of services provided by the Adviser, the investment performance of the Janus Henderson Fund, and any expense limitations agreed to or provided by the Adviser.
Economies of Scale
The Trustees considered information about the potential for the Adviser to realize economies of scale as the assets of the Janus Henderson Funds increase. They noted that their independent fee consultant published a report to the Trustees in June 2022 which provided its research and analysis into economies of scale. They also noted that, although many Janus Henderson Funds pay advisory fees at a fixed base rate as a percentage of net assets, without any breakpoints or performance fees, their independent fee consultant concluded that 75% of these Janus Henderson Funds’ have contractual management fees (gross of waivers) below their Broadridge Expense Group averages. The Trustees also noted the following from the independent fee consultant’s report: (1) that 31% of Janus Henderson Funds had management fee breakpoints in place whereby investors pay lower management fees as fund AUM increases; (2) that 29% of Janus Henderson Funds have low flat-rate fees and performance fees where the Adviser is incentivized to invest in resources which drive Janus Henderson Fund performance; and (3) that 39% of Janus Henderson Funds have low flat-rate fees versus peers where investors pay low fixed fees when the Janus Henderson Fund is small/midsized and higher fees when the Janus Henderson Fund grows in assets. The Trustees also noted that the Janus Henderson Funds share directly in economies of scale through the significant investments made by the Adviser and its affiliates related to services provided to the Funds and the lower charges of third-party service providers that are based in part on the combined scale of all of the Janus Henderson Funds.
The Trustees also considered the independent fee consultant’s conclusion that, given the limitations of various analytical approaches to economies of scale and their conflicting results, it is difficult to analytically confirm or deny the existence of economies of scale in the Janus Henderson complex. In this regard, the independent consultant concluded that (1) to the extent there were economies of scale at the Adviser, the Adviser’s general strategy of setting fixed management fees below peers appeared to share any such economies with investors even on smaller Janus Henderson Funds which have not yet achieved those economies and (2) by setting lower fixed fees from the start on these Janus Henderson Funds, the Adviser appeared to be investing to increase the likelihood that these Janus Henderson Funds will grow to a level to achieve any economies of scale that may exist. Further, the independent fee consultant provided its belief that Janus Henderson Fund investors are well-served by the fee levels and performance fee structures in place on the Janus Henderson Funds in light of any economies of scale that may be present at the Adviser.
Based on all of the information reviewed, including the recent and past research and analysis conducted by the Trustees’ independent fee consultant, the Trustees concluded that the current fee structure of each Janus Henderson Fund was reasonable and that the current rates of fees do reflect a sharing between the Adviser and the Janus
Janus Henderson Short Duration Flexible Bond Fund
Additional Information (unaudited)
Henderson Fund of any economies of scale that may be present at the current asset level of the Janus Henderson Fund.
Other Benefits to the Adviser
The Trustees also considered benefits that accrue to the Adviser and its affiliates from their relationships with the Janus Henderson Funds. They recognized that two affiliates of the Adviser separately serve the Janus Henderson Funds as transfer agent and distributor, respectively, and the transfer agent receives compensation directly from the non-money market Janus Henderson Funds for services provided, and that such compensation contributes to the overall profitability of the Adviser and its affiliates that results from their relationship with the Janus Henderson Funds. The Trustees also considered the Adviser’s past and proposed use of commissions paid by the Janus Henderson Funds on portfolio brokerage transactions to obtain proprietary and third-party research products and services benefiting the Janus Henderson Fund and/or other clients of the Adviser and/or the Adviser. The Trustees concluded that the Adviser’s use of these types of client commission arrangements to obtain proprietary and third-party research products and services was consistent with regulatory requirements and guidelines and was likely to benefit each Janus Henderson Fund. The Trustees also concluded that, other than the services provided by the Adviser and its affiliates pursuant to the agreements and the fees to be paid by each Janus Henderson Fund therefor, the Janus Henderson Funds and the Adviser may potentially benefit from their relationship with each other in other ways. They concluded that the Adviser and its affiliates share directly in economies of scale through the lower charges of third-party service providers that are based in part on the combined scale of the Janus Henderson Funds and other clients serviced by the Adviser and its affiliates. They also concluded that the Adviser benefits from the receipt of research products and services acquired through commissions paid on portfolio transactions of the Janus Henderson Funds and that the Janus Henderson Funds benefit from the Adviser’s receipt of those products and services as well as research products and services acquired through commissions paid by other clients of the Adviser. They further concluded that the success of any Janus Henderson Fund could attract other business to the Adviser or other Janus Henderson Funds, and that the success of the Adviser could enhance the Adviser’s ability to serve the Janus Henderson Funds.
Janus Henderson Short Duration Flexible Bond Fund
Liquidity Risk Management Program (unaudited)
Liquidity Risk Management Program
Rule 22e-4 under the Investment Company Act of 1940, as amended (the “Liquidity Rule”), requires open-end funds (but not money market funds) to adopt and implement a written liquidity risk management program (the “LRMP”) that is reasonably designed to assess and manage liquidity risk, which is the risk that a fund could not meet redemption requests without significant dilution of remaining investors’ interest in the fund. The Fund has implemented a LRMP, which incorporates the following elements: (i) assessment, management, and periodic review of liquidity risk; (ii) classification of portfolio holdings; (iii) the establishment and monitoring of a highly liquid investment minimum, as applicable; (iv) a 15% limitation on a Fund’s illiquid investments; (v) redemptions in-kind; and (vi) board oversight.
The Trustees of the Fund (the “Trustees”) have designated Janus Henderson Investors US LLC, the Fund’s investment adviser (the “Adviser”), as the Program Administrator for the LRMP responsible for administering the LRMP and carrying out the specific responsibilities of the LRMP. A working group comprised of various teams within the Adviser’s business is responsible for administering the LRMP and carrying out the specific responsibilities of different aspects of the LRMP (the “Liquidity Risk Working Group”). In assessing each Fund’s liquidity risk, the Liquidity Risk Working Group periodically considers, as relevant, factors including (i) the liquidity of a Fund’s portfolio investments during normal and reasonably foreseeable stressed conditions; (ii) whether a Fund’s investment strategy is appropriate for an open-end fund; (iii) the extent to which a Fund’s strategy involves a relatively concentrated portfolio or large positions in any issuer; (iv) a Fund’s use of borrowing for investment purposes; and (v) a Fund’s use of derivatives.
The Liquidity Rule requires the Trustees to review at least annually a written report provided by the Program Administrator that addresses the operation of the LRMP and assesses its adequacy and the effectiveness of its implementation, including, if applicable, the operation of the highly liquid investment minimum, and any material changes to the LRMP (the “Program Administrator Report”). At a meeting held on March 15, 2023, the Adviser provided the Program Administrator Report to the Trustees which covered the operation of the LRMP from January 1, 2022 through December 31, 2022 (the “Reporting Period”).
The Program Administrator Report discussed the operation and effectiveness of the LRMP during the Reporting Period. Among other things, the Program Administrator Report indicated that there were no material changes to the LRMP during the Reporting Period, although there were certain methodology adjustments implemented relating to a change in data provider. Additionally, the findings presented in the Program Administrator Report indicated that the LRMP operated adequately during the Reporting Period. These findings included that the Fund was able to meet redemptions during the normal course of business during the Reporting Period. The Program Administrator Report also stated that the Fund did not exceed the 15% limit on illiquid assets during the Reporting Period, that the Fund held primarily highly liquid assets, and was considered to be a primarily highly liquid fund during the Reporting Period. Also included among the Program Administrator Report’s findings was the determination that the Fund’s investment strategy remains appropriate for an open-end fund. In addition, the Adviser expressed its belief in the Program Administrator Report that the LRMP is reasonably designed and adequate to assess and manage the Fund’s liquidity risk, considering the Fund’s particular risks and circumstances, and includes policies and procedures reasonably designed to implement each required component of the Liquidity Rule.
There can be no assurance that the LRMP will achieve its objectives in the future. Please refer to your Fund’s prospectus for more information regarding the risks to which an investment in the Fund may be subject.
Janus Henderson Short Duration Flexible Bond Fund
Useful Information About Your Fund Report (unaudited)
Management Commentary
The Management Commentary in this report includes valuable insight as well as statistical information to help you understand how your Fund’s performance and characteristics stack up against those of comparable indices.
If the Fund invests in foreign securities, this report may include information about country exposure. Country exposure is based primarily on the country of risk. A company may be allocated to a country based on other factors such as location of the company’s principal office, the location of the principal trading market for the company’s securities, or the country where a majority of the company’s revenues are derived.
Please keep in mind that the opinions expressed in the Management Commentary are just that: opinions. They are a reflection based on best judgment at the time this report was compiled, which was June 30, 2023. As the investing environment changes, so could opinions. These views are unique and are not necessarily shared by fellow employees or by Janus Henderson in general.
Performance Overviews
Performance overview graphs compare the performance of a hypothetical $10,000 investment in the Fund with one or more widely used market indices. When comparing the performance of the Fund with an index, keep in mind that market indices are not available for investment and do not reflect deduction of expenses.
Average annual total returns are quoted for a Fund with more than one year of performance history. Average annual total return is calculated by taking the growth or decline in value of an investment over a period of time, including reinvestment of dividends and distributions, then calculating the annual compounded percentage rate that would have produced the same result had the rate of growth been constant throughout the period. Average annual total return does not reflect the deduction of taxes that a shareholder would pay on Fund distributions or redemptions of Fund shares.
Cumulative total returns are quoted for a Fund with less than one year of performance history. Cumulative total return is the growth or decline in value of an investment over time, independent of the period of time involved. Cumulative total return does not reflect the deduction of taxes that a shareholder would pay on Fund distributions or redemptions of Fund shares.
Pursuant to federal securities rules, expense ratios shown in the performance chart reflect subsidized (if applicable) and unsubsidized ratios. The total annual fund operating expenses ratio is gross of any fee waivers, reflecting the Fund’s unsubsidized expense ratio. The net annual fund operating expenses ratio (if applicable) includes contractual waivers of the Adviser and reflects the Fund’s subsidized expense ratio. Ratios may be higher or lower than those shown in the “Financial Highlights” in this report.
Schedule of Investments
Following the performance overview section is the Fund’s Schedule of Investments. This schedule reports the types of securities held in the Fund on the last day of the reporting period. Securities are usually listed by type (common stock, corporate bonds, U.S. Government obligations, etc.) and by industry classification (banking, communications, insurance, etc.). Holdings are subject to change without notice.
The value of each security is quoted as of the last day of the reporting period. The value of securities denominated in foreign currencies is converted into U.S. dollars.
If the Fund invests in foreign securities, it will also provide a summary of investments by country. This summary reports the Fund exposure to different countries by providing the percentage of securities invested in each country. The country of each security represents the country of risk. The Fund’s Schedule of Investments relies upon the industry group and country classifications published by Bloomberg and/or MSCI Inc.
Tables listing details of individual forward currency contracts, futures, written options, swaptions, and swaps follow the Fund’s Schedule of Investments (if applicable).
Statement of Assets and Liabilities
This statement is often referred to as the “balance sheet.” It lists the assets and liabilities of the Fund on the last day of the reporting period.
Janus Henderson Short Duration Flexible Bond Fund
Useful Information About Your Fund Report (unaudited)
The Fund’s assets are calculated by adding the value of the securities owned, the receivable for securities sold but not yet settled, the receivable for dividends declared but not yet received on securities owned, and the receivable for Fund shares sold to investors but not yet settled. The Fund’s liabilities include payables for securities purchased but not yet settled, Fund shares redeemed but not yet paid, and expenses owed but not yet paid. Additionally, there may be other assets and liabilities such as unrealized gain or loss on forward currency contracts.
The section entitled “Net Assets Consist of” breaks down the components of the Fund’s net assets. Because the Fund must distribute substantially all earnings, you will notice that a significant portion of net assets is shareholder capital.
The last section of this statement reports the net asset value (“NAV”) per share on the last day of the reporting period. The NAV is calculated by dividing the Fund’s net assets for each share class (assets minus liabilities) by the number of shares outstanding.
Statement of Operations
This statement details the Fund’s income, expenses, realized gains and losses on securities and currency transactions, and changes in unrealized appreciation or depreciation of Fund holdings.
The first section in this statement, entitled “Investment Income,” reports the dividends earned from securities and interest earned from interest-bearing securities in the Fund.
The next section reports the expenses incurred by the Fund, including the advisory fee paid to the investment adviser, transfer agent fees and expenses, and printing and postage for mailing statements, financial reports and prospectuses. Expense offsets and expense reimbursements, if any, are also shown.
The last section lists the amounts of realized gains or losses from investment and foreign currency transactions, and changes in unrealized appreciation or depreciation of investments and foreign currency-denominated assets and liabilities. The Fund will realize a gain (or loss) when it sells its position in a particular security. A change in unrealized gain (or loss) refers to the change in net appreciation or depreciation of the Fund during the reporting period. “Net Realized and Unrealized Gain/(Loss) on Investments” is affected both by changes in the market value of Fund holdings and by gains (or losses) realized during the reporting period.
Statements of Changes in Net Assets
These statements report the increase or decrease in the Fund’s net assets during the reporting period. Changes in the Fund’s net assets are attributable to investment operations, dividends and distributions to investors, and capital share transactions. This is important to investors because it shows exactly what caused the Fund’s net asset size to change during the period.
The first section summarizes the information from the Statement of Operations regarding changes in net assets due to the Fund’s investment operations. The Fund’s net assets may also change as a result of dividend and capital gains distributions to investors. If investors receive their dividends and/or distributions in cash, money is taken out of the Fund to pay the dividend and/or distribution. If investors reinvest their dividends and/or distributions, the Fund’s net assets will not be affected.
The reinvestment of dividends and distributions is included under “Capital Share Transactions.” “Capital Shares” refers to the money investors contribute to the Fund through purchases or withdrawals via redemptions. The Fund’s net assets will increase and decrease in value as investors purchase and redeem shares from the Fund.
Financial Highlights
This schedule provides a per-share breakdown of the components that affect the Fund’s NAV for current and past reporting periods as well as total return, asset size, ratios, and portfolio turnover rate.
The first line in the table reflects the NAV per share at the beginning of the reporting period. The next line reports the net investment income/(loss) per share. Following is the per share total of net gains/(losses), realized and unrealized. Per share dividends and distributions to investors are then subtracted to arrive at the NAV per share at the end of the period. The next line reflects the total return for the period. The total return may include adjustments in accordance with generally accepted accounting principles required at the period end for financial reporting purposes. As a result, the total return may differ from the total return reflected for individual shareholder transactions. Also included are ratios of expenses and net investment income to average net assets.
Janus Henderson Short Duration Flexible Bond Fund
Useful Information About Your Fund Report (unaudited)
The Fund’s expenses may be reduced through expense offsets and expense reimbursements. The ratios shown reflect expenses before and after any such offsets and reimbursements.
The ratio of net investment income/(loss) summarizes the income earned less expenses, divided by the average net assets of the Fund during the reporting period. Do not confuse this ratio with the Fund’s yield. The net investment income ratio is not a true measure of the Fund’s yield because it does not take into account the dividends distributed to the Fund’s investors.
The next figure is the portfolio turnover rate, which measures the buying and selling activity in the Fund. Portfolio turnover is affected by market conditions, changes in the asset size of the Fund, fluctuating volume of shareholder purchase and redemption orders, the nature of the Fund’s investments, and the investment style and/or outlook of the portfolio manager(s) and/or investment personnel. A 100% rate implies that an amount equal to the value of the entire portfolio was replaced once during the fiscal year; a 50% rate means that an amount equal to the value of half the portfolio is traded in a year; and a 200% rate means that an amount equal to the value of the entire portfolio is traded every six months.
Janus Henderson Short Duration Flexible Bond Fund
Designation Requirements (unaudited)
For federal income tax purposes, the Fund designated the following for the year ended June 30, 2023:
| | |
| | |
Section 163(j) Interest Dividend | 93% |
Janus Henderson Short Duration Flexible Bond Fund
Trustees and Officers (unaudited)
The following are the Trustees and officers of the Trust, together with a brief description of their principal occupations during the last five years (principal occupations for certain Trustees may include periods over five years). The Fund’s Statement of Additional Information includes additional information about the Trustees and officers and is available, without charge, by calling 1-877-335-2687.
Each Trustee has served in that capacity since he or she was originally elected or appointed. The Trustees do not serve a specified term of office. Each Trustee will hold office until the termination of the Trust or his or her earlier death, resignation, retirement, incapacity, or removal. Under the Fund’s Governance Procedures and Guidelines, the policy is for Trustees to retire no later than the end of the calendar year in which the Trustee turns 75. The Trustees review the Fund’s Governance Procedures and Guidelines from time to time and may make changes they deem appropriate. The Fund’s Nominating and Governance Committee will consider nominees for the position of Trustee recommended by shareholders. Shareholders may submit the name of a candidate for consideration by the Committee by submitting their recommendations to the Trust’s Secretary. Each Trustee is currently a Trustee of one other registered investment company advised by the Adviser: Janus Aspen Series. Collectively, these two registered investment companies consist of 49 series or funds referred to herein as the Fund Complex.
The Trust’s officers are elected annually by the Trustees for a one-year term. Certain officers also serve as officers of Janus Aspen Series. Certain officers of the Fund may also be officers and/or directors of the Adviser. Except as otherwise disclosed, Fund officers receive no compensation from the Fund, except for the Fund’s Chief Compliance Officer, as authorized by the Trustees.
| | | | | | |
TRUSTEES |
Name, Address, and Age | Positions Held with the Trust | Length of Time Served | Principal Occupations During the Past Five Years | Number of Portfolios/Funds in Fund Complex Overseen by Trustee | Other Directorships Held by Trustee During the Past Five Years |
Independent Trustees | | | | |
Alan A. Brown
151 Detroit Street
Denver, CO 80206
DOB: 1962 | Chairman
Trustee | 5/22-Present
1/13-Present | Principal, Curam Holdings LLC (since 2018). Formerly, Executive Vice President, Institutional Markets, of Black Creek Group (private equity real estate investment management firm) (2012-2018), Executive Vice President and Co-Head, Global Private Client Group (2007-2010), Executive Vice President, Mutual Funds (2005-2007), and Chief Marketing Officer (2001-2005) of Nuveen Investments, Inc. (asset management). | 49 | Advisory Board Member of AEW Core Property Trust (open-end property fund) (since 2020), and Director of WTTW (PBS affiliate) (since 2003). Formerly, Director of MotiveQuest LLC (strategic social market research company) (2003-2016), Director of Nuveen Global Investors LLC (2007-2011), Director of Communities in Schools (2004-2010), and Director of Mutual Fund Education Alliance (until 2010). |
Janus Henderson Short Duration Flexible Bond Fund
Trustees and Officers (unaudited)
| | | | | | |
TRUSTEES |
Name, Address, and Age | Positions Held with the Trust | Length of Time Served | Principal Occupations During the Past Five Years | Number of Portfolios/Funds in Fund Complex Overseen by Trustee | Other Directorships Held by Trustee During the Past Five Years |
Independent Trustees | | | | |
Cheryl D. Alston
151 Detroit Street
Denver, CO 80206
DOB: 1966 | Trustee | 8/22-Present | Executive Director and Chief Investment Officer, Employees’ Retirement Fund of the City of Dallas (since 2004). | 49 | Director of Blue Cross Blue Shield of Kansas City (a not-for-profit health insurance provider) (since 2016) and Director of Global Life Insurance (life and supplemental health insurance provider) (since 2017). Formerly, Director of Federal Home Loan Bank of Dallas (2017-2021). |
Janus Henderson Short Duration Flexible Bond Fund
Trustees and Officers (unaudited)
| | | | | | |
TRUSTEES |
Name, Address, and Age | Positions Held with the Trust | Length of Time Served | Principal Occupations During the Past Five Years | Number of Portfolios/Funds in Fund Complex Overseen by Trustee | Other Directorships Held by Trustee During the Past Five Years |
Independent Trustees | | | | |
Janus Henderson Short Duration Flexible Bond Fund
Trustees and Officers (unaudited)
| | | | | | |
William D. Cvengros
151 Detroit Street
Denver, CO 80206
DOB: 1948 | Trustee | 1/11-Present | Chief Executive Officer of SJC Capital, LLC (a personal investment company and consulting firm) (since 2002). Formerly, Chief Executive Officer and President of PIMCO Advisors Holdings L.P. (a publicly traded investment management firm) (1994-2000), and Chief Investment Officer (1987-1994) and Vice Chairman and Director (1990-1994) of Pacific Life Insurance Company (a mutual life insurance and annuity company) (1987-1994). | 49 | Member, Limited Partner Advisory Committee, Karmel Capital Fund III (later stage growth fund) (since 2022), Member of the Investment Committee for the Orange County Community Foundation (a grantmaking foundation) (since 2020), Advisory Board Member, RevOZ Fund LP and related funds (real estate investments for opportunity zones) (since 2020), and Advisory Board Member, Innovate Partners Emerging Growth and Equity Fund I (early stage venture capital fund) (since 2014). Formerly, Managing Trustee of National Retirement Partners Liquidating Trust (2013-2016), Chairman, National Retirement Partners, Inc. (formerly a network of advisors to 401(k) plans) (2005-2013), Director of Prospect Acquisition Corp. (a special purpose acquisition corporation) (2007-2009), Director of RemedyTemp, Inc. (temporary help services company) (1996-2006), and Trustee of PIMCO Funds Multi-Manager Series (1990-2000) and Pacific Life Variable Life & Annuity Trusts (1987-1994). |
Janus Henderson Short Duration Flexible Bond Fund
Trustees and Officers (unaudited)
| | | | | | |
TRUSTEES |
Name, Address, and Age | Positions Held with the Trust | Length of Time Served | Principal Occupations During the Past Five Years | Number of Portfolios/Funds in Fund Complex Overseen by Trustee | Other Directorships Held by Trustee During the Past Five Years |
Independent Trustees | | | | |
Raudline Etienne
151 Detroit Street
Denver, CO 80206
DOB: 1965 | Trustee | 6/16-Present | Founder, Daraja Capital (advisory and investment firm) (since 2016). Formerly, Senior Vice President and Senior Advisor, Albright Stonebridge Group LLC (global strategy firm) (2011-2021), and Deputy Comptroller and Chief Investment Officer, New York State Common Retirement Fund (public pension fund) (2008-2011). | 49 | Member of the Investment Committee for Cooper Union (private college) (since 2021) and Director of Brightwood Capital Advisors, LLC (since 2014). Formerly, Board Member, Van Alen Institute (nonprofit architectural and design organization) (2019-2022). |
Darrell B. Jackson
151 Detroit Street
Denver, CO 80206
DOB: 1958 | Trustee | 8/22-Present | President and Chief Executive Officer, The Efficace Group Inc. (since 2018). Formerly, President and Chief Executive Officer, Seaway Bank and Trust Company (community bank) (2014-2015), and Executive Vice President and Co-President, Wealth Management (2009-2014), and several senior positions, including Group Executive, Senior Vice President, and Vice President (1995-2009) of Northern Trust Company (financial services company) (1995-2014). | 49 | Director of Amalgamated Financial Corp (bank) (since August 2021), Director of YR Media (a not-for-profit production company) (since 2021), and Director of Gray-Bowen-Scott (transportation project consulting firm) (since April 2020). Formerly, Director of Delaware Place Bank (closely held commercial bank) (2016-2018) and Director of Seaway Bank and Trust Company (2014-2015). |
Janus Henderson Short Duration Flexible Bond Fund
Trustees and Officers (unaudited)
| | | | | | |
TRUSTEES |
Name, Address, and Age | Positions Held with the Trust | Length of Time Served | Principal Occupations During the Past Five Years | Number of Portfolios/Funds in Fund Complex Overseen by Trustee | Other Directorships Held by Trustee During the Past Five Years |
Independent Trustees | | | | |
William F. McCalpin
151 Detroit Street
Denver, CO 80206
DOB: 1957 | Trustee | 6/02-Present | Chief Executive Officer, muun chi LLC (organic food business) (since 2022) and Independent Consultant (since 2019). Formerly, Chief Operating Officer, muun chi LLC (2020-2022), Managing Partner, Impact Investments, Athena Capital Advisors LLC (independent registered investment advisor) (2016-2019), Managing Director, Holos Consulting LLC (provides consulting services to foundations and other nonprofit organizations) (2009-2016), Chief Executive Officer, Imprint Capital Advisors (impact investment firm) (2013-2015), and Executive Vice President and Chief Operating Officer of The Rockefeller Brothers Fund (a private family foundation) (1998-2006). | 49 | Chairman of the Board and Trustee of The Investment Fund for Foundations Investment Program (TIP) (consisting of 1 fund) (since 2008). Formerly, Director of the F.B. Heron Foundation (a private grantmaking foundation) (2006-2022), and Director of Mutual Fund Directors Forum (a non-profit organization serving independent directors of U.S. mutual funds) (2016-2021). |
Janus Henderson Short Duration Flexible Bond Fund
Trustees and Officers (unaudited)
| | | | | | |
TRUSTEES |
Name, Address, and Age | Positions Held with the Trust | Length of Time Served | Principal Occupations During the Past Five Years | Number of Portfolios/Funds in Fund Complex Overseen by Trustee | Other Directorships Held by Trustee During the Past Five Years |
Independent Trustees | | | | |
Gary A. Poliner
151 Detroit Street
Denver, CO 80206
DOB: 1953 | Trustee | 6/16-Present | Retired. Formerly, President (2010-2013) of Northwestern Mutual Life Insurance Company. | 49 | Director of MGIC Investment Corporation (private mortgage insurance) (since 2013). Formerly, Director, West Bend Mutual Insurance Company (property/casualty insurance) (2013-2021), Trustee of Northwestern Mutual Life Insurance Company (2010-2013) and Director of Frank Russell Company (global asset management firm) (2008-2013). |
Diane L. Wallace
151 Detroit Street
Denver, CO 80206
DOB: 1958 | Trustee | 6/17-Present | Retired. Formerly, Chief Operating Officer, Senior Vice President-Operations, and Chief Financial Officer for Driehaus Capital Management, LLC (1988-2006) and Treasurer for Driehaus Mutual Funds (1996-2002). | 49 | Formerly, Director of Family Service of Lake County (2019-2021), Independent Trustee, Henderson Global Funds (13 portfolios) (2015-2017), Independent Trustee, State Farm Associates’ Funds Trust, State Farm Mutual Fund Trust, and State Farm Variable Product Trust (28 portfolios) (2013-2017). |
Janus Henderson Short Duration Flexible Bond Fund
Trustees and Officers (unaudited)
| | | | |
OFFICERS |
Name, Address, and Age | Positions Held with the Trust | Term of Office* and Length of Time Served | Principal Occupations During the Past Five Years |
Michael Keough
151 Detroit Street
Denver, CO 80206
DOB: 1978 | Executive Vice President and Co-Portfolio Manager
Janus Henderson Short Duration Flexible Bond Fund | 12/19-Present | Portfolio Manager for other Janus Henderson accounts. |
Greg Wilensky
151 Detroit Street
Denver, CO 80206
DOB: 1967 | Executive Vice President and Co-Portfolio Manager
Janus Henderson Short Duration Flexible Bond Fund | 2/20-Present | Head of U.S. Fixed-Income of Janus Henderson Investors and Portfolio Manager for other Janus Henderson accounts. Formerly, Director and Lead Portfolio Manager of the U.S. Multi-Sector Fixed Income team at AllianceBernstein (2007-2019). |
Michelle Rosenberg
151 Detroit Street
Denver, CO 80206
DOB: 1973 | President and Chief Executive Officer | 9/22-Present | General Counsel and Corporate Secretary of Janus Henderson Investors (since 2018). Formerly, Interim President and Chief Executive Officer of the Trust and Janus Aspen Series (2022), Senior Vice President and Head of Legal, North America of Janus Henderson Investors (2017-2018) and Deputy General Counsel of Janus Henderson US (Holdings) Inc. (2015-2018). |
Janus Henderson Short Duration Flexible Bond Fund
Trustees and Officers (unaudited)
| | | | |
OFFICERS |
Name, Address, and Age | Positions Held with the Trust | Term of Office* and Length of Time Served | Principal Occupations During the Past Five Years |
Kristin Mariani
151 Detroit Street
Denver, CO 80206
DOB: 1966 | Vice President and Chief Compliance Officer | 7/20-Present | Head of Compliance, North America at Janus Henderson Investors (since September 2020) and Chief Compliance Officer at Janus Henderson Investors US LLC (since September 2017). Formerly, Anti-Money Laundering Officer for the Trust and Janus Aspen Series (July 2020-December 2022), Global Head of Investment Management Compliance at Janus Henderson Investors (February 2019-August 2020), Vice President, Head of Global Distribution Compliance and Chief Compliance Officer at Janus Henderson Distributors US LLC (May 2017-September 2017), Vice President, Compliance at Janus Henderson US (Holdings) Inc., Janus Henderson Investors US LLC, and Janus Henderson Distributors US LLC (2009-2017). |
Jesper Nergaard
151 Detroit Street
Denver, CO 80206
DOB: 1962 | Chief Financial Officer
Vice President, Treasurer, and Principal Accounting Officer | 3/05-Present
2/05-Present | Head of U.S. Fund Administration, Janus Henderson Investors and Janus Henderson Services US LLC. |
Abigail J. Murray
151 Detroit Street
Denver, CO 80206
DOB: 1975 | Vice President, Chief Legal Counsel, and Secretary | 12/20-Present | Managing Counsel (since 2020). Formerly, Senior Counsel for Invesco Ltd. (2017-2020), and Vice President and Senior Counsel, ALPS Fund Services, Inc. and Assistant General Counsel, ALPS Advisors, Inc. (2015-2017). |
Ciaran Askin
151 Detroit Street
Denver, CO 80206
DOB: 1978 | Anti-Money Laundering Officer | 12/22-Present | Global Head of Financial Crime, Janus Henderson Investors (since 2022). Formerly, Global Head of Financial Crime for Invesco Ltd. (2017-2022). |
* Officers are elected at least annually by the Trustees for a one-year term and may also be elected from time to time by the Trustees for an interim period. |
| | | | | | | | |
| | | | | |

| | | | |
This report is submitted for the general information of shareholders of the Fund. It is not an offer or solicitation for the Fund and is not authorized for distribution to prospective investors unless preceded or accompanied by an effective prospectus. |
Janus Henderson is a trademark of Janus Henderson Group plc or one of its subsidiaries. © Janus Henderson Group plc Janus Henderson Distributors US LLC Janus Henderson Group is the ultimate parent of Janus Henderson Distributors US LLC |
| | | | 125-02-93030 08-23 |
| | | |
| | | |
| | | ANNUAL REPORT June 30, 2023 |
| | |
| | Janus Henderson Small Cap Value Fund |
| | |
| | Janus Investment Fund |
| |
| | | |
| | | HIGHLIGHTS · Portfolio management perspective · Investment strategy behind your fund · Fund performance, characteristics
and holdings |
Table of Contents
Janus Henderson Small Cap Value Fund
Janus Henderson Small Cap Value Fund (unaudited)
| | | | | | |
| | | | 
Craig Kempler co-portfolio manager | 
Justin Tugman co-portfolio manager |
| | | |
PERFORMANCE OVERVIEW
For the 12-month period ended June 30, 2023, the Janus Henderson Small Cap Value Fund Class I shares returned 12.65%, outperforming its benchmark, the Russell 2000® Value Index, which returned 6.01%.
INVESTMENT ENVIRONMENT
Stocks began a volatile period in negative territory, with investors concerned about the pace and extent of interest rate hikes as central banks committed to getting inflation under control. Supply chain bottlenecks and commodity prices eased from earlier in 2022, but a tight labor market kept upward pressure on wages, leading the Federal Reserve (Fed) to hike interest rates 75 basis points (bps) in both July and September. The prospect of further rate tightening drove bond yields higher, adding to corporate funding challenges. Stocks then rose on hopes that moderating inflation might allow the Fed to slow the pace of its rate hikes. However, inflation remained stubbornly high, and the Fed raised rates by 75 bps in November, 50 bps in December, and 25 bps in both February and March.
The failure of several banks in March raised concerns over the condition of the U.S. and European banking industries, triggering a sell-off in financial and cyclical stocks and a flight to quality that benefited U.S. Treasuries. Amid the increased volatility, stocks continued to rally, especially in the industrials and consumer discretionary sectors, aided by signs of moderating inflation and resilient economic growth. Stocks in the utilities and materials sectors lagged the market. In May, the Fed raised rates by 25 bps but paused in June. Investors favored more speculative stocks toward period end, along with investments they expected to benefit from advancements in artificial intelligence.
PERFORMANCE DISCUSSION
The portfolio outperformed its benchmark for the 12-month period. Stock selection drove relative performance, with investments in industrials, information technology, and materials contributing on a relative basis. An overweight allocation to industrials also was beneficial. Stock selection in financials, consumer discretionary, and healthcare detracted, as did an underweight allocation to consumer discretionary.
Several of our energy holdings were top individual contributors. These included ChampionX, a provider of chemistry solutions and engineered equipment and technologies to oil and gas companies, and Chord Energy, an energy exploration and production company that primarily produces oil. Both companies continued to execute well despite headwinds for natural gas and oil prices.
Relative performance also was aided by several materials investments, including long-time holding Commercial Metals, a leading U.S. rebar producer. The company posted strong results and indicated good future demand for its products over the period, as healthy nonresidential and government-funded infrastructure spending more than offset a slowing housing environment.
While we benefited from our continued underweight allocation to the financial sector, several of our holdings – First Interstate BancSystem, Horizon Bancorp, and Ameris Bancorp in particular – were caught in the broad-based sell-off in bank stocks in March, which hindered relative performance. Montana-based First Interstate BancSystem was the top individual detractor over the period, reporting weaker-than-expected first-quarter results and declining deposits. It also faced increased scrutiny over its credit exposure and some unrealized losses in its security portfolio. Given the headwinds for bank profitability and
Janus Henderson Small Cap Value Fund (unaudited)
the potential for credit losses in a weaker economy, we exited several names that did not earn our highest confidence. We continue to focus on high-quality banks with healthy balance sheets, diversified deposit bases, and disciplined lending practices. Additionally, we believe the rush to improve liquidity at banks could lead to a more restrictive lending environment, potentially pressuring economic growth. We have maintained underweight allocations in financials as well as in other investments, such as real estate investment trusts, that we believe could be negatively impacted by tighter credit availability.
OUTLOOK
We have been pleased and somewhat surprised with the resiliency of the economy and the health of corporate earnings. At the same time, we recognize we have yet to see the full impact of Fed rate hikes, and we believe there is more work for policymakers to do in combating inflation, including on the wage front. We also see potential future headwinds from the tightening of bank lending and credit standards, which could act as a further brake on the economy. There remains a decent risk that further slowing in economic growth and earnings estimates could lead to market volatility. That said, we have positioned the portfolio to benefit from strong markets and provide protection in challenging market environments. We continue to believe small caps look very attractive relative to large caps for the long term. As always, we will look for new opportunities to use market volatility to our advantage as we identify attractive rewards/risks for companies with strong balance sheets, consistent free cash flow, and stable earnings profiles.
Thank you for your investment in the Janus Henderson Small Cap Value Fund.
Basis point (bp) equals 1/100 of a percentage point. 1 bp = 0.01%, 100 bps = 1%
Important Notice – Tailored Shareholder Reports
Effective January 24, 2023, the Securities and Exchange Commission (the “SEC”) adopted rule and form amendments that require mutual funds and exchange-traded funds to provide shareholders with streamlined annual and semi-annual shareholder reports that highlight key information. Other information, including financial statements, that currently appears in shareholder reports will be made available online, delivered free of charge to shareholders upon request, and filed with the SEC. The first tailored shareholder report for the Fund will be for the reporting period ending June 30, 2024. Currently, management is evaluating the impact of the rule and form amendments on the content of the Fund’s current shareholder reports.
Janus Henderson Small Cap Value Fund (unaudited)
Fund At A Glance
June 30, 2023
| | | | | | | | | | |
| | | | | | | | | |
| | | | | | | | | |
| | | | | | | | | |
| 5 Top Contributors - Holdings | 5 Top Detractors - Holdings |
| | Average
Weight | | Relative
Contribution | | | Average
Weight | | Relative
Contribution |
| Comfort Systems USA Inc | 1.76% | | 1.26% | | First Interstate BancSystem Inc - Class A | 2.28% | | -0.92% |
| Boyd Group Services Inc | 1.88% | | 1.08% | | Horizon Bancorp Inc/IN | 0.92% | | -0.55% |
| ChampionX Corp | 2.30% | | 0.98% | | Hanover Insurance Group Inc | 1.54% | | -0.50% |
| Commercial Metals Co | 2.10% | | 0.83% | | Black Hills Corp | 2.41% | | -0.47% |
| Chord Energy Corp | 2.23% | | 0.83% | | Ameris Bancorp | 2.34% | | -0.40% |
| | | | | | | |
| 5 Top Contributors - Sectors* | | | | | |
| | | Relative | | Fund | Russell 2000 Value Index |
| | | Contribution | | Average Weight | Average Weight |
| Industrials | | 3.22% | | 20.54% | 13.37% |
| Information Technology | | 1.37% | | 6.84% | 5.86% |
| Materials | | 1.31% | | 5.85% | 4.13% |
| Energy | | 1.18% | | 8.47% | 6.06% |
| Consumer Staples | | 0.69% | | 3.93% | 2.71% |
| | | | | | |
| | | | | | |
| 5 Top Detractors - Sectors* | | | | | |
| | | Relative | | Fund | Russell 2000 Value Index |
| | | Contribution | | Average Weight | Average Weight |
| Financials | | -0.53% | | 22.33% | 27.75% |
| Consumer Discretionary | | -0.48% | | 8.27% | 10.45% |
| Health Care | | -0.33% | | 9.35% | 10.72% |
| Utilities | | -0.16% | | 3.21% | 5.04% |
| Other** | | -0.06% | | 3.14% | 0.00% |
| | | | | | | |
| Relative contribution reflects how the portolio's holdings impacted return relative to the benchmark. Cash and securities not held in the portfolio are not shown. For equity portfolios, relative contribution compares the performance of a security in the portfolio to the benchmark's total return, factoring in the difference in weight of that security in the benchmark. Returns are calculated using daily returns and previous day ending weights rolled up by ticker, excluding fixed income securities, gross of advisory fees, may exclude certain derivatives and will differ from actual performance.
Performance attribution reflects returns gross of advisory fees and may differ from actual returns as they are based on end of day holdings. Attribution is calculated by geometrically linking daily returns for the portfolio and index. |
* | Based on sector classification according to the Global Industry Classification Standard (“GICS”) codes, which are the exclusive property and a service mark of MSCI Inc. and Standard & Poor’s. |
** | Not a GICS classified sector. |
Janus Henderson Small Cap Value Fund (unaudited)
Fund At A Glance
June 30, 2023
| | |
5 Largest Equity Holdings - (% of Net Assets) |
Oasis Petroleum Inc | |
Oil, Gas & Consumable Fuels | 2.8% |
ChampionX Corp | |
Energy Equipment & Services | 2.7% |
Hillenbrand Inc | |
Machinery | 2.6% |
STAG Industrial Inc | |
Industrial Real Estate Investment Trusts (REITs) | 2.6% |
Black Hills Corp | |
Multi-Utilities | 2.2% |
| | 12.9% |
| | | | | | |
Asset Allocation - (% of Net Assets) | |
Common Stocks | | 96.8% | |
Repurchase Agreements | | 2.0% | |
Investment Companies | | 1.2% | |
Investments Purchased with Cash Collateral from Securities Lending | | 0.7% | |
Other | | (0.7)% |
| | | 100.0% |
| | |
Top Country Allocations - Long Positions - (% of Investment Securities) |
As of June 30, 2023 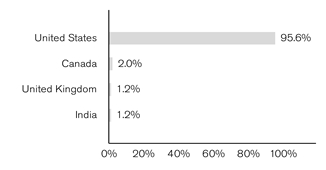
| As of June 30, 2022 
|
Janus Henderson Small Cap Value Fund (unaudited)
Performance
| |
See important disclosures on the next page. |
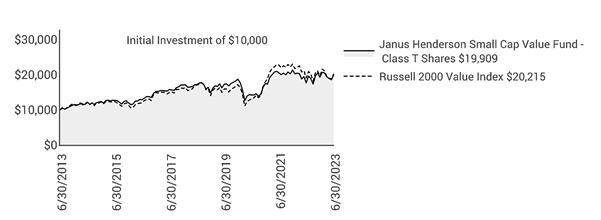
| | | | | | | | | | |
| | | | | | | | |
| | | | | | | | |
Average Annual Total Return - for the periods ended June 30, 2023 | | | Prospectus Expense Ratios |
| | One
Year | Five
Year | Ten
Year | | | Total Annual Fund
Operating Expenses‡ | Net Annual Fund
Operating Expenses‡ |
Class A Shares at NAV | | 12.39% | 2.79% | 6.90% | | | 1.77% | 1.22% |
Class A Shares at MOP | | 5.91% | 1.58% | 6.27% | | | | |
Class C Shares at NAV | | 11.56% | 2.12% | 6.24% | | | 1.70% | 1.70% |
Class C Shares at CDSC | | 10.56% | 2.12% | 6.24% | | | | |
Class D Shares | | 12.63% | 3.08% | 7.22% | | | 0.75% | 0.75% |
Class I Shares | | 12.65% | 3.10% | 7.25% | | | 0.74% | 0.74% |
Class L Shares(1) | | 12.75% | 3.22% | 7.36% | | | 0.81% | 0.81% |
Class N Shares | | 12.81% | 3.24% | 7.39% | | | 0.60% | 0.60% |
Class R Shares | | 11.97% | 2.46% | 6.58% | | | 1.36% | 1.36% |
Class S Shares | | 12.22% | 2.73% | 6.85% | | | 1.11% | 1.11% |
Class T Shares | | 12.51% | 2.99% | 7.13% | | | 0.85% | 0.85% |
Russell 2000 Value Index | | 6.01% | 3.54% | 7.29% | | | | |
Morningstar Quartile - Class T Shares | | 2nd | 4th | 3rd | | | | |
Morningstar Ranking - based on total returns for Small Value Funds | | 182/481 | 381/445 | 256/404 | | | | |
Returns quoted are past performance and do not guarantee future results; current performance may be lower or higher. Investment returns and principal value will vary; there may be a gain or loss when shares are sold. For the most recent month-end performance call 800.668.0434 (or 800.525.3713 if you hold shares directly with Janus Henderson) or visit janushenderson.com/performance (or janushenderson.com/allfunds if you hold shares directly with Janus Henderson).
Maximum Offering Price (MOP) returns include the maximum sales charge of 5.75%. Net Asset Value (NAV) returns exclude this charge, which would have reduced returns.
CDSC returns include a 1% contingent deferred sales charge (CDSC) on Shares redeemed within 12 months of purchase. Net Asset Value (NAV) returns exclude this charge, which would have reduced returns.
For certain periods, the Fund’s performance may reflect the effects of expense waivers.
Class L Shares have a voluntarily agreed administrative fee waiver, which could be changed or terminated at any time.
Janus Henderson Small Cap Value Fund (unaudited)
Performance
This Fund has a performance-based management fee that may adjust up or down based on the Fund’s performance.
Performance may be affected by risks that include those associated with foreign and emerging markets, fixed income securities, high-yield and high-risk securities, undervalued, overlooked and smaller capitalization companies, real estate related securities including Real Estate Investment Trusts (REITs), Environmental, Social and Governance (ESG) factors, non-diversification, portfolio turnover, derivatives, short sales, initial public offerings (IPOs) and potential conflicts of interest. Each product has different risks. Please see the prospectus for more information about risks, holdings and other details.
Returns include reinvestment of all dividends and distributions and do not reflect the deduction of taxes that a shareholder would pay on Fund distributions or redemptions of Fund shares. The returns do not include adjustments in accordance with generally accepted accounting principles required at the period end for financial reporting purposes.
Class A Shares, Class C Shares, Class R Shares and Class S Shares commenced operations on July 6, 2009. Performance shown for each class reflects the performance of the Fund’s Class J Shares (formerly named Investor Shares) for periods prior to July 6, 2009, calculated using the fees and expenses of the corresponding class, without the effect of any fee and expense limitations or waivers.
Class D Shares commenced operations on February 16, 2010, as a result of the restructuring of Class J Shares, the predecessor share class. Performance shown for periods prior to February 16, 2010, reflects the performance of the Fund’s former Class J Shares (formerly named Investor Shares).
Class I Shares commenced operations on July 6, 2009. Performance shown reflects the performance of the Fund’s Class J Shares (formerly named Investor Shares) for periods prior to July 6, 2009, calculated using the fees and expenses of Class J Shares, net of any applicable fee and expense limitations or waivers.
Class N Shares of the Fund commenced operations on May 31, 2012. Performance shown for Class N Shares reflects the performance of the Fund’s Class T Shares from July 6, 2009 to May 31, 2012, calculated using the fees and expenses of Class T Shares, net of any applicable fee and expense limitations or waivers. For periods prior to July 6, 2009, the performance shown for Class N Shares reflects the performance of the Fund’s Class J Shares (formerly named Investor Shares), calculated using the fees and expenses of Class J Shares, net of any applicable fee and expense limitations or waivers.
Class T Shares (formerly named Class J Shares) commenced operations with the Fund’s inception. Performance shown for Class T Shares reflects the fees and expenses of Class T Shares, net of any applicable fee and expense limitations or waivers.
If each share class of the Fund had been available during periods prior to its commencement, the performance shown may have been different. The performance shown for periods following the Fund’s commencement of each share class reflects the fees and expenses of each respective share class, net of any applicable fee and expense limitations or waivers. Please refer to the Fund’s prospectuses for further details concerning historical performance.
Ranking is for the share class shown only; other classes may have different performance characteristics. When an expense waiver is in effect, it may have a material effect on the total return, and therefore the ranking for the period.
© 2023 Morningstar, Inc. All Rights Reserved.
There is no assurance that the investment process will consistently lead to successful investing.
See Notes to Schedule of Investments and Other Information for index definitions.
Index performance does not reflect the expenses of managing a portfolio as an index is unmanaged and not available for direct investment.
See “Useful Information About Your Fund Report.”
‡ As stated in the prospectus. Net expense ratios reflect the expense waiver, if any, contractually agreed to for at least a one-year period commencing on October 28, 2022. This contractual waiver may be terminated or modified only at the discretion of the Board of Trustees. See Financial Highlights for actual expense ratios during the reporting period.
(1) Closed to new investors.
Janus Henderson Small Cap Value Fund (unaudited)
Expense Examples
As a shareholder of the Fund, you incur two types of costs: (1) transaction costs, such as sales charges (loads) on purchase payments (applicable to Class A Shares only); and (2) ongoing costs, including management fees; 12b-1 distribution and shareholder servicing fees; transfer agent fees and expenses payable pursuant to the Transfer Agency Agreement; and other Fund expenses. This example is intended to help you understand your ongoing costs (in dollars) of investing in the Fund and to compare these costs with the ongoing costs of investing in other mutual funds. To do so, compare this 5% hypothetical example with the 5% hypothetical examples that appear in the shareholder reports of the other funds. The example is based upon an investment of $1,000 invested at the beginning of the period and held for the six-months indicated, unless noted otherwise in the table and footnotes below.
Actual Expenses
The information in the table under the heading “Actual” provides information about actual account values and actual expenses. You may use the information in these columns, together with the amount you invested, to estimate the expenses that you paid over the period. Simply divide your account value by $1,000 (for example, an $8,600 account value divided by $1,000 = 8.6), then multiply the result by the number in the appropriate column for your share class under the heading entitled “Expenses Paid During Period” to estimate the expenses you paid on your account during the period.
Hypothetical Example for Comparison Purposes
The information in the table under the heading “Hypothetical (5% return before expenses)” provides information about hypothetical account values and hypothetical expenses based upon the Fund’s actual expense ratio and an assumed rate of return of 5% per year before expenses, which is not the Fund’s actual return. The hypothetical account values and expenses may not be used to estimate the actual ending account balance or expenses you paid for the period. You may use this information to compare the ongoing costs of investing in the Fund and other funds. To do so, compare this 5% hypothetical example with the 5% hypothetical examples that appear in the shareholder reports of the other funds. Additionally, for an analysis of the fees associated with an investment in any share class or other similar funds, please visit www.finra.org/fundanalyzer.
Please note that the expenses shown in the table are meant to highlight your ongoing costs only and do not reflect any transaction costs. These fees are fully described in the Fund’s prospectuses. Therefore, the hypothetical examples are useful in comparing ongoing costs only, and will not help you determine the relative total costs of owning different funds. In addition, if these transaction costs were included, your costs would have been higher.
| | | | | | | | | | | |
| | | | | | | | |
| | | Actual | | Hypothetical
(5% return before expenses) | |
| Beginning
Account
Value
(1/1/23) | Ending
Account
Value
(6/30/23) | Expenses
Paid During
Period
(1/1/23 - 6/30/23)† | | Beginning
Account
Value
(1/1/23) | Ending
Account
Value
(6/30/23) | Expenses
Paid During
Period
(1/1/23 - 6/30/23)† | Net Annualized
Expense Ratio
(1/1/23 - 6/30/23) |
Class A Shares | $1,000.00 | $1,032.00 | $4.89 | | $1,000.00 | $1,019.98 | $4.86 | 0.97% |
Class C Shares | $1,000.00 | $1,028.40 | $8.25 | | $1,000.00 | $1,016.66 | $8.20 | 1.64% |
Class D Shares | $1,000.00 | $1,033.40 | $3.63 | | $1,000.00 | $1,021.22 | $3.61 | 0.72% |
Class I Shares | $1,000.00 | $1,033.70 | $3.63 | | $1,000.00 | $1,021.22 | $3.61 | 0.72% |
Class L Shares | $1,000.00 | $1,033.90 | $2.87 | | $1,000.00 | $1,021.97 | $2.86 | 0.57% |
Class N Shares | $1,000.00 | $1,034.20 | $2.82 | | $1,000.00 | $1,022.02 | $2.81 | 0.56% |
Class R Shares | $1,000.00 | $1,030.50 | $6.65 | | $1,000.00 | $1,018.25 | $6.61 | 1.32% |
Class S Shares | $1,000.00 | $1,031.70 | $5.39 | | $1,000.00 | $1,019.49 | $5.36 | 1.07% |
Class T Shares | $1,000.00 | $1,032.80 | $4.03 | | $1,000.00 | $1,020.83 | $4.01 | 0.80% |
† | Expenses Paid During Period are equal to the Net Annualized Expense Ratio multiplied by the average account value over the period, multiplied by 181/365 (to reflect the one-half year period). Expenses in the examples include the effect of applicable fee waivers and/or expense reimbursements, if any. Had such waivers and/or reimbursements not been in effect, your expenses would have been higher. Please refer to the Notes to Financial Statements or the Fund’s prospectuses for more information regarding waivers and/or reimbursements. |
Janus Henderson Small Cap Value Fund
Schedule of Investments
June 30, 2023
| | | | | | | | |
Shares or
Principal Amounts | | | Value | |
Common Stocks– 96.8% | | | |
Aerospace & Defense – 2.4% | | | |
| | AAR Corp* | | 416,047 | | | $24,030,875 | |
| | AerSale Corp* | | 1,431,950 | | | 21,049,665 | |
| | Spirit AeroSystems Holdings Inc | | 512,881 | | | 14,970,996 | |
| | | 60,051,536 | |
Auto Components – 1.3% | | | |
| | Adient PLC* | | 411,664 | | | 15,774,964 | |
| | Dorman Products Inc* | | 215,925 | | | 17,021,368 | |
| | | 32,796,332 | |
Banks – 12.7% | | | |
| | Ameris Bancorp | | 1,261,134 | | | 43,143,394 | |
| | Cadence Bank | | 1,747,383 | | | 34,318,602 | |
| | Eastern Bankshares Inc | | 471,849 | | | 5,789,587 | |
| | Enterprise Financial Services Corp | | 201,753 | | | 7,888,542 | |
| | FB Financial Corp | | 694,408 | | | 19,478,144 | |
| | First Busey Corp | | 796,634 | | | 16,012,343 | |
| | First Interstate BancSystem Inc - Class A | | 1,616,974 | | | 38,548,660 | |
| | Fulton Financial Corp | | 2,018,030 | | | 24,054,918 | |
| | Hancock Whitney Corp | | 976,104 | | | 37,462,872 | |
| | Provident Financial Services Inc | | 297,853 | | | 4,866,918 | |
| | Simmons First National Corp - Class A | | 1,009,271 | | | 17,409,925 | |
| | United Community Banks Inc/GA | | 1,625,424 | | | 40,619,346 | |
| | WSFS Financial Corp | | 702,977 | | | 26,516,292 | |
| | | 316,109,543 | |
Beverages – 1.6% | | | |
| | Coca-Cola Consolidated Inc | | 61,268 | | | 38,967,673 | |
Biotechnology – 0.4% | | | |
| | Anika Therapeutics Inc* | | 354,175 | | | 9,201,466 | |
Building Products – 1.8% | | | |
| | Gibraltar Industries Inc* | | 372,031 | | | 23,408,191 | |
| | Masonite International Corp* | | 218,513 | | | 22,384,472 | |
| | | 45,792,663 | |
Capital Markets – 3.0% | | | |
| | Artisan Partners Asset Management Inc | | 919,719 | | | 36,154,154 | |
| | Piper Jaffray Cos | | 299,305 | | | 38,688,164 | |
| | | 74,842,318 | |
Chemicals – 1.8% | | | |
| | American Vanguard Corp | | 712,361 | | | 12,729,891 | |
| | Innospec Inc | | 327,109 | | | 32,854,828 | |
| | | 45,584,719 | |
Commercial Services & Supplies – 2.9% | | | |
| | Boyd Group Services Inc | | 257,915 | | | 49,213,360 | |
| | UniFirst Corp/MA | | 146,450 | | | 22,701,214 | |
| | | 71,914,574 | |
Construction & Engineering – 1.5% | | | |
| | Comfort Systems USA Inc | | 232,346 | | | 38,151,213 | |
Construction Materials – 1.8% | | | |
| | Eagle Materials Inc | | 237,949 | | | 44,358,453 | |
Diversified Financial Services – 0.9% | | | |
| | EVERTEC Inc | | 608,913 | | | 22,426,266 | |
Electrical Equipment – 1.7% | | | |
| | Encore Wire Corp | | 227,901 | | | 42,373,633 | |
Electronic Equipment, Instruments & Components – 4.4% | | | |
| | Fabrinet* | | 317,499 | | | 41,236,770 | |
| | Insight Enterprises Inc* | | 324,214 | | | 47,445,477 | |
| | Rogers Corp* | | 133,302 | | | 21,585,593 | |
| | | 110,267,840 | |
Energy Equipment & Services – 3.5% | | | |
| | ChampionX Corp | | 2,147,953 | | | 66,672,461 | |
| | |
See Notes to Schedule of Investments and Other Information and Notes to Financial Statements. |
| |
8 | JUNE 30, 2023 |
Janus Henderson Small Cap Value Fund
Schedule of Investments
June 30, 2023
| | | | | | | | |
Shares or
Principal Amounts | | | Value | |
Common Stocks– (continued) | | | |
Energy Equipment & Services– (continued) | | | |
| | Weatherford International PLC* | | 318,440 | | | $21,150,785 | |
| | | 87,823,246 | |
Food & Staples Retailing – 1.3% | | | |
| | Casey's General Stores Inc | | 128,076 | | | 31,235,175 | |
Food Products – 1.3% | | | |
| | Nomad Foods Ltd* | | 1,775,731 | | | 31,110,807 | |
Gas Utilities – 0.5% | | | |
| | ONE Gas Inc | | 155,012 | | | 11,906,472 | |
Health Care Equipment & Supplies – 4.8% | | | |
| | Embecta Corp | | 1,292,823 | | | 27,924,977 | |
| | Envista Holdings Corp* | | 1,032,404 | | | 34,936,551 | |
| | NuVasive Inc* | | 724,709 | | | 30,140,647 | |
| | Varex Imaging Corp*,£ | | 1,088,819 | | | 25,663,464 | |
| | | 118,665,639 | |
Health Care Providers & Services – 2.9% | | | |
| | Amedisys Inc* | | 123,990 | | | 11,337,646 | |
| | Enhabit Inc* | | 1,651,390 | | | 18,990,985 | |
| | Owens & Minor Inc* | | 2,217,957 | | | 42,229,901 | |
| | | 72,558,532 | |
Health Care Real Estate Investment Trusts (REITs) – 1.3% | | | |
| | Physicians Realty Trust | | 2,275,246 | | | 31,830,692 | |
Hotel & Resort Real Estate Investment Trusts (REITs) – 0.5% | | | |
| | Sunstone Hotel Investors Inc | | 1,315,881 | | | 13,316,716 | |
Hotels, Restaurants & Leisure – 1.2% | | | |
| | Century Casinos Inc*,£ | | 2,024,855 | | | 14,376,470 | |
| | Portillo's Inc - Class A* | | 739,073 | | | 16,651,315 | |
| | | 31,027,785 | |
Household Durables – 3.0% | | | |
| | M/I Homes Inc* | | 357,170 | | | 31,141,652 | |
| | Meritage Homes Corp | | 185,956 | | | 26,455,960 | |
| | Skyline Champion Corp* | | 250,561 | | | 16,399,217 | |
| | | 73,996,829 | |
Industrial Real Estate Investment Trusts (REITs) – 2.6% | | | |
| | STAG Industrial Inc | | 1,782,091 | | | 63,941,425 | |
Insurance – 2.9% | | | |
| | Axis Capital Holdings Ltd | | 387,420 | | | 20,854,819 | |
| | Hanover Insurance Group Inc | | 305,690 | | | 34,552,141 | |
| | Selective Insurance Group Inc | | 167,035 | | | 16,027,008 | |
| | | 71,433,968 | |
Machinery – 6.6% | | | |
| | Hillenbrand Inc | | 1,257,329 | | | 64,475,831 | |
| | Lincoln Electric Holdings Inc | | 218,512 | | | 43,403,039 | |
| | Shyft Group Inc/The | | 1,164,177 | | | 25,681,745 | |
| | Terex Corp | | 516,458 | | | 30,899,682 | |
| | | 164,460,297 | |
Marine – 1.6% | | | |
| | Kirby Corp* | | 512,233 | | | 39,416,329 | |
Metals & Mining – 3.2% | | | |
| | Commercial Metals Co | | 919,985 | | | 48,446,410 | |
| | TimkenSteel Corp* | | 1,392,402 | | | 30,034,111 | |
| | | 78,480,521 | |
Multiline Retail – 0.9% | | | |
| | Ollie's Bargain Outlet Holdings Inc* | | 373,820 | | | 21,655,393 | |
Multi-Utilities – 2.2% | | | |
| | Black Hills Corp | | 921,987 | | | 55,558,937 | |
Office Real Estate Investment Trusts (REITs) – 0.5% | | | |
| | Corporate Office Properties Trust | | 530,612 | | | 12,602,035 | |
| | |
See Notes to Schedule of Investments and Other Information and Notes to Financial Statements. |
| |
Janus Investment Fund | 9 |
Janus Henderson Small Cap Value Fund
Schedule of Investments
June 30, 2023
| | | | | | | | |
Shares or
Principal Amounts | | | Value | |
Common Stocks– (continued) | | | |
Oil, Gas & Consumable Fuels – 5.8% | | | |
| | Gulfport Energy Corp* | | 339,818 | | | $35,704,677 | |
| | Magnolia Oil & Gas Corp | | 1,912,910 | | | 39,979,819 | |
| | Oasis Petroleum Inc | | 454,344 | | | 69,878,107 | |
| | | 145,562,603 | |
Pharmaceuticals – 0.5% | | | |
| | Pacira Pharmaceuticals Inc* | | 323,079 | | | 12,945,776 | |
Professional Services – 1.2% | | | |
| | WNS Holdings Ltd (ADR)* | | 414,569 | | | 30,562,027 | |
Retail Real Estate Investment Trusts (REITs) – 0.9% | | | |
| | Phillips Edison & Co Inc | | 682,935 | | | 23,274,425 | |
Semiconductor & Semiconductor Equipment – 1.8% | | | |
| | Diodes Inc* | | 211,033 | | | 19,518,442 | |
| | Ultra Clean Holdings Inc* | | 657,250 | | | 25,277,835 | |
| | | 44,796,277 | |
Specialized Real Estate Investment Trusts (REITs) – 1.0% | | | |
| | National Storage Affiliates Trust | | 319,385 | | | 11,124,180 | |
| | PotlatchDeltic Corp | | 259,859 | | | 13,733,548 | |
| | | 24,857,728 | |
Specialty Retail – 1.6% | | | |
| | Academy Sports & Outdoors Inc | | 746,235 | | | 40,334,002 | |
Textiles, Apparel & Luxury Goods – 1.2% | | | |
| | Steven Madden Ltd | | 901,076 | | | 29,456,174 | |
Trading Companies & Distributors – 3.8% | | | |
| | GATX Corp | | 244,906 | | | 31,529,198 | |
| | H&E Equipment Services Inc | | 676,905 | | | 30,968,404 | |
| | MSC Industrial Direct Co Inc | | 338,480 | | | 32,250,374 | |
| | | 94,747,976 | |
Total Common Stocks (cost $1,934,657,346) | | 2,410,396,015 | |
Investment Companies– 1.2% | | | |
Exchange-Traded Funds (ETFs) – 1.2% | | | |
| | SPDR S&P Biotech#((cost $30,032,013) | | 361,336 | | | 30,063,155 | |
Repurchase Agreements– 2.0% | | | |
| | ING Financial Markets LLC, Joint repurchase agreement, 5.0500%, dated 6/30/23, maturing 7/3/23 to be repurchased at $25,610,773 collateralized by $28,294,683 in U.S. Treasuries 0% - 4.6250%, 4/18/24 - 11/15/52 with a value of $26,122,993 | | $25,600,000 | | | 25,600,000 | |
| | Royal Bank of Canada, NY Branch, Joint repurchase agreement, 4.9900%, dated 6/30/23, maturing 7/3/23 to be repurchased at $25,010,396 collateralized by $27,357,050 in U.S. Treasuries 2.2500% - 5.4177%, 1/31/24 - 8/15/27 with a value of $25,510,605 | | 25,000,000 | | | 25,000,000 | |
Total Repurchase Agreements (cost $50,600,000) | | 50,600,000 | |
Investments Purchased with Cash Collateral from Securities Lending– 0.7% | | | |
Investment Companies – 0.5% | | | |
| | Janus Henderson Cash Collateral Fund LLC, 4.9971%ºº,£ | | 13,164,153 | | | 13,164,153 | |
Time Deposits – 0.2% | | | |
| | Royal Bank of Canada, 5.0600%, 7/3/23 | | $3,291,038 | | | 3,291,038 | |
Total Investments Purchased with Cash Collateral from Securities Lending (cost $16,455,191) | | 16,455,191 | |
Total Investments (total cost $2,031,744,550) – 100.7% | | 2,507,514,361 | |
Liabilities, net of Cash, Receivables and Other Assets – (0.7)% | | (16,419,675) | |
Net Assets – 100% | | $2,491,094,686 | |
| | |
See Notes to Schedule of Investments and Other Information and Notes to Financial Statements. |
| |
10 | JUNE 30, 2023 |
Janus Henderson Small Cap Value Fund
Schedule of Investments
June 30, 2023
| | | | | | |
Summary of Investments by Country - (Long Positions) (unaudited) |
| |
| | | | | % of | |
| | | | | Investment | |
Country | | Value | | Securities | |
United States | | $2,396,628,167 | | 95.6 | % |
Canada | | 49,213,360 | | 2.0 | |
United Kingdom | | 31,110,807 | | 1.2 | |
India | | 30,562,027 | | 1.2 | |
| | | | | | |
| | | | | | |
Total | | $2,507,514,361 | | 100.0 | % |
Schedules of Affiliated Investments – (% of Net Assets)
| | | | | | | | | | | |
| | Dividend Income(1) | Realized Gain/(Loss)(1) | Change in Unrealized Appreciation/ Depreciation(1) | Value at 6/30/23 |
Common Stocks - 1.6% |
Health Care Equipment & Supplies - 1.0% | |
| | Varex Imaging Corp* | $ | - | $ | (1,755,969) | $ | 2,422,989 | $ | 25,663,464 |
Hotels, Restaurants & Leisure - 0.6% | |
| | Century Casinos Inc* | | - | | (3,929) | | (88,677) | | 14,376,470 |
Total Common Stocks | $ | - | $ | (1,759,898) | $ | 2,334,312 | $ | 40,039,934 |
Investments Purchased with Cash Collateral from Securities Lending - 0.5% |
Investment Companies - 0.5% | |
| | Janus Henderson Cash Collateral Fund LLC, 4.9971%ºº | | 99,410∆ | | - | | - | | 13,164,153 |
Total Affiliated Investments - 2.1% | $ | 99,410 | $ | (1,759,898) | $ | 2,334,312 | $ | 53,204,087 |
(1) For securities that were affiliated for a portion of the year ended June 30, 2023, this column reflects amounts for the entire year ended June 30, 2023 and not just the period in which the security was affiliated.
| | | | | | | | | | | |
| | Value at 6/30/22 | Purchases | Sales Proceeds | Value at 6/30/23 |
Common Stocks - 1.6% |
Health Care Equipment & Supplies - 1.0% | |
| | Varex Imaging Corp* | | 42,753,840 | | 4,572,481 | | (22,329,877) | | 25,663,464 |
Hotels, Restaurants & Leisure - 0.6% | |
| | Century Casinos Inc* | | 15,015,917 | | - | | (546,841) | | 14,376,470 |
Investments Purchased with Cash Collateral from Securities Lending - 0.5% |
Investment Companies - 0.5% | |
| | Janus Henderson Cash Collateral Fund LLC, 4.9971%ºº | | - | | 40,554,882 | | (27,390,729) | | 13,164,153 |
| | |
See Notes to Schedule of Investments and Other Information and Notes to Financial Statements. |
| |
Janus Investment Fund | 11 |
Janus Henderson Small Cap Value Fund
Schedule of Investments
June 30, 2023
| | | | | | | | | | |
Offsetting of Financial Assets and Derivative Assets |
| |
| | | Gross Amounts | | | | | | |
| | | of Recognized | | Offsetting Asset | | Collateral | | |
Counterparty | | Assets | | or Liability(a) | | Pledged(b) | | Net Amount |
| | | | | | | | | |
ING Financial Markets LLC | $ | 25,600,000 | $ | — | $ | (25,600,000) | $ | — |
JPMorgan Chase Bank, National Association | | 16,240,474 | | — | | (16,240,474) | | — |
Royal Bank of Canada, NY Branch | | 25,000,000 | | — | | (25,000,000) | | — |
| | | | | | | | | |
Total | $ | 66,840,474 | $ | — | $ | (66,840,474) | $ | — |
(a) | Represents the amount of assets or liabilities that could be offset with the same counterparty under master netting or similar agreements that management elects not to offset on the Statement of Assets and Liabilities. |
(b) | Collateral pledged is limited to the net outstanding amount due to/from an individual counterparty. The actual collateral amounts pledged may exceed these amounts and may fluctuate in value. |
| | |
See Notes to Schedule of Investments and Other Information and Notes to Financial Statements. |
| |
12 | JUNE 30, 2023 |
Janus Henderson Small Cap Value Fund
Notes to Schedule of Investments and Other Information
| | |
Russell 2000® Value Index | Russell 2000® Value Index reflects the performance of U.S. small-cap equities with lower price-to-book ratios and lower forecasted growth values. |
| | |
ADR | American Depositary Receipt |
LLC | Limited Liability Company |
PLC | Public Limited Company |
SPDR | Standard & Poor's Depositary Receipt |
| | |
* | Non-income producing security. |
| | |
ºº | Rate shown is the 7-day yield as of June 30, 2023. |
| | |
# | Loaned security; a portion of the security is on loan at June 30, 2023. |
| | |
£ | The Fund may invest in certain securities that are considered affiliated companies. As defined by the Investment Company Act of 1940, as amended, an affiliated company is one in which the Fund owns 5% or more of the outstanding voting securities, or a company which is under common ownership or control. |
| | |
∆ | Net of income paid to the securities lending agent and rebates paid to the borrowing counterparties. |
| | | | | | | | | | | | | |
The following is a summary of the inputs that were used to value the Fund’s investments in securities and other financial instruments as of June 30, 2023. See Notes to Financial Statements for more information. |
| |
Valuation Inputs Summary |
| | | | | | | |
| | | | | Level 2 - | | Level 3 - |
| | | Level 1 - | | Other Significant | | Significant |
| | | Quoted Prices | | Observable Inputs | | Unobservable Inputs |
| | | | | | | |
Assets | | | | | | |
Investments In Securities: | | | | | | |
Common Stocks | $ | 2,410,396,015 | $ | - | $ | - |
Investment Companies | | 30,063,155 | | - | | - |
Repurchase Agreements | | - | | 50,600,000 | | - |
Investments Purchased with Cash Collateral from Securities Lending | | - | | 16,455,191 | | - |
Total Assets | $ | 2,440,459,170 | $ | 67,055,191 | $ | - |
| | | | | | | |
Janus Henderson Small Cap Value Fund
Statement of Assets and Liabilities
June 30, 2023
| |
See footnotes at the end of the Statement. |
| | | | | | | |
| | | | | | |
Assets: | | | | |
| Unaffiliated investments, at value (cost $1,936,921,300)(1) | | $ | 2,403,710,274 | |
| Affiliated investments, at value (cost $44,223,250) | | | 53,204,087 | |
| Repurchase agreements, at value (cost $50,600,000) | | | 50,600,000 | |
| Cash | | | 59,781 | |
| Trustees' deferred compensation | | | 63,337 | |
| Receivables: | | | | |
| | Investments sold | | | 8,729,258 | |
| | Dividends | | | 2,313,613 | |
| | Fund shares sold | | | 1,364,777 | |
| | Interest | | | 21,169 | |
| Other assets | | | 56,669 | |
Total Assets | | | 2,520,122,965 | |
Liabilities: | | | | |
| Collateral for securities loaned (Note 2) | | | 16,455,191 | |
| Payables: | | | — | |
| | Investments purchased | | | 6,979,553 | |
| | Fund shares repurchased | | | 3,860,613 | |
| | Advisory fees | | | 1,143,700 | |
| | Transfer agent fees and expenses | | | 286,753 | |
| | Trustees' deferred compensation fees | | | 63,337 | |
| | Professional fees | | | 57,606 | |
| | 12b-1 Distribution and shareholder servicing fees | | | 45,412 | |
| | Trustees' fees and expenses | | | 16,032 | |
| | Affiliated fund administration fees payable | | | 5,397 | |
| | Custodian fees | | | 5,250 | |
| | Accrued expenses and other payables | | | 109,435 | |
Total Liabilities | | | 29,028,279 | |
Net Assets | | $ | 2,491,094,686 | |
| | |
See Notes to Financial Statements. |
| |
14 | JUNE 30, 2023 |
Janus Henderson Small Cap Value Fund
Statement of Assets and Liabilities
June 30, 2023
| | | | | | | |
| | | | | | |
| | | | | | | |
Net Assets Consist of: | | | | |
| Capital (par value and paid-in surplus) | | $ | 1,897,404,016 | |
| Total distributable earnings (loss) | | | 593,690,670 | |
Total Net Assets | | $ | 2,491,094,686 | |
Net Assets - Class A Shares | | $ | 27,929,722 | |
| Shares Outstanding, $0.01 Par Value (unlimited shares authorized) | | | 1,220,244 | |
Net Asset Value Per Share(2) | | $ | 22.89 | |
Maximum Offering Price Per Share(3) | | $ | 24.29 | |
Net Assets - Class C Shares | | $ | 17,031,584 | |
| Shares Outstanding, $0.01 Par Value (unlimited shares authorized) | | | 810,454 | |
Net Asset Value Per Share(2) | | $ | 21.01 | |
Net Assets - Class D Shares | | $ | 89,434,161 | |
| Shares Outstanding, $0.01 Par Value (unlimited shares authorized) | | | 3,955,236 | |
Net Asset Value Per Share | | $ | 22.61 | |
Net Assets - Class I Shares | | $ | 1,372,676,512 | |
| Shares Outstanding, $0.01 Par Value (unlimited shares authorized) | | | 60,398,573 | |
Net Asset Value Per Share | | $ | 22.73 | |
Net Assets - Class L Shares | | $ | 81,632,712 | |
| Shares Outstanding, $0.01 Par Value (unlimited shares authorized) | | | 3,475,908 | |
Net Asset Value Per Share | | $ | 23.49 | |
Net Assets - Class N Shares | | $ | 525,231,250 | |
| Shares Outstanding, $0.01 Par Value (unlimited shares authorized) | | | 23,139,668 | |
Net Asset Value Per Share | | $ | 22.70 | |
Net Assets - Class R Shares | | $ | 42,026,684 | |
| Shares Outstanding, $0.01 Par Value (unlimited shares authorized) | | | 1,915,638 | |
Net Asset Value Per Share | | $ | 21.94 | |
Net Assets - Class S Shares | | $ | 27,150,052 | |
| Shares Outstanding, $0.01 Par Value (unlimited shares authorized) | | | 1,209,593 | |
Net Asset Value Per Share | | $ | 22.45 | |
Net Assets - Class T Shares | | $ | 307,982,009 | |
| Shares Outstanding, $0.01 Par Value (unlimited shares authorized) | | | 13,567,308 | |
Net Asset Value Per Share | | $ | 22.70 | |
| |
(1) Includes $16,240,474 of securities on loan. See Note 2 in Notes to Financial Statements. (2) Redemption price per share may be reduced for any applicable contingent deferred sales charge. (3) Maximum offering price is computed at 100/94.25 of net asset value. |
| | |
See Notes to Financial Statements. |
| |
Janus Investment Fund | 15 |
Janus Henderson Small Cap Value Fund
Statement of Operations
For the year ended June 30, 2023
| | | | | | |
| | | | | |
Investment Income: | | | |
| Dividends | $ | 41,629,725 | |
| Interest | | 1,633,642 | |
| Affiliated securities lending income, net | | 99,410 | |
| Unaffiliated securities lending income, net | | 25,606 | |
| Other income | | 262 | |
| Foreign tax withheld | | (19,865) | |
Total Investment Income | | 43,368,780 | |
Expenses: | | | |
| Advisory fees | | 14,052,851 | |
| 12b-1 Distribution and shareholder servicing fees: | | | |
| | Class A Shares | | 63,704 | |
| | Class C Shares | | 175,218 | |
| | Class R Shares | | 224,102 | |
| | Class S Shares | | 70,116 | |
| Transfer agent administrative fees and expenses: | | | |
| | Class D Shares | | 107,245 | |
| | Class L Shares | | 170,464 | |
| | Class R Shares | | 112,172 | |
| | Class S Shares | | 70,173 | |
| | Class T Shares | | 884,378 | |
| Transfer agent networking and omnibus fees: | | | |
| | Class A Shares | | 91,122 | |
| | Class C Shares | | 16,212 | |
| | Class I Shares | | 2,317,026 | |
| Other transfer agent fees and expenses: | | | |
| | Class A Shares | | 2,197 | |
| | Class C Shares | | 895 | |
| | Class D Shares | | 17,110 | |
| | Class I Shares | | 81,148 | |
| | Class L Shares | | 1,684 | |
| | Class N Shares | | 25,045 | |
| | Class R Shares | | 932 | |
| | Class S Shares | | 635 | |
| | Class T Shares | | 5,027 | |
| Registration fees | | 236,037 | |
| Shareholder reports expense | | 190,091 | |
| Affiliated fund administration fees | | 84,391 | |
| Professional fees | | 82,647 | |
| Trustees’ fees and expenses | | 71,590 | |
| Custodian fees | | 23,751 | |
| Other expenses | | 213,292 | |
Total Expenses | | 19,391,255 | |
Less: Excess Expense Reimbursement and Waivers | | (349,298) | |
Net Expenses | | 19,041,957 | |
Net Investment Income/(Loss) | | 24,326,823 | |
| | | | | |
| | |
See Notes to Financial Statements. |
| |
16 | JUNE 30, 2023 |
Janus Henderson Small Cap Value Fund
Statement of Operations
For the year ended June 30, 2023
| | | | | | |
| | | | | |
Net Realized Gain/(Loss) on Investments: | | | |
| Investments and foreign currency transactions | $ | 116,886,871 | |
| Investments in affiliates | | (1,759,898) | |
Total Net Realized Gain/(Loss) on Investments | | 115,126,973 | |
Change in Unrealized Net Appreciation/Depreciation: | | | |
| Investments, foreign currency translations and Trustees’ deferred compensation | | 177,891,356 | |
| Investments in affiliates | | 2,334,312 | |
Total Change in Unrealized Net Appreciation/Depreciation | | 180,225,668 | |
Net Increase/(Decrease) in Net Assets Resulting from Operations | $ | 319,679,464 | |
| | | | | |
| | |
See Notes to Financial Statements. |
| |
Janus Investment Fund | 17 |
Janus Henderson Small Cap Value Fund
Statements of Changes in Net Assets
| | | | | | | | | |
| | | | | | | | |
| | | Year ended
June 30, 2023 | | Year ended
June 30, 2022 | |
| | | | | | | | | |
Operations: | | | | | | |
| Net investment income/(loss) | $ | 24,326,823 | | $ | 17,827,750 | |
| Net realized gain/(loss) on investments | | 115,126,973 | | | 235,198,671 | |
| Change in unrealized net appreciation/depreciation | | 180,225,668 | | | (685,581,612) | |
Net Increase/(Decrease) in Net Assets Resulting from Operations | | 319,679,464 | | | (432,555,191) | |
Dividends and Distributions to Shareholders: | | | | | | |
| | Class A Shares | | (1,201,002) | | | (1,127,366) | |
| | Class C Shares | | (797,503) | | | (333,534) | |
| | Class D Shares | | (4,306,275) | | | (1,952,056) | |
| | Class I Shares | | (67,590,940) | | | (35,391,712) | |
| | Class L Shares | | (3,957,051) | | | (2,168,424) | |
| | Class N Shares | | (26,860,645) | | | (17,702,297) | |
| | Class R Shares | | (1,858,291) | | | (834,998) | |
| | Class S Shares | | (1,201,026) | | | (623,421) | |
| | Class T Shares | | (15,583,510) | | | (9,580,571) | |
Net Decrease from Dividends and Distributions to Shareholders | | (123,356,243) | | | (69,714,379) | |
Capital Share Transactions: | | | | | | |
| | Class A Shares | | (4,037,263) | | | (32,725,992) | |
| | Class C Shares | | (1,542,913) | | | (2,210,185) | |
| | Class D Shares | | (2,926,076) | | | (6,166,574) | |
| | Class I Shares | | (166,213,635) | | | (424,960,781) | |
| | Class L Shares | | (15,502,175) | | | (14,048,314) | |
| | Class N Shares | | (105,130,829) | | | (217,820,011) | |
| | Class R Shares | | (6,019,543) | | | 3,548,749 | |
| | Class S Shares | | (1,869,761) | | | (11,119,133) | |
| | Class T Shares | | (107,076,257) | | | (116,734,518) | |
Net Increase/(Decrease) from Capital Share Transactions | | (410,318,452) | | | (822,236,759) | |
Net Increase/(Decrease) in Net Assets | | (213,995,231) | | | (1,324,506,329) | |
Net Assets: | | | | | | |
| Beginning of period | | 2,705,089,917 | | | 4,029,596,246 | |
| End of period | $ | 2,491,094,686 | | $ | 2,705,089,917 | |
| | | | | | | | |
| | |
See Notes to Financial Statements. |
| |
18 | JUNE 30, 2023 |
Janus Henderson Small Cap Value Fund
Financial Highlights
| | | | | | | | | | | | | | | | | | | |
Class A Shares | | | | | | | | | | | | | | | |
For a share outstanding during the year ended June 30 | | 2023 | | | 2022 | | | 2021 | | | 2020 | | | 2019 | |
| Net Asset Value, Beginning of Period | | $21.24 | | | $24.95 | | | $17.59 | | | $21.57 | | | $23.18 | |
| Income/(Loss) from Investment Operations: | | | | | | | | | | | | | | | |
| | Net investment income/(loss)(1) | | 0.16 | | | 0.04 | | | 0.13 | | | 0.15 | | | 0.25 | |
| | Net realized and unrealized gain/(loss) | | 2.44 | | | (3.32) | | | 7.40 | | | (4.00) | | | (0.39) | |
| Total from Investment Operations | | 2.60 | | | (3.28) | | | 7.53 | | | (3.85) | | | (0.14) | |
| Less Dividends and Distributions: | | | | | | | | | | | | | | | |
| | Dividends (from net investment income) | | — | | | (0.17) | | | (0.17) | | | (0.13) | | | — | |
| | Distributions (from capital gains) | | (0.95) | | | (0.26) | | | — | | | — | | | (1.47) | |
| Total Dividends and Distributions | | (0.95) | | | (0.43) | | | (0.17) | | | (0.13) | | | (1.47) | |
| Net Asset Value, End of Period | | $22.89 | | | $21.24 | | | $24.95 | | | $17.59 | | | $21.57 | |
| Total Return* | | 12.39% | | | (13.44)% | | | 42.99% | | | (17.98)% | | | 0.56% | |
| Net Assets, End of Period (in thousands) | | $27,930 | | | $29,651 | | | $69,385 | | | $64,025 | | | $61,505 | |
| Average Net Assets for the Period (in thousands) | | $29,442 | | | $61,533 | | | $68,997 | | | $62,337 | | | $48,049 | |
| Ratios to Average Net Assets**: | | | | | | | | | | | | | | | |
| | Ratio of Gross Expenses | | 1.11% | | | 1.77% | | | 1.76% | | | 1.86% | | | 1.27% | |
| | Ratio of Net Expenses (After Waivers and Expense Offsets) | | 0.91% | | | 1.05% | | | 1.11% | | | 1.39% | | | 1.14% | |
| | Ratio of Net Investment Income/(Loss) | | 0.73% | | | 0.18% | | | 0.59% | | | 0.77% | | | 1.15% | |
| Portfolio Turnover Rate | | 44% | | | 44% | | | 53% | | | 59% | | | 39% | |
| | | | | | | | | | | | | | | | | | | |
| |
* Total return includes adjustments in accordance with generally accepted accounting principles required at the year or period end and are not annualized for periods of less than one full year. ** Annualized for periods of less than one full year. (1) Per share amounts are calculated based on average shares outstanding during the year or period. |
| | |
See Notes to Financial Statements. |
| |
Janus Investment Fund | 19 |
Janus Henderson Small Cap Value Fund
Financial Highlights
| | | | | | | | | | | | | | | | | | | |
Class C Shares | | | | | | | | | | | | | | | |
For a share outstanding during the year ended June 30 | | 2023 | | | 2022 | | | 2021 | | | 2020 | | | 2019 | |
| Net Asset Value, Beginning of Period | | $19.71 | | | $23.27 | | | $16.41 | | | $20.12 | | | $21.87 | |
| Income/(Loss) from Investment Operations: | | | | | | | | | | | | | | | |
| | Net investment income/(loss)(1) | | —(2) | | | (0.10) | | | (0.01) | | | 0.06 | | | 0.11 | |
| | Net realized and unrealized gain/(loss) | | 2.25 | | | (3.10) | | | 6.91 | | | (3.77) | | | (0.39) | |
| Total from Investment Operations | | 2.25 | | | (3.20) | | | 6.90 | | | (3.71) | | | (0.28) | |
| Less Dividends and Distributions: | | | | | | | | | | | | | | | |
| | Dividends (from net investment income) | | — | | | (0.10) | | | (0.04) | | | — | | | — | |
| | Distributions (from capital gains) | | (0.95) | | | (0.26) | | | — | | | — | | | (1.47) | |
| Total Dividends and Distributions | | (0.95) | | | (0.36) | | | (0.04) | | | — | | | (1.47) | |
| Net Asset Value, End of Period | | $21.01 | | | $19.71 | | | $23.27 | | | $16.41 | | | $20.12 | |
| Total Return* | | 11.56% | | | (14.02)% | | | 42.07% | | | (18.44)% | | | (0.07)% | |
| Net Assets, End of Period (in thousands) | | $17,032 | | | $17,440 | | | $22,889 | | | $20,967 | | | $29,619 | |
| Average Net Assets for the Period (in thousands) | | $17,910 | | | $21,362 | | | $22,037 | | | $26,855 | | | $26,902 | |
| Ratios to Average Net Assets**: | | | | | | | | | | | | | | | |
| | Ratio of Gross Expenses | | 1.65% | | | 1.69% | | | 1.77% | | | 1.92% | | | 1.75% | |
| | Ratio of Net Expenses (After Waivers and Expense Offsets) | | 1.65% | | | 1.69% | | | 1.77% | | | 1.92% | | | 1.75% | |
| | Ratio of Net Investment Income/(Loss) | | (0.01)% | | | (0.45)% | | | (0.06)% | | | 0.30% | | | 0.56% | |
| Portfolio Turnover Rate | | 44% | | | 44% | | | 53% | | | 59% | | | 39% | |
| | | | | | | | | | | | | | | | | | | |
| |
* Total return includes adjustments in accordance with generally accepted accounting principles required at the year or period end and are not annualized for periods of less than one full year. ** Annualized for periods of less than one full year. (1) Per share amounts are calculated based on average shares outstanding during the year or period. (2) Less than $0.005 on a per share basis. |
| | |
See Notes to Financial Statements. |
| |
20 | JUNE 30, 2023 |
Janus Henderson Small Cap Value Fund
Financial Highlights
| | | | | | | | | | | | | | | | | | | |
Class D Shares | | | | | | | | | | | | | | | |
For a share outstanding during the year ended June 30 | | 2023 | | | 2022 | | | 2021 | | | 2020 | | | 2019 | |
| Net Asset Value, Beginning of Period | | $21.08 | | | $24.75 | | | $17.44 | | | $21.38 | | | $22.99 | |
| Income/(Loss) from Investment Operations: | | | | | | | | | | | | | | | |
| | Net investment income/(loss)(1) | | 0.21 | | | 0.12 | | | 0.18 | | | 0.24 | | | 0.32 | |
| | Net realized and unrealized gain/(loss) | | 2.41 | | | (3.32) | | | 7.35 | | | (3.96) | | | (0.41) | |
| Total from Investment Operations | | 2.62 | | | (3.20) | | | 7.53 | | | (3.72) | | | (0.09) | |
| Less Dividends and Distributions: | | | | | | | | | | | | | | | |
| | Dividends (from net investment income) | | (0.14) | | | (0.21) | | | (0.22) | | | (0.22) | | | (0.05) | |
| | Distributions (from capital gains) | | (0.95) | | | (0.26) | | | — | | | — | | | (1.47) | |
| Total Dividends and Distributions | | (1.09) | | | (0.47) | | | (0.22) | | | (0.22) | | | (1.52) | |
| Net Asset Value, End of Period | | $22.61 | | | $21.08 | | | $24.75 | | | $17.44 | | | $21.38 | |
| Total Return* | | 12.63% | | | (13.24)% | | | 43.43% | | | (17.65)% | | | 0.82% | |
| Net Assets, End of Period (in thousands) | | $89,434 | | | $86,052 | | | $107,471 | | | $86,650 | | | $116,468 | |
| Average Net Assets for the Period (in thousands) | | $90,698 | | | $101,735 | | | $94,637 | | | $105,847 | | | $117,978 | |
| Ratios to Average Net Assets**: | | | | | | | | | | | | | | | |
| | Ratio of Gross Expenses | | 0.72% | | | 0.75% | | | 0.84% | | | 1.01% | | | 0.83% | |
| | Ratio of Net Expenses (After Waivers and Expense Offsets) | | 0.72% | | | 0.75% | | | 0.84% | | | 1.01% | | | 0.83% | |
| | Ratio of Net Investment Income/(Loss) | | 0.92% | | | 0.49% | | | 0.84% | | | 1.20% | | | 1.48% | |
| Portfolio Turnover Rate | | 44% | | | 44% | | | 53% | | | 59% | | | 39% | |
| | | | | | | | | | | | | | | | | | | |
| |
* Total return includes adjustments in accordance with generally accepted accounting principles required at the year or period end and are not annualized for periods of less than one full year. ** Annualized for periods of less than one full year. (1) Per share amounts are calculated based on average shares outstanding during the year or period. |
| | |
See Notes to Financial Statements. |
| |
Janus Investment Fund | 21 |
Janus Henderson Small Cap Value Fund
Financial Highlights
| | | | | | | | | | | | | | | | | | | |
Class I Shares | | | | | | | | | | | | | | | |
For a share outstanding during the year ended June 30 | | 2023 | | | 2022 | | | 2021 | | | 2020 | | | 2019 | |
| Net Asset Value, Beginning of Period | | $21.18 | | | $24.86 | | | $17.53 | | | $21.50 | | | $23.12 | |
| Income/(Loss) from Investment Operations: | | | | | | | | | | | | | | | |
| | Net investment income/(loss)(1) | | 0.21 | | | 0.12 | | | 0.19 | | | 0.24 | | | 0.33 | |
| | Net realized and unrealized gain/(loss) | | 2.43 | | | (3.33) | | | 7.37 | | | (3.97) | | | (0.41) | |
| Total from Investment Operations | | 2.64 | | | (3.21) | | | 7.56 | | | (3.73) | | | (0.08) | |
| Less Dividends and Distributions: | | | | | | | | | | | | | | | |
| | Dividends (from net investment income) | | (0.14) | | | (0.21) | | | (0.23) | | | (0.24) | | | (0.07) | |
| | Distributions (from capital gains) | | (0.95) | | | (0.26) | | | — | | | — | | | (1.47) | |
| Total Dividends and Distributions | | (1.09) | | | (0.47) | | | (0.23) | | | (0.24) | | | (1.54) | |
| Net Asset Value, End of Period | | $22.73 | | | $21.18 | | | $24.86 | | | $17.53 | | | $21.50 | |
| Total Return* | | 12.65% | | | (13.21)% | | | 43.36% | | | (17.62)% | | | 0.89% | |
| Net Assets, End of Period (in thousands) | | $1,372,677 | | | $1,436,933 | | | $2,121,333 | | | $1,584,586 | | | $1,531,568 | |
| Average Net Assets for the Period (in thousands) | | $1,444,167 | | | $1,839,602 | | | $1,887,591 | | | $1,646,400 | | | $1,337,975 | |
| Ratios to Average Net Assets**: | | | | | | | | | | | | | | | |
| | Ratio of Gross Expenses | | 0.73% | | | 0.74% | | | 0.81% | | | 1.01% | | | 0.79% | |
| | Ratio of Net Expenses (After Waivers and Expense Offsets) | | 0.72% | | | 0.74% | | | 0.81% | | | 1.01% | | | 0.79% | |
| | Ratio of Net Investment Income/(Loss) | | 0.92% | | | 0.50% | | | 0.87% | | | 1.19% | | | 1.52% | |
| Portfolio Turnover Rate | | 44% | | | 44% | | | 53% | | | 59% | | | 39% | |
| | | | | | | | | | | | | | | | | | | |
| |
* Total return includes adjustments in accordance with generally accepted accounting principles required at the year or period end and are not annualized for periods of less than one full year. ** Annualized for periods of less than one full year. (1) Per share amounts are calculated based on average shares outstanding during the year or period. |
| | |
See Notes to Financial Statements. |
| |
22 | JUNE 30, 2023 |
Janus Henderson Small Cap Value Fund
Financial Highlights
| | | | | | | | | | | | | | | | | | | |
Class L Shares | | | | | | | | | | | | | | | |
For a share outstanding during the year ended June 30 | | 2023 | | | 2022 | | | 2021 | | | 2020 | | | 2019 | |
| Net Asset Value, Beginning of Period | | $21.86 | | | $25.62 | | | $18.05 | | | $22.13 | | | $23.73 | |
| Income/(Loss) from Investment Operations: | | | | | | | | | | | | | | | |
| | Net investment income/(loss)(1) | | 0.25 | | | 0.16 | | | 0.22 | | | 0.28 | | | 0.36 | |
| | Net realized and unrealized gain/(loss) | | 2.51 | | | (3.43) | | | 7.60 | | | (4.10) | | | (0.42) | |
| Total from Investment Operations | | 2.76 | | | (3.27) | | | 7.82 | | | (3.82) | | | (0.06) | |
| Less Dividends and Distributions: | | | | | | | | | | | | | | | |
| | Dividends (from net investment income) | | (0.18) | | | (0.23) | | | (0.25) | | | (0.26) | | | (0.07) | |
| | Distributions (from capital gains) | | (0.95) | | | (0.26) | | | — | | | — | | | (1.47) | |
| Total Dividends and Distributions | | (1.13) | | | (0.49) | | | (0.25) | | | (0.26) | | | (1.54) | |
| Net Asset Value, End of Period | | $23.49 | | | $21.86 | | | $25.62 | | | $18.05 | | | $22.13 | |
| Total Return* | | 12.80% | | | (13.07)% | | | 43.60% | | | (17.53)% | | | 0.97% | |
| Net Assets, End of Period (in thousands) | | $81,633 | | | $90,492 | | | $120,351 | | | $97,950 | | | $148,304 | |
| Average Net Assets for the Period (in thousands) | | $86,269 | | | $111,073 | | | $109,087 | | | $130,117 | | | $155,137 | |
| Ratios to Average Net Assets**: | | | | | | | | | | | | | | | |
| | Ratio of Gross Expenses | | 0.77% | | | 0.81% | | | 0.88% | | | 1.06% | | | 0.88% | |
| | Ratio of Net Expenses (After Waivers and Expense Offsets) | | 0.58% | | | 0.62% | | | 0.69% | | | 0.87% | | | 0.69% | |
| | Ratio of Net Investment Income/(Loss) | | 1.06% | | | 0.63% | | | 1.00% | | | 1.36% | | | 1.62% | |
| Portfolio Turnover Rate | | 44% | | | 44% | | | 53% | | | 59% | | | 39% | |
| | | | | | | | | | | | | | | | | | | |
| |
* Total return includes adjustments in accordance with generally accepted accounting principles required at the year or period end and are not annualized for periods of less than one full year. ** Annualized for periods of less than one full year. (1) Per share amounts are calculated based on average shares outstanding during the year or period. |
| | |
See Notes to Financial Statements. |
| |
Janus Investment Fund | 23 |
Janus Henderson Small Cap Value Fund
Financial Highlights
| | | | | | | | | | | | | | | | | | | |
Class N Shares | | | | | | | | | | | | | | | |
For a share outstanding during the year ended June 30 | | 2023 | | | 2022 | | | 2021 | | | 2020 | | | 2019 | |
| Net Asset Value, Beginning of Period | | $21.16 | | | $24.82 | | | $17.50 | | | $21.46 | | | $23.08 | |
| Income/(Loss) from Investment Operations: | | | | | | | | | | | | | | | |
| | Net investment income/(loss)(1) | | 0.24 | | | 0.16 | | | 0.22 | | | 0.26 | | | 0.35 | |
| | Net realized and unrealized gain/(loss) | | 2.43 | | | (3.33) | | | 7.36 | | | (3.95) | | | (0.42) | |
| Total from Investment Operations | | 2.67 | | | (3.17) | | | 7.58 | | | (3.69) | | | (0.07) | |
| Less Dividends and Distributions: | | | | | | | | | | | | | | | |
| | Dividends (from net investment income) | | (0.18) | | | (0.23) | | | (0.26) | | | (0.27) | | | (0.08) | |
| | Distributions (from capital gains) | | (0.95) | | | (0.26) | | | — | | | — | | | (1.47) | |
| Total Dividends and Distributions | | (1.13) | | | (0.49) | | | (0.26) | | | (0.27) | | | (1.55) | |
| Net Asset Value, End of Period | | $22.70 | | | $21.16 | | | $24.82 | | | $17.50 | | | $21.46 | |
| Total Return* | | 12.81% | | | (13.09)% | | | 43.57% | | | (17.48)% | | | 0.97% | |
| Net Assets, End of Period (in thousands) | | $525,231 | | | $586,927 | | | $922,073 | | | $676,894 | | | $585,199 | |
| Average Net Assets for the Period (in thousands) | | $551,264 | | | $822,081 | | | $839,582 | | | $632,706 | | | $515,945 | |
| Ratios to Average Net Assets**: | | | | | | | | | | | | | | | |
| | Ratio of Gross Expenses | | 0.57% | | | 0.60% | | | 0.67% | | | 0.86% | | | 0.68% | |
| | Ratio of Net Expenses (After Waivers and Expense Offsets) | | 0.57% | | | 0.60% | | | 0.67% | | | 0.86% | | | 0.68% | |
| | Ratio of Net Investment Income/(Loss) | | 1.07% | | | 0.65% | | | 1.01% | | | 1.31% | | | 1.65% | |
| Portfolio Turnover Rate | | 44% | | | 44% | | | 53% | | | 59% | | | 39% | |
| | | | | | | | | | | | | | | | | | | |
| |
* Total return includes adjustments in accordance with generally accepted accounting principles required at the year or period end and are not annualized for periods of less than one full year. ** Annualized for periods of less than one full year. (1) Per share amounts are calculated based on average shares outstanding during the year or period. |
| | |
See Notes to Financial Statements. |
| |
24 | JUNE 30, 2023 |
Janus Henderson Small Cap Value Fund
Financial Highlights
| | | | | | | | | | | | | | | | | | | |
Class R Shares | | | | | | | | | | | | | | | |
For a share outstanding during the year ended June 30 | | 2023 | | | 2022 | | | 2021 | | | 2020 | | | 2019 | |
| Net Asset Value, Beginning of Period | | $20.47 | | | $24.12 | | | $17.03 | | | $20.84 | | | $22.53 | |
| Income/(Loss) from Investment Operations: | | | | | | | | | | | | | | | |
| | Net investment income/(loss)(1) | | 0.07 | | | (0.03) | | | 0.05 | | | 0.11 | | | 0.18 | |
| | Net realized and unrealized gain/(loss) | | 2.35 | | | (3.22) | | | 7.16 | | | (3.87) | | | (0.40) | |
| Total from Investment Operations | | 2.42 | | | (3.25) | | | 7.21 | | | (3.76) | | | (0.22) | |
| Less Dividends and Distributions: | | | | | | | | | | | | | | | |
| | Dividends (from net investment income) | | — | | | (0.14) | | | (0.12) | | | (0.05) | | | — | |
| | Distributions (from capital gains) | | (0.95) | | | (0.26) | | | — | | | — | | | (1.47) | |
| Total Dividends and Distributions | | (0.95) | | | (0.40) | | | (0.12) | | | (0.05) | | | (1.47) | |
| Net Asset Value, End of Period | | $21.94 | | | $20.47 | | | $24.12 | | | $17.03 | | | $20.84 | |
| Total Return* | | 11.97% | | | (13.73)% | | | 42.49% | | | (18.11)% | | | 0.20% | |
| Net Assets, End of Period (in thousands) | | $42,027 | | | $44,592 | | | $48,908 | | | $33,724 | | | $37,555 | |
| Average Net Assets for the Period (in thousands) | | $44,634 | | | $49,737 | | | $42,169 | | | $36,610 | | | $36,037 | |
| Ratios to Average Net Assets**: | | | | | | | | | | | | | | | |
| | Ratio of Gross Expenses | | 1.33% | | | 1.36% | | | 1.42% | | | 1.61% | | | 1.43% | |
| | Ratio of Net Expenses (After Waivers and Expense Offsets) | | 1.33% | | | 1.36% | | | 1.42% | | | 1.61% | | | 1.43% | |
| | Ratio of Net Investment Income/(Loss) | | 0.32% | | | (0.11)% | | | 0.25% | | | 0.57% | | | 0.87% | |
| Portfolio Turnover Rate | | 44% | | | 44% | | | 53% | | | 59% | | | 39% | |
| | | | | | | | | | | | | | | | | | | |
| |
* Total return includes adjustments in accordance with generally accepted accounting principles required at the year or period end and are not annualized for periods of less than one full year. ** Annualized for periods of less than one full year. (1) Per share amounts are calculated based on average shares outstanding during the year or period. |
| | |
See Notes to Financial Statements. |
| |
Janus Investment Fund | 25 |
Janus Henderson Small Cap Value Fund
Financial Highlights
| | | | | | | | | | | | | | | | | | | |
Class S Shares | | | | | | | | | | | | | | | |
For a share outstanding during the year ended June 30 | | 2023 | | | 2022 | | | 2021 | | | 2020 | | | 2019 | |
| Net Asset Value, Beginning of Period | | $20.91 | | | $24.57 | | | $17.32 | | | $21.23 | | | $22.85 | |
| Income/(Loss) from Investment Operations: | | | | | | | | | | | | | | | |
| | Net investment income/(loss)(1) | | 0.12 | | | 0.03 | | | 0.11 | | | 0.17 | | | 0.24 | |
| | Net realized and unrealized gain/(loss) | | 2.40 | | | (3.28) | | | 7.29 | | | (3.95) | | | (0.39) | |
| Total from Investment Operations | | 2.52 | | | (3.25) | | | 7.40 | | | (3.78) | | | (0.15) | |
| Less Dividends and Distributions: | | | | | | | | | | | | | | | |
| | Dividends (from net investment income) | | (0.03) | | | (0.15) | | | (0.15) | | | (0.13) | | | — | |
| | Distributions (from capital gains) | | (0.95) | | | (0.26) | | | — | | | — | | | (1.47) | |
| Total Dividends and Distributions | | (0.98) | | | (0.41) | | | (0.15) | | | (0.13) | | | (1.47) | |
| Net Asset Value, End of Period | | $22.45 | | | $20.91 | | | $24.57 | | | $17.32 | | | $21.23 | |
| Total Return* | | 12.22% | | | (13.49)% | | | 42.91% | | | (17.96)% | | | 0.52% | |
| Net Assets, End of Period (in thousands) | | $27,150 | | | $26,996 | | | $42,715 | | | $43,538 | | | $55,050 | |
| Average Net Assets for the Period (in thousands) | | $27,921 | | | $36,165 | | | $45,978 | | | $56,349 | | | $55,579 | |
| Ratios to Average Net Assets**: | | | | | | | | | | | | | | | |
| | Ratio of Gross Expenses | | 1.08% | | | 1.11% | | | 1.18% | | | 1.36% | | | 1.18% | |
| | Ratio of Net Expenses (After Waivers and Expense Offsets) | | 1.08% | | | 1.11% | | | 1.18% | | | 1.36% | | | 1.18% | |
| | Ratio of Net Investment Income/(Loss) | | 0.56% | | | 0.14% | | | 0.55% | | | 0.87% | | | 1.14% | |
| Portfolio Turnover Rate | | 44% | | | 44% | | | 53% | | | 59% | | | 39% | |
| | | | | | | | | | | | | | | | | | | |
| |
* Total return includes adjustments in accordance with generally accepted accounting principles required at the year or period end and are not annualized for periods of less than one full year. ** Annualized for periods of less than one full year. (1) Per share amounts are calculated based on average shares outstanding during the year or period. |
| | |
See Notes to Financial Statements. |
| |
26 | JUNE 30, 2023 |
Janus Henderson Small Cap Value Fund
Financial Highlights
| | | | | | | | | | | | | | | | | | | |
Class T Shares | | | | | | | | | | | | | | | |
For a share outstanding during the year ended June 30 | | 2023 | | | 2022 | | | 2021 | | | 2020 | | | 2019 | |
| Net Asset Value, Beginning of Period | | $21.14 | | | $24.82 | | | $17.49 | | | $21.44 | | | $23.03 | |
| Income/(Loss) from Investment Operations: | | | | | | | | | | | | | | | |
| | Net investment income/(loss)(1) | | 0.19 | | | 0.10 | | | 0.17 | | | 0.22 | | | 0.30 | |
| | Net realized and unrealized gain/(loss) | | 2.42 | | | (3.33) | | | 7.36 | | | (3.98) | | | (0.40) | |
| Total from Investment Operations | | 2.61 | | | (3.23) | | | 7.53 | | | (3.76) | | | (0.10) | |
| Less Dividends and Distributions: | | | | | | | | | | | | | | | |
| | Dividends (from net investment income) | | (0.10) | | | (0.19) | | | (0.20) | | | (0.19) | | | (0.02) | |
| | Distributions (from capital gains) | | (0.95) | | | (0.26) | | | — | | | — | | | (1.47) | |
| Total Dividends and Distributions | | (1.05) | | | (0.45) | | | (0.20) | | | (0.19) | | | (1.49) | |
| Net Asset Value, End of Period | | $22.70 | | | $21.14 | | | $24.82 | | | $17.49 | | | $21.44 | |
| Total Return* | | 12.51% | | | (13.29)% | | | 43.30% | | | (17.74)% | | | 0.76% | |
| Net Assets, End of Period (in thousands) | | $307,982 | | | $386,007 | | | $574,472 | | | $516,634 | | | $652,049 | |
| Average Net Assets for the Period (in thousands) | | $352,068 | | | $511,237 | | | $555,651 | | | $621,808 | | | $681,320 | |
| Ratios to Average Net Assets**: | | | | | | | | | | | | | | | |
| | Ratio of Gross Expenses | | 0.82% | | | 0.85% | | | 0.92% | | | 1.10% | | | 0.92% | |
| | Ratio of Net Expenses (After Waivers and Expense Offsets) | | 0.81% | | | 0.85% | | | 0.92% | | | 1.10% | | | 0.92% | |
| | Ratio of Net Investment Income/(Loss) | | 0.82% | | | 0.40% | | | 0.78% | | | 1.11% | | | 1.38% | |
| Portfolio Turnover Rate | | 44% | | | 44% | | | 53% | | | 59% | | | 39% | |
| | | | | | | | | | | | | | | | | | | |
| |
* Total return includes adjustments in accordance with generally accepted accounting principles required at the year or period end and are not annualized for periods of less than one full year. ** Annualized for periods of less than one full year. (1) Per share amounts are calculated based on average shares outstanding during the year or period. |
| | |
See Notes to Financial Statements. |
| |
Janus Investment Fund | 27 |
Janus Henderson Small Cap Value Fund
Notes to Financial Statements
1. Organization and Significant Accounting Policies
Janus Henderson Small Cap Value Fund (the “Fund”) is a series of Janus Investment Fund (the “Trust”), which is organized as a Massachusetts business trust and is registered under the Investment Company Act of 1940, as amended (the “1940 Act”), as an open-end management investment company, and therefore has applied the specialized accounting and reporting guidance in Financial Accounting Standards Board (“FASB”) Accounting Standards Codification (“ASC”) Topic 946. The Trust offers 39 funds, each of which offers multiple share classes, with differing investment objectives and policies. The Fund seeks capital appreciation. The Fund is classified as diversified, as defined in the 1940 Act. Janus Henderson Investors US LLC is the investment adviser (the “Adviser”) to the Fund.
The Fund offers multiple classes of shares in order to meet the needs of various types of investors. Each class represents an interest in the same portfolio of investments. Certain financial intermediaries may not offer all classes of shares.
Shareholders, including other funds, individuals, accounts, as well as the Fund’s portfolio manager(s) and/or investment personnel, may from time to time own (beneficially or of record) a significant percentage of the Fund’s Shares and can be considered to “control” the Fund when that ownership exceeds 25% of the Fund’s assets (and which may differ from control as determined in accordance with United States of America generally accepted accounting principles ("US GAAP")).
Class A Shares are offered through financial intermediary platforms including, but not limited to, traditional brokerage platforms, mutual fund wrap fee programs, bank trust platforms, and retirement platforms.
Class C Shares are offered through financial intermediary platforms including, but not limited to, traditional brokerage platforms, mutual fund wrap fee programs, and bank trust platforms.
Class C Shares are closed to investments by new employer-sponsored retirement plans and existing employer-sponsored retirement plans are no longer able to make additional purchases or exchanges into Class C Shares.
The Fund currently implements an automatic conversion feature pursuant to which Class C Shares that have been held for eight years are automatically converted to Class A Shares without the imposition of any sales charge, fee or other charge. The conversion will generally occur no later than ten business days in the month following the month of the eighth anniversary of the date of purchase. Class C Shares purchased through the reinvestment of dividends and other distributions on Class C Shares will convert to Class A Shares at the same time as the original Class C Shares with respect to which they were purchased. For Class C Shares held in omnibus accounts on intermediary platforms, the Fund relies on these intermediaries to implement this conversion feature. Your financial intermediary may have separate policies and procedures as to when and how Class C Shares may be converted to Class A Shares.
Effective July 6, 2020, Class D Shares are available to new investors, subject to any closed fund policies for a Fund, as applicable. Previously, Class D Shares were only available to investors who already had a direct account with the Janus Henderson funds; immediate family members or members of the same household of an eligible individual investor; and existing beneficial owners of sole proprietorships or partnerships that hold accounts directly with the Janus Henderson funds.
Class I Shares are available through certain financial intermediary platforms including, but not limited to, mutual fund wrap fee programs, managed account programs, asset allocation programs, bank trust platforms, as well as certain retirement platforms. Class I Shares are also available to certain direct institutional investors including, but not limited to, corporations, certain retirement plans, public plans, and foundations/endowments, who established Class I Share accounts before August 4, 2017.
Class L Shares are designed for pension and profit-sharing plans, employee benefit trusts, endowments, foundations and corporations, as well as high net worth individuals and financial intermediaries who are willing to maintain a minimum account balance of $250,000.
Class N Shares are generally available only to financial intermediaries purchasing on behalf of: 1) certain adviser-assisted, employer-sponsored retirement plans, including 401(k) plans, 457 plans, 403(b) plans, Taft-Hartley multi-employer plans, profit-sharing and money purchase pension plans, defined benefit plans and certain welfare benefit plans, such as health savings accounts, and nonqualified deferred compensation plans; and 2) retail investors purchasing in qualified or nonqualified accounts, whose accounts are held through an omnibus account at their financial
Janus Henderson Small Cap Value Fund
Notes to Financial Statements
intermediary, and where the financial intermediary requires no payment or reimbursement from the Fund, the Adviser, or its affiliates. Class N Shares are also available to Janus Henderson proprietary products and to certain direct institutional investors approved by Janus Henderson Distributors US LLC (the “Distributor”) including, but not limited to, corporations, certain retirement plans, public plans, and foundations and endowments, subject to minimum investment requirements.
Class R Shares are offered through financial intermediary platforms including, but not limited to, retirement platforms.
Class S Shares are offered through financial intermediary platforms including, but not limited to, retirement platforms and asset allocation, mutual fund wrap, or other discretionary or nondiscretionary fee-based investment advisory programs. In addition, Class S Shares may be available through certain financial intermediaries who have an agreement with the Adviser or its affiliates to offer Class S Shares on their supermarket platforms.
Class T Shares are available through certain financial intermediary platforms including, but not limited to, mutual fund wrap fee programs, managed account programs, asset allocation programs, bank trust platforms, as well as certain retirement platforms. In addition, Class T Shares may be available through certain financial intermediaries who have an agreement with the Adviser or its affiliates to offer Class T Shares on their supermarket platforms.
The following accounting policies have been followed by the Fund and are in conformity with US GAAP.
Investment Valuation
Fund holdings are valued in accordance with policies and procedures established by the Adviser pursuant to Rule 2a-5 under the 1940 Act and approved by and subject to the oversight of the Trustees (the “Valuation Procedures”). Equity securities traded on a domestic securities exchange are generally valued at readily available market quotations, which are (i) the official close prices or (ii) last sale prices on the primary market or exchange in which the securities trade. If such price is lacking for the trading period immediately preceding the time of determination, such securities are generally valued at their current bid price. Equity securities that are traded on a foreign exchange are generally valued at the closing prices on such markets. In the event that there is no current trading volume on a particular security in such foreign exchange, the bid price from the primary exchange is generally used to value the security. Foreign securities and currencies are converted to U.S. dollars using the current spot USD dollar exchange rate in effect at the close of the New York Stock Exchange (“NYSE”). The Adviser will determine the market value of individual securities held by it by using prices provided by one or more Adviser-approved professional pricing services or, as needed, by obtaining market quotations from independent broker-dealers. Most debt securities are valued in accordance with the evaluated bid price supplied by the pricing service that is intended to reflect market value. The evaluated bid price supplied by the pricing service is an evaluation that may consider factors such as security prices, yields, maturities and ratings. Certain short-term securities maturing within 60 days or less may be evaluated and valued on an amortized cost basis provided that the amortized cost determined approximates market value. Securities for which market quotations or evaluated prices are not readily available or deemed unreliable are valued at fair value determined in good faith by the Adviser pursuant to the Valuation Procedures. Circumstances in which fair valuation may be utilized include, but are not limited to: (i) a significant event that may affect the securities of a single issuer, such as a merger, bankruptcy, or significant issuer-specific development; (ii) an event that may affect an entire market, such as a natural disaster or significant governmental action; (iii) a nonsignificant event such as a market closing early or not opening, or a security trading halt; and (iv) pricing of a nonvalued security and a restricted or nonpublic security. Special valuation considerations may apply with respect to “odd-lot” fixed-income transactions which, due to their small size, may receive evaluated prices by pricing services which reflect a large block trade and not what actually could be obtained for the odd-lot position. The value of the securities of other mutual funds held by the Fund, if any, will be calculated using the NAV of such mutual funds, and the prospectuses for such mutual funds explain the circumstances under which they use fair valuation and the effects of using fair valuation. The value of the securities of any cash management pooled investment vehicles that operate as money market funds held by the Fund, if any, will be calculated using the NAV of such funds.
Valuation Inputs Summary
FASB ASC 820, Fair Value Measurements and Disclosures (“ASC 820”), defines fair value, establishes a framework for measuring fair value, and expands disclosure requirements regarding fair value measurements. This standard emphasizes that fair value is a market-based measurement that should be determined based on the assumptions that market participants would use in pricing an asset or liability and establishes a hierarchy that prioritizes inputs to valuation techniques used to measure fair value. These inputs are summarized into three broad levels:
Janus Henderson Small Cap Value Fund
Notes to Financial Statements
Level 1 – Unadjusted quoted prices in active markets the Fund has the ability to access for identical assets or liabilities.
Level 2 – Observable inputs other than unadjusted quoted prices included in Level 1 that are observable for the asset or liability either directly or indirectly. These inputs may include quoted prices for the identical instrument on an inactive market, prices for similar instruments, interest rates, prepayment speeds, credit risk, yield curves, default rates and similar data.
Assets or liabilities categorized as Level 2 in the hierarchy generally include: debt securities fair valued in accordance with the evaluated bid or ask prices supplied by a pricing service; securities traded on OTC markets and listed securities for which no sales are reported that are fair valued at the latest bid price (or yield equivalent thereof) obtained from one or more dealers transacting in a market for such securities or by a pricing service approved by the Fund’s Trustees; certain short-term debt securities with maturities of 60 days or less that are fair valued at amortized cost; and equity securities of foreign issuers whose fair value is determined by using systematic fair valuation models provided by independent third parties in order to adjust for stale pricing which may occur between the close of certain foreign exchanges and the close of the NYSE. Other securities that may be categorized as Level 2 in the hierarchy include, but are not limited to, preferred stocks, bank loans, swaps, investments in unregistered investment companies, options, and forward contracts.
Level 3 – Unobservable inputs for the asset or liability to the extent that relevant observable inputs are not available, representing the Fund’s own assumptions about the assumptions that a market participant would use in valuing the asset or liability, and that would be based on the best information available.
There have been no significant changes in valuation techniques used in valuing any such positions held by the Fund since the beginning of the fiscal year.
The inputs or methodology used for fair valuing securities are not necessarily an indication of the risk associated with investing in those securities. The summary of inputs used as of June 30, 2023 to fair value the Fund’s investments in securities and other financial instruments is included in the “Valuation Inputs Summary” in the Notes to Schedule of Investments and Other Information.
Investment Transactions and Investment Income
Investment transactions are accounted for as of the date purchased or sold (trade date). Dividend income is recorded on the ex-dividend date. Certain dividends from foreign securities will be recorded as soon as the Fund is informed of the dividend, if such information is obtained subsequent to the ex-dividend date. Dividends from foreign securities may be subject to withholding taxes in foreign jurisdictions. Non-cash dividends, if any, are recorded on the ex-dividend date at fair value. Interest income is recorded daily on the accrual basis and includes amortization of premiums and accretion of discounts. The Fund classifies gains and losses on prepayments received as an adjustment to interest income. Debt securities may be placed in non-accrual status and related interest income may be reduced by stopping current accruals and writing off interest receivables when collection of all or a portion of interest has become doubtful. Gains and losses are determined on the identified cost basis, which is the same basis used for federal income tax purposes. Income, as well as gains and losses, both realized and unrealized, are allocated daily to each class of shares based upon the ratio of net assets represented by each class as a percentage of total net assets.
Expenses
The Fund bears expenses incurred specifically on its behalf. Each class of shares bears a portion of general expenses, which are allocated daily to each class of shares based upon the ratio of net assets represented by each class as a percentage of total net assets. Expenses directly attributable to a specific class of shares are charged against the operations of such class.
Estimates
The preparation of financial statements in conformity with US GAAP requires management to make estimates and assumptions that affect the reported amount of assets and liabilities and disclosure of contingent assets and liabilities at the date of the financial statements, and the reported amounts of income and expenses during the reporting period. Actual results could differ from those estimates.
Indemnifications
In the normal course of business, the Fund may enter into contracts that contain provisions for indemnification of other parties against certain potential liabilities. The Fund’s maximum exposure under these arrangements is unknown, and
Janus Henderson Small Cap Value Fund
Notes to Financial Statements
would involve future claims that may be made against the Fund that have not yet occurred. Currently, the risk of material loss from such claims is considered remote.
Foreign Currency Translations
The Fund does not isolate that portion of the results of operations resulting from the effect of changes in foreign exchange rates on investments from the fluctuations arising from changes in market prices of securities held at the date of the financial statements. Net unrealized appreciation or depreciation of investments and foreign currency translations arise from changes in the value of assets and liabilities, including investments in securities held at the date of the financial statements, resulting from changes in the exchange rates and changes in market prices of securities held.
Currency gains and losses are also calculated on payables and receivables that are denominated in foreign currencies. The payables and receivables are generally related to foreign security transactions and income translations.
Foreign currency-denominated assets and forward currency contracts may involve more risks than domestic transactions, including currency risk, counterparty risk, political and economic risk, regulatory risk and equity risk. Risks may arise from unanticipated movements in the value of foreign currencies relative to the U.S. dollar.
Dividends and Distributions
The Fund generally declares and distributes dividends of net investment income and realized capital gains (if any) annually. The Fund may treat a portion of the amount paid to redeem shares as a distribution of investment company taxable income and realized capital gains that are reflected in the net asset value. This practice, commonly referred to as “equalization,” has no effect on the redeeming shareholder or a Fund’s total return, but may reduce the amounts that would otherwise be required to be paid as taxable dividends to the remaining shareholders. It is possible that the Internal Revenue Service (IRS) could challenge the Fund's equalization methodology or calculations, and any such challenge could result in additional tax, interest, or penalties to be paid by the Fund.
The Fund may make certain investments in real estate investment trusts (“REITs”) which pay dividends to their shareholders based upon funds available from operations. It is quite common for these dividends to exceed the REITs’ taxable earnings and profits, resulting in the excess portion of such dividends being designated as a return of capital. If the Fund distributes such amounts, such distributions could constitute a return of capital to shareholders for federal income tax purposes.
Federal Income Taxes
The Fund intends to continue to qualify as a regulated investment company and distribute all of its taxable income in accordance with the requirements of Subchapter M of the Internal Revenue Code. Management has analyzed the Fund’s tax positions taken for all open federal income tax years, generally a three-year period, and has concluded that no provision for federal income tax is required in the Fund’s financial statements. The Fund is not aware of any tax positions for which it is reasonably possible that the total amounts of unrecognized tax benefits will significantly change in the next twelve months.
2. Other Investments and Strategies
Market Risk
The value of the Fund’s portfolio may decrease if the value of one or more issuers in the Fund’s portfolio decreases. Further, regardless of how well individual companies or securities perform, the value of the Fund’s portfolio could also decrease if there are deteriorating economic or market conditions, including, but not limited to, a general decline in prices on the stock markets, a general decline in real estate markets, a decline in commodities prices, or if the market favors different types of securities than the types of securities in which the Fund invests. If the value of the Fund’s portfolio decreases, the Fund’s NAV will also decrease, which means if you sell your shares in the Fund you may lose money. Market risk may affect a single issuer, industry, economic sector, or the market as a whole. The increasing interconnectivity between global economies and financial markets increases the likelihood that events or conditions in one region or financial market may adversely impact issuers in a different country, region or financial market. Social, political, economic and other conditions and events, such as natural disasters, health emergencies (e.g., epidemics and pandemics), terrorism, conflicts, including related sanctions, and social unrest, could reduce consumer demand or economic output, result in market closures, travel restrictions and/or quarantines, and generally have a significant impact on the global economies and financial markets.
Janus Henderson Small Cap Value Fund
Notes to Financial Statements
• COVID-19 Pandemic. The effects of COVID-19 have contributed to increased volatility in global financial markets and have affected and may continue to affect certain countries, regions, issuers, industries and market sectors more dramatically than others. These conditions and events could have a significant impact on the Fund and its investments, the Fund’s ability to meet redemption requests, and the processes and operations of the Fund’s service providers, including the Adviser.
• Russia/Ukraine Invasion. Russia launched a large-scale invasion of Ukraine on February 24, 2022. The extent and duration of the military action, resulting sanctions and resulting future market disruptions in the region are impossible to predict, but could be significant and have a severe adverse effect on the region, including significant negative impacts on the economy and the markets for certain securities and commodities, such as oil and natural gas, as well as other sectors.
Exchange-Traded Funds
The Fund may invest in exchange-traded funds (“ETFs”) to gain exposure to a particular portion of the market. ETFs are typically open-end investment companies, which may seek to track the performance of a specific index or be actively managed. ETFs are traded on a national securities exchange at market prices that may vary from the net asset value of their underlying investments. Accordingly, there may be times when an ETF trades at a premium or discount. When the Fund invests in an ETF, in addition to directly bearing the expenses associated with its own operations, it will bear a pro rata portion of the ETF's expenses. As a result, the cost of investing in the Fund may be higher than the cost of investing directly in ETFs and may be higher than other mutual funds that invest directly in stocks and bonds. ETFs also involve the risk that an active trading market for an ETF's shares may not develop or be maintained. Similarly, because the value of ETF shares depends on the demand in the market, the Fund may not be able to purchase or sell an ETF at the most optimal time, which could adversely affect the Fund’s performance. In addition, ETFs that track particular indices may be unable to match the performance of such underlying indices due to the temporary unavailability of certain index securities in the secondary market or other factors, such as discrepancies with respect to the weighting of securities. Because the Fund may invest in a broad range of ETFs, such risks may include, but are not limited to, leverage risk, foreign exposure risk, interest rate risk, emerging markets risk, and commodity-linked investments risk. The Fund is also subject to substantially the same risks as those associated with direct exposure to the securities held by the ETF.
Real Estate Investing
The Fund may invest in equity and debt securities of real estate-related companies. Such companies may include those in the real estate industry or real estate-related industries. These securities may include common stocks, corporate bonds, preferred stocks, and other equity securities, including, but not limited to, mortgage-backed securities, real estate-backed securities, securities of REITs and similar REIT-like entities. A REIT is a trust that invests in real estate-related projects, such as properties, mortgage loans, and construction loans. REITs are generally categorized as equity, mortgage, or hybrid REITs. A REIT may be listed on an exchange or traded OTC.
Repurchase Agreements
The Fund and other funds advised by the Adviser or its affiliates may transfer daily uninvested cash balances into one or more joint trading accounts. Assets in the joint trading accounts are invested in money market instruments and the proceeds are allocated to the participating funds on a pro rata basis.
Repurchase agreements held by the Fund are fully collateralized, and such collateral is in the possession of the Fund’s custodian or, for tri-party agreements, the custodian designated by the agreement. The collateral is evaluated daily to ensure its market value exceeds the current market value of the repurchase agreements, including accrued interest. In the event of default on the obligation to repurchase, the Fund has the right to liquidate the collateral and apply the proceeds in satisfaction of the obligation. In the event of default or bankruptcy by the other party to the agreement, realization and/or retention of the collateral or proceeds may be subject to legal proceedings.
Counterparties
Fund transactions involving a counterparty are subject to the risk that the counterparty or a third party will not fulfill its obligation to the Fund (“counterparty risk”). Counterparty risk may arise because of the counterparty’s financial condition (i.e., financial difficulties, bankruptcy, or insolvency), market activities and developments, or other reasons, whether foreseen or not. A counterparty’s inability to fulfill its obligation may result in significant financial loss to the Fund. The Fund may be unable to recover its investment from the counterparty or may obtain a limited recovery, and/or recovery
Janus Henderson Small Cap Value Fund
Notes to Financial Statements
may be delayed. The extent of the Fund’s exposure to counterparty risk with respect to financial assets and liabilities approximates its carrying value. See the "Offsetting Assets and Liabilities" section of this Note for further details.
The Fund may be exposed to counterparty risk through participation in various programs, including, but not limited to, lending its securities to third parties, cash sweep arrangements whereby the Fund’s cash balance is invested in one or more types of cash management vehicles, as well as investments in, but not limited to, repurchase agreements, debt securities, and derivatives, including various types of swaps, futures and options. The Fund intends to enter into financial transactions with counterparties that the Adviser believes to be creditworthy at the time of the transaction. There is always the risk that the Adviser’s analysis of a counterparty’s creditworthiness is incorrect or may change due to market conditions. To the extent that the Fund focuses its transactions with a limited number of counterparties, it will have greater exposure to the risks associated with one or more counterparties.
Securities Lending
Under procedures adopted by the Trustees, the Fund may seek to earn additional income by lending securities to certain qualified broker-dealers and institutions. JPMorgan Chase Bank, National Association acts as securities lending agent and a limited purpose custodian or subcustodian to receive and disburse cash balances and cash collateral, hold short-term investments, hold collateral, and perform other custodial functions in accordance with the Non-Custodial Securities Lending Agreement. For financial reporting purposes, the Fund does not offset financial instruments’ payables and receivables and related collateral on the Statement of Assets and Liabilities. The Fund may lend fund securities in an amount equal to up to 1/3 of its total assets as determined at the time of the loan origination. There is the risk of delay in recovering a loaned security or the risk of loss in collateral rights if the borrower fails financially. In addition, the Adviser makes efforts to balance the benefits and risks from granting such loans. All loans will be continuously secured by collateral which may consist of cash, U.S. Government securities, domestic and foreign short-term debt instruments, letters of credit, time deposits, repurchase agreements, money market mutual funds or other money market accounts, or such other collateral as permitted by the SEC. If the Fund is unable to recover a security on loan, the Fund may use the collateral to purchase replacement securities in the market. There is a risk that the value of the collateral could decrease below the cost of the replacement security by the time the replacement investment is made, resulting in a loss to the Fund. In certain circumstances individual loan transactions could yield negative returns.
Upon receipt of cash collateral, the Adviser may invest it in affiliated or non-affiliated cash management vehicles, whether registered or unregistered entities, as permitted by the 1940 Act and rules promulgated thereunder. The Adviser currently intends to primarily invest the cash collateral in a cash management vehicle for which the Adviser serves as investment adviser, Janus Henderson Cash Collateral Fund LLC, or in time deposits. An investment in Janus Henderson Cash Collateral Fund LLC is generally subject to the same risks that shareholders experience when investing in similarly structured vehicles, such as the potential for significant fluctuations in assets as a result of the purchase and redemption activity of the securities lending program, a decline in the value of the collateral, and possible liquidity issues. Such risks may delay the return of the cash collateral and cause the Fund to violate its agreement to return the cash collateral to a borrower in a timely manner. As adviser to the Fund and Janus Henderson Cash Collateral Fund LLC, the Adviser has an inherent conflict of interest as a result of its fiduciary duties to both the Fund and Janus Henderson Cash Collateral Fund LLC. Additionally, the Adviser receives an investment advisory fee of 0.05% for managing Janus Henderson Cash Collateral Fund LLC, but it may not receive a fee for managing certain other affiliated cash management vehicles in which the Fund may invest, and therefore may have an incentive to allocate preferred investment opportunities to investment vehicles for which it is receiving a fee.
The value of the collateral must be at least 102% of the market value of the loaned securities that are denominated in U.S. dollars and 105% of the market value of the loaned securities that are not denominated in U.S. dollars. Loaned securities and related collateral are marked-to-market each business day based upon the market value of the loaned securities at the close of business, employing the most recent available pricing information. Collateral levels are then adjusted based on this mark-to-market evaluation. Additional required collateral, or excess collateral returned, is delivered on the next business day. Therefore, the value of the collateral held may be temporarily less than 102% or 105% value of the securities on loan. The cash collateral invested by the Adviser is disclosed in the Schedule of Investments (if applicable).
Income earned from the investment of the cash collateral, net of rebates paid to, or fees paid by, borrowers and less the fees paid to the lending agent are included as “Affiliated securities lending income, net” on the Statement of Operations. As of June 30, 2023, securities lending transactions accounted for as secured borrowings with an overnight and continuous contractual maturity are $16,240,474. Gross amounts of recognized liabilities for securities lending
Janus Henderson Small Cap Value Fund
Notes to Financial Statements
(collateral received) as of June 30, 2023 is $16,455,191, resulting in the net amount due to the counterparty of $214,717.
Offsetting Assets and Liabilities
The Fund presents gross and net information about transactions that are either offset in the financial statements or subject to an enforceable master netting arrangement or similar agreement with a designated counterparty, regardless of whether the transactions are actually offset in the Statement of Assets and Liabilities.
The Offsetting Assets and Liabilities table located in the Schedule of Investments presents gross amounts of recognized assets and/or liabilities and the net amounts after deducting collateral that has been pledged by counterparties or has been pledged to counterparties (if applicable). For corresponding information grouped by type of instrument, see the Fund's Schedule of Investments.
All repurchase agreements are transacted under legally enforceable master repurchase agreements that give the Fund, in the event of default by the counterparty, the right to liquidate securities held and to offset receivables and payables with the counterparty. For financial reporting purposes, the Fund does not offset financial instruments' payables and receivables and related collateral on the Statement of Assets and Liabilities. Repurchase agreements held by the Fund are fully collateralized, and such collateral is in the possession of the Fund’s custodian or, for tri-party agreements, the custodian designated by the agreement. The collateral is evaluated daily to ensure its market value exceeds the current market value of the repurchase agreements, including accrued interest.
3. Investment Advisory Agreements and Other Transactions with Affiliates
The Fund pays the Adviser an investment advisory fee rate that may adjust up or down based on the Fund’s performance relative to its benchmark index.
The investment advisory fee rate paid to the Adviser by the Fund consists of two components: (1) a base fee calculated by applying the contractual fixed rate of the advisory fee to the Fund’s average daily net assets during the previous month (the “Base Fee Rate”), plus or minus (2) a performance-fee adjustment (the “Performance Adjustment”) calculated by applying a variable rate of up to 0.15% (positive or negative) to the Fund’s average daily net assets based on the Fund’s relative performance compared to the cumulative investment record of its benchmark index over a 36-month performance measurement period or shorter time period, as applicable. The investment advisory fee rate is calculated daily and paid monthly.
The investment performance of the Fund’s Class A Shares (waiving the upfront sales load) for the performance measurement period is used to calculate the Performance Adjustment. The Fund’s Base Fee Rate prior to any performance adjustment (expressed as an annual rate) is 0.72%, and the Fund’s benchmark index used in the calculation is the Russell 2000® Value Index.
No Performance Adjustment is applied unless the difference between the Fund’s investment performance and the cumulative investment record of the Fund’s benchmark index is 0.50% or greater (positive or negative) during the applicable performance measurement period. The Base Fee Rate is subject to an upward or downward Performance Adjustment for every full 0.50% increment by which the Fund outperforms or underperforms its benchmark index, up to the Fund’s full performance rate of ±5.50%. Because the Performance Adjustment is tied to a Fund’s relative performance compared to its benchmark index (and not its absolute performance), the Performance Adjustment could increase the Adviser’s fee even if the Fund’s Shares lose value during the performance measurement period and could decrease the Adviser’s fee even if the Fund’s Shares increase in value during the performance measurement period. For purposes of computing the Base Fee Rate and the Performance Adjustment, net assets are averaged over different periods (average daily net assets during the previous month for the Base Fee Rate, versus average daily net assets during the performance measurement period for the Performance Adjustment). Performance of the Fund is calculated net of expenses whereas the Fund’s benchmark index does not have any fees or expenses. Reinvestment of dividends and distributions is included in calculating both the performance of a Fund and the Fund’s benchmark index.
The Fund’s prospectuses and statement(s) of additional information contain additional information about performance-based fees. The amount shown as advisory fees on the Statement of Operations reflects the Base Fee Rate plus/minus any Performance Adjustment. For the year ended June 30, 2023, the performance adjusted investment advisory fee rate before any waivers and/or reimbursements of expenses is 0.53%.
Janus Henderson Small Cap Value Fund
Notes to Financial Statements
The Adviser has contractually agreed to waive the investment advisory fee and/or reimburse operating expenses to the extent that the Fund’s total annual fund operating expenses, excluding any performance adjustments to management fees, the fees payable pursuant to a Rule 12b-1 plan, shareholder servicing fees, such as transfer agency fees (including out-of-pocket costs), administrative services fees and any networking/omnibus payable by any share class, brokerage commissions, interest, dividends, taxes, acquired fund fees and expenses, and extraordinary expenses, exceed the annual rate of 0.91% of the Fund’s average daily net assets. The Adviser has agreed to continue the waivers for at least a one-year period commencing October 28, 2022. If applicable, amounts waived and/or reimbursed to the Fund by the Adviser are disclosed as “Excess Expense Reimbursement and Waivers” on the Statement of Operations.
The Adviser serves as administrator to the Fund pursuant to an administration agreement between the Adviser and the Trust. Under the administration agreement, the Adviser is authorized to perform, or cause others to perform certain administration, compliance, and accounting services to the Fund, including providing office space for the Fund, and is reimbursed by the Fund for certain of its costs in providing these services (to the extent the Adviser seeks reimbursement and such costs are not otherwise waived). In addition, employees of the Adviser and/or its affiliates may serve as officers of the Trust. The Fund pays for some or all of the salaries, fees, and expenses of the Adviser employees and Fund officers, with respect to certain specified administration functions they perform on behalf of the Fund. The Fund pays these costs based on out-of-pocket expenses incurred by the Adviser, and these costs are separate and apart from advisory fees and other expenses paid in connection with the investment advisory services the Adviser (or any subadvisor, as applicable) provides to the Fund. These amounts are disclosed as “Affiliated fund administration fees” on the Statement of Operations. In addition, some expenses related to compensation payable to the Fund’s Chief Compliance Officer and certain compliance staff, all of whom are employees of the Adviser and/or its affiliates, are shared with the Fund. Total compensation of $343,237 was paid to the Chief Compliance Officer and certain compliance staff by the Trust during the year ended June 30, 2023. The Fund's portion is reported as part of “Other expenses” on the Statement of Operations.
Janus Henderson Services US LLC (the “Transfer Agent”), a wholly-owned subsidiary of the Adviser, is the Fund’s transfer agent. The Transfer Agent provides or arranges for the provision of shareholder services including, but not limited to, recordkeeping, subaccounting, answering inquiries regarding accounts, order processing, transaction confirmations, the mailing of prospectuses and shareholder reports, and other shareholder services provided to or on behalf of shareholders. These amounts are disclosed as “Transfer agent administrative fees and expenses” on the Statement of Operations.
Class D Shares of the Fund pay the Transfer Agent an annual administrative services fee based on the average daily net assets of Class D Shares as detailed below.
| | |
Average Daily Net Assets of Class D Shares of the Janus Henderson funds | Administrative Services Fee |
Under $40 billion | 0.12% |
$40 billion – $49.9 billion | 0.10% |
Over $49.9 billion | 0.08% |
During the reporting period, the administrative services fee rate was 0.12%.
The Transfer Agent receives an administrative services fee at an annual rate of up to 0.25% of the average daily net assets of the Fund’s Class R Shares, Class S Shares, and Class T Shares for providing or procuring administrative services to investors in Class R Shares, Class S Shares, and Class T Shares of the Fund. The Transfer Agent expects to use all or a significant portion of this fee to compensate retirement plan service providers, broker-dealers, bank trust departments, financial advisors, and other financial intermediaries for providing these services. The Transfer Agent may keep certain amounts retained for reimbursement of out-of-pocket costs incurred for servicing clients of Class R Shares, Class S Shares, and Class T Shares.
The Transfer Agent receives an administrative fee based on the average daily net assets Class L Shares of the Fund based on the average proportion of the Fund’s total net assets sold directly and the average proportion of the Fund’s net assets sold through financial intermediaries on a monthly basis. The asset-weighted fee is calculated by applying a blended annual fee rate of 0.12% on average net assets for the proportion of assets sold directly and 0.25% on average net assets for the proportion of assets sold through financial intermediaries. These amounts are disclosed as “Transfer agent administrative fees and expenses” on the Statement of Operations. The Transfer Agent has agreed to
Janus Henderson Small Cap Value Fund
Notes to Financial Statements
waive all or a portion of this fee. Such waiver is voluntary and could change or be terminated at any time at the discretion of the Transfer Agent or the Adviser without prior notification to shareholders. Removal of this fee waiver may have a significant impact on Class L Shares’ total expense ratio. If applicable, amounts waived to the Fund by the Adviser are disclosed as “Excess Expense Reimbursement and Waivers” on the Statement of Operations.
Shareholder Services provided by these financial intermediaries may include, but are not limited to, recordkeeping, subaccounting, order processing, providing order confirmations, periodic statements, forwarding prospectuses, shareholder reports, and other materials to existing customers, answering inquiries regarding accounts, and other administrative services. Order processing includes the submission of transactions through the National Securities Clearing Corporation (“NSCC”) or similar systems, or those processed on a manual basis with the Adviser. For all share classes, the Transfer Agent also seeks reimbursement for costs it incurs as transfer agent and for providing servicing.
Certain, but not all, intermediaries may charge administrative fees to investors in Class A Shares, Class C Shares, and Class I Shares for administrative services provided on behalf of such investors. These administrative fees are paid by the Class A Shares, Class C Shares, and Class I Shares of the Fund to the Transfer Agent, which uses such fees to reimburse intermediaries. Consistent with the Transfer Agency Agreement between the Transfer Agent and the Fund, the Transfer Agent may negotiate the level, structure, and/or terms of the administrative fees with intermediaries requiring such fees on behalf of the Fund. The Adviser and its affiliates benefit from an increase in assets that may result from such relationships. The Adviser has agreed to limit these fees up to 0.20% for Class A Shares and Class C Shares, and up to 0.15% for Class I Shares on an annual basis based on the daily net assets of each share class. Such limits are subject to change by the Trustees in the future. These amounts are disclosed as “Transfer agent networking and omnibus fees” on the Statement of Operations.
The Transfer Agent is not compensated for its services related to the shares, except for out-of-pocket costs, although the Transfer Agent is compensated for its services related to Fund’s Class L Shares and Class D Shares. These amounts are disclosed as “Other transfer agent fees and expenses” on the Statement of Operations.
Under distribution and shareholder servicing plans (the “Plans”) adopted in accordance with Rule 12b-1 under the 1940 Act, the Fund pays the Trust’s distributor, the Distributor, a wholly-owned subsidiary of the Adviser, a fee for the sale and distribution and/or shareholder servicing of the shares based on the average daily net assets for each share class at an annual rate of up to 0.25% for Class A Shares, up to 1.00% for Class C Shares, up to 0.50% for Class R Shares, and up to 0.25% for Class S Shares. Under the terms of the Plans, the Trust is authorized to make payments to the Distributor for remittance to retirement plan service providers, broker-dealers, bank trust departments, financial advisors, and other financial intermediaries, as compensation for distribution and/or shareholder services performed by such entities for their customers who are investors in the Fund. These amounts are disclosed as “12b-1 Distribution and shareholder servicing fees” on the Statement of Operations.
Class A Shares include a 5.75% upfront sales charge of the offering price of the Fund. The sales charge is allocated between the Distributor and financial intermediaries. During the year ended June 30, 2023, the Distributor retained upfront sales charges of $1,763.
A contingent deferred sales charge (“CDSC”) of 1.00% will be deducted with respect to Class A Shares purchased without a sales load and redeemed within 12 months of purchase, unless waived. Any applicable CDSC will be 1.00% of the lesser of the original purchase price or the value of the redemption of the Class A Shares redeemed. There were no CDSCs paid by redeeming shareholders of Class A Shares to the Distributor during the year ended June 30, 2023.
A CDSC of 1.00% will be deducted with respect to Class C Shares redeemed within 12 months of purchase, unless waived. Any applicable CDSC will be 1.00% of the lesser of the original purchase price or the value of the redemption of the Class C Shares redeemed. During the year ended June 30, 2023, redeeming shareholders of Class C Shares paid CDSCs of $263.
The Board of Trustees has adopted a deferred compensation plan (the “Deferred Plan”) for independent Trustees to elect to defer receipt of all or a portion of the annual compensation they are entitled to receive from the Fund. All deferred fees are credited to an account established in the name of the Trustees. The amounts credited to the account then increase or decrease, as the case may be, in accordance with the performance of one or more of the Janus Henderson funds that are selected by the Trustees. The account balance continues to fluctuate in accordance with the performance of the selected fund or funds until final payment of all amounts are credited to the account. The fluctuation of the account balance is recorded by the Fund as unrealized appreciation/(depreciation) and is included as of June 30,
Janus Henderson Small Cap Value Fund
Notes to Financial Statements
2023 on the Statement of Assets and Liabilities in the asset, “Trustees’ deferred compensation,” and liability, “Trustees’ deferred compensation fees.” Additionally, the recorded unrealized appreciation/(depreciation) is included in “Total distributable earnings (loss)” on the Statement of Assets and Liabilities. Deferred compensation expenses for the year ended June 30, 2023 are included in “Trustees’ fees and expenses” on the Statement of Operations. Trustees are allowed to change their designation of mutual funds from time to time. Amounts will be deferred until distributed in accordance with the Deferred Plan. Deferred fees of $426,025 were paid by the Trust to the Trustees under the Deferred Plan during the year ended June 30, 2023.
Any purchases and sales, realized gains/losses and recorded dividends from affiliated investments during the year ended June 30, 2023 can be found in the “Schedules of Affiliated Investments” located in the Schedule of Investments.
4. Federal Income Tax
The tax components of capital shown in the table below represent: (1) distribution requirements the Fund must satisfy under the income tax regulations; (2) losses or deductions the Fund may be able to offset against income and gains realized in future years; and (3) unrealized appreciation or depreciation of investments for federal income tax purposes.
Other book to tax differences primarily consist of deferred compensation. The Fund has elected to treat gains and losses on forward foreign currency contracts as capital gains and losses, if applicable. Other foreign currency gains and losses on debt instruments are treated as ordinary income for federal income tax purposes pursuant to Section 988 of the Internal Revenue Code.
| | | | | | | |
| | | | Other Book | Net Tax | |
Undistributed
Ordinary Income | Undistributed
Long-Term Gains | Accumulated
Capital Losses | Loss Deferrals | to Tax
Differences | Appreciation/
(Depreciation) | |
$ 21,166,317 | $ 102,795,874 | $ - | $ - | $ (55,673) | $469,784,152 | |
The aggregate cost of investments and the composition of unrealized appreciation and depreciation of investment securities for federal income tax purposes as of June 30, 2023 are noted below. The primary differences between book and tax appreciation or depreciation of investments are wash sale loss deferrals and investments in partnerships.
| | | | |
Federal Tax Cost | Unrealized
Appreciation | Unrealized
(Depreciation) | Net Tax Appreciation/
(Depreciation) |
$ 2,037,730,209 | $557,651,169 | $(87,867,017) | $ 469,784,152 |
Income and capital gains distributions are determined in accordance with income tax regulations that may differ from US GAAP. These differences are due to differing treatments for items such as net short-term gains, deferral of wash sale losses, and foreign currency transactions. Certain permanent differences such as tax returns of capital and net investment losses noted below have been reclassified to capital.
| | | | | |
For the year ended June 30, 2023 | |
Distributions | | |
From Ordinary Income | From Long-Term Capital Gains | Tax Return of Capital | Net Investment Loss | |
$ 15,633,347 | $ 107,722,896 | $ - | $ - | |
| | | | | |
For the year ended June 30, 2022 | |
Distributions | | |
From Ordinary Income | From Long-Term Capital Gains | Tax Return of Capital | Net Investment Loss | |
$ 31,292,352 | $ 38,422,027 | $ - | $ - | |
Janus Henderson Small Cap Value Fund
Notes to Financial Statements
Permanent book to tax basis differences may result in reclassifications between the components of net assets. These differences have no impact on the results of operations or net assets. Capital has been adjusted by $16,955,604, including $14,060,472 of long-term capital gain, for distributions in connection with Fund shares redemption (tax equalization).
5. Capital Share Transactions
| | | | | | | |
| | | | | | |
| | Year ended June 30, 2023 | | Year ended June 30, 2022 |
| | Shares | Amount | | Shares | Amount |
| | | | | | | |
Class A Shares: | | | | | |
Shares sold | 214,756 | $ 4,838,998 | | 502,071 | $ 12,324,447 |
Reinvested dividends and distributions | 42,433 | 935,219 | | 19,815 | 498,339 |
Shares repurchased | (433,166) | (9,811,480) | | (1,906,388) | (45,548,778) |
Net Increase/(Decrease) | (175,977) | $ (4,037,263) | | (1,384,502) | $ (32,725,992) |
Class C Shares: | | | | | |
Shares sold | 20,591 | $ 438,387 | | 51,858 | $ 1,184,720 |
Reinvested dividends and distributions | 38,642 | 784,812 | | 13,998 | 327,829 |
Shares repurchased | (133,580) | (2,766,112) | | (164,576) | (3,722,734) |
Net Increase/(Decrease) | (74,347) | $ (1,542,913) | | (98,720) | $ (2,210,185) |
Class D Shares: | | | | | |
Shares sold | 119,523 | $ 2,712,862 | | 246,003 | $ 6,013,235 |
Reinvested dividends and distributions | 193,144 | 4,198,951 | | 76,267 | 1,901,327 |
Shares repurchased | (439,242) | (9,837,889) | | (583,549) | (14,081,136) |
Net Increase/(Decrease) | (126,575) | $ (2,926,076) | | (261,279) | $ (6,166,574) |
Class I Shares: | | | | | |
Shares sold | 10,105,264 | $ 228,765,913 | | 13,316,385 | $ 324,356,312 |
Reinvested dividends and distributions | 3,061,205 | 66,887,325 | | 1,371,811 | 34,350,140 |
Shares repurchased | (20,608,044) | (461,866,873) | | (32,181,491) | (783,667,233) |
Net Increase/(Decrease) | (7,441,575) | $(166,213,635) | | (17,493,295) | $(424,960,781) |
Class L Shares: | | | | | |
Shares sold | 79,015 | $ 1,847,850 | | 89,379 | $ 2,255,291 |
Reinvested dividends and distributions | 147,934 | 3,338,863 | | 72,633 | 1,876,099 |
Shares repurchased | (891,300) | (20,688,888) | | (718,940) | (18,179,704) |
Net Increase/(Decrease) | (664,351) | $ (15,502,175) | | (556,928) | $ (14,048,314) |
Class N Shares: | | | | | |
Shares sold | 4,217,956 | $ 94,866,352 | | 9,219,322 | $ 232,336,998 |
Reinvested dividends and distributions | 1,023,510 | 22,322,753 | | 618,226 | 15,455,657 |
Shares repurchased | (9,838,568) | (222,319,934) | | (19,252,161) | (465,612,666) |
Net Increase/(Decrease) | (4,597,102) | $(105,130,829) | | (9,414,613) | $(217,820,011) |
Class R Shares: | | | | | |
Shares sold | 203,076 | $ 4,484,059 | | 425,497 | $ 10,043,495 |
Reinvested dividends and distributions | 87,817 | 1,858,216 | | 34,389 | 834,969 |
Shares repurchased | (553,367) | (12,361,818) | | (309,137) | (7,329,715) |
Net Increase/(Decrease) | (262,474) | $ (6,019,543) | | 150,749 | $ 3,548,749 |
Class S Shares: | | | | | |
Shares sold | 258,407 | $ 5,769,175 | | 225,119 | $ 5,399,452 |
Reinvested dividends and distributions | 55,265 | 1,194,831 | | 24,901 | 616,559 |
Shares repurchased | (395,421) | (8,833,767) | | (696,995) | (17,135,144) |
Net Increase/(Decrease) | (81,749) | $ (1,869,761) | | (446,975) | $ (11,119,133) |
Class T Shares: | | | | | |
Shares sold | 671,656 | $ 15,168,690 | | 1,396,696 | $ 33,944,957 |
Reinvested dividends and distributions | 698,074 | 15,245,927 | | 375,679 | 9,391,965 |
Shares repurchased | (6,065,045) | (137,490,874) | | (6,657,712) | (160,071,440) |
Net Increase/(Decrease) | (4,695,315) | $(107,076,257) | | (4,885,337) | $(116,734,518) |
Janus Henderson Small Cap Value Fund
Notes to Financial Statements
6. Purchases and Sales of Investment Securities
For the year ended June 30, 2023, the aggregate cost of purchases and proceeds from sales of investment securities (excluding any short-term securities, short-term options contracts, TBAs, and in-kind transactions, as applicable) was as follows:
| | | | |
Purchases of
Securities | Proceeds from Sales
of Securities | Purchases of Long-
Term U.S. Government
Obligations | Proceeds from Sales
of Long-Term U.S.
Government Obligations |
$1,147,318,284 | $1,683,726,070 | $ - | $ - |
7. Subsequent Event
Management has evaluated whether any events or transactions occurred subsequent to June 30, 2023 and through the date of issuance of the Fund's financial statements and determined that there were no material events or transactions that would require recognition or disclosure in the Fund’s financial statements.
Janus Henderson Small Cap Value Fund
Report of Independent Registered Public Accounting Firm
To the Board of Trustees of Janus Investment Fund and Shareholders of Janus Henderson Small Cap Value Fund
Opinion on the Financial Statements
We have audited the accompanying statement of assets and liabilities, including the schedule of investments, of Janus Henderson Small Cap Value Fund (one of the funds constituting Janus Investment Fund, referred to hereafter as the “Fund”) as of June 30, 2023, the related statement of operations for the year ended June 30, 2023, the statements of changes in net assets for each of the two years in the period ended June 30, 2023, including the related notes, and the financial highlights for each of the five years in the period ended June 30, 2023 (collectively referred to as the “financial statements”). In our opinion, the financial statements present fairly, in all material respects, the financial position of the Fund as of June 30, 2023, the results of its operations for the year then ended, the changes in its net assets for each of the two years in the period ended June 30, 2023 and the financial highlights for each of the five years in the period ended June 30, 2023 in conformity with accounting principles generally accepted in the United States of America.
Basis for Opinion
These financial statements are the responsibility of the Fund’s management. Our responsibility is to express an opinion on the Fund’s financial statements based on our audits. We are a public accounting firm registered with the Public Company Accounting Oversight Board (United States) (PCAOB) and are required to be independent with respect to the Fund in accordance with the U.S. federal securities laws and the applicable rules and regulations of the Securities and Exchange Commission and the PCAOB.
We conducted our audits of these financial statements in accordance with the standards of the PCAOB. Those standards require that we plan and perform the audit to obtain reasonable assurance about whether the financial statements are free of material misstatement, whether due to error or fraud.
Our audits included performing procedures to assess the risks of material misstatement of the financial statements, whether due to error or fraud, and performing procedures that respond to those risks. Such procedures included examining, on a test basis, evidence regarding the amounts and disclosures in the financial statements. Our audits also included evaluating the accounting principles used and significant estimates made by management, as well as evaluating the overall presentation of the financial statements. Our procedures included confirmation of securities owned as of June 30, 2023 by correspondence with the custodian, transfer agent and brokers; when replies were not received from brokers, we performed other auditing procedures. We believe that our audits provide a reasonable basis for our opinion.

Denver, Colorado
August 21, 2023
We have served as the auditor of one or more investment companies in Janus Henderson Funds since 1990.
Janus Henderson Small Cap Value Fund
Additional Information (unaudited)
Proxy Voting Policies and Voting Record
A description of the policies and procedures that the Fund uses to determine how to vote proxies relating to its portfolio securities is available without charge: (i) upon request, by calling 1-800-525-1093; (ii) on the Fund’s website at janushenderson.com/proxyvoting; and (iii) on the SEC’s website at http://www.sec.gov. Additionally, information regarding the Fund’s proxy voting record for the most recent twelve-month period ended June 30 is also available, free of charge, through janushenderson.com/proxyvoting and from the SEC’s website at http://www.sec.gov.
Full Holdings
The Fund files its complete portfolio holdings (schedule of investments) with the SEC as an exhibit to Form N-PORT within 60 days of the end of the first and third fiscal quarters, and in the annual report and semiannual report to shareholders. The Fund’s Form N-PORT filings and annual and semiannual reports: (i) are available on the SEC’s website at http://www.sec.gov; and (ii) are available without charge, upon request, by calling a Janus Henderson representative at 1-877-335-2687 (toll free) (or 1-800-525-3713 if you hold Class D shares). Portfolio holdings consisting of at least the names of the holdings are generally available on a monthly basis with a 30-day lag under Full Holdings for the Fund at janushenderson.com/info (or janushenderson.com/reports if you hold Class D Shares).
APPROVAL OF ADVISORY AGREEMENTS DURING THE PERIOD
The Trustees of Janus Aspen Series, each of whom serves as an “independent” Trustee (the “Trustees”), oversee the management of each portfolio of Janus Aspen Series (each, a “VIT Portfolio,” and collectively, the “VIT Portfolios”), as well as each fund of Janus Investment Fund (each, a “Fund,” and collectively, the “Funds” and together with the VIT Portfolios, the “Janus Henderson Funds,” and each, a “Janus Henderson Fund”). As required by law, the Trustees determine annually whether to continue the investment advisory agreement for each Janus Henderson Fund.
In connection with their most recent consideration of those agreements for each Janus Henderson Fund, the Trustees received and reviewed information provided by Janus Henderson Investors US LLC (the “Adviser”) in response to requests of the Trustees and their independent legal counsel. They also received and reviewed information and analysis provided by, and in response to requests of, their independent fee consultant. Throughout their consideration of the agreements, the Trustees were advised by their independent legal counsel. The Trustees met with management to consider the agreements, and also met separately in executive session with their independent legal counsel and their independent fee consultant.
At meetings held on November 9-10, 2022 and December 13-14, 2022, the Trustees evaluated the information provided by the Adviser and the independent fee consultant, as well as other information provided by the Adviser and the independent fee consultant during the year. Following such evaluation, the Trustees determined that the overall arrangements between each Janus Henderson Fund and the Adviser were fair and reasonable in light of the nature, extent, and quality of the services provided by the Adviser and its affiliates, the fees charged for those services, and other matters that the Trustees considered relevant in the exercise of their business judgment, and unanimously approved the continuation of the investment advisory agreement for each Janus Henderson Fund for the period from February 1, 2023 through February 1, 2024, subject to earlier termination as provided for in each agreement.
In considering the continuation of those agreements, the Trustees reviewed and analyzed various factors that they determined were relevant, including the factors described below, none of which by itself was considered dispositive. However, the material factors and conclusions that formed the basis for the Trustees’ determination to approve the continuation of the agreements are discussed separately below. Also included is a summary of the independent fee consultant’s conclusions and opinions that arose during, and were included as part of, the Trustees’ consideration of the agreements. “Management fees,” as used herein, reflect actual annual advisory fees and, for the purpose of peer comparisons any administration fees (excluding out of pocket costs), net of any waivers, paid by a fund as a percentage of average net assets.
Nature, Extent and Quality of Services
The Trustees reviewed the nature, extent, and quality of the services provided by the Adviser to the Janus Henderson Funds, taking into account the investment objective, strategies, and policies of each Janus Henderson Fund, and the knowledge the Trustees gained from their regular meetings with management on at least a quarterly basis and their ongoing review of information related to the Janus Henderson Funds. In addition, the Trustees reviewed the resources and key personnel of the Adviser, particularly noting those employees who provide investment and risk management services to the Janus Henderson Funds. The Trustees also considered other services provided to the Janus Henderson
Janus Henderson Small Cap Value Fund
Additional Information (unaudited)
Funds by the Adviser, such as managing the execution of portfolio transactions and the selection of broker-dealers for those transactions. The Trustees considered the Adviser’s role as administrator to the Janus Henderson Funds, noting that the Adviser generally does not receive a fee for its services as administrator, but is reimbursed for its out-of-pocket costs. The Trustees considered the role of the Adviser in monitoring adherence to the Janus Henderson Funds’ investment restrictions, providing support services for the Trustees and Trustee committees, and overseeing communications with Janus Henderson Fund shareholders and the activities of other service providers, including monitoring compliance with various policies and procedures of the Janus Henderson Funds and with applicable securities laws and regulations.
In this regard, the independent fee consultant noted that the Adviser provides a number of different services for the Janus Henderson Funds and their shareholders, ranging from investment management services to various other servicing functions, and that, in its view, the Adviser is a capable provider of those services. The independent fee consultant also provided its belief that the Adviser has developed a number of institutional competitive advantages that should enable it to provide superior investment and service performance over the long term.
The Trustees concluded that the nature, extent, and quality of the services provided by the Adviser to each Janus Henderson Fund were appropriate and consistent with the terms of the respective advisory agreements, and that, taking into account steps taken to address those Janus Henderson Funds whose performance lagged that of their peers for certain periods, the Janus Henderson Funds were likely to benefit from the continued provision of those services. They also concluded that the Adviser had sufficient personnel, with the appropriate education and experience, to serve the Janus Henderson Funds effectively and had demonstrated its ability to attract well-qualified personnel.
Performance of the Funds
The Trustees considered the performance results of each Janus Henderson Fund over various time periods. They noted that they considered Janus Henderson Fund performance data throughout the year, including periodic meetings with each Janus Henderson Fund’s portfolio manager(s), and also reviewed information comparing each Janus Henderson Fund’s performance with the performance of comparable fund peer groups identified by Broadridge Financial Solutions, Inc. (“Broadridge”), an independent data provider, and with the Janus Henderson Fund’s benchmark index. In this regard, the independent fee consultant found that the overall Janus Henderson Funds’ performance has been reasonable, noting that: (i) for the 36 months ended May 31, 2022, approximately 38% of the Janus Henderson Funds were in the top two quartiles of their Broadridge peer groups; (ii) for the 36 months ended September 30, 2022, approximately 45% of the Janus Henderson Funds were in the top two quartiles of performance as reported by Morningstar, and (iii) for the 12 months ended September 30, 2022, approximately 55% of the Janus Henderson Funds were in the top two quartiles of performance as reported by Morningstar.
The Trustees considered the performance of each Janus Henderson Fund, noting that performance may vary by share class, and noted the following with respect to the Funds:
Asset Allocation Funds
· For Janus Henderson Global Allocation Fund – Conservative, the Trustees noted that the Fund’s performance was in the third Broadridge quartile for the 36 months ended May 31, 2022 and the bottom Broadridge quartile for the 12 months ended May 31, 2022. The Trustees noted the reasons for the Fund’s underperformance and the steps the Adviser had taken or was taking to improve performance.
· For Janus Henderson Global Allocation Fund – Growth, the Trustees noted that the Fund’s performance was in the bottom Broadridge quartile for the 36 months ended May 31, 2022 and the bottom Broadridge quartile for the 12 months ended May 31, 2022. The Trustees noted the reasons for the Fund’s underperformance and the steps the Adviser had taken or was taking to improve performance.
· For Janus Henderson Global Allocation Fund – Moderate, the Trustees noted that the Fund’s performance was in the bottom Broadridge quartile for the 36 months ended May 31, 2022 and the bottom Broadridge quartile for the 12 months ended May 31, 2022. The Trustees noted the reasons for the Fund’s underperformance and the steps the Adviser had taken or was taking to improve performance.
Fixed-Income Funds
· For Janus Henderson Absolute Return Income Opportunities Fund, the Trustees noted that the Fund’s performance was in the third Broadridge quartile for the 36 months ended May 31, 2022 and the first Broadridge
Janus Henderson Small Cap Value Fund
Additional Information (unaudited)
quartile for the 12 months ended May 31, 2022. The Trustees noted the reasons for the Fund’s underperformance, the steps the Adviser had taken or was taking to improve performance, and that the performance trend was improving.
· For Janus Developed World Bond Fund, the Trustees noted that the Fund’s performance was in the bottom Broadridge quartile for the 36 months ended May 31, 2022 and the bottom Broadridge quartile for the 12 months ended May 31, 2022. The Trustees noted the reasons for the Fund’s underperformance and the steps the Adviser had taken or was taking to improve performance.
· For Janus Henderson Flexible Bond Fund, the Trustees noted that the Fund’s performance was in the first Broadridge quartile for the 36 months ended May 31, 2022 and the second Broadridge quartile for the 12 months ended May 31, 2022.
· For Janus Henderson Global Bond Fund, the Trustees noted that the Fund’s performance was in the third Broadridge quartile for the 36 months ended May 31, 2022 and the bottom Broadridge quartile for the 12 months ended May 31, 2022. The Trustees noted the reasons for the Fund’s underperformance and the steps the Adviser had taken or was taking to improve performance.
· For Janus Henderson High-Yield Fund, the Trustees noted that the Fund’s performance was in the third Broadridge quartile for the 36 months ended May 31, 2022 and the bottom Broadridge quartile for the 12 months ended May 31, 2022. The Trustees noted the reasons for the Fund’s underperformance and the steps the Adviser had taken or was taking to improve performance.
· For Janus Henderson Multi-Sector Income Fund, the Trustees noted that the Fund’s performance was in the second Broadridge quartile for the 36 months ended May 31, 2022 and the third Broadridge quartile for the 12 months ended May 31, 2022.
· For Janus Henderson Short Duration Flexible Bond Fund, the Trustees noted that the Fund’s performance was in the third Broadridge quartile for the 36 months ended May 31, 2022 and the bottom Broadridge quartile for the 12 months ended May 31, 2022. The Trustees noted the reasons for the Fund’s underperformance and the steps the Adviser had taken or was taking to improve performance.
Global and International Equity Funds
· For Janus Henderson Asia Equity Fund, the Trustees noted that the Fund’s performance was in the third Broadridge quartile for the 36 months ended May 31, 2022 and the third Broadridge quartile for the 12 months ended May 31, 2022. The Trustees noted the reasons for the Fund’s underperformance, while also noting that the Fund has a performance fee structure that results in lower management fees during periods of underperformance, and the steps the Adviser had taken or was taking to improve performance.
· For Janus Henderson Emerging Markets Fund, the Trustees noted that the Fund’s performance was in the third Broadridge quartile for the 36 months ended May 31, 2022 and the third Broadridge quartile for the 12 months ended May 31, 2022. The Trustees noted the reasons for the Fund’s underperformance and the steps the Adviser had taken or was taking to improve performance.
· For Janus Henderson European Focus Fund, the Trustees noted that the Fund’s performance was in the first Broadridge quartile for the 36 months ended May 31, 2022 and the second Broadridge quartile for the 12 months ended May 31, 2022.
· For Janus Henderson Global Equity Income Fund, the Trustees noted that the Fund’s performance was in the third Broadridge quartile for the 36 months ended May 31, 2022 and the first Broadridge quartile for the 12 months ended May 31, 2022. The Trustees noted the reasons for the Fund’s underperformance, the steps the Adviser had taken or was taking to improve performance, and that the performance trend was improving.
· For Janus Henderson Global Life Sciences Fund, the Trustees noted that the Fund’s performance was in the third Broadridge quartile for the 36 months ended May 31, 2022 and the second Broadridge quartile for the 12 months ended May 31, 2022. The Trustees noted the reasons for the Fund’s underperformance, the steps the Adviser had taken or was taking to improve performance, and that the performance trend was improving.
Janus Henderson Small Cap Value Fund
Additional Information (unaudited)
· For Janus Henderson Global Sustainable Equity Fund, the Trustees noted that the Fund’s performance was in the second Broadridge quartile for the 12 months ended May 31, 2022. The Trustees noted that 36 month-end performance was not yet available.
· For Janus Henderson Global Real Estate Fund, the Trustees noted that the Fund’s performance was in the second Broadridge quartile for the 36 months ended May 31, 2022 and the bottom Broadridge quartile for the 12 months ended May 31, 2022.
· For Janus Henderson Global Research Fund, the Trustees noted that the Fund’s performance was in the second Broadridge quartile for the 36 months ended May 31, 2022 and the first Broadridge quartile for the 12 months ended May 31, 2022.
· For Janus Henderson Global Select Fund, the Trustees noted that the Fund’s performance was in the first Broadridge quartile for the 36 months ended May 31, 2022 and the first Broadridge quartile for the 12 months ended May 31, 2022.
· For Janus Henderson Global Technology and Innovation Fund, the Trustees noted that the Fund’s performance was in the second Broadridge quartile for the 36 months ended May 31, 2022 and the second Broadridge quartile for the 12 months ended May 31, 2022.
· For Janus Henderson International Opportunities Fund, the Trustees noted that the Fund’s performance was in the bottom Broadridge quartile for the 36 months ended May 31, 2022 and the third Broadridge quartile for the 12 months ended May 31, 2022. The Trustees noted the reasons for the Fund’s underperformance and the steps the Adviser had taken or was taking to improve performance.
· For Janus Henderson Overseas Fund, the Trustees noted that the Fund’s performance was in the first Broadridge quartile for the 36 months ended May 31, 2022 and the first Broadridge quartile for the 12 months ended May 31, 2022.
· For Janus Henderson Responsible International Dividend Fund (formerly the Janus Henderson Dividend & Income Builder Fund), the Trustees noted that the Fund’s performance was in the bottom Broadridge quartile for the 36 months ended May 31, 2022 and the bottom Broadridge quartile for the 12 months ended May 31, 2022. The Trustees noted the reasons for the Fund’s underperformance and the steps the Adviser had taken or was taking to improve performance.
Money Market Funds
· For Janus Henderson Government Money Market Fund, the Trustees noted that the Fund’s performance was in the third Broadridge quartile for the 36 months ended May 31, 2022 and the bottom Broadridge quartile for the 12 months ended May 31, 2022. The Trustees noted the reasons for the Fund’s underperformance and the steps the Adviser had taken or was taking to improve performance.
· For Janus Henderson Money Market Fund, the Trustees noted that the Fund’s performance was in the third Broadridge quartile for the 36 months ended May 31, 2022 and the bottom Broadridge quartile for the 12 months ended May 31, 2022. The Trustees noted the reasons for the Fund’s underperformance and the steps the Adviser had taken or was taking to improve performance.
Multi-Asset Funds
· For Janus Henderson Adaptive Global Allocation Fund, the Trustees noted that the Fund’s performance was in bottom Broadridge quartile for the 36 months ended May 31, 2022 and the second Broadridge quartile for the 12 months ended May 31, 2022. The Trustees noted the reasons for the Fund’s underperformance, the steps the Adviser had taken or was taking to improve performance, and that the performance trend was improving.
· For Janus Henderson Balanced Fund, the Trustees noted that the Fund’s performance was in the first Broadridge quartile for the 36 months ended May 31, 2022 and the first Broadridge quartile for the 12 months ended May 31, 2022.
Janus Henderson Small Cap Value Fund
Additional Information (unaudited)
U.S. Equity Funds
· For Janus Henderson Adaptive Risk Managed U.S. Equity Fund, the Trustees noted that the Fund’s performance was in the bottom Broadridge quartile for the 36 months ended May 31, 2022 and the second Broadridge quartile for the 12 months ended May 31, 2022. The Trustees noted the reasons for the Fund’s underperformance, the steps the Adviser had taken or were taking to improve performance, and that the performance trend was improving.
· For Janus Henderson Contrarian Fund, the Trustees noted that the Fund’s performance was in the first Broadridge quartile for the 36 months ended May 31, 2022 and the bottom Broadridge quartile for the 12 months ended May 31, 2022.
· For Janus Henderson Enterprise Fund, the Trustees noted that the Fund’s performance was in the second Broadridge quartile for the 36 months ended May 31, 2022 and the first Broadridge quartile for the 12 months ended May 31, 2022.
· For Janus Henderson Forty Fund, the Trustees noted that the Fund’s performance was in the third Broadridge quartile for the 36 months ended May 31, 2022 and the bottom Broadridge quartile for the 12 months ended May 31, 2022. The Trustees noted the reasons for the Fund’s underperformance and the steps the Adviser had taken or was taking to improve performance.
· For Janus Henderson Growth and Income Fund, the Trustees noted that the Fund’s performance was in the bottom Broadridge quartile for the 36 months ended May 31, 2022 and the first Broadridge quartile for the 12 months ended May 31, 2022. The Trustees noted the reasons for the Fund’s underperformance, the steps the Adviser had taken or was taking to improve performance, and that the performance trend was improving.
· For Janus Henderson Mid Cap Value Fund, the Trustees noted that the Fund’s performance was in the bottom Broadridge quartile for the 36 months ended May 31, 2022 and the second Broadridge quartile for the 12 months ended May 31, 2022. The Trustees noted the reasons for the Fund’s underperformance, while also noting that the Fund has a performance fee structure that results in lower management fees during periods of underperformance, the steps the Adviser had taken or was taking to improve performance, and that the performance trend was improving.
· For Janus Henderson Research Fund, the Trustees noted that the Fund’s performance was in the third Broadridge quartile for the 36 months ended May 31, 2022 and the third Broadridge quartile for the 12 months ended May 31, 2022. The Trustees noted the reasons for the Fund’s underperformance, while also noting that the Fund has a performance fee structure that results in lower management fees during periods of underperformance and the steps the Adviser had taken or was taking to improve performance.
· For Janus Henderson Small Cap Value Fund, the Trustees noted that the Fund’s performance was in the bottom Broadridge quartile for the 36 months ended May 31, 2022 and the second Broadridge quartile for the 12 months ended May 31, 2022. The Trustees noted the reasons for the Fund’s underperformance, while also noting that the Fund has a performance fee structure that results in lower management fees during periods of underperformance, the steps the Adviser had taken or was taking to improve performance, and that the performance trend was improving.
· For Janus Henderson Small-Mid Cap Value Fund, the Trustees noted that the Fund’s performance was in the bottom Broadridge quartile for the 36 months ended May 31, 2022 and the second Broadridge quartile for the 12 months ended May 31, 2022. The Trustees noted the reasons for the Fund’s underperformance, while also noting that the Fund has a performance fee structure that results in lower management fees during periods of underperformance, the steps the Adviser had taken or was taking to improve performance, and that the performance trend is improving.
· For Janus Henderson Triton Fund, the Trustees noted that the Fund’s performance was in the bottom Broadridge quartile for the 36 months ended May 31, 2022 and the second Broadridge quartile for the 12 months ended May 31, 2022. The Trustees noted the reasons for the Fund’s underperformance, the steps the Adviser had taken or was taking to improve performance, and that the performance trend was improving.
· For Janus Henderson Venture Fund, the Trustees noted that the Fund’s performance was in the bottom Broadridge quartile for the 36 months ended May 31, 2022 and the second Broadridge quartile for the 12 months ended May
Janus Henderson Small Cap Value Fund
Additional Information (unaudited)
31, 2022. The Trustees noted the reasons for the Fund’s underperformance, the steps the Adviser had taken or was taking to improve performance, and that the performance trend was improving.
In consideration of each Janus Henderson Fund’s performance, the Trustees concluded that, taking into account the factors relevant to performance, as well as other considerations, including steps taken to improve performance, as applicable, the Janus Henderson Fund’s performance warranted continuation of such Janus Henderson Fund’s investment advisory agreement.
Costs of Services Provided
The Trustees examined information regarding the fees and expenses of each Janus Henderson Fund in comparison to similar information for other comparable funds as provided by Broadridge, an independent data provider. They also reviewed an analysis of that information provided by their independent fee consultant. The independent fee consultant provided its belief that the management fees charged by the Adviser to each of the Janus Henderson Funds under the current investment advisory and administration agreements are reasonable in relation to the services provided by the Adviser. The independent fee consultant found: (1) the total expenses and management fees of the Janus Henderson Funds to be reasonable relative to other comparable mutual funds; (2) the total expenses, on average, were 6% under the average total expenses of the respective Broadridge peer group; and (3) the management fees for the Janus Henderson Funds, on average, were 5% under the average management fees for the respective Broadridge peer group. The Trustees also considered the total expenses for each share class of each Janus Henderson Fund compared to the average total expenses for its Broadridge Expense Group and to average total expenses for its Broadridge Expense Universe.
For Janus Henderson Funds with three or more years of performance history, the independent fee consultant also performed a systematic “focus list” analysis of expenses which assessed fund fees in the context of fund performance being delivered. Based on this analysis, the independent fee consultant found that the combination of service quality/performance and expenses on these individual Janus Henderson Funds was reasonable in light of performance trends, performance histories, changes in portfolio management, relative average net asset levels, and the existence of performance fees, breakpoints, and/or expense waivers on such Janus Henderson Funds.
The Trustees considered the methodology used by the Adviser in determining compensation payable to portfolio managers, the competitive environment for investment management talent, and the competitive market for mutual funds in different distribution channels.
The Trustees also reviewed management fees charged by the Adviser to comparable separate account clients and to comparable non-affiliated funds subadvised by the Adviser (for which the Adviser provides only or primarily portfolio management services). Although in most instances subadvisory and separate account fee rates for various investment strategies were lower than management fee rates for Janus Henderson Funds having a similar strategy, the Trustees considered that the Adviser noted that, under the terms of the management agreements with the Janus Henderson Funds, the Adviser performs significant additional services for the Janus Henderson Funds that it does not provide to those other clients, including administration services, oversight of the Janus Henderson Funds’ other service providers, Trustee support, regulatory compliance and numerous other services, and that, in serving the Janus Henderson Funds, the Adviser assumes many legal risks and other costs that it does not assume in servicing its other clients. Moreover, the Trustees noted that the independent fee consultant found that: (1) the management fees the Adviser charges to the Janus Henderson Funds are reasonable in relation to the management fees the Adviser charges to funds subadvised by the Adviser and to the fees the Adviser charges to its institutional separate account clients; (2) these subadvised and institutional separate accounts have different service and infrastructure needs and operate in markets very different from the retail fund market; (3) Janus Henderson mutual fund investors enjoy reasonable fees relative to the fees charged in these other markets; and (4) as part of its 2022 review, 9 of 11 Janus Henderson Funds have lower management fees than similar funds subadvised by the Adviser. The Trustees noted that for the two Janus Henderson Funds that did not, management fees for each were under the average of its 15(c) peer group.
The Trustees considered the fees for each Janus Henderson Fund for its fiscal year ended in 2021 and noted the following with regard to each Janus Henderson Fund’s total expenses, net of applicable fee waivers (the Fund’s “total expenses”) as reflected in the comparative information provided by Broadridge:
Janus Henderson Small Cap Value Fund
Additional Information (unaudited)
Asset Allocation Funds
· For Janus Henderson Global Allocation Fund – Conservative, the Trustees noted that, although the Fund’s total expenses exceeded the peer group average for certain share classes, overall the Fund’s total expenses were reasonable. The Trustees also noted that the Adviser has contractually agreed to limit the Fund’s expenses.
· For Janus Henderson Global Allocation Fund – Growth, the Trustees noted that, although the Fund’s total expenses exceeded the peer group average for certain share classes, overall the Fund’s total expenses were reasonable. The Trustees also noted that the Adviser has contractually agreed to limit the Fund’s expenses, although this limit did not apply because the Fund’s total expenses as shown were below the applicable fee limit.
· For Janus Henderson Global Allocation Fund – Moderate, the Trustees noted that, although the Fund’s total expenses exceeded the peer group average for one share class, overall the Fund’s total expenses were reasonable. The Trustees also noted that the Adviser has contractually agreed to limit the Fund’s expenses.
Fixed-Income Funds
· For Janus Henderson Absolute Return Income Opportunities Fund, the Trustees noted that, although the Fund’s total expenses exceeded the peer group average for certain share classes, overall the Fund’s total expenses were reasonable. The Trustees also noted that the Adviser has contractually agreed to limit the Fund’s expenses.
· For Janus Henderson Developed World Bond Fund, the Trustees noted that, although the Fund’s total expenses exceeded the peer group average for one share class, overall the Fund’s total expenses were reasonable. The Trustees also noted that the Adviser has contractually agreed to limit the Fund’s expenses.
· For Janus Henderson Flexible Bond Fund, the Trustees noted that, although the Fund’s total expenses exceeded the peer group average for certain share classes, overall the Fund’s total expenses were reasonable. The Trustees also noted that the Adviser has contractually agreed to limit the Fund’s expenses, although this limit did not apply because the Fund’s total expenses as shown were below the applicable fee limit.
· For Janus Henderson Global Bond Fund, the Trustees noted that, although the Fund’s total expenses exceeded the peer group average for certain share classes, overall the Fund’s total expenses were reasonable. The Trustees also noted that the Adviser has contractually agreed to limit the Fund’s expenses.
· For Janus Henderson High-Yield Fund, the Trustees noted that, although the Fund’s total expenses exceeded the peer group average for certain share classes, overall the Fund’s total expenses were reasonable. The Trustees also noted that the Adviser has contractually agreed to limit the Fund’s expenses.
· For Janus Henderson Multi-Sector Income Fund, the Trustees noted that, although the Fund’s total expenses exceeded the peer group average for certain share classes, overall the Fund’s total expenses were reasonable. The Trustees also noted that the Adviser has contractually agreed to limit the Fund’s expenses.
· For Janus Henderson Short Duration Flexible Bond Fund, the Trustees noted that, although the Fund’s total expenses exceeded the peer group average for certain share classes, overall the Fund’s total expenses were reasonable. The Trustees also noted that the Adviser has contractually agreed to limit the Fund’s expenses.
Global and International Equity Funds
· For Janus Henderson Asia Equity Fund, the Trustees noted that, although the Fund’s total expenses exceeded the peer group average for certain share classes, overall the Fund’s total expenses were reasonable. The Trustees also noted that the Adviser has contractually agreed to limit the Fund’s expenses.
· For Janus Henderson Emerging Markets Fund, the Trustees noted that, although the Fund’s total expenses exceeded the peer group average for certain share classes, overall the Fund’s total expenses were reasonable. The Trustees also noted that the Adviser has contractually agreed to limit the Fund’s expenses.
· For Janus Henderson European Focus Fund, the Trustees noted that, although the Fund’s total expenses exceeded the peer group average for one share class, overall the Fund’s expenses were reasonable. The Trustees also noted that the Adviser has contractually agreed to limit the Fund’s expenses.
· For Janus Henderson Global Equity Income Fund, the Trustees noted that, although the Fund’s total expenses exceeded the peer group average for one share class, overall the Fund’s total expenses were reasonable. The
Janus Henderson Small Cap Value Fund
Additional Information (unaudited)
Trustees also noted that the Adviser has contractually agreed to limit the Fund’s expenses, although this limit did not apply because the Fund’s total expenses as shown were below the applicable fee limit.
· For Janus Henderson Global Life Sciences Fund, the Trustees noted that the Fund’s total expenses were below the peer group average for all share classes.
· For Janus Henderson Global Real Estate Fund, the Trustees noted that, although the Fund’s total expenses exceeded the peer group average for certain share classes, overall the Fund’s total expenses were reasonable. The Trustees also noted that the Adviser has contractually agreed to limit the Fund’s expenses, although this limit did not apply because the Fund’s total expenses as shown were below the applicable fee limit.
· For Janus Henderson Global Research Fund, the Trustees noted that, although the Fund’s total expenses exceeded the peer group average for one share class, overall the Fund’s total expenses were reasonable. The Trustees also noted that the Adviser has contractually agreed to limit the Fund’s expenses, although this limit did not apply because the Fund’s total expenses as shown were below the applicable fee limit.
· For Janus Henderson Global Select Fund, the Trustees noted that, although the Fund’s total expenses exceeded the peer group average for certain share classes, overall the Fund’s total expenses were reasonable. The Trustees also noted that the Adviser has contractually agreed to limit the Fund’s expenses.
· For Janus Henderson Global Sustainable Equity Fund, the Trustees noted that, although the Fund’s total expenses exceeded the peer group average for certain share classes, overall the Fund’s expenses were reasonable. The Trustees also noted that the Adviser has contractually agreed to limit the Fund’s expenses.
· For Janus Henderson Global Technology and Innovation Fund, the Trustees noted that the Fund’s total expenses were below the peer group average for all share classes.
· For Janus Henderson International Opportunities Fund, the Trustees noted that, although the Fund’s total expenses exceeded the peer group average for certain share classes, overall the Fund’s expenses were reasonable. The Trustees also noted that the Adviser has contractually agreed to limit the Fund’s expenses.
· For Janus Henderson Overseas Fund, the Trustees noted that although the Fund’s total expenses exceeded the peer group average for certain share classes, overall the Fund’s total expenses were reasonable. The Trustees also noted that the Adviser has contractually agreed to limit the Fund’s expenses, although this limit did not apply because the Fund’s total expenses as shown were below the applicable fee limit.
· For Janus Henderson Responsible International Dividend Fund (formerly the Janus Henderson Dividend & Income Builder Fund), the Trustees noted that, although the Fund’s total expenses exceeded the peer group for one share class, overall the Fund’s total expenses were reasonable. The Trustees also noted that the Adviser has contractually agreed to limit the Fund’s expenses.
Money Market Funds
· For Janus Henderson Government Money Market Fund, the Trustees noted that the Fund’s total expenses were below the peer group average for all share classes.
· For Janus Henderson Money Market Fund, the Trustees noted that the Fund’s total expenses were below the peer group average for all share classes.
Multi-Asset Funds
· For Janus Henderson Adaptive Global Allocation Fund, the Trustees noted that the Fund’s total expenses were below the peer group average for all share classes.
· For Janus Henderson Balanced Fund, the Trustees noted that, although the Fund’s total expenses exceeded the peer group average for certain share classes, overall the Fund’s total expenses were reasonable. The Trustees also noted that the Adviser has contractually agreed to limit the Fund’s expenses, although this limit did not apply because the Fund’s total expenses as shown were below the applicable fee limit.
Janus Henderson Small Cap Value Fund
Additional Information (unaudited)
U.S. Equity Funds
· For Janus Henderson Adaptive Risk Managed U.S. Equity Fund, the Trustees noted that, although the Fund’s total expenses exceeded the peer group average for certain share classes, overall the Fund’s total expenses were reasonable. The Trustees also noted that the Adviser has contractually agreed to limit the Fund’s expenses, although this limit did not apply because the Fund’s total expenses as shown were below the applicable fee limit.
· For Janus Henderson Contrarian Fund, the Trustees noted that, although the Fund’s total expenses exceeded the peer group average for all share classes, overall the Fund’s total expenses were reasonable. The Trustees also noted that the Adviser had contractually agreed to limit the Fund’s expenses.
· For Janus Henderson Enterprise Fund, the Trustees noted that, although the Fund’s total expenses exceeded the peer group average for certain share classes, overall the Fund’s total expenses were reasonable. The Trustees also noted that the Adviser has contractually agreed to limit the Fund’s expenses, although this limit did not apply because the Fund’s total expenses as shown were below the applicable fee limit.
· For Janus Henderson Forty Fund, the Trustees noted that, although the Fund’s total expenses exceeded the peer group average for certain share classes, overall the Fund’s total expenses were reasonable. The Trustees also noted that the Adviser has contractually agreed to limit the Fund’s expenses, although this limit did not apply because the Fund’s total expenses as shown were below the applicable fee limit.
· For Janus Henderson Growth and Income Fund, the Trustees noted that, although the Fund’s total expenses exceeded the peer group average for certain share classes, overall the Fund’s total expenses were reasonable. The Trustees also noted that the Adviser has contractually agreed to limit the Fund’s expenses, although this limit did not apply because the Fund’s total expenses as shown were below the applicable fee limit.
· For Janus Henderson Mid Cap Value Fund, the Trustees noted that the Fund’s total expenses were below the peer group average for all share classes.
· For Janus Henderson Research Fund, the Trustees noted that, although the Fund’s total expenses exceeded the peer group average for certain share classes, overall the Fund’s total expenses were reasonable. The Trustees also noted that the Adviser has contractually agreed to limit the Fund’s expenses.
· For Janus Henderson Small Cap Value Fund, the Trustees noted that, although the Fund’s total expenses exceeded the peer group average for one share class, overall the Fund’s total expenses were reasonable. The Trustees also noted that the Adviser has contractually agreed to limit the Fund’s expenses, although this limit did not apply because the Fund’s total expenses as shown were below the applicable fee limit.
· For Janus Henderson Small-Mid Cap Value Fund, the Trustees noted that the Fund’s total expenses were below the peer group average for all share classes.
· For Janus Henderson Triton Fund, the Trustees noted that, although the Fund’s total expenses exceeded the peer group average for one share class, overall the Fund’s total expenses were reasonable. The Trustees also noted that the Adviser has contractually agreed to limit the Fund’s expenses, although this limit did not apply because the Fund’s total expenses as shown were below the applicable fee limit.
· For Janus Henderson Venture Fund, the Trustees noted that although the Fund’s total expenses exceeded the peer group average for one share class, overall the Fund’s total expenses were reasonable. The Trustees also noted that the Adviser has contractually agreed to limit the Fund’s expenses, although this limit did not apply because the Fund’s total expenses as shown were below the applicable fee limit.
The Trustees reviewed information on the overall profitability to the Adviser and its affiliates from their relationships with the Janus Henderson Funds, and considered profitability data of other publicly traded mutual fund advisers. The Trustees recognized that profitability comparisons among fund managers are difficult because of the variation in the type of comparative information that is publicly available, and the profitability of any fund manager is affected by numerous factors, including the organizational structure of the particular fund manager, differences in complex size, difference in product mix, difference in types of business (mutual fund, institutional and other), differences in the types of funds and other accounts it manages, possible other lines of business, the methodology for allocating expenses and the fund manager’s capital structure and cost of capital.
Janus Henderson Small Cap Value Fund
Additional Information (unaudited)
Additionally, the Trustees considered the estimated profitability to the Adviser from the investment management services it provided to each Janus Henderson Fund. In their review, the Trustees considered whether the Adviser receive adequate incentives and resources to manage the Janus Henderson Funds effectively. In reviewing profitability, the Trustees noted that the estimated profitability for an individual Janus Henderson Fund is necessarily a product of the allocation methodology utilized by the Adviser to allocate its expenses as part of the estimated profitability calculation. In this regard, the Trustees noted that the independent fee consultant found as part of its 2022 review that (1) the expense allocation methodology and rationales utilized by the Adviser were reasonable and (2) no clear correlation exists between expense allocations and operating margins. The Trustees also considered that the estimated profitability for an individual Janus Henderson Fund was influenced by a number of factors, including not only the allocation methodology selected, but also the presence of fee waivers and expense caps, and whether the Janus Henderson Fund’s investment management agreement contained breakpoints or a performance fee component. The Trustees determined, after taking into account these factors, among others, that the Adviser’s estimated profitability with respect to each Janus Henderson Fund was not unreasonable in relation to the services provided, and that the variation in the range of such estimated profitability among the Janus Henderson Funds was not a material factor in the Board’s approval of the reasonableness of any Janus Henderson Fund’s investment management fees.
The Trustees concluded that the management fees payable by each Janus Henderson Fund to the Adviser were reasonable in relation to the nature, extent, and quality of the services provided, taking into account the fees charged by other advisers for managing comparable mutual funds with similar strategies, the fees the Adviser charges to other clients, and, as applicable, the impact of fund performance on management fees payable by the Janus Henderson Funds. The Trustees also concluded that each Janus Henderson Fund’s total expenses were reasonable, taking into account the size of the Janus Henderson Fund, the quality of services provided by the Adviser, the investment performance of the Janus Henderson Fund, and any expense limitations agreed to or provided by the Adviser.
Economies of Scale
The Trustees considered information about the potential for the Adviser to realize economies of scale as the assets of the Janus Henderson Funds increase. They noted that their independent fee consultant published a report to the Trustees in June 2022 which provided its research and analysis into economies of scale. They also noted that, although many Janus Henderson Funds pay advisory fees at a fixed base rate as a percentage of net assets, without any breakpoints or performance fees, their independent fee consultant concluded that 75% of these Janus Henderson Funds’ have contractual management fees (gross of waivers) below their Broadridge Expense Group averages. The Trustees also noted the following from the independent fee consultant’s report: (1) that 31% of Janus Henderson Funds had management fee breakpoints in place whereby investors pay lower management fees as fund AUM increases; (2) that 29% of Janus Henderson Funds have low flat-rate fees and performance fees where the Adviser is incentivized to invest in resources which drive Janus Henderson Fund performance; and (3) that 39% of Janus Henderson Funds have low flat-rate fees versus peers where investors pay low fixed fees when the Janus Henderson Fund is small/midsized and higher fees when the Janus Henderson Fund grows in assets. The Trustees also noted that the Janus Henderson Funds share directly in economies of scale through the significant investments made by the Adviser and its affiliates related to services provided to the Funds and the lower charges of third-party service providers that are based in part on the combined scale of all of the Janus Henderson Funds.
The Trustees also considered the independent fee consultant’s conclusion that, given the limitations of various analytical approaches to economies of scale and their conflicting results, it is difficult to analytically confirm or deny the existence of economies of scale in the Janus Henderson complex. In this regard, the independent consultant concluded that (1) to the extent there were economies of scale at the Adviser, the Adviser’s general strategy of setting fixed management fees below peers appeared to share any such economies with investors even on smaller Janus Henderson Funds which have not yet achieved those economies and (2) by setting lower fixed fees from the start on these Janus Henderson Funds, the Adviser appeared to be investing to increase the likelihood that these Janus Henderson Funds will grow to a level to achieve any economies of scale that may exist. Further, the independent fee consultant provided its belief that Janus Henderson Fund investors are well-served by the fee levels and performance fee structures in place on the Janus Henderson Funds in light of any economies of scale that may be present at the Adviser.
Based on all of the information reviewed, including the recent and past research and analysis conducted by the Trustees’ independent fee consultant, the Trustees concluded that the current fee structure of each Janus Henderson Fund was reasonable and that the current rates of fees do reflect a sharing between the Adviser and the Janus
Janus Henderson Small Cap Value Fund
Additional Information (unaudited)
Henderson Fund of any economies of scale that may be present at the current asset level of the Janus Henderson Fund.
Other Benefits to the Adviser
The Trustees also considered benefits that accrue to the Adviser and its affiliates from their relationships with the Janus Henderson Funds. They recognized that two affiliates of the Adviser separately serve the Janus Henderson Funds as transfer agent and distributor, respectively, and the transfer agent receives compensation directly from the non-money market Janus Henderson Funds for services provided, and that such compensation contributes to the overall profitability of the Adviser and its affiliates that results from their relationship with the Janus Henderson Funds. The Trustees also considered the Adviser’s past and proposed use of commissions paid by the Janus Henderson Funds on portfolio brokerage transactions to obtain proprietary and third-party research products and services benefiting the Janus Henderson Fund and/or other clients of the Adviser and/or the Adviser. The Trustees concluded that the Adviser’s use of these types of client commission arrangements to obtain proprietary and third-party research products and services was consistent with regulatory requirements and guidelines and was likely to benefit each Janus Henderson Fund. The Trustees also concluded that, other than the services provided by the Adviser and its affiliates pursuant to the agreements and the fees to be paid by each Janus Henderson Fund therefor, the Janus Henderson Funds and the Adviser may potentially benefit from their relationship with each other in other ways. They concluded that the Adviser and its affiliates share directly in economies of scale through the lower charges of third-party service providers that are based in part on the combined scale of the Janus Henderson Funds and other clients serviced by the Adviser and its affiliates. They also concluded that the Adviser benefits from the receipt of research products and services acquired through commissions paid on portfolio transactions of the Janus Henderson Funds and that the Janus Henderson Funds benefit from the Adviser’s receipt of those products and services as well as research products and services acquired through commissions paid by other clients of the Adviser. They further concluded that the success of any Janus Henderson Fund could attract other business to the Adviser or other Janus Henderson Funds, and that the success of the Adviser could enhance the Adviser’s ability to serve the Janus Henderson Funds.
Janus Henderson Small Cap Value Fund
Liquidity Risk Management Program (unaudited)
Liquidity Risk Management Program
Rule 22e-4 under the Investment Company Act of 1940, as amended (the “Liquidity Rule”), requires open-end funds (but not money market funds) to adopt and implement a written liquidity risk management program (the “LRMP”) that is reasonably designed to assess and manage liquidity risk, which is the risk that a fund could not meet redemption requests without significant dilution of remaining investors’ interest in the fund. The Fund has implemented a LRMP, which incorporates the following elements: (i) assessment, management, and periodic review of liquidity risk; (ii) classification of portfolio holdings; (iii) the establishment and monitoring of a highly liquid investment minimum, as applicable; (iv) a 15% limitation on a Fund’s illiquid investments; (v) redemptions in-kind; and (vi) board oversight.
The Trustees of the Fund (the “Trustees”) have designated Janus Henderson Investors US LLC, the Fund’s investment adviser (the “Adviser”), as the Program Administrator for the LRMP responsible for administering the LRMP and carrying out the specific responsibilities of the LRMP. A working group comprised of various teams within the Adviser’s business is responsible for administering the LRMP and carrying out the specific responsibilities of different aspects of the LRMP (the “Liquidity Risk Working Group”). In assessing each Fund’s liquidity risk, the Liquidity Risk Working Group periodically considers, as relevant, factors including (i) the liquidity of a Fund’s portfolio investments during normal and reasonably foreseeable stressed conditions; (ii) whether a Fund’s investment strategy is appropriate for an open-end fund; (iii) the extent to which a Fund’s strategy involves a relatively concentrated portfolio or large positions in any issuer; (iv) a Fund’s use of borrowing for investment purposes; and (v) a Fund’s use of derivatives.
The Liquidity Rule requires the Trustees to review at least annually a written report provided by the Program Administrator that addresses the operation of the LRMP and assesses its adequacy and the effectiveness of its implementation, including, if applicable, the operation of the highly liquid investment minimum, and any material changes to the LRMP (the “Program Administrator Report”). At a meeting held on March 15, 2023, the Adviser provided the Program Administrator Report to the Trustees which covered the operation of the LRMP from January 1, 2022 through December 31, 2022 (the “Reporting Period”).
The Program Administrator Report discussed the operation and effectiveness of the LRMP during the Reporting Period. Among other things, the Program Administrator Report indicated that there were no material changes to the LRMP during the Reporting Period, although there were certain methodology adjustments implemented relating to a change in data provider. Additionally, the findings presented in the Program Administrator Report indicated that the LRMP operated adequately during the Reporting Period. These findings included that the Fund was able to meet redemptions during the normal course of business during the Reporting Period. The Program Administrator Report also stated that the Fund did not exceed the 15% limit on illiquid assets during the Reporting Period, that the Fund held primarily highly liquid assets, and was considered to be a primarily highly liquid fund during the Reporting Period. Also included among the Program Administrator Report’s findings was the determination that the Fund’s investment strategy remains appropriate for an open-end fund. In addition, the Adviser expressed its belief in the Program Administrator Report that the LRMP is reasonably designed and adequate to assess and manage the Fund’s liquidity risk, considering the Fund’s particular risks and circumstances, and includes policies and procedures reasonably designed to implement each required component of the Liquidity Rule.
There can be no assurance that the LRMP will achieve its objectives in the future. Please refer to your Fund’s prospectus for more information regarding the risks to which an investment in the Fund may be subject.
Janus Henderson Small Cap Value Fund
Useful Information About Your Fund Report (unaudited)
Management Commentary
The Management Commentary in this report includes valuable insight as well as statistical information to help you understand how your Fund’s performance and characteristics stack up against those of comparable indices.
If the Fund invests in foreign securities, this report may include information about country exposure. Country exposure is based primarily on the country of risk. A company may be allocated to a country based on other factors such as location of the company’s principal office, the location of the principal trading market for the company’s securities, or the country where a majority of the company’s revenues are derived.
Please keep in mind that the opinions expressed in the Management Commentary are just that: opinions. They are a reflection based on best judgment at the time this report was compiled, which was June 30, 2023. As the investing environment changes, so could opinions. These views are unique and are not necessarily shared by fellow employees or by Janus Henderson in general.
Performance Overviews
Performance overview graphs compare the performance of a hypothetical $10,000 investment in the Fund with one or more widely used market indices. When comparing the performance of the Fund with an index, keep in mind that market indices are not available for investment and do not reflect deduction of expenses.
Average annual total returns are quoted for a Fund with more than one year of performance history. Average annual total return is calculated by taking the growth or decline in value of an investment over a period of time, including reinvestment of dividends and distributions, then calculating the annual compounded percentage rate that would have produced the same result had the rate of growth been constant throughout the period. Average annual total return does not reflect the deduction of taxes that a shareholder would pay on Fund distributions or redemptions of Fund shares.
Cumulative total returns are quoted for a Fund with less than one year of performance history. Cumulative total return is the growth or decline in value of an investment over time, independent of the period of time involved. Cumulative total return does not reflect the deduction of taxes that a shareholder would pay on Fund distributions or redemptions of Fund shares.
Pursuant to federal securities rules, expense ratios shown in the performance chart reflect subsidized (if applicable) and unsubsidized ratios. The total annual fund operating expenses ratio is gross of any fee waivers, reflecting the Fund’s unsubsidized expense ratio. The net annual fund operating expenses ratio (if applicable) includes contractual waivers of the Adviser and reflects the Fund’s subsidized expense ratio. Ratios may be higher or lower than those shown in the “Financial Highlights” in this report.
Schedule of Investments
Following the performance overview section is the Fund’s Schedule of Investments. This schedule reports the types of securities held in the Fund on the last day of the reporting period. Securities are usually listed by type (common stock, corporate bonds, U.S. Government obligations, etc.) and by industry classification (banking, communications, insurance, etc.). Holdings are subject to change without notice.
The value of each security is quoted as of the last day of the reporting period. The value of securities denominated in foreign currencies is converted into U.S. dollars.
If the Fund invests in foreign securities, it will also provide a summary of investments by country. This summary reports the Fund exposure to different countries by providing the percentage of securities invested in each country. The country of each security represents the country of risk. The Fund’s Schedule of Investments relies upon the industry group and country classifications published by Bloomberg and/or MSCI Inc.
Tables listing details of individual forward currency contracts, futures, written options, swaptions, and swaps follow the Fund’s Schedule of Investments (if applicable).
Statement of Assets and Liabilities
This statement is often referred to as the “balance sheet.” It lists the assets and liabilities of the Fund on the last day of the reporting period.
Janus Henderson Small Cap Value Fund
Useful Information About Your Fund Report (unaudited)
The Fund’s assets are calculated by adding the value of the securities owned, the receivable for securities sold but not yet settled, the receivable for dividends declared but not yet received on securities owned, and the receivable for Fund shares sold to investors but not yet settled. The Fund’s liabilities include payables for securities purchased but not yet settled, Fund shares redeemed but not yet paid, and expenses owed but not yet paid. Additionally, there may be other assets and liabilities such as unrealized gain or loss on forward currency contracts.
The section entitled “Net Assets Consist of” breaks down the components of the Fund’s net assets. Because the Fund must distribute substantially all earnings, you will notice that a significant portion of net assets is shareholder capital.
The last section of this statement reports the net asset value (“NAV”) per share on the last day of the reporting period. The NAV is calculated by dividing the Fund’s net assets for each share class (assets minus liabilities) by the number of shares outstanding.
Statement of Operations
This statement details the Fund’s income, expenses, realized gains and losses on securities and currency transactions, and changes in unrealized appreciation or depreciation of Fund holdings.
The first section in this statement, entitled “Investment Income,” reports the dividends earned from securities and interest earned from interest-bearing securities in the Fund.
The next section reports the expenses incurred by the Fund, including the advisory fee paid to the investment adviser, transfer agent fees and expenses, and printing and postage for mailing statements, financial reports and prospectuses. Expense offsets and expense reimbursements, if any, are also shown.
The last section lists the amounts of realized gains or losses from investment and foreign currency transactions, and changes in unrealized appreciation or depreciation of investments and foreign currency-denominated assets and liabilities. The Fund will realize a gain (or loss) when it sells its position in a particular security. A change in unrealized gain (or loss) refers to the change in net appreciation or depreciation of the Fund during the reporting period. “Net Realized and Unrealized Gain/(Loss) on Investments” is affected both by changes in the market value of Fund holdings and by gains (or losses) realized during the reporting period.
Statements of Changes in Net Assets
These statements report the increase or decrease in the Fund’s net assets during the reporting period. Changes in the Fund’s net assets are attributable to investment operations, dividends and distributions to investors, and capital share transactions. This is important to investors because it shows exactly what caused the Fund’s net asset size to change during the period.
The first section summarizes the information from the Statement of Operations regarding changes in net assets due to the Fund’s investment operations. The Fund’s net assets may also change as a result of dividend and capital gains distributions to investors. If investors receive their dividends and/or distributions in cash, money is taken out of the Fund to pay the dividend and/or distribution. If investors reinvest their dividends and/or distributions, the Fund’s net assets will not be affected.
The reinvestment of dividends and distributions is included under “Capital Share Transactions.” “Capital Shares” refers to the money investors contribute to the Fund through purchases or withdrawals via redemptions. The Fund’s net assets will increase and decrease in value as investors purchase and redeem shares from the Fund.
Financial Highlights
This schedule provides a per-share breakdown of the components that affect the Fund’s NAV for current and past reporting periods as well as total return, asset size, ratios, and portfolio turnover rate.
The first line in the table reflects the NAV per share at the beginning of the reporting period. The next line reports the net investment income/(loss) per share. Following is the per share total of net gains/(losses), realized and unrealized. Per share dividends and distributions to investors are then subtracted to arrive at the NAV per share at the end of the period. The next line reflects the total return for the period. The total return may include adjustments in accordance with generally accepted accounting principles required at the period end for financial reporting purposes. As a result, the total return may differ from the total return reflected for individual shareholder transactions. Also included are ratios of expenses and net investment income to average net assets.
Janus Henderson Small Cap Value Fund
Useful Information About Your Fund Report (unaudited)
The Fund’s expenses may be reduced through expense offsets and expense reimbursements. The ratios shown reflect expenses before and after any such offsets and reimbursements.
The ratio of net investment income/(loss) summarizes the income earned less expenses, divided by the average net assets of the Fund during the reporting period. Do not confuse this ratio with the Fund’s yield. The net investment income ratio is not a true measure of the Fund’s yield because it does not take into account the dividends distributed to the Fund’s investors.
The next figure is the portfolio turnover rate, which measures the buying and selling activity in the Fund. Portfolio turnover is affected by market conditions, changes in the asset size of the Fund, fluctuating volume of shareholder purchase and redemption orders, the nature of the Fund’s investments, and the investment style and/or outlook of the portfolio manager(s) and/or investment personnel. A 100% rate implies that an amount equal to the value of the entire portfolio was replaced once during the fiscal year; a 50% rate means that an amount equal to the value of half the portfolio is traded in a year; and a 200% rate means that an amount equal to the value of the entire portfolio is traded every six months.
Janus Henderson Small Cap Value Fund
Designation Requirements (unaudited)
For federal income tax purposes, the Fund designated the following for the year ended June 30, 2023:
| | |
| | |
Section 163(j) Interest Dividend | 4% |
Capital Gain Distributions | $121,783,368 |
Dividends Received Deduction Percentage | 100% |
Qualified Dividend Income Percentage | 100% |
Janus Henderson Small Cap Value Fund
Trustees and Officers (unaudited)
The following are the Trustees and officers of the Trust, together with a brief description of their principal occupations during the last five years (principal occupations for certain Trustees may include periods over five years). The Fund’s Statement of Additional Information includes additional information about the Trustees and officers and is available, without charge, by calling 1-877-335-2687.
Each Trustee has served in that capacity since he or she was originally elected or appointed. The Trustees do not serve a specified term of office. Each Trustee will hold office until the termination of the Trust or his or her earlier death, resignation, retirement, incapacity, or removal. Under the Fund’s Governance Procedures and Guidelines, the policy is for Trustees to retire no later than the end of the calendar year in which the Trustee turns 75. The Trustees review the Fund’s Governance Procedures and Guidelines from time to time and may make changes they deem appropriate. The Fund’s Nominating and Governance Committee will consider nominees for the position of Trustee recommended by shareholders. Shareholders may submit the name of a candidate for consideration by the Committee by submitting their recommendations to the Trust’s Secretary. Each Trustee is currently a Trustee of one other registered investment company advised by the Adviser: Janus Aspen Series. Collectively, these two registered investment companies consist of 49 series or funds referred to herein as the Fund Complex.
The Trust’s officers are elected annually by the Trustees for a one-year term. Certain officers also serve as officers of Janus Aspen Series. Certain officers of the Fund may also be officers and/or directors of the Adviser. Except as otherwise disclosed, Fund officers receive no compensation from the Fund, except for the Fund’s Chief Compliance Officer, as authorized by the Trustees.
| | | | | | |
TRUSTEES |
Name, Address, and Age | Positions Held with the Trust | Length of Time Served | Principal Occupations During the Past Five Years | Number of Portfolios/Funds in Fund Complex Overseen by Trustee | Other Directorships Held by Trustee During the Past Five Years |
Independent Trustees | | | | |
Alan A. Brown
151 Detroit Street
Denver, CO 80206
DOB: 1962 | Chairman
Trustee | 5/22-Present
1/13-Present | Principal, Curam Holdings LLC (since 2018). Formerly, Executive Vice President, Institutional Markets, of Black Creek Group (private equity real estate investment management firm) (2012-2018), Executive Vice President and Co-Head, Global Private Client Group (2007-2010), Executive Vice President, Mutual Funds (2005-2007), and Chief Marketing Officer (2001-2005) of Nuveen Investments, Inc. (asset management). | 49 | Advisory Board Member of AEW Core Property Trust (open-end property fund) (since 2020), and Director of WTTW (PBS affiliate) (since 2003). Formerly, Director of MotiveQuest LLC (strategic social market research company) (2003-2016), Director of Nuveen Global Investors LLC (2007-2011), Director of Communities in Schools (2004-2010), and Director of Mutual Fund Education Alliance (until 2010). |
Janus Henderson Small Cap Value Fund
Trustees and Officers (unaudited)
| | | | | | |
TRUSTEES |
Name, Address, and Age | Positions Held with the Trust | Length of Time Served | Principal Occupations During the Past Five Years | Number of Portfolios/Funds in Fund Complex Overseen by Trustee | Other Directorships Held by Trustee During the Past Five Years |
Independent Trustees | | | | |
Cheryl D. Alston
151 Detroit Street
Denver, CO 80206
DOB: 1966 | Trustee | 8/22-Present | Executive Director and Chief Investment Officer, Employees’ Retirement Fund of the City of Dallas (since 2004). | 49 | Director of Blue Cross Blue Shield of Kansas City (a not-for-profit health insurance provider) (since 2016) and Director of Global Life Insurance (life and supplemental health insurance provider) (since 2017). Formerly, Director of Federal Home Loan Bank of Dallas (2017-2021). |
Janus Henderson Small Cap Value Fund
Trustees and Officers (unaudited)
| | | | | | |
TRUSTEES |
Name, Address, and Age | Positions Held with the Trust | Length of Time Served | Principal Occupations During the Past Five Years | Number of Portfolios/Funds in Fund Complex Overseen by Trustee | Other Directorships Held by Trustee During the Past Five Years |
Independent Trustees | | | | |
Janus Henderson Small Cap Value Fund
Trustees and Officers (unaudited)
| | | | | | |
William D. Cvengros
151 Detroit Street
Denver, CO 80206
DOB: 1948 | Trustee | 1/11-Present | Chief Executive Officer of SJC Capital, LLC (a personal investment company and consulting firm) (since 2002). Formerly, Chief Executive Officer and President of PIMCO Advisors Holdings L.P. (a publicly traded investment management firm) (1994-2000), and Chief Investment Officer (1987-1994) and Vice Chairman and Director (1990-1994) of Pacific Life Insurance Company (a mutual life insurance and annuity company) (1987-1994). | 49 | Member, Limited Partner Advisory Committee, Karmel Capital Fund III (later stage growth fund) (since 2022), Member of the Investment Committee for the Orange County Community Foundation (a grantmaking foundation) (since 2020), Advisory Board Member, RevOZ Fund LP and related funds (real estate investments for opportunity zones) (since 2020), and Advisory Board Member, Innovate Partners Emerging Growth and Equity Fund I (early stage venture capital fund) (since 2014). Formerly, Managing Trustee of National Retirement Partners Liquidating Trust (2013-2016), Chairman, National Retirement Partners, Inc. (formerly a network of advisors to 401(k) plans) (2005-2013), Director of Prospect Acquisition Corp. (a special purpose acquisition corporation) (2007-2009), Director of RemedyTemp, Inc. (temporary help services company) (1996-2006), and Trustee of PIMCO Funds Multi-Manager Series (1990-2000) and Pacific Life Variable Life & Annuity Trusts (1987-1994). |
Janus Henderson Small Cap Value Fund
Trustees and Officers (unaudited)
| | | | | | |
TRUSTEES |
Name, Address, and Age | Positions Held with the Trust | Length of Time Served | Principal Occupations During the Past Five Years | Number of Portfolios/Funds in Fund Complex Overseen by Trustee | Other Directorships Held by Trustee During the Past Five Years |
Independent Trustees | | | | |
Raudline Etienne
151 Detroit Street
Denver, CO 80206
DOB: 1965 | Trustee | 6/16-Present | Founder, Daraja Capital (advisory and investment firm) (since 2016). Formerly, Senior Vice President and Senior Advisor, Albright Stonebridge Group LLC (global strategy firm) (2011-2021), and Deputy Comptroller and Chief Investment Officer, New York State Common Retirement Fund (public pension fund) (2008-2011). | 49 | Member of the Investment Committee for Cooper Union (private college) (since 2021) and Director of Brightwood Capital Advisors, LLC (since 2014). Formerly, Board Member, Van Alen Institute (nonprofit architectural and design organization) (2019-2022). |
Darrell B. Jackson
151 Detroit Street
Denver, CO 80206
DOB: 1958 | Trustee | 8/22-Present | President and Chief Executive Officer, The Efficace Group Inc. (since 2018). Formerly, President and Chief Executive Officer, Seaway Bank and Trust Company (community bank) (2014-2015), and Executive Vice President and Co-President, Wealth Management (2009-2014), and several senior positions, including Group Executive, Senior Vice President, and Vice President (1995-2009) of Northern Trust Company (financial services company) (1995-2014). | 49 | Director of Amalgamated Financial Corp (bank) (since August 2021), Director of YR Media (a not-for-profit production company) (since 2021), and Director of Gray-Bowen-Scott (transportation project consulting firm) (since April 2020). Formerly, Director of Delaware Place Bank (closely held commercial bank) (2016-2018) and Director of Seaway Bank and Trust Company (2014-2015). |
Janus Henderson Small Cap Value Fund
Trustees and Officers (unaudited)
| | | | | | |
TRUSTEES |
Name, Address, and Age | Positions Held with the Trust | Length of Time Served | Principal Occupations During the Past Five Years | Number of Portfolios/Funds in Fund Complex Overseen by Trustee | Other Directorships Held by Trustee During the Past Five Years |
Independent Trustees | | | | |
William F. McCalpin
151 Detroit Street
Denver, CO 80206
DOB: 1957 | Trustee | 6/02-Present | Chief Executive Officer, muun chi LLC (organic food business) (since 2022) and Independent Consultant (since 2019). Formerly, Chief Operating Officer, muun chi LLC (2020-2022), Managing Partner, Impact Investments, Athena Capital Advisors LLC (independent registered investment advisor) (2016-2019), Managing Director, Holos Consulting LLC (provides consulting services to foundations and other nonprofit organizations) (2009-2016), Chief Executive Officer, Imprint Capital Advisors (impact investment firm) (2013-2015), and Executive Vice President and Chief Operating Officer of The Rockefeller Brothers Fund (a private family foundation) (1998-2006). | 49 | Chairman of the Board and Trustee of The Investment Fund for Foundations Investment Program (TIP) (consisting of 1 fund) (since 2008). Formerly, Director of the F.B. Heron Foundation (a private grantmaking foundation) (2006-2022), and Director of Mutual Fund Directors Forum (a non-profit organization serving independent directors of U.S. mutual funds) (2016-2021). |
Janus Henderson Small Cap Value Fund
Trustees and Officers (unaudited)
| | | | | | |
TRUSTEES |
Name, Address, and Age | Positions Held with the Trust | Length of Time Served | Principal Occupations During the Past Five Years | Number of Portfolios/Funds in Fund Complex Overseen by Trustee | Other Directorships Held by Trustee During the Past Five Years |
Independent Trustees | | | | |
Gary A. Poliner
151 Detroit Street
Denver, CO 80206
DOB: 1953 | Trustee | 6/16-Present | Retired. Formerly, President (2010-2013) of Northwestern Mutual Life Insurance Company. | 49 | Director of MGIC Investment Corporation (private mortgage insurance) (since 2013). Formerly, Director, West Bend Mutual Insurance Company (property/casualty insurance) (2013-2021), Trustee of Northwestern Mutual Life Insurance Company (2010-2013) and Director of Frank Russell Company (global asset management firm) (2008-2013). |
Diane L. Wallace
151 Detroit Street
Denver, CO 80206
DOB: 1958 | Trustee | 6/17-Present | Retired. Formerly, Chief Operating Officer, Senior Vice President-Operations, and Chief Financial Officer for Driehaus Capital Management, LLC (1988-2006) and Treasurer for Driehaus Mutual Funds (1996-2002). | 49 | Formerly, Director of Family Service of Lake County (2019-2021), Independent Trustee, Henderson Global Funds (13 portfolios) (2015-2017), Independent Trustee, State Farm Associates’ Funds Trust, State Farm Mutual Fund Trust, and State Farm Variable Product Trust (28 portfolios) (2013-2017). |
Janus Henderson Small Cap Value Fund
Trustees and Officers (unaudited)
| | | | |
OFFICERS |
Name, Address, and Age | Positions Held with the Trust | Term of Office* and Length of Time Served | Principal Occupations During the Past Five Years |
Craig Kempler
151 Detroit Street
Denver, CO 80206
DOB: 1977 | Executive Vice President and Co-Portfolio Manager
Janus Henderson Small Cap Value Fund | 10/17-Present | Portfolio Manager for other Janus Henderson accounts. |
Justin Tugman
151 Detroit Street
Denver, CO 80206
DOB: 1973 | Executive Vice President and Co-Portfolio Manager
Janus Henderson Small Cap Value Fund | 3/09-Present | Portfolio Manager for other Janus Henderson accounts. |
Michelle Rosenberg
151 Detroit Street
Denver, CO 80206
DOB: 1973 | President and Chief Executive Officer | 9/22-Present | General Counsel and Corporate Secretary of Janus Henderson Investors (since 2018). Formerly, Interim President and Chief Executive Officer of the Trust and Janus Aspen Series (2022), Senior Vice President and Head of Legal, North America of Janus Henderson Investors (2017-2018) and Deputy General Counsel of Janus Henderson US (Holdings) Inc. (2015-2018). |
Kristin Mariani
151 Detroit Street
Denver, CO 80206
DOB: 1966 | Vice President and Chief Compliance Officer | 7/20-Present | Head of Compliance, North America at Janus Henderson Investors (since September 2020) and Chief Compliance Officer at Janus Henderson Investors US LLC (since September 2017). Formerly, Anti-Money Laundering Officer for the Trust and Janus Aspen Series (July 2020-December 2022), Global Head of Investment Management Compliance at Janus Henderson Investors (February 2019-August 2020), Vice President, Head of Global Distribution Compliance and Chief Compliance Officer at Janus Henderson Distributors US LLC (May 2017-September 2017), Vice President, Compliance at Janus Henderson US (Holdings) Inc., Janus Henderson Investors US LLC, and Janus Henderson Distributors US LLC (2009-2017). |
Janus Henderson Small Cap Value Fund
Trustees and Officers (unaudited)
| | | | |
OFFICERS |
Name, Address, and Age | Positions Held with the Trust | Term of Office* and Length of Time Served | Principal Occupations During the Past Five Years |
Jesper Nergaard
151 Detroit Street
Denver, CO 80206
DOB: 1962 | Chief Financial Officer
Vice President, Treasurer, and Principal Accounting Officer | 3/05-Present
2/05-Present | Head of U.S. Fund Administration, Janus Henderson Investors and Janus Henderson Services US LLC. |
Abigail J. Murray
151 Detroit Street
Denver, CO 80206
DOB: 1975 | Vice President, Chief Legal Counsel, and Secretary | 12/20-Present | Managing Counsel (since 2020). Formerly, Senior Counsel for Invesco Ltd. (2017-2020), and Vice President and Senior Counsel, ALPS Fund Services, Inc. and Assistant General Counsel, ALPS Advisors, Inc. (2015-2017). |
Ciaran Askin
151 Detroit Street
Denver, CO 80206
DOB: 1978 | Anti-Money Laundering Officer | 12/22-Present | Global Head of Financial Crime, Janus Henderson Investors (since 2022). Formerly, Global Head of Financial Crime for Invesco Ltd. (2017-2022). |
* Officers are elected at least annually by the Trustees for a one-year term and may also be elected from time to time by the Trustees for an interim period. |
Janus Henderson Small Cap Value Fund
Notes
NotesPage1
| | | | | | | | |
| | | | | |

| | | | |
This report is submitted for the general information of shareholders of the Fund. It is not an offer or solicitation for the Fund and is not authorized for distribution to prospective investors unless preceded or accompanied by an effective prospectus. |
Janus Henderson is a trademark of Janus Henderson Group plc or one of its subsidiaries. © Janus Henderson Group plc Janus Henderson Distributors US LLC Janus Henderson Group is the ultimate parent of Janus Henderson Distributors US LLC |
| | | | 125-02-93034 08-23 |
| | | |
| | | |
| | | ANNUAL REPORT June 30, 2023 |
| | |
| | Janus Henderson Small-Mid Cap Value Fund |
| | |
| | Janus Investment Fund |
| |
| | | |
| | | HIGHLIGHTS · Portfolio management perspective · Investment strategy behind your fund · Fund performance, characteristics
and holdings |
Table of Contents
Janus Henderson Small-Mid Cap Value Fund
Janus Henderson Small-Mid Cap Value Fund (unaudited)
| | | | | | |
| | | | 
Justin Tugman co-portfolio manager | 
Kevin Preloger co-portfolio manager |
| | | |
PERFORMANCE OVERVIEW
For the 12-month period ended June 30, 2023, the Janus Henderson Small-Mid Cap Value Fund Class I shares returned 15.40%, outperforming its primary benchmark, the Russell 2500TM Value Index, which returned 10.37%.
INVESTMENT ENVIRONMENT
Stocks began a volatile period in negative territory, with investors concerned about the pace and extent of interest rate hikes as central banks committed to getting inflation under control. Supply chain bottlenecks and commodity prices eased from earlier in 2022, but a tight labor market kept upward pressure on wages, leading the Federal Reserve (Fed) to hike interest rates 75 basis points (bps) in both July and September. The prospect of further rate tightening drove bond yields higher, adding to corporate funding challenges. Stocks then rose on hopes that moderating inflation might allow the Fed to slow the pace of its rate hikes. However, inflation remained stubbornly high, and the Fed raised rates by 75 bps in November, 50 bps in December, and 25 bps in both February and March.
The failure of several banks in March raised concerns over the condition of the U.S. and European banking industries, triggering a sell-off in financial and cyclical stocks and a flight to quality that benefited U.S. Treasuries. Amid the increased volatility, stocks continued to rally, especially in the industrials and consumer discretionary sectors, aided by signs of moderating inflation and resilient economic growth. Stocks in the utilities and materials sectors lagged the market. In May, the Fed raised rates by 25 bps but paused in June. Investors favored more speculative stocks toward period end, along with investments they expected to benefit from advancements in artificial intelligence.
PERFORMANCE DISCUSSION
The Fund’s outperformance relative to its benchmark was driven by strong selection in real estate, energy, and healthcare. Stock selection in financials and industrials dragged on relative returns, as did an overweight allocation to consumer staples.
The top individual contributor to relative performance over the period was Cardinal Health, a healthcare services company that provides pharmaceutical and medical product distribution to healthcare providers. This is a business that has historically delivered stable returns and strong free cash flow. Oil services company ChampionX also contributed, as it continued to execute well despite headwinds for natural gas and oil prices.
Several of our investments also benefited from a revival in housing construction late in the period, as the tight supply of existing homes on the market boosted demand for new construction. This benefited homebuilder Toll Brothers, which reported strong revenue growth and contributed positively to performance.
Financials declined in March after a crisis of confidence led customers to pull their deposits out of several regional banks – among them, Silicon Valley Bank (SVB), one of our holdings. Unlike past bank crises, this run on deposits wasn’t caused by credit concerns on the lending side. Instead, large depositors became concerned about the relative maturities of balance sheet assets and liabilities that appeared worrisome in a rising rate environment. We responded by liquidating our investment in SVB in March; nevertheless, the stock was among the top individual detractors from relative performance for the 12-month period.
The bank crisis also triggered a broad-based – and, in our opinion, mostly indiscriminate – sell-off that impacted
Janus Henderson Small-Mid Cap Value Fund (unaudited)
several other bank holdings, among them, Synovus Financial Corp., a financial services company, and First Interstate BancSystem, a Montana-based regional bank. The latter reported weaker-than-expected first-quarter results and declining deposits. It also faced increased scrutiny over its credit exposure and some unrealized losses in its security portfolio. While we reduced some bank positions where we saw elevated risks, we believe the balance sheet fundamentals and lending practices of the banks we own remain strong. Additionally, we believe these banks have the capacity to manage deposit outflows because of their low loan-to-deposit ratios and diversified deposit bases. We continue to focus on high-quality banks with healthy balance sheets, diversified deposit bases, and disciplined lending practices.
We ended the period overweight in energy, materials, information technology, healthcare, and industrials. We were underweight in communication services, consumer staples, utilities, real estate, consumer discretionary, and financials.
OUTLOOK
We have been pleased and somewhat surprised with the resiliency of the economy and the health of corporate earnings. At the same time, we recognize we have yet to see the full impact of Fed rate hikes, and we believe there is more work for policymakers to do in combating inflation, including on the wage front. We also see potential future headwinds from the tightening of bank lending and credit standards, which could act as a further brake on the economy. There remains a decent risk that further slowing in economic growth and earnings estimates could lead to market volatility. That said, we have positioned the portfolio to benefit from strong markets and provide protection in challenging market environments. We continue to believe small caps look very attractive relative to large caps for the long term. As always, we will look for new opportunities to use market volatility to our advantage as we identify attractive rewards/risks for companies with strong balance sheets, consistent free cash flow, and stable earnings profiles.
Thank you for your continued investment in the Janus Henderson Small-Mid Cap Value Fund.
Basis point (bp) equals 1/100 of a percentage point. 1 bp = 0.01%, 100 bps = 1%
Important Notice – Tailored Shareholder Reports
Effective January 24, 2023, the Securities and Exchange Commission (the “SEC”) adopted rule and form amendments that require mutual funds and exchange-traded funds to provide shareholders with streamlined annual and semi-annual shareholder reports that highlight key information. Other information, including financial statements, that currently appears in shareholder reports will be made available online, delivered free of charge to shareholders upon request, and filed with the SEC. The first tailored shareholder report for the Fund will be for the reporting period ending June 30, 2024. Currently, management is evaluating the impact of the rule and form amendments on the content of the Fund’s current shareholder reports.
Janus Henderson Small-Mid Cap Value Fund (unaudited)
Fund At A Glance
June 30, 2023
| | | | | | | | | | |
| | | | | | | | | |
| | | | | | | | | |
| | | | | | | | | |
| 5 Top Contributors - Holdings | 5 Top Detractors - Holdings |
| | Average
Weight | | Relative
Contribution | | | Average
Weight | | Relative
Contribution |
| Cardinal Health Inc | 2.39% | | 1.45% | | SVB Financial Group | 0.42% | | -1.94% |
| ChampionX Corp | 2.48% | | 1.11% | | First Interstate BancSystem Inc - Class A | 2.49% | | -1.05% |
| Toll Brothers Inc | 1.03% | | 0.91% | | Nomad Foods Ltd | 1.76% | | -0.69% |
| Vontier Corp | 2.13% | | 0.87% | | Synovus Financial Corp | 2.14% | | -0.58% |
| Lincoln Electric Holdings Inc | 1.78% | | 0.85% | | Washington Federal Inc | 0.56% | | -0.45% |
| | | | | | | |
| 5 Top Contributors - Sectors* | | | | | |
| | | Relative | | Fund | Russell 2500 Value Index |
| | | Contribution | | Average Weight | Average Weight |
| Real Estate | | 1.60% | | 8.56% | 11.42% |
| Information Technology | | 1.34% | | 9.86% | 8.52% |
| Energy | | 1.21% | | 6.83% | 4.54% |
| Health Care | | 1.17% | | 11.91% | 8.75% |
| Communication Services | | 0.63% | | 2.05% | 3.13% |
| | | | | | |
| | | | | | |
| 5 Top Detractors - Sectors* | | | | | |
| | | Relative | | Fund | Russell 2500 Value Index |
| | | Contribution | | Average Weight | Average Weight |
| Financials | | -0.64% | | 14.81% | 21.22% |
| Other** | | -0.16% | | 2.53% | 0.00% |
| Consumer Staples | | -0.06% | | 3.93% | 3.04% |
| Industrials | | 0.08% | | 19.49% | 18.01% |
| Utilities | | 0.26% | | 2.38% | 4.13% |
| | | | | | | |
| Relative contribution reflects how the portolio's holdings impacted return relative to the benchmark. Cash and securities not held in the portfolio are not shown. For equity portfolios, relative contribution compares the performance of a security in the portfolio to the benchmark's total return, factoring in the difference in weight of that security in the benchmark. Returns are calculated using daily returns and previous day ending weights rolled up by ticker, excluding fixed income securities, gross of advisory fees, may exclude certain derivatives and will differ from actual performance.
Performance attribution reflects returns gross of advisory fees and may differ from actual returns as they are based on end of day holdings. Attribution is calculated by geometrically linking daily returns for the portfolio and index. |
* | Based on sector classification according to the Global Industry Classification Standard (“GICS”) codes, which are the exclusive property and a service mark of MSCI Inc. and Standard & Poor’s. |
** | Not a GICS classified sector. |
Janus Henderson Small-Mid Cap Value Fund (unaudited)
Fund At A Glance
June 30, 2023
| | |
5 Largest Equity Holdings - (% of Net Assets) |
Hillenbrand Inc | |
Machinery | 3.4% |
Cardinal Health Inc | |
Health Care Providers & Services | 3.1% |
Globus Medical Inc | |
Health Care Equipment & Supplies | 3.0% |
Fortune Brands Home & Security Inc | |
Building Products | 2.9% |
Toll Brothers Inc | |
Household Durables | 2.9% |
| | 15.3% |
| | | | | | |
Asset Allocation - (% of Net Assets) | |
Common Stocks | | 97.0% | |
Repurchase Agreements | | 3.0% | |
Other | | 0.0% |
| | | 100.0% |
| | |
Top Country Allocations - Long Positions - (% of Investment Securities) |
As of June 30, 2023 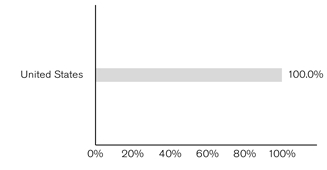
| As of June 30, 2022 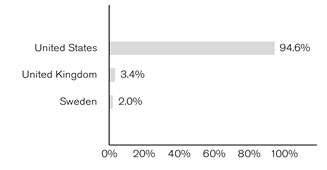
|
Janus Henderson Small-Mid Cap Value Fund (unaudited)
Performance
| |
See important disclosures on the next page. |

| | | | | | | | | | | |
| | | | | | | | | |
| | | | | | | | | |
Average Annual Total Return - for the periods ended June 30, 2023 | | | Prospectus Expense Ratios |
| | One
Year | Five
Year | Ten
Year | Since
Inception* | | | Total Annual Fund
Operating Expenses‡ | Net Annual Fund
Operating Expenses‡ |
Class A Shares at NAV | | 15.09% | 4.77% | 7.42% | 8.61% | | | 1.28% | 1.12% |
Class A Shares at MOP | | 8.43% | 3.54% | 6.78% | 8.05% | | | | |
Class C Shares at NAV | | 14.17% | 3.95% | 6.58% | 7.77% | | | 2.52% | 1.85% |
Class C Shares at CDSC | | 13.17% | 3.95% | 6.58% | 7.77% | | | | |
Class D Shares | | 15.28% | 4.97% | 7.65% | 8.83% | | | 0.95% | 0.88% |
Class I Shares | | 15.40% | 5.01% | 7.71% | 8.91% | | | 0.91% | 0.81% |
Class N Shares | | 15.54% | 5.12% | 7.74% | 8.86% | | | 0.80% | 0.73% |
Class S Shares | | 15.00% | 4.70% | 7.35% | 8.52% | | | 1.56% | 1.23% |
Class T Shares | | 15.18% | 4.86% | 7.55% | 8.73% | | | 1.07% | 0.98% |
Russell 2500 Value Index | | 10.37% | 5.32% | 8.02% | 10.28% | | | | |
Morningstar Quartile - Class I Shares | | 1st | 4th | 4th | 4th | | | | |
Morningstar Ranking - based on total returns for Mid-Cap Blend Funds | | 58/402 | 328/381 | 242/329 | 288/319 | | | | |
Returns quoted are past performance and do not guarantee future results; current performance may be lower or higher. Investment returns and principal value will vary; there may be a gain or loss when shares are sold. For the most recent month-end performance call 800.668.0434 (or 800.525.3713 if you hold shares directly with Janus Henderson) or visit janushenderson.com/performance (or janushenderson.com/allfunds if you hold shares directly with Janus Henderson).
Maximum Offering Price (MOP) returns include the maximum sales charge of 5.75%. Net Asset Value (NAV) returns exclude this charge, which would have reduced returns.
CDSC returns include a 1% contingent deferred sales charge (CDSC) on Shares redeemed within 12 months of purchase. Net Asset Value (NAV) returns exclude this charge, which would have reduced returns.
For certain periods, the Fund’s performance may reflect the effects of expense waivers.
This Fund has a performance-based management fee that may adjust up or down based on the Fund’s performance.
Janus Henderson Small-Mid Cap Value Fund (unaudited)
Performance
Performance may be affected by risks that include those associated with foreign and emerging markets, fixed income securities, high-yield and high-risk securities, undervalued, overlooked and smaller capitalization companies, real estate related securities including Real Estate Investment Trusts (REITs), Environmental, Social and Governance (ESG) factors, non-diversification, portfolio turnover, derivatives, short sales, initial public offerings (IPOs) and potential conflicts of interest. Each product has different risks. Please see the prospectus for more information about risks, holdings and other details.
Returns include reinvestment of all dividends and distributions and do not reflect the deduction of taxes that a shareholder would pay on Fund distributions or redemptions of Fund shares. The returns do not include adjustments in accordance with generally accepted accounting principles required at the period end for financial reporting purposes.
Class N Shares commenced operations on August 4, 2017. Performance shown for periods prior to August 4, 2017 reflects the historical performance of the Fund’s Class I Shares, calculated using the fees and expenses of Class N Shares, without the effect of any fee and expense limitations or waivers.
If Class N Shares of the Fund had been available during periods prior August 4, 2017, the performance shown may have been different. The performance shown for periods following the Fund’s commencement Class N Shares reflects the fees and expenses of Class N Shares, net of any applicable fee and expense limitations or waivers. Please refer to the Fund’s prospectuses for further details concerning historical performance.
Ranking is for the share class shown only; other classes may have different performance characteristics. When an expense waiver is in effect, it may have a material effect on the total return, and therefore the ranking for the period.
© 2023 Morningstar, Inc. All Rights Reserved.
There is no assurance that the investment process will consistently lead to successful investing.
See Notes to Schedule of Investments and Other Information for index definitions.
Index performance does not reflect the expenses of managing a portfolio as an index is unmanaged and not available for direct investment.
See “Useful Information About Your Fund Report.”
*The Fund’s inception date – December 15, 2011
‡ As stated in the prospectus. Net expense ratios reflect the expense waiver, if any, contractually agreed to for at least a one-year period commencing on October 28, 2022. This contractual waiver may be terminated or modified only at the discretion of the Board of Trustees. See Financial Highlights for actual expense ratios during the reporting period.
Janus Henderson Small-Mid Cap Value Fund (unaudited)
Expense Examples
As a shareholder of the Fund, you incur two types of costs: (1) transaction costs, such as sales charges (loads) on purchase payments (applicable to Class A Shares only); and (2) ongoing costs, including management fees; 12b-1 distribution and shareholder servicing fees; transfer agent fees and expenses payable pursuant to the Transfer Agency Agreement; and other Fund expenses. This example is intended to help you understand your ongoing costs (in dollars) of investing in the Fund and to compare these costs with the ongoing costs of investing in other mutual funds. To do so, compare this 5% hypothetical example with the 5% hypothetical examples that appear in the shareholder reports of the other funds. The example is based upon an investment of $1,000 invested at the beginning of the period and held for the six-months indicated, unless noted otherwise in the table and footnotes below.
Actual Expenses
The information in the table under the heading “Actual” provides information about actual account values and actual expenses. You may use the information in these columns, together with the amount you invested, to estimate the expenses that you paid over the period. Simply divide your account value by $1,000 (for example, an $8,600 account value divided by $1,000 = 8.6), then multiply the result by the number in the appropriate column for your share class under the heading entitled “Expenses Paid During Period” to estimate the expenses you paid on your account during the period.
Hypothetical Example for Comparison Purposes
The information in the table under the heading “Hypothetical (5% return before expenses)” provides information about hypothetical account values and hypothetical expenses based upon the Fund’s actual expense ratio and an assumed rate of return of 5% per year before expenses, which is not the Fund’s actual return. The hypothetical account values and expenses may not be used to estimate the actual ending account balance or expenses you paid for the period. You may use this information to compare the ongoing costs of investing in the Fund and other funds. To do so, compare this 5% hypothetical example with the 5% hypothetical examples that appear in the shareholder reports of the other funds. Additionally, for an analysis of the fees associated with an investment in any share class or other similar funds, please visit www.finra.org/fundanalyzer.
Please note that the expenses shown in the table are meant to highlight your ongoing costs only and do not reflect any transaction costs. These fees are fully described in the Fund’s prospectuses. Therefore, the hypothetical examples are useful in comparing ongoing costs only, and will not help you determine the relative total costs of owning different funds. In addition, if these transaction costs were included, your costs would have been higher.
| | | | | | | | | | | |
| | | | | | | | |
| | | Actual | | Hypothetical
(5% return before expenses) | |
| Beginning
Account
Value
(1/1/23) | Ending
Account
Value
(6/30/23) | Expenses
Paid During
Period
(1/1/23 - 6/30/23)† | | Beginning
Account
Value
(1/1/23) | Ending
Account
Value
(6/30/23) | Expenses
Paid During
Period
(1/1/23 - 6/30/23)† | Net Annualized
Expense Ratio
(1/1/23 - 6/30/23) |
Class A Shares | $1,000.00 | $1,063.20 | $5.37 | | $1,000.00 | $1,019.59 | $5.26 | 1.05% |
Class C Shares | $1,000.00 | $1,058.70 | $9.14 | | $1,000.00 | $1,015.92 | $8.95 | 1.79% |
Class D Shares | $1,000.00 | $1,064.50 | $4.10 | | $1,000.00 | $1,020.83 | $4.01 | 0.80% |
Class I Shares | $1,000.00 | $1,064.50 | $3.94 | | $1,000.00 | $1,020.98 | $3.86 | 0.77% |
Class N Shares | $1,000.00 | $1,065.30 | $3.43 | | $1,000.00 | $1,021.47 | $3.36 | 0.67% |
Class S Shares | $1,000.00 | $1,063.80 | $4.96 | | $1,000.00 | $1,019.98 | $4.86 | 0.97% |
Class T Shares | $1,000.00 | $1,063.60 | $4.66 | | $1,000.00 | $1,020.28 | $4.56 | 0.91% |
† | Expenses Paid During Period are equal to the Net Annualized Expense Ratio multiplied by the average account value over the period, multiplied by 181/365 (to reflect the one-half year period). Expenses in the examples include the effect of applicable fee waivers and/or expense reimbursements, if any. Had such waivers and/or reimbursements not been in effect, your expenses would have been higher. Please refer to the Notes to Financial Statements or the Fund’s prospectuses for more information regarding waivers and/or reimbursements. |
Janus Henderson Small-Mid Cap Value Fund
Schedule of Investments
June 30, 2023
| | | | | | | | |
Shares or
Principal Amounts | | | Value | |
Common Stocks– 97.0% | | | |
Aerospace & Defense – 2.1% | | | |
| | BWX Technologies Inc | | 30,966 | | | $2,216,237 | |
Auto Components – 1.2% | | | |
| | Aptiv PLC* | | 11,792 | | | 1,203,845 | |
Banks – 7.0% | | | |
| | Ameris Bancorp | | 47,955 | | | 1,640,541 | |
| | FB Financial Corp | | 62,847 | | | 1,762,858 | |
| | First Interstate BancSystem Inc - Class A | | 66,505 | | | 1,585,479 | |
| | Synovus Financial Corp | | 76,954 | | | 2,327,858 | |
| | | 7,316,736 | |
Building Products – 5.6% | | | |
| | Carlisle Cos Inc | | 10,660 | | | 2,734,610 | |
| | Fortune Brands Home & Security Inc | | 42,054 | | | 3,025,785 | |
| | | 5,760,395 | |
Capital Markets – 2.5% | | | |
| | Jefferies Financial Group Inc | | 79,573 | | | 2,639,436 | |
Chemicals – 3.0% | | | |
| | FMC Corp | | 14,654 | | | 1,528,998 | |
| | Innospec Inc | | 15,553 | | | 1,562,143 | |
| | | 3,091,141 | |
Containers & Packaging – 1.8% | | | |
| | Graphic Packaging Holding Co | | 77,927 | | | 1,872,586 | |
Electrical Equipment – 1.8% | | | |
| | Encore Wire Corp | | 10,238 | | | 1,903,551 | |
Electronic Equipment, Instruments & Components – 6.2% | | | |
| | Insight Enterprises Inc* | | 12,160 | | | 1,779,494 | |
| | Vontier Corp | | 74,189 | | | 2,389,628 | |
| | Zebra Technologies Corp* | | 7,511 | | | 2,221,979 | |
| | | 6,391,101 | |
Energy Equipment & Services – 2.4% | | | |
| | ChampionX Corp | | 80,778 | | | 2,507,349 | |
Food & Staples Retailing – 2.1% | | | |
| | Casey's General Stores Inc | | 9,069 | | | 2,211,748 | |
Health Care Equipment & Supplies – 6.2% | | | |
| | Embecta Corp | | 66,435 | | | 1,434,996 | |
| | Envista Holdings Corp* | | 55,863 | | | 1,890,404 | |
| | Globus Medical Inc* | | 51,572 | | | 3,070,597 | |
| | | 6,395,997 | |
Health Care Providers & Services – 5.1% | | | |
| | Amedisys Inc* | | 22,366 | | | 2,045,147 | |
| | Cardinal Health Inc | | 34,400 | | | 3,253,208 | |
| | | 5,298,355 | |
Hotels, Restaurants & Leisure – 1.7% | | | |
| | Portillo's Inc - Class A* | | 77,992 | | | 1,757,160 | |
Household Durables – 2.9% | | | |
| | Toll Brothers Inc | | 38,211 | | | 3,021,344 | |
Industrial Real Estate Investment Trusts (REITs) – 2.4% | | | |
| | STAG Industrial Inc | | 67,987 | | | 2,439,374 | |
Insurance – 4.7% | | | |
| | Axis Capital Holdings Ltd | | 36,561 | | | 1,968,079 | |
| | Hartford Financial Services Group Inc | | 40,791 | | | 2,937,768 | |
| | | 4,905,847 | |
Life Sciences Tools & Services – 1.4% | | | |
| | Charles River Laboratories International Inc* | | 6,891 | | | 1,448,833 | |
Machinery – 5.7% | | | |
| | Hillenbrand Inc | | 68,751 | | | 3,525,551 | |
| | Lincoln Electric Holdings Inc | | 12,247 | | | 2,432,622 | |
| | | 5,958,173 | |
| | |
See Notes to Schedule of Investments and Other Information and Notes to Financial Statements. |
| |
8 | JUNE 30, 2023 |
Janus Henderson Small-Mid Cap Value Fund
Schedule of Investments
June 30, 2023
| | | | | | | | |
Shares or
Principal Amounts | | | Value | |
Common Stocks– (continued) | | | |
Marine – 2.3% | | | |
| | Kirby Corp* | | 31,081 | | | $2,391,683 | |
Metals & Mining – 2.2% | | | |
| | Commercial Metals Co | | 42,895 | | | 2,258,851 | |
Multi-Utilities – 2.5% | | | |
| | Black Hills Corp | | 43,135 | | | 2,599,315 | |
Oil, Gas & Consumable Fuels – 4.1% | | | |
| | Gulfport Energy Corp* | | 17,917 | | | 1,882,539 | |
| | Magnolia Oil & Gas Corp | | 111,560 | | | 2,331,604 | |
| | | 4,214,143 | |
Residential Real Estate Investment Trusts (REITs) – 2.0% | | | |
| | Equity LifeStyle Properties Inc | | 30,884 | | | 2,065,831 | |
Semiconductor & Semiconductor Equipment – 3.0% | | | |
| | Microchip Technology Inc | | 16,528 | | | 1,480,744 | |
| | Ultra Clean Holdings Inc* | | 41,707 | | | 1,604,051 | |
| | | 3,084,795 | |
Software – 1.9% | | | |
| | Black Knight Inc* | | 32,387 | | | 1,934,476 | |
Specialized Real Estate Investment Trusts (REITs) – 4.1% | | | |
| | Lamar Advertising Co | | 28,493 | | | 2,827,930 | |
| | PotlatchDeltic Corp | | 26,691 | | | 1,410,619 | |
| | | 4,238,549 | |
Specialty Retail – 3.3% | | | |
| | Bath & Body Works Inc | | 61,125 | | | 2,292,187 | |
| | Burlington Stores Inc* | | 7,479 | | | 1,177,120 | |
| | | 3,469,307 | |
Textiles, Apparel & Luxury Goods – 2.1% | | | |
| | Steven Madden Ltd | | 67,538 | | | 2,207,817 | |
Trading Companies & Distributors – 3.7% | | | |
| | H&E Equipment Services Inc | | 32,134 | | | 1,470,131 | |
| | MSC Industrial Direct Co Inc | | 25,073 | | | 2,388,955 | |
| | | 3,859,086 | |
Total Common Stocks (cost $88,071,235) | | 100,663,061 | |
Repurchase Agreements– 3.0% | | | |
| | ING Financial Markets LLC, Joint repurchase agreement, 5.0500%, dated 6/30/23, maturing 7/3/23 to be repurchased at $3,101,305 collateralized by $3,426,309 in U.S. Treasuries 0% - 4.6250%, 4/18/24 - 11/15/52 with a value of $3,163,331((cost $3,100,000) | | $3,100,000 | | | 3,100,000 | |
Total Investments (total cost $91,171,235) – 100.0% | | 103,763,061 | |
Cash, Receivables and Other Assets, net of Liabilities – 0% | | 32,572 | |
Net Assets – 100% | | $103,795,633 | |
| | |
See Notes to Schedule of Investments and Other Information and Notes to Financial Statements. |
| |
Janus Investment Fund | 9 |
Janus Henderson Small-Mid Cap Value Fund
Schedule of Investments
June 30, 2023
| | | | | | | | | | |
Offsetting of Financial Assets and Derivative Assets |
| |
| | | Gross Amounts | | | | | | |
| | | of Recognized | | Offsetting Asset | | Collateral | | |
Counterparty | | Assets | | or Liability(a) | | Pledged(b) | | Net Amount |
| | | | | | | | | |
ING Financial Markets LLC | $ | 3,100,000 | $ | — | $ | (3,100,000) | $ | — |
| | | | | | | | | |
(a) | Represents the amount of assets or liabilities that could be offset with the same counterparty under master netting or similar agreements that management elects not to offset on the Statement of Assets and Liabilities. |
(b) | Collateral pledged is limited to the net outstanding amount due to/from an individual counterparty. The actual collateral amounts pledged may exceed these amounts and may fluctuate in value. |
| | |
See Notes to Schedule of Investments and Other Information and Notes to Financial Statements. |
| |
10 | JUNE 30, 2023 |
Janus Henderson Small-Mid Cap Value Fund
Notes to Schedule of Investments and Other Information
| | |
Russell 2500TM Value Index | Russell 2500TM Value Index reflects the performance of U.S. small to mid-cap equities with lower price-to-book ratios and lower forecasted growth values. |
| | |
LLC | Limited Liability Company |
PLC | Public Limited Company |
| | |
* | Non-income producing security. |
| | | | | | | | | | | | | |
The following is a summary of the inputs that were used to value the Fund’s investments in securities and other financial instruments as of June 30, 2023. See Notes to Financial Statements for more information. |
| |
Valuation Inputs Summary |
| | | | | | | |
| | | | | Level 2 - | | Level 3 - |
| | | Level 1 - | | Other Significant | | Significant |
| | | Quoted Prices | | Observable Inputs | | Unobservable Inputs |
| | | | | | | |
Assets | | | | | | |
Investments In Securities: | | | | | | |
Common Stocks | $ | 100,663,061 | $ | - | $ | - |
Repurchase Agreements | | - | | 3,100,000 | | - |
Total Assets | $ | 100,663,061 | $ | 3,100,000 | $ | - |
| | | | | | | |
Janus Henderson Small-Mid Cap Value Fund
Statement of Assets and Liabilities
June 30, 2023
| |
See footnotes at the end of the Statement. |
| | | | | | | |
| | | | | | |
Assets: | | | | |
| Investments, at value (cost $88,071,235) | | $ | 100,663,061 | |
| Repurchase agreements, at value (cost $3,100,000) | | | 3,100,000 | |
| Cash | | | 17,554 | |
| Trustees' deferred compensation | | | 2,638 | |
| Receivables: | | | | |
| | Dividends | | | 140,222 | |
| | Investments sold | | | 83,623 | |
| | Fund shares sold | | | 55,256 | |
| | Interest | | | 1,305 | |
| Other assets | | | 337 | |
Total Assets | | | 104,063,996 | |
Liabilities: | | | | |
| Payables: | | | — | |
| | Fund shares repurchased | | | 124,382 | |
| | Professional fees | | | 54,130 | |
| | Advisory fees | | | 38,758 | |
| | Transfer agent fees and expenses | | | 8,743 | |
| | Trustees' deferred compensation fees | | | 2,638 | |
| | 12b-1 Distribution and shareholder servicing fees | | | 870 | |
| | Trustees' fees and expenses | | | 713 | |
| | Custodian fees | | | 684 | |
| | Affiliated fund administration fees payable | | | 222 | |
| | Accrued expenses and other payables | | | 37,223 | |
Total Liabilities | | | 268,363 | |
Net Assets | | $ | 103,795,633 | |
| | |
See Notes to Financial Statements. |
| |
12 | JUNE 30, 2023 |
Janus Henderson Small-Mid Cap Value Fund
Statement of Assets and Liabilities
June 30, 2023
| | | | | | | |
| | | | | | |
| | | | | | | |
Net Assets Consist of: | | | | |
| Capital (par value and paid-in surplus) | | $ | 97,675,741 | |
| Total distributable earnings (loss) | | | 6,119,892 | |
Total Net Assets | | $ | 103,795,633 | |
Net Assets - Class A Shares | | $ | 2,424,378 | |
| Shares Outstanding, $0.01 Par Value (unlimited shares authorized) | | | 180,277 | |
Net Asset Value Per Share(1) | | $ | 13.45 | |
Maximum Offering Price Per Share(2) | | $ | 14.27 | |
Net Assets - Class C Shares | | $ | 353,850 | |
| Shares Outstanding, $0.01 Par Value (unlimited shares authorized) | | | 27,617 | |
Net Asset Value Per Share(1) | | $ | 12.81 | |
Net Assets - Class D Shares | | $ | 40,870,854 | |
| Shares Outstanding, $0.01 Par Value (unlimited shares authorized) | | | 3,017,607 | |
Net Asset Value Per Share | | $ | 13.54 | |
Net Assets - Class I Shares | | $ | 7,074,434 | |
| Shares Outstanding, $0.01 Par Value (unlimited shares authorized) | | | 516,786 | |
Net Asset Value Per Share | | $ | 13.69 | |
Net Assets - Class N Shares | | $ | 46,653,472 | |
| Shares Outstanding, $0.01 Par Value (unlimited shares authorized) | | | 3,442,442 | |
Net Asset Value Per Share | | $ | 13.55 | |
Net Assets - Class S Shares | | $ | 228,940 | |
| Shares Outstanding, $0.01 Par Value (unlimited shares authorized) | | | 17,168 | |
Net Asset Value Per Share | | $ | 13.34 | |
Net Assets - Class T Shares | | $ | 6,189,705 | |
| Shares Outstanding, $0.01 Par Value (unlimited shares authorized) | | | 456,794 | |
Net Asset Value Per Share | | $ | 13.55 | |
| |
(1) Redemption price per share may be reduced for any applicable contingent deferred sales charge. (2) Maximum offering price is computed at 100/94.25 of net asset value. |
| | |
See Notes to Financial Statements. |
| |
Janus Investment Fund | 13 |
Janus Henderson Small-Mid Cap Value Fund
Statement of Operations
For the year ended June 30, 2023
| | | | | | |
| | | | | |
Investment Income: | | | |
| Dividends | $ | 1,831,084 | |
| Interest | | 101,816 | |
| Other income | | 51 | |
Total Investment Income | | 1,932,951 | |
Expenses: | | | |
| Advisory fees | | 644,774 | |
| 12b-1 Distribution and shareholder servicing fees: | | | |
| | Class A Shares | | 5,764 | |
| | Class C Shares | | 3,823 | |
| | Class S Shares | | 1,013 | |
| Transfer agent administrative fees and expenses: | | | |
| | Class D Shares | | 50,436 | |
| | Class S Shares | | 1,236 | |
| | Class T Shares | | 16,778 | |
| Transfer agent networking and omnibus fees: | | | |
| | Class A Shares | | 2,949 | |
| | Class C Shares | | 453 | |
| | Class I Shares | | 6,513 | |
| Other transfer agent fees and expenses: | | | |
| | Class A Shares | | 183 | |
| | Class C Shares | | 33 | |
| | Class D Shares | | 11,033 | |
| | Class I Shares | | 457 | |
| | Class N Shares | | 2,628 | |
| | Class S Shares | | 19 | |
| | Class T Shares | | 156 | |
| Registration fees | | 96,621 | |
| Non-affiliated fund administration fees | | 66,167 | |
| Professional fees | | 50,631 | |
| Shareholder reports expense | | 19,251 | |
| Custodian fees | | 3,613 | |
| Affiliated fund administration fees | | 3,607 | |
| Trustees’ fees and expenses | | 3,204 | |
| Other expenses | | 10,375 | |
Total Expenses | | 1,001,717 | |
Less: Excess Expense Reimbursement and Waivers | | (116,692) | |
Net Expenses | | 885,025 | |
Net Investment Income/(Loss) | | 1,047,926 | |
Net Realized Gain/(Loss) on Investments: | | | |
| Investments | | (4,410,567) | |
Total Net Realized Gain/(Loss) on Investments | | (4,410,567) | |
Change in Unrealized Net Appreciation/Depreciation: | | | |
| Investments and Trustees’ deferred compensation | | 19,496,522 | |
Total Change in Unrealized Net Appreciation/Depreciation | | 19,496,522 | |
Net Increase/(Decrease) in Net Assets Resulting from Operations | $ | 16,133,881 | |
| | | | | |
| | |
See Notes to Financial Statements. |
| |
14 | JUNE 30, 2023 |
Janus Henderson Small-Mid Cap Value Fund
Statements of Changes in Net Assets
| | | | | | | | | |
| | | | | | | | |
| | | Year ended
June 30, 2023 | | Year ended
June 30, 2022 | |
| | | | | | | | | |
Operations: | | | | | | |
| Net investment income/(loss) | $ | 1,047,926 | | $ | 950,847 | |
| Net realized gain/(loss) on investments | | (4,410,567) | | | 1,636,295 | |
| Change in unrealized net appreciation/depreciation | | 19,496,522 | | | (21,819,692) | |
Net Increase/(Decrease) in Net Assets Resulting from Operations | | 16,133,881 | | | (19,232,550) | |
Dividends and Distributions to Shareholders: | | | | | | |
| | Class A Shares | | (6,350) | | | (79,135) | |
| | Class C Shares | | — | | | (12,497) | |
| | Class D Shares | | (231,444) | | | (1,467,870) | |
| | Class I Shares | | (37,979) | | | (310,688) | |
| | Class N Shares | | (420,035) | | | (2,081,053) | |
| | Class S Shares | | — | | | (30,861) | |
| | Class T Shares | | (24,323) | | | (239,738) | |
Net Decrease from Dividends and Distributions to Shareholders | | (720,131) | | | (4,221,842) | |
Capital Share Transactions: | | | | | | |
| | Class A Shares | | (266,933) | | | (428,805) | |
| | Class C Shares | | (144,748) | | | 22,667 | |
| | Class D Shares | | (5,423,913) | | | (17,630,182) | |
| | Class I Shares | | (2,305,216) | | | (4,610,382) | |
| | Class N Shares | | (17,553,577) | | | (2,767,610) | |
| | Class S Shares | | (809,610) | | | (5,229) | |
| | Class T Shares | | (2,245,624) | | | (9,681,030) | |
Net Increase/(Decrease) from Capital Share Transactions | | (28,749,621) | | | (35,100,571) | |
Net Increase/(Decrease) in Net Assets | | (13,335,871) | | | (58,554,963) | |
Net Assets: | | | | | | |
| Beginning of period | | 117,131,504 | | | 175,686,467 | |
| End of period | $ | 103,795,633 | | $ | 117,131,504 | |
| | | | | | | | |
| | |
See Notes to Financial Statements. |
| |
Janus Investment Fund | 15 |
Janus Henderson Small-Mid Cap Value Fund
Financial Highlights
| | | | | | | | | | | | | | | | | | | |
Class A Shares | | | | | | | | | | | | | | | |
For a share outstanding during the year ended June 30 | | 2023 | | | 2022 | | | 2021 | | | 2020 | | | 2019 | |
| Net Asset Value, Beginning of Period | | $11.72 | | | $13.98 | | | $10.17 | | | $13.17 | | | $14.13 | |
| Income/(Loss) from Investment Operations: | | | | | | | | | | | | | | | |
| | Net investment income/(loss)(1) | | 0.08 | | | 0.06 | | | 0.10 | | | 0.10 | | | 0.10 | |
| | Net realized and unrealized gain/(loss) | | 1.69 | | | (1.93) | | | 3.78 | | | (1.71) | | | 0.65 | |
| Total from Investment Operations | | 1.77 | | | (1.87) | | | 3.88 | | | (1.61) | | | 0.75 | |
| Less Dividends and Distributions: | | | | | | | | | | | | | | | |
| | Dividends (from net investment income) | | (0.04) | | | (0.05) | | | (0.07) | | | (0.11) | | | (0.18) | |
| | Distributions (from capital gains) | | — | | | (0.34) | | | — | | | (1.28) | | | (1.53) | |
| Total Dividends and Distributions | | (0.04) | | | (0.39) | | | (0.07) | | | (1.39) | | | (1.71) | |
| Net Asset Value, End of Period | | $13.45 | | | $11.72 | | | $13.98 | | | $10.17 | | | $13.17 | |
| Total Return* | | 15.09% | | | (13.78)% | | | 38.27% | | | (14.37)% | | | 7.46% | |
| Net Assets, End of Period (in thousands) | | $2,424 | | | $2,387 | | | $3,279 | | | $3,039 | | | $2,055 | |
| Average Net Assets for the Period (in thousands) | | $2,292 | | | $2,920 | | | $3,034 | | | $2,169 | | | $852 | |
| Ratios to Average Net Assets**: | | | | | | | | | | | | | | | |
| | Ratio of Gross Expenses | | 1.28% | | | 1.28% | | | 1.35% | | | 1.78% | | | 1.91% | |
| | Ratio of Net Expenses (After Waivers and Expense Offsets) | | 1.07% | | | 1.12% | | | 1.07% | | | 1.34% | | | 1.31% | |
| | Ratio of Net Investment Income/(Loss) | | 0.62% | | | 0.42% | | | 0.81% | | | 0.88% | | | 0.79% | |
| Portfolio Turnover Rate | | 62% | | | 80% | | | 99% | | | 152% | | | 40% | |
| | | | | | | | | | | | | | | | | | | |
| |
* Total return includes adjustments in accordance with generally accepted accounting principles required at the year or period end and are not annualized for periods of less than one full year. ** Annualized for periods of less than one full year. (1) Per share amounts are calculated based on average shares outstanding during the year or period. |
| | |
See Notes to Financial Statements. |
| |
16 | JUNE 30, 2023 |
Janus Henderson Small-Mid Cap Value Fund
Financial Highlights
| | | | | | | | | | | | | | | | | | | |
Class C Shares | | | | | | | | | | | | | | | |
For a share outstanding during the year ended June 30 | | 2023 | | | 2022 | | | 2021 | | | 2020 | | | 2019 | |
| Net Asset Value, Beginning of Period | | $11.22 | | | $13.45 | | | $9.80 | | | $12.74 | | | $13.73 | |
| Income/(Loss) from Investment Operations: | | | | | | | | | | | | | | | |
| | Net investment income/(loss)(1) | | (0.02) | | | (0.04) | | | 0.02 | | | 0.01 | | | 0.02 | |
| | Net realized and unrealized gain/(loss) | | 1.61 | | | (1.85) | | | 3.63 | | | (1.66) | | | 0.60 | |
| Total from Investment Operations | | 1.59 | | | (1.89) | | | 3.65 | | | (1.65) | | | 0.62 | |
| Less Dividends and Distributions: | | | | | | | | | | | | | | | |
| | Dividends (from net investment income) | | — | | | — | | | — | | | (0.01) | | | (0.08) | |
| | Distributions (from capital gains) | | — | | | (0.34) | | | — | | | (1.28) | | | (1.53) | |
| Total Dividends and Distributions | | — | | | (0.34) | | | — | | | (1.29) | | | (1.61) | |
| Net Asset Value, End of Period | | $12.81 | | | $11.22 | | | $13.45 | | | $9.80 | | | $12.74 | |
| Total Return* | | 14.17% | | | (14.41)% | | | 37.24% | | | (15.04)% | | | 6.52% | |
| Net Assets, End of Period (in thousands) | | $354 | | | $450 | | | $515 | | | $353 | | | $398 | |
| Average Net Assets for the Period (in thousands) | | $374 | | | $493 | | | $427 | | | $380 | | | $318 | |
| Ratios to Average Net Assets**: | | | | | | | | | | | | | | | |
| | Ratio of Gross Expenses | | 2.72% | | | 2.51% | | | 2.70% | | | 3.23% | | | 3.30% | |
| | Ratio of Net Expenses (After Waivers and Expense Offsets) | | 1.84% | | | 1.84% | | | 1.81% | | | 2.14% | | | 2.09% | |
| | Ratio of Net Investment Income/(Loss) | | (0.15)% | | | (0.33)% | | | 0.14% | | | 0.12% | | | 0.16% | |
| Portfolio Turnover Rate | | 62% | | | 80% | | | 99% | | | 152% | | | 40% | |
| | | | | | | | | | | | | | | | | | | |
| |
* Total return includes adjustments in accordance with generally accepted accounting principles required at the year or period end and are not annualized for periods of less than one full year. ** Annualized for periods of less than one full year. (1) Per share amounts are calculated based on average shares outstanding during the year or period. |
| | |
See Notes to Financial Statements. |
| |
Janus Investment Fund | 17 |
Janus Henderson Small-Mid Cap Value Fund
Financial Highlights
| | | | | | | | | | | | | | | | | | | |
Class D Shares | | | | | | | | | | | | | | | |
For a share outstanding during the year ended June 30 | | 2023 | | | 2022 | | | 2021 | | | 2020 | | | 2019 | |
| Net Asset Value, Beginning of Period | | $11.81 | | | $14.08 | | | $10.24 | | | $13.24 | | | $14.19 | |
| Income/(Loss) from Investment Operations: | | | | | | | | | | | | | | | |
| | Net investment income/(loss)(1) | | 0.11 | | | 0.08 | | | 0.10 | | | 0.13 | | | 0.16 | |
| | Net realized and unrealized gain/(loss) | | 1.69 | | | (1.93) | | | 3.83 | | | (1.72) | | | 0.61 | |
| Total from Investment Operations | | 1.80 | | | (1.85) | | | 3.93 | | | (1.59) | | | 0.77 | |
| Less Dividends and Distributions: | | | | | | | | | | | | | | | |
| | Dividends (from net investment income) | | (0.07) | | | (0.08) | | | (0.09) | | | (0.13) | | | (0.19) | |
| | Distributions (from capital gains) | | — | | | (0.34) | | | — | | | (1.28) | | | (1.53) | |
| Total Dividends and Distributions | | (0.07) | | | (0.42) | | | (0.09) | | | (1.41) | | | (1.72) | |
| Net Asset Value, End of Period | | $13.54 | | | $11.81 | | | $14.08 | | | $10.24 | | | $13.24 | |
| Total Return* | | 15.28% | | | (13.54)% | | | 38.52% | | | (14.20)% | | | 7.57% | |
| Net Assets, End of Period (in thousands) | | $40,871 | | | $40,878 | | | $66,854 | | | $21,708 | | | $23,948 | |
| Average Net Assets for the Period (in thousands) | | $42,663 | | | $49,604 | | | $34,811 | | | $22,879 | | | $22,739 | |
| Ratios to Average Net Assets**: | | | | | | | | | | | | | | | |
| | Ratio of Gross Expenses | | 0.94% | | | 0.95% | | | 1.06% | | | 1.51% | | | 1.45% | |
| | Ratio of Net Expenses (After Waivers and Expense Offsets) | | 0.83% | | | 0.87% | | | 0.89% | | | 1.17% | | | 1.10% | |
| | Ratio of Net Investment Income/(Loss) | | 0.86% | | | 0.62% | | | 0.78% | | | 1.06% | | | 1.22% | |
| Portfolio Turnover Rate | | 62% | | | 80% | | | 99% | | | 152% | | | 40% | |
| | | | | | | | | | | | | | | | | | | |
| |
* Total return includes adjustments in accordance with generally accepted accounting principles required at the year or period end and are not annualized for periods of less than one full year. ** Annualized for periods of less than one full year. (1) Per share amounts are calculated based on average shares outstanding during the year or period. |
| | |
See Notes to Financial Statements. |
| |
18 | JUNE 30, 2023 |
Janus Henderson Small-Mid Cap Value Fund
Financial Highlights
| | | | | | | | | | | | | | | | | | | |
Class I Shares | | | | | | | | | | | | | | | |
For a share outstanding during the year ended June 30 | | 2023 | | | 2022 | | | 2021 | | | 2020 | | | 2019 | |
| Net Asset Value, Beginning of Period | | $11.93 | | | $14.22 | | | $10.34 | | | $13.36 | | | $14.21 | |
| Income/(Loss) from Investment Operations: | | | | | | | | | | | | | | | |
| | Net investment income/(loss)(1) | | 0.11 | | | 0.09 | | | 0.13 | | | 0.11 | | | 0.16 | |
| | Net realized and unrealized gain/(loss) | | 1.72 | | | (1.96) | | | 3.84 | | | (1.72) | | | 0.63 | |
| Total from Investment Operations | | 1.83 | | | (1.87) | | | 3.97 | | | (1.61) | | | 0.79 | |
| Less Dividends and Distributions: | | | | | | | | | | | | | | | |
| | Dividends (from net investment income) | | (0.07) | | | (0.08) | | | (0.09) | | | (0.13) | | | (0.11) | |
| | Distributions (from capital gains) | | — | | | (0.34) | | | — | | | (1.28) | | | (1.53) | |
| Total Dividends and Distributions | | (0.07) | | | (0.42) | | | (0.09) | | | (1.41) | | | (1.64) | |
| Net Asset Value, End of Period | | $13.69 | | | $11.93 | | | $14.22 | | | $10.34 | | | $13.36 | |
| Total Return* | | 15.40% | | | (13.56)% | | | 38.58% | | | (14.19)% | | | 7.66% | |
| Net Assets, End of Period (in thousands) | | $7,074 | | | $8,309 | | | $14,659 | | | $9,848 | | | $7,535 | |
| Average Net Assets for the Period (in thousands) | | $7,072 | | | $10,673 | | | $13,258 | | | $6,734 | | | $6,250 | |
| Ratios to Average Net Assets**: | | | | | | | | | | | | | | | |
| | Ratio of Gross Expenses | | 0.90% | | | 0.91% | | | 1.10% | | | 1.47% | | | 1.39% | |
| | Ratio of Net Expenses (After Waivers and Expense Offsets) | | 0.79% | | | 0.82% | | | 0.89% | | | 1.13% | | | 1.06% | |
| | Ratio of Net Investment Income/(Loss) | | 0.88% | | | 0.67% | | | 1.02% | | | 0.93% | | | 1.20% | |
| Portfolio Turnover Rate | | 62% | | | 80% | | | 99% | | | 152% | | | 40% | |
| | | | | | | | | | | | | | | | | | | |
| |
* Total return includes adjustments in accordance with generally accepted accounting principles required at the year or period end and are not annualized for periods of less than one full year. ** Annualized for periods of less than one full year. (1) Per share amounts are calculated based on average shares outstanding during the year or period. |
| | |
See Notes to Financial Statements. |
| |
Janus Investment Fund | 19 |
Janus Henderson Small-Mid Cap Value Fund
Financial Highlights
| | | | | | | | | | | | | | | | | | | |
Class N Shares | | | | | | | | | | | | | | | |
For a share outstanding during the year ended June 30 | | 2023 | | | 2022 | | | 2021 | | | 2020 | | | 2019 | |
| Net Asset Value, Beginning of Period | | $11.81 | | | $14.09 | | | $10.24 | | | $13.24 | | | $14.20 | |
| Income/(Loss) from Investment Operations: | | | | | | | | | | | | | | | |
| | Net investment income/(loss)(1) | | 0.13 | | | 0.11 | | | 0.11 | | | 0.15 | | | 0.19 | |
| | Net realized and unrealized gain/(loss) | | 1.70 | | | (1.95) | | | 3.84 | | | (1.72) | | | 0.59 | |
| Total from Investment Operations | | 1.83 | | | (1.84) | | | 3.95 | | | (1.57) | | | 0.78 | |
| Less Dividends and Distributions: | | | | | | | | | | | | | | | |
| | Dividends (from net investment income) | | (0.09) | | | (0.10) | | | (0.10) | | | (0.15) | | | (0.21) | |
| | Distributions (from capital gains) | | — | | | (0.34) | | | — | | | (1.28) | | | (1.53) | |
| Total Dividends and Distributions | | (0.09) | | | (0.44) | | | (0.10) | | | (1.43) | | | (1.74) | |
| Net Asset Value, End of Period | | $13.55 | | | $11.81 | | | $14.09 | | | $10.24 | | | $13.24 | |
| Total Return* | | 15.54% | | | (13.48)% | | | 38.72% | | | (14.09)% | | | 7.73% | |
| Net Assets, End of Period (in thousands) | | $46,653 | | | $56,752 | | | $70,581 | | | $1,806 | | | $1,852 | |
| Average Net Assets for the Period (in thousands) | | $54,098 | | | $65,311 | | | $28,417 | | | $2,112 | | | $1,782 | |
| Ratios to Average Net Assets**: | | | | | | | | | | | | | | | |
| | Ratio of Gross Expenses | | 0.77% | | | 0.80% | | | 0.88% | | | 1.48% | | | 1.41% | |
| | Ratio of Net Expenses (After Waivers and Expense Offsets) | | 0.69% | | | 0.74% | | | 0.76% | | | 1.03% | | | 0.96% | |
| | Ratio of Net Investment Income/(Loss) | | 1.02% | | | 0.79% | | | 0.83% | | | 1.24% | | | 1.40% | |
| Portfolio Turnover Rate | | 62% | | | 80% | | | 99% | | | 152% | | | 40% | |
| | | | | | | | | | | | | | | | | | | |
| |
* Total return includes adjustments in accordance with generally accepted accounting principles required at the year or period end and are not annualized for periods of less than one full year. ** Annualized for periods of less than one full year. (1) Per share amounts are calculated based on average shares outstanding during the year or period. |
| | |
See Notes to Financial Statements. |
| |
20 | JUNE 30, 2023 |
Janus Henderson Small-Mid Cap Value Fund
Financial Highlights
| | | | | | | | | | | | | | | | | | | |
Class S Shares | | | | | | | | | | | | | | | |
For a share outstanding during the year ended June 30 | | 2023 | | | 2022 | | | 2021 | | | 2020 | | | 2019 | |
| Net Asset Value, Beginning of Period | | $11.60 | | | $13.84 | | | $10.06 | | | $13.07 | | | $14.12 | |
| Income/(Loss) from Investment Operations: | | | | | | | | | | | | | | | |
| | Net investment income/(loss)(1) | | 0.07 | | | 0.04 | | | 0.08 | | | 0.08 | | | 0.09 | |
| | Net realized and unrealized gain/(loss) | | 1.67 | | | (1.91) | | | 3.75 | | | (1.69) | | | 0.65 | |
| Total from Investment Operations | | 1.74 | | | (1.87) | | | 3.83 | | | (1.61) | | | 0.74 | |
| Less Dividends and Distributions: | | | | | | | | | | | | | | | |
| | Dividends (from net investment income) | | — | | | (0.03) | | | (0.05) | | | (0.12) | | | (0.26) | |
| | Distributions (from capital gains) | | — | | | (0.34) | | | — | | | (1.28) | | | (1.53) | |
| Total Dividends and Distributions | | — | | | (0.37) | | | (0.05) | | | (1.40) | | | (1.79) | |
| Net Asset Value, End of Period | | $13.34 | | | $11.60 | | | $13.84 | | | $10.06 | | | $13.07 | |
| Total Return* | | 15.00% | | | (13.85)% | | | 38.16% | | | (14.51)% | | | 7.51% | |
| Net Assets, End of Period (in thousands) | | $229 | | | $939 | | | $1,136 | | | $1,004 | | | $390 | |
| Average Net Assets for the Period (in thousands) | | $493 | | | $1,110 | | | $1,084 | | | $890 | | | $115 | |
| Ratios to Average Net Assets**: | | | | | | | | | | | | | | | |
| | Ratio of Gross Expenses | | 1.84% | | | 1.54% | | | 1.71% | | | 2.16% | | | 4.23% | |
| | Ratio of Net Expenses (After Waivers and Expense Offsets) | | 1.13% | | | 1.20% | | | 1.23% | | | 1.51% | | | 1.29% | |
| | Ratio of Net Investment Income/(Loss) | | 0.51% | | | 0.31% | | | 0.68% | | | 0.71% | | | 0.70% | |
| Portfolio Turnover Rate | | 62% | | | 80% | | | 99% | | | 152% | | | 40% | |
| | | | | | | | | | | | | | | | | | | |
| |
* Total return includes adjustments in accordance with generally accepted accounting principles required at the year or period end and are not annualized for periods of less than one full year. ** Annualized for periods of less than one full year. (1) Per share amounts are calculated based on average shares outstanding during the year or period. |
| | |
See Notes to Financial Statements. |
| |
Janus Investment Fund | 21 |
Janus Henderson Small-Mid Cap Value Fund
Financial Highlights
| | | | | | | | | | | | | | | | | | | |
Class T Shares | | | | | | | | | | | | | | | |
For a share outstanding during the year ended June 30 | | 2023 | | | 2022 | | | 2021 | | | 2020 | | | 2019 | |
| Net Asset Value, Beginning of Period | | $11.81 | | | $14.07 | | | $10.21 | | | $13.22 | | | $14.16 | |
| Income/(Loss) from Investment Operations: | | | | | | | | | | | | | | | |
| | Net investment income/(loss)(1) | | 0.10 | | | 0.06 | | | 0.06 | | | 0.14 | | | 0.15 | |
| | Net realized and unrealized gain/(loss) | | 1.69 | | | (1.93) | | | 3.86 | | | (1.76) | | | 0.61 | |
| Total from Investment Operations | | 1.79 | | | (1.87) | | | 3.92 | | | (1.62) | | | 0.76 | |
| Less Dividends and Distributions: | | | | | | | | | | | | | | | |
| | Dividends (from net investment income) | | (0.05) | | | (0.05) | | | (0.06) | | | (0.11) | | | (0.17) | |
| | Distributions (from capital gains) | | — | | | (0.34) | | | — | | | (1.28) | | | (1.53) | |
| Total Dividends and Distributions | | (0.05) | | | (0.39) | | | (0.06) | | | (1.39) | | | (1.70) | |
| Net Asset Value, End of Period | | $13.55 | | | $11.81 | | | $14.07 | | | $10.21 | | | $13.22 | |
| Total Return* | | 15.18% | | | (13.67)% | | | 38.50% | | | (14.40)% | | | 7.51% | |
| Net Assets, End of Period (in thousands) | | $6,190 | | | $7,416 | | | $18,663 | | | $38,649 | | | $23,144 | |
| Average Net Assets for the Period (in thousands) | | $6,677 | | | $8,946 | | | $11,012 | | | $17,402 | | | $27,284 | |
| Ratios to Average Net Assets**: | | | | | | | | | | | | | | | |
| | Ratio of Gross Expenses | | 1.06% | | | 1.07% | | | 1.18% | | | 1.55% | | | 1.51% | |
| | Ratio of Net Expenses (After Waivers and Expense Offsets) | | 0.94% | | | 0.99% | | | 1.02% | | | 1.27% | | | 1.20% | |
| | Ratio of Net Investment Income/(Loss) | | 0.74% | | | 0.46% | | | 0.49% | | | 1.08% | | | 1.14% | |
| Portfolio Turnover Rate | | 62% | | | 80% | | | 99% | | | 152% | | | 40% | |
| | | | | | | | | | | | | | | | | | | |
| |
* Total return includes adjustments in accordance with generally accepted accounting principles required at the year or period end and are not annualized for periods of less than one full year. ** Annualized for periods of less than one full year. (1) Per share amounts are calculated based on average shares outstanding during the year or period. |
| | |
See Notes to Financial Statements. |
| |
22 | JUNE 30, 2023 |
Janus Henderson Small-Mid Cap Value Fund
Notes to Financial Statements
1. Organization and Significant Accounting Policies
Janus Henderson Small-Mid Cap Value Fund (the “Fund”) is a series of Janus Investment Fund (the “Trust”), which is organized as a Massachusetts business trust and is registered under the Investment Company Act of 1940, as amended (the “1940 Act”), as an open-end management investment company, and therefore has applied the specialized accounting and reporting guidance in Financial Accounting Standards Board (“FASB”) Accounting Standards Codification (“ASC”) Topic 946. The Trust offers 39 funds, each of which offers multiple share classes, with differing investment objectives and policies. The Fund seeks capital appreciation. The Fund is classified as diversified, as defined in the 1940 Act. Janus Henderson Investors US LLC is the investment adviser (the “Adviser”) to the Fund.
The Fund offers multiple classes of shares in order to meet the needs of various types of investors. Each class represents an interest in the same portfolio of investments. Certain financial intermediaries may not offer all classes of shares.
Shareholders, including individuals, accounts, as well as the Fund’s portfolio manager(s) and/or investment personnel, may from time to time own (beneficially or of record) a significant percentage of the Fund’s Shares and can be considered to “control” the Fund when that ownership exceeds 25% of the Fund’s assets (and which may differ from control as determined in accordance with United States of America generally accepted accounting principles ("US GAAP")).
Class A Shares are offered through financial intermediary platforms including, but not limited to, traditional brokerage platforms, mutual fund wrap fee programs, bank trust platforms, and retirement platforms.
Class C Shares are offered through financial intermediary platforms including, but not limited to, traditional brokerage platforms, mutual fund wrap fee programs, and bank trust platforms.
Class C Shares are closed to investments by new employer-sponsored retirement plans and existing employer-sponsored retirement plans are no longer able to make additional purchases or exchanges into Class C Shares.
The Fund currently implements an automatic conversion feature pursuant to which Class C Shares that have been held for eight years are automatically converted to Class A Shares without the imposition of any sales charge, fee or other charge. The conversion will generally occur no later than ten business days in the month following the month of the eighth anniversary of the date of purchase. Class C Shares purchased through the reinvestment of dividends and other distributions on Class C Shares will convert to Class A Shares at the same time as the original Class C Shares with respect to which they were purchased. For Class C Shares held in omnibus accounts on intermediary platforms, the Fund relies on these intermediaries to implement this conversion feature. Your financial intermediary may have separate policies and procedures as to when and how Class C Shares may be converted to Class A Shares.
Effective July 6, 2020, Class D Shares are available to new investors, subject to any closed fund policies for a Fund, as applicable. Previously, Class D Shares were only available to investors who already had a direct account with the Janus Henderson funds; immediate family members or members of the same household of an eligible individual investor; and existing beneficial owners of sole proprietorships or partnerships that hold accounts directly with the Janus Henderson funds.
Class I Shares are available through certain financial intermediary platforms including, but not limited to, mutual fund wrap fee programs, managed account programs, asset allocation programs, bank trust platforms, as well as certain retirement platforms. Class I Shares are also available to certain direct institutional investors including, but not limited to, corporations, certain retirement plans, public plans, and foundations/endowments, who established Class I Share accounts before August 4, 2017.
Class N Shares are generally available only to financial intermediaries purchasing on behalf of: 1) certain adviser-assisted, employer-sponsored retirement plans, including 401(k) plans, 457 plans, 403(b) plans, Taft-Hartley multi-employer plans, profit-sharing and money purchase pension plans, defined benefit plans and certain welfare benefit plans, such as health savings accounts, and nonqualified deferred compensation plans; and 2) retail investors purchasing in qualified or nonqualified accounts, whose accounts are held through an omnibus account at their financial intermediary, and where the financial intermediary requires no payment or reimbursement from the Fund, the Adviser, or its affiliates. Class N Shares are also available to Janus Henderson proprietary products and to certain direct institutional investors approved by Janus Henderson Distributors US LLC (the “Distributor”) including, but not limited to,
Janus Henderson Small-Mid Cap Value Fund
Notes to Financial Statements
corporations, certain retirement plans, public plans, and foundations and endowments, subject to minimum investment requirements.
Class S Shares are offered through financial intermediary platforms including, but not limited to, retirement platforms and asset allocation, mutual fund wrap, or other discretionary or nondiscretionary fee-based investment advisory programs. In addition, Class S Shares may be available through certain financial intermediaries who have an agreement with the Adviser or its affiliates to offer Class S Shares on their supermarket platforms.
Class T Shares are available through certain financial intermediary platforms including, but not limited to, mutual fund wrap fee programs, managed account programs, asset allocation programs, bank trust platforms, as well as certain retirement platforms. In addition, Class T Shares may be available through certain financial intermediaries who have an agreement with the Adviser or its affiliates to offer Class T Shares on their supermarket platforms.
The following accounting policies have been followed by the Fund and are in conformity with US GAAP.
Investment Valuation
Fund holdings are valued in accordance with policies and procedures established by the Adviser pursuant to Rule 2a-5 under the 1940 Act and approved by and subject to the oversight of the Trustees (the “Valuation Procedures”). Equity securities traded on a domestic securities exchange are generally valued at readily available market quotations, which are (i) the official close prices or (ii) last sale prices on the primary market or exchange in which the securities trade. If such price is lacking for the trading period immediately preceding the time of determination, such securities are generally valued at their current bid price. Equity securities that are traded on a foreign exchange are generally valued at the closing prices on such markets. In the event that there is no current trading volume on a particular security in such foreign exchange, the bid price from the primary exchange is generally used to value the security. Foreign securities and currencies are converted to U.S. dollars using the current spot USD dollar exchange rate in effect at the close of the New York Stock Exchange (“NYSE”). The Adviser will determine the market value of individual securities held by it by using prices provided by one or more Adviser-approved professional pricing services or, as needed, by obtaining market quotations from independent broker-dealers. Most debt securities are valued in accordance with the evaluated bid price supplied by the pricing service that is intended to reflect market value. The evaluated bid price supplied by the pricing service is an evaluation that may consider factors such as security prices, yields, maturities and ratings. Certain short-term securities maturing within 60 days or less may be evaluated and valued on an amortized cost basis provided that the amortized cost determined approximates market value. Securities for which market quotations or evaluated prices are not readily available or deemed unreliable are valued at fair value determined in good faith by the Adviser pursuant to the Valuation Procedures. Circumstances in which fair valuation may be utilized include, but are not limited to: (i) a significant event that may affect the securities of a single issuer, such as a merger, bankruptcy, or significant issuer-specific development; (ii) an event that may affect an entire market, such as a natural disaster or significant governmental action; (iii) a nonsignificant event such as a market closing early or not opening, or a security trading halt; and (iv) pricing of a nonvalued security and a restricted or nonpublic security. Special valuation considerations may apply with respect to “odd-lot” fixed-income transactions which, due to their small size, may receive evaluated prices by pricing services which reflect a large block trade and not what actually could be obtained for the odd-lot position. The value of the securities of other mutual funds held by the Fund, if any, will be calculated using the NAV of such mutual funds, and the prospectuses for such mutual funds explain the circumstances under which they use fair valuation and the effects of using fair valuation. The value of the securities of any cash management pooled investment vehicles that operate as money market funds held by the Fund, if any, will be calculated using the NAV of such funds.
Valuation Inputs Summary
FASB ASC 820, Fair Value Measurements and Disclosures (“ASC 820”), defines fair value, establishes a framework for measuring fair value, and expands disclosure requirements regarding fair value measurements. This standard emphasizes that fair value is a market-based measurement that should be determined based on the assumptions that market participants would use in pricing an asset or liability and establishes a hierarchy that prioritizes inputs to valuation techniques used to measure fair value. These inputs are summarized into three broad levels:
Level 1 – Unadjusted quoted prices in active markets the Fund has the ability to access for identical assets or liabilities.
Level 2 – Observable inputs other than unadjusted quoted prices included in Level 1 that are observable for the asset or liability either directly or indirectly. These inputs may include quoted prices for the identical instrument on
Janus Henderson Small-Mid Cap Value Fund
Notes to Financial Statements
an inactive market, prices for similar instruments, interest rates, prepayment speeds, credit risk, yield curves, default rates and similar data.
Assets or liabilities categorized as Level 2 in the hierarchy generally include: debt securities fair valued in accordance with the evaluated bid or ask prices supplied by a pricing service; securities traded on OTC markets and listed securities for which no sales are reported that are fair valued at the latest bid price (or yield equivalent thereof) obtained from one or more dealers transacting in a market for such securities or by a pricing service approved by the Fund’s Trustees; certain short-term debt securities with maturities of 60 days or less that are fair valued at amortized cost; and equity securities of foreign issuers whose fair value is determined by using systematic fair valuation models provided by independent third parties in order to adjust for stale pricing which may occur between the close of certain foreign exchanges and the close of the NYSE. Other securities that may be categorized as Level 2 in the hierarchy include, but are not limited to, preferred stocks, bank loans, swaps, investments in unregistered investment companies, options, and forward contracts.
Level 3 – Unobservable inputs for the asset or liability to the extent that relevant observable inputs are not available, representing the Fund’s own assumptions about the assumptions that a market participant would use in valuing the asset or liability, and that would be based on the best information available.
There have been no significant changes in valuation techniques used in valuing any such positions held by the Fund since the beginning of the fiscal year.
The inputs or methodology used for fair valuing securities are not necessarily an indication of the risk associated with investing in those securities. The summary of inputs used as of June 30, 2023 to fair value the Fund’s investments in securities and other financial instruments is included in the “Valuation Inputs Summary” in the Notes to Schedule of Investments and Other Information.
Investment Transactions and Investment Income
Investment transactions are accounted for as of the date purchased or sold (trade date). Dividend income is recorded on the ex-dividend date. Certain dividends from foreign securities will be recorded as soon as the Fund is informed of the dividend, if such information is obtained subsequent to the ex-dividend date. Dividends from foreign securities may be subject to withholding taxes in foreign jurisdictions. Non-cash dividends, if any, are recorded on the ex-dividend date at fair value. Interest income is recorded daily on the accrual basis and includes amortization of premiums and accretion of discounts. The Fund classifies gains and losses on prepayments received as an adjustment to interest income. Debt securities may be placed in non-accrual status and related interest income may be reduced by stopping current accruals and writing off interest receivables when collection of all or a portion of interest has become doubtful. Gains and losses are determined on the identified cost basis, which is the same basis used for federal income tax purposes. Income, as well as gains and losses, both realized and unrealized, are allocated daily to each class of shares based upon the ratio of net assets represented by each class as a percentage of total net assets.
Expenses
The Fund bears expenses incurred specifically on its behalf. Each class of shares bears a portion of general expenses, which are allocated daily to each class of shares based upon the ratio of net assets represented by each class as a percentage of total net assets. Expenses directly attributable to a specific class of shares are charged against the operations of such class.
Estimates
The preparation of financial statements in conformity with US GAAP requires management to make estimates and assumptions that affect the reported amount of assets and liabilities and disclosure of contingent assets and liabilities at the date of the financial statements, and the reported amounts of income and expenses during the reporting period. Actual results could differ from those estimates.
Indemnifications
In the normal course of business, the Fund may enter into contracts that contain provisions for indemnification of other parties against certain potential liabilities. The Fund’s maximum exposure under these arrangements is unknown, and would involve future claims that may be made against the Fund that have not yet occurred. Currently, the risk of material loss from such claims is considered remote.
Janus Henderson Small-Mid Cap Value Fund
Notes to Financial Statements
Dividends and Distributions
The Fund generally declares and distributes dividends of net investment income and realized capital gains (if any) annually. The Fund may treat a portion of the amount paid to redeem shares as a distribution of investment company taxable income and realized capital gains that are reflected in the net asset value. This practice, commonly referred to as “equalization,” has no effect on the redeeming shareholder or a Fund’s total return, but may reduce the amounts that would otherwise be required to be paid as taxable dividends to the remaining shareholders. It is possible that the Internal Revenue Service (IRS) could challenge the Fund's equalization methodology or calculations, and any such challenge could result in additional tax, interest, or penalties to be paid by the Fund.
The Fund may make certain investments in real estate investment trusts (“REITs”) which pay dividends to their shareholders based upon funds available from operations. It is quite common for these dividends to exceed the REITs’ taxable earnings and profits, resulting in the excess portion of such dividends being designated as a return of capital. If the Fund distributes such amounts, such distributions could constitute a return of capital to shareholders for federal income tax purposes.
Federal Income Taxes
The Fund intends to continue to qualify as a regulated investment company and distribute all of its taxable income in accordance with the requirements of Subchapter M of the Internal Revenue Code. Management has analyzed the Fund’s tax positions taken for all open federal income tax years, generally a three-year period, and has concluded that no provision for federal income tax is required in the Fund’s financial statements. The Fund is not aware of any tax positions for which it is reasonably possible that the total amounts of unrecognized tax benefits will significantly change in the next twelve months.
2. Other Investments and Strategies
Market Risk
The value of the Fund’s portfolio may decrease if the value of one or more issuers in the Fund’s portfolio decreases. Further, regardless of how well individual companies or securities perform, the value of the Fund’s portfolio could also decrease if there are deteriorating economic or market conditions, including, but not limited to, a general decline in prices on the stock markets, a general decline in real estate markets, a decline in commodities prices, or if the market favors different types of securities than the types of securities in which the Fund invests. If the value of the Fund’s portfolio decreases, the Fund’s NAV will also decrease, which means if you sell your shares in the Fund you may lose money. Market risk may affect a single issuer, industry, economic sector, or the market as a whole. The increasing interconnectivity between global economies and financial markets increases the likelihood that events or conditions in one region or financial market may adversely impact issuers in a different country, region or financial market. Social, political, economic and other conditions and events, such as natural disasters, health emergencies (e.g., epidemics and pandemics), terrorism, conflicts, including related sanctions, and social unrest, could reduce consumer demand or economic output, result in market closures, travel restrictions and/or quarantines, and generally have a significant impact on the global economies and financial markets.
• COVID-19 Pandemic. The effects of COVID-19 have contributed to increased volatility in global financial markets and have affected and may continue to affect certain countries, regions, issuers, industries and market sectors more dramatically than others. These conditions and events could have a significant impact on the Fund and its investments, the Fund’s ability to meet redemption requests, and the processes and operations of the Fund’s service providers, including the Adviser.
• Russia/Ukraine Invasion. Russia launched a large-scale invasion of Ukraine on February 24, 2022. The extent and duration of the military action, resulting sanctions and resulting future market disruptions in the region are impossible to predict, but could be significant and have a severe adverse effect on the region, including significant negative impacts on the economy and the markets for certain securities and commodities, such as oil and natural gas, as well as other sectors.
Real Estate Investing
The Fund may invest in equity and debt securities of real estate-related companies. Such companies may include those in the real estate industry or real estate-related industries. These securities may include common stocks, corporate bonds, preferred stocks, and other equity securities, including, but not limited to, mortgage-backed securities, real estate-backed securities, securities of REITs and similar REIT-like entities. A REIT is a trust that invests in real estate-
Janus Henderson Small-Mid Cap Value Fund
Notes to Financial Statements
related projects, such as properties, mortgage loans, and construction loans. REITs are generally categorized as equity, mortgage, or hybrid REITs. A REIT may be listed on an exchange or traded OTC.
Repurchase Agreements
The Fund and other funds advised by the Adviser or its affiliates may transfer daily uninvested cash balances into one or more joint trading accounts. Assets in the joint trading accounts are invested in money market instruments and the proceeds are allocated to the participating funds on a pro rata basis.
Repurchase agreements held by the Fund are fully collateralized, and such collateral is in the possession of the Fund’s custodian or, for tri-party agreements, the custodian designated by the agreement. The collateral is evaluated daily to ensure its market value exceeds the current market value of the repurchase agreements, including accrued interest. In the event of default on the obligation to repurchase, the Fund has the right to liquidate the collateral and apply the proceeds in satisfaction of the obligation. In the event of default or bankruptcy by the other party to the agreement, realization and/or retention of the collateral or proceeds may be subject to legal proceedings.
Counterparties
Fund transactions involving a counterparty are subject to the risk that the counterparty or a third party will not fulfill its obligation to the Fund (“counterparty risk”). Counterparty risk may arise because of the counterparty’s financial condition (i.e., financial difficulties, bankruptcy, or insolvency), market activities and developments, or other reasons, whether foreseen or not. A counterparty’s inability to fulfill its obligation may result in significant financial loss to the Fund. The Fund may be unable to recover its investment from the counterparty or may obtain a limited recovery, and/or recovery may be delayed. The extent of the Fund’s exposure to counterparty risk with respect to financial assets and liabilities approximates its carrying value. See the "Offsetting Assets and Liabilities" section of this Note for further details.
The Fund may be exposed to counterparty risk through participation in various programs, including, but not limited to, lending its securities to third parties, cash sweep arrangements whereby the Fund’s cash balance is invested in one or more types of cash management vehicles, as well as investments in, but not limited to, repurchase agreements, debt securities, and derivatives, including various types of swaps, futures and options. The Fund intends to enter into financial transactions with counterparties that the Adviser believes to be creditworthy at the time of the transaction. There is always the risk that the Adviser’s analysis of a counterparty’s creditworthiness is incorrect or may change due to market conditions. To the extent that the Fund focuses its transactions with a limited number of counterparties, it will have greater exposure to the risks associated with one or more counterparties.
Offsetting Assets and Liabilities
The Fund presents gross and net information about transactions that are either offset in the financial statements or subject to an enforceable master netting arrangement or similar agreement with a designated counterparty, regardless of whether the transactions are actually offset in the Statement of Assets and Liabilities.
The Offsetting Assets and Liabilities table located in the Schedule of Investments presents gross amounts of recognized assets and/or liabilities and the net amounts after deducting collateral that has been pledged by counterparties or has been pledged to counterparties (if applicable). For corresponding information grouped by type of instrument, see the Fund's Schedule of Investments.
All repurchase agreements are transacted under legally enforceable master repurchase agreements that give the Fund, in the event of default by the counterparty, the right to liquidate securities held and to offset receivables and payables with the counterparty. For financial reporting purposes, the Fund does not offset financial instruments' payables and receivables and related collateral on the Statement of Assets and Liabilities. Repurchase agreements held by the Fund are fully collateralized, and such collateral is in the possession of the Fund’s custodian or, for tri-party agreements, the custodian designated by the agreement. The collateral is evaluated daily to ensure its market value exceeds the current market value of the repurchase agreements, including accrued interest.
3. Investment Advisory Agreements and Other Transactions with Affiliates
The Fund pays the Adviser an investment advisory fee rate that may adjust up or down based on the Fund’s performance relative to its benchmark index.
The investment advisory fee rate paid to the Adviser by the Fund consists of two components: (1) a base fee calculated by applying the contractual fixed rate of the advisory fee to the Fund’s average daily net assets during the previous month (the “Base Fee Rate”), plus or minus (2) a performance-fee adjustment (the “Performance Adjustment”)
Janus Henderson Small-Mid Cap Value Fund
Notes to Financial Statements
calculated by applying a variable rate of up to 0.15% (positive or negative) to the Fund’s average daily net assets based on the Fund’s relative performance compared to the cumulative investment record of its benchmark index over a 36-month performance measurement period or shorter time period, as applicable. The investment advisory fee rate is calculated daily and paid monthly.
The investment performance of the Fund’s Class A Shares (waiving the upfront sales load) for the performance measurement period is used to calculate the Performance Adjustment. The Fund’s Base Fee Rate prior to any performance adjustment (expressed as an annual rate) is 0.70%. The Fund’s primary benchmark index is the Russell 2500TM Value Index. The Russell 3000® Value Index was used to calculate the Fund’s performance fee adjustment prior to August 1, 2019. For a period of 36 months beginning on August 1, 2019, the Fund’s performance fee adjustment was calculated based on a combination of the Russell 2500TM Value Index and the Russell 3000® Value Index. Effective August 1, 2022, the Russell 3000® Value Index was eliminated from the performance adjustment calculation for the Fund, and the performance adjustment now only includes the Fund’s performance relative to the Russell 2500TM Value Index.
No Performance Adjustment is applied unless the difference between the Fund’s investment performance and the cumulative investment record of the Fund’s benchmark index is 0.50% or greater (positive or negative) during the applicable performance measurement period. The Base Fee Rate is subject to an upward or downward Performance Adjustment for every full 0.50% increment by which the Fund outperforms or underperforms its benchmark index, up to the Fund’s full performance rate of ±5.00%. Because the Performance Adjustment is tied to a Fund’s relative performance compared to its benchmark index (and not its absolute performance), the Performance Adjustment could increase the Adviser’s fee even if the Fund’s Shares lose value during the performance measurement period and could decrease the Adviser’s fee even if the Fund’s Shares increase in value during the performance measurement period. For purposes of computing the Base Fee Rate and the Performance Adjustment, net assets are averaged over different periods (average daily net assets during the previous month for the Base Fee Rate, versus average daily net assets during the performance measurement period for the Performance Adjustment). Performance of the Fund is calculated net of expenses whereas the Fund’s benchmark index does not have any fees or expenses. Reinvestment of dividends and distributions is included in calculating both the performance of a Fund and the Fund’s benchmark index.
The Fund’s prospectuses and statement(s) of additional information contain additional information about performance-based fees. The amount shown as advisory fees on the Statement of Operations reflects the Base Fee Rate plus/minus any Performance Adjustment. For the year ended June 30, 2023, the performance adjusted investment advisory fee rate before any waivers and/or reimbursements of expenses is 0.57%.
The Adviser has contractually agreed to waive the investment advisory fee and/or reimburse operating expenses to the extent that the Fund’s total annual fund operating expenses, excluding any performance adjustments to management fees, the fees payable pursuant to a Rule 12b-1 plan, shareholder servicing fees, such as transfer agency fees (including out-of-pocket costs), administrative services fees and any networking/omnibus payable by any share class, brokerage commissions, interest, dividends, taxes, acquired fund fees and expenses, and extraordinary expenses, exceed the annual rate of 0.82% of the Fund’s average daily net assets. The Adviser has agreed to continue the waivers for at least a one-year period commencing October 28, 2022. If applicable, amounts waived and/or reimbursed to the Fund by the Adviser are disclosed as “Excess Expense Reimbursement and Waivers” on the Statement of Operations.
The Adviser serves as administrator to the Fund pursuant to an administration agreement between the Adviser and the Trust. Under the administration agreement, the Adviser is authorized to perform, or cause others to perform certain administration, compliance, and accounting services to the Fund, including providing office space for the Fund, and is reimbursed by the Fund for certain of its costs in providing these services (to the extent the Adviser seeks reimbursement and such costs are not otherwise waived). In addition, employees of the Adviser and/or its affiliates may serve as officers of the Trust. The Fund pays for some or all of the salaries, fees, and expenses of the Adviser employees and Fund officers, with respect to certain specified administration functions they perform on behalf of the Fund. The Fund pays these costs based on out-of-pocket expenses incurred by the Adviser, and these costs are separate and apart from advisory fees and other expenses paid in connection with the investment advisory services the Adviser (or any subadvisor, as applicable) provides to the Fund. These amounts are disclosed as “Affiliated fund administration fees” on the Statement of Operations. In addition, some expenses related to compensation payable to the Fund’s Chief Compliance Officer and certain compliance staff, all of whom are employees of the Adviser and/or its affiliates, are shared with the Fund. Total compensation of $343,237 was paid to the Chief Compliance Officer and
Janus Henderson Small-Mid Cap Value Fund
Notes to Financial Statements
certain compliance staff by the Trust during the year ended June 30, 2023. The Fund's portion is reported as part of “Other expenses” on the Statement of Operations.
Janus Henderson Services US LLC (the “Transfer Agent”), a wholly-owned subsidiary of the Adviser, is the Fund’s transfer agent. The Transfer Agent provides or arranges for the provision of shareholder services including, but not limited to, recordkeeping, subaccounting, answering inquiries regarding accounts, order processing, transaction confirmations, the mailing of prospectuses and shareholder reports, and other shareholder services provided to or on behalf of shareholders. These amounts are disclosed as “Transfer agent administrative fees and expenses” on the Statement of Operations.
Class D Shares of the Fund pay the Transfer Agent an annual administrative services fee based on the average daily net assets of Class D Shares as detailed below.
| | |
Average Daily Net Assets of Class D Shares of the Janus Henderson funds | Administrative Services Fee |
Under $40 billion | 0.12% |
$40 billion – $49.9 billion | 0.10% |
Over $49.9 billion | 0.08% |
During the reporting period, the administrative services fee rate was 0.12%.
The Transfer Agent receives an administrative services fee at an annual rate of up to 0.25% of the average daily net assets of the Fund’s Class S Shares and Class T Shares for providing or procuring administrative services to investors in Class S Shares and Class T Shares of the Fund. The Transfer Agent expects to use all or a significant portion of this fee to compensate retirement plan service providers, broker-dealers, bank trust departments, financial advisors, and other financial intermediaries for providing these services. The Transfer Agent may keep certain amounts retained for reimbursement of out-of-pocket costs incurred for servicing clients of Class S Shares and Class T Shares.
Shareholder Services provided by these financial intermediaries may include, but are not limited to, recordkeeping, subaccounting, order processing, providing order confirmations, periodic statements, forwarding prospectuses, shareholder reports, and other materials to existing customers, answering inquiries regarding accounts, and other administrative services. Order processing includes the submission of transactions through the National Securities Clearing Corporation (“NSCC”) or similar systems, or those processed on a manual basis with the Adviser. For all share classes, the Transfer Agent also seeks reimbursement for costs it incurs as transfer agent and for providing servicing.
Certain, but not all, intermediaries may charge administrative fees to investors in Class A Shares, Class C Shares, and Class I Shares for administrative services provided on behalf of such investors. These administrative fees are paid by the Class A Shares, Class C Shares, and Class I Shares of the Fund to the Transfer Agent, which uses such fees to reimburse intermediaries. Consistent with the Transfer Agency Agreement between the Transfer Agent and the Fund, the Transfer Agent may negotiate the level, structure, and/or terms of the administrative fees with intermediaries requiring such fees on behalf of the Fund. The Adviser and its affiliates benefit from an increase in assets that may result from such relationships. The Adviser has agreed to limit these fees up to 0.20% for Class A Shares and Class C Shares, and up to 0.15% for Class I Shares on an annual basis based on the daily net assets of each share class. Such limits are subject to change by the Trustees in the future. These amounts are disclosed as “Transfer agent networking and omnibus fees” on the Statement of Operations.
The Transfer Agent is not compensated for its services related to the shares, except for out-of-pocket costs, although the Transfer Agent is compensated for its services related to Fund’s Class D Shares. These amounts are disclosed as “Other transfer agent fees and expenses” on the Statement of Operations.
Under distribution and shareholder servicing plans (the “Plans”) adopted in accordance with Rule 12b-1 under the 1940 Act, the Fund pays the Trust’s distributor, the Distributor, a wholly-owned subsidiary of the Adviser, a fee for the sale and distribution and/or shareholder servicing of the shares based on the average daily net assets for each share class at an annual rate of up to 0.25% for Class A Shares, up to 1.00% for Class C Shares, and up to 0.25% for Class S Shares. Under the terms of the Plans, the Trust is authorized to make payments to the Distributor for remittance to retirement plan service providers, broker-dealers, bank trust departments, financial advisors, and other financial intermediaries, as compensation for distribution and/or shareholder services performed by such entities for their customers who are investors in the Fund. These amounts are disclosed as “12b-1 Distribution and shareholder servicing fees” on the Statement of Operations.
Janus Henderson Small-Mid Cap Value Fund
Notes to Financial Statements
Class A Shares include a 5.75% upfront sales charge of the offering price of the Fund. The sales charge is allocated between the Distributor and financial intermediaries. During the year ended June 30, 2023, the Distributor retained upfront sales charges of $448.
A contingent deferred sales charge (“CDSC”) of 1.00% will be deducted with respect to Class A Shares purchased without a sales load and redeemed within 12 months of purchase, unless waived. Any applicable CDSC will be 1.00% of the lesser of the original purchase price or the value of the redemption of the Class A Shares redeemed. There were no CDSCs paid by redeeming shareholders of Class A Shares to the Distributor during the year ended June 30, 2023.
A CDSC of 1.00% will be deducted with respect to Class C Shares redeemed within 12 months of purchase, unless waived. Any applicable CDSC will be 1.00% of the lesser of the original purchase price or the value of the redemption of the Class C Shares redeemed. There were no CDSCs paid by redeeming shareholders of Class C Shares during the year ended June 30, 2023.
The Board of Trustees has adopted a deferred compensation plan (the “Deferred Plan”) for independent Trustees to elect to defer receipt of all or a portion of the annual compensation they are entitled to receive from the Fund. All deferred fees are credited to an account established in the name of the Trustees. The amounts credited to the account then increase or decrease, as the case may be, in accordance with the performance of one or more of the Janus Henderson funds that are selected by the Trustees. The account balance continues to fluctuate in accordance with the performance of the selected fund or funds until final payment of all amounts are credited to the account. The fluctuation of the account balance is recorded by the Fund as unrealized appreciation/(depreciation) and is included as of June 30, 2023 on the Statement of Assets and Liabilities in the asset, “Trustees’ deferred compensation,” and liability, “Trustees’ deferred compensation fees.” Additionally, the recorded unrealized appreciation/(depreciation) is included in “Total distributable earnings (loss)” on the Statement of Assets and Liabilities. Deferred compensation expenses for the year ended June 30, 2023 are included in “Trustees’ fees and expenses” on the Statement of Operations. Trustees are allowed to change their designation of mutual funds from time to time. Amounts will be deferred until distributed in accordance with the Deferred Plan. Deferred fees of $426,025 were paid by the Trust to the Trustees under the Deferred Plan during the year ended June 30, 2023.
As of June 30, 2023, shares of the Fund were owned by affiliates of the Adviser, and/or other funds advised by the Adviser, as indicated in the table below:
| | | | | | | |
Class | % of Class Owned | | % of Fund Owned | | |
Class A Shares | - | % | - | % | |
Class C Shares | - | | - | | |
Class D Shares | - | | - | | |
Class I Shares | - | | - | | |
Class N Shares | 47 | | 21 | | |
Class S Shares | 38 | | -* | | |
Class T Shares | - | | - | | |
| | | | | | |
* | Less than 0.50% | | | | | |
Janus Henderson Small-Mid Cap Value Fund
Notes to Financial Statements
4. Federal Income Tax
The tax components of capital shown in the table below represent: (1) distribution requirements the Fund must satisfy under the income tax regulations; (2) losses or deductions the Fund may be able to offset against income and gains realized in future years; and (3) unrealized appreciation or depreciation of investments for federal income tax purposes.
Other book to tax differences primarily consist of deferred compensation. The Fund has elected to treat gains and losses on forward foreign currency contracts as capital gains and losses, if applicable. Other foreign currency gains and losses on debt instruments are treated as ordinary income for federal income tax purposes pursuant to Section 988 of the Internal Revenue Code.
| | | | | | | |
| | | | Other Book | Net Tax | |
Undistributed
Ordinary Income | Undistributed
Long-Term Gains | Accumulated
Capital Losses | Loss Deferrals | to Tax
Differences | Appreciation/
(Depreciation) | |
$ 388,425 | $ - | $ (6,090,278) | $ - | $ (2,638) | $ 11,824,383 | |
Accumulated capital losses noted below represent net capital loss carryovers, as of June 30, 2023, that may be available to offset future realized capital gains and thereby reduce future taxable gains distributions. The following table shows these capital loss carryovers.
| | | | | | |
| | | | | |
Capital Loss Carryover Schedule | | |
For the year ended June 30, 2023 | | |
| No Expiration | | | |
| Short-Term | Long-Term | Accumulated
Capital Losses | | |
| $(6,090,278) | $ - | $ (6,090,278) | | |
The aggregate cost of investments and the composition of unrealized appreciation and depreciation of investment securities for federal income tax purposes as of June 30, 2023 are noted below. The primary difference between book and tax appreciation or depreciation of investments is wash sale loss deferrals.
| | | | |
Federal Tax Cost | Unrealized
Appreciation | Unrealized
(Depreciation) | Net Tax Appreciation/
(Depreciation) |
$ 91,938,678 | $15,940,717 | $ (4,116,334) | $ 11,824,383 |
Janus Henderson Small-Mid Cap Value Fund
Notes to Financial Statements
Income and capital gains distributions are determined in accordance with income tax regulations that may differ from US GAAP. These differences are due to differing treatments for items such as net short-term gains, deferral of wash sale losses, and capital loss carryovers. Certain permanent differences such as tax returns of capital and net investment losses noted below have been reclassified to capital.
| | | | | |
For the year ended June 30, 2023 | |
Distributions | | |
From Ordinary Income | From Long-Term Capital Gains | Tax Return of Capital | Net Investment Loss | |
$ 720,131 | $ - | $ - | $ - | |
| | | | | |
For the year ended June 30, 2022 | |
Distributions | | |
From Ordinary Income | From Long-Term Capital Gains | Tax Return of Capital | Net Investment Loss | |
$ 854,268 | $ 3,367,574 | $ - | $ - | |
Permanent book to tax basis differences may result in reclassifications between the components of net assets. These differences have no impact on the results of operations or net assets.
Janus Henderson Small-Mid Cap Value Fund
Notes to Financial Statements
5. Capital Share Transactions
| | | | | | | |
| | | | | | |
| | Year ended June 30, 2023 | | Year ended June 30, 2022 |
| | Shares | Amount | | Shares | Amount |
| | | | | | | |
Class A Shares: | | | | | |
Shares sold | 12,537 | $ 163,797 | | 15,045 | $ 202,833 |
Reinvested dividends and distributions | 505 | 6,350 | | 5,810 | 79,135 |
Shares repurchased | (36,384) | (437,080) | | (51,693) | (710,773) |
Net Increase/(Decrease) | (23,342) | $ (266,933) | | (30,838) | $ (428,805) |
Class C Shares: | | | | | |
Shares sold | 3,611 | $ 43,236 | | 5,225 | $ 66,326 |
Reinvested dividends and distributions | - | - | | 955 | 12,497 |
Shares repurchased | (16,104) | (187,984) | | (4,323) | (56,156) |
Net Increase/(Decrease) | (12,493) | $ (144,748) | | 1,857 | $ 22,667 |
Class D Shares: | | | | | |
Shares sold | 508,073 | $ 6,729,242 | | 788,962 | $ 10,804,986 |
Reinvested dividends and distributions | 17,788 | 224,835 | | 103,899 | 1,423,415 |
Shares repurchased | (970,215) | (12,377,990) | | (2,177,708) | (29,858,583) |
Net Increase/(Decrease) | (444,354) | $ (5,423,913) | | (1,284,847) | $(17,630,182) |
Class I Shares: | | | | | |
Shares sold | 87,999 | $ 1,156,764 | | 128,465 | $ 1,787,759 |
Reinvested dividends and distributions | 2,974 | 37,979 | | 22,449 | 310,688 |
Shares repurchased | (270,652) | (3,499,959) | | (485,566) | (6,708,829) |
Net Increase/(Decrease) | (179,679) | $ (2,305,216) | | (334,652) | $ (4,610,382) |
Class N Shares: | | | | | |
Shares sold | 1,273,572 | $ 16,309,966 | | 1,218,146 | $ 16,587,943 |
Reinvested dividends and distributions | 33,231 | 420,035 | | 151,902 | 2,081,053 |
Shares repurchased | (2,667,885) | (34,283,578) | | (1,574,792) | (21,436,606) |
Net Increase/(Decrease) | (1,361,082) | $(17,553,577) | | (204,744) | $ (2,767,610) |
Class S Shares: | | | | | |
Shares sold | 11,491 | $ 143,916 | | 8,954 | $ 119,811 |
Reinvested dividends and distributions | - | - | | 2,289 | 30,861 |
Shares repurchased | (75,338) | (953,526) | | (12,293) | (155,901) |
Net Increase/(Decrease) | (63,847) | $ (809,610) | | (1,050) | $ (5,229) |
Class T Shares: | | | | | |
Shares sold | 204,265 | $ 2,619,557 | | 142,207 | $ 1,927,674 |
Reinvested dividends and distributions | 1,923 | 24,323 | | 17,486 | 239,738 |
Shares repurchased | (377,553) | (4,889,504) | | (857,665) | (11,848,442) |
Net Increase/(Decrease) | (171,365) | $ (2,245,624) | | (697,972) | $ (9,681,030) |
6. Purchases and Sales of Investment Securities
For the year ended June 30, 2023, the aggregate cost of purchases and proceeds from sales of investment securities (excluding any short-term securities, short-term options contracts, TBAs, and in-kind transactions, as applicable) was as follows:
| | | | |
Purchases of
Securities | Proceeds from Sales
of Securities | Purchases of Long-
Term U.S. Government
Obligations | Proceeds from Sales
of Long-Term U.S.
Government Obligations |
$69,234,423 | $ 97,454,320 | $ - | $ - |
Janus Henderson Small-Mid Cap Value Fund
Notes to Financial Statements
7. Subsequent Event
Management has evaluated whether any events or transactions occurred subsequent to June 30, 2023 and through the date of issuance of the Fund's financial statements and determined that there were no material events or transactions that would require recognition or disclosure in the Fund’s financial statements.
Janus Henderson Small-Mid Cap Value Fund
Report of Independent Registered Public Accounting Firm
To the Board of Trustees of Janus Investment Fund and Shareholders of Janus Henderson Small-Mid Cap Value Fund
Opinion on the Financial Statements
We have audited the accompanying statement of assets and liabilities, including the schedule of investments, of Janus Henderson Small-Mid Cap Value Fund (one of the funds constituting Janus Investment Fund, referred to hereafter as the “Fund”) as of June 30, 2023, the related statement of operations for the year ended June 30, 2023, the statements of changes in net assets for each of the two years in the period ended June 30, 2023, including the related notes, and the financial highlights for each of the five years in the period ended June 30, 2023 (collectively referred to as the “financial statements”). In our opinion, the financial statements present fairly, in all material respects, the financial position of the Fund as of June 30, 2023, the results of its operations for the year then ended, the changes in its net assets for each of the two years in the period ended June 30, 2023 and the financial highlights for each of the five years in the period ended June 30, 2023 in conformity with accounting principles generally accepted in the United States of America.
Basis for Opinion
These financial statements are the responsibility of the Fund’s management. Our responsibility is to express an opinion on the Fund’s financial statements based on our audits. We are a public accounting firm registered with the Public Company Accounting Oversight Board (United States) (PCAOB) and are required to be independent with respect to the Fund in accordance with the U.S. federal securities laws and the applicable rules and regulations of the Securities and Exchange Commission and the PCAOB.
We conducted our audits of these financial statements in accordance with the standards of the PCAOB. Those standards require that we plan and perform the audit to obtain reasonable assurance about whether the financial statements are free of material misstatement, whether due to error or fraud.
Our audits included performing procedures to assess the risks of material misstatement of the financial statements, whether due to error or fraud, and performing procedures that respond to those risks. Such procedures included examining, on a test basis, evidence regarding the amounts and disclosures in the financial statements. Our audits also included evaluating the accounting principles used and significant estimates made by management, as well as evaluating the overall presentation of the financial statements. Our procedures included confirmation of securities owned as of June 30, 2023 by correspondence with the custodian and brokers. We believe that our audits provide a reasonable basis for our opinion.

Denver, Colorado
August 21, 2023
We have served as the auditor of one or more investment companies in Janus Henderson Funds since 1990.
Janus Henderson Small-Mid Cap Value Fund
Additional Information (unaudited)
Proxy Voting Policies and Voting Record
A description of the policies and procedures that the Fund uses to determine how to vote proxies relating to its portfolio securities is available without charge: (i) upon request, by calling 1-800-525-1093; (ii) on the Fund’s website at janushenderson.com/proxyvoting; and (iii) on the SEC’s website at http://www.sec.gov. Additionally, information regarding the Fund’s proxy voting record for the most recent twelve-month period ended June 30 is also available, free of charge, through janushenderson.com/proxyvoting and from the SEC’s website at http://www.sec.gov.
Full Holdings
The Fund files its complete portfolio holdings (schedule of investments) with the SEC as an exhibit to Form N-PORT within 60 days of the end of the first and third fiscal quarters, and in the annual report and semiannual report to shareholders. The Fund’s Form N-PORT filings and annual and semiannual reports: (i) are available on the SEC’s website at http://www.sec.gov; and (ii) are available without charge, upon request, by calling a Janus Henderson representative at 1-877-335-2687 (toll free) (or 1-800-525-3713 if you hold Class D shares). Portfolio holdings consisting of at least the names of the holdings are generally available on a monthly basis with a 30-day lag under Full Holdings for the Fund at janushenderson.com/info (or janushenderson.com/reports if you hold Class D Shares).
APPROVAL OF ADVISORY AGREEMENTS DURING THE PERIOD
The Trustees of Janus Aspen Series, each of whom serves as an “independent” Trustee (the “Trustees”), oversee the management of each portfolio of Janus Aspen Series (each, a “VIT Portfolio,” and collectively, the “VIT Portfolios”), as well as each fund of Janus Investment Fund (each, a “Fund,” and collectively, the “Funds” and together with the VIT Portfolios, the “Janus Henderson Funds,” and each, a “Janus Henderson Fund”). As required by law, the Trustees determine annually whether to continue the investment advisory agreement for each Janus Henderson Fund.
In connection with their most recent consideration of those agreements for each Janus Henderson Fund, the Trustees received and reviewed information provided by Janus Henderson Investors US LLC (the “Adviser”) in response to requests of the Trustees and their independent legal counsel. They also received and reviewed information and analysis provided by, and in response to requests of, their independent fee consultant. Throughout their consideration of the agreements, the Trustees were advised by their independent legal counsel. The Trustees met with management to consider the agreements, and also met separately in executive session with their independent legal counsel and their independent fee consultant.
At meetings held on November 9-10, 2022 and December 13-14, 2022, the Trustees evaluated the information provided by the Adviser and the independent fee consultant, as well as other information provided by the Adviser and the independent fee consultant during the year. Following such evaluation, the Trustees determined that the overall arrangements between each Janus Henderson Fund and the Adviser were fair and reasonable in light of the nature, extent, and quality of the services provided by the Adviser and its affiliates, the fees charged for those services, and other matters that the Trustees considered relevant in the exercise of their business judgment, and unanimously approved the continuation of the investment advisory agreement for each Janus Henderson Fund for the period from February 1, 2023 through February 1, 2024, subject to earlier termination as provided for in each agreement.
In considering the continuation of those agreements, the Trustees reviewed and analyzed various factors that they determined were relevant, including the factors described below, none of which by itself was considered dispositive. However, the material factors and conclusions that formed the basis for the Trustees’ determination to approve the continuation of the agreements are discussed separately below. Also included is a summary of the independent fee consultant’s conclusions and opinions that arose during, and were included as part of, the Trustees’ consideration of the agreements. “Management fees,” as used herein, reflect actual annual advisory fees and, for the purpose of peer comparisons any administration fees (excluding out of pocket costs), net of any waivers, paid by a fund as a percentage of average net assets.
Nature, Extent and Quality of Services
The Trustees reviewed the nature, extent, and quality of the services provided by the Adviser to the Janus Henderson Funds, taking into account the investment objective, strategies, and policies of each Janus Henderson Fund, and the knowledge the Trustees gained from their regular meetings with management on at least a quarterly basis and their ongoing review of information related to the Janus Henderson Funds. In addition, the Trustees reviewed the resources and key personnel of the Adviser, particularly noting those employees who provide investment and risk management services to the Janus Henderson Funds. The Trustees also considered other services provided to the Janus Henderson
Janus Henderson Small-Mid Cap Value Fund
Additional Information (unaudited)
Funds by the Adviser, such as managing the execution of portfolio transactions and the selection of broker-dealers for those transactions. The Trustees considered the Adviser’s role as administrator to the Janus Henderson Funds, noting that the Adviser generally does not receive a fee for its services as administrator, but is reimbursed for its out-of-pocket costs. The Trustees considered the role of the Adviser in monitoring adherence to the Janus Henderson Funds’ investment restrictions, providing support services for the Trustees and Trustee committees, and overseeing communications with Janus Henderson Fund shareholders and the activities of other service providers, including monitoring compliance with various policies and procedures of the Janus Henderson Funds and with applicable securities laws and regulations.
In this regard, the independent fee consultant noted that the Adviser provides a number of different services for the Janus Henderson Funds and their shareholders, ranging from investment management services to various other servicing functions, and that, in its view, the Adviser is a capable provider of those services. The independent fee consultant also provided its belief that the Adviser has developed a number of institutional competitive advantages that should enable it to provide superior investment and service performance over the long term.
The Trustees concluded that the nature, extent, and quality of the services provided by the Adviser to each Janus Henderson Fund were appropriate and consistent with the terms of the respective advisory agreements, and that, taking into account steps taken to address those Janus Henderson Funds whose performance lagged that of their peers for certain periods, the Janus Henderson Funds were likely to benefit from the continued provision of those services. They also concluded that the Adviser had sufficient personnel, with the appropriate education and experience, to serve the Janus Henderson Funds effectively and had demonstrated its ability to attract well-qualified personnel.
Performance of the Funds
The Trustees considered the performance results of each Janus Henderson Fund over various time periods. They noted that they considered Janus Henderson Fund performance data throughout the year, including periodic meetings with each Janus Henderson Fund’s portfolio manager(s), and also reviewed information comparing each Janus Henderson Fund’s performance with the performance of comparable fund peer groups identified by Broadridge Financial Solutions, Inc. (“Broadridge”), an independent data provider, and with the Janus Henderson Fund’s benchmark index. In this regard, the independent fee consultant found that the overall Janus Henderson Funds’ performance has been reasonable, noting that: (i) for the 36 months ended May 31, 2022, approximately 38% of the Janus Henderson Funds were in the top two quartiles of their Broadridge peer groups; (ii) for the 36 months ended September 30, 2022, approximately 45% of the Janus Henderson Funds were in the top two quartiles of performance as reported by Morningstar, and (iii) for the 12 months ended September 30, 2022, approximately 55% of the Janus Henderson Funds were in the top two quartiles of performance as reported by Morningstar.
The Trustees considered the performance of each Janus Henderson Fund, noting that performance may vary by share class, and noted the following with respect to the Funds:
Asset Allocation Funds
· For Janus Henderson Global Allocation Fund – Conservative, the Trustees noted that the Fund’s performance was in the third Broadridge quartile for the 36 months ended May 31, 2022 and the bottom Broadridge quartile for the 12 months ended May 31, 2022. The Trustees noted the reasons for the Fund’s underperformance and the steps the Adviser had taken or was taking to improve performance.
· For Janus Henderson Global Allocation Fund – Growth, the Trustees noted that the Fund’s performance was in the bottom Broadridge quartile for the 36 months ended May 31, 2022 and the bottom Broadridge quartile for the 12 months ended May 31, 2022. The Trustees noted the reasons for the Fund’s underperformance and the steps the Adviser had taken or was taking to improve performance.
· For Janus Henderson Global Allocation Fund – Moderate, the Trustees noted that the Fund’s performance was in the bottom Broadridge quartile for the 36 months ended May 31, 2022 and the bottom Broadridge quartile for the 12 months ended May 31, 2022. The Trustees noted the reasons for the Fund’s underperformance and the steps the Adviser had taken or was taking to improve performance.
Fixed-Income Funds
· For Janus Henderson Absolute Return Income Opportunities Fund, the Trustees noted that the Fund’s performance was in the third Broadridge quartile for the 36 months ended May 31, 2022 and the first Broadridge
Janus Henderson Small-Mid Cap Value Fund
Additional Information (unaudited)
quartile for the 12 months ended May 31, 2022. The Trustees noted the reasons for the Fund’s underperformance, the steps the Adviser had taken or was taking to improve performance, and that the performance trend was improving.
· For Janus Developed World Bond Fund, the Trustees noted that the Fund’s performance was in the bottom Broadridge quartile for the 36 months ended May 31, 2022 and the bottom Broadridge quartile for the 12 months ended May 31, 2022. The Trustees noted the reasons for the Fund’s underperformance and the steps the Adviser had taken or was taking to improve performance.
· For Janus Henderson Flexible Bond Fund, the Trustees noted that the Fund’s performance was in the first Broadridge quartile for the 36 months ended May 31, 2022 and the second Broadridge quartile for the 12 months ended May 31, 2022.
· For Janus Henderson Global Bond Fund, the Trustees noted that the Fund’s performance was in the third Broadridge quartile for the 36 months ended May 31, 2022 and the bottom Broadridge quartile for the 12 months ended May 31, 2022. The Trustees noted the reasons for the Fund’s underperformance and the steps the Adviser had taken or was taking to improve performance.
· For Janus Henderson High-Yield Fund, the Trustees noted that the Fund’s performance was in the third Broadridge quartile for the 36 months ended May 31, 2022 and the bottom Broadridge quartile for the 12 months ended May 31, 2022. The Trustees noted the reasons for the Fund’s underperformance and the steps the Adviser had taken or was taking to improve performance.
· For Janus Henderson Multi-Sector Income Fund, the Trustees noted that the Fund’s performance was in the second Broadridge quartile for the 36 months ended May 31, 2022 and the third Broadridge quartile for the 12 months ended May 31, 2022.
· For Janus Henderson Short Duration Flexible Bond Fund, the Trustees noted that the Fund’s performance was in the third Broadridge quartile for the 36 months ended May 31, 2022 and the bottom Broadridge quartile for the 12 months ended May 31, 2022. The Trustees noted the reasons for the Fund’s underperformance and the steps the Adviser had taken or was taking to improve performance.
Global and International Equity Funds
· For Janus Henderson Asia Equity Fund, the Trustees noted that the Fund’s performance was in the third Broadridge quartile for the 36 months ended May 31, 2022 and the third Broadridge quartile for the 12 months ended May 31, 2022. The Trustees noted the reasons for the Fund’s underperformance, while also noting that the Fund has a performance fee structure that results in lower management fees during periods of underperformance, and the steps the Adviser had taken or was taking to improve performance.
· For Janus Henderson Emerging Markets Fund, the Trustees noted that the Fund’s performance was in the third Broadridge quartile for the 36 months ended May 31, 2022 and the third Broadridge quartile for the 12 months ended May 31, 2022. The Trustees noted the reasons for the Fund’s underperformance and the steps the Adviser had taken or was taking to improve performance.
· For Janus Henderson European Focus Fund, the Trustees noted that the Fund’s performance was in the first Broadridge quartile for the 36 months ended May 31, 2022 and the second Broadridge quartile for the 12 months ended May 31, 2022.
· For Janus Henderson Global Equity Income Fund, the Trustees noted that the Fund’s performance was in the third Broadridge quartile for the 36 months ended May 31, 2022 and the first Broadridge quartile for the 12 months ended May 31, 2022. The Trustees noted the reasons for the Fund’s underperformance, the steps the Adviser had taken or was taking to improve performance, and that the performance trend was improving.
· For Janus Henderson Global Life Sciences Fund, the Trustees noted that the Fund’s performance was in the third Broadridge quartile for the 36 months ended May 31, 2022 and the second Broadridge quartile for the 12 months ended May 31, 2022. The Trustees noted the reasons for the Fund’s underperformance, the steps the Adviser had taken or was taking to improve performance, and that the performance trend was improving.
Janus Henderson Small-Mid Cap Value Fund
Additional Information (unaudited)
· For Janus Henderson Global Sustainable Equity Fund, the Trustees noted that the Fund’s performance was in the second Broadridge quartile for the 12 months ended May 31, 2022. The Trustees noted that 36 month-end performance was not yet available.
· For Janus Henderson Global Real Estate Fund, the Trustees noted that the Fund’s performance was in the second Broadridge quartile for the 36 months ended May 31, 2022 and the bottom Broadridge quartile for the 12 months ended May 31, 2022.
· For Janus Henderson Global Research Fund, the Trustees noted that the Fund’s performance was in the second Broadridge quartile for the 36 months ended May 31, 2022 and the first Broadridge quartile for the 12 months ended May 31, 2022.
· For Janus Henderson Global Select Fund, the Trustees noted that the Fund’s performance was in the first Broadridge quartile for the 36 months ended May 31, 2022 and the first Broadridge quartile for the 12 months ended May 31, 2022.
· For Janus Henderson Global Technology and Innovation Fund, the Trustees noted that the Fund’s performance was in the second Broadridge quartile for the 36 months ended May 31, 2022 and the second Broadridge quartile for the 12 months ended May 31, 2022.
· For Janus Henderson International Opportunities Fund, the Trustees noted that the Fund’s performance was in the bottom Broadridge quartile for the 36 months ended May 31, 2022 and the third Broadridge quartile for the 12 months ended May 31, 2022. The Trustees noted the reasons for the Fund’s underperformance and the steps the Adviser had taken or was taking to improve performance.
· For Janus Henderson Overseas Fund, the Trustees noted that the Fund’s performance was in the first Broadridge quartile for the 36 months ended May 31, 2022 and the first Broadridge quartile for the 12 months ended May 31, 2022.
· For Janus Henderson Responsible International Dividend Fund (formerly the Janus Henderson Dividend & Income Builder Fund), the Trustees noted that the Fund’s performance was in the bottom Broadridge quartile for the 36 months ended May 31, 2022 and the bottom Broadridge quartile for the 12 months ended May 31, 2022. The Trustees noted the reasons for the Fund’s underperformance and the steps the Adviser had taken or was taking to improve performance.
Money Market Funds
· For Janus Henderson Government Money Market Fund, the Trustees noted that the Fund’s performance was in the third Broadridge quartile for the 36 months ended May 31, 2022 and the bottom Broadridge quartile for the 12 months ended May 31, 2022. The Trustees noted the reasons for the Fund’s underperformance and the steps the Adviser had taken or was taking to improve performance.
· For Janus Henderson Money Market Fund, the Trustees noted that the Fund’s performance was in the third Broadridge quartile for the 36 months ended May 31, 2022 and the bottom Broadridge quartile for the 12 months ended May 31, 2022. The Trustees noted the reasons for the Fund’s underperformance and the steps the Adviser had taken or was taking to improve performance.
Multi-Asset Funds
· For Janus Henderson Adaptive Global Allocation Fund, the Trustees noted that the Fund’s performance was in bottom Broadridge quartile for the 36 months ended May 31, 2022 and the second Broadridge quartile for the 12 months ended May 31, 2022. The Trustees noted the reasons for the Fund’s underperformance, the steps the Adviser had taken or was taking to improve performance, and that the performance trend was improving.
· For Janus Henderson Balanced Fund, the Trustees noted that the Fund’s performance was in the first Broadridge quartile for the 36 months ended May 31, 2022 and the first Broadridge quartile for the 12 months ended May 31, 2022.
Janus Henderson Small-Mid Cap Value Fund
Additional Information (unaudited)
U.S. Equity Funds
· For Janus Henderson Adaptive Risk Managed U.S. Equity Fund, the Trustees noted that the Fund’s performance was in the bottom Broadridge quartile for the 36 months ended May 31, 2022 and the second Broadridge quartile for the 12 months ended May 31, 2022. The Trustees noted the reasons for the Fund’s underperformance, the steps the Adviser had taken or were taking to improve performance, and that the performance trend was improving.
· For Janus Henderson Contrarian Fund, the Trustees noted that the Fund’s performance was in the first Broadridge quartile for the 36 months ended May 31, 2022 and the bottom Broadridge quartile for the 12 months ended May 31, 2022.
· For Janus Henderson Enterprise Fund, the Trustees noted that the Fund’s performance was in the second Broadridge quartile for the 36 months ended May 31, 2022 and the first Broadridge quartile for the 12 months ended May 31, 2022.
· For Janus Henderson Forty Fund, the Trustees noted that the Fund’s performance was in the third Broadridge quartile for the 36 months ended May 31, 2022 and the bottom Broadridge quartile for the 12 months ended May 31, 2022. The Trustees noted the reasons for the Fund’s underperformance and the steps the Adviser had taken or was taking to improve performance.
· For Janus Henderson Growth and Income Fund, the Trustees noted that the Fund’s performance was in the bottom Broadridge quartile for the 36 months ended May 31, 2022 and the first Broadridge quartile for the 12 months ended May 31, 2022. The Trustees noted the reasons for the Fund’s underperformance, the steps the Adviser had taken or was taking to improve performance, and that the performance trend was improving.
· For Janus Henderson Mid Cap Value Fund, the Trustees noted that the Fund’s performance was in the bottom Broadridge quartile for the 36 months ended May 31, 2022 and the second Broadridge quartile for the 12 months ended May 31, 2022. The Trustees noted the reasons for the Fund’s underperformance, while also noting that the Fund has a performance fee structure that results in lower management fees during periods of underperformance, the steps the Adviser had taken or was taking to improve performance, and that the performance trend was improving.
· For Janus Henderson Research Fund, the Trustees noted that the Fund’s performance was in the third Broadridge quartile for the 36 months ended May 31, 2022 and the third Broadridge quartile for the 12 months ended May 31, 2022. The Trustees noted the reasons for the Fund’s underperformance, while also noting that the Fund has a performance fee structure that results in lower management fees during periods of underperformance and the steps the Adviser had taken or was taking to improve performance.
· For Janus Henderson Small Cap Value Fund, the Trustees noted that the Fund’s performance was in the bottom Broadridge quartile for the 36 months ended May 31, 2022 and the second Broadridge quartile for the 12 months ended May 31, 2022. The Trustees noted the reasons for the Fund’s underperformance, while also noting that the Fund has a performance fee structure that results in lower management fees during periods of underperformance, the steps the Adviser had taken or was taking to improve performance, and that the performance trend was improving.
· For Janus Henderson Small-Mid Cap Value Fund, the Trustees noted that the Fund’s performance was in the bottom Broadridge quartile for the 36 months ended May 31, 2022 and the second Broadridge quartile for the 12 months ended May 31, 2022. The Trustees noted the reasons for the Fund’s underperformance, while also noting that the Fund has a performance fee structure that results in lower management fees during periods of underperformance, the steps the Adviser had taken or was taking to improve performance, and that the performance trend is improving.
· For Janus Henderson Triton Fund, the Trustees noted that the Fund’s performance was in the bottom Broadridge quartile for the 36 months ended May 31, 2022 and the second Broadridge quartile for the 12 months ended May 31, 2022. The Trustees noted the reasons for the Fund’s underperformance, the steps the Adviser had taken or was taking to improve performance, and that the performance trend was improving.
· For Janus Henderson Venture Fund, the Trustees noted that the Fund’s performance was in the bottom Broadridge quartile for the 36 months ended May 31, 2022 and the second Broadridge quartile for the 12 months ended May
Janus Henderson Small-Mid Cap Value Fund
Additional Information (unaudited)
31, 2022. The Trustees noted the reasons for the Fund’s underperformance, the steps the Adviser had taken or was taking to improve performance, and that the performance trend was improving.
In consideration of each Janus Henderson Fund’s performance, the Trustees concluded that, taking into account the factors relevant to performance, as well as other considerations, including steps taken to improve performance, as applicable, the Janus Henderson Fund’s performance warranted continuation of such Janus Henderson Fund’s investment advisory agreement.
Costs of Services Provided
The Trustees examined information regarding the fees and expenses of each Janus Henderson Fund in comparison to similar information for other comparable funds as provided by Broadridge, an independent data provider. They also reviewed an analysis of that information provided by their independent fee consultant. The independent fee consultant provided its belief that the management fees charged by the Adviser to each of the Janus Henderson Funds under the current investment advisory and administration agreements are reasonable in relation to the services provided by the Adviser. The independent fee consultant found: (1) the total expenses and management fees of the Janus Henderson Funds to be reasonable relative to other comparable mutual funds; (2) the total expenses, on average, were 6% under the average total expenses of the respective Broadridge peer group; and (3) the management fees for the Janus Henderson Funds, on average, were 5% under the average management fees for the respective Broadridge peer group. The Trustees also considered the total expenses for each share class of each Janus Henderson Fund compared to the average total expenses for its Broadridge Expense Group and to average total expenses for its Broadridge Expense Universe.
For Janus Henderson Funds with three or more years of performance history, the independent fee consultant also performed a systematic “focus list” analysis of expenses which assessed fund fees in the context of fund performance being delivered. Based on this analysis, the independent fee consultant found that the combination of service quality/performance and expenses on these individual Janus Henderson Funds was reasonable in light of performance trends, performance histories, changes in portfolio management, relative average net asset levels, and the existence of performance fees, breakpoints, and/or expense waivers on such Janus Henderson Funds.
The Trustees considered the methodology used by the Adviser in determining compensation payable to portfolio managers, the competitive environment for investment management talent, and the competitive market for mutual funds in different distribution channels.
The Trustees also reviewed management fees charged by the Adviser to comparable separate account clients and to comparable non-affiliated funds subadvised by the Adviser (for which the Adviser provides only or primarily portfolio management services). Although in most instances subadvisory and separate account fee rates for various investment strategies were lower than management fee rates for Janus Henderson Funds having a similar strategy, the Trustees considered that the Adviser noted that, under the terms of the management agreements with the Janus Henderson Funds, the Adviser performs significant additional services for the Janus Henderson Funds that it does not provide to those other clients, including administration services, oversight of the Janus Henderson Funds’ other service providers, Trustee support, regulatory compliance and numerous other services, and that, in serving the Janus Henderson Funds, the Adviser assumes many legal risks and other costs that it does not assume in servicing its other clients. Moreover, the Trustees noted that the independent fee consultant found that: (1) the management fees the Adviser charges to the Janus Henderson Funds are reasonable in relation to the management fees the Adviser charges to funds subadvised by the Adviser and to the fees the Adviser charges to its institutional separate account clients; (2) these subadvised and institutional separate accounts have different service and infrastructure needs and operate in markets very different from the retail fund market; (3) Janus Henderson mutual fund investors enjoy reasonable fees relative to the fees charged in these other markets; and (4) as part of its 2022 review, 9 of 11 Janus Henderson Funds have lower management fees than similar funds subadvised by the Adviser. The Trustees noted that for the two Janus Henderson Funds that did not, management fees for each were under the average of its 15(c) peer group.
The Trustees considered the fees for each Janus Henderson Fund for its fiscal year ended in 2021 and noted the following with regard to each Janus Henderson Fund’s total expenses, net of applicable fee waivers (the Fund’s “total expenses”) as reflected in the comparative information provided by Broadridge:
Janus Henderson Small-Mid Cap Value Fund
Additional Information (unaudited)
Asset Allocation Funds
· For Janus Henderson Global Allocation Fund – Conservative, the Trustees noted that, although the Fund’s total expenses exceeded the peer group average for certain share classes, overall the Fund’s total expenses were reasonable. The Trustees also noted that the Adviser has contractually agreed to limit the Fund’s expenses.
· For Janus Henderson Global Allocation Fund – Growth, the Trustees noted that, although the Fund’s total expenses exceeded the peer group average for certain share classes, overall the Fund’s total expenses were reasonable. The Trustees also noted that the Adviser has contractually agreed to limit the Fund’s expenses, although this limit did not apply because the Fund’s total expenses as shown were below the applicable fee limit.
· For Janus Henderson Global Allocation Fund – Moderate, the Trustees noted that, although the Fund’s total expenses exceeded the peer group average for one share class, overall the Fund’s total expenses were reasonable. The Trustees also noted that the Adviser has contractually agreed to limit the Fund’s expenses.
Fixed-Income Funds
· For Janus Henderson Absolute Return Income Opportunities Fund, the Trustees noted that, although the Fund’s total expenses exceeded the peer group average for certain share classes, overall the Fund’s total expenses were reasonable. The Trustees also noted that the Adviser has contractually agreed to limit the Fund’s expenses.
· For Janus Henderson Developed World Bond Fund, the Trustees noted that, although the Fund’s total expenses exceeded the peer group average for one share class, overall the Fund’s total expenses were reasonable. The Trustees also noted that the Adviser has contractually agreed to limit the Fund’s expenses.
· For Janus Henderson Flexible Bond Fund, the Trustees noted that, although the Fund’s total expenses exceeded the peer group average for certain share classes, overall the Fund’s total expenses were reasonable. The Trustees also noted that the Adviser has contractually agreed to limit the Fund’s expenses, although this limit did not apply because the Fund’s total expenses as shown were below the applicable fee limit.
· For Janus Henderson Global Bond Fund, the Trustees noted that, although the Fund’s total expenses exceeded the peer group average for certain share classes, overall the Fund’s total expenses were reasonable. The Trustees also noted that the Adviser has contractually agreed to limit the Fund’s expenses.
· For Janus Henderson High-Yield Fund, the Trustees noted that, although the Fund’s total expenses exceeded the peer group average for certain share classes, overall the Fund’s total expenses were reasonable. The Trustees also noted that the Adviser has contractually agreed to limit the Fund’s expenses.
· For Janus Henderson Multi-Sector Income Fund, the Trustees noted that, although the Fund’s total expenses exceeded the peer group average for certain share classes, overall the Fund’s total expenses were reasonable. The Trustees also noted that the Adviser has contractually agreed to limit the Fund’s expenses.
· For Janus Henderson Short Duration Flexible Bond Fund, the Trustees noted that, although the Fund’s total expenses exceeded the peer group average for certain share classes, overall the Fund’s total expenses were reasonable. The Trustees also noted that the Adviser has contractually agreed to limit the Fund’s expenses.
Global and International Equity Funds
· For Janus Henderson Asia Equity Fund, the Trustees noted that, although the Fund’s total expenses exceeded the peer group average for certain share classes, overall the Fund’s total expenses were reasonable. The Trustees also noted that the Adviser has contractually agreed to limit the Fund’s expenses.
· For Janus Henderson Emerging Markets Fund, the Trustees noted that, although the Fund’s total expenses exceeded the peer group average for certain share classes, overall the Fund’s total expenses were reasonable. The Trustees also noted that the Adviser has contractually agreed to limit the Fund’s expenses.
· For Janus Henderson European Focus Fund, the Trustees noted that, although the Fund’s total expenses exceeded the peer group average for one share class, overall the Fund’s expenses were reasonable. The Trustees also noted that the Adviser has contractually agreed to limit the Fund’s expenses.
· For Janus Henderson Global Equity Income Fund, the Trustees noted that, although the Fund’s total expenses exceeded the peer group average for one share class, overall the Fund’s total expenses were reasonable. The
Janus Henderson Small-Mid Cap Value Fund
Additional Information (unaudited)
Trustees also noted that the Adviser has contractually agreed to limit the Fund’s expenses, although this limit did not apply because the Fund’s total expenses as shown were below the applicable fee limit.
· For Janus Henderson Global Life Sciences Fund, the Trustees noted that the Fund’s total expenses were below the peer group average for all share classes.
· For Janus Henderson Global Real Estate Fund, the Trustees noted that, although the Fund’s total expenses exceeded the peer group average for certain share classes, overall the Fund’s total expenses were reasonable. The Trustees also noted that the Adviser has contractually agreed to limit the Fund’s expenses, although this limit did not apply because the Fund’s total expenses as shown were below the applicable fee limit.
· For Janus Henderson Global Research Fund, the Trustees noted that, although the Fund’s total expenses exceeded the peer group average for one share class, overall the Fund’s total expenses were reasonable. The Trustees also noted that the Adviser has contractually agreed to limit the Fund’s expenses, although this limit did not apply because the Fund’s total expenses as shown were below the applicable fee limit.
· For Janus Henderson Global Select Fund, the Trustees noted that, although the Fund’s total expenses exceeded the peer group average for certain share classes, overall the Fund’s total expenses were reasonable. The Trustees also noted that the Adviser has contractually agreed to limit the Fund’s expenses.
· For Janus Henderson Global Sustainable Equity Fund, the Trustees noted that, although the Fund’s total expenses exceeded the peer group average for certain share classes, overall the Fund’s expenses were reasonable. The Trustees also noted that the Adviser has contractually agreed to limit the Fund’s expenses.
· For Janus Henderson Global Technology and Innovation Fund, the Trustees noted that the Fund’s total expenses were below the peer group average for all share classes.
· For Janus Henderson International Opportunities Fund, the Trustees noted that, although the Fund’s total expenses exceeded the peer group average for certain share classes, overall the Fund’s expenses were reasonable. The Trustees also noted that the Adviser has contractually agreed to limit the Fund’s expenses.
· For Janus Henderson Overseas Fund, the Trustees noted that although the Fund’s total expenses exceeded the peer group average for certain share classes, overall the Fund’s total expenses were reasonable. The Trustees also noted that the Adviser has contractually agreed to limit the Fund’s expenses, although this limit did not apply because the Fund’s total expenses as shown were below the applicable fee limit.
· For Janus Henderson Responsible International Dividend Fund (formerly the Janus Henderson Dividend & Income Builder Fund), the Trustees noted that, although the Fund’s total expenses exceeded the peer group for one share class, overall the Fund’s total expenses were reasonable. The Trustees also noted that the Adviser has contractually agreed to limit the Fund’s expenses.
Money Market Funds
· For Janus Henderson Government Money Market Fund, the Trustees noted that the Fund’s total expenses were below the peer group average for all share classes.
· For Janus Henderson Money Market Fund, the Trustees noted that the Fund’s total expenses were below the peer group average for all share classes.
Multi-Asset Funds
· For Janus Henderson Adaptive Global Allocation Fund, the Trustees noted that the Fund’s total expenses were below the peer group average for all share classes.
· For Janus Henderson Balanced Fund, the Trustees noted that, although the Fund’s total expenses exceeded the peer group average for certain share classes, overall the Fund’s total expenses were reasonable. The Trustees also noted that the Adviser has contractually agreed to limit the Fund’s expenses, although this limit did not apply because the Fund’s total expenses as shown were below the applicable fee limit.
Janus Henderson Small-Mid Cap Value Fund
Additional Information (unaudited)
U.S. Equity Funds
· For Janus Henderson Adaptive Risk Managed U.S. Equity Fund, the Trustees noted that, although the Fund’s total expenses exceeded the peer group average for certain share classes, overall the Fund’s total expenses were reasonable. The Trustees also noted that the Adviser has contractually agreed to limit the Fund’s expenses, although this limit did not apply because the Fund’s total expenses as shown were below the applicable fee limit.
· For Janus Henderson Contrarian Fund, the Trustees noted that, although the Fund’s total expenses exceeded the peer group average for all share classes, overall the Fund’s total expenses were reasonable. The Trustees also noted that the Adviser had contractually agreed to limit the Fund’s expenses.
· For Janus Henderson Enterprise Fund, the Trustees noted that, although the Fund’s total expenses exceeded the peer group average for certain share classes, overall the Fund’s total expenses were reasonable. The Trustees also noted that the Adviser has contractually agreed to limit the Fund’s expenses, although this limit did not apply because the Fund’s total expenses as shown were below the applicable fee limit.
· For Janus Henderson Forty Fund, the Trustees noted that, although the Fund’s total expenses exceeded the peer group average for certain share classes, overall the Fund’s total expenses were reasonable. The Trustees also noted that the Adviser has contractually agreed to limit the Fund’s expenses, although this limit did not apply because the Fund’s total expenses as shown were below the applicable fee limit.
· For Janus Henderson Growth and Income Fund, the Trustees noted that, although the Fund’s total expenses exceeded the peer group average for certain share classes, overall the Fund’s total expenses were reasonable. The Trustees also noted that the Adviser has contractually agreed to limit the Fund’s expenses, although this limit did not apply because the Fund’s total expenses as shown were below the applicable fee limit.
· For Janus Henderson Mid Cap Value Fund, the Trustees noted that the Fund’s total expenses were below the peer group average for all share classes.
· For Janus Henderson Research Fund, the Trustees noted that, although the Fund’s total expenses exceeded the peer group average for certain share classes, overall the Fund’s total expenses were reasonable. The Trustees also noted that the Adviser has contractually agreed to limit the Fund’s expenses.
· For Janus Henderson Small Cap Value Fund, the Trustees noted that, although the Fund’s total expenses exceeded the peer group average for one share class, overall the Fund’s total expenses were reasonable. The Trustees also noted that the Adviser has contractually agreed to limit the Fund’s expenses, although this limit did not apply because the Fund’s total expenses as shown were below the applicable fee limit.
· For Janus Henderson Small-Mid Cap Value Fund, the Trustees noted that the Fund’s total expenses were below the peer group average for all share classes.
· For Janus Henderson Triton Fund, the Trustees noted that, although the Fund’s total expenses exceeded the peer group average for one share class, overall the Fund’s total expenses were reasonable. The Trustees also noted that the Adviser has contractually agreed to limit the Fund’s expenses, although this limit did not apply because the Fund’s total expenses as shown were below the applicable fee limit.
· For Janus Henderson Venture Fund, the Trustees noted that although the Fund’s total expenses exceeded the peer group average for one share class, overall the Fund’s total expenses were reasonable. The Trustees also noted that the Adviser has contractually agreed to limit the Fund’s expenses, although this limit did not apply because the Fund’s total expenses as shown were below the applicable fee limit.
The Trustees reviewed information on the overall profitability to the Adviser and its affiliates from their relationships with the Janus Henderson Funds, and considered profitability data of other publicly traded mutual fund advisers. The Trustees recognized that profitability comparisons among fund managers are difficult because of the variation in the type of comparative information that is publicly available, and the profitability of any fund manager is affected by numerous factors, including the organizational structure of the particular fund manager, differences in complex size, difference in product mix, difference in types of business (mutual fund, institutional and other), differences in the types of funds and other accounts it manages, possible other lines of business, the methodology for allocating expenses and the fund manager’s capital structure and cost of capital.
Janus Henderson Small-Mid Cap Value Fund
Additional Information (unaudited)
Additionally, the Trustees considered the estimated profitability to the Adviser from the investment management services it provided to each Janus Henderson Fund. In their review, the Trustees considered whether the Adviser receive adequate incentives and resources to manage the Janus Henderson Funds effectively. In reviewing profitability, the Trustees noted that the estimated profitability for an individual Janus Henderson Fund is necessarily a product of the allocation methodology utilized by the Adviser to allocate its expenses as part of the estimated profitability calculation. In this regard, the Trustees noted that the independent fee consultant found as part of its 2022 review that (1) the expense allocation methodology and rationales utilized by the Adviser were reasonable and (2) no clear correlation exists between expense allocations and operating margins. The Trustees also considered that the estimated profitability for an individual Janus Henderson Fund was influenced by a number of factors, including not only the allocation methodology selected, but also the presence of fee waivers and expense caps, and whether the Janus Henderson Fund’s investment management agreement contained breakpoints or a performance fee component. The Trustees determined, after taking into account these factors, among others, that the Adviser’s estimated profitability with respect to each Janus Henderson Fund was not unreasonable in relation to the services provided, and that the variation in the range of such estimated profitability among the Janus Henderson Funds was not a material factor in the Board’s approval of the reasonableness of any Janus Henderson Fund’s investment management fees.
The Trustees concluded that the management fees payable by each Janus Henderson Fund to the Adviser were reasonable in relation to the nature, extent, and quality of the services provided, taking into account the fees charged by other advisers for managing comparable mutual funds with similar strategies, the fees the Adviser charges to other clients, and, as applicable, the impact of fund performance on management fees payable by the Janus Henderson Funds. The Trustees also concluded that each Janus Henderson Fund’s total expenses were reasonable, taking into account the size of the Janus Henderson Fund, the quality of services provided by the Adviser, the investment performance of the Janus Henderson Fund, and any expense limitations agreed to or provided by the Adviser.
Economies of Scale
The Trustees considered information about the potential for the Adviser to realize economies of scale as the assets of the Janus Henderson Funds increase. They noted that their independent fee consultant published a report to the Trustees in June 2022 which provided its research and analysis into economies of scale. They also noted that, although many Janus Henderson Funds pay advisory fees at a fixed base rate as a percentage of net assets, without any breakpoints or performance fees, their independent fee consultant concluded that 75% of these Janus Henderson Funds’ have contractual management fees (gross of waivers) below their Broadridge Expense Group averages. The Trustees also noted the following from the independent fee consultant’s report: (1) that 31% of Janus Henderson Funds had management fee breakpoints in place whereby investors pay lower management fees as fund AUM increases; (2) that 29% of Janus Henderson Funds have low flat-rate fees and performance fees where the Adviser is incentivized to invest in resources which drive Janus Henderson Fund performance; and (3) that 39% of Janus Henderson Funds have low flat-rate fees versus peers where investors pay low fixed fees when the Janus Henderson Fund is small/midsized and higher fees when the Janus Henderson Fund grows in assets. The Trustees also noted that the Janus Henderson Funds share directly in economies of scale through the significant investments made by the Adviser and its affiliates related to services provided to the Funds and the lower charges of third-party service providers that are based in part on the combined scale of all of the Janus Henderson Funds.
The Trustees also considered the independent fee consultant’s conclusion that, given the limitations of various analytical approaches to economies of scale and their conflicting results, it is difficult to analytically confirm or deny the existence of economies of scale in the Janus Henderson complex. In this regard, the independent consultant concluded that (1) to the extent there were economies of scale at the Adviser, the Adviser’s general strategy of setting fixed management fees below peers appeared to share any such economies with investors even on smaller Janus Henderson Funds which have not yet achieved those economies and (2) by setting lower fixed fees from the start on these Janus Henderson Funds, the Adviser appeared to be investing to increase the likelihood that these Janus Henderson Funds will grow to a level to achieve any economies of scale that may exist. Further, the independent fee consultant provided its belief that Janus Henderson Fund investors are well-served by the fee levels and performance fee structures in place on the Janus Henderson Funds in light of any economies of scale that may be present at the Adviser.
Based on all of the information reviewed, including the recent and past research and analysis conducted by the Trustees’ independent fee consultant, the Trustees concluded that the current fee structure of each Janus Henderson Fund was reasonable and that the current rates of fees do reflect a sharing between the Adviser and the Janus
Janus Henderson Small-Mid Cap Value Fund
Additional Information (unaudited)
Henderson Fund of any economies of scale that may be present at the current asset level of the Janus Henderson Fund.
Other Benefits to the Adviser
The Trustees also considered benefits that accrue to the Adviser and its affiliates from their relationships with the Janus Henderson Funds. They recognized that two affiliates of the Adviser separately serve the Janus Henderson Funds as transfer agent and distributor, respectively, and the transfer agent receives compensation directly from the non-money market Janus Henderson Funds for services provided, and that such compensation contributes to the overall profitability of the Adviser and its affiliates that results from their relationship with the Janus Henderson Funds. The Trustees also considered the Adviser’s past and proposed use of commissions paid by the Janus Henderson Funds on portfolio brokerage transactions to obtain proprietary and third-party research products and services benefiting the Janus Henderson Fund and/or other clients of the Adviser and/or the Adviser. The Trustees concluded that the Adviser’s use of these types of client commission arrangements to obtain proprietary and third-party research products and services was consistent with regulatory requirements and guidelines and was likely to benefit each Janus Henderson Fund. The Trustees also concluded that, other than the services provided by the Adviser and its affiliates pursuant to the agreements and the fees to be paid by each Janus Henderson Fund therefor, the Janus Henderson Funds and the Adviser may potentially benefit from their relationship with each other in other ways. They concluded that the Adviser and its affiliates share directly in economies of scale through the lower charges of third-party service providers that are based in part on the combined scale of the Janus Henderson Funds and other clients serviced by the Adviser and its affiliates. They also concluded that the Adviser benefits from the receipt of research products and services acquired through commissions paid on portfolio transactions of the Janus Henderson Funds and that the Janus Henderson Funds benefit from the Adviser’s receipt of those products and services as well as research products and services acquired through commissions paid by other clients of the Adviser. They further concluded that the success of any Janus Henderson Fund could attract other business to the Adviser or other Janus Henderson Funds, and that the success of the Adviser could enhance the Adviser’s ability to serve the Janus Henderson Funds.
Janus Henderson Small-Mid Cap Value Fund
Liquidity Risk Management Program (unaudited)
Liquidity Risk Management Program
Rule 22e-4 under the Investment Company Act of 1940, as amended (the “Liquidity Rule”), requires open-end funds (but not money market funds) to adopt and implement a written liquidity risk management program (the “LRMP”) that is reasonably designed to assess and manage liquidity risk, which is the risk that a fund could not meet redemption requests without significant dilution of remaining investors’ interest in the fund. The Fund has implemented a LRMP, which incorporates the following elements: (i) assessment, management, and periodic review of liquidity risk; (ii) classification of portfolio holdings; (iii) the establishment and monitoring of a highly liquid investment minimum, as applicable; (iv) a 15% limitation on a Fund’s illiquid investments; (v) redemptions in-kind; and (vi) board oversight.
The Trustees of the Fund (the “Trustees”) have designated Janus Henderson Investors US LLC, the Fund’s investment adviser (the “Adviser”), as the Program Administrator for the LRMP responsible for administering the LRMP and carrying out the specific responsibilities of the LRMP. A working group comprised of various teams within the Adviser’s business is responsible for administering the LRMP and carrying out the specific responsibilities of different aspects of the LRMP (the “Liquidity Risk Working Group”). In assessing each Fund’s liquidity risk, the Liquidity Risk Working Group periodically considers, as relevant, factors including (i) the liquidity of a Fund’s portfolio investments during normal and reasonably foreseeable stressed conditions; (ii) whether a Fund’s investment strategy is appropriate for an open-end fund; (iii) the extent to which a Fund’s strategy involves a relatively concentrated portfolio or large positions in any issuer; (iv) a Fund’s use of borrowing for investment purposes; and (v) a Fund’s use of derivatives.
The Liquidity Rule requires the Trustees to review at least annually a written report provided by the Program Administrator that addresses the operation of the LRMP and assesses its adequacy and the effectiveness of its implementation, including, if applicable, the operation of the highly liquid investment minimum, and any material changes to the LRMP (the “Program Administrator Report”). At a meeting held on March 15, 2023, the Adviser provided the Program Administrator Report to the Trustees which covered the operation of the LRMP from January 1, 2022 through December 31, 2022 (the “Reporting Period”).
The Program Administrator Report discussed the operation and effectiveness of the LRMP during the Reporting Period. Among other things, the Program Administrator Report indicated that there were no material changes to the LRMP during the Reporting Period, although there were certain methodology adjustments implemented relating to a change in data provider. Additionally, the findings presented in the Program Administrator Report indicated that the LRMP operated adequately during the Reporting Period. These findings included that the Fund was able to meet redemptions during the normal course of business during the Reporting Period. The Program Administrator Report also stated that the Fund did not exceed the 15% limit on illiquid assets during the Reporting Period, that the Fund held primarily highly liquid assets, and was considered to be a primarily highly liquid fund during the Reporting Period. Also included among the Program Administrator Report’s findings was the determination that the Fund’s investment strategy remains appropriate for an open-end fund. In addition, the Adviser expressed its belief in the Program Administrator Report that the LRMP is reasonably designed and adequate to assess and manage the Fund’s liquidity risk, considering the Fund’s particular risks and circumstances, and includes policies and procedures reasonably designed to implement each required component of the Liquidity Rule.
There can be no assurance that the LRMP will achieve its objectives in the future. Please refer to your Fund’s prospectus for more information regarding the risks to which an investment in the Fund may be subject.
Janus Henderson Small-Mid Cap Value Fund
Useful Information About Your Fund Report (unaudited)
Management Commentary
The Management Commentary in this report includes valuable insight as well as statistical information to help you understand how your Fund’s performance and characteristics stack up against those of comparable indices.
If the Fund invests in foreign securities, this report may include information about country exposure. Country exposure is based primarily on the country of risk. A company may be allocated to a country based on other factors such as location of the company’s principal office, the location of the principal trading market for the company’s securities, or the country where a majority of the company’s revenues are derived.
Please keep in mind that the opinions expressed in the Management Commentary are just that: opinions. They are a reflection based on best judgment at the time this report was compiled, which was June 30, 2023. As the investing environment changes, so could opinions. These views are unique and are not necessarily shared by fellow employees or by Janus Henderson in general.
Performance Overviews
Performance overview graphs compare the performance of a hypothetical $10,000 investment in the Fund with one or more widely used market indices. When comparing the performance of the Fund with an index, keep in mind that market indices are not available for investment and do not reflect deduction of expenses.
Average annual total returns are quoted for a Fund with more than one year of performance history. Average annual total return is calculated by taking the growth or decline in value of an investment over a period of time, including reinvestment of dividends and distributions, then calculating the annual compounded percentage rate that would have produced the same result had the rate of growth been constant throughout the period. Average annual total return does not reflect the deduction of taxes that a shareholder would pay on Fund distributions or redemptions of Fund shares.
Cumulative total returns are quoted for a Fund with less than one year of performance history. Cumulative total return is the growth or decline in value of an investment over time, independent of the period of time involved. Cumulative total return does not reflect the deduction of taxes that a shareholder would pay on Fund distributions or redemptions of Fund shares.
Pursuant to federal securities rules, expense ratios shown in the performance chart reflect subsidized (if applicable) and unsubsidized ratios. The total annual fund operating expenses ratio is gross of any fee waivers, reflecting the Fund’s unsubsidized expense ratio. The net annual fund operating expenses ratio (if applicable) includes contractual waivers of the Adviser and reflects the Fund’s subsidized expense ratio. Ratios may be higher or lower than those shown in the “Financial Highlights” in this report.
Schedule of Investments
Following the performance overview section is the Fund’s Schedule of Investments. This schedule reports the types of securities held in the Fund on the last day of the reporting period. Securities are usually listed by type (common stock, corporate bonds, U.S. Government obligations, etc.) and by industry classification (banking, communications, insurance, etc.). Holdings are subject to change without notice.
The value of each security is quoted as of the last day of the reporting period. The value of securities denominated in foreign currencies is converted into U.S. dollars.
If the Fund invests in foreign securities, it will also provide a summary of investments by country. This summary reports the Fund exposure to different countries by providing the percentage of securities invested in each country. The country of each security represents the country of risk. The Fund’s Schedule of Investments relies upon the industry group and country classifications published by Bloomberg and/or MSCI Inc.
Tables listing details of individual forward currency contracts, futures, written options, swaptions, and swaps follow the Fund’s Schedule of Investments (if applicable).
Statement of Assets and Liabilities
This statement is often referred to as the “balance sheet.” It lists the assets and liabilities of the Fund on the last day of the reporting period.
Janus Henderson Small-Mid Cap Value Fund
Useful Information About Your Fund Report (unaudited)
The Fund’s assets are calculated by adding the value of the securities owned, the receivable for securities sold but not yet settled, the receivable for dividends declared but not yet received on securities owned, and the receivable for Fund shares sold to investors but not yet settled. The Fund’s liabilities include payables for securities purchased but not yet settled, Fund shares redeemed but not yet paid, and expenses owed but not yet paid. Additionally, there may be other assets and liabilities such as unrealized gain or loss on forward currency contracts.
The section entitled “Net Assets Consist of” breaks down the components of the Fund’s net assets. Because the Fund must distribute substantially all earnings, you will notice that a significant portion of net assets is shareholder capital.
The last section of this statement reports the net asset value (“NAV”) per share on the last day of the reporting period. The NAV is calculated by dividing the Fund’s net assets for each share class (assets minus liabilities) by the number of shares outstanding.
Statement of Operations
This statement details the Fund’s income, expenses, realized gains and losses on securities and currency transactions, and changes in unrealized appreciation or depreciation of Fund holdings.
The first section in this statement, entitled “Investment Income,” reports the dividends earned from securities and interest earned from interest-bearing securities in the Fund.
The next section reports the expenses incurred by the Fund, including the advisory fee paid to the investment adviser, transfer agent fees and expenses, and printing and postage for mailing statements, financial reports and prospectuses. Expense offsets and expense reimbursements, if any, are also shown.
The last section lists the amounts of realized gains or losses from investment and foreign currency transactions, and changes in unrealized appreciation or depreciation of investments and foreign currency-denominated assets and liabilities. The Fund will realize a gain (or loss) when it sells its position in a particular security. A change in unrealized gain (or loss) refers to the change in net appreciation or depreciation of the Fund during the reporting period. “Net Realized and Unrealized Gain/(Loss) on Investments” is affected both by changes in the market value of Fund holdings and by gains (or losses) realized during the reporting period.
Statements of Changes in Net Assets
These statements report the increase or decrease in the Fund’s net assets during the reporting period. Changes in the Fund’s net assets are attributable to investment operations, dividends and distributions to investors, and capital share transactions. This is important to investors because it shows exactly what caused the Fund’s net asset size to change during the period.
The first section summarizes the information from the Statement of Operations regarding changes in net assets due to the Fund’s investment operations. The Fund’s net assets may also change as a result of dividend and capital gains distributions to investors. If investors receive their dividends and/or distributions in cash, money is taken out of the Fund to pay the dividend and/or distribution. If investors reinvest their dividends and/or distributions, the Fund’s net assets will not be affected.
The reinvestment of dividends and distributions is included under “Capital Share Transactions.” “Capital Shares” refers to the money investors contribute to the Fund through purchases or withdrawals via redemptions. The Fund’s net assets will increase and decrease in value as investors purchase and redeem shares from the Fund.
Financial Highlights
This schedule provides a per-share breakdown of the components that affect the Fund’s NAV for current and past reporting periods as well as total return, asset size, ratios, and portfolio turnover rate.
The first line in the table reflects the NAV per share at the beginning of the reporting period. The next line reports the net investment income/(loss) per share. Following is the per share total of net gains/(losses), realized and unrealized. Per share dividends and distributions to investors are then subtracted to arrive at the NAV per share at the end of the period. The next line reflects the total return for the period. The total return may include adjustments in accordance with generally accepted accounting principles required at the period end for financial reporting purposes. As a result, the total return may differ from the total return reflected for individual shareholder transactions. Also included are ratios of expenses and net investment income to average net assets.
Janus Henderson Small-Mid Cap Value Fund
Useful Information About Your Fund Report (unaudited)
The Fund’s expenses may be reduced through expense offsets and expense reimbursements. The ratios shown reflect expenses before and after any such offsets and reimbursements.
The ratio of net investment income/(loss) summarizes the income earned less expenses, divided by the average net assets of the Fund during the reporting period. Do not confuse this ratio with the Fund’s yield. The net investment income ratio is not a true measure of the Fund’s yield because it does not take into account the dividends distributed to the Fund’s investors.
The next figure is the portfolio turnover rate, which measures the buying and selling activity in the Fund. Portfolio turnover is affected by market conditions, changes in the asset size of the Fund, fluctuating volume of shareholder purchase and redemption orders, the nature of the Fund’s investments, and the investment style and/or outlook of the portfolio manager(s) and/or investment personnel. A 100% rate implies that an amount equal to the value of the entire portfolio was replaced once during the fiscal year; a 50% rate means that an amount equal to the value of half the portfolio is traded in a year; and a 200% rate means that an amount equal to the value of the entire portfolio is traded every six months.
Janus Henderson Small-Mid Cap Value Fund
Designation Requirements (unaudited)
For federal income tax purposes, the Fund designated the following for the year ended June 30, 2023:
| | |
| | |
Section 163(j) Interest Dividend | 5% |
Dividends Received Deduction Percentage | 100% |
Qualified Dividend Income Percentage | 100% |
Janus Henderson Small-Mid Cap Value Fund
Trustees and Officers (unaudited)
The following are the Trustees and officers of the Trust, together with a brief description of their principal occupations during the last five years (principal occupations for certain Trustees may include periods over five years). The Fund’s Statement of Additional Information includes additional information about the Trustees and officers and is available, without charge, by calling 1-877-335-2687.
Each Trustee has served in that capacity since he or she was originally elected or appointed. The Trustees do not serve a specified term of office. Each Trustee will hold office until the termination of the Trust or his or her earlier death, resignation, retirement, incapacity, or removal. Under the Fund’s Governance Procedures and Guidelines, the policy is for Trustees to retire no later than the end of the calendar year in which the Trustee turns 75. The Trustees review the Fund’s Governance Procedures and Guidelines from time to time and may make changes they deem appropriate. The Fund’s Nominating and Governance Committee will consider nominees for the position of Trustee recommended by shareholders. Shareholders may submit the name of a candidate for consideration by the Committee by submitting their recommendations to the Trust’s Secretary. Each Trustee is currently a Trustee of one other registered investment company advised by the Adviser: Janus Aspen Series. Collectively, these two registered investment companies consist of 49 series or funds referred to herein as the Fund Complex.
The Trust’s officers are elected annually by the Trustees for a one-year term. Certain officers also serve as officers of Janus Aspen Series. Certain officers of the Fund may also be officers and/or directors of the Adviser. Except as otherwise disclosed, Fund officers receive no compensation from the Fund, except for the Fund’s Chief Compliance Officer, as authorized by the Trustees.
| | | | | | |
TRUSTEES |
Name, Address, and Age | Positions Held with the Trust | Length of Time Served | Principal Occupations During the Past Five Years | Number of Portfolios/Funds in Fund Complex Overseen by Trustee | Other Directorships Held by Trustee During the Past Five Years |
Independent Trustees | | | | |
Alan A. Brown
151 Detroit Street
Denver, CO 80206
DOB: 1962 | Chairman
Trustee | 5/22-Present
1/13-Present | Principal, Curam Holdings LLC (since 2018). Formerly, Executive Vice President, Institutional Markets, of Black Creek Group (private equity real estate investment management firm) (2012-2018), Executive Vice President and Co-Head, Global Private Client Group (2007-2010), Executive Vice President, Mutual Funds (2005-2007), and Chief Marketing Officer (2001-2005) of Nuveen Investments, Inc. (asset management). | 49 | Advisory Board Member of AEW Core Property Trust (open-end property fund) (since 2020), and Director of WTTW (PBS affiliate) (since 2003). Formerly, Director of MotiveQuest LLC (strategic social market research company) (2003-2016), Director of Nuveen Global Investors LLC (2007-2011), Director of Communities in Schools (2004-2010), and Director of Mutual Fund Education Alliance (until 2010). |
Janus Henderson Small-Mid Cap Value Fund
Trustees and Officers (unaudited)
| | | | | | |
TRUSTEES |
Name, Address, and Age | Positions Held with the Trust | Length of Time Served | Principal Occupations During the Past Five Years | Number of Portfolios/Funds in Fund Complex Overseen by Trustee | Other Directorships Held by Trustee During the Past Five Years |
Independent Trustees | | | | |
Cheryl D. Alston
151 Detroit Street
Denver, CO 80206
DOB: 1966 | Trustee | 8/22-Present | Executive Director and Chief Investment Officer, Employees’ Retirement Fund of the City of Dallas (since 2004). | 49 | Director of Blue Cross Blue Shield of Kansas City (a not-for-profit health insurance provider) (since 2016) and Director of Global Life Insurance (life and supplemental health insurance provider) (since 2017). Formerly, Director of Federal Home Loan Bank of Dallas (2017-2021). |
Janus Henderson Small-Mid Cap Value Fund
Trustees and Officers (unaudited)
| | | | | | |
TRUSTEES |
Name, Address, and Age | Positions Held with the Trust | Length of Time Served | Principal Occupations During the Past Five Years | Number of Portfolios/Funds in Fund Complex Overseen by Trustee | Other Directorships Held by Trustee During the Past Five Years |
Independent Trustees | | | | |
Janus Henderson Small-Mid Cap Value Fund
Trustees and Officers (unaudited)
| | | | | | |
William D. Cvengros
151 Detroit Street
Denver, CO 80206
DOB: 1948 | Trustee | 1/11-Present | Chief Executive Officer of SJC Capital, LLC (a personal investment company and consulting firm) (since 2002). Formerly, Chief Executive Officer and President of PIMCO Advisors Holdings L.P. (a publicly traded investment management firm) (1994-2000), and Chief Investment Officer (1987-1994) and Vice Chairman and Director (1990-1994) of Pacific Life Insurance Company (a mutual life insurance and annuity company) (1987-1994). | 49 | Member, Limited Partner Advisory Committee, Karmel Capital Fund III (later stage growth fund) (since 2022), Member of the Investment Committee for the Orange County Community Foundation (a grantmaking foundation) (since 2020), Advisory Board Member, RevOZ Fund LP and related funds (real estate investments for opportunity zones) (since 2020), and Advisory Board Member, Innovate Partners Emerging Growth and Equity Fund I (early stage venture capital fund) (since 2014). Formerly, Managing Trustee of National Retirement Partners Liquidating Trust (2013-2016), Chairman, National Retirement Partners, Inc. (formerly a network of advisors to 401(k) plans) (2005-2013), Director of Prospect Acquisition Corp. (a special purpose acquisition corporation) (2007-2009), Director of RemedyTemp, Inc. (temporary help services company) (1996-2006), and Trustee of PIMCO Funds Multi-Manager Series (1990-2000) and Pacific Life Variable Life & Annuity Trusts (1987-1994). |
Janus Henderson Small-Mid Cap Value Fund
Trustees and Officers (unaudited)
| | | | | | |
TRUSTEES |
Name, Address, and Age | Positions Held with the Trust | Length of Time Served | Principal Occupations During the Past Five Years | Number of Portfolios/Funds in Fund Complex Overseen by Trustee | Other Directorships Held by Trustee During the Past Five Years |
Independent Trustees | | | | |
Raudline Etienne
151 Detroit Street
Denver, CO 80206
DOB: 1965 | Trustee | 6/16-Present | Founder, Daraja Capital (advisory and investment firm) (since 2016). Formerly, Senior Vice President and Senior Advisor, Albright Stonebridge Group LLC (global strategy firm) (2011-2021), and Deputy Comptroller and Chief Investment Officer, New York State Common Retirement Fund (public pension fund) (2008-2011). | 49 | Member of the Investment Committee for Cooper Union (private college) (since 2021) and Director of Brightwood Capital Advisors, LLC (since 2014). Formerly, Board Member, Van Alen Institute (nonprofit architectural and design organization) (2019-2022). |
Darrell B. Jackson
151 Detroit Street
Denver, CO 80206
DOB: 1958 | Trustee | 8/22-Present | President and Chief Executive Officer, The Efficace Group Inc. (since 2018). Formerly, President and Chief Executive Officer, Seaway Bank and Trust Company (community bank) (2014-2015), and Executive Vice President and Co-President, Wealth Management (2009-2014), and several senior positions, including Group Executive, Senior Vice President, and Vice President (1995-2009) of Northern Trust Company (financial services company) (1995-2014). | 49 | Director of Amalgamated Financial Corp (bank) (since August 2021), Director of YR Media (a not-for-profit production company) (since 2021), and Director of Gray-Bowen-Scott (transportation project consulting firm) (since April 2020). Formerly, Director of Delaware Place Bank (closely held commercial bank) (2016-2018) and Director of Seaway Bank and Trust Company (2014-2015). |
Janus Henderson Small-Mid Cap Value Fund
Trustees and Officers (unaudited)
| | | | | | |
TRUSTEES |
Name, Address, and Age | Positions Held with the Trust | Length of Time Served | Principal Occupations During the Past Five Years | Number of Portfolios/Funds in Fund Complex Overseen by Trustee | Other Directorships Held by Trustee During the Past Five Years |
Independent Trustees | | | | |
William F. McCalpin
151 Detroit Street
Denver, CO 80206
DOB: 1957 | Trustee | 6/02-Present | Chief Executive Officer, muun chi LLC (organic food business) (since 2022) and Independent Consultant (since 2019). Formerly, Chief Operating Officer, muun chi LLC (2020-2022), Managing Partner, Impact Investments, Athena Capital Advisors LLC (independent registered investment advisor) (2016-2019), Managing Director, Holos Consulting LLC (provides consulting services to foundations and other nonprofit organizations) (2009-2016), Chief Executive Officer, Imprint Capital Advisors (impact investment firm) (2013-2015), and Executive Vice President and Chief Operating Officer of The Rockefeller Brothers Fund (a private family foundation) (1998-2006). | 49 | Chairman of the Board and Trustee of The Investment Fund for Foundations Investment Program (TIP) (consisting of 1 fund) (since 2008). Formerly, Director of the F.B. Heron Foundation (a private grantmaking foundation) (2006-2022), and Director of Mutual Fund Directors Forum (a non-profit organization serving independent directors of U.S. mutual funds) (2016-2021). |
Janus Henderson Small-Mid Cap Value Fund
Trustees and Officers (unaudited)
| | | | | | |
TRUSTEES |
Name, Address, and Age | Positions Held with the Trust | Length of Time Served | Principal Occupations During the Past Five Years | Number of Portfolios/Funds in Fund Complex Overseen by Trustee | Other Directorships Held by Trustee During the Past Five Years |
Independent Trustees | | | | |
Gary A. Poliner
151 Detroit Street
Denver, CO 80206
DOB: 1953 | Trustee | 6/16-Present | Retired. Formerly, President (2010-2013) of Northwestern Mutual Life Insurance Company. | 49 | Director of MGIC Investment Corporation (private mortgage insurance) (since 2013). Formerly, Director, West Bend Mutual Insurance Company (property/casualty insurance) (2013-2021), Trustee of Northwestern Mutual Life Insurance Company (2010-2013) and Director of Frank Russell Company (global asset management firm) (2008-2013). |
Diane L. Wallace
151 Detroit Street
Denver, CO 80206
DOB: 1958 | Trustee | 6/17-Present | Retired. Formerly, Chief Operating Officer, Senior Vice President-Operations, and Chief Financial Officer for Driehaus Capital Management, LLC (1988-2006) and Treasurer for Driehaus Mutual Funds (1996-2002). | 49 | Formerly, Director of Family Service of Lake County (2019-2021), Independent Trustee, Henderson Global Funds (13 portfolios) (2015-2017), Independent Trustee, State Farm Associates’ Funds Trust, State Farm Mutual Fund Trust, and State Farm Variable Product Trust (28 portfolios) (2013-2017). |
Janus Henderson Small-Mid Cap Value Fund
Trustees and Officers (unaudited)
| | | | |
OFFICERS |
Name, Address, and Age | Positions Held with the Trust | Term of Office* and Length of Time Served | Principal Occupations During the Past Five Years |
Kevin Preloger
151 Detroit Street
Denver, CO 80206
DOB: 1975 | Executive Vice President and Co-Portfolio Manager
Janus Henderson Small-Mid Cap Value Fund | 8/19-Present | Portfolio Manager for other Janus Henderson accounts. |
Justin Tugman
151 Detroit Street
Denver, CO 80206
DOB: 1973 | Executive Vice President and Co-Portfolio Manager
Janus Henderson Small-Mid Cap Value Fund | 8/19-Present | Portfolio Manager for other Janus Henderson accounts. |
Michelle Rosenberg
151 Detroit Street
Denver, CO 80206
DOB: 1973 | President and Chief Executive Officer | 9/22-Present | General Counsel and Corporate Secretary of Janus Henderson Investors (since 2018). Formerly, Interim President and Chief Executive Officer of the Trust and Janus Aspen Series (2022), Senior Vice President and Head of Legal, North America of Janus Henderson Investors (2017-2018) and Deputy General Counsel of Janus Henderson US (Holdings) Inc. (2015-2018). |
Kristin Mariani
151 Detroit Street
Denver, CO 80206
DOB: 1966 | Vice President and Chief Compliance Officer | 7/20-Present | Head of Compliance, North America at Janus Henderson Investors (since September 2020) and Chief Compliance Officer at Janus Henderson Investors US LLC (since September 2017). Formerly, Anti-Money Laundering Officer for the Trust and Janus Aspen Series (July 2020-December 2022), Global Head of Investment Management Compliance at Janus Henderson Investors (February 2019-August 2020), Vice President, Head of Global Distribution Compliance and Chief Compliance Officer at Janus Henderson Distributors US LLC (May 2017-September 2017), Vice President, Compliance at Janus Henderson US (Holdings) Inc., Janus Henderson Investors US LLC, and Janus Henderson Distributors US LLC (2009-2017). |
Janus Henderson Small-Mid Cap Value Fund
Trustees and Officers (unaudited)
| | | | |
OFFICERS |
Name, Address, and Age | Positions Held with the Trust | Term of Office* and Length of Time Served | Principal Occupations During the Past Five Years |
Jesper Nergaard
151 Detroit Street
Denver, CO 80206
DOB: 1962 | Chief Financial Officer
Vice President, Treasurer, and Principal Accounting Officer | 3/05-Present
2/05-Present | Head of U.S. Fund Administration, Janus Henderson Investors and Janus Henderson Services US LLC. |
Abigail J. Murray
151 Detroit Street
Denver, CO 80206
DOB: 1975 | Vice President, Chief Legal Counsel, and Secretary | 12/20-Present | Managing Counsel (since 2020). Formerly, Senior Counsel for Invesco Ltd. (2017-2020), and Vice President and Senior Counsel, ALPS Fund Services, Inc. and Assistant General Counsel, ALPS Advisors, Inc. (2015-2017). |
Ciaran Askin
151 Detroit Street
Denver, CO 80206
DOB: 1978 | Anti-Money Laundering Officer | 12/22-Present | Global Head of Financial Crime, Janus Henderson Investors (since 2022). Formerly, Global Head of Financial Crime for Invesco Ltd. (2017-2022). |
* Officers are elected at least annually by the Trustees for a one-year term and may also be elected from time to time by the Trustees for an interim period. |
Janus Henderson Small-Mid Cap Value Fund
Notes
NotesPage1
Janus Henderson Small-Mid Cap Value Fund
Notes
NotesPage2
| | | | | | | | |
| | | | | |

| | | | |
This report is submitted for the general information of shareholders of the Fund. It is not an offer or solicitation for the Fund and is not authorized for distribution to prospective investors unless preceded or accompanied by an effective prospectus. |
Janus Henderson is a trademark of Janus Henderson Group plc or one of its subsidiaries. © Janus Henderson Group plc Janus Henderson Distributors US LLC Janus Henderson Group is the ultimate parent of Janus Henderson Distributors US LLC |
| | | | 125-02-93033 08-23 |
| | | |
| | | |
| | | ANNUAL REPORT June 30, 2023 |
| | |
| | Janus Henderson Sustainable Multi-Asset Allocation Fund |
| | |
| | Janus Investment Fund |
| |
| | | |
| | | HIGHLIGHTS · Portfolio management perspective · Investment strategy behind your fund · Fund performance, characteristics
and holdings |
Table of Contents
Janus Henderson Sustainable Multi-Asset Allocation Fund
Janus Henderson Sustainable Multi-Asset Allocation Fund (unaudited)
| | | | | | |
| | | | 
Oliver Blackbourn co-portfolio manager | 
Nick Harper co-portfolio manager |
| | | |
PERFORMANCE OVERVIEW
For the period beginning at inception on August 16, 2022, and ending on June 30, 2023, the Sustainable Multi-Asset Allocation Fund returned 1.10% versus 2.22% for its primary benchmark, 60% MSCI All Country World IndexSM Net / 40% Bloomberg U.S. Aggregate Bond Index.
MARKET ENVIRONMENT
Global equity markets, as measured by the MSCI All Country World Index, rose 5.2% since the inception of the strategy, but U.S. fixed markets struggled, with the Bloomberg U.S. Aggregate Bond index returning -2.7%. International equities were boosted by the depreciation of the U.S. dollar, helping the MSCI Europe IndexSM to a 14.9% return and the MSCI Japan IndexSM to a 9.8% gain in U.S. dollar terms. The S&P 500® Index rose 5.0% over the same period, outpacing the MSCI Emerging Markets IndexSM which fell 0.4%.
The period was mostly defined by the evolving outlook for monetary policy. Early in the period, bond yields rose in response to global interest rate hikes, as central banks attempted to fight high levels of inflation. This weighed on the valuations of risk assets, particularly expensive growth equities. However, 10-year U.S. Treasury yields peaked in October 2022, following a turn lower in the U.S. inflation rate, reducing the downward pressure on valuations. U.S. growth equities subsequently led a significant rally, despite the still elevated level of interest rates and bond yields. Technology-related names were helped by optimism about the potential for artificial intelligence (AI) to drive greater earnings growth. More widely, significant upside growth surprises gave confidence that the U.S. economy remains solid, with the labor market still very strong; however, more leading indicators continued to show some worrying signs. As a result, bond yields failed to make new highs for the cycle in 2023 and more cyclical, value-style U.S. equities struggled to make gains.
PERFORMANCE DISCUSSION
The Janus Henderson Sustainable Multi-Asset Allocation Fund seeks to maximize investment returns by investing in underlying Janus Henderson ETFs and mutual funds that incorporate certain environment, social, and governance (ESG) factors in their investment process. The fund-of-funds structure incorporates both strategic and dynamic asset allocation to gain exposure to equities and fixed income securities through Janus Henderson’s proprietary sustainable ETFs and mutual funds.
Underperformance was largely a result of the underweight allocation to equities during a period of recovery and the underperformance of the Janus Henderson International Sustainable Equity and Janus Henderson Net Zero Transition Resources ETFs against the benchmark, the MSCI All Country World Index. While the Janus Henderson U.S. Sustainable Equity ETF also lagged the MSCI All Country World Index, it kept pace with the MSCI USA regional sub-component of the wider index. There was also a modest drag from fixed income assets due to the slight underperformance of the Janus Henderson Sustainable & Impact Core Bond ETF compared to the Bloomberg U.S. Aggregate Bond Index and some allocation effects. The Janus Henderson Sustainable Corporate Bond ETF outperformed the wider U.S. aggregate index but was a smaller allocation within the portfolio.
OUTLOOK
Investors remain split between those that see a soft landing and those concerned about a more negative outcome. Much of the discussion is centered on the stickiness of inflation and the damage that economies ultimately experience as a result of central bank interest
Janus Henderson Sustainable Multi-Asset Allocation Fund (unaudited)
rate hikes, both past and future. While uncertainty appears low in the equity and high-yield credit markets, expected volatility in government bond and foreign exchange markets remains elevated. When considering the positives and negatives that characterize this environment, we are concerned about what see as asymmetric risks leading to more potential downside than incremental upside at this point. We continue to take a cautious stance, concerned about the risk of financial shocks as a result of the rapid increase in interest rates but also the potential for economic pain to build over the second half of the year. We are particularly mindful of what is becoming a notable lag between rate hikes and their intended impact on the economy. Despite being over a year into the hiking cycle, both corporate credit spreads and earnings expectations have proven resilient. Neither broad credit nor global equity markets currently appear to price in much downside should we see a meaningful slowdown or increasing defaults.
Thank you for investing in the Janus Henderson Sustainable Multi-Asset Allocation Fund.
Important Notice – Tailored Shareholder Reports
Effective January 24, 2023, the Securities and Exchange Commission (the “SEC”) adopted rule and form amendments that require mutual funds and exchange-traded funds to provide shareholders with streamlined annual and semi-annual shareholder reports that highlight key information. Other information, including financial statements, that currently appears in shareholder reports will be made available online, delivered free of charge to shareholders upon request, and filed with the SEC. The first tailored shareholder report for the Fund will be for the reporting period ending June 30, 2024. Currently, management is evaluating the impact of the rule and form amendments on the content of the Fund’s current shareholder reports.
Janus Henderson Sustainable Multi-Asset Allocation Fund (unaudited)
Fund At A Glance
June 30, 2023
| | | | |
Holdings - (% of Net Assets) | | | |
Janus Henderson Sustainable & Impact Core Bond | | 36.0 | % |
Janus Henderson U.S. Sustainable Equity | | 32.6 | |
Janus Henderson International Sustainable Equity | | 16.1 | |
Janus Henderson Net Zero Transition Resources | | 8.0 | |
Janus Henderson Sustainable Corporate Bond | | 4.8 | |
Janus Henderson Cash Liquidity Fund LLC | | 3.8 | |
| | | | | | |
Asset Allocation - (% of Net Assets) | |
Investment Companies | | 101.3% | |
Other | | (1.3)% |
| | | 100.0% |
Janus Henderson Sustainable Multi-Asset Allocation Fund (unaudited)
Performance
| |
See important disclosures on the next page. |
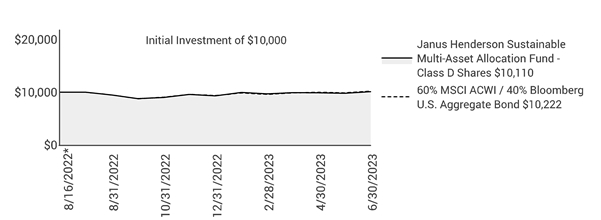
| | | | | | | | |
| | | | | | |
| | | | | | |
Cumulative Total Return - for the periods ended June 30, 2023 | | | Prospectus Expense Ratios |
| | Since
Inception* | | | Total Annual Fund
Operating Expenses‡ | Net Annual Fund
Operating Expenses‡ |
Class D Shares | | 1.10% | | | 2.23% | 0.74% |
60% MSCI ACWI / 40% Bloomberg U.S. Aggregate Bond | | 2.22% | | | | |
Morningstar Quartile - Class D Shares | | 3rd | | | | |
Morningstar Ranking - based on total returns for U.S. Fund World Allocation | | 375/743 | | | | |
Returns quoted are past performance and do not guarantee future results; current performance may be lower or higher. Investment returns and principal value will vary; there may be a gain or loss when shares are sold. For the most recent month-end performance call 800.668.0434 (or 800.525.3713 if you hold shares directly with Janus Henderson) or visit janushenderson.com/performance (or janushenderson.com/allfunds if you hold shares directly with Janus Henderson).
For certain periods, the Fund’s performance may reflect the effects of expense waivers.
Performance may be affected by risks that include those associated with foreign and emerging markets, fixed income securities, high-yield and high-risk securities, undervalued, overlooked and smaller capitalization companies, real estate related securities including Real Estate Investment Trusts (REITs), Environmental, Social and Governance (ESG) factors, non-diversification, portfolio turnover, derivatives, short sales, initial public offerings (IPOs) and potential conflicts of interest. Each product has different risks. Please see the prospectus for more information about risks, holdings and other details.
Performance of the Global Allocation Funds depends on that of the underlying funds. They are subject to the volatility of the financial markets. Because Janus Henderson Investors US LLC is the adviser to the Fund and to the underlying affiliated funds held within the Fund, it is subject to certain potential conflicts of interest.
Returns include reinvestment of all dividends and distributions and do not reflect the deduction of taxes that a shareholder would pay on Fund distributions or redemptions of Fund shares. The returns do not include adjustments in accordance with generally accepted accounting principles required at the period end for financial reporting purposes.
Ranking is for the share class shown only; other classes may have different performance characteristics. When an expense waiver is in effect, it may have a material effect on the total return, and therefore the ranking for the period.
© 2023 Morningstar, Inc. All Rights Reserved.
There is no assurance that the investment process will consistently lead to successful investing.
See Notes to Schedule of Investments and Other Information for index definitions.
Index performance does not reflect the expenses of managing a portfolio as an index is unmanaged and not available for direct investment.
See “Useful Information About Your Fund Report.”
Janus Henderson Sustainable Multi-Asset Allocation Fund (unaudited)
Performance
*The Fund’s inception date – August 16, 2022
‡ As stated in the prospectus. Net expense ratios reflect the advisory fee waiver contractually agreed to through at least October 31, 2023. This contractual waiver may be terminated or modified prior to this date only at the discretion of the Board of Trustees. Certain expenses waived or reimbursed during the first three years of operation may be recovered within three years of such waiver or reimbursement amount, if the expense ratio falls below certain limits. See Financial Highlights for actual expense ratios during the reporting period.
Janus Henderson Sustainable Multi-Asset Allocation Fund (unaudited)
Expense Examples
As a shareholder of the Fund, you incur two types of costs: (1) transaction costs and (2) ongoing costs, including management fees; 12b-1 distribution and shareholder servicing fees; transfer agent fees and expenses payable pursuant to the Transfer Agency Agreement; and other Fund expenses. This example is intended to help you understand your ongoing costs (in dollars) of investing in the Fund and to compare these costs with the ongoing costs of investing in other mutual funds. To do so, compare this 5% hypothetical example with the 5% hypothetical examples that appear in the shareholder reports of the other funds. The example is based upon an investment of $1,000 invested at the beginning of the period and held for the six-months indicated, unless noted otherwise in the table and footnotes below.
Actual Expenses
The information in the table under the heading “Actual” provides information about actual account values and actual expenses. You may use the information in these columns, together with the amount you invested, to estimate the expenses that you paid over the period. Simply divide your account value by $1,000 (for example, an $8,600 account value divided by $1,000 = 8.6), then multiply the result by the number in the appropriate column for your share class under the heading entitled “Expenses Paid During Period” to estimate the expenses you paid on your account during the period.
Hypothetical Example for Comparison Purposes
The information in the table under the heading “Hypothetical (5% return before expenses)” provides information about hypothetical account values and hypothetical expenses based upon the Fund’s actual expense ratio and an assumed rate of return of 5% per year before expenses, which is not the Fund’s actual return. The hypothetical account values and expenses may not be used to estimate the actual ending account balance or expenses you paid for the period. You may use this information to compare the ongoing costs of investing in the Fund and other funds. To do so, compare this 5% hypothetical example with the 5% hypothetical examples that appear in the shareholder reports of the other funds. Additionally, for an analysis of the fees associated with an investment in any share class or other similar funds, please visit www.finra.org/fundanalyzer.
Please note that the expenses shown in the table are meant to highlight your ongoing costs only and do not reflect any transaction costs. These fees are fully described in the Fund’s prospectus. Therefore, the hypothetical examples are useful in comparing ongoing costs only, and will not help you determine the relative total costs of owning different funds. In addition, if these transaction costs were included, your costs would have been higher.
| | | | | | | | | | | |
| | | | | | | | |
| | | Actual | | Hypothetical
(5% return before expenses) | |
| Beginning
Account
Value
(1/1/23) | Ending
Account
Value
(6/30/23) | Expenses
Paid During
Period
(1/1/23 - 6/30/23)† | | Beginning
Account
Value
(1/1/23) | Ending
Account
Value
(6/30/23) | Expenses
Paid During
Period
(1/1/23 - 6/30/23)† | Net Annualized
Expense Ratio
(1/1/23 - 6/30/23) |
Class D Shares | $1,000.00 | $1,082.80 | $1.76 | | $1,000.00 | $1,023.11 | $1.71 | 0.34% |
† | Expenses Paid During Period is equal to the Net Annualized Expense Ratio multiplied by the average account value over the period, multiplied by 181/365 (to reflect the one-half year period). Expenses in the examples include the effect of applicable fee waivers and/or expense reimbursements, if any. Had such waivers and/or reimbursements not been in effect, your expenses would have been higher. Please refer to the Notes to Financial Statements or the Fund’s prospectuses for more information regarding waivers and/or reimbursements. |
Janus Henderson Sustainable Multi-Asset Allocation Fund
Schedule of Investments
June 30, 2023
| | | | | | | | |
Shares
| | | Value | |
Investment Companies£– 101.3% | | | |
Exchange-Traded Funds (ETFs) – 97.5% | | | |
| | Janus Henderson International Sustainable Equity | | 37,751 | | | $681,239 | |
| | Janus Henderson Net Zero Transition Resources | | 14,708 | | | 340,365 | |
| | Janus Henderson Sustainable & Impact Core Bond | | 36,221 | | | 1,520,558 | |
| | Janus Henderson Sustainable Corporate Bond | | 4,946 | | | 202,029 | |
| | Janus Henderson U.S. Sustainable Equity | | 61,339 | | | 1,377,705 | |
| | | 4,121,896 | |
Money Markets – 3.8% | | | |
| | Janus Henderson Cash Liquidity Fund LLC, 5.1900%ºº | | 158,661 | | | 158,693 | |
Total Investments (total cost $4,106,448) – 101.3% | | 4,280,589 | |
Liabilities, net of Cash, Receivables and Other Assets – (1.3)% | | (54,772) | |
Net Assets – 100% | | $4,225,817 | |
Schedules of Affiliated Investments – (% of Net Assets)
| | | | | | | | | | | | | |
| | Dividend Income | Realized Gain/(Loss) | | Change in Unrealized Appreciation/ Depreciation | Value at 6/30/23 |
Investment Companies - 101.3% |
Exchange-Traded Funds (ETFs) - 97.5% |
| | Janus Henderson International Sustainable Equity | $ | 7,283 | $ | - | | | $ | 41,298 | $ | 681,239 |
| | Janus Henderson Net Zero Transition Resources | | 3,573 | | (1,283) | | | | (3,120) | | 340,365 |
| | Janus Henderson Sustainable & Impact Core Bond | | 20,615 | | - | | | | (19,894) | | 1,520,558 |
| | Janus Henderson Sustainable Corporate Bond | | 4,796 | | (3,462) | | | | 1,308 | | 202,029 |
| | Janus Henderson U.S. Sustainable Equity | | 3,331 | | (3,424) | | | | 154,539 | | 1,377,705 |
Total Exchange-Traded Funds (ETFs) | $ | 39,598 | $ | (8,169) | | | $ | 174,131 | $ | 4,121,896 |
Money Markets - 3.8% |
| | Janus Henderson Cash Liquidity Fund LLC, 5.1900%ºº | | 6,908 | | 2 | | | | 10 | | 158,693 |
Total Affiliated Investments - 101.3% | $ | 46,506 | $ | (8,167) | | | $ | 174,141 | $ | 4,280,589 |
| | |
See Notes to Schedule of Investments and Other Information and Notes to Financial Statements. |
| |
Janus Investment Fund | 7 |
Janus Henderson Sustainable Multi-Asset Allocation Fund
Schedule of Investments
June 30, 2023
| | | | | | | | | | | |
| | Value at 8/16/22 | Purchases | Sales Proceeds | Value at 6/30/23 |
Investment Companies - 101.3% |
Exchange-Traded Funds (ETFs) - 97.5% | |
| | Janus Henderson International Sustainable Equity | | - | | 639,941 | | - | | 681,239 |
| | Janus Henderson Net Zero Transition Resources | | - | | 355,778 | | (11,010) | | 340,365 |
| | Janus Henderson Sustainable & Impact Core Bond | | - | | 1,540,452 | | - | | 1,520,558 |
| | Janus Henderson Sustainable Corporate Bond | | - | | 269,324 | | (65,141) | | 202,029 |
| | Janus Henderson U.S. Sustainable Equity | | - | | 1,274,007 | | (47,417) | | 1,377,705 |
Money Markets - 3.8% | |
| | Janus Henderson Cash Liquidity Fund LLC, 5.1900%ºº | | - | | 3,763,396 | | (3,604,715) | | 158,693 |
| | |
See Notes to Schedule of Investments and Other Information and Notes to Financial Statements. |
| |
8 | JUNE 30, 2023 |
Janus Henderson Sustainable Multi-Asset Allocation Fund
Notes to Schedule of Investments and Other Information
| | |
60% MSCI ACWI / 40% Bloomberg U.S. Aggregate Bond | 60% MSCI ACWI / 40% Bloomberg U.S. Aggregate Bond is an internally-calculated, hypothetical combination of total returns from the MSCI All Country World IndexSM (60%) and the Bloomberg Global Aggregate Bond Index (40%). |
| | |
ETF | Exchange-Traded Fund |
LLC | Limited Liability Company |
| | |
ºº | Rate shown is the 7-day yield as of June 30, 2023. |
| | |
£ | The Fund may invest in certain securities that are considered affiliated companies. As defined by the Investment Company Act of 1940, as amended, an affiliated company is one in which the Fund owns 5% or more of the outstanding voting securities, or a company which is under common ownership or control. |
| | | | | | | | | | | | | |
The following is a summary of the inputs that were used to value the Fund’s investments in securities and other financial instruments as of June 30, 2023. See Notes to Financial Statements for more information. |
| |
Valuation Inputs Summary |
| | | | | | | |
| | | | | Level 2 - | | Level 3 - |
| | | Level 1 - | | Other Significant | | Significant |
| | | Quoted Prices | | Observable Inputs | | Unobservable Inputs |
| | | | | | | |
Assets | | | | | | |
Investments In Securities: | | | | | | |
Investment Companies | $ | 4,121,896 | $ | 158,693 | $ | - |
| | | | | | | |
Janus Henderson Sustainable Multi-Asset Allocation Fund
Statement of Assets and Liabilities
June 30, 2023
| | | | | | | |
| | | | | | |
Assets: | | | | |
| Affiliated investments, at value (cost $4,106,448) | | $ | 4,280,589 | |
| Trustees' deferred compensation | | | 107 | |
| Receivables: | | | | |
| | Dividends from affiliates | | | 10,777 | |
| | Fund shares sold | | | 25 | |
Total Assets | | | 4,291,498 | |
Liabilities: | | | | |
| Payables: | | | — | |
| | Professional fees | | | 36,467 | |
| | Advisory fees | | | 19,034 | |
| | Fund shares repurchased | | | 2,596 | |
| | Custodian fees | | | 1,049 | |
| | Transfer agent fees and expenses | | | 658 | |
| | Trustees' deferred compensation fees | | | 107 | |
| | Trustees' fees and expenses | | | 17 | |
| | Accrued expenses and other payables | | | 5,753 | |
Total Liabilities | | | 65,681 | |
Net Assets | | $ | 4,225,817 | |
Net Assets Consist of: | | | | |
| Capital (par value and paid-in surplus) | | $ | 4,029,451 | |
| Total distributable earnings (loss) | | | 196,366 | |
Total Net Assets | | $ | 4,225,817 | |
Net Assets - Class D Shares | | $ | 4,225,817 | |
| Shares Outstanding, $0.01 Par Value (unlimited shares authorized) | | | 419,477 | |
Net Asset Value Per Share | | $ | 10.07 | |
| | |
See Notes to Financial Statements. |
| |
10 | JUNE 30, 2023 |
Janus Henderson Sustainable Multi-Asset Allocation Fund
Statement of Operations
For the period ended June 30, 2023(1)
| | | | | | |
| | | | | |
Investment Income: |
| Dividends from affiliates | $ | 46,506 | |
| Other income | | 220 | |
Total Investment Income | | 46,726 | |
Expenses: | | | |
| Advisory fees | | 1,131 | |
| Transfer agent administrative fees and expenses: | | |
| | Class D Shares | | 2,654 | |
| Other transfer agent fees and expenses: | | | |
| | Class D Shares | | 1,487 | |
| Professional fees | | 37,315 | |
| Registration fees | | 33,664 | |
| Non-affiliated fund administration fees | | 12,407 | |
| Shareholder reports expense | | 4,203 | |
| Custodian fees | | 1,852 | |
| Trustees’ fees and expenses | | 57 | |
| Other expenses | | 23 | |
Total Expenses | | 94,793 | |
Less: Excess Expense Reimbursement and Waivers | | (87,031) | |
Net Expenses | | 7,762 | |
Net Investment Income/(Loss) | | 38,964 | |
Net Realized Gain/(Loss) on Investments: |
| Investments in affiliates | | (8,167) | |
Total Net Realized Gain/(Loss) on Investments | (8,167) | |
Change in Unrealized Net Appreciation/Depreciation: |
| Investments in affiliates | | 174,141 | |
Total Change in Unrealized Net Appreciation/Depreciation | 174,141 | |
Net Increase/(Decrease) in Net Assets Resulting from Operations | $ | 204,938 | |
| | | | | |
| |
(1) Period from August 16, 2022 (inception date) through June 30, 2023. |
| | |
See Notes to Financial Statements. |
| |
Janus Investment Fund | 11 |
Janus Henderson Sustainable Multi-Asset Allocation Fund
Statement of Changes in Net Assets
| | | | | | |
| | | | | |
| | | Period ended
June 30, 2023(1) | |
| | | | | | |
Operations: | | | |
| Net investment income/(loss) | $ | 38,964 | |
| Net realized gain/(loss) on investments | | (8,167) | |
| Change in unrealized net appreciation/depreciation | | 174,141 | |
Net Increase/(Decrease) in Net Assets Resulting from Operations | | 204,938 | |
Dividends and Distributions to Shareholders: | | | |
| | Class D Shares | | (8,572) | |
Net Decrease from Dividends and Distributions to Shareholders | | (8,572) | |
Capital Share Transactions: | | | |
| | Class D Shares | | 4,029,451 | |
Net Increase/(Decrease) from Capital Share Transactions | | 4,029,451 | |
Net Increase/(Decrease) in Net Assets | | 4,225,817 | |
Net Assets: | | | |
| Beginning of period | | — | |
| End of period | $ | 4,225,817 | |
| | | | | |
| |
(1) Period from August 16, 2022 (inception date) through June 30, 2023. |
| | |
See Notes to Financial Statements. |
| |
12 | JUNE 30, 2023 |
Janus Henderson Sustainable Multi-Asset Allocation Fund
Financial Highlights
| | | | | | | |
Class D Shares | | | |
For a share outstanding during the period ended June 30 | | 2023(1) | |
| Net Asset Value, Beginning of Period | | $10.00 | |
| Income/(Loss) from Investment Operations: | | | |
| | Net investment income/(loss)(2) | | 0.15 | |
| | Net realized and unrealized gain/(loss) | | (0.04)(3) | |
| Total from Investment Operations | | 0.11 | |
| Less Dividends and Distributions: | | | |
| | Dividends (from net investment income) | | (0.04) | |
| Total Dividends and Distributions | | (0.04) | |
| Net Asset Value, End of Period | | $10.07 | |
| Total Return* | | 1.10% | |
| Net Assets, End of Period (in thousands) | | $4,226 | |
| Average Net Assets for the Period (in thousands) | | $2,561 | |
| Ratios to Average Net Assets**: | | | |
| | Ratio of Gross Expenses | | 4.24% | |
| | Ratio of Net Expenses (After Waivers and Expense Offsets) | | 0.35% | |
| | Ratio of Net Investment Income/(Loss) | | 1.74% | |
| Portfolio Turnover Rate | | 6% | |
| | | | | | | |
| |
* Total return includes adjustments in accordance with generally accepted accounting principles required at the year or period end and are not annualized for periods of less than one full year. ** Annualized for periods of less than one full year. (1) Period from August 16, 2022 (inception date) through June 30, 2023. (2) Per share amounts are calculated based on average shares outstanding during the year or period. (3) The amount shown does not correlate with the change in the aggregate gains and losses in the Fund's securities for the year or period due to the timing of sales and repurchases of the Fund's shares in relation to fluctuating market values for the Fund's securities. |
| | |
See Notes to Financial Statements. |
| |
Janus Investment Fund | 13 |
Janus Henderson Sustainable Multi-Asset Allocation Fund
Notes to Financial Statements
1. Organization and Significant Accounting Policies
Janus Henderson Sustainable Multi-Asset Allocation Fund (the “Fund”) is a series of Janus Investment Fund (the “Trust”), which is organized as a Massachusetts business trust and is registered under the Investment Company Act of 1940, as amended (the “1940 Act”), as an open-end management investment company, and therefore has applied the specialized accounting and reporting guidance in Financial Accounting Standards Board (“FASB”) Accounting Standards Codification (“ASC”) Topic 946. The Fund operates as a “fund of funds,” meaning substantially all of the Fund’s assets will be invested in other Janus Henderson mutual funds and exchange-traded funds ("ETFs") (the “underlying funds”). The Trust offers 39 funds, each of which offers multiple share classes, with differing investment objectives and policies. The Fund seeks long-term capital appreciation. The Fund is classified as diversified, as defined in the 1940 Act. Janus Henderson Investors US LLC is the investment adviser (the “Adviser”) to the Fund.
The Fund currently offers Class D Shares. Class D Shares are available to new investors, subject to any closed fund policies for a Fund, as applicable.
Shareholders, including other funds, individuals, accounts, as well as the Fund’s portfolio manager(s) and/or investment personnel, may from time to time own (beneficially or of record) a significant percentage of the Fund’s Shares and can be considered to “control” the Fund when that ownership exceeds 25% of the Fund’s assets (and which may differ from control as determined in accordance with United States of America generally accepted accounting principles ("US GAAP")).
The following accounting policies have been followed by the Fund and are in conformity with US GAAP.
Underlying Funds
The Fund invests in a variety of underlying funds to pursue a target allocation of equity investments, fixed-income securities, and alternative investments and may also invest in money market instruments or cash/cash equivalents. The Fund has a target allocation, which is how the Fund's investments generally will be allocated among the major asset classes over the long term, as well as normal ranges, under normal market conditions, within which the Fund's asset class allocations generally will vary over short-term periods. The Fund's long-term expected average asset allocation is as follows: 60% to equity investments, 40% to fixed-income securities and money market instruments, and 0% to alternative investments. Additional details and descriptions of the investment objectives and strategies of each of the underlying funds are available in the Fund’s and underlying funds’ prospectuses available at janushenderson.com. The Trustees of the underlying funds may change the investment objectives or strategies of the underlying funds at any time without prior notice to the Fund’s shareholders.
Investment Valuation
The Fund’s net asset value (“NAV”) is calculated based upon the NAV of each of the underlying funds in which the Fund invests on the day of valuation. The NAV for each class of the underlying funds is computed by dividing the total value of securities and other assets allocated to the class, less liabilities allocated to that class, by the total number of shares outstanding for the class.
Valuation Inputs Summary
FASB ASC 820, Fair Value Measurements and Disclosures (“ASC 820”), defines fair value, establishes a framework for measuring fair value, and expands disclosure requirements regarding fair value measurements. This standard emphasizes that fair value is a market-based measurement that should be determined based on the assumptions that market participants would use in pricing an asset or liability and establishes a hierarchy that prioritizes inputs to valuation techniques used to measure fair value. These inputs are summarized into three broad levels:
Level 1 – Unadjusted quoted prices in active markets the Fund has the ability to access for identical assets or liabilities.
Level 2 – Observable inputs other than unadjusted quoted prices included in Level 1 that are observable for the asset or liability either directly or indirectly. These inputs may include quoted prices for the identical instrument on an inactive market, prices for similar instruments, interest rates, prepayment speeds, credit risk, yield curves, default rates and similar data.
Assets or liabilities categorized as Level 2 in the hierarchy generally include: debt securities fair valued in accordance with the evaluated bid or ask prices supplied by a pricing service; securities traded on OTC markets and listed securities for which no sales are reported that are fair valued at the latest bid price (or yield equivalent
Janus Henderson Sustainable Multi-Asset Allocation Fund
Notes to Financial Statements
thereof) obtained from one or more dealers transacting in a market for such securities or by a pricing service approved by the Fund’s Trustees; certain short-term debt securities with maturities of 60 days or less that are fair valued at amortized cost; and equity securities of foreign issuers whose fair value is determined by using systematic fair valuation models provided by independent third parties in order to adjust for stale pricing which may occur between the close of certain foreign exchanges and the close of the NYSE. Other securities that may be categorized as Level 2 in the hierarchy include, but are not limited to, preferred stocks, bank loans, swaps, investments in unregistered investment companies, options, and forward contracts.
Level 3 – Unobservable inputs for the asset or liability to the extent that relevant observable inputs are not available, representing the Fund’s own assumptions about the assumptions that a market participant would use in valuing the asset or liability, and that would be based on the best information available.
There have been no significant changes in valuation techniques used in valuing any such positions held by the Fund since the beginning of the fiscal period.
The inputs or methodology used for fair valuing securities are not necessarily an indication of the risk associated with investing in those securities. The summary of inputs used as of June 30, 2023 to fair value the Fund’s investments in securities and other financial instruments is included in the “Valuation Inputs Summary” in the Notes to Schedule of Investments and Other Information.
Investment Transactions and Investment Income
Investment transactions are accounted for as of the date purchased or sold (trade date). Dividend income is recorded on the ex-dividend date. Certain dividends from foreign securities will be recorded as soon as the Fund is informed of the dividend, if such information is obtained subsequent to the ex-dividend date. Dividends from foreign securities may be subject to withholding taxes in foreign jurisdictions. Non-cash dividends, if any, are recorded on the ex-dividend date at fair value. Interest income is recorded daily on the accrual basis and includes amortization of premiums and accretion of discounts. The Fund classifies gains and losses on prepayments received as an adjustment to interest income. Debt securities may be placed in non-accrual status and related interest income may be reduced by stopping current accruals and writing off interest receivables when collection of all or a portion of interest has become doubtful. Gains and losses are determined on the identified cost basis, which is the same basis used for federal income tax purposes. Income, as well as gains and losses, both realized and unrealized, are allocated daily to each class of shares based upon the ratio of net assets represented by each class as a percentage of total net assets.
Expenses
The Fund bears expenses incurred specifically on its behalf. Each class of shares bears a portion of general expenses, which are allocated daily to each class of shares based upon the ratio of net assets represented by each class as a percentage of total net assets. Expenses directly attributable to a specific class of shares are charged against the operations of such class.
Estimates
The preparation of financial statements in conformity with US GAAP requires management to make estimates and assumptions that affect the reported amount of assets and liabilities and disclosure of contingent assets and liabilities at the date of the financial statements, and the reported amounts of income and expenses during the reporting period. Actual results could differ from those estimates.
Indemnifications
In the normal course of business, the Fund may enter into contracts that contain provisions for indemnification of other parties against certain potential liabilities. The Fund’s maximum exposure under these arrangements is unknown, and would involve future claims that may be made against the Fund that have not yet occurred. Currently, the risk of material loss from such claims is considered remote.
Dividends and Distributions
The Fund generally declares and distributes dividends of net investment income and realized capital gains (if any) annually. The Fund may treat a portion of the amount paid to redeem shares as a distribution of investment company taxable income and realized capital gains that are reflected in the net asset value. This practice, commonly referred to as “equalization,” has no effect on the redeeming shareholder or a Fund’s total return, but may reduce the amounts that would otherwise be required to be paid as taxable dividends to the remaining shareholders. It is possible that the
Janus Henderson Sustainable Multi-Asset Allocation Fund
Notes to Financial Statements
Internal Revenue Service (IRS) could challenge the Fund's equalization methodology or calculations, and any such challenge could result in additional tax, interest, or penalties to be paid by the Fund.
The underlying funds may make certain investments in real estate investment trusts (“REITs”) which pay dividends to their shareholders based upon funds available from operations. It is quite common for these dividends to exceed the REITs’ taxable earnings and profits, resulting in the excess portion of such dividends being designated as a return of capital. If the underlying funds distribute such amounts, such distributions could constitute a return of capital to shareholders for federal income tax purposes.
Federal Income Taxes
The Fund intends to continue to qualify as a regulated investment company and distribute all of its taxable income in accordance with the requirements of Subchapter M of the Internal Revenue Code. Management has analyzed the Fund’s tax positions taken for all open federal income tax years, generally a three-year period, and has concluded that no provision for federal income tax is required in the Fund’s financial statements. The Fund is not aware of any tax positions for which it is reasonably possible that the total amounts of unrecognized tax benefits will significantly change in the next twelve months.
2. Investment Advisory Agreements and Other Transactions with Affiliates
The Fund pays the Adviser an investment advisory fee which is calculated daily and paid monthly. The Fund’s "base" fee rate prior to any performance adjustment (expressed as an annual rate) is 0.05%.
The Adviser has contractually agreed to waive the investment advisory fee and/or reimburse operating expenses to the extent that the Fund’s total annual fund operating expenses, excluding any expenses of an underlying fund (acquired fund fees and expenses) shareholder servicing fees, such as transfer agency fees (including out-of-pocket costs), brokerage commissions, interest, dividends, taxes, and extraordinary expenses, exceed the annual rate of 0.16% of the Fund’s average daily net assets. The Adviser has agreed to continue the waiver until at least October 31, 2023. If applicable, amounts waived and/or reimbursed to the Fund by the Adviser are disclosed as “Excess Expense Reimbursement and Waivers” on the Statement of Operations.
For the period of three years subsequent to the Fund’s commencement of operations, or until the Fund’s assets exceed the first breakpoint in the investment advisory fee schedule, whichever occurs first, the Adviser may recover from the Fund fees and expenses previously waived or reimbursed, which could then be considered a deferral, if the Fund’s expense ratio including recovered expenses, falls below the expense limit. If applicable, this amount is disclosed as “Recoupment expense” on the Statement of Operations. During the period ended June 30, 2023, the Adviser reimbursed the Fund $87,031 of fees and expense that are eligible for recoupment. As of June 30, 2023, the aggregate amount of recoupment that may potentially be made to the Adviser is $87,031. The recoupment of such reimbursements expires at the latest August 16, 2027.
The Adviser serves as administrator to the Fund pursuant to an administration agreement, and is authorized to perform, or cause others to perform, the administration services necessary for the operation of the Fund. The Adviser does not receive compensation for serving as administrator and it bears the expenses related to operation of the Fund, such as, but not limited to fund accounting and tax services; shareholder servicing; and preparation of various documents filed with the SEC. The Fund bears costs related to any compensation, fees, or reimbursements paid to Trustees who are independent of the Adviser; fees and expenses of counsel to the Independent Trustees; fees and expenses of consultants to the Fund; custody fees; audit expenses; brokerage commissions and all other expenses in connection with execution of portfolio transactions; blue sky registration costs; interest; all federal, state and local taxes (including stamp, excise, income, and franchise taxes); expenses of shareholder meetings, including the preparation, printing, and distribution of proxy statements, notices, and reports to shareholders; expenses of printing and mailing to existing shareholders prospectuses, statements of additional information, shareholder reports, and other materials required to be mailed to shareholders by federal or state laws or regulations; transfer agency fees and expenses payable pursuant to a transfer agency agreement between the Trust and the Transfer Agent on behalf of the Fund; any litigation; and other extraordinary expenses. In addition, some expenses related to compensation payable to the Fund's Chief Compliance Officer and compliance staff are shared with the Fund. Total compensation of $343,237 was paid to the Chief Compliance Officer and certain compliance staff by the Trust during the period ended June 30, 2023. The Fund's portion is reported as part of “Other expenses” on the Statement of Operations.
Janus Henderson Sustainable Multi-Asset Allocation Fund
Notes to Financial Statements
Janus Henderson Services US LLC (the “Transfer Agent”), a wholly-owned subsidiary of the Adviser, is the Fund’s transfer agent. The Transfer Agent provides or arranges for the provision of shareholder services including, but not limited to, recordkeeping, subaccounting, answering inquiries regarding accounts, order processing, transaction confirmations, the mailing of prospectuses and shareholder reports, and other shareholder services provided to or on behalf of shareholders. These amounts are disclosed as “Transfer agent administrative fees and expenses” on the Statement of Operations.
Class D Shares of the Fund pay the Transfer Agent an annual administrative services fee based on the average daily net assets of Class D Shares as detailed below.
| | |
Average Daily Net Assets of Class D Shares of the Janus Henderson funds | Administrative Services Fee |
Under $40 billion | 0.12% |
$40 billion – $49.9 billion | 0.10% |
Over $49.9 billion | 0.08% |
During the reporting period, the administrative services fee rate was 0.12%.
Shareholder Services provided by these financial intermediaries may include, but are not limited to, recordkeeping, subaccounting, order processing, providing order confirmations, periodic statements, forwarding prospectuses, shareholder reports, and other materials to existing customers, answering inquiries regarding accounts, and other administrative services. Order processing includes the submission of transactions through the National Securities Clearing Corporation (“NSCC”) or similar systems, or those processed on a manual basis with the Adviser. For all share classes, the Transfer Agent also seeks reimbursement for costs it incurs as transfer agent and for providing servicing.
The Transfer Agent is not compensated for its services related to the shares, except for out-of-pocket costs, although the Transfer Agent is compensated for its services related to Fund’s Class D Shares. These amounts are disclosed as “Other transfer agent fees and expenses” on the Statement of Operations.
The Board of Trustees has adopted a deferred compensation plan (the “Deferred Plan”) for independent Trustees to elect to defer receipt of all or a portion of the annual compensation they are entitled to receive from the Fund. All deferred fees are credited to an account established in the name of the Trustees. The amounts credited to the account then increase or decrease, as the case may be, in accordance with the performance of one or more of the Janus Henderson funds that are selected by the Trustees. The account balance continues to fluctuate in accordance with the performance of the selected fund or funds until final payment of all amounts are credited to the account. The fluctuation of the account balance is recorded by the Fund as unrealized appreciation/(depreciation) and is included as of June 30, 2023 on the Statement of Assets and Liabilities in the asset, “Trustees’ deferred compensation,” and liability, “Trustees’ deferred compensation fees.” Additionally, the recorded unrealized appreciation/(depreciation) is included in “Total distributable earnings (loss)” on the Statement of Assets and Liabilities. Deferred compensation expenses for the period ended June 30, 2023 are included in “Trustees’ fees and expenses” on the Statement of Operations. Trustees are allowed to change their designation of mutual funds from time to time. Amounts will be deferred until distributed in accordance with the Deferred Plan. Deferred fees of $426,025 were paid by the Trust to the Trustees under the Deferred Plan during the period ended June 30, 2023.
Pursuant to the provisions of the 1940 Act and related rules, the Fund may participate in an affiliated or non-affiliated cash sweep program. In the cash sweep program, uninvested cash balances of the Fund may be used to purchase shares of affiliated or non-affiliated money market funds or cash management pooled investment vehicles that operate as money market funds. The Fund is eligible to participate in the cash sweep program (the “Investing Funds”). The Adviser has an inherent conflict of interest because of its fiduciary duties to the affiliated money market funds or cash management pooled investment vehicles and the Investing Funds. Janus Henderson Cash Liquidity Fund LLC (the “Sweep Vehicle”) is an affiliated unregistered cash management pooled investment vehicle that invests primarily in highly-rated short-term fixed-income securities. The Sweep Vehicle operates pursuant to the provisions of the 1940 Act that govern the operation of money market funds and prices its shares at NAV reflecting market-based values of its portfolio securities (i.e., a “floating” NAV) rounded to the fourth decimal place (e.g., $1.0000). The Sweep Vehicle is permitted to impose a liquidity fee (of up to 2%) on redemptions from the Sweep Vehicle or a redemption gate that temporarily suspends redemptions from the Sweep Vehicle for up to 10 business days during a 90 day period. There are no restrictions on the Fund's ability to withdraw investments from the Sweep Vehicle at will, and there are no
Janus Henderson Sustainable Multi-Asset Allocation Fund
Notes to Financial Statements
unfunded capital commitments due from the Fund to the Sweep Vehicle. The Sweep Vehicle does not charge any management fee, sales charge or service fee.
Any purchases and sales, realized gains/losses and recorded dividends from affiliated investments during the period ended June 30, 2023 can be found in the “Schedules of Affiliated Investments” located in the Schedule of Investments.
As of June 30, 2023, shares of the Fund were owned by affiliates of the Adviser, and/or other funds advised by the Adviser, as indicated in the table below:
| | | | | | |
Class | % of Class Owned | | % of Fund Owned | | |
Class D Shares | 12 | % | 12 | % | |
| | | | | | |
3. Federal Income Tax
The tax components of capital shown in the table below represent: (1) distribution requirements the Fund must satisfy under the income tax regulations; (2) losses or deductions the Fund may be able to offset against income and gains realized in future years; and (3) unrealized appreciation or depreciation of investments for federal income tax purposes.
Other book to tax differences primarily consist of deferred compensation. The Fund has elected to treat gains and losses on forward foreign currency contracts as capital gains and losses, if applicable. Other foreign currency gains and losses on debt instruments are treated as ordinary income for federal income tax purposes pursuant to Section 988 of the Internal Revenue Code.
| | | | | | | |
| | | | Other Book | Net Tax | |
Undistributed
Ordinary Income | Undistributed
Long-Term Gains | Accumulated
Capital Losses | Loss Deferrals | to Tax
Differences | Appreciation/
(Depreciation) | |
$ 23,951 | $ - | $ (2,980) | $ - | $ (107) | $ 175,502 | |
Accumulated capital losses noted below represent net capital loss carryovers, as of June 30, 2023, that may be available to offset future realized capital gains and thereby reduce future taxable gains distributions. The following table shows these capital loss carryovers.
| | | | | | |
| | | | | |
Capital Loss Carryover Schedule | | |
For the year ended June 30, 2023 | | |
| No Expiration | | | |
| Short-Term | Long-Term | Accumulated
Capital Losses | | |
| $ (2,980) | $ - | $ (2,980) | | |
The aggregate cost of investments and the composition of unrealized appreciation and depreciation of investment securities for federal income tax purposes as of June 30, 2023 are noted below. The primary differences between book and tax appreciation or depreciation of investments are wash sale loss deferrals and investments in partnerships.
| | | | |
Federal Tax Cost | Unrealized
Appreciation | Unrealized
(Depreciation) | Net Tax Appreciation/
(Depreciation) |
$ 4,105,087 | $ 193,254 | $ (17,752) | $ 175,502 |
Janus Henderson Sustainable Multi-Asset Allocation Fund
Notes to Financial Statements
Income and capital gains distributions are determined in accordance with income tax regulations that may differ from US GAAP. These differences are due to differing treatments for items such as net short-term gains, deferral of wash sale losses, and capital loss carryovers. Certain permanent differences such as tax returns of capital and net investment losses noted below have been reclassified to capital.
| | | | | |
For the year ended June 30, 2023 | |
Distributions | | |
From Ordinary Income | From Long-Term Capital Gains | Tax Return of Capital | Net Investment Loss | |
$ 8,572 | $ - | $ - | $ - | |
Permanent book to tax basis differences may result in reclassifications between the components of net assets. These differences have no impact on the results of operations or net assets.
4. Capital Share Transactions
| | | | |
| | | |
| | Period ended June 30, 2023(1) |
| | Shares | Amount |
| | | | |
Class D Shares: | | |
Shares sold | 456,803 | $ 4,394,106 |
Reinvested dividends and distributions | 897 | 8,400 |
Shares repurchased | (38,223) | (373,055) |
Net Increase/(Decrease) | 419,477 | $ 4,029,451 |
(1) | Period from August 16, 2022 (inception date) through June 30, 2023. |
5. Purchases and Sales of Investment Securities
For the period ended June 30, 2023, the aggregate cost of purchases and proceeds from sales of investment securities (excluding any short-term securities, short-term options contracts, TBAs, and in-kind transactions, as applicable) was as follows:
| | | | |
Purchases of
Securities | Proceeds from Sales
of Securities | Purchases of Long-
Term U.S. Government
Obligations | Proceeds from Sales
of Long-Term U.S.
Government Obligations |
$ 4,079,502 | $ 123,568 | $ - | $ - |
6. Subsequent Event
Management has evaluated whether any events or transactions occurred subsequent to June 30, 2023 and through the date of issuance of the Fund's financial statements and determined that there were no material events or transactions that would require recognition or disclosure in the Fund’s financial statements other than the following:
On August 10, 2023, the Trustees approved a plan to liquidate the Fund, with such liquidation effective on or about October 19, 2023, or at such other time as may be authorized by the Trustees (the “Liquidation Date”). Effective on or about August 11, 2023, the Fund no longer accepted investments by new shareholders. Furthermore, the Adviser has agreed to waive its advisory fee, effective August 11, 2023 through the Liquidation Date.
Janus Henderson Sustainable Multi-Asset Allocation Fund
Report of Independent Registered Public Accounting Firm
To the Board of Trustees of Janus Investment Fund and Shareholders of Janus Henderson Sustainable Multi-Asset Allocation Fund
Opinion on the Financial Statements
We have audited the accompanying statement of assets and liabilities, including the schedule of investments, of Janus Henderson Sustainable Multi-Asset Allocation Fund (one of the funds constituting Janus Investment Fund, referred to hereafter as the "Fund") as of June 30, 2023, and the related statements of operations and changes in net assets, including the related notes, and the financial highlights for the period August 16, 2022 (commencement of operations) through June 30, 2023 (collectively referred to as the “financial statements”). In our opinion, the financial statements present fairly, in all material respects, the financial position of the Fund as of June 30, 2023, and the results of its operations, changes in its net assets, and the financial highlights for the period August 16, 2022 (commencement of operations) through June 30, 2023 in conformity with accounting principles generally accepted in the United States of America.
Basis for Opinion
These financial statements are the responsibility of the Fund’s management. Our responsibility is to express an opinion on the Fund’s financial statements based on our audit. We are a public accounting firm registered with the Public Company Accounting Oversight Board (United States) (PCAOB) and are required to be independent with respect to the Fund in accordance with the U.S. federal securities laws and the applicable rules and regulations of the Securities and Exchange Commission and the PCAOB.
We conducted our audit of these financial statements in accordance with the standards of the PCAOB. Those standards require that we plan and perform the audit to obtain reasonable assurance about whether the financial statements are free of material misstatement, whether due to error or fraud.
Our audit included performing procedures to assess the risks of material misstatement of the financial statements, whether due to error or fraud, and performing procedures that respond to those risks. Such procedures included examining, on a test basis, evidence regarding the amounts and disclosures in the financial statements. Our audit also included evaluating the accounting principles used and significant estimates made by management, as well as evaluating the overall presentation of the financial statements. Our procedures included confirmation of securities owned as of June 30, 2023 by correspondence with the custodian and transfer agent. We believe that our audit provides a reasonable basis for our opinion.

Denver, Colorado
August 21, 2023
We have served as the auditor of one or more investment companies in Janus Henderson Funds since 1990.
Janus Henderson Sustainable Multi-Asset Allocation Fund
Additional Information (unaudited)
Proxy Voting Policies and Voting Record
A description of the policies and procedures that the Fund uses to determine how to vote proxies relating to its portfolio securities is available without charge: (i) upon request, by calling 1-800-525-1093; (ii) on the Fund’s website at janushenderson.com/proxyvoting; and (iii) on the SEC’s website at http://www.sec.gov. Additionally, information regarding the Fund’s proxy voting record for the most recent twelve-month period ended June 30 is also available, free of charge, through janushenderson.com/proxyvoting and from the SEC’s website at http://www.sec.gov.
Full Holdings
The Fund files its complete portfolio holdings (schedule of investments) with the SEC as an exhibit to Form N-PORT within 60 days of the end of the first and third fiscal quarters, and in the annual report and semiannual report to shareholders. The Fund’s Form N-PORT filings and annual and semiannual reports: (i) are available on the SEC’s website at http://www.sec.gov; and (ii) are available without charge, upon request, by calling a Janus Henderson representative at 1-877-335-2687 (toll free) (or 1-800-525-3713 if you hold Class D shares). Portfolio holdings consisting of at least the names of the holdings are generally available on a monthly basis with a 30-day lag under Full Holdings for the Fund at janushenderson.com/info (or janushenderson.com/reports if you hold Class D Shares).
APPROVAL OF ADVISORY AGREEMENTS DURING THE PERIOD
The Trustees of Janus Aspen Series, each of whom serves as an “independent” Trustee (the “Trustees”), oversee the management of each portfolio of Janus Aspen Series (each, a “VIT Portfolio,” and collectively, the “VIT Portfolios”), as well as each fund of Janus Investment Fund (each, a “Fund,” and collectively, the “Funds” and together with the VIT Portfolios, the “Janus Henderson Funds,” and each, a “Janus Henderson Fund”). As required by law, the Trustees determine annually whether to continue the investment advisory agreement for each Janus Henderson Fund.
In connection with their most recent consideration of those agreements for each Janus Henderson Fund, the Trustees received and reviewed information provided by Janus Henderson Investors US LLC (the “Adviser”) in response to requests of the Trustees and their independent legal counsel. They also received and reviewed information and analysis provided by, and in response to requests of, their independent fee consultant. Throughout their consideration of the agreements, the Trustees were advised by their independent legal counsel. The Trustees met with management to consider the agreements, and also met separately in executive session with their independent legal counsel and their independent fee consultant.
At meetings held on November 9-10, 2022 and December 13-14, 2022, the Trustees evaluated the information provided by the Adviser and the independent fee consultant, as well as other information provided by the Adviser and the independent fee consultant during the year. Following such evaluation, the Trustees determined that the overall arrangements between each Janus Henderson Fund and the Adviser were fair and reasonable in light of the nature, extent, and quality of the services provided by the Adviser and its affiliates, the fees charged for those services, and other matters that the Trustees considered relevant in the exercise of their business judgment, and unanimously approved the continuation of the investment advisory agreement for each Janus Henderson Fund for the period from February 1, 2023 through February 1, 2024, subject to earlier termination as provided for in each agreement.
In considering the continuation of those agreements, the Trustees reviewed and analyzed various factors that they determined were relevant, including the factors described below, none of which by itself was considered dispositive. However, the material factors and conclusions that formed the basis for the Trustees’ determination to approve the continuation of the agreements are discussed separately below. Also included is a summary of the independent fee consultant’s conclusions and opinions that arose during, and were included as part of, the Trustees’ consideration of the agreements. “Management fees,” as used herein, reflect actual annual advisory fees and, for the purpose of peer comparisons any administration fees (excluding out of pocket costs), net of any waivers, paid by a fund as a percentage of average net assets.
Nature, Extent and Quality of Services
The Trustees reviewed the nature, extent, and quality of the services provided by the Adviser to the Janus Henderson Funds, taking into account the investment objective, strategies, and policies of each Janus Henderson Fund, and the knowledge the Trustees gained from their regular meetings with management on at least a quarterly basis and their ongoing review of information related to the Janus Henderson Funds. In addition, the Trustees reviewed the resources and key personnel of the Adviser, particularly noting those employees who provide investment and risk management services to the Janus Henderson Funds. The Trustees also considered other services provided to the Janus Henderson
Janus Henderson Sustainable Multi-Asset Allocation Fund
Additional Information (unaudited)
Funds by the Adviser, such as managing the execution of portfolio transactions and the selection of broker-dealers for those transactions. The Trustees considered the Adviser’s role as administrator to the Janus Henderson Funds, noting that the Adviser generally does not receive a fee for its services as administrator, but is reimbursed for its out-of-pocket costs. The Trustees considered the role of the Adviser in monitoring adherence to the Janus Henderson Funds’ investment restrictions, providing support services for the Trustees and Trustee committees, and overseeing communications with Janus Henderson Fund shareholders and the activities of other service providers, including monitoring compliance with various policies and procedures of the Janus Henderson Funds and with applicable securities laws and regulations.
In this regard, the independent fee consultant noted that the Adviser provides a number of different services for the Janus Henderson Funds and their shareholders, ranging from investment management services to various other servicing functions, and that, in its view, the Adviser is a capable provider of those services. The independent fee consultant also provided its belief that the Adviser has developed a number of institutional competitive advantages that should enable it to provide superior investment and service performance over the long term.
The Trustees concluded that the nature, extent, and quality of the services provided by the Adviser to each Janus Henderson Fund were appropriate and consistent with the terms of the respective advisory agreements, and that, taking into account steps taken to address those Janus Henderson Funds whose performance lagged that of their peers for certain periods, the Janus Henderson Funds were likely to benefit from the continued provision of those services. They also concluded that the Adviser had sufficient personnel, with the appropriate education and experience, to serve the Janus Henderson Funds effectively and had demonstrated its ability to attract well-qualified personnel.
Performance of the Funds
The Trustees considered the performance results of each Janus Henderson Fund over various time periods. They noted that they considered Janus Henderson Fund performance data throughout the year, including periodic meetings with each Janus Henderson Fund’s portfolio manager(s), and also reviewed information comparing each Janus Henderson Fund’s performance with the performance of comparable fund peer groups identified by Broadridge Financial Solutions, Inc. (“Broadridge”), an independent data provider, and with the Janus Henderson Fund’s benchmark index. In this regard, the independent fee consultant found that the overall Janus Henderson Funds’ performance has been reasonable, noting that: (i) for the 36 months ended May 31, 2022, approximately 38% of the Janus Henderson Funds were in the top two quartiles of their Broadridge peer groups; (ii) for the 36 months ended September 30, 2022, approximately 45% of the Janus Henderson Funds were in the top two quartiles of performance as reported by Morningstar, and (iii) for the 12 months ended September 30, 2022, approximately 55% of the Janus Henderson Funds were in the top two quartiles of performance as reported by Morningstar.
The Trustees considered the performance of each Janus Henderson Fund, noting that performance may vary by share class, and noted the following with respect to the Funds:
Asset Allocation Funds
· For Janus Henderson Global Allocation Fund – Conservative, the Trustees noted that the Fund’s performance was in the third Broadridge quartile for the 36 months ended May 31, 2022 and the bottom Broadridge quartile for the 12 months ended May 31, 2022. The Trustees noted the reasons for the Fund’s underperformance and the steps the Adviser had taken or was taking to improve performance.
· For Janus Henderson Global Allocation Fund – Growth, the Trustees noted that the Fund’s performance was in the bottom Broadridge quartile for the 36 months ended May 31, 2022 and the bottom Broadridge quartile for the 12 months ended May 31, 2022. The Trustees noted the reasons for the Fund’s underperformance and the steps the Adviser had taken or was taking to improve performance.
· For Janus Henderson Global Allocation Fund – Moderate, the Trustees noted that the Fund’s performance was in the bottom Broadridge quartile for the 36 months ended May 31, 2022 and the bottom Broadridge quartile for the 12 months ended May 31, 2022. The Trustees noted the reasons for the Fund’s underperformance and the steps the Adviser had taken or was taking to improve performance.
Fixed-Income Funds
· For Janus Henderson Absolute Return Income Opportunities Fund, the Trustees noted that the Fund’s performance was in the third Broadridge quartile for the 36 months ended May 31, 2022 and the first Broadridge
Janus Henderson Sustainable Multi-Asset Allocation Fund
Additional Information (unaudited)
quartile for the 12 months ended May 31, 2022. The Trustees noted the reasons for the Fund’s underperformance, the steps the Adviser had taken or was taking to improve performance, and that the performance trend was improving.
· For Janus Developed World Bond Fund, the Trustees noted that the Fund’s performance was in the bottom Broadridge quartile for the 36 months ended May 31, 2022 and the bottom Broadridge quartile for the 12 months ended May 31, 2022. The Trustees noted the reasons for the Fund’s underperformance and the steps the Adviser had taken or was taking to improve performance.
· For Janus Henderson Flexible Bond Fund, the Trustees noted that the Fund’s performance was in the first Broadridge quartile for the 36 months ended May 31, 2022 and the second Broadridge quartile for the 12 months ended May 31, 2022.
· For Janus Henderson Global Bond Fund, the Trustees noted that the Fund’s performance was in the third Broadridge quartile for the 36 months ended May 31, 2022 and the bottom Broadridge quartile for the 12 months ended May 31, 2022. The Trustees noted the reasons for the Fund’s underperformance and the steps the Adviser had taken or was taking to improve performance.
· For Janus Henderson High-Yield Fund, the Trustees noted that the Fund’s performance was in the third Broadridge quartile for the 36 months ended May 31, 2022 and the bottom Broadridge quartile for the 12 months ended May 31, 2022. The Trustees noted the reasons for the Fund’s underperformance and the steps the Adviser had taken or was taking to improve performance.
· For Janus Henderson Multi-Sector Income Fund, the Trustees noted that the Fund’s performance was in the second Broadridge quartile for the 36 months ended May 31, 2022 and the third Broadridge quartile for the 12 months ended May 31, 2022.
· For Janus Henderson Short Duration Flexible Bond Fund, the Trustees noted that the Fund’s performance was in the third Broadridge quartile for the 36 months ended May 31, 2022 and the bottom Broadridge quartile for the 12 months ended May 31, 2022. The Trustees noted the reasons for the Fund’s underperformance and the steps the Adviser had taken or was taking to improve performance.
Global and International Equity Funds
· For Janus Henderson Asia Equity Fund, the Trustees noted that the Fund’s performance was in the third Broadridge quartile for the 36 months ended May 31, 2022 and the third Broadridge quartile for the 12 months ended May 31, 2022. The Trustees noted the reasons for the Fund’s underperformance, while also noting that the Fund has a performance fee structure that results in lower management fees during periods of underperformance, and the steps the Adviser had taken or was taking to improve performance.
· For Janus Henderson Emerging Markets Fund, the Trustees noted that the Fund’s performance was in the third Broadridge quartile for the 36 months ended May 31, 2022 and the third Broadridge quartile for the 12 months ended May 31, 2022. The Trustees noted the reasons for the Fund’s underperformance and the steps the Adviser had taken or was taking to improve performance.
· For Janus Henderson European Focus Fund, the Trustees noted that the Fund’s performance was in the first Broadridge quartile for the 36 months ended May 31, 2022 and the second Broadridge quartile for the 12 months ended May 31, 2022.
· For Janus Henderson Global Equity Income Fund, the Trustees noted that the Fund’s performance was in the third Broadridge quartile for the 36 months ended May 31, 2022 and the first Broadridge quartile for the 12 months ended May 31, 2022. The Trustees noted the reasons for the Fund’s underperformance, the steps the Adviser had taken or was taking to improve performance, and that the performance trend was improving.
· For Janus Henderson Global Life Sciences Fund, the Trustees noted that the Fund’s performance was in the third Broadridge quartile for the 36 months ended May 31, 2022 and the second Broadridge quartile for the 12 months ended May 31, 2022. The Trustees noted the reasons for the Fund’s underperformance, the steps the Adviser had taken or was taking to improve performance, and that the performance trend was improving.
Janus Henderson Sustainable Multi-Asset Allocation Fund
Additional Information (unaudited)
· For Janus Henderson Global Sustainable Equity Fund, the Trustees noted that the Fund’s performance was in the second Broadridge quartile for the 12 months ended May 31, 2022. The Trustees noted that 36 month-end performance was not yet available.
· For Janus Henderson Global Real Estate Fund, the Trustees noted that the Fund’s performance was in the second Broadridge quartile for the 36 months ended May 31, 2022 and the bottom Broadridge quartile for the 12 months ended May 31, 2022.
· For Janus Henderson Global Research Fund, the Trustees noted that the Fund’s performance was in the second Broadridge quartile for the 36 months ended May 31, 2022 and the first Broadridge quartile for the 12 months ended May 31, 2022.
· For Janus Henderson Global Select Fund, the Trustees noted that the Fund’s performance was in the first Broadridge quartile for the 36 months ended May 31, 2022 and the first Broadridge quartile for the 12 months ended May 31, 2022.
· For Janus Henderson Global Technology and Innovation Fund, the Trustees noted that the Fund’s performance was in the second Broadridge quartile for the 36 months ended May 31, 2022 and the second Broadridge quartile for the 12 months ended May 31, 2022.
· For Janus Henderson International Opportunities Fund, the Trustees noted that the Fund’s performance was in the bottom Broadridge quartile for the 36 months ended May 31, 2022 and the third Broadridge quartile for the 12 months ended May 31, 2022. The Trustees noted the reasons for the Fund’s underperformance and the steps the Adviser had taken or was taking to improve performance.
· For Janus Henderson Overseas Fund, the Trustees noted that the Fund’s performance was in the first Broadridge quartile for the 36 months ended May 31, 2022 and the first Broadridge quartile for the 12 months ended May 31, 2022.
· For Janus Henderson Responsible International Dividend Fund (formerly the Janus Henderson Dividend & Income Builder Fund), the Trustees noted that the Fund’s performance was in the bottom Broadridge quartile for the 36 months ended May 31, 2022 and the bottom Broadridge quartile for the 12 months ended May 31, 2022. The Trustees noted the reasons for the Fund’s underperformance and the steps the Adviser had taken or was taking to improve performance.
Money Market Funds
· For Janus Henderson Government Money Market Fund, the Trustees noted that the Fund’s performance was in the third Broadridge quartile for the 36 months ended May 31, 2022 and the bottom Broadridge quartile for the 12 months ended May 31, 2022. The Trustees noted the reasons for the Fund’s underperformance and the steps the Adviser had taken or was taking to improve performance.
· For Janus Henderson Money Market Fund, the Trustees noted that the Fund’s performance was in the third Broadridge quartile for the 36 months ended May 31, 2022 and the bottom Broadridge quartile for the 12 months ended May 31, 2022. The Trustees noted the reasons for the Fund’s underperformance and the steps the Adviser had taken or was taking to improve performance.
Multi-Asset Funds
· For Janus Henderson Adaptive Global Allocation Fund, the Trustees noted that the Fund’s performance was in bottom Broadridge quartile for the 36 months ended May 31, 2022 and the second Broadridge quartile for the 12 months ended May 31, 2022. The Trustees noted the reasons for the Fund’s underperformance, the steps the Adviser had taken or was taking to improve performance, and that the performance trend was improving.
· For Janus Henderson Balanced Fund, the Trustees noted that the Fund’s performance was in the first Broadridge quartile for the 36 months ended May 31, 2022 and the first Broadridge quartile for the 12 months ended May 31, 2022.
Janus Henderson Sustainable Multi-Asset Allocation Fund
Additional Information (unaudited)
U.S. Equity Funds
· For Janus Henderson Adaptive Risk Managed U.S. Equity Fund, the Trustees noted that the Fund’s performance was in the bottom Broadridge quartile for the 36 months ended May 31, 2022 and the second Broadridge quartile for the 12 months ended May 31, 2022. The Trustees noted the reasons for the Fund’s underperformance, the steps the Adviser had taken or were taking to improve performance, and that the performance trend was improving.
· For Janus Henderson Contrarian Fund, the Trustees noted that the Fund’s performance was in the first Broadridge quartile for the 36 months ended May 31, 2022 and the bottom Broadridge quartile for the 12 months ended May 31, 2022.
· For Janus Henderson Enterprise Fund, the Trustees noted that the Fund’s performance was in the second Broadridge quartile for the 36 months ended May 31, 2022 and the first Broadridge quartile for the 12 months ended May 31, 2022.
· For Janus Henderson Forty Fund, the Trustees noted that the Fund’s performance was in the third Broadridge quartile for the 36 months ended May 31, 2022 and the bottom Broadridge quartile for the 12 months ended May 31, 2022. The Trustees noted the reasons for the Fund’s underperformance and the steps the Adviser had taken or was taking to improve performance.
· For Janus Henderson Growth and Income Fund, the Trustees noted that the Fund’s performance was in the bottom Broadridge quartile for the 36 months ended May 31, 2022 and the first Broadridge quartile for the 12 months ended May 31, 2022. The Trustees noted the reasons for the Fund’s underperformance, the steps the Adviser had taken or was taking to improve performance, and that the performance trend was improving.
· For Janus Henderson Mid Cap Value Fund, the Trustees noted that the Fund’s performance was in the bottom Broadridge quartile for the 36 months ended May 31, 2022 and the second Broadridge quartile for the 12 months ended May 31, 2022. The Trustees noted the reasons for the Fund’s underperformance, while also noting that the Fund has a performance fee structure that results in lower management fees during periods of underperformance, the steps the Adviser had taken or was taking to improve performance, and that the performance trend was improving.
· For Janus Henderson Research Fund, the Trustees noted that the Fund’s performance was in the third Broadridge quartile for the 36 months ended May 31, 2022 and the third Broadridge quartile for the 12 months ended May 31, 2022. The Trustees noted the reasons for the Fund’s underperformance, while also noting that the Fund has a performance fee structure that results in lower management fees during periods of underperformance and the steps the Adviser had taken or was taking to improve performance.
· For Janus Henderson Small Cap Value Fund, the Trustees noted that the Fund’s performance was in the bottom Broadridge quartile for the 36 months ended May 31, 2022 and the second Broadridge quartile for the 12 months ended May 31, 2022. The Trustees noted the reasons for the Fund’s underperformance, while also noting that the Fund has a performance fee structure that results in lower management fees during periods of underperformance, the steps the Adviser had taken or was taking to improve performance, and that the performance trend was improving.
· For Janus Henderson Small-Mid Cap Value Fund, the Trustees noted that the Fund’s performance was in the bottom Broadridge quartile for the 36 months ended May 31, 2022 and the second Broadridge quartile for the 12 months ended May 31, 2022. The Trustees noted the reasons for the Fund’s underperformance, while also noting that the Fund has a performance fee structure that results in lower management fees during periods of underperformance, the steps the Adviser had taken or was taking to improve performance, and that the performance trend is improving.
· For Janus Henderson Triton Fund, the Trustees noted that the Fund’s performance was in the bottom Broadridge quartile for the 36 months ended May 31, 2022 and the second Broadridge quartile for the 12 months ended May 31, 2022. The Trustees noted the reasons for the Fund’s underperformance, the steps the Adviser had taken or was taking to improve performance, and that the performance trend was improving.
· For Janus Henderson Venture Fund, the Trustees noted that the Fund’s performance was in the bottom Broadridge quartile for the 36 months ended May 31, 2022 and the second Broadridge quartile for the 12 months ended May
Janus Henderson Sustainable Multi-Asset Allocation Fund
Additional Information (unaudited)
31, 2022. The Trustees noted the reasons for the Fund’s underperformance, the steps the Adviser had taken or was taking to improve performance, and that the performance trend was improving.
In consideration of each Janus Henderson Fund’s performance, the Trustees concluded that, taking into account the factors relevant to performance, as well as other considerations, including steps taken to improve performance, as applicable, the Janus Henderson Fund’s performance warranted continuation of such Janus Henderson Fund’s investment advisory agreement.
Costs of Services Provided
The Trustees examined information regarding the fees and expenses of each Janus Henderson Fund in comparison to similar information for other comparable funds as provided by Broadridge, an independent data provider. They also reviewed an analysis of that information provided by their independent fee consultant. The independent fee consultant provided its belief that the management fees charged by the Adviser to each of the Janus Henderson Funds under the current investment advisory and administration agreements are reasonable in relation to the services provided by the Adviser. The independent fee consultant found: (1) the total expenses and management fees of the Janus Henderson Funds to be reasonable relative to other comparable mutual funds; (2) the total expenses, on average, were 6% under the average total expenses of the respective Broadridge peer group; and (3) the management fees for the Janus Henderson Funds, on average, were 5% under the average management fees for the respective Broadridge peer group. The Trustees also considered the total expenses for each share class of each Janus Henderson Fund compared to the average total expenses for its Broadridge Expense Group and to average total expenses for its Broadridge Expense Universe.
For Janus Henderson Funds with three or more years of performance history, the independent fee consultant also performed a systematic “focus list” analysis of expenses which assessed fund fees in the context of fund performance being delivered. Based on this analysis, the independent fee consultant found that the combination of service quality/performance and expenses on these individual Janus Henderson Funds was reasonable in light of performance trends, performance histories, changes in portfolio management, relative average net asset levels, and the existence of performance fees, breakpoints, and/or expense waivers on such Janus Henderson Funds.
The Trustees considered the methodology used by the Adviser in determining compensation payable to portfolio managers, the competitive environment for investment management talent, and the competitive market for mutual funds in different distribution channels.
The Trustees also reviewed management fees charged by the Adviser to comparable separate account clients and to comparable non-affiliated funds subadvised by the Adviser (for which the Adviser provides only or primarily portfolio management services). Although in most instances subadvisory and separate account fee rates for various investment strategies were lower than management fee rates for Janus Henderson Funds having a similar strategy, the Trustees considered that the Adviser noted that, under the terms of the management agreements with the Janus Henderson Funds, the Adviser performs significant additional services for the Janus Henderson Funds that it does not provide to those other clients, including administration services, oversight of the Janus Henderson Funds’ other service providers, Trustee support, regulatory compliance and numerous other services, and that, in serving the Janus Henderson Funds, the Adviser assumes many legal risks and other costs that it does not assume in servicing its other clients. Moreover, the Trustees noted that the independent fee consultant found that: (1) the management fees the Adviser charges to the Janus Henderson Funds are reasonable in relation to the management fees the Adviser charges to funds subadvised by the Adviser and to the fees the Adviser charges to its institutional separate account clients; (2) these subadvised and institutional separate accounts have different service and infrastructure needs and operate in markets very different from the retail fund market; (3) Janus Henderson mutual fund investors enjoy reasonable fees relative to the fees charged in these other markets; and (4) as part of its 2022 review, 9 of 11 Janus Henderson Funds have lower management fees than similar funds subadvised by the Adviser. The Trustees noted that for the two Janus Henderson Funds that did not, management fees for each were under the average of its 15(c) peer group.
The Trustees considered the fees for each Janus Henderson Fund for its fiscal year ended in 2021 and noted the following with regard to each Janus Henderson Fund’s total expenses, net of applicable fee waivers (the Fund’s “total expenses”) as reflected in the comparative information provided by Broadridge:
Janus Henderson Sustainable Multi-Asset Allocation Fund
Additional Information (unaudited)
Asset Allocation Funds
· For Janus Henderson Global Allocation Fund – Conservative, the Trustees noted that, although the Fund’s total expenses exceeded the peer group average for certain share classes, overall the Fund’s total expenses were reasonable. The Trustees also noted that the Adviser has contractually agreed to limit the Fund’s expenses.
· For Janus Henderson Global Allocation Fund – Growth, the Trustees noted that, although the Fund’s total expenses exceeded the peer group average for certain share classes, overall the Fund’s total expenses were reasonable. The Trustees also noted that the Adviser has contractually agreed to limit the Fund’s expenses, although this limit did not apply because the Fund’s total expenses as shown were below the applicable fee limit.
· For Janus Henderson Global Allocation Fund – Moderate, the Trustees noted that, although the Fund’s total expenses exceeded the peer group average for one share class, overall the Fund’s total expenses were reasonable. The Trustees also noted that the Adviser has contractually agreed to limit the Fund’s expenses.
Fixed-Income Funds
· For Janus Henderson Absolute Return Income Opportunities Fund, the Trustees noted that, although the Fund’s total expenses exceeded the peer group average for certain share classes, overall the Fund’s total expenses were reasonable. The Trustees also noted that the Adviser has contractually agreed to limit the Fund’s expenses.
· For Janus Henderson Developed World Bond Fund, the Trustees noted that, although the Fund’s total expenses exceeded the peer group average for one share class, overall the Fund’s total expenses were reasonable. The Trustees also noted that the Adviser has contractually agreed to limit the Fund’s expenses.
· For Janus Henderson Flexible Bond Fund, the Trustees noted that, although the Fund’s total expenses exceeded the peer group average for certain share classes, overall the Fund’s total expenses were reasonable. The Trustees also noted that the Adviser has contractually agreed to limit the Fund’s expenses, although this limit did not apply because the Fund’s total expenses as shown were below the applicable fee limit.
· For Janus Henderson Global Bond Fund, the Trustees noted that, although the Fund’s total expenses exceeded the peer group average for certain share classes, overall the Fund’s total expenses were reasonable. The Trustees also noted that the Adviser has contractually agreed to limit the Fund’s expenses.
· For Janus Henderson High-Yield Fund, the Trustees noted that, although the Fund’s total expenses exceeded the peer group average for certain share classes, overall the Fund’s total expenses were reasonable. The Trustees also noted that the Adviser has contractually agreed to limit the Fund’s expenses.
· For Janus Henderson Multi-Sector Income Fund, the Trustees noted that, although the Fund’s total expenses exceeded the peer group average for certain share classes, overall the Fund’s total expenses were reasonable. The Trustees also noted that the Adviser has contractually agreed to limit the Fund’s expenses.
· For Janus Henderson Short Duration Flexible Bond Fund, the Trustees noted that, although the Fund’s total expenses exceeded the peer group average for certain share classes, overall the Fund’s total expenses were reasonable. The Trustees also noted that the Adviser has contractually agreed to limit the Fund’s expenses.
Global and International Equity Funds
· For Janus Henderson Asia Equity Fund, the Trustees noted that, although the Fund’s total expenses exceeded the peer group average for certain share classes, overall the Fund’s total expenses were reasonable. The Trustees also noted that the Adviser has contractually agreed to limit the Fund’s expenses.
· For Janus Henderson Emerging Markets Fund, the Trustees noted that, although the Fund’s total expenses exceeded the peer group average for certain share classes, overall the Fund’s total expenses were reasonable. The Trustees also noted that the Adviser has contractually agreed to limit the Fund’s expenses.
· For Janus Henderson European Focus Fund, the Trustees noted that, although the Fund’s total expenses exceeded the peer group average for one share class, overall the Fund’s expenses were reasonable. The Trustees also noted that the Adviser has contractually agreed to limit the Fund’s expenses.
· For Janus Henderson Global Equity Income Fund, the Trustees noted that, although the Fund’s total expenses exceeded the peer group average for one share class, overall the Fund’s total expenses were reasonable. The
Janus Henderson Sustainable Multi-Asset Allocation Fund
Additional Information (unaudited)
Trustees also noted that the Adviser has contractually agreed to limit the Fund’s expenses, although this limit did not apply because the Fund’s total expenses as shown were below the applicable fee limit.
· For Janus Henderson Global Life Sciences Fund, the Trustees noted that the Fund’s total expenses were below the peer group average for all share classes.
· For Janus Henderson Global Real Estate Fund, the Trustees noted that, although the Fund’s total expenses exceeded the peer group average for certain share classes, overall the Fund’s total expenses were reasonable. The Trustees also noted that the Adviser has contractually agreed to limit the Fund’s expenses, although this limit did not apply because the Fund’s total expenses as shown were below the applicable fee limit.
· For Janus Henderson Global Research Fund, the Trustees noted that, although the Fund’s total expenses exceeded the peer group average for one share class, overall the Fund’s total expenses were reasonable. The Trustees also noted that the Adviser has contractually agreed to limit the Fund’s expenses, although this limit did not apply because the Fund’s total expenses as shown were below the applicable fee limit.
· For Janus Henderson Global Select Fund, the Trustees noted that, although the Fund’s total expenses exceeded the peer group average for certain share classes, overall the Fund’s total expenses were reasonable. The Trustees also noted that the Adviser has contractually agreed to limit the Fund’s expenses.
· For Janus Henderson Global Sustainable Equity Fund, the Trustees noted that, although the Fund’s total expenses exceeded the peer group average for certain share classes, overall the Fund’s expenses were reasonable. The Trustees also noted that the Adviser has contractually agreed to limit the Fund’s expenses.
· For Janus Henderson Global Technology and Innovation Fund, the Trustees noted that the Fund’s total expenses were below the peer group average for all share classes.
· For Janus Henderson International Opportunities Fund, the Trustees noted that, although the Fund’s total expenses exceeded the peer group average for certain share classes, overall the Fund’s expenses were reasonable. The Trustees also noted that the Adviser has contractually agreed to limit the Fund’s expenses.
· For Janus Henderson Overseas Fund, the Trustees noted that although the Fund’s total expenses exceeded the peer group average for certain share classes, overall the Fund’s total expenses were reasonable. The Trustees also noted that the Adviser has contractually agreed to limit the Fund’s expenses, although this limit did not apply because the Fund’s total expenses as shown were below the applicable fee limit.
· For Janus Henderson Responsible International Dividend Fund (formerly the Janus Henderson Dividend & Income Builder Fund), the Trustees noted that, although the Fund’s total expenses exceeded the peer group for one share class, overall the Fund’s total expenses were reasonable. The Trustees also noted that the Adviser has contractually agreed to limit the Fund’s expenses.
Money Market Funds
· For Janus Henderson Government Money Market Fund, the Trustees noted that the Fund’s total expenses were below the peer group average for all share classes.
· For Janus Henderson Money Market Fund, the Trustees noted that the Fund’s total expenses were below the peer group average for all share classes.
Multi-Asset Funds
· For Janus Henderson Adaptive Global Allocation Fund, the Trustees noted that the Fund’s total expenses were below the peer group average for all share classes.
· For Janus Henderson Balanced Fund, the Trustees noted that, although the Fund’s total expenses exceeded the peer group average for certain share classes, overall the Fund’s total expenses were reasonable. The Trustees also noted that the Adviser has contractually agreed to limit the Fund’s expenses, although this limit did not apply because the Fund’s total expenses as shown were below the applicable fee limit.
Janus Henderson Sustainable Multi-Asset Allocation Fund
Additional Information (unaudited)
U.S. Equity Funds
· For Janus Henderson Adaptive Risk Managed U.S. Equity Fund, the Trustees noted that, although the Fund’s total expenses exceeded the peer group average for certain share classes, overall the Fund’s total expenses were reasonable. The Trustees also noted that the Adviser has contractually agreed to limit the Fund’s expenses, although this limit did not apply because the Fund’s total expenses as shown were below the applicable fee limit.
· For Janus Henderson Contrarian Fund, the Trustees noted that, although the Fund’s total expenses exceeded the peer group average for all share classes, overall the Fund’s total expenses were reasonable. The Trustees also noted that the Adviser had contractually agreed to limit the Fund’s expenses.
· For Janus Henderson Enterprise Fund, the Trustees noted that, although the Fund’s total expenses exceeded the peer group average for certain share classes, overall the Fund’s total expenses were reasonable. The Trustees also noted that the Adviser has contractually agreed to limit the Fund’s expenses, although this limit did not apply because the Fund’s total expenses as shown were below the applicable fee limit.
· For Janus Henderson Forty Fund, the Trustees noted that, although the Fund’s total expenses exceeded the peer group average for certain share classes, overall the Fund’s total expenses were reasonable. The Trustees also noted that the Adviser has contractually agreed to limit the Fund’s expenses, although this limit did not apply because the Fund’s total expenses as shown were below the applicable fee limit.
· For Janus Henderson Growth and Income Fund, the Trustees noted that, although the Fund’s total expenses exceeded the peer group average for certain share classes, overall the Fund’s total expenses were reasonable. The Trustees also noted that the Adviser has contractually agreed to limit the Fund’s expenses, although this limit did not apply because the Fund’s total expenses as shown were below the applicable fee limit.
· For Janus Henderson Mid Cap Value Fund, the Trustees noted that the Fund’s total expenses were below the peer group average for all share classes.
· For Janus Henderson Research Fund, the Trustees noted that, although the Fund’s total expenses exceeded the peer group average for certain share classes, overall the Fund’s total expenses were reasonable. The Trustees also noted that the Adviser has contractually agreed to limit the Fund’s expenses.
· For Janus Henderson Small Cap Value Fund, the Trustees noted that, although the Fund’s total expenses exceeded the peer group average for one share class, overall the Fund’s total expenses were reasonable. The Trustees also noted that the Adviser has contractually agreed to limit the Fund’s expenses, although this limit did not apply because the Fund’s total expenses as shown were below the applicable fee limit.
· For Janus Henderson Small-Mid Cap Value Fund, the Trustees noted that the Fund’s total expenses were below the peer group average for all share classes.
· For Janus Henderson Triton Fund, the Trustees noted that, although the Fund’s total expenses exceeded the peer group average for one share class, overall the Fund’s total expenses were reasonable. The Trustees also noted that the Adviser has contractually agreed to limit the Fund’s expenses, although this limit did not apply because the Fund’s total expenses as shown were below the applicable fee limit.
· For Janus Henderson Venture Fund, the Trustees noted that although the Fund’s total expenses exceeded the peer group average for one share class, overall the Fund’s total expenses were reasonable. The Trustees also noted that the Adviser has contractually agreed to limit the Fund’s expenses, although this limit did not apply because the Fund’s total expenses as shown were below the applicable fee limit.
The Trustees reviewed information on the overall profitability to the Adviser and its affiliates from their relationships with the Janus Henderson Funds, and considered profitability data of other publicly traded mutual fund advisers. The Trustees recognized that profitability comparisons among fund managers are difficult because of the variation in the type of comparative information that is publicly available, and the profitability of any fund manager is affected by numerous factors, including the organizational structure of the particular fund manager, differences in complex size, difference in product mix, difference in types of business (mutual fund, institutional and other), differences in the types of funds and other accounts it manages, possible other lines of business, the methodology for allocating expenses and the fund manager’s capital structure and cost of capital.
Janus Henderson Sustainable Multi-Asset Allocation Fund
Additional Information (unaudited)
Additionally, the Trustees considered the estimated profitability to the Adviser from the investment management services it provided to each Janus Henderson Fund. In their review, the Trustees considered whether the Adviser receive adequate incentives and resources to manage the Janus Henderson Funds effectively. In reviewing profitability, the Trustees noted that the estimated profitability for an individual Janus Henderson Fund is necessarily a product of the allocation methodology utilized by the Adviser to allocate its expenses as part of the estimated profitability calculation. In this regard, the Trustees noted that the independent fee consultant found as part of its 2022 review that (1) the expense allocation methodology and rationales utilized by the Adviser were reasonable and (2) no clear correlation exists between expense allocations and operating margins. The Trustees also considered that the estimated profitability for an individual Janus Henderson Fund was influenced by a number of factors, including not only the allocation methodology selected, but also the presence of fee waivers and expense caps, and whether the Janus Henderson Fund’s investment management agreement contained breakpoints or a performance fee component. The Trustees determined, after taking into account these factors, among others, that the Adviser’s estimated profitability with respect to each Janus Henderson Fund was not unreasonable in relation to the services provided, and that the variation in the range of such estimated profitability among the Janus Henderson Funds was not a material factor in the Board’s approval of the reasonableness of any Janus Henderson Fund’s investment management fees.
The Trustees concluded that the management fees payable by each Janus Henderson Fund to the Adviser were reasonable in relation to the nature, extent, and quality of the services provided, taking into account the fees charged by other advisers for managing comparable mutual funds with similar strategies, the fees the Adviser charges to other clients, and, as applicable, the impact of fund performance on management fees payable by the Janus Henderson Funds. The Trustees also concluded that each Janus Henderson Fund’s total expenses were reasonable, taking into account the size of the Janus Henderson Fund, the quality of services provided by the Adviser, the investment performance of the Janus Henderson Fund, and any expense limitations agreed to or provided by the Adviser.
Economies of Scale
The Trustees considered information about the potential for the Adviser to realize economies of scale as the assets of the Janus Henderson Funds increase. They noted that their independent fee consultant published a report to the Trustees in June 2022 which provided its research and analysis into economies of scale. They also noted that, although many Janus Henderson Funds pay advisory fees at a fixed base rate as a percentage of net assets, without any breakpoints or performance fees, their independent fee consultant concluded that 75% of these Janus Henderson Funds’ have contractual management fees (gross of waivers) below their Broadridge Expense Group averages. The Trustees also noted the following from the independent fee consultant’s report: (1) that 31% of Janus Henderson Funds had management fee breakpoints in place whereby investors pay lower management fees as fund AUM increases; (2) that 29% of Janus Henderson Funds have low flat-rate fees and performance fees where the Adviser is incentivized to invest in resources which drive Janus Henderson Fund performance; and (3) that 39% of Janus Henderson Funds have low flat-rate fees versus peers where investors pay low fixed fees when the Janus Henderson Fund is small/midsized and higher fees when the Janus Henderson Fund grows in assets. The Trustees also noted that the Janus Henderson Funds share directly in economies of scale through the significant investments made by the Adviser and its affiliates related to services provided to the Funds and the lower charges of third-party service providers that are based in part on the combined scale of all of the Janus Henderson Funds.
The Trustees also considered the independent fee consultant’s conclusion that, given the limitations of various analytical approaches to economies of scale and their conflicting results, it is difficult to analytically confirm or deny the existence of economies of scale in the Janus Henderson complex. In this regard, the independent consultant concluded that (1) to the extent there were economies of scale at the Adviser, the Adviser’s general strategy of setting fixed management fees below peers appeared to share any such economies with investors even on smaller Janus Henderson Funds which have not yet achieved those economies and (2) by setting lower fixed fees from the start on these Janus Henderson Funds, the Adviser appeared to be investing to increase the likelihood that these Janus Henderson Funds will grow to a level to achieve any economies of scale that may exist. Further, the independent fee consultant provided its belief that Janus Henderson Fund investors are well-served by the fee levels and performance fee structures in place on the Janus Henderson Funds in light of any economies of scale that may be present at the Adviser.
Based on all of the information reviewed, including the recent and past research and analysis conducted by the Trustees’ independent fee consultant, the Trustees concluded that the current fee structure of each Janus Henderson Fund was reasonable and that the current rates of fees do reflect a sharing between the Adviser and the Janus
Janus Henderson Sustainable Multi-Asset Allocation Fund
Additional Information (unaudited)
Henderson Fund of any economies of scale that may be present at the current asset level of the Janus Henderson Fund.
Other Benefits to the Adviser
The Trustees also considered benefits that accrue to the Adviser and its affiliates from their relationships with the Janus Henderson Funds. They recognized that two affiliates of the Adviser separately serve the Janus Henderson Funds as transfer agent and distributor, respectively, and the transfer agent receives compensation directly from the non-money market Janus Henderson Funds for services provided, and that such compensation contributes to the overall profitability of the Adviser and its affiliates that results from their relationship with the Janus Henderson Funds. The Trustees also considered the Adviser’s past and proposed use of commissions paid by the Janus Henderson Funds on portfolio brokerage transactions to obtain proprietary and third-party research products and services benefiting the Janus Henderson Fund and/or other clients of the Adviser and/or the Adviser. The Trustees concluded that the Adviser’s use of these types of client commission arrangements to obtain proprietary and third-party research products and services was consistent with regulatory requirements and guidelines and was likely to benefit each Janus Henderson Fund. The Trustees also concluded that, other than the services provided by the Adviser and its affiliates pursuant to the agreements and the fees to be paid by each Janus Henderson Fund therefor, the Janus Henderson Funds and the Adviser may potentially benefit from their relationship with each other in other ways. They concluded that the Adviser and its affiliates share directly in economies of scale through the lower charges of third-party service providers that are based in part on the combined scale of the Janus Henderson Funds and other clients serviced by the Adviser and its affiliates. They also concluded that the Adviser benefits from the receipt of research products and services acquired through commissions paid on portfolio transactions of the Janus Henderson Funds and that the Janus Henderson Funds benefit from the Adviser’s receipt of those products and services as well as research products and services acquired through commissions paid by other clients of the Adviser. They further concluded that the success of any Janus Henderson Fund could attract other business to the Adviser or other Janus Henderson Funds, and that the success of the Adviser could enhance the Adviser’s ability to serve the Janus Henderson Funds.
Janus Henderson Sustainable Multi-Asset Allocation Fund
Liquidity Risk Management Program (unaudited)
Liquidity Risk Management Program
Rule 22e-4 under the Investment Company Act of 1940, as amended (the “Liquidity Rule”), requires open-end funds (but not money market funds) to adopt and implement a written liquidity risk management program (the “LRMP”) that is reasonably designed to assess and manage liquidity risk, which is the risk that a fund could not meet redemption requests without significant dilution of remaining investors’ interest in the fund. The Fund has implemented a LRMP, which incorporates the following elements: (i) assessment, management, and periodic review of liquidity risk; (ii) classification of portfolio holdings; (iii) the establishment and monitoring of a highly liquid investment minimum, as applicable; (iv) a 15% limitation on a Fund’s illiquid investments; (v) redemptions in-kind; and (vi) board oversight.
The Trustees of the Fund (the “Trustees”) have designated Janus Henderson Investors US LLC, the Fund’s investment adviser (the “Adviser”), as the Program Administrator for the LRMP responsible for administering the LRMP and carrying out the specific responsibilities of the LRMP. A working group comprised of various teams within the Adviser’s business is responsible for administering the LRMP and carrying out the specific responsibilities of different aspects of the LRMP (the “Liquidity Risk Working Group”). In assessing each Fund’s liquidity risk, the Liquidity Risk Working Group periodically considers, as relevant, factors including (i) the liquidity of a Fund’s portfolio investments during normal and reasonably foreseeable stressed conditions; (ii) whether a Fund’s investment strategy is appropriate for an open-end fund; (iii) the extent to which a Fund’s strategy involves a relatively concentrated portfolio or large positions in any issuer; (iv) a Fund’s use of borrowing for investment purposes; and (v) a Fund’s use of derivatives.
The Liquidity Rule requires the Trustees to review at least annually a written report provided by the Program Administrator that addresses the operation of the LRMP and assesses its adequacy and the effectiveness of its implementation, including, if applicable, the operation of the highly liquid investment minimum, and any material changes to the LRMP (the “Program Administrator Report”). At a meeting held on March 15, 2023, the Adviser provided the Program Administrator Report to the Trustees which covered the operation of the LRMP from January 1, 2022 through December 31, 2022 (the “Reporting Period”).
The Program Administrator Report discussed the operation and effectiveness of the LRMP during the Reporting Period. Among other things, the Program Administrator Report indicated that there were no material changes to the LRMP during the Reporting Period, although there were certain methodology adjustments implemented relating to a change in data provider. Additionally, the findings presented in the Program Administrator Report indicated that the LRMP operated adequately during the Reporting Period. These findings included that the Fund was able to meet redemptions during the normal course of business during the Reporting Period. The Program Administrator Report also stated that the Fund did not exceed the 15% limit on illiquid assets during the Reporting Period, that the Fund held primarily highly liquid assets, and was considered to be a primarily highly liquid fund during the Reporting Period. Also included among the Program Administrator Report’s findings was the determination that the Fund’s investment strategy remains appropriate for an open-end fund. In addition, the Adviser expressed its belief in the Program Administrator Report that the LRMP is reasonably designed and adequate to assess and manage the Fund’s liquidity risk, considering the Fund’s particular risks and circumstances, and includes policies and procedures reasonably designed to implement each required component of the Liquidity Rule.
There can be no assurance that the LRMP will achieve its objectives in the future. Please refer to your Fund’s prospectus for more information regarding the risks to which an investment in the Fund may be subject.
Janus Henderson Sustainable Multi-Asset Allocation Fund
Useful Information About Your Fund Report (unaudited)
Management Commentary
The Management Commentary in this report includes valuable insight as well as statistical information to help you understand how your Fund’s performance and characteristics stack up against those of comparable indices.
If the Fund invests in foreign securities, this report may include information about country exposure. Country exposure is based primarily on the country of risk. A company may be allocated to a country based on other factors such as location of the company’s principal office, the location of the principal trading market for the company’s securities, or the country where a majority of the company’s revenues are derived.
Please keep in mind that the opinions expressed in the Management Commentary are just that: opinions. They are a reflection based on best judgment at the time this report was compiled, which was June 30, 2023. As the investing environment changes, so could opinions. These views are unique and are not necessarily shared by fellow employees or by Janus Henderson in general.
Performance Overviews
Performance overview graphs compare the performance of a hypothetical $10,000 investment in the Fund with one or more widely used market indices. When comparing the performance of the Fund with an index, keep in mind that market indices are not available for investment and do not reflect deduction of expenses.
Average annual total returns are quoted for a Fund with more than one year of performance history. Average annual total return is calculated by taking the growth or decline in value of an investment over a period of time, including reinvestment of dividends and distributions, then calculating the annual compounded percentage rate that would have produced the same result had the rate of growth been constant throughout the period. Average annual total return does not reflect the deduction of taxes that a shareholder would pay on Fund distributions or redemptions of Fund shares.
Cumulative total returns are quoted for a Fund with less than one year of performance history. Cumulative total return is the growth or decline in value of an investment over time, independent of the period of time involved. Cumulative total return does not reflect the deduction of taxes that a shareholder would pay on Fund distributions or redemptions of Fund shares.
Pursuant to federal securities rules, expense ratios shown in the performance chart reflect subsidized (if applicable) and unsubsidized ratios. The total annual fund operating expenses ratio is gross of any fee waivers, reflecting the Fund’s unsubsidized expense ratio. The net annual fund operating expenses ratio (if applicable) includes contractual waivers of the Adviser and reflects the Fund’s subsidized expense ratio. Ratios may be higher or lower than those shown in the “Financial Highlights” in this report.
Schedule of Investments
Following the performance overview section is the Fund’s Schedule of Investments. This schedule reports the types of securities held in the Fund on the last day of the reporting period. Securities are usually listed by type (common stock, corporate bonds, U.S. Government obligations, etc.) and by industry classification (banking, communications, insurance, etc.). Holdings are subject to change without notice.
The value of each security is quoted as of the last day of the reporting period. The value of securities denominated in foreign currencies is converted into U.S. dollars.
If the Fund invests in foreign securities, it will also provide a summary of investments by country. This summary reports the Fund exposure to different countries by providing the percentage of securities invested in each country. The country of each security represents the country of risk. The Fund’s Schedule of Investments relies upon the industry group and country classifications published by Bloomberg and/or MSCI Inc.
Tables listing details of individual forward currency contracts, futures, written options, swaptions, and swaps follow the Fund’s Schedule of Investments (if applicable).
Statement of Assets and Liabilities
This statement is often referred to as the “balance sheet.” It lists the assets and liabilities of the Fund on the last day of the reporting period.
Janus Henderson Sustainable Multi-Asset Allocation Fund
Useful Information About Your Fund Report (unaudited)
The Fund’s assets are calculated by adding the value of the securities owned, the receivable for securities sold but not yet settled, the receivable for dividends declared but not yet received on securities owned, and the receivable for Fund shares sold to investors but not yet settled. The Fund’s liabilities include payables for securities purchased but not yet settled, Fund shares redeemed but not yet paid, and expenses owed but not yet paid. Additionally, there may be other assets and liabilities such as unrealized gain or loss on forward currency contracts.
The section entitled “Net Assets Consist of” breaks down the components of the Fund’s net assets. Because the Fund must distribute substantially all earnings, you will notice that a significant portion of net assets is shareholder capital.
The last section of this statement reports the net asset value (“NAV”) per share on the last day of the reporting period. The NAV is calculated by dividing the Fund’s net assets for each share class (assets minus liabilities) by the number of shares outstanding.
Statement of Operations
This statement details the Fund’s income, expenses, realized gains and losses on securities and currency transactions, and changes in unrealized appreciation or depreciation of Fund holdings.
The first section in this statement, entitled “Investment Income,” reports the dividends earned from securities and interest earned from interest-bearing securities in the Fund.
The next section reports the expenses incurred by the Fund, including the advisory fee paid to the investment adviser, transfer agent fees and expenses, and printing and postage for mailing statements, financial reports and prospectuses. Expense offsets and expense reimbursements, if any, are also shown.
The last section lists the amounts of realized gains or losses from investment and foreign currency transactions, and changes in unrealized appreciation or depreciation of investments and foreign currency-denominated assets and liabilities. The Fund will realize a gain (or loss) when it sells its position in a particular security. A change in unrealized gain (or loss) refers to the change in net appreciation or depreciation of the Fund during the reporting period. “Net Realized and Unrealized Gain/(Loss) on Investments” is affected both by changes in the market value of Fund holdings and by gains (or losses) realized during the reporting period.
Statements of Changes in Net Assets
These statements report the increase or decrease in the Fund’s net assets during the reporting period. Changes in the Fund’s net assets are attributable to investment operations, dividends and distributions to investors, and capital share transactions. This is important to investors because it shows exactly what caused the Fund’s net asset size to change during the period.
The first section summarizes the information from the Statement of Operations regarding changes in net assets due to the Fund’s investment operations. The Fund’s net assets may also change as a result of dividend and capital gains distributions to investors. If investors receive their dividends and/or distributions in cash, money is taken out of the Fund to pay the dividend and/or distribution. If investors reinvest their dividends and/or distributions, the Fund’s net assets will not be affected.
The reinvestment of dividends and distributions is included under “Capital Share Transactions.” “Capital Shares” refers to the money investors contribute to the Fund through purchases or withdrawals via redemptions. The Fund’s net assets will increase and decrease in value as investors purchase and redeem shares from the Fund.
Financial Highlights
This schedule provides a per-share breakdown of the components that affect the Fund’s NAV for current and past reporting periods as well as total return, asset size, ratios, and portfolio turnover rate.
The first line in the table reflects the NAV per share at the beginning of the reporting period. The next line reports the net investment income/(loss) per share. Following is the per share total of net gains/(losses), realized and unrealized. Per share dividends and distributions to investors are then subtracted to arrive at the NAV per share at the end of the period. The next line reflects the total return for the period. The total return may include adjustments in accordance with generally accepted accounting principles required at the period end for financial reporting purposes. As a result, the total return may differ from the total return reflected for individual shareholder transactions. Also included are ratios of expenses and net investment income to average net assets.
Janus Henderson Sustainable Multi-Asset Allocation Fund
Useful Information About Your Fund Report (unaudited)
The Fund’s expenses may be reduced through expense offsets and expense reimbursements. The ratios shown reflect expenses before and after any such offsets and reimbursements.
The ratio of net investment income/(loss) summarizes the income earned less expenses, divided by the average net assets of the Fund during the reporting period. Do not confuse this ratio with the Fund’s yield. The net investment income ratio is not a true measure of the Fund’s yield because it does not take into account the dividends distributed to the Fund’s investors.
The next figure is the portfolio turnover rate, which measures the buying and selling activity in the Fund. Portfolio turnover is affected by market conditions, changes in the asset size of the Fund, fluctuating volume of shareholder purchase and redemption orders, the nature of the Fund’s investments, and the investment style and/or outlook of the portfolio manager(s) and/or investment personnel. A 100% rate implies that an amount equal to the value of the entire portfolio was replaced once during the fiscal year; a 50% rate means that an amount equal to the value of half the portfolio is traded in a year; and a 200% rate means that an amount equal to the value of the entire portfolio is traded every six months.
Janus Henderson Sustainable Multi-Asset Allocation Fund
Designation Requirements (unaudited)
For federal income tax purposes, the Fund designated the following for the period ended June 30, 2023:
| | |
| | |
Dividends Received Deduction Percentage | 13% |
Qualified Dividend Income Percentage | 43% |
Janus Henderson Sustainable Multi-Asset Allocation Fund
Trustees and Officers (unaudited)
The following are the Trustees and officers of the Trust, together with a brief description of their principal occupations during the last five years (principal occupations for certain Trustees may include periods over five years). The Fund’s Statement of Additional Information includes additional information about the Trustees and officers and is available, without charge, by calling 1-877-335-2687.
Each Trustee has served in that capacity since he or she was originally elected or appointed. The Trustees do not serve a specified term of office. Each Trustee will hold office until the termination of the Trust or his or her earlier death, resignation, retirement, incapacity, or removal. Under the Fund’s Governance Procedures and Guidelines, the policy is for Trustees to retire no later than the end of the calendar year in which the Trustee turns 75. The Trustees review the Fund’s Governance Procedures and Guidelines from time to time and may make changes they deem appropriate. The Fund’s Nominating and Governance Committee will consider nominees for the position of Trustee recommended by shareholders. Shareholders may submit the name of a candidate for consideration by the Committee by submitting their recommendations to the Trust’s Secretary. Each Trustee is currently a Trustee of one other registered investment company advised by the Adviser: Janus Aspen Series. Collectively, these two registered investment companies consist of 49 series or funds referred to herein as the Fund Complex.
The Trust’s officers are elected annually by the Trustees for a one-year term. Certain officers also serve as officers of Janus Aspen Series. Certain officers of the Fund may also be officers and/or directors of the Adviser. Except as otherwise disclosed, Fund officers receive no compensation from the Fund, except for the Fund’s Chief Compliance Officer, as authorized by the Trustees.
| | | | | | |
TRUSTEES |
Name, Address, and Age | Positions Held with the Trust | Length of Time Served | Principal Occupations During the Past Five Years | Number of Portfolios/Funds in Fund Complex Overseen by Trustee | Other Directorships Held by Trustee During the Past Five Years |
Independent Trustees | | | | |
Alan A. Brown
151 Detroit Street
Denver, CO 80206
DOB: 1962 | Chairman
Trustee | 5/22-Present
1/13-Present | Principal, Curam Holdings LLC (since 2018). Formerly, Executive Vice President, Institutional Markets, of Black Creek Group (private equity real estate investment management firm) (2012-2018), Executive Vice President and Co-Head, Global Private Client Group (2007-2010), Executive Vice President, Mutual Funds (2005-2007), and Chief Marketing Officer (2001-2005) of Nuveen Investments, Inc. (asset management). | 49 | Advisory Board Member of AEW Core Property Trust (open-end property fund) (since 2020), and Director of WTTW (PBS affiliate) (since 2003). Formerly, Director of MotiveQuest LLC (strategic social market research company) (2003-2016), Director of Nuveen Global Investors LLC (2007-2011), Director of Communities in Schools (2004-2010), and Director of Mutual Fund Education Alliance (until 2010). |
Janus Henderson Sustainable Multi-Asset Allocation Fund
Trustees and Officers (unaudited)
| | | | | | |
TRUSTEES |
Name, Address, and Age | Positions Held with the Trust | Length of Time Served | Principal Occupations During the Past Five Years | Number of Portfolios/Funds in Fund Complex Overseen by Trustee | Other Directorships Held by Trustee During the Past Five Years |
Independent Trustees | | | | |
Cheryl D. Alston
151 Detroit Street
Denver, CO 80206
DOB: 1966 | Trustee | 8/22-Present | Executive Director and Chief Investment Officer, Employees’ Retirement Fund of the City of Dallas (since 2004). | 49 | Director of Blue Cross Blue Shield of Kansas City (a not-for-profit health insurance provider) (since 2016) and Director of Global Life Insurance (life and supplemental health insurance provider) (since 2017). Formerly, Director of Federal Home Loan Bank of Dallas (2017-2021). |
Janus Henderson Sustainable Multi-Asset Allocation Fund
Trustees and Officers (unaudited)
| | | | | | |
TRUSTEES |
Name, Address, and Age | Positions Held with the Trust | Length of Time Served | Principal Occupations During the Past Five Years | Number of Portfolios/Funds in Fund Complex Overseen by Trustee | Other Directorships Held by Trustee During the Past Five Years |
Independent Trustees | | | | |
Janus Henderson Sustainable Multi-Asset Allocation Fund
Trustees and Officers (unaudited)
| | | | | | |
William D. Cvengros
151 Detroit Street
Denver, CO 80206
DOB: 1948 | Trustee | 1/11-Present | Chief Executive Officer of SJC Capital, LLC (a personal investment company and consulting firm) (since 2002). Formerly, Chief Executive Officer and President of PIMCO Advisors Holdings L.P. (a publicly traded investment management firm) (1994-2000), and Chief Investment Officer (1987-1994) and Vice Chairman and Director (1990-1994) of Pacific Life Insurance Company (a mutual life insurance and annuity company) (1987-1994). | 49 | Member, Limited Partner Advisory Committee, Karmel Capital Fund III (later stage growth fund) (since 2022), Member of the Investment Committee for the Orange County Community Foundation (a grantmaking foundation) (since 2020), Advisory Board Member, RevOZ Fund LP and related funds (real estate investments for opportunity zones) (since 2020), and Advisory Board Member, Innovate Partners Emerging Growth and Equity Fund I (early stage venture capital fund) (since 2014). Formerly, Managing Trustee of National Retirement Partners Liquidating Trust (2013-2016), Chairman, National Retirement Partners, Inc. (formerly a network of advisors to 401(k) plans) (2005-2013), Director of Prospect Acquisition Corp. (a special purpose acquisition corporation) (2007-2009), Director of RemedyTemp, Inc. (temporary help services company) (1996-2006), and Trustee of PIMCO Funds Multi-Manager Series (1990-2000) and Pacific Life Variable Life & Annuity Trusts (1987-1994). |
Janus Henderson Sustainable Multi-Asset Allocation Fund
Trustees and Officers (unaudited)
| | | | | | |
TRUSTEES |
Name, Address, and Age | Positions Held with the Trust | Length of Time Served | Principal Occupations During the Past Five Years | Number of Portfolios/Funds in Fund Complex Overseen by Trustee | Other Directorships Held by Trustee During the Past Five Years |
Independent Trustees | | | | |
Raudline Etienne
151 Detroit Street
Denver, CO 80206
DOB: 1965 | Trustee | 6/16-Present | Founder, Daraja Capital (advisory and investment firm) (since 2016). Formerly, Senior Vice President and Senior Advisor, Albright Stonebridge Group LLC (global strategy firm) (2011-2021), and Deputy Comptroller and Chief Investment Officer, New York State Common Retirement Fund (public pension fund) (2008-2011). | 49 | Member of the Investment Committee for Cooper Union (private college) (since 2021) and Director of Brightwood Capital Advisors, LLC (since 2014). Formerly, Board Member, Van Alen Institute (nonprofit architectural and design organization) (2019-2022). |
Darrell B. Jackson
151 Detroit Street
Denver, CO 80206
DOB: 1958 | Trustee | 8/22-Present | President and Chief Executive Officer, The Efficace Group Inc. (since 2018). Formerly, President and Chief Executive Officer, Seaway Bank and Trust Company (community bank) (2014-2015), and Executive Vice President and Co-President, Wealth Management (2009-2014), and several senior positions, including Group Executive, Senior Vice President, and Vice President (1995-2009) of Northern Trust Company (financial services company) (1995-2014). | 49 | Director of Amalgamated Financial Corp (bank) (since August 2021), Director of YR Media (a not-for-profit production company) (since 2021), and Director of Gray-Bowen-Scott (transportation project consulting firm) (since April 2020). Formerly, Director of Delaware Place Bank (closely held commercial bank) (2016-2018) and Director of Seaway Bank and Trust Company (2014-2015). |
Janus Henderson Sustainable Multi-Asset Allocation Fund
Trustees and Officers (unaudited)
| | | | | | |
TRUSTEES |
Name, Address, and Age | Positions Held with the Trust | Length of Time Served | Principal Occupations During the Past Five Years | Number of Portfolios/Funds in Fund Complex Overseen by Trustee | Other Directorships Held by Trustee During the Past Five Years |
Independent Trustees | | | | |
William F. McCalpin
151 Detroit Street
Denver, CO 80206
DOB: 1957 | Trustee | 6/02-Present | Chief Executive Officer, muun chi LLC (organic food business) (since 2022) and Independent Consultant (since 2019). Formerly, Chief Operating Officer, muun chi LLC (2020-2022), Managing Partner, Impact Investments, Athena Capital Advisors LLC (independent registered investment advisor) (2016-2019), Managing Director, Holos Consulting LLC (provides consulting services to foundations and other nonprofit organizations) (2009-2016), Chief Executive Officer, Imprint Capital Advisors (impact investment firm) (2013-2015), and Executive Vice President and Chief Operating Officer of The Rockefeller Brothers Fund (a private family foundation) (1998-2006). | 49 | Chairman of the Board and Trustee of The Investment Fund for Foundations Investment Program (TIP) (consisting of 1 fund) (since 2008). Formerly, Director of the F.B. Heron Foundation (a private grantmaking foundation) (2006-2022), and Director of Mutual Fund Directors Forum (a non-profit organization serving independent directors of U.S. mutual funds) (2016-2021). |
Janus Henderson Sustainable Multi-Asset Allocation Fund
Trustees and Officers (unaudited)
| | | | | | |
TRUSTEES |
Name, Address, and Age | Positions Held with the Trust | Length of Time Served | Principal Occupations During the Past Five Years | Number of Portfolios/Funds in Fund Complex Overseen by Trustee | Other Directorships Held by Trustee During the Past Five Years |
Independent Trustees | | | | |
Gary A. Poliner
151 Detroit Street
Denver, CO 80206
DOB: 1953 | Trustee | 6/16-Present | Retired. Formerly, President (2010-2013) of Northwestern Mutual Life Insurance Company. | 49 | Director of MGIC Investment Corporation (private mortgage insurance) (since 2013). Formerly, Director, West Bend Mutual Insurance Company (property/casualty insurance) (2013-2021), Trustee of Northwestern Mutual Life Insurance Company (2010-2013) and Director of Frank Russell Company (global asset management firm) (2008-2013). |
Diane L. Wallace
151 Detroit Street
Denver, CO 80206
DOB: 1958 | Trustee | 6/17-Present | Retired. Formerly, Chief Operating Officer, Senior Vice President-Operations, and Chief Financial Officer for Driehaus Capital Management, LLC (1988-2006) and Treasurer for Driehaus Mutual Funds (1996-2002). | 49 | Formerly, Director of Family Service of Lake County (2019-2021), Independent Trustee, Henderson Global Funds (13 portfolios) (2015-2017), Independent Trustee, State Farm Associates’ Funds Trust, State Farm Mutual Fund Trust, and State Farm Variable Product Trust (28 portfolios) (2013-2017). |
Janus Henderson Sustainable Multi-Asset Allocation Fund
Trustees and Officers (unaudited)
| | | | |
OFFICERS |
Name, Address, and Age | Positions Held with the Trust | Term of Office* and Length of Time Served | Principal Occupations During the Past Five Years |
Oliver Blackbourn
151 Detroit Street
Denver, CO 80206
DOB: 1986 | Executive Vice President and Co-Portfolio Manager
Janus Henderson Sustainable Multi-Asset Allocation Fund | 8/22-Present | Portfolio Manager for other Janus Henderson accounts. |
Nick Harper
151 Detroit Street
Denver, CO 80206
DOB: 1984 | Executive Vice President and Co-Portfolio Manager
Janus Henderson Sustainable Multi-Asset Allocation Fund | 8/22-Present | Portfolio Manager for other Janus Henderson accounts. |
Michelle Rosenberg
151 Detroit Street
Denver, CO 80206
DOB: 1973 | President and Chief Executive Officer | 9/22-Present | General Counsel and Corporate Secretary of Janus Henderson Investors (since 2018). Formerly, Interim President and Chief Executive Officer of the Trust and Janus Aspen Series (2022), Senior Vice President and Head of Legal, North America of Janus Henderson Investors (2017-2018) and Deputy General Counsel of Janus Henderson US (Holdings) Inc. (2015-2018). |
Kristin Mariani
151 Detroit Street
Denver, CO 80206
DOB: 1966 | Vice President and Chief Compliance Officer | 7/20-Present | Head of Compliance, North America at Janus Henderson Investors (since September 2020) and Chief Compliance Officer at Janus Henderson Investors US LLC (since September 2017). Formerly, Anti-Money Laundering Officer for the Trust and Janus Aspen Series (July 2020-December 2022), Global Head of Investment Management Compliance at Janus Henderson Investors (February 2019-August 2020), Vice President, Head of Global Distribution Compliance and Chief Compliance Officer at Janus Henderson Distributors US LLC (May 2017-September 2017), Vice President, Compliance at Janus Henderson US (Holdings) Inc., Janus Henderson Investors US LLC, and Janus Henderson Distributors US LLC (2009-2017). |
Janus Henderson Sustainable Multi-Asset Allocation Fund
Trustees and Officers (unaudited)
| | | | |
OFFICERS |
Name, Address, and Age | Positions Held with the Trust | Term of Office* and Length of Time Served | Principal Occupations During the Past Five Years |
Jesper Nergaard
151 Detroit Street
Denver, CO 80206
DOB: 1962 | Chief Financial Officer
Vice President, Treasurer, and Principal Accounting Officer | 3/05-Present
2/05-Present | Head of U.S. Fund Administration, Janus Henderson Investors and Janus Henderson Services US LLC. |
Abigail J. Murray
151 Detroit Street
Denver, CO 80206
DOB: 1975 | Vice President, Chief Legal Counsel, and Secretary | 12/20-Present | Managing Counsel (since 2020). Formerly, Senior Counsel for Invesco Ltd. (2017-2020), and Vice President and Senior Counsel, ALPS Fund Services, Inc. and Assistant General Counsel, ALPS Advisors, Inc. (2015-2017). |
Ciaran Askin
151 Detroit Street
Denver, CO 80206
DOB: 1978 | Anti-Money Laundering Officer | 12/22-Present | Global Head of Financial Crime, Janus Henderson Investors (since 2022). Formerly, Global Head of Financial Crime for Invesco Ltd. (2017-2022). |
* Officers are elected at least annually by the Trustees for a one-year term and may also be elected from time to time by the Trustees for an interim period. |
Janus Henderson Sustainable Multi-Asset Allocation Fund
Notes
NotesPage1
| | | | | | | | |
| | | | | |

| | | | |
This report is submitted for the general information of shareholders of the Fund. It is not an offer or solicitation for the Fund and is not authorized for distribution to prospective investors unless preceded or accompanied by an effective prospectus. |
Janus Henderson is a trademark of Janus Henderson Group plc or one of its subsidiaries. © Janus Henderson Group plc Janus Henderson Distributors US LLC Janus Henderson Group is the ultimate parent of Janus Henderson Distributors US LLC |
| | | | 125-02-93096 08-23 |
(b) Not applicable.
Item 2 - Code of Ethics
As of the end of the period covered by this Form N-CSR, the Registrant has adopted a Code of Ethics (as defined in Item 2(b) of Form N-CSR), which is posted on the Registrant's website: janushenderson.com. Registrant intends to post any amendments to, or waivers from (as defined in Item 2 of Form N-CSR), such code on janushenderson.com within five business days following the date of such amendment or waiver.
Item 3 - Audit Committee Financial Expert
The Registrant's Board of Trustees has determined that the following members of the Board's Audit Committee are "audit committee financial experts," as defined in Item 3 to Form N-CSR: William D. Cvengros, Gary A. Poliner, Diane Wallace, and Cheryl D. Alston who are each "independent" under the standards set forth in Item 3 to Form N-CSR.
Item 4 - Principal Accountant Fees and Services
Janus Investment Fund (the "Trust"), a Massachusetts business trust registered under the Investment Company Act of 1940, as amended, as an open-end investment company, offers 39 funds which include multiple series of shares with differing investment objectives and policies. The funds comprising the Trust have differing fiscal year ends (June 30 and September 30). This Form N-CSR relates to funds with June 30 fiscal year ends (the "Funds").
(a) Audit Fees
The aggregate fees billed for each of the last two fiscal years for professional services rendered by the principal accountant for the audit of the Funds' annual financial statements or services that are normally provided by the accountant in connection with statutory and regulatory filings or engagements for those fiscal years were $965,556 in fiscal 2023 and $880,714 in fiscal 2022.
(b) Audit-Related Fees
The aggregate fees billed in each of the last two fiscal years for assurance and related services by the principal accountant that are reasonably related to the performance of the audit of the Funds' financial statements and are not reported under paragraph (a) of this Item were $0 in fiscal 2023 and $0 in fiscal 2022.
(c) Tax Fees
The aggregate fees billed in each of the last two fiscal years for professional services rendered by the principal accountant for tax compliance, tax advice, and tax planning were $196,687 in fiscal 2023 and $167,622 in fiscal 2022.
The nature of the services comprising the fees disclosed under this category includes tax compliance, tax planning, tax advice, and corporate actions review.
(d) All Other Fees
The aggregate fees billed in each of the last two fiscal years for products and services provided by the principal accountant, other than the services reported in paragraphs (a) through (c) of this Item were $0 in fiscal 2023 and $0 in fiscal 2022.
(e) (1) The registrant's Audit Committee Charter requires the registrant's Audit Committee to pre-approve any engagement of the principal accountant (i) to provide audit or non-audit services to the registrant or (ii) to provide non-audit services to the registrant's investment adviser or any entity controlling, controlled by, or under common control with the investment adviser that provides ongoing services to the registrant, if the engagement relates directly to the operations and financial reporting of the registrant, except for those non-audit services that were subject to the pre-approval exception under Rule 2-01 of Regulation S-X. The Chairman of the Audit Committee or, if the Chairman is unavailable, another member of the Audit Committee who is an independent Trustee, may grant the pre-approval. All such delegated pre-approvals must be presented to the Audit Committee no later than the next Audit Committee meeting.
(2) No services described in paragraphs (b) through (d) of this Item were approved by the Registrant’s audit committee pursuant to paragraph (c)(7)(i)(C) of Rule 2-01 of Regulation S-X.
(f) Not applicable as less than 50%
(g) The aggregate non-audit fees billed by the registrant's accountant for services rendered to the registrant, and rendered to the registrant's investment adviser (not including any sub-adviser whose role is primarily portfolio management and is subcontracted with or overseen by another investment adviser), and any entity controlling, controlled by, or under common control with the adviser that provides ongoing services to the registrant for each of the last two fiscal years of the registrant were $196,687 in fiscal 2023 and $167,622 in fiscal 2022.
(h) The registrant's audit committee of the board of trustees has considered whether the provision of non-audit services that were rendered to the registrant's investment adviser (not including any subadviser whose role is primarily portfolio management and is subcontracted with or overseen by another investment adviser), and any entity controlling, controlled by, or under common control with the investment adviser that provides ongoing services to the registrant that were not pre-approved pursuant to paragraph (c)(7)(ii) of Rule 2-01 of Regulation S-X is compatible with maintaining the principal accountant's independence.
(i) Not applicable.
(j) Not applicable.
Item 5 - Audit Committee of Listed Registrants
Not applicable.
Item 6 - Investments
(a) Schedule of Investments is contained in the Reports to Shareholders included under Item 1 of this Form N-CSR.
(b) Not applicable.
Item 7 - Disclosure of Proxy Voting Policies and Procedures for Closed-End Management Investment Companies
Not applicable to this Registrant.
Item 8 - Portfolio Managers of Closed-End Management Investment Companies
Not applicable to this Registrant.
Item 9 - Purchases of Equity Securities by Closed-End Management Investment Company and Affiliated Purchasers
Not applicable to this Registrant.
Item 10 - Submission of Matters to a Vote of Security Holders
There have been no material changes to the procedures by which shareholders may recommend nominees to the Registrant's Board of Trustees.
Item 11 - Controls and Procedures
(a) The Registrant's Principal Executive Officer and Principal Financial Officer have evaluated the Registrant's disclosure controls and procedures (as defined in Rule 30a-3(c) under the Investment Company Act of 1940, as amended) within 90 days of this filing and have concluded that the Registrant's disclosure controls and procedures were effective, as of that date.
(b) There have been no changes in the Registrant's internal control over financial reporting (as defined in Rule 30a-3(d) under the Investment Company Act of 1940, as amended) that occurred during the period covered by this report that have materially affected, or are reasonably likely to materially affect, the Registrant's internal control over financial reporting.
Item 12 - Disclosure of Securities Lending Activities for Closed-End Management Investment Companies
(a) Not applicable.
(b) Not applicable.
Item 13 - Exhibits
(a)(1) Not applicable because the Registrant has posted its Code of Ethics (as defined in Item 2(b) of Form N-CSR) on its website pursuant to paragraph (f)(2) of Item 2 of Form N-CSR.
(a)(2) Separate certifications for the Registrant's Principal Executive Officer and Principal Financial Officer, as required under Rule 30a-2(a) under the Investment Company Act of 1940, as amended, are attached as Ex99CERT.
(b) A certification for the Registrant's Principal Executive Officer and Principal Financial Officer, as required by Rule 30a-2(b) under the Investment Company Act of 1940, as amended, is attached as Ex99.906CERT.
Signatures
Pursuant to the requirements of the Securities Exchange Act of 1934, as amended, and the Investment Company Act of 1940, as amended, the Registrant has duly caused this report to be signed on its behalf by the undersigned, thereunto duly authorized.
Janus Investment Fund
By: /s/ Michelle Rosenberg
Michelle Rosenberg, President and Chief Executive Officer of Janus Investment Fund
(Principal Executive Officer)
Date: August 29, 2023
Pursuant to the requirements of the Securities Exchange Act of 1934, as amended, and the Investment Company Act of 1940, as amended, this report has been signed below by the following persons on behalf of the Registrant and in the capacities and on the dates indicated.
By: /s/ Michelle Rosenberg
Michelle Rosenberg, President and Chief Executive Officer of Janus Investment Fund
(Principal Executive Officer)
Date: August 29, 2023
By: /s/ Jesper Nergaard
Jesper Nergaard, Vice President, Chief Financial Officer, Treasurer and Principal Accounting Officer of Janus Investment Fund
(Principal Accounting Officer and Principal Financial Officer)
Date: August 29, 2023