Returns quoted are past performance and do not guarantee future results; current performance may be lower or higher. For the most recent month-end performance call 800.668.0434 (or 800.525.3713 if you hold shares directly with Janus Henderson) or visit janushenderson.com/performance (or janushenderson.com/allfunds if you hold shares directly with Janus Henderson).
You could lose money by investing in the Fund. Although the Fund seeks to preserve the value of your investment at $1.00 per share, it cannot guarantee it will do so. The Fund may impose a fee upon the sale of your shares or may temporarily suspend your ability to sell shares if the Fund’s liquidity falls below required minimums because of market conditions or other factors. An investment in the Fund is not insured or guaranteed by the Federal Deposit Insurance Corporation or any other government agency. The Fund’s sponsor has no legal obligation to provide financial support to the Fund, and you should not expect that the sponsor will provide financial support to the Fund at any time.
Returns include reinvestment of all dividends and distributions.
The yield more closely reflects the current earnings of the money market fund than the total return.
Class D Shares of the Fund commenced operations on February 16, 2010. Performance shown for periods prior to February 16, 2010, reflects the performance of the Fund’s former Class J Shares, the initial share class (renamed Class T Shares effective February 16, 2010), calculated using the fees and expenses in effect during the periods shown, net of any applicable fee and expense limitations or waivers.
If Class D Shares of the Fund had been available during periods prior to February 16, 2010, the performance shown may have been different. The performance shown for periods following the Fund’s commencement of Class D Shares reflects the fees and expenses of Class D Shares, net of any applicable fee and expense limitations or waivers. Please refer to the Fund’s prospectuses for further details concerning historical performance.
See Notes to Schedule of Investments and Other Information and Notes to Financial Statements.
‡ As stated in the prospectus. See Financial Highlights for actual expense ratios during the reporting period.
As a shareholder of the Fund, you incur two types of costs: (1) transaction costs and (2) ongoing costs, including management fees; transfer agent fees and expenses payable pursuant to the Transfer Agency Agreement; and other Fund expenses. This example is intended to help you understand your ongoing costs (in dollars) of investing in the Fund and to compare these costs with the ongoing costs of investing in other mutual funds. To do so, compare this 5% hypothetical example with the 5% hypothetical examples that appear in the shareholder reports of the other funds. The example is based upon an investment of $1,000 invested at the beginning of the period and held for the six-months indicated, unless noted otherwise in the table and footnotes below.
The information in the table under the heading “Actual” provides information about actual account values and actual expenses. You may use the information in these columns, together with the amount you invested, to estimate the expenses that you paid over the period. Simply divide your account value by $1,000 (for example, an $8,600 account value divided by $1,000 = 8.6), then multiply the result by the number in the appropriate column for your share class under the heading entitled “Expenses Paid During Period” to estimate the expenses you paid on your account during the period.
The information in the table under the heading “Hypothetical (5% return before expenses)” provides information about hypothetical account values and hypothetical expenses based upon the Fund’s actual expense ratio and an assumed rate of return of 5% per year before expenses, which is not the Fund’s actual return. The hypothetical account values and expenses may not be used to estimate the actual ending account balance or expenses you paid for the period. You may use this information to compare the ongoing costs of investing in the Fund and other funds. To do so, compare this 5% hypothetical example with the 5% hypothetical examples that appear in the shareholder reports of the other funds. Additionally, for an analysis of the fees associated with an investment in either share class or other similar funds, please visit www.finra.org/fundanalyzer.
Please note that the expenses shown in the table are meant to highlight your ongoing costs only and do not reflect any transaction costs. These fees are fully described in the Fund’s prospectuses. Therefore, the hypothetical examples are useful in comparing ongoing costs only, and will not help you determine the relative total costs of owning different funds. In addition, if these transaction costs were included, your costs would have been higher.
Money market funds may hold securities with stated maturities of greater than 397 days when those securities have features that allow a fund to “put” back the security to the issuer or to a third party within 397 days of acquisition. The maturity dates shown in the security descriptions are the stated maturity dates.
Janus Henderson Money Market Fund (the “Fund”) is a series fund. The Fund is part of Janus Investment Fund (the “Trust”), which is organized as a Massachusetts business trust and is registered under the Investment Company Act of 1940, as amended (the “1940 Act”), as an open-end management investment company, and therefore has applied the specialized accounting and reporting guidance in Financial Accounting Standards Board (“FASB”) Accounting Standards Codification (“ASC”) Topic 946. The Trust offers 38 Funds which include multiple series of shares, with differing investment objectives and policies. The Fund seeks capital preservation and liquidity with current income as a secondary objective. Janus Henderson Investors US LLC (formerly Janus Capital Management LLC) is the investment adviser (the “Adviser”) to the Fund.
The Fund offers two classes of shares in order to meet the needs of various types of investors. Each class represents an interest in the same portfolio of investments. Certain financial intermediaries may not offer both classes of shares.
The Fund is classified as a “retail money market fund,” as such term is defined in or interpreted under the rules governing money market funds. A retail money market fund is a money market fund that has policies and procedures reasonably designed to limit all beneficial owners of the Fund to natural persons, which means that the Fund’s Shares can only be held through individual investors. In order to make an initial investment in the Fund, the Fund requires that a shareholder provide certain information (e.g., Social Security number or government-issued identification) that confirms your eligibility to invest in the Fund. Accounts that are not beneficially owned by natural persons, such as business and limited liability company accounts, charitable or financial organizations, and corporate and S-Corp accounts, are not eligible to invest in the Fund, and will be involuntarily redeemed from the Fund after having been provided sufficient notice.
As a retail money market fund, the Fund may be subject to liquidity fees and/or redemption gates on fund redemptions if the Fund’s liquidity falls below required minimums because of market conditions or other factors. Liquidity fees and redemption gates are most likely to be imposed during times of extraordinary market stress. Pursuant to Rule 2a-7 under the 1940 Act, the Trustees are permitted to impose a liquidity fee on redemptions from the Fund (up to 2%) or a redemption gate to temporarily restrict redemptions from the Fund for up to 10 business days (in any 90-day period) in the event that the Fund’s weekly liquid assets fall below certain designated thresholds.
If the Fund’s weekly liquid assets fall below 30% of the Fund’s total assets, the Trustees are permitted, but not required, to (i) impose a liquidity fee of no more than 2% of the amount redeemed and/or (ii) impose a redemption gate to temporarily suspend the right of redemption. If the Fund’s weekly liquid assets fall below 10% of the Fund’s total assets, the Fund will impose, generally as of the beginning of the next business day, a liquidity fee of 1% of the amount redeemed unless the Trustees determine that such a fee would not be in the best interests of the Fund or determines that a lower or higher fee (subject to the 2% limit) would be in the best interests of the Fund. A liquidity fee or redemption gate may be imposed as early as the same day that the Fund's weekly liquid assets fall below the 30% or 10% thresholds.
Shareholders, including individuals, accounts, as well as the Fund’s portfolio manager(s) and/or investment personnel, may from time to time own (beneficially or of record) a significant percentage of the Fund’s Shares and can be considered to “control” the Fund when that ownership exceeds 25% of the Fund’s assets (and which may differ from control as determined in accordance with United States of America generally accepted accounting principles ("US GAAP")).
Effective July 6, 2020, Class D Shares are available to new investors, subject to any closed fund policies for a Fund, as applicable. Previously, Class D Shares were only available to investors who already had a direct account with the Janus Henderson funds; immediate family members or members of the same household of an eligible individual investor; and existing beneficial owners of sole proprietorships or partnerships that hold accounts directly with the Janus Henderson funds.
Class T Shares are available through certain financial intermediary platforms including, but not limited to, mutual fund wrap fee programs, managed account programs, asset allocation programs, bank trust platforms, as well as certain retirement platforms. In addition, Class T Shares may be available through certain financial intermediaries who have an agreement with the Adviser or its affiliates to offer Class T Shares on their supermarket platforms.
The following accounting policies have been followed by the Fund and are in conformity with US GAAP.
The Fund has adopted liquidity requirements (measured at the time of purchase) as noted:
The Fund will limit its investments in illiquid securities to 5% or less of its total assets.
Securities held by the Fund are valued in accordance with policies and procedures established by and under the supervision of the Trustees (the “Valuation Procedures”). Investments held by the Fund are valued utilizing the amortized cost method of valuation permitted in accordance with Rule 2a-7 under the 1940 Act and certain conditions therein. Under the amortized cost method, which does not take into account unrealized capital gains or losses, an instrument is initially valued at its cost and thereafter assumes a constant accretion/amortization to maturity of any discount or premium.
FASB ASC 820, Fair Value Measurements and Disclosures (“ASC 820”), defines fair value, establishes a framework for measuring fair value, and expands disclosure requirements regarding fair value measurements. This standard emphasizes that fair value is a market-based measurement that should be determined based on the assumptions that market participants would use in pricing an asset or liability and establishes a hierarchy that prioritizes inputs to valuation techniques used to measure fair value. These inputs are summarized into three broad levels:
Level 1 – Unadjusted quoted prices in active markets the Fund has the ability to access for identical assets or liabilities.
Level 2 – Observable inputs other than unadjusted quoted prices included in Level 1 that are observable for the asset or liability either directly or indirectly. These inputs may include quoted prices for the identical instrument on an inactive market, prices for similar instruments, interest rates, prepayment speeds, credit risk, yield curves, default rates and similar data.
Assets or liabilities categorized as Level 2 in the hierarchy generally include: debt securities fair valued in accordance with the evaluated bid or ask prices supplied by a pricing service; securities traded on OTC markets and listed securities for which no sales are reported that are fair valued at the latest bid price (or yield equivalent thereof) obtained from one or more dealers transacting in a market for such securities or by a pricing service approved by the Fund’s Trustees; certain short-term debt securities with maturities of 60 days or less that are fair valued at amortized cost; and equity securities of foreign issuers whose fair value is determined by using systematic fair valuation models provided by independent third parties in order to adjust for stale pricing which may occur between the close of certain foreign exchanges and the close of the NYSE.
Periodic review and monitoring of the valuation of short-term securities is performed in an effort to ensure that amortized cost approximates market value. Other securities that may be categorized as Level 2 in the hierarchy include, but are not limited to, preferred stocks, bank loans, swaps, investments in unregistered investment companies, options, and forward contracts.
Level 3 – Unobservable inputs for the asset or liability to the extent that relevant observable inputs are not available, representing the Fund’s own assumptions about the assumptions that a market participant would use in valuing the asset or liability, and that would be based on the best information available.
There have been no significant changes in valuation techniques used in valuing any such positions held by the Fund since the beginning of the fiscal year.
The inputs or methodology used for fair valuing securities are not necessarily an indication of the risk associated with investing in those securities. The summary of inputs used as of June 30, 2022 to fair value the Fund’s investments in securities and other financial instruments is included in the “Valuation Inputs Summary” in the Notes to Schedule of Investments and Other Information.
The Fund bears expenses incurred specifically on its behalf. Each class of shares bears a portion of general expenses, which are allocated daily to each class of shares based upon the ratio of net assets represented by each class as a percentage of total net assets. Expenses directly attributable to a specific class of shares are charged against the operations of such class.
The preparation of financial statements in conformity with US GAAP requires management to make estimates and assumptions that affect the reported amount of assets and liabilities and disclosure of contingent assets and liabilities at the date of the financial statements, and the reported amounts of income and expenses during the reporting period. Actual results could differ from those estimates.
In the normal course of business, the Fund may enter into contracts that contain provisions for indemnification of other parties against certain potential liabilities. The Fund’s maximum exposure under these arrangements is unknown, and would involve future claims that may be made against the Fund that have not yet occurred. Currently, the risk of material loss from such claims is considered remote.
Dividends, if any, are declared daily and distributed monthly for the Fund. Realized capital gains, if any, are declared and distributed in December. The Fund may treat a portion of the amount paid to redeem shares as a distribution of investment company taxable income and realized capital gains that are reflected in the net asset value. This practice, commonly referred to as “equalization,” has no effect on the redeeming shareholder or the Fund’s total return, but may reduce the amounts that would otherwise be required to be paid as taxable dividends to the remaining shareholders. It is possible that the Internal Revenue Service (IRS) could challenge the Fund's equalization methodology or calculations, and any such challenge could result in additional tax, interest, or penalties to be paid by the Fund.
The Fund intends to continue to qualify as a regulated investment company and distribute all of its taxable income in accordance with the requirements of Subchapter M of the Internal Revenue Code. Management has analyzed the Fund’s tax positions taken for all open federal income tax years, generally a three-year period, and has concluded that no provision for federal income tax is required in the Fund’s financial statements. The Fund is not aware of any tax positions for which it is reasonably possible that the total amounts of unrecognized tax benefits will significantly change in the next twelve months.
2. Other Investments and Strategies
In response to the COVID-19 pandemic, the U.S. government and the Federal Reserve, as well as certain foreign governments and central banks, have taken extraordinary actions to support local and global economies and the
financial markets, including reducing interest rates to record-low levels. Extremely low or negative interest rates may become more prevalent or may not work as intended. As there is little precedent for this situation, the impact on various markets that interest rate or other significant policy changes may have is unknown. The withdrawal of this support, a failure of measures put in place in response to such economic uncertainty, or investor perception that such efforts were not sufficient could each negatively affect financial markets generally, and the value and liquidity of specific securities. In addition, policy and legislative changes in the United States and in other countries continue to impact many aspects of financial regulation.
Widespread disease, including pandemics and epidemics, and natural or environmental disasters, including those which may be attributable to global climate change, such as earthquakes, fires, floods, hurricanes, tsunamis and weather-related phenomena generally, have been and can be highly disruptive to economies and markets, adversely impacting individual companies, sectors, industries, markets, currencies, interest and inflation rates, credit ratings, investor sentiment, and other factors affecting the value of a Fund’s investments. Economies and financial markets throughout the world have become increasingly interconnected, which increases the likelihood that events or conditions in one region or country will adversely affect markets or issuers in other regions or countries, including the United States. These disruptions could prevent a Fund from executing advantageous investment decisions in a timely manner and negatively impact a Fund’s ability to achieve its investment objective(s). Any such event(s) could have a significant adverse impact on the value of a Fund. In addition, these disruptions could also impair the information technology and other operational systems upon which the Fund’s service providers, including the Adviser or the subadviser (as applicable), rely, and could otherwise disrupt the ability of employees of the Fund’s service providers to perform essential tasks on behalf of the Fund. Adverse weather conditions may also have a particularly significant negative effect on issuers in the agricultural sector and on insurance and reinsurance companies that insure or reinsure against the impact of natural disasters.
Fund transactions involving a counterparty are subject to the risk that the counterparty or a third party will not fulfill its obligation to the Fund (“counterparty risk”). Counterparty risk may arise because of the counterparty’s financial condition (i.e., financial difficulties, bankruptcy, or insolvency), market activities and developments, or other reasons, whether foreseen or not. A counterparty’s inability to fulfill its obligation may result in significant financial loss to the Fund. The Fund may be unable to recover its investment from the counterparty or may obtain a limited recovery, and/or recovery may be delayed. The extent of the Fund’s exposure to counterparty risk with respect to financial assets and liabilities approximates its carrying value. See the "Offsetting Assets and Liabilities" section of this Note for further details.
The Fund may be exposed to counterparty risk through its investments in certain securities, including, but not limited to, repurchase agreements and debt securities. The Fund intends to enter into financial transactions with counterparties that the Adviser believes to be creditworthy at the time of the transaction. There is always the risk that the Adviser’s analysis of a counterparty’s creditworthiness is incorrect or may change due to market conditions. To the extent that the Fund focuses its transactions with a limited number of counterparties, it will have greater exposure to the risks associated with one or more counterparties.
The Fund presents gross and net information about transactions that are either offset in the financial statements or subject to an enforceable master netting arrangement or similar agreement with a designated counterparty, regardless of whether the transactions are actually offset in the Statement of Assets and Liabilities.
The Offsetting Assets and Liabilities table located in the Schedule of Investments presents gross amounts of recognized assets and/or liabilities and the net amounts after deducting collateral that has been pledged by counterparties or has been pledged to counterparties (if applicable). For corresponding information grouped by type of instrument, see the Fund's Schedule of Investments.
All repurchase agreements are transacted under legally enforceable master repurchase agreements that give the Fund, in the event of default by the counterparty, the right to liquidate securities held and to offset receivables and payables with the counterparty. For financial reporting purposes, the Fund does not offset financial instruments' payables and receivables and related collateral on the Statement of Assets and Liabilities. Repurchase agreements held by the Fund are fully collateralized, and such collateral is in the possession of the Fund’s custodian or, for tri-party agreements, the custodian designated by the agreement. The collateral is evaluated daily to ensure its market value exceeds the current market value of the repurchase agreements, including accrued interest.
The Fund and other funds advised by the Adviser or its affiliates may transfer daily uninvested cash balances into one or more joint trading accounts. Assets in the joint trading accounts are invested in money market instruments and the proceeds are allocated to the participating funds on a pro rata basis.
Repurchase agreements held by the Fund are fully collateralized, and such collateral is in the possession of the Fund’s custodian or, for tri-party agreements, the custodian designated by the agreement. The collateral is evaluated daily to ensure its market value exceeds the current market value of the repurchase agreements, including accrued interest. In the event of default on the obligation to repurchase, the Fund has the right to liquidate the collateral and apply the proceeds in satisfaction of the obligation. In the event of default or bankruptcy by the other party to the agreement, realization and/or retention of the collateral or proceeds may be subject to legal proceedings.
The Fund may invest in U.S. and non-U.S. government debt securities (“sovereign debt”). Some investments in sovereign debt, such as U.S. sovereign debt, are considered low risk. However, investments in sovereign debt, especially the debt of less developed countries, can involve a high degree of risk, including the risk that the governmental entity that controls the repayment of sovereign debt may not be willing or able to repay the principal and/or to pay the interest on its sovereign debt in a timely manner. A sovereign debtor’s willingness or ability to satisfy its debt obligation may be affected by various factors including, but not limited to, its cash flow situation, the extent of its foreign currency reserves, the availability of foreign exchange when a payment is due, the relative size of its debt position in relation to its economy as a whole, the sovereign debtor’s policy toward international lenders, and local political constraints to which the governmental entity may be subject. Sovereign debtors may also be dependent on expected disbursements from foreign governments, multilateral agencies, and other entities. The failure of a sovereign debtor to implement economic reforms, achieve specified levels of economic performance, or repay principal or interest when due may result in the cancellation of third party commitments to lend funds to the sovereign debtor, which may further impair such debtor’s ability or willingness to timely service its debts. The Fund may be requested to participate in the rescheduling of such sovereign debt and to extend further loans to governmental entities, which may adversely affect the Fund’s holdings. In the event of default, there may be limited or no legal remedies for collecting sovereign debt and there may be no bankruptcy proceedings through which the Fund may collect all or part of the sovereign debt that a governmental entity has not repaid. In addition, to the extent the Fund invests in non-U.S. sovereign debt, it may be subject to currency risk.
The Fund also may purchase variable and floating rate demand notes of corporations and other entities, which are unsecured obligations redeemable upon not more than 30 days’ notice. The Fund may purchase variable and floating rate demand notes of U.S. Government issuers or commercial banks. These obligations include master demand notes that permit investment of fluctuating amounts at varying rates of interest pursuant to direct arrangements with the issuer of the instrument. The issuer of these obligations often has the right, after a given period, to prepay the outstanding principal amount of the obligations upon a specified number of days’ notice. These obligations generally are not traded, nor generally is there an established secondary market for these obligations. To the extent a demand note
does not have a seven day or shorter demand feature and there is no readily available market for the obligation, it is treated as an illiquid investment. The rate of interest on securities purchased by the Fund may be tied to short-term Treasury or other government securities or indices on securities that are permissible investments of the Fund, as well as other money market rates of interest. The Fund will not purchase securities whose values are tied to interest rates or indices that are not appropriate for the duration and volatility standards of a money market fund.
3. Investment Advisory Agreements and Other Transactions with Affiliates
The Fund pays the Adviser an investment advisory fee which is calculated daily and paid monthly. The Fund’s contractual investment advisory fee rate (expressed as an annual rate) is 0.20% of its average daily net assets.
The Adviser may waive and/or reimburse additional fees to the extent necessary to assist the Fund in attempting to maintain a yield of at least 0.00%. These waivers and reimbursements are voluntary and could change or be terminated at any time at the discretion of the Adviser. There is no guarantee that the Fund will maintain a positive yield. If applicable, amounts waived and/or reimbursed to the Fund by the Adviser are disclosed as “Excess Expense Reimbursement” on the Statement of Operations.
Class D Shares and Class T Shares of the Fund compensate the Adviser at an annual rate of 0.36% and 0.38%, respectively, of average daily net assets for providing certain administration services including, but not limited to, oversight and coordination of the Fund’s service providers, recordkeeping and registration functions and also to pay for costs such as shareholder servicing and custody. These amounts are disclosed as “Administration services fees” on the Statement of Operations. A portion of the Fund’s administration fee is paid to BNP Paribas Financial Services ("BPFS"). BPFS provides certain administrative services to the Fund, including services related to Fund accounting, calculation of the Fund’s daily NAV, and Fund audit, tax, and reporting obligations, pursuant to a sub-administration agreement with the Adviser on behalf of the Fund. The Adviser does not receive any additional compensation, beyond the administration services fee for serving as administrator.
The Board of Trustees has adopted a deferred compensation plan (the “Deferred Plan”) for independent Trustees to elect to defer receipt of all or a portion of the annual compensation they are entitled to receive from the Fund. All deferred fees are credited to an account established in the name of the Trustees. The amounts credited to the account then increase or decrease, as the case may be, in accordance with the performance of one or more of the Janus Henderson funds that are selected by the Trustees. The account balance continues to fluctuate in accordance with the performance of the selected fund or funds until final payment of all amounts are credited to the account. The fluctuation of the account balance is recorded by the Fund as unrealized appreciation/(depreciation) and is included as of June 30, 2022 on the Statement of Assets and Liabilities in the asset, “Trustees’ deferred compensation,” and liability, “Trustees’ deferred compensation fees.” Additionally, the recorded unrealized appreciation/(depreciation) is included in “Total distributable earnings (loss)” on the Statement of Assets and Liabilities. Deferred compensation expenses for the year ended June 30, 2022 are included in “Trustees’ fees and expenses” on the Statement of Operations. Trustees are allowed to change their designation of mutual funds from time to time. Amounts will be deferred until distributed in accordance with the Deferred Plan. Deferred fees of $431,326 were paid by the Trust to the Trustees under the Deferred Plan during the year ended June 30, 2022.
4. Federal Income Tax
The tax components of capital shown in the table below represent: (1) distribution requirements the Fund must satisfy under the income tax regulations; (2) losses or deductions the Fund may be able to offset against income and gains realized in future years; and (3) unrealized appreciation or depreciation of investments for federal income tax purposes.
Other book to tax differences primarily consist of deferred compensation. The Fund has elected to treat gains and losses on forward foreign currency contracts as capital gains and losses, if applicable. Other foreign currency gains and losses on debt instruments are treated as ordinary income for federal income tax purposes pursuant to Section 988 of the Internal Revenue Code.
Income and capital gains distributions are determined in accordance with income tax regulations that may differ from US GAAP. These differences are due to differing treatments for items such as net short-term gains, deferral of wash sale losses, and capital loss carryovers. Certain permanent differences such as tax returns of capital and net investment losses noted below have been reclassified to capital.
Permanent book to tax basis differences may result in reclassifications between the components of net assets. These differences have no impact on the results of operations or net assets. The following reclassifications have been made to the Fund:
Capital has been adjusted by $5,251, all of which is long-term capital gain, for distributions in connection with Fund share redemptions (tax equalization).
5. Capital Share Transactions
6. Subsequent Event
Management has evaluated whether any events or transactions occurred subsequent to June 30, 2022 and through the date of issuance of the Fund’s financial statements and determined that there were no material events or transactions that would require recognition or disclosure in the Fund’s financial statements.
To the Board of Trustees of Janus Investment Fund and Shareholders of Janus Henderson Money Market Fund
These financial statements are the responsibility of the Fund’s management. Our responsibility is to express an opinion on the Fund’s financial statements based on our audits. We are a public accounting firm registered with the Public Company Accounting Oversight Board (United States) (PCAOB) and are required to be independent with respect to the Fund in accordance with the U.S. federal securities laws and the applicable rules and regulations of the Securities and Exchange Commission and the PCAOB.
We conducted our audits of these financial statements in accordance with the standards of the PCAOB. Those standards require that we plan and perform the audit to obtain reasonable assurance about whether the financial statements are free of material misstatement, whether due to error or fraud.
We have served as the auditor of one or more investment companies in Janus Henderson Funds since 1990.
A description of the policies and procedures that the Fund uses to determine how to vote proxies relating to its portfolio securities is available without charge: (i) upon request, by calling 1-800-525-1093; (ii) on the Fund’s website at janushenderson.com/proxyvoting; and (iii) on the SEC’s website at http://www.sec.gov. Additionally, information regarding the Fund’s proxy voting record for the most recent twelve-month period ended June 30 is also available, free of charge, through janushenderson.com/proxyvoting and from the SEC’s website at http://www.sec.gov.
The Fund files its complete holdings in a monthly report on Form N-MFP within 5 business days after each month end. These reports (i) are available on the SEC’s website at http://www.sec.gov; (ii) may be reviewed and copied at the SEC’s Public Reference Room in Washington, D.C. (information on the Public Reference Room may be obtained by calling 1-800-SEC-0330); and (iii) are available without charge, upon request, by calling a Janus Henderson representative at 1-877-335-2687 (toll free) (or 1-800-525-3713 if you hold Class D Shares).
The Trustees of Janus Aspen Series, each of whom serves as an “independent” Trustee (the “Trustees”), oversee the management of each portfolio of Janus Aspen Series (each, a “VIT Portfolio,” and collectively, the “VIT Portfolios”), as well as each fund of Janus Investment Fund (each, a “Fund,” and collectively, the “Funds” and together with the VIT Portfolios, the “Janus Henderson Funds,” and each, a “Janus Henderson Fund”). As required by law, the Trustees determine annually whether to continue the investment advisory agreement for each Janus Henderson Fund and the subadvisory agreement for each Janus Henderson Fund that utilizes a subadviser.
In connection with their most recent consideration of those agreements for each Janus Henderson Fund, the Trustees received and reviewed information provided by Janus Henderson Investors US LLC (formerly, Janus Capital Management LLC) (the “Adviser”) and the subadviser in response to requests of the Trustees and their independent legal counsel. They also received and reviewed information and analysis provided by, and in response to requests of, their independent fee consultant. Throughout their consideration of the agreements, the Trustees were advised by their independent legal counsel. The Trustees met with management to consider the agreements, and also met separately in executive session with their independent legal counsel and their independent fee consultant.
At meetings held on November 3-4, 2021 and December 7-8, 2021, the Trustees’ evaluated the information provided by the Adviser, the subadviser, and the independent fee consultant, as well as other information addressed during the year. Following such evaluation, the Trustees determined that the overall arrangements between each Janus Henderson Fund and the Adviser and each subadviser, as applicable, were fair and reasonable in light of the nature, extent and quality of the services provided by the Adviser, its affiliates and the subadviser, the fees charged for those services, and other matters that the Trustees considered relevant in the exercise of their business judgment and unanimously approved the continuation of the investment advisory agreement for each Janus Henderson Fund and the subadvisory agreement for each subadvised Janus Henderson Fund, for the period from February 1, 2022 through February 1, 2023, subject to earlier termination as provided for in each agreement.
In considering the continuation of those agreements, the Trustees reviewed and analyzed various factors that they determined were relevant, including the factors described below, none of which by itself was considered dispositive. However, the material factors and conclusions that formed the basis for the Trustees’ determination to approve the continuation of the agreements are discussed separately below. Also included is a summary of the independent fee consultant’s conclusions and opinions that arose during, and were included as part of, the Trustees’ consideration of the agreements. “Management fees,” as used herein, reflect actual annual advisory fees and, for the purpose of peer comparisons any administration fees (excluding out of pocket costs), net of any waivers, paid by a fund as a percentage of average net assets.
The Trustees reviewed the nature, extent and quality of the services provided by the Adviser and the subadviser to the Janus Henderson Funds, taking into account the investment objective, strategies and policies of each Janus Henderson Fund, and the knowledge the Trustees gained from their regular meetings with management on at least a quarterly basis and their ongoing review of information related to the Janus Henderson Funds. In addition, the Trustees reviewed
the resources and key personnel of the Adviser and the subadviser, particularly noting those employees who provide investment and risk management services to the Janus Henderson Funds. The Trustees also considered other services provided to the Janus Henderson Funds by the Adviser or the subadviser, such as managing the execution of portfolio transactions and the selection of broker-dealers for those transactions. The Trustees considered the Adviser’s role as administrator to the Janus Henderson Funds, noting that the Adviser generally does not receive a fee for its services as administrator, but is reimbursed for its out-of-pocket costs. The Trustees considered the role of the Adviser in monitoring adherence to the Janus Henderson Funds’ investment restrictions, providing support services for the Trustees and Trustee committees, and overseeing communications with shareholders and the activities of other service providers, including monitoring compliance with various policies and procedures of the Janus Henderson Funds and with applicable securities laws and regulations.
In this regard, the independent fee consultant noted that the Adviser provides a number of different services for the Janus Henderson Funds and fund shareholders, ranging from investment management services to various other servicing functions, and that, in its view, the Adviser is a capable provider of those services. The independent fee consultant also provided its belief that the Adviser has developed a number of institutional competitive advantages that should enable it to provide superior investment and service performance over the long term.
The Trustees concluded that the nature, extent and quality of the services provided by the Adviser and the subadviser to each Janus Henderson Fund were appropriate and consistent with the terms of the respective advisory and subadvisory agreements, and that, taking into account steps taken to address those Janus Henderson Funds whose performance lagged that of their peers for certain periods, the Janus Henderson Funds were likely to benefit from the continued provision of those services. They also concluded that the Adviser and the subadviser had sufficient personnel, with the appropriate education and experience, to serve the Janus Henderson Funds effectively and each had demonstrated its ability to attract well-qualified personnel.
The Trustees considered the performance results of each Janus Henderson Fund over various time periods. They noted that they considered Janus Henderson Fund performance data throughout the year, including periodic meetings with each Janus Henderson Fund’s portfolio manager(s), and also reviewed information comparing each Janus Henderson Fund’s performance with the performance of comparable funds and peer groups identified by Broadridge Financial Solutions, Inc. (“Broadridge”), an independent data provider, and with the Janus Henderson Fund’s benchmark index. In this regard, the independent fee consultant found that the overall Janus Henderson Funds’ performance has been reasonable: for the 36 months ended September 30, 2021, approximately 55% of the Janus Henderson Funds were in the top two quartiles of performance versus Broadridge peers, and for the 12 months ended September 30, 2021, approximately 45% of the Janus Henderson Funds were in the top two quartiles of performance versus Broadridge peers.
The Trustees considered the performance of each Fund, noting that performance may vary by share class, and noted the following:
Broadridge quartile for the 12 months ended May 31, 2021. The Trustees noted the reasons for the Fund’s underperformance and the steps the Adviser had taken or was taking to improve performance.
Multi-Asset U.S. Equity Funds
ended May 31, 2021. The Trustees noted the reasons for the Fund’s underperformance, and the steps the Adviser had taken or was taking to improve performance.
U.S. Equity Funds
In consideration of each Janus Henderson Fund’s performance, the Trustees concluded that, taking into account the factors relevant to performance, as well as other considerations, including steps taken to improve performance, the Janus Henderson Fund’s performance warranted continuation of such Janus Henderson Fund’s investment advisory and subadvisory agreement(s).
The Trustees examined information regarding the fees and expenses of each Janus Henderson Fund in comparison to similar information for other comparable funds as provided by Broadridge, an independent data provider. They also reviewed an analysis of that information provided by their independent fee consultant and noted that the rate of management fees (investment advisory fees and any administration fees but excluding out-of-pocket costs) for many of the Janus Henderson Funds, after applicable waivers, was below the average management fee rate of the respective peer group of funds selected by an independent data provider. The Trustees also examined information regarding the subadvisory fees charged for subadvisory services, as applicable, noting that all such fees were paid by the Adviser out of its management fees collected from such Janus Henderson Fund.
The independent fee consultant provided its belief that the management fees charged by the Adviser to each of the Janus Henderson Funds under the current investment advisory and administration agreements are reasonable in relation to the services provided by the Adviser. The independent fee consultant found: (1) the total expenses and management fees of the Janus Henderson Funds to be reasonable relative to other comparable mutual funds; (2) the total expenses, on average, were 8% under the average total expenses of the respective Broadridge Expense Group peers; and (3) and the management fees for the Janus Henderson Funds, on average, were 6% under the average management fees for the respective Broadridge Expense Group. The Trustees also considered the total expenses for each share class of each Janus Henderson Fund compared to the average total expenses for its Broadridge Expense Group and to average total expenses for its Broadridge Expense Universe.
For certain Janus Henderson Funds, the independent fee consultant also performed a systematic “focus list” analysis of expenses which assessed fund fees in the context of fund performance being delivered. Based on this analysis, the independent fee consultant found that the combination of service quality/performance and expenses on these individual Janus Henderson Funds was reasonable in light of performance trends, performance histories, and existence of performance fees, breakpoints, and/or expense waivers on such Janus Henderson Funds.
The Trustees considered the methodology used by the Adviser and subadviser in determining compensation payable to portfolio managers, the competitive environment for investment management talent, and the competitive market for mutual funds in different distribution channels.
The Trustees also reviewed management fees charged by the Adviser and subadviser to comparable separate account clients and to comparable non-affiliated funds subadvised by the Adviser or subadviser (for which the Adviser or the subadviser provides only or primarily portfolio management services). Although in most instances subadvisory and separate account fee rates for various investment strategies were lower than management fee rates for Janus Henderson Funds having a similar strategy, the Trustees considered that the Adviser noted that, under the terms of the management agreements with the Janus Henderson Funds, the Adviser performs significant additional services for the Janus Henderson Funds that it does not provide to those other clients, including administration services, oversight of the Janus Henderson Funds’ other service providers, trustee support, regulatory compliance and numerous other services, and that, in serving the Janus Henderson Funds, the Adviser assumes many legal risks and other costs that it does not assume in servicing its other clients. Moreover, the Trustees noted that the independent fee consultant found that: (1) the management fees the Adviser charges to the Janus Henderson Funds are reasonable in relation to the management fees the Adviser charges to funds subadvised by the Adviser and to the fees the Adviser charges to its institutional separate account clients; (2) these subadvised and institutional separate accounts have different service and infrastructure needs and operate in markets very distinct relative to retail funds; (3) Janus Henderson mutual fund investors enjoy reasonable fees relative to the fees charged to Janus Henderson subadvised fund and separate account investors; and (4) as part of its 2020 review, 9 of 10 Janus Henderson Funds have lower management fees than similar funds subadvised by the Adviser.
The Trustees considered the fees for each Janus Henderson Fund for its fiscal year ended in 2020, including the VIT Portfolios, and noted the following with regard to each VIT Portfolio’s total expenses, net of applicable fee waivers (the VIT Portfolio’s “total expenses”):
Multi-Asset U.S. Equity Funds
that the Adviser has contractually agreed to limit the Fund’s expenses, although this limit did not apply because the Fund’s total expenses were already below the applicable fee limit.
U.S. Equity Funds
The Trustees reviewed information on the overall profitability to the Adviser and its affiliates from their relationships with the Janus Henderson Funds, and considered profitability data of other publicly traded mutual fund advisers. The Trustees recognized that profitability comparisons among fund managers are difficult because of the variation in the type of comparative information that is publicly available, and the profitability of any fund manager is affected by
numerous factors, including the organizational structure of the particular fund manager, differences in complex size, difference in product mix, difference in types of business (mutual fund, institutional and other), differences in the types of funds and other accounts it manages, possible other lines of business, the methodology for allocating expenses and the fund manager’s capital structure and cost of capital.
Additionally, the Trustees considered the estimated profitability to the Adviser from the investment management services it provided to each Janus Henderson Fund. In their review, the Trustees considered whether the Adviser and subadviser receive adequate incentives and resources to manage the Janus Henderson Funds effectively. In reviewing profitability, the Trustees noted that the estimated profitability for an individual Janus Henderson Fund is necessarily a product of the allocation methodology utilized by the Adviser to allocate its expenses as part of the estimated profitability calculation. In this regard, the Trustees noted that the independent fee consultant found that (1) the expense allocation methodology and rationales utilized by the Adviser were reasonable and (2) no clear correlation exists between expense allocations and operating margins. The Trustees also considered that the estimated profitability for an individual Janus Henderson Fund was influenced by a number of factors, including not only the allocation methodology selected, but also the presence of fee waivers and expense caps, and whether the Janus Henderson Fund’s investment management agreement contained breakpoints or a performance fee component. The Trustees determined, after taking into account these factors, among others, that the Adviser’s estimated profitability with respect to each Janus Henderson Fund was not unreasonable in relation to the services provided, and that the variation in the range of such estimated profitability among the Janus Henderson Funds was not a material factor in the Board’s approval of the reasonableness of any Janus Henderson Fund’s investment management fees.
The Trustees concluded that the management fees payable by each Janus Henderson Fund to the Adviser and its affiliates, as well as the fees paid by the Adviser to the subadviser of subadvised Janus Henderson Funds, were reasonable in relation to the nature, extent, and quality of the services provided, taking into account the fees charged by other advisers for managing comparable mutual funds with similar strategies, the fees the Adviser and the subadviser charge to other clients, and, as applicable, the impact of fund performance on management fees payable by the Janus Henderson Funds. The Trustees also concluded that each Janus Henderson Fund’s total expenses were reasonable, taking into account the size of the Janus Henderson Fund, the quality of services provided by the Adviser and subadviser, the investment performance of the Janus Henderson Fund, and any expense limitations agreed to or provided by the Adviser.
The Trustees considered information about the potential for the Adviser to realize economies of scale as the assets of the Janus Henderson Funds increase. They noted that their independent fee consultant published a report to the Trustees in November 2019 which provided its research and analysis into economies of scale. They also noted that, although many Janus Henderson Funds pay advisory fees at a fixed base rate as a percentage of net assets, without any breakpoints or performance fees, their independent fee consultant concluded that 75% of these Janus Henderson Funds’ have contractual management fees (gross of waivers) below their Broadridge Expense Group averages. The Trustees also noted the following: (1) that for those Janus Henderson Funds whose expenses are being reduced by the contractual expense limitations of the Adviser, the Adviser is subsidizing certain of these Janus Henderson Funds because they have not reached adequate scale; (2) performance fee structures have been implemented for various Janus Henderson Funds that have caused the effective rate of advisory fees payable by such Janus Henderson Fund to vary depending on the investment performance of the Janus Henderson Fund relative to its benchmark index over the measurement period; and (3) a few Janus Henderson Funds have fee schedules with breakpoints and reduced fee rates above certain asset levels. The Trustees also noted that the Janus Henderson Funds share directly in economies of scale through the significant investments made by the Adviser and its affiliates related to services provided to the Funds and the lower charges of third-party service providers that are based in part on the combined scale of all of the Janus Henderson Funds.
The Trustees also considered the independent fee consultant’s conclusion that, given the limitations of various analytical approaches to economies of scale and their conflicting results, it is difficult to analytically confirm or deny the existence of economies of scale in the Janus Henderson complex. In this regard, the independent consultant concluded that (1) to the extent there were economies of scale at the Adviser, the Adviser’s general strategy of setting fixed management fees below peers appeared to share any such economies with investors even on smaller Janus Henderson Funds which have not yet achieved those economies and (2) by setting lower fixed fees from the start on these Janus Henderson Funds, the Adviser appeared to be investing to increase the likelihood that these Janus
Henderson Funds will grow to a level to achieve any economies of scale that may exist. Further, the independent fee consultant provided its belief that Janus Henderson Fund investors are well-served by the fee levels and performance fee structures in place on the Janus Henderson Funds in light of any economies of scale that may be present at the Adviser.
Based on all of the information reviewed, including the recent and past research and analysis conducted by the Trustees’ independent fee consultant, the Trustees concluded that the current fee structure of each Janus Henderson Fund was reasonable and that the current rates of fees do reflect a sharing between the Adviser and the Janus Henderson Fund of any economies of scale that may be present at the current asset level of the Janus Henderson Fund.
The Trustees also considered benefits that accrue to the Adviser and its affiliates and subadviser to the Janus Henderson Funds from their relationships with the Janus Henderson Funds. They recognized that two affiliates of the Adviser separately serve the Janus Henderson Funds as transfer agent and distributor, respectively, and the transfer agent receives compensation directly from the non-money market funds for services provided, and that such compensation contributes to the overall profitability of the Adviser and its affiliates that results from their relationship with the Janus Henderson Funds. The Trustees also considered the Adviser’s past and proposed use of commissions paid by the Janus Henderson Funds on portfolio brokerage transactions to obtain proprietary and third-party research products and services benefiting the Janus Henderson Fund and/or other clients of the Adviser and/or the Adviser, and/or subadviser to a Janus Henderson Fund. The Trustees concluded that the Adviser’s and the subadviser’s use of these types of client commission arrangements to obtain proprietary and third-party research products and services was consistent with regulatory requirements and guidelines and was likely to benefit each Janus Henderson Fund. The Trustees also concluded that, other than the services provided by the Adviser and its affiliates and subadviser pursuant to the agreements and the fees to be paid by each Janus Henderson Fund therefor, the Janus Henderson Funds and the Adviser and the subadviser may potentially benefit from their relationship with each other in other ways. They concluded that the Adviser and its affiliates share directly in economies of scale through the lower charges of third-party service providers that are based in part on the combined scale of the Janus Henderson Funds and other clients serviced by the Adviser and its affiliates. They also concluded that the Adviser and the subadviser benefit from the receipt of research products and services acquired through commissions paid on portfolio transactions of the Janus Henderson Funds and that the Janus Henderson Funds benefit from the Adviser’s and/or the subadviser’s receipt of those products and services as well as research products and services acquired through commissions paid by other clients of the Adviser and/or other clients of the subadviser. They further concluded that the success of any Janus Henderson Fund could attract other business to the Adviser, the subadviser or other Janus Henderson funds, and that the success of the Adviser and the subadviser could enhance the Adviser’s and the subadviser’s ability to serve the Janus Henderson Funds.
Rule 22e-4 under the Investment Company Act of 1940, as amended (the “Liquidity Rule”), requires open-end funds (but not money market funds) to adopt and implement a written liquidity risk management program (the “LRMP”) that is reasonably designed to assess and manage liquidity risk, which is the risk that a fund could not meet redemption requests without significant dilution of remaining investors’ interest in the fund. The Fund has implemented a LRMP, which incorporates the following elements: (i) assessment, management, and periodic review of liquidity risk; (ii) classification of portfolio holdings; (iii) the establishment and monitoring of a highly liquid investment minimum, as applicable; (iv) a 15% limitation on a Fund’s illiquid investments; (v) redemptions in-kind; and (vi) board oversight.
The Trustees of the Fund (the “Trustees”) have designated Janus Henderson Investors US LLC, the Fund’s investment adviser (the “Adviser”), as the Program Administrator for the LRMP responsible for administering the LRMP and carrying out the specific responsibilities of the LRMP. A working group comprised of various teams within the Adviser’s business is responsible for administering the LRMP and carrying out the specific responsibilities of different aspects of the LRMP (the “Liquidity Risk Working Group”). In assessing each Fund’s liquidity risk, the Liquidity Risk Working Group periodically considers, as relevant, factors including (i) the liquidity of a Fund’s portfolio investments during normal and reasonably foreseeable stressed conditions; (ii) whether a Fund’s investment strategy is appropriate for an open-end fund; (iii) the extent to which a Fund’s strategy involves a relatively concentrated portfolio or large positions in any issuer; (iv) a Fund’s use of borrowing for investment purposes; and (v) a Fund’s use of derivatives.
The Liquidity Rule requires the Trustees to review at least annually a written report provided by the Program Administrator that addresses the operation of the LRMP and assesses its adequacy and the effectiveness of its implementation, including, if applicable, the operation of the highly liquid investment minimum, and any material changes to the LRMP (the “Program Administrator Report”). At a meeting held on March 16, 2022, the Adviser provided the Program Administrator Report to the Trustees which covered the operation of the LRMP from January 1, 2021 through December 31, 2021 (the “Reporting Period”).
The Program Administrator Report discussed the operation and effectiveness of the LRMP during the Reporting Period. It noted that the Fund was able to meet redemptions during the normal course of business during the Reporting Period. The Program Administrator Report also stated that the Fund did not exceed the 15% limit on illiquid assets during the Reporting Period, that the Fund held primarily highly liquid assets, and was considered to be a primarily highly liquid fund during the Reporting Period. In addition, the Adviser expressed its belief in the Program Administrator Report that the LRMP is reasonably designed and adequate to assess and manage the Fund’s liquidity risk, considering the Fund’s particular risks and circumstances, and includes policies and procedures reasonably designed to implement each required component of the Liquidity Rule.
There can be no assurance that the LRMP will achieve its objectives in the future. Please refer to your Fund’s prospectus for more information regarding the risks to which an investment in the Fund may be subject.
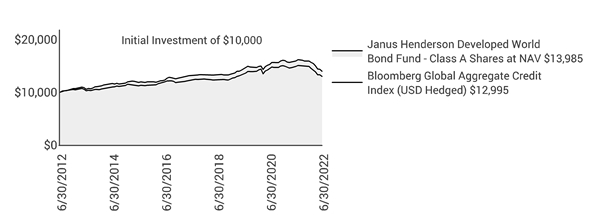
Average annual total returns are quoted for a Fund with more than one year of performance history. Average annual total return is calculated by taking the growth or decline in value of an investment over a period of time, including reinvestment of dividends and distributions, then calculating the annual compounded percentage rate that would have produced the same result had the rate of growth been constant throughout the period. Average annual total return does not reflect the deduction of taxes that a shareholder would pay on Fund distributions or redemptions of Fund shares.
Pursuant to federal securities rules, expense ratios shown in the performance chart reflect subsidized (if applicable) and unsubsidized ratios. The total annual fund operating expenses ratio is gross of any fee waivers, reflecting the Fund’s unsubsidized expense ratio. The net annual fund operating expenses ratio (if applicable) includes contractual waivers of Janus Capital and reflects the Fund’s subsidized expense ratio. Ratios may be higher or lower than those shown in the “Financial Highlights” in this report.
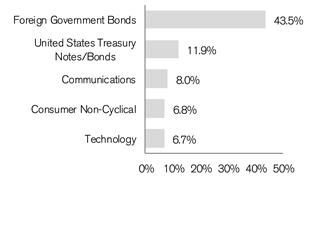
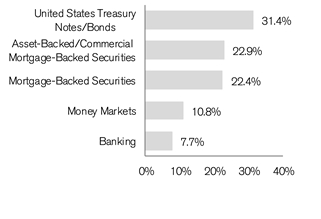
Following the performance overview section is the Fund’s Schedule of Investments. This schedule reports the types of securities held in the Fund on the last day of the reporting period. Securities are usually listed by type (common stock, corporate bonds, U.S. Government obligations, etc.) and by industry classification (banking, communications, insurance, etc.). Holdings are subject to change without notice.
The value of each security is quoted as of the last day of the reporting period. The value of securities denominated in foreign currencies is converted into U.S. dollars.
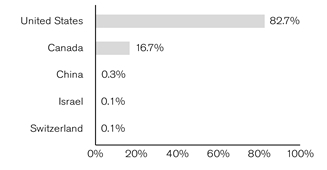
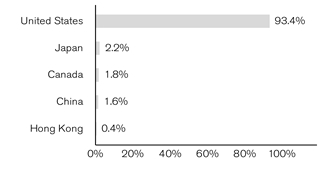
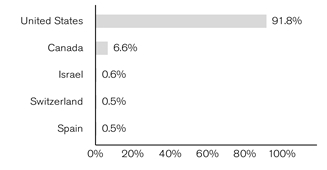
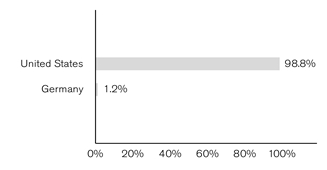
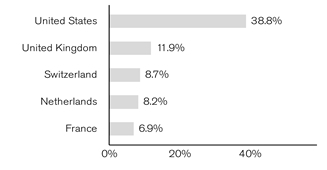
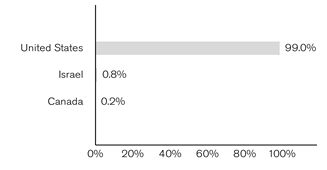
If the Fund invests in foreign securities, it will also provide a summary of investments by country. This summary reports the Fund exposure to different countries by providing the percentage of securities invested in each country. The country of each security represents the country of risk. The Fund’s Schedule of Investments relies upon the industry group and country classifications published by Bloomberg and/or MSCI Inc.
Tables listing details of individual forward currency contracts, futures, written options, swaptions, and swaps follow the Fund’s Schedule of Investments (if applicable).
This statement is often referred to as the “balance sheet.” It lists the assets and liabilities of the Fund on the last day of the reporting period.
The Fund’s assets are calculated by adding the value of the securities owned, the receivable for securities sold but not yet settled, the receivable for dividends declared but not yet received on securities owned, and the receivable for Fund shares sold to investors but not yet settled. The Fund’s liabilities include payables for securities purchased but not yet settled, Fund shares redeemed but not yet paid, and expenses owed but not yet paid. Additionally, there may be other assets and liabilities such as unrealized gain or loss on forward currency contracts.
The section entitled “Net Assets Consist of” breaks down the components of the Fund’s net assets. Because the Fund must distribute substantially all earnings, you will notice that a significant portion of net assets is shareholder capital.
The last section of this statement reports the net asset value (“NAV”) per share on the last day of the reporting period. The NAV is calculated by dividing the Fund’s net assets for each share class (assets minus liabilities) by the number of shares outstanding.
This statement details the Fund’s income, expenses, realized gains and losses on securities and currency transactions, and changes in unrealized appreciation or depreciation of Fund holdings.
The first section in this statement, entitled “Investment Income,” reports the dividends earned from securities and interest earned from interest-bearing securities in the Fund.
The next section reports the expenses incurred by the Fund, including the advisory fee paid to the investment adviser, transfer agent fees and expenses, and printing and postage for mailing statements, financial reports and prospectuses. Expense offsets and expense reimbursements, if any, are also shown.
The last section lists the amounts of realized gains or losses from investment and foreign currency transactions, and changes in unrealized appreciation or depreciation of investments and foreign currency-denominated assets and liabilities. The Fund will realize a gain (or loss) when it sells its position in a particular security. A change in unrealized gain (or loss) refers to the change in net appreciation or depreciation of the Fund during the reporting period. “Net Realized and Unrealized Gain/(Loss) on Investments” is affected both by changes in the market value of Fund holdings and by gains (or losses) realized during the reporting period.
These statements report the increase or decrease in the Fund’s net assets during the reporting period. Changes in the Fund’s net assets are attributable to investment operations, dividends and distributions to investors, and capital share transactions. This is important to investors because it shows exactly what caused the Fund’s net asset size to change during the period.
The first section summarizes the information from the Statement of Operations regarding changes in net assets due to the Fund’s investment operations. The Fund’s net assets may also change as a result of dividend and capital gains distributions to investors. If investors receive their dividends and/or distributions in cash, money is taken out of the Fund to pay the dividend and/or distribution. If investors reinvest their dividends and/or distributions, the Fund’s net assets will not be affected.
The reinvestment of dividends and distributions is included under “Capital Share Transactions.” “Capital Shares” refers to the money investors contribute to the Fund through purchases or withdrawals via redemptions. The Fund’s net assets will increase and decrease in value as investors purchase and redeem shares from the Fund.
This schedule provides a per-share breakdown of the components that affect the Fund’s NAV for current and past reporting periods as well as total return, asset size, ratios, and portfolio turnover rate.
The Fund’s expenses may be reduced through expense offsets and expense reimbursements. The ratios shown reflect expenses before and after any such offsets and reimbursements.
The ratio of net investment income/(loss) summarizes the income earned less expenses, divided by the average net assets of the Fund during the reporting period. Do not confuse this ratio with the Fund’s yield. The net investment income ratio is not a true measure of the Fund’s yield because it does not take into account the dividends distributed to the Fund’s investors.
The next figure is the portfolio turnover rate, which measures the buying and selling activity in the Fund. Portfolio turnover is affected by market conditions, changes in the asset size of the Fund, fluctuating volume of shareholder purchase and redemption orders, the nature of the Fund’s investments, and the investment style and/or outlook of the portfolio manager(s) and/or investment personnel. A 100% rate implies that an amount equal to the value of the entire portfolio was replaced once during the fiscal year; a 50% rate means that an amount equal to the value of half the portfolio is traded in a year; and a 200% rate means that an amount equal to the value of the entire portfolio is traded every six months.
For federal income tax purposes, the Fund designated the following for the year ended June 30, 2022:
The following are the Trustees and officers of the Trust, together with a brief description of their principal occupations during the last five years (principal occupations for certain Trustees may include periods over five years). The Fund’s Statement of Additional Information includes additional information about the Trustees and officers and is available, without charge, by calling 1-877-335-2687.
Each Trustee has served in that capacity since he or she was originally elected or appointed. The Trustees do not serve a specified term of office. Each Trustee will hold office until the termination of the Trust or his or her earlier death, resignation, retirement, incapacity, or removal. Under the Fund’s Governance Procedures and Guidelines, the policy is for Trustees to retire no later than the end of the calendar year in which the Trustee turns 75. The Trustees review the Fund’s Governance Procedures and Guidelines from time to time and may make changes they deem appropriate. The Fund’s Nominating and Governance Committee will consider nominees for the position of Trustee recommended by shareholders. Shareholders may submit the name of a candidate for consideration by the Committee by submitting their recommendations to the Trust’s Secretary. Each Trustee is currently a Trustee of one other registered investment company advised by the Adviser: Janus Aspen Series. Collectively, these two registered investment companies consist of 50 series or funds referred to herein as the Fund Complex.
The Trust’s officers are elected annually by the Trustees for a one-year term. Certain officers also serve as officers of Janus Aspen Series. Certain officers of the Fund may also be officers and/or directors of the Adviser. Except as otherwise disclosed, Fund officers receive no compensation from the Fund, except for the Fund’s Chief Compliance Officer, as authorized by the Trustees.
| | | |
| | | |
| | | ANNUAL REPORT June 30, 2022 |
| | |
| | Janus Henderson Multi-Sector Income Fund |
| | |
| | Janus Investment Fund |
| |
| | | |
| | | HIGHLIGHTS · Portfolio management perspective · Investment strategy behind your fund · Fund performance, characteristics
and holdings |
Table of Contents
Janus Henderson Multi-Sector Income Fund
Janus Henderson Multi-Sector Income Fund (unaudited)
| | | | | | |
FUND SNAPSHOT This multi-sector income fund seeks high current income with a secondary focus on capital appreciation. Our approach leverages dynamic allocation and a bottom-up, fundamentally driven process that focuses on identifying the best risk-adjusted opportunities across fixed income sectors. | | | 
John Kerschner co-portfolio manager | 
John Lloyd co-portfolio manager | 
Seth Meyer co-portfolio manager |
| | | |
PERFORMANCE OVERVIEW
For the 12-month period ended June 30, 2022, the Janus Henderson Multi-Sector Income Fund’s Class I shares returned -9.99% compared with a -10.29% return for the Fund’s benchmark, the Bloomberg U.S. Aggregate Bond Index.
MARKET ENVIRONMENT
The period commenced with strengthening economic conditions and improving consumer sentiment. Following record stimulus in response to the COVID pandemic, economic growth was strong, asset prices had recovered, and the unemployment rate was trending down steadily. Despite the emergence of new COVID variants during the first half of the period – that slowed the gains in spending and labor market participation – the recovery continued, largely due to ongoing accommodative monetary policy. While COVID continued to be a nagging factor, the main story of the period turned out to be the rapid rise of inflation, the Federal Reserve’s (Fed) slow but increasingly aggressive response to taming it, and the sharp repricing of risk assets in expectation of a higher rate environment.
Inflation continued to rise, with the Fed initially communicating that inflation was “transitory” and would abate once supply chain disruptions were alleviated. In hindsight, this turned out to be a policy error on the Fed’s part: With each passing month, inflation continued to rise, the anticipated peak did not materialize, and it became increasingly difficult for the transitory thesis to hold. Credit markets held steady through the end of 2021, but with Russia’s invasion of Ukraine early in 2022, oil, gas and commodities prices spiked, signaling further upward pressure on inflation. At this point the Fed finally acknowledged inflation was not transitory and made a hawkish pivot, raising rates 1.50% through the end of the period. Further, it communicated it was committed to bringing down inflation with future hikes. Markets repriced aggressively and risk assets recorded significantly negative returns in response.
Toward period end, we witnessed deterioration in economic growth and consumer sentiment, with an economic slowdown or recession seeming more likely as a result of tighter monetary policy. Both credit and interest rate sectors recorded negative returns, with most of the move occurring in the second half of the period. The yield on the 10-year U.S. Treasury rose from 1.47% to 3.01% during the period, while credit spreads simultaneously widened across all sectors.
PERFORMANCE DISCUSSION
Our favorable view on the U.S. economy early in the period, and the belief that the Fed likely would remain accommodative, led us at first to maintain our overweight exposure to credit markets broadly, including a material out-of-index position in high-yield corporate bonds. We also focused on maintaining a diversified portfolio, decreasing our overall corporate bond allocation and raising exposure to certain structured securities such as asset-backed securities, commercial mortgage-backed securities and both non-agency residential mortgages and agency mortgage-backed securities (MBS). We held the view that these sectors could provide additional sources of income while diversifying our risk factors.
The Fed’s hawkish pivot early in 2022 and the promise of more aggressive rate hikes prompted us to significantly reduce the Fund’s exposure to interest rates across the portfolio in March, while expectations for continued uncertainty surrounding the Russia/Ukraine conflict led us to reduce corporate risk, primarily through lower exposure to the high-yield corporate bond market. As the period continued, central banks become more aggressive in their efforts to tame inflation and we witnessed some deterioration in the macro environment, we continued our efforts to raise the overall credit quality of the Fund. We selectively added exposure to investment-grade corporate bonds, believing they offered increasingly attractive valuations and would provide greater stability to the overall portfolio in the event higher interest rates and/or
Janus Henderson Multi-Sector Income Fund (unaudited)
geopolitical factors raised fears of the U.S. economy entering a recession.
Our consistent duration underweight was a strong contributor to relative outperformance during the fiscal year. By period end, we felt much of the rise in rates had already occurred and we moved to increase duration in the Fund, though we remained underweight. Security selection decisions were also additive overall, with particular strength in our MBS holdings. Despite reducing our exposure to the high-yield corporate bond market over the period, this out-of-index allocation was the largest drag on performance, particularly amid the broad sell-off in risk assets in 2022. Our out-of-index allocations to non-agency mortgages and collateralized loan obligations also detracted from relative performance.
DERIVATIVES USAGE
Please see the Derivative Instruments section in the “Notes to Financial Statements” for a discussion of derivatives used by the Fund.
OUTLOOK
High inflation – and the Fed’s late but increasingly aggressive response to taming it – has been the story of the year, and it will likely continue to be until inflation trends back meaningfully to the central bank’s target range. The Fed has struck a far more austere tone of late, making it clear that it is intent on preventing the short-term inflation problem from becoming a long-term one. We do not believe that the Fed is bluffing at this juncture: We expect it will act in line with its narrative by tightening monetary conditions until inflation is on a clear path back to where it should be.
Of course, the key risk in the Fed’s eleventh-hour crusade is that it overtightens and tips the U.S. economy into at best a growth slowdown but more likely a recession. This is a risk the Fed appears willing to take, thanks in part to the strength of the economy – unemployment is back to pre-pandemic lows and both consumer and corporate balance sheets are strong. Essentially the Fed believes the consumer and corporates are in good enough shape to handle a recession if one transpires due to monetary tightening.
While the economic situation is sobering, we believe that being well positioned is key. Following the repricing in much of the fixed income market, bonds are now offering some of the most attractive yields we’ve seen since the Global Financial Crisis. Even as the likelihood of an economic slowdown or recession grows, we think that slowing growth is likely to place a ceiling on intermediate and long-term rates in the near term, which should provide some support for assets with exposure to interest rate risk. Within credit spread products, any continued deterioration in the macro environment is likely to place further pressure on credit spreads. We therefore remain cautiously positioned within our spread sector allocation, while being prepared to take advantage of market weakness to add risk to the portfolio should spreads widen significantly from current levels.
Thank you for investing in the Janus Henderson Multi-Sector Income Fund.
Janus Henderson Multi-Sector Income Fund (unaudited)
Fund At A Glance
June 30, 2022
| | | |
Fund Profile | | |
30-day SEC Yield* | Without
Reimbursement | With
Reimbursement |
Class A Shares NAV | 3.69% | 3.69% |
Class A Shares MOP | 3.51% | 3.51% |
Class C Shares** | 2.92% | 2.92% |
Class D Shares | 3.85% | 3.85% |
Class I Shares | 3.91% | 3.91% |
Class N Shares | 4.01% | 4.01% |
Class S Shares | 3.25% | 3.48% |
Class T Shares | 3.76% | 3.76% |
Weighted Average Maturity | 5.7 Years |
Average Effective Duration*** | 4.1 Years |
* Yield will fluctuate. | | |
** Does not include the 1.00% contingent deferred sales charge. |
*** A theoretical measure of price volatility. | |
| | |
Ratings† Summary - (% of Total Investments) | |
AAA | 22.6% |
AA | 3.5% |
A | 2.5% |
BBB | 13.4% |
BB | 14.6% |
B | 10.7% |
CCC | 5.4% |
CC | 0.1% |
Not Rated | 45.9% |
Other | -18.7% |
† Credit ratings provided by Standard & Poor's (S&P), an independent credit rating agency. Credit ratings range from AAA (highest) to D (lowest) based on S&P's measures. Further information on S&P's rating methodology may be found at www.standardandpoors.com. Other rating agencies may rate the same securities differently. Ratings are relative and subjective and are not absolute standards of quality. Credit quality does not remove market risk and is subject to change. "Not Rated" securities are not rated by S&P, but may be rated by other rating agencies and do not necessarily indicate low quality. "Other" includes cash equivalents, equity securities, and certain derivative instruments. |
Significant Areas of Investment - (% of Net Assets)

| | | | | | |
Asset Allocation - (% of Net Assets) | |
Asset-Backed/Commercial Mortgage-Backed Securities | | 57.8% | |
Corporate Bonds | | 30.8% | |
Mortgage-Backed Securities | | 22.8% | |
Bank Loans and Mezzanine Loans | | 6.3% | |
Investment Companies | | 0.9% | |
Investments Purchased with Cash Collateral from Securities Lending | | 0.6% | |
Preferred Stocks | | 0.2% | |
Convertible Preferred Stocks | | 0.1% | |
Common Stocks | | 0.1% | |
Convertible Corporate Bonds | | 0.1% | |
Other | | (19.7)% |
| | | 100.0% |
Janus Henderson Multi-Sector Income Fund (unaudited)
Performance
| |
See important disclosures on the next page. |
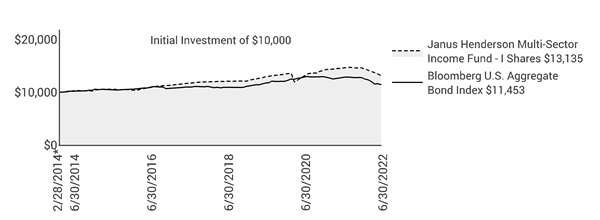
| | | | | | | | | | |
| | | | | | | | |
| | | | | | | | |
Average Annual Total Return - for the periods ended June 30, 2022 | | | Prospectus Expense Ratios |
| | One
Year | Five
Year | Since
Inception* | | | Total Annual Fund
Operating Expenses‡ | Net Annual Fund
Operating Expenses‡ |
Class A Shares at NAV | | -10.18% | 2.16% | 3.07% | | | 0.91% | 0.91% |
Class A Shares at MOP | | -14.40% | 1.17% | 2.47% | | | | |
Class C Shares at NAV | | -10.86% | 1.36% | 2.31% | | | 1.68% | 1.68% |
Class C Shares at CDSC | | -11.72% | 1.36% | 2.31% | | | | |
Class D Shares | | -10.03% | 2.30% | 3.23% | | | 0.74% | 0.74% |
Class I Shares | | -9.99% | 2.39% | 3.33% | | | 0.69% | 0.69% |
Class N Shares | | -9.91% | 2.44% | 3.38% | | | 0.60% | 0.60% |
Class S Shares | | -10.39% | 2.09% | 3.01% | | | 1.43% | 1.14% |
Class T Shares | | -10.12% | 2.22% | 3.14% | | | 0.85% | 0.85% |
Bloomberg U.S. Aggregate Bond Index | | -10.29% | 0.88% | 1.64% | | | | |
Morningstar Quartile - Class I Shares | | 2nd | 1st | 1st | | | | |
Morningstar Ranking - based on total returns for Multisector Bond Funds | | 135/346 | 29/270 | 10/206 | | | | |
Returns quoted are past performance and do not guarantee future results; current performance may be lower or higher. Investment returns and principal value will vary; there may be a gain or loss when shares are sold. For the most recent month-end performance call 800.668.0434 (or 800.525.3713 if you hold shares directly with Janus Henderson) or visit janushenderson.com/performance (or janushenderson.com/allfunds if you hold shares directly with Janus Henderson).
Maximum Offering Price (MOP) returns include the maximum sales charge of 4.75%. Net Asset Value (NAV) returns exclude this charge, which would have reduced returns.
CDSC returns include a 1% contingent deferred sales charge (CDSC) on Shares redeemed within 12 months of purchase. Net Asset Value (NAV) returns exclude this charge, which would have reduced returns.
For certain periods, the Fund’s performance may reflect the effect of expense waivers.
Janus Henderson Multi-Sector Income Fund (unaudited)
Performance
Performance may be affected by risks that include those associated with foreign and emerging markets, fixed income securities, high-yield and high-risk securities, undervalued, overlooked and smaller capitalization companies, real estate related securities including Real Estate Investment Trusts (REITs), Environmental, Social and Governance (ESG) factors, non-diversification, portfolio turnover, derivatives, short sales, initial public offerings (IPOs) and potential conflicts of interest. Each product has different risks. Please see the prospectus for more information about risks, holdings and other details.
Returns include reinvestment of all dividends and distributions and do not reflect the deduction of taxes that a shareholder would pay on Fund distributions or redemptions of Fund shares. The returns do not include adjustments in accordance with generally accepted accounting principles required at the period end for financial reporting purposes.
Ranking is for the share class shown only; other classes may have different performance characteristics. When an expense waiver is in effect, it may have a material effect on the total return, and therefore the ranking for the period.
© 2022 Morningstar, Inc. All Rights Reserved.
There is no assurance that the investment process will consistently lead to successful investing.
See Notes to Schedule of Investments and Other Information for index definitions.
Index performance does not reflect the expenses of managing a portfolio as an index is unmanaged and not available for direct investment.
See “Useful Information About Your Fund Report.”
*The Fund’s inception date – February 28, 2014
‡ As stated in the prospectus. Net expense ratios reflect the expense waivers, if any, contractually agreed to for at least a one-year period commencing on October 28, 2021. See Financial Highlights for actual expense ratios during the reporting period.
Janus Henderson Multi-Sector Income Fund (unaudited)
Expense Examples
As a shareholder of the Fund, you incur two types of costs: (1) transaction costs, such as sales charges (loads) on purchase payments (applicable to Class A Shares only); and (2) ongoing costs, including management fees; 12b-1 distribution and shareholder servicing fees; transfer agent fees and expenses payable pursuant to the Transfer Agency Agreement; and other Fund expenses. This example is intended to help you understand your ongoing costs (in dollars) of investing in the Fund and to compare these costs with the ongoing costs of investing in other mutual funds. To do so, compare this 5% hypothetical example with the 5% hypothetical examples that appear in the shareholder reports of the other funds. The example is based upon an investment of $1,000 invested at the beginning of the period and held for the six-months indicated, unless noted otherwise in the table and footnotes below.
Actual Expenses
The information in the table under the heading “Actual” provides information about actual account values and actual expenses. You may use the information in these columns, together with the amount you invested, to estimate the expenses that you paid over the period. Simply divide your account value by $1,000 (for example, an $8,600 account value divided by $1,000 = 8.6), then multiply the result by the number in the appropriate column for your share class under the heading entitled “Expenses Paid During Period” to estimate the expenses you paid on your account during the period.
Hypothetical Example for Comparison Purposes
The information in the table under the heading “Hypothetical (5% return before expenses)” provides information about hypothetical account values and hypothetical expenses based upon the Fund’s actual expense ratio and an assumed rate of return of 5% per year before expenses, which is not the Fund’s actual return. The hypothetical account values and expenses may not be used to estimate the actual ending account balance or expenses you paid for the period. You may use this information to compare the ongoing costs of investing in the Fund and other funds. To do so, compare this 5% hypothetical example with the 5% hypothetical examples that appear in the shareholder reports of the other funds. Additionally, for an analysis of the fees associated with an investment in any share class or other similar funds, please visit www.finra.org/fundanalyzer.
Please note that the expenses shown in the table are meant to highlight your ongoing costs only and do not reflect any transaction costs. These fees are fully described in the Fund’s prospectuses. Therefore, the hypothetical examples are useful in comparing ongoing costs only, and will not help you determine the relative total costs of owning different funds. In addition, if these transaction costs were included, your costs would have been higher.
| | | | | | | | | | | |
| | | | | | | | |
| | | Actual | | Hypothetical
(5% return before expenses) | |
| Beginning
Account
Value
(1/1/22) | Ending
Account
Value
(6/30/22) | Expenses
Paid During
Period
(1/1/22 - 6/30/22)† | | Beginning
Account
Value
(1/1/22) | Ending
Account
Value
(6/30/22) | Expenses
Paid During
Period
(1/1/22 - 6/30/22)† | Net Annualized
Expense Ratio
(1/1/22 - 6/30/22) |
Class A Shares | $1,000.00 | $896.40 | $4.23 | | $1,000.00 | $1,020.33 | $4.51 | 0.90% |
Class C Shares | $1,000.00 | $893.10 | $7.74 | | $1,000.00 | $1,016.61 | $8.25 | 1.65% |
Class D Shares | $1,000.00 | $897.10 | $3.48 | | $1,000.00 | $1,021.12 | $3.71 | 0.74% |
Class I Shares | $1,000.00 | $897.30 | $3.29 | | $1,000.00 | $1,021.32 | $3.51 | 0.70% |
Class N Shares | $1,000.00 | $897.70 | $2.78 | | $1,000.00 | $1,021.87 | $2.96 | 0.59% |
Class S Shares | $1,000.00 | $895.40 | $5.40 | | $1,000.00 | $1,019.09 | $5.76 | 1.15% |
Class T Shares | $1,000.00 | $896.70 | $3.90 | | $1,000.00 | $1,020.68 | $4.16 | 0.83% |
† | Expenses Paid During Period are equal to the Net Annualized Expense Ratio multiplied by the average account value over the period, multiplied by 181/365 (to reflect the one-half year period). Expenses in the examples include the effect of applicable fee waivers and/or expense reimbursements, if any. Had such waivers and/or reimbursements not been in effect, your expenses would have been higher. Please refer to the Notes to Financial Statements or the Fund’s prospectuses for more information regarding waivers and/or reimbursements. |
Janus Henderson Multi-Sector Income Fund
Schedule of Investments
June 30, 2022
| | | | | | | | |
Shares or
Principal Amounts | | | Value | |
Asset-Backed/Commercial Mortgage-Backed Securities– 57.8% | | | |
| | Aaset 2019-2 Trust, 6.4130%, 10/16/39 (144A) | | $4,723,808 | | | $2,258,463 | |
| | ACC Auto Trust 2021-A C, 3.7900%, 4/15/27 (144A) | | 6,000,000 | | | 5,691,648 | |
| | ACC Auto Trust 2021-A D, 6.1000%, 6/15/29 (144A) | | 3,700,000 | | | 3,536,873 | |
| | ACM Auto Trust 2022-1A C, 5.4800%, 4/20/29 (144A) | | 8,250,000 | | | 8,179,489 | |
| | Affirm Asset Securitization Trust 2021-A C, 1.6600%, 8/15/25 (144A) | | 7,630,000 | | | 7,276,191 | |
| | Affirm Asset Securitization Trust 2021-A D, 3.4900%, 8/15/25 (144A) | | 3,350,000 | | | 3,212,056 | |
| | Affirm Asset Securitization Trust 2021-A E, 5.6500%, 8/15/25 (144A) | | 2,010,000 | | | 1,958,988 | |
| | AGL CLO 1 Ltd 2021-10A A, | | | | | | |
| | ICE LIBOR USD 3 Month + 1.1300%, 2.1743%, 4/15/34 (144A)‡ | | 5,000,000 | | | 4,815,795 | |
| | AGL CLO 1 Ltd 2021-10A D, | | | | | | |
| | ICE LIBOR USD 3 Month + 2.9000%, 3.9443%, 4/15/34 (144A)‡ | | 8,000,000 | | | 7,273,944 | |
| | Alaska Airlines 2020-1 Class A Pass Through Trust, 4.8000%, 8/15/27 (144A) | | 7,248,178 | | | 7,151,640 | |
| | Apidos CLO 2013-12A ER, | | | | | | |
| | ICE LIBOR USD 3 Month + 5.4000%, 5.6413%, 4/15/31 (144A)‡ | | 3,150,000 | | | 2,637,643 | |
| | Apidos CLO 2013-15A A1RR, | | | | | | |
| | ICE LIBOR USD 3 Month + 1.0100%, 2.0727%, 4/20/31 (144A)‡ | | 4,209,000 | | | 4,129,627 | |
| | Atrium CDO Corp 12A AR, | | | | | | |
| | ICE LIBOR USD 3 Month + 0.8300%, 1.9663%, 4/22/27 (144A)‡ | | 10,686,201 | | | 10,532,096 | |
| | Avis Budget Rental Car Funding AESOP LLC 2018-2A D, 3.0400%, 3/20/25 (144A) | | 13,000,000 | | | 12,326,948 | |
| | Avis Budget Rental Car Funding AESOP LLC 2019-2A D, 3.0400%, 9/22/25 (144A) | | 5,000,000 | | | 4,693,467 | |
| | Avis Budget Rental Car Funding AESOP LLC 2021-1A D, 3.7100%, 8/20/27 (144A) | | 6,000,000 | | | 5,323,198 | |
| | BAMLL Commercial Mortgage Securities Trust 2014-FRR4 CK29, | | | | | | |
| | 0%, 5/27/23 (144A) | | 15,370,000 | | | 14,203,137 | |
| | BCP Trust 2021-330N D, | | | | | | |
| | ICE LIBOR USD 1 Month + 2.4920%, 3.8160%, 6/15/38 (144A)‡ | | 10,000,000 | | | 9,381,692 | |
| | Benefit Street Partners CLO Ltd 2016-10A CRR, | | | | | | |
| | ICE LIBOR USD 3 Month + 3.5000%, 4.5627%, 4/20/34 (144A)‡ | | 6,750,000 | | | 6,080,920 | |
| | Benefit Street Partners CLO Ltd 2016-10A DRR, | | | | | | |
| | ICE LIBOR USD 3 Month + 6.7500%, 7.8127%, 4/20/34 (144A)‡ | | 5,000,000 | | | 4,404,005 | |
| | Benefit Street Partners CLO Ltd 2020-21A ER, | | | | | | |
| | ICE LIBOR USD 3 Month + 6.7000%, 7.7443%, 10/15/34 (144A)‡ | | 3,000,000 | | | 2,631,579 | |
| | BlueMountain CLO XXVI Ltd 2019-24A ER, | | | | | | |
| | ICE LIBOR USD 3 Month + 6.8400%, 7.0940%, 4/20/34 (144A)‡ | | 6,500,000 | | | 5,708,904 | |
| | BlueMountain CLO XXVI Ltd 2019-25A D2R, | | | | | | |
| | ICE LIBOR USD 3 Month + 4.1500%, 4.3913%, 7/15/36 (144A)‡ | | 6,250,000 | | | 5,687,944 | |
| | BlueMountain CLO XXVI Ltd 2019-25A ER, | | | | | | |
| | ICE LIBOR USD 3 Month + 7.2500%, 8.2943%, 7/15/36 (144A)‡ | | 6,000,000 | | | 5,271,000 | |
| | BlueMountain CLO XXVI Ltd 2019-26A ER, | | | | | | |
| | ICE LIBOR USD 3 Month + 7.1300%, 8.1927%, 10/20/34 (144A)‡ | | 7,000,000 | | | 6,300,700 | |
| | BlueMountain CLO XXVI Ltd 2021-28A A, | | | | | | |
| | ICE LIBOR USD 3 Month + 1.2600%, 2.3043%, 4/15/34 (144A)‡ | | 5,000,000 | | | 4,863,570 | |
| | BPR Trust 2022-OANA D, | | | | | | |
| | CME Term SOFR 1 Month + 3.6950%, 4.4770%, 4/15/37 (144A)‡ | | 15,000,000 | | | 14,452,130 | |
| | Business Jet Securities LLC 2020-1A B, 3.9670%, 11/15/35 (144A) | | 5,069,783 | | | 4,585,285 | |
| | Business Jet Securities LLC 2021-1A B, 2.9180%, 4/15/36 (144A) | | 2,266,438 | | | 2,024,917 | |
| | Business Jet Securities LLC 2021-1A C, 5.0670%, 4/15/36 (144A) | | 2,250,216 | | | 2,007,006 | |
| | Business Jet Securities LLC 2022-1A C, 6.4130%, 6/15/37 (144A) | | 4,765,616 | | | 4,642,663 | |
| | BX Commercial Mortgage Trust 2019-MMP F, | | | | | | |
| | ICE LIBOR USD 1 Month + 2.7921%, 4.1161%, 8/15/36 (144A)‡ | | 12,935,269 | | | 12,331,836 | |
| | BX Commercial Mortgage Trust 2019-XL, | | | | | | |
| | ICE LIBOR USD 1 Month + 2.0000%, 3.3240%, 10/15/36 (144A)‡ | | 2,550,000 | | | 2,454,907 | |
| | BX Commercial Mortgage Trust 2019-XL, | | | | | | |
| | ICE LIBOR USD 1 Month + 2.6500%, 3.9740%, 10/15/36 (144A)‡ | | 15,440,250 | | | 14,460,648 | |
| | BX Commercial Mortgage Trust 2021-21M E, | | | | | | |
| | ICE LIBOR USD 1 Month + 2.1710%, 3.4950%, 10/15/36 (144A)‡ | | 9,000,000 | | | 8,257,175 | |
| | BX Commercial Mortgage Trust 2021-ARIA E, | | | | | | |
| | ICE LIBOR USD 1 Month + 2.2445%, 3.5685%, 10/15/36 (144A)‡ | | 10,000,000 | | | 9,334,236 | |
| | BX Commercial Mortgage Trust 2021-LBA EJV, | | | | | | |
| | ICE LIBOR USD 1 Month + 2.0000%, 3.3250%, 2/15/36 (144A)‡ | | 11,200,000 | | | 10,280,237 | |
| | | | | | | | |
| | |
See Notes to Schedule of Investments and Other Information and Notes to Financial Statements. |
| |
Janus Investment Fund | 7 |
Janus Henderson Multi-Sector Income Fund
Schedule of Investments
June 30, 2022
| | | | | | | | |
Shares or
Principal Amounts | | | Value | |
Asset-Backed/Commercial Mortgage-Backed Securities– (continued) | | | |
| | BX Commercial Mortgage Trust 2021-LBA EV, | | | | | | |
| | ICE LIBOR USD 1 Month + 2.0000%, 3.3250%, 2/15/36 (144A)‡ | | $9,000,000 | | | $8,192,861 | |
| | BX Commercial Mortgage Trust 2021-SOAR J, | | | | | | |
| | ICE LIBOR USD 1 Month + 3.7500%, 5.0750%, 6/15/38 (144A)‡ | | 9,229,088 | | | 8,686,466 | |
| | BX Commercial Mortgage Trust 2021-VINO G, | | | | | | |
| | ICE LIBOR USD 1 Month + 3.9523%, 5.2763%, 5/15/38 (144A)‡ | | 12,000,000 | | | 11,103,701 | |
| | BX Commercial Mortgage Trust 2021-VOLT F, | | | | | | |
| | ICE LIBOR USD 1 Month + 2.4000%, 3.7240%, 9/15/36 (144A)‡ | | 8,440,000 | | | 7,871,152 | |
| | BX Commercial Mortgage Trust 2021-VOLT G, | | | | | | |
| | ICE LIBOR USD 1 Month + 2.8500%, 4.1740%, 9/15/36 (144A)‡ | | 6,000,000 | | | 5,411,636 | |
| | Carlyle Global Markets Strategies 2012-3A CR2, | | | | | | |
| | ICE LIBOR USD 3 Month + 3.5000%, 3.7384%, 1/14/32 (144A)‡ | | 4,139,000 | | | 3,628,856 | |
| | Carvana Auto Receivables Trust 2019-2A XS, 0%, 4/15/26 (144A)‡,¤ | | 118,935,665 | | | 441,251 | |
| | Carvana Auto Receivables Trust 2019-4A XS, 0%, 10/15/26 (144A)‡,¤ | | 84,025,209 | | | 360,468 | |
| | Carvana Auto Receivables Trust 2021-N3 E, 3.1600%, 6/12/28 (144A) | | 12,890,000 | | | 11,746,835 | |
| | Carvana Auto Receivables Trust 2021-N3 N, 2.5300%, 6/12/28 (144A) | | 521,599 | | | 521,426 | |
| | Carvana Auto Receivables Trust 2021-N4 N, 2.9900%, 9/11/28 (144A) | | 926,237 | | | 925,133 | |
| | Castlelake Aircraft Securitization Trust 2016-1, 6.1500%, 8/15/41 | | 488,415 | | | 383,406 | |
| | Castlelake Aircraft Securitization Trust 2018-1, 6.6250%, 6/15/43 (144A) | | 3,830,196 | | | 2,471,686 | |
| | CBAM CLO Management 2019-10A E, | | | | | | |
| | ICE LIBOR USD 3 Month + 7.0000%, 8.0627%, 4/20/32 (144A)‡ | | 3,000,000 | | | 2,663,184 | |
| | CBAM CLO Management 2020-13A A, | | | | | | |
| | ICE LIBOR USD 3 Month + 1.4300%, 2.4927%, 1/20/34 (144A)‡ | | 6,000,000 | | | 5,900,496 | |
| | CBAM CLO Management 2021-14A A, | | | | | | |
| | ICE LIBOR USD 3 Month + 1.1000%, 2.1627%, 4/20/34 (144A)‡ | | 15,000,000 | | | 14,506,575 | |
| | CBAM CLO Management 2021-14A D, | | | | | | |
| | ICE LIBOR USD 3 Month + 3.1000%, 4.1627%, 4/20/34 (144A)‡ | | 10,000,000 | | | 8,827,270 | |
| | Chase Auto Credit Linked Note 2021-3 E, 2.1020%, 2/26/29 (144A) | | 1,583,771 | | | 1,533,454 | |
| | Chase Auto Credit Linked Notes 2021-1 E, 2.3650%, 9/25/28 (144A) | | 1,978,226 | | | 1,942,701 | |
| | Chase Auto Credit Linked Notes 2021-1 F, 4.2800%, 9/25/28 (144A) | | 3,337,000 | | | 3,213,015 | |
| | Chase Mortgage Finance Corp 2021-CL1 M4, | | | | | | |
| | US 30 Day Average SOFR + 2.6500%, 3.5757%, 2/25/50 (144A)‡ | | 2,669,467 | | | 2,504,691 | |
| | Chase Mortgage Finance Corp 2021-CL1 M5, | | | | | | |
| | US 30 Day Average SOFR + 3.2500%, 4.1757%, 2/25/50 (144A)‡ | | 1,067,919 | | | 999,241 | |
| | CIFC Funding Ltd 2015-3A DR, | | | | | | |
| | ICE LIBOR USD 3 Month + 2.5000%, 3.5443%, 4/19/29 (144A)‡ | | 2,097,500 | | | 1,851,795 | |
| | CIFC Funding Ltd 2016-1A D2RR, | | | | | | |
| | ICE LIBOR USD 3 Month + 4.2500%, 5.3483%, 10/21/31 (144A)‡ | | 5,000,000 | | | 4,640,165 | |
| | CIM Retail Portfolio Trust 2021-RETL E, | | | | | | |
| | ICE LIBOR USD 1 Month + 3.7500%, 5.0750%, 8/15/36 (144A)‡ | | 3,900,000 | | | 3,801,248 | |
| | CIM Trust 2021-NR1 A1, 2.5690%, 7/25/55 (144A)Ç | | 6,664,697 | | | 6,339,284 | |
| | Citigroup Commercial Mortgage Trust 2018-C5, 0.6899%, 6/10/51‡,¤ | | 36,034,362 | | | 1,155,009 | |
| | Citigroup Commercial Mortgage Trust 2021-PRM2 E, | | | | | | |
| | ICE LIBOR USD 1 Month + 2.4000%, 3.7250%, 10/15/36 (144A)‡ | | 2,000,000 | | | 1,894,241 | |
| | Citigroup Commercial Mortgage Trust 2021-PRM2 F, | | | | | | |
| | ICE LIBOR USD 1 Month + 3.7500%, 5.0750%, 10/15/36 (144A)‡ | | 6,000,000 | | | 5,670,440 | |
| | Citigroup Commercial Mortgage Trust 2021-PRM2 G, | | | | | | |
| | ICE LIBOR USD 1 Month + 4.5000%, 5.8250%, 10/15/36 (144A)‡ | | 6,000,000 | | | 5,827,587 | |
| | Citigroup Commercial Mortgage Trust 2021-PRM2 J, | | | | | | |
| | ICE LIBOR USD 1 Month + 5.4000%, 6.7250%, 10/15/36 (144A)‡ | | 6,000,000 | | | 5,663,766 | |
| | Coinstar Funding LLC 2017-1A A2, 5.2160%, 4/25/47 (144A) | | 12,810,750 | | | 12,422,794 | |
| | Cold Storage Trust 2020-ICE5 F, | | | | | | |
| | ICE LIBOR USD 1 Month + 3.4925%, 4.8165%, 11/15/37 (144A)‡ | | 12,828,026 | | | 12,191,208 | |
| | Cologix Data Centers Issuer LLC 2022-1CAN A2, 4.9400%, 1/25/52 (144A) | | 5,000,000 | CAD | | 3,627,203 | |
| | COLT Funding LLC 2021-3R B1, 3.5630%, 12/25/64 (144A)‡ | | 2,547,000 | | | 2,153,295 | |
| | COLT Funding LLC 2021-3R B2, 4.5660%, 12/25/64 (144A)‡ | | 2,145,000 | | | 1,946,277 | |
| | Conn Funding II LP 2021-A B, 2.8700%, 5/15/26 (144A) | | 3,140,000 | | | 3,056,884 | |
| | Connecticut Avenue Securities Trust 2017-C05 1M2C, | | | | | | |
| | ICE LIBOR USD 1 Month + 2.2000%, 3.8236%, 1/25/30‡ | | 11,211,032 | | | 11,221,410 | |
| | | | | | | | |
| | |
See Notes to Schedule of Investments and Other Information and Notes to Financial Statements. |
| |
8 | JUNE 30, 2022 |
Janus Henderson Multi-Sector Income Fund
Schedule of Investments
June 30, 2022
| | | | | | | | |
Shares or
Principal Amounts | | | Value | |
Asset-Backed/Commercial Mortgage-Backed Securities– (continued) | | | |
| | Connecticut Avenue Securities Trust 2018-C05 1B1, | | | | | | |
| | ICE LIBOR USD 1 Month + 4.2500%, 5.8736%, 1/25/31‡ | | $5,692,259 | | | $5,655,163 | |
| | Connecticut Avenue Securities Trust 2018-R07 1B1, | | | | | | |
| | ICE LIBOR USD 1 Month + 4.3500%, 5.9736%, 4/25/31 (144A)‡ | | 4,000,000 | | | 3,976,051 | |
| | Connecticut Avenue Securities Trust 2019-R02, | | | | | | |
| | ICE LIBOR USD 1 Month + 2.3000%, 3.9236%, 8/25/31 (144A)‡ | | 178,583 | | | 177,930 | |
| | Connecticut Avenue Securities Trust 2019-R02, | | | | | | |
| | ICE LIBOR USD 1 Month + 4.1500%, 5.7736%, 8/25/31 (144A)‡ | | 20,849,000 | | | 20,613,021 | |
| | Connecticut Avenue Securities Trust 2019-R03 1B1, | | | | | | |
| | ICE LIBOR USD 1 Month + 4.1000%, 5.7236%, 9/25/31 (144A)‡ | | 13,230,669 | | | 13,079,089 | |
| | Connecticut Avenue Securities Trust 2019-R04 2B1, | | | | | | |
| | ICE LIBOR USD 1 Month + 5.2500%, 6.8736%, 6/25/39 (144A)‡ | | 5,648,548 | | | 5,724,443 | |
| | Connecticut Avenue Securities Trust 2019-R05, | | | | | | |
| | ICE LIBOR USD 1 Month + 4.1000%, 5.7236%, 7/25/39 (144A)‡ | | 9,119,291 | | | 8,908,668 | |
| | Connecticut Avenue Securities Trust 2021-R02 2B1, | | | | | | |
| | US 30 Day Average SOFR + 3.3000%, 4.2257%, 11/25/41 (144A)‡ | | 7,600,000 | | | 6,561,266 | |
| | Connecticut Avenue Securities Trust 2022-R01 1B1, | | | | | | |
| | US 30 Day Average SOFR + 3.1500%, 4.0757%, 12/25/41 (144A)‡ | | 13,477,000 | | | 10,792,731 | |
| | Connecticut Avenue Securities Trust 2022-R02 2B1, | | | | | | |
| | US 30 Day Average SOFR + 4.5000%, 5.4257%, 1/25/42 (144A)‡ | | 17,053,000 | | | 15,460,178 | |
| | Connecticut Avenue Securities Trust 2022-R04 1M1, | | | | | | |
| | US 30 Day Average SOFR + 2.0000%, 2.9257%, 3/25/42 (144A)‡ | | 12,824,489 | | | 12,568,827 | |
| | Credit Suisse Commercial Mortgage Trust 2019-ICE4 F, | | | | | | |
| | ICE LIBOR USD 1 Month + 2.6500%, 3.9740%, 5/15/36 (144A)‡ | | 14,200,000 | | | 13,485,397 | |
| | Credit Suisse Commercial Mortgage Trust 2020-TMIC A, | | | | | | |
| | ICE LIBOR USD 1 Month + 3.0000%, 4.3240%, 12/15/35 (144A)‡ | | 15,000,000 | | | 14,814,703 | |
| | Credit Suisse Commercial Mortgage Trust 2020-UNFI, | | | | | | |
| | ICE LIBOR USD 1 Month + 3.6682%, 4.7882%, 12/15/22 (144A)‡ | | 15,000,000 | | | 14,657,641 | |
| | Credit Suisse Commercial Mortgage Trust 2021-WEHO A, | | | | | | |
| | ICE LIBOR USD 1 Month + 3.9693%, 5.2943%, 4/15/23 (144A)‡ | | 12,581,125 | | | 12,212,034 | |
| | CSAIL 2021-C20 XA, 1.1700%, 3/15/54‡,¤ | | 60,475,669 | | | 4,133,977 | |
| | DBCCRE Mortgage Trust 2014-ARCP D, 5.0990%, 1/10/34 (144A)‡ | | 1,000,000 | | | 986,700 | |
| | DBCCRE Mortgage Trust 2014-ARCP E, 5.0990%, 1/10/34 (144A)‡ | | 2,848,000 | | | 2,726,732 | |
| | DBCCRE Mortgage Trust 2014-ARCP F, 5.0990%, 1/10/34 (144A)‡ | | 11,442,000 | | | 10,872,967 | |
| | Diamond Infrastructure Funding LLC 2021-1A B, 2.3550%, 4/15/49 (144A) | | 4,000,000 | | | 3,435,121 | |
| | Diamond Infrastructure Funding LLC 2021-1A C, 3.4750%, 4/15/49 (144A) | | 3,420,000 | | | 2,907,958 | |
| | Diamond Issuer LLC 2021-1A C, 3.7870%, 11/20/51 (144A) | | 5,000,000 | | | 4,238,771 | |
| | Diamond Resorts Owner Trust 2021-1A D, 3.8300%, 11/21/33 (144A) | | 797,880 | | | 762,792 | |
| | DROP Mortgage Trust 2021-FILE D, | | | | | | |
| | ICE LIBOR USD 1 Month + 2.7500%, 4.0700%, 10/15/43 (144A)‡ | | 15,000,000 | | | 13,983,933 | |
| | Dryden Senior Loan Fund 2020-83A D, | | | | | | |
| | ICE LIBOR USD 3 Month + 3.5000%, 4.5443%, 1/18/32 (144A)‡ | | 6,000,000 | | | 5,556,792 | |
| | ECAF I Ltd, 5.8020%, 6/15/40 (144A) | | 3,163,638 | | | 893,766 | |
| | Elmwood CLO VIII Ltd 2021-1A A, | | | | | | |
| | ICE LIBOR USD 3 Month + 1.2400%, 2.3027%, 1/20/34 (144A)‡ | | 5,000,000 | | | 4,863,930 | |
| | Elmwood CLO VIII Ltd 2021-1A D, | | | | | | |
| | ICE LIBOR USD 3 Month + 3.0000%, 4.0627%, 1/20/34 (144A)‡ | | 3,000,000 | | | 2,800,074 | |
| | Exeter Automobile Receivables Trust 2020-1A E, 3.7400%, 1/15/27 (144A) | | 3,000,000 | | | 2,928,311 | |
| | Exeter Automobile Receivables Trust 2020-2A E, 7.1900%, 9/15/27 (144A) | | 6,794,000 | | | 6,908,502 | |
| | Extended Stay America Trust 2021-ESH E, | | | | | | |
| | ICE LIBOR USD 1 Month + 2.8500%, 4.1750%, 7/15/38 (144A)‡ | | 15,057,330 | | | 14,454,337 | |
| | ExteNet Issuer LLC, 5.2190%, 7/26/49 (144A) | | 4,000,000 | | | 3,799,573 | |
| | Fannie Mae REMICS, ICE LIBOR USD 1 Month + 55.0000%, 43.3212%, 10/25/40‡ | | 588,203 | | | 1,257,002 | |
| | Fannie Mae REMICS, 3.0000%, 5/25/48 | | 16,919 | | | 16,170 | |
| | Fannie Mae REMICS, ICE LIBOR USD 1 Month + 6.0500%, 4.4264%, 8/25/48‡,¤ | | 7,877,065 | | | 1,102,565 | |
| | First Investors Auto Owner Trust 2018-1, 7.1600%, 8/15/25 (144A) | | 6,026,000 | | | 6,038,805 | |
| | Flagstar Mortgage Trust 2021-13IN A17, 3.0000%, 12/30/51 (144A)‡ | | 16,386,193 | | | 14,221,410 | |
| | Flagstar Mortgage Trust 2021-13IN A2, 3.0000%, 12/30/51 (144A)‡ | | 42,213,466 | | | 37,641,044 | |
| | Foursight Capital Auto Receivables Trust 2020-1 F, 4.6200%, 6/15/27 (144A) | | 1,250,000 | | | 1,248,862 | |
| | | | | | | | |
| | |
See Notes to Schedule of Investments and Other Information and Notes to Financial Statements. |
| |
Janus Investment Fund | 9 |
Janus Henderson Multi-Sector Income Fund
Schedule of Investments
June 30, 2022
| | | | | | | | |
Shares or
Principal Amounts | | | Value | |
Asset-Backed/Commercial Mortgage-Backed Securities– (continued) | | | |
| | Freddie Mac Multifamily Structured Credit Risk 2021-MN1 B1, | | | | | | |
| | US 30 Day Average SOFR + 7.7500%, 8.6757%, 1/25/51 (144A)‡ | | $1,000,000 | | | $984,653 | |
| | Freddie Mac Multifamily Structured Credit Risk 2021-MN1 M2, | | | | | | |
| | US 30 Day Average SOFR + 3.7500%, 4.6757%, 1/25/51 (144A)‡ | | 2,000,000 | | | 1,709,051 | |
| | Freddie Mac Multifamily Structured Credit Risk 2021-MN3 M2, | | | | | | |
| | US 30 Day Average SOFR + 4.0000%, 4.5845%, 11/25/51 (144A)‡ | | 10,000,000 | | | 8,865,548 | |
| | Freddie Mac Structured Agency Credit Risk Debt Notes 2018-DNA2 B1, | | | | | | |
| | ICE LIBOR USD 1 Month + 3.7000%, 5.3236%, 12/25/30 (144A)‡ | | 5,607,000 | | | 5,481,313 | |
| | Freddie Mac Structured Agency Credit Risk Debt Notes 2020-DNA3 B1, | | | | | | |
| | ICE LIBOR USD 1 Month + 5.1000%, 6.7236%, 6/25/50 (144A)‡ | | 6,332,862 | | | 6,485,336 | |
| | Freddie Mac Structured Agency Credit Risk Debt Notes 2020-HQA3 M2, | | | | | | |
| | ICE LIBOR USD 1 Month + 3.6000%, 5.2236%, 7/25/50 (144A)‡ | | 285,323 | | | 285,359 | |
| | Freddie Mac Structured Agency Credit Risk Debt Notes 2020-HQA4 B1, | | | | | | |
| | ICE LIBOR USD 1 Month + 5.2500%, 6.8736%, 9/25/50 (144A)‡ | | 8,939,000 | | | 9,214,271 | |
| | Freddie Mac Structured Agency Credit Risk Debt Notes 2020-HQA5 B1, | | | | | | |
| | US 30 Day Average SOFR + 4.0000%, 4.9257%, 11/25/50 (144A)‡ | | 5,441,430 | | | 5,172,301 | |
| | Freddie Mac Structured Agency Credit Risk Debt Notes 2021-DNA2 B2, | | | | | | |
| | US 30 Day Average SOFR + 6.0000%, 6.9257%, 8/25/33 (144A)‡ | | 12,308,000 | | | 9,818,554 | |
| | Freddie Mac Structured Agency Credit Risk Debt Notes 2021-DNA2 M2, | | | | | | |
| | US 30 Day Average SOFR + 2.3000%, 3.2257%, 8/25/33 (144A)‡ | | 1,483,000 | | | 1,401,734 | |
| | Freddie Mac Structured Agency Credit Risk Debt Notes 2021-DNA3 B2, | | | | | | |
| | US 30 Day Average SOFR + 6.2500%, 7.1757%, 10/25/33 (144A)‡ | | 20,836,000 | | | 17,020,896 | |
| | Freddie Mac Structured Agency Credit Risk Debt Notes 2021-DNA5 B1, | | | | | | |
| | US 30 Day Average SOFR + 3.0500%, 3.9757%, 1/25/34 (144A)‡ | | 6,624,000 | | | 5,719,416 | |
| | FREMF Mortgage Trust 2018-KF45, | | | | | | |
| | ICE LIBOR USD 1 Month + 1.9500%, 3.0699%, 3/25/25 (144A)‡ | | 426,398 | | | 421,793 | |
| | FREMF Mortgage Trust 2018-KL2P BPZ, | | | | | | |
| | ICE LIBOR USD 1 Month + 2.5000%, 3.6199%, 1/25/28 (144A)‡ | | 5,597,272 | | | 5,497,351 | |
| | FREMF Mortgage Trust 2018-KSW4 C, | | | | | | |
| | ICE LIBOR USD 1 Month + 5.0000%, 6.1199%, 10/25/28‡ | | 8,167,653 | | | 7,641,975 | |
| | FREMF Mortgage Trust 2019-KF70 C, | | | | | | |
| | ICE LIBOR USD 1 Month + 6.0000%, 7.1199%, 9/25/29 (144A)‡ | | 13,299,902 | | | 13,092,207 | |
| | FREMF Mortgage Trust 2019-KF72, | | | | | | |
| | ICE LIBOR USD 1 Month + 2.1000%, 3.2199%, 11/25/26 (144A)‡ | | 3,219,329 | | | 3,137,041 | |
| | Gam Resecuritization Trust 2021-FRR2 BK74, 0%, 9/27/51 (144A)◊ | | 11,000,000 | | | 7,614,039 | |
| | Gam Resecuritization Trust 2021-FRR2 CK74, 0%, 9/27/51 (144A)◊ | | 18,068,494 | | | 11,792,081 | |
| | GCAT 2022-INV1 A26, 3.0000%, 12/25/51 (144A)‡ | | 17,902,587 | | | 15,732,244 | |
| | Golden Tree Loan Management US CLO1 Ltd 2017-1A ER2, | | | | | | |
| | ICE LIBOR USD 3 Month + 6.5000%, 6.7540%, 4/20/34 (144A)‡ | | 5,000,000 | | | 4,359,620 | |
| | Government National Mortgage Association, | | | | | | |
| | ICE LIBOR USD 1 Month + 5.5500%, 3.9549%, 1/20/44‡,¤ | | 403,106 | | | 46,790 | |
| | Government National Mortgage Association, | | | | | | |
| | ICE LIBOR USD 1 Month + 6.1500%, 4.6407%, 10/16/55‡,¤ | | 512,822 | | | 39,668 | |
| | Government National Mortgage Association, 0.2865%, 1/16/60‡,¤ | | 12,700,213 | | | 410,165 | |
| | Great Wolf Trust, | | | | | | |
| | ICE LIBOR USD 1 Month + 2.7320%, 4.0560%, 12/15/36 (144A)‡ | | 19,500,000 | | | 18,204,775 | |
| | Great Wolf Trust, | | | | | | |
| | ICE LIBOR USD 1 Month + 3.1310%, 4.4550%, 12/15/36 (144A)‡ | | 3,899,000 | | | 3,573,324 | |
| | GS Mortgage Securities Trust 2017-SLP F, 4.7443%, 10/10/32 (144A)‡ | | 6,500,000 | | | 6,391,430 | |
| | GS Mortgage Securities Trust 2017-SLP G, 4.7443%, 10/10/32 (144A)‡ | | 1,831,000 | | | 1,781,627 | |
| | Hertz Vehicle Financing LLC 2021-1A D, 3.9800%, 12/26/25 (144A) | | 15,000,000 | | | 13,927,878 | |
| | HGI CRE CLO Ltd 2021-FL1 D, | | | | | | |
| | ICE LIBOR USD 1 Month + 2.3500%, 3.8593%, 6/16/36 (144A)‡ | | 5,000,000 | | | 4,795,359 | |
| | Highbridge Loan Management Ltd 10A-16 DR, | | | | | | |
| | ICE LIBOR USD 3 Month + 6.4100%, 7.4727%, 4/20/34 (144A)‡ | | 9,000,000 | | | 7,736,580 | |
| | Highbridge Loan Management Ltd 2021-16A A1, | | | | | | |
| | ICE LIBOR USD 3 Month + 1.1400%, 2.3240%, 1/23/35 (144A)‡ | | 14,722,000 | | | 14,176,005 | |
| | Hilton Grand Vacations Trust 2022-1D D, 6.7900%, 6/20/34 (144A) | | 3,180,147 | | | 3,155,077 | |
| | Home Partners of America Trust 2021-2 F, 3.7990%, 12/17/26 (144A) | | 19,635,888 | | | 18,401,319 | |
| | Home Partners of America Trust 2021-3 F, 4.2420%, 1/17/41 (144A) | | 4,799,032 | | | 4,091,183 | |
| | |
See Notes to Schedule of Investments and Other Information and Notes to Financial Statements. |
| |
10 | JUNE 30, 2022 |
Janus Henderson Multi-Sector Income Fund
Schedule of Investments
June 30, 2022
| | | | | | | | |
Shares or
Principal Amounts | | | Value | |
Asset-Backed/Commercial Mortgage-Backed Securities– (continued) | | | |
| | Hotwire Funding LLC 2021-1 C, 4.4590%, 11/20/51 (144A) | | $3,000,000 | | | $2,753,349 | |
| | JP Morgan Chase Commercial Mortgage Sec Trust 2021-NYAH E, | | | | | | |
| | ICE LIBOR USD 1 Month + 1.8400%, 3.1640%, 6/15/38 (144A)‡ | | 5,000,000 | | | 4,705,056 | |
| | JP Morgan Chase Commercial Mortgage Sec Trust 2022-NLP D, | | | | | | |
| | CME Term SOFR 1 Month + 2.1664%, 3.4451%, 4/15/37 (144A)‡ | | 19,300,000 | | | 18,073,917 | |
| | Kayne CLO 10 Ltd 2021-10A A, | | | | | | |
| | ICE LIBOR USD 3 Month + 1.1700%, 1.4289%, 4/23/34 (144A)‡ | | 12,500,000 | | | 12,128,800 | |
| | KNDL Mortgage Trust 2019-KNSQ F, | | | | | | |
| | ICE LIBOR USD 1 Month + 2.0000%, 3.3240%, 5/15/36 (144A)‡ | | 2,000,000 | | | 1,931,336 | |
| | LCM LP XIV, ICE LIBOR USD 3 Month + 1.0400%, 2.1027%, 7/20/31 (144A)‡ | | 4,640,000 | | | 4,519,263 | |
| | Lendbuzz Securitization Trust 2021-1A A, 4.2200%, 5/17/27 (144A)‡ | | 4,736,908 | | | 4,652,586 | |
| | Lendbuzz Securitization Trust 2021-1A A, 5.9900%, 12/15/28 (144A)‡ | | 5,594,000 | | | 5,559,010 | |
| | Life Financial Services Trust 2021-BMR E, | | | | | | |
| | ICE LIBOR USD 1 Month + 1.7500%, 3.0740%, 3/15/38 (144A)‡ | | 27,523,164 | | | 25,709,180 | |
| | Life Financial Services Trust 2022-BMR2 D, | | | | | | |
| | CME Term SOFR 1 Month + 2.5419%, 3.8206%, 5/15/39 (144A)‡ | | 10,000,000 | | | 9,546,426 | |
| | LoanMe Trust SBL 2019-1, 10.0000%, 8/15/30 (144A)Ç | | 8,036,693 | | | 7,954,784 | |
| | Longfellow Place CLO Ltd 2013-1A DRR, | | | | | | |
| | ICE LIBOR USD 3 Month + 4.5000%, 5.5443%, 4/15/29 (144A)‡ | | 3,000,000 | | | 2,879,979 | |
| | LUXE Commercial Mortgage Trust 2021-TRIP E, | | | | | | |
| | ICE LIBOR USD 1 Month + 2.7500%, 4.0740%, 10/15/38 (144A)‡ | | 8,000,000 | | | 7,521,401 | |
| | LUXE Commercial Mortgage Trust 2021-TRIP F, | | | | | | |
| | ICE LIBOR USD 1 Month + 3.2500%, 4.5740%, 10/15/38 (144A)‡ | | 8,000,000 | | | 7,456,643 | |
| | Luxury Lease Partners Auto Trust 2021-ARC2 A, 3.0000%, 7/15/27 (144A) | | 2,648,636 | | | 2,592,011 | |
| | Madison Park Funding Ltd 2016-22A DR, | | | | | | |
| | ICE LIBOR USD 3 Month + 3.5000%, 4.5443%, 1/15/33 (144A)‡ | | 8,500,000 | | | 7,886,206 | |
| | Madison Park Funding Ltd 2018-32A A1R, | | | | | | |
| | ICE LIBOR USD 3 Month + 1.0000%, 1.2589%, 1/22/31 (144A)‡ | | 10,000,000 | | | 9,766,160 | |
| | Madison Park Funding Ltd 2018-32A DR, | | | | | | |
| | ICE LIBOR USD 3 Month + 3.2000%, 3.4589%, 1/22/31 (144A)‡ | | 7,000,000 | | | 6,571,222 | |
| | Madison Park Funding Ltd 2021-38A A, | | | | | | |
| | ICE LIBOR USD 3 Month + 1.1200%, 2.1643%, 7/17/34 (144A)‡ | | 5,000,000 | | | 4,831,215 | |
| | Magnetite CLO Ltd 2015-12A ARR, | | | | | | |
| | ICE LIBOR USD 3 Month + 1.1000%, 2.1443%, 10/15/31 (144A)‡ | | 4,375,000 | | | 4,279,013 | |
| | MBRT 2019-MBR H1, | | | | | | |
| | ICE LIBOR USD 1 Month + 4.2500%, 5.5740%, 11/15/36 (144A)‡ | | 5,000,000 | | | 4,842,060 | |
| | MBRT 2019-MBR H2, | | | | | | |
| | ICE LIBOR USD 1 Month + 5.2000%, 6.5240%, 11/15/36 (144A)‡ | | 1,950,000 | | | 1,885,823 | |
| | MED Trust 2021-MDLN D, | | | | | | |
| | ICE LIBOR USD 1 Month + 2.0000%, 3.3250%, 11/15/38 (144A)‡ | | 18,386,000 | | | 17,437,846 | |
| | MED Trust 2021-MDLN F, | | | | | | |
| | ICE LIBOR USD 1 Month + 4.0000%, 5.3250%, 11/15/38 (144A)‡ | | 7,733,000 | | | 7,234,190 | |
| | MED Trust 2021-MDLN G, | | | | | | |
| | ICE LIBOR USD 1 Month + 5.2500%, 6.5750%, 11/15/38 (144A)‡ | | 15,000,000 | | | 14,028,512 | |
| | Mello Mortgage Capital Acceptance Trust 2021-INV4 A3, | | | | | | |
| | 2.5000%, 12/25/51 (144A)‡ | | 3,643,509 | | | 3,099,314 | |
| | Mello Warehouse Securitization Trust 2021-1 F, | | | | | | |
| | ICE LIBOR USD 1 Month + 2.7500%, 3.4179%, 2/25/55 (144A)‡ | | 3,386,000 | | | 3,203,357 | |
| | Mercury Financial Credit Card Master Trust 2021-1A B, | | | | | | |
| | 2.3300%, 3/20/26 (144A) | | 5,000,000 | | | 4,793,717 | |
| | Mercury Financial Credit Card Master Trust 2021-1A C, | | | | | | |
| | 4.2100%, 3/20/26 (144A) | | 4,000,000 | | | 3,926,297 | |
| | MHC Commercial Mortgage Trust 2021-MHC E, | | | | | | |
| | ICE LIBOR USD 1 Month + 2.1010%, 3.4250%, 4/15/38 (144A)‡ | | 3,000,000 | | | 2,818,605 | |
| | MHC Commercial Mortgage Trust 2021-MHC G, | | | | | | |
| | ICE LIBOR USD 1 Month + 3.2010%, 4.5250%, 4/15/38 (144A)‡ | | 10,620,000 | | | 9,773,299 | |
| | Mission Lane Credit Card Master Trust 2021-A B, 2.2400%, 9/15/26 (144A) | | 3,000,000 | | | 2,831,254 | |
| | Mission Lane Credit Card Master Trust 2021-A C, 4.7500%, 9/15/26 (144A) | | 5,000,000 | | | 4,714,674 | |
| | Multifamily Connecticut Avenue Securities Trust 2019-01, | | | | | | |
| | ICE LIBOR USD 1 Month + 3.2500%, 4.8736%, 10/15/49 (144A)‡ | | 18,756,000 | | | 16,583,035 | |
| | |
See Notes to Schedule of Investments and Other Information and Notes to Financial Statements. |
| |
Janus Investment Fund | 11 |
Janus Henderson Multi-Sector Income Fund
Schedule of Investments
June 30, 2022
| | | | | | | | |
Shares or
Principal Amounts | | | Value | |
Asset-Backed/Commercial Mortgage-Backed Securities– (continued) | | | |
| | Multifamily Connecticut Avenue Securities Trust 2020-01, | | | | | | |
| | ICE LIBOR USD 1 Month + 3.7500%, 5.3736%, 3/25/50 (144A)‡ | | $9,946,000 | | | $8,851,940 | |
| | Multifamily Connecticut Avenue Securities Trust 2020-01 CE, | | | | | | |
| | ICE LIBOR USD 1 Month + 7.5000%, 9.1236%, 3/25/50 (144A)‡ | | 2,000,000 | | | 1,926,752 | |
| | MVW Owner Trust 2021-1WA D, 3.1700%, 1/22/41 (144A) | | 2,790,611 | | | 2,586,970 | |
| | NBC Funding LLC 2021-1 B, 4.9700%, 7/30/51 (144A) | | 3,000,000 | | | 2,760,260 | |
| | Neuberger Berman CLO Ltd, | | | | | | |
| | ICE LIBOR USD 3 Month + 2.8000%, 4.0381%, 1/28/30 (144A)‡ | | 6,000,000 | | | 5,395,722 | |
| | New Residential Mortgage Loan Trust 2022-SFR1 F, 4.4430%, 2/17/39 (144A) | | 10,500,000 | | | 9,315,627 | |
| | NW Re-Remic Trust 2021-FRR1 BK88, 2.6760%, 12/18/51 (144A)‡ | | 20,000,000 | | | 15,896,838 | |
| | Oak Hill Credit Partners 2012-7A AR3, | | | | | | |
| | ICE LIBOR USD 3 Month + 1.0700%, 2.5480%, 2/20/34 (144A)‡ | | 5,000,000 | | | 4,837,650 | |
| | Oak Street Investment Grade Net Lease Fund 2020-1A B1, | | | | | | |
| | 5.1100%, 11/20/50 (144A) | | 4,499,000 | | | 4,030,430 | |
| | Oak Street Investment Grade Net Lease Fund 2021-1A B1, | | | | | | |
| | 4.2300%, 1/20/51 (144A) | | 2,400,000 | | | 2,231,422 | |
| | Oasis Securitization 2021-1A A, 2.5792%, 2/15/33 (144A) | | 2,169,820 | | | 2,144,458 | |
| | Oasis Securitization 2021-2A A, 2.1430%, 10/15/33 (144A) | | 6,968,322 | | | 6,822,842 | |
| | Oasis Securitization 2021-2A B, 5.1470%, 10/15/33 (144A) | | 6,968,740 | | | 6,824,465 | |
| | OCP CLO Ltd, ICE LIBOR USD 3 Month + 3.0000%, 3.2589%, 4/24/29 (144A)‡ | | 6,000,000 | | | 5,808,204 | |
| | Octagon Investment Partners 42 Ltd 2019-3A AR, | | | | | | |
| | ICE LIBOR USD 3 Month + 1.1400%, 2.1843%, 7/15/34 (144A)‡ | | 10,000,000 | | | 9,637,970 | |
| | Octagon Investment Partners 42 Ltd 2019-3A ER, | | | | | | |
| | ICE LIBOR USD 3 Month + 6.7500%, 7.7943%, 7/15/34 (144A)‡ | | 7,000,000 | | | 6,208,601 | |
| | Octagon Investment Partners 44 Ltd 2019-1A AR, | | | | | | |
| | ICE LIBOR USD 3 Month + 1.1800%, 1.4213%, 10/15/34 (144A)‡ | | 15,000,000 | | | 14,407,275 | |
| | Octagon Investment Partners 44 Ltd 2019-1A ER, | | | | | | |
| | ICE LIBOR USD 3 Month + 6.7500%, 6.9913%, 10/15/34 (144A)‡ | | 6,600,000 | | | 5,764,638 | |
| | Octagon Investment Partners XXI Ltd 2014-1A AAR3, | | | | | | |
| | ICE LIBOR USD 3 Month + 1.0000%, 2.4113%, 2/14/31 (144A)‡ | | 8,000,000 | | | 7,799,128 | |
| | Ondeck Asset Securitization Trust LLC 2021-1A C, 2.9700%, 5/17/27 (144A) | | 3,000,000 | | | 2,836,984 | |
| | Onslow Bay Financial LLC 2021-INV3 A3, 2.5000%, 10/25/51 (144A)‡ | | 5,567,404 | | | 4,748,836 | |
| | Pagaya AI Debt Selection Trust 2021-1 CERT, 0%, 11/15/27 (144A)‡,¤ | | 1,846,154 | | | 1,384,616 | |
| | Pagaya AI Debt Selection Trust 2022-1 C, 4.8880%, 10/15/29 (144A) | | 3,680,000 | | | 3,318,993 | |
| | Palmer Square Loan Funding 2022-2A D, | | | | | | |
| | CME Term SOFR 3 Month + 6.2000%, 0%, 10/15/30 (144A)‡ | | 5,000,000 | | | 4,459,378 | |
| | Pawnee Equipment Receivables Series 2019-1 LLC, 3.8000%, 1/15/26 (144A) | | 4,467,000 | | | 4,372,870 | |
| | Pawnee Equipment Receivables Series 2020-1 LLC, 5.4300%, 7/15/27 (144A) | | 6,165,000 | | | 5,952,461 | |
| | Perimeter Master Note Business Trust, 5.2100%, 5/15/24 (144A) | | 2,250,000 | | | 2,205,929 | |
| | Point Securitization Trust 2021-1 A1, 3.2282%, 2/25/52 (144A)‡ | | 6,142,717 | | | 6,127,912 | |
| | Preston Ridge Partners Mortgage Trust 2021-10 A1, 2.4870%, 10/25/26 (144A)Ç | | 10,143,321 | | | 9,592,067 | |
| | Preston Ridge Partners Mortgage Trust 2021-9 A1, 2.3630%, 10/25/26 (144A)Ç | | 12,808,417 | | | 12,232,784 | |
| | Preston Ridge Partners Mortgage Trust 2022-2 A1, 5.0000%, 3/25/27 (144A)Ç | | 8,150,359 | | | 8,151,615 | |
| | Pretium Mortgage Credit Partners LLC 2021-RN4 A1, 2.4871%, 10/25/51 (144A)‡ | | 18,114,121 | | | 16,915,414 | |
| | PRIMA Capital Ltd, 4.2500%, 12/25/50 (144A) | | 10,500,000 | | | 8,887,215 | |
| | Progress Residential Trust 2021-SFR11 F, 4.4200%, 1/17/39 (144A) | | 4,885,000 | | | 4,095,070 | |
| | Progress Residential Trust 2022-SFR1 F, 4.8800%, 2/17/41 (144A) | | 9,000,000 | | | 7,862,911 | |
| | Progress Residential Trust 2022-SFR3 F, 6.6000%, 4/17/39 (144A) | | 2,500,000 | | | 2,375,584 | |
| | Project Silver, 6.9000%, 7/15/44 (144A)‡ | | 898,315 | | | 458,354 | |
| | Raptor Aircraft Finance I LLC, 4.2130%, 8/23/44 (144A) | | 10,992,095 | | | 8,526,252 | |
| | Regatta XV Funding Ltd 2018-4A D, | | | | | | |
| | ICE LIBOR USD 3 Month + 6.5000%, 7.6840%, 10/25/31 (144A)‡ | | 2,350,000 | | | 2,012,721 | |
| | Sand Trust 2021-1A D, | | | | | | |
| | ICE LIBOR USD 3 Month + 3.5500%, 4.5943%, 10/15/34 (144A)‡ | | 8,000,000 | | | 6,975,720 | |
| | Santander Consumer Auto Receivables Trust 2020-BA, 4.1300%, 1/15/27 (144A) | | 1,500,000 | | | 1,468,733 | |
| | Santander Consumer Auto Receivables Trust 2021-AA E, | | | | | | |
| | 3.2800%, 3/15/27 (144A) | | 1,750,000 | | | 1,664,136 | |
| | Santander Prime Auto Issuance Notes Trust 2018-A, 6.8000%, 9/15/25 (144A) | | 798,099 | | | 796,609 | |
| | SB Multifamily Repack Trust 2020-FRR2 A1, 4.0000%, 12/27/39 (144A)‡ | | 1,869,753 | | | 1,864,415 | |
| | SEB Funding LLC 2021-1A A2, 4.9690%, 1/30/52 (144A) | | 21,692,633 | | | 19,983,102 | |
| | |
See Notes to Schedule of Investments and Other Information and Notes to Financial Statements. |
| |
12 | JUNE 30, 2022 |
Janus Henderson Multi-Sector Income Fund
Schedule of Investments
June 30, 2022
| | | | | | | | |
Shares or
Principal Amounts | | | Value | |
Asset-Backed/Commercial Mortgage-Backed Securities– (continued) | | | |
| | Sierra Receivables Funding Co LLC 2020-2A D, 6.5900%, 7/20/37 (144A) | | $2,898,441 | | | $2,885,608 | |
| | Sierra Receivables Funding Co LLC 2021-1A D, 3.1700%, 11/20/37 (144A) | | 6,353,582 | | | 6,025,905 | |
| | Sierra Timeshare 2019-1 Receivables Funding LLC, 4.7500%, 1/20/36 (144A) | | 1,709,614 | | | 1,693,780 | |
| | Sierra Timeshare 2019-2 Receivables Funding LLC, 4.5400%, 5/20/36 (144A) | | 1,940,090 | | | 1,902,947 | |
| | Sprite Limited 2021-1 B, 5.1000%, 11/15/46 (144A) | | 5,681,820 | | | 4,908,242 | |
| | Sprite Limited 2021-1 C, 8.8350%, 11/15/46 (144A) | | 5,500,020 | | | 4,830,088 | |
| | Summit Issuer LLC 2020-1A A2, 2.2900%, 12/20/50 (144A) | | 6,000,000 | | | 5,487,421 | |
| | Summit Issuer LLC 2020-1A B, 3.1790%, 12/20/50 (144A) | | 2,500,000 | | | 2,250,595 | |
| | Symphony CLO Ltd 2012-9A D2R2, | | | | | | |
| | ICE LIBOR USD 3 Month + 4.1000%, 5.1443%, 7/16/32 (144A)‡ | | 11,000,000 | | | 10,147,731 | |
| | Symphony CLO Ltd 2014-15A DR2, | | | | | | |
| | ICE LIBOR USD 3 Month + 4.0000%, 5.0443%, 1/17/32 (144A)‡ | | 2,000,000 | | | 1,824,730 | |
| | Symphony CLO Ltd 2021-26A ER, | | | | | | |
| | ICE LIBOR USD 3 Month + 7.5000%, 8.5627%, 4/20/33 (144A)‡ | | 10,000,000 | | | 8,919,750 | |
| | Thrust Engine Leasing 2021-1A A, 4.1630%, 7/15/40 (144A) | | 9,723,493 | | | 8,619,469 | |
| | Thunderbolt Aircraft Lease Ltd 2017-A B, 5.7500%, 5/17/32 (144A)Ç | | 2,361,758 | | | 1,792,083 | |
| | TPI Re-Remic Trust 2022-FRR1 DK33, 0%, 7/25/46 (144A)◊ | | 2,237,000 | | | 2,060,451 | |
| | TPI Re-Remic Trust 2022-FRR1 DK34, 0%, 7/25/46 (144A)◊ | | 5,124,000 | | | 4,719,603 | |
| | TPI Re-Remic Trust 2022-FRR1 DK35, 0%, 8/25/46 (144A)◊ | | 2,639,000 | | | 2,430,725 | |
| | Tricolor Auto Securitization Trust 2022-1A E, 7.7900%, 8/16/27 (144A) | | 10,870,000 | | | 10,919,152 | |
| | TVEST LLC 2021-A B, 0%, 9/15/33 (144A) | | 6,550,000 | | | 4,879,947 | |
| | Upstart Securitization Trust 2019-2 C, 4.7830%, 9/20/29 (144A) | | 11,253,282 | | | 11,186,191 | |
| | Upstart Securitization Trust 2019-3 C, 5.3810%, 1/21/30 (144A) | | 20,600,000 | | | 20,416,427 | |
| | Upstart Securitization Trust 2020-3 C, 6.2500%, 11/20/30 (144A) | | 12,000,000 | | | 11,754,880 | |
| | Upstart Securitization Trust 2021-1 B, 1.8900%, 3/20/31 (144A) | | 2,400,000 | | | 2,313,476 | |
| | Upstart Securitization Trust 2021-1 C, 4.0600%, 3/20/31 (144A) | | 3,250,000 | | | 3,002,731 | |
| | VASA Trust 2021-VASA D, | | | | | | |
| | ICE LIBOR USD 1 Month + 2.1000%, 3.4240%, 7/15/39 (144A)‡ | | 7,000,000 | | | 6,562,561 | |
| | VASA Trust 2021-VASA F, | | | | | | |
| | ICE LIBOR USD 1 Month + 3.9000%, 5.2240%, 7/15/39 (144A)‡ | | 5,500,000 | | | 5,142,843 | |
| | VB-S1 Issuer LLC 2020-2A B, 3.2290%, 9/15/50 (144A) | | 5,750,000 | | | 5,377,005 | |
| | VB-S1 Issuer LLC 2020-2A C, 4.4590%, 9/15/50 (144A) | | 6,000,000 | | | 5,698,729 | |
| | Venture CDO Ltd 2021-42A A1A, | | | | | | |
| | ICE LIBOR USD 3 Month + 1.1300%, 2.1743%, 4/15/34 (144A)‡ | | 10,000,000 | | | 9,600,780 | |
| | Voya CLO Ltd 2014-4A CR2, | | | | | | |
| | ICE LIBOR USD 3 Month + 3.3500%, 3.5884%, 7/14/31 (144A)‡ | | 7,000,000 | | | 5,774,937 | |
| | Voya CLO Ltd 2018-2A E, | | | | | | |
| | ICE LIBOR USD 3 Month + 5.2500%, 6.2943%, 7/15/31 (144A)‡ | | 1,625,000 | | | 1,323,840 | |
| | Voya CLO Ltd 2021-1A A, | | | | | | |
| | ICE LIBOR USD 3 Month + 1.1400%, 1.3813%, 7/15/34 (144A)‡ | | 5,000,000 | | | 4,797,950 | |
| | Wells Fargo Commercial Mortgage Trust 2021-C61 XA, 1.5034%, 11/15/54‡,¤ | | 81,657,349 | | | 6,995,531 | |
| | Westgate Resorts 2018-4A C, | | | | | | |
| | ICE LIBOR USD 3 Month + 3.3000%, 4.4840%, 10/25/31 (144A)‡ | | 2,000,000 | | | 1,812,796 | |
| | Westgate Resorts 2022-1A D, 3.8380%, 8/20/36 (144A) | | 3,554,054 | | | 3,414,673 | |
| | Westlake Automobile Receivable Trust 2020-3A F, 5.1100%, 5/17/27 (144A) | | 7,000,000 | | | 6,826,981 | |
| | Westlake Automobile Receivable Trust 2021-3A E, 3.4200%, 4/15/27 (144A) | | 5,000,000 | | | 4,592,727 | |
| | Westlake Automobile Receivables Trust 2019-1, 5.6700%, 2/17/26 (144A) | | 2,000,000 | | | 2,014,234 | |
| | Willis Engine Securitization Trust 2020-A B, 4.2120%, 3/15/45 (144A) | | 5,652,202 | | | 4,391,903 | |
| | Willis Engine Securitization Trust 2020-A C, 6.6570%, 3/15/45 (144A) | | 1,735,237 | | | 1,098,989 | |
| | Z Capital Credit Partners CLO 2018-1 Ltd, | | | | | | |
| | ICE LIBOR USD 3 Month + 2.4500%, 3.4943%, 1/16/31 (144A)‡ | | 1,250,000 | | | 1,230,939 | |
| | Z Capital Credit Partners CLO 2018-1A A2 Ltd, | | | | | | |
| | ICE LIBOR USD 3 Month + 1.5600%, 2.6043%, 1/16/31 (144A)‡ | | 3,090,000 | | | 3,061,498 | |
Total Asset-Backed/Commercial Mortgage-Backed Securities (cost $1,845,049,444) | | 1,708,008,127 | |
Bank Loans and Mezzanine Loans– 6.3% | | | |
Basic Industry – 0.8% | | | |
| | Aruba Investments Holdings LLC, | | | | | | |
| | ICE LIBOR USD 1 Month + 7.7500%, 9.3827%, 11/24/28‡ | | 5,786,000 | | | 5,467,770 | |
| | GEON Performance Solutions, | | | | | | |
| | ICE LIBOR USD 1 Month + 4.5000%, 6.1661%, 8/18/28‡ | | 4,845,992 | | | 4,573,405 | |
| | |
See Notes to Schedule of Investments and Other Information and Notes to Financial Statements. |
| |
Janus Investment Fund | 13 |
Janus Henderson Multi-Sector Income Fund
Schedule of Investments
June 30, 2022
| | | | | | | | |
Shares or
Principal Amounts | | | Value | |
Bank Loans and Mezzanine Loans– (continued) | | | |
Basic Industry– (continued) | | | |
| | Herens US Holdco Corp, ICE LIBOR USD 1 Month + 4.0000%, 6.2504%, 7/3/28‡ | | $7,615,625 | | | $6,777,906 | |
| | INEOS US Petrochem LLC, ICE LIBOR USD 1 Month + 2.7500%, 4.4161%, 1/29/26‡ | | 3,585,780 | | | 3,376,227 | |
| | Olympus Water US Holding Corp, | | | | | | |
| | CME Term SOFR 1 Month + 4.5000%, 5.1980%, 11/9/28‡ | | 1,990,087 | | | 1,858,244 | |
| | | 22,053,552 | |
Brokerage – 0.2% | | | |
| | Citadel Securities LP, CME Term SOFR 1 Month + 2.5000%, 4.1398%, 2/2/28‡ | | 7,367,037 | | | 7,070,072 | |
Capital Goods – 0.7% | | | |
| | Arcline FM Holdings LLC, ICE LIBOR USD 3 Month + 8.2500%, 9.0000%, 6/25/29‡ | | 12,859,010 | | | 12,023,174 | |
| | PECF USS Intermediate Holding III Corp, | | | | | | |
| | ICE LIBOR USD 1 Month + 4.2500%, 5.9161%, 12/15/28‡ | | 10,670,965 | | | 9,603,868 | |
| | | 21,627,042 | |
Consumer Cyclical – 2.1% | | | |
| | Boardriders Inc, ICE LIBOR USD 3 Month + 6.5000%, 7.7389%, 4/23/24ƒ,‡ | | 4,595,788 | | | 2,516,194 | |
| | Boardriders Inc, | | | | | | |
| | ICE LIBOR USD 3 Month + 8.0000%, 9.0000% (9.79% Cash or 9.37% PIK), 4/23/24‡,Ø,¢ | | 1,451 | | | 1,451 | |
| | Driven Performance Brands Inc, | | | | | | |
| | ICE LIBOR USD 3 Month + 3.0000%, 3.5169%, 12/17/28‡ | | 4,614,129 | | | 4,302,675 | |
| | Enterprise Development Authority/The, | | | | | | |
| | ICE LIBOR USD 1 Month + 4.2500%, 5.9161%, 2/28/28‡ | | 5,203,985 | | | 4,950,291 | |
| | Loire Finco Luxembourg, | | | | | | |
| | Euro Interbank Offered Rate 12 Month + 3.0000%, 3.0000%, 4/21/27‡ | | 2,660,000 | EUR | | 2,487,531 | |
| | Mic Glen LLC, ICE LIBOR USD 1 Month + 6.7500%, 8.4161%, 7/20/29‡ | | 7,907,942 | | | 7,525,751 | |
| | Olaplex Inc, CME Term SOFR 3 Month + 3.7500%, 4.7991%, 2/23/29‡ | | 6,300,000 | | | 5,937,750 | |
| | Rent-A-Center Inc, ICE LIBOR USD 1 Month + 3.2500%, 4.9375%, 2/17/28‡ | | 4,949,875 | | | 4,439,444 | |
| | Sovos Brands Intermediate Inc, | | | | | | |
| | ICE LIBOR USD 3 Month + 3.5000%, 4.2500%, 6/8/28‡ | | 3,495,764 | | | 3,292,590 | |
| | Stars Group Holdings BV, ICE LIBOR USD 3 Month + 2.2500%, 4.5004%, 7/21/26‡ | | 20,318,775 | | | 19,284,753 | |
| | Tacala Investment Corp, ICE LIBOR USD 1 Month + 7.5000%, 9.1661%, 2/4/28‡ | | 5,683,991 | | | 5,286,112 | |
| | Woof Holdings Inc, ICE LIBOR USD 3 Month + 7.2500%, 9.3134%, 12/21/28‡ | | 1,707,290 | | | 1,638,998 | |
| | | 61,663,540 | |
Consumer Non-Cyclical – 1.0% | | | |
| | Bayou Intermediate II LLC, | | | | | | |
| | ICE LIBOR USD 3 Month + 4.5000%, 5.7860%, 8/2/28‡ | | 8,955,000 | | | 8,506,181 | |
| | Eyecare Partners LLC, ICE LIBOR USD 3 Month + 6.7500%, 9.0004%, 11/15/29‡ | | 7,500,000 | | | 7,087,500 | |
| | Journey Personal Care Corp, | | | | | | |
| | ICE LIBOR USD 3 Month + 4.2500%, 6.5004%, 3/1/28‡ | | 4,654,467 | | | 3,537,395 | |
| | Mamba Purchaser Inc, ICE LIBOR USD 1 Month + 6.5000%, 8.0951%, 10/15/29‡ | | 4,000,000 | | | 3,820,000 | |
| | National Mentor Holdings Inc, | | | | | | |
| | ICE LIBOR USD 3 Month + 7.2500%, 9.5100%, 3/2/29‡ | | 580,826 | | | 516,935 | |
| | Perrigo Investments LLC, CME Term SOFR 1 Month + 2.5000%, 4.1985%, 4/20/29‡ | | 5,000,000 | | | 4,800,000 | |
| | Surgery Center Holdings Inc, | | | | | | |
| | ICE LIBOR USD 1 Month + 3.7500%, 4.9500%, 8/31/26‡ | | 2,647,753 | | | 2,467,821 | |
| | | 30,735,832 | |
Diversified Financial Services – 0.3% | | | |
| | Luxembourg Investment Co 428 Sarl, | | | | | | |
| | CME Term SOFR 3 Month + 5.0000%, 7.0544%, 1/3/29‡ | | 8,327,195 | | | 7,785,927 | |
Other Diversified Financial Services – 0.2% | | | |
| | IGT Holding IV AB, ICE LIBOR USD 3 Month + 3.4000%, 5.6504%, 3/31/28‡ | | 5,456,925 | | | 5,074,940 | |
Technology – 0.7% | | | |
| | Acuris Finance US Inc, CME Term SOFR 3 Month + 4.0000%, 6.2044%, 2/16/28‡ | | 2,570,885 | | | 2,416,632 | |
| | Magenta Buyer LLC, ICE LIBOR USD 3 Month + 8.2500%, 9.4800%, 7/27/29‡ | | 8,900,000 | | | 8,099,000 | |
| | Mitchell International Inc, | | | | | | |
| | ICE LIBOR USD 1 Month + 3.7500%, 5.3451%, 10/15/28‡ | | 7,820,400 | | | 7,109,213 | |
| | Sunshine Software Merger Sub Inc, | | | | | | |
| | ICE LIBOR USD 1 Month + 3.7500%, 5.4161%, 10/16/28‡ | | 4,964,558 | | | 4,426,747 | |
| | | 22,051,592 | |
| | |
See Notes to Schedule of Investments and Other Information and Notes to Financial Statements. |
| |
14 | JUNE 30, 2022 |
Janus Henderson Multi-Sector Income Fund
Schedule of Investments
June 30, 2022
| | | | | | | | |
Shares or
Principal Amounts | | | Value | |
Bank Loans and Mezzanine Loans– (continued) | | | |
Transportation – 0.3% | | | |
| | First Student Bidco Inc, ICE LIBOR USD 3 Month + 3.0000%, 3.9829%, 7/21/28‡ | | $2,696,078 | | | $2,402,880 | |
| | First Student Bidco Inc, ICE LIBOR USD 3 Month + 3.0000%, 3.9829%, 7/21/28‡ | | 7,267,402 | | | 6,493,346 | |
| | | 8,896,226 | |
Total Bank Loans and Mezzanine Loans (cost $202,538,469) | | 186,958,723 | |
Corporate Bonds– 30.8% | | | |
Banking – 4.0% | | | |
| | Banco La Hipotecaria SA, 5.5000%, 9/15/23 (144A) | | 5,700,000 | | | 5,686,529 | |
| | Banco La Hipotecaria SA, 4.1250%, 12/15/24 (144A) | | 5,000,000 | | | 4,835,726 | |
| | Bank of America Corp, SOFR + 1.8300%, 4.5710%, 4/27/33‡ | | 11,365,000 | | | 11,060,543 | |
| | Bank of New York Mellon Corp, | | | | | | |
| | US Treasury Yield Curve Rate 5 Year + 4.3580%, 4.7000%‡,µ | | 2,998,000 | | | 2,929,046 | |
| | Bank of Montreal, | | | | | | |
| | US Treasury Yield Curve Rate 5 Year + 1.4000%, 3.0880%, 1/10/37‡ | | 13,029,000 | | | 10,661,543 | |
| | Citigroup Inc, SOFR + 2.0860%, 4.9100%, 5/24/33‡ | | 9,250,000 | | | 9,127,211 | |
| | Citigroup Inc, US Treasury Yield Curve Rate 5 Year + 3.4170%, 3.8750%‡,µ | | 5,310,000 | | | 4,407,300 | |
| | Commonwealth Bank of Australia, 3.7840%, 3/14/32 (144A) | | 11,593,000 | | | 10,212,724 | |
| | HSBC Holdings PLC, SOFR + 1.9470%, 2.3570%, 8/18/31‡ | | 5,226,000 | | | 4,235,965 | |
| | JPMorgan Chase & Co, SOFR + 1.2600%, 2.9630%, 1/25/33‡ | | 5,094,000 | | | 4,372,490 | |
| | JPMorgan Chase & Co, SOFR + 1.8000%, 4.5860%, 4/26/33‡ | | 1,865,000 | | | 1,831,880 | |
| | JPMorgan Chase & Co, SOFR + 3.3800%, 5.0000%‡,µ | | 3,476,000 | | | 3,067,570 | |
| | Morgan Stanley, SOFR + 3.1200%, 3.6220%, 4/1/31‡ | | 6,492,000 | | | 5,963,190 | |
| | Morgan Stanley, SOFR + 1.2900%, 2.9430%, 1/21/33‡ | | 3,417,000 | | | 2,928,551 | |
| | Morgan Stanley, SOFR + 2.6200%, 5.2970%, 4/20/37‡ | | 4,603,000 | | | 4,457,542 | |
| | Natwest Group PLC, | | | | | | |
| | US Treasury Yield Curve Rate 1 Year + 2.2700%, 5.5160%, 9/30/28‡ | | 13,900,000 | | | 13,999,011 | |
| | SVB Financial Group, | | | | | | |
| | US Treasury Yield Curve Rate 5 Year + 3.0740%, 4.2500%‡,µ | | 3,350,000 | | | 2,527,678 | |
| | SVB Financial Group, | | | | | | |
| | US Treasury Yield Curve Rate 10 Year + 3.0640%, 4.1000%‡,µ | | 6,392,000 | | | 4,395,870 | |
| | UBS Group AG, | | | | | | |
| | US Treasury Yield Curve Rate 1 Year + 1.7500%, 4.7510%, 5/12/28 (144A)‡ | | 7,400,000 | | | 7,323,268 | |
| | Wells Fargo & Co, SOFR + 2.1300%, 4.6110%, 4/25/53‡ | | 4,695,000 | | | 4,344,311 | |
| | | 118,367,948 | |
Basic Industry – 2.5% | | | |
| | Arconic Rolled Products, 6.1250%, 2/15/28 (144A) | | 2,705,000 | | | 2,525,875 | |
| | Axalta Coating Systems Ltd, 3.3750%, 2/15/29 (144A) | | 8,877,000 | | | 7,246,916 | |
| | Carpenter Technology Corp, 7.6250%, 3/15/30 | | 7,246,000 | | | 6,653,973 | |
| | Diamond BC BV, 4.6250%, 10/1/29 (144A) | | 8,751,000 | | | 6,998,175 | |
| | First Quantum Minerals Ltd, 7.5000%, 4/1/25 (144A) | | 8,616,000 | | | 8,146,100 | |
| | Hudbay Minerals Inc, 4.5000%, 4/1/26 (144A) | | 6,918,000 | | | 5,788,844 | |
| | Hudbay Minerals Inc, 6.1250%, 4/1/29 (144A) | | 6,957,000 | | | 5,642,440 | |
| | IAMGOLD Corp, 5.7500%, 10/15/28 (144A) | | 8,423,000 | | | 5,600,641 | |
| | Iris Holdings Inc, 8.7500% (8.75% Cash or 9.50% PIK), 2/15/26 (144A)Ø | | 6,203,000 | | | 4,962,400 | |
| | Neon Holdings Inc, 10.1250%, 4/1/26 (144A) | | 12,160,000 | | | 11,587,021 | |
| | PMHC II Inc, 9.0000%, 2/15/30 (144A) | | 10,893,000 | | | 7,678,744 | |
| | | 72,831,129 | |
Brokerage – 0.8% | | | |
| | Charles Schwab Corp, | | | | | | |
| | US Treasury Yield Curve Rate 5 Year + 3.1680%, 4.0000%‡,µ | | 10,888,000 | | | 9,229,322 | |
| | Coinbase Global Inc, 3.3750%, 10/1/28 (144A) | | 6,582,000 | | | 4,143,073 | |
| | Coinbase Global Inc, 3.6250%, 10/1/31 (144A) | | 10,595,000 | | | 5,950,213 | |
| | NFP Corp, 6.8750%, 8/15/28 (144A) | | 4,500,000 | | | 3,712,680 | |
| | | 23,035,288 | |
Capital Goods – 3.5% | | | |
| | Allegion US Holding Co Inc, 5.4110%, 7/1/32 | | 5,292,000 | | | 5,256,192 | |
| | ARD Finance SA, 5.0000% (5.00% Cash or 5.75% PIK), 6/30/27Ø | | 9,468,244 | EUR | | 7,130,598 | |
| | ARD Finance SA, 5.0000% (5.00% Cash or 5.75% PIK), 6/30/27 (144A)Ø | | 1,468,400 | EUR | | 1,105,862 | |
| | ARD Finance SA, 6.5000% (6.50% Cash or 7.25% PIK), 6/30/27 (144A)Ø | | 2,518,536 | | | 1,868,149 | |
| | |
See Notes to Schedule of Investments and Other Information and Notes to Financial Statements. |
| |
Janus Investment Fund | 15 |
Janus Henderson Multi-Sector Income Fund
Schedule of Investments
June 30, 2022
| | | | | | | | |
Shares or
Principal Amounts | | | Value | |
Corporate Bonds– (continued) | | | |
Capital Goods– (continued) | | | |
| | Ardagh Metal Packaging Finance USA LLC / Adragh Metal Packaging Finance PLC, | | | | | | |
| | 6.0000%, 6/15/27 (144A) | | $5,621,000 | | | $5,563,272 | |
| | Ardagh Packaging Finance PLC / Ardagh Holdings USA Inc, | | | | | | |
| | 4.1250%, 8/15/26 (144A) | | 7,429,000 | | | 6,293,923 | |
| | Ardagh Packaging Finance PLC / Ardagh Holdings USA Inc, | | | | | | |
| | 5.2500%, 8/15/27 (144A) | | 4,928,000 | | | 3,513,960 | |
| | Builders FirstSource Inc, 6.3750%, 6/15/32 (144A) | | 14,413,000 | | | 12,863,602 | |
| | CP Atlas Buyer Inc, 7.0000%, 12/1/28 (144A) | | 2,047,000 | | | 1,478,302 | |
| | GCC SAB de CV, 3.6140%, 4/20/32 (144A)# | | 7,008,000 | | | 5,720,420 | |
| | HT Troplast GmbH, 9.2500%, 7/15/25 (144A) | | 2,790,000 | EUR | | 2,587,177 | |
| | JELD-WEN Inc, 4.8750%, 12/15/27 (144A)# | | 7,039,000 | | | 5,490,420 | |
| | LABL Escrow Issuer LLC, 10.5000%, 7/15/27 (144A) | | 8,347,000 | | | 7,261,890 | |
| | LABL Inc, 8.2500%, 11/1/29 (144A) | | 8,536,000 | | | 6,444,680 | |
| | New Enterprise Stone & Lime Co Inc, 5.2500%, 7/15/28 (144A) | | 8,506,000 | | | 6,992,228 | |
| | Oscar AcquisitionCo LLC / Oscar Finance Inc, 9.5000%, 4/15/30 (144A) | | 1,850,000 | | | 1,466,377 | |
| | PECF USS Intermediate Holding III Corp, 8.0000%, 11/15/29 (144A) | | 4,276,000 | | | 3,388,730 | |
| | Sofima Holdings SpA, 3.7500%, 1/15/28 (144A) | | 3,480,000 | EUR | | 2,918,062 | |
| | Standard Industries Inc/NJ, 4.3750%, 7/15/30 (144A) | | 12,704,000 | | | 10,020,280 | |
| | Vontier Corp, 2.9500%, 4/1/31 | | 7,107,000 | | | 5,570,893 | |
| | | 102,935,017 | |
Communications – 4.1% | | | |
| | Altice Financing SA, 5.0000%, 1/15/28 (144A) | | 6,822,000 | | | 5,497,440 | |
| | Altice France SA, 5.5000%, 10/15/29 (144A) | | 4,610,000 | | | 3,521,625 | |
| | AT&T Inc, EURIBOR ICE SWAP Rate + 3.1400%, 2.8750%‡,µ | | 5,300,000 | EUR | | 4,831,409 | |
| | Block Communications Inc, 4.8750%, 3/1/28 (144A) | | 7,120,000 | | | 6,016,400 | |
| | CCO Holdings LLC / CCO Holdings Capital Corp, 4.7500%, 2/1/32 (144A) | | 10,709,000 | | | 8,768,529 | |
| | Charter Communications Operating LLC / Charter Communications Operating Capital, | | | | | | |
| | 4.4000%, 4/1/33 | | 4,942,000 | | | 4,412,405 | |
| | CSC Holdings LLC, 7.5000%, 4/1/28 (144A) | | 5,055,000 | | | 4,220,925 | |
| | Front Range BidCo Inc, 6.1250%, 3/1/28 (144A) | | 5,811,000 | | | 4,196,181 | |
| | Gray Escrow II Inc, 5.3750%, 11/15/31 (144A) | | 6,092,000 | | | 4,881,093 | |
| | LCPR Senior Secured Financing DAC, 5.1250%, 7/15/29 (144A) | | 8,642,000 | | | 7,216,070 | |
| | Liberty Interactive LLC, 8.5000%, 7/15/29 | | 6,763,000 | | | 4,683,239 | |
| | Magallanes Inc, 4.2790%, 3/15/32 (144A) | | 8,447,000 | | | 7,549,443 | |
| | Netflix Inc, 4.3750%, 11/15/26 | | 7,036,000 | | | 6,779,256 | |
| | Netflix Inc, 3.6250%, 6/15/30 | | 5,837,000 | EUR | | 5,275,061 | |
| | T-Mobile USA Inc, 3.3750%, 4/15/29 (144A) | | 6,983,000 | | | 6,110,125 | |
| | T-Mobile USA Inc, 3.3750%, 4/15/29 | | 10,636,000 | | | 9,306,500 | |
| | Twitter Inc, 3.8750%, 12/15/27 (144A)# | | 3,205,000 | | | 3,021,530 | |
| | Twitter Inc, 5.0000%, 3/1/30 (144A) | | 17,456,000 | | | 16,561,380 | |
| | Univision Communications Inc, 7.3750%, 6/30/30 (144A) | | 4,640,000 | | | 4,535,600 | |
| | Windstream Escrow LLC, 7.7500%, 8/15/28 (144A) | | 4,728,000 | | | 3,806,040 | |
| | | 121,190,251 | |
Construction & Engineering – 0.1% | | | |
| | Arcosa Inc, 4.3750%, 4/15/29 (144A) | | 2,481,000 | | | 2,105,263 | |
Consumer Cyclical – 3.7% | | | |
| | Allied Universal Holdco LLC / Allied Universal Finance Corp, | | | | | | |
| | 6.0000%, 6/1/29 (144A)# | | 4,949,000 | | | 3,593,823 | |
| | Carnival Corp, 7.6250%, 3/1/26 (144A) | | 3,563,000 | | | 2,759,686 | |
| | Carvana Co, 5.5000%, 4/15/27 (144A)# | | 1,963,000 | | | 1,266,797 | |
| | Carvana Co, 4.8750%, 9/1/29 (144A)# | | 9,538,000 | | | 5,423,356 | |
| | Dornoch Debt Merger Sub Inc, 6.6250%, 10/15/29 (144A) | | 10,142,000 | | | 7,489,867 | |
| | Fertitta Entertainment Inc, 6.7500%, 1/15/30 (144A) | | 8,830,000 | | | 6,777,025 | |
| | Full House Resorts Inc, 8.2500%, 2/15/28 (144A) | | 8,378,000 | | | 6,696,340 | |
| | GLP Capital LP / GLP Financing II Inc, 4.0000%, 1/15/31 | | 5,229,000 | | | 4,509,639 | |
| | IHO Verwaltungs GmbH, 3.8750% (3.88% Cash or 4.63% PIK), 5/15/27 (144A)Ø | | 8,638,149 | EUR | | 7,037,958 | |
| | IRB Holding Corp, 7.0000%, 6/15/25 (144A) | | 5,992,000 | | | 5,865,269 | |
| | LGI Homes Inc, 4.0000%, 7/15/29 (144A) | | 4,600,000 | | | 3,434,360 | |
| | Lithia Motors Inc, 4.3750%, 1/15/31 (144A) | | 6,689,000 | | | 5,702,373 | |
| | |
See Notes to Schedule of Investments and Other Information and Notes to Financial Statements. |
| |
16 | JUNE 30, 2022 |
Janus Henderson Multi-Sector Income Fund
Schedule of Investments
June 30, 2022
| | | | | | | | |
Shares or
Principal Amounts | | | Value | |
Corporate Bonds– (continued) | | | |
Consumer Cyclical– (continued) | | | |
| | LSF9 Atlantis Holdings LLC / Victra Finance Corp, 7.7500%, 2/15/26 (144A) | | $9,468,000 | | | $8,016,191 | |
| | Premier Entertainment Sub LLC / Premier Entertainment Finance Corp, | | | | | | |
| | 5.6250%, 9/1/29 (144A) | | 8,184,000 | | | 5,826,681 | |
| | Premier Entertainment Sub LLC / Premier Entertainment Finance Corp, | | | | | | |
| | 5.8750%, 9/1/31 (144A) | | 8,207,000 | | | 5,695,766 | |
| | PulteGroup Inc, 7.8750%, 6/15/32 | | 2,122,000 | | | 2,389,985 | |
| | Rent-A-Center Inc, 6.3750%, 2/15/29 (144A)# | | 5,870,000 | | | 4,578,600 | |
| | Sands China Ltd, 4.8750%, 6/18/30 | | 3,143,000 | | | 2,296,590 | |
| | Sugarhouse HSP Gaming Prop Mezz LP / Sugarhouse HSP Gaming Finance Corp, | | | | | | |
| | 5.8750%, 5/15/25 (144A) | | 5,010,000 | | | 4,608,029 | |
| | VICI Properties LP, 4.9500%, 2/15/30 | | 8,005,000 | | | 7,586,419 | |
| | VICI Properties LP, 5.1250%, 5/15/32 | | 3,126,000 | | | 2,945,755 | |
| | Wendy's International LLC, 7.0000%, 12/15/25 | | 5,841,000 | | | 5,935,916 | |
| | | 110,436,425 | |
Consumer Non-Cyclical – 2.0% | | | |
| | BellRing Brands Inc, 7.0000%, 3/15/30 (144A)# | | 6,756,000 | | | 6,367,530 | |
| | CHS / Community Health Systems Inc, 6.8750%, 4/15/29 (144A) | | 6,756,000 | | | 4,357,620 | |
| | CHS / Community Health Systems Inc, 4.7500%, 2/15/31 (144A) | | 9,903,000 | | | 7,250,465 | |
| | Hadrian Merger Sub Inc, 8.5000%, 5/1/26 (144A) | | 9,876,000 | | | 9,332,820 | |
| | HLF Financing Sarl LLC / Herbalife International Inc, | | | | | | |
| | 4.8750%, 6/1/29 (144A) | | 7,721,000 | | | 5,327,490 | |
| | JBS USA LUX SA / JBS USA Food Co / JBS USA Finance Inc, | | | | | | |
| | 6.5000%, 4/15/29 (144A) | | 720,000 | | | 724,320 | |
| | ModivCare Escrow Issuer Inc, 5.0000%, 10/1/29 (144A)# | | 3,673,000 | | | 2,966,833 | |
| | Smithfield Foods Inc, 3.0000%, 10/15/30 (144A) | | 3,136,000 | | | 2,599,735 | |
| | Teva Pharmaceutical Finance Netherlands III BV, 3.1500%, 10/1/26 | | 6,856,000 | | | 5,621,920 | |
| | Teva Pharmaceutical Industries Ltd, 4.7500%, 5/9/27 | | 8,753,000 | | | 7,476,096 | |
| | Universal Health Services Inc, 2.6500%, 1/15/32 (144A) | | 8,266,000 | | | 6,432,825 | |
| | | 58,457,654 | |
Electric – 1.6% | | | |
| | Algonquin Power & Utilities Corp, | | | | | | |
| | US Treasury Yield Curve Rate 5 Year + 3.2490%, 4.7500%, 1/18/82‡ | | 8,480,000 | | | 7,038,241 | |
| | American Electric Power Co Inc, | | | | | | |
| | US Treasury Yield Curve Rate 5 Year + 2.6750%, 3.8750%, 2/15/62‡ | | 8,836,000 | | | 6,987,130 | |
| | CMS Energy Corp, | | | | | | |
| | US Treasury Yield Curve Rate 5 Year + 4.1160%, 4.7500%, 6/1/50‡ | | 5,380,000 | | | 4,714,064 | |
| | Duquesne Light Holdings Inc, 2.5320%, 10/1/30 (144A) | | 4,969,000 | | | 4,082,650 | |
| | IPALCO Enterprises Inc, 4.2500%, 5/1/30 | | 6,498,000 | | | 6,033,037 | |
| | NRG Energy Inc, 3.3750%, 2/15/29 (144A) | | 9,230,000 | | | 7,443,164 | |
| | Toledo Edison Co/The, 2.6500%, 5/1/28 (144A)# | | 3,042,000 | | | 2,845,931 | |
| | Xcel Energy Inc, 4.6000%, 6/1/32 | | 7,676,000 | | | 7,612,737 | |
| | | 46,756,954 | |
Energy – 2.3% | | | |
| | DCP Midstream Operating LP, 5.6000%, 4/1/44 | | 2,517,000 | | | 2,034,025 | |
| | DT Midstream Inc, 4.1250%, 6/15/29 (144A) | | 7,432,000 | | | 6,298,620 | |
| | EnLink Midstream LLC, 5.6250%, 1/15/28 (144A) | | 6,693,000 | | | 6,139,269 | |
| | EQM Midstream Partners LP, 4.7500%, 1/15/31 (144A) | | 4,974,000 | | | 3,966,765 | |
| | EQT Corp, 3.1250%, 5/15/26 (144A) | | 6,742,000 | | | 6,312,602 | |
| | Hess Midstream Operations LP, 4.2500%, 2/15/30 (144A) | | 5,561,000 | | | 4,657,143 | |
| | Howard Midstream Energy Partners LLC, 6.7500%, 1/15/27 (144A) | | 10,438,000 | | | 8,992,374 | |
| | NGL Energy Partners LP / NGL Energy Finance Corp, 7.5000%, 2/1/26 (144A) | | 6,471,000 | | | 5,823,900 | |
| | Rockies Express Pipeline LLC, 4.9500%, 7/15/29 (144A) | | 1,462,000 | | | 1,250,010 | |
| | Southwestern Energy Co, 5.3750%, 3/15/30 | | 5,776,000 | | | 5,313,920 | |
| | Tallgrass Energy Partners LP / Tallgrass Energy Finance Corp, | | | | | | |
| | 6.0000%, 9/1/31 (144A) | | 1,155,000 | | | 952,875 | |
| | Viper Energy Partners LP, 5.3750%, 11/1/27 (144A) | | 8,289,000 | | | 7,922,725 | |
| | Western Midstream Operating LP, 4.5500%, 2/1/30Ç | | 8,600,000 | | | 7,439,000 | |
| | | 67,103,228 | |
| | |
See Notes to Schedule of Investments and Other Information and Notes to Financial Statements. |
| |
Janus Investment Fund | 17 |
Janus Henderson Multi-Sector Income Fund
Schedule of Investments
June 30, 2022
| | | | | | | | |
Shares or
Principal Amounts | | | Value | |
Corporate Bonds– (continued) | | | |
Finance Companies – 1.4% | | | |
| | FirstCash Inc, 4.6250%, 9/1/28 (144A) | | $5,509,000 | | | $4,757,572 | |
| | FirstCash Inc, 5.6250%, 1/1/30 (144A) | | 5,664,000 | | | 4,890,808 | |
| | Fortress Transportation and Infrastructure Investors LLC, | | | | | | |
| | 6.5000%, 10/1/25 (144A) | | 3,031,000 | | | 2,859,779 | |
| | Fortress Transportation and Infrastructure Investors LLC, | | | | | | |
| | 9.7500%, 8/1/27 (144A) | | 3,509,000 | | | 3,429,709 | |
| | OneMain Finance Corp, 3.8750%, 9/15/28# | | 9,000,000 | | | 6,885,000 | |
| | Owl Rock Core Income Corp, 4.7000%, 2/8/27 (144A) | | 8,750,000 | | | 7,981,560 | |
| | Quicken Loans LLC, 3.8750%, 3/1/31 (144A) | | 12,378,000 | | | 9,274,712 | |
| | | 40,079,140 | |
Financial Institutions – 0.2% | | | |
| | Burford Capital Global Finance LLC, 6.2500%, 4/15/28 (144A) | | 2,153,000 | | | 1,883,066 | |
| | CPI Property Group SA, EUR SWAP ANNUAL 5 YR + 4.9440%, 4.8750%‡,µ | | 5,589,000 | EUR | | 3,328,699 | |
| | | 5,211,765 | |
Industrial – 0.1% | | | |
| | AT Securities BV, USD SWAP SEMI 30/360 5YR + 3.5460%, 5.2500%‡,µ | | 5,000,000 | | | 4,486,800 | |
Industrial Conglomerates – 0.3% | | | |
| | General Electric Co, ICE LIBOR USD 3 Month + 3.3300%, 5.1589%‡,µ | | 10,974,000 | | | 9,615,419 | |
Information Technology Services – 0% | | | |
| | KBR Inc, 4.7500%, 9/30/28 (144A) | | 1,195,000 | | | 1,053,199 | |
Insurance – 1.5% | | | |
| | Athene Holding Ltd, 3.5000%, 1/15/31 | | 6,715,000 | | | 5,684,850 | |
| | Berkshire Hathaway Finance Corp, 3.8500%, 3/15/52 | | 8,722,000 | | | 7,466,518 | |
| | Brown & Brown Inc, 4.9500%, 3/17/52 | | 5,188,000 | | | 4,550,771 | |
| | Centene Corp, 3.3750%, 2/15/30 | | 10,622,000 | | | 9,007,987 | |
| | Progressive Corp/The, 3.0000%, 3/15/32 | | 5,504,000 | | | 4,930,076 | |
| | Prudential Financial Inc, | | | | | | |
| | US Treasury Yield Curve Rate 5 Year + 3.0350%, 3.7000%, 10/1/50‡ | | 3,317,000 | | | 2,776,495 | |
| | Ryan Specialty Group LLC, 4.3750%, 2/1/30 (144A) | | 11,243,000 | | | 9,781,410 | |
| | | 44,198,107 | |
Other Diversified Financial Services – 0.5% | | | |
| | FTAI Infra Escrow Holdings LLC, 10.5000%, 6/1/27 (144A) | | 16,795,000 | | | 15,885,551 | |
Real Estate Investment Trusts (REITs) – 1.1% | | | |
| | Broadstone Net Lease LLC, 2.6000%, 9/15/31 | | 7,439,000 | | | 6,066,581 | |
| | Global Net Lease Inc / Global Net Lease Operating Partnership LP, | | | | | | |
| | 3.7500%, 12/15/27 (144A) | | 8,400,000 | | | 7,019,801 | |
| | Lexington Realty Trust, 2.7000%, 9/15/30 | | 5,313,000 | | | 4,360,902 | |
| | MPT Operating Partnership LP / MPT Finance Corp, 4.6250%, 8/1/29 | | 9,000,000 | | | 7,897,500 | |
| | Safehold Operating Partnership LP, 2.8000%, 6/15/31 | | 8,960,000 | | | 7,287,085 | |
| | | 32,631,869 | |
Technology – 0.5% | | | |
| | Austin BidCo Inc, 7.1250%, 12/15/28 (144A) | | 8,552,000 | | | 6,871,960 | |
| | MSCI Inc, 3.6250%, 11/1/31 (144A) | | 9,019,000 | | | 7,423,972 | |
| | | 14,295,932 | |
Transportation – 0.6% | | | |
| | StorCentric Inc, 5.8750%, 2/19/23 (144A)€ | | 6,000,000 | | | 5,940,000 | |
| | Watco Cos LLC / Watco Finance Corp, 6.5000%, 6/15/27 (144A) | | 12,880,000 | | | 11,797,074 | |
| | | 17,737,074 | |
Total Corporate Bonds (cost $1,075,184,061) | | 908,414,013 | |
Convertible Corporate Bonds– 0.1% | | | |
Interactive Media & Services – 0.1% | | | |
| | Snap Inc, 0.7500%, 8/1/26#((cost $3,013,887) | | 1,435,000 | | | 1,360,380 | |
Mortgage-Backed Securities– 22.8% | | | |
Fannie Mae: | | | |
| | 2.0000%, TBA, 15 Year Maturity | | 14,522,062 | | | 13,549,403 | |
| | 2.5000%, TBA, 15 Year Maturity | | 7,679,559 | | | 7,335,384 | |
| | 3.0000%, TBA, 15 Year Maturity | | 16,732,212 | | | 16,346,016 | |
| | 3.5000%, TBA, 15 Year Maturity | | 5,799,117 | | | 5,764,073 | |
| | |
See Notes to Schedule of Investments and Other Information and Notes to Financial Statements. |
| |
18 | JUNE 30, 2022 |
Janus Henderson Multi-Sector Income Fund
Schedule of Investments
June 30, 2022
| | | | | | | | |
Shares or
Principal Amounts | | | Value | |
Mortgage-Backed Securities– (continued) | | | |
Fannie Mae– (continued) | | | |
| | 3.0000%, TBA, 30 Year Maturity | | $140,920,000 | | | $131,182,569 | |
| | 3.5000%, TBA, 30 Year Maturity | | 121,753,696 | | | 117,075,310 | |
| | 4.0000%, TBA, 30 Year Maturity | | 33,871,454 | | | 33,393,900 | |
| | 4.5000%, TBA, 30 Year Maturity | | 69,486,645 | | | 69,743,746 | |
| | | 394,390,401 | |
Fannie Mae Pool: | | | |
| | 3.0000%, 10/1/34 | | 180,345 | | | 177,331 | |
| | 6.0000%, 2/1/37 | | 750 | | | 817 | |
| | 3.0000%, 9/1/42 | | 1,082,396 | | | 1,035,346 | |
| | 3.0000%, 1/1/43 | | 1,489,116 | | | 1,424,386 | |
| | 3.0000%, 2/1/43 | | 4,357,858 | | | 4,168,429 | |
| | 3.0000%, 2/1/43 | | 604,214 | | | 577,950 | |
| | 3.0000%, 2/1/43 | | 41,074 | | | 39,241 | |
| | 3.0000%, 3/1/43 | | 1,834,831 | | | 1,752,949 | |
| | 3.0000%, 3/1/43 | | 522,902 | | | 499,567 | |
| | 3.0000%, 5/1/43 | | 433,068 | | | 413,742 | |
| | 3.0000%, 5/1/43 | | 2,081 | | | 1,988 | |
| | 5.0000%, 7/1/44 | | 6,205 | | | 6,499 | |
| | 4.5000%, 10/1/44 | | 4,173 | | | 4,284 | |
| | 4.5000%, 3/1/45 | | 6,076 | | | 6,237 | |
| | 3.0000%, 7/1/45 | | 2,357,165 | | | 2,251,973 | |
| | 3.5000%, 12/1/45 | | 288,694 | | | 282,568 | |
| | 4.5000%, 2/1/46 | | 8,752 | | | 9,016 | |
| | 3.5000%, 7/1/46 | | 14,242 | | | 13,924 | |
| | 3.0000%, 9/1/46 | | 1,064,130 | | | 1,017,874 | |
| | 3.0000%, 11/1/46 | | 317,003 | | | 301,464 | |
| | 3.0000%, 1/1/47 | | 54,132 | | | 51,479 | |
| | 3.5000%, 3/1/47 | | 250,879 | | | 245,556 | |
| | 4.0000%, 5/1/47 | | 946,635 | | | 949,351 | |
| | 3.5000%, 7/1/47 | | 222,144 | | | 217,431 | |
| | 3.5000%, 8/1/47 | | 2,736 | | | 2,671 | |
| | 3.5000%, 1/1/48 | | 3,522 | | | 3,421 | |
| | 4.0000%, 1/1/48 | | 13,091 | | | 13,076 | |
| | 3.0000%, 2/1/48 | | 45,429 | | | 43,124 | |
| | 3.5000%, 3/1/48 | | 3,352,590 | | | 3,273,418 | |
| | 4.0000%, 3/1/48 | | 3,924 | | | 3,919 | |
| | 3.5000%, 7/1/48 | | 5,725,809 | | | 5,597,955 | |
| | 4.5000%, 12/1/48 | | 699,156 | | | 712,559 | |
| | 3.0000%, 9/1/49 | | 389,193 | | | 365,787 | |
| | 2.5000%, 1/1/50 | | 1,051,075 | | | 955,621 | |
| | 2.5000%, 8/1/50 | | 109,445 | | | 100,076 | |
| | 2.5000%, 6/1/51 | | 13,542,314 | | | 12,338,335 | |
| | 2.0000%, 9/1/51 | | 4,270,315 | | | 3,713,509 | |
| | 3.0000%, 9/1/51 | | 16,671,910 | | | 15,566,606 | |
| | 3.0000%, 2/1/57 | | 5,654,510 | | | 5,316,679 | |
| | 3.0000%, 6/1/57 | | 25,360 | | | 23,749 | |
| | | 63,479,907 | |
Freddie Mac Gold Pool: | | | |
| | 3.5000%, 1/1/47 | | 170,759 | | | 168,051 | |
Freddie Mac Pool: | | | |
| | 3.0000%, 5/1/31 | | 1,604,555 | | | 1,592,820 | |
| | 3.0000%, 9/1/32 | | 225,531 | | | 223,298 | |
| | 3.0000%, 1/1/33 | | 136,405 | | | 135,054 | |
| | 3.0000%, 10/1/34 | | 386,622 | | | 380,160 | |
| | 3.0000%, 10/1/34 | | 177,846 | | | 174,874 | |
| | 6.0000%, 4/1/40 | | 15,851 | | | 17,313 | |
| | 3.0000%, 2/1/43 | | 4,465 | | | 4,265 | |
| | 3.5000%, 2/1/43 | | 4,086 | | | 4,020 | |
| | 3.0000%, 3/1/43 | | 94,135 | | | 89,934 | |
| | |
See Notes to Schedule of Investments and Other Information and Notes to Financial Statements. |
| |
Janus Investment Fund | 19 |
Janus Henderson Multi-Sector Income Fund
Schedule of Investments
June 30, 2022
| | | | | | | | |
Shares or
Principal Amounts | | | Value | |
Mortgage-Backed Securities– (continued) | | | |
Freddie Mac Pool– (continued) | | | |
| | 3.0000%, 3/1/43 | | $2,568 | | | $2,454 | |
| | 3.0000%, 6/1/43 | | 139,014 | | | 131,247 | |
| | 3.0000%, 11/1/43 | | 4,526,087 | | | 4,329,364 | |
| | 3.5000%, 2/1/44 | | 12,282 | | | 12,083 | |
| | 4.5000%, 5/1/44 | | 3,069 | | | 3,161 | |
| | 3.5000%, 12/1/44 | | 225,337 | | | 221,574 | |
| | 3.0000%, 1/1/45 | | 2,691 | | | 2,566 | |
| | 3.5000%, 7/1/46 | | 2,860 | | | 2,780 | |
| | 3.0000%, 10/1/46 | | 17,089 | | | 16,200 | |
| | 4.0000%, 3/1/47 | | 7,309 | | | 7,337 | |
| | 3.5000%, 9/1/47 | | 4,558 | | | 4,451 | |
| | 3.5000%, 12/1/47 | | 45,319 | | | 44,251 | |
| | 3.5000%, 2/1/48 | | 2,920 | | | 2,831 | |
| | 4.0000%, 4/1/48 | | 1,527 | | | 1,522 | |
| | 4.5000%, 4/1/49 | | 1,124,263 | | | 1,140,923 | |
| | 4.0000%, 5/1/49 | | 4,655,346 | | | 4,641,056 | |
| | 3.5000%, 8/1/49 | | 2,383,611 | | | 2,319,362 | |
| | 3.0000%, 10/1/49 | | 453,524 | | | 426,542 | |
| | 3.0000%, 10/1/49 | | 239,514 | | | 225,264 | |
| | 3.0000%, 11/1/49 | | 678,947 | | | 638,553 | |
| | 3.0000%, 11/1/49 | | 176,721 | | | 166,207 | |
| | 3.0000%, 11/1/49 | | 30,210 | | | 28,413 | |
| | 3.0000%, 12/1/49 | | 1,491,545 | | | 1,402,806 | |
| | 3.0000%, 12/1/49 | | 635,261 | | | 597,466 | |
| | 3.0000%, 12/1/49 | | 383,623 | | | 360,799 | |
| | 2.5000%, 1/1/50 | | 463,785 | | | 421,703 | |
| | 3.0000%, 3/1/50 | | 1,009,611 | | | 947,683 | |
| | 2.5000%, 8/1/50 | | 56,084 | | | 51,313 | |
| | 2.5000%, 8/1/50 | | 20,168 | | | 18,442 | |
| | 2.5000%, 9/1/50 | | 103,317 | | | 94,424 | |
| | 2.0000%, 9/1/51 | | 4,597,641 | | | 3,998,150 | |
| | 2.0000%, 9/1/51 | | 4,298,144 | | | 3,737,705 | |
| | 2.5000%, 1/1/52 | | 203,662 | | | 184,608 | |
| | 2.5000%, 1/1/52 | | 123,247 | | | 111,307 | |
| | | 28,916,285 | |
Ginnie Mae: | | | |
| | 3.0000%, TBA, 30 Year Maturity | | 79,720,178 | | | 75,109,641 | |
| | 3.5000%, TBA, 30 Year Maturity | | 98,660,539 | | | 95,849,306 | |
| | 4.0000%, TBA, 30 Year Maturity | | 16,054,402 | | | 15,981,627 | |
| | | 186,940,574 | |
Ginnie Mae I Pool: | | | |
| | 4.5000%, 8/15/46 | | 11,705 | | | 12,080 | |
| | 4.0000%, 7/15/47 | | 3,558 | | | 3,592 | |
| | 4.0000%, 8/15/47 | | 353 | | | 356 | |
| | 4.0000%, 11/15/47 | | 780 | | | 787 | |
| | 4.0000%, 12/15/47 | | 2,067 | | | 2,087 | |
| | | 18,902 | |
Ginnie Mae II Pool: | | | |
| | 4.5000%, 2/20/48 | | 119,571 | | | 122,960 | |
| | 4.5000%, 5/20/48 | | 2,750 | | | 2,808 | |
| | 4.5000%, 5/20/48 | | 956 | | | 976 | |
| | | 126,744 | |
Total Mortgage-Backed Securities (cost $682,896,954) | | 674,040,864 | |
Common Stocks– 0.1% | | | |
Diversified Financial Services – 0% | | | |
| | Clarivate Analytics PLC* | | 4,217 | | | 58,448 | |
| | |
See Notes to Schedule of Investments and Other Information and Notes to Financial Statements. |
| |
20 | JUNE 30, 2022 |
Janus Henderson Multi-Sector Income Fund
Schedule of Investments
June 30, 2022
| | | | | | | | |
Shares or
Principal Amounts | | | Value | |
Common Stocks– (continued) | | | |
Semiconductor & Semiconductor Equipment – 0.1% | | | |
| | NVIDIA Corp | | 12,946 | | | $1,962,484 | |
Total Common Stocks (cost $3,533,775) | | 2,020,932 | |
Preferred Stocks– 0.2% | | | |
Consumer Cyclical – 0% | | | |
| | Quiksilver Inc¢ | | 12,688 | | | 10,785 | |
Finance Companies – 0% | | | |
| | Castlelake Aircraft Securitization Trust 2018-1, 6/15/43 (144A)‡ | | 1,000,000 | | | 160,000 | |
| | Upstart Securitization Trust 2019-3, 1/21/30 (144A) | | 8,250 | | | 624,223 | |
| | | 784,223 | |
Industrial – 0% | | | |
| | Project Silver, 3/15/44 (144A)‡ | | 1,500,000 | | | 336,633 | |
| | START Ireland, 3/15/44 (144A)‡ | | 1,500,000 | | | 324,908 | |
| | Thunderbolt II Aircraft Lease Ltd, 9/15/38 (144A) | | 10 | | | 137,674 | |
| | Thunderbolt III Aircraft Lease Ltd, 11/15/39 (144A)‡ | | 5,000,000 | | | 400,000 | |
| | | 1,199,215 | |
Student Loan – 0.2% | | | |
| | SoFi Professional Loan Program 2017-E LLC, 11/26/40 (144A) | | 25,000 | | | 361,453 | |
| | SoFi Professional Loan Program 2017-F LLC, 1/25/41 (144A) | | 35,000 | | | 620,757 | |
| | SoFi Professional Loan Program 2018-C Trust, 1/25/48 (144A) | | 58,000 | | | 824,209 | |
| | SoFi Professional Loan Program 2018-D Trust, 2/25/48 (144A) | | 76,000 | | | 720,001 | |
| | SoFi Professional Loan Program 2019-B LLC, 8/17/48 (144A) | | 70,900 | | | 802,290 | |
| | SoFi Professional Loan Program 2020-A Trust, 5/15/46 (144A) | | 34,000 | | | 921,580 | |
| | | 4,250,290 | |
Total Preferred Stocks (cost $29,010,353) | | 6,244,513 | |
Convertible Preferred Stocks– 0.1% | | | |
Health Care Equipment & Supplies – 0.1% | | | |
| | Becton Dickinson and Co, 0.6000%, 6/1/23((cost $2,999,882) | | 59,700 | | | 2,961,717 | |
Investment Companies– 0.9% | | | |
Money Markets – 0.9% | | | |
| | Janus Henderson Cash Liquidity Fund LLC, 1.3877%ºº,£((cost $27,919,343) | | 27,919,343 | | | 27,922,135 | |
Investments Purchased with Cash Collateral from Securities Lending– 0.6% | | | |
Investment Companies – 0.5% | | | |
| | Janus Henderson Cash Collateral Fund LLC, 1.3810%ºº,£ | | 14,134,115 | | | 14,134,115 | |
Time Deposits – 0.1% | | | |
| | Royal Bank of Canada, 1.5600%, 7/1/22 | | $3,695,029 | | | 3,695,029 | |
Total Investments Purchased with Cash Collateral from Securities Lending (cost $17,829,144) | | 17,829,144 | |
Total Investments (total cost $3,889,975,312) – 119.7% | | 3,535,760,548 | |
Liabilities, net of Cash, Receivables and Other Assets – (19.7)% | | (581,119,018) | |
Net Assets – 100% | | $2,954,641,530 | |
| | |
See Notes to Schedule of Investments and Other Information and Notes to Financial Statements. |
| |
Janus Investment Fund | 21 |
Janus Henderson Multi-Sector Income Fund
Schedule of Investments
June 30, 2022
| | | | | | |
Summary of Investments by Country - (Long Positions) (unaudited) |
| |
| | | | | % of | |
| | | | | Investment | |
Country | | Value | | Securities | |
United States | | $3,312,409,120 | | 93.7 | % |
Canada | | 40,611,740 | | 1.1 | |
Cayman Islands | | 34,103,972 | | 1.0 | |
Luxembourg | | 23,387,976 | | 0.7 | |
United Kingdom | | 20,722,507 | | 0.6 | |
Germany | | 14,111,935 | | 0.4 | |
Israel | | 13,098,016 | | 0.4 | |
Peru | | 11,431,284 | | 0.3 | |
Panama | | 10,522,255 | | 0.3 | |
Australia | | 10,212,724 | | 0.3 | |
Zambia | | 8,146,100 | | 0.2 | |
Switzerland | | 7,323,268 | | 0.2 | |
Mexico | | 5,720,420 | | 0.2 | |
Burkina Faso | | 5,600,641 | | 0.1 | |
Sweden | | 5,074,940 | | 0.1 | |
France | | 3,521,625 | | 0.1 | |
Czech Republic | | 3,328,699 | | 0.1 | |
Italy | | 2,918,062 | | 0.1 | |
Macao | | 2,296,590 | | 0.1 | |
Ireland | | 893,766 | | 0.0 | |
Bermuda | | 324,908 | | 0.0 | |
| | | | | | |
| | | | | | |
Total | | $3,535,760,548 | | 100.0 | % |
| | |
See Notes to Schedule of Investments and Other Information and Notes to Financial Statements. |
| |
22 | JUNE 30, 2022 |
Janus Henderson Multi-Sector Income Fund
Schedule of Investments
June 30, 2022
Schedules of Affiliated Investments – (% of Net Assets)
| | | | | | | | | | | |
| | Dividend Income | Realized Gain/(Loss) | Change in Unrealized Appreciation/ Depreciation | Value at 6/30/22 |
Investment Companies - 0.9% |
Money Markets - 0.9% | |
| | Janus Henderson Cash Liquidity Fund LLC, 1.3877%ºº | $ | 167,264 | $ | 844 | $ | 69 | $ | 27,922,135 |
Investments Purchased with Cash Collateral from Securities Lending - 0.5% |
Investment Companies - 0.5% | |
| | Janus Henderson Cash Collateral Fund LLC, 1.3810%ºº | | 86,040∆ | | - | | - | | 14,134,115 |
Total Affiliated Investments - 1.4% | $ | 253,304 | $ | 844 | $ | 69 | $ | 42,056,250 |
| | | | | | | | | | | |
| | Value at 6/30/21 | Purchases | Sales Proceeds | Value at 6/30/22 |
Investment Companies - 0.9% |
Money Markets - 0.9% | |
| | Janus Henderson Cash Liquidity Fund LLC, 1.3877%ºº | | 217,738,920 | | 1,330,840,927 | | (1,520,658,625) | | 27,922,135 |
Investments Purchased with Cash Collateral from Securities Lending - 0.5% |
Investment Companies - 0.5% | |
| | Janus Henderson Cash Collateral Fund LLC, 1.3810%ºº | | 4,455,764 | | 119,393,966 | | (109,715,615) | | 14,134,115 |
| | | | | | | |
Schedule of Forward Foreign Currency Exchange Contracts | | | | | | |
| | | | | | | | | |
Counterparty/ Foreign Currency | Settlement Date | Foreign Currency Amount (Sold)/ Purchased | | USD Currency Amount (Sold)/ Purchased | | Market Value and Unrealized Appreciation/ (Depreciation) | |
Citibank, National Association: | | | | | | | | |
Canadian Dollar | 8/4/22 | (4,998,106) | $ | 3,885,642 | | 2,181 | | |
HSBC Securities (USA), Inc.: | | | | | | | | |
Euro | 8/4/22 | 2,936,000 | | (3,066,123) | | 17,188 | | |
Euro | 8/4/22 | (42,159,222) | | 44,516,345 | | 241,823 | | |
| | | | | | | | | |
| | | | | | | 259,011 | | |
Total | | | | | $ | 261,192 | | |
| | |
See Notes to Schedule of Investments and Other Information and Notes to Financial Statements. |
| |
Janus Investment Fund | 23 |
Janus Henderson Multi-Sector Income Fund
Schedule of Investments
June 30, 2022
Schedule of Futures
| | | | | | | | | | | | | | | |
Description | | Number of Contracts | | Expiration Date | | Notional Amount | | Value and Unrealized Appreciation/(Depreciation) | | |
Futures Long: | | | | | | | | | | |
10 Year US Treasury Note | | 4,129 | | 9/30/22 | $ | 489,415,531 | $ | (6,032,213) | |
2 Year US Treasury Note | | 54 | | 10/5/22 | | 11,340,844 | | 119,813 | |
Total - Futures Long | | | | | | | | (5,912,400) | |
Futures Short: | | | | | | | | | | |
5 Year US Treasury Note | | 1,240 | | 10/5/22 | | (139,190,000) | | 1,143,125 | |
Ultra 10-Year Treasury Note | | 584 | | 9/30/22 | | (74,387,000) | | 1,188,188 | |
Ultra Long Term US Treasury Bond | | 24 | | 9/30/22 | | (3,704,250) | | 86,250 | |
US Treasury Long Bond | | 64 | | 9/30/22 | | (8,872,000) | | 148,454 | |
Total - Futures Short | | | | | | | | 2,566,017 | |
Total | | | | | | | $ | (3,346,383) | | |
| | | | | | | | | | |
Schedule of Centrally Cleared Credit Default Swaps - Buy Protection |
Reference Asset | Maturity Date | Notional Amount | | | Premiums Paid/(Received) | | Unrealized Appreciation/ (Depreciation) | | Value |
CDX.NA.HY.S38, Fixed Rate of 5.00%, Paid Quarterly | 6/20/27 | (149,094,000) | USD | $ | (5,888,643) | $ | 10,045,111 | $ | 4,156,468 |
The following table, grouped by derivative type, provides information about the fair value and location of derivatives within the Statement of Assets and Liabilities as of June 30, 2022.
| | | | | | | | | | | | |
Fair Value of Derivative Instruments (not accounted for as hedging instruments) as of June 30, 2022 |
| | | | | | | | | | | |
| | | | | Credit
Contracts | | Currency
Contracts | | Interest Rate
Contracts | | Total |
Asset Derivatives: | | | | | | | | | |
Forward foreign currency exchange contracts | | | $ - | | $261,192 | | $ - | | $ 261,192 |
*Futures contracts | | | - | | - | | 2,685,830 | | $ 2,685,830 |
*Swaps - centrally cleared | | | 10,045,111 | | - | | - | | $10,045,111 |
| | | | | | | | | | |
Total Asset Derivatives | | | $10,045,111 | | $261,192 | | $ 2,685,830 | | $12,992,133 |
Liability Derivatives: | | | | | | | | | |
*Futures contracts | | | $ - | | $ - | | $ 6,032,213 | | $ 6,032,213 |
| | | | | | | | | | |
*The fair value presented includes net cumulative unrealized appreciation (depreciation) on futures contracts and centrally cleared swaps. In the Statement of Assets and Liabilities, only current day's variation margin is reported in receivables or payables and the net cumulative unrealized appreciation (depreciation) is included in total distributable earnings (loss). |
| | |
See Notes to Schedule of Investments and Other Information and Notes to Financial Statements. |
| |
24 | JUNE 30, 2022 |
Janus Henderson Multi-Sector Income Fund
Schedule of Investments
June 30, 2022
The following tables provide information about the effect of derivatives and hedging activities on the Fund’s Statement of Operations for the year ended June 30, 2022.
| | | | | | | | | | | |
The effect of Derivative Instruments (not accounted for as hedging instruments) on the Statement of Operations for the year ended June 30, 2022 |
| | | | | | | | | | |
Amount of Realized Gain/(Loss) Recognized on Derivatives |
Derivative | | Credit
Contracts | | Currency
Contracts | | Interest Rate
Contracts | | Total |
Futures contracts | | $ - | | $ - | | $(30,901,545) | | $(30,901,545) |
Forward foreign currency exchange contracts | | - | | 9,333,085 | | - | | $ 9,333,085 |
Swap contracts | | (2,665,086) | | - | | 1,140,593 | | $ (1,524,493) |
| | | | | | | | | | | |
Total | | $ (2,665,086) | | $ 9,333,085 | | $(29,760,952) | | $(23,092,953) |
| | | | | | | | | | | |
| | | | | | | | | | | |
Amount of Change in Unrealized Appreciation/Depreciation Recognized on Derivatives |
Derivative | | Credit
Contracts | | Currency
Contracts | | Interest Rate
Contracts | | Total |
Futures contracts | | $ - | | $ - | | $ 2,375,418 | | $ 2,375,418 |
Forward foreign currency exchange contracts | | - | | (1,699,982) | | - | | $ (1,699,982) |
Swap contracts | | 10,045,111 | | - | | (334,574) | | $ 9,710,537 |
| | | | | | | | | | | |
Total | | $10,045,111 | | $(1,699,982) | | $ 2,040,844 | | $ 10,385,973 |
Please see the "Net Realized Gain/(Loss) on Investments" "Change in Unrealized Net Appreciation/Depreciation" sections of the Fund’s Statement of Operations.
| | |
Average Ending Monthly Value of Derivative Instruments During the Year Ended June 30, 2022 |
| |
| |
Credit default swaps: | |
Average notional amount - buy protection | $77,668,769 |
Average notional amount - sell protection | 9,530,769 |
Forward foreign currency exchange contracts: | |
Average amounts purchased - in USD | 11,212,168 |
Average amounts sold - in USD | 74,062,040 |
Futures contracts: | |
Average notional amount of contracts - long | 900,660,977 |
Average notional amount of contracts - short | 316,357,268 |
Interest rate swaps: | |
Average notional amount - pay fixed rate/receive floating rate | 6,769,231 |
| | |
| |
| |
| |
| | |
See Notes to Schedule of Investments and Other Information and Notes to Financial Statements. |
| |
Janus Investment Fund | 25 |
Janus Henderson Multi-Sector Income Fund
Schedule of Investments
June 30, 2022
| | | | | | | | | | |
Offsetting of Financial Assets and Derivative Assets |
| |
| | | Gross Amounts | | | | | | |
| | | of Recognized | | Offsetting Asset | | Collateral | | |
Counterparty | | Assets | | or Liability(a) | | Pledged(b) | | Net Amount |
| | | | | | | | | |
Citibank, National Association | $ | 2,181 | $ | — | $ | — | $ | 2,181 |
HSBC Securities (USA), Inc. | | 259,011 | | — | | — | | 259,011 |
JPMorgan Chase Bank, National Association | | 17,025,246 | | — | | (17,025,246) | | — |
| | | | | | | | | |
Total | $ | 17,286,438 | $ | — | $ | (17,025,246) | $ | 261,192 |
(a) | Represents the amount of assets or liabilities that could be offset with the same counterparty under master netting or similar agreements that management elects not to offset on the Statement of Assets and Liabilities. |
(b) | Collateral pledged is limited to the net outstanding amount due to/from an individual counterparty. The actual collateral amounts pledged may exceed these amounts and may fluctuate in value. |
| | |
See Notes to Schedule of Investments and Other Information and Notes to Financial Statements. |
| |
26 | JUNE 30, 2022 |
Janus Henderson Multi-Sector Income Fund
Notes to Schedule of Investments and Other Information
| | |
Bloomberg U.S. Aggregate Bond Index | Bloomberg U.S. Aggregate Bond Index is a broad-based measure of the investment grade, US dollar-denominated, fixed-rate taxable bond market. |
| | |
EURIBOR | Euro Interbank Offered Rate |
ICE | Intercontinental Exchange |
LIBOR | London Interbank Offered Rate |
LLC | Limited Liability Company |
LP | Limited Partnership |
PLC | Public Limited Company |
SOFR | Secured Overnight Financing Rate |
TBA | (To Be Announced) Securities are purchased/sold on a forward commitment basis with an approximate principal amount and no defined maturity date. The actual principal and maturity date will be determined upon settlement when specific mortgage pools are assigned. |
| | |
144A | Securities sold under Rule 144A of the Securities Act of 1933, as amended, are subject to legal and/or contractual restrictions on resale and may not be publicly sold without registration under the 1933 Act. Unless otherwise noted, these securities have been determined to be liquid under guidelines established by the Board of Trustees. The total value of 144A securities as of the year ended June 30, 2022 is $2,252,879,331, which represents 76.2% of net assets. |
| | |
* | Non-income producing security. |
| | |
ƒ | All or a portion of this position is not funded, or has been purchased on a delayed delivery or when-issued basis. If applicable, interest rates will be determined and interest will begin to accrue at a future date. See Notes to Financial Statements. |
| | |
‡ | Variable or floating rate security. Rate shown is the current rate as of June 30, 2022. Certain variable rate securities are not based on a published reference rate and spread; they are determined by the issuer or agent and current market conditions. Reference rate is as of reset date and may vary by security, which may not indicate a reference rate and/or spread in their description. |
| | |
ºº | Rate shown is the 7-day yield as of June 30, 2022. |
| | |
# | Loaned security; a portion of the security is on loan at June 30, 2022. |
| | |
µ | Perpetual security. Perpetual securities have no stated maturity date, but they may be called/redeemed by the issuer. The date indicated, if any, represents the next call date. |
| | |
Ç | Step bond. The coupon rate will increase or decrease periodically based upon a predetermined schedule. The rate shown reflects the current rate. |
| | |
¤ | Interest only security. An interest only security represents the interest only portion of a pool of underlying mortgages or mortgage-backed securities which are separated and sold individually from the principal portion of the securities. Principal amount shown represents the par value on which interest payments are based. |
| | |
Ø | Payment-in-kind security which may pay interest/dividends in additional par/shares and/or in cash. Rates shown are the current rate and possible payment rates. |
| | |
€ | Issuer is not accruing interest income. The rate shown is the stated coupon rate. |
| | |
¢ | Security is valued using significant unobservable inputs. The total value of Level 3 securities as of the year ended June 30, 2022 is $12,236, which represents 0.0% of net assets. |
| | |
£ | The Fund may invest in certain securities that are considered affiliated companies. As defined by the Investment Company Act of 1940, as amended, an affiliated company is one in which the Fund owns 5% or more of the outstanding voting securities, or a company which is |
Janus Henderson Multi-Sector Income Fund
Notes to Schedule of Investments and Other Information
| | |
| | under common ownership or control. |
| | |
∆ | Net of income paid to the securities lending agent and rebates paid to the borrowing counterparties. |
| | | | | | | | | | | | | | |
The following is a summary of the inputs that were used to value the Fund’s investments in securities and other financial instruments as of June 30, 2022. See Notes to Financial Statements for more information. |
| |
Valuation Inputs Summary |
| | | | | | | |
| | | | | Level 2 - | | Level 3 - |
| | | Level 1 - | | Other Significant | | Significant |
| | | Quoted Prices | | Observable Inputs | | Unobservable Inputs |
| | | | | | | |
Assets | | | | | | |
Investments In Securities: | | | | | | |
Asset-Backed/Commercial Mortgage-Backed Securities | $ | - | $ | 1,708,008,127 | $ | - |
Bank Loans and Mezzanine Loans | | - | | 186,957,272 | | 1,451 |
Corporate Bonds | | - | | 908,414,013 | | - |
Convertible Corporate Bonds | | - | | 1,360,380 | | - |
Mortgage-Backed Securities | | - | | 674,040,864 | | - |
Common Stocks | | 2,020,932 | | - | | - |
Preferred Stocks | | - | | 6,233,728 | | 10,785 |
Convertible Preferred Stocks | | - | | 2,961,717 | | - |
Investment Companies | | - | | 27,922,135 | | - |
Investments Purchased with Cash Collateral from Securities Lending | | - | | 17,829,144 | | - |
Total Investments in Securities | $ | 2,020,932 | $ | 3,533,727,380 | $ | 12,236 |
Other Financial Instruments(a): | | | | | | |
Forward Foreign Currency Exchange Contracts | | - | | 261,192 | | - |
Futures Contracts | | 2,685,830 | | - | | - |
Centrally Cleared Swaps | | - | | 10,045,111 | | - |
Total Assets | $ | 4,706,762 | $ | 3,544,033,683 | $ | 12,236 |
Liabilities | | | | | | |
Other Financial Instruments(a): | | | | | | |
Futures Contracts | $ | 6,032,213 | $ | - | $ | - |
| | | | | | | |
(a) | Other financial instruments include forward foreign currency exchange contracts, futures, written options, written swaptions, and swap contracts. Forward foreign currency exchange contracts, futures contracts, and swap contracts are reported at their unrealized appreciation/(depreciation) at measurement date, which represents the change in the contract's value from trade date. Written options and written swaptions are reported at their market value at measurement date. |
Janus Henderson Multi-Sector Income Fund
Statement of Assets and Liabilities
June 30, 2022
| |
See footnotes at the end of the Statement. |
| | | | | | | |
| | | | | | |
Assets: | | | | |
| Unaffiliated investments, at value (cost $3,847,921,854)(1) | | $ | 3,493,704,298 | |
| Affiliated investments, at value (cost $42,053,458) | | | 42,056,250 | |
| Cash | | | 3,180,258 | |
| Deposits with brokers for centrally cleared derivatives | | | 9,921,357 | |
| Deposits with brokers for futures | | | 5,410,004 | |
| Forward foreign currency exchange contracts | | | 261,192 | |
| Cash denominated in foreign currency (cost $21,130) | | | 21,130 | |
| Variation margin receivable on futures contracts | | | 4,223,891 | |
| Variation margin receivable on centrally cleared swaps | | | 204,284 | |
| Trustees' deferred compensation | | | 86,449 | |
| Receivables: | | | | |
| | Interest | | | 23,127,436 | |
| | Investments sold | | | 12,140,130 | |
| | Fund shares sold | | | 4,966,286 | |
| | Dividends from affiliates | | | 30,633 | |
| | Dividends | | | 518 | |
| Other assets | | | 46,289 | |
Total Assets | | | 3,599,380,405 | |
Liabilities: | | | | |
| Collateral for securities loaned (Note 3) | | | 17,829,144 | |
| Variation margin payable on futures contracts | | | 1,811,750 | |
| Payables: | | | — | |
| | TBA investments purchased | | | 581,479,592 | |
| | Fund shares repurchased | | | 21,495,343 | |
| | Investments purchased | | | 19,290,610 | |
| | Advisory fees | | | 1,383,362 | |
| | Dividends | | | 483,939 | |
| | Transfer agent fees and expenses | | | 468,883 | |
| | Trustees' deferred compensation fees | | | 86,449 | |
| | Professional fees | | | 78,801 | |
| | 12b-1 Distribution and shareholder servicing fees | | | 63,693 | |
| | Trustees' fees and expenses | | | 13,252 | |
| | Affiliated fund administration fees payable | | | 6,214 | |
| | Custodian fees | | | 744 | |
| | Accrued expenses and other payables | | | 247,099 | |
Total Liabilities | | | 644,738,875 | |
Net Assets | | $ | 2,954,641,530 | |
| | |
See Notes to Financial Statements. |
| |
Janus Investment Fund | 29 |
Janus Henderson Multi-Sector Income Fund
Statement of Assets and Liabilities
June 30, 2022
| | | | | | | |
| | | | | | |
| | | | | | | |
Net Assets Consist of: | | | | |
| Capital (par value and paid-in surplus) | | $ | 3,387,270,810 | |
| Total distributable earnings (loss) | | | (432,629,280) | |
Total Net Assets | | $ | 2,954,641,530 | |
Net Assets - Class A Shares | | $ | 49,566,335 | |
| Shares Outstanding, $0.01 Par Value (unlimited shares authorized) | | | 5,675,537 | |
Net Asset Value Per Share(2) | | $ | 8.73 | |
Maximum Offering Price Per Share(3) | | $ | 9.17 | |
Net Assets - Class C Shares | | $ | 62,504,075 | |
| Shares Outstanding, $0.01 Par Value (unlimited shares authorized) | | | 7,155,421 | |
Net Asset Value Per Share(2) | | $ | 8.74 | |
Net Assets - Class D Shares | | $ | 91,299,456 | |
| Shares Outstanding, $0.01 Par Value (unlimited shares authorized) | | | 10,451,719 | |
Net Asset Value Per Share | | $ | 8.74 | |
Net Assets - Class I Shares | | $ | 2,522,907,181 | |
| Shares Outstanding, $0.01 Par Value (unlimited shares authorized) | | | 288,897,529 | |
Net Asset Value Per Share | | $ | 8.73 | |
Net Assets - Class N Shares | | $ | 68,120,010 | |
| Shares Outstanding, $0.01 Par Value (unlimited shares authorized) | | | 7,797,441 | |
Net Asset Value Per Share | | $ | 8.74 | |
Net Assets - Class S Shares | | $ | 1,201,767 | |
| Shares Outstanding, $0.01 Par Value (unlimited shares authorized) | | | 137,694 | |
Net Asset Value Per Share | | $ | 8.73 | |
Net Assets - Class T Shares | | $ | 159,042,706 | |
| Shares Outstanding, $0.01 Par Value (unlimited shares authorized) | | | 18,216,015 | |
Net Asset Value Per Share | | $ | 8.73 | |
| |
(1) Includes $17,025,246 of securities on loan. See Note 3 in Notes to Financial Statements. (2) Redemption price per share may be reduced for any applicable contingent deferred sales charge. (3) Maximum offering price is computed at 100/95.25 of net asset value. |
| | |
See Notes to Financial Statements. |
| |
30 | JUNE 30, 2022 |
Janus Henderson Multi-Sector Income Fund
Statement of Operations
For the year ended June 30, 2022
| | | | | | |
| | | | | |
Investment Income: | | | |
| Interest | $ | 138,374,468 | |
| Dividends | | 6,513,953 | |
| Dividends from affiliates | | 167,264 | |
| Affiliated securities lending income, net | | 86,040 | |
| Unaffiliated securities lending income, net | | 8,919 | |
| Other income | | 1,136,290 | |
Total Investment Income | | 146,286,934 | |
Expenses: | | | |
| Advisory fees | | 18,627,845 | |
| 12b-1 Distribution and shareholder servicing fees: | | | |
| | Class A Shares | | 159,221 | |
| | Class C Shares | | 717,443 | |
| | Class S Shares | | 2,233 | |
| Transfer agent administrative fees and expenses: | | | |
| | Class D Shares | | 117,942 | |
| | Class S Shares | | 2,232 | |
| | Class T Shares | | 506,496 | |
| Transfer agent networking and omnibus fees: | | | |
| | Class A Shares | | 28,444 | |
| | Class C Shares | | 56,128 | |
| | Class I Shares | | 2,664,345 | |
| Other transfer agent fees and expenses: | | | |
| | Class A Shares | | 3,724 | |
| | Class C Shares | | 3,389 | |
| | Class D Shares | | 14,418 | |
| | Class I Shares | | 119,818 | |
| | Class N Shares | | 3,704 | |
| | Class S Shares | | 37 | |
| | Class T Shares | | 1,986 | |
| Registration fees | | 351,395 | |
| Shareholder reports expense | | 200,438 | |
| Professional fees | | 131,050 | |
| Affiliated fund administration fees | | 83,763 | |
| Custodian fees | | 64,879 | |
| Trustees’ fees and expenses | | 59,456 | |
| Short sales interest expense | | 53,451 | |
| Other expenses | | 342,548 | |
Total Expenses | | 24,316,385 | |
Less: Excess Expense Reimbursement and Waivers | | (23,794) | |
Net Expenses | | 24,292,591 | |
Net Investment Income/(Loss) | | 121,994,343 | |
| | | | | |
| | |
See Notes to Financial Statements. |
| |
Janus Investment Fund | 31 |
Janus Henderson Multi-Sector Income Fund
Statement of Operations
For the year ended June 30, 2022
| | | | | | |
| | | | | |
Net Realized Gain/(Loss) on Investments: | | | |
| Investments and foreign currency transactions | $ | (71,181,485) | |
| Investments in affiliates | | 844 | |
| Forward foreign currency exchange contracts | | 9,333,085 | |
| Futures contracts | | (30,901,545) | |
| Short sales | | 224,865 | |
| Swap contracts | | (1,524,493) | |
| TBA sales commitments | | 633,406 | |
Total Net Realized Gain/(Loss) on Investments | | (93,415,323) | |
Change in Unrealized Net Appreciation/Depreciation: | | | |
| Investments, foreign currency translations and Trustees’ deferred compensation | | (386,209,256) | |
| Investments in affiliates | | 69 | |
| Forward foreign currency exchange contracts | | (1,699,982) | |
| Futures contracts | | 2,375,418 | |
| TBA sales commitments | | 103,279 | |
| Swap contracts | | 9,710,537 | |
Total Change in Unrealized Net Appreciation/Depreciation | | (375,719,935) | |
Net Increase/(Decrease) in Net Assets Resulting from Operations | $ | (347,140,915) | |
| | | | | |
| | |
See Notes to Financial Statements. |
| |
32 | JUNE 30, 2022 |
Janus Henderson Multi-Sector Income Fund
Statements of Changes in Net Assets
| | | | | | | | | |
| | | | | | | | |
| | | Year ended
June 30, 2022 | | Year ended
June 30, 2021 | |
| | | | | | | | | |
Operations: | | | | | | |
| Net investment income/(loss) | $ | 121,994,343 | | $ | 109,350,977 | |
| Net realized gain/(loss) on investments | | (93,415,323) | | | 78,575,490 | |
| Change in unrealized net appreciation/depreciation | | (375,719,935) | | | 93,406,178 | |
Net Increase/(Decrease) in Net Assets Resulting from Operations | | (347,140,915) | | | 281,332,645 | |
Dividends and Distributions to Shareholders: | | | | | | |
| | Class A Shares | | (2,535,097) | | | (2,383,996) | |
| | Class C Shares | | (2,360,641) | | | (2,293,328) | |
| | Class D Shares | | (4,349,450) | | | (3,952,607) | |
| | Class I Shares | | (117,851,696) | | | (89,743,409) | |
| | Class N Shares | | (4,378,152) | | | (4,655,898) | |
| | Class S Shares | | (33,689) | | | (37,044) | |
| | Class T Shares | | (8,153,049) | | | (12,349,661) | |
| Total Dividends and Distributions to Shareholders | | (139,661,774) | | | (115,415,943) | |
| Return of Capital on Dividends and Distributions | | | | | | |
| | Class A Shares | | (31,545) | | | — | |
| | Class C Shares | | (35,270) | | | — | |
| | Class D Shares | | (50,890) | | | — | |
| | Class I Shares | | (1,333,778) | | | — | |
| | Class N Shares | | (52,643) | | | — | |
| | Class S Shares | | (379) | | | — | |
| | Class T Shares | | (100,119) | | | — | |
| Total Return of Capital Dividends and Distributions | | (1,604,624) | | | — | |
Net Decrease from Dividends and Distributions to Shareholders | | (141,266,398) | | | (115,415,943) | |
Capital Share Transactions: | | | | | | |
| | Class A Shares | | (8,643,788) | | | 14,195,757 | |
| | Class C Shares | | 2,009,650 | | | 3,186,101 | |
| | Class D Shares | | (2,175,198) | | | 24,735,614 | |
| | Class I Shares | | 366,961,875 | | | 637,421,757 | |
| | Class N Shares | | (41,998,008) | | | 27,555,092 | |
| | Class S Shares | | 605,584 | | | (308,332) | |
| | Class T Shares | | (43,085,492) | | | (75,137,201) | |
Net Increase/(Decrease) from Capital Share Transactions | | 273,674,623 | | | 631,648,788 | |
Net Increase/(Decrease) in Net Assets | | (214,732,690) | | | 797,565,490 | |
Net Assets: | | | | | | |
| Beginning of period | | 3,169,374,220 | | | 2,371,808,730 | |
| End of period | $ | 2,954,641,530 | | $ | 3,169,374,220 | |
| | | | | | | | |
| | |
See Notes to Financial Statements. |
| |
Janus Investment Fund | 33 |
Janus Henderson Multi-Sector Income Fund
Financial Highlights
| | | | | | | | | | | | | | | | | | | |
Class A Shares | | | | | | | | | | | | | | | |
For a share outstanding during the year ended June 30 | | 2022 | | | 2021 | | | 2020 | | | 2019 | | | 2018 | |
| Net Asset Value, Beginning of Period | | $10.12 | | | $9.47 | | | $9.89 | | | $9.66 | | | $9.83 | |
| Income/(Loss) from Investment Operations: | | | | | | | | | | | | | | | |
| | Net investment income/(loss)(1) | | 0.33 | | | 0.39 | | | 0.40 | | | 0.42 | | | 0.40 | |
| | Net realized and unrealized gain/(loss) | | (1.33) | | | 0.67 | | | (0.34) | | | 0.25 | | | (0.08) | |
| Total from Investment Operations | | (1.00) | | | 1.06 | | | 0.06 | | | 0.67 | | | 0.32 | |
| Less Dividends and Distributions: | | | | | | | | | | | | | | | |
| | Dividends (from net investment income) | | (0.36) | | | (0.41) | | | (0.40) | | | (0.44) | | | (0.43) | |
| | Distributions (from capital gains) | | (0.03) | | | — | | | (0.05) | | | — | | | (0.06) | |
| | Return of capital | | —(2) | | | — | | | (0.03) | | | — | | | — | |
| Total Dividends and Distributions | | (0.39) | | | (0.41) | | | (0.48) | | | (0.44) | | | (0.49) | |
| Net Asset Value, End of Period | | $8.73 | | | $10.12 | | | $9.47 | | | $9.89 | | | $9.66 | |
| Total Return* | | (10.18)% | | | 11.38%(3) | | | 0.61% | | | 7.11% | | | 3.20% | |
| Net Assets, End of Period (in thousands) | | $49,566 | | | $67,032 | | | $49,168 | | | $20,276 | | | $15,697 | |
| Average Net Assets for the Period (in thousands) | | $63,735 | | | $57,669 | | | $40,103 | | | $14,907 | | | $13,616 | |
| Ratios to Average Net Assets**: | | | | | | | | | | | | | | | |
| | Ratio of Gross Expenses | | 0.90% | | | 0.91% | | | 0.92% | | | 1.05% | | | 1.11% | |
| | Ratio of Net Expenses (After Waivers and Expense Offsets) | | 0.90% | | | 0.91% | | | 0.92% | | | 1.00% | | | 0.99% | |
| | Ratio of Net Investment Income/(Loss) | | 3.43% | | | 3.91% | | | 4.19% | | | 4.35% | | | 4.16% | |
| Portfolio Turnover Rate(4) | | 75% | | | 119% | | | 188% | | | 142% | | | 194% | |
| | | | | | | | | | | | | | | | | | | |
| |
* Total return includes adjustments in accordance with generally accepted accounting principles required at the year or period end and are not annualized for periods of less than one full year. ** Annualized for periods of less than one full year. (1) Per share amounts are calculated based on average shares outstanding during the year or period. (2) Less than $0.005 on a per share basis. (3) 0.01% of the Fund’s total return consists of a voluntary reimbursement by the Adviser for realized investment losses and another 0.04% consists of a gain on an investment not meeting the investment guidelines of the Fund. Excluding these items, total return would have been 11.33%. (4) Portfolio Turnover Rate excludes TBA (to be announced) purchase and sales commitments. |
| | |
See Notes to Financial Statements. |
| |
34 | JUNE 30, 2022 |
Janus Henderson Multi-Sector Income Fund
Financial Highlights
| | | | | | | | | | | | | | | | | | | |
Class C Shares | | | | | | | | | | | | | | | |
For a share outstanding during the year ended June 30 | | 2022 | | | 2021 | | | 2020 | | | 2019 | | | 2018 | |
| Net Asset Value, Beginning of Period | | $10.12 | | | $9.47 | | | $9.89 | | | $9.67 | | | $9.84 | |
| Income/(Loss) from Investment Operations: | | | | | | | | | | | | | | | |
| | Net investment income/(loss)(1) | | 0.26 | | | 0.32 | | | 0.33 | | | 0.35 | | | 0.33 | |
| | Net realized and unrealized gain/(loss) | | (1.33) | | | 0.67 | | | (0.35) | | | 0.23 | | | (0.09) | |
| Total from Investment Operations | | (1.07) | | | 0.99 | | | (0.02) | | | 0.58 | | | 0.24 | |
| Less Dividends and Distributions: | | | | | | | | | | | | | | | |
| | Dividends (from net investment income) | | (0.28) | | | (0.34) | | | (0.33) | | | (0.36) | | | (0.35) | |
| | Distributions (from capital gains) | | (0.03) | | | — | | | (0.05) | | | — | | | (0.06) | |
| | Return of capital | | —(2) | | | — | | | (0.02) | | | — | | | — | |
| Total Dividends and Distributions | | (0.31) | | | (0.34) | | | (0.40) | | | (0.36) | | | (0.41) | |
| Net Asset Value, End of Period | | $8.74 | | | $10.12 | | | $9.47 | | | $9.89 | | | $9.67 | |
| Total Return* | | (10.75)% | | | 10.58%(3) | | | (0.18)% | | | 6.20% | | | 2.40% | |
| Net Assets, End of Period (in thousands) | | $62,504 | | | $71,133 | | | $63,574 | | | $30,350 | | | $18,101 | |
| Average Net Assets for the Period (in thousands) | | $73,171 | | | $67,010 | | | $50,662 | | | $20,980 | | | $12,273 | |
| Ratios to Average Net Assets**: | | | | | | | | | | | | | | | |
| | Ratio of Gross Expenses | | 1.66% | | | 1.64% | | | 1.71% | | | 1.79% | | | 1.90% | |
| | Ratio of Net Expenses (After Waivers and Expense Offsets) | | 1.66% | | | 1.64% | | | 1.71% | | | 1.76% | | | 1.79% | |
| | Ratio of Net Investment Income/(Loss) | | 2.70% | | | 3.19% | | | 3.43% | | | 3.60% | | | 3.40% | |
| Portfolio Turnover Rate(4) | | 75% | | | 119% | | | 188% | | | 142% | | | 194% | |
| | | | | | | | | | | | | | | | | | | |
| |
* Total return includes adjustments in accordance with generally accepted accounting principles required at the year or period end and are not annualized for periods of less than one full year. ** Annualized for periods of less than one full year. (1) Per share amounts are calculated based on average shares outstanding during the year or period. (2) Less than $0.005 on a per share basis. (3) 0.01% of the Fund’s total return consists of a voluntary reimbursement by the Adviser for realized investment losses and another 0.04% consists of a gain on an investment not meeting the investment guidelines of the Fund. Excluding these items, total return would have been 10.53%. (4) Portfolio Turnover Rate excludes TBA (to be announced) purchase and sales commitments. |
| | |
See Notes to Financial Statements. |
| |
Janus Investment Fund | 35 |
Janus Henderson Multi-Sector Income Fund
Financial Highlights
| | | | | | | | | | | | | | | | | | | |
Class D Shares | | | | | | | | | | | | | | | |
For a share outstanding during the year ended June 30 | | 2022 | | | 2021 | | | 2020 | | | 2019 | | | 2018 | |
| Net Asset Value, Beginning of Period | | $10.12 | | | $9.47 | | | $9.89 | | | $9.67 | | | $9.84 | |
| Income/(Loss) from Investment Operations: | | | | | | | | | | | | | | | |
| | Net investment income/(loss)(1) | | 0.35 | | | 0.40 | | | 0.42 | | | 0.44 | | | 0.43 | |
| | Net realized and unrealized gain/(loss) | | (1.33) | | | 0.68 | | | (0.35) | | | 0.23 | | | (0.10) | |
| Total from Investment Operations | | (0.98) | | | 1.08 | | | 0.07 | | | 0.67 | | | 0.33 | |
| Less Dividends and Distributions: | | | | | | | | | | | | | | | |
| | Dividends (from net investment income) | | (0.37) | | | (0.43) | | | (0.41) | | | (0.45) | | | (0.44) | |
| | Distributions (from capital gains) | | (0.03) | | | — | | | (0.05) | | | — | | | (0.06) | |
| | Return of capital | | —(2) | | | — | | | (0.03) | | | — | | | — | |
| Total Dividends and Distributions | | (0.40) | | | (0.43) | | | (0.49) | | | (0.45) | | | (0.50) | |
| Net Asset Value, End of Period | | $8.74 | | | $10.12 | | | $9.47 | | | $9.89 | | | $9.67 | |
| Total Return* | | (9.93)% | | | 11.57%(3) | | | 0.77% | | | 7.18% | | | 3.36% | |
| Net Assets, End of Period (in thousands) | | $91,299 | | | $108,418 | | | $78,091 | | | $57,522 | | | $31,328 | |
| Average Net Assets for the Period (in thousands) | | $104,991 | | | $91,918 | | | $79,433 | | | $42,770 | | | $28,932 | |
| Ratios to Average Net Assets**: | | | | | | | | | | | | | | | |
| | Ratio of Gross Expenses | | 0.73% | | | 0.74% | | | 0.76% | | | 0.88% | | | 0.98% | |
| | Ratio of Net Expenses (After Waivers and Expense Offsets) | | 0.73% | | | 0.74% | | | 0.76% | | | 0.84% | | | 0.84% | |
| | Ratio of Net Investment Income/(Loss) | | 3.61% | | | 4.07% | | | 4.30% | | | 4.54% | | | 4.36% | |
| Portfolio Turnover Rate(4) | | 75% | | | 119% | | | 188% | | | 142% | | | 194% | |
| | | | | | | | | | | | | | | | | | | |
| |
* Total return includes adjustments in accordance with generally accepted accounting principles required at the year or period end and are not annualized for periods of less than one full year. ** Annualized for periods of less than one full year. (1) Per share amounts are calculated based on average shares outstanding during the year or period. (2) Less than $0.005 on a per share basis. (3) 0.01% of the Fund’s total return consists of a voluntary reimbursement by the Adviser for realized investment losses and another 0.04% consists of a gain on an investment not meeting the investment guidelines of the Fund. Excluding these items, total return would have been 11.52%. (4) Portfolio Turnover Rate excludes TBA (to be announced) purchase and sales commitments. |
| | |
See Notes to Financial Statements. |
| |
36 | JUNE 30, 2022 |
Janus Henderson Multi-Sector Income Fund
Financial Highlights
| | | | | | | | | | | | | | | | | | | |
Class I Shares | | | | | | | | | | | | | | | |
For a share outstanding during the year ended June 30 | | 2022 | | | 2021 | | | 2020 | | | 2019 | | | 2018 | |
| Net Asset Value, Beginning of Period | | $10.12 | | | $9.47 | | | $9.88 | | | $9.66 | | | $9.83 | |
| Income/(Loss) from Investment Operations: | | | | | | | | | | | | | | | |
| | Net investment income/(loss)(1) | | 0.36 | | | 0.41 | | | 0.43 | | | 0.44 | | | 0.43 | |
| | Net realized and unrealized gain/(loss) | | (1.34) | | | 0.67 | | | (0.34) | | | 0.24 | | | (0.09) | |
| Total from Investment Operations | | (0.98) | | | 1.08 | | | 0.09 | | | 0.68 | | | 0.34 | |
| Less Dividends and Distributions: | | | | | | | | | | | | | | | |
| | Dividends (from net investment income) | | (0.38) | | | (0.43) | | | (0.42) | | | (0.46) | | | (0.45) | |
| | Distributions (from capital gains) | | (0.03) | | | — | | | (0.05) | | | — | | | (0.06) | |
| | Return of capital | | —(2) | | | — | | | (0.03) | | | — | | | — | |
| Total Dividends and Distributions | | (0.41) | | | (0.43) | | | (0.50) | | | (0.46) | | | (0.51) | |
| Net Asset Value, End of Period | | $8.73 | | | $10.12 | | | $9.47 | | | $9.88 | | | $9.66 | |
| Total Return* | | (9.99)% | | | 11.63%(3) | | | 0.93% | | | 7.25% | | | 3.46% | |
| Net Assets, End of Period (in thousands) | | $2,522,907 | | | $2,570,289 | | | $1,805,985 | | | $909,014 | | | $196,433 | |
| Average Net Assets for the Period (in thousands) | | $2,803,141 | | | $2,061,334 | | | $1,542,112 | | | $476,391 | | | $110,623 | |
| Ratios to Average Net Assets**: | | | | | | | | | | | | | | | |
| | Ratio of Gross Expenses | | 0.69% | | | 0.69% | | | 0.70% | | | 0.80% | | | 0.87% | |
| | Ratio of Net Expenses (After Waivers and Expense Offsets) | | 0.69% | | | 0.69% | | | 0.70% | | | 0.78% | | | 0.76% | |
| | Ratio of Net Investment Income/(Loss) | | 3.68% | | | 4.13% | | | 4.42% | | | 4.59% | | | 4.45% | |
| Portfolio Turnover Rate(4) | | 75% | | | 119% | | | 188% | | | 142% | | | 194% | |
| | | | | | | | | | | | | | | | | | | |
| |
* Total return includes adjustments in accordance with generally accepted accounting principles required at the year or period end and are not annualized for periods of less than one full year. ** Annualized for periods of less than one full year. (1) Per share amounts are calculated based on average shares outstanding during the year or period. (2) Less than $0.005 on a per share basis. (3) 0.01% of the Fund’s total return consists of a voluntary reimbursement by the Adviser for realized investment losses and another 0.04% consists of a gain on an investment not meeting the investment guidelines of the Fund. Excluding these items, total return would have been 11.58%. (4) Portfolio Turnover Rate excludes TBA (to be announced) purchase and sales commitments. |
| | |
See Notes to Financial Statements. |
| |
Janus Investment Fund | 37 |
Janus Henderson Multi-Sector Income Fund
Financial Highlights
| | | | | | | | | | | | | | | | | | | |
Class N Shares | | | | | | | | | | | | | | | |
For a share outstanding during the year ended June 30 | | 2022 | | | 2021 | | | 2020 | | | 2019 | | | 2018 | |
| Net Asset Value, Beginning of Period | | $10.12 | | | $9.47 | | | $9.89 | | | $9.67 | | | $9.84 | |
| Income/(Loss) from Investment Operations: | | | | | | | | | | | | | | | |
| | Net investment income/(loss)(1) | | 0.37 | | | 0.42 | | | 0.44 | | | 0.45 | | | 0.44 | |
| | Net realized and unrealized gain/(loss) | | (1.33) | | | 0.67 | | | (0.36) | | | 0.24 | | | (0.09) | |
| Total from Investment Operations | | (0.96) | | | 1.09 | | | 0.08 | | | 0.69 | | | 0.35 | |
| Less Dividends and Distributions: | | | | | | | | | | | | | | | |
| | Dividends (from net investment income) | | (0.39) | | | (0.44) | | | (0.42) | | | (0.47) | | | (0.46) | |
| | Distributions (from capital gains) | | (0.03) | | | — | | | (0.05) | | | — | | | (0.06) | |
| | Return of capital | | —(2) | | | — | | | (0.03) | | | — | | | — | |
| Total Dividends and Distributions | | (0.42) | | | (0.44) | | | (0.50) | | | (0.47) | | | (0.52) | |
| Net Asset Value, End of Period | | $8.74 | | | $10.12 | | | $9.47 | | | $9.89 | | | $9.67 | |
| Total Return* | | (9.80)% | | | 11.73%(3) | | | 0.90% | | | 7.32% | | | 3.51% | |
| Net Assets, End of Period (in thousands) | | $68,120 | | | $121,983 | | | $88,092 | | | $6,763 | | | $2,696 | |
| Average Net Assets for the Period (in thousands) | | $101,875 | | | $104,964 | | | $20,729 | | | $3,933 | | | $2,017 | |
| Ratios to Average Net Assets**: | | | | | | | | | | | | | | | |
| | Ratio of Gross Expenses | | 0.59% | | | 0.60% | | | 0.63% | | | 0.80% | | | 0.84% | |
| | Ratio of Net Expenses (After Waivers and Expense Offsets) | | 0.59% | | | 0.60% | | | 0.63% | | | 0.71% | | | 0.69% | |
| | Ratio of Net Investment Income/(Loss) | | 3.73% | | | 4.21% | | | 4.68% | | | 4.67% | | | 4.50% | |
| Portfolio Turnover Rate(4) | | 75% | | | 119% | | | 188% | | | 142% | | | 194% | |
| | | | | | | | | | | | | | | | | | | |
| |
* Total return includes adjustments in accordance with generally accepted accounting principles required at the year or period end and are not annualized for periods of less than one full year. ** Annualized for periods of less than one full year. (1) Per share amounts are calculated based on average shares outstanding during the year or period. (2) Less than $0.005 on a per share basis. (3) 0.01% of the Fund’s total return consists of a voluntary reimbursement by the Adviser for realized investment losses and another 0.04% consists of a gain on an investment not meeting the investment guidelines of the Fund. Excluding these items, total return would have been 11.68%. (4) Portfolio Turnover Rate excludes TBA (to be announced) purchase and sales commitments. |
| | |
See Notes to Financial Statements. |
| |
38 | JUNE 30, 2022 |
Janus Henderson Multi-Sector Income Fund
Financial Highlights
| | | | | | | | | | | | | | | | | | | |
Class S Shares | | | | | | | | | | | | | | | |
For a share outstanding during the year ended June 30 | | 2022 | | | 2021 | | | 2020 | | | 2019 | | | 2018 | |
| Net Asset Value, Beginning of Period | | $10.11 | | | $9.46 | | | $9.91 | | | $9.67 | | | $9.84 | |
| Income/(Loss) from Investment Operations: | | | | | | | | | | | | | | | |
| | Net investment income/(loss)(1) | | 0.32 | | | 0.39 | | | 0.39 | | | 0.43 | | | 0.40 | |
| | Net realized and unrealized gain/(loss) | | (1.34) | | | 0.67 | | | (0.37) | | | 0.27 | | | (0.09) | |
| Total from Investment Operations | | (1.02) | | | 1.06 | | | 0.02 | | | 0.70 | | | 0.31 | |
| Less Dividends and Distributions: | | | | | | | | | | | | | | | |
| | Dividends (from net investment income) | | (0.33) | | | (0.41) | | | (0.39) | | | (0.46) | | | (0.42) | |
| | Distributions (from capital gains) | | (0.03) | | | — | | | (0.05) | | | — | | | (0.06) | |
| | Return of capital | | —(2) | | | — | | | (0.03) | | | — | | | — | |
| Total Dividends and Distributions | | (0.36) | | | (0.41) | | | (0.47) | | | (0.46) | | | (0.48) | |
| Net Asset Value, End of Period | | $8.73 | | | $10.11 | | | $9.46 | | | $9.91 | | | $9.67 | |
| Total Return* | | (10.30)% | | | 11.32%(3) | | | 0.19% | | | 7.51% | | | 3.12% | |
| Net Assets, End of Period (in thousands) | | $1,202 | | | $745 | | | $987 | | | $652 | | | $1,228 | |
| Average Net Assets for the Period (in thousands) | | $890 | | | $898 | | | $775 | | | $908 | | | $1,181 | |
| Ratios to Average Net Assets**: | | | | | | | | | | | | | | | |
| | Ratio of Gross Expenses | | 1.45% | | | 1.33% | | | 1.43% | | | 1.36% | | | 1.37% | |
| | Ratio of Net Expenses (After Waivers and Expense Offsets) | | 1.15% | | | 0.98% | | | 1.03% | | | 0.89% | | | 1.07% | |
| | Ratio of Net Investment Income/(Loss) | | 3.33% | | | 3.88% | | | 4.05% | | | 4.47% | | | 4.13% | |
| Portfolio Turnover Rate(4) | | 75% | | | 119% | | | 188% | | | 142% | | | 194% | |
| | | | | | | | | | | | | | | | | | | |
| |
* Total return includes adjustments in accordance with generally accepted accounting principles required at the year or period end and are not annualized for periods of less than one full year. ** Annualized for periods of less than one full year. (1) Per share amounts are calculated based on average shares outstanding during the year or period. (2) Less than $0.005 on a per share basis. (3) 0.01% of the Fund’s total return consists of a voluntary reimbursement by the Adviser for realized investment losses and another 0.04% consists of a gain on an investment not meeting the investment guidelines of the Fund. Excluding these items, total return would have been 11.27%. (4) Portfolio Turnover Rate excludes TBA (to be announced) purchase and sales commitments. |
| | |
See Notes to Financial Statements. |
| |
Janus Investment Fund | 39 |
Janus Henderson Multi-Sector Income Fund
Financial Highlights
| | | | | | | | | | | | | | | | | | | |
Class T Shares | | | | | | | | | | | | | | | |
For a share outstanding during the year ended June 30 | | 2022 | | | 2021 | | | 2020 | | | 2019 | | | 2018 | |
| Net Asset Value, Beginning of Period | | $10.12 | | | $9.47 | | | $9.89 | | | $9.66 | | | $9.83 | |
| Income/(Loss) from Investment Operations: | | | | | | | | | | | | | | | |
| | Net investment income/(loss)(1) | | 0.34 | | | 0.40 | | | 0.41 | | | 0.42 | | | 0.41 | |
| | Net realized and unrealized gain/(loss) | | (1.34) | | | 0.67 | | | (0.35) | | | 0.25 | | | (0.09) | |
| Total from Investment Operations | | (1.00) | | | 1.07 | | | 0.06 | | | 0.67 | | | 0.32 | |
| Less Dividends and Distributions: | | | | | | | | | | | | | | | |
| | Dividends (from net investment income) | | (0.36) | | | (0.42) | | | (0.40) | | | (0.44) | | | (0.43) | |
| | Distributions (from capital gains) | | (0.03) | | | — | | | (0.05) | | | — | | | (0.06) | |
| | Return of capital | | —(2) | | | — | | | (0.03) | | | — | | | — | |
| Total Dividends and Distributions | | (0.39) | | | (0.42) | | | (0.48) | | | (0.44) | | | (0.49) | |
| Net Asset Value, End of Period | | $8.73 | | | $10.12 | | | $9.47 | | | $9.89 | | | $9.66 | |
| Total Return* | | (10.12)% | | | 11.47%(3) | | | 0.67% | | | 7.17% | | | 3.26% | |
| Net Assets, End of Period (in thousands) | | $159,043 | | | $229,774 | | | $285,912 | | | $149,662 | | | $75,614 | |
| Average Net Assets for the Period (in thousands) | | $202,714 | | | $291,205 | | | $250,371 | | | $105,637 | | | $47,107 | |
| Ratios to Average Net Assets**: | | | | | | | | | | | | | | | |
| | Ratio of Gross Expenses | | 0.84% | | | 0.85% | | | 0.86% | | | 0.98% | | | 1.06% | |
| | Ratio of Net Expenses (After Waivers and Expense Offsets) | | 0.83% | | | 0.83% | | | 0.86% | | | 0.95% | | | 0.94% | |
| | Ratio of Net Investment Income/(Loss) | | 3.50% | | | 4.01% | | | 4.27% | | | 4.42% | | | 4.26% | |
| Portfolio Turnover Rate(4) | | 75% | | | 119% | | | 188% | | | 142% | | | 194% | |
| | | | | | | | | | | | | | | | | | | |
| |
* Total return includes adjustments in accordance with generally accepted accounting principles required at the year or period end and are not annualized for periods of less than one full year. ** Annualized for periods of less than one full year. (1) Per share amounts are calculated based on average shares outstanding during the year or period. (2) Less than $0.005 on a per share basis. (3) 0.01% of the Fund’s total return consists of a voluntary reimbursement by the Adviser for realized investment losses and another 0.04% consists of a gain on an investment not meeting the investment guidelines of the Fund. Excluding these items, total return would have been 11.42%. (4) Portfolio Turnover Rate excludes TBA (to be announced) purchase and sales commitments. |
| | |
See Notes to Financial Statements. |
| |
40 | JUNE 30, 2022 |
Janus Henderson Multi-Sector Income Fund
Notes to Financial Statements
1. Organization and Significant Accounting Policies
Janus Henderson Multi-Sector Income Fund (the “Fund”) is a series of Janus Investment Fund (the “Trust”), which is organized as a Massachusetts business trust and is registered under the Investment Company Act of 1940, as amended (the “1940 Act”), as an open-end management investment company, and therefore has applied the specialized accounting and reporting guidance in Financial Accounting Standards Board (“FASB”) Accounting Standards Codification (“ASC”) Topic 946. The Trust offers 38 funds, each of which offers multiple share classes, with differing investment objectives and policies. The Fund seeks high current income with a secondary focus on capital appreciation. The Fund is classified as diversified, as defined in the 1940 Act. Janus Henderson Investors US LLC (formerly Janus Capital Management LLC) is the investment adviser (the “Adviser”) to the Fund.
The Fund offers multiple classes of shares in order to meet the needs of various types of investors. Each class represents an interest in the same portfolio of investments. Certain financial intermediaries may not offer all classes of shares.
Shareholders, including individuals, accounts, as well as the Fund’s portfolio manager(s) and/or investment personnel, may from time to time own (beneficially or of record) a significant percentage of the Fund’s Shares and can be considered to “control” the Fund when that ownership exceeds 25% of the Fund’s assets (and which may differ from control as determined in accordance with United States of America generally accepted accounting principles ("US GAAP")).
Class A Shares are offered through financial intermediary platforms including, but not limited to, traditional brokerage platforms, mutual fund wrap fee programs, bank trust platforms, and retirement platforms.
Class C Shares are offered through financial intermediary platforms including, but not limited to, traditional brokerage platforms, mutual fund wrap fee programs, and bank trust platforms.
Class C Shares are closed to investments by new employer-sponsored retirement plans and existing employer-sponsored retirement plans are no longer able to make additional purchases or exchanges into Class C Shares.
The Funds currently implement an automatic conversion feature pursuant to which Class C Shares that have been held for eight years are automatically converted to Class A Shares without the imposition of any sales charge, fee or other charge. The conversion will generally occur no later than ten business days in the month following the month of the eighth anniversary of the date of purchase. Class C Shares purchased through the reinvestment of dividends and other distributions on Class C Shares will convert to Class A Shares at the same time as the original Class C Shares with respect to which they were purchased. For Class C Shares held in omnibus accounts on intermediary platforms, the Fund will rely on these intermediaries to implement this conversion feature. Your financial intermediary may have separate policies and procedures as to when and how Class C Shares may be converted to Class A Shares. Please contact your financial intermediary for additional information.
Effective July 6, 2020, Class D Shares are available to new investors, subject to any closed fund policies for a Fund, as applicable. Previously, Class D Shares were only available to investors who already had a direct account with the Janus Henderson funds; immediate family members or members of the same household of an eligible individual investor; and existing beneficial owners of sole proprietorships or partnerships that hold accounts directly with the Janus Henderson funds.
Class I Shares are available through certain financial intermediary platforms including, but not limited to, mutual fund wrap fee programs, managed account programs, asset allocation programs, bank trust platforms, as well as certain retirement platforms. Class I Shares are also available to certain direct institutional investors including, but not limited to, corporations, certain retirement plans, public plans, and foundations/endowments, who established Class I Share accounts before August 4, 2017.
Class N Shares are generally available only to financial intermediaries purchasing on behalf of: 1) certain adviser-assisted, employer-sponsored retirement plans, including 401(k) plans, 457 plans, 403(b) plans, Taft-Hartley multi-employer plans, profit-sharing and money purchase pension plans, defined benefit plans and certain welfare benefit plans, such as health savings accounts, and nonqualified deferred compensation plans; and 2) retail investors purchasing in qualified or nonqualified accounts, whose accounts are held through an omnibus account at their financial intermediary, and where the financial intermediary requires no payment or reimbursement from the Fund, the Adviser, or its affiliates. Class N Shares are also available to Janus Henderson proprietary products and to certain direct
Janus Henderson Multi-Sector Income Fund
Notes to Financial Statements
institutional investors approved by Janus Henderson Distributors US LLC (formerly Janus Distributors LLC) (the “Distributor”) including, but not limited to, corporations, certain retirement plans, public plans, and foundations and endowments, subject to minimum investment requirements.
Class S Shares are offered through financial intermediary platforms including, but not limited to, retirement platforms and asset allocation, mutual fund wrap, or other discretionary or nondiscretionary fee-based investment advisory programs. In addition, Class S Shares may be available through certain financial intermediaries who have an agreement with the Adviser or its affiliates to offer Class S Shares on their supermarket platforms.
Class T Shares are available through certain financial intermediary platforms including, but not limited to, mutual fund wrap fee programs, managed account programs, asset allocation programs, bank trust platforms, as well as certain retirement platforms. In addition, Class T Shares may be available through certain financial intermediaries who have an agreement with the Adviser or its affiliates to offer Class T Shares on their supermarket platforms.
The following accounting policies have been followed by the Fund and are in conformity with United States of America generally accepted accounting principles ("US GAAP").
Investment Valuation
Securities held by the Fund are valued in accordance with policies and procedures established by and under the supervision of the Trustees (the “Valuation Procedures”). Equity securities traded on a domestic securities exchange are generally valued at the closing prices on the primary market or exchange on which they trade. If such price is lacking for the trading period immediately preceding the time of determination, such securities are generally valued at their current bid price. Equity securities that are traded on a foreign exchange are generally valued at the closing prices on such markets. In the event that there is no current trading volume on a particular security in such foreign exchange, the bid price from the primary exchange is generally used to value the security. Securities that are traded on the over-the-counter (“OTC”) markets are generally valued at their closing or latest bid prices as available. Foreign securities and currencies are converted to U.S. dollars using the applicable exchange rate in effect at the close of the New York Stock Exchange (“NYSE”). The Fund will determine the market value of individual securities held by it by using prices provided by one or more approved professional pricing services or, as needed, by obtaining market quotations from independent broker-dealers. Most debt securities are valued in accordance with the evaluated bid price supplied by the pricing service that is intended to reflect market value. The evaluated bid price supplied by the pricing service is an evaluation that may consider factors such as security prices, yields, maturities and ratings. Certain short-term securities maturing within 60 days or less may be evaluated and valued on an amortized cost basis provided that the amortized cost determined approximates market value. Securities for which market quotations or evaluated prices are not readily available or deemed unreliable are valued at fair value determined in good faith under the Valuation Procedures. Circumstances in which fair value pricing may be utilized include, but are not limited to: (i) a significant event that may affect the securities of a single issuer, such as a merger, bankruptcy, or significant issuer-specific development; (ii) an event that may affect an entire market, such as a natural disaster or significant governmental action; (iii) a nonsignificant event such as a market closing early or not opening, or a security trading halt; and (iv) pricing of a nonvalued security and a restricted or nonpublic security. Special valuation considerations may apply with respect to “odd-lot” fixed-income transactions which, due to their small size, may receive evaluated prices by pricing services which reflect a large block trade and not what actually could be obtained for the odd-lot position. The Fund uses systematic fair valuation models provided by independent third parties to value international equity securities in order to adjust for stale pricing, which may occur between the close of certain foreign exchanges and the close of the NYSE.
Valuation Inputs Summary
FASB ASC 820, Fair Value Measurements and Disclosures (“ASC 820”), defines fair value, establishes a framework for measuring fair value, and expands disclosure requirements regarding fair value measurements. This standard emphasizes that fair value is a market-based measurement that should be determined based on the assumptions that market participants would use in pricing an asset or liability and establishes a hierarchy that prioritizes inputs to valuation techniques used to measure fair value. These inputs are summarized into three broad levels:
Level 1 – Unadjusted quoted prices in active markets the Fund has the ability to access for identical assets or liabilities.
Level 2 – Observable inputs other than unadjusted quoted prices included in Level 1 that are observable for the asset or liability either directly or indirectly. These inputs may include quoted prices for the identical instrument on
Janus Henderson Multi-Sector Income Fund
Notes to Financial Statements
an inactive market, prices for similar instruments, interest rates, prepayment speeds, credit risk, yield curves, default rates and similar data.
Assets or liabilities categorized as Level 2 in the hierarchy generally include: debt securities fair valued in accordance with the evaluated bid or ask prices supplied by a pricing service; securities traded on OTC markets and listed securities for which no sales are reported that are fair valued at the latest bid price (or yield equivalent thereof) obtained from one or more dealers transacting in a market for such securities or by a pricing service approved by the Fund’s Trustees; certain short-term debt securities with maturities of 60 days or less that are fair valued at amortized cost; and equity securities of foreign issuers whose fair value is determined by using systematic fair valuation models provided by independent third parties in order to adjust for stale pricing which may occur between the close of certain foreign exchanges and the close of the NYSE. Other securities that may be categorized as Level 2 in the hierarchy include, but are not limited to, preferred stocks, bank loans, swaps, investments in unregistered investment companies, options, and forward contracts.
Level 3 – Unobservable inputs for the asset or liability to the extent that relevant observable inputs are not available, representing the Fund’s own assumptions about the assumptions that a market participant would use in valuing the asset or liability, and that would be based on the best information available.
There have been no significant changes in valuation techniques used in valuing any such positions held by the Fund since the beginning of the fiscal year.
The inputs or methodology used for fair valuing securities are not necessarily an indication of the risk associated with investing in those securities. The summary of inputs used as of June 30, 2022 to fair value the Fund’s investments in securities and other financial instruments is included in the “Valuation Inputs Summary” in the Notes to Schedule of Investments and Other Information.
The Fund did not hold a significant amount of Level 3 securities as of June 30, 2022.
Investment Transactions and Investment Income
Investment transactions are accounted for as of the date purchased or sold (trade date). Dividend income is recorded on the ex-dividend date. Certain dividends from foreign securities will be recorded as soon as the Fund is informed of the dividend, if such information is obtained subsequent to the ex-dividend date. Dividends from foreign securities may be subject to withholding taxes in foreign jurisdictions. Non-cash dividends, if any, are recorded on the ex-dividend date at fair value. Interest income is recorded daily on the accrual basis and includes amortization of premiums and accretion of discounts. The Fund classifies gains and losses on prepayments received as an adjustment to interest income. Debt securities may be placed in non-accrual status and related interest income may be reduced by stopping current accruals and writing off interest receivables when collection of all or a portion of interest has become doubtful. Gains and losses are determined on the identified cost basis, which is the same basis used for federal income tax purposes. Income, as well as gains and losses, both realized and unrealized, are allocated daily to each class of shares based upon the ratio of net assets represented by each class as a percentage of total net assets.
Expenses
The Fund bears expenses incurred specifically on its behalf. Each class of shares bears a portion of general expenses, which are allocated daily to each class of shares based upon the ratio of net assets represented by each class as a percentage of total net assets. Expenses directly attributable to a specific class of shares are charged against the operations of such class.
Estimates
The preparation of financial statements in conformity with US GAAP requires management to make estimates and assumptions that affect the reported amount of assets and liabilities and disclosure of contingent assets and liabilities at the date of the financial statements, and the reported amounts of income and expenses during the reporting period. Actual results could differ from those estimates.
Indemnifications
In the normal course of business, the Fund may enter into contracts that contain provisions for indemnification of other parties against certain potential liabilities. The Fund’s maximum exposure under these arrangements is unknown, and would involve future claims that may be made against the Fund that have not yet occurred. Currently, the risk of material loss from such claims is considered remote.
Janus Henderson Multi-Sector Income Fund
Notes to Financial Statements
Foreign Currency Translations
The Fund does not isolate that portion of the results of operations resulting from the effect of changes in foreign exchange rates on investments from the fluctuations arising from changes in market prices of securities held at the date of the financial statements. Net unrealized appreciation or depreciation of investments and foreign currency translations arise from changes in the value of assets and liabilities, including investments in securities held at the date of the financial statements, resulting from changes in the exchange rates and changes in market prices of securities held.
Currency gains and losses are also calculated on payables and receivables that are denominated in foreign currencies. The payables and receivables are generally related to foreign security transactions and income translations.
Foreign currency-denominated assets and forward currency contracts may involve more risks than domestic transactions, including currency risk, counterparty risk, political and economic risk, regulatory risk and equity risk. Risks may arise from unanticipated movements in the value of foreign currencies relative to the U.S. dollar.
Dividends and Distributions
Dividends are declared daily and distributed monthly for the Fund. Realized capital gains, if any, are declared and distributed in December. The Fund may treat a portion of the amount paid to redeem shares as a distribution of investment company taxable income and realized capital gains that are reflected in the net asset value. This practice, commonly referred to as “equalization,” has no effect on the redeeming shareholder or a Fund’s total return, but may reduce the amounts that would otherwise be required to be paid as taxable dividends to the remaining shareholders. It is possible that the Internal Revenue Service (IRS) could challenge the Fund's equalization methodology or calculations, and any such challenge could result in additional tax, interest, or penalties to be paid by the Fund.
The Fund may make certain investments in real estate investment trusts (“REITs”) which pay dividends to their shareholders based upon funds available from operations. It is quite common for these dividends to exceed the REITs’ taxable earnings and profits, resulting in the excess portion of such dividends being designated as a return of capital. If the Fund distributes such amounts, such distributions could constitute a return of capital to shareholders for federal income tax purposes.
Federal Income Taxes
The Fund intends to continue to qualify as a regulated investment company and distribute all of its taxable income in accordance with the requirements of Subchapter M of the Internal Revenue Code. Management has analyzed the Fund’s tax positions taken for all open federal income tax years, generally a three-year period, and has concluded that no provision for federal income tax is required in the Fund’s financial statements. The Fund is not aware of any tax positions for which it is reasonably possible that the total amounts of unrecognized tax benefits will significantly change in the next twelve months.
2. Derivative Instruments
The Fund may invest in various types of derivatives, which may at times result in significant derivative exposure. A derivative is a financial instrument whose performance is derived from the performance of another asset. The Fund may invest in derivative instruments including, but not limited to: futures contracts, put options, call options, options on futures contracts, options on foreign currencies, options on recovery locks, options on security and commodity indices, swaps, forward contracts, structured investments, and other equity-linked derivatives. Each derivative instrument that was held by the Fund during the year ended June 30, 2022 is discussed in further detail below. A summary of derivative activity by the Fund is reflected in the tables at the end of the Schedule of Investments.
The Fund may use derivative instruments for hedging purposes (to offset risks associated with an investment, currency exposure, or market conditions), to adjust currency exposure relative to a benchmark index, or for speculative purposes (to earn income and seek to enhance returns). When the Fund invests in a derivative for speculative purposes, the Fund will be fully exposed to the risks of loss of that derivative, which may sometimes be greater than the derivative’s cost. The Fund may not use any derivative to gain exposure to an asset or class of assets that it would be prohibited by its investment restrictions from purchasing directly. The Fund’s ability to use derivative instruments may also be limited by tax considerations.
Investments in derivatives in general are subject to market risks that may cause their prices to fluctuate over time. Investments in derivatives may not directly correlate with the price movements of the underlying instrument. As a result, the use of derivatives may expose the Fund to additional risks that it would not be subject to if it invested directly in the
Janus Henderson Multi-Sector Income Fund
Notes to Financial Statements
securities underlying those derivatives. The use of derivatives may result in larger losses or smaller gains than otherwise would be the case. Derivatives can be volatile and may involve significant risks.
In pursuit of its investment objective, the Fund may seek to use derivatives to increase or decrease exposure to the following market risk factors:
· Commodity Risk – the risk related to the change in value of commodities or commodity-linked investments due to changes in the overall market movements, volatility of the underlying benchmark, changes in interest rates, or other factors affecting a particular industry or commodity such as drought, floods, weather, livestock disease, embargoes, tariffs, and international economic, political, and regulatory developments.
· Counterparty Risk – the risk that the counterparty (the party on the other side of the transaction) on a derivative transaction will be unable to honor its financial obligation to the Fund.
· Credit Risk – the risk an issuer will be unable to make principal and interest payments when due, or will default on its obligations.
· Currency Risk – the risk that changes in the exchange rate between currencies will adversely affect the value (in U.S. dollar terms) of an investment.
· Equity Risk – the risk related to the change in value of equity securities as they relate to increases or decreases in the general market.
· Index Risk – if the derivative is linked to the performance of an index, it will be subject to the risks associated with changes in that index. If the index changes, the Fund could receive lower interest payments or experience a reduction in the value of the derivative to below what the Fund paid. Certain indexed securities, including inverse securities (which move in an opposite direction to the index), may create leverage, to the extent that they increase or decrease in value at a rate that is a multiple of the changes in the applicable index.
· Interest Rate Risk – the risk that the value of fixed-income securities will generally decline as prevailing interest rates rise, which may cause the Fund’s NAV to likewise decrease.
· Leverage Risk – the risk associated with certain types of leveraged investments or trading strategies pursuant to which relatively small market movements may result in large changes in the value of an investment. The Fund creates leverage by investing in instruments, including derivatives, where the investment loss can exceed the original amount invested. Certain investments or trading strategies, such as short sales, that involve leverage can result in losses that greatly exceed the amount originally invested.
· Liquidity Risk – the risk that certain securities may be difficult or impossible to sell at the time that the seller would like or at the price that the seller believes the security is currently worth.
Derivatives may generally be traded OTC or on an exchange. Derivatives traded OTC are agreements that are individually negotiated between parties and can be tailored to meet a purchaser’s needs. OTC derivatives are not guaranteed by a clearing agency and may be subject to increased credit risk.
In an effort to mitigate credit risk associated with derivatives traded OTC, the Fund may enter into collateral agreements with certain counterparties whereby, subject to certain minimum exposure requirements, the Fund may require the counterparty to post collateral if the Fund has a net aggregate unrealized gain on all OTC derivative contracts with a particular counterparty. Additionally, the Fund may deposit cash and/or treasuries as collateral with the counterparty and/or custodian daily (based on the daily valuation of the financial asset) if the Fund has a net aggregate unrealized loss on OTC derivative contracts with a particular counterparty. All liquid securities and restricted cash are considered to cover in an amount at all times equal to or greater than the Fund’s commitment with respect to certain exchange-traded derivatives, centrally cleared derivatives, forward foreign currency exchange contracts, short sales, and/or securities with extended settlement dates. There is no guarantee that counterparty exposure is reduced and these arrangements are dependent on the Adviser’s ability to establish and maintain appropriate systems and trading.
Forward Foreign Currency Exchange Contracts
A forward foreign currency exchange contract (“forward currency contract”) is an obligation to buy or sell a specified currency at a future date at a negotiated rate (which may be U.S. dollars or a foreign currency). The Fund may enter into forward currency contracts for hedging purposes, including, but not limited to, reducing exposure to changes in foreign
Janus Henderson Multi-Sector Income Fund
Notes to Financial Statements
currency exchange rates on foreign portfolio holdings and locking in the U.S. dollar cost of firm purchase and sale commitments for securities denominated in or exposed to foreign currencies. The Fund may also invest in forward currency contracts for non-hedging purposes such as seeking to enhance returns. The Fund is subject to currency risk and counterparty risk in the normal course of pursuing its investment objective through its investments in forward currency contracts.
Forward currency contracts are valued by converting the foreign value to U.S. dollars by using the current spot U.S. dollar exchange rate and/or forward rate for that currency. Exchange and forward rates as of the close of the NYSE are used to value the forward currency contracts. The unrealized appreciation/(depreciation) for forward currency contracts is reported in the Statement of Assets and Liabilities as a receivable or payable and in the Statement of Operations for the change in unrealized net appreciation/depreciation (if applicable). The realized gain or loss arising from the difference between the U.S. dollar cost of the original contract and the value of the foreign currency in U.S. dollars upon closing a forward currency contract is reported on the Statement of Operations (if applicable).
During the year, the Fund entered into forward currency contracts with the obligation to purchase foreign currencies in the future at an agreed upon rate in order to decrease exposure to currency risk associated with foreign currency denominated securities held by the Fund.
During the year, the Fund entered into forward currency contracts with the obligation to sell foreign currencies in the future at an agreed upon rate in order to decrease exposure to currency risk associated with foreign currency denominated securities held by the Fund.
Futures Contracts
A futures contract is an exchange-traded agreement to take or make delivery of an underlying asset at a specific time in the future for a specific predetermined negotiated price. The Fund may enter into futures contracts to gain exposure to the stock market or other markets pending investment of cash balances or to meet liquidity needs. The Fund is subject to interest rate risk, equity risk, and currency risk in the normal course of pursuing its investment objective through its investments in futures contracts. The Fund may also use such derivative instruments to hedge or protect from adverse movements in securities prices, currency rates or interest rates. The use of futures contracts may involve risks such as the possibility of illiquid markets or imperfect correlation between the values of the contracts and the underlying securities, or that the counterparty will fail to perform its obligations.
Futures contracts are valued at the settlement price on valuation date on the exchange as reported by an approved vendor. Mini contracts, as defined in the description of the contract, shall be valued using the Actual Settlement Price or “ASET” price type as reported by an approved vendor. In the event that foreign futures trade when the foreign equity markets are closed, the last foreign futures trade price shall be used. Futures contracts are marked-to-market daily, and the daily variation margin is recorded as a receivable or payable on the Statement of Assets and Liabilities (if applicable). The change in unrealized net appreciation/depreciation is reported on the Statement of Operations (if applicable). When a contract is closed, a realized gain or loss is reported on the Statement of Operations (if applicable), equal to the difference between the opening and closing value of the contract. Securities held by the Fund that are designated as collateral for market value on futures contracts are noted on the Schedule of Investments (if applicable). Such collateral is in the possession of the Fund’s futures commission merchant.
With futures, there is minimal counterparty credit risk to the Fund since futures are exchange-traded and the exchange’s clearinghouse, as counterparty to all exchange-traded futures, guarantees the futures against default.
During the year, the Fund purchased interest rate futures to increase exposure to interest rate risk.
During the year, the Fund sold interest rate futures to decrease exposure to interest rate risk.
Swaps
Swap agreements are two-party contracts entered into primarily by institutional investors for periods ranging from a day to more than one year to exchange one set of cash flows for another. The most significant factor in the performance of swap agreements is the change in value of the specific index, security, or currency, or other factors that determine the amounts of payments due to and from the Fund. The use of swaps is a highly specialized activity which involves investment techniques and risks different from those associated with ordinary portfolio securities transactions. Swap transactions may in some instances involve the delivery of securities or other underlying assets by the Fund or its counterparty to collateralize obligations under the swap. If the other party to a swap that is not collateralized defaults, the Fund would risk the loss of the net amount of the payments that it contractually is entitled to receive. Swap
Janus Henderson Multi-Sector Income Fund
Notes to Financial Statements
agreements entail the risk that a party will default on its payment obligations to the Fund. If the other party to a swap defaults, the Fund would risk the loss of the net amount of the payments that it contractually is entitled to receive. If the Fund utilizes a swap at the wrong time or judges market conditions incorrectly, the swap may result in a loss to the Fund and reduce the Fund’s total return.
Swap agreements also bear the risk that the Fund will not be able to meet its obligation to the counterparty. Swap agreements are typically privately negotiated and entered into in the OTC market. However, certain swap agreements are required to be cleared through a clearinghouse and traded on an exchange or swap execution facility. Swaps that are required to be cleared are required to post initial and variation margins in accordance with the exchange requirements. Regulations enacted require the Fund to centrally clear certain interest rate and credit default index swaps through a clearinghouse or central counterparty (“CCP”). To clear a swap with a CCP, the Fund will submit the swap to, and post collateral with, a futures clearing merchant (“FCM”) that is a clearinghouse member. Alternatively, the Fund may enter into a swap with a financial institution other than the FCM (the “Executing Dealer”) and arrange for the swap to be transferred to the FCM for clearing. The Fund may also enter into a swap with the FCM itself. The CCP, the FCM, and the Executing Dealer are all subject to regulatory oversight by the U.S. Commodity Futures Trading Commission (“CFTC”). A default or failure by a CCP or an FCM, or the failure of a swap to be transferred from an Executing Dealer to the FCM for clearing, may expose the Fund to losses, increase its costs, or prevent the Fund from entering or exiting swap positions, accessing collateral, or fully implementing its investment strategies. The regulatory requirement to clear certain swaps could, either temporarily or permanently, reduce the liquidity of cleared swaps or increase the costs of entering into those swaps.
Index swaps, interest rate swaps, inflation swaps and credit default swaps are valued using an approved vendor supplied price. Basket swaps are valued using a broker supplied price. Equity swaps that consist of a single underlying equity are valued either at the closing price, the latest bid price, or the last sale price on the primary market or exchange it trades. The market value of swap contracts are aggregated by positive and negative values and are disclosed separately as an asset or liability on the Fund’s Statement of Assets and Liabilities (if applicable). Realized gains and losses are reported on the Fund’s Statement of Operations (if applicable). The change in unrealized net appreciation or depreciation during the year is included in the Statement of Operations (if applicable).
The Fund’s maximum risk of loss from counterparty risk or credit risk is the discounted value of the payments to be received from/paid to the counterparty over the contract’s remaining life, to the extent that the amount is positive. The risk is mitigated by having a netting arrangement between the Fund and the counterparty and by the posting of collateral by the counterparty to cover the Fund’s exposure to the counterparty.
The Fund may enter into various types of credit default swap agreements, including OTC credit default swap agreements, for investment purposes, to add leverage to its Fund, or to hedge against widening credit spreads on high-yield/high-risk bonds. Credit default swaps are a specific kind of counterparty agreement that allow the transfer of third party credit risk from one party to the other. One party in the swap is a lender and faces credit risk from a third party, and the counterparty in the credit default swap agrees to insure this risk in exchange for regular periodic payments. Credit default swaps could result in losses if the Fund does not correctly evaluate the creditworthiness of the company or companies on which the credit default swap is based. Credit default swap agreements may involve greater risks than if the Fund had invested in the reference obligation directly since, in addition to risks relating to the reference obligation, credit default swaps are subject to illiquidity risk, counterparty risk, and credit risk. The Fund will generally incur a greater degree of risk when it sells a credit default swap than when it purchases a credit default swap. As a buyer of a credit default swap, the Fund may lose its investment and recover nothing should no credit event occur and the swap is held to its termination date. As seller of a credit default swap, if a credit event were to occur, the value of any deliverable obligation received by the Fund, coupled with the upfront or periodic payments previously received, may be less than what it pays to the buyer, resulting in a loss of value to the Fund.
As a buyer of credit protection, the Fund is entitled to receive the par (or other agreed-upon) value of a referenced debt obligation from the counterparty to the contract in the event of a default or other credit event by a third party, such as a U.S. or foreign issuer, on the debt obligation. In return, the Fund as buyer would pay to the counterparty a periodic stream of payments over the term of the contract provided that no credit event has occurred. If no credit event occurs, the Fund would have spent the stream of payments and potentially received no benefit from the contract.
If the Fund is the seller of credit protection against a particular security, the Fund would receive an up-front or periodic payment to compensate against potential credit events. As the seller in a credit default swap contract, the Fund would
Janus Henderson Multi-Sector Income Fund
Notes to Financial Statements
be required to pay the par value (the “notional value”) (or other agreed-upon value) of a referenced debt obligation to the counterparty in the event of a default by a third party, such as a U.S. or foreign corporate issuer, on the debt obligation. In return, the Fund would receive from the counterparty a periodic stream of payments over the term of the contract provided that no event of default has occurred. If no default occurs, the Fund would keep the stream of payments and would have no payment obligations. As the seller, the Fund would effectively add leverage to its portfolio because, in addition to its total net assets, the Fund would be subject to investment exposure on the notional value of the swap. The maximum potential amount of future payments (undiscounted) that the Fund as a seller could be required to make in a credit default transaction would be the notional amount of the agreement.
The Fund may invest in CDXs. A CDX is a swap on an index of credit default swaps. CDXs allow an investor to manage credit risk or take a position on a basket of credit entities (such as credit default swaps or commercial mortgage-backed securities) in a more efficient manner than transacting in a single-name CDS. If a credit event occurs in one of the underlying companies, the protection is paid out via the delivery of the defaulted bond by the buyer of protection in return for a payment of notional value of the defaulted bond by the seller of protection or it may be settled through a cash settlement between the two parties. The underlying company is then removed from the index. If the Fund holds a long position in a CDX, the Fund would indirectly bear its proportionate share of any expenses paid by a CDX. A Fund holding a long position in CDXs typically receives income from principal or interest paid on the underlying securities. By investing in CDXs, the Fund could be exposed to illiquidity risk, counterparty risk, and credit risk of the issuers of the underlying loan obligations and of the CDX markets. If there is a default by the CDX counterparty, the Fund will have contractual remedies pursuant to the agreements related to the transaction. CDXs also bear the risk that the Fund will not be able to meet its obligation to the counterparty.
During the year, the Fund sold protection via the credit default swap market in order to gain credit risk exposure to individual corporates, countries and/or credit indices where gaining this exposure via the cash bond market was less attractive.
During the year, the Fund purchased protection via the credit default swap market in order to reduce credit risk exposure to individual corporates, countries and/or credit indices where reducing this exposure via the cash bond market was less attractive.
The Fund’s use of interest rate swaps involves investment techniques and risks different from those associated with ordinary portfolio security transactions. Interest rate swaps do not involve the delivery of securities, other underlying assets, or principal. Interest rate swaps involve the exchange by two parties of their respective commitments to pay or receive interest (e.g., an exchange of floating rate payments for fixed rate payments). Interest rate swaps may result in potential losses if interest rates do not move as expected or if the counterparties are unable to satisfy their obligations. Interest rate swaps are generally entered into on a net basis. Accordingly, the risk of loss with respect to interest rate swaps is limited to the net amount of interest payments that the Fund is contractually obligated to make.
During the year, the Fund entered into interest rate swaps paying a fixed interest rate and receiving a floating interest rate in order to decrease interest rate risk (duration) exposure. As interest rates rise, the Fund benefits by receiving a higher expected future floating rate, while paying a fixed rate that has not increased.
There were no interest rate swaps held at June 30, 2022.
3. Other Investments and Strategies
Additional Investment Risk
The Fund may be invested in lower-rated debt securities that have a higher risk of default or loss of value since these securities may be sensitive to economic changes, political changes, or adverse developments specific to the issuer.
In response to the COVID-19 pandemic, the U.S. government and the Federal Reserve, as well as certain foreign governments and central banks, have taken extraordinary actions to support local and global economies and the financial markets, including reducing interest rates to record-low levels. Extremely low or negative interest rates may become more prevalent or may not work as intended. As there is little precedent for this situation, the impact on various markets that interest rate or other significant policy changes may have is unknown. The withdrawal of this support, a failure of measures put in place in response to such economic uncertainty, or investor perception that such efforts were not sufficient could each negatively affect financial markets generally, and the value and liquidity of specific securities.
Janus Henderson Multi-Sector Income Fund
Notes to Financial Statements
In addition, policy and legislative changes in the United States and in other countries continue to impact many aspects of financial regulation.
Widespread disease, including pandemics and epidemics, and natural or environmental disasters, including those which may be attributable to global climate change, such as earthquakes, fires, floods, hurricanes, tsunamis and weather-related phenomena generally, have been and can be highly disruptive to economies and markets, adversely impacting individual companies, sectors, industries, markets, currencies, interest and inflation rates, credit ratings, investor sentiment, and other factors affecting the value of a Fund’s investments. Economies and financial markets throughout the world have become increasingly interconnected, which increases the likelihood that events or conditions in one region or country will adversely affect markets or issuers in other regions or countries, including the United States. These disruptions could prevent a Fund from executing advantageous investment decisions in a timely manner and negatively impact a Fund’s ability to achieve its investment objective(s). Any such event(s) could have a significant adverse impact on the value of a Fund. In addition, these disruptions could also impair the information technology and other operational systems upon which the Fund’s service providers, including the Adviser or the subadviser (as applicable), rely, and could otherwise disrupt the ability of employees of the Fund’s service providers to perform essential tasks on behalf of the Fund. Adverse weather conditions may also have a particularly significant negative effect on issuers in the agricultural sector and on insurance and reinsurance companies that insure or reinsure against the impact of natural disasters.
A number of countries in the European Union (the “EU”) have experienced, and may continue to experience, severe economic and financial difficulties. In particular, many EU nations are susceptible to economic risks associated with high levels of debt. Many non-governmental issuers, and even certain governments, have defaulted on, or been forced to restructure, their debts. Many other issuers have faced difficulties obtaining credit or refinancing existing obligations. Financial institutions have in many cases required government or central bank support, have needed to raise capital, and/or have been impaired in their ability to extend credit. As a result, financial markets in the EU have experienced extreme volatility and declines in asset values and liquidity. These difficulties may continue, worsen, or spread further within the EU. Responses to these financial problems by European governments, central banks, and others, including austerity measures and reforms, may not work, may result in social unrest, and may limit future growth and economic recovery or have other unintended consequences. Among other things, these developments have adversely affected the value and exchange rate of the euro and pound sterling, and may continue to significantly affect the economies of all EU countries, which in turn may have a material adverse effect on the Fund’s investments in such countries, other countries that depend on EU countries for significant amounts of trade or investment, or issuers with exposure to debt issued by certain EU countries.
LIBOR Replacement Risk
The Fund may invest in certain debt securities, derivatives or other financial instruments that utilize the London Interbank Offered Rate (“LIBOR”) or other interbank offered rates as a reference rate for various rate calculations. The U.K. Financial Conduct Authority has announced that it intends to stop compelling or inducing banks to submit rates for many LIBOR settings after December 31, 2021, and for certain other commonly used U.S. dollar LIBOR settings after June 30, 2023. The elimination of LIBOR or other reference rates and the transition process away from LIBOR could adversely impact (i) volatility and liquidity in markets that are tied to those reference rates, (ii) the market for, or value of, specific securities or payments linked to those reference rates, (iii) availability or terms of borrowing or refinancing, or (iv) the effectiveness of hedging strategies. For these and other reasons, the elimination of LIBOR or changes to other reference rates may adversely affect the Fund’s performance and/or net asset value. Alternatives to LIBOR are established or in development in most major currencies, including the Secured Overnight Financing Rate (“SOFR”) that is intended to replace the U.S. dollar LIBOR. The effect of the discontinuation of, LIBOR or other reference rates will depend on (1) existing fallback or termination provisions in individual contracts and (2) whether, how, and when industry participants develop and adopt new reference rates and fallbacks for both legacy and new products and instruments. Accordingly, it is difficult to predict the full impact of the transition away from LIBOR or other reference rates on the Fund until new reference rates and fallbacks for both legacy and new products, instruments and contracts are commercially accepted.
Counterparties
Fund transactions involving a counterparty are subject to the risk that the counterparty or a third party will not fulfill its obligation to the Fund (“counterparty risk”). Counterparty risk may arise because of the counterparty’s financial condition (i.e., financial difficulties, bankruptcy, or insolvency), market activities and developments, or other reasons, whether
Janus Henderson Multi-Sector Income Fund
Notes to Financial Statements
foreseen or not. A counterparty’s inability to fulfill its obligation may result in significant financial loss to the Fund. The Fund may be unable to recover its investment from the counterparty or may obtain a limited recovery, and/or recovery may be delayed. The extent of the Fund’s exposure to counterparty risk with respect to financial assets and liabilities approximates its carrying value. See the "Offsetting Assets and Liabilities" section of this Note for further details.
The Fund may be exposed to counterparty risk through participation in various programs, including, but not limited to, lending its securities to third parties, cash sweep arrangements whereby the Fund’s cash balance is invested in one or more types of cash management vehicles, as well as investments in, but not limited to, repurchase agreements, debt securities, and derivatives, including various types of swaps, futures and options. The Fund intends to enter into financial transactions with counterparties that the Adviser believes to be creditworthy at the time of the transaction. There is always the risk that the Adviser’s analysis of a counterparty’s creditworthiness is incorrect or may change due to market conditions. To the extent that the Fund focuses its transactions with a limited number of counterparties, it will have greater exposure to the risks associated with one or more counterparties.
Loans
The Fund may invest in various commercial loans, including bank loans, bridge loans, debtor-in-possession (“DIP”) loans, mezzanine loans, and other fixed and floating rate loans. These loans may be acquired through loan participations and assignments or on a when-issued basis. Commercial loans will comprise no more than 50% of the Fund’s total assets. Below are descriptions of the types of loans held by the Fund as of June 30, 2022.
· Bank Loans - Bank loans are obligations of companies or other entities entered into in connection with recapitalizations, acquisitions, and refinancings. The Fund’s investments in bank loans are generally acquired as a participation interest in, or assignment of, loans originated by a lender or other financial institution. These investments may include institutionally-traded floating and fixed-rate debt securities.
· Floating Rate Loans – Floating rate loans are debt securities that have floating interest rates, that adjust periodically, and are tied to a benchmark lending rate, such as London Interbank Offered Rate (“LIBOR”). In other cases, the lending rate could be tied to the prime rate offered by one or more major U.S. banks or the rate paid on large certificates of deposit traded in the secondary markets. If the benchmark lending rate changes, the rate payable to lenders under the loan will change at the next scheduled adjustment date specified in the loan agreement. Floating rate loans are typically issued to companies (‘‘borrowers’’) in connection with recapitalizations, acquisitions, and refinancings. Floating rate loan investments are generally below investment grade. Senior floating rate loans are secured by specific collateral of a borrower and are senior in the borrower’s capital structure. The senior position in the borrower’s capital structure generally gives holders of senior loans a claim on certain of the borrower’s assets that is senior to subordinated debt and preferred and common stock in the case of a borrower’s default. Floating rate loan investments may involve foreign borrowers, and investments may be denominated in foreign currencies. Floating rate loans often involve borrowers whose financial condition is troubled or uncertain and companies that are highly leveraged. The Fund may invest in obligations of borrowers who are in bankruptcy proceedings. While the Fund generally expects to invest in fully funded term loans, certain of the loans in which the Fund may invest include revolving loans, bridge loans, and delayed draw term loans.
Purchasers of floating rate loans may pay and/or receive certain fees. The Fund may receive fees such as covenant waiver fees or prepayment penalty fees. The Fund may pay fees such as facility fees. Such fees may affect the Fund’s return.
· Mezzanine Loans - Mezzanine loans are secured by the stock of the company that owns the assets. Mezzanine loans are a hybrid of debt and equity financing that is typically used to fund the expansion of existing companies. A mezzanine loan is composed of debt capital that gives the lender the right to convert to an ownership or equity interest in the company if the loan is not paid back in time and in full. Mezzanine loans typically are the most subordinated debt obligation in an issuer’s capital structure.
Mortgage- and Asset-Backed Securities
Mortgage- and asset-backed securities represent interests in “pools” of commercial or residential mortgages or other assets, including consumer and commercial loans or receivables. The Fund may purchase fixed or variable rate commercial or residential mortgage-backed securities issued by the Government National Mortgage Association (“Ginnie Mae”), the Federal National Mortgage Association (“Fannie Mae”), the Federal Home Loan Mortgage Corporation (“Freddie Mac”), or other governmental or government-related entities. Ginnie Mae’s guarantees are backed
Janus Henderson Multi-Sector Income Fund
Notes to Financial Statements
as to the timely payment of principal and interest by the full faith and credit of the U.S. Government. Fannie Mae and Freddie Mac securities are not backed by the full faith and credit of the U.S. Government. In September 2008, the Federal Housing Finance Agency (“FHFA”), an agency of the U.S. Government, placed Fannie Mae and Freddie Mac under conservatorship. Since that time, Fannie Mae and Freddie Mac have received capital support through U.S. Treasury preferred stock purchases and Treasury and Federal Reserve purchases of their mortgage-backed securities. The FHFA and the U.S. Treasury have imposed strict limits on the size of these entities’ mortgage portfolios. The FHFA has the power to cancel any contract entered into by Fannie Mae and Freddie Mac prior to FHFA’s appointment as conservator or receiver, including the guarantee obligations of Fannie Mae and Freddie Mac.
The Fund may also purchase other mortgage- and asset-backed securities through single- and multi-seller conduits, collateralized debt obligations, structured investment vehicles, and other similar securities. Asset-backed securities may be backed by various consumer obligations, including automobile loans, equipment leases, credit card receivables, or other collateral. In the event the underlying loans are not paid, the securities’ issuer could be forced to sell the assets and recognize losses on such assets, which could impact your return. Unlike traditional debt instruments, payments on these securities include both interest and a partial payment of principal. Mortgage- and asset-backed securities are subject to both extension risk, where borrowers pay off their debt obligations more slowly in times of rising interest rates, and prepayment risk, where borrowers pay off their debt obligations sooner than expected in times of declining interest rates. These risks may reduce the Fund’s returns. In addition, investments in mortgage- and asset-backed securities, including those comprised of subprime mortgages, may be subject to a higher degree of credit risk, valuation risk, extension risk (if interest rates rise), and liquidity risk than various other types of fixed-income securities. Additionally, although mortgage-backed securities are generally supported by some form of government or private guarantee and/or insurance, there is no assurance that guarantors or insurers will meet their obligations.
Offsetting Assets and Liabilities
The Fund presents gross and net information about transactions that are either offset in the financial statements or subject to an enforceable master netting arrangement or similar agreement with a designated counterparty, regardless of whether the transactions are actually offset in the Statement of Assets and Liabilities.
In order to better define its contractual rights and to secure rights that will help the Fund mitigate its counterparty risk, the Fund has entered into an International Swaps and Derivatives Association, Inc. Master Agreement (“ISDA Master Agreement”) or similar agreement with its derivative contract counterparties. An ISDA Master Agreement is a bilateral agreement between the Fund and a counterparty that governs OTC derivatives and forward foreign currency exchange contracts and typically contains, among other things, collateral posting terms and netting provisions in the event of a default and/or termination event. Under an ISDA Master Agreement, in the event of a default and/or termination event, the Fund may offset with each counterparty certain derivative financial instruments’ payables and/or receivables with collateral held and/or posted and create one single net payment.
The Offsetting Assets and Liabilities tables located in the Schedule of Investments present gross amounts of recognized assets and/or liabilities and the net amounts after deducting collateral that has been pledged by counterparties or has been pledged to counterparties (if applicable). For corresponding information grouped by type of instrument, see the “Fair Value of Derivative Instruments (not accounted for as hedging instruments) as of June 30, 2022” table located in the Fund’s Schedule of Investments.
JPMorgan Chase Bank, National Association acts as securities lending agent and a limited purpose custodian or subcustodian to receive and disburse cash balances and cash collateral, hold short-term investments, hold collateral, and perform other custodial functions in accordance with the Non-Custodial Securities Lending Agreement. For financial reporting purposes, the Fund does not offset financial instruments' payables and receivables and related collateral on the Statement of Assets and Liabilities. Securities on loan will be continuously secured by collateral which may consist of cash, U.S. Government securities, domestic and foreign short-term debt instruments, letters of credit, time deposits, repurchase agreements, money market mutual funds or other money market accounts, or such other collateral as permitted by the Securities and Exchange Commission (the “SEC”). See “Securities Lending” in the “Notes to Financial Statements” for additional information.
The Fund generally does not exchange collateral on its forward foreign currency contracts with its counterparties; however, all liquid securities and restricted cash are considered to cover in an amount at all times equal to or greater than the Fund’s commitment with respect to these contracts. Certain securities may be segregated at the Fund’s custodian. These segregated securities are denoted on the accompanying Schedule of Investments and are evaluated
Janus Henderson Multi-Sector Income Fund
Notes to Financial Statements
daily to ensure their cover and/or market value equals or exceeds the Fund’s corresponding forward foreign currency exchange contract's obligation value.
Real Estate Investing
The Fund may invest in equity and debt securities of real estate-related companies. Such companies may include those in the real estate industry or real estate-related industries. These securities may include common stocks, corporate bonds, preferred stocks, and other equity securities, including, but not limited to, mortgage-backed securities, real estate-backed securities, securities of REITs and similar REIT-like entities. A REIT is a trust that invests in real estate-related projects, such as properties, mortgage loans, and construction loans. REITs are generally categorized as equity, mortgage, or hybrid REITs. A REIT may be listed on an exchange or traded OTC.
Securities Lending
Under procedures adopted by the Trustees, the Fund may seek to earn additional income by lending securities to certain qualified broker-dealers and institutions. JPMorgan Chase Bank, National Association acts as securities lending agent and a limited purpose custodian or subcustodian to receive and disburse cash balances and cash collateral, hold short-term investments, hold collateral, and perform other custodial functions in accordance with the Non-Custodial Securities Lending Agreement. The Fund may lend fund securities in an amount equal to up to 1/3 of its total assets as determined at the time of the loan origination. There is the risk of delay in recovering a loaned security or the risk of loss in collateral rights if the borrower fails financially. In addition, the Adviser makes efforts to balance the benefits and risks from granting such loans. All loans will be continuously secured by collateral which may consist of cash, U.S. Government securities, domestic and foreign short-term debt instruments, letters of credit, time deposits, repurchase agreements, money market mutual funds or other money market accounts, or such other collateral as permitted by the SEC. If the Fund is unable to recover a security on loan, the Fund may use the collateral to purchase replacement securities in the market. There is a risk that the value of the collateral could decrease below the cost of the replacement security by the time the replacement investment is made, resulting in a loss to the Fund. In certain circumstances individual loan transactions could yield negative returns.
Upon receipt of cash collateral, the Adviser may invest it in affiliated or non-affiliated cash management vehicles, whether registered or unregistered entities, as permitted by the 1940 Act and rules promulgated thereunder. The Adviser currently intends to primarily invest the cash collateral in a cash management vehicle for which the Adviser serves as investment adviser, Janus Henderson Cash Collateral Fund LLC, or in time deposits. An investment in Janus Henderson Cash Collateral Fund LLC is generally subject to the same risks that shareholders experience when investing in similarly structured vehicles, such as the potential for significant fluctuations in assets as a result of the purchase and redemption activity of the securities lending program, a decline in the value of the collateral, and possible liquidity issues. Such risks may delay the return of the cash collateral and cause the Fund to violate its agreement to return the cash collateral to a borrower in a timely manner. As adviser to the Fund and Janus Henderson Cash Collateral Fund LLC, the Adviser has an inherent conflict of interest as a result of its fiduciary duties to both the Fund and Janus Henderson Cash Collateral Fund LLC. Additionally, the Adviser receives an investment advisory fee of 0.05% for managing Janus Henderson Cash Collateral Fund LLC, but it may not receive a fee for managing certain other affiliated cash management vehicles in which the Fund may invest, and therefore may have an incentive to allocate preferred investment opportunities to investment vehicles for which it is receiving a fee.
The value of the collateral must be at least 102% of the market value of the loaned securities that are denominated in U.S. dollars and 105% of the market value of the loaned securities that are not denominated in U.S. dollars. Loaned securities and related collateral are marked-to-market each business day based upon the market value of the loaned securities at the close of business, employing the most recent available pricing information. Collateral levels are then adjusted based on this mark-to-market evaluation. Additional required collateral, or excess collateral returned, is delivered on the next business day. Therefore, the value of the collateral held may be temporarily less than 102% or 105% value of the securities on loan. The cash collateral invested by the Adviser is disclosed in the Schedule of Investments (if applicable).
Income earned from the investment of the cash collateral, net of rebates paid to, or fees paid by, borrowers and less the fees paid to the lending agent are included as “Affiliated securities lending income, net” on the Statement of Operations. As of June 30, 2022, securities lending transactions accounted for as secured borrowings with an overnight and continuous contractual maturity are $17,025,246. Gross amounts of recognized liabilities for securities lending (collateral received) as of June 30, 2022 is $17,829,144, resulting in the net amount due to the counterparty of $803,898.
Janus Henderson Multi-Sector Income Fund
Notes to Financial Statements
Short Sales
The Fund may engage in “short sales against the box.” Short sales against the box involve either selling short a security that the Fund owns or selling short a security that the Fund has the right to obtain, for delivery at a specified date in the future. The Fund may enter into short sales against the box to hedge against anticipated declines in the market price of portfolio securities. The Fund does not deliver from its portfolio the securities sold short and does not immediately receive the proceeds of the short sale. The Fund borrows the securities sold short and receives proceeds from the short sale only when it delivers the securities to the lender. If the value of the securities sold short increases prior to the scheduled delivery date, the Fund loses the opportunity to participate in the gain.
The Fund may also engage in other short sales. The Fund may engage in short sales when the portfolio manager(s) and/or investment personnel anticipate that a security’s market purchase price will be less than its borrowing price. To complete the transaction, the Fund must borrow the security to deliver it to the purchaser and buy that same security in the market to return it to the lender. Although the potential for gain as a result of a short sale is limited to the price at which the Fund sold the security short less the cost of borrowing the security, the potential for loss is theoretically unlimited because there is no limit to the cost of replacing the borrowed security. There is no assurance the Fund will be able to close out a short position at a particular time or at an acceptable price. A lender may request, or market conditions may dictate, that the securities sold short be returned to it on short notice, and the Fund may have to buy the borrowed securities at an unfavorable price. If this occurs at a time when other short sellers of the same security also want to close out their positions, it is more likely that the Fund will have to cover its short sale at an unfavorable price and potentially reduce or eliminate any gain, or cause a loss, as a result of the short sale. A gain or a loss will be recognized upon termination of a short sale. Short sales held by the Fund are fully collateralized by restricted cash or other securities, which are denoted on the accompanying Schedule of Investments. The Fund is also required to pay the lender of the security any dividends or interest that accrues on a borrowed security during the period of the loan. Depending on the arrangements made with the broker or custodian, the Fund may or may not receive any payments (including interest) on collateral it has deposited with the broker. The Fund pays stock loan fees, disclosed on the Consolidated Statement of Operations,/disclosed on the Statement of Operations, on assets borrowed from the security broker.
The Fund may also enter into short positions through derivative instruments, such as options contracts, futures contracts, and swap agreements, which may expose the Fund to similar risks. To the extent that the Fund enters into short derivative positions, the Fund may be exposed to risks similar to those associated with short sales, including the risk that the Fund’s losses are theoretically unlimited.
TBA Commitments
The Fund may enter into “to be announced” or “TBA” commitments. TBAs are forward agreements for the purchase or sale of securities, including mortgage-backed securities, for a fixed price, with payment and delivery on an agreed upon future settlement date. The specific securities to be delivered are not identified at the trade date. However, delivered securities must meet specified terms, including issuer, rate, and mortgage terms. Although the particular TBA securities must meet industry-accepted “good delivery” standards, there can be no assurance that a security purchased on forward commitment basis will ultimately be issued or delivered by the counterparty. During the settlement period, the Fund will still bear the risk of any decline in the value of the security to be delivered. Because TBA commitments do not require the delivery of a specific security, the characteristics of the security delivered to the Fund may be less favorable than expected. If the counterparty to a transaction fails to deliver the security, the Fund could suffer a loss. To facilitate TBA commitments, the Fund will segregate or otherwise earmark liquid assets marked to market daily in an amount at least equal to such TBA commitments. Proposed rules of the Financial Industry Regulatory Authority (“FINRA”) include mandatory margin requirements for TBA commitments which, in some circumstances, will require the Fund to also post collateral. These collateral requirements may increase costs associated with the Fund’s participation in the TBA market.
When-Issued, Delayed Delivery and Forward Commitment Transactions
The Fund may purchase or sell securities on a when-issued, delayed delivery, or forward commitment basis. When purchasing a security on a when-issued, delayed delivery, or forward commitment basis, the Fund assumes the rights and risks of ownership of the security, including the risk of price and yield fluctuations, and takes such fluctuations into account when determining its net asset value. Typically, no income accrues on securities the Fund has committed to purchase prior to the time delivery of the securities is made. Because the Fund is not required to pay for the security until the delivery date, these risks are in addition to the risks associated with the Fund’s other investments. If the other party to a transaction fails to deliver the securities, the Fund could miss a favorable price or yield opportunity. If the Fund
Janus Henderson Multi-Sector Income Fund
Notes to Financial Statements
remains substantially fully invested at a time when when-issued, delayed delivery, or forward commitment purchases are outstanding, the purchases may result in a form of leverage. If the Fund remains substantially fully invested at a time when when-issued, delayed delivery, or forward commitment purchases (including TBA commitments) are outstanding, the purchases may result in a form of leverage.
When the Fund has sold a security on a when-issued, delayed delivery, or forward commitment basis, the Fund does not participate in future gains or losses with respect to the security. If the other party to a transaction fails to pay for the securities, the Fund could suffer a loss. Additionally, when selling a security on a when-issued, delayed delivery, or forward commitment basis without owning the security, the Fund will incur a loss if the security’s price appreciates in value such that the security’s price is above the agreed upon price on the settlement date. The Fund may dispose of or renegotiate a transaction after it is entered into, and may purchase or sell when-issued, delayed delivery or forward commitment securities before the settlement date, which may result in a gain or loss.
4. Investment Advisory Agreements and Other Transactions with Affiliates
The Fund pays the Adviser an investment advisory fee which is calculated daily and paid monthly. The following table reflects the Fund’s contractual investment advisory fee rate (expressed as an annual rate).
| | |
Average Daily Net Assets of the Fund | Contractual Investment Advisory Fee (%) |
First $200 Million | 0.60 |
Next $500 Million | 0.57 |
Over $700 Million | 0.55 |
The Fund’s actual investment advisory fee rate for the reporting period was 0.56% of average annual net assets before any applicable waivers.
The Adviser has contractually agreed to waive the investment advisory fee and/or reimburse operating expenses to the extent that the Fund’s total annual fund operating expenses, excluding the fees payable pursuant to a Rule 12b-1 plan, shareholder servicing fees, such as transfer agency fees (including out-of-pocket costs), administrative services fees and any networking/omnibus payable by any share class, brokerage commissions, interest, dividends, taxes, acquired fund fees and expenses, and extraordinary expenses, exceed the annual rate of 0.64% of the Fund’s average daily net assets. The Adviser has agreed to continue the waivers for at least a one-year period commencing October 28, 2021. If applicable, amounts waived and/or reimbursed to the Fund by the Adviser are disclosed as “Excess Expense Reimbursement and Waivers” on the Statement of Operations.
The Adviser serves as administrator to the Fund pursuant to an administration agreement between the Adviser and the Trust. Under the administration agreement, the Adviser is authorized to perform, or cause others to perform certain administration, compliance, and accounting services to the Fund, including providing office space for the Fund, and is reimbursed by the Fund for certain of its costs in providing these services (to the extent the Adviser seeks reimbursement and such costs are not otherwise waived). In addition, employees of the Adviser and/or its affiliates may serve as officers of the Trust. The Fund pays for some or all of the salaries, fees, and expenses of the Adviser employees and Fund officers, with respect to certain specified administration functions they perform on behalf of the Fund. The Fund pays these costs based on out-of-pocket expenses incurred by the Adviser, and these costs are separate and apart from advisory fees and other expenses paid in connection with the investment advisory services the Adviser (or any subadvisor, as applicable) provides to the Fund. These amounts are disclosed as “Affiliated fund administration fees” on the Statement of Operations. In addition, some expenses related to compensation payable to the Fund’s Chief Compliance Officer and certain compliance staff, all of whom are employees of the Adviser and/or its affiliates, are shared with the Fund. Total compensation of $474,228 was paid to the Chief Compliance Officer and certain compliance staff by the Trust during the year ended June 30, 2022. The Fund's portion is reported as part of “Other expenses” on the Statement of Operations.
Janus Henderson Services US LLC (formerly Janus Services LLC) (the “Transfer Agent”), a wholly-owned subsidiary of the Adviser, is the Fund’s transfer agent. The Transfer Agent provides or arranges for the provision of shareholder services including, but not limited to, recordkeeping, subaccounting, answering inquiries regarding accounts, order processing, transaction confirmations, the mailing of prospectuses and shareholder reports, and other shareholder services provided to or on behalf of shareholders. These amounts are disclosed as “Transfer agent administrative fees and expenses” on the Statement of Operations.
Janus Henderson Multi-Sector Income Fund
Notes to Financial Statements
Class D Shares of the Fund pay the Transfer Agent an annual administrative services fee based on the average daily net assets of Class D Shares as detailed below.
| | |
Average Daily Net Assets of Class D Shares of the Janus Henderson funds | Administrative Services Fee |
Under $40 billion | 0.12% |
$40 billion – $49.9 billion | 0.10% |
Over $49.9 billion | 0.08% |
During the reporting period, the administrative services fee rate was 0.11%.
The Transfer Agent receives an administrative services fee at an annual rate of up to 0.25% of the average daily net assets of the Fund’s Class S Shares and Class T Shares for providing or procuring administrative services to investors in Class S Shares and Class T Shares of the Fund. The Transfer Agent expects to use all or a significant portion of this fee to compensate retirement plan service providers, broker-dealers, bank trust departments, financial advisors, and other financial intermediaries for providing these services. The Transfer Agent may keep certain amounts retained for reimbursement of out-of-pocket costs incurred for servicing clients of Class S Shares and Class T Shares.
Shareholder Services provided by these financial intermediaries may include, but are not limited to, recordkeeping, subaccounting, order processing, providing order confirmations, periodic statements, forwarding prospectuses, shareholder reports, and other materials to existing customers, answering inquiries regarding accounts, and other administrative services. Order processing includes the submission of transactions through the National Securities Clearing Corporation (“NSCC”) or similar systems, or those processed on a manual basis with the Adviser. For all share classes, the Transfer Agent also seeks reimbursement for costs it incurs as transfer agent and for providing servicing.
Certain, but not all, intermediaries may charge administrative fees to investors in Class A Shares, Class C Shares, and Class I Shares for administrative services provided on behalf of such investors. These administrative fees are paid by the Class A Shares, Class C Shares, and Class I Shares of the Fund to the Transfer Agent, which uses such fees to reimburse intermediaries. Consistent with the Transfer Agency Agreement between the Transfer Agent and the Fund, the Transfer Agent may negotiate the level, structure, and/or terms of the administrative fees with intermediaries requiring such fees on behalf of the Fund. The Adviser and its affiliates benefit from an increase in assets that may result from such relationships. The Adviser has agreed to limit these fees up to 0.20% for Class A Shares and Class C Shares, and up to 0.15% for Class I Shares on an annual basis based on the daily net assets of each share class. Such limits are subject to change by the Trustees in the future. These amounts are disclosed as “Transfer agent networking and omnibus fees” on the Statement of Operations.
The Transfer Agent is not compensated for its services related to the shares, except for out-of-pocket costs, although the Transfer Agent is compensated for its services related to Fund’s Class D Shares. These amounts are disclosed as “Other transfer agent fees and expenses” on the Statement of Operations.
Under distribution and shareholder servicing plans (the “Plans”) adopted in accordance with Rule 12b-1 under the 1940 Act, the Fund pays the Trust’s distributor, the Distributor, a wholly-owned subsidiary of the Adviser, a fee for the sale and distribution and/or shareholder servicing of the shares based on the average daily net assets for each share class at an annual rate of up to 0.25% for Class A Shares, up to 1.00% for Class C Shares, and up to 0.25% for Class S Shares. Under the terms of the Plans, the Trust is authorized to make payments to the Distributor for remittance to retirement plan service providers, broker-dealers, bank trust departments, financial advisors, and other financial intermediaries, as compensation for distribution and/or shareholder services performed by such entities for their customers who are investors in the Fund. These amounts are disclosed as “12b-1 Distribution and shareholder servicing fees” on the Statement of Operations.
Class A Shares include a 4.75% upfront sales charge of the offering price of the Fund. The sales charge is allocated between the Distributor and financial intermediaries. During the year ended June 30, 2022, the Distributor retained upfront sales charges of $18,020.
A contingent deferred sales charge (“CDSC”) of 1.00% will be deducted with respect to Class A Shares purchased without a sales load and redeemed within 12 months of purchase, unless waived. Any applicable CDSC will be 1.00% of the lesser of the original purchase price or the value of the redemption of the Class A Shares redeemed. During the year ended June 30, 2022, redeeming shareholders of Class A Shares paid CDSCs of $16,897 to Janus Henderson Distributors.
Janus Henderson Multi-Sector Income Fund
Notes to Financial Statements
A CDSC of 1.00% will be deducted with respect to Class C Shares redeemed within 12 months of purchase, unless waived. Any applicable CDSC will be 1.00% of the lesser of the original purchase price or the value of the redemption of the Class C Shares redeemed. During the year ended June 30, 2022, redeeming shareholders of Class C Shares paid CDSCs of $12,124.
The Board of Trustees has adopted a deferred compensation plan (the “Deferred Plan”) for independent Trustees to elect to defer receipt of all or a portion of the annual compensation they are entitled to receive from the Fund. All deferred fees are credited to an account established in the name of the Trustees. The amounts credited to the account then increase or decrease, as the case may be, in accordance with the performance of one or more of the Janus Henderson funds that are selected by the Trustees. The account balance continues to fluctuate in accordance with the performance of the selected fund or funds until final payment of all amounts are credited to the account. The fluctuation of the account balance is recorded by the Fund as unrealized appreciation/(depreciation) and is included as of June 30, 2022 on the Statement of Assets and Liabilities in the asset, “Trustees’ deferred compensation,” and liability, “Trustees’ deferred compensation fees.” Additionally, the recorded unrealized appreciation/(depreciation) is included in “Total distributable earnings (loss)” on the Statement of Assets and Liabilities. Deferred compensation expenses for the year ended June 30, 2022 are included in “Trustees’ fees and expenses” on the Statement of Operations. Trustees are allowed to change their designation of mutual funds from time to time. Amounts will be deferred until distributed in accordance with the Deferred Plan. Deferred fees of $431,326 were paid by the Trust to the Trustees under the Deferred Plan during the year ended June 30, 2022.
Pursuant to the provisions of the 1940 Act and related rules, the Fund may participate in an affiliated or non-affiliated cash sweep program. In the cash sweep program, uninvested cash balances of the Fund may be used to purchase shares of affiliated or non-affiliated money market funds or cash management pooled investment vehicles that operate as money market funds. The Fund is eligible to participate in the cash sweep program (the “Investing Funds”). The Adviser has an inherent conflict of interest because of its fiduciary duties to the affiliated money market funds or cash management pooled investment vehicles and the Investing Funds. Janus Henderson Cash Liquidity Fund LLC (the “Sweep Vehicle”) is an affiliated unregistered cash management pooled investment vehicle that invests primarily in highly-rated short-term fixed-income securities. The Sweep Vehicle operates pursuant to the provisions of the 1940 Act that govern the operation of money market funds and prices its shares at NAV reflecting market-based values of its portfolio securities (i.e., a “floating” NAV) rounded to the fourth decimal place (e.g., $1.0000). The Sweep Vehicle is permitted to impose a liquidity fee (of up to 2%) on redemptions from the Sweep Vehicle or a redemption gate that temporarily suspends redemptions from the Sweep Vehicle for up to 10 business days during a 90 day period. There are no restrictions on the Fund's ability to withdraw investments from the Sweep Vehicle at will, and there are no unfunded capital commitments due from the Fund to the Sweep Vehicle. The Sweep Vehicle does not charge any management fee, sales charge or service fee.
Any purchases and sales, realized gains/losses and recorded dividends from affiliated investments during the year ended June 30, 2022 can be found in the “Schedules of Affiliated Investments” located in the Schedule of Investments.
The Fund is permitted to purchase or sell securities (“cross-trade”) between itself and other funds or accounts managed by the Adviser in accordance with Rule 17a-7 under the Investment Company Act of 1940 (“Rule 17a-7”), when the transaction is consistent with the investment objectives and policies of the Fund and in accordance with the Internal Cross Trade Procedures adopted by the Trust’s Board of Trustees. These procedures have been designed to ensure that any cross-trade of securities by the Fund from or to another fund or account that is or could be considered an affiliate of the Fund under certain limited circumstances by virtue of having a common investment adviser, common Officer, or common Trustee complies with Rule 17a-7. Under these procedures, each cross-trade is effected at the current market price to save costs where allowed. During the year ended June 30, 2022, the Fund engaged in cross trades amounting to $1,488,146 in purchases and $78,092,545 in sales, resulting in a net realized gain of $118,489. The net realized gain is included within the “Net Realized Gain/(Loss) on Investments” section of the Fund’s Statement of Operations.
5. Federal Income Tax
The tax components of capital shown in the table below represent: (1) distribution requirements the Fund must satisfy under the income tax regulations; (2) losses or deductions the Fund may be able to offset against income and gains realized in future years; and (3) unrealized appreciation or depreciation of investments for federal income tax purposes.
Janus Henderson Multi-Sector Income Fund
Notes to Financial Statements
Other book to tax differences primarily consist of deferred compensation, derivatives, and foreign currency contract adjustments. The Fund has elected to treat gains and losses on forward foreign currency contracts as capital gains and losses, if applicable. Other foreign currency gains and losses on debt instruments are treated as ordinary income for federal income tax purposes pursuant to Section 988 of the Internal Revenue Code.
| | | | | | | | |
| | | Loss Deferrals | Other Book | Net Tax | |
Undistributed
Ordinary Income | Undistributed
Long-Term Gains | Accumulated
Capital Losses | Late-Year
Ordinary Loss | Post-October
Capital Loss | to Tax
Differences | Appreciation/
(Depreciation) | |
$ - | $ - | $ (97,034,651) | $ - | $ - | $9,958,663 | $(345,553,292) | |
Accumulated capital losses noted below represent net capital loss carryovers, as of June 30, 2022, that may be available to offset future realized capital gains and thereby reduce future taxable gains distributions. The following table shows these capital loss carryovers.
| | | | | | |
| | | | | |
Capital Loss Carryover Schedule | | |
For the year ended June 30, 2022 | | |
| No Expiration | | | |
| Short-Term | Long-Term | Accumulated
Capital Losses | | |
| $(85,870,537) | $(11,164,114) | $ (97,034,651) | | |
The aggregate cost of investments and the composition of unrealized appreciation and depreciation of investment securities for federal income tax purposes as of June 30, 2022 are noted below. The primary differences between book and tax appreciation or depreciation of investments are wash sale loss deferrals, investments in partnerships, and investments in passive foreign investment companies.
| | | | |
Federal Tax Cost | Unrealized
Appreciation | Unrealized
(Depreciation) | Net Tax Appreciation/
(Depreciation) |
$ 3,881,313,840 | $ 1,856,237 | $(347,409,529) | $ (345,553,292) |
Information on the tax components of derivatives as of June 30, 2022 is as follows:
| | | | |
Federal Tax Cost | Unrealized
Appreciation | Unrealized
(Depreciation) | Net Tax Appreciation/
(Depreciation) |
$ (8,973,835) | $10,045,112 | $ - | $ 10,045,112 |
Tax cost of investments and unrealized appreciation/(depreciation) may also include timing differences that do not constitute adjustments to tax basis.
Janus Henderson Multi-Sector Income Fund
Notes to Financial Statements
Income and capital gains distributions are determined in accordance with income tax regulations that may differ from US GAAP. These differences are due to differing treatments for items such as net short-term gains, deferral of wash sale losses, foreign currency transactions, and capital loss carryovers. Certain permanent differences such as tax returns of capital and net investment losses noted below have been reclassified to capital.
| | | | | |
For the year ended June 30, 2022 | |
Distributions | | |
From Ordinary Income | From Long-Term Capital Gains | Tax Return of Capital | Net Investment Loss | |
$ 133,372,181 | $ 6,289,592 | $ 1,604,625 | $ - | |
| | | | | |
For the year ended June 30, 2021 | |
Distributions | | |
From Ordinary Income | From Long-Term Capital Gains | Tax Return of Capital | Net Investment Loss | |
$ 115,415,943 | $ - | $ - | $ - | |
Permanent book to tax basis differences may result in reclassifications between the components of net assets. These differences have no impact on the results of operations or net assets. The following reclassifications have been made to the Fund:
| | | |
| | |
Increase/(Decrease) to Capital | Increase/(Decrease) to Undistributed
Net Investment Income/Loss | Increase/(Decrease) to Undistributed
Net Realized Gain/Loss |
$ (1,604,625) | $ 6,816,467 | $ (5,211,842) |
Janus Henderson Multi-Sector Income Fund
Notes to Financial Statements
6. Capital Share Transactions
| | | | | | | |
| | | | | | |
| | Year ended June 30, 2022 | | Year ended June 30, 2021 |
| | Shares | Amount | | Shares | Amount |
| | | | | | | |
Class A Shares: | | | | | |
Shares sold | 3,512,155 | $ 34,685,238 | | 5,296,698 | $ 52,885,839 |
Reinvested dividends and distributions | 259,890 | 2,514,847 | | 236,695 | 2,354,171 |
Shares repurchased | (4,721,195) | (45,843,873) | | (4,101,540) | (41,044,253) |
Net Increase/(Decrease) | (949,150) | $ (8,643,788) | | 1,431,853 | $ 14,195,757 |
Class C Shares: | | | | | |
Shares sold | 2,219,963 | $ 21,892,520 | | 1,671,116 | $ 16,695,454 |
Reinvested dividends and distributions | 246,899 | 2,381,260 | | 230,346 | 2,290,871 |
Shares repurchased | (2,339,517) | (22,264,130) | | (1,585,562) | (15,800,224) |
Net Increase/(Decrease) | 127,345 | $ 2,009,650 | | 315,900 | $ 3,186,101 |
Class D Shares: | | | | | |
Shares sold | 3,410,009 | $ 33,432,311 | | 5,002,814 | $ 49,941,405 |
Reinvested dividends and distributions | 426,998 | 4,125,281 | | 373,370 | 3,718,250 |
Shares repurchased | (4,096,910) | (39,732,790) | | (2,908,655) | (28,924,041) |
Net Increase/(Decrease) | (259,903) | $ (2,175,198) | | 2,467,529 | $ 24,735,614 |
Class I Shares: | | | | | |
Shares sold | 149,981,113 | $1,463,410,864 | | 130,873,274 | $1,307,962,871 |
Reinvested dividends and distributions | 11,822,831 | 113,937,965 | | 8,681,127 | 86,379,431 |
Shares repurchased | (126,898,055) | (1,210,386,954) | | (76,272,612) | (756,920,545) |
Net Increase/(Decrease) | 34,905,889 | $ 366,961,875 | | 63,281,789 | $ 637,421,757 |
Class N Shares: | | | | | |
Shares sold | 4,626,991 | $ 44,871,422 | | 5,313,468 | $ 53,038,704 |
Reinvested dividends and distributions | 393,069 | 3,835,550 | | 414,150 | 4,122,238 |
Shares repurchased | (9,276,670) | (90,704,980) | | (2,980,678) | (29,605,850) |
Net Increase/(Decrease) | (4,256,610) | $ (41,998,008) | | 2,746,940 | $ 27,555,092 |
Class S Shares: | | | | | |
Shares sold | 79,987 | $ 756,904 | | 14,686 | $ 146,663 |
Reinvested dividends and distributions | 3,575 | 34,068 | | 3,649 | 36,188 |
Shares repurchased | (19,572) | (185,388) | | (48,928) | (491,183) |
Net Increase/(Decrease) | 63,990 | $ 605,584 | | (30,593) | $ (308,332) |
Class T Shares: | | | | | |
Shares sold | 7,538,261 | $ 73,701,449 | | 14,913,942 | $ 148,486,729 |
Reinvested dividends and distributions | 847,371 | 8,196,736 | | 1,237,845 | 12,302,567 |
Shares repurchased | (12,885,155) | (124,983,677) | | (23,637,310) | (235,926,497) |
Net Increase/(Decrease) | (4,499,523) | $ (43,085,492) | | (7,485,523) | $ (75,137,201) |
7. Purchases and Sales of Investment Securities
For the year ended June 30, 2022, the aggregate cost of purchases and proceeds from sales of investment securities (excluding any short-term securities, short-term options contracts, TBAs, and in-kind transactions, as applicable) was as follows:
| | | | |
Purchases of
Securities | Proceeds from Sales
of Securities | Purchases of Long-
Term U.S. Government
Obligations | Proceeds from Sales
of Long-Term U.S.
Government Obligations |
$ 2,694,957,997 | $ 2,388,889,249 | $ - | $ - |
8. Recent Accounting Pronouncements
The FASB issued Accounting Standards Update 2020-04 Reference Rate Reform: Facilitation of the Effects of Reference Rate Reform on Financial Reporting (“ASU 2020-04”) in March 2020. The new guidance in the ASU provide
Janus Henderson Multi-Sector Income Fund
Notes to Financial Statements
optional temporary financial reporting relief from the effect of certain types of contract modifications due to the planned discontinuation of the LIBOR or other interbank-offered based reference rates as of the end of 2021. For new and existing contracts, Funds may elect to apply the guidance as of March 12, 2020 through December 31, 2022. FASB has proposed extending the sunset date to December 31, 2024. Management is currently evaluating the impact, if any, of the ASU’s adoption to the Fund’s financial statements.
9. Subsequent Event
Management has evaluated whether any events or transactions occurred subsequent to June 30, 2022 and through the date of issuance of the Fund’s financial statements and determined that there were no material events or transactions that would require recognition or disclosure in the Fund’s financial statements.
Janus Henderson Multi-Sector Income Fund
Report of Independent Registered Public Accounting Firm
To the Board of Trustees of Janus Investment Fund and Shareholders of Janus Henderson Multi-Sector Income Fund
Opinion on the Financial Statements
We have audited the accompanying statement of assets and liabilities, including the schedule of investments, of Janus Henderson Multi-Sector Income Fund (one of the funds constituting Janus Investment Fund, referred to hereafter as the "Fund") as of June 30, 2022, the related statement of operations for the year ended June 30, 2022, the statements of changes in net assets for each of the two years in the period ended June 30, 2022, including the related notes, and the financial highlights for each of the five years in the period ended June 30, 2022 (collectively referred to as the “financial statements”). In our opinion, the financial statements present fairly, in all material respects, the financial position of the Fund as of June 30, 2022, the results of its operations for the year then ended, the changes in its net assets for each of the two years in the period ended June 30, 2022 and the financial highlights for each of the five years in the period ended June 30, 2022 in conformity with accounting principles generally accepted in the United States of America.
Basis for Opinion
These financial statements are the responsibility of the Fund’s management. Our responsibility is to express an opinion on the Fund’s financial statements based on our audits. We are a public accounting firm registered with the Public Company Accounting Oversight Board (United States) (PCAOB) and are required to be independent with respect to the Fund in accordance with the U.S. federal securities laws and the applicable rules and regulations of the Securities and Exchange Commission and the PCAOB.
We conducted our audits of these financial statements in accordance with the standards of the PCAOB. Those standards require that we plan and perform the audit to obtain reasonable assurance about whether the financial statements are free of material misstatement, whether due to error or fraud.
Our audits included performing procedures to assess the risks of material misstatement of the financial statements, whether due to error or fraud, and performing procedures that respond to those risks. Such procedures included examining, on a test basis, evidence regarding the amounts and disclosures in the financial statements. Our audits also included evaluating the accounting principles used and significant estimates made by management, as well as evaluating the overall presentation of the financial statements. Our procedures included confirmation of securities owned as of June 30, 2022 by correspondence with the custodian, transfer agent, investee company, and brokers; when replies were not received from brokers, we performed other auditing procedures. We believe that our audits provide a reasonable basis for our opinion.

Denver, Colorado
August 19, 2022
We have served as the auditor of one or more investment companies in Janus Henderson Funds since 1990.
Janus Henderson Multi-Sector Income Fund
Additional Information (unaudited)
Proxy Voting Policies and Voting Record
A description of the policies and procedures that the Fund uses to determine how to vote proxies relating to its portfolio securities is available without charge: (i) upon request, by calling 1-800-525-1093; (ii) on the Fund’s website at janushenderson.com/proxyvoting; and (iii) on the SEC’s website at http://www.sec.gov. Additionally, information regarding the Fund’s proxy voting record for the most recent twelve-month period ended June 30 is also available, free of charge, through janushenderson.com/proxyvoting and from the SEC’s website at http://www.sec.gov.
Full Holdings
The Fund files its complete portfolio holdings (schedule of investments) with the SEC as an exhibit to Form N-PORT within 60 days of the end of the first and third fiscal quarters, and in the annual report and semiannual report to shareholders. The Fund’s Form N-PORT filings and annual and semiannual reports: (i) are available on the SEC’s website at http://www.sec.gov; (ii) may be reviewed and copied at the SEC’s Public Reference Room in Washington, D.C. (information on the Public Reference Room may be obtained by calling 1-800-SEC-0330); and (iii) are available without charge, upon request, by calling a Janus Henderson representative at 1-877-335-2687 (toll free) (or 1-800-525-3713 if you hold Class D shares). Portfolio holdings consisting of at least the names of the holdings are generally available on a monthly basis with a 30-day lag under Full Holdings for the Fund at janushenderson.com/info (or janushenderson.com/reports if you hold Class D Shares).
APPROVAL OF ADVISORY AGREEMENTS DURING THE PERIOD
The Trustees of Janus Aspen Series, each of whom serves as an “independent” Trustee (the “Trustees”), oversee the management of each portfolio of Janus Aspen Series (each, a “VIT Portfolio,” and collectively, the “VIT Portfolios”), as well as each fund of Janus Investment Fund (each, a “Fund,” and collectively, the “Funds” and together with the VIT Portfolios, the “Janus Henderson Funds,” and each, a “Janus Henderson Fund”). As required by law, the Trustees determine annually whether to continue the investment advisory agreement for each Janus Henderson Fund and the subadvisory agreement for each Janus Henderson Fund that utilizes a subadviser.
In connection with their most recent consideration of those agreements for each Janus Henderson Fund, the Trustees received and reviewed information provided by Janus Henderson Investors US LLC (formerly, Janus Capital Management LLC) (the “Adviser”) and the subadviser in response to requests of the Trustees and their independent legal counsel. They also received and reviewed information and analysis provided by, and in response to requests of, their independent fee consultant. Throughout their consideration of the agreements, the Trustees were advised by their independent legal counsel. The Trustees met with management to consider the agreements, and also met separately in executive session with their independent legal counsel and their independent fee consultant.
At meetings held on November 3-4, 2021 and December 7-8, 2021, the Trustees’ evaluated the information provided by the Adviser, the subadviser, and the independent fee consultant, as well as other information addressed during the year. Following such evaluation, the Trustees determined that the overall arrangements between each Janus Henderson Fund and the Adviser and each subadviser, as applicable, were fair and reasonable in light of the nature, extent and quality of the services provided by the Adviser, its affiliates and the subadviser, the fees charged for those services, and other matters that the Trustees considered relevant in the exercise of their business judgment and unanimously approved the continuation of the investment advisory agreement for each Janus Henderson Fund and the subadvisory agreement for each subadvised Janus Henderson Fund, for the period from February 1, 2022 through February 1, 2023, subject to earlier termination as provided for in each agreement.
In considering the continuation of those agreements, the Trustees reviewed and analyzed various factors that they determined were relevant, including the factors described below, none of which by itself was considered dispositive. However, the material factors and conclusions that formed the basis for the Trustees’ determination to approve the continuation of the agreements are discussed separately below. Also included is a summary of the independent fee consultant’s conclusions and opinions that arose during, and were included as part of, the Trustees’ consideration of the agreements. “Management fees,” as used herein, reflect actual annual advisory fees and, for the purpose of peer comparisons any administration fees (excluding out of pocket costs), net of any waivers, paid by a fund as a percentage of average net assets.
Nature, Extent and Quality of Services
The Trustees reviewed the nature, extent and quality of the services provided by the Adviser and the subadviser to the Janus Henderson Funds, taking into account the investment objective, strategies and policies of each Janus Henderson
Janus Henderson Multi-Sector Income Fund
Additional Information (unaudited)
Fund, and the knowledge the Trustees gained from their regular meetings with management on at least a quarterly basis and their ongoing review of information related to the Janus Henderson Funds. In addition, the Trustees reviewed the resources and key personnel of the Adviser and the subadviser, particularly noting those employees who provide investment and risk management services to the Janus Henderson Funds. The Trustees also considered other services provided to the Janus Henderson Funds by the Adviser or the subadviser, such as managing the execution of portfolio transactions and the selection of broker-dealers for those transactions. The Trustees considered the Adviser’s role as administrator to the Janus Henderson Funds, noting that the Adviser generally does not receive a fee for its services as administrator, but is reimbursed for its out-of-pocket costs. The Trustees considered the role of the Adviser in monitoring adherence to the Janus Henderson Funds’ investment restrictions, providing support services for the Trustees and Trustee committees, and overseeing communications with shareholders and the activities of other service providers, including monitoring compliance with various policies and procedures of the Janus Henderson Funds and with applicable securities laws and regulations.
In this regard, the independent fee consultant noted that the Adviser provides a number of different services for the Janus Henderson Funds and fund shareholders, ranging from investment management services to various other servicing functions, and that, in its view, the Adviser is a capable provider of those services. The independent fee consultant also provided its belief that the Adviser has developed a number of institutional competitive advantages that should enable it to provide superior investment and service performance over the long term.
The Trustees concluded that the nature, extent and quality of the services provided by the Adviser and the subadviser to each Janus Henderson Fund were appropriate and consistent with the terms of the respective advisory and subadvisory agreements, and that, taking into account steps taken to address those Janus Henderson Funds whose performance lagged that of their peers for certain periods, the Janus Henderson Funds were likely to benefit from the continued provision of those services. They also concluded that the Adviser and the subadviser had sufficient personnel, with the appropriate education and experience, to serve the Janus Henderson Funds effectively and each had demonstrated its ability to attract well-qualified personnel.
Performance of the Funds
The Trustees considered the performance results of each Janus Henderson Fund over various time periods. They noted that they considered Janus Henderson Fund performance data throughout the year, including periodic meetings with each Janus Henderson Fund’s portfolio manager(s), and also reviewed information comparing each Janus Henderson Fund’s performance with the performance of comparable funds and peer groups identified by Broadridge Financial Solutions, Inc. (“Broadridge”), an independent data provider, and with the Janus Henderson Fund’s benchmark index. In this regard, the independent fee consultant found that the overall Janus Henderson Funds’ performance has been reasonable: for the 36 months ended September 30, 2021, approximately 55% of the Janus Henderson Funds were in the top two quartiles of performance versus Broadridge peers, and for the 12 months ended September 30, 2021, approximately 45% of the Janus Henderson Funds were in the top two quartiles of performance versus Broadridge peers.
The Trustees considered the performance of each Fund, noting that performance may vary by share class, and noted the following:
Asset Allocation Funds
· For Janus Henderson Global Allocation Fund – Conservative, the Trustees noted that the Fund’s performance was in the second Broadridge quartile for the 36 months ended May 31, 2021 and the first Broadridge quartile for the 12 months ended May 31, 2021.
· For Janus Henderson Global Allocation Fund – Growth, the Trustees noted that the Fund’s performance was in the bottom Broadridge quartile for the 36 months ended May 31, 2021 and the first Broadridge quartile for the 12 months ended May 31, 2021. The Trustees noted the reasons for the Fund’s underperformance, the steps the Adviser had taken or was taking to improve performance, and that the performance trend was improving.
· For Janus Henderson Global Allocation Fund – Moderate, the Trustees noted that the Fund’s performance was in the third Broadridge quartile for the 36 months ended May 31, 2021 and the first Broadridge quartile for the 12 months ended May 31, 2021. The Trustees noted the reasons for the Fund’s underperformance, the steps the Adviser had taken or was taking to improve performance and that the performance trend was improving
Janus Henderson Multi-Sector Income Fund
Additional Information (unaudited)
Fixed-Income Funds
· For Janus Henderson Absolute Return Income Opportunities Fund, the Trustees noted that the Fund’s performance was in the bottom Broadridge quartile for the 36 months ended May 31, 2021 and the bottom Broadridge quartile for the 12 months ended May 31, 2021. The Trustees noted the reasons for the Fund’s underperformance and the steps the Adviser had taken or was taking to improve performance.
· For Janus Developed World Bond Fund, the Trustees noted the Fund’s performance was in the second Broadridge quartile for the 36 months ended May 31, 2021 and the bottom Broadridge quartile for the 12 months ended May 31, 2021.
· For Janus Henderson Flexible Bond Fund, the Trustees noted that the Fund’s performance was in the first Broadridge quartile for the 36 months ended May 31, 2021 and the third Broadridge quartile for the 12 months ended May 31, 2021.
· For Janus Henderson Global Bond Fund, the Trustees noted that the Fund’s performance was in the second Broadridge quartile for the 36 months ended May 31, 2021 and the third Broadridge quartile for the 12 months ended May 31, 2021.
· For Janus Henderson High-Yield Fund, the Trustees noted that the Fund’s performance was in the first Broadridge quartile for the 36 months ended May 31, 2021 and the second Broadridge quartile for the 12 months ended May 31, 2021.
· For Janus Henderson Multi-Sector Income Fund, the Trustees noted that the Fund’s performance was in the first Broadridge quartile for the 36 months ended May 31, 2021 and the first Broadridge quartile for the 12 months ended May 31, 2021.
· For Janus Henderson Short Duration Flexible Bond Fund, the Trustees noted that the Fund’s performance was in the second Broadridge quartile for the 36 months ended May 31, 2021 and the second Broadridge quartile for the 12 months ended May 31, 2021.
Global and International Equity Funds
· For Janus Henderson Asia Equity Fund, the Trustees noted that the Fund’s performance was in the second Broadridge quartile for the 36 months ended May 31, 2021 and the second Broadridge quartile for the 12 months ended May 31, 2021.
· For Janus Henderson Emerging Markets Fund, the Trustees noted that the Fund’s performance was in the second Broadridge quartile for the 36 months ended May 31, 2021 and the first Broadridge quartile for the 12 months ended May 31, 2021.
· For Janus Henderson European Focus Fund, the Trustees noted that the Fund’s performance was in the first Broadridge quartile for the 36 months ended May 31, 2021 and the first Broadridge quartile for the 12 months ended May 31, 2021.
· For Janus Henderson Global Equity Income Fund, the Trustees noted that the Fund’s performance was in the bottom Broadridge quartile for the 36 months ended May 31, 2021 and the third Broadridge quartile for the 12 months ended May 31, 2021. The Trustees noted the reasons for the Fund’s underperformance and the steps the Adviser had taken or was taking to improve performance.
· For Janus Henderson Global Life Sciences Fund, the Trustees noted that the Fund’s performance was in the first Broadridge quartile for the 36 months ended May 31, 2021 and the first Broadridge quartile for the 12 months ended May 31, 2021.
· For Janus Henderson Global Real Estate Fund, the Trustees noted that the Fund’s performance was in the first Broadridge quartile for the 36 months ended May 31, 2021 and the bottom Broadridge quartile for the 12 months ended May 31, 2021.
· For Janus Henderson Global Research Fund, the Trustees noted that the Fund’s performance was in the third Broadridge quartile for the 36 months ended May 31, 2021 and the third Broadridge quartile for the 12 months ended May 31, 2021. The Trustees noted the reasons for the Fund’s underperformance, while also noting that the
Janus Henderson Multi-Sector Income Fund
Additional Information (unaudited)
Fund has a performance fee structure that results in lower management fees during periods of underperformance, and the steps the Adviser had taken or was taking to improve performance.
· For Janus Henderson Global Select Fund, the Trustees noted that the Fund’s performance was in the first Broadridge quartile for the 36 months ended May 31, 2021 and the first Broadridge quartile for the 12 months ended May 31, 2021.
· For Janus Henderson Global Technology and Innovation Fund, the Trustees noted that the Fund’s performance was in the second Broadridge quartile for the 36 months ended May 31, 2021 and the bottom Broadridge quartile for the 12 months ended May 31, 2021.
· For Janus Henderson International Opportunities Fund, the Trustees noted that the Fund’s performance was in the bottom Broadridge quartile for the 36 months ended May 31, 2021 and the third Broadridge quartile for the 12 months ended May 31, 2021. The Trustees noted the reasons for the Fund’s underperformance and the steps the Adviser had taken or was taking to improve performance.
· For Janus Henderson Overseas Fund, the Trustees noted that the Fund’s performance was in the second Broadridge quartile for the 36 months ended May 31, 2021 and the first Broadridge quartile for the 12 months ended May 31, 2021.
Money Market Funds
· For Janus Henderson Government Money Market Fund, the Trustees noted that the Fund’s performance was in the third Broadridge quartile for the 36 months ended May 31, 2021 and the bottom Broadridge quartile for the 12 months ended May 31, 2021. The Trustees noted the reasons for the Fund’s underperformance and the steps the Adviser had taken or was taking to improve performance.
· For Janus Henderson Money Market Fund, the Trustees noted that the Fund’s performance was in the third Broadridge quartile for the 36 months ended May 31, 2021 and the bottom Broadridge quartile for the 12 months ended May 31, 2021. The Trustees noted the reasons for the Fund’s underperformance and the steps the Adviser had taken or was taking to improve performance.
Multi-Asset Funds
· For Janus Henderson Adaptive Global Allocation Fund, the Trustees noted that the Fund’s performance was in bottom Broadridge quartile for the 36 months ended May 31, 2021 and the bottom Broadridge quartile for the 12 months ended May 31, 2021. The Trustees noted the reasons for the Fund’s underperformance and the steps the Adviser had taken or was taking to improve performance.
· For Janus Henderson Dividend & Income Builder Fund, the Trustees noted that the Fund’s performance was in the third Broadridge quartile for the 36 months ended May 31, 2021 and the third Broadridge quartile for the 12 months ended May 31, 2021. The Trustees noted the reasons for the Fund’s underperformance and the steps the Adviser had taken or was taking to improve performance.
Multi-Asset U.S. Equity Funds
· For Janus Henderson Balanced Fund, the Trustees noted that the Fund’s performance was in the first Broadridge quartile for the 36 months ended May 31, 2021 and the third Broadridge quartile for the 12 months ended May 31, 2021.
· For Janus Henderson Contrarian Fund, the Trustees noted that the Fund’s performance was in the first Broadridge quartile for the 36 months ended May 31, 2021 and the first Broadridge quartile for the 12 months ended May 31, 2021.
· For Janus Henderson Enterprise Fund, the Trustees noted that the Fund’s performance was in the bottom Broadridge quartile for the 36 months ended May 31, 2021 and the third Broadridge quartile for the 12 months ended May 31, 2021. The Trustees noted the reasons for the Fund’s underperformance, and the steps the Adviser had taken or was taking to improve performance.
· For Janus Henderson Forty Fund, the Trustees noted that the Fund’s performance was in the first Broadridge quartile for the 36 months ended May 31, 2021 and the first Broadridge quartile for the 12 months ended May 31, 2021.
Janus Henderson Multi-Sector Income Fund
Additional Information (unaudited)
· For Janus Henderson Growth and Income Fund, the Trustees noted that the Fund’s performance was in the bottom Broadridge quartile for the 36 months ended May 31, 2021 and the third Broadridge quartile for the 12 months ended May 31, 2021. The Trustees noted the reasons for the Fund’s underperformance, and the steps the Adviser had taken or was taking to improve performance.
· For Janus Henderson Research Fund, the Trustees noted that the Fund’s performance was in the third Broadridge quartile for the 36 months ended May 31, 2021 and the third Broadridge quartile for the 12 months ended May 31, 2021. The Trustees noted the reasons for the Fund’s underperformance while also noting that the Fund has a performance fee structure that results in lower management fees during periods of underperformance, and the steps the Adviser had taken or was taking to improve performance.
· For Janus Henderson Triton Fund, the Trustees noted that the Fund’s performance was in the bottom Broadridge quartile for the 36 months ended May 31, 2021 and the bottom Broadridge quartile for the 12 months ended May 31, 2021. The Trustees noted the reasons for the Fund’s underperformance, and the steps the Adviser had taken or was taking to improve performance.
· For Janus Henderson Venture Fund, the Trustees noted that the Fund’s performance was in the third Broadridge quartile for the 36 months ended May 31, 2021 and the bottom Broadridge quartile for the 12 months ended May 31, 2021. The Trustees noted the reasons for the Fund’s underperformance, and the steps the Adviser had taken or was taking to improve performance.
Quantitative Equity Funds
· For Janus Henderson Emerging Markets Managed Volatility Fund, the Trustees noted that the Fund’s performance was in the bottom Broadridge quartile for the 36 months ended May 31, 2021 and the bottom Broadridge quartile for the 12 months ended May 31, 2021. The Trustees noted the reasons for the Fund’s underperformance and the steps the Adviser and subadviser had taken or were taking to improve performance.
· For Janus Henderson Global Income Managed Volatility Fund, the Trustees noted that the Fund’s performance was in the second Broadridge quartile for the 36 months ended May 31, 2021 and the bottom Broadridge quartile for the 12 months ended May 31, 2021.
· For Janus Henderson International Managed Volatility Fund, the Trustees noted that the Fund’s performance was in the bottom Broadridge quartile for the 36 months ended May 31, 2021 and the bottom Broadridge quartile for the 12 months ended May 31, 2021. The Trustees noted the reasons for the Fund’s underperformance, the steps the Adviser and subadviser had taken or were taking to improve performance.
· For Janus Henderson U.S. Managed Volatility Fund, the Trustees noted that the Fund’s performance was in the bottom Broadridge quartile for the 36 months ended May 31, 2021 and the bottom Broadridge quartile for the 12 months ended May 31, 2021. The Trustees noted the reasons for the Fund’s underperformance, the steps the Adviser and subadviser had taken or were taking to improve performance.
U.S. Equity Funds
· For Janus Henderson Mid Cap Value Fund, the Trustees noted that the Fund’s performance was in the bottom Broadridge quartile for the 36 months ended May 31, 2021 and the bottom Broadridge quartile for the 12 months ended May 31, 2021. The Trustees noted the reasons for the Fund’s underperformance, while also noting that the Fund has a performance fee structure that results in lower management fees during periods of underperformance, and the steps the Adviser had taken or was taking to improve performance.
· For Janus Henderson Small Cap Value Fund, the Trustees noted that the Fund’s performance was in the bottom Broadridge quartile for the 36 months ended May 31, 2021 and the bottom Broadridge quartile for the 12 months ended May 31, 2021. The Trustees noted the reasons for the Fund’s underperformance, while also noting that the Fund has a performance fee structure that results in lower management fees during periods of underperformance, and the steps the Adviser had taken or was taking to improve performance.
· For Janus Henderson Small-Mid Cap Value Fund, the Trustees noted that the Fund’s performance was in the third Broadridge quartile for the 36 months ended May 31, 2021 and the bottom Broadridge quartile for the 12 months ended May 31, 2021. The Trustees noted the reasons for the Fund’s underperformance, while also noting that the Fund has a performance fee structure that results in lower management fees during periods of underperformance, and the steps the Adviser had taken or was taking to improve performance.
Janus Henderson Multi-Sector Income Fund
Additional Information (unaudited)
In consideration of each Janus Henderson Fund’s performance, the Trustees concluded that, taking into account the factors relevant to performance, as well as other considerations, including steps taken to improve performance, the Janus Henderson Fund’s performance warranted continuation of such Janus Henderson Fund’s investment advisory and subadvisory agreement(s).
Costs of Services Provided
The Trustees examined information regarding the fees and expenses of each Janus Henderson Fund in comparison to similar information for other comparable funds as provided by Broadridge, an independent data provider. They also reviewed an analysis of that information provided by their independent fee consultant and noted that the rate of management fees (investment advisory fees and any administration fees but excluding out-of-pocket costs) for many of the Janus Henderson Funds, after applicable waivers, was below the average management fee rate of the respective peer group of funds selected by an independent data provider. The Trustees also examined information regarding the subadvisory fees charged for subadvisory services, as applicable, noting that all such fees were paid by the Adviser out of its management fees collected from such Janus Henderson Fund.
The independent fee consultant provided its belief that the management fees charged by the Adviser to each of the Janus Henderson Funds under the current investment advisory and administration agreements are reasonable in relation to the services provided by the Adviser. The independent fee consultant found: (1) the total expenses and management fees of the Janus Henderson Funds to be reasonable relative to other comparable mutual funds; (2) the total expenses, on average, were 8% under the average total expenses of the respective Broadridge Expense Group peers; and (3) and the management fees for the Janus Henderson Funds, on average, were 6% under the average management fees for the respective Broadridge Expense Group. The Trustees also considered the total expenses for each share class of each Janus Henderson Fund compared to the average total expenses for its Broadridge Expense Group and to average total expenses for its Broadridge Expense Universe.
For certain Janus Henderson Funds, the independent fee consultant also performed a systematic “focus list” analysis of expenses which assessed fund fees in the context of fund performance being delivered. Based on this analysis, the independent fee consultant found that the combination of service quality/performance and expenses on these individual Janus Henderson Funds was reasonable in light of performance trends, performance histories, and existence of performance fees, breakpoints, and/or expense waivers on such Janus Henderson Funds.
The Trustees considered the methodology used by the Adviser and subadviser in determining compensation payable to portfolio managers, the competitive environment for investment management talent, and the competitive market for mutual funds in different distribution channels.
The Trustees also reviewed management fees charged by the Adviser and subadviser to comparable separate account clients and to comparable non-affiliated funds subadvised by the Adviser or subadviser (for which the Adviser or the subadviser provides only or primarily portfolio management services). Although in most instances subadvisory and separate account fee rates for various investment strategies were lower than management fee rates for Janus Henderson Funds having a similar strategy, the Trustees considered that the Adviser noted that, under the terms of the management agreements with the Janus Henderson Funds, the Adviser performs significant additional services for the Janus Henderson Funds that it does not provide to those other clients, including administration services, oversight of the Janus Henderson Funds’ other service providers, trustee support, regulatory compliance and numerous other services, and that, in serving the Janus Henderson Funds, the Adviser assumes many legal risks and other costs that it does not assume in servicing its other clients. Moreover, the Trustees noted that the independent fee consultant found that: (1) the management fees the Adviser charges to the Janus Henderson Funds are reasonable in relation to the management fees the Adviser charges to funds subadvised by the Adviser and to the fees the Adviser charges to its institutional separate account clients; (2) these subadvised and institutional separate accounts have different service and infrastructure needs and operate in markets very distinct relative to retail funds; (3) Janus Henderson mutual fund investors enjoy reasonable fees relative to the fees charged to Janus Henderson subadvised fund and separate account investors; and (4) as part of its 2020 review, 9 of 10 Janus Henderson Funds have lower management fees than similar funds subadvised by the Adviser.
The Trustees considered the fees for each Janus Henderson Fund for its fiscal year ended in 2020, including the VIT Portfolios, and noted the following with regard to each VIT Portfolio’s total expenses, net of applicable fee waivers (the VIT Portfolio’s “total expenses”):
Janus Henderson Multi-Sector Income Fund
Additional Information (unaudited)
Asset Allocation Funds
· For Janus Henderson Global Allocation Fund – Conservative, the Trustees noted that, although the Fund’s total expenses exceeded the peer group average for certain share classes, overall the Fund’s total expenses were reasonable. The Trustees also noted that the Adviser has contractually agreed to limit the Fund’s expenses.
· For Janus Henderson Global Allocation Fund – Growth, the Trustees noted that, although the Fund’s total expenses exceeded the peer group average for certain share classes, overall the Fund’s total expenses were reasonable.
· For Janus Henderson Global Allocation Fund – Moderate, the Trustees noted that, although the Fund’s total expenses exceeded the peer group for certain share classes, overall the Fund’s total expenses were reasonable. The Trustees also noted that the Adviser has contractually agreed to limit the Fund’s expenses.
Fixed-Income Funds
· For Janus Henderson Absolute Return Income Opportunities Fund, the Trustees noted that, although the Fund’s total expenses exceeded the peer group for certain share classes, overall the Fund’s total expenses were reasonable. The Trustees also noted that the Adviser has contractually agreed to limit the Fund’s expenses.
· For Janus Henderson Developed World Bond Fund, the Trustees noted that, although the Fund’s total expenses exceeded the peer group for one share class, overall the Fund’s total expenses were reasonable. The Trustees also noted that the Adviser has contractually agreed to limit the Fund’s expenses.
· For Janus Henderson Flexible Bond Fund, the Trustees noted that, although the Fund’s total expenses exceeded the peer group for certain share classes, overall the Fund’s total expenses were reasonable. The Trustees also noted that the Adviser has contractually agreed to limit the Fund’s expenses, although this limit did not apply because the Fund’s total expenses were already below the applicable fee limit.
· For Janus Henderson Global Bond Fund, the Trustees noted that, although the Fund’s total expenses exceeded the peer group average for certain share classes, overall the Fund’s total expenses were reasonable. The Trustees also noted that the Adviser has contractually agreed to limit the Fund’s expenses.
· For Janus Henderson High-Yield Fund, the Trustees noted that, although the Fund’s total expenses exceeded the peer group for certain share classes, overall the Fund’s total expenses were reasonable. The Trustees also noted that the Adviser has contractually agreed to limit the Fund’s expenses.
· For Janus Henderson Multi-Sector Income Fund, the Trustees noted that, although the Fund’s total expenses exceeded the peer group for certain share classes, overall the Fund’s total expenses were reasonable. The Trustees also noted that the Adviser has contractually agreed to limit the Fund’s expenses.
· For Janus Henderson Short Duration Flexible Bond Fund, the Trustees noted that, although the Fund’s total expenses exceeded the peer group for certain share classes, overall the Fund’s total expenses were reasonable. The Trustees also noted that the Adviser has contractually agreed to limit the Fund’s expenses.
Global and International Equity Funds
· For Janus Henderson Asia Equity Fund, the Trustees noted that, although the Fund’s total expenses exceeded the peer group for certain share classes, overall the Fund’s total expenses were reasonable. The Trustees also noted that the Adviser has contractually agreed to limit the Fund’s expenses.
· For Janus Henderson Emerging Markets Fund, the Trustees noted that, although the Fund’s total expenses exceeded the peer group for certain share classes, overall the Fund’s total expenses were reasonable. The Trustees also noted that the Adviser has contractually agreed to limit the Fund’s expenses.
· For Janus Henderson European Focus Fund, the Trustees noted that, although the Fund’s total expenses exceeded the peer group average for certain share classes, overall the Fund’s total expenses were reasonable. The Trustees also noted that the Adviser has contractually agreed to limit the Fund’s expenses.
· For Janus Henderson Global Equity Income Fund, the Trustees noted that, although the Fund’s total expenses exceeded the peer group for one share class, overall the Fund’s total expenses were reasonable. The Trustees also noted that the Adviser has contractually agreed to limit the Fund’s expenses, although this limit did not apply because the Fund’s total expenses were already below the applicable fee limit.
Janus Henderson Multi-Sector Income Fund
Additional Information (unaudited)
· For Janus Henderson Global Life Sciences Fund, the Trustees noted that the Fund’s total expenses were below the peer group for all share classes.
· For Janus Henderson Global Real Estate Fund, the Trustees noted, although the Fund’s total expenses exceeded the peer group average for certain share classes, overall the Fund’s total expenses were reasonable. The Trustees also noted that the Adviser has contractually agreed to limit the Fund’s expenses, although this limit did not apply because the Fund’s total expenses were already below the applicable fee limit.
· For Janus Henderson Global Research Fund, the Trustees noted that the Fund’s total expenses were below the peer group for all share classes.
· For Janus Henderson Global Select Fund, the Trustees noted that, although the Fund’s total expenses exceeded the peer group average for one share class, overall the Fund’s total expenses were reasonable. The Trustees also noted that the Adviser has contractually agreed to limit the Fund’s expenses.
· For Janus Henderson Global Sustainable Equity Fund, the Trustees noted that the Fund’s total expenses were below the peer group for all share classes.
· For Janus Henderson Global Technology and Innovation Fund, the Trustees noted that the Fund’s total expenses were below the peer group for all share classes.
· For Janus Henderson International Opportunities Fund, the Trustees noted that, although the Fund’s total expenses exceeded the peer group average for certain share classes, overall the Fund’s total expenses were reasonable. The Trustees also noted that the Adviser has contractually agreed to limit the Fund’s expenses.
· For Janus Henderson Overseas Fund, the Trustees noted that although the Fund’s total expenses exceeded the peer group average for certain share classes, overall the Fund’s total expenses were reasonable. The Trustees also noted that the Adviser has contractually agreed to limit the Fund’s expenses, although this limit did not apply because the Fund’s total expenses were already below the applicable fee limit.
Money Market Funds
· For Janus Henderson Government Money Market Fund, the Trustees noted that, although the Fund’s total expenses exceeded the peer group for both share classes, overall the Fund’s total expenses were reasonable. The Trustees also noted that the Adviser has voluntarily agreed to limit the Fund’s expenses to assist the Fund in attempting to maintain a yield of at least 0.00%.
· For Janus Henderson Money Market Fund, the Trustees noted that, although the Fund’s total expenses exceeded the peer group for both share classes, overall the Fund’s total expenses were reasonable. The Trustees also noted that the Adviser has agreed to limit the Fund’s expenses to assist the Fund in attempting to maintain a yield of at least 0.00%.
Multi-Asset Funds
· For Janus Henderson Adaptive Global Allocation Fund, the Trustees noted that, that the Fund’s total expenses were below the peer group average for all share classes.
· For Janus Henderson Dividend & Income Builder Fund, the Trustees noted that, that the Fund’s total expenses were below the peer group average for all share classes.
Multi-Asset U.S. Equity Funds
· For Janus Henderson Balanced Fund, the Trustees noted that, although the Fund’s total expenses exceeded the peer group average for certain share classes, overall the Fund’s total expenses were reasonable. The Trustees also noted that the Adviser has contractually agreed to limit the Fund’s expenses, although this limit did not apply because the Fund’s total expenses were already below the applicable fee limit.
· For Janus Henderson Contrarian Fund, the Trustees noted that, although the Fund’s total expenses exceeded the peer group average for certain share classes, overall the Fund’s total expenses were reasonable. The Trustees also noted that the Adviser had contractually agreed to limit the Fund’s expenses.
· For Janus Henderson Enterprise Fund, the Trustees noted that, although the Fund’s total expenses exceeded the peer group for certain share classes, overall the Fund’s total expenses were reasonable. The Trustees also noted
Janus Henderson Multi-Sector Income Fund
Additional Information (unaudited)
that the Adviser has contractually agreed to limit the Fund’s expenses, although this limit did not apply because the Fund’s total expenses were already below the applicable fee limit.
· For Janus Henderson Forty Fund, the Trustees noted that, although the Fund’s total expenses exceeded the peer group for certain share classes, overall the Fund’s total expenses were reasonable. The Trustees also noted that the Adviser has contractually agreed to limit the Fund’s expenses, although this limit did not apply because the Fund’s total expenses were already below the applicable fee limit.
· For Janus Henderson Growth and Income Fund, the Trustees noted that, although the Fund’s total expenses exceeded the peer group for certain share classes, overall the Fund’s total expenses were reasonable. The Trustees also noted that the Adviser has contractually agreed to limit the Fund’s expenses, although this limit did not apply because the Fund’s total expenses were already below the applicable fee limit.
· For Janus Henderson Research Fund, the Trustees noted that, although the Fund’s total expenses exceeded the peer group for one share class, overall the Fund’s total expenses were reasonable. The Trustees also noted that the Adviser has contractually agreed to limit the Fund’s expenses, although this limit did not apply because the Fund’s total expenses were already below the applicable fee limit.
· For Janus Henderson Triton Fund, the Trustees noted that the Fund’s total expenses were below the peer group for all share classes.
· For Janus Henderson Venture Fund, the Trustees noted that the Fund’s total expenses were below the peer group for all share classes.
Quantitative Equity Funds
· For Janus Henderson Emerging Markets Managed Volatility Fund, the Trustees noted that, although the Fund’s total expenses exceeded the peer group for certain share classes, overall the Fund’s total expenses were reasonable. The Trustees also noted that the Adviser has contractually agreed to limit the Fund’s expenses.
· For Janus Henderson Global Income Managed Volatility Fund, the Trustees noted that the Fund’s total expenses were below the peer group for all share classes.
· For Janus Henderson International Managed Volatility Fund, the Trustees noted that, although the Fund’s total expenses exceeded the peer group for certain share classes, overall the Fund’s total expenses were reasonable. The Trustees also noted that the Adviser has contractually agreed to limit the Fund’s expenses.
· For Janus Henderson U.S. Managed Volatility Fund, the Trustees noted that, although the Fund’s total expenses exceeded the peer group for certain share classes, overall the Fund’s total expenses were reasonable. The Trustees also noted that the Adviser has contractually agreed to limit the Fund’s expenses, although this limit did not apply because the Fund’s total expenses were already below the applicable fee limit.
U.S. Equity Funds
· For Janus Henderson Mid Cap Value Fund, the Trustees noted that, although the Fund’s total expenses exceeded the peer group average for certain share classes, overall the Fund’s total expenses were reasonable. The Trustees also noted that the Adviser has contractually agreed to limit the Fund’s expenses, although this limit did not apply because the Fund’s total expenses were already below the applicable fee limit.
· For Janus Henderson Small Cap Value Fund, the Trustees noted that, although the Fund’s total expenses exceeded the peer group average for certain share classes, overall the Fund’s total expenses were reasonable. The Trustees also noted that the Adviser has contractually agreed to limit the Fund’s expenses, although this limit did not apply because the Fund’s total expenses were already below the applicable fee limit.
· For Janus Henderson Small-Mid Cap Value Fund, the Trustees noted that, although the Fund’s total expenses exceeded the peer group average for certain share classes, overall the Fund’s total expenses were reasonable. The Trustees also noted that the Adviser has contractually agreed to limit the Fund’s expenses.
The Trustees reviewed information on the overall profitability to the Adviser and its affiliates from their relationships with the Janus Henderson Funds, and considered profitability data of other publicly traded mutual fund advisers. The Trustees recognized that profitability comparisons among fund managers are difficult because of the variation in the type of comparative information that is publicly available, and the profitability of any fund manager is affected by
Janus Henderson Multi-Sector Income Fund
Additional Information (unaudited)
numerous factors, including the organizational structure of the particular fund manager, differences in complex size, difference in product mix, difference in types of business (mutual fund, institutional and other), differences in the types of funds and other accounts it manages, possible other lines of business, the methodology for allocating expenses and the fund manager’s capital structure and cost of capital.
Additionally, the Trustees considered the estimated profitability to the Adviser from the investment management services it provided to each Janus Henderson Fund. In their review, the Trustees considered whether the Adviser and subadviser receive adequate incentives and resources to manage the Janus Henderson Funds effectively. In reviewing profitability, the Trustees noted that the estimated profitability for an individual Janus Henderson Fund is necessarily a product of the allocation methodology utilized by the Adviser to allocate its expenses as part of the estimated profitability calculation. In this regard, the Trustees noted that the independent fee consultant found that (1) the expense allocation methodology and rationales utilized by the Adviser were reasonable and (2) no clear correlation exists between expense allocations and operating margins. The Trustees also considered that the estimated profitability for an individual Janus Henderson Fund was influenced by a number of factors, including not only the allocation methodology selected, but also the presence of fee waivers and expense caps, and whether the Janus Henderson Fund’s investment management agreement contained breakpoints or a performance fee component. The Trustees determined, after taking into account these factors, among others, that the Adviser’s estimated profitability with respect to each Janus Henderson Fund was not unreasonable in relation to the services provided, and that the variation in the range of such estimated profitability among the Janus Henderson Funds was not a material factor in the Board’s approval of the reasonableness of any Janus Henderson Fund’s investment management fees.
The Trustees concluded that the management fees payable by each Janus Henderson Fund to the Adviser and its affiliates, as well as the fees paid by the Adviser to the subadviser of subadvised Janus Henderson Funds, were reasonable in relation to the nature, extent, and quality of the services provided, taking into account the fees charged by other advisers for managing comparable mutual funds with similar strategies, the fees the Adviser and the subadviser charge to other clients, and, as applicable, the impact of fund performance on management fees payable by the Janus Henderson Funds. The Trustees also concluded that each Janus Henderson Fund’s total expenses were reasonable, taking into account the size of the Janus Henderson Fund, the quality of services provided by the Adviser and subadviser, the investment performance of the Janus Henderson Fund, and any expense limitations agreed to or provided by the Adviser.
Economies of Scale
The Trustees considered information about the potential for the Adviser to realize economies of scale as the assets of the Janus Henderson Funds increase. They noted that their independent fee consultant published a report to the Trustees in November 2019 which provided its research and analysis into economies of scale. They also noted that, although many Janus Henderson Funds pay advisory fees at a fixed base rate as a percentage of net assets, without any breakpoints or performance fees, their independent fee consultant concluded that 75% of these Janus Henderson Funds’ have contractual management fees (gross of waivers) below their Broadridge Expense Group averages. The Trustees also noted the following: (1) that for those Janus Henderson Funds whose expenses are being reduced by the contractual expense limitations of the Adviser, the Adviser is subsidizing certain of these Janus Henderson Funds because they have not reached adequate scale; (2) performance fee structures have been implemented for various Janus Henderson Funds that have caused the effective rate of advisory fees payable by such Janus Henderson Fund to vary depending on the investment performance of the Janus Henderson Fund relative to its benchmark index over the measurement period; and (3) a few Janus Henderson Funds have fee schedules with breakpoints and reduced fee rates above certain asset levels. The Trustees also noted that the Janus Henderson Funds share directly in economies of scale through the significant investments made by the Adviser and its affiliates related to services provided to the Funds and the lower charges of third-party service providers that are based in part on the combined scale of all of the Janus Henderson Funds.
The Trustees also considered the independent fee consultant’s conclusion that, given the limitations of various analytical approaches to economies of scale and their conflicting results, it is difficult to analytically confirm or deny the existence of economies of scale in the Janus Henderson complex. In this regard, the independent consultant concluded that (1) to the extent there were economies of scale at the Adviser, the Adviser’s general strategy of setting fixed management fees below peers appeared to share any such economies with investors even on smaller Janus Henderson Funds which have not yet achieved those economies and (2) by setting lower fixed fees from the start on these Janus Henderson Funds, the Adviser appeared to be investing to increase the likelihood that these Janus
Janus Henderson Multi-Sector Income Fund
Additional Information (unaudited)
Henderson Funds will grow to a level to achieve any economies of scale that may exist. Further, the independent fee consultant provided its belief that Janus Henderson Fund investors are well-served by the fee levels and performance fee structures in place on the Janus Henderson Funds in light of any economies of scale that may be present at the Adviser.
Based on all of the information reviewed, including the recent and past research and analysis conducted by the Trustees’ independent fee consultant, the Trustees concluded that the current fee structure of each Janus Henderson Fund was reasonable and that the current rates of fees do reflect a sharing between the Adviser and the Janus Henderson Fund of any economies of scale that may be present at the current asset level of the Janus Henderson Fund.
Other Benefits to the Adviser
The Trustees also considered benefits that accrue to the Adviser and its affiliates and subadviser to the Janus Henderson Funds from their relationships with the Janus Henderson Funds. They recognized that two affiliates of the Adviser separately serve the Janus Henderson Funds as transfer agent and distributor, respectively, and the transfer agent receives compensation directly from the non-money market funds for services provided, and that such compensation contributes to the overall profitability of the Adviser and its affiliates that results from their relationship with the Janus Henderson Funds. The Trustees also considered the Adviser’s past and proposed use of commissions paid by the Janus Henderson Funds on portfolio brokerage transactions to obtain proprietary and third-party research products and services benefiting the Janus Henderson Fund and/or other clients of the Adviser and/or the Adviser, and/or subadviser to a Janus Henderson Fund. The Trustees concluded that the Adviser’s and the subadviser’s use of these types of client commission arrangements to obtain proprietary and third-party research products and services was consistent with regulatory requirements and guidelines and was likely to benefit each Janus Henderson Fund. The Trustees also concluded that, other than the services provided by the Adviser and its affiliates and subadviser pursuant to the agreements and the fees to be paid by each Janus Henderson Fund therefor, the Janus Henderson Funds and the Adviser and the subadviser may potentially benefit from their relationship with each other in other ways. They concluded that the Adviser and its affiliates share directly in economies of scale through the lower charges of third-party service providers that are based in part on the combined scale of the Janus Henderson Funds and other clients serviced by the Adviser and its affiliates. They also concluded that the Adviser and the subadviser benefit from the receipt of research products and services acquired through commissions paid on portfolio transactions of the Janus Henderson Funds and that the Janus Henderson Funds benefit from the Adviser’s and/or the subadviser’s receipt of those products and services as well as research products and services acquired through commissions paid by other clients of the Adviser and/or other clients of the subadviser. They further concluded that the success of any Janus Henderson Fund could attract other business to the Adviser, the subadviser or other Janus Henderson funds, and that the success of the Adviser and the subadviser could enhance the Adviser’s and the subadviser’s ability to serve the Janus Henderson Funds.
Janus Henderson Multi-Sector Income Fund
Liquidity Risk Management Program (unaudited)
Liquidity Risk Management Program
Rule 22e-4 under the Investment Company Act of 1940, as amended (the “Liquidity Rule”), requires open-end funds (but not money market funds) to adopt and implement a written liquidity risk management program (the “LRMP”) that is reasonably designed to assess and manage liquidity risk, which is the risk that a fund could not meet redemption requests without significant dilution of remaining investors’ interest in the fund. The Fund has implemented a LRMP, which incorporates the following elements: (i) assessment, management, and periodic review of liquidity risk; (ii) classification of portfolio holdings; (iii) the establishment and monitoring of a highly liquid investment minimum, as applicable; (iv) a 15% limitation on a Fund’s illiquid investments; (v) redemptions in-kind; and (vi) board oversight.
The Trustees of the Fund (the “Trustees”) have designated Janus Henderson Investors US LLC, the Fund’s investment adviser (the “Adviser”), as the Program Administrator for the LRMP responsible for administering the LRMP and carrying out the specific responsibilities of the LRMP. A working group comprised of various teams within the Adviser’s business is responsible for administering the LRMP and carrying out the specific responsibilities of different aspects of the LRMP (the “Liquidity Risk Working Group”). In assessing each Fund’s liquidity risk, the Liquidity Risk Working Group periodically considers, as relevant, factors including (i) the liquidity of a Fund’s portfolio investments during normal and reasonably foreseeable stressed conditions; (ii) whether a Fund’s investment strategy is appropriate for an open-end fund; (iii) the extent to which a Fund’s strategy involves a relatively concentrated portfolio or large positions in any issuer; (iv) a Fund’s use of borrowing for investment purposes; and (v) a Fund’s use of derivatives.
The Liquidity Rule requires the Trustees to review at least annually a written report provided by the Program Administrator that addresses the operation of the LRMP and assesses its adequacy and the effectiveness of its implementation, including, if applicable, the operation of the highly liquid investment minimum, and any material changes to the LRMP (the “Program Administrator Report”). At a meeting held on March 16, 2022, the Adviser provided the Program Administrator Report to the Trustees which covered the operation of the LRMP from January 1, 2021 through December 31, 2021 (the “Reporting Period”).
The Program Administrator Report discussed the operation and effectiveness of the LRMP during the Reporting Period. It noted that the Fund was able to meet redemptions during the normal course of business during the Reporting Period. The Program Administrator Report also stated that the Fund did not exceed the 15% limit on illiquid assets during the Reporting Period, that the Fund held primarily highly liquid assets, and was considered to be a primarily highly liquid fund during the Reporting Period. In addition, the Adviser expressed its belief in the Program Administrator Report that the LRMP is reasonably designed and adequate to assess and manage the Fund’s liquidity risk, considering the Fund’s particular risks and circumstances, and includes policies and procedures reasonably designed to implement each required component of the Liquidity Rule.
There can be no assurance that the LRMP will achieve its objectives in the future. Please refer to your Fund’s prospectus for more information regarding the risks to which an investment in the Fund may be subject.
Janus Henderson Multi-Sector Income Fund
Useful Information About Your Fund Report (unaudited)
Management Commentary
The Management Commentary in this report includes valuable insight as well as statistical information to help you understand how your Fund’s performance and characteristics stack up against those of comparable indices.
If the Fund invests in foreign securities, this report may include information about country exposure. Country exposure is based primarily on the country of risk. A company may be allocated to a country based on other factors such as location of the company’s principal office, the location of the principal trading market for the company’s securities, or the country where a majority of the company’s revenues are derived.
Please keep in mind that the opinions expressed in the Management Commentary are just that: opinions. They are a reflection based on best judgment at the time this report was compiled, which was June 30, 2022. As the investing environment changes, so could opinions. These views are unique and are not necessarily shared by fellow employees or by Janus Henderson in general.
Performance Overviews
Performance overview graphs compare the performance of a hypothetical $10,000 investment in the Fund with one or more widely used market indices. When comparing the performance of the Fund with an index, keep in mind that market indices are not available for investment and do not reflect deduction of expenses.
Average annual total returns are quoted for a Fund with more than one year of performance history. Average annual total return is calculated by taking the growth or decline in value of an investment over a period of time, including reinvestment of dividends and distributions, then calculating the annual compounded percentage rate that would have produced the same result had the rate of growth been constant throughout the period. Average annual total return does not reflect the deduction of taxes that a shareholder would pay on Fund distributions or redemptions of Fund shares.
Cumulative total returns are quoted for a Fund with less than one year of performance history. Cumulative total return is the growth or decline in value of an investment over time, independent of the period of time involved. Cumulative total return does not reflect the deduction of taxes that a shareholder would pay on Fund distributions or redemptions of Fund shares.
Pursuant to federal securities rules, expense ratios shown in the performance chart reflect subsidized (if applicable) and unsubsidized ratios. The total annual fund operating expenses ratio is gross of any fee waivers, reflecting the Fund’s unsubsidized expense ratio. The net annual fund operating expenses ratio (if applicable) includes contractual waivers of the Adviser and reflects the Fund’s subsidized expense ratio. Ratios may be higher or lower than those shown in the “Financial Highlights” in this report.
Schedule of Investments
Following the performance overview section is the Fund’s Schedule of Investments. This schedule reports the types of securities held in the Fund on the last day of the reporting period. Securities are usually listed by type (common stock, corporate bonds, U.S. Government obligations, etc.) and by industry classification (banking, communications, insurance, etc.). Holdings are subject to change without notice.
The value of each security is quoted as of the last day of the reporting period. The value of securities denominated in foreign currencies is converted into U.S. dollars.
If the Fund invests in foreign securities, it will also provide a summary of investments by country. This summary reports the Fund exposure to different countries by providing the percentage of securities invested in each country. The country of each security represents the country of risk. The Fund’s Schedule of Investments relies upon the industry group and country classifications published by Bloomberg and/or MSCI Inc.
Tables listing details of individual forward currency contracts, futures, written options, swaptions, and swaps follow the Fund’s Schedule of Investments (if applicable).
Statement of Assets and Liabilities
This statement is often referred to as the “balance sheet.” It lists the assets and liabilities of the Fund on the last day of the reporting period.
Janus Henderson Multi-Sector Income Fund
Useful Information About Your Fund Report (unaudited)
The Fund’s assets are calculated by adding the value of the securities owned, the receivable for securities sold but not yet settled, the receivable for dividends declared but not yet received on securities owned, and the receivable for Fund shares sold to investors but not yet settled. The Fund’s liabilities include payables for securities purchased but not yet settled, Fund shares redeemed but not yet paid, and expenses owed but not yet paid. Additionally, there may be other assets and liabilities such as unrealized gain or loss on forward currency contracts.
The section entitled “Net Assets Consist of” breaks down the components of the Fund’s net assets. Because the Fund must distribute substantially all earnings, you will notice that a significant portion of net assets is shareholder capital.
The last section of this statement reports the net asset value (“NAV”) per share on the last day of the reporting period. The NAV is calculated by dividing the Fund’s net assets for each share class (assets minus liabilities) by the number of shares outstanding.
Statement of Operations
This statement details the Fund’s income, expenses, realized gains and losses on securities and currency transactions, and changes in unrealized appreciation or depreciation of Fund holdings.
The first section in this statement, entitled “Investment Income,” reports the dividends earned from securities and interest earned from interest-bearing securities in the Fund.
The next section reports the expenses incurred by the Fund, including the advisory fee paid to the investment adviser, transfer agent fees and expenses, and printing and postage for mailing statements, financial reports and prospectuses. Expense offsets and expense reimbursements, if any, are also shown.
The last section lists the amounts of realized gains or losses from investment and foreign currency transactions, and changes in unrealized appreciation or depreciation of investments and foreign currency-denominated assets and liabilities. The Fund will realize a gain (or loss) when it sells its position in a particular security. A change in unrealized gain (or loss) refers to the change in net appreciation or depreciation of the Fund during the reporting period. “Net Realized and Unrealized Gain/(Loss) on Investments” is affected both by changes in the market value of Fund holdings and by gains (or losses) realized during the reporting period.
Statements of Changes in Net Assets
These statements report the increase or decrease in the Fund’s net assets during the reporting period. Changes in the Fund’s net assets are attributable to investment operations, dividends and distributions to investors, and capital share transactions. This is important to investors because it shows exactly what caused the Fund’s net asset size to change during the period.
The first section summarizes the information from the Statement of Operations regarding changes in net assets due to the Fund’s investment operations. The Fund’s net assets may also change as a result of dividend and capital gains distributions to investors. If investors receive their dividends and/or distributions in cash, money is taken out of the Fund to pay the dividend and/or distribution. If investors reinvest their dividends and/or distributions, the Fund’s net assets will not be affected.
The reinvestment of dividends and distributions is included under “Capital Share Transactions.” “Capital Shares” refers to the money investors contribute to the Fund through purchases or withdrawals via redemptions. The Fund’s net assets will increase and decrease in value as investors purchase and redeem shares from the Fund.
Financial Highlights
This schedule provides a per-share breakdown of the components that affect the Fund’s NAV for current and past reporting periods as well as total return, asset size, ratios, and portfolio turnover rate.
The first line in the table reflects the NAV per share at the beginning of the reporting period. The next line reports the net investment income/(loss) per share. Following is the per share total of net gains/(losses), realized and unrealized. Per share dividends and distributions to investors are then subtracted to arrive at the NAV per share at the end of the period. The next line reflects the total return for the period. The total return may include adjustments in accordance with generally accepted accounting principles required at the period end for financial reporting purposes. As a result, the total return may differ from the total return reflected for individual shareholder transactions. Also included are ratios of expenses and net investment income to average net assets.
Janus Henderson Multi-Sector Income Fund
Useful Information About Your Fund Report (unaudited)
The Fund’s expenses may be reduced through expense offsets and expense reimbursements. The ratios shown reflect expenses before and after any such offsets and reimbursements.
The ratio of net investment income/(loss) summarizes the income earned less expenses, divided by the average net assets of the Fund during the reporting period. Do not confuse this ratio with the Fund’s yield. The net investment income ratio is not a true measure of the Fund’s yield because it does not take into account the dividends distributed to the Fund’s investors.
The next figure is the portfolio turnover rate, which measures the buying and selling activity in the Fund. Portfolio turnover is affected by market conditions, changes in the asset size of the Fund, fluctuating volume of shareholder purchase and redemption orders, the nature of the Fund’s investments, and the investment style and/or outlook of the portfolio manager(s) and/or investment personnel. A 100% rate implies that an amount equal to the value of the entire portfolio was replaced once during the fiscal year; a 50% rate means that an amount equal to the value of half the portfolio is traded in a year; and a 200% rate means that an amount equal to the value of the entire portfolio is traded every six months.
Janus Henderson Multi-Sector Income Fund
Designation Requirements (unaudited)
For federal income tax purposes, the Fund designated the following for the year ended June 30, 2022:
| | |
| | |
Section 163(j) Interest Dividend | 87% |
Capital Gain Distributions | $6,289,592 |
Return of Capital Distributions | $1,604,625 |
Qualified Dividend Income Percentage | 1% |
Janus Henderson Multi-Sector Income Fund
Trustees and Officers (unaudited)
The following are the Trustees and officers of the Trust, together with a brief description of their principal occupations during the last five years (principal occupations for certain Trustees may include periods over five years). The Fund’s Statement of Additional Information includes additional information about the Trustees and officers and is available, without charge, by calling 1-877-335-2687.
Each Trustee has served in that capacity since he or she was originally elected or appointed. The Trustees do not serve a specified term of office. Each Trustee will hold office until the termination of the Trust or his or her earlier death, resignation, retirement, incapacity, or removal. Under the Fund’s Governance Procedures and Guidelines, the policy is for Trustees to retire no later than the end of the calendar year in which the Trustee turns 75. The Trustees review the Fund’s Governance Procedures and Guidelines from time to time and may make changes they deem appropriate. The Fund’s Nominating and Governance Committee will consider nominees for the position of Trustee recommended by shareholders. Shareholders may submit the name of a candidate for consideration by the Committee by submitting their recommendations to the Trust’s Secretary. Each Trustee is currently a Trustee of one other registered investment company advised by the Adviser: Janus Aspen Series. Collectively, these two registered investment companies consist of 50 series or funds referred to herein as the Fund Complex.
The Trust’s officers are elected annually by the Trustees for a one-year term. Certain officers also serve as officers of Janus Aspen Series. Certain officers of the Fund may also be officers and/or directors of the Adviser. Except as otherwise disclosed, Fund officers receive no compensation from the Fund, except for the Fund’s Chief Compliance Officer, as authorized by the Trustees.
| | | | | | |
TRUSTEES |
Name, Address, and Age | Positions Held with the Trust | Length of Time Served | Principal Occupations During the Past Five Years | Number of Portfolios/Funds in Fund Complex Overseen by Trustee | Other Directorships Held by Trustee During the Past Five Years |
Independent Trustees | | | | |
Alan A. Brown
151 Detroit Street
Denver, CO 80206
DOB: 1962 | Chairman
Trustee | 5/22-Present
1/13-Present | Principal, Curam Holdings LLC (since 2018). Formerly, Executive Vice President, Institutional Markets, of Black Creek Group (private equity real estate investment management firm) (2012-2018), Executive Vice President and Co-Head, Global Private Client Group (2007-2010), Executive Vice President, Mutual Funds (2005-2007), and Chief Marketing Officer (2001-2005) of Nuveen Investments, Inc. (asset management). | 50 | Advisory Board Member of AEW Core Property Trust (open-end property fund) (since 2020), and Director of WTTW (PBS affiliate) (since 2003). Formerly, Director of MotiveQuest LLC (strategic social market research company) (2003-2016), Director of Nuveen Global Investors LLC (2007-2011), Director of Communities in Schools (2004-2010), and Director of Mutual Fund Education Alliance (until 2010). |
Janus Henderson Multi-Sector Income Fund
Trustees and Officers (unaudited)
| | | | | | |
TRUSTEES |
Name, Address, and Age | Positions Held with the Trust | Length of Time Served | Principal Occupations During the Past Five Years | Number of Portfolios/Funds in Fund Complex Overseen by Trustee | Other Directorships Held by Trustee During the Past Five Years |
Independent Trustees | | | | |
Cheryl D. Alston
151 Detroit Street
Denver, CO 80206
DOB: 1966 | Trustee | 8/22-Present | Executive Director and Chief Investment Officer, Employees’ Retirement Fund of the City of Dallas (since 2004). | 50 | Director of Blue Cross Blue Shield of Kansas City (a not-for-profit health insurance provider) (since 2016) and Director of Global Life Insurance (life and supplemental health insurance provider) (since 2017). Formerly, Director of Federal Home Loan Bank of Dallas (2017-2021). |
Janus Henderson Multi-Sector Income Fund
Trustees and Officers (unaudited)
| | | | | | |
TRUSTEES |
Name, Address, and Age | Positions Held with the Trust | Length of Time Served | Principal Occupations During the Past Five Years | Number of Portfolios/Funds in Fund Complex Overseen by Trustee | Other Directorships Held by Trustee During the Past Five Years |
Independent Trustees | | | | |
William D. Cvengros
151 Detroit Street
Denver, CO 80206
DOB: 1948 | Trustee | 1/11-Present | Chief Executive Officer of SJC Capital, LLC (a personal investment company and consulting firm) (since 2002). Formerly, Chief Executive Officer and President of PIMCO Advisors Holdings L.P. (a publicly traded investment management firm) (1994-2000), and Chief Investment Officer (1987-1994) and Vice Chairman and Director (1990-1994) of Pacific Life Insurance Company (a mutual life insurance and annuity company) (1987-1994). | 50 | Member, Limited Partner Advisory Committee, Karmel Capital Fund III (later stage growth fund) (since 2022), Member of the Investment Committee for the Orange County Community Foundation (a grantmaking foundation) (since 2020), Advisory Board Member, RevOZ Fund LP and related funds (real estate investments for opportunity zones) (since 2020), and Advisory Board Member, Innovate Partners Emerging Growth and Equity Fund I (early stage venture capital fund) (since 2014). Formerly, Managing Trustee of National Retirement Partners Liquidating Trust (2013-2016), Chairman, National Retirement Partners, Inc. (formerly a network of advisors to 401(k) plans) (2005-2013), Director of Prospect Acquisition Corp. (a special purpose acquisition corporation) (2007-2009), Director of RemedyTemp, Inc. (temporary help services company) (1996-2006), and Trustee of PIMCO Funds Multi-Manager Series (1990-2000) and Pacific Life Variable Life & Annuity Trusts (1987-1994). |
Janus Henderson Multi-Sector Income Fund
Trustees and Officers (unaudited)
| | | | | | |
TRUSTEES |
Name, Address, and Age | Positions Held with the Trust | Length of Time Served | Principal Occupations During the Past Five Years | Number of Portfolios/Funds in Fund Complex Overseen by Trustee | Other Directorships Held by Trustee During the Past Five Years |
Independent Trustees | | | | |
Raudline Etienne
151 Detroit Street
Denver, CO 80206
DOB: 1965 | Trustee | 6/16-Present | Founder, Daraja Capital (advisory and investment firm) (since 2016). Formerly, Senior Vice President and Senior Advisor, Albright Stonebridge Group LLC (global strategy firm) (2011-2021), and Deputy Comptroller and Chief Investment Officer, New York State Common Retirement Fund (public pension fund) (2008-2011). | 50 | Member of the Investment Committee for Cooper Union (private college) (since 2021), Board Member, Van Alen Institute (nonprofit architectural and design organization) (since 2019) and Director of Brightwood Capital Advisors, LLC (since 2014). |
Darrell B. Jackson
151 Detroit Street
Denver, CO 80206
DOB: 1958 | Trustee | 8/22-Present | President and Chief Executive Officer, The Efficace Group Inc. (since 2018). Formerly, President and Chief Executive Officer, Seaway Bank and Trust Company (community bank) (2014-2015), and Executive Vice President and Co-President, Wealth Management (2009-2014), and several senior positions, including Group Executive, Senior Vice President, and Vice President (1995-2009) of Northern Trust Company (financial services company) (1995-2014). | 50 | Director of Amalgamated Financial Corp (bank) (since August 2021), Director of YR Media (a not-for-profit production company) (since 2021), and Director of Gray-Bowen-Scott (transportation project consulting firm) (since April 2020). Formerly, Director of Delaware Place Bank (closely held commercial bank) (2016-2018) and Director of Seaway Bank and Trust Company (2014-2015). |
Janus Henderson Multi-Sector Income Fund
Trustees and Officers (unaudited)
| | | | | | |
TRUSTEES |
Name, Address, and Age | Positions Held with the Trust | Length of Time Served | Principal Occupations During the Past Five Years | Number of Portfolios/Funds in Fund Complex Overseen by Trustee | Other Directorships Held by Trustee During the Past Five Years |
Independent Trustees | | | | |
William F. McCalpin
151 Detroit Street
Denver, CO 80206
DOB: 1957 | Trustee | 6/02-Present | Chief Executive Officer, muun chi LLC (organic food business) (since 2022). Formerly, Chief Operating Officer, muun chi LLC (2020-2022), Managing Partner, Impact Investments, Athena Capital Advisors LLC (independent registered investment advisor) (2016-2019), Managing Director, Holos Consulting LLC (provides consulting services to foundations and other nonprofit organizations) (2009-2016), Chief Executive Officer, Imprint Capital Advisors (impact investment firm) (2013-2015), and Executive Vice President and Chief Operating Officer of The Rockefeller Brothers Fund (a private family foundation) (1998-2006). | 50 | Chairman of the Board and Trustee of The Investment Fund for Foundations Investment Program (TIP) (consisting of 1 fund) (since 2008) and Director of the F.B. Heron Foundation (a private grantmaking foundation) (since 2006). Formerly, Director of Mutual Fund Directors Forum (a non-profit organization serving independent directors of U.S. mutual funds) (2016-2021). |
Janus Henderson Multi-Sector Income Fund
Trustees and Officers (unaudited)
| | | | | | |
TRUSTEES |
Name, Address, and Age | Positions Held with the Trust | Length of Time Served | Principal Occupations During the Past Five Years | Number of Portfolios/Funds in Fund Complex Overseen by Trustee | Other Directorships Held by Trustee During the Past Five Years |
Independent Trustees | | | | |
Gary A. Poliner
151 Detroit Street
Denver, CO 80206
DOB: 1953 | Trustee | 6/16-Present | Retired. Formerly, President (2010-2013) of Northwestern Mutual Life Insurance Company. | 50 | Director of MGIC Investment Corporation (private mortgage insurance) (since 2013). Formerly, Director, West Bend Mutual Insurance Company (property/casualty insurance) (2013-2021), Trustee of Northwestern Mutual Life Insurance Company (2010-2013) and Director of Frank Russell Company (global asset management firm) (2008-2013). |
Diane L. Wallace
151 Detroit Street
Denver, CO 80206
DOB: 1958 | Trustee | 6/17-Present | Retired. Formerly, Chief Operating Officer, Senior Vice President-Operations, and Chief Financial Officer for Driehaus Capital Management, LLC (1988-2006) and Treasurer for Driehaus Mutual Funds (1996-2002). | 50 | Formerly, Director of Family Service of Lake County (2019-2021), Independent Trustee, Henderson Global Funds (13 portfolios) (2015-2017), Independent Trustee, State Farm Associates’ Funds Trust, State Farm Mutual Fund Trust, and State Farm Variable Product Trust (28 portfolios) (2013-2017).
|
Janus Henderson Multi-Sector Income Fund
Trustees and Officers (unaudited)
| | | | | | |
TRUSTEES |
Name, Address, and Age | Positions Held with the Trust | Length of Time Served | Principal Occupations During the Past Five Years | Number of Portfolios/Funds in Fund Complex Overseen by Trustee | Other Directorships Held by Trustee During the Past Five Years |
Independent Trustees | | | | |
Linda S. Wolf
151 Detroit Street
Denver, CO 80206
DOB: 1947 | Trustee | 11/05-Present | Retired. Formerly, Chairman and Chief Executive Officer of Leo Burnett (Worldwide) (advertising agency) (2001-2005). | 50 | Director of Chicago Community Trust (Regional Community Foundation), Lurie Children’s Hospital (Chicago, IL), and Shirley Ryan Ability Lab. Formerly, Director of Wrapports, LLC (until 2022), Director of Chicago Council on Global Affairs (until 2019), InnerWorkings (until 2019) and Director of Walmart (until 2017). |
Janus Henderson Multi-Sector Income Fund
Trustees and Officers (unaudited)
| | | | |
OFFICERS |
Name, Address, and Age | Positions Held with the Trust | Term of Office* and Length of Time Served | Principal Occupations During the Past Five Years |
John Kerschner
151 Detroit Street
Denver, CO 80206
DOB: 1967 | Executive Vice President and Co-Portfolio Manager
Janus Henderson Multi-Sector Income Fund | 2/14-Present | Head of U.S. Securitized Products of Janus Henderson Investors and Portfolio Manager for other Janus Henderson accounts. |
John Lloyd
151 Detroit Street
Denver, CO 80206
DOB: 1975 | Executive Vice President and Co-Portfolio Manager
Janus Henderson Multi-Sector Income Fund | 2/14-Present | Co-Head of Global Credit Research of Janus Henderson Investors, Portfolio Manager for other Janus Henderson accounts, and Analyst for Janus Henderson Investors US LLC. |
Seth Meyer
151 Detroit Street
Denver, CO 80206
DOB: 1976 | Executive Vice President and Co-Portfolio Manager
Janus Henderson Multi-Sector Income Fund | 2/14-Present | Portfolio Manager for other Janus Henderson accounts. |
Michelle Rosenberg
151 Detroit Street
Denver, CO 80206
DOB: 1973 | Interim President and Chief Executive Officer | 1/22-Present | General Counsel and Corporate Secretary of Janus Henderson Investors (since 2018). Formerly, Senior Vice President and Head of Legal, North America of Janus Henderson Investors (2017-2018) and Deputy General Counsel of Janus Henderson US (Holdings) Inc. (2015-2018). |
Kristin Mariani
151 Detroit Street
Denver, CO 80206
DOB: 1966 | Vice President, Chief Compliance Officer, and Anti-Money Laundering Officer | 7/20-Present | Head of Compliance, North America for Janus Henderson Investors (since September 2020) and Chief Compliance Officer for Janus Henderson Investors US LLC (since September 2017). Formerly, Global Head of Investment Management Compliance for Janus Henderson Investors (February 2019-August 2020), Vice President, Head of Global Distribution Compliance and Chief Compliance Officer of Janus Henderson Distributors US LLC (May 2017-September 2017), Vice President, Compliance at Janus Henderson US (Holdings) Inc., Janus Henderson Investors US LLC, and Janus Henderson Distributors US LLC (2009-2017). |
Janus Henderson Multi-Sector Income Fund
Trustees and Officers (unaudited)
| | | | |
OFFICERS |
Name, Address, and Age | Positions Held with the Trust | Term of Office* and Length of Time Served | Principal Occupations During the Past Five Years |
Jesper Nergaard
151 Detroit Street
Denver, CO 80206
DOB: 1962 | Chief Financial Officer
Vice President, Treasurer, and Principal Accounting Officer | 3/05-Present
2/05-Present | Head of U.S. Fund Administration, Janus Henderson Investors and Janus Henderson Services US LLC. |
Abigail J. Murray
151 Detroit Street
Denver, CO 80206
DOB: 1975 | Vice President, Chief Legal Officer, and Secretary | 12/20-Present | Managing Counsel (2020-present). Formerly, Senior Counsel for Invesco Ltd. (2017-2020), and Vice President and Senior Counsel, ALPS Fund Services, Inc. and Assistant General Counsel, ALPS Advisors, Inc. (2015-2017). |
* Officers are elected at least annually by the Trustees for a one-year term and may also be elected from time to time by the Trustees for an interim period. |
Janus Henderson Multi-Sector Income Fund
Notes
NotesPage1
Janus Henderson Multi-Sector Income Fund
Notes
NotesPage2
Janus Henderson Multi-Sector Income Fund
Notes
NotesPage3
| | | | | | | | |
| | | | | |

| | | | |
This report is submitted for the general information of shareholders of the Fund. It is not an offer or solicitation for the Fund and is not authorized for distribution to prospective investors unless preceded or accompanied by an effective prospectus. |
Janus Henderson is a trademark of Janus Henderson Group plc or one of its subsidiaries. © Janus Henderson Group plc Janus Henderson Distributors US LLC |
| | | | 125-02-93028 08-22 |
| | | |
| | | |
| | | ANNUAL REPORT June 30, 2022 |
| | |
| | Janus Henderson Short Duration Flexible Bond Fund (Formerly Janus Henderson Short-Term Bond Fund) |
| | |
| | Janus Investment Fund |
| |
| | | |
| | | HIGHLIGHTS · Portfolio management perspective · Investment strategy behind your fund · Fund performance, characteristics
and holdings |
Table of Contents
Janus Henderson Short Duration Flexible Bond Fund
Janus Henderson Short Duration Flexible Bond Fund (unaudited)
| | | | | | |
FUND SNAPSHOT The Fund seeks as high a level of current income as is consistent with preservation of capital. We believe our research-driven investment process, diversified portfolio construction and robust risk management can provide attractive income and drive consistent risk-adjusted performance, with excess returns generated primarily through sector and security decisions. Our collaborative investment teams utilize our investment flexibility to adjust our allocations across the investment cycle in an effort to capitalize on attractive opportunities with limited interest rate sensitivity. | | | 
Seth Meyer co-portfolio manager | 
Greg Wilensky co-portfolio manager | 
Michael Keough co-portfolio manager |
| | | |
PERFORMANCE SUMMARY
For the 12-month period ended June 30, 2022, the Janus Henderson Short-Duration Flexible Bond Fund’s Class I shares returned -6.08% compared with -3.56% for the Fund’s benchmark, the Bloomberg 1-3 Year U.S. Government/Credit Index.
MARKET ENVIRONMENT
The period commenced with strengthening economic conditions and improving consumer sentiment. Following record stimulus in response to the COVID pandemic, economic growth was strong, asset prices had recovered, and the unemployment rate was trending down steadily. The emergence of new COVID variants led to continued supply chain bottlenecks and elevated goods prices, but the lingering risks to the outlook resulted in additional fiscal stimulus and the Federal Reserve (Fed) maintaining overly accommodative monetary policy. As the period progressed, the main story turned out to be the sharp repricing of risk assets as the Fed pivoted to aggressively raise interest rates to tame inflation. Both credit and interest rate sectors recorded negative returns, with virtually all the move occurring in the second half of the period. The yield on the 2-year U.S. Treasury rose sharply from 0.25% to 2.95% during the period, while credit spreads simultaneously widened across all sectors.
Inflation continued to rise during the period, with the Fed initially communicating that inflation was “transitory” and would abate once supply chain disruptions were alleviated. In hindsight, this turned out to be a policy error on the Fed’s part – with each passing month, inflation continued to rise and it became increasingly difficult for the transitory thesis to hold. Credit markets held steady through the end of 2021, but with Russia’s invasion of Ukraine early in 2022, oil, gas and commodities prices spiked, signaling further upward pressure on inflation. By early 2022 the Fed capitulated by acknowledging that inflation was not transitory and made a hawkish pivot, proceeding to raise rates 1.50% through the end of June. Further, it communicated it was committed to bringing down inflation with future hikes. Toward the end of the period, we witnessed deterioration in economic growth and consumer sentiment, with an economic slowdown beyond a “soft landing” seeming more likely.
PERFORMANCE DISCUSSION
Our objective is to generate moderate income from credit spread sectors while limiting drawdowns. To do this, we construct the portfolio with credit risk and a modest amount of interest rate risk. Historically, these have had negative correlations – for example, as Treasury yields rise, credit spreads tighten. However, during the latter half of the period, Treasury yields and credit spreads both moved higher with a positive correlation, which provides a challenging backdrop to this philosophical approach.
We entered the period with more duration than the index, consistent with the structural bias noted above. This detracted from relative returns, as the Treasury yield curve moved up sharply. A modest allocation to Treasury Inflation-Protected Securities (TIPS) during the period helped to offset relative underperformance. We also maintained a higher allocation to spread products than the index, notably an out-of-index allocation to short-duration high-yield bonds. While we trimmed our risk allocation during the period, this positioning detracted from relative returns.
We remained opportunistic in securitized credit. We added to asset-backed securities (ABS), commercial mortgage-backed securities (CMBS) and collateralized mortgage obligations (CMO), as securitized assets experienced,
Janus Henderson Short Duration Flexible Bond Fund (unaudited)
what we believe to be, excessive spread widening. While securitized sectors did not aid relative performance during the period, this positioning is in line with where we believe the portfolio will be best positioned for the growing likelihood of an economic slowdown.
DERIVATIVES USAGE
During the period, we used Treasury futures to efficiently bring the portfolio in line with our targets for overall duration and our positioning along the yield curve.
Please see the Derivative Instruments section in the “Notes to Financial Statements” for a discussion of derivatives used by the Fund.
OUTLOOK
The persistence and pervasiveness of extremely high inflation – and the Fed’s late but increasingly aggressive response to taming it – has been the story of the year, and it will likely continue to be until inflation trends back meaningfully toward the central bank’s target range. The Fed has struck a far more austere tone of late, making it clear that it is intent on preventing the short-term inflation problem from becoming a long-term one. We do not believe that the Fed is bluffing at this juncture – we expect it will act in line with its narrative by tightening monetary conditions until inflation is on a clear path back to where it should be.
The key risk in the Fed’s eleventh-hour crusade is that, through tightening, it tips the U.S. economy into a growth slowdown or recession. This is a risk the Fed appears willing to take – and needs to take – to bring inflation down, and to ultimately put the economy in a strong position for the long term. Essentially the Fed believes the consumer and corporates are in good enough shape – unemployment is back to pre-pandemic lows and both consumer and corporate balance sheets are stronger than they’ve ever been heading into an economic slowdown – to handle a recession if one transpires due to monetary tightening.
While the economic situation is sobering, we believe that being well positioned is key to navigating the economic and market cycles. Short-duration assets have priced in an extremely aggressive Fed tightening cycle, and therefore, we believe much of the repricing of interest rate risk has already occurred. We consider the yield curve shift as a positive for fixed income assets, as bonds are now offering more attractive income and diversification than before. Furthermore, as the likelihood of an economic slowdown or recession grows, we think that slowing growth is likely to place a ceiling on interest rates in the near term, which should provide some support for assets with exposure to interest rate risk.
Within credit spread products, any continued deterioration in the macro environment is likely to place further pressure on credit spreads. We therefore remain cautiously positioned within our spread sector allocation, have repositioned into higher quality credit, and continue to seek exposure in securitized sectors where, in our view, prices better reflect the possibility of recession, and in those that we believe will fare better in an economic downturn. We anticipate a dynamic and challenging year ahead, and our team’s objective is to position the portfolio to manage the risks and capitalize on the opportunities that present themselves.
Thank you for your investment in the Janus Henderson Short-Duration Flexible Bond Fund.
Janus Henderson Short Duration Flexible Bond Fund (unaudited)
Fund At A Glance
June 30, 2022
| | | |
Fund Profile | | |
30-day SEC Yield* | Without
Reimbursement | With
Reimbursement |
Class A Shares NAV | 3.43% | 3.55% |
Class A Shares MOP | 3.35% | 3.46% |
Class C Shares** | 2.64% | 2.76% |
Class D Shares | 3.59% | 3.72% |
Class I Shares | 3.61% | 3.72% |
Class N Shares | 3.74% | 3.85% |
Class S Shares | 2.70% | 3.34% |
Class T Shares | 3.50% | 3.61% |
Weighted Average Maturity | 2.8 Years |
Average Effective Duration*** | 2.3 Years |
* Yield will fluctuate. | | |
** Does not include the 1.00% contingent deferred sales charge. |
*** A theoretical measure of price volatility. | |
| | |
Ratings† Summary - (% of Total Investments) | |
AAA | 8.1% |
AA | 26.5% |
A | 6.0% |
BBB | 18.2% |
BB | 9.3% |
B | 1.7% |
Not Rated | 28.8% |
Other | 1.4% |
† Credit ratings provided by Standard & Poor's (S&P), an independent credit rating agency. Credit ratings range from AAA (highest) to D (lowest) based on S&P's measures. Further information on S&P's rating methodology may be found at www.standardandpoors.com. Other rating agencies may rate the same securities differently. Ratings are relative and subjective and are not absolute standards of quality. Credit quality does not remove market risk and is subject to change. "Not Rated" securities are not rated by S&P, but may be rated by other rating agencies and do not necessarily indicate low quality. "Other" includes cash equivalents, equity securities, and certain derivative instruments. |
Significant Areas of Investment - (% of Net Assets)
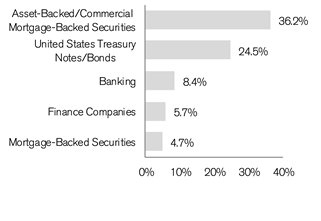
| | | | | | |
Asset Allocation - (% of Net Assets) | |
Asset-Backed/Commercial Mortgage-Backed Securities | | 36.2% | |
Corporate Bonds | | 32.8% | |
United States Treasury Notes/Bonds | | 24.5% | |
Mortgage-Backed Securities | | 4.7% | |
Investment Companies | | 3.9% | |
Bank Loans and Mezzanine Loans | | 0.3% | |
Investments Purchased with Cash Collateral from Securities Lending | | 0.1% | |
Other | | (2.5)% |
| | | 100.0% |
Janus Henderson Short Duration Flexible Bond Fund (unaudited)
Performance
| |
See important disclosures on the next page. |
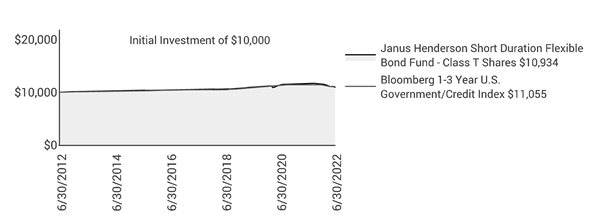
| | | | | | | | | | | |
| | | | | | | | | |
| | | | | | | | | |
Average Annual Total Return - for the periods ended June 30, 2022 | | | Prospectus Expense Ratios |
| | One
Year | Five
Year | Ten
Year | Since
Inception* | | | Total Annual Fund
Operating Expenses‡ | Net Annual Fund
Operating Expenses‡ |
Class A Shares at NAV | | -6.28% | 0.66% | 0.88% | 3.10% | | | 0.78% | 0.69% |
Class A Shares at MOP | | -8.66% | 0.13% | 0.62% | 2.93% | | | | |
Class C Shares at NAV | | -6.97% | -0.11% | 0.12% | 2.40% | | | 1.56% | 1.45% |
Class C Shares at CDSC | | -7.89% | -0.11% | 0.12% | 2.40% | | | | |
Class D Shares | | -6.12% | 0.76% | 1.00% | 3.42% | | | 0.63% | 0.53% |
Class I Shares | | -6.08% | 0.86% | 1.10% | 3.32% | | | 0.60% | 0.45% |
Class N Shares | | -6.03% | 0.89% | 1.14% | 3.44% | | | 0.50% | 0.39% |
Class S Shares | | -6.16% | 0.48% | 0.71% | 2.93% | | | 1.43% | 0.89% |
Class T Shares | | -6.23% | 0.65% | 0.90% | 3.37% | | | 0.73% | 0.64% |
Bloomberg 1-3 Year U.S. Government/Credit Index | | -3.56% | 1.07% | 1.01% | 3.45%** | | | | |
Morningstar Quartile - Class T Shares | | 4th | 4th | 4th | 2nd | | | | |
Morningstar Ranking - based on total returns for Short-Term Bond Funds | | 492/602 | 408/542 | 318/447 | 73/154 | | | | |
Returns quoted are past performance and do not guarantee future results; current performance may be lower or higher. Investment returns and principal value will vary; there may be a gain or loss when shares are sold. For the most recent month-end performance call 800.668.0434 (or 800.525.3713 if you hold shares directly with Janus Henderson) or visit janushenderson.com/performance (or janushenderson.com/allfunds if you hold shares directly with Janus Henderson).
Maximum Offering Price (MOP) returns include the maximum sales charge of 2.50%. Net Asset Value (NAV) returns exclude this charge, which would have reduced returns.
CDSC returns include a 1% contingent deferred sales charge (CDSC) on Shares redeemed within 12 months of purchase. Net Asset Value (NAV) returns exclude this charge, which would have reduced returns.
For certain periods, the Fund’s performance may reflect the effect of expense waivers.
Janus Henderson Short Duration Flexible Bond Fund (unaudited)
Performance
Performance may be affected by risks that include those associated with foreign and emerging markets, fixed income securities, high-yield and high-risk securities, undervalued, overlooked and smaller capitalization companies, real estate related securities including Real Estate Investment Trusts (REITs), Environmental, Social and Governance (ESG) factors, non-diversification, portfolio turnover, derivatives, short sales, initial public offerings (IPOs) and potential conflicts of interest. Each product has different risks. Please see the prospectus for more information about risks, holdings and other details.
Returns include reinvestment of all dividends and distributions and do not reflect the deduction of taxes that a shareholder would pay on Fund distributions or redemptions of Fund shares. The returns do not include adjustments in accordance with generally accepted accounting principles required at the period end for financial reporting purposes.
Class A Shares, Class C Shares, Class I Shares, and Class S Shares commenced operations on July 6, 2009. Performance shown for each class for periods prior to July 6, 2009, reflects the performance of the Fund’s Class J Shares, the initial share class (renamed Class T Shares effective February 16, 2010), calculated using the fees and expenses of each respective share class, without the effect of any fee and expense limitations or waivers.
Class D Shares commenced operations on February 16, 2010. Performance shown for periods prior to February 16, 2010, reflects the performance of the Fund’s former Class J Shares, calculated using the fees and expenses in effect during the periods shown, net of any applicable fee and expense limitations or waivers.
Class N Shares commenced operations on May 31, 2012. Performance shown for periods prior to May 31, 2012, reflects the performance of the Fund’s Class T Shares, calculated using the fees and expenses of Class T Shares, net of any applicable fee and expense limitations or waivers.
If each share class of the Fund had been available during periods prior to its commencement, the performance shown may have been different. The performance shown for periods following the Fund’s commencement of each share class reflects the fees and expenses of each respective share class, net of any applicable fee and expense limitations or waivers. Please refer to the Fund’s prospectuses for further details concerning historical performance.
Ranking is for the share class shown only; other classes may have different performance characteristics. When an expense waiver is in effect, it may have a material effect on the total return, and therefore the ranking for the period.
© 2022 Morningstar, Inc. All Rights Reserved.
There is no assurance that the investment process will consistently lead to successful investing.
See Notes to Schedule of Investments and Other Information for index definitions.
Index performance does not reflect the expenses of managing a portfolio as an index is unmanaged and not available for direct investment.
See “Useful Information About Your Fund Report.”
*The Fund’s inception date – September 1, 1992
** The Bloomberg 1-3 Year U.S. Government/Credit Index’s since inception returns are calculated from August 31, 1992.
‡ As stated in the prospectus. Net expense ratios reflect the expense waivers, if any, contractually agreed to for at least a one-year period commencing on October 28, 2021. See Financial Highlights for actual expense ratios during the reporting period.
Janus Henderson Short Duration Flexible Bond Fund (unaudited)
Expense Examples
As a shareholder of the Fund, you incur two types of costs: (1) transaction costs, such as sales charges (loads) on purchase payments (applicable to Class A Shares only); and (2) ongoing costs, including management fees; 12b-1 distribution and shareholder servicing fees; transfer agent fees and expenses payable pursuant to the Transfer Agency Agreement; and other Fund expenses. This example is intended to help you understand your ongoing costs (in dollars) of investing in the Fund and to compare these costs with the ongoing costs of investing in other mutual funds. To do so, compare this 5% hypothetical example with the 5% hypothetical examples that appear in the shareholder reports of the other funds. The example is based upon an investment of $1,000 invested at the beginning of the period and held for the six-months indicated, unless noted otherwise in the table and footnotes below.
Actual Expenses
The information in the table under the heading “Actual” provides information about actual account values and actual expenses. You may use the information in these columns, together with the amount you invested, to estimate the expenses that you paid over the period. Simply divide your account value by $1,000 (for example, an $8,600 account value divided by $1,000 = 8.6), then multiply the result by the number in the appropriate column for your share class under the heading entitled “Expenses Paid During Period” to estimate the expenses you paid on your account during the period.
Hypothetical Example for Comparison Purposes
The information in the table under the heading “Hypothetical (5% return before expenses)” provides information about hypothetical account values and hypothetical expenses based upon the Fund’s actual expense ratio and an assumed rate of return of 5% per year before expenses, which is not the Fund’s actual return. The hypothetical account values and expenses may not be used to estimate the actual ending account balance or expenses you paid for the period. You may use this information to compare the ongoing costs of investing in the Fund and other funds. To do so, compare this 5% hypothetical example with the 5% hypothetical examples that appear in the shareholder reports of the other funds. Additionally, for an analysis of the fees associated with an investment in any share class or other similar funds, please visit www.finra.org/fundanalyzer.
Please note that the expenses shown in the table are meant to highlight your ongoing costs only and do not reflect any transaction costs. These fees are fully described in the Fund’s prospectuses. Therefore, the hypothetical examples are useful in comparing ongoing costs only, and will not help you determine the relative total costs of owning different funds. In addition, if these transaction costs were included, your costs would have been higher.
| | | | | | | | | | | |
| | | | | | | | |
| | | Actual | | Hypothetical
(5% return before expenses) | |
| Beginning
Account
Value
(1/1/22) | Ending
Account
Value
(6/30/22) | Expenses
Paid During
Period
(1/1/22 - 6/30/22)† | | Beginning
Account
Value
(1/1/22) | Ending
Account
Value
(6/30/22) | Expenses
Paid During
Period
(1/1/22 - 6/30/22)† | Net Annualized
Expense Ratio
(1/1/22 - 6/30/22) |
Class A Shares | $1,000.00 | $940.90 | $3.32 | | $1,000.00 | $1,021.37 | $3.46 | 0.69% |
Class C Shares | $1,000.00 | $937.50 | $6.58 | | $1,000.00 | $1,018.00 | $6.85 | 1.37% |
Class D Shares | $1,000.00 | $941.70 | $2.50 | | $1,000.00 | $1,022.22 | $2.61 | 0.52% |
Class I Shares | $1,000.00 | $942.10 | $2.17 | | $1,000.00 | $1,022.56 | $2.26 | 0.45% |
Class N Shares | $1,000.00 | $942.10 | $1.88 | | $1,000.00 | $1,022.86 | $1.96 | 0.39% |
Class S Shares | $1,000.00 | $943.20 | $4.19 | | $1,000.00 | $1,020.48 | $4.36 | 0.87% |
Class T Shares | $1,000.00 | $941.20 | $3.03 | | $1,000.00 | $1,021.67 | $3.16 | 0.63% |
† | Expenses Paid During Period are equal to the Net Annualized Expense Ratio multiplied by the average account value over the period, multiplied by 181/365 (to reflect the one-half year period). Expenses in the examples include the effect of applicable fee waivers and/or expense reimbursements, if any. Had such waivers and/or reimbursements not been in effect, your expenses would have been higher. Please refer to the Notes to Financial Statements or the Fund’s prospectuses for more information regarding waivers and/or reimbursements. |
Janus Henderson Short Duration Flexible Bond Fund
Schedule of Investments
June 30, 2022
| | | | | | | | |
Shares or
Principal Amounts | | | Value | |
Asset-Backed/Commercial Mortgage-Backed Securities– 36.2% | | | |
| | 208 Park Avenue Mortgage Trust 2017-280P, | | | | | | |
| | ICE LIBOR USD 1 Month + 0.8800%, 2.0710%, 9/15/34 (144A)‡ | | $4,021,000 | | | $3,935,126 | |
| | ACC Auto Trust 2021-A A, 1.0800%, 4/15/27 (144A) | | 606,970 | | | 594,524 | |
| | ACC Auto Trust 2022-A A, 4.5800%, 7/15/26 (144A) | | 2,460,311 | | | 2,437,723 | |
| | ACC Trust 2021-1 A, 0.7400%, 11/20/23 (144A) | | 115,847 | | | 115,684 | |
| | ACM Auto Trust 2022-1A A, 3.2300%, 4/20/29 (144A) | | 2,538,610 | | | 2,861,940 | |
| | Affirm Asset Securitization Trust 2021-A A, 0.8800%, 8/15/25 (144A) | | 1,370,000 | | | 1,352,736 | |
| | Affirm Asset Securitization Trust 2021-B A, 1.0300%, 8/17/26 (144A) | | 1,402,000 | | | 1,330,670 | |
| | Angel Oak Mortgage Trust I LLC 2019-5, 2.5930%, 10/25/49 (144A)‡ | | 222,299 | | | 219,034 | |
| | Angel Oak Mortgage Trust I LLC 2019-6, | | | | | | |
| | ICE LIBOR USD 12 Month + 0.9500%, 2.6200%, 11/25/59 (144A)‡ | | 191,632 | | | 187,671 | |
| | Aqua Finance Trust 2021-A A, 1.5400%, 7/17/46 (144A) | | 814,459 | | | 752,170 | |
| | Arivo Acceptance Auto Loan Receivables 2022-1A A, 3.9300%, 5/15/28 (144A) | | 3,029,719 | | | 3,028,116 | |
| | Atalaya Equipment Leasing Fund I LP 2021-1A A2, 1.2300%, 5/15/26 (144A) | | 1,451,063 | | | 1,418,400 | |
| | Avis Budget Rental Car Funding AESOP LLC 2017-2A D, 4.5600%, 3/20/24 (144A) | | 3,234,000 | | | 3,233,996 | |
| | Barclays Commercial Mortgage Securities LLC 2017-DELC, | | | | | | |
| | ICE LIBOR USD 1 Month + 0.8500%, 2.1740%, 8/15/36 (144A)‡ | | 874,000 | | | 856,382 | |
| | BPR Trust 2022-OANA A, | | | | | | |
| | CME Term SOFR 1 Month + 1.8980%, 2.6800%, 4/15/37 (144A)‡ | | 3,717,000 | | | 3,636,796 | |
| | BX Commercial Mortgage Trust 2019-XL, | | | | | | |
| | ICE LIBOR USD 1 Month + 0.9200%, 2.2440%, 10/15/36 (144A)‡ | | 3,746,157 | | | 3,685,128 | |
| | BX Commercial Mortgage Trust 2019-XL, | | | | | | |
| | ICE LIBOR USD 1 Month + 1.0800%, 2.4040%, 10/15/36 (144A)‡ | | 850,000 | | | 836,722 | |
| | BX Commercial Mortgage Trust 2021-21M A, | | | | | | |
| | ICE LIBOR USD 1 Month + 0.7300%, 2.0540%, 10/15/36 (144A)‡ | | 2,508,000 | | | 2,420,210 | |
| | BX Commercial Mortgage Trust 2021-LBA AJV, | | | | | | |
| | ICE LIBOR USD 1 Month + 0.8000%, 2.1250%, 2/15/36 (144A)‡ | | 1,598,000 | | | 1,511,953 | |
| | BX Commercial Mortgage Trust 2021-LBA AV, | | | | | | |
| | ICE LIBOR USD 1 Month + 0.8000%, 2.1250%, 2/15/36 (144A)‡ | | 1,817,000 | | | 1,720,202 | |
| | BX Commercial Mortgage Trust 2021-VOLT F, | | | | | | |
| | ICE LIBOR USD 1 Month + 2.4000%, 3.7240%, 9/15/36 (144A)‡ | | 3,235,000 | | | 3,016,964 | |
| | Carvana Auto Receivables Trust 2021-P4 A2, 0.8200%, 4/10/25 | | 1,294,593 | | | 1,271,027 | |
| | CBAM CLO Management 2019-11RA A2, | | | | | | |
| | ICE LIBOR USD 3 Month + 1.5000%, 1.6249%, 1/20/35 (144A)‡ | | 4,325,000 | | | 4,128,892 | |
| | CF Hippolyta Issuer LLC 2021-1A A1, 1.5300%, 3/15/61 (144A) | | 2,221,256 | | | 1,951,276 | |
| | CF Hippolyta Issuer LLC 2021-1A B1, 1.9800%, 3/15/61 (144A) | | 815,007 | | | 701,141 | |
| | Chase Auto Credit Linked Notes 2020-1 B, 0.9910%, 1/25/28 (144A) | | 1,421,750 | | | 1,404,708 | |
| | Chase Auto Credit Linked Notes 2020-2 B, 0.8400%, 2/25/28 (144A) | | 769,125 | | | 757,090 | |
| | Chase Auto Credit Linked Notes 2021-1 B, 0.8750%, 9/25/28 (144A) | | 1,541,953 | | | 1,507,610 | |
| | Chase Auto Credit Linked Notes 2021-2 B, 0.8890%, 12/26/28 (144A) | | 1,190,663 | | | 1,157,856 | |
| | Chesapeake Funding II LLC 2019-2A, 2.7100%, 9/15/31 (144A) | | 2,858,000 | | | 2,832,777 | |
| | CIFC Funding Ltd 2016-1A BRR, | | | | | | |
| | ICE LIBOR USD 3 Month + 1.7000%, 2.7983%, 10/21/31 (144A)‡ | | 1,278,000 | | | 1,216,825 | |
| | CIFC Funding Ltd 2021-7A B, | | | | | | |
| | ICE LIBOR USD 3 Month + 1.6000%, 2.7840%, 1/23/35 (144A)‡ | | 1,432,000 | | | 1,350,327 | |
| | CIM Trust 2021-NR1 A1, 2.5690%, 7/25/55 (144A)Ç | | 1,455,297 | | | 1,384,240 | |
| | Cold Storage Trust 2020-ICE5 A, | | | | | | |
| | ICE LIBOR USD 1 Month + 0.9000%, 2.2240%, 11/15/37 (144A)‡ | | 3,282,205 | | | 3,190,737 | |
| | Cold Storage Trust 2020-ICE5 B, | | | | | | |
| | ICE LIBOR USD 1 Month + 1.3000%, 2.6240%, 11/15/37 (144A)‡ | | 1,683,863 | | | 1,636,952 | |
| | Cold Storage Trust 2020-ICE5 C, | | | | | | |
| | ICE LIBOR USD 1 Month + 1.6500%, 2.9740%, 11/15/37 (144A)‡ | | 1,690,744 | | | 1,639,545 | |
| | COLEM Mortgage Trust 2022-HLNE A, 2.5430%, 4/12/42 (144A)‡ | | 4,914,000 | | | 4,391,871 | |
| | Conn Funding II LP 2021-A A, 1.0500%, 5/15/26 (144A) | | 622,874 | | | 611,861 | |
| | Connecticut Avenue Securities Trust 2015-C01 1M2, | | | | | | |
| | ICE LIBOR USD 1 Month + 4.3000%, 5.9236%, 2/25/25‡ | | 642,256 | | | 642,483 | |
| | Connecticut Avenue Securities Trust 2017-C01, | | | | | | |
| | ICE LIBOR USD 1 Month + 3.5500%, 5.1736%, 7/25/29‡ | | 943,967 | | | 968,540 | |
| | Connecticut Avenue Securities Trust 2017-C05 1M2, | | | | | | |
| | ICE LIBOR USD 1 Month + 2.2000%, 3.8236%, 1/25/30‡ | | 1,145,281 | | | 1,149,869 | |
| | |
See Notes to Schedule of Investments and Other Information and Notes to Financial Statements. |
| |
Janus Investment Fund | 7 |
Janus Henderson Short Duration Flexible Bond Fund
Schedule of Investments
June 30, 2022
| | | | | | | | |
Shares or
Principal Amounts | | | Value | |
Asset-Backed/Commercial Mortgage-Backed Securities– (continued) | | | |
| | Connecticut Avenue Securities Trust 2017-C07 1M2, | | | | | | |
| | ICE LIBOR USD 1 Month + 2.4000%, 4.0236%, 5/25/30‡ | | $3,657,285 | | | $3,686,876 | |
| | Connecticut Avenue Securities Trust 2018-R07, | | | | | | |
| | ICE LIBOR USD 1 Month + 2.4000%, 4.0236%, 4/25/31 (144A)‡ | | 113,486 | | | 113,121 | |
| | Connecticut Avenue Securities Trust 2019-R02, | | | | | | |
| | ICE LIBOR USD 1 Month + 2.3000%, 3.9236%, 8/25/31 (144A)‡ | | 70,156 | | | 69,900 | |
| | Connecticut Avenue Securities Trust 2019-R03, | | | | | | |
| | ICE LIBOR USD 1 Month + 2.1500%, 3.7736%, 9/25/31 (144A)‡ | | 932,890 | | | 928,479 | |
| | Connecticut Avenue Securities Trust 2019-R06, | | | | | | |
| | ICE LIBOR USD 1 Month + 2.1000%, 3.7236%, 9/25/39 (144A)‡ | | 614,258 | | | 611,652 | |
| | Connecticut Avenue Securities Trust 2019-R07, | | | | | | |
| | ICE LIBOR USD 1 Month + 2.1000%, 3.7236%, 10/25/39 (144A)‡ | | 7,255 | | | 7,228 | |
| | Connecticut Avenue Securities Trust 2021-R02 2M2, | | | | | | |
| | US 30 Day Average SOFR + 2.0000%, 2.9257%, 11/25/41 (144A)‡ | | 3,397,000 | | | 3,036,661 | |
| | Connecticut Avenue Securities Trust 2021-R03 1M2, | | | | | | |
| | US 30 Day Average SOFR + 1.6500%, 2.5757%, 12/25/41 (144A)‡ | | 1,248,000 | | | 1,108,431 | |
| | Connecticut Avenue Securities Trust 2022-R01 1B1, | | | | | | |
| | US 30 Day Average SOFR + 3.1500%, 4.0757%, 12/25/41 (144A)‡ | | 2,315,000 | | | 1,853,912 | |
| | Connecticut Avenue Securities Trust 2022-R01 1M2, | | | | | | |
| | US 30 Day Average SOFR + 1.9000%, 2.8257%, 12/25/41 (144A)‡ | | 2,611,000 | | | 2,348,223 | |
| | Connecticut Avenue Securities Trust 2022-R03 1M1, | | | | | | |
| | US 30 Day Average SOFR + 2.1000%, 3.0257%, 3/25/42 (144A)‡ | | 2,871,830 | | | 2,818,125 | |
| | Connecticut Avenue Securities Trust 2022-R04 1M1, | | | | | | |
| | US 30 Day Average SOFR + 2.0000%, 2.9257%, 3/25/42 (144A)‡ | | 1,270,589 | | | 1,245,259 | |
| | Connecticut Avenue Securities Trust 2022-R05 2M1, | | | | | | |
| | US 30 Day Average SOFR + 1.9000%, 2.8257%, 4/25/42 (144A)‡ | | 2,001,122 | | | 1,966,940 | |
| | Connecticut Avenue Securities Trust 2022-R06 1M1, | | | | | | |
| | US 30 Day Average SOFR + 2.7500%, 3.6977%, 5/25/42 (144A)‡ | | 867,583 | | | 865,495 | |
| | Consumer Loan Underlying Bond Credit Trust 2019-P2 C, | | | | | | |
| | 4.4100%, 10/15/26 (144A) | | 718,377 | | | 715,997 | |
| | CP EF Asset Securitization I LLC 2002-1A A, 5.9600%, 4/15/30 (144A) | | 3,625,000 | | | 3,624,724 | |
| | Credit Suisse Commercial Mortgage Trust 2019-ICE4, | | | | | | |
| | ICE LIBOR USD 1 Month + 0.9800%, 2.3040%, 5/15/36 (144A)‡ | | 4,234,000 | | | 4,163,970 | |
| | Credit Suisse Commercial Mortgage Trust 2019-ICE4 C, | | | | | | |
| | ICE LIBOR USD 1 Month + 1.4300%, 2.7540%, 5/15/36 (144A)‡ | | 4,106,000 | | | 4,006,548 | |
| | Credit Suisse Commercial Mortgage Trust 2020-UNFI, | | | | | | |
| | ICE LIBOR USD 1 Month + 3.6682%, 4.7882%, 12/15/22 (144A)‡ | | 4,000,000 | | | 3,908,704 | |
| | Credit Suisse Commercial Mortgage Trust 2021-WEHO A, | | | | | | |
| | ICE LIBOR USD 1 Month + 3.9693%, 5.2943%, 4/15/23 (144A)‡ | | 1,689,832 | | | 1,640,258 | |
| | DB Master Finance LLC 2017-1A A2II, 4.0300%, 11/20/47 (144A) | | 4,906,230 | | | 4,653,615 | |
| | DBCCRE Mortgage Trust 2014-ARCP E, 5.0990%, 1/10/34 (144A)‡ | | 5,367,000 | | | 5,138,473 | |
| | Diamond Infrastructure Funding LLC 2021-1A A, 1.7600%, 4/15/49 (144A) | | 2,114,000 | | | 1,815,424 | |
| | Diamond Resorts Owner Trust 2021-1A A, 1.5100%, 11/21/33 (144A) | | 894,158 | | | 852,837 | |
| | Donlen Fleet Lease Funding 2021-2 B, 0.9800%, 12/11/34 (144A) | | 1,572,000 | | | 1,480,066 | |
| | Donlen Fleet Lease Funding 2021-2 C, 1.2000%, 12/11/34 (144A) | | 1,471,000 | | | 1,377,106 | |
| | Drive Auto Receivables Trust 2020-1, 2.7000%, 5/17/27 | | 2,511,000 | | | 2,471,828 | |
| | DROP Mortgage Trust 2021-FILE A, | | | | | | |
| | ICE LIBOR USD 1 Month + 1.1500%, 2.4700%, 10/15/43 (144A)‡ | | 3,929,000 | | | 3,766,202 | |
| | Eagle Re Ltd, ICE LIBOR USD 1 Month + 0.9000%, 2.5236%, 1/25/30 (144A)‡ | | 4,251,573 | | | 4,224,751 | |
| | Exeter Automobile Receivables Trust 2019-1, 5.2000%, 1/15/26 (144A) | | 2,895,000 | | | 2,897,806 | |
| | Exeter Automobile Receivables Trust 2020-1A C, 2.4900%, 1/15/25 (144A) | | 862,066 | | | 861,429 | |
| | Exeter Automobile Receivables Trust 2020-2A E, 7.1900%, 9/15/27 (144A) | | 2,687,000 | | | 2,732,285 | |
| | Exeter Automobile Receivables Trust 2021-1A D, 1.0800%, 11/16/26 | | 1,081,000 | | | 1,017,206 | |
| | Extended Stay America Trust 2021-ESH A, | | | | | | |
| | ICE LIBOR USD 1 Month + 1.0800%, 2.4050%, 7/15/38 (144A)‡ | | 1,116,131 | | | 1,089,920 | |
| | Extended Stay America Trust 2021-ESH B, | | | | | | |
| | ICE LIBOR USD 1 Month + 1.3800%, 2.7050%, 7/15/38 (144A)‡ | | 717,584 | | | 694,597 | |
| | Extended Stay America Trust 2021-ESH E, | | | | | | |
| | ICE LIBOR USD 1 Month + 2.8500%, 4.1750%, 7/15/38 (144A)‡ | | 3,366,282 | | | 3,231,475 | |
| | | | | | | | |
| | |
See Notes to Schedule of Investments and Other Information and Notes to Financial Statements. |
| |
8 | JUNE 30, 2022 |
Janus Henderson Short Duration Flexible Bond Fund
Schedule of Investments
June 30, 2022
| | | | | | | | |
Shares or
Principal Amounts | | | Value | |
Asset-Backed/Commercial Mortgage-Backed Securities– (continued) | | | |
| | Fannie Mae Connecticut Avenue Securities, | | | | | | |
| | ICE LIBOR USD 1 Month + 5.0000%, 6.6236%, 7/25/25‡ | | $227,079 | | | $228,701 | |
| | Fannie Mae Connecticut Avenue Securities, | | | | | | |
| | ICE LIBOR USD 1 Month + 5.7000%, 7.3236%, 4/25/28‡ | | 489,264 | | | 516,861 | |
| | First Investors Auto Owner Trust 2022-1A A, 2.0300%, 1/15/27 (144A) | | 3,947,814 | | | 3,860,050 | |
| | Flagstar Mortgage Trust 2021-13IN A2, 3.0000%, 12/30/51 (144A)‡ | | 5,732,973 | | | 5,111,996 | |
| | Foursight Capital Auto Receivables Trust 2021-1 B, 0.8700%, 1/15/26 (144A) | | 2,960,000 | | | 2,910,510 | |
| | Freddie Mac Structured Agency Credit Risk Debt Notes 2019-DNA4 M2, | | | | | | |
| | ICE LIBOR USD 1 Month + 1.9500%, 3.5736%, 10/25/49 (144A)‡ | | 435,193 | | | 431,616 | |
| | Freddie Mac Structured Agency Credit Risk Debt Notes 2020-DNA6 M1, | | | | | | |
| | US 30 Day Average SOFR + 0.9000%, 1.8257%, 12/25/50 (144A)‡ | | 2,980 | | | 2,980 | |
| | Freddie Mac Structured Agency Credit Risk Debt Notes 2020-DNA6 M2, | | | | | | |
| | US 30 Day Average SOFR + 2.0000%, 2.9257%, 12/25/50 (144A)‡ | | 1,707,000 | | | 1,679,689 | |
| | Freddie Mac Structured Agency Credit Risk Debt Notes 2020-HQA2 M2, | | | | | | |
| | ICE LIBOR USD 1 Month + 3.1000%, 4.7236%, 3/25/50 (144A)‡ | | 2,855,488 | | | 2,805,579 | |
| | Freddie Mac Structured Agency Credit Risk Debt Notes 2020-HQA5 M2, | | | | | | |
| | US 30 Day Average SOFR + 2.6000%, 3.5257%, 11/25/50 (144A)‡ | | 1,941,688 | | | 1,925,929 | |
| | Freddie Mac Structured Agency Credit Risk Debt Notes 2021-DNA2 M2, | | | | | | |
| | US 30 Day Average SOFR + 2.3000%, 3.2257%, 8/25/33 (144A)‡ | | 844,000 | | | 797,750 | |
| | Freddie Mac Structured Agency Credit Risk Debt Notes 2021-HQA1 M2, | | | | | | |
| | US 30 Day Average SOFR + 2.2500%, 3.1757%, 8/25/33 (144A)‡ | | 907,000 | | | 840,561 | |
| | Freddie Mac Structured Agency Credit Risk Debt Notes 2021-HQA2 M2, | | | | | | |
| | US 30 Day Average SOFR + 2.0500%, 2.9757%, 12/25/33 (144A)‡ | | 3,482,000 | | | 3,109,930 | |
| | Freddie Mac Structured Agency Credit Risk Debt Notes 2022-DNA5 M1A, | | | | | | |
| | US 30 Day Average SOFR + 2.9500%, 3.7292%, 6/25/42 (144A)‡ | | 1,822,000 | | | 1,823,114 | |
| | Freddie Mac Structured Agency Credit Risk Debt Notes 2022-HQA1 M1A, | | | | | | |
| | US 30 Day Average SOFR + 2.1000%, 3.0257%, 3/25/42 (144A)‡ | | 1,347,937 | | | 1,335,958 | |
| | FREED ABS Trust 2019-2 C, 4.8600%, 11/18/26 (144A) | | 641,807 | | | 641,937 | |
| | FREED ABS Trust 2021-3FP B, 1.0100%, 11/20/28 (144A) | | 4,226,000 | | | 4,144,251 | |
| | FREED ABS Trust 2022-2CP B, 4.4900%, 5/18/29 (144A) | | 6,317,000 | | | 6,235,841 | |
| | GCAT 2022-INV1 A1, 3.0000%, 12/25/51 (144A)‡ | | 5,041,934 | | | 4,474,940 | |
| | GLS Auto Receivables Issuer Trust 2020-4A B, 0.8700%, 12/16/24 (144A) | | 1,462,788 | | | 1,457,281 | |
| | Great Wolf Trust, | | | | | | |
| | ICE LIBOR USD 1 Month + 1.0340%, 2.3580%, 12/15/36 (144A)‡ | | 5,929,000 | | | 5,784,151 | |
| | Hewlett-Packard Financial Services Company Trust 2020-1A C, | | | | | | |
| | 2.0300%, 2/20/30 (144A) | | 800,000 | | | 794,401 | |
| | Hewlett-Packard Financial Services Company Trust 2020-1A D, | | | | | | |
| | 2.2600%, 2/20/30 (144A) | | 800,000 | | | 790,281 | |
| | Hilton Grand Vacations Trust 2020-AA, 2.7400%, 2/25/39 (144A) | | 2,224,410 | | | 2,140,455 | |
| | JP Morgan Mortgage Trust 2019-LTV2, 3.5000%, 12/25/49 (144A)‡ | | 78,465 | | | 77,896 | |
| | KNDL Mortgage Trust 2019-KNSQ A, | | | | | | |
| | ICE LIBOR USD 1 Month + 0.8000%, 2.1240%, 5/15/36 (144A)‡ | | 3,838,000 | | | 3,790,742 | |
| | LAD Auto Receivables Trust 2021-1A A, 1.3000%, 8/17/26 (144A) | | 1,074,378 | | | 1,046,451 | |
| | Lanark Master Issuer PLC, 2.2770%, 12/22/69 (144A)‡ | | 3,829,000 | | | 3,808,443 | |
| | Lendbuzz Securitization Trust 2021-1A A, 1.4600%, 6/15/26 (144A) | | 1,469,240 | | | 1,414,621 | |
| | Lendbuzz Securitization Trust 2021-1A A, 4.2200%, 5/17/27 (144A)‡ | | 3,112,148 | | | 3,056,749 | |
| | LendingPoint Asset Securitization Trust 2021-A A, 1.0000%, 12/15/28 (144A) | | 1,242,317 | | | 1,233,856 | |
| | LendingPoint Asset Securitization Trust 2021-B A, 1.1100%, 2/15/29 (144A) | | 1,637,595 | | | 1,605,700 | |
| | LendingPoint Asset Securitization Trust 2022-A A, 1.6800%, 6/15/29 (144A) | | 3,141,007 | | | 3,081,769 | |
| | Life Financial Services Trust 2021-BMR A, | | | | | | |
| | ICE LIBOR USD 1 Month + 0.7000%, 2.0240%, 3/15/38 (144A)‡ | | 4,147,151 | | | 4,009,541 | |
| | Life Financial Services Trust 2021-BMR C, | | | | | | |
| | ICE LIBOR USD 1 Month + 1.1000%, 2.4240%, 3/15/38 (144A)‡ | | 1,980,685 | | | 1,880,977 | |
| | Life Financial Services Trust 2022-BMR2 A1, | | | | | | |
| | CME Term SOFR 1 Month + 1.2952%, 2.5739%, 5/15/39 (144A)‡ | | 3,177,000 | | | 3,093,809 | |
| | Life Financial Services Trust 2022-BMR2 B, | | | | | | |
| | CME Term SOFR 1 Month + 1.7939%, 3.0726%, 5/15/39 (144A)‡ | | 1,059,000 | | | 1,027,498 | |
| | LUXE Commercial Mortgage Trust 2021-TRIP A, | | | | | | |
| | ICE LIBOR USD 1 Month + 1.0500%, 2.3740%, 10/15/38 (144A)‡ | | 653,000 | | | 626,541 | |
| | Marlette Funding Trust 2021-3A A, 0.6500%, 12/15/31 (144A) | | 2,260,848 | | | 2,213,622 | |
| | |
See Notes to Schedule of Investments and Other Information and Notes to Financial Statements. |
| |
Janus Investment Fund | 9 |
Janus Henderson Short Duration Flexible Bond Fund
Schedule of Investments
June 30, 2022
| | | | | | | | |
Shares or
Principal Amounts | | | Value | |
Asset-Backed/Commercial Mortgage-Backed Securities– (continued) | | | |
| | MED Trust 2021-MDLN C, | | | | | | |
| | ICE LIBOR USD 1 Month + 1.8000%, 3.1250%, 11/15/38 (144A)‡ | | $587,000 | | | $557,980 | |
| | MED Trust 2021-MDLN D, | | | | | | |
| | ICE LIBOR USD 1 Month + 2.0000%, 3.3250%, 11/15/38 (144A)‡ | | 596,000 | | | 565,265 | |
| | MED Trust 2021-MDLN E, | | | | | | |
| | ICE LIBOR USD 1 Month + 3.1500%, 4.4750%, 11/15/38 (144A)‡ | | 2,647,000 | | | 2,488,125 | |
| | MED Trust 2021-MDLN F, | | | | | | |
| | ICE LIBOR USD 1 Month + 4.0000%, 5.3250%, 11/15/38 (144A)‡ | | 1,665,000 | | | 1,557,601 | |
| | Mello Mortgage Capital Acceptance Trust 2021-INV3 A11, | | | | | | |
| | US 30 Day Average SOFR + 0.9500%, 1.8757%, 10/25/51 (144A)‡ | | 1,821,745 | | | 1,723,915 | |
| | Mello Mortgage Capital Acceptance Trust 2021-INV4 A3, | | | | | | |
| | 2.5000%, 12/25/51 (144A)‡ | | 1,905,112 | | | 1,620,564 | |
| | Mello Mortgage Capital Acceptance Trust 2022-INV1 A2, | | | | | | |
| | 3.0000%, 3/25/52 (144A)‡ | | 3,445,101 | | | 3,051,474 | |
| | Mercury Financial Credit Card Master Trust 2021-1A A, | | | | | | |
| | 1.5400%, 3/20/26 (144A) | | 1,890,000 | | | 1,801,943 | |
| | MHC Commercial Mortgage Trust 2021-MHC A, | | | | | | |
| | ICE LIBOR USD 1 Month + 0.8010%, 2.1250%, 4/15/38 (144A)‡ | | 3,727,956 | | | 3,605,018 | |
| | MHC Commercial Mortgage Trust 2021-MHC C, | | | | | | |
| | ICE LIBOR USD 1 Month + 1.3510%, 2.6750%, 4/15/38 (144A)‡ | | 1,797,068 | | | 1,703,431 | |
| | Neuberger Berman CLO Ltd 2019-33A BR, | | | | | | |
| | ICE LIBOR USD 3 Month + 1.6000%, 2.6443%, 10/16/33 (144A)‡ | | 3,800,000 | | | 3,611,672 | |
| | NMEF Funding LLC 2022-A A2, 2.5800%, 10/16/28 (144A) | | 3,531,000 | | | 3,438,846 | |
| | NRZ Excess Spread Collateralized Notes 2020-PLS1 A, | | | | | | |
| | 3.8440%, 12/25/25 (144A) | | 471,200 | | | 443,592 | |
| | NRZ Excess Spread Collateralized Notes 2021-FHT1 A, 3.1040%, 7/25/26 (144A) | | 1,349,645 | | | 1,222,158 | |
| | Oak Street Investment Grade Net Lease Fund 2020-1A A1, | | | | | | |
| | 1.8500%, 11/20/50 (144A) | | 1,412,880 | | | 1,293,809 | |
| | Oasis Securitization 2021-2A A, 2.1430%, 10/15/33 (144A) | | 2,057,049 | | | 2,014,103 | |
| | Oasis Securitization 2022-1A A, 4.7500%, 5/15/34 (144A) | | 2,552,893 | | | 2,526,444 | |
| | Oceanview Mortgage Trust 2021-4 A11, | | | | | | |
| | US 30 Day Average SOFR + 0.8500%, 1.7757%, 10/25/51 (144A)‡ | | 2,015,932 | | | 1,885,573 | |
| | Oceanview Mortgage Trust 2021-5 AF, | | | | | | |
| | US 30 Day Average SOFR + 0.8500%, 1.4345%, 11/25/51 (144A)‡ | | 1,966,410 | | | 1,845,107 | |
| | Oceanview Mortgage Trust 2022-1 A1, 3.0000%, 12/25/51 (144A)‡ | | 2,046,700 | | | 1,809,096 | |
| | Oceanview Mortgage Trust 2022-2 A1, 3.0000%, 12/25/51 (144A)‡ | | 4,042,607 | | | 3,587,986 | |
| | OCP CLO Ltd 2015-10A BR2, | | | | | | |
| | ICE LIBOR USD 3 Month + 1.6500%, 2.8637%, 1/26/34 (144A)‡ | | 2,686,000 | | | 2,521,144 | |
| | Octagon Investment Partners 48 Ltd 2020-3A BR, | | | | | | |
| | ICE LIBOR USD 3 Month + 1.6000%, 2.6627%, 10/20/34 (144A)‡ | | 527,000 | | | 497,101 | |
| | Ondeck Asset Securitization Trust LLC 2021-1A A, 1.5900%, 5/17/27 (144A) | | 1,807,000 | | | 1,668,985 | |
| | Onslow Bay Financial LLC 2021-INV3 A3, 2.5000%, 10/25/51 (144A)‡ | | 2,997,784 | | | 2,557,023 | |
| | Onslow Bay Financial LLC 2022-INV1 A1, 3.0000%, 12/25/51 (144A)‡ | | 4,073,688 | | | 3,604,269 | |
| | Onslow Bay Financial LLC 2022-INV1 A18, 3.0000%, 12/25/51 (144A)‡ | | 1,727,736 | | | 1,518,279 | |
| | Oscar US Funding Trust 2017-2A A4, 2.7600%, 12/10/24 (144A) | | 383,982 | | | 383,938 | |
| | Oscar US Funding Trust 2021-1A A3, 0.7000%, 4/10/25 (144A) | | 2,188,000 | | | 2,108,754 | |
| | Pagaya AI Debt Selection Trust 2022-1 A, 2.0300%, 10/15/29 (144A) | | 1,274,130 | | | 1,230,990 | |
| | Palmer Square Loan Funding 2020-1A A2, | | | | | | |
| | ICE LIBOR USD 3 Month + 1.3500%, 2.8280%, 2/20/28 (144A)‡ | | 3,093,334 | | | 3,026,957 | |
| | Pawnee Equipment Receivables 2021-1 A2, 1.1000%, 7/15/27 (144A) | | 3,923,000 | | | 3,786,782 | |
| | Prestige Auto Receivables Trust 2018-1, 3.7500%, 10/15/24 (144A) | | 97,373 | | | 97,378 | |
| | Preston Ridge Partners Mortgage Trust 2021-10 A1, 2.4870%, 10/25/26 (144A)Ç | | 2,069,960 | | | 1,957,465 | |
| | Preston Ridge Partners Mortgage Trust 2021-9 A1, 2.3630%, 10/25/26 (144A)Ç | | 2,144,129 | | | 2,047,768 | |
| | Preston Ridge Partners Mortgage Trust 2022-2 A1, 5.0000%, 3/25/27 (144A)Ç | | 2,686,710 | | | 2,687,124 | |
| | Provident Funding Mortgage Trust 2021-INV1 A1, 2.5000%, 8/25/51 (144A)‡ | | 1,672,657 | | | 1,429,297 | |
| | Santander Bank Auto Credit-Linked Notes 2021-1A C, 3.2680%, 12/15/31 (144A) | | 1,097,864 | | | 1,070,096 | |
| | Santander Bank Auto Credit-Linked Notes 2022-A B, 5.2810%, 5/15/32 (144A) | | 2,552,922 | | | 2,518,454 | |
| | Santander Consumer Auto Receivables Trust 2020-AA, 1.3700%, 10/15/24 (144A) | | 112,788 | | | 112,593 | |
| | Santander Drive Auto Receivables Trust 2021-1 D, 1.1300%, 11/16/26 | | 4,581,000 | | | 4,379,896 | |
| | Santander Prime Auto Issuance Notes Trust 2018-A, 5.0400%, 9/15/25 (144A) | | 739,331 | | | 741,974 | |
| | |
See Notes to Schedule of Investments and Other Information and Notes to Financial Statements. |
| |
10 | JUNE 30, 2022 |
Janus Henderson Short Duration Flexible Bond Fund
Schedule of Investments
June 30, 2022
| | | | | | | | |
Shares or
Principal Amounts | | | Value | |
Asset-Backed/Commercial Mortgage-Backed Securities– (continued) | | | |
| | Sierra Receivables Funding Co LLC 2021-1A A, 0.9900%, 11/20/37 (144A) | | $1,465,527 | | | $1,384,801 | |
| | SoFi Professional Loan Program 2020-C Trust, 1.9500%, 2/15/46 (144A) | | 1,978,081 | | | 1,899,004 | |
| | SREIT Trust 2021-FLWR D, | | | | | | |
| | ICE LIBOR USD 1 Month + 1.3750%, 2.6990%, 7/15/36 (144A)‡ | | 2,543,000 | | | 2,362,655 | |
| | SREIT Trust 2021-MFP A, | | | | | | |
| | ICE LIBOR USD 1 Month + 0.7308%, 2.0548%, 11/15/38 (144A)‡ | | 3,236,000 | | | 3,069,943 | |
| | Tesla Auto Lease Trust 2020-A, 4.6400%, 8/20/24 (144A) | | 2,650,000 | | | 2,636,715 | |
| | Tesla Auto Lease Trust 2021-B A3, 0.6000%, 9/22/25 (144A) | | 1,050,000 | | | 991,173 | |
| | Tesla Auto Lease Trust 2021-B B, 0.9100%, 9/22/25 (144A) | | 538,000 | | | 504,158 | |
| | Theorem Funding Trust 2021-1A A, 1.2100%, 12/15/27 (144A) | | 1,176,553 | | | 1,146,664 | |
| | TPI Re-Remic Trust 2022-FRR1 AK33, 0%, 7/25/46 (144A)◊ | | 994,000 | | | 940,618 | |
| | TPI Re-Remic Trust 2022-FRR1 AK34, 0%, 7/25/46 (144A)◊ | | 819,000 | | | 775,016 | |
| | TPI Re-Remic Trust 2022-FRR1 AK35, 0%, 8/25/46 (144A)◊ | | 1,109,000 | | | 1,045,051 | |
| | Tricolor Auto Securitization Trust 2022-1A A, 3.3000%, 2/18/25 (144A) | | 2,497,435 | | | 2,485,552 | |
| | TTAN 2021-MHC A, ICE LIBOR USD 1 Month + 0.8500%, 2.1750%, 3/15/38 (144A)‡ | | 1,676,721 | | | 1,613,410 | |
| | UNIFY Auto Receivables Trust 2021-1A A4, 0.9800%, 7/15/26 (144A) | | 2,930,000 | | | 2,858,500 | |
| | United Wholesale Mortgage LLC 2021-INV4 A3, 2.5000%, 12/25/51 (144A)‡ | | 1,479,507 | | | 1,268,892 | |
| | Upstart Securitization Trust 2020-3 A, 1.7020%, 11/20/30 (144A) | | 331,795 | | | 330,295 | |
| | Upstart Securitization Trust 2021-1 A, 0.8700%, 3/20/31 (144A) | | 357,448 | | | 353,449 | |
| | Upstart Securitization Trust 2021-3 A, 0.8300%, 7/20/31 (144A) | | 1,565,910 | | | 1,519,881 | |
| | Upstart Securitization Trust 2021-4 A, 0.8400%, 9/20/31 (144A) | | 2,233,954 | | | 2,168,895 | |
| | Upstart Securitization Trust 2021-5 A, 1.3100%, 11/20/31 (144A) | | 711,419 | | | 683,689 | |
| | Upstart Securitization Trust 2022-1 A, 3.1200%, 3/20/32 (144A) | | 4,562,033 | | | 4,444,554 | |
| | Upstart Securitization Trust 2022-2 A, 4.3700%, 5/20/32 (144A) | | 4,007,000 | | | 3,968,835 | |
| | Vantage Data Centers LLC 2020-1A A2, 1.6450%, 9/15/45 (144A) | | 2,652,000 | | | 2,403,503 | |
| | VASA Trust 2021-VASA A, | | | | | | |
| | ICE LIBOR USD 1 Month + 0.9000%, 2.2240%, 7/15/39 (144A)‡ | | 1,260,000 | | | 1,203,453 | |
| | Verizon Owner Trust 2019-C, 2.0600%, 4/22/24 | | 8,417,000 | | | 8,342,126 | |
| | Verus Securitization Trust 2020-1, 2.6420%, 1/25/60 (144A)Ç | | 3,737,476 | | | 3,625,100 | |
| | VMC Finance LLC 2021-HT1 A, | | | | | | |
| | ICE LIBOR USD 1 Month + 1.6500%, 2.5860%, 1/18/37 (144A)‡ | | 1,626,295 | | | 1,556,578 | |
| | Westgate Resorts 2022-1A A, 1.7880%, 8/20/36 (144A) | | 767,676 | | | 733,004 | |
| | Woodward Capital Management 2021-3 A21, | | | | | | |
| | US 30 Day Average SOFR + 0.8000%, 1.3845%, 7/25/51 (144A)‡ | | 1,294,364 | | | 1,204,678 | |
Total Asset-Backed/Commercial Mortgage-Backed Securities (cost $392,078,510) | | 375,706,435 | |
Bank Loans and Mezzanine Loans– 0.3% | | | |
Capital Goods – 0.3% | | | |
| | Zurn Holdings Inc, ICE LIBOR USD 1 Month + 2.2500%, 3.9161%, 10/4/28‡((cost $3,248,619) | | 3,255,935 | | | 3,181,146 | |
Corporate Bonds– 32.8% | | | |
Banking – 8.4% | | | |
| | Banco Santander SA, | | | | | | |
| | US Treasury Yield Curve Rate 1 Year + 2.0000%, 4.1750%, 3/24/28‡ | | 8,400,000 | | | 8,015,112 | |
| | Bank of America Corp, SOFR + 0.6500%, 1.5300%, 12/6/25‡ | | 9,491,000 | | | 8,830,856 | |
| | Bank of New York Mellon Corp, | | | | | | |
| | US Treasury Yield Curve Rate 5 Year + 4.3580%, 4.7000%‡,µ | | 5,759,000 | | | 5,626,543 | |
| | BNP Paribas SA, ICE LIBOR USD 3 Month + 2.2350%, 4.7050%, 1/10/25 (144A)‡ | | 3,253,000 | | | 3,251,299 | |
| | BNP Paribas SA, ICE LIBOR USD 3 Month + 1.1110%, 2.8190%, 11/19/25 (144A)‡ | | 2,267,000 | | | 2,165,612 | |
| | BNP Paribas SA, USD SWAP SEMI 30/360 5YR + 5.1500%, 7.3750% (144A)‡,µ | | 5,148,000 | | | 5,096,251 | |
| | Citigroup Inc, 4.4000%, 6/10/25 | | 5,577,000 | | | 5,568,672 | |
| | Deutsche Bank AG / New York, 0.9620%, 11/8/23 | | 3,030,000 | | | 2,902,930 | |
| | Goldman Sachs Group Inc, SOFR + 0.5380%, 0.6270%, 11/17/23‡ | | 5,881,000 | | | 5,807,488 | |
| | JPMorgan Chase & Co, SOFR + 1.3200%, 4.0800%, 4/26/26‡ | | 6,763,000 | | | 6,678,644 | |
| | JPMorgan Chase & Co, ICE LIBOR USD 3 Month + 3.7800%, 6.7500%‡,µ | | 5,657,000 | | | 5,694,761 | |
| | Morgan Stanley, 4.1000%, 5/22/23 | | 8,673,000 | | | 8,706,824 | |
| | Morgan Stanley, ICE LIBOR USD 3 Month + 0.8470%, 3.7370%, 4/24/24‡ | | 5,133,000 | | | 5,115,129 | |
| | SVB Financial Group, | | | | | | |
| | US Treasury Yield Curve Rate 5 Year + 3.0740%, 4.2500%‡,µ | | 7,497,000 | | | 5,656,717 | |
| | |
See Notes to Schedule of Investments and Other Information and Notes to Financial Statements. |
| |
Janus Investment Fund | 11 |
Janus Henderson Short Duration Flexible Bond Fund
Schedule of Investments
June 30, 2022
| | | | | | | | |
Shares or
Principal Amounts | | | Value | |
Corporate Bonds– (continued) | | | |
Banking– (continued) | | | |
| | UBS Group AG, USD SWAP SEMI 30/360 5YR + 4.3440%, 7.0000% (144A)‡,µ | | $5,447,000 | | | $5,306,044 | |
| | Wells Fargo & Co, SOFR + 1.5100%, 3.5260%, 3/24/28‡ | | 3,116,000 | | | 2,951,311 | |
| | | 87,374,193 | |
Basic Industry – 0.9% | | | |
| | Novelis Corp, 3.2500%, 11/15/26 (144A) | | 4,224,000 | | | 3,570,440 | |
| | Univar Solutions USA Inc, 5.1250%, 12/1/27 (144A) | | 1,692,000 | | | 1,574,727 | |
| | W R Grace Holdings LLC, 5.6250%, 10/1/24 (144A) | | 3,946,000 | | | 3,822,924 | |
| | | 8,968,091 | |
Brokerage – 1.0% | | | |
| | Charles Schwab Corp, | | | | | | |
| | US Treasury Yield Curve Rate 5 Year + 4.9710%, 5.3750%‡,µ | | 10,603,000 | | | 10,470,463 | |
Capital Goods – 1.4% | | | |
| | Ardagh Packaging Finance PLC / Ardagh Holdings USA Inc, | | | | | | |
| | 4.1250%, 8/15/26 (144A) | | 8,937,000 | | | 7,571,516 | |
| | GFL Environmental Inc, 3.7500%, 8/1/25 (144A) | | 3,989,000 | | | 3,699,798 | |
| | TransDigm Inc, 8.0000%, 12/15/25 (144A) | | 2,724,000 | | | 2,754,618 | |
| | | 14,025,932 | |
Communications – 2.0% | | | |
| | CenturyLink Inc, 7.5000%, 4/1/24 | | 1,450,000 | | | 1,430,063 | |
| | CenturyLink Inc, 5.6250%, 4/1/25 | | 1,053,000 | | | 998,539 | |
| | Netflix Inc, 3.6250%, 6/15/25 (144A) | | 7,722,000 | | | 7,361,923 | |
| | Sprint Communications Inc, 6.0000%, 11/15/22 | | 3,817,000 | | | 3,833,614 | |
| | Sprint Corp, 7.8750%, 9/15/23 | | 2,254,000 | | | 2,323,401 | |
| | T-Mobile USA Inc, 2.2500%, 2/15/26 | | 2,834,000 | | | 2,550,297 | |
| | T-Mobile USA Inc, 2.2500%, 2/15/26 (144A) | | 2,864,000 | | | 2,577,294 | |
| | | 21,075,131 | |
Consumer Cyclical – 3.4% | | | |
| | Amazon.com Inc, 2.7300%, 4/13/24 | | 3,911,000 | | | 3,880,688 | |
| | Colt Merger Sub Inc, 5.7500%, 7/1/25 (144A) | | 2,695,000 | | | 2,577,255 | |
| | GLP Capital LP / GLP Financing II Inc, 3.3500%, 9/1/24 | | 5,795,000 | | | 5,537,968 | |
| | International Game Technology PLC, 6.5000%, 2/15/25 (144A) | | 2,189,000 | | | 2,178,055 | |
| | International Game Technology PLC, 4.1250%, 4/15/26 (144A) | | 1,766,000 | | | 1,598,230 | |
| | IRB Holding Corp, 7.0000%, 6/15/25 (144A) | | 1,596,000 | | | 1,562,245 | |
| | Lowe's Cos Inc, 3.3500%, 4/1/27 | | 916,000 | | | 881,492 | |
| | Vail Resorts Inc, 6.2500%, 5/15/25 (144A) | | 3,139,000 | | | 3,135,139 | |
| | VICI Properties LP, 4.3750%, 5/15/25 | | 3,774,000 | | | 3,685,987 | |
| | VICI Properties LP / VICI Note Co Inc, 3.5000%, 2/15/25 (144A) | | 8,868,000 | | | 8,295,328 | |
| | Wyndham Destinations Inc, 5.6500%, 4/1/24 | | 1,763,000 | | | 1,732,148 | |
| | | 35,064,535 | |
Consumer Non-Cyclical – 2.6% | | | |
| | Albertsons Cos Inc / Safeway Inc / New Albertsons LP / Albertsons LLC, | | | | | | |
| | 3.5000%, 2/15/23 (144A) | | 5,132,000 | | | 5,071,032 | |
| | Brunswick Corp, 0.8500%, 8/18/24 | | 6,078,000 | | | 5,616,870 | |
| | HCA Inc, 5.3750%, 2/1/25 | | 1,308,000 | | | 1,301,146 | |
| | HCA Inc, 5.8750%, 2/15/26 | | 684,000 | | | 687,509 | |
| | Horizon Pharma USA Inc, 5.5000%, 8/1/27 (144A) | | 2,095,000 | | | 2,020,313 | |
| | Indigo Merger Sub Inc, 2.8750%, 7/15/26 (144A) | | 6,630,000 | | | 5,900,700 | |
| | JBS Finance Luxembourg Sarl, 2.5000%, 1/15/27 (144A) | | 4,222,000 | | | 3,672,554 | |
| | Providence Service Corp, 5.8750%, 11/15/25 (144A) | | 1,734,000 | | | 1,595,280 | |
| | Tenet Healthcare Corp, 4.6250%, 7/15/24 | | 712,000 | | | 683,328 | |
| | | 26,548,732 | |
Electric – 0.1% | | | |
| | NextEra Energy Operating Partners LP, 4.2500%, 7/15/24 (144A) | | 1,229,000 | | | 1,175,661 | |
Energy – 0.9% | | | |
| | EQT Corp, 3.1250%, 5/15/26 (144A) | | 8,555,000 | | | 8,010,132 | |
| | Targa Resources Partners LP / Targa Resources Partners Finance Corp, | | | | | | |
| | 6.5000%, 7/15/27 | | 1,643,000 | | | 1,683,023 | |
| | | 9,693,155 | |
| | |
See Notes to Schedule of Investments and Other Information and Notes to Financial Statements. |
| |
12 | JUNE 30, 2022 |
Janus Henderson Short Duration Flexible Bond Fund
Schedule of Investments
June 30, 2022
| | | | | | | | |
Shares or
Principal Amounts | | | Value | |
Corporate Bonds– (continued) | | | |
Finance Companies – 5.7% | | | |
| | AerCap Ireland Capital DAC / AerCap Global Aviation Trust, | | | | | | |
| | 1.6500%, 10/29/24 | | $6,559,000 | | | $6,056,133 | |
| | AerCap Ireland Capital DAC / AerCap Global Aviation Trust, | | | | | | |
| | 2.4500%, 10/29/26 | | 13,077,000 | | | 11,386,965 | |
| | Air Lease Corp, 0.8000%, 8/18/24 | | 3,072,000 | | | 2,813,001 | |
| | Air Lease Corp, 1.8750%, 8/15/26 | | 3,147,000 | | | 2,718,958 | |
| | Ares Capital Corp, 2.8750%, 6/15/27 | | 4,880,000 | | | 4,073,204 | |
| | Avolon Holdings Funding Ltd, 4.2500%, 4/15/26 (144A) | | 2,351,000 | | | 2,177,135 | |
| | Avolon Holdings Funding Ltd, 2.1250%, 2/21/26 (144A) | | 3,354,000 | | | 2,899,587 | |
| | Blackstone Private Credit Fund, 4.7000%, 3/24/25 (144A) | | 5,609,000 | | | 5,388,284 | |
| | Castlelake Aviation Finance DAC, 5.0000%, 4/15/27 (144A)# | | 2,999,000 | | | 2,489,622 | |
| | OneMain Finance Corp, 3.5000%, 1/15/27 | | 2,473,000 | | | 1,978,400 | |
| | Owl Rock Capital Corp, 3.1250%, 4/13/27 (144A) | | 4,908,000 | | | 4,191,016 | |
| | Rocket Mortgage LLC / Rocket Mortgage Co-Issuer Inc, | | | | | | |
| | 2.8750%, 10/15/26 (144A) | | 7,856,000 | | | 6,492,277 | |
| | SLM Corp, 3.1250%, 11/2/26 | | 5,551,000 | | | 4,482,210 | |
| | Springleaf Finance Corp, 6.8750%, 3/15/25 | | 2,071,000 | | | 1,962,811 | |
| | | 59,109,603 | |
Government Sponsored – 0.3% | | | |
| | DAE Funding LLC, 1.5500%, 8/1/24 (144A) | | 1,642,000 | | | 1,537,991 | |
| | NOVA Chemicals Corp, 4.8750%, 6/1/24 (144A) | | 1,707,000 | | | 1,622,499 | |
| | | 3,160,490 | |
Insurance – 2.0% | | | |
| | Athene Global Funding, 1.7160%, 1/7/25 (144A) | | 6,009,000 | | | 5,607,058 | |
| | Centene Corp, 4.2500%, 12/15/27 | | 13,752,000 | | | 12,837,079 | |
| | Corebridge Financial Inc, 3.5000%, 4/4/25 (144A) | | 2,625,000 | | | 2,550,409 | |
| | | 20,994,546 | |
Real Estate Investment Trusts (REITs) – 0.6% | | | |
| | HAT Holdings I LLC / HAT Holdings II LLC, 3.3750%, 6/15/26 (144A) | | 4,371,000 | | | 3,759,060 | |
| | Starwood Property Trust Inc, 3.7500%, 12/31/24 (144A) | | 2,946,000 | | | 2,680,860 | |
| | | 6,439,920 | |
Technology – 3.5% | | | |
| | Broadcom Inc, 3.4590%, 9/15/26 | | 12,701,000 | | | 12,168,371 | |
| | Microchip Technology Inc, 2.6700%, 9/1/23 | | 5,655,000 | | | 5,560,781 | |
| | Microchip Technology Inc, 4.2500%, 9/1/25 | | 2,385,000 | | | 2,321,821 | |
| | Qorvo Inc, 1.7500%, 12/15/24 (144A)# | | 3,936,000 | | | 3,676,696 | |
| | S&P Global Inc, 2.4500%, 3/1/27 (144A) | | 5,769,000 | | | 5,399,802 | |
| | SK Hynix Inc, 1.0000%, 1/19/24 (144A) | | 6,587,000 | | | 6,288,477 | |
| | TSMC Arizona Corp, 3.8750%, 4/22/27 | | 1,299,000 | | | 1,294,592 | |
| | | 36,710,540 | |
Total Corporate Bonds (cost $368,541,584) | | 340,810,992 | |
Mortgage-Backed Securities– 4.7% | | | |
Fannie Mae: | | | |
| | 3.0000%, TBA, 30 Year Maturity | | 7,660,827 | | | 7,131,472 | |
| | 3.5000%, TBA, 30 Year Maturity | | 5,636,570 | | | 5,419,985 | |
| | 4.0000%, TBA, 30 Year Maturity | | 12,119,125 | | | 11,948,257 | |
| | 4.5000%, TBA, 30 Year Maturity | | 2,643,895 | | | 2,653,677 | |
| | | 27,153,391 | |
Fannie Mae Pool: | | | |
| | 3.0000%, 3/1/52 | | 6,103,235 | | | 5,688,663 | |
| | 3.0000%, 3/1/52 | | 1,440,706 | | | 1,345,791 | |
| | 3.0000%, 4/1/52 | | 1,209,068 | | | 1,130,109 | |
| | 3.0000%, 4/1/52 | | 1,066,413 | | | 996,088 | |
| | 3.5000%, 4/1/52 | | 1,066,581 | | | 1,032,131 | |
| | 3.5000%, 4/1/52 | | 590,126 | | | 570,966 | |
| | 3.5000%, 4/1/52 | | 366,042 | | | 354,219 | |
| | 3.5000%, 4/1/52 | | 221,596 | | | 214,415 | |
| | 3.5000%, 4/1/52 | | 170,235 | | | 164,708 | |
| | |
See Notes to Schedule of Investments and Other Information and Notes to Financial Statements. |
| |
Janus Investment Fund | 13 |
Janus Henderson Short Duration Flexible Bond Fund
Schedule of Investments
June 30, 2022
| | | | | | | | |
Shares or
Principal Amounts | | | Value | |
Mortgage-Backed Securities– (continued) | | | |
Fannie Mae Pool– (continued) | | | |
| | 3.5000%, 6/1/52 | | $4,150,020 | | | $3,994,288 | |
| | 3.5000%, 6/1/52 | | 1,288,868 | | | 1,240,371 | |
| | | 16,731,749 | |
Freddie Mac Pool: | | | |
| | 3.5000%, 2/1/52 | | 1,228,876 | | | 1,184,679 | |
| | 3.5000%, 4/1/52 | | 147,495 | | | 142,719 | |
| | 3.5000%, 4/1/52 | | 123,518 | | | 119,511 | |
| | 3.5000%, 5/1/52 | | 3,331,795 | | | 3,210,193 | |
| | | 4,657,102 | |
Total Mortgage-Backed Securities (cost $49,523,732) | | 48,542,242 | |
United States Treasury Notes/Bonds– 24.5% | | | |
| | 0.1250%, 12/31/22 | | 4,293,000 | | | 4,241,685 | |
| | 0.1250%, 2/28/23 | | 21,798,000 | | | 21,427,604 | |
| | 0.1250%, 3/31/23 | | 26,954,000 | | | 26,430,713 | |
| | 0.2500%, 4/15/23 | | 8,776,000 | | | 8,599,452 | |
| | 0.1250%, 4/30/23 | | 17,062,000 | | | 16,678,105 | |
| | 0.1250%, 5/31/23 | | 24,051,000 | | | 23,455,362 | |
| | 0.1250%, 6/30/23 | | 60,346,000 | | | 58,698,271 | |
| | 0.1250%, 8/31/23 | | 4,619,000 | | | 4,468,702 | |
| | 0.3750%, 10/31/23 | | 44,134,000 | | | 42,651,373 | |
| | 0.8750%, 1/31/24 | | 17,979,000 | | | 17,397,492 | |
| | 0.7500%, 11/15/24 | | 9,849,000 | | | 9,338,853 | |
| | 1.1250%, 1/15/25 | | 760,000 | | | 724,791 | |
| | 1.5000%, 2/15/25 | | 361,000 | | | 346,955 | |
| | 1.7500%, 3/15/25 | | 1,442,000 | | | 1,394,065 | |
| | 0.8750%, 9/30/26 | | 2,586,400 | | | 2,362,111 | |
| | 2.7500%, 4/30/27 | | 15,243,900 | | | 15,037,869 | |
| | 2.7500%, 5/31/29 | | 1,453,000 | | | 1,424,394 | |
Total United States Treasury Notes/Bonds (cost $261,214,644) | | 254,677,797 | |
Investment Companies– 3.9% | | | |
Money Markets – 3.9% | | | |
| | Janus Henderson Cash Liquidity Fund LLC, 1.3877%ºº,£((cost $40,686,668) | | 40,684,162 | | | 40,688,230 | |
Investments Purchased with Cash Collateral from Securities Lending– 0.1% | | | |
Investment Companies – 0.1% | | | |
| | Janus Henderson Cash Collateral Fund LLC, 1.3810%ºº,£ | | 1,022,250 | | | 1,022,250 | |
Time Deposits – 0% | | | |
| | Royal Bank of Canada, 1.5600%, 7/1/22 | | $255,563 | | | 255,563 | |
Total Investments Purchased with Cash Collateral from Securities Lending (cost $1,277,813) | | 1,277,813 | |
Total Investments (total cost $1,116,571,570) – 102.5% | | 1,064,884,655 | |
Liabilities, net of Cash, Receivables and Other Assets – (2.5)% | | (26,202,617) | |
Net Assets – 100% | | $1,038,682,038 | |
| | |
See Notes to Schedule of Investments and Other Information and Notes to Financial Statements. |
| |
14 | JUNE 30, 2022 |
Janus Henderson Short Duration Flexible Bond Fund
Schedule of Investments
June 30, 2022
| | | | | | |
Summary of Investments by Country - (Long Positions) (unaudited) |
| |
| | | | | % of | |
| | | | | Investment | |
Country | | Value | | Securities | |
United States | | $981,924,867 | | 92.2 | % |
Ireland | | 28,420,520 | | 2.7 | |
France | | 10,513,162 | | 1.0 | |
Canada | | 8,155,074 | | 0.8 | |
Spain | | 8,015,112 | | 0.7 | |
South Korea | | 6,288,477 | | 0.6 | |
Switzerland | | 5,306,044 | | 0.5 | |
Bermuda | | 4,224,751 | | 0.4 | |
United Kingdom | | 3,808,443 | | 0.4 | |
Germany | | 2,902,930 | | 0.3 | |
Japan | | 2,492,692 | | 0.2 | |
United Arab Emirates | | 1,537,991 | | 0.1 | |
Taiwan | | 1,294,592 | | 0.1 | |
| | | | | | |
| | | | | | |
Total | | $1,064,884,655 | | 100.0 | % |
| | |
See Notes to Schedule of Investments and Other Information and Notes to Financial Statements. |
| |
Janus Investment Fund | 15 |
Janus Henderson Short Duration Flexible Bond Fund
Schedule of Investments
June 30, 2022
Schedules of Affiliated Investments – (% of Net Assets)
| | | | | | | | | | | |
| | Dividend Income | Realized Gain/(Loss) | Change in Unrealized Appreciation/ Depreciation | Value at 6/30/22 |
Investment Companies - 3.9% |
Money Markets - 3.9% | |
| | Janus Henderson Cash Liquidity Fund LLC, 1.3877%ºº | $ | 142,429 | $ | (434) | $ | 1,562 | $ | 40,688,230 |
Investments Purchased with Cash Collateral from Securities Lending - 0.1% |
Investment Companies - 0.1% | |
| | Janus Henderson Cash Collateral Fund LLC, 1.3810%ºº | | 8,659∆ | | - | | - | | 1,022,250 |
Total Affiliated Investments - 4.0% | $ | 151,088 | $ | (434) | $ | 1,562 | $ | 41,710,480 |
| | | | | | | | | | | |
| | Value at 6/30/21 | Purchases | Sales Proceeds | Value at 6/30/22 |
Investment Companies - 3.9% |
Money Markets - 3.9% | |
| | Janus Henderson Cash Liquidity Fund LLC, 1.3877%ºº | | 74,352,923 | | 659,083,329 | | (692,749,150) | | 40,688,230 |
Investments Purchased with Cash Collateral from Securities Lending - 0.1% |
Investment Companies - 0.1% | |
| | Janus Henderson Cash Collateral Fund LLC, 1.3810%ºº | | - | | 141,516,031 | | (140,493,781) | | 1,022,250 |
| | |
See Notes to Schedule of Investments and Other Information and Notes to Financial Statements. |
| |
16 | JUNE 30, 2022 |
Janus Henderson Short Duration Flexible Bond Fund
Schedule of Investments
June 30, 2022
Schedule of Futures
| | | | | | | | | | | | | | | |
Description | | Number of Contracts | | Expiration Date | | Notional Amount | | Value and Unrealized Appreciation/(Depreciation) | | |
Futures Long: | | | | | | | | | | |
2 Year US Treasury Note | | 1,410 | | 10/5/22 | $ | 296,122,033 | $ | (1,659,140) | |
5 Year US Treasury Note | | 53 | | 10/5/22 | | 5,949,250 | | (49,273) | |
Ultra 10-Year Treasury Note | | 39 | | 9/30/22 | | 4,967,625 | | (79,219) | |
Ultra Long Term US Treasury Bond | | 3 | | 9/30/22 | | 463,031 | | (10,756) | |
Total - Futures Long | | | | | | | | (1,798,388) | |
Futures Short: | | | | | | | | | | |
10 Year US Treasury Note | | 116 | | 9/30/22 | | (13,749,625) | | 168,563 | |
US Treasury Long Bond | | 100 | | 9/30/22 | | (13,862,500) | | 231,959 | |
Total - Futures Short | | | | | | | | 400,522 | |
Total | | | | | | | $ | (1,397,866) | | |
The following table, grouped by derivative type, provides information about the fair value and location of derivatives within the Statement of Assets and Liabilities as of June 30, 2022.
| | | | | | |
Fair Value of Derivative Instruments (not accounted for as hedging instruments) as of June 30, 2022 |
| | | | | |
| | | | | Interest Rate
Contracts |
Asset Derivatives: | | | |
*Futures contracts | | | $ 400,522 |
| | | | |
Liability Derivatives: | | | |
*Futures contracts | | | $ 1,798,388 |
| | | | |
*The fair value presented includes net cumulative unrealized appreciation (depreciation) on futures contracts and centrally cleared swaps. In the Statement of Assets and Liabilities, only current day's variation margin is reported in receivables or payables and the net cumulative unrealized appreciation (depreciation) is included in total distributable earnings (loss). |
The following tables provide information about the effect of derivatives and hedging activities on the Fund’s Statement of Operations for the year ended June 30, 2022.
| | | | | |
The effect of Derivative Instruments (not accounted for as hedging instruments) on the Statement of Operations for the year ended June 30, 2022 |
| | | | |
Amount of Realized Gain/(Loss) Recognized on Derivatives |
Derivative | | Interest Rate
Contracts |
Futures contracts | | $(15,377,684) |
| | | | | |
| | | | | |
| | | | | |
Amount of Change in Unrealized Appreciation/Depreciation Recognized on Derivatives |
Derivative | | Interest Rate
Contracts |
Futures contracts | | $ (520,907) |
| | | | | |
| | |
See Notes to Schedule of Investments and Other Information and Notes to Financial Statements. |
| |
Janus Investment Fund | 17 |
Janus Henderson Short Duration Flexible Bond Fund
Schedule of Investments
June 30, 2022
Please see the "Net Realized Gain/(Loss) on Investments" and "Change in Unrealized Net Appreciation/Depreciation" sections of the Fund’s Statement of Operations.
| | |
Average Ending Monthly Value of Derivative Instruments During the Year Ended June 30, 2022 |
| |
| |
Futures contracts: | |
Average notional amount of contracts - long | $449,021,258 |
Average notional amount of contracts - short | 37,109,924 |
| | |
| |
| |
| |
| | | | | | | | | | |
Offsetting of Financial Assets and Derivative Assets |
| |
| | | Gross Amounts | | | | | | |
| | | of Recognized | | Offsetting Asset | | Collateral | | |
Counterparty | | Assets | | or Liability(a) | | Pledged(b) | | Net Amount |
| | | | | | | | | |
JPMorgan Chase Bank, National Association | $ | 1,233,024 | $ | — | $ | (1,233,024) | $ | — |
| | | | | | | | | |
(a) | Represents the amount of assets or liabilities that could be offset with the same counterparty under master netting or similar agreements that management elects not to offset on the Statement of Assets and Liabilities. |
(b) | Collateral pledged is limited to the net outstanding amount due to/from an individual counterparty. The actual collateral amounts pledged may exceed these amounts and may fluctuate in value. |
| | |
See Notes to Schedule of Investments and Other Information and Notes to Financial Statements. |
| |
18 | JUNE 30, 2022 |
Janus Henderson Short Duration Flexible Bond Fund
Notes to Schedule of Investments and Other Information
| | |
Bloomberg 1-3 Year U.S. Government/Credit Index | Bloomberg 1-3 Year U.S. Government/Credit Index measures Treasuries, government-related issues and corporates with maturity between 1-3 years. |
| | |
ICE | Intercontinental Exchange |
LIBOR | London Interbank Offered Rate |
LLC | Limited Liability Company |
LP | Limited Partnership |
PLC | Public Limited Company |
SOFR | Secured Overnight Financing Rate |
TBA | (To Be Announced) Securities are purchased/sold on a forward commitment basis with an approximate principal amount and no defined maturity date. The actual principal and maturity date will be determined upon settlement when specific mortgage pools are assigned. |
| | |
144A | Securities sold under Rule 144A of the Securities Act of 1933, as amended, are subject to legal and/or contractual restrictions on resale and may not be publicly sold without registration under the 1933 Act. Unless otherwise noted, these securities have been determined to be liquid under guidelines established by the Board of Trustees. The total value of 144A securities as of the year ended June 30, 2022 is $503,336,165, which represents 48.5% of net assets. |
| | |
‡ | Variable or floating rate security. Rate shown is the current rate as of June 30, 2022. Certain variable rate securities are not based on a published reference rate and spread; they are determined by the issuer or agent and current market conditions. Reference rate is as of reset date and may vary by security, which may not indicate a reference rate and/or spread in their description. |
| | |
ºº | Rate shown is the 7-day yield as of June 30, 2022. |
| | |
# | Loaned security; a portion of the security is on loan at June 30, 2022. |
| | |
µ | Perpetual security. Perpetual securities have no stated maturity date, but they may be called/redeemed by the issuer. The date indicated, if any, represents the next call date. |
| | |
Ç | Step bond. The coupon rate will increase or decrease periodically based upon a predetermined schedule. The rate shown reflects the current rate. |
| | |
£ | The Fund may invest in certain securities that are considered affiliated companies. As defined by the Investment Company Act of 1940, as amended, an affiliated company is one in which the Fund owns 5% or more of the outstanding voting securities, or a company which is under common ownership or control. |
| | |
∆ | Net of income paid to the securities lending agent and rebates paid to the borrowing counterparties. |
Janus Henderson Short Duration Flexible Bond Fund
Notes to Schedule of Investments and Other Information
| | | | | | | | | | | | | | |
The following is a summary of the inputs that were used to value the Fund’s investments in securities and other financial instruments as of June 30, 2022. See Notes to Financial Statements for more information. |
| |
Valuation Inputs Summary |
| | | | | | | |
| | | | | Level 2 - | | Level 3 - |
| | | Level 1 - | | Other Significant | | Significant |
| | | Quoted Prices | | Observable Inputs | | Unobservable Inputs |
| | | | | | | |
Assets | | | | | | |
Investments In Securities: | | | | | | |
Asset-Backed/Commercial Mortgage-Backed Securities | $ | - | $ | 375,706,435 | $ | - |
Bank Loans and Mezzanine Loans | | - | | 3,181,146 | | - |
Corporate Bonds | | - | | 340,810,992 | | - |
Mortgage-Backed Securities | | - | | 48,542,242 | | - |
United States Treasury Notes/Bonds | | - | | 254,677,797 | | - |
Investment Companies | | - | | 40,688,230 | | - |
Investments Purchased with Cash Collateral from Securities Lending | | - | | 1,277,813 | | - |
Total Investments in Securities | $ | - | $ | 1,064,884,655 | $ | - |
Other Financial Instruments(a): | | | | | | |
Futures Contracts | | 400,522 | | - | | - |
Total Assets | $ | 400,522 | $ | 1,064,884,655 | $ | - |
Liabilities | | | | | | |
Other Financial Instruments(a): | | | | | | |
Futures Contracts | $ | 1,798,388 | $ | - | $ | - |
| | | | | | | |
(a) | Other financial instruments include forward foreign currency exchange contracts, futures, written options, written swaptions, and swap contracts. Forward foreign currency exchange contracts, futures contracts, and swap contracts are reported at their unrealized appreciation/(depreciation) at measurement date, which represents the change in the contract's value from trade date. Written options and written swaptions are reported at their market value at measurement date. |
Janus Henderson Short Duration Flexible Bond Fund
Statement of Assets and Liabilities
June 30, 2022
| |
See footnotes at the end of the Statement. |
| | | | | | | |
| | | | | | |
Assets: | | | | |
| Unaffiliated investments, at value (cost $1,074,862,652)(1) | | $ | 1,023,174,175 | |
| Affiliated investments, at value (cost $41,708,918) | | | 41,710,480 | |
| Cash | | | 335,416 | |
| Deposits with brokers for futures | | | 2,629,000 | |
| Variation margin receivable on futures contracts | | | 1,128,729 | |
| Trustees' deferred compensation | | | 30,324 | |
| Receivables: | | | | |
| | Interest | | | 4,001,195 | |
| | Fund shares sold | | | 1,918,757 | |
| | Dividends from affiliates | | | 36,666 | |
| Other assets | | | 4,497 | |
Total Assets | | | 1,074,969,239 | |
Liabilities: | | | | |
| Collateral for securities loaned (Note 3) | | | 1,277,813 | |
| Variation margin payable on futures contracts | | | 286,563 | |
| Payables: | | | — | |
| | TBA investments purchased | | | 27,341,521 | |
| | Investments purchased | | | 3,621,876 | |
| | Fund shares repurchased | | | 3,034,897 | |
| | Advisory fees | | | 254,848 | |
| | Transfer agent fees and expenses | | | 188,466 | |
| | Professional fees | | | 65,043 | |
| | Dividends | | | 58,815 | |
| | Trustees' deferred compensation fees | | | 30,324 | |
| | 12b-1 Distribution and shareholder servicing fees | | | 28,215 | |
| | Trustees' fees and expenses | | | 4,437 | |
| | Custodian fees | | | 3,359 | |
| | Affiliated fund administration fees payable | | | 2,165 | |
| | Accrued expenses and other payables | | | 88,859 | |
Total Liabilities | | | 36,287,201 | |
Net Assets | | $ | 1,038,682,038 | |
| | |
See Notes to Financial Statements. |
| |
Janus Investment Fund | 21 |
Janus Henderson Short Duration Flexible Bond Fund
Statement of Assets and Liabilities
June 30, 2022
| | | | | | | |
| | | | | | |
| | | | | | | |
Net Assets Consist of: | | | | |
| Capital (par value and paid-in surplus) | | $ | 1,132,429,053 | |
| Total distributable earnings (loss) | | | (93,747,015) | |
Total Net Assets | | $ | 1,038,682,038 | |
Net Assets - Class A Shares | | $ | 66,254,052 | |
| Shares Outstanding, $0.01 Par Value (unlimited shares authorized) | | | 23,244,905 | |
Net Asset Value Per Share(2) | | $ | 2.85 | |
Maximum Offering Price Per Share(3) | | $ | 2.92 | |
Net Assets - Class C Shares | | $ | 16,946,547 | |
| Shares Outstanding, $0.01 Par Value (unlimited shares authorized) | | | 5,956,910 | |
Net Asset Value Per Share(2) | | $ | 2.84 | |
Net Assets - Class D Shares | | $ | 172,561,856 | |
| Shares Outstanding, $0.01 Par Value (unlimited shares authorized) | | | 60,496,630 | |
Net Asset Value Per Share | | $ | 2.85 | |
Net Assets - Class I Shares | | $ | 442,881,344 | |
| Shares Outstanding, $0.01 Par Value (unlimited shares authorized) | | | 155,460,670 | |
Net Asset Value Per Share | | $ | 2.85 | |
Net Assets - Class N Shares | | $ | 45,087,908 | |
| Shares Outstanding, $0.01 Par Value (unlimited shares authorized) | | | 15,874,144 | |
Net Asset Value Per Share | | $ | 2.84 | |
Net Assets - Class S Shares | | $ | 371,088 | |
| Shares Outstanding, $0.01 Par Value (unlimited shares authorized) | | | 130,334 | |
Net Asset Value Per Share | | $ | 2.85 | |
Net Assets - Class T Shares | | $ | 294,579,243 | |
| Shares Outstanding, $0.01 Par Value (unlimited shares authorized) | | | 103,243,467 | |
Net Asset Value Per Share | | $ | 2.85 | |
| |
(1) Includes $1,233,024 of securities on loan. See Note 3 in Notes to Financial Statements. (2) Redemption price per share may be reduced for any applicable contingent deferred sales charge. (3) Maximum offering price is computed at 100/97.5 of net asset value. |
| | |
See Notes to Financial Statements. |
| |
22 | JUNE 30, 2022 |
Janus Henderson Short Duration Flexible Bond Fund
Statement of Operations
For the year ended June 30, 2022
| | | | | | |
| | | | | |
Investment Income: | | | |
| Interest | $ | 19,885,572 | |
| Dividends from affiliates | | 142,429 | |
| Affiliated securities lending income, net | | 8,659 | |
| Unaffiliated securities lending income, net | | 1,067 | |
| Other income | | 501,369 | |
Total Investment Income | | 20,539,096 | |
Expenses: | | | |
| Advisory fees | | 5,123,243 | |
| 12b-1 Distribution and shareholder servicing fees: | | | |
| | Class A Shares | | 186,756 | |
| | Class C Shares | | 192,882 | |
| | Class S Shares | | 1,586 | |
| Transfer agent administrative fees and expenses: | | | |
| | Class D Shares | | 219,122 | |
| | Class S Shares | | 1,586 | |
| | Class T Shares | | 883,767 | |
| Transfer agent networking and omnibus fees: | | | |
| | Class A Shares | | 33,646 | |
| | Class C Shares | | 12,448 | |
| | Class I Shares | | 619,893 | |
| Other transfer agent fees and expenses: | | | |
| | Class A Shares | | 4,416 | |
| | Class C Shares | | 986 | |
| | Class D Shares | | 33,658 | |
| | Class I Shares | | 22,205 | |
| | Class N Shares | | 1,053 | |
| | Class S Shares | | 32 | |
| | Class T Shares | | 4,110 | |
| Registration fees | | 150,320 | |
| Shareholder reports expense | | 94,810 | |
| Professional fees | | 69,890 | |
| Affiliated fund administration fees | | 29,109 | |
| Trustees’ fees and expenses | | 19,544 | |
| Custodian fees | | 13,107 | |
| Other expenses | | 134,364 | |
Total Expenses | | 7,852,533 | |
Less: Excess Expense Reimbursement and Waivers | | (1,147,023) | |
Net Expenses | | 6,705,510 | |
Net Investment Income/(Loss) | | 13,833,586 | |
| | | | | |
| | |
See Notes to Financial Statements. |
| |
Janus Investment Fund | 23 |
Janus Henderson Short Duration Flexible Bond Fund
Statement of Operations
For the year ended June 30, 2022
| | | | | | |
| | | | | |
Net Realized Gain/(Loss) on Investments: | | | |
| Investments | $ | (7,663,223) | |
| Investments in affiliates | | (434) | |
| Futures contracts | | (15,377,684) | |
Total Net Realized Gain/(Loss) on Investments | | (23,041,341) | |
Change in Unrealized Net Appreciation/Depreciation: | | | |
| Investments and Trustees’ deferred compensation | | (62,374,707) | |
| Investments in affiliates | | 1,562 | |
| Futures contracts | | (520,907) | |
Total Change in Unrealized Net Appreciation/Depreciation | | (62,894,052) | |
Net Increase/(Decrease) in Net Assets Resulting from Operations | $ | (72,101,807) | |
| | | | | |
| | |
See Notes to Financial Statements. |
| |
24 | JUNE 30, 2022 |
Janus Henderson Short Duration Flexible Bond Fund
Statements of Changes in Net Assets
| | | | | | | | | |
| | | | | | | | |
| | | Year ended
June 30, 2022 | | Year ended
June 30, 2021 | |
| | | | | | | | | |
Operations: | | | | | | |
| Net investment income/(loss) | $ | 13,833,586 | | $ | 18,806,750 | |
| Net realized gain/(loss) on investments | | (23,041,341) | | | 16,826,241 | |
| Change in unrealized net appreciation/depreciation | | (62,894,052) | | | (6,100,654) | |
Net Increase/(Decrease) in Net Assets Resulting from Operations | | (72,101,807) | | | 29,532,337 | |
Dividends and Distributions to Shareholders: | | | | | | |
| | Class A Shares | | (939,007) | | | (1,247,705) | |
| | Class C Shares | | (110,941) | | | (297,223) | |
| | Class D Shares | | (2,783,229) | | | (3,728,556) | |
| | Class I Shares | | (7,234,654) | | | (7,452,379) | |
| | Class N Shares | | (464,174) | | | (313,285) | |
| | Class S Shares | | (6,770) | | | (9,698) | |
| | Class T Shares | | (4,613,466) | | | (7,130,790) | |
Net Decrease from Dividends and Distributions to Shareholders | | (16,152,241) | | | (20,179,636) | |
Capital Share Transactions: | | | | | | |
| | Class A Shares | | (5,724,778) | | | 12,056,021 | |
| | Class C Shares | | (5,185,205) | | | (3,882,252) | |
| | Class D Shares | | (20,358,158) | | | 14,311,095 | |
| | Class I Shares | | 59,461,565 | | | 37,368,586 | |
| | Class N Shares | | 31,568,304 | | | (1,464,013) | |
| | Class S Shares | | (240,057) | | | (135,454) | |
| | Class T Shares | | (83,079,366) | | | (27,028,589) | |
Net Increase/(Decrease) from Capital Share Transactions | | (23,557,695) | | | 31,225,394 | |
Net Increase/(Decrease) in Net Assets | | (111,811,743) | | | 40,578,095 | |
Net Assets: | | | | | | |
| Beginning of period | | 1,150,493,781 | | | 1,109,915,686 | |
| End of period | $ | 1,038,682,038 | | $ | 1,150,493,781 | |
| | | | | | | | |
| | |
See Notes to Financial Statements. |
| |
Janus Investment Fund | 25 |
Janus Henderson Short Duration Flexible Bond Fund
Financial Highlights
| | | | | | | | | | | | | | | | | | | |
Class A Shares | | | | | | | | | | | | | | | |
For a share outstanding during the year ended June 30 | | 2022 | | | 2021 | | | 2020 | | | 2019 | | | 2018 | |
| Net Asset Value, Beginning of Period | | $3.08 | | | $3.06 | | | $3.02 | | | $2.98 | | | $3.02 | |
| Income/(Loss) from Investment Operations: | | | | | | | | | | | | | | | |
| | Net investment income/(loss)(1) | | 0.03 | | | 0.05 | | | 0.06 | | | 0.07 | | | 0.05 | |
| | Net realized and unrealized gain/(loss) | | (0.22) | | | 0.02 | | | 0.05 | | | 0.04 | | | (0.04) | |
| Total from Investment Operations | | (0.19) | | | 0.07 | | | 0.11 | | | 0.11 | | | 0.01 | |
| Less Dividends and Distributions: | | | | | | | | | | | | | | | |
| | Dividends (from net investment income) | | (0.04) | | | (0.05) | | | (0.07) | | | (0.07) | | | (0.05) | |
| Total Dividends and Distributions | | (0.04) | | | (0.05) | | | (0.07) | | | (0.07) | | | (0.05) | |
| Net Asset Value, End of Period | | $2.85 | | | $3.08 | | | $3.06 | | | $3.02 | | | $2.98 | |
| Total Return* | | (6.28)% | | | 2.30% | | | 3.57% | | | 3.64% | | | 0.41% | |
| Net Assets, End of Period (in thousands) | | $66,254 | | | $77,673 | | | $65,066 | | | $57,815 | | | $52,118 | |
| Average Net Assets for the Period (in thousands) | | $74,703 | | | $76,534 | | | $56,628 | | | $57,158 | | | $61,037 | |
| Ratios to Average Net Assets**: | | | | | | | | | | | | | | | |
| | Ratio of Gross Expenses | | 0.78% | | | 0.78% | | | 0.79% | | | 0.85% | | | 0.90% | |
| | Ratio of Net Expenses (After Waivers and Expense Offsets) | | 0.71% | | | 0.74% | | | 0.74% | | | 0.77% | | | 0.79% | |
| | Ratio of Net Investment Income/(Loss) | | 1.06% | | | 1.51% | | | 2.10% | | | 2.25% | | | 1.69% | |
| Portfolio Turnover Rate | | 94%(2) | | | 112%(2) | | | 121% | | | 79% | | | 78% | |
| | | | | | | | | | | | | | | | | | | |
| |
* Total return includes adjustments in accordance with generally accepted accounting principles required at the year or period end and are not annualized for periods of less than one full year. ** Annualized for periods of less than one full year. (1) Per share amounts are calculated based on average shares outstanding during the year or period. (2) Portfolio Turnover Rate excludes TBA (to be announced) purchase and sales commitments. |
| | |
See Notes to Financial Statements. |
| |
26 | JUNE 30, 2022 |
Janus Henderson Short Duration Flexible Bond Fund
Financial Highlights
| | | | | | | | | | | | | | | | | | | |
Class C Shares | | | | | | | | | | | | | | | |
For a share outstanding during the year ended June 30 | | 2022 | | | 2021 | | | 2020 | | | 2019 | | | 2018 | |
| Net Asset Value, Beginning of Period | | $3.08 | | | $3.05 | | | $3.01 | | | $2.97 | | | $3.02 | |
| Income/(Loss) from Investment Operations: | | | | | | | | | | | | | | | |
| | Net investment income/(loss)(1) | | 0.01 | | | 0.03 | | | 0.04 | | | 0.05 | | | 0.03 | |
| | Net realized and unrealized gain/(loss) | | (0.23) | | | 0.03 | | | 0.04 | | | 0.04 | | | (0.05) | |
| Total from Investment Operations | | (0.22) | | | 0.06 | | | 0.08 | | | 0.09 | | | (0.02) | |
| Less Dividends and Distributions: | | | | | | | | | | | | | | | |
| | Dividends (from net investment income) | | (0.02) | | | (0.03) | | | (0.04) | | | (0.05) | | | (0.03) | |
| Total Dividends and Distributions | | (0.02) | | | (0.03) | | | (0.04) | | | (0.05) | | | (0.03) | |
| Net Asset Value, End of Period | | $2.84 | | | $3.08 | | | $3.05 | | | $3.01 | | | $2.97 | |
| Total Return* | | (7.27)% | | | 2.04% | | | 2.84% | | | 2.90% | | | (0.69)% | |
| Net Assets, End of Period (in thousands) | | $16,947 | | | $23,656 | | | $27,296 | | | $29,434 | | | $27,253 | |
| Average Net Assets for the Period (in thousands) | | $20,412 | | | $28,272 | | | $26,387 | | | $30,443 | | | $33,426 | |
| Ratios to Average Net Assets**: | | | | | | | | | | | | | | | |
| | Ratio of Gross Expenses | | 1.51% | | | 1.37% | | | 1.53% | | | 1.58% | | | 1.67% | |
| | Ratio of Net Expenses (After Waivers and Expense Offsets) | | 1.42% | | | 1.32% | | | 1.47% | | | 1.49% | | | 1.56% | |
| | Ratio of Net Investment Income/(Loss) | | 0.34% | | | 0.93% | | | 1.37% | | | 1.52% | | | 0.91% | |
| Portfolio Turnover Rate | | 94%(2) | | | 112%(2) | | | 121% | | | 79% | | | 78% | |
| | | | | | | | | | | | | | | | | | | |
| |
* Total return includes adjustments in accordance with generally accepted accounting principles required at the year or period end and are not annualized for periods of less than one full year. ** Annualized for periods of less than one full year. (1) Per share amounts are calculated based on average shares outstanding during the year or period. (2) Portfolio Turnover Rate excludes TBA (to be announced) purchase and sales commitments. |
| | |
See Notes to Financial Statements. |
| |
Janus Investment Fund | 27 |
Janus Henderson Short Duration Flexible Bond Fund
Financial Highlights
| | | | | | | | | | | | | | | | | | | |
Class D Shares | | | | | | | | | | | | | | | |
For a share outstanding during the year ended June 30 | | 2022 | | | 2021 | | | 2020 | | | 2019 | | | 2018 | |
| Net Asset Value, Beginning of Period | | $3.08 | | | $3.06 | | | $3.02 | | | $2.98 | | | $3.03 | |
| Income/(Loss) from Investment Operations: | | | | | | | | | | | | | | | |
| | Net investment income/(loss)(1) | | 0.04 | | | 0.05 | | | 0.07 | | | 0.07 | | | 0.06 | |
| | Net realized and unrealized gain/(loss) | | (0.23) | | | 0.03 | | | 0.04 | | | 0.04 | | | (0.05) | |
| Total from Investment Operations | | (0.19) | | | 0.08 | | | 0.11 | | | 0.11 | | | 0.01 | |
| Less Dividends and Distributions: | | | | | | | | | | | | | | | |
| | Dividends (from net investment income) | | (0.04) | | | (0.06) | | | (0.07) | | | (0.07) | | | (0.06) | |
| Total Dividends and Distributions | | (0.04) | | | (0.06) | | | (0.07) | | | (0.07) | | | (0.06) | |
| Net Asset Value, End of Period | | $2.85 | | | $3.08 | | | $3.06 | | | $3.02 | | | $2.98 | |
| Total Return* | | (6.12)% | | | 2.47% | | | 3.74% | | | 3.81% | | | 0.24% | |
| Net Assets, End of Period (in thousands) | | $172,562 | | | $207,596 | | | $191,666 | | | $178,483 | | | $167,616 | |
| Average Net Assets for the Period (in thousands) | | $195,168 | | | $207,465 | | | $182,265 | | | $172,435 | | | $173,652 | |
| Ratios to Average Net Assets**: | | | | | | | | | | | | | | | |
| | Ratio of Gross Expenses | | 0.63% | | | 0.63% | | | 0.64% | | | 0.70% | | | 0.76% | |
| | Ratio of Net Expenses (After Waivers and Expense Offsets) | | 0.54% | | | 0.57% | | | 0.58% | | | 0.60% | | | 0.63% | |
| | Ratio of Net Investment Income/(Loss) | | 1.23% | | | 1.68% | | | 2.25% | | | 2.40% | | | 1.87% | |
| Portfolio Turnover Rate | | 94%(2) | | | 112%(2) | | | 121% | | | 79% | | | 78% | |
| | | | | | | | | | | | | | | | | | | |
| |
* Total return includes adjustments in accordance with generally accepted accounting principles required at the year or period end and are not annualized for periods of less than one full year. ** Annualized for periods of less than one full year. (1) Per share amounts are calculated based on average shares outstanding during the year or period. (2) Portfolio Turnover Rate excludes TBA (to be announced) purchase and sales commitments. |
| | |
See Notes to Financial Statements. |
| |
28 | JUNE 30, 2022 |
Janus Henderson Short Duration Flexible Bond Fund
Financial Highlights
| | | | | | | | | | | | | | | | | | | |
Class I Shares | | | | | | | | | | | | | | | |
For a share outstanding during the year ended June 30 | | 2022 | | | 2021 | | | 2020 | | | 2019 | | | 2018 | |
| Net Asset Value, Beginning of Period | | $3.08 | | | $3.05 | | | $3.02 | | | $2.97 | | | $3.02 | |
| Income/(Loss) from Investment Operations: | | | | | | | | | | | | | | | |
| | Net investment income/(loss)(1) | | 0.04 | | | 0.05 | | | 0.07 | | | 0.07 | | | 0.06 | |
| | Net realized and unrealized gain/(loss) | | (0.23) | | | 0.04 | | | 0.03 | | | 0.05 | | | (0.05) | |
| Total from Investment Operations | | (0.19) | | | 0.09 | | | 0.10 | | | 0.12 | | | 0.01 | |
| Less Dividends and Distributions: | | | | | | | | | | | | | | | |
| | Dividends (from net investment income) | | (0.04) | | | (0.06) | | | (0.07) | | | (0.07) | | | (0.06) | |
| Total Dividends and Distributions | | (0.04) | | | (0.06) | | | (0.07) | | | (0.07) | | | (0.06) | |
| Net Asset Value, End of Period | | $2.85 | | | $3.08 | | | $3.05 | | | $3.02 | | | $2.97 | |
| Total Return* | | (6.08)% | | | 2.82% | | | 3.42% | | | 4.19% | | | 0.29% | |
| Net Assets, End of Period (in thousands) | | $442,881 | | | $421,533 | | | $380,901 | | | $392,758 | | | $453,776 | |
| Average Net Assets for the Period (in thousands) | | $490,490 | | | $412,021 | | | $383,912 | | | $414,017 | | | $527,072 | |
| Ratios to Average Net Assets**: | | | | | | | | | | | | | | | |
| | Ratio of Gross Expenses | | 0.61% | | | 0.60% | | | 0.61% | | | 0.65% | | | 0.68% | |
| | Ratio of Net Expenses (After Waivers and Expense Offsets) | | 0.49% | | | 0.56% | | | 0.56% | | | 0.57% | | | 0.57% | |
| | Ratio of Net Investment Income/(Loss) | | 1.28% | | | 1.69% | | | 2.27% | | | 2.43% | | | 1.91% | |
| Portfolio Turnover Rate | | 94%(2) | | | 112%(2) | | | 121% | | | 79% | | | 78% | |
| | | | | | | | | | | | | | | | | | | |
| |
* Total return includes adjustments in accordance with generally accepted accounting principles required at the year or period end and are not annualized for periods of less than one full year. ** Annualized for periods of less than one full year. (1) Per share amounts are calculated based on average shares outstanding during the year or period. (2) Portfolio Turnover Rate excludes TBA (to be announced) purchase and sales commitments. |
| | |
See Notes to Financial Statements. |
| |
Janus Investment Fund | 29 |
Janus Henderson Short Duration Flexible Bond Fund
Financial Highlights
| | | | | | | | | | | | | | | | | | | |
Class N Shares | | | | | | | | | | | | | | | |
For a share outstanding during the year ended June 30 | | 2022 | | | 2021 | | | 2020 | | | 2019 | | | 2018 | |
| Net Asset Value, Beginning of Period | | $3.07 | | | $3.05 | | | $3.01 | | | $2.97 | | | $3.02 | |
| Income/(Loss) from Investment Operations: | | | | | | | | | | | | | | | |
| | Net investment income/(loss)(1) | | 0.04 | | | 0.06 | | | 0.07 | | | 0.08 | | | 0.06 | |
| | Net realized and unrealized gain/(loss) | | (0.22) | | | 0.02 | | | 0.05 | | | 0.04 | | | (0.05) | |
| Total from Investment Operations | | (0.18) | | | 0.08 | | | 0.12 | | | 0.12 | | | 0.01 | |
| Less Dividends and Distributions: | | | | | | | | | | | | | | | |
| | Dividends (from net investment income) | | (0.05) | | | (0.06) | | | (0.08) | | | (0.08) | | | (0.06) | |
| Total Dividends and Distributions | | (0.05) | | | (0.06) | | | (0.08) | | | (0.08) | | | (0.06) | |
| Net Asset Value, End of Period | | $2.84 | | | $3.07 | | | $3.05 | | | $3.01 | | | $2.97 | |
| Total Return* | | (6.03)% | | | 2.61% | | | 3.89% | | | 3.95% | | | 0.37% | |
| Net Assets, End of Period (in thousands) | | $45,088 | | | $15,816 | | | $17,144 | | | $37,464 | | | $61,806 | |
| Average Net Assets for the Period (in thousands) | | $29,059 | | | $16,326 | | | $41,174 | | | $64,559 | | | $43,541 | |
| Ratios to Average Net Assets**: | | | | | | | | | | | | | | | |
| | Ratio of Gross Expenses | | 0.50% | | | 0.50% | | | 0.49% | | | 0.55% | | | 0.61% | |
| | Ratio of Net Expenses (After Waivers and Expense Offsets) | | 0.41% | | | 0.44% | | | 0.44% | | | 0.47% | | | 0.50% | |
| | Ratio of Net Investment Income/(Loss) | | 1.39% | | | 1.80% | | | 2.34% | | | 2.53% | | | 2.11% | |
| Portfolio Turnover Rate | | 94%(2) | | | 112%(2) | | | 121% | | | 79% | | | 78% | |
| | | | | | | | | | | | | | | | | | | |
| |
* Total return includes adjustments in accordance with generally accepted accounting principles required at the year or period end and are not annualized for periods of less than one full year. ** Annualized for periods of less than one full year. (1) Per share amounts are calculated based on average shares outstanding during the year or period. (2) Portfolio Turnover Rate excludes TBA (to be announced) purchase and sales commitments. |
| | |
See Notes to Financial Statements. |
| |
30 | JUNE 30, 2022 |
Janus Henderson Short Duration Flexible Bond Fund
Financial Highlights
| | | | | | | | | | | | | | | | | | | |
Class S Shares | | | | | | | | | | | | | | | |
For a share outstanding during the year ended June 30 | | 2022 | | | 2021 | | | 2020 | | | 2019 | | | 2018 | |
| Net Asset Value, Beginning of Period | | $3.07 | | | $3.05 | | | $3.01 | | | $2.97 | | | $3.02 | |
| Income/(Loss) from Investment Operations: | | | | | | | | | | | | | | | |
| | Net investment income/(loss)(1) | | 0.03 | | | 0.04 | | | 0.06 | | | 0.06 | | | 0.05 | |
| | Net realized and unrealized gain/(loss) | | (0.22) | | | 0.02 | | | 0.04 | | | 0.04 | | | (0.05) | |
| Total from Investment Operations | | (0.19) | | | 0.06 | | | 0.10 | | | 0.10 | | | — | |
| Less Dividends and Distributions: | | | | | | | | | | | | | | | |
| | Dividends (from net investment income) | | (0.03) | | | (0.04) | | | (0.06) | | | (0.06) | | | (0.05) | |
| Total Dividends and Distributions | | (0.03) | | | (0.04) | | | (0.06) | | | (0.06) | | | (0.05) | |
| Net Asset Value, End of Period | | $2.85 | | | $3.07 | | | $3.05 | | | $3.01 | | | $2.97 | |
| Total Return* | | (6.16)% | | | 2.12% | | | 3.39% | | | 3.46% | | | (0.09)% | |
| Net Assets, End of Period (in thousands) | | $371 | | | $660 | | | $791 | | | $1,162 | | | $1,574 | |
| Average Net Assets for the Period (in thousands) | | $635 | | | $674 | | | $1,085 | | | $1,322 | | | $1,778 | |
| Ratios to Average Net Assets**: | | | | | | | | | | | | | | | |
| | Ratio of Gross Expenses | | 1.46% | | | 1.43% | | | 1.26% | | | 1.27% | | | 1.14% | |
| | Ratio of Net Expenses (After Waivers and Expense Offsets) | | 0.90% | | | 0.92% | | | 0.93% | | | 0.95% | | | 0.96% | |
| | Ratio of Net Investment Income/(Loss) | | 0.87% | | | 1.32% | | | 1.88% | | | 2.04% | | | 1.52% | |
| Portfolio Turnover Rate | | 94%(2) | | | 112%(2) | | | 121% | | | 79% | | | 78% | |
| | | | | | | | | | | | | | | | | | | |
| |
* Total return includes adjustments in accordance with generally accepted accounting principles required at the year or period end and are not annualized for periods of less than one full year. ** Annualized for periods of less than one full year. (1) Per share amounts are calculated based on average shares outstanding during the year or period. (2) Portfolio Turnover Rate excludes TBA (to be announced) purchase and sales commitments. |
| | |
See Notes to Financial Statements. |
| |
Janus Investment Fund | 31 |
Janus Henderson Short Duration Flexible Bond Fund
Financial Highlights
| | | | | | | | | | | | | | | | | | | |
Class T Shares | | | | | | | | | | | | | | | |
For a share outstanding during the year ended June 30 | | 2022 | | | 2021 | | | 2020 | | | 2019 | | | 2018 | |
| Net Asset Value, Beginning of Period | | $3.08 | | | $3.06 | | | $3.02 | | | $2.98 | | | $3.03 | |
| Income/(Loss) from Investment Operations: | | | | | | | | | | | | | | | |
| | Net investment income/(loss)(1) | | 0.03 | | | 0.05 | | | 0.06 | | | 0.07 | | | 0.05 | |
| | Net realized and unrealized gain/(loss) | | (0.22) | | | 0.02 | | | 0.05 | | | 0.04 | | | (0.05) | |
| Total from Investment Operations | | (0.19) | | | 0.07 | | | 0.11 | | | 0.11 | | | — | |
| Less Dividends and Distributions: | | | | | | | | | | | | | | | |
| | Dividends (from net investment income) | | (0.04) | | | (0.05) | | | (0.07) | | | (0.07) | | | (0.05) | |
| Total Dividends and Distributions | | (0.04) | | | (0.05) | | | (0.07) | | | (0.07) | | | (0.05) | |
| Net Asset Value, End of Period | | $2.85 | | | $3.08 | | | $3.06 | | | $3.02 | | | $2.98 | |
| Total Return* | | (6.23)% | | | 2.36% | | | 3.63% | | | 3.70% | | | 0.13% | |
| Net Assets, End of Period (in thousands) | | $294,579 | | | $403,560 | | | $427,052 | | | $521,348 | | | $770,913 | |
| Average Net Assets for the Period (in thousands) | | $353,907 | | | $424,193 | | | $473,636 | | | $628,515 | | | $986,661 | |
| Ratios to Average Net Assets**: | | | | | | | | | | | | | | | |
| | Ratio of Gross Expenses | | 0.73% | | | 0.73% | | | 0.74% | | | 0.80% | | | 0.84% | |
| | Ratio of Net Expenses (After Waivers and Expense Offsets) | | 0.65% | | | 0.69% | | | 0.69% | | | 0.71% | | | 0.73% | |
| | Ratio of Net Investment Income/(Loss) | | 1.10% | | | 1.56% | | | 2.14% | | | 2.27% | | | 1.74% | |
| Portfolio Turnover Rate | | 94%(2) | | | 112%(2) | | | 121% | | | 79% | | | 78% | |
| | | | | | | | | | | | | | | | | | | |
| |
* Total return includes adjustments in accordance with generally accepted accounting principles required at the year or period end and are not annualized for periods of less than one full year. ** Annualized for periods of less than one full year. (1) Per share amounts are calculated based on average shares outstanding during the year or period. (2) Portfolio Turnover Rate excludes TBA (to be announced) purchase and sales commitments. |
| | |
See Notes to Financial Statements. |
| |
32 | JUNE 30, 2022 |
Janus Henderson Short Duration Flexible Bond Fund
Notes to Financial Statements
1. Organization and Significant Accounting Policies
Janus Henderson Short Duration Flexible Bond Fund (formerly named Janus Henderson Short-Term Bond Fund) (the “Fund”) is a series of Janus Investment Fund (the “Trust”), which is organized as a Massachusetts business trust and is registered under the Investment Company Act of 1940, as amended (the “1940 Act”), as an open-end management investment company, and therefore has applied the specialized accounting and reporting guidance in Financial Accounting Standards Board (“FASB”) Accounting Standards Codification (“ASC”) Topic 946. The Trust offers 38 funds, each of which offers multiple share classes, with differing investment objectives and policies. The Fund seeks as high a level of current income as is consistent with preservation of capital. The Fund is classified as diversified, as defined in the 1940 Act. Janus Henderson Investors US LLC (formerly Janus Capital Management LLC) is the investment adviser (the “Adviser”) to the Fund.
The Fund offers multiple classes of shares in order to meet the needs of various types of investors. Each class represents an interest in the same portfolio of investments. Certain financial intermediaries may not offer all classes of shares.
Class A Shares are offered through financial intermediary platforms including, but not limited to, traditional brokerage platforms, mutual fund wrap fee programs, bank trust platforms, and retirement platforms.
Class C Shares are offered through financial intermediary platforms including, but not limited to, traditional brokerage platforms, mutual fund wrap fee programs, and bank trust platforms.
Class C Shares are closed to investments by new employer-sponsored retirement plans and existing employer-sponsored retirement plans are no longer able to make additional purchases or exchanges into Class C Shares.
The Funds currently implement an automatic conversion feature pursuant to which Class C Shares that have been held for eight years are automatically converted to Class A Shares without the imposition of any sales charge, fee or other charge. The conversion will generally occur no later than ten business days in the month following the month of the eighth anniversary of the date of purchase. Class C Shares purchased through the reinvestment of dividends and other distributions on Class C Shares will convert to Class A Shares at the same time as the original Class C Shares with respect to which they were purchased. For Class C Shares held in omnibus accounts on intermediary platforms, the Fund will rely on these intermediaries to implement this conversion feature. Your financial intermediary may have separate policies and procedures as to when and how Class C Shares may be converted to Class A Shares. Please contact your financial intermediary for additional information.
Effective July 6, 2020, Class D Shares are available to new investors, subject to any closed fund policies for a Fund, as applicable. Previously, Class D Shares were only available to investors who already had a direct account with the Janus Henderson funds; immediate family members or members of the same household of an eligible individual investor; and existing beneficial owners of sole proprietorships or partnerships that hold accounts directly with the Janus Henderson funds.
Class I Shares are available through certain financial intermediary platforms including, but not limited to, mutual fund wrap fee programs, managed account programs, asset allocation programs, bank trust platforms, as well as certain retirement platforms. Class I Shares are also available to certain direct institutional investors including, but not limited to, corporations, certain retirement plans, public plans, and foundations/endowments, who established Class I Share accounts before August 4, 2017.
Class N Shares are generally available only to financial intermediaries purchasing on behalf of: 1) certain adviser-assisted, employer-sponsored retirement plans, including 401(k) plans, 457 plans, 403(b) plans, Taft-Hartley multi-employer plans, profit-sharing and money purchase pension plans, defined benefit plans and certain welfare benefit plans, such as health savings accounts, and nonqualified deferred compensation plans; and 2) retail investors purchasing in qualified or nonqualified accounts, whose accounts are held through an omnibus account at their financial intermediary, and where the financial intermediary requires no payment or reimbursement from the Fund, the Adviser, or its affiliates. Class N Shares are also available to Janus Henderson proprietary products and to certain direct institutional investors approved by Janus Henderson Distributors US LLC (formerly Janus Distributors LLC) (the “Distributor”) including, but not limited to, corporations, certain retirement plans, public plans, and foundations and endowments, subject to minimum investment requirements.
Janus Henderson Short Duration Flexible Bond Fund
Notes to Financial Statements
Class S Shares are offered through financial intermediary platforms including, but not limited to, retirement platforms and asset allocation, mutual fund wrap, or other discretionary or nondiscretionary fee-based investment advisory programs. In addition, Class S Shares may be available through certain financial intermediaries who have an agreement with the Adviser or its affiliates to offer Class S Shares on their supermarket platforms.
Class T Shares are available through certain financial intermediary platforms including, but not limited to, mutual fund wrap fee programs, managed account programs, asset allocation programs, bank trust platforms, as well as certain retirement platforms. In addition, Class T Shares may be available through certain financial intermediaries who have an agreement with the Adviser or its affiliates to offer Class T Shares on their supermarket platforms.
The following accounting policies have been followed by the Fund and are in conformity with United States of America generally accepted accounting principles ("US GAAP").
Investment Valuation
Securities held by the Fund are valued in accordance with policies and procedures established by and under the supervision of the Trustees (the “Valuation Procedures”). Equity securities traded on a domestic securities exchange are generally valued at the closing prices on the primary market or exchange on which they trade. If such price is lacking for the trading period immediately preceding the time of determination, such securities are generally valued at their current bid price. Equity securities that are traded on a foreign exchange are generally valued at the closing prices on such markets. In the event that there is no current trading volume on a particular security in such foreign exchange, the bid price from the primary exchange is generally used to value the security. Securities that are traded on the over-the-counter (“OTC”) markets are generally valued at their closing or latest bid prices as available. Foreign securities and currencies are converted to U.S. dollars using the applicable exchange rate in effect at the close of the New York Stock Exchange (“NYSE”). The Fund will determine the market value of individual securities held by it by using prices provided by one or more approved professional pricing services or, as needed, by obtaining market quotations from independent broker-dealers. Most debt securities are valued in accordance with the evaluated bid price supplied by the pricing service that is intended to reflect market value. The evaluated bid price supplied by the pricing service is an evaluation that may consider factors such as security prices, yields, maturities and ratings. Certain short-term securities maturing within 60 days or less may be evaluated and valued on an amortized cost basis provided that the amortized cost determined approximates market value. Securities for which market quotations or evaluated prices are not readily available or deemed unreliable are valued at fair value determined in good faith under the Valuation Procedures. Circumstances in which fair value pricing may be utilized include, but are not limited to: (i) a significant event that may affect the securities of a single issuer, such as a merger, bankruptcy, or significant issuer-specific development; (ii) an event that may affect an entire market, such as a natural disaster or significant governmental action; (iii) a nonsignificant event such as a market closing early or not opening, or a security trading halt; and (iv) pricing of a nonvalued security and a restricted or nonpublic security. Special valuation considerations may apply with respect to “odd-lot” fixed-income transactions which, due to their small size, may receive evaluated prices by pricing services which reflect a large block trade and not what actually could be obtained for the odd-lot position. The Fund uses systematic fair valuation models provided by independent third parties to value international equity securities in order to adjust for stale pricing, which may occur between the close of certain foreign exchanges and the close of the NYSE.
Valuation Inputs Summary
FASB ASC 820, Fair Value Measurements and Disclosures (“ASC 820”), defines fair value, establishes a framework for measuring fair value, and expands disclosure requirements regarding fair value measurements. This standard emphasizes that fair value is a market-based measurement that should be determined based on the assumptions that market participants would use in pricing an asset or liability and establishes a hierarchy that prioritizes inputs to valuation techniques used to measure fair value. These inputs are summarized into three broad levels:
Level 1 – Unadjusted quoted prices in active markets the Fund has the ability to access for identical assets or liabilities.
Level 2 – Observable inputs other than unadjusted quoted prices included in Level 1 that are observable for the asset or liability either directly or indirectly. These inputs may include quoted prices for the identical instrument on an inactive market, prices for similar instruments, interest rates, prepayment speeds, credit risk, yield curves, default rates and similar data.
Assets or liabilities categorized as Level 2 in the hierarchy generally include: debt securities fair valued in accordance with the evaluated bid or ask prices supplied by a pricing service; securities traded on OTC markets
Janus Henderson Short Duration Flexible Bond Fund
Notes to Financial Statements
and listed securities for which no sales are reported that are fair valued at the latest bid price (or yield equivalent thereof) obtained from one or more dealers transacting in a market for such securities or by a pricing service approved by the Fund’s Trustees; certain short-term debt securities with maturities of 60 days or less that are fair valued at amortized cost; and equity securities of foreign issuers whose fair value is determined by using systematic fair valuation models provided by independent third parties in order to adjust for stale pricing which may occur between the close of certain foreign exchanges and the close of the NYSE. Other securities that may be categorized as Level 2 in the hierarchy include, but are not limited to, preferred stocks, bank loans, swaps, investments in unregistered investment companies, options, and forward contracts.
Level 3 – Unobservable inputs for the asset or liability to the extent that relevant observable inputs are not available, representing the Fund’s own assumptions about the assumptions that a market participant would use in valuing the asset or liability, and that would be based on the best information available.
There have been no significant changes in valuation techniques used in valuing any such positions held by the Fund since the beginning of the fiscal year.
The inputs or methodology used for fair valuing securities are not necessarily an indication of the risk associated with investing in those securities. The summary of inputs used as of June 30, 2022 to fair value the Fund’s investments in securities and other financial instruments is included in the “Valuation Inputs Summary” in the Notes to Schedule of Investments and Other Information.
Investment Transactions and Investment Income
Investment transactions are accounted for as of the date purchased or sold (trade date). Dividend income is recorded on the ex-dividend date. Certain dividends from foreign securities will be recorded as soon as the Fund is informed of the dividend, if such information is obtained subsequent to the ex-dividend date. Dividends from foreign securities may be subject to withholding taxes in foreign jurisdictions. Non-cash dividends, if any, are recorded on the ex-dividend date at fair value. Interest income is recorded daily on the accrual basis and includes amortization of premiums and accretion of discounts. The Fund classifies gains and losses on prepayments received as an adjustment to interest income. Debt securities may be placed in non-accrual status and related interest income may be reduced by stopping current accruals and writing off interest receivables when collection of all or a portion of interest has become doubtful. Gains and losses are determined on the identified cost basis, which is the same basis used for federal income tax purposes. Income, as well as gains and losses, both realized and unrealized, are allocated daily to each class of shares based upon the ratio of net assets represented by each class as a percentage of total net assets.
Expenses
The Fund bears expenses incurred specifically on its behalf. Each class of shares bears a portion of general expenses, which are allocated daily to each class of shares based upon the ratio of net assets represented by each class as a percentage of total net assets. Expenses directly attributable to a specific class of shares are charged against the operations of such class.
Estimates
The preparation of financial statements in conformity with US GAAP requires management to make estimates and assumptions that affect the reported amount of assets and liabilities and disclosure of contingent assets and liabilities at the date of the financial statements, and the reported amounts of income and expenses during the reporting period. Actual results could differ from those estimates.
Indemnifications
In the normal course of business, the Fund may enter into contracts that contain provisions for indemnification of other parties against certain potential liabilities. The Fund’s maximum exposure under these arrangements is unknown, and would involve future claims that may be made against the Fund that have not yet occurred. Currently, the risk of material loss from such claims is considered remote.
Dividends and Distributions
Dividends are declared daily and distributed monthly for the Fund. Realized capital gains, if any, are declared and distributed in December. The Fund may treat a portion of the amount paid to redeem shares as a distribution of investment company taxable income and realized capital gains that are reflected in the net asset value. This practice, commonly referred to as “equalization,” has no effect on the redeeming shareholder or a Fund’s total return, but may reduce the amounts that would otherwise be required to be paid as taxable dividends to the remaining shareholders. It
Janus Henderson Short Duration Flexible Bond Fund
Notes to Financial Statements
is possible that the Internal Revenue Service (IRS) could challenge the Fund's equalization methodology or calculations, and any such challenge could result in additional tax, interest, or penalties to be paid by the Fund.
Federal Income Taxes
The Fund intends to continue to qualify as a regulated investment company and distribute all of its taxable income in accordance with the requirements of Subchapter M of the Internal Revenue Code. Management has analyzed the Fund’s tax positions taken for all open federal income tax years, generally a three-year period, and has concluded that no provision for federal income tax is required in the Fund’s financial statements. The Fund is not aware of any tax positions for which it is reasonably possible that the total amounts of unrecognized tax benefits will significantly change in the next twelve months.
2. Derivative Instruments
The Fund may invest in various types of derivatives, which may at times result in significant derivative exposure. A derivative is a financial instrument whose performance is derived from the performance of another asset. The Fund may invest in derivative instruments including, but not limited to: futures contracts, put options, call options, options on futures contracts, options on foreign currencies, options on recovery locks, options on security and commodity indices, swaps, forward contracts, structured investments, and other equity-linked derivatives. Each derivative instrument that was held by the Fund during the year ended June 30, 2022 is discussed in further detail below. A summary of derivative activity by the Fund is reflected in the tables at the end of the Schedule of Investments.
The Fund may use derivative instruments for hedging purposes (to offset risks associated with an investment, currency exposure, or market conditions), to adjust currency exposure relative to a benchmark index, or for speculative purposes (to earn income and seek to enhance returns). When the Fund invests in a derivative for speculative purposes, the Fund will be fully exposed to the risks of loss of that derivative, which may sometimes be greater than the derivative’s cost. The Fund may not use any derivative to gain exposure to an asset or class of assets that it would be prohibited by its investment restrictions from purchasing directly. The Fund’s ability to use derivative instruments may also be limited by tax considerations.
Investments in derivatives in general are subject to market risks that may cause their prices to fluctuate over time. Investments in derivatives may not directly correlate with the price movements of the underlying instrument. As a result, the use of derivatives may expose the Fund to additional risks that it would not be subject to if it invested directly in the securities underlying those derivatives. The use of derivatives may result in larger losses or smaller gains than otherwise would be the case. Derivatives can be volatile and may involve significant risks.
In pursuit of its investment objective, the Fund may seek to use derivatives to increase or decrease exposure to the following market risk factors:
· Commodity Risk – the risk related to the change in value of commodities or commodity-linked investments due to changes in the overall market movements, volatility of the underlying benchmark, changes in interest rates, or other factors affecting a particular industry or commodity such as drought, floods, weather, livestock disease, embargoes, tariffs, and international economic, political, and regulatory developments.
· Counterparty Risk – the risk that the counterparty (the party on the other side of the transaction) on a derivative transaction will be unable to honor its financial obligation to the Fund.
· Credit Risk – the risk an issuer will be unable to make principal and interest payments when due, or will default on its obligations.
· Currency Risk – the risk that changes in the exchange rate between currencies will adversely affect the value (in U.S. dollar terms) of an investment.
· Equity Risk – the risk related to the change in value of equity securities as they relate to increases or decreases in the general market.
· Index Risk – if the derivative is linked to the performance of an index, it will be subject to the risks associated with changes in that index. If the index changes, the Fund could receive lower interest payments or experience a reduction in the value of the derivative to below what the Fund paid. Certain indexed securities, including inverse securities (which move in an opposite direction to the index), may create leverage, to the extent that they increase or decrease in value at a rate that is a multiple of the changes in the applicable index.
Janus Henderson Short Duration Flexible Bond Fund
Notes to Financial Statements
· Interest Rate Risk – the risk that the value of fixed-income securities will generally decline as prevailing interest rates rise, which may cause the Fund’s NAV to likewise decrease.
· Leverage Risk – the risk associated with certain types of leveraged investments or trading strategies pursuant to which relatively small market movements may result in large changes in the value of an investment. The Fund creates leverage by investing in instruments, including derivatives, where the investment loss can exceed the original amount invested. Certain investments or trading strategies, such as short sales, that involve leverage can result in losses that greatly exceed the amount originally invested.
· Liquidity Risk – the risk that certain securities may be difficult or impossible to sell at the time that the seller would like or at the price that the seller believes the security is currently worth.
Derivatives may generally be traded OTC or on an exchange. Derivatives traded OTC are agreements that are individually negotiated between parties and can be tailored to meet a purchaser’s needs. OTC derivatives are not guaranteed by a clearing agency and may be subject to increased credit risk.
In an effort to mitigate credit risk associated with derivatives traded OTC, the Fund may enter into collateral agreements with certain counterparties whereby, subject to certain minimum exposure requirements, the Fund may require the counterparty to post collateral if the Fund has a net aggregate unrealized gain on all OTC derivative contracts with a particular counterparty. Additionally, the Fund may deposit cash and/or treasuries as collateral with the counterparty and/or custodian daily (based on the daily valuation of the financial asset) if the Fund has a net aggregate unrealized loss on OTC derivative contracts with a particular counterparty. All liquid securities and restricted cash are considered to cover in an amount at all times equal to or greater than the Fund’s commitment with respect to certain exchange-traded derivatives, centrally cleared derivatives, forward foreign currency exchange contracts, short sales, and/or securities with extended settlement dates. There is no guarantee that counterparty exposure is reduced and these arrangements are dependent on the Adviser’s ability to establish and maintain appropriate systems and trading.
Futures Contracts
A futures contract is an exchange-traded agreement to take or make delivery of an underlying asset at a specific time in the future for a specific predetermined negotiated price. The Fund may enter into futures contracts to gain exposure to the stock market or other markets pending investment of cash balances or to meet liquidity needs. The Fund is subject to interest rate risk, equity risk, and currency risk in the normal course of pursuing its investment objective through its investments in futures contracts. The Fund may also use such derivative instruments to hedge or protect from adverse movements in securities prices, currency rates or interest rates. The use of futures contracts may involve risks such as the possibility of illiquid markets or imperfect correlation between the values of the contracts and the underlying securities, or that the counterparty will fail to perform its obligations.
Futures contracts are valued at the settlement price on valuation date on the exchange as reported by an approved vendor. Mini contracts, as defined in the description of the contract, shall be valued using the Actual Settlement Price or “ASET” price type as reported by an approved vendor. In the event that foreign futures trade when the foreign equity markets are closed, the last foreign futures trade price shall be used.
Futures contracts are marked-to-market daily, and the daily variation margin is recorded as a receivable or payable on the Statement of Assets and Liabilities (if applicable). The change in unrealized net appreciation/depreciation is reported on the Statement of Operations (if applicable). When a contract is closed, a realized gain or loss is reported on the Statement of Operations (if applicable), equal to the difference between the opening and closing value of the contract.
Securities held by the Fund that are designated as collateral for market value on futures contracts are noted on the Schedule of Investments (if applicable). Such collateral is in the possession of the Fund’s futures commission merchant.
With futures, there is minimal counterparty credit risk to the Fund since futures are exchange-traded and the exchange’s clearinghouse, as counterparty to all exchange-traded futures, guarantees the futures against default.
During the year, the Fund purchased interest rate futures to increase exposure to interest rate risk.
During the year, the Fund sold interest rate futures to decrease exposure to interest rate risk.
Janus Henderson Short Duration Flexible Bond Fund
Notes to Financial Statements
3. Other Investments and Strategies
Additional Investment Risk
The Fund may be invested in lower-rated debt securities that have a higher risk of default or loss of value since these securities may be sensitive to economic changes, political changes, or adverse developments specific to the issuer.
In response to the COVID-19 pandemic, the U.S. government and the Federal Reserve, as well as certain foreign governments and central banks, have taken extraordinary actions to support local and global economies and the financial markets, including reducing interest rates to record-low levels. Extremely low or negative interest rates may become more prevalent or may not work as intended. As there is little precedent for this situation, the impact on various markets that interest rate or other significant policy changes may have is unknown. The withdrawal of this support, a failure of measures put in place in response to such economic uncertainty, or investor perception that such efforts were not sufficient could each negatively affect financial markets generally, and the value and liquidity of specific securities. In addition, policy and legislative changes in the United States and in other countries continue to impact many aspects of financial regulation.
Widespread disease, including pandemics and epidemics, and natural or environmental disasters, including those which may be attributable to global climate change, such as earthquakes, fires, floods, hurricanes, tsunamis and weather-related phenomena generally, have been and can be highly disruptive to economies and markets, adversely impacting individual companies, sectors, industries, markets, currencies, interest and inflation rates, credit ratings, investor sentiment, and other factors affecting the value of a Fund’s investments. Economies and financial markets throughout the world have become increasingly interconnected, which increases the likelihood that events or conditions in one region or country will adversely affect markets or issuers in other regions or countries, including the United States. These disruptions could prevent a Fund from executing advantageous investment decisions in a timely manner and negatively impact a Fund’s ability to achieve its investment objective(s). Any such event(s) could have a significant adverse impact on the value of a Fund. In addition, these disruptions could also impair the information technology and other operational systems upon which the Fund’s service providers, including the Adviser or the subadviser (as applicable), rely, and could otherwise disrupt the ability of employees of the Fund’s service providers to perform essential tasks on behalf of the Fund. Adverse weather conditions may also have a particularly significant negative effect on issuers in the agricultural sector and on insurance and reinsurance companies that insure or reinsure against the impact of natural disasters.
A number of countries in the European Union (the “EU”) have experienced, and may continue to experience, severe economic and financial difficulties. In particular, many EU nations are susceptible to economic risks associated with high levels of debt. Many non-governmental issuers, and even certain governments, have defaulted on, or been forced to restructure, their debts. Many other issuers have faced difficulties obtaining credit or refinancing existing obligations. Financial institutions have in many cases required government or central bank support, have needed to raise capital, and/or have been impaired in their ability to extend credit. As a result, financial markets in the EU have experienced extreme volatility and declines in asset values and liquidity. These difficulties may continue, worsen, or spread further within the EU. Responses to these financial problems by European governments, central banks, and others, including austerity measures and reforms, may not work, may result in social unrest, and may limit future growth and economic recovery or have other unintended consequences. Among other things, these developments have adversely affected the value and exchange rate of the euro and pound sterling, and may continue to significantly affect the economies of all EU countries, which in turn may have a material adverse effect on the Fund’s investments in such countries, other countries that depend on EU countries for significant amounts of trade or investment, or issuers with exposure to debt issued by certain EU countries.
LIBOR Replacement Risk
The Fund may invest in certain debt securities, derivatives or other financial instruments that utilize the London Interbank Offered Rate (“LIBOR”) or other interbank offered rates as a reference rate for various rate calculations. The U.K. Financial Conduct Authority has announced that it intends to stop compelling or inducing banks to submit rates for many LIBOR settings after December 31, 2021, and for certain other commonly used U.S. dollar LIBOR settings after June 30, 2023. The elimination of LIBOR or other reference rates and the transition process away from LIBOR could adversely impact (i) volatility and liquidity in markets that are tied to those reference rates, (ii) the market for, or value of, specific securities or payments linked to those reference rates, (iii) availability or terms of borrowing or refinancing, or (iv) the effectiveness of hedging strategies. For these and other reasons, the elimination of LIBOR or changes to other reference rates may adversely affect the Fund’s performance and/or net asset value. Alternatives to LIBOR are
Janus Henderson Short Duration Flexible Bond Fund
Notes to Financial Statements
established or in development in most major currencies, including the Secured Overnight Financing Rate (“SOFR”) that is intended to replace the U.S. dollar LIBOR. The effect of the discontinuation of, LIBOR or other reference rates will depend on (1) existing fallback or termination provisions in individual contracts and (2) whether, how, and when industry participants develop and adopt new reference rates and fallbacks for both legacy and new products and instruments. Accordingly, it is difficult to predict the full impact of the transition away from LIBOR or other reference rates on the Fund until new reference rates and fallbacks for both legacy and new products, instruments and contracts are commercially accepted.
Counterparties
Fund transactions involving a counterparty are subject to the risk that the counterparty or a third party will not fulfill its obligation to the Fund (“counterparty risk”). Counterparty risk may arise because of the counterparty’s financial condition (i.e., financial difficulties, bankruptcy, or insolvency), market activities and developments, or other reasons, whether foreseen or not. A counterparty’s inability to fulfill its obligation may result in significant financial loss to the Fund. The Fund may be unable to recover its investment from the counterparty or may obtain a limited recovery, and/or recovery may be delayed. The extent of the Fund’s exposure to counterparty risk with respect to financial assets and liabilities approximates its carrying value. See the "Offsetting Assets and Liabilities" section of this Note for further details.
The Fund may be exposed to counterparty risk through participation in various programs, including, but not limited to, lending its securities to third parties, cash sweep arrangements whereby the Fund’s cash balance is invested in one or more types of cash management vehicles, as well as investments in, but not limited to, repurchase agreements, debt securities, and derivatives, including various types of swaps, futures and options. The Fund intends to enter into financial transactions with counterparties that the Adviser believes to be creditworthy at the time of the transaction. There is always the risk that the Adviser’s analysis of a counterparty’s creditworthiness is incorrect or may change due to market conditions. To the extent that the Fund focuses its transactions with a limited number of counterparties, it will have greater exposure to the risks associated with one or more counterparties.
Loans
The Fund may invest in various commercial loans, including bank loans, bridge loans, debtor-in-possession (“DIP”) loans, mezzanine loans, and other fixed and floating rate loans. These loans may be acquired through loan participations and assignments or on a when-issued basis. Commercial loans will comprise no more than 20% of the Fund’s total assets. Below are descriptions of the types of loans held by the Fund as of June 30, 2022.
· Bank Loans - Bank loans are obligations of companies or other entities entered into in connection with recapitalizations, acquisitions, and refinancings. The Fund’s investments in bank loans are generally acquired as a participation interest in, or assignment of, loans originated by a lender or other financial institution. These investments may include institutionally-traded floating and fixed-rate debt securities.
· Floating Rate Loans – Floating rate loans are debt securities that have floating interest rates, that adjust periodically, and are tied to a benchmark lending rate, such as London Interbank Offered Rate (“LIBOR”). In other cases, the lending rate could be tied to the prime rate offered by one or more major U.S. banks or the rate paid on large certificates of deposit traded in the secondary markets. If the benchmark lending rate changes, the rate payable to lenders under the loan will change at the next scheduled adjustment date specified in the loan agreement. Floating rate loans are typically issued to companies (‘‘borrowers’’) in connection with recapitalizations, acquisitions, and refinancings. Floating rate loan investments are generally below investment grade. Senior floating rate loans are secured by specific collateral of a borrower and are senior in the borrower’s capital structure. The senior position in the borrower’s capital structure generally gives holders of senior loans a claim on certain of the borrower’s assets that is senior to subordinated debt and preferred and common stock in the case of a borrower’s default. Floating rate loan investments may involve foreign borrowers, and investments may be denominated in foreign currencies. Floating rate loans often involve borrowers whose financial condition is troubled or uncertain and companies that are highly leveraged. The Fund may invest in obligations of borrowers who are in bankruptcy proceedings. While the Fund generally expects to invest in fully funded term loans, certain of the loans in which the Fund may invest include revolving loans, bridge loans, and delayed draw term loans.
Purchasers of floating rate loans may pay and/or receive certain fees. The Fund may receive fees such as covenant waiver fees or prepayment penalty fees. The Fund may pay fees such as facility fees. Such fees may affect the Fund’s return.
Janus Henderson Short Duration Flexible Bond Fund
Notes to Financial Statements
· Mezzanine Loans - Mezzanine loans are secured by the stock of the company that owns the assets. Mezzanine loans are a hybrid of debt and equity financing that is typically used to fund the expansion of existing companies. A mezzanine loan is composed of debt capital that gives the lender the right to convert to an ownership or equity interest in the company if the loan is not paid back in time and in full. Mezzanine loans typically are the most subordinated debt obligation in an issuer’s capital structure.
Mortgage- and Asset-Backed Securities
Mortgage- and asset-backed securities represent interests in “pools” of commercial or residential mortgages or other assets, including consumer and commercial loans or receivables. The Fund may purchase fixed or variable rate commercial or residential mortgage-backed securities issued by the Government National Mortgage Association (“Ginnie Mae”), the Federal National Mortgage Association (“Fannie Mae”), the Federal Home Loan Mortgage Corporation (“Freddie Mac”), or other governmental or government-related entities. Ginnie Mae’s guarantees are backed as to the timely payment of principal and interest by the full faith and credit of the U.S. Government. Fannie Mae and Freddie Mac securities are not backed by the full faith and credit of the U.S. Government. In September 2008, the Federal Housing Finance Agency (“FHFA”), an agency of the U.S. Government, placed Fannie Mae and Freddie Mac under conservatorship. Since that time, Fannie Mae and Freddie Mac have received capital support through U.S. Treasury preferred stock purchases and Treasury and Federal Reserve purchases of their mortgage-backed securities. The FHFA and the U.S. Treasury have imposed strict limits on the size of these entities’ mortgage portfolios. The FHFA has the power to cancel any contract entered into by Fannie Mae and Freddie Mac prior to FHFA’s appointment as conservator or receiver, including the guarantee obligations of Fannie Mae and Freddie Mac.
The Fund may also purchase other mortgage- and asset-backed securities through single- and multi-seller conduits, collateralized debt obligations, structured investment vehicles, and other similar securities. Asset-backed securities may be backed by various consumer obligations, including automobile loans, equipment leases, credit card receivables, or other collateral. In the event the underlying loans are not paid, the securities’ issuer could be forced to sell the assets and recognize losses on such assets, which could impact your return. Unlike traditional debt instruments, payments on these securities include both interest and a partial payment of principal. Mortgage- and asset-backed securities are subject to both extension risk, where borrowers pay off their debt obligations more slowly in times of rising interest rates, and prepayment risk, where borrowers pay off their debt obligations sooner than expected in times of declining interest rates. These risks may reduce the Fund’s returns. In addition, investments in mortgage- and asset-backed securities, including those comprised of subprime mortgages, may be subject to a higher degree of credit risk, valuation risk, extension risk (if interest rates rise), and liquidity risk than various other types of fixed-income securities. Additionally, although mortgage-backed securities are generally supported by some form of government or private guarantee and/or insurance, there is no assurance that guarantors or insurers will meet their obligations.
Offsetting Assets and Liabilities
The Fund presents gross and net information about transactions that are either offset in the financial statements or subject to an enforceable master netting arrangement or similar agreement with a designated counterparty, regardless of whether the transactions are actually offset in the Statement of Assets and Liabilities.
The Offsetting Assets and Liabilities table located in the Schedule of Investments presents gross amounts of recognized assets and/or liabilities and the net amounts after deducting collateral that has been pledged by counterparties or has been pledged to counterparties (if applicable). For corresponding information grouped by type of instrument, see the Fund's Schedule of Investments.
JPMorgan Chase Bank, National Association acts as securities lending agent and a limited purpose custodian or subcustodian to receive and disburse cash balances and cash collateral, hold short-term investments, hold collateral, and perform other custodial functions in accordance with the Non-Custodial Securities Lending Agreement. For financial reporting purposes, the Fund does not offset financial instruments’ payables and receivables and related collateral on the Statement of Assets and Liabilities. Securities on loan will be continuously secured by collateral which may consist of cash, U.S. Government securities, domestic and foreign short-term debt instruments, letters of credit, time deposits, repurchase agreements, money market mutual funds or other money market accounts, or such other collateral as permitted by the Securities and Exchange Commission (the “SEC”). See “Securities Lending” in the “Notes to Financial Statements” for additional information.
Janus Henderson Short Duration Flexible Bond Fund
Notes to Financial Statements
Real Estate Investing
The Fund may invest in equity and debt securities of real estate-related companies. Such companies may include those in the real estate industry or real estate-related industries. These securities may include common stocks, corporate bonds, preferred stocks, and other equity securities, including, but not limited to, mortgage-backed securities, real estate-backed securities, securities of REITs and similar REIT-like entities. A REIT is a trust that invests in real estate-related projects, such as properties, mortgage loans, and construction loans. REITs are generally categorized as equity, mortgage, or hybrid REITs. A REIT may be listed on an exchange or traded OTC.
Securities Lending
Under procedures adopted by the Trustees, the Fund may seek to earn additional income by lending securities to certain qualified broker-dealers and institutions. JPMorgan Chase Bank, National Association acts as securities lending agent and a limited purpose custodian or subcustodian to receive and disburse cash balances and cash collateral, hold short-term investments, hold collateral, and perform other custodial functions in accordance with the Non-Custodial Securities Lending Agreement. The Fund may lend fund securities in an amount equal to up to 1/3 of its total assets as determined at the time of the loan origination. There is the risk of delay in recovering a loaned security or the risk of loss in collateral rights if the borrower fails financially. In addition, the Adviser makes efforts to balance the benefits and risks from granting such loans. All loans will be continuously secured by collateral which may consist of cash, U.S. Government securities, domestic and foreign short-term debt instruments, letters of credit, time deposits, repurchase agreements, money market mutual funds or other money market accounts, or such other collateral as permitted by the SEC. If the Fund is unable to recover a security on loan, the Fund may use the collateral to purchase replacement securities in the market. There is a risk that the value of the collateral could decrease below the cost of the replacement security by the time the replacement investment is made, resulting in a loss to the Fund. In certain circumstances individual loan transactions could yield negative returns.
Upon receipt of cash collateral, the Adviser may invest it in affiliated or non-affiliated cash management vehicles, whether registered or unregistered entities, as permitted by the 1940 Act and rules promulgated thereunder. The Adviser currently intends to primarily invest the cash collateral in a cash management vehicle for which the Adviser serves as investment adviser, Janus Henderson Cash Collateral Fund LLC, or in time deposits. An investment in Janus Henderson Cash Collateral Fund LLC is generally subject to the same risks that shareholders experience when investing in similarly structured vehicles, such as the potential for significant fluctuations in assets as a result of the purchase and redemption activity of the securities lending program, a decline in the value of the collateral, and possible liquidity issues. Such risks may delay the return of the cash collateral and cause the Fund to violate its agreement to return the cash collateral to a borrower in a timely manner. As adviser to the Fund and Janus Henderson Cash Collateral Fund LLC, the Adviser has an inherent conflict of interest as a result of its fiduciary duties to both the Fund and Janus Henderson Cash Collateral Fund LLC. Additionally, the Adviser receives an investment advisory fee of 0.05% for managing Janus Henderson Cash Collateral Fund LLC, but it may not receive a fee for managing certain other affiliated cash management vehicles in which the Fund may invest, and therefore may have an incentive to allocate preferred investment opportunities to investment vehicles for which it is receiving a fee.
The value of the collateral must be at least 102% of the market value of the loaned securities that are denominated in U.S. dollars and 105% of the market value of the loaned securities that are not denominated in U.S. dollars. Loaned securities and related collateral are marked-to-market each business day based upon the market value of the loaned securities at the close of business, employing the most recent available pricing information. Collateral levels are then adjusted based on this mark-to-market evaluation. Additional required collateral, or excess collateral returned, is delivered on the next business day. Therefore, the value of the collateral held may be temporarily less than 102% or 105% value of the securities on loan. The cash collateral invested by the Adviser is disclosed in the Schedule of Investments (if applicable).
Income earned from the investment of the cash collateral, net of rebates paid to, or fees paid by, borrowers and less the fees paid to the lending agent are included as “Affiliated securities lending income, net” on the Statement of Operations. As of June 30, 2022, securities lending transactions accounted for as secured borrowings with an overnight and continuous contractual maturity are $1,233,024. Gross amounts of recognized liabilities for securities lending (collateral received) as of June 30, 2022 is $1,277,813, resulting in the net amount due to the counterparty of $44,789.
Sovereign Debt
The Fund may invest in U.S. and non-U.S. government debt securities (“sovereign debt”). Some investments in sovereign debt, such as U.S. sovereign debt, are considered low risk. However, investments in sovereign debt, especially the debt
Janus Henderson Short Duration Flexible Bond Fund
Notes to Financial Statements
of less developed countries, can involve a high degree of risk, including the risk that the governmental entity that controls the repayment of sovereign debt may not be willing or able to repay the principal and/or to pay the interest on its sovereign debt in a timely manner. A sovereign debtor’s willingness or ability to satisfy its debt obligation may be affected by various factors including, but not limited to, its cash flow situation, the extent of its foreign currency reserves, the availability of foreign exchange when a payment is due, the relative size of its debt position in relation to its economy as a whole, the sovereign debtor’s policy toward international lenders, and local political constraints to which the governmental entity may be subject. Sovereign debtors may also be dependent on expected disbursements from foreign governments, multilateral agencies, and other entities. The failure of a sovereign debtor to implement economic reforms, achieve specified levels of economic performance, or repay principal or interest when due may result in the cancellation of third party commitments to lend funds to the sovereign debtor, which may further impair such debtor’s ability or willingness to timely service its debts. The Fund may be requested to participate in the rescheduling of such sovereign debt and to extend further loans to governmental entities, which may adversely affect the Fund’s holdings. In the event of default, there may be limited or no legal remedies for collecting sovereign debt and there may be no bankruptcy proceedings through which the Fund may collect all or part of the sovereign debt that a governmental entity has not repaid. In addition, to the extent the Fund invests in non-U.S. sovereign debt, it may be subject to currency risk.
TBA Commitments
The Fund may enter into “to be announced” or “TBA” commitments. TBAs are forward agreements for the purchase or sale of securities, including mortgage-backed securities, for a fixed price, with payment and delivery on an agreed upon future settlement date. The specific securities to be delivered are not identified at the trade date. However, delivered securities must meet specified terms, including issuer, rate, and mortgage terms. Although the particular TBA securities must meet industry-accepted “good delivery” standards, there can be no assurance that a security purchased on forward commitment basis will ultimately be issued or delivered by the counterparty. During the settlement period, the Fund will still bear the risk of any decline in the value of the security to be delivered. Because TBA commitments do not require the delivery of a specific security, the characteristics of the security delivered to the Fund may be less favorable than expected. If the counterparty to a transaction fails to deliver the security, the Fund could suffer a loss. To facilitate TBA commitments, the Fund will segregate or otherwise earmark liquid assets marked to market daily in an amount at least equal to such TBA commitments. Proposed rules of the Financial Industry Regulatory Authority (“FINRA”) include mandatory margin requirements for TBA commitments which, in some circumstances, will require the Fund to also post collateral. These collateral requirements may increase costs associated with the Fund’s participation in the TBA market.
When-Issued, Delayed Delivery and Forward Commitment Transactions
The Fund may purchase or sell securities on a when-issued, delayed delivery, or forward commitment basis. When purchasing a security on a when-issued, delayed delivery, or forward commitment basis, the Fund assumes the rights and risks of ownership of the security, including the risk of price and yield fluctuations, and takes such fluctuations into account when determining its net asset value. Typically, no income accrues on securities the Fund has committed to purchase prior to the time delivery of the securities is made. Because the Fund is not required to pay for the security until the delivery date, these risks are in addition to the risks associated with the Fund’s other investments. If the other party to a transaction fails to deliver the securities, the Fund could miss a favorable price or yield opportunity. If the Fund remains substantially fully invested at a time when when-issued, delayed delivery, or forward commitment purchases are outstanding, the purchases may result in a form of leverage. If the Fund remains substantially fully invested at a time when when-issued, delayed delivery, or forward commitment purchases (including TBA commitments) are outstanding, the purchases may result in a form of leverage.
When the Fund has sold a security on a when-issued, delayed delivery, or forward commitment basis, the Fund does not participate in future gains or losses with respect to the security. If the other party to a transaction fails to pay for the securities, the Fund could suffer a loss. Additionally, when selling a security on a when-issued, delayed delivery, or forward commitment basis without owning the security, the Fund will incur a loss if the security’s price appreciates in value such that the security’s price is above the agreed upon price on the settlement date. The Fund may dispose of or renegotiate a transaction after it is entered into, and may purchase or sell when-issued, delayed delivery or forward commitment securities before the settlement date, which may result in a gain or loss.
4. Investment Advisory Agreements and Other Transactions with Affiliates
The Fund pays the Adviser an investment advisory fee which is calculated daily and paid monthly. The Fund’s contractual investment advisory fee rate (expressed as an annual rate) is 0.44% of its average daily net assets.
Janus Henderson Short Duration Flexible Bond Fund
Notes to Financial Statements
The Adviser has contractually agreed to waive the investment advisory fee and/or reimburse operating expenses to the extent that the Fund’s total annual fund operating expenses, excluding the fees payable pursuant to a Rule 12b-1 plan, shareholder servicing fees, such as transfer agency fees (including out-of-pocket costs), administrative services fees and any networking/omnibus payable by any share class, brokerage commissions, interest, dividends, taxes, acquired fund fees and expenses, and extraordinary expenses, exceed the annual rate of 0.39% of the Fund’s average daily net assets. The Adviser shall reimburse or waive networking/omnibus fees and out-of-pocket transfer agency costs payable by any share class so that such fees, in the aggregate, do not exceed 0.06% of a share class' average daily net assets. The Adviser has agreed to continue the waivers for at least one-year commencing October 28, 2021. For the period from October 28, 2021 until November 5, 2021, the Adviser had contractually agreed to waive the advisory fee payable by the Fund or reimburse expenses in an amount equal to the amount, if any, that the Fund’s total annual fund operating expenses, including the investment advisory fee, but excluding the fees payable pursuant to a Rule 12b-1 plan, shareholder servicing fees, such as transfer agency fees (but excluding out-of-pocket costs), brokerage commissions, interest, dividends, taxes, acquired fund fees and expenses, and extraordinary expenses , exceed the annual rate of 0.39% of the Fund’s average daily net assets. Under the previous expense limit (for the one-year period that commenced on October 28, 2020), the Adviser contractually agreed to waive the advisory fee payable by the Fund or reimburse expenses in an amount equal to the amount, if any, that the Fund’s total annual fund operating expenses, including the investment advisory fee, but excluding the fees payable pursuant to a Rule 12b-1 plan, shareholder servicing fees, such as transfer agency fees (including out-of-pocket costs), brokerage commissions, interest, dividends, taxes, acquired fund fees and expenses, and extraordinary expenses, exceeded the annual rate of 0.44% of the Fund’s average daily net assets. If applicable, amounts waived and/or reimbursed to the Fund by the Adviser are disclosed as “Excess Expense Reimbursement and Waivers” on the Statement of Operations.
The Adviser serves as administrator to the Fund pursuant to an administration agreement between the Adviser and the Trust. Under the administration agreement, the Adviser is authorized to perform, or cause others to perform certain administration, compliance, and accounting services to the Fund, including providing office space for the Fund, and is reimbursed by the Fund for certain of its costs in providing these services (to the extent the Adviser seeks reimbursement and such costs are not otherwise waived). In addition, employees of the Adviser and/or its affiliates may serve as officers of the Trust. The Fund pays for some or all of the salaries, fees, and expenses of the Adviser employees and Fund officers, with respect to certain specified administration functions they perform on behalf of the Fund. The Fund pays these costs based on out-of-pocket expenses incurred by the Adviser, and these costs are separate and apart from advisory fees and other expenses paid in connection with the investment advisory services the Adviser (or any subadvisor, as applicable) provides to the Fund. These amounts are disclosed as “Affiliated fund administration fees” on the Statement of Operations. In addition, some expenses related to compensation payable to the Fund’s Chief Compliance Officer and certain compliance staff, all of whom are employees of the Adviser and/or its affiliates, are shared with the Fund. Total compensation of $474,228 was paid to the Chief Compliance Officer and certain compliance staff by the Trust during the year ended June 30, 2022. The Fund's portion is reported as part of “Other expenses” on the Statement of Operations.
Janus Henderson Services US LLC (formerly Janus Services LLC) (the “Transfer Agent”), a wholly-owned subsidiary of the Adviser, is the Fund’s transfer agent. The Transfer Agent provides or arranges for the provision of shareholder services including, but not limited to, recordkeeping, subaccounting, answering inquiries regarding accounts, order processing, transaction confirmations, the mailing of prospectuses and shareholder reports, and other shareholder services provided to or on behalf of shareholders. These amounts are disclosed as “Transfer agent administrative fees and expenses” on the Statement of Operations.
Class D Shares of the Fund pay the Transfer Agent an annual administrative services fee based on the average daily net assets of Class D Shares as detailed below.
| | |
Average Daily Net Assets of Class D Shares of the Janus Henderson funds | Administrative Services Fee |
Under $40 billion | 0.12% |
$40 billion – $49.9 billion | 0.10% |
Over $49.9 billion | 0.08% |
During the reporting period, the administrative services fee rate was 0.11%.
The Transfer Agent receives an administrative services fee at an annual rate of up to 0.25% of the average daily net assets of the Fund’s Class S Shares and Class T Shares for providing or procuring administrative services to investors in
Janus Henderson Short Duration Flexible Bond Fund
Notes to Financial Statements
Class S Shares and Class T Shares of the Fund. The Transfer Agent expects to use all or a significant portion of this fee to compensate retirement plan service providers, broker-dealers, bank trust departments, financial advisors, and other financial intermediaries for providing these services. The Transfer Agent may keep certain amounts retained for reimbursement of out-of-pocket costs incurred for servicing clients of Class S Shares and Class T Shares.
Shareholder Services provided by these financial intermediaries may include, but are not limited to, recordkeeping, subaccounting, order processing, providing order confirmations, periodic statements, forwarding prospectuses, shareholder reports, and other materials to existing customers, answering inquiries regarding accounts, and other administrative services. Order processing includes the submission of transactions through the National Securities Clearing Corporation (“NSCC”) or similar systems, or those processed on a manual basis with the Adviser. For all share classes, the Transfer Agent also seeks reimbursement for costs it incurs as transfer agent and for providing servicing.
Certain, but not all, intermediaries may charge administrative fees to investors in Class A Shares, Class C Shares, and Class I Shares for administrative services provided on behalf of such investors. These administrative fees are paid by the Class A Shares, Class C Shares, and Class I Shares of the Fund to the Transfer Agent, which uses such fees to reimburse intermediaries. Consistent with the Transfer Agency Agreement between the Transfer Agent and the Fund, the Transfer Agent may negotiate the level, structure, and/or terms of the administrative fees with intermediaries requiring such fees on behalf of the Fund. The Adviser and its affiliates benefit from an increase in assets that may result from such relationships. The Adviser has agreed to limit these fees up to 0.20% for Class A Shares and Class C Shares, and up to 0.15% for Class I Shares on an annual basis based on the daily net assets of each share class. Such limits are subject to change by the Trustees in the future. These amounts are disclosed as “Transfer agent networking and omnibus fees” on the Statement of Operations.
The Transfer Agent is not compensated for its services related to the shares, except for out-of-pocket costs, although the Transfer Agent is compensated for its services related to Fund’s Class D Shares. These amounts are disclosed as “Other transfer agent fees and expenses” on the Statement of Operations.
Under distribution and shareholder servicing plans (the “Plans”) adopted in accordance with Rule 12b-1 under the 1940 Act, the Fund pays the Trust’s distributor, the Distributor, a wholly-owned subsidiary of the Adviser, a fee for the sale and distribution and/or shareholder servicing of the shares based on the average daily net assets for each share class at an annual rate of up to 0.25% for Class A Shares, up to 1.00% for Class C Shares, and up to 0.25% for Class S Shares. Under the terms of the Plans, the Trust is authorized to make payments to the Distributor for remittance to retirement plan service providers, broker-dealers, bank trust departments, financial advisors, and other financial intermediaries, as compensation for distribution and/or shareholder services performed by such entities for their customers who are investors in the Fund. These amounts are disclosed as “12b-1 Distribution and shareholder servicing fees” on the Statement of Operations.
Class A Shares include a 2.50% upfront sales charge of the offering price of the Fund. The sales charge is allocated between the Distributor and financial intermediaries. During the year ended June 30, 2022, the Distributor retained upfront sales charges of $7,058.
A contingent deferred sales charge (“CDSC”) of 1.00% will be deducted with respect to Class A Shares purchased without a sales load and redeemed within 12 months of purchase, unless waived. Any applicable CDSC will be 1.00% of the lesser of the original purchase price or the value of the redemption of the Class A Shares redeemed. During the year ended June 30, 2022, redeeming shareholders of Class A Shares paid CDSCs of $6,442 to Janus Henderson Distributors.
A CDSC of 1.00% will be deducted with respect to Class C Shares redeemed within 12 months of purchase, unless waived. Any applicable CDSC will be 1.00% of the lesser of the original purchase price or the value of the redemption of the Class C Shares redeemed. During the year ended June 30, 2022, redeeming shareholders of Class C Shares paid CDSCs of $6,834.
The Board of Trustees has adopted a deferred compensation plan (the “Deferred Plan”) for independent Trustees to elect to defer receipt of all or a portion of the annual compensation they are entitled to receive from the Fund. All deferred fees are credited to an account established in the name of the Trustees. The amounts credited to the account then increase or decrease, as the case may be, in accordance with the performance of one or more of the Janus Henderson funds that are selected by the Trustees. The account balance continues to fluctuate in accordance with the performance of the selected fund or funds until final payment of all amounts are credited to the account. The fluctuation
Janus Henderson Short Duration Flexible Bond Fund
Notes to Financial Statements
of the account balance is recorded by the Fund as unrealized appreciation/(depreciation) and is included as of June 30, 2022 on the Statement of Assets and Liabilities in the asset, “Trustees’ deferred compensation,” and liability, “Trustees’ deferred compensation fees.” Additionally, the recorded unrealized appreciation/(depreciation) is included in “Total distributable earnings (loss)” on the Statement of Assets and Liabilities. Deferred compensation expenses for the year ended June 30, 2022 are included in “Trustees’ fees and expenses” on the Statement of Operations. Trustees are allowed to change their designation of mutual funds from time to time. Amounts will be deferred until distributed in accordance with the Deferred Plan. Deferred fees of $431,326 were paid by the Trust to the Trustees under the Deferred Plan during the year ended June 30, 2022.
Pursuant to the provisions of the 1940 Act and related rules, the Fund may participate in an affiliated or non-affiliated cash sweep program. In the cash sweep program, uninvested cash balances of the Fund may be used to purchase shares of affiliated or non-affiliated money market funds or cash management pooled investment vehicles that operate as money market funds. The Fund is eligible to participate in the cash sweep program (the “Investing Funds”). The Adviser has an inherent conflict of interest because of its fiduciary duties to the affiliated money market funds or cash management pooled investment vehicles and the Investing Funds. Janus Henderson Cash Liquidity Fund LLC (the “Sweep Vehicle”) is an affiliated unregistered cash management pooled investment vehicle that invests primarily in highly-rated short-term fixed-income securities. The Sweep Vehicle operates pursuant to the provisions of the 1940 Act that govern the operation of money market funds and prices its shares at NAV reflecting market-based values of its portfolio securities (i.e., a “floating” NAV) rounded to the fourth decimal place (e.g., $1.0000). The Sweep Vehicle is permitted to impose a liquidity fee (of up to 2%) on redemptions from the Sweep Vehicle or a redemption gate that temporarily suspends redemptions from the Sweep Vehicle for up to 10 business days during a 90 day period. There are no restrictions on the Fund's ability to withdraw investments from the Sweep Vehicle at will, and there are no unfunded capital commitments due from the Fund to the Sweep Vehicle. The Sweep Vehicle does not charge any management fee, sales charge or service fee.
Any purchases and sales, realized gains/losses and recorded dividends from affiliated investments during the year ended June 30, 2022 can be found in the “Schedules of Affiliated Investments” located in the Schedule of Investments.
The Fund is permitted to purchase or sell securities (“cross-trade”) between itself and other funds or accounts managed by the Adviser in accordance with Rule 17a-7 under the Investment Company Act of 1940 (“Rule 17a-7”), when the transaction is consistent with the investment objectives and policies of the Fund and in accordance with the Internal Cross Trade Procedures adopted by the Trust’s Board of Trustees. These procedures have been designed to ensure that any cross-trade of securities by the Fund from or to another fund or account that is or could be considered an affiliate of the Fund under certain limited circumstances by virtue of having a common investment adviser, common Officer, or common Trustee complies with Rule 17a-7. Under these procedures, each cross-trade is effected at the current market price to save costs where allowed. During the year ended June 30, 2022, the Fund engaged in cross trades amounting to $9,289,889 in sales, resulting in a net realized loss of $531,094. The net realized loss is included within the “Net Realized Gain/(Loss) on Investments” section of the Fund’s Statement of Operations.
As of June 30, 2022, shares of the Fund were owned by affiliates of the Adviser, and/or other funds advised by the Adviser, as indicated in the table below:
| | | | | | |
Class | % of Class Owned | | % of Fund Owned | | |
Class A Shares | - | % | - | % | |
Class C Shares | - | | - | | |
Class D Shares | - | | - | | |
Class I Shares | - | | - | | |
Class N Shares | 73 | | 3 | | |
Class S Shares | - | | - | | |
Class T Shares | - | | - | | |
| | | | | | |
Janus Henderson Short Duration Flexible Bond Fund
Notes to Financial Statements
In addition, other shareholders, including other funds, other funds, individuals, accounts, as well as the Fund’s portfolio manager(s) and/or investment personnel, may from time to time own (beneficially or of record) a significant percentage of the Fund’s Shares and can be considered to “control” the Fund when that ownership exceeds 25% of the Fund’s assets (and which may differ from control as determined in accordance with US GAAP).
5. Federal Income Tax
The tax components of capital shown in the table below represent: (1) distribution requirements the Fund must satisfy under the income tax regulations; (2) losses or deductions the Fund may be able to offset against income and gains realized in future years; and (3) unrealized appreciation or depreciation of investments for federal income tax purposes.
Other book to tax differences primarily consist of deferred compensation and derivatives. The Fund has elected to treat gains and losses on forward foreign currency contracts as capital gains and losses, if applicable. Other foreign currency gains and losses on debt instruments are treated as ordinary income for federal income tax purposes pursuant to Section 988 of the Internal Revenue Code.
| | | | | | | | |
| | | Loss Deferrals | Other Book | Net Tax | |
Undistributed
Ordinary Income | Undistributed
Long-Term Gains | Accumulated
Capital Losses | Late-Year
Ordinary Loss | Post-October
Capital Loss | to Tax
Differences | Appreciation/
(Depreciation) | |
$ 102,490 | $ - | $ (39,132,879) | $ - | $ - | $ (30,322) | $(54,686,304) | |
Accumulated capital losses noted below represent net capital loss carryovers, as of June 30, 2022, that may be available to offset future realized capital gains and thereby reduce future taxable gains distributions. The following table shows these capital loss carryovers.
| | | | | | |
| | | | | |
Capital Loss Carryover Schedule | | |
For the year ended June 30, 2022 | | |
| No Expiration | | | |
| Short-Term | Long-Term | Accumulated
Capital Losses | | |
| $(28,068,136) | $(11,064,743) | $ (39,132,879) | | |
The aggregate cost of investments and the composition of unrealized appreciation and depreciation of investment securities for federal income tax purposes as of June 30, 2022 are noted below. The primary differences between book and tax appreciation or depreciation of investments are wash sale loss deferrals and investments in partnerships.
| | | | |
Federal Tax Cost | Unrealized
Appreciation | Unrealized
(Depreciation) | Net Tax Appreciation/
(Depreciation) |
$1,119,570,959 | $ 24,193 | $(54,710,497) | $(54,686,304) |
Information on the tax components of derivatives as of June 30, 2022 is as follows:
| | | | |
Federal Tax Cost | Unrealized
Appreciation | Unrealized
(Depreciation) | Net Tax Appreciation/
(Depreciation) |
$ (1,397,866) | $ - | $ - | $ - |
Tax cost of investments and unrealized appreciation/(depreciation) may also include timing differences that do not constitute adjustments to tax basis.
Janus Henderson Short Duration Flexible Bond Fund
Notes to Financial Statements
Income and capital gains distributions are determined in accordance with income tax regulations that may differ from US GAAP. These differences are due to differing treatments for items such as net short-term gains, deferral of wash sale losses, and capital loss carryovers. Certain permanent differences such as tax returns of capital and net investment losses noted below have been reclassified to capital.
| | | | | |
For the year ended June 30, 2022 | |
Distributions | | |
From Ordinary Income | From Long-Term Capital Gains | Tax Return of Capital | Net Investment Loss | |
$ 16,152,241 | $ - | $ - | $ - | |
| | | | | |
For the year ended June 30, 2021 | |
Distributions | | |
From Ordinary Income | From Long-Term Capital Gains | Tax Return of Capital | Net Investment Loss | |
$ 20,179,636 | $ - | $ - | $ - | |
Permanent book to tax basis differences may result in reclassifications between the components of net assets. These differences have no impact on the results of operations or net assets. The following reclassifications have been made to the Fund:
| | | |
| | |
Increase/(Decrease) to Capital | Increase/(Decrease) to Undistributed
Net Investment Income/Loss | Increase/(Decrease) to Undistributed
Net Realized Gain/Loss |
$ - | $ 2,218,195 | $ (2,218,195) |
Janus Henderson Short Duration Flexible Bond Fund
Notes to Financial Statements
6. Capital Share Transactions
| | | | | | | |
| | | | | | |
| | Year ended June 30, 2022 | | Year ended June 30, 2021 |
| | Shares | Amount | | Shares | Amount |
| | | | | | | |
Class A Shares: | | | | | |
Shares sold | 6,103,315 | $ 18,445,802 | | 13,187,059 | $ 40,609,136 |
Reinvested dividends and distributions | 274,134 | 819,202 | | 345,398 | 1,064,189 |
Shares repurchased | (8,342,036) | (24,989,782) | | (9,614,892) | (29,617,304) |
Net Increase/(Decrease) | (1,964,587) | $ (5,724,778) | | 3,917,565 | $ 12,056,021 |
Class C Shares: | | | | | |
Shares sold | 4,292,448 | $ 12,734,788 | | 5,525,136 | $ 16,981,556 |
Reinvested dividends and distributions | 34,482 | 102,292 | | 89,805 | 276,255 |
Shares repurchased | (6,063,009) | (18,022,285) | | (6,871,458) | (21,140,063) |
Net Increase/(Decrease) | (1,736,079) | $ (5,185,205) | | (1,256,517) | $ (3,882,252) |
Class D Shares: | | | | | |
Shares sold | 11,917,807 | $ 35,906,077 | | 23,731,931 | $ 73,144,037 |
Reinvested dividends and distributions | 905,441 | 2,710,465 | | 1,178,293 | 3,634,403 |
Shares repurchased | (19,658,291) | (58,974,700) | | (20,259,770) | (62,467,345) |
Net Increase/(Decrease) | (6,835,043) | $ (20,358,158) | | 4,650,454 | $ 14,311,095 |
Class I Shares: | | | | | |
Shares sold | 73,919,598 | $224,736,454 | | 71,404,362 | $219,862,802 |
Reinvested dividends and distributions | 2,314,486 | 6,911,116 | | 2,273,591 | 6,998,878 |
Shares repurchased | (57,678,560) | (172,186,005) | | (61,499,492) | (189,493,094) |
Net Increase/(Decrease) | 18,555,524 | $ 59,461,565 | | 12,178,461 | $ 37,368,586 |
Class N Shares: | | | | | |
Shares sold | 14,278,921 | $ 42,161,680 | | 1,734,787 | $ 5,331,585 |
Reinvested dividends and distributions | 156,160 | 462,994 | | 101,012 | 310,642 |
Shares repurchased | (3,713,697) | (11,056,370) | | (2,310,961) | (7,106,240) |
Net Increase/(Decrease) | 10,721,384 | $ 31,568,304 | | (475,162) | $ (1,464,013) |
Class S Shares: | | | | | |
Shares sold | 8,311 | $ 25,440 | | 44,302 | $ 136,124 |
Reinvested dividends and distributions | 2,270 | 6,770 | | 3,147 | 9,681 |
Shares repurchased | (94,996) | (272,267) | | (91,940) | (281,259) |
Net Increase/(Decrease) | (84,415) | $ (240,057) | | (44,491) | $ (135,454) |
Class T Shares: | | | | | |
Shares sold | 6,699,468 | $ 20,273,024 | | 19,115,175 | $ 58,933,323 |
Reinvested dividends and distributions | 1,522,835 | 4,560,703 | | 2,282,467 | 7,043,848 |
Shares repurchased | (35,879,119) | (107,913,093) | | (30,151,248) | (93,005,760) |
Net Increase/(Decrease) | (27,656,816) | $ (83,079,366) | | (8,753,606) | $ (27,028,589) |
7. Purchases and Sales of Investment Securities
For the year ended June 30, 2022, the aggregate cost of purchases and proceeds from sales of investment securities (excluding any short-term securities, short-term options contracts, TBAs, and in-kind transactions, as applicable) was as follows:
| | | | |
Purchases of
Securities | Proceeds from Sales
of Securities | Purchases of Long-
Term U.S. Government
Obligations | Proceeds from Sales
of Long-Term U.S.
Government Obligations |
$656,906,010 | $ 685,782,543 | $ 365,414,321 | $ 361,002,842 |
8. Recent Accounting Pronouncements
The FASB issued Accounting Standards Update 2020-04 Reference Rate Reform: Facilitation of the Effects of Reference Rate Reform on Financial Reporting (“ASU 2020-04”) in March 2020. The new guidance in the ASU provide
Janus Henderson Short Duration Flexible Bond Fund
Notes to Financial Statements
optional temporary financial reporting relief from the effect of certain types of contract modifications due to the planned discontinuation of the LIBOR or other interbank-offered based reference rates as of the end of 2021. For new and existing contracts, Funds may elect to apply the guidance as of March 12, 2020 through December 31, 2022. FASB has proposed extending the sunset date to December 31, 2024. Management is currently evaluating the impact, if any, of the ASU’s adoption to the Fund’s financial statements.
9. Subsequent Event
Management has evaluated whether any events or transactions occurred subsequent to June 30, 2022 and through the date of issuance of the Fund’s financial statements and determined that there were no material events or transactions that would require recognition or disclosure in the Fund’s financial statements.
Janus Henderson Short Duration Flexible Bond Fund
Report of Independent Registered Public Accounting Firm
To the Board of Trustees of Janus Investment Fund and Shareholders of Janus Henderson Short Duration Flexible Bond Fund
Opinion on the Financial Statements
We have audited the accompanying statement of assets and liabilities, including the schedule of investments, of Janus Henderson Short Duration Flexible Bond Fund (one of the funds constituting Janus Investment Fund, referred to hereafter as the "Fund") as of June 30, 2022, the related statement of operations for the year ended June 30, 2022, the statements of changes in net assets for each of the two years in the period ended June 30, 2022, including the related notes, and the financial highlights for each of the five years in the period ended June 30, 2022 (collectively referred to as the “financial statements”). In our opinion, the financial statements present fairly, in all material respects, the financial position of the Fund as of June 30, 2022, the results of its operations for the year then ended, the changes in its net assets for each of the two years in the period ended June 30, 2022 and the financial highlights for each of the five years in the period ended June 30, 2022 in conformity with accounting principles generally accepted in the United States of America.
Basis for Opinion
These financial statements are the responsibility of the Fund’s management. Our responsibility is to express an opinion on the Fund’s financial statements based on our audits. We are a public accounting firm registered with the Public Company Accounting Oversight Board (United States) (PCAOB) and are required to be independent with respect to the Fund in accordance with the U.S. federal securities laws and the applicable rules and regulations of the Securities and Exchange Commission and the PCAOB.
We conducted our audits of these financial statements in accordance with the standards of the PCAOB. Those standards require that we plan and perform the audit to obtain reasonable assurance about whether the financial statements are free of material misstatement, whether due to error or fraud.
Our audits included performing procedures to assess the risks of material misstatement of the financial statements, whether due to error or fraud, and performing procedures that respond to those risks. Such procedures included examining, on a test basis, evidence regarding the amounts and disclosures in the financial statements. Our audits also included evaluating the accounting principles used and significant estimates made by management, as well as evaluating the overall presentation of the financial statements. Our procedures included confirmation of securities owned as of June 30, 2022 by correspondence with the custodian, transfer agent, and brokers; when replies were not received from brokers, we performed other auditing procedures. We believe that our audits provide a reasonable basis for our opinion.

Denver, Colorado
August 19, 2022
We have served as the auditor of one or more investment companies in Janus Henderson Funds since 1990.
Janus Henderson Short Duration Flexible Bond Fund
Additional Information (unaudited)
Proxy Voting Policies and Voting Record
A description of the policies and procedures that the Fund uses to determine how to vote proxies relating to its portfolio securities is available without charge: (i) upon request, by calling 1-800-525-1093; (ii) on the Fund’s website at janushenderson.com/proxyvoting; and (iii) on the SEC’s website at http://www.sec.gov. Additionally, information regarding the Fund’s proxy voting record for the most recent twelve-month period ended June 30 is also available, free of charge, through janushenderson.com/proxyvoting and from the SEC’s website at http://www.sec.gov.
Full Holdings
The Fund files its complete portfolio holdings (schedule of investments) with the SEC as an exhibit to Form N-PORT within 60 days of the end of the first and third fiscal quarters, and in the annual report and semiannual report to shareholders. The Fund’s Form N-PORT filings and annual and semiannual reports: (i) are available on the SEC’s website at http://www.sec.gov; (ii) may be reviewed and copied at the SEC’s Public Reference Room in Washington, D.C. (information on the Public Reference Room may be obtained by calling 1-800-SEC-0330); and (iii) are available without charge, upon request, by calling a Janus Henderson representative at 1-877-335-2687 (toll free) (or 1-800-525-3713 if you hold Class D shares). Portfolio holdings consisting of at least the names of the holdings are generally available on a monthly basis with a 30-day lag under Full Holdings for the Fund at janushenderson.com/info (or janushenderson.com/reports if you hold Class D Shares).
APPROVAL OF ADVISORY AGREEMENTS DURING THE PERIOD
The Trustees of Janus Aspen Series, each of whom serves as an “independent” Trustee (the “Trustees”), oversee the management of each portfolio of Janus Aspen Series (each, a “VIT Portfolio,” and collectively, the “VIT Portfolios”), as well as each fund of Janus Investment Fund (each, a “Fund,” and collectively, the “Funds” and together with the VIT Portfolios, the “Janus Henderson Funds,” and each, a “Janus Henderson Fund”). As required by law, the Trustees determine annually whether to continue the investment advisory agreement for each Janus Henderson Fund and the subadvisory agreement for each Janus Henderson Fund that utilizes a subadviser.
In connection with their most recent consideration of those agreements for each Janus Henderson Fund, the Trustees received and reviewed information provided by Janus Henderson Investors US LLC (formerly, Janus Capital Management LLC) (the “Adviser”) and the subadviser in response to requests of the Trustees and their independent legal counsel. They also received and reviewed information and analysis provided by, and in response to requests of, their independent fee consultant. Throughout their consideration of the agreements, the Trustees were advised by their independent legal counsel. The Trustees met with management to consider the agreements, and also met separately in executive session with their independent legal counsel and their independent fee consultant.
At meetings held on November 3-4, 2021 and December 7-8, 2021, the Trustees’ evaluated the information provided by the Adviser, the subadviser, and the independent fee consultant, as well as other information addressed during the year. Following such evaluation, the Trustees determined that the overall arrangements between each Janus Henderson Fund and the Adviser and each subadviser, as applicable, were fair and reasonable in light of the nature, extent and quality of the services provided by the Adviser, its affiliates and the subadviser, the fees charged for those services, and other matters that the Trustees considered relevant in the exercise of their business judgment and unanimously approved the continuation of the investment advisory agreement for each Janus Henderson Fund and the subadvisory agreement for each subadvised Janus Henderson Fund, for the period from February 1, 2022 through February 1, 2023, subject to earlier termination as provided for in each agreement.
In considering the continuation of those agreements, the Trustees reviewed and analyzed various factors that they determined were relevant, including the factors described below, none of which by itself was considered dispositive. However, the material factors and conclusions that formed the basis for the Trustees’ determination to approve the continuation of the agreements are discussed separately below. Also included is a summary of the independent fee consultant’s conclusions and opinions that arose during, and were included as part of, the Trustees’ consideration of the agreements. “Management fees,” as used herein, reflect actual annual advisory fees and, for the purpose of peer comparisons any administration fees (excluding out of pocket costs), net of any waivers, paid by a fund as a percentage of average net assets.
Nature, Extent and Quality of Services
The Trustees reviewed the nature, extent and quality of the services provided by the Adviser and the subadviser to the Janus Henderson Funds, taking into account the investment objective, strategies and policies of each Janus Henderson
Janus Henderson Short Duration Flexible Bond Fund
Additional Information (unaudited)
Fund, and the knowledge the Trustees gained from their regular meetings with management on at least a quarterly basis and their ongoing review of information related to the Janus Henderson Funds. In addition, the Trustees reviewed the resources and key personnel of the Adviser and the subadviser, particularly noting those employees who provide investment and risk management services to the Janus Henderson Funds. The Trustees also considered other services provided to the Janus Henderson Funds by the Adviser or the subadviser, such as managing the execution of portfolio transactions and the selection of broker-dealers for those transactions. The Trustees considered the Adviser’s role as administrator to the Janus Henderson Funds, noting that the Adviser generally does not receive a fee for its services as administrator, but is reimbursed for its out-of-pocket costs. The Trustees considered the role of the Adviser in monitoring adherence to the Janus Henderson Funds’ investment restrictions, providing support services for the Trustees and Trustee committees, and overseeing communications with shareholders and the activities of other service providers, including monitoring compliance with various policies and procedures of the Janus Henderson Funds and with applicable securities laws and regulations.
In this regard, the independent fee consultant noted that the Adviser provides a number of different services for the Janus Henderson Funds and fund shareholders, ranging from investment management services to various other servicing functions, and that, in its view, the Adviser is a capable provider of those services. The independent fee consultant also provided its belief that the Adviser has developed a number of institutional competitive advantages that should enable it to provide superior investment and service performance over the long term.
The Trustees concluded that the nature, extent and quality of the services provided by the Adviser and the subadviser to each Janus Henderson Fund were appropriate and consistent with the terms of the respective advisory and subadvisory agreements, and that, taking into account steps taken to address those Janus Henderson Funds whose performance lagged that of their peers for certain periods, the Janus Henderson Funds were likely to benefit from the continued provision of those services. They also concluded that the Adviser and the subadviser had sufficient personnel, with the appropriate education and experience, to serve the Janus Henderson Funds effectively and each had demonstrated its ability to attract well-qualified personnel.
Performance of the Funds
The Trustees considered the performance results of each Janus Henderson Fund over various time periods. They noted that they considered Janus Henderson Fund performance data throughout the year, including periodic meetings with each Janus Henderson Fund’s portfolio manager(s), and also reviewed information comparing each Janus Henderson Fund’s performance with the performance of comparable funds and peer groups identified by Broadridge Financial Solutions, Inc. (“Broadridge”), an independent data provider, and with the Janus Henderson Fund’s benchmark index. In this regard, the independent fee consultant found that the overall Janus Henderson Funds’ performance has been reasonable: for the 36 months ended September 30, 2021, approximately 55% of the Janus Henderson Funds were in the top two quartiles of performance versus Broadridge peers, and for the 12 months ended September 30, 2021, approximately 45% of the Janus Henderson Funds were in the top two quartiles of performance versus Broadridge peers.
The Trustees considered the performance of each Fund, noting that performance may vary by share class, and noted the following:
Asset Allocation Funds
· For Janus Henderson Global Allocation Fund – Conservative, the Trustees noted that the Fund’s performance was in the second Broadridge quartile for the 36 months ended May 31, 2021 and the first Broadridge quartile for the 12 months ended May 31, 2021.
· For Janus Henderson Global Allocation Fund – Growth, the Trustees noted that the Fund’s performance was in the bottom Broadridge quartile for the 36 months ended May 31, 2021 and the first Broadridge quartile for the 12 months ended May 31, 2021. The Trustees noted the reasons for the Fund’s underperformance, the steps the Adviser had taken or was taking to improve performance, and that the performance trend was improving.
· For Janus Henderson Global Allocation Fund – Moderate, the Trustees noted that the Fund’s performance was in the third Broadridge quartile for the 36 months ended May 31, 2021 and the first Broadridge quartile for the 12 months ended May 31, 2021. The Trustees noted the reasons for the Fund’s underperformance, the steps the Adviser had taken or was taking to improve performance and that the performance trend was improving
Janus Henderson Short Duration Flexible Bond Fund
Additional Information (unaudited)
Fixed-Income Funds
· For Janus Henderson Absolute Return Income Opportunities Fund, the Trustees noted that the Fund’s performance was in the bottom Broadridge quartile for the 36 months ended May 31, 2021 and the bottom Broadridge quartile for the 12 months ended May 31, 2021. The Trustees noted the reasons for the Fund’s underperformance and the steps the Adviser had taken or was taking to improve performance.
· For Janus Developed World Bond Fund, the Trustees noted the Fund’s performance was in the second Broadridge quartile for the 36 months ended May 31, 2021 and the bottom Broadridge quartile for the 12 months ended May 31, 2021.
· For Janus Henderson Flexible Bond Fund, the Trustees noted that the Fund’s performance was in the first Broadridge quartile for the 36 months ended May 31, 2021 and the third Broadridge quartile for the 12 months ended May 31, 2021.
· For Janus Henderson Global Bond Fund, the Trustees noted that the Fund’s performance was in the second Broadridge quartile for the 36 months ended May 31, 2021 and the third Broadridge quartile for the 12 months ended May 31, 2021.
· For Janus Henderson High-Yield Fund, the Trustees noted that the Fund’s performance was in the first Broadridge quartile for the 36 months ended May 31, 2021 and the second Broadridge quartile for the 12 months ended May 31, 2021.
· For Janus Henderson Multi-Sector Income Fund, the Trustees noted that the Fund’s performance was in the first Broadridge quartile for the 36 months ended May 31, 2021 and the first Broadridge quartile for the 12 months ended May 31, 2021.
· For Janus Henderson Short Duration Flexible Bond Fund, the Trustees noted that the Fund’s performance was in the second Broadridge quartile for the 36 months ended May 31, 2021 and the second Broadridge quartile for the 12 months ended May 31, 2021.
Global and International Equity Funds
· For Janus Henderson Asia Equity Fund, the Trustees noted that the Fund’s performance was in the second Broadridge quartile for the 36 months ended May 31, 2021 and the second Broadridge quartile for the 12 months ended May 31, 2021.
· For Janus Henderson Emerging Markets Fund, the Trustees noted that the Fund’s performance was in the second Broadridge quartile for the 36 months ended May 31, 2021 and the first Broadridge quartile for the 12 months ended May 31, 2021.
· For Janus Henderson European Focus Fund, the Trustees noted that the Fund’s performance was in the first Broadridge quartile for the 36 months ended May 31, 2021 and the first Broadridge quartile for the 12 months ended May 31, 2021.
· For Janus Henderson Global Equity Income Fund, the Trustees noted that the Fund’s performance was in the bottom Broadridge quartile for the 36 months ended May 31, 2021 and the third Broadridge quartile for the 12 months ended May 31, 2021. The Trustees noted the reasons for the Fund’s underperformance and the steps the Adviser had taken or was taking to improve performance.
· For Janus Henderson Global Life Sciences Fund, the Trustees noted that the Fund’s performance was in the first Broadridge quartile for the 36 months ended May 31, 2021 and the first Broadridge quartile for the 12 months ended May 31, 2021.
· For Janus Henderson Global Real Estate Fund, the Trustees noted that the Fund’s performance was in the first Broadridge quartile for the 36 months ended May 31, 2021 and the bottom Broadridge quartile for the 12 months ended May 31, 2021.
· For Janus Henderson Global Research Fund, the Trustees noted that the Fund’s performance was in the third Broadridge quartile for the 36 months ended May 31, 2021 and the third Broadridge quartile for the 12 months ended May 31, 2021. The Trustees noted the reasons for the Fund’s underperformance, while also noting that the
Janus Henderson Short Duration Flexible Bond Fund
Additional Information (unaudited)
Fund has a performance fee structure that results in lower management fees during periods of underperformance, and the steps the Adviser had taken or was taking to improve performance.
· For Janus Henderson Global Select Fund, the Trustees noted that the Fund’s performance was in the first Broadridge quartile for the 36 months ended May 31, 2021 and the first Broadridge quartile for the 12 months ended May 31, 2021.
· For Janus Henderson Global Technology and Innovation Fund, the Trustees noted that the Fund’s performance was in the second Broadridge quartile for the 36 months ended May 31, 2021 and the bottom Broadridge quartile for the 12 months ended May 31, 2021.
· For Janus Henderson International Opportunities Fund, the Trustees noted that the Fund’s performance was in the bottom Broadridge quartile for the 36 months ended May 31, 2021 and the third Broadridge quartile for the 12 months ended May 31, 2021. The Trustees noted the reasons for the Fund’s underperformance and the steps the Adviser had taken or was taking to improve performance.
· For Janus Henderson Overseas Fund, the Trustees noted that the Fund’s performance was in the second Broadridge quartile for the 36 months ended May 31, 2021 and the first Broadridge quartile for the 12 months ended May 31, 2021.
Money Market Funds
· For Janus Henderson Government Money Market Fund, the Trustees noted that the Fund’s performance was in the third Broadridge quartile for the 36 months ended May 31, 2021 and the bottom Broadridge quartile for the 12 months ended May 31, 2021. The Trustees noted the reasons for the Fund’s underperformance and the steps the Adviser had taken or was taking to improve performance.
· For Janus Henderson Money Market Fund, the Trustees noted that the Fund’s performance was in the third Broadridge quartile for the 36 months ended May 31, 2021 and the bottom Broadridge quartile for the 12 months ended May 31, 2021. The Trustees noted the reasons for the Fund’s underperformance and the steps the Adviser had taken or was taking to improve performance.
Multi-Asset Funds
· For Janus Henderson Adaptive Global Allocation Fund, the Trustees noted that the Fund’s performance was in bottom Broadridge quartile for the 36 months ended May 31, 2021 and the bottom Broadridge quartile for the 12 months ended May 31, 2021. The Trustees noted the reasons for the Fund’s underperformance and the steps the Adviser had taken or was taking to improve performance.
· For Janus Henderson Dividend & Income Builder Fund, the Trustees noted that the Fund’s performance was in the third Broadridge quartile for the 36 months ended May 31, 2021 and the third Broadridge quartile for the 12 months ended May 31, 2021. The Trustees noted the reasons for the Fund’s underperformance and the steps the Adviser had taken or was taking to improve performance.
Multi-Asset U.S. Equity Funds
· For Janus Henderson Balanced Fund, the Trustees noted that the Fund’s performance was in the first Broadridge quartile for the 36 months ended May 31, 2021 and the third Broadridge quartile for the 12 months ended May 31, 2021.
· For Janus Henderson Contrarian Fund, the Trustees noted that the Fund’s performance was in the first Broadridge quartile for the 36 months ended May 31, 2021 and the first Broadridge quartile for the 12 months ended May 31, 2021.
· For Janus Henderson Enterprise Fund, the Trustees noted that the Fund’s performance was in the bottom Broadridge quartile for the 36 months ended May 31, 2021 and the third Broadridge quartile for the 12 months ended May 31, 2021. The Trustees noted the reasons for the Fund’s underperformance, and the steps the Adviser had taken or was taking to improve performance.
· For Janus Henderson Forty Fund, the Trustees noted that the Fund’s performance was in the first Broadridge quartile for the 36 months ended May 31, 2021 and the first Broadridge quartile for the 12 months ended May 31, 2021.
Janus Henderson Short Duration Flexible Bond Fund
Additional Information (unaudited)
· For Janus Henderson Growth and Income Fund, the Trustees noted that the Fund’s performance was in the bottom Broadridge quartile for the 36 months ended May 31, 2021 and the third Broadridge quartile for the 12 months ended May 31, 2021. The Trustees noted the reasons for the Fund’s underperformance, and the steps the Adviser had taken or was taking to improve performance.
· For Janus Henderson Research Fund, the Trustees noted that the Fund’s performance was in the third Broadridge quartile for the 36 months ended May 31, 2021 and the third Broadridge quartile for the 12 months ended May 31, 2021. The Trustees noted the reasons for the Fund’s underperformance while also noting that the Fund has a performance fee structure that results in lower management fees during periods of underperformance, and the steps the Adviser had taken or was taking to improve performance.
· For Janus Henderson Triton Fund, the Trustees noted that the Fund’s performance was in the bottom Broadridge quartile for the 36 months ended May 31, 2021 and the bottom Broadridge quartile for the 12 months ended May 31, 2021. The Trustees noted the reasons for the Fund’s underperformance, and the steps the Adviser had taken or was taking to improve performance.
· For Janus Henderson Venture Fund, the Trustees noted that the Fund’s performance was in the third Broadridge quartile for the 36 months ended May 31, 2021 and the bottom Broadridge quartile for the 12 months ended May 31, 2021. The Trustees noted the reasons for the Fund’s underperformance, and the steps the Adviser had taken or was taking to improve performance.
Quantitative Equity Funds
· For Janus Henderson Emerging Markets Managed Volatility Fund, the Trustees noted that the Fund’s performance was in the bottom Broadridge quartile for the 36 months ended May 31, 2021 and the bottom Broadridge quartile for the 12 months ended May 31, 2021. The Trustees noted the reasons for the Fund’s underperformance and the steps the Adviser and subadviser had taken or were taking to improve performance.
· For Janus Henderson Global Income Managed Volatility Fund, the Trustees noted that the Fund’s performance was in the second Broadridge quartile for the 36 months ended May 31, 2021 and the bottom Broadridge quartile for the 12 months ended May 31, 2021.
· For Janus Henderson International Managed Volatility Fund, the Trustees noted that the Fund’s performance was in the bottom Broadridge quartile for the 36 months ended May 31, 2021 and the bottom Broadridge quartile for the 12 months ended May 31, 2021. The Trustees noted the reasons for the Fund’s underperformance, the steps the Adviser and subadviser had taken or were taking to improve performance.
· For Janus Henderson U.S. Managed Volatility Fund, the Trustees noted that the Fund’s performance was in the bottom Broadridge quartile for the 36 months ended May 31, 2021 and the bottom Broadridge quartile for the 12 months ended May 31, 2021. The Trustees noted the reasons for the Fund’s underperformance, the steps the Adviser and subadviser had taken or were taking to improve performance.
U.S. Equity Funds
· For Janus Henderson Mid Cap Value Fund, the Trustees noted that the Fund’s performance was in the bottom Broadridge quartile for the 36 months ended May 31, 2021 and the bottom Broadridge quartile for the 12 months ended May 31, 2021. The Trustees noted the reasons for the Fund’s underperformance, while also noting that the Fund has a performance fee structure that results in lower management fees during periods of underperformance, and the steps the Adviser had taken or was taking to improve performance.
· For Janus Henderson Small Cap Value Fund, the Trustees noted that the Fund’s performance was in the bottom Broadridge quartile for the 36 months ended May 31, 2021 and the bottom Broadridge quartile for the 12 months ended May 31, 2021. The Trustees noted the reasons for the Fund’s underperformance, while also noting that the Fund has a performance fee structure that results in lower management fees during periods of underperformance, and the steps the Adviser had taken or was taking to improve performance.
· For Janus Henderson Small-Mid Cap Value Fund, the Trustees noted that the Fund’s performance was in the third Broadridge quartile for the 36 months ended May 31, 2021 and the bottom Broadridge quartile for the 12 months ended May 31, 2021. The Trustees noted the reasons for the Fund’s underperformance, while also noting that the Fund has a performance fee structure that results in lower management fees during periods of underperformance, and the steps the Adviser had taken or was taking to improve performance.
Janus Henderson Short Duration Flexible Bond Fund
Additional Information (unaudited)
In consideration of each Janus Henderson Fund’s performance, the Trustees concluded that, taking into account the factors relevant to performance, as well as other considerations, including steps taken to improve performance, the Janus Henderson Fund’s performance warranted continuation of such Janus Henderson Fund’s investment advisory and subadvisory agreement(s).
Costs of Services Provided
The Trustees examined information regarding the fees and expenses of each Janus Henderson Fund in comparison to similar information for other comparable funds as provided by Broadridge, an independent data provider. They also reviewed an analysis of that information provided by their independent fee consultant and noted that the rate of management fees (investment advisory fees and any administration fees but excluding out-of-pocket costs) for many of the Janus Henderson Funds, after applicable waivers, was below the average management fee rate of the respective peer group of funds selected by an independent data provider. The Trustees also examined information regarding the subadvisory fees charged for subadvisory services, as applicable, noting that all such fees were paid by the Adviser out of its management fees collected from such Janus Henderson Fund.
The independent fee consultant provided its belief that the management fees charged by the Adviser to each of the Janus Henderson Funds under the current investment advisory and administration agreements are reasonable in relation to the services provided by the Adviser. The independent fee consultant found: (1) the total expenses and management fees of the Janus Henderson Funds to be reasonable relative to other comparable mutual funds; (2) the total expenses, on average, were 8% under the average total expenses of the respective Broadridge Expense Group peers; and (3) and the management fees for the Janus Henderson Funds, on average, were 6% under the average management fees for the respective Broadridge Expense Group. The Trustees also considered the total expenses for each share class of each Janus Henderson Fund compared to the average total expenses for its Broadridge Expense Group and to average total expenses for its Broadridge Expense Universe.
For certain Janus Henderson Funds, the independent fee consultant also performed a systematic “focus list” analysis of expenses which assessed fund fees in the context of fund performance being delivered. Based on this analysis, the independent fee consultant found that the combination of service quality/performance and expenses on these individual Janus Henderson Funds was reasonable in light of performance trends, performance histories, and existence of performance fees, breakpoints, and/or expense waivers on such Janus Henderson Funds.
The Trustees considered the methodology used by the Adviser and subadviser in determining compensation payable to portfolio managers, the competitive environment for investment management talent, and the competitive market for mutual funds in different distribution channels.
The Trustees also reviewed management fees charged by the Adviser and subadviser to comparable separate account clients and to comparable non-affiliated funds subadvised by the Adviser or subadviser (for which the Adviser or the subadviser provides only or primarily portfolio management services). Although in most instances subadvisory and separate account fee rates for various investment strategies were lower than management fee rates for Janus Henderson Funds having a similar strategy, the Trustees considered that the Adviser noted that, under the terms of the management agreements with the Janus Henderson Funds, the Adviser performs significant additional services for the Janus Henderson Funds that it does not provide to those other clients, including administration services, oversight of the Janus Henderson Funds’ other service providers, trustee support, regulatory compliance and numerous other services, and that, in serving the Janus Henderson Funds, the Adviser assumes many legal risks and other costs that it does not assume in servicing its other clients. Moreover, the Trustees noted that the independent fee consultant found that: (1) the management fees the Adviser charges to the Janus Henderson Funds are reasonable in relation to the management fees the Adviser charges to funds subadvised by the Adviser and to the fees the Adviser charges to its institutional separate account clients; (2) these subadvised and institutional separate accounts have different service and infrastructure needs and operate in markets very distinct relative to retail funds; (3) Janus Henderson mutual fund investors enjoy reasonable fees relative to the fees charged to Janus Henderson subadvised fund and separate account investors; and (4) as part of its 2020 review, 9 of 10 Janus Henderson Funds have lower management fees than similar funds subadvised by the Adviser.
The Trustees considered the fees for each Janus Henderson Fund for its fiscal year ended in 2020, including the VIT Portfolios, and noted the following with regard to each VIT Portfolio’s total expenses, net of applicable fee waivers (the VIT Portfolio’s “total expenses”):
Janus Henderson Short Duration Flexible Bond Fund
Additional Information (unaudited)
Asset Allocation Funds
· For Janus Henderson Global Allocation Fund – Conservative, the Trustees noted that, although the Fund’s total expenses exceeded the peer group average for certain share classes, overall the Fund’s total expenses were reasonable. The Trustees also noted that the Adviser has contractually agreed to limit the Fund’s expenses.
· For Janus Henderson Global Allocation Fund – Growth, the Trustees noted that, although the Fund’s total expenses exceeded the peer group average for certain share classes, overall the Fund’s total expenses were reasonable.
· For Janus Henderson Global Allocation Fund – Moderate, the Trustees noted that, although the Fund’s total expenses exceeded the peer group for certain share classes, overall the Fund’s total expenses were reasonable. The Trustees also noted that the Adviser has contractually agreed to limit the Fund’s expenses.
Fixed-Income Funds
· For Janus Henderson Absolute Return Income Opportunities Fund, the Trustees noted that, although the Fund’s total expenses exceeded the peer group for certain share classes, overall the Fund’s total expenses were reasonable. The Trustees also noted that the Adviser has contractually agreed to limit the Fund’s expenses.
· For Janus Henderson Developed World Bond Fund, the Trustees noted that, although the Fund’s total expenses exceeded the peer group for one share class, overall the Fund’s total expenses were reasonable. The Trustees also noted that the Adviser has contractually agreed to limit the Fund’s expenses.
· For Janus Henderson Flexible Bond Fund, the Trustees noted that, although the Fund’s total expenses exceeded the peer group for certain share classes, overall the Fund’s total expenses were reasonable. The Trustees also noted that the Adviser has contractually agreed to limit the Fund’s expenses, although this limit did not apply because the Fund’s total expenses were already below the applicable fee limit.
· For Janus Henderson Global Bond Fund, the Trustees noted that, although the Fund’s total expenses exceeded the peer group average for certain share classes, overall the Fund’s total expenses were reasonable. The Trustees also noted that the Adviser has contractually agreed to limit the Fund’s expenses.
· For Janus Henderson High-Yield Fund, the Trustees noted that, although the Fund’s total expenses exceeded the peer group for certain share classes, overall the Fund’s total expenses were reasonable. The Trustees also noted that the Adviser has contractually agreed to limit the Fund’s expenses.
· For Janus Henderson Multi-Sector Income Fund, the Trustees noted that, although the Fund’s total expenses exceeded the peer group for certain share classes, overall the Fund’s total expenses were reasonable. The Trustees also noted that the Adviser has contractually agreed to limit the Fund’s expenses.
· For Janus Henderson Short Duration Flexible Bond Fund, the Trustees noted that, although the Fund’s total expenses exceeded the peer group for certain share classes, overall the Fund’s total expenses were reasonable. The Trustees also noted that the Adviser has contractually agreed to limit the Fund’s expenses.
Global and International Equity Funds
· For Janus Henderson Asia Equity Fund, the Trustees noted that, although the Fund’s total expenses exceeded the peer group for certain share classes, overall the Fund’s total expenses were reasonable. The Trustees also noted that the Adviser has contractually agreed to limit the Fund’s expenses.
· For Janus Henderson Emerging Markets Fund, the Trustees noted that, although the Fund’s total expenses exceeded the peer group for certain share classes, overall the Fund’s total expenses were reasonable. The Trustees also noted that the Adviser has contractually agreed to limit the Fund’s expenses.
· For Janus Henderson European Focus Fund, the Trustees noted that, although the Fund’s total expenses exceeded the peer group average for certain share classes, overall the Fund’s total expenses were reasonable. The Trustees also noted that the Adviser has contractually agreed to limit the Fund’s expenses.
· For Janus Henderson Global Equity Income Fund, the Trustees noted that, although the Fund’s total expenses exceeded the peer group for one share class, overall the Fund’s total expenses were reasonable. The Trustees also noted that the Adviser has contractually agreed to limit the Fund’s expenses, although this limit did not apply because the Fund’s total expenses were already below the applicable fee limit.
Janus Henderson Short Duration Flexible Bond Fund
Additional Information (unaudited)
· For Janus Henderson Global Life Sciences Fund, the Trustees noted that the Fund’s total expenses were below the peer group for all share classes.
· For Janus Henderson Global Real Estate Fund, the Trustees noted, although the Fund’s total expenses exceeded the peer group average for certain share classes, overall the Fund’s total expenses were reasonable. The Trustees also noted that the Adviser has contractually agreed to limit the Fund’s expenses, although this limit did not apply because the Fund’s total expenses were already below the applicable fee limit.
· For Janus Henderson Global Research Fund, the Trustees noted that the Fund’s total expenses were below the peer group for all share classes.
· For Janus Henderson Global Select Fund, the Trustees noted that, although the Fund’s total expenses exceeded the peer group average for one share class, overall the Fund’s total expenses were reasonable. The Trustees also noted that the Adviser has contractually agreed to limit the Fund’s expenses.
· For Janus Henderson Global Sustainable Equity Fund, the Trustees noted that the Fund’s total expenses were below the peer group for all share classes.
· For Janus Henderson Global Technology and Innovation Fund, the Trustees noted that the Fund’s total expenses were below the peer group for all share classes.
· For Janus Henderson International Opportunities Fund, the Trustees noted that, although the Fund’s total expenses exceeded the peer group average for certain share classes, overall the Fund’s total expenses were reasonable. The Trustees also noted that the Adviser has contractually agreed to limit the Fund’s expenses.
· For Janus Henderson Overseas Fund, the Trustees noted that although the Fund’s total expenses exceeded the peer group average for certain share classes, overall the Fund’s total expenses were reasonable. The Trustees also noted that the Adviser has contractually agreed to limit the Fund’s expenses, although this limit did not apply because the Fund’s total expenses were already below the applicable fee limit.
Money Market Funds
· For Janus Henderson Government Money Market Fund, the Trustees noted that, although the Fund’s total expenses exceeded the peer group for both share classes, overall the Fund’s total expenses were reasonable. The Trustees also noted that the Adviser has voluntarily agreed to limit the Fund’s expenses to assist the Fund in attempting to maintain a yield of at least 0.00%.
· For Janus Henderson Money Market Fund, the Trustees noted that, although the Fund’s total expenses exceeded the peer group for both share classes, overall the Fund’s total expenses were reasonable. The Trustees also noted that the Adviser has agreed to limit the Fund’s expenses to assist the Fund in attempting to maintain a yield of at least 0.00%.
Multi-Asset Funds
· For Janus Henderson Adaptive Global Allocation Fund, the Trustees noted that, that the Fund’s total expenses were below the peer group average for all share classes.
· For Janus Henderson Dividend & Income Builder Fund, the Trustees noted that, that the Fund’s total expenses were below the peer group average for all share classes.
Multi-Asset U.S. Equity Funds
· For Janus Henderson Balanced Fund, the Trustees noted that, although the Fund’s total expenses exceeded the peer group average for certain share classes, overall the Fund’s total expenses were reasonable. The Trustees also noted that the Adviser has contractually agreed to limit the Fund’s expenses, although this limit did not apply because the Fund’s total expenses were already below the applicable fee limit.
· For Janus Henderson Contrarian Fund, the Trustees noted that, although the Fund’s total expenses exceeded the peer group average for certain share classes, overall the Fund’s total expenses were reasonable. The Trustees also noted that the Adviser had contractually agreed to limit the Fund’s expenses.
· For Janus Henderson Enterprise Fund, the Trustees noted that, although the Fund’s total expenses exceeded the peer group for certain share classes, overall the Fund’s total expenses were reasonable. The Trustees also noted
Janus Henderson Short Duration Flexible Bond Fund
Additional Information (unaudited)
that the Adviser has contractually agreed to limit the Fund’s expenses, although this limit did not apply because the Fund’s total expenses were already below the applicable fee limit.
· For Janus Henderson Forty Fund, the Trustees noted that, although the Fund’s total expenses exceeded the peer group for certain share classes, overall the Fund’s total expenses were reasonable. The Trustees also noted that the Adviser has contractually agreed to limit the Fund’s expenses, although this limit did not apply because the Fund’s total expenses were already below the applicable fee limit.
· For Janus Henderson Growth and Income Fund, the Trustees noted that, although the Fund’s total expenses exceeded the peer group for certain share classes, overall the Fund’s total expenses were reasonable. The Trustees also noted that the Adviser has contractually agreed to limit the Fund’s expenses, although this limit did not apply because the Fund’s total expenses were already below the applicable fee limit.
· For Janus Henderson Research Fund, the Trustees noted that, although the Fund’s total expenses exceeded the peer group for one share class, overall the Fund’s total expenses were reasonable. The Trustees also noted that the Adviser has contractually agreed to limit the Fund’s expenses, although this limit did not apply because the Fund’s total expenses were already below the applicable fee limit.
· For Janus Henderson Triton Fund, the Trustees noted that the Fund’s total expenses were below the peer group for all share classes.
· For Janus Henderson Venture Fund, the Trustees noted that the Fund’s total expenses were below the peer group for all share classes.
Quantitative Equity Funds
· For Janus Henderson Emerging Markets Managed Volatility Fund, the Trustees noted that, although the Fund’s total expenses exceeded the peer group for certain share classes, overall the Fund’s total expenses were reasonable. The Trustees also noted that the Adviser has contractually agreed to limit the Fund’s expenses.
· For Janus Henderson Global Income Managed Volatility Fund, the Trustees noted that the Fund’s total expenses were below the peer group for all share classes.
· For Janus Henderson International Managed Volatility Fund, the Trustees noted that, although the Fund’s total expenses exceeded the peer group for certain share classes, overall the Fund’s total expenses were reasonable. The Trustees also noted that the Adviser has contractually agreed to limit the Fund’s expenses.
· For Janus Henderson U.S. Managed Volatility Fund, the Trustees noted that, although the Fund’s total expenses exceeded the peer group for certain share classes, overall the Fund’s total expenses were reasonable. The Trustees also noted that the Adviser has contractually agreed to limit the Fund’s expenses, although this limit did not apply because the Fund’s total expenses were already below the applicable fee limit.
U.S. Equity Funds
· For Janus Henderson Mid Cap Value Fund, the Trustees noted that, although the Fund’s total expenses exceeded the peer group average for certain share classes, overall the Fund’s total expenses were reasonable. The Trustees also noted that the Adviser has contractually agreed to limit the Fund’s expenses, although this limit did not apply because the Fund’s total expenses were already below the applicable fee limit.
· For Janus Henderson Small Cap Value Fund, the Trustees noted that, although the Fund’s total expenses exceeded the peer group average for certain share classes, overall the Fund’s total expenses were reasonable. The Trustees also noted that the Adviser has contractually agreed to limit the Fund’s expenses, although this limit did not apply because the Fund’s total expenses were already below the applicable fee limit.
· For Janus Henderson Small-Mid Cap Value Fund, the Trustees noted that, although the Fund’s total expenses exceeded the peer group average for certain share classes, overall the Fund’s total expenses were reasonable. The Trustees also noted that the Adviser has contractually agreed to limit the Fund’s expenses.
The Trustees reviewed information on the overall profitability to the Adviser and its affiliates from their relationships with the Janus Henderson Funds, and considered profitability data of other publicly traded mutual fund advisers. The Trustees recognized that profitability comparisons among fund managers are difficult because of the variation in the type of comparative information that is publicly available, and the profitability of any fund manager is affected by
Janus Henderson Short Duration Flexible Bond Fund
Additional Information (unaudited)
numerous factors, including the organizational structure of the particular fund manager, differences in complex size, difference in product mix, difference in types of business (mutual fund, institutional and other), differences in the types of funds and other accounts it manages, possible other lines of business, the methodology for allocating expenses and the fund manager’s capital structure and cost of capital.
Additionally, the Trustees considered the estimated profitability to the Adviser from the investment management services it provided to each Janus Henderson Fund. In their review, the Trustees considered whether the Adviser and subadviser receive adequate incentives and resources to manage the Janus Henderson Funds effectively. In reviewing profitability, the Trustees noted that the estimated profitability for an individual Janus Henderson Fund is necessarily a product of the allocation methodology utilized by the Adviser to allocate its expenses as part of the estimated profitability calculation. In this regard, the Trustees noted that the independent fee consultant found that (1) the expense allocation methodology and rationales utilized by the Adviser were reasonable and (2) no clear correlation exists between expense allocations and operating margins. The Trustees also considered that the estimated profitability for an individual Janus Henderson Fund was influenced by a number of factors, including not only the allocation methodology selected, but also the presence of fee waivers and expense caps, and whether the Janus Henderson Fund’s investment management agreement contained breakpoints or a performance fee component. The Trustees determined, after taking into account these factors, among others, that the Adviser’s estimated profitability with respect to each Janus Henderson Fund was not unreasonable in relation to the services provided, and that the variation in the range of such estimated profitability among the Janus Henderson Funds was not a material factor in the Board’s approval of the reasonableness of any Janus Henderson Fund’s investment management fees.
The Trustees concluded that the management fees payable by each Janus Henderson Fund to the Adviser and its affiliates, as well as the fees paid by the Adviser to the subadviser of subadvised Janus Henderson Funds, were reasonable in relation to the nature, extent, and quality of the services provided, taking into account the fees charged by other advisers for managing comparable mutual funds with similar strategies, the fees the Adviser and the subadviser charge to other clients, and, as applicable, the impact of fund performance on management fees payable by the Janus Henderson Funds. The Trustees also concluded that each Janus Henderson Fund’s total expenses were reasonable, taking into account the size of the Janus Henderson Fund, the quality of services provided by the Adviser and subadviser, the investment performance of the Janus Henderson Fund, and any expense limitations agreed to or provided by the Adviser.
Economies of Scale
The Trustees considered information about the potential for the Adviser to realize economies of scale as the assets of the Janus Henderson Funds increase. They noted that their independent fee consultant published a report to the Trustees in November 2019 which provided its research and analysis into economies of scale. They also noted that, although many Janus Henderson Funds pay advisory fees at a fixed base rate as a percentage of net assets, without any breakpoints or performance fees, their independent fee consultant concluded that 75% of these Janus Henderson Funds’ have contractual management fees (gross of waivers) below their Broadridge Expense Group averages. The Trustees also noted the following: (1) that for those Janus Henderson Funds whose expenses are being reduced by the contractual expense limitations of the Adviser, the Adviser is subsidizing certain of these Janus Henderson Funds because they have not reached adequate scale; (2) performance fee structures have been implemented for various Janus Henderson Funds that have caused the effective rate of advisory fees payable by such Janus Henderson Fund to vary depending on the investment performance of the Janus Henderson Fund relative to its benchmark index over the measurement period; and (3) a few Janus Henderson Funds have fee schedules with breakpoints and reduced fee rates above certain asset levels. The Trustees also noted that the Janus Henderson Funds share directly in economies of scale through the significant investments made by the Adviser and its affiliates related to services provided to the Funds and the lower charges of third-party service providers that are based in part on the combined scale of all of the Janus Henderson Funds.
The Trustees also considered the independent fee consultant’s conclusion that, given the limitations of various analytical approaches to economies of scale and their conflicting results, it is difficult to analytically confirm or deny the existence of economies of scale in the Janus Henderson complex. In this regard, the independent consultant concluded that (1) to the extent there were economies of scale at the Adviser, the Adviser’s general strategy of setting fixed management fees below peers appeared to share any such economies with investors even on smaller Janus Henderson Funds which have not yet achieved those economies and (2) by setting lower fixed fees from the start on these Janus Henderson Funds, the Adviser appeared to be investing to increase the likelihood that these Janus
Janus Henderson Short Duration Flexible Bond Fund
Additional Information (unaudited)
Henderson Funds will grow to a level to achieve any economies of scale that may exist. Further, the independent fee consultant provided its belief that Janus Henderson Fund investors are well-served by the fee levels and performance fee structures in place on the Janus Henderson Funds in light of any economies of scale that may be present at the Adviser.
Based on all of the information reviewed, including the recent and past research and analysis conducted by the Trustees’ independent fee consultant, the Trustees concluded that the current fee structure of each Janus Henderson Fund was reasonable and that the current rates of fees do reflect a sharing between the Adviser and the Janus Henderson Fund of any economies of scale that may be present at the current asset level of the Janus Henderson Fund.
Other Benefits to the Adviser
The Trustees also considered benefits that accrue to the Adviser and its affiliates and subadviser to the Janus Henderson Funds from their relationships with the Janus Henderson Funds. They recognized that two affiliates of the Adviser separately serve the Janus Henderson Funds as transfer agent and distributor, respectively, and the transfer agent receives compensation directly from the non-money market funds for services provided, and that such compensation contributes to the overall profitability of the Adviser and its affiliates that results from their relationship with the Janus Henderson Funds. The Trustees also considered the Adviser’s past and proposed use of commissions paid by the Janus Henderson Funds on portfolio brokerage transactions to obtain proprietary and third-party research products and services benefiting the Janus Henderson Fund and/or other clients of the Adviser and/or the Adviser, and/or subadviser to a Janus Henderson Fund. The Trustees concluded that the Adviser’s and the subadviser’s use of these types of client commission arrangements to obtain proprietary and third-party research products and services was consistent with regulatory requirements and guidelines and was likely to benefit each Janus Henderson Fund. The Trustees also concluded that, other than the services provided by the Adviser and its affiliates and subadviser pursuant to the agreements and the fees to be paid by each Janus Henderson Fund therefor, the Janus Henderson Funds and the Adviser and the subadviser may potentially benefit from their relationship with each other in other ways. They concluded that the Adviser and its affiliates share directly in economies of scale through the lower charges of third-party service providers that are based in part on the combined scale of the Janus Henderson Funds and other clients serviced by the Adviser and its affiliates. They also concluded that the Adviser and the subadviser benefit from the receipt of research products and services acquired through commissions paid on portfolio transactions of the Janus Henderson Funds and that the Janus Henderson Funds benefit from the Adviser’s and/or the subadviser’s receipt of those products and services as well as research products and services acquired through commissions paid by other clients of the Adviser and/or other clients of the subadviser. They further concluded that the success of any Janus Henderson Fund could attract other business to the Adviser, the subadviser or other Janus Henderson funds, and that the success of the Adviser and the subadviser could enhance the Adviser’s and the subadviser’s ability to serve the Janus Henderson Funds.
Janus Henderson Short Duration Flexible Bond Fund
Liquidity Risk Management Program (unaudited)
Liquidity Risk Management Program
Rule 22e-4 under the Investment Company Act of 1940, as amended (the “Liquidity Rule”), requires open-end funds (but not money market funds) to adopt and implement a written liquidity risk management program (the “LRMP”) that is reasonably designed to assess and manage liquidity risk, which is the risk that a fund could not meet redemption requests without significant dilution of remaining investors’ interest in the fund. The Fund has implemented a LRMP, which incorporates the following elements: (i) assessment, management, and periodic review of liquidity risk; (ii) classification of portfolio holdings; (iii) the establishment and monitoring of a highly liquid investment minimum, as applicable; (iv) a 15% limitation on a Fund’s illiquid investments; (v) redemptions in-kind; and (vi) board oversight.
The Trustees of the Fund (the “Trustees”) have designated Janus Henderson Investors US LLC, the Fund’s investment adviser (the “Adviser”), as the Program Administrator for the LRMP responsible for administering the LRMP and carrying out the specific responsibilities of the LRMP. A working group comprised of various teams within the Adviser’s business is responsible for administering the LRMP and carrying out the specific responsibilities of different aspects of the LRMP (the “Liquidity Risk Working Group”). In assessing each Fund’s liquidity risk, the Liquidity Risk Working Group periodically considers, as relevant, factors including (i) the liquidity of a Fund’s portfolio investments during normal and reasonably foreseeable stressed conditions; (ii) whether a Fund’s investment strategy is appropriate for an open-end fund; (iii) the extent to which a Fund’s strategy involves a relatively concentrated portfolio or large positions in any issuer; (iv) a Fund’s use of borrowing for investment purposes; and (v) a Fund’s use of derivatives.
The Liquidity Rule requires the Trustees to review at least annually a written report provided by the Program Administrator that addresses the operation of the LRMP and assesses its adequacy and the effectiveness of its implementation, including, if applicable, the operation of the highly liquid investment minimum, and any material changes to the LRMP (the “Program Administrator Report”). At a meeting held on March 16, 2022, the Adviser provided the Program Administrator Report to the Trustees which covered the operation of the LRMP from January 1, 2021 through December 31, 2021 (the “Reporting Period”).
The Program Administrator Report discussed the operation and effectiveness of the LRMP during the Reporting Period. It noted that the Fund was able to meet redemptions during the normal course of business during the Reporting Period. The Program Administrator Report also stated that the Fund did not exceed the 15% limit on illiquid assets during the Reporting Period, that the Fund held primarily highly liquid assets, and was considered to be a primarily highly liquid fund during the Reporting Period. In addition, the Adviser expressed its belief in the Program Administrator Report that the LRMP is reasonably designed and adequate to assess and manage the Fund’s liquidity risk, considering the Fund’s particular risks and circumstances, and includes policies and procedures reasonably designed to implement each required component of the Liquidity Rule.
There can be no assurance that the LRMP will achieve its objectives in the future. Please refer to your Fund’s prospectus for more information regarding the risks to which an investment in the Fund may be subject.
Janus Henderson Short Duration Flexible Bond Fund
Useful Information About Your Fund Report (unaudited)
Management Commentary
The Management Commentary in this report includes valuable insight as well as statistical information to help you understand how your Fund’s performance and characteristics stack up against those of comparable indices.
If the Fund invests in foreign securities, this report may include information about country exposure. Country exposure is based primarily on the country of risk. A company may be allocated to a country based on other factors such as location of the company’s principal office, the location of the principal trading market for the company’s securities, or the country where a majority of the company’s revenues are derived.
Please keep in mind that the opinions expressed in the Management Commentary are just that: opinions. They are a reflection based on best judgment at the time this report was compiled, which was June 30, 2022. As the investing environment changes, so could opinions. These views are unique and are not necessarily shared by fellow employees or by Janus Henderson in general.
Performance Overviews
Performance overview graphs compare the performance of a hypothetical $10,000 investment in the Fund with one or more widely used market indices. When comparing the performance of the Fund with an index, keep in mind that market indices are not available for investment and do not reflect deduction of expenses.
Average annual total returns are quoted for a Fund with more than one year of performance history. Average annual total return is calculated by taking the growth or decline in value of an investment over a period of time, including reinvestment of dividends and distributions, then calculating the annual compounded percentage rate that would have produced the same result had the rate of growth been constant throughout the period. Average annual total return does not reflect the deduction of taxes that a shareholder would pay on Fund distributions or redemptions of Fund shares.
Cumulative total returns are quoted for a Fund with less than one year of performance history. Cumulative total return is the growth or decline in value of an investment over time, independent of the period of time involved. Cumulative total return does not reflect the deduction of taxes that a shareholder would pay on Fund distributions or redemptions of Fund shares.
Pursuant to federal securities rules, expense ratios shown in the performance chart reflect subsidized (if applicable) and unsubsidized ratios. The total annual fund operating expenses ratio is gross of any fee waivers, reflecting the Fund’s unsubsidized expense ratio. The net annual fund operating expenses ratio (if applicable) includes contractual waivers of the Adviser and reflects the Fund’s subsidized expense ratio. Ratios may be higher or lower than those shown in the “Financial Highlights” in this report.
Schedule of Investments
Following the performance overview section is the Fund’s Schedule of Investments. This schedule reports the types of securities held in the Fund on the last day of the reporting period. Securities are usually listed by type (common stock, corporate bonds, U.S. Government obligations, etc.) and by industry classification (banking, communications, insurance, etc.). Holdings are subject to change without notice.
The value of each security is quoted as of the last day of the reporting period. The value of securities denominated in foreign currencies is converted into U.S. dollars.
If the Fund invests in foreign securities, it will also provide a summary of investments by country. This summary reports the Fund exposure to different countries by providing the percentage of securities invested in each country. The country of each security represents the country of risk. The Fund’s Schedule of Investments relies upon the industry group and country classifications published by Bloomberg and/or MSCI Inc.
Tables listing details of individual forward currency contracts, futures, written options, swaptions, and swaps follow the Fund’s Schedule of Investments (if applicable).
Statement of Assets and Liabilities
This statement is often referred to as the “balance sheet.” It lists the assets and liabilities of the Fund on the last day of the reporting period.
Janus Henderson Short Duration Flexible Bond Fund
Useful Information About Your Fund Report (unaudited)
The Fund’s assets are calculated by adding the value of the securities owned, the receivable for securities sold but not yet settled, the receivable for dividends declared but not yet received on securities owned, and the receivable for Fund shares sold to investors but not yet settled. The Fund’s liabilities include payables for securities purchased but not yet settled, Fund shares redeemed but not yet paid, and expenses owed but not yet paid. Additionally, there may be other assets and liabilities such as unrealized gain or loss on forward currency contracts.
The section entitled “Net Assets Consist of” breaks down the components of the Fund’s net assets. Because the Fund must distribute substantially all earnings, you will notice that a significant portion of net assets is shareholder capital.
The last section of this statement reports the net asset value (“NAV”) per share on the last day of the reporting period. The NAV is calculated by dividing the Fund’s net assets for each share class (assets minus liabilities) by the number of shares outstanding.
Statement of Operations
This statement details the Fund’s income, expenses, realized gains and losses on securities and currency transactions, and changes in unrealized appreciation or depreciation of Fund holdings.
The first section in this statement, entitled “Investment Income,” reports the dividends earned from securities and interest earned from interest-bearing securities in the Fund.
The next section reports the expenses incurred by the Fund, including the advisory fee paid to the investment adviser, transfer agent fees and expenses, and printing and postage for mailing statements, financial reports and prospectuses. Expense offsets and expense reimbursements, if any, are also shown.
The last section lists the amounts of realized gains or losses from investment and foreign currency transactions, and changes in unrealized appreciation or depreciation of investments and foreign currency-denominated assets and liabilities. The Fund will realize a gain (or loss) when it sells its position in a particular security. A change in unrealized gain (or loss) refers to the change in net appreciation or depreciation of the Fund during the reporting period. “Net Realized and Unrealized Gain/(Loss) on Investments” is affected both by changes in the market value of Fund holdings and by gains (or losses) realized during the reporting period.
Statements of Changes in Net Assets
These statements report the increase or decrease in the Fund’s net assets during the reporting period. Changes in the Fund’s net assets are attributable to investment operations, dividends and distributions to investors, and capital share transactions. This is important to investors because it shows exactly what caused the Fund’s net asset size to change during the period.
The first section summarizes the information from the Statement of Operations regarding changes in net assets due to the Fund’s investment operations. The Fund’s net assets may also change as a result of dividend and capital gains distributions to investors. If investors receive their dividends and/or distributions in cash, money is taken out of the Fund to pay the dividend and/or distribution. If investors reinvest their dividends and/or distributions, the Fund’s net assets will not be affected.
The reinvestment of dividends and distributions is included under “Capital Share Transactions.” “Capital Shares” refers to the money investors contribute to the Fund through purchases or withdrawals via redemptions. The Fund’s net assets will increase and decrease in value as investors purchase and redeem shares from the Fund.
Financial Highlights
This schedule provides a per-share breakdown of the components that affect the Fund’s NAV for current and past reporting periods as well as total return, asset size, ratios, and portfolio turnover rate.
The first line in the table reflects the NAV per share at the beginning of the reporting period. The next line reports the net investment income/(loss) per share. Following is the per share total of net gains/(losses), realized and unrealized. Per share dividends and distributions to investors are then subtracted to arrive at the NAV per share at the end of the period. The next line reflects the total return for the period. The total return may include adjustments in accordance with generally accepted accounting principles required at the period end for financial reporting purposes. As a result, the total return may differ from the total return reflected for individual shareholder transactions. Also included are ratios of expenses and net investment income to average net assets.
Janus Henderson Short Duration Flexible Bond Fund
Useful Information About Your Fund Report (unaudited)
The Fund’s expenses may be reduced through expense offsets and expense reimbursements. The ratios shown reflect expenses before and after any such offsets and reimbursements.
The ratio of net investment income/(loss) summarizes the income earned less expenses, divided by the average net assets of the Fund during the reporting period. Do not confuse this ratio with the Fund’s yield. The net investment income ratio is not a true measure of the Fund’s yield because it does not take into account the dividends distributed to the Fund’s investors.
The next figure is the portfolio turnover rate, which measures the buying and selling activity in the Fund. Portfolio turnover is affected by market conditions, changes in the asset size of the Fund, fluctuating volume of shareholder purchase and redemption orders, the nature of the Fund’s investments, and the investment style and/or outlook of the portfolio manager(s) and/or investment personnel. A 100% rate implies that an amount equal to the value of the entire portfolio was replaced once during the fiscal year; a 50% rate means that an amount equal to the value of half the portfolio is traded in a year; and a 200% rate means that an amount equal to the value of the entire portfolio is traded every six months.
Janus Henderson Short Duration Flexible Bond Fund
Designation Requirements (unaudited)
For federal income tax purposes, the Fund designated the following for the year ended June 30, 2022:
| | |
| | |
Section 163(j) Interest Dividend | 83% |
Janus Henderson Short Duration Flexible Bond Fund
Trustees and Officers (unaudited)
The following are the Trustees and officers of the Trust, together with a brief description of their principal occupations during the last five years (principal occupations for certain Trustees may include periods over five years). The Fund’s Statement of Additional Information includes additional information about the Trustees and officers and is available, without charge, by calling 1-877-335-2687.
Each Trustee has served in that capacity since he or she was originally elected or appointed. The Trustees do not serve a specified term of office. Each Trustee will hold office until the termination of the Trust or his or her earlier death, resignation, retirement, incapacity, or removal. Under the Fund’s Governance Procedures and Guidelines, the policy is for Trustees to retire no later than the end of the calendar year in which the Trustee turns 75. The Trustees review the Fund’s Governance Procedures and Guidelines from time to time and may make changes they deem appropriate. The Fund’s Nominating and Governance Committee will consider nominees for the position of Trustee recommended by shareholders. Shareholders may submit the name of a candidate for consideration by the Committee by submitting their recommendations to the Trust’s Secretary. Each Trustee is currently a Trustee of one other registered investment company advised by the Adviser: Janus Aspen Series. Collectively, these two registered investment companies consist of 50 series or funds referred to herein as the Fund Complex.
The Trust’s officers are elected annually by the Trustees for a one-year term. Certain officers also serve as officers of Janus Aspen Series. Certain officers of the Fund may also be officers and/or directors of the Adviser. Except as otherwise disclosed, Fund officers receive no compensation from the Fund, except for the Fund’s Chief Compliance Officer, as authorized by the Trustees.
| | | | | | |
TRUSTEES |
Name, Address, and Age | Positions Held with the Trust | Length of Time Served | Principal Occupations During the Past Five Years | Number of Portfolios/Funds in Fund Complex Overseen by Trustee | Other Directorships Held by Trustee During the Past Five Years |
Independent Trustees | | | | |
Alan A. Brown
151 Detroit Street
Denver, CO 80206
DOB: 1962 | Chairman
Trustee | 5/22-Present
1/13-Present | Principal, Curam Holdings LLC (since 2018). Formerly, Executive Vice President, Institutional Markets, of Black Creek Group (private equity real estate investment management firm) (2012-2018), Executive Vice President and Co-Head, Global Private Client Group (2007-2010), Executive Vice President, Mutual Funds (2005-2007), and Chief Marketing Officer (2001-2005) of Nuveen Investments, Inc. (asset management). | 50 | Advisory Board Member of AEW Core Property Trust (open-end property fund) (since 2020), and Director of WTTW (PBS affiliate) (since 2003). Formerly, Director of MotiveQuest LLC (strategic social market research company) (2003-2016), Director of Nuveen Global Investors LLC (2007-2011), Director of Communities in Schools (2004-2010), and Director of Mutual Fund Education Alliance (until 2010). |
Janus Henderson Short Duration Flexible Bond Fund
Trustees and Officers (unaudited)
| | | | | | |
TRUSTEES |
Name, Address, and Age | Positions Held with the Trust | Length of Time Served | Principal Occupations During the Past Five Years | Number of Portfolios/Funds in Fund Complex Overseen by Trustee | Other Directorships Held by Trustee During the Past Five Years |
Independent Trustees | | | | |
Cheryl D. Alston
151 Detroit Street
Denver, CO 80206
DOB: 1966 | Trustee | 8/22-Present | Executive Director and Chief Investment Officer, Employees’ Retirement Fund of the City of Dallas (since 2004). | 50 | Director of Blue Cross Blue Shield of Kansas City (a not-for-profit health insurance provider) (since 2016) and Director of Global Life Insurance (life and supplemental health insurance provider) (since 2017). Formerly, Director of Federal Home Loan Bank of Dallas (2017-2021). |
Janus Henderson Short Duration Flexible Bond Fund
Trustees and Officers (unaudited)
| | | | | | |
TRUSTEES |
Name, Address, and Age | Positions Held with the Trust | Length of Time Served | Principal Occupations During the Past Five Years | Number of Portfolios/Funds in Fund Complex Overseen by Trustee | Other Directorships Held by Trustee During the Past Five Years |
Independent Trustees | | | | |
William D. Cvengros
151 Detroit Street
Denver, CO 80206
DOB: 1948 | Trustee | 1/11-Present | Chief Executive Officer of SJC Capital, LLC (a personal investment company and consulting firm) (since 2002). Formerly, Chief Executive Officer and President of PIMCO Advisors Holdings L.P. (a publicly traded investment management firm) (1994-2000), and Chief Investment Officer (1987-1994) and Vice Chairman and Director (1990-1994) of Pacific Life Insurance Company (a mutual life insurance and annuity company) (1987-1994). | 50 | Member, Limited Partner Advisory Committee, Karmel Capital Fund III (later stage growth fund) (since 2022), Member of the Investment Committee for the Orange County Community Foundation (a grantmaking foundation) (since 2020), Advisory Board Member, RevOZ Fund LP and related funds (real estate investments for opportunity zones) (since 2020), and Advisory Board Member, Innovate Partners Emerging Growth and Equity Fund I (early stage venture capital fund) (since 2014). Formerly, Managing Trustee of National Retirement Partners Liquidating Trust (2013-2016), Chairman, National Retirement Partners, Inc. (formerly a network of advisors to 401(k) plans) (2005-2013), Director of Prospect Acquisition Corp. (a special purpose acquisition corporation) (2007-2009), Director of RemedyTemp, Inc. (temporary help services company) (1996-2006), and Trustee of PIMCO Funds Multi-Manager Series (1990-2000) and Pacific Life Variable Life & Annuity Trusts (1987-1994). |
Janus Henderson Short Duration Flexible Bond Fund
Trustees and Officers (unaudited)
| | | | | | |
TRUSTEES |
Name, Address, and Age | Positions Held with the Trust | Length of Time Served | Principal Occupations During the Past Five Years | Number of Portfolios/Funds in Fund Complex Overseen by Trustee | Other Directorships Held by Trustee During the Past Five Years |
Independent Trustees | | | | |
Raudline Etienne
151 Detroit Street
Denver, CO 80206
DOB: 1965 | Trustee | 6/16-Present | Founder, Daraja Capital (advisory and investment firm) (since 2016). Formerly, Senior Vice President and Senior Advisor, Albright Stonebridge Group LLC (global strategy firm) (2011-2021), and Deputy Comptroller and Chief Investment Officer, New York State Common Retirement Fund (public pension fund) (2008-2011). | 50 | Member of the Investment Committee for Cooper Union (private college) (since 2021), Board Member, Van Alen Institute (nonprofit architectural and design organization) (since 2019) and Director of Brightwood Capital Advisors, LLC (since 2014). |
Darrell B. Jackson
151 Detroit Street
Denver, CO 80206
DOB: 1958 | Trustee | 8/22-Present | President and Chief Executive Officer, The Efficace Group Inc. (since 2018). Formerly, President and Chief Executive Officer, Seaway Bank and Trust Company (community bank) (2014-2015), and Executive Vice President and Co-President, Wealth Management (2009-2014), and several senior positions, including Group Executive, Senior Vice President, and Vice President (1995-2009) of Northern Trust Company (financial services company) (1995-2014). | 50 | Director of Amalgamated Financial Corp (bank) (since August 2021), Director of YR Media (a not-for-profit production company) (since 2021), and Director of Gray-Bowen-Scott (transportation project consulting firm) (since April 2020). Formerly, Director of Delaware Place Bank (closely held commercial bank) (2016-2018) and Director of Seaway Bank and Trust Company (2014-2015). |
Janus Henderson Short Duration Flexible Bond Fund
Trustees and Officers (unaudited)
| | | | | | |
TRUSTEES |
Name, Address, and Age | Positions Held with the Trust | Length of Time Served | Principal Occupations During the Past Five Years | Number of Portfolios/Funds in Fund Complex Overseen by Trustee | Other Directorships Held by Trustee During the Past Five Years |
Independent Trustees | | | | |
William F. McCalpin
151 Detroit Street
Denver, CO 80206
DOB: 1957 | Trustee | 6/02-Present | Chief Executive Officer, muun chi LLC (organic food business) (since 2022). Formerly, Chief Operating Officer, muun chi LLC (2020-2022), Managing Partner, Impact Investments, Athena Capital Advisors LLC (independent registered investment advisor) (2016-2019), Managing Director, Holos Consulting LLC (provides consulting services to foundations and other nonprofit organizations) (2009-2016), Chief Executive Officer, Imprint Capital Advisors (impact investment firm) (2013-2015), and Executive Vice President and Chief Operating Officer of The Rockefeller Brothers Fund (a private family foundation) (1998-2006). | 50 | Chairman of the Board and Trustee of The Investment Fund for Foundations Investment Program (TIP) (consisting of 1 fund) (since 2008) and Director of the F.B. Heron Foundation (a private grantmaking foundation) (since 2006). Formerly, Director of Mutual Fund Directors Forum (a non-profit organization serving independent directors of U.S. mutual funds) (2016-2021). |
Janus Henderson Short Duration Flexible Bond Fund
Trustees and Officers (unaudited)
| | | | | | |
TRUSTEES |
Name, Address, and Age | Positions Held with the Trust | Length of Time Served | Principal Occupations During the Past Five Years | Number of Portfolios/Funds in Fund Complex Overseen by Trustee | Other Directorships Held by Trustee During the Past Five Years |
Independent Trustees | | | | |
Gary A. Poliner
151 Detroit Street
Denver, CO 80206
DOB: 1953 | Trustee | 6/16-Present | Retired. Formerly, President (2010-2013) of Northwestern Mutual Life Insurance Company. | 50 | Director of MGIC Investment Corporation (private mortgage insurance) (since 2013). Formerly, Director, West Bend Mutual Insurance Company (property/casualty insurance) (2013-2021), Trustee of Northwestern Mutual Life Insurance Company (2010-2013) and Director of Frank Russell Company (global asset management firm) (2008-2013). |
Diane L. Wallace
151 Detroit Street
Denver, CO 80206
DOB: 1958 | Trustee | 6/17-Present | Retired. Formerly, Chief Operating Officer, Senior Vice President-Operations, and Chief Financial Officer for Driehaus Capital Management, LLC (1988-2006) and Treasurer for Driehaus Mutual Funds (1996-2002). | 50 | Formerly, Director of Family Service of Lake County (2019-2021), Independent Trustee, Henderson Global Funds (13 portfolios) (2015-2017), Independent Trustee, State Farm Associates’ Funds Trust, State Farm Mutual Fund Trust, and State Farm Variable Product Trust (28 portfolios) (2013-2017).
|
Janus Henderson Short Duration Flexible Bond Fund
Trustees and Officers (unaudited)
| | | | | | |
TRUSTEES |
Name, Address, and Age | Positions Held with the Trust | Length of Time Served | Principal Occupations During the Past Five Years | Number of Portfolios/Funds in Fund Complex Overseen by Trustee | Other Directorships Held by Trustee During the Past Five Years |
Independent Trustees | | | | |
Linda S. Wolf
151 Detroit Street
Denver, CO 80206
DOB: 1947 | Trustee | 11/05-Present | Retired. Formerly, Chairman and Chief Executive Officer of Leo Burnett (Worldwide) (advertising agency) (2001-2005). | 50 | Director of Chicago Community Trust (Regional Community Foundation), Lurie Children’s Hospital (Chicago, IL), and Shirley Ryan Ability Lab. Formerly, Director of Wrapports, LLC (until 2022), Director of Chicago Council on Global Affairs (until 2019), InnerWorkings (until 2019) and Director of Walmart (until 2017). |
Janus Henderson Short Duration Flexible Bond Fund
Trustees and Officers (unaudited)
| | | | |
OFFICERS |
Name, Address, and Age | Positions Held with the Trust | Term of Office* and Length of Time Served | Principal Occupations During the Past Five Years |
Michael Keough
151 Detroit Street
Denver, CO 80206
DOB: 1978 | Executive Vice President and Co-Portfolio Manager
Janus Henderson Short Duration Flexible Bond Fund | 12/19-Present | Portfolio Manager for other Janus Henderson accounts. |
Seth Meyer
151 Detroit Street
Denver, CO 80206
DOB: 1976 | Executive Vice President and Co-Portfolio Manager
Janus Henderson Short Duration Flexible Bond Fund | 12/19-Present
| Portfolio Manager for other Janus Henderson accounts. |
Greg Wilensky
151 Detroit Street
Denver, CO 80206
DOB: 1967 | Executive Vice President and Co-Portfolio Manager
Janus Henderson Short Duration Flexible Bond Fund | 2/20-Present | Head of U.S. Fixed Income of Janus Henderson Investors and Portfolio Manager for other Janus Henderson accounts. Formerly, Director and Lead Portfolio Manager of the U.S. Multi-Sector Fixed Income team at AllianceBernstein (2007-2019). |
Michelle Rosenberg
151 Detroit Street
Denver, CO 80206
DOB: 1973 | Interim President and Chief Executive Officer | 1/22-Present | General Counsel and Corporate Secretary of Janus Henderson Investors (since 2018). Formerly, Senior Vice President and Head of Legal, North America of Janus Henderson Investors (2017-2018) and Deputy General Counsel of Janus Henderson US (Holdings) Inc. (2015-2018). |
Janus Henderson Short Duration Flexible Bond Fund
Trustees and Officers (unaudited)
| | | | |
OFFICERS |
Name, Address, and Age | Positions Held with the Trust | Term of Office* and Length of Time Served | Principal Occupations During the Past Five Years |
Kristin Mariani
151 Detroit Street
Denver, CO 80206
DOB: 1966 | Vice President, Chief Compliance Officer, and Anti-Money Laundering Officer | 7/20-Present | Head of Compliance, North America for Janus Henderson Investors (since September 2020) and Chief Compliance Officer for Janus Henderson Investors US LLC (since September 2017). Formerly, Global Head of Investment Management Compliance for Janus Henderson Investors (February 2019-August 2020), Vice President, Head of Global Distribution Compliance and Chief Compliance Officer of Janus Henderson Distributors US LLC (May 2017-September 2017), Vice President, Compliance at Janus Henderson US (Holdings) Inc., Janus Henderson Investors US LLC, and Janus Henderson Distributors US LLC (2009-2017). |
Jesper Nergaard
151 Detroit Street
Denver, CO 80206
DOB: 1962 | Chief Financial Officer
Vice President, Treasurer, and Principal Accounting Officer | 3/05-Present
2/05-Present | Head of U.S. Fund Administration, Janus Henderson Investors and Janus Henderson Services US LLC. |
Abigail J. Murray
151 Detroit Street
Denver, CO 80206
DOB: 1975 | Vice President, Chief Legal Officer, and Secretary | 12/20-Present | Managing Counsel (2020-present). Formerly, Senior Counsel for Invesco Ltd. (2017-2020), and Vice President and Senior Counsel, ALPS Fund Services, Inc. and Assistant General Counsel, ALPS Advisors, Inc. (2015-2017). |
* Officers are elected at least annually by the Trustees for a one-year term and may also be elected from time to time by the Trustees for an interim period. |
Janus Henderson Short Duration Flexible Bond Fund
Notes
NotesPage1
Janus Henderson Short Duration Flexible Bond Fund
Notes
NotesPage2
| | | | | | | | |
| | | | | |

| | | | |
This report is submitted for the general information of shareholders of the Fund. It is not an offer or solicitation for the Fund and is not authorized for distribution to prospective investors unless preceded or accompanied by an effective prospectus. |
Janus Henderson is a trademark of Janus Henderson Group plc or one of its subsidiaries. © Janus Henderson Group plc Janus Henderson Distributors US LLC |
| | | | 125-02-93030 08-22 |
| | | |
| | | |
| | | ANNUAL REPORT June 30, 2022 |
| | |
| | Janus Henderson Small Cap Value Fund |
| | |
| | Janus Investment Fund |
| |
| | | |
| | | HIGHLIGHTS · Portfolio management perspective · Investment strategy behind your fund · Fund performance, characteristics
and holdings |
Table of Contents
Janus Henderson Small Cap Value Fund
Janus Henderson Small Cap Value Fund (unaudited)(closed to certain new investors)
| | | | | | |
FUND SNAPSHOT As defensive value specialists, we look to invest in high-quality companies with strong management teams, stable balance sheets, and durable competitive advantages that are trading at attractive valuations. The Fund seeks capital appreciation. | | | | 
Craig Kempler co-portfolio manager | 
Justin Tugman co-portfolio manager |
| | | |
PERFORMANCE
For the 12-month period ended June 30, 2022, the Janus Henderson Small Cap Value Fund Class I shares returned -13.21%, outperforming its benchmark, the Russell 2000® Value Index, which returned -16.28%.
INVESTMENT ENVIRONMENT
The period commenced with strengthening economic conditions and improving consumer sentiment. Following record stimulus in response to the COVID pandemic, economic growth was strong, asset prices had recovered, and the unemployment rate was trending down steadily. Despite the emergence of new COVID variants during the first half of the period – that slowed the gains in spending and labor market participation – the recovery continued, largely due to ongoing accommodative monetary policy. While COVID persisted as a nagging factor, the focal story of the 12-month period turned out to be the rapid rise of inflation, the Federal Reserve’s (Fed) slow but increasingly aggressive response to taming it, and the prospect of multiple interest rate hikes. Toward the close of 2021, the anticipation of higher interest rates triggered a rotation out of high-beta (beta is a measure of a stock’s volatility relative to that of the market), high-valuation stocks, especially in the small-cap market. This spurred a move into value stocks, which outperformed growth for the period.
Soaring inflation continued into 2022, with the Fed initially communicating that inflation was “transitory” and would abate once supply chain disruptions were alleviated. Market volatility increased in late February after the war in Ukraine led to an upward spike in commodity prices. With each passing month, inflation continued to rise, the anticipated peak did not materialize, and it became increasingly difficult for the Fed’s transitory thesis to hold. Finally, starting in March, the Fed imposed several interest rate hikes, ultimately raising interest rates 150 basis points by period end. The Fed also signaled it may continue this aggressive pace of monetary tightening in the second half of 2022. By the close of the period, there were signs that higher gasoline prices and rising inflation were starting to slow the broader economy, especially the housing and consumer spending markets. Investors scaled back their expectations for economic growth and corporate earnings, as recession fears weighed on stock performance.
PERFORMANCE DISCUSSION
Despite a challenging market environment over the period, we were pleased to see our portfolio provide relative downside preservation for investors, aided by our strong stock selection. This was due in part to our avoidance of lower-quality, high-valuation or unprofitable companies that were especially impacted by the market sell-off in the second half of the period. Our holdings have stronger balance sheets relative to companies in the benchmark, and we believe this attribute may be even more important going forward. We were pleased to see many of our disciplined value investments rewarded for their higher quality and strong fundamentals.
Several stocks in the materials sector were notable contributors to relative results, as higher commodities prices provided a tailwind for their earnings. While various commodity prices retreated toward period end, many remained well above year-ago levels. This strong demand and pricing environment benefited our holdings in leading U.S. rebar producer Commercial Metals, as well as energy company Magnolia Oil & Gas. We have continued to favor disciplined, cost-advantaged commodities producers with strong competitive and pricing power.
Our stock selection in healthcare also aided relative performance. Early in the period, we took advantage of the market volatility to add selectively to our health care exposure, focusing on profitable companies in areas such as contract drug development and health care equipment and services companies working to reduce health care costs and improve patient outcomes.
Janus Henderson Small Cap Value Fund (unaudited)(closed to certain new investors)
Our focus on higher-quality, well-capitalized companies in the energy sector detracted during a period when surging energy stocks far outperformed other sectors of the index. While many of our individual energy stocks performed well, the Fund’s underweight in the sector for much of the period, as well as its lower exposure to natural gas producers, hurt relative returns. Late in the period we added positions in a natural gas producer and a gas utility and ended the period with a sector overweight.
The consumer discretionary sector was another area of weakness, as soaring gasoline and food prices left consumers with less money to spend on dining out or entertainment. The women’s plus-size clothing brand Torrid Holdings was the largest individual detractor over the period. Near-term uncertainty for consumer spending led us to reduce our weighting in consumer discretionary. In information technology, business uncertainty and rising costs pressured Ultra Clean Holdings, a provider of high-purity cleaning services used in semiconductor production. The company missed its earnings target, and the stock declined.
Fund positioning relative to the benchmark changed significantly in late June following the rebalancing of the Russell 2000 Value Index. The portfolio ended the period overweight in industrials, energy and materials. It was underweight financials, real estate, healthcare, consumer discretionary, consumer staples, utilities and communication services. Its weighting in information technology ended the period roughly in line with the index.
OUTLOOK
We caution that the market may see heightened volatility as investors await more clarity on the outlook for inflation, interest rates and economic growth. We have seen some glimmers of improvement on the inflation front with the recent pullback in commodities prices as well as some easing in supply chain pressures. However, the Fed likely will need to raise rates further to get inflation closer to their target. Past Fed efforts to contain inflation have often led to a recession rather than a soft landing. We don’t believe this possibility is reflected in either corporate earnings outlooks or price-to-earnings (P/E) multiples (a measure of share price compared to earnings per share for a stock or stocks in a portfolio), and additional downward revisions may further unsettle the markets. Despite these uncertainties, we believe the Fund is well positioned to perform defensively, due to our focus on reasonably valued companies with strong balance sheets and healthy cash flows. We also seek to use volatility to our advantage as we identify opportunities that fit with our defensive value approach. We remain committed to this approach, which aims to pursue long-term opportunity while managing downside risk.
Thank you for your investment in the Janus Henderson Small Cap Value Fund.
Janus Henderson Small Cap Value Fund (unaudited)(closed to certain new investors)
Fund At A Glance
June 30, 2022
| | | | | | | | | | |
| | | | | | | | | |
| | | | | | | | | |
| | | | | | | | | |
| 5 Top Contributors - Holdings | 5 Top Detractors - Holdings |
| | Average
Weight | | Relative
Contribution | | | Average
Weight | | Relative
Contribution |
| Magnolia Oil & Gas Corp | 1.81% | | 0.70% | | Torrid Holdings Inc | 0.31% | | -0.46% |
| Black Hills Corp | 1.94% | | 0.52% | | ModivCare Inc | 0.86% | | -0.44% |
| Encore Wire Corp | 1.37% | | 0.49% | | Ultra Clean Holdings Inc | 0.55% | | -0.32% |
| Commercial Metals Co | 1.98% | | 0.43% | | Healthcare Services Group Inc | 0.31% | | -0.31% |
| First Horizon National Corp | 1.07% | | 0.42% | | Stoneridge Inc | 0.41% | | -0.30% |
| | | | | | | |
| 5 Top Contributors - Sectors* | | | | | |
| | | Relative | | Fund | Russell 2000 Value Index |
| | | Contribution | | Average Weight | Average Weight |
| Health Care | | 2.09% | | 9.76% | 9.85% |
| Communication Services | | 1.73% | | 0.98% | 3.64% |
| Materials | | 1.02% | | 6.86% | 4.60% |
| Information Technology | | 0.75% | | 8.24% | 5.46% |
| Financials | | 0.67% | | 22.14% | 26.18% |
| | | | | | |
| | | | | | |
| 5 Top Detractors - Sectors* | | | | | |
| | | Relative | | Fund | Russell 2000 Value Index |
| | | Contribution | | Average Weight | Average Weight |
| Energy | | -2.40% | | 5.51% | 7.90% |
| Utilities | | -0.46% | | 2.17% | 5.08% |
| Consumer Discretionary | | -0.37% | | 8.43% | 7.75% |
| Consumer Staples | | -0.18% | | 3.55% | 2.96% |
| Industrials | | -0.06% | | 19.99% | 15.08% |
| | | | | | | |
| Relative contribution reflects how the portolio's holdings impacted return relative to the benchmark. Cash and securities not held in the portfolio are not shown. For equity portfolios, relative contribution compares the performance of a security in the portfolio to the benchmark's total return, factoring in the difference in weight of that security in the benchmark. Returns are calculated using daily returns and previous day ending weights rolled up by ticker, excluding fixed income securities, gross of advisory fees, may exclude certain derivatives and will differ from actual performance.
Performance attribution reflects returns gross of advisory fees and may differ from actual returns as they are based on end of day holdings. Attribution is calculated by geometrically linking daily returns for the portfolio and index. |
* | Based on sector classification according to the Global Industry Classification Standard (“GICS”) codes, which are the exclusive property and a service mark of MSCI Inc. and Standard & Poor’s. |
Janus Henderson Small Cap Value Fund (unaudited)(closed to certain new investors)
Fund At A Glance
June 30, 2022
| | |
5 Largest Equity Holdings - (% of Net Assets) |
Black Hills Corp | |
Multi-Utilities | 3.1% |
Magnolia Oil & Gas Corp | |
Oil, Gas & Consumable Fuels | 2.6% |
First Interstate BancSystem Inc - Class A | |
Banks | 2.5% |
Ameris Bancorp | |
Banks | 2.3% |
Phillips Edison & Co Inc | |
Equity Real Estate Investment Trusts (REITs) | 2.1% |
| | 12.6% |
| | | | | | |
Asset Allocation - (% of Net Assets) | |
Common Stocks | | 97.6% | |
Repurchase Agreements | | 2.3% | |
Other | | 0.1% |
| | | 100.0% |
| | |
Top Country Allocations - Long Positions - (% of Investment Securities) |
As of June 30, 2022 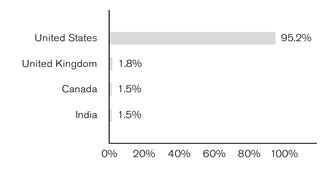
| As of June 30, 2021 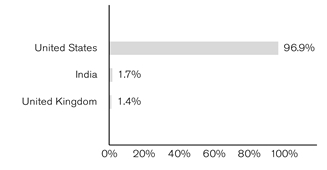
|
Janus Henderson Small Cap Value Fund (unaudited)(closed to certain new investors)
Performance
| |
See important disclosures on the next page. |
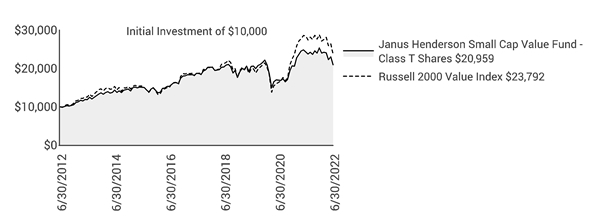
| | | | | | | | | | |
| | | | | | | | |
| | | | | | | | |
Average Annual Total Return - for the periods ended June 30, 2022 | | | Prospectus Expense Ratios |
| | One
Year | Five
Year | Ten
Year | | | Total Annual Fund
Operating Expenses‡ | Net Annual Fund
Operating Expenses‡ |
Class A Shares at NAV(1) | | -13.44% | 2.05% | 7.45% | | | 1.76% | 1.27% |
Class A Shares at MOP(1) | | -18.41% | 0.86% | 6.81% | | | | |
Class C Shares at NAV(1) | | -14.02% | 1.43% | 6.78% | | | 1.79% | 1.79% |
Class C Shares at CDSC(1) | | -14.86% | 1.43% | 6.78% | | | | |
Class D Shares(2) | | -13.24% | 2.37% | 7.77% | | | 0.84% | 0.84% |
Class I Shares(1) | | -13.21% | 2.40% | 7.80% | | | 0.81% | 0.81% |
Class L Shares(2) | | -13.07% | 2.51% | 7.92% | | | 0.88% | 0.88% |
Class N Shares(1) | | -13.09% | 2.53% | 7.94% | | | 0.67% | 0.67% |
Class R Shares(1) | | -13.73% | 1.75% | 7.14% | | | 1.42% | 1.42% |
Class S Shares(1) | | -13.49% | 2.01% | 7.41% | | | 1.18% | 1.18% |
Class T Shares(1) | | -13.29% | 2.28% | 7.68% | | | 0.92% | 0.92% |
Russell 2000 Value Index | | -16.28% | 4.89% | 9.05% | | | | |
Morningstar Quartile - Class T Shares | | 3rd | 4th | 4th | | | | |
Morningstar Ranking - based on total returns for Small Value Funds | | 306/474 | 401/439 | 329/404 | | | | |
Returns quoted are past performance and do not guarantee future results; current performance may be lower or higher. Investment returns and principal value will vary; there may be a gain or loss when shares are sold. For the most recent month-end performance call 800.668.0434 (or 800.525.3713 if you hold shares directly with Janus Henderson) or visit janushenderson.com/performance (or janushenderson.com/allfunds if you hold shares directly with Janus Henderson).
Maximum Offering Price (MOP) returns include the maximum sales charge of 5.75%. Net Asset Value (NAV) returns exclude this charge, which would have reduced returns.
CDSC returns include a 1% contingent deferred sales charge (CDSC) on Shares redeemed within 12 months of purchase. Net Asset Value (NAV) returns exclude this charge, which would have reduced returns.
Class L Shares have a voluntarily agreed administrative fee waiver, which could be changed or terminated at any time.
Janus Henderson Small Cap Value Fund (unaudited)(closed to certain new investors)
Performance
For certain periods, the Fund’s performance may reflect the effect of expense waivers.
This Fund has a performance-based management fee that may adjust up or down based on the Fund’s performance.
Performance may be affected by risks that include those associated with foreign and emerging markets, fixed income securities, high-yield and high-risk securities, undervalued, overlooked and smaller capitalization companies, real estate related securities including Real Estate Investment Trusts (REITs), Environmental, Social and Governance (ESG) factors, non-diversification, portfolio turnover, derivatives, short sales, initial public offerings (IPOs) and potential conflicts of interest. Each product has different risks. Please see the prospectus for more information about risks, holdings and other details.
Returns include reinvestment of all dividends and distributions and do not reflect the deduction of taxes that a shareholder would pay on Fund distributions or redemptions of Fund shares. The returns do not include adjustments in accordance with generally accepted accounting principles required at the period end for financial reporting purposes.
Class A Shares, Class C Shares, Class R Shares and Class S Shares commenced operations on July 6, 2009. Performance shown for each class reflects the performance of the Fund’s Class J Shares (formerly named Investor Shares) for periods prior to July 6, 2009, calculated using the fees and expenses of the corresponding class, without the effect of any fee and expense limitations or waivers.
Class D Shares commenced operations on February 16, 2010, as a result of the restructuring of Class J Shares, the predecessor share class. Performance shown for periods prior to February 16, 2010, reflects the performance of the Fund’s former Class J Shares (formerly named Investor Shares).
Class I Shares commenced operations on July 6, 2009. Performance shown reflects the performance of the Fund’s Class J Shares (formerly named Investor Shares) for periods prior to July 6, 2009, calculated using the fees and expenses of Class J Shares, net of any applicable fee and expense limitations or waivers.
Class N Shares of the Fund commenced operations on May 31, 2012. Performance shown for Class N Shares reflects the performance of the Fund’s Class T Shares from July 6, 2009 to May 31, 2012, calculated using the fees and expenses of Class T Shares, net of any applicable fee and expense limitations or waivers. For periods prior to July 6, 2009, the performance shown for Class N Shares reflects the performance of the Fund’s Class J Shares (formerly named Investor Shares), calculated using the fees and expenses of Class J Shares, net of any applicable fee and expense limitations or waivers.
Class T Shares (formerly named Class J Shares) commenced operations with the Fund’s inception. Performance shown for Class T Shares reflects the fees and expenses of Class T Shares, net of any applicable fee and expense limitations or waivers.
If each share class of the Fund had been available during periods prior to its commencement, the performance shown may have been different. The performance shown for periods following the Fund’s commencement of each share class reflects the fees and expenses of each respective share class, net of any applicable fee and expense limitations or waivers. Please refer to the Fund’s prospectuses for further details concerning historical performance.
Ranking is for the share class shown only; other classes may have different performance characteristics. When an expense waiver is in effect, it may have a material effect on the total return, and therefore the ranking for the period.
© 2022 Morningstar, Inc. All Rights Reserved.
There is no assurance that the investment process will consistently lead to successful investing.
See Notes to Schedule of Investments and Other Information for index definitions.
Index performance does not reflect the expenses of managing a portfolio as an index is unmanaged and not available for direct investment.
See “Useful Information About Your Fund Report.”
‡ As stated in the prospectus. Net expense ratios reflect the expense waivers, if any, contractually agreed to for at least a one-year period commencing on October 28, 2021. See Financial Highlights for actual expense ratios during the reporting period.
(1) Closed to certain new investors.
(2) Closed to new investors.
Janus Henderson Small Cap Value Fund (unaudited)(closed to certain new investors)
Expense Examples
As a shareholder of the Fund, you incur two types of costs: (1) transaction costs, such as sales charges (loads) on purchase payments (applicable to Class A Shares only); and (2) ongoing costs, including management fees; 12b-1 distribution and shareholder servicing fees; transfer agent fees and expenses payable pursuant to the Transfer Agency Agreement; and other Fund expenses. This example is intended to help you understand your ongoing costs (in dollars) of investing in the Fund and to compare these costs with the ongoing costs of investing in other mutual funds. To do so, compare this 5% hypothetical example with the 5% hypothetical examples that appear in the shareholder reports of the other funds. The example is based upon an investment of $1,000 invested at the beginning of the period and held for the six-months indicated, unless noted otherwise in the table and footnotes below.
Actual Expenses
The information in the table under the heading “Actual” provides information about actual account values and actual expenses. You may use the information in these columns, together with the amount you invested, to estimate the expenses that you paid over the period. Simply divide your account value by $1,000 (for example, an $8,600 account value divided by $1,000 = 8.6), then multiply the result by the number in the appropriate column for your share class under the heading entitled “Expenses Paid During Period” to estimate the expenses you paid on your account during the period.
Hypothetical Example for Comparison Purposes
The information in the table under the heading “Hypothetical (5% return before expenses)” provides information about hypothetical account values and hypothetical expenses based upon the Fund’s actual expense ratio and an assumed rate of return of 5% per year before expenses, which is not the Fund’s actual return. The hypothetical account values and expenses may not be used to estimate the actual ending account balance or expenses you paid for the period. You may use this information to compare the ongoing costs of investing in the Fund and other funds. To do so, compare this 5% hypothetical example with the 5% hypothetical examples that appear in the shareholder reports of the other funds. Additionally, for an analysis of the fees associated with an investment in any share class or other similar funds, please visit www.finra.org/fundanalyzer.
Please note that the expenses shown in the table are meant to highlight your ongoing costs only and do not reflect any transaction costs. These fees are fully described in the Fund’s prospectuses. Therefore, the hypothetical examples are useful in comparing ongoing costs only, and will not help you determine the relative total costs of owning different funds. In addition, if these transaction costs were included, your costs would have been higher.
| | | | | | | | | | | |
| | | | | | | | |
| | | Actual | | Hypothetical
(5% return before expenses) | |
| Beginning
Account
Value
(1/1/22) | Ending
Account
Value
(6/30/22) | Expenses
Paid During
Period
(1/1/22 - 6/30/22)† | | Beginning
Account
Value
(1/1/22) | Ending
Account
Value
(6/30/22) | Expenses
Paid During
Period
(1/1/22 - 6/30/22)† | Net Annualized
Expense Ratio
(1/1/22 - 6/30/22) |
Class A Shares | $1,000.00 | $826.50 | $4.53 | | $1,000.00 | $1,019.84 | $5.01 | 1.00% |
Class C Shares | $1,000.00 | $823.30 | $7.46 | | $1,000.00 | $1,016.61 | $8.25 | 1.65% |
Class D Shares | $1,000.00 | $827.30 | $3.31 | | $1,000.00 | $1,021.17 | $3.66 | 0.73% |
Class I Shares | $1,000.00 | $827.30 | $3.26 | | $1,000.00 | $1,021.22 | $3.61 | 0.72% |
Class L Shares | $1,000.00 | $828.00 | $2.67 | | $1,000.00 | $1,021.87 | $2.96 | 0.59% |
Class N Shares | $1,000.00 | $827.90 | $2.63 | | $1,000.00 | $1,021.92 | $2.91 | 0.58% |
Class R Shares | $1,000.00 | $824.70 | $5.97 | | $1,000.00 | $1,018.25 | $6.61 | 1.32% |
Class S Shares | $1,000.00 | $826.20 | $4.84 | | $1,000.00 | $1,019.49 | $5.36 | 1.07% |
Class T Shares | $1,000.00 | $827.10 | $3.71 | | $1,000.00 | $1,020.73 | $4.11 | 0.82% |
† | Expenses Paid During Period are equal to the Net Annualized Expense Ratio multiplied by the average account value over the period, multiplied by 181/365 (to reflect the one-half year period). Expenses in the examples include the effect of applicable fee waivers and/or expense reimbursements, if any. Had such waivers and/or reimbursements not been in effect, your expenses would have been higher. Please refer to the Notes to Financial Statements or the Fund’s prospectuses for more information regarding waivers and/or reimbursements. |
Janus Henderson Small Cap Value Fund
Schedule of Investments
June 30, 2022
| | | | | | | | |
Shares or
Principal Amounts | | | Value | |
Common Stocks– 97.6% | | | |
Aerospace & Defense – 2.0% | | | |
| | BWX Technologies Inc | | 597,822 | | | $32,934,014 | |
| | Spirit AeroSystems Holdings Inc | | 761,955 | | | 22,325,282 | |
| | | 55,259,296 | |
Auto Components – 1.2% | | | |
| | Adient PLC* | | 1,106,931 | | | 32,798,366 | |
Banks – 19.1% | | | |
| | Ameris Bancorp | | 1,550,482 | | | 62,298,367 | |
| | Atlantic Union Bankshares Corp | | 1,352,696 | | | 45,883,448 | |
| | Cadence Bank | | 2,005,155 | | | 47,081,039 | |
| | Enterprise Financial Services Corp | | 316,701 | | | 13,143,092 | |
| | FB Financial Corp | | 762,955 | | | 29,923,095 | |
| | First Busey Corp | | 707,366 | | | 16,163,313 | |
| | First Interstate BancSystem Inc - Class A | | 1,795,739 | | | 68,435,613 | |
| | Fulton Financial Corp | | 2,048,942 | | | 29,607,212 | |
| | Hancock Whitney Corp | | 728,434 | | | 32,291,479 | |
| | Heartland Financial USA Inc | | 518,094 | | | 21,521,625 | |
| | Horizon Bancorp Inc/IN | | 1,928,540 | | | 33,595,167 | |
| | Sandy Spring Bancorp Inc | | 618,804 | | | 24,176,672 | |
| | United Bankshares Inc | | 1,218,103 | | | 42,718,872 | |
| | United Community Banks Inc/GA | | 1,668,889 | | | 50,383,759 | |
| | | 517,222,753 | |
Beverages – 1.3% | | | |
| | Coca-Cola Consolidated Inc | | 60,303 | | | 34,004,862 | |
Biotechnology – 1.0% | | | |
| | Anika Therapeutics Inc* | | 659,519 | | | 14,720,464 | |
| | Exelixis Inc* | | 654,149 | | | 13,619,382 | |
| | | 28,339,846 | |
Building Products – 1.3% | | | |
| | Masonite International Corp* | | 209,509 | | | 16,096,577 | |
| | PGT Innovations Inc* | | 1,071,838 | | | 17,835,384 | |
| | | 33,931,961 | |
Chemicals – 2.5% | | | |
| | American Vanguard Corp | | 712,361 | | | 15,921,268 | |
| | Innospec Inc | | 525,796 | | | 50,365,999 | |
| | | 66,287,267 | |
Commercial Services & Supplies – 3.2% | | | |
| | Boyd Group Services Inc | | 376,721 | | | 40,587,517 | |
| | UniFirst Corp/MA | | 273,920 | | | 47,163,546 | |
| | | 87,751,063 | |
Construction & Engineering – 1.8% | | | |
| | Comfort Systems USA Inc | | 601,000 | | | 49,973,150 | |
Construction Materials – 1.3% | | | |
| | Eagle Materials Inc | | 326,833 | | | 35,932,020 | |
Electrical Equipment – 1.8% | | | |
| | Encore Wire Corp | | 392,186 | | | 40,755,969 | |
| | Thermon Group Holdings Inc* | | 618,721 | | | 8,693,030 | |
| | | 49,448,999 | |
Electronic Equipment, Instruments & Components – 2.4% | | | |
| | Fabrinet* | | 373,408 | | | 30,283,389 | |
| | Insight Enterprises Inc* | | 405,698 | | | 35,003,623 | |
| | | 65,287,012 | |
Energy Equipment & Services – 1.8% | | | |
| | ChampionX Corp | | 2,432,346 | | | 48,282,068 | |
Entertainment – 0.7% | | | |
| | Madison Square Garden Co* | | 119,267 | | | 18,009,317 | |
Equity Real Estate Investment Trusts (REITs) – 10.1% | | | |
| | Corporate Office Properties Trust | | 1,474,357 | | | 38,613,410 | |
| | Phillips Edison & Co Inc£ | | 1,705,190 | | | 56,970,398 | |
| | |
See Notes to Schedule of Investments and Other Information and Notes to Financial Statements. |
| |
8 | JUNE 30, 2022 |
Janus Henderson Small Cap Value Fund
Schedule of Investments
June 30, 2022
| | | | | | | | |
Shares or
Principal Amounts | | | Value | |
Common Stocks– (continued) | | | |
Equity Real Estate Investment Trusts (REITs)– (continued) | | | |
| | PotlatchDeltic Corp | | 912,475 | | | $40,322,270 | |
| | STAG Industrial Inc | | 1,731,053 | | | 53,454,917 | |
| | Sunstone Hotel Investors Inc* | | 5,300,034 | | | 52,576,337 | |
| | UMH Properties Inc | | 1,737,234 | | | 30,679,552 | |
| | | 272,616,884 | |
Food & Staples Retailing – 1.6% | | | |
| | Casey's General Stores Inc | | 232,231 | | | 42,958,090 | |
Food Products – 1.8% | | | |
| | Nomad Foods Ltd* | | 2,402,658 | | | 48,029,133 | |
Gas Utilities – 1.2% | | | |
| | ONE Gas Inc | | 395,373 | | | 32,100,334 | |
Health Care Equipment & Supplies – 7.8% | | | |
| | Embecta Corp* | | 1,140,542 | | | 28,878,523 | |
| | Envista Holdings Corp* | | 1,471,521 | | | 56,712,419 | |
| | Globus Medical Inc* | | 773,800 | | | 43,441,132 | |
| | Natus Medical Inc* | | 658,529 | | | 21,579,995 | |
| | Varex Imaging Corp*,£ | | 1,998,777 | | | 42,753,840 | |
| | Zimvie Inc* | | 1,078,149 | | | 17,261,166 | |
| | | 210,627,075 | |
Health Care Providers & Services – 0.5% | | | |
| | ModivCare Inc* | | 158,859 | | | 13,423,586 | |
Hotels, Restaurants & Leisure – 1.2% | | | |
| | Century Casinos Inc*,£ | | 2,085,544 | | | 15,015,917 | |
| | Portillo's Inc - Class A* | | 1,058,683 | | | 17,309,467 | |
| | | 32,325,384 | |
Household Durables – 1.6% | | | |
| | Skyline Champion Corp* | | 937,525 | | | 44,457,436 | |
Information Technology Services – 1.5% | | | |
| | WNS Holdings Ltd (ADR)* | | 532,514 | | | 39,746,845 | |
Insurance – 2.8% | | | |
| | First American Financial Corp | | 270,376 | | | 14,308,298 | |
| | Hanover Insurance Group Inc | | 331,091 | | | 48,422,059 | |
| | Selective Insurance Group Inc | | 162,531 | | | 14,130,445 | |
| | | 76,860,802 | |
Machinery – 4.5% | | | |
| | Hillenbrand Inc | | 1,127,271 | | | 46,173,020 | |
| | Lincoln Electric Holdings Inc | | 388,217 | | | 47,890,449 | |
| | Watts Water Technologies Inc - Class A | | 225,346 | | | 27,681,503 | |
| | | 121,744,972 | |
Metals & Mining – 1.8% | | | |
| | Commercial Metals Co | | 1,494,534 | | | 49,469,075 | |
Multiline Retail – 0.3% | | | |
| | Ollie's Bargain Outlet Holdings Inc* | | 138,017 | | | 8,108,499 | |
Multi-Utilities – 3.1% | | | |
| | Black Hills Corp | | 1,136,646 | | | 82,713,729 | |
Oil, Gas & Consumable Fuels – 6.5% | | | |
| | Denbury Inc* | | 484,075 | | | 29,039,659 | |
| | Gulfport Energy Corp* | | 378,217 | | | 30,072,034 | |
| | Magnolia Oil & Gas Corp | | 3,337,216 | | | 70,048,164 | |
| | Whiting Petroleum Corp | | 683,076 | | | 46,469,660 | |
| | | 175,629,517 | |
Professional Services – 1.5% | | | |
| | Korn Ferry | | 399,978 | | | 23,206,724 | |
| | Mantech International Corp | | 178,191 | | | 17,008,331 | |
| | | 40,215,055 | |
Real Estate Management & Development – 0.7% | | | |
| | Marcus & Millichap Inc | | 525,127 | | | 19,424,448 | |
Semiconductor & Semiconductor Equipment – 2.1% | | | |
| | Diodes Inc* | | 305,073 | | | 19,698,564 | |
| | |
See Notes to Schedule of Investments and Other Information and Notes to Financial Statements. |
| |
Janus Investment Fund | 9 |
Janus Henderson Small Cap Value Fund
Schedule of Investments
June 30, 2022
| | | | | | | | |
Shares or
Principal Amounts | | | Value | |
Common Stocks– (continued) | | | |
Semiconductor & Semiconductor Equipment– (continued) | | | |
| | FormFactor Inc* | | 456,336 | | | $17,673,893 | |
| | Ultra Clean Holdings Inc* | | 668,673 | | | 19,906,395 | |
| | | 57,278,852 | |
Specialty Retail – 0.1% | | | |
| | Torrid Holdings Inc* | | 334,607 | | | 1,445,502 | |
Textiles, Apparel & Luxury Goods – 0.4% | | | |
| | Hanesbrands Inc | | 1,067,874 | | | 10,988,423 | |
Thrifts & Mortgage Finance – 1.5% | | | |
| | WSFS Financial Corp | | 1,007,051 | | | 40,372,675 | |
Trading Companies & Distributors – 3.6% | | | |
| | GATX Corp | | 481,305 | | | 45,319,679 | |
| | H&E Equipment Services Inc | | 984,773 | | | 28,528,874 | |
| | MSC Industrial Direct Co Inc | | 308,549 | | | 23,175,115 | |
| | | 97,023,668 | |
Total Common Stocks (cost $2,344,543,828) | | 2,640,087,964 | |
Repurchase Agreements– 2.3% | | | |
| | ING Financial Markets LLC, Joint repurchase agreement, 1.4700%, dated 6/30/22, maturing 7/1/22 to be repurchased at $16,300,666 collateralized by $18,224,935 in U.S. Treasuries 0% - 3.2500%, 11/17/22 - 11/15/51 with a value of $16,626,680 | | $16,300,000 | | | 16,300,000 | |
| | Royal Bank of Canada, NY Branch, Joint repurchase agreement, 1.4100%, dated 6/30/22, maturing 7/1/22 to be repurchased at $45,001,763 collateralized by $46,607,985 in U.S. Treasuries 0.3750% - 3.2500%, 7/15/24 - 5/15/42 with a value of $45,901,807 | | 45,000,000 | | | 45,000,000 | |
Total Repurchase Agreements (cost $61,300,000) | | 61,300,000 | |
Total Investments (total cost $2,405,843,828) – 99.9% | | 2,701,387,964 | |
Cash, Receivables and Other Assets, net of Liabilities – 0.1% | | 3,701,953 | |
Net Assets – 100% | | $2,705,089,917 | |
| | | | | | |
Summary of Investments by Country - (Long Positions) (unaudited) |
| |
| | | | | % of | |
| | | | | Investment | |
Country | | Value | | Securities | |
United States | | $2,573,024,469 | | 95.2 | % |
United Kingdom | | 48,029,133 | | 1.8 | |
Canada | | 40,587,517 | | 1.5 | |
India | | 39,746,845 | | 1.5 | |
| | | | | | |
| | | | | | |
Total | | $2,701,387,964 | | 100.0 | % |
| | |
See Notes to Schedule of Investments and Other Information and Notes to Financial Statements. |
| |
10 | JUNE 30, 2022 |
Janus Henderson Small Cap Value Fund
Schedule of Investments
June 30, 2022
Schedules of Affiliated Investments – (% of Net Assets)
| | | | | | | | | | | |
| | Dividend Income(1) | Realized Gain/(Loss)(1) | Change in Unrealized Appreciation/ Depreciation(1) | Value at 6/30/22 |
Common Stocks - 2.2% |
Aerospace & Defense - N/A | |
| | Vectrus Inc* | $ | - | $ | (252,219) | $ | (676,465) | $ | - |
Auto Components - N/A | |
| | Stoneridge Inc* | | - | | (3,627,829) | | (10,297,683) | | - |
Equity Real Estate Investment Trusts (REITs) - N/A | |
| | Phillips Edison & Co Incš | | 1,445,445 | | (224,446) | | 6,629,651 | | N/A |
Health Care Equipment & Supplies - 1.6% | |
| | Varex Imaging Corp* | | - | | 2,607,732 | | (12,862,174) | | 42,753,840 |
Hotels, Restaurants & Leisure - 0.6% | |
| | Century Casinos Inc* | | - | | 707,730 | | (13,520,364) | | 15,015,917 |
Total Affiliated Investments - 2.2% | $ | 1,445,445 | $ | (789,032) | $ | (30,727,035) | $ | 57,769,757 |
(1) For securities that were affiliated for a portion of the year ended June 30, 2022, this column reflects amounts for the entire year ended June 30, 2022 and not just the period in which the security was affiliated.
| | | | | | | | | | | |
| | Value at 6/30/21 | Purchases | Sales Proceeds | Value at 6/30/22 |
Common Stocks - 2.2% |
Aerospace & Defense - N/A | |
| | Vectrus Inc* | | 30,519,039 | | - | | (29,590,355) | | - |
Auto Components - N/A | |
| | Stoneridge Inc* | | 48,359,527 | | - | | (34,434,015) | | - |
Equity Real Estate Investment Trusts (REITs) - N/A | |
| | Phillips Edison & Co Incš | | - | | 54,805,464 | | (4,240,271)Ð | | 56,970,398 |
Health Care Equipment & Supplies - 1.6% | |
| | Varex Imaging Corp* | | 54,098,837 | | 6,264,417 | | (7,354,972) | | 42,753,840 |
Hotels, Restaurants & Leisure - 0.6% | |
| | Century Casinos Inc* | | 29,649,304 | | - | | (1,820,753) | | 15,015,917 |
| | |
See Notes to Schedule of Investments and Other Information and Notes to Financial Statements. |
| |
Janus Investment Fund | 11 |
Janus Henderson Small Cap Value Fund
Schedule of Investments
June 30, 2022
| | | | | | | | | | |
Offsetting of Financial Assets and Derivative Assets |
| |
| | | Gross Amounts | | | | | | |
| | | of Recognized | | Offsetting Asset | | Collateral | | |
Counterparty | | Assets | | or Liability(a) | | Pledged(b) | | Net Amount |
| | | | | | | | | |
ING Financial Markets LLC | $ | 16,300,000 | $ | — | $ | (16,300,000) | $ | — |
Royal Bank of Canada, NY Branch | | 45,000,000 | | — | | (45,000,000) | | — |
| | | | | | | | | |
Total | $ | 61,300,000 | $ | — | $ | (61,300,000) | $ | — |
(a) | Represents the amount of assets or liabilities that could be offset with the same counterparty under master netting or similar agreements that management elects not to offset on the Statement of Assets and Liabilities. |
(b) | Collateral pledged is limited to the net outstanding amount due to/from an individual counterparty. The actual collateral amounts pledged may exceed these amounts and may fluctuate in value. |
| | |
See Notes to Schedule of Investments and Other Information and Notes to Financial Statements. |
| |
12 | JUNE 30, 2022 |
Janus Henderson Small Cap Value Fund
Notes to Schedule of Investments and Other Information
| | |
Russell 2000® Value Index | Russell 2000® Value Index reflects the performance of U.S. small-cap equities with lower price-to-book ratios and lower forecasted growth values. |
| | |
ADR | American Depositary Receipt |
LLC | Limited Liability Company |
PLC | Public Limited Company |
| | |
* | Non-income producing security. |
| | |
£ | The Fund may invest in certain securities that are considered affiliated companies. As defined by the Investment Company Act of 1940, as amended, an affiliated company is one in which the Fund owns 5% or more of the outstanding voting securities, or a company which is under common ownership or control. |
| | |
š | Company was no longer an affiliate as of June 30, 2022. |
| | |
Ð | All or a portion is the result of a corporate action. |
| | | | | | | | | | | | | |
The following is a summary of the inputs that were used to value the Fund’s investments in securities and other financial instruments as of June 30, 2022. See Notes to Financial Statements for more information. |
| |
Valuation Inputs Summary |
| | | | | | | |
| | | | | Level 2 - | | Level 3 - |
| | | Level 1 - | | Other Significant | | Significant |
| | | Quoted Prices | | Observable Inputs | | Unobservable Inputs |
| | | | | | | |
Assets | | | | | | |
Investments In Securities: | | | | | | |
Common Stocks | $ | 2,640,087,964 | $ | - | $ | - |
Repurchase Agreements | | - | | 61,300,000 | | - |
Total Assets | $ | 2,640,087,964 | $ | 61,300,000 | $ | - |
| | | | | | | |
Janus Henderson Small Cap Value Fund
Statement of Assets and Liabilities
June 30, 2022
| |
See footnotes at the end of the Statement. |
| | | | | | | |
| | | | | | |
Assets: | | | | |
| Unaffiliated investments, at value (cost $2,293,420,596) | | $ | 2,582,318,207 | |
| Affiliated investments, at value (cost $51,123,232) | | | 57,769,757 | |
| Repurchase agreements, at value (cost $61,300,000) | | | 61,300,000 | |
| Cash | | | 26,638 | |
| Cash denominated in foreign currency (cost $17,146) | | | 17,146 | |
| Trustees' deferred compensation | | | 79,063 | |
| Receivables: | | | | |
| | Fund shares sold | | | 66,411,975 | |
| | Investments sold | | | 22,518,942 | |
| | Dividends | | | 3,394,124 | |
| | Interest | | | 2,555 | |
| Other assets | | | 11,762 | |
Total Assets | | | 2,793,850,169 | |
Liabilities: | | | | |
| Payables: | | | — | |
| | Fund shares repurchased | | | 67,248,102 | |
| | Investments purchased | | | 19,287,097 | |
| | Advisory fees | | | 1,257,100 | |
| | Transfer agent fees and expenses | | | 539,331 | |
| | Trustees' deferred compensation fees | | | 79,063 | |
| | Professional fees | | | 54,372 | |
| | 12b-1 Distribution and shareholder servicing fees | | | 46,712 | |
| | Trustees' fees and expenses | | | 13,723 | |
| | Custodian fees | | | 6,839 | |
| | Affiliated fund administration fees payable | | | 5,884 | |
| | Accrued expenses and other payables | | | 222,029 | |
Total Liabilities | | | 88,760,252 | |
Net Assets | | $ | 2,705,089,917 | |
| | |
See Notes to Financial Statements. |
| |
14 | JUNE 30, 2022 |
Janus Henderson Small Cap Value Fund
Statement of Assets and Liabilities
June 30, 2022
| | | | | | | |
| | | | | | |
| | | | | | | |
Net Assets Consist of: | | | | |
| Capital (par value and paid-in surplus) | | $ | 2,290,766,864 | |
| Total distributable earnings (loss) | | | 414,323,053 | |
Total Net Assets | | $ | 2,705,089,917 | |
Net Assets - Class A Shares | | $ | 29,650,517 | |
| Shares Outstanding, $0.01 Par Value (unlimited shares authorized) | | | 1,396,221 | |
Net Asset Value Per Share(1) | | $ | 21.24 | |
Maximum Offering Price Per Share(2) | | $ | 22.54 | |
Net Assets - Class C Shares | | $ | 17,439,836 | |
| Shares Outstanding, $0.01 Par Value (unlimited shares authorized) | | | 884,801 | |
Net Asset Value Per Share(1) | | $ | 19.71 | |
Net Assets - Class D Shares | | $ | 86,051,651 | |
| Shares Outstanding, $0.01 Par Value (unlimited shares authorized) | | | 4,081,811 | |
Net Asset Value Per Share | | $ | 21.08 | |
Net Assets - Class I Shares | | $ | 1,436,933,351 | |
| Shares Outstanding, $0.01 Par Value (unlimited shares authorized) | | | 67,840,148 | |
Net Asset Value Per Share | | $ | 21.18 | |
Net Assets - Class L Shares | | $ | 90,492,422 | |
| Shares Outstanding, $0.01 Par Value (unlimited shares authorized) | | | 4,140,259 | |
Net Asset Value Per Share | | $ | 21.86 | |
Net Assets - Class N Shares | | $ | 586,927,277 | |
| Shares Outstanding, $0.01 Par Value (unlimited shares authorized) | | | 27,736,770 | |
Net Asset Value Per Share | | $ | 21.16 | |
Net Assets - Class R Shares | | $ | 44,591,943 | |
| Shares Outstanding, $0.01 Par Value (unlimited shares authorized) | | | 2,178,112 | |
Net Asset Value Per Share | | $ | 20.47 | |
Net Assets - Class S Shares | | $ | 26,995,999 | |
| Shares Outstanding, $0.01 Par Value (unlimited shares authorized) | | | 1,291,342 | |
Net Asset Value Per Share | | $ | 20.91 | |
Net Assets - Class T Shares | | $ | 386,006,921 | |
| Shares Outstanding, $0.01 Par Value (unlimited shares authorized) | | | 18,262,623 | |
Net Asset Value Per Share | | $ | 21.14 | |
| |
(1) Redemption price per share may be reduced for any applicable contingent deferred sales charge. (2) Maximum offering price is computed at 100/94.25 of net asset value. |
| | |
See Notes to Financial Statements. |
| |
Janus Investment Fund | 15 |
Janus Henderson Small Cap Value Fund
Statement of Operations
For the year ended June 30, 2022
| | | | | | |
| | | | | |
Investment Income: | | | |
| Dividends | $ | 42,712,360 | |
| Dividends from affiliates | | 1,445,445 | |
| Interest | | 139,397 | |
| Other income | | 3,299 | |
| Foreign tax withheld | | (9,491) | |
Total Investment Income | | 44,291,010 | |
Expenses: | | | |
| Advisory fees | | 20,442,224 | |
| 12b-1 Distribution and shareholder servicing fees: | | | |
| | Class A Shares | | 153,833 | |
| | Class C Shares | | 210,650 | |
| | Class R Shares | | 248,073 | |
| | Class S Shares | | 90,199 | |
| Transfer agent administrative fees and expenses: | | | |
| | Class D Shares | | 114,296 | |
| | Class L Shares | | 223,972 | |
| | Class R Shares | | 124,342 | |
| | Class S Shares | | 90,412 | |
| | Class T Shares | | 1,278,092 | |
| Transfer agent networking and omnibus fees: | | | |
| | Class A Shares | | 559,829 | |
| | Class C Shares | | 18,043 | |
| | Class I Shares | | 2,537,121 | |
| Other transfer agent fees and expenses: | | | |
| | Class A Shares | | 3,889 | |
| | Class C Shares | | 1,047 | |
| | Class D Shares | | 19,572 | |
| | Class I Shares | | 83,320 | |
| | Class L Shares | | 1,878 | |
| | Class N Shares | | 31,151 | |
| | Class R Shares | | 1,029 | |
| | Class S Shares | | 690 | |
| | Class T Shares | | 6,583 | |
| Registration fees | | 219,284 | |
| Shareholder reports expense | | 193,020 | |
| Affiliated fund administration fees | | 88,863 | |
| Trustees’ fees and expenses | | 61,092 | |
| Professional fees | | 59,646 | |
| Custodian fees | | 21,653 | |
| Other expenses | | 259,487 | |
Total Expenses | | 27,143,290 | |
Less: Excess Expense Reimbursement and Waivers | | (680,030) | |
Net Expenses | | 26,463,260 | |
Net Investment Income/(Loss) | | 17,827,750 | |
| | | | | |
| | |
See Notes to Financial Statements. |
| |
16 | JUNE 30, 2022 |
Janus Henderson Small Cap Value Fund
Statement of Operations
For the year ended June 30, 2022
| | | | | | |
| | | | | |
Net Realized Gain/(Loss) on Investments: | | | |
| Investments and foreign currency transactions | $ | 235,987,703 | |
| Investments in affiliates | | (789,032) | |
Total Net Realized Gain/(Loss) on Investments | | 235,198,671 | |
Change in Unrealized Net Appreciation/Depreciation: | | | |
| Investments, foreign currency translations and Trustees’ deferred compensation | | (654,854,577) | |
| Investments in affiliates | | (30,727,035) | |
Total Change in Unrealized Net Appreciation/Depreciation | | (685,581,612) | |
Net Increase/(Decrease) in Net Assets Resulting from Operations | $ | (432,555,191) | |
| | | | | |
| | |
See Notes to Financial Statements. |
| |
Janus Investment Fund | 17 |
Janus Henderson Small Cap Value Fund
Statements of Changes in Net Assets
| | | | | | | | | |
| | | | | | | | |
| | | Year ended
June 30, 2022 | | Year ended
June 30, 2021 | |
| | | | | | | | | |
Operations: | | | | | | |
| Net investment income/(loss) | $ | 17,827,750 | | $ | 31,942,529 | |
| Net realized gain/(loss) on investments | | 235,198,671 | | | 178,647,109 | |
| Change in unrealized net appreciation/depreciation | | (685,581,612) | | | 1,099,131,584 | |
Net Increase/(Decrease) in Net Assets Resulting from Operations | | (432,555,191) | | | 1,309,721,222 | |
Dividends and Distributions to Shareholders: | | | | | | |
| | Class A Shares | | (1,127,366) | | | (558,586) | |
| | Class C Shares | | (333,534) | | | (40,703) | |
| | Class D Shares | | (1,952,056) | | | (966,547) | |
| | Class I Shares | | (35,391,712) | | | (20,579,197) | |
| | Class L Shares | | (2,168,424) | | | (1,225,524) | |
| | Class N Shares | | (17,702,297) | | | (9,856,554) | |
| | Class R Shares | | (834,998) | | | (250,227) | |
| | Class S Shares | | (623,421) | | | (362,562) | |
| | Class T Shares | | (9,580,571) | | | (5,282,096) | |
Net Decrease from Dividends and Distributions to Shareholders | | (69,714,379) | | | (39,121,996) | |
Capital Share Transactions: | | | | | | |
| | Class A Shares | | (32,725,992) | | | (18,711,756) | |
| | Class C Shares | | (2,210,185) | | | (5,683,661) | |
| | Class D Shares | | (6,166,574) | | | (11,176,474) | |
| | Class I Shares | | (424,960,781) | | | (120,505,119) | |
| | Class L Shares | | (14,048,314) | | | (15,005,263) | |
| | Class N Shares | | (217,820,011) | | | (43,112,315) | |
| | Class R Shares | | 3,548,749 | | | 767,864 | |
| | Class S Shares | | (11,119,133) | | | (17,044,195) | |
| | Class T Shares | | (116,734,518) | | | (135,499,435) | |
Net Increase/(Decrease) from Capital Share Transactions | | (822,236,759) | | | (365,970,354) | |
Net Increase/(Decrease) in Net Assets | | (1,324,506,329) | | | 904,628,872 | |
Net Assets: | | | | | | |
| Beginning of period | | 4,029,596,246 | | | 3,124,967,374 | |
| End of period | $ | 2,705,089,917 | | $ | 4,029,596,246 | |
| | | | | | | | |
| | |
See Notes to Financial Statements. |
| |
18 | JUNE 30, 2022 |
Janus Henderson Small Cap Value Fund
Financial Highlights
| | | | | | | | | | | | | | | | | | | |
Class A Shares | | | | | | | | | | | | | | | |
For a share outstanding during the year ended June 30 | | 2022 | | | 2021 | | | 2020 | | | 2019 | | | 2018 | |
| Net Asset Value, Beginning of Period | | $24.95 | | | $17.59 | | | $21.57 | | | $23.18 | | | $23.19 | |
| Income/(Loss) from Investment Operations: | | | | | | | | | | | | | | | |
| | Net investment income/(loss)(1) | | 0.04 | | | 0.13 | | | 0.15 | | | 0.25 | | | 0.09 | |
| | Net realized and unrealized gain/(loss) | | (3.32) | | | 7.40 | | | (4.00) | | | (0.39) | | | 1.87 | |
| Total from Investment Operations | | (3.28) | | | 7.53 | | | (3.85) | | | (0.14) | | | 1.96 | |
| Less Dividends and Distributions: | | | | | | | | | | | | | | | |
| | Dividends (from net investment income) | | (0.17) | | | (0.17) | | | (0.13) | | | — | | | (0.01) | |
| | Distributions (from capital gains) | | (0.26) | | | — | | | — | | | (1.47) | | | (1.96) | |
| Total Dividends and Distributions | | (0.43) | | | (0.17) | | | (0.13) | | | (1.47) | | | (1.97) | |
| Net Asset Value, End of Period | | $21.24 | | | $24.95 | | | $17.59 | | | $21.57 | | | $23.18 | |
| Total Return* | | (13.44)% | | | 42.99% | | | (17.98)% | | | 0.56% | | | 8.44% | |
| Net Assets, End of Period (in thousands) | | $29,651 | | | $69,385 | | | $64,025 | | | $61,505 | | | $54,782 | |
| Average Net Assets for the Period (in thousands) | | $61,533 | | | $68,997 | | | $62,337 | | | $48,049 | | | $53,655 | |
| Ratios to Average Net Assets**: | | | | | | | | | | | | | | | |
| | Ratio of Gross Expenses | | 1.77% | | | 1.76% | | | 1.86% | | | 1.27% | | | 1.35% | |
| | Ratio of Net Expenses (After Waivers and Expense Offsets) | | 1.05% | | | 1.11% | | | 1.39% | | | 1.14% | | | 1.26% | |
| | Ratio of Net Investment Income/(Loss) | | 0.18% | | | 0.59% | | | 0.77% | | | 1.15% | | | 0.40% | |
| Portfolio Turnover Rate | | 44% | | | 53% | | | 59% | | | 39% | | | 51% | |
| | | | | | | | | | | | | | | | | | | |
| |
* Total return includes adjustments in accordance with generally accepted accounting principles required at the year or period end and are not annualized for periods of less than one full year. ** Annualized for periods of less than one full year. (1) Per share amounts are calculated based on average shares outstanding during the year or period. |
| | |
See Notes to Financial Statements. |
| |
Janus Investment Fund | 19 |
Janus Henderson Small Cap Value Fund
Financial Highlights
| | | | | | | | | | | | | | | | | | | |
Class C Shares | | | | | | | | | | | | | | | |
For a share outstanding during the year ended June 30 | | 2022 | | | 2021 | | | 2020 | | | 2019 | | | 2018 | |
| Net Asset Value, Beginning of Period | | $23.27 | | | $16.41 | | | $20.12 | | | $21.87 | | | $22.09 | |
| Income/(Loss) from Investment Operations: | | | | | | | | | | | | | | | |
| | Net investment income/(loss)(1) | | (0.10) | | | (0.01) | | | 0.06 | | | 0.11 | | | (0.05) | |
| | Net realized and unrealized gain/(loss) | | (3.10) | | | 6.91 | | | (3.77) | | | (0.39) | | | 1.79 | |
| Total from Investment Operations | | (3.20) | | | 6.90 | | | (3.71) | | | (0.28) | | | 1.74 | |
| Less Dividends and Distributions: | | | | | | | | | | | | | | | |
| | Dividends (from net investment income) | | (0.10) | | | (0.04) | | | — | | | — | | | — | |
| | Distributions (from capital gains) | | (0.26) | | | — | | | — | | | (1.47) | | | (1.96) | |
| Total Dividends and Distributions | | (0.36) | | | (0.04) | | | — | | | (1.47) | | | (1.96) | |
| Net Asset Value, End of Period | | $19.71 | | | $23.27 | | | $16.41 | | | $20.12 | | | $21.87 | |
| Total Return* | | (14.02)% | | | 42.07% | | | (18.44)% | | | (0.07)% | | | 7.84% | |
| Net Assets, End of Period (in thousands) | | $17,440 | | | $22,889 | | | $20,967 | | | $29,619 | | | $26,828 | |
| Average Net Assets for the Period (in thousands) | | $21,362 | | | $22,037 | | | $26,855 | | | $26,902 | | | $23,627 | |
| Ratios to Average Net Assets**: | | | | | | | | | | | | | | | |
| | Ratio of Gross Expenses | | 1.69% | | | 1.77% | | | 1.92% | | | 1.75% | | | 1.86% | |
| | Ratio of Net Expenses (After Waivers and Expense Offsets) | | 1.69% | | | 1.77% | | | 1.92% | | | 1.75% | | | 1.86% | |
| | Ratio of Net Investment Income/(Loss) | | (0.45)% | | | (0.06)% | | | 0.30% | | | 0.56% | | | (0.24)% | |
| Portfolio Turnover Rate | | 44% | | | 53% | | | 59% | | | 39% | | | 51% | |
| | | | | | | | | | | | | | | | | | | |
| |
* Total return includes adjustments in accordance with generally accepted accounting principles required at the year or period end and are not annualized for periods of less than one full year. ** Annualized for periods of less than one full year. (1) Per share amounts are calculated based on average shares outstanding during the year or period. |
| | |
See Notes to Financial Statements. |
| |
20 | JUNE 30, 2022 |
Janus Henderson Small Cap Value Fund
Financial Highlights
| | | | | | | | | | | | | | | | | | | |
Class D Shares | | | | | | | | | | | | | | | |
For a share outstanding during the year ended June 30 | | 2022 | | | 2021 | | | 2020 | | | 2019 | | | 2018 | |
| Net Asset Value, Beginning of Period | | $24.75 | | | $17.44 | | | $21.38 | | | $22.99 | | | $23.01 | |
| Income/(Loss) from Investment Operations: | | | | | | | | | | | | | | | |
| | Net investment income/(loss)(1) | | 0.12 | | | 0.18 | | | 0.24 | | | 0.32 | | | 0.16 | |
| | Net realized and unrealized gain/(loss) | | (3.32) | | | 7.35 | | | (3.96) | | | (0.41) | | | 1.86 | |
| Total from Investment Operations | | (3.20) | | | 7.53 | | | (3.72) | | | (0.09) | | | 2.02 | |
| Less Dividends and Distributions: | | | | | | | | | | | | | | | |
| | Dividends (from net investment income) | | (0.21) | | | (0.22) | | | (0.22) | | | (0.05) | | | (0.08) | |
| | Distributions (from capital gains) | | (0.26) | | | — | | | — | | | (1.47) | | | (1.96) | |
| Total Dividends and Distributions | | (0.47) | | | (0.22) | | | (0.22) | | | (1.52) | | | (2.04) | |
| Net Asset Value, End of Period | | $21.08 | | | $24.75 | | | $17.44 | | | $21.38 | | | $22.99 | |
| Total Return* | | (13.24)% | | | 43.43% | | | (17.65)% | | | 0.82% | | | 8.79% | |
| Net Assets, End of Period (in thousands) | | $86,052 | | | $107,471 | | | $86,650 | | | $116,468 | | | $127,533 | |
| Average Net Assets for the Period (in thousands) | | $101,735 | | | $94,637 | | | $105,847 | | | $117,978 | | | $130,614 | |
| Ratios to Average Net Assets**: | | | | | | | | | | | | | | | |
| | Ratio of Gross Expenses | | 0.75% | | | 0.84% | | | 1.01% | | | 0.83% | | | 0.96% | |
| | Ratio of Net Expenses (After Waivers and Expense Offsets) | | 0.75% | | | 0.84% | | | 1.01% | | | 0.83% | | | 0.96% | |
| | Ratio of Net Investment Income/(Loss) | | 0.49% | | | 0.84% | | | 1.20% | | | 1.48% | | | 0.70% | |
| Portfolio Turnover Rate | | 44% | | | 53% | | | 59% | | | 39% | | | 51% | |
| | | | | | | | | | | | | | | | | | | |
| |
* Total return includes adjustments in accordance with generally accepted accounting principles required at the year or period end and are not annualized for periods of less than one full year. ** Annualized for periods of less than one full year. (1) Per share amounts are calculated based on average shares outstanding during the year or period. |
| | |
See Notes to Financial Statements. |
| |
Janus Investment Fund | 21 |
Janus Henderson Small Cap Value Fund
Financial Highlights
| | | | | | | | | | | | | | | | | | | |
Class I Shares | | | | | | | | | | | | | | | |
For a share outstanding during the year ended June 30 | | 2022 | | | 2021 | | | 2020 | | | 2019 | | | 2018 | |
| Net Asset Value, Beginning of Period | | $24.86 | | | $17.53 | | | $21.50 | | | $23.12 | | | $23.13 | |
| Income/(Loss) from Investment Operations: | | | | | | | | | | | | | | | |
| | Net investment income/(loss)(1) | | 0.12 | | | 0.19 | | | 0.24 | | | 0.33 | | | 0.18 | |
| | Net realized and unrealized gain/(loss) | | (3.33) | | | 7.37 | | | (3.97) | | | (0.41) | | | 1.87 | |
| Total from Investment Operations | | (3.21) | | | 7.56 | | | (3.73) | | | (0.08) | | | 2.05 | |
| Less Dividends and Distributions: | | | | | | | | | | | | | | | |
| | Dividends (from net investment income) | | (0.21) | | | (0.23) | | | (0.24) | | | (0.07) | | | (0.10) | |
| | Distributions (from capital gains) | | (0.26) | | | — | | | — | | | (1.47) | | | (1.96) | |
| Total Dividends and Distributions | | (0.47) | | | (0.23) | | | (0.24) | | | (1.54) | | | (2.06) | |
| Net Asset Value, End of Period | | $21.18 | | | $24.86 | | | $17.53 | | | $21.50 | | | $23.12 | |
| Total Return* | | (13.21)% | | | 43.36% | | | (17.62)% | | | 0.89% | | | 8.85% | |
| Net Assets, End of Period (in thousands) | | $1,436,933 | | | $2,121,333 | | | $1,584,586 | | | $1,531,568 | | | $1,264,218 | |
| Average Net Assets for the Period (in thousands) | | $1,839,602 | | | $1,887,591 | | | $1,646,400 | | | $1,337,975 | | | $1,150,680 | |
| Ratios to Average Net Assets**: | | | | | | | | | | | | | | | |
| | Ratio of Gross Expenses | | 0.74% | | | 0.81% | | | 1.01% | | | 0.79% | | | 0.88% | |
| | Ratio of Net Expenses (After Waivers and Expense Offsets) | | 0.74% | | | 0.81% | | | 1.01% | | | 0.79% | | | 0.88% | |
| | Ratio of Net Investment Income/(Loss) | | 0.50% | | | 0.87% | | | 1.19% | | | 1.52% | | | 0.77% | |
| Portfolio Turnover Rate | | 44% | | | 53% | | | 59% | | | 39% | | | 51% | |
| | | | | | | | | | | | | | | | | | | |
| |
* Total return includes adjustments in accordance with generally accepted accounting principles required at the year or period end and are not annualized for periods of less than one full year. ** Annualized for periods of less than one full year. (1) Per share amounts are calculated based on average shares outstanding during the year or period. |
| | |
See Notes to Financial Statements. |
| |
22 | JUNE 30, 2022 |
Janus Henderson Small Cap Value Fund
Financial Highlights
| | | | | | | | | | | | | | | | | | | |
Class L Shares | | | | | | | | | | | | | | | |
For a share outstanding during the year ended June 30 | | 2022 | | | 2021 | | | 2020 | | | 2019 | | | 2018 | |
| Net Asset Value, Beginning of Period | | $25.62 | | | $18.05 | | | $22.13 | | | $23.73 | | | $23.69 | |
| Income/(Loss) from Investment Operations: | | | | | | | | | | | | | | | |
| | Net investment income/(loss)(1) | | 0.16 | | | 0.22 | | | 0.28 | | | 0.36 | | | 0.20 | |
| | Net realized and unrealized gain/(loss) | | (3.43) | | | 7.60 | | | (4.10) | | | (0.42) | | | 1.91 | |
| Total from Investment Operations | | (3.27) | | | 7.82 | | | (3.82) | | | (0.06) | | | 2.11 | |
| Less Dividends and Distributions: | | | | | | | | | | | | | | | |
| | Dividends (from net investment income) | | (0.23) | | | (0.25) | | | (0.26) | | | (0.07) | | | (0.11) | |
| | Distributions (from capital gains) | | (0.26) | | | — | | | — | | | (1.47) | | | (1.96) | |
| Total Dividends and Distributions | | (0.49) | | | (0.25) | | | (0.26) | | | (1.54) | | | (2.07) | |
| Net Asset Value, End of Period | | $21.86 | | | $25.62 | | | $18.05 | | | $22.13 | | | $23.73 | |
| Total Return* | | (13.07)% | | | 43.60% | | | (17.53)% | | | 0.97% | | | 8.91% | |
| Net Assets, End of Period (in thousands) | | $90,492 | | | $120,351 | | | $97,950 | | | $148,304 | | | $173,144 | |
| Average Net Assets for the Period (in thousands) | | $111,073 | | | $109,087 | | | $130,117 | | | $155,137 | | | $187,635 | |
| Ratios to Average Net Assets**: | | | | | | | | | | | | | | | |
| | Ratio of Gross Expenses | | 0.81% | | | 0.88% | | | 1.06% | | | 0.88% | | | 1.02% | |
| | Ratio of Net Expenses (After Waivers and Expense Offsets) | | 0.62% | | | 0.69% | | | 0.87% | | | 0.69% | | | 0.84% | |
| | Ratio of Net Investment Income/(Loss) | | 0.63% | | | 1.00% | | | 1.36% | | | 1.62% | | | 0.84% | |
| Portfolio Turnover Rate | | 44% | | | 53% | | | 59% | | | 39% | | | 51% | |
| | | | | | | | | | | | | | | | | | | |
| |
* Total return includes adjustments in accordance with generally accepted accounting principles required at the year or period end and are not annualized for periods of less than one full year. ** Annualized for periods of less than one full year. (1) Per share amounts are calculated based on average shares outstanding during the year or period. |
| | |
See Notes to Financial Statements. |
| |
Janus Investment Fund | 23 |
Janus Henderson Small Cap Value Fund
Financial Highlights
| | | | | | | | | | | | | | | | | | | |
Class N Shares | | | | | | | | | | | | | | | |
For a share outstanding during the year ended June 30 | | 2022 | | | 2021 | | | 2020 | | | 2019 | | | 2018 | |
| Net Asset Value, Beginning of Period | | $24.82 | | | $17.50 | | | $21.46 | | | $23.08 | | | $23.09 | |
| Income/(Loss) from Investment Operations: | | | | | | | | | | | | | | | |
| | Net investment income/(loss)(1) | | 0.16 | | | 0.22 | | | 0.26 | | | 0.35 | | | 0.19 | |
| | Net realized and unrealized gain/(loss) | | (3.33) | | | 7.36 | | | (3.95) | | | (0.42) | | | 1.88 | |
| Total from Investment Operations | | (3.17) | | | 7.58 | | | (3.69) | | | (0.07) | | | 2.07 | |
| Less Dividends and Distributions: | | | | | | | | | | | | | | | |
| | Dividends (from net investment income) | | (0.23) | | | (0.26) | | | (0.27) | | | (0.08) | | | (0.12) | |
| | Distributions (from capital gains) | | (0.26) | | | — | | | — | | | (1.47) | | | (1.96) | |
| Total Dividends and Distributions | | (0.49) | | | (0.26) | | | (0.27) | | | (1.55) | | | (2.08) | |
| Net Asset Value, End of Period | | $21.16 | | | $24.82 | | | $17.50 | | | $21.46 | | | $23.08 | |
| Total Return* | | (13.09)% | | | 43.57% | | | (17.48)% | | | 0.97% | | | 8.97% | |
| Net Assets, End of Period (in thousands) | | $586,927 | | | $922,073 | | | $676,894 | | | $585,199 | | | $470,614 | |
| Average Net Assets for the Period (in thousands) | | $822,081 | | | $839,582 | | | $632,706 | | | $515,945 | | | $402,129 | |
| Ratios to Average Net Assets**: | | | | | | | | | | | | | | | |
| | Ratio of Gross Expenses | | 0.60% | | | 0.67% | | | 0.86% | | | 0.68% | | | 0.81% | |
| | Ratio of Net Expenses (After Waivers and Expense Offsets) | | 0.60% | | | 0.67% | | | 0.86% | | | 0.68% | | | 0.81% | |
| | Ratio of Net Investment Income/(Loss) | | 0.65% | | | 1.01% | | | 1.31% | | | 1.65% | | | 0.83% | |
| Portfolio Turnover Rate | | 44% | | | 53% | | | 59% | | | 39% | | | 51% | |
| | | | | | | | | | | | | | | | | | | |
| |
* Total return includes adjustments in accordance with generally accepted accounting principles required at the year or period end and are not annualized for periods of less than one full year. ** Annualized for periods of less than one full year. (1) Per share amounts are calculated based on average shares outstanding during the year or period. |
| | |
See Notes to Financial Statements. |
| |
24 | JUNE 30, 2022 |
Janus Henderson Small Cap Value Fund
Financial Highlights
| | | | | | | | | | | | | | | | | | | |
Class R Shares | | | | | | | | | | | | | | | |
For a share outstanding during the year ended June 30 | | 2022 | | | 2021 | | | 2020 | | | 2019 | | | 2018 | |
| Net Asset Value, Beginning of Period | | $24.12 | | | $17.03 | | | $20.84 | | | $22.53 | | | $22.64 | |
| Income/(Loss) from Investment Operations: | | | | | | | | | | | | | | | |
| | Net investment income/(loss)(1) | | (0.03) | | | 0.05 | | | 0.11 | | | 0.18 | | | 0.02 | |
| | Net realized and unrealized gain/(loss) | | (3.22) | | | 7.16 | | | (3.87) | | | (0.40) | | | 1.83 | |
| Total from Investment Operations | | (3.25) | | | 7.21 | | | (3.76) | | | (0.22) | | | 1.85 | |
| Less Dividends and Distributions: | | | | | | | | | | | | | | | |
| | Dividends (from net investment income) | | (0.14) | | | (0.12) | | | (0.05) | | | — | | | — | |
| | Distributions (from capital gains) | | (0.26) | | | — | | | — | | | (1.47) | | | (1.96) | |
| Total Dividends and Distributions | | (0.40) | | | (0.12) | | | (0.05) | | | (1.47) | | | (1.96) | |
| Net Asset Value, End of Period | | $20.47 | | | $24.12 | | | $17.03 | | | $20.84 | | | $22.53 | |
| Total Return* | | (13.73)% | | | 42.49% | | | (18.11)% | | | 0.20% | | | 8.15% | |
| Net Assets, End of Period (in thousands) | | $44,592 | | | $48,908 | | | $33,724 | | | $37,555 | | | $39,887 | |
| Average Net Assets for the Period (in thousands) | | $49,737 | | | $42,169 | | | $36,610 | | | $36,037 | | | $38,061 | |
| Ratios to Average Net Assets**: | | | | | | | | | | | | | | | |
| | Ratio of Gross Expenses | | 1.36% | | | 1.42% | | | 1.61% | | | 1.43% | | | 1.56% | |
| | Ratio of Net Expenses (After Waivers and Expense Offsets) | | 1.36% | | | 1.42% | | | 1.61% | | | 1.43% | | | 1.56% | |
| | Ratio of Net Investment Income/(Loss) | | (0.11)% | | | 0.25% | | | 0.57% | | | 0.87% | | | 0.09% | |
| Portfolio Turnover Rate | | 44% | | | 53% | | | 59% | | | 39% | | | 51% | |
| | | | | | | | | | | | | | | | | | | |
| |
* Total return includes adjustments in accordance with generally accepted accounting principles required at the year or period end and are not annualized for periods of less than one full year. ** Annualized for periods of less than one full year. (1) Per share amounts are calculated based on average shares outstanding during the year or period. |
| | |
See Notes to Financial Statements. |
| |
Janus Investment Fund | 25 |
Janus Henderson Small Cap Value Fund
Financial Highlights
| | | | | | | | | | | | | | | | | | | |
Class S Shares | | | | | | | | | | | | | | | |
For a share outstanding during the year ended June 30 | | 2022 | | | 2021 | | | 2020 | | | 2019 | | | 2018 | |
| Net Asset Value, Beginning of Period | | $24.57 | | | $17.32 | | | $21.23 | | | $22.85 | | | $22.89 | |
| Income/(Loss) from Investment Operations: | | | | | | | | | | | | | | | |
| | Net investment income/(loss)(1) | | 0.03 | | | 0.11 | | | 0.17 | | | 0.24 | | | 0.09 | |
| | Net realized and unrealized gain/(loss) | | (3.28) | | | 7.29 | | | (3.95) | | | (0.39) | | | 1.83 | |
| Total from Investment Operations | | (3.25) | | | 7.40 | | | (3.78) | | | (0.15) | | | 1.92 | |
| Less Dividends and Distributions: | | | | | | | | | | | | | | | |
| | Dividends (from net investment income) | | (0.15) | | | (0.15) | | | (0.13) | | | — | | | — | |
| | Distributions (from capital gains) | | (0.26) | | | — | | | — | | | (1.47) | | | (1.96) | |
| Total Dividends and Distributions | | (0.41) | | | (0.15) | | | (0.13) | | | (1.47) | | | (1.96) | |
| Net Asset Value, End of Period | | $20.91 | | | $24.57 | | | $17.32 | | | $21.23 | | | $22.85 | |
| Total Return* | | (13.49)% | | | 42.91% | | | (17.96)% | | | 0.52% | | | 8.37% | |
| Net Assets, End of Period (in thousands) | | $26,996 | | | $42,715 | | | $43,538 | | | $55,050 | | | $61,772 | |
| Average Net Assets for the Period (in thousands) | | $36,165 | | | $45,978 | | | $56,349 | | | $55,579 | | | $66,582 | |
| Ratios to Average Net Assets**: | | | | | | | | | | | | | | | |
| | Ratio of Gross Expenses | | 1.11% | | | 1.18% | | | 1.36% | | | 1.18% | | | 1.30% | |
| | Ratio of Net Expenses (After Waivers and Expense Offsets) | | 1.11% | | | 1.18% | | | 1.36% | | | 1.18% | | | 1.30% | |
| | Ratio of Net Investment Income/(Loss) | | 0.14% | | | 0.55% | | | 0.87% | | | 1.14% | | | 0.37% | |
| Portfolio Turnover Rate | | 44% | | | 53% | | | 59% | | | 39% | | | 51% | |
| | | | | | | | | | | | | | | | | | | |
| |
* Total return includes adjustments in accordance with generally accepted accounting principles required at the year or period end and are not annualized for periods of less than one full year. ** Annualized for periods of less than one full year. (1) Per share amounts are calculated based on average shares outstanding during the year or period. |
| | |
See Notes to Financial Statements. |
| |
26 | JUNE 30, 2022 |
Janus Henderson Small Cap Value Fund
Financial Highlights
| | | | | | | | | | | | | | | | | | | |
Class T Shares | | | | | | | | | | | | | | | |
For a share outstanding during the year ended June 30 | | 2022 | | | 2021 | | | 2020 | | | 2019 | | | 2018 | |
| Net Asset Value, Beginning of Period | | $24.82 | | | $17.49 | | | $21.44 | | | $23.03 | | | $23.05 | |
| Income/(Loss) from Investment Operations: | | | | | | | | | | | | | | | |
| | Net investment income/(loss)(1) | | 0.10 | | | 0.17 | | | 0.22 | | | 0.30 | | | 0.14 | |
| | Net realized and unrealized gain/(loss) | | (3.33) | | | 7.36 | | | (3.98) | | | (0.40) | | | 1.86 | |
| Total from Investment Operations | | (3.23) | | | 7.53 | | | (3.76) | | | (0.10) | | | 2.00 | |
| Less Dividends and Distributions: | | | | | | | | | | | | | | | |
| | Dividends (from net investment income) | | (0.19) | | | (0.20) | | | (0.19) | | | (0.02) | | | (0.06) | |
| | Distributions (from capital gains) | | (0.26) | | | — | | | — | | | (1.47) | | | (1.96) | |
| Total Dividends and Distributions | | (0.45) | | | (0.20) | | | (0.19) | | | (1.49) | | | (2.02) | |
| Net Asset Value, End of Period | | $21.14 | | | $24.82 | | | $17.49 | | | $21.44 | | | $23.03 | |
| Total Return* | | (13.29)% | | | 43.30% | | | (17.74)% | | | 0.76% | | | 8.69% | |
| Net Assets, End of Period (in thousands) | | $386,007 | | | $574,472 | | | $516,634 | | | $652,049 | | | $787,120 | |
| Average Net Assets for the Period (in thousands) | | $511,237 | | | $555,651 | | | $621,808 | | | $681,320 | | | $805,838 | |
| Ratios to Average Net Assets**: | | | | | | | | | | | | | | | |
| | Ratio of Gross Expenses | | 0.85% | | | 0.92% | | | 1.10% | | | 0.92% | | | 1.05% | |
| | Ratio of Net Expenses (After Waivers and Expense Offsets) | | 0.85% | | | 0.92% | | | 1.10% | | | 0.92% | | | 1.05% | |
| | Ratio of Net Investment Income/(Loss) | | 0.40% | | | 0.78% | | | 1.11% | | | 1.38% | | | 0.60% | |
| Portfolio Turnover Rate | | 44% | | | 53% | | | 59% | | | 39% | | | 51% | |
| | | | | | | | | | | | | | | | | | | |
| |
* Total return includes adjustments in accordance with generally accepted accounting principles required at the year or period end and are not annualized for periods of less than one full year. ** Annualized for periods of less than one full year. (1) Per share amounts are calculated based on average shares outstanding during the year or period. |
| | |
See Notes to Financial Statements. |
| |
Janus Investment Fund | 27 |
Janus Henderson Small Cap Value Fund
Notes to Financial Statements
1. Organization and Significant Accounting Policies
Janus Henderson Small Cap Value Fund (the “Fund”) is a series of Janus Investment Fund (the “Trust”), which is organized as a Massachusetts business trust and is registered under the Investment Company Act of 1940, as amended (the “1940 Act”), as an open-end management investment company, and therefore has applied the specialized accounting and reporting guidance in Financial Accounting Standards Board (“FASB”) Accounting Standards Codification (“ASC”) Topic 946. The Trust offers 38 funds, each of which offers multiple share classes, with differing investment objectives and policies. The Fund seeks capital appreciation. The Fund is classified as diversified, as defined in the 1940 Act. Janus Henderson Investors US LLC (formerly Janus Capital Management LLC) is the investment adviser (the “Adviser”) to the Fund.
The Fund offers multiple classes of shares in order to meet the needs of various types of investors. Each class represents an interest in the same portfolio of investments. Certain financial intermediaries may not offer all classes of shares.
Shareholders, including other funds, individuals, accounts, as well as the Fund’s portfolio manager(s) and/or investment personnel, may from time to time own (beneficially or of record) a significant percentage of the Fund’s Shares and can be considered to “control” the Fund when that ownership exceeds 25% of the Fund’s assets (and which may differ from control as determined in accordance with United States of America generally accepted accounting principles ("US GAAP")).
Class A Shares are offered through financial intermediary platforms including, but not limited to, traditional brokerage platforms, mutual fund wrap fee programs, bank trust platforms, and retirement platforms.
Class C Shares are offered through financial intermediary platforms including, but not limited to, traditional brokerage platforms, mutual fund wrap fee programs, and bank trust platforms.
Class C Shares are closed to investments by new employer-sponsored retirement plans and existing employer-sponsored retirement plans are no longer able to make additional purchases or exchanges into Class C Shares.
The Funds currently implement an automatic conversion feature pursuant to which Class C Shares that have been held for eight years are automatically converted to Class A Shares without the imposition of any sales charge, fee or other charge. The conversion will generally occur no later than ten business days in the month following the month of the eighth anniversary of the date of purchase. Class C Shares purchased through the reinvestment of dividends and other distributions on Class C Shares will convert to Class A Shares at the same time as the original Class C Shares with respect to which they were purchased. For Class C Shares held in omnibus accounts on intermediary platforms, the Fund will rely on these intermediaries to implement this conversion feature. Your financial intermediary may have separate policies and procedures as to when and how Class C Shares may be converted to Class A Shares. Please contact your financial intermediary for additional information.
Effective July 6, 2020, Class D Shares are available to new investors, subject to any closed fund policies for a Fund, as applicable. Previously, Class D Shares were only available to investors who already had a direct account with the Janus Henderson funds; immediate family members or members of the same household of an eligible individual investor; and existing beneficial owners of sole proprietorships or partnerships that hold accounts directly with the Janus Henderson funds.
Class I Shares are available through certain financial intermediary platforms including, but not limited to, mutual fund wrap fee programs, managed account programs, asset allocation programs, bank trust platforms, as well as certain retirement platforms. Class I Shares are also available to certain direct institutional investors including, but not limited to, corporations, certain retirement plans, public plans, and foundations/endowments, who established Class I Share accounts before August 4, 2017.
Class L Shares are designed for pension and profit-sharing plans, employee benefit trusts, endowments, foundations and corporations, as well as high net worth individuals and financial intermediaries who are willing to maintain a minimum account balance of $250,000.
Class N Shares are generally available only to financial intermediaries purchasing on behalf of: 1) certain adviser-assisted, employer-sponsored retirement plans, including 401(k) plans, 457 plans, 403(b) plans, Taft-Hartley multi-employer plans, profit-sharing and money purchase pension plans, defined benefit plans and certain welfare benefit
Janus Henderson Small Cap Value Fund
Notes to Financial Statements
plans, such as health savings accounts, and nonqualified deferred compensation plans; and 2) retail investors purchasing in qualified or nonqualified accounts, whose accounts are held through an omnibus account at their financial intermediary, and where the financial intermediary requires no payment or reimbursement from the Fund, the Adviser, or its affiliates. Class N Shares are also available to Janus Henderson proprietary products and to certain direct institutional investors approved by Janus Henderson Distributors US LLC (formerly Janus Distributors LLC) (the “Distributor”) including, but not limited to, corporations, certain retirement plans, public plans, and foundations and endowments, subject to minimum investment requirements.
Class R Shares are offered through financial intermediary platforms including, but not limited to, retirement platforms.
Class S Shares are offered through financial intermediary platforms including, but not limited to, retirement platforms and asset allocation, mutual fund wrap, or other discretionary or nondiscretionary fee-based investment advisory programs. In addition, Class S Shares may be available through certain financial intermediaries who have an agreement with the Adviser or its affiliates to offer Class S Shares on their supermarket platforms.
Class T Shares are available through certain financial intermediary platforms including, but not limited to, mutual fund wrap fee programs, managed account programs, asset allocation programs, bank trust platforms, as well as certain retirement platforms. In addition, Class T Shares may be available through certain financial intermediaries who have an agreement with the Adviser or its affiliates to offer Class T Shares on their supermarket platforms.
The following accounting policies have been followed by the Fund and are in conformity with US GAAP.
Investment Valuation
Securities held by the Fund are valued in accordance with policies and procedures established by and under the supervision of the Trustees (the “Valuation Procedures”). Equity securities traded on a domestic securities exchange are generally valued at the closing prices on the primary market or exchange on which they trade. If such price is lacking for the trading period immediately preceding the time of determination, such securities are generally valued at their current bid price. Equity securities that are traded on a foreign exchange are generally valued at the closing prices on such markets. In the event that there is no current trading volume on a particular security in such foreign exchange, the bid price from the primary exchange is generally used to value the security. Securities that are traded on the over-the-counter (“OTC”) markets are generally valued at their closing or latest bid prices as available. Foreign securities and currencies are converted to U.S. dollars using the applicable exchange rate in effect at the close of the New York Stock Exchange (“NYSE”). The Fund will determine the market value of individual securities held by it by using prices provided by one or more approved professional pricing services or, as needed, by obtaining market quotations from independent broker-dealers. Most debt securities are valued in accordance with the evaluated bid price supplied by the pricing service that is intended to reflect market value. The evaluated bid price supplied by the pricing service is an evaluation that may consider factors such as security prices, yields, maturities and ratings. Certain short-term securities maturing within 60 days or less may be evaluated and valued on an amortized cost basis provided that the amortized cost determined approximates market value. Securities for which market quotations or evaluated prices are not readily available or deemed unreliable are valued at fair value determined in good faith under the Valuation Procedures. Circumstances in which fair value pricing may be utilized include, but are not limited to: (i) a significant event that may affect the securities of a single issuer, such as a merger, bankruptcy, or significant issuer-specific development; (ii) an event that may affect an entire market, such as a natural disaster or significant governmental action; (iii) a nonsignificant event such as a market closing early or not opening, or a security trading halt; and (iv) pricing of a nonvalued security and a restricted or nonpublic security. Special valuation considerations may apply with respect to “odd-lot” fixed-income transactions which, due to their small size, may receive evaluated prices by pricing services which reflect a large block trade and not what actually could be obtained for the odd-lot position. The Fund uses systematic fair valuation models provided by independent third parties to value international equity securities in order to adjust for stale pricing, which may occur between the close of certain foreign exchanges and the close of the NYSE.
Valuation Inputs Summary
FASB ASC 820, Fair Value Measurements and Disclosures (“ASC 820”), defines fair value, establishes a framework for measuring fair value, and expands disclosure requirements regarding fair value measurements. This standard emphasizes that fair value is a market-based measurement that should be determined based on the assumptions that market participants would use in pricing an asset or liability and establishes a hierarchy that prioritizes inputs to valuation techniques used to measure fair value. These inputs are summarized into three broad levels:
Janus Henderson Small Cap Value Fund
Notes to Financial Statements
Level 1 – Unadjusted quoted prices in active markets the Fund has the ability to access for identical assets or liabilities.
Level 2 – Observable inputs other than unadjusted quoted prices included in Level 1 that are observable for the asset or liability either directly or indirectly. These inputs may include quoted prices for the identical instrument on an inactive market, prices for similar instruments, interest rates, prepayment speeds, credit risk, yield curves, default rates and similar data.
Assets or liabilities categorized as Level 2 in the hierarchy generally include: debt securities fair valued in accordance with the evaluated bid or ask prices supplied by a pricing service; securities traded on OTC markets and listed securities for which no sales are reported that are fair valued at the latest bid price (or yield equivalent thereof) obtained from one or more dealers transacting in a market for such securities or by a pricing service approved by the Fund’s Trustees; certain short-term debt securities with maturities of 60 days or less that are fair valued at amortized cost; and equity securities of foreign issuers whose fair value is determined by using systematic fair valuation models provided by independent third parties in order to adjust for stale pricing which may occur between the close of certain foreign exchanges and the close of the NYSE. Other securities that may be categorized as Level 2 in the hierarchy include, but are not limited to, preferred stocks, bank loans, swaps, investments in unregistered investment companies, options, and forward contracts.
Level 3 – Unobservable inputs for the asset or liability to the extent that relevant observable inputs are not available, representing the Fund’s own assumptions about the assumptions that a market participant would use in valuing the asset or liability, and that would be based on the best information available.
There have been no significant changes in valuation techniques used in valuing any such positions held by the Fund since the beginning of the fiscal year.
The inputs or methodology used for fair valuing securities are not necessarily an indication of the risk associated with investing in those securities. The summary of inputs used as of June 30, 2022 to fair value the Fund’s investments in securities and other financial instruments is included in the “Valuation Inputs Summary” in the Notes to Schedule of Investments and Other Information.
Investment Transactions and Investment Income
Investment transactions are accounted for as of the date purchased or sold (trade date). Dividend income is recorded on the ex-dividend date. Certain dividends from foreign securities will be recorded as soon as the Fund is informed of the dividend, if such information is obtained subsequent to the ex-dividend date. Dividends from foreign securities may be subject to withholding taxes in foreign jurisdictions. Non-cash dividends, if any, are recorded on the ex-dividend date at fair value. Interest income is recorded daily on the accrual basis and includes amortization of premiums and accretion of discounts. The Fund classifies gains and losses on prepayments received as an adjustment to interest income. Debt securities may be placed in non-accrual status and related interest income may be reduced by stopping current accruals and writing off interest receivables when collection of all or a portion of interest has become doubtful. Gains and losses are determined on the identified cost basis, which is the same basis used for federal income tax purposes. Income, as well as gains and losses, both realized and unrealized, are allocated daily to each class of shares based upon the ratio of net assets represented by each class as a percentage of total net assets.
Expenses
The Fund bears expenses incurred specifically on its behalf. Each class of shares bears a portion of general expenses, which are allocated daily to each class of shares based upon the ratio of net assets represented by each class as a percentage of total net assets. Expenses directly attributable to a specific class of shares are charged against the operations of such class.
Estimates
The preparation of financial statements in conformity with US GAAP requires management to make estimates and assumptions that affect the reported amount of assets and liabilities and disclosure of contingent assets and liabilities at the date of the financial statements, and the reported amounts of income and expenses during the reporting period. Actual results could differ from those estimates.
Indemnifications
In the normal course of business, the Fund may enter into contracts that contain provisions for indemnification of other parties against certain potential liabilities. The Fund’s maximum exposure under these arrangements is unknown, and
Janus Henderson Small Cap Value Fund
Notes to Financial Statements
would involve future claims that may be made against the Fund that have not yet occurred. Currently, the risk of material loss from such claims is considered remote.
Foreign Currency Translations
The Fund does not isolate that portion of the results of operations resulting from the effect of changes in foreign exchange rates on investments from the fluctuations arising from changes in market prices of securities held at the date of the financial statements. Net unrealized appreciation or depreciation of investments and foreign currency translations arise from changes in the value of assets and liabilities, including investments in securities held at the date of the financial statements, resulting from changes in the exchange rates and changes in market prices of securities held.
Currency gains and losses are also calculated on payables and receivables that are denominated in foreign currencies. The payables and receivables are generally related to foreign security transactions and income translations.
Foreign currency-denominated assets and forward currency contracts may involve more risks than domestic transactions, including currency risk, counterparty risk, political and economic risk, regulatory risk and equity risk. Risks may arise from unanticipated movements in the value of foreign currencies relative to the U.S. dollar.
Dividends and Distributions
The Fund generally declares and distributes dividends of net investment income and realized capital gains (if any) annually. The Fund may treat a portion of the amount paid to redeem shares as a distribution of investment company taxable income and realized capital gains that are reflected in the net asset value. This practice, commonly referred to as “equalization,” has no effect on the redeeming shareholder or a Fund’s total return, but may reduce the amounts that would otherwise be required to be paid as taxable dividends to the remaining shareholders. It is possible that the Internal Revenue Service (IRS) could challenge the Fund's equalization methodology or calculations, and any such challenge could result in additional tax, interest, or penalties to be paid by the Fund.
The Fund may make certain investments in real estate investment trusts (“REITs”) which pay dividends to their shareholders based upon funds available from operations. It is quite common for these dividends to exceed the REITs’ taxable earnings and profits, resulting in the excess portion of such dividends being designated as a return of capital. If the Fund distributes such amounts, such distributions could constitute a return of capital to shareholders for federal income tax purposes.
Federal Income Taxes
The Fund intends to continue to qualify as a regulated investment company and distribute all of its taxable income in accordance with the requirements of Subchapter M of the Internal Revenue Code. Management has analyzed the Fund’s tax positions taken for all open federal income tax years, generally a three-year period, and has concluded that no provision for federal income tax is required in the Fund’s financial statements. The Fund is not aware of any tax positions for which it is reasonably possible that the total amounts of unrecognized tax benefits will significantly change in the next twelve months.
2. Other Investments and Strategies
Additional Investment Risk
In response to the COVID-19 pandemic, the U.S. government and the Federal Reserve, as well as certain foreign governments and central banks, have taken extraordinary actions to support local and global economies and the financial markets, including reducing interest rates to record-low levels. Extremely low or negative interest rates may become more prevalent or may not work as intended. As there is little precedent for this situation, the impact on various markets that interest rate or other significant policy changes may have is unknown. The withdrawal of this support, a failure of measures put in place in response to such economic uncertainty, or investor perception that such efforts were not sufficient could each negatively affect financial markets generally, and the value and liquidity of specific securities. In addition, policy and legislative changes in the United States and in other countries continue to impact many aspects of financial regulation.
Widespread disease, including pandemics and epidemics, and natural or environmental disasters, including those which may be attributable to global climate change, such as earthquakes, fires, floods, hurricanes, tsunamis and weather-related phenomena generally, have been and can be highly disruptive to economies and markets, adversely impacting individual companies, sectors, industries, markets, currencies, interest and inflation rates, credit ratings, investor sentiment, and other factors affecting the value of a Fund’s investments. Economies and financial markets throughout
Janus Henderson Small Cap Value Fund
Notes to Financial Statements
the world have become increasingly interconnected, which increases the likelihood that events or conditions in one region or country will adversely affect markets or issuers in other regions or countries, including the United States. These disruptions could prevent a Fund from executing advantageous investment decisions in a timely manner and negatively impact a Fund’s ability to achieve its investment objective(s). Any such event(s) could have a significant adverse impact on the value of a Fund. In addition, these disruptions could also impair the information technology and other operational systems upon which the Fund’s service providers, including the Adviser or the subadviser (as applicable), rely, and could otherwise disrupt the ability of employees of the Fund’s service providers to perform essential tasks on behalf of the Fund. Adverse weather conditions may also have a particularly significant negative effect on issuers in the agricultural sector and on insurance and reinsurance companies that insure or reinsure against the impact of natural disasters.
A number of countries in the European Union (the “EU”) have experienced, and may continue to experience, severe economic and financial difficulties. In particular, many EU nations are susceptible to economic risks associated with high levels of debt. Many non-governmental issuers, and even certain governments, have defaulted on, or been forced to restructure, their debts. Many other issuers have faced difficulties obtaining credit or refinancing existing obligations. Financial institutions have in many cases required government or central bank support, have needed to raise capital, and/or have been impaired in their ability to extend credit. As a result, financial markets in the EU have experienced extreme volatility and declines in asset values and liquidity. These difficulties may continue, worsen, or spread further within the EU. Responses to these financial problems by European governments, central banks, and others, including austerity measures and reforms, may not work, may result in social unrest, and may limit future growth and economic recovery or have other unintended consequences. Among other things, these developments have adversely affected the value and exchange rate of the euro and pound sterling, and may continue to significantly affect the economies of all EU countries, which in turn may have a material adverse effect on the Fund’s investments in such countries, other countries that depend on EU countries for significant amounts of trade or investment, or issuers with exposure to debt issued by certain EU countries.
Counterparties
Fund transactions involving a counterparty are subject to the risk that the counterparty or a third party will not fulfill its obligation to the Fund (“counterparty risk”). Counterparty risk may arise because of the counterparty’s financial condition (i.e., financial difficulties, bankruptcy, or insolvency), market activities and developments, or other reasons, whether foreseen or not. A counterparty’s inability to fulfill its obligation may result in significant financial loss to the Fund. The Fund may be unable to recover its investment from the counterparty or may obtain a limited recovery, and/or recovery may be delayed. The extent of the Fund’s exposure to counterparty risk with respect to financial assets and liabilities approximates its carrying value. See the "Offsetting Assets and Liabilities" section of this Note for further details.
The Fund may be exposed to counterparty risk through participation in various programs, including, but not limited to, lending its securities to third parties, cash sweep arrangements whereby the Fund’s cash balance is invested in one or more types of cash management vehicles, as well as investments in, but not limited to, repurchase agreements, debt securities, and derivatives, including various types of swaps, futures and options. The Fund intends to enter into financial transactions with counterparties that the Adviser believes to be creditworthy at the time of the transaction. There is always the risk that the Adviser’s analysis of a counterparty’s creditworthiness is incorrect or may change due to market conditions. To the extent that the Fund focuses its transactions with a limited number of counterparties, it will have greater exposure to the risks associated with one or more counterparties.
Offsetting Assets and Liabilities
The Fund presents gross and net information about transactions that are either offset in the financial statements or subject to an enforceable master netting arrangement or similar agreement with a designated counterparty, regardless of whether the transactions are actually offset in the Statement of Assets and Liabilities.
The Offsetting Assets and Liabilities table located in the Schedule of Investments presents gross amounts of recognized assets and/or liabilities and the net amounts after deducting collateral that has been pledged by counterparties or has been pledged to counterparties (if applicable). For corresponding information grouped by type of instrument, see the Fund's Schedule of Investments.
All repurchase agreements are transacted under legally enforceable master repurchase agreements that give the Fund, in the event of default by the counterparty, the right to liquidate securities held and to offset receivables and payables with the counterparty. For financial reporting purposes, the Fund does not offset financial instruments' payables and
Janus Henderson Small Cap Value Fund
Notes to Financial Statements
receivables and related collateral on the Statement of Assets and Liabilities. Repurchase agreements held by the Fund are fully collateralized, and such collateral is in the possession of the Fund’s custodian or, for tri-party agreements, the custodian designated by the agreement. The collateral is evaluated daily to ensure its market value exceeds the current market value of the repurchase agreements, including accrued interest.
Real Estate Investing
The Fund may invest in equity and debt securities of real estate-related companies. Such companies may include those in the real estate industry or real estate-related industries. These securities may include common stocks, corporate bonds, preferred stocks, and other equity securities, including, but not limited to, mortgage-backed securities, real estate-backed securities, securities of REITs and similar REIT-like entities. A REIT is a trust that invests in real estate-related projects, such as properties, mortgage loans, and construction loans. REITs are generally categorized as equity, mortgage, or hybrid REITs. A REIT may be listed on an exchange or traded OTC.
Repurchase Agreements
The Fund and other funds advised by the Adviser or its affiliates may transfer daily uninvested cash balances into one or more joint trading accounts. Assets in the joint trading accounts are invested in money market instruments and the proceeds are allocated to the participating funds on a pro rata basis.
Repurchase agreements held by the Fund are fully collateralized, and such collateral is in the possession of the Fund’s custodian or, for tri-party agreements, the custodian designated by the agreement. The collateral is evaluated daily to ensure its market value exceeds the current market value of the repurchase agreements, including accrued interest. In the event of default on the obligation to repurchase, the Fund has the right to liquidate the collateral and apply the proceeds in satisfaction of the obligation. In the event of default or bankruptcy by the other party to the agreement, realization and/or retention of the collateral or proceeds may be subject to legal proceedings.
3. Investment Advisory Agreements and Other Transactions with Affiliates
The Fund pays the Adviser an investment advisory fee rate that may adjust up or down based on the Fund’s performance relative to its benchmark index.
The investment advisory fee rate paid to the Adviser by the Fund consists of two components: (1) a base fee calculated by applying the contractual fixed rate of the advisory fee to the Fund’s average daily net assets during the previous month (the “Base Fee Rate”), plus or minus (2) a performance-fee adjustment (the “Performance Adjustment”) calculated by applying a variable rate of up to 0.15% (positive or negative) to the Fund’s average daily net assets based on the Fund’s relative performance compared to the cumulative investment record of its benchmark index over a 36-month performance measurement period or shorter time period, as applicable. The investment advisory fee rate is calculated daily and paid monthly.
The investment performance of the Fund’s Class A Shares (waiving the upfront sales load) for the performance measurement period is used to calculate the Performance Adjustment. The Fund’s Base Fee Rate prior to any performance adjustment (expressed as an annual rate) is 0.72%, and the Fund’s benchmark index used in the calculation is the Russell 2000® Value Index.
No Performance Adjustment is applied unless the difference between the Fund’s investment performance and the cumulative investment record of the Fund’s benchmark index is 0.50% or greater (positive or negative) during the applicable performance measurement period. The Base Fee Rate is subject to an upward or downward Performance Adjustment for every full 0.50% increment by which the Fund outperforms or underperforms its benchmark index, up to the Fund’s full performance rate of ±5.50%. Because the Performance Adjustment is tied to a Fund’s relative performance compared to its benchmark index (and not its absolute performance), the Performance Adjustment could increase the Adviser’s fee even if the Fund’s Shares lose value during the performance measurement period and could decrease the Adviser’s fee even if the Fund’s Shares increase in value during the performance measurement period. For purposes of computing the Base Fee Rate and the Performance Adjustment, net assets are averaged over different periods (average daily net assets during the previous month for the Base Fee Rate, versus average daily net assets during the performance measurement period for the Performance Adjustment). Performance of the Fund is calculated net of expenses whereas the Fund’s benchmark index does not have any fees or expenses. Reinvestment of dividends and distributions is included in calculating both the performance of a Fund and the Fund’s benchmark index.
The Fund’s prospectuses and statement(s) of additional information contain additional information about performance-based fees. The amount shown as advisory fees on the Statement of Operations reflects the Base Fee Rate plus/minus
Janus Henderson Small Cap Value Fund
Notes to Financial Statements
any Performance Adjustment. For the year ended June 30, 2022, the performance adjusted investment advisory fee rate before any waivers and/or reimbursements of expenses is 0.58%.
The Adviser has contractually agreed to waive the investment advisory fee and/or reimburse operating expenses to the extent that the Fund’s total annual fund operating expenses, excluding any performance adjustments to management fees, the fees payable pursuant to a Rule 12b-1 plan, shareholder servicing fees, such as transfer agency fees (including out-of-pocket costs), administrative services fees and any networking/omnibus payable by any share class, brokerage commissions, interest, dividends, taxes, acquired fund fees and expenses, and extraordinary expenses, exceed the annual rate of 0.91% of the Fund’s average daily net assets. The Adviser has agreed to continue the waivers for at least a one-year period commencing October 28, 2021. If applicable, amounts waived and/or reimbursed to the Fund by the Adviser are disclosed as “Excess Expense Reimbursement and Waivers” on the Statement of Operations.
The Adviser serves as administrator to the Fund pursuant to an administration agreement between the Adviser and the Trust. Under the administration agreement, the Adviser is authorized to perform, or cause others to perform certain administration, compliance, and accounting services to the Fund, including providing office space for the Fund, and is reimbursed by the Fund for certain of its costs in providing these services (to the extent the Adviser seeks reimbursement and such costs are not otherwise waived). In addition, employees of the Adviser and/or its affiliates may serve as officers of the Trust. The Fund pays for some or all of the salaries, fees, and expenses of the Adviser employees and Fund officers, with respect to certain specified administration functions they perform on behalf of the Fund. The Fund pays these costs based on out-of-pocket expenses incurred by the Adviser, and these costs are separate and apart from advisory fees and other expenses paid in connection with the investment advisory services the Adviser (or any subadvisor, as applicable) provides to the Fund. These amounts are disclosed as “Affiliated fund administration fees” on the Statement of Operations. In addition, some expenses related to compensation payable to the Fund’s Chief Compliance Officer and certain compliance staff, all of whom are employees of the Adviser and/or its affiliates, are shared with the Fund. Total compensation of $474,228 was paid to the Chief Compliance Officer and certain compliance staff by the Trust during the year ended June 30, 2022. The Fund's portion is reported as part of “Other expenses” on the Statement of Operations.
Janus Henderson Services US LLC (formerly Janus Services LLC) (the “Transfer Agent”), a wholly-owned subsidiary of the Adviser, is the Fund’s transfer agent. The Transfer Agent provides or arranges for the provision of shareholder services including, but not limited to, recordkeeping, subaccounting, answering inquiries regarding accounts, order processing, transaction confirmations, the mailing of prospectuses and shareholder reports, and other shareholder services provided to or on behalf of shareholders. These amounts are disclosed as “Transfer agent administrative fees and expenses” on the Statement of Operations.
Class D Shares of the Fund pay the Transfer Agent an annual administrative services fee based on the average daily net assets of Class D Shares as detailed below.
| | |
Average Daily Net Assets of Class D Shares of the Janus Henderson funds | Administrative Services Fee |
Under $40 billion | 0.12% |
$40 billion – $49.9 billion | 0.10% |
Over $49.9 billion | 0.08% |
During the reporting period, the administrative services fee rate was 0.11%.
The Transfer Agent receives an administrative services fee at an annual rate of up to 0.25% of the average daily net assets of the Fund’s Class R Shares, Class S Shares, and Class T Shares for providing or procuring administrative services to investors in Class R Shares, Class S Shares, and Class T Shares of the Fund. The Transfer Agent expects to use all or a significant portion of this fee to compensate retirement plan service providers, broker-dealers, bank trust departments, financial advisors, and other financial intermediaries for providing these services. The Transfer Agent may keep certain amounts retained for reimbursement of out-of-pocket costs incurred for servicing clients of Class R Shares, Class S Shares, and Class T Shares.
The Transfer Agent receives an administrative fee based on the average daily net assets Class L Shares of the Fund based on the average proportion of the Fund’s total net assets sold directly and the average proportion of the Fund’s net assets sold through financial intermediaries on a monthly basis. The asset-weighted fee is calculated by applying a blended annual fee rate of 0.12% on average net assets for the proportion of assets sold directly and 0.25% on
Janus Henderson Small Cap Value Fund
Notes to Financial Statements
average net assets for the proportion of assets sold through financial intermediaries. These amounts are disclosed as “Transfer agent administrative fees and expenses” on the Statement of Operations. The Transfer Agent has agreed to waive all or a portion of this fee. Such waiver is voluntary and could change or be terminated at any time at the discretion of the Transfer Agent or the Adviser without prior notification to shareholders. Removal of this fee waiver may have a significant impact on Class L Shares’ total expense ratio. If applicable, amounts waived to the Fund by the Adviser are disclosed as “Excess Expense Reimbursement and Waivers” on the Statement of Operations.
Shareholder Services provided by these financial intermediaries may include, but are not limited to, recordkeeping, subaccounting, order processing, providing order confirmations, periodic statements, forwarding prospectuses, shareholder reports, and other materials to existing customers, answering inquiries regarding accounts, and other administrative services. Order processing includes the submission of transactions through the National Securities Clearing Corporation (“NSCC”) or similar systems, or those processed on a manual basis with the Adviser. For all share classes, the Transfer Agent also seeks reimbursement for costs it incurs as transfer agent and for providing servicing.
Certain, but not all, intermediaries may charge administrative fees to investors in Class A Shares, Class C Shares, and Class I Shares for administrative services provided on behalf of such investors. These administrative fees are paid by the Class A Shares, Class C Shares, and Class I Shares of the Fund to the Transfer Agent, which uses such fees to reimburse intermediaries. Consistent with the Transfer Agency Agreement between the Transfer Agent and the Fund, the Transfer Agent may negotiate the level, structure, and/or terms of the administrative fees with intermediaries requiring such fees on behalf of the Fund. The Adviser and its affiliates benefit from an increase in assets that may result from such relationships. The Adviser has agreed to limit these fees up to 0.20% for Class A Shares and Class C Shares, and up to 0.15% for Class I Shares on an annual basis based on the daily net assets of each share class. Such limits are subject to change by the Trustees in the future. These amounts are disclosed as “Transfer agent networking and omnibus fees” on the Statement of Operations.
The Transfer Agent is not compensated for its services related to the shares, except for out-of-pocket costs, although the Transfer Agent is compensated for its services related to Fund’s Class L Shares and Class D Shares. These amounts are disclosed as “Other transfer agent fees and expenses” on the Statement of Operations.
Under distribution and shareholder servicing plans (the “Plans”) adopted in accordance with Rule 12b-1 under the 1940 Act, the Fund pays the Trust’s distributor, the Distributor, a wholly-owned subsidiary of the Adviser, a fee for the sale and distribution and/or shareholder servicing of the shares based on the average daily net assets for each share class at an annual rate of up to 0.25% for Class A Shares, up to 1.00% for Class C Shares, up to 0.50% for Class R Shares, and up to 0.25% for Class S Shares. Under the terms of the Plans, the Trust is authorized to make payments to the Distributor for remittance to retirement plan service providers, broker-dealers, bank trust departments, financial advisors, and other financial intermediaries, as compensation for distribution and/or shareholder services performed by such entities for their customers who are investors in the Fund. These amounts are disclosed as “12b-1 Distribution and shareholder servicing fees” on the Statement of Operations.
Class A Shares include a 5.75% upfront sales charge of the offering price of the Fund. The sales charge is allocated between the Distributor and financial intermediaries. During the year ended June 30, 2022, the Distributor retained upfront sales charges of $2,077.
A contingent deferred sales charge (“CDSC”) of 1.00% will be deducted with respect to Class A Shares purchased without a sales load and redeemed within 12 months of purchase, unless waived. Any applicable CDSC will be 1.00% of the lesser of the original purchase price or the value of the redemption of the Class A Shares redeemed. There were no CDSCs paid by redeeming shareholders of Class A Shares to the Distributor during the year ended June 30, 2022.
A CDSC of 1.00% will be deducted with respect to Class C Shares redeemed within 12 months of purchase, unless waived. Any applicable CDSC will be 1.00% of the lesser of the original purchase price or the value of the redemption of the Class C Shares redeemed. During the year ended June 30, 2022, redeeming shareholders of Class C Shares paid CDSCs of $207.
The Board of Trustees has adopted a deferred compensation plan (the “Deferred Plan”) for independent Trustees to elect to defer receipt of all or a portion of the annual compensation they are entitled to receive from the Fund. All deferred fees are credited to an account established in the name of the Trustees. The amounts credited to the account then increase or decrease, as the case may be, in accordance with the performance of one or more of the Janus Henderson funds that are selected by the Trustees. The account balance continues to fluctuate in accordance with the
Janus Henderson Small Cap Value Fund
Notes to Financial Statements
performance of the selected fund or funds until final payment of all amounts are credited to the account. The fluctuation of the account balance is recorded by the Fund as unrealized appreciation/(depreciation) and is included as of June 30, 2022 on the Statement of Assets and Liabilities in the asset, “Trustees’ deferred compensation,” and liability, “Trustees’ deferred compensation fees.” Additionally, the recorded unrealized appreciation/(depreciation) is included in “Total distributable earnings (loss)” on the Statement of Assets and Liabilities. Deferred compensation expenses for the year ended June 30, 2022 are included in “Trustees’ fees and expenses” on the Statement of Operations. Trustees are allowed to change their designation of mutual funds from time to time. Amounts will be deferred until distributed in accordance with the Deferred Plan. Deferred fees of $431,326 were paid by the Trust to the Trustees under the Deferred Plan during the year ended June 30, 2022.
Any purchases and sales, realized gains/losses and recorded dividends from affiliated investments during the year ended June 30, 2022 can be found in the “Schedules of Affiliated Investments” located in the Schedule of Investments.
The Fund is permitted to purchase or sell securities (“cross-trade”) between itself and other funds or accounts managed by the Adviser in accordance with Rule 17a-7 under the Investment Company Act of 1940 (“Rule 17a-7”), when the transaction is consistent with the investment objectives and policies of the Fund and in accordance with the Internal Cross Trade Procedures adopted by the Trust’s Board of Trustees. These procedures have been designed to ensure that any cross-trade of securities by the Fund from or to another fund or account that is or could be considered an affiliate of the Fund under certain limited circumstances by virtue of having a common investment adviser, common Officer, or common Trustee complies with Rule 17a-7. Under these procedures, each cross-trade is effected at the current market price to save costs where allowed. During the year ended June 30, 2022, the Fund engaged in cross trades amounting to $266,438 in purchases and $6,687,323 in sales, resulting in a net realized loss of $553,823. The net realized loss is included within the “Net Realized Gain/(Loss) on Investments” section of the Fund’s Statement of Operations.
4. Federal Income Tax
The tax components of capital shown in the table below represent: (1) distribution requirements the Fund must satisfy under the income tax regulations; (2) losses or deductions the Fund may be able to offset against income and gains realized in future years; and (3) unrealized appreciation or depreciation of investments for federal income tax purposes.
Other book to tax differences primarily consist of deferred compensation. The Fund has elected to treat gains and losses on forward foreign currency contracts as capital gains and losses, if applicable. Other foreign currency gains and losses on debt instruments are treated as ordinary income for federal income tax purposes pursuant to Section 988 of the Internal Revenue Code.
| | | | | | | | |
| | | Loss Deferrals | Other Book | Net Tax | |
Undistributed
Ordinary Income | Undistributed
Long-Term Gains | Accumulated
Capital Losses | Late-Year
Ordinary Loss | Post-October
Capital Loss | to Tax
Differences | Appreciation/
(Depreciation) | |
$ 15,633,346 | $ 107,722,606 | $ - | $ - | $ - | $ (71,391) | $291,038,492 | |
During the year ended June 30, 2022, capital loss carryovers of $69,224,055 were utilized by the Fund.
The aggregate cost of investments and the composition of unrealized appreciation and depreciation of investment securities for federal income tax purposes as of June 30, 2022 are noted below. The primary difference between book and tax appreciation or depreciation of investments is wash sale loss deferrals.
| | | | |
Federal Tax Cost | Unrealized
Appreciation | Unrealized
(Depreciation) | Net Tax Appreciation/
(Depreciation) |
$2,410,349,472 | $456,337,974 | $(165,299,482) | $291,038,492 |
Janus Henderson Small Cap Value Fund
Notes to Financial Statements
Income and capital gains distributions are determined in accordance with income tax regulations that may differ from US GAAP. These differences are due to differing treatments for items such as net short-term gains, deferral of wash sale losses, foreign currency transactions, and capital loss carryovers. Certain permanent differences such as tax returns of capital and net investment losses noted below have been reclassified to capital.
| | | | | |
For the year ended June 30, 2022 | |
Distributions | | |
From Ordinary Income | From Long-Term Capital Gains | Tax Return of Capital | Net Investment Loss | |
$ 31,292,352 | $ 38,422,027 | $ - | $ - | |
| | | | | |
For the year ended June 30, 2021 | |
Distributions | | |
From Ordinary Income | From Long-Term Capital Gains | Tax Return of Capital | Net Investment Loss | |
$ 39,121,996 | $ - | $ - | $ - | |
Permanent book to tax basis differences may result in reclassifications between the components of net assets. These differences have no impact on the results of operations or net assets. The following reclassifications have been made to the Fund:
| | | |
| | |
Increase/(Decrease) to Capital | Increase/(Decrease) to Undistributed
Net Investment Income/Loss | Increase/(Decrease) to Undistributed
Net Realized Gain/Loss |
$ 22,771,706 | $ (2,175,293) | $ (20,596,413) |
Capital has been adjusted by $22,771,706, including $21,034,667 of long-term capital gain, for distributions in connection with Fund share redemptions (tax equalization).
Janus Henderson Small Cap Value Fund
Notes to Financial Statements
5. Capital Share Transactions
| | | | | | | |
| | | | | | |
| | Year ended June 30, 2022 | | Year ended June 30, 2021 |
| | Shares | Amount | | Shares | Amount |
| | | | | | | |
Class A Shares: | | | | | |
Shares sold | 502,071 | $ 12,324,447 | | 841,439 | $ 17,947,735 |
Reinvested dividends and distributions | 19,815 | 498,339 | | 12,261 | 256,501 |
Shares repurchased | (1,906,388) | (45,548,778) | | (1,711,882) | (36,915,992) |
Net Increase/(Decrease) | (1,384,502) | $ (32,725,992) | | (858,182) | $ (18,711,756) |
Class C Shares: | | | | | |
Shares sold | 51,858 | $ 1,184,720 | | 104,790 | $ 2,058,655 |
Reinvested dividends and distributions | 13,998 | 327,829 | | 2,034 | 39,809 |
Shares repurchased | (164,576) | (3,722,734) | | (400,640) | (7,782,125) |
Net Increase/(Decrease) | (98,720) | $ (2,210,185) | | (293,816) | $ (5,683,661) |
Class D Shares: | | | | | |
Shares sold | 246,003 | $ 6,013,235 | | 494,729 | $ 11,355,208 |
Reinvested dividends and distributions | 76,267 | 1,901,327 | | 45,346 | 939,110 |
Shares repurchased | (583,549) | (14,081,136) | | (1,164,499) | (23,470,792) |
Net Increase/(Decrease) | (261,279) | $ (6,166,574) | | (624,424) | $ (11,176,474) |
Class I Shares: | | | | | |
Shares sold | 13,316,385 | $ 324,356,312 | | 28,795,860 | $ 607,524,654 |
Reinvested dividends and distributions | 1,371,811 | 34,350,140 | | 930,947 | 19,363,696 |
Shares repurchased | (32,181,491) | (783,667,233) | | (34,811,441) | (747,393,469) |
Net Increase/(Decrease) | (17,493,295) | $(424,960,781) | | (5,084,634) | $(120,505,119) |
Class L Shares: | | | | | |
Shares sold | 89,379 | $ 2,255,291 | | 186,268 | $ 4,317,025 |
Reinvested dividends and distributions | 72,633 | 1,876,099 | | 49,634 | 1,063,163 |
Shares repurchased | (718,940) | (18,179,704) | | (964,189) | (20,385,451) |
Net Increase/(Decrease) | (556,928) | $ (14,048,314) | | (728,287) | $ (15,005,263) |
Class N Shares: | | | | | |
Shares sold | 9,219,322 | $ 232,336,998 | | 15,982,981 | $ 331,650,525 |
Reinvested dividends and distributions | 618,226 | 15,455,657 | | 424,420 | 8,806,725 |
Shares repurchased | (19,252,161) | (465,612,666) | | (17,945,108) | (383,569,565) |
Net Increase/(Decrease) | (9,414,613) | $(217,820,011) | | (1,537,707) | $ (43,112,315) |
Class R Shares: | | | | | |
Shares sold | 425,497 | $ 10,043,495 | | 419,175 | $ 8,571,509 |
Reinvested dividends and distributions | 34,389 | 834,969 | | 12,304 | 249,155 |
Shares repurchased | (309,137) | (7,329,715) | | (384,583) | (8,052,800) |
Net Increase/(Decrease) | 150,749 | $ 3,548,749 | | 46,896 | $ 767,864 |
Class S Shares: | | | | | |
Shares sold | 225,119 | $ 5,399,452 | | 508,347 | $ 10,263,991 |
Reinvested dividends and distributions | 24,901 | 616,559 | | 17,425 | 358,961 |
Shares repurchased | (696,995) | (17,135,144) | | (1,300,490) | (27,667,147) |
Net Increase/(Decrease) | (446,975) | $ (11,119,133) | | (774,718) | $ (17,044,195) |
Class T Shares: | | | | | |
Shares sold | 1,396,696 | $ 33,944,957 | | 5,764,980 | $ 118,686,803 |
Reinvested dividends and distributions | 375,679 | 9,391,965 | | 248,702 | 5,165,550 |
Shares repurchased | (6,657,712) | (160,071,440) | | (12,398,768) | (259,351,788) |
Net Increase/(Decrease) | (4,885,337) | $(116,734,518) | | (6,385,086) | $(135,499,435) |
Janus Henderson Small Cap Value Fund
Notes to Financial Statements
6. Purchases and Sales of Investment Securities
For the year ended June 30, 2022, the aggregate cost of purchases and proceeds from sales of investment securities (excluding any short-term securities, short-term options contracts, TBAs, and in-kind transactions, as applicable) was as follows:
| | | | |
Purchases of
Securities | Proceeds from Sales
of Securities | Purchases of Long-
Term U.S. Government
Obligations | Proceeds from Sales
of Long-Term U.S.
Government Obligations |
$1,514,828,216 | $2,364,530,502 | $ - | $ - |
7. Subsequent Event
Management has evaluated whether any events or transactions occurred subsequent to June 30, 2022 and through the date of issuance of the Fund's financial statements and determined that there were no material events or transactions that would require recognition or disclosure in the Fund’s financial statements.
Janus Henderson Small Cap Value Fund
Report of Independent Registered Public Accounting Firm
To the Board of Trustees of Janus Investment Fund and Shareholders of Janus Henderson Small Cap Value Fund
Opinion on the Financial Statements
We have audited the accompanying statement of assets and liabilities, including the schedule of investments, of Janus Henderson Small Cap Value Fund (one of the funds constituting Janus Investment Fund, referred to hereafter as the “Fund”) as of June 30, 2022, the related statement of operations for the year ended June 30, 2022, the statements of changes in net assets for each of the two years in the period ended June 30, 2022, including the related notes, and the financial highlights for each of the five years in the period ended June 30, 2022 (collectively referred to as the “financial statements”). In our opinion, the financial statements present fairly, in all material respects, the financial position of the Fund as of June 30, 2022, the results of its operations for the year then ended, the changes in its net assets for each of the two years in the period ended June 30, 2022 and the financial highlights for each of the five years in the period ended June 30, 2022 in conformity with accounting principles generally accepted in the United States of America.
Basis for Opinion
These financial statements are the responsibility of the Fund’s management. Our responsibility is to express an opinion on the Fund’s financial statements based on our audits. We are a public accounting firm registered with the Public Company Accounting Oversight Board (United States) (PCAOB) and are required to be independent with respect to the Fund in accordance with the U.S. federal securities laws and the applicable rules and regulations of the Securities and Exchange Commission and the PCAOB.
We conducted our audits of these financial statements in accordance with the standards of the PCAOB. Those standards require that we plan and perform the audit to obtain reasonable assurance about whether the financial statements are free of material misstatement, whether due to error or fraud.
Our audits included performing procedures to assess the risks of material misstatement of the financial statements, whether due to error or fraud, and performing procedures that respond to those risks. Such procedures included examining, on a test basis, evidence regarding the amounts and disclosures in the financial statements. Our audits also included evaluating the accounting principles used and significant estimates made by management, as well as evaluating the overall presentation of the financial statements. Our procedures included confirmation of securities owned as of June 30, 2022 by correspondence with the custodian and brokers; when replies were not received from brokers, we performed other auditing procedures. We believe that our audits provide a reasonable basis for our opinion.

Denver, Colorado
August 19, 2022
We have served as the auditor of one or more investment companies in Janus Henderson Funds since 1990.
Janus Henderson Small Cap Value Fund
Additional Information (unaudited)
Proxy Voting Policies and Voting Record
A description of the policies and procedures that the Fund uses to determine how to vote proxies relating to its portfolio securities is available without charge: (i) upon request, by calling 1-800-525-1093; (ii) on the Fund’s website at janushenderson.com/proxyvoting; and (iii) on the SEC’s website at http://www.sec.gov. Additionally, information regarding the Fund’s proxy voting record for the most recent twelve-month period ended June 30 is also available, free of charge, through janushenderson.com/proxyvoting and from the SEC’s website at http://www.sec.gov.
Full Holdings
The Fund files its complete portfolio holdings (schedule of investments) with the SEC as an exhibit to Form N-PORT within 60 days of the end of the first and third fiscal quarters, and in the annual report and semiannual report to shareholders. The Fund’s Form N-PORT filings and annual and semiannual reports: (i) are available on the SEC’s website at http://www.sec.gov; (ii) may be reviewed and copied at the SEC’s Public Reference Room in Washington, D.C. (information on the Public Reference Room may be obtained by calling 1-800-SEC-0330); and (iii) are available without charge, upon request, by calling a Janus Henderson representative at 1-877-335-2687 (toll free) (or 1-800-525-3713 if you hold Class D shares). Portfolio holdings consisting of at least the names of the holdings are generally available on a monthly basis with a 30-day lag under Full Holdings for the Fund at janushenderson.com/info (or janushenderson.com/reports if you hold Class D Shares).
APPROVAL OF ADVISORY AGREEMENTS DURING THE PERIOD
The Trustees of Janus Aspen Series, each of whom serves as an “independent” Trustee (the “Trustees”), oversee the management of each portfolio of Janus Aspen Series (each, a “VIT Portfolio,” and collectively, the “VIT Portfolios”), as well as each fund of Janus Investment Fund (each, a “Fund,” and collectively, the “Funds” and together with the VIT Portfolios, the “Janus Henderson Funds,” and each, a “Janus Henderson Fund”). As required by law, the Trustees determine annually whether to continue the investment advisory agreement for each Janus Henderson Fund and the subadvisory agreement for each Janus Henderson Fund that utilizes a subadviser.
In connection with their most recent consideration of those agreements for each Janus Henderson Fund, the Trustees received and reviewed information provided by Janus Henderson Investors US LLC (formerly, Janus Capital Management LLC) (the “Adviser”) and the subadviser in response to requests of the Trustees and their independent legal counsel. They also received and reviewed information and analysis provided by, and in response to requests of, their independent fee consultant. Throughout their consideration of the agreements, the Trustees were advised by their independent legal counsel. The Trustees met with management to consider the agreements, and also met separately in executive session with their independent legal counsel and their independent fee consultant.
At meetings held on November 3-4, 2021 and December 7-8, 2021, the Trustees’ evaluated the information provided by the Adviser, the subadviser, and the independent fee consultant, as well as other information addressed during the year. Following such evaluation, the Trustees determined that the overall arrangements between each Janus Henderson Fund and the Adviser and each subadviser, as applicable, were fair and reasonable in light of the nature, extent and quality of the services provided by the Adviser, its affiliates and the subadviser, the fees charged for those services, and other matters that the Trustees considered relevant in the exercise of their business judgment and unanimously approved the continuation of the investment advisory agreement for each Janus Henderson Fund and the subadvisory agreement for each subadvised Janus Henderson Fund, for the period from February 1, 2022 through February 1, 2023, subject to earlier termination as provided for in each agreement.
In considering the continuation of those agreements, the Trustees reviewed and analyzed various factors that they determined were relevant, including the factors described below, none of which by itself was considered dispositive. However, the material factors and conclusions that formed the basis for the Trustees’ determination to approve the continuation of the agreements are discussed separately below. Also included is a summary of the independent fee consultant’s conclusions and opinions that arose during, and were included as part of, the Trustees’ consideration of the agreements. “Management fees,” as used herein, reflect actual annual advisory fees and, for the purpose of peer comparisons any administration fees (excluding out of pocket costs), net of any waivers, paid by a fund as a percentage of average net assets.
Nature, Extent and Quality of Services
The Trustees reviewed the nature, extent and quality of the services provided by the Adviser and the subadviser to the Janus Henderson Funds, taking into account the investment objective, strategies and policies of each Janus Henderson
Janus Henderson Small Cap Value Fund
Additional Information (unaudited)
Fund, and the knowledge the Trustees gained from their regular meetings with management on at least a quarterly basis and their ongoing review of information related to the Janus Henderson Funds. In addition, the Trustees reviewed the resources and key personnel of the Adviser and the subadviser, particularly noting those employees who provide investment and risk management services to the Janus Henderson Funds. The Trustees also considered other services provided to the Janus Henderson Funds by the Adviser or the subadviser, such as managing the execution of portfolio transactions and the selection of broker-dealers for those transactions. The Trustees considered the Adviser’s role as administrator to the Janus Henderson Funds, noting that the Adviser generally does not receive a fee for its services as administrator, but is reimbursed for its out-of-pocket costs. The Trustees considered the role of the Adviser in monitoring adherence to the Janus Henderson Funds’ investment restrictions, providing support services for the Trustees and Trustee committees, and overseeing communications with shareholders and the activities of other service providers, including monitoring compliance with various policies and procedures of the Janus Henderson Funds and with applicable securities laws and regulations.
In this regard, the independent fee consultant noted that the Adviser provides a number of different services for the Janus Henderson Funds and fund shareholders, ranging from investment management services to various other servicing functions, and that, in its view, the Adviser is a capable provider of those services. The independent fee consultant also provided its belief that the Adviser has developed a number of institutional competitive advantages that should enable it to provide superior investment and service performance over the long term.
The Trustees concluded that the nature, extent and quality of the services provided by the Adviser and the subadviser to each Janus Henderson Fund were appropriate and consistent with the terms of the respective advisory and subadvisory agreements, and that, taking into account steps taken to address those Janus Henderson Funds whose performance lagged that of their peers for certain periods, the Janus Henderson Funds were likely to benefit from the continued provision of those services. They also concluded that the Adviser and the subadviser had sufficient personnel, with the appropriate education and experience, to serve the Janus Henderson Funds effectively and each had demonstrated its ability to attract well-qualified personnel.
Performance of the Funds
The Trustees considered the performance results of each Janus Henderson Fund over various time periods. They noted that they considered Janus Henderson Fund performance data throughout the year, including periodic meetings with each Janus Henderson Fund’s portfolio manager(s), and also reviewed information comparing each Janus Henderson Fund’s performance with the performance of comparable funds and peer groups identified by Broadridge Financial Solutions, Inc. (“Broadridge”), an independent data provider, and with the Janus Henderson Fund’s benchmark index. In this regard, the independent fee consultant found that the overall Janus Henderson Funds’ performance has been reasonable: for the 36 months ended September 30, 2021, approximately 55% of the Janus Henderson Funds were in the top two quartiles of performance versus Broadridge peers, and for the 12 months ended September 30, 2021, approximately 45% of the Janus Henderson Funds were in the top two quartiles of performance versus Broadridge peers.
The Trustees considered the performance of each Fund, noting that performance may vary by share class, and noted the following:
Asset Allocation Funds
· For Janus Henderson Global Allocation Fund – Conservative, the Trustees noted that the Fund’s performance was in the second Broadridge quartile for the 36 months ended May 31, 2021 and the first Broadridge quartile for the 12 months ended May 31, 2021.
· For Janus Henderson Global Allocation Fund – Growth, the Trustees noted that the Fund’s performance was in the bottom Broadridge quartile for the 36 months ended May 31, 2021 and the first Broadridge quartile for the 12 months ended May 31, 2021. The Trustees noted the reasons for the Fund’s underperformance, the steps the Adviser had taken or was taking to improve performance, and that the performance trend was improving.
· For Janus Henderson Global Allocation Fund – Moderate, the Trustees noted that the Fund’s performance was in the third Broadridge quartile for the 36 months ended May 31, 2021 and the first Broadridge quartile for the 12 months ended May 31, 2021. The Trustees noted the reasons for the Fund’s underperformance, the steps the Adviser had taken or was taking to improve performance and that the performance trend was improving
Janus Henderson Small Cap Value Fund
Additional Information (unaudited)
Fixed-Income Funds
· For Janus Henderson Absolute Return Income Opportunities Fund, the Trustees noted that the Fund’s performance was in the bottom Broadridge quartile for the 36 months ended May 31, 2021 and the bottom Broadridge quartile for the 12 months ended May 31, 2021. The Trustees noted the reasons for the Fund’s underperformance and the steps the Adviser had taken or was taking to improve performance.
· For Janus Developed World Bond Fund, the Trustees noted the Fund’s performance was in the second Broadridge quartile for the 36 months ended May 31, 2021 and the bottom Broadridge quartile for the 12 months ended May 31, 2021.
· For Janus Henderson Flexible Bond Fund, the Trustees noted that the Fund’s performance was in the first Broadridge quartile for the 36 months ended May 31, 2021 and the third Broadridge quartile for the 12 months ended May 31, 2021.
· For Janus Henderson Global Bond Fund, the Trustees noted that the Fund’s performance was in the second Broadridge quartile for the 36 months ended May 31, 2021 and the third Broadridge quartile for the 12 months ended May 31, 2021.
· For Janus Henderson High-Yield Fund, the Trustees noted that the Fund’s performance was in the first Broadridge quartile for the 36 months ended May 31, 2021 and the second Broadridge quartile for the 12 months ended May 31, 2021.
· For Janus Henderson Multi-Sector Income Fund, the Trustees noted that the Fund’s performance was in the first Broadridge quartile for the 36 months ended May 31, 2021 and the first Broadridge quartile for the 12 months ended May 31, 2021.
· For Janus Henderson Short Duration Flexible Bond Fund, the Trustees noted that the Fund’s performance was in the second Broadridge quartile for the 36 months ended May 31, 2021 and the second Broadridge quartile for the 12 months ended May 31, 2021.
Global and International Equity Funds
· For Janus Henderson Asia Equity Fund, the Trustees noted that the Fund’s performance was in the second Broadridge quartile for the 36 months ended May 31, 2021 and the second Broadridge quartile for the 12 months ended May 31, 2021.
· For Janus Henderson Emerging Markets Fund, the Trustees noted that the Fund’s performance was in the second Broadridge quartile for the 36 months ended May 31, 2021 and the first Broadridge quartile for the 12 months ended May 31, 2021.
· For Janus Henderson European Focus Fund, the Trustees noted that the Fund’s performance was in the first Broadridge quartile for the 36 months ended May 31, 2021 and the first Broadridge quartile for the 12 months ended May 31, 2021.
· For Janus Henderson Global Equity Income Fund, the Trustees noted that the Fund’s performance was in the bottom Broadridge quartile for the 36 months ended May 31, 2021 and the third Broadridge quartile for the 12 months ended May 31, 2021. The Trustees noted the reasons for the Fund’s underperformance and the steps the Adviser had taken or was taking to improve performance.
· For Janus Henderson Global Life Sciences Fund, the Trustees noted that the Fund’s performance was in the first Broadridge quartile for the 36 months ended May 31, 2021 and the first Broadridge quartile for the 12 months ended May 31, 2021.
· For Janus Henderson Global Real Estate Fund, the Trustees noted that the Fund’s performance was in the first Broadridge quartile for the 36 months ended May 31, 2021 and the bottom Broadridge quartile for the 12 months ended May 31, 2021.
· For Janus Henderson Global Research Fund, the Trustees noted that the Fund’s performance was in the third Broadridge quartile for the 36 months ended May 31, 2021 and the third Broadridge quartile for the 12 months ended May 31, 2021. The Trustees noted the reasons for the Fund’s underperformance, while also noting that the
Janus Henderson Small Cap Value Fund
Additional Information (unaudited)
Fund has a performance fee structure that results in lower management fees during periods of underperformance, and the steps the Adviser had taken or was taking to improve performance.
· For Janus Henderson Global Select Fund, the Trustees noted that the Fund’s performance was in the first Broadridge quartile for the 36 months ended May 31, 2021 and the first Broadridge quartile for the 12 months ended May 31, 2021.
· For Janus Henderson Global Technology and Innovation Fund, the Trustees noted that the Fund’s performance was in the second Broadridge quartile for the 36 months ended May 31, 2021 and the bottom Broadridge quartile for the 12 months ended May 31, 2021.
· For Janus Henderson International Opportunities Fund, the Trustees noted that the Fund’s performance was in the bottom Broadridge quartile for the 36 months ended May 31, 2021 and the third Broadridge quartile for the 12 months ended May 31, 2021. The Trustees noted the reasons for the Fund’s underperformance and the steps the Adviser had taken or was taking to improve performance.
· For Janus Henderson Overseas Fund, the Trustees noted that the Fund’s performance was in the second Broadridge quartile for the 36 months ended May 31, 2021 and the first Broadridge quartile for the 12 months ended May 31, 2021.
Money Market Funds
· For Janus Henderson Government Money Market Fund, the Trustees noted that the Fund’s performance was in the third Broadridge quartile for the 36 months ended May 31, 2021 and the bottom Broadridge quartile for the 12 months ended May 31, 2021. The Trustees noted the reasons for the Fund’s underperformance and the steps the Adviser had taken or was taking to improve performance.
· For Janus Henderson Money Market Fund, the Trustees noted that the Fund’s performance was in the third Broadridge quartile for the 36 months ended May 31, 2021 and the bottom Broadridge quartile for the 12 months ended May 31, 2021. The Trustees noted the reasons for the Fund’s underperformance and the steps the Adviser had taken or was taking to improve performance.
Multi-Asset Funds
· For Janus Henderson Adaptive Global Allocation Fund, the Trustees noted that the Fund’s performance was in bottom Broadridge quartile for the 36 months ended May 31, 2021 and the bottom Broadridge quartile for the 12 months ended May 31, 2021. The Trustees noted the reasons for the Fund’s underperformance and the steps the Adviser had taken or was taking to improve performance.
· For Janus Henderson Dividend & Income Builder Fund, the Trustees noted that the Fund’s performance was in the third Broadridge quartile for the 36 months ended May 31, 2021 and the third Broadridge quartile for the 12 months ended May 31, 2021. The Trustees noted the reasons for the Fund’s underperformance and the steps the Adviser had taken or was taking to improve performance.
Multi-Asset U.S. Equity Funds
· For Janus Henderson Balanced Fund, the Trustees noted that the Fund’s performance was in the first Broadridge quartile for the 36 months ended May 31, 2021 and the third Broadridge quartile for the 12 months ended May 31, 2021.
· For Janus Henderson Contrarian Fund, the Trustees noted that the Fund’s performance was in the first Broadridge quartile for the 36 months ended May 31, 2021 and the first Broadridge quartile for the 12 months ended May 31, 2021.
· For Janus Henderson Enterprise Fund, the Trustees noted that the Fund’s performance was in the bottom Broadridge quartile for the 36 months ended May 31, 2021 and the third Broadridge quartile for the 12 months ended May 31, 2021. The Trustees noted the reasons for the Fund’s underperformance, and the steps the Adviser had taken or was taking to improve performance.
· For Janus Henderson Forty Fund, the Trustees noted that the Fund’s performance was in the first Broadridge quartile for the 36 months ended May 31, 2021 and the first Broadridge quartile for the 12 months ended May 31, 2021.
Janus Henderson Small Cap Value Fund
Additional Information (unaudited)
· For Janus Henderson Growth and Income Fund, the Trustees noted that the Fund’s performance was in the bottom Broadridge quartile for the 36 months ended May 31, 2021 and the third Broadridge quartile for the 12 months ended May 31, 2021. The Trustees noted the reasons for the Fund’s underperformance, and the steps the Adviser had taken or was taking to improve performance.
· For Janus Henderson Research Fund, the Trustees noted that the Fund’s performance was in the third Broadridge quartile for the 36 months ended May 31, 2021 and the third Broadridge quartile for the 12 months ended May 31, 2021. The Trustees noted the reasons for the Fund’s underperformance while also noting that the Fund has a performance fee structure that results in lower management fees during periods of underperformance, and the steps the Adviser had taken or was taking to improve performance.
· For Janus Henderson Triton Fund, the Trustees noted that the Fund’s performance was in the bottom Broadridge quartile for the 36 months ended May 31, 2021 and the bottom Broadridge quartile for the 12 months ended May 31, 2021. The Trustees noted the reasons for the Fund’s underperformance, and the steps the Adviser had taken or was taking to improve performance.
· For Janus Henderson Venture Fund, the Trustees noted that the Fund’s performance was in the third Broadridge quartile for the 36 months ended May 31, 2021 and the bottom Broadridge quartile for the 12 months ended May 31, 2021. The Trustees noted the reasons for the Fund’s underperformance, and the steps the Adviser had taken or was taking to improve performance.
Quantitative Equity Funds
· For Janus Henderson Emerging Markets Managed Volatility Fund, the Trustees noted that the Fund’s performance was in the bottom Broadridge quartile for the 36 months ended May 31, 2021 and the bottom Broadridge quartile for the 12 months ended May 31, 2021. The Trustees noted the reasons for the Fund’s underperformance and the steps the Adviser and subadviser had taken or were taking to improve performance.
· For Janus Henderson Global Income Managed Volatility Fund, the Trustees noted that the Fund’s performance was in the second Broadridge quartile for the 36 months ended May 31, 2021 and the bottom Broadridge quartile for the 12 months ended May 31, 2021.
· For Janus Henderson International Managed Volatility Fund, the Trustees noted that the Fund’s performance was in the bottom Broadridge quartile for the 36 months ended May 31, 2021 and the bottom Broadridge quartile for the 12 months ended May 31, 2021. The Trustees noted the reasons for the Fund’s underperformance, the steps the Adviser and subadviser had taken or were taking to improve performance.
· For Janus Henderson U.S. Managed Volatility Fund, the Trustees noted that the Fund’s performance was in the bottom Broadridge quartile for the 36 months ended May 31, 2021 and the bottom Broadridge quartile for the 12 months ended May 31, 2021. The Trustees noted the reasons for the Fund’s underperformance, the steps the Adviser and subadviser had taken or were taking to improve performance.
U.S. Equity Funds
· For Janus Henderson Mid Cap Value Fund, the Trustees noted that the Fund’s performance was in the bottom Broadridge quartile for the 36 months ended May 31, 2021 and the bottom Broadridge quartile for the 12 months ended May 31, 2021. The Trustees noted the reasons for the Fund’s underperformance, while also noting that the Fund has a performance fee structure that results in lower management fees during periods of underperformance, and the steps the Adviser had taken or was taking to improve performance.
· For Janus Henderson Small Cap Value Fund, the Trustees noted that the Fund’s performance was in the bottom Broadridge quartile for the 36 months ended May 31, 2021 and the bottom Broadridge quartile for the 12 months ended May 31, 2021. The Trustees noted the reasons for the Fund’s underperformance, while also noting that the Fund has a performance fee structure that results in lower management fees during periods of underperformance, and the steps the Adviser had taken or was taking to improve performance.
· For Janus Henderson Small-Mid Cap Value Fund, the Trustees noted that the Fund’s performance was in the third Broadridge quartile for the 36 months ended May 31, 2021 and the bottom Broadridge quartile for the 12 months ended May 31, 2021. The Trustees noted the reasons for the Fund’s underperformance, while also noting that the Fund has a performance fee structure that results in lower management fees during periods of underperformance, and the steps the Adviser had taken or was taking to improve performance.
Janus Henderson Small Cap Value Fund
Additional Information (unaudited)
In consideration of each Janus Henderson Fund’s performance, the Trustees concluded that, taking into account the factors relevant to performance, as well as other considerations, including steps taken to improve performance, the Janus Henderson Fund’s performance warranted continuation of such Janus Henderson Fund’s investment advisory and subadvisory agreement(s).
Costs of Services Provided
The Trustees examined information regarding the fees and expenses of each Janus Henderson Fund in comparison to similar information for other comparable funds as provided by Broadridge, an independent data provider. They also reviewed an analysis of that information provided by their independent fee consultant and noted that the rate of management fees (investment advisory fees and any administration fees but excluding out-of-pocket costs) for many of the Janus Henderson Funds, after applicable waivers, was below the average management fee rate of the respective peer group of funds selected by an independent data provider. The Trustees also examined information regarding the subadvisory fees charged for subadvisory services, as applicable, noting that all such fees were paid by the Adviser out of its management fees collected from such Janus Henderson Fund.
The independent fee consultant provided its belief that the management fees charged by the Adviser to each of the Janus Henderson Funds under the current investment advisory and administration agreements are reasonable in relation to the services provided by the Adviser. The independent fee consultant found: (1) the total expenses and management fees of the Janus Henderson Funds to be reasonable relative to other comparable mutual funds; (2) the total expenses, on average, were 8% under the average total expenses of the respective Broadridge Expense Group peers; and (3) and the management fees for the Janus Henderson Funds, on average, were 6% under the average management fees for the respective Broadridge Expense Group. The Trustees also considered the total expenses for each share class of each Janus Henderson Fund compared to the average total expenses for its Broadridge Expense Group and to average total expenses for its Broadridge Expense Universe.
For certain Janus Henderson Funds, the independent fee consultant also performed a systematic “focus list” analysis of expenses which assessed fund fees in the context of fund performance being delivered. Based on this analysis, the independent fee consultant found that the combination of service quality/performance and expenses on these individual Janus Henderson Funds was reasonable in light of performance trends, performance histories, and existence of performance fees, breakpoints, and/or expense waivers on such Janus Henderson Funds.
The Trustees considered the methodology used by the Adviser and subadviser in determining compensation payable to portfolio managers, the competitive environment for investment management talent, and the competitive market for mutual funds in different distribution channels.
The Trustees also reviewed management fees charged by the Adviser and subadviser to comparable separate account clients and to comparable non-affiliated funds subadvised by the Adviser or subadviser (for which the Adviser or the subadviser provides only or primarily portfolio management services). Although in most instances subadvisory and separate account fee rates for various investment strategies were lower than management fee rates for Janus Henderson Funds having a similar strategy, the Trustees considered that the Adviser noted that, under the terms of the management agreements with the Janus Henderson Funds, the Adviser performs significant additional services for the Janus Henderson Funds that it does not provide to those other clients, including administration services, oversight of the Janus Henderson Funds’ other service providers, trustee support, regulatory compliance and numerous other services, and that, in serving the Janus Henderson Funds, the Adviser assumes many legal risks and other costs that it does not assume in servicing its other clients. Moreover, the Trustees noted that the independent fee consultant found that: (1) the management fees the Adviser charges to the Janus Henderson Funds are reasonable in relation to the management fees the Adviser charges to funds subadvised by the Adviser and to the fees the Adviser charges to its institutional separate account clients; (2) these subadvised and institutional separate accounts have different service and infrastructure needs and operate in markets very distinct relative to retail funds; (3) Janus Henderson mutual fund investors enjoy reasonable fees relative to the fees charged to Janus Henderson subadvised fund and separate account investors; and (4) as part of its 2020 review, 9 of 10 Janus Henderson Funds have lower management fees than similar funds subadvised by the Adviser.
The Trustees considered the fees for each Janus Henderson Fund for its fiscal year ended in 2020, including the VIT Portfolios, and noted the following with regard to each VIT Portfolio’s total expenses, net of applicable fee waivers (the VIT Portfolio’s “total expenses”):
Janus Henderson Small Cap Value Fund
Additional Information (unaudited)
Asset Allocation Funds
· For Janus Henderson Global Allocation Fund – Conservative, the Trustees noted that, although the Fund’s total expenses exceeded the peer group average for certain share classes, overall the Fund’s total expenses were reasonable. The Trustees also noted that the Adviser has contractually agreed to limit the Fund’s expenses.
· For Janus Henderson Global Allocation Fund – Growth, the Trustees noted that, although the Fund’s total expenses exceeded the peer group average for certain share classes, overall the Fund’s total expenses were reasonable.
· For Janus Henderson Global Allocation Fund – Moderate, the Trustees noted that, although the Fund’s total expenses exceeded the peer group for certain share classes, overall the Fund’s total expenses were reasonable. The Trustees also noted that the Adviser has contractually agreed to limit the Fund’s expenses.
Fixed-Income Funds
· For Janus Henderson Absolute Return Income Opportunities Fund, the Trustees noted that, although the Fund’s total expenses exceeded the peer group for certain share classes, overall the Fund’s total expenses were reasonable. The Trustees also noted that the Adviser has contractually agreed to limit the Fund’s expenses.
· For Janus Henderson Developed World Bond Fund, the Trustees noted that, although the Fund’s total expenses exceeded the peer group for one share class, overall the Fund’s total expenses were reasonable. The Trustees also noted that the Adviser has contractually agreed to limit the Fund’s expenses.
· For Janus Henderson Flexible Bond Fund, the Trustees noted that, although the Fund’s total expenses exceeded the peer group for certain share classes, overall the Fund’s total expenses were reasonable. The Trustees also noted that the Adviser has contractually agreed to limit the Fund’s expenses, although this limit did not apply because the Fund’s total expenses were already below the applicable fee limit.
· For Janus Henderson Global Bond Fund, the Trustees noted that, although the Fund’s total expenses exceeded the peer group average for certain share classes, overall the Fund’s total expenses were reasonable. The Trustees also noted that the Adviser has contractually agreed to limit the Fund’s expenses.
· For Janus Henderson High-Yield Fund, the Trustees noted that, although the Fund’s total expenses exceeded the peer group for certain share classes, overall the Fund’s total expenses were reasonable. The Trustees also noted that the Adviser has contractually agreed to limit the Fund’s expenses.
· For Janus Henderson Multi-Sector Income Fund, the Trustees noted that, although the Fund’s total expenses exceeded the peer group for certain share classes, overall the Fund’s total expenses were reasonable. The Trustees also noted that the Adviser has contractually agreed to limit the Fund’s expenses.
· For Janus Henderson Short Duration Flexible Bond Fund, the Trustees noted that, although the Fund’s total expenses exceeded the peer group for certain share classes, overall the Fund’s total expenses were reasonable. The Trustees also noted that the Adviser has contractually agreed to limit the Fund’s expenses.
Global and International Equity Funds
· For Janus Henderson Asia Equity Fund, the Trustees noted that, although the Fund’s total expenses exceeded the peer group for certain share classes, overall the Fund’s total expenses were reasonable. The Trustees also noted that the Adviser has contractually agreed to limit the Fund’s expenses.
· For Janus Henderson Emerging Markets Fund, the Trustees noted that, although the Fund’s total expenses exceeded the peer group for certain share classes, overall the Fund’s total expenses were reasonable. The Trustees also noted that the Adviser has contractually agreed to limit the Fund’s expenses.
· For Janus Henderson European Focus Fund, the Trustees noted that, although the Fund’s total expenses exceeded the peer group average for certain share classes, overall the Fund’s total expenses were reasonable. The Trustees also noted that the Adviser has contractually agreed to limit the Fund’s expenses.
· For Janus Henderson Global Equity Income Fund, the Trustees noted that, although the Fund’s total expenses exceeded the peer group for one share class, overall the Fund’s total expenses were reasonable. The Trustees also noted that the Adviser has contractually agreed to limit the Fund’s expenses, although this limit did not apply because the Fund’s total expenses were already below the applicable fee limit.
Janus Henderson Small Cap Value Fund
Additional Information (unaudited)
· For Janus Henderson Global Life Sciences Fund, the Trustees noted that the Fund’s total expenses were below the peer group for all share classes.
· For Janus Henderson Global Real Estate Fund, the Trustees noted, although the Fund’s total expenses exceeded the peer group average for certain share classes, overall the Fund’s total expenses were reasonable. The Trustees also noted that the Adviser has contractually agreed to limit the Fund’s expenses, although this limit did not apply because the Fund’s total expenses were already below the applicable fee limit.
· For Janus Henderson Global Research Fund, the Trustees noted that the Fund’s total expenses were below the peer group for all share classes.
· For Janus Henderson Global Select Fund, the Trustees noted that, although the Fund’s total expenses exceeded the peer group average for one share class, overall the Fund’s total expenses were reasonable. The Trustees also noted that the Adviser has contractually agreed to limit the Fund’s expenses.
· For Janus Henderson Global Sustainable Equity Fund, the Trustees noted that the Fund’s total expenses were below the peer group for all share classes.
· For Janus Henderson Global Technology and Innovation Fund, the Trustees noted that the Fund’s total expenses were below the peer group for all share classes.
· For Janus Henderson International Opportunities Fund, the Trustees noted that, although the Fund’s total expenses exceeded the peer group average for certain share classes, overall the Fund’s total expenses were reasonable. The Trustees also noted that the Adviser has contractually agreed to limit the Fund’s expenses.
· For Janus Henderson Overseas Fund, the Trustees noted that although the Fund’s total expenses exceeded the peer group average for certain share classes, overall the Fund’s total expenses were reasonable. The Trustees also noted that the Adviser has contractually agreed to limit the Fund’s expenses, although this limit did not apply because the Fund’s total expenses were already below the applicable fee limit.
Money Market Funds
· For Janus Henderson Government Money Market Fund, the Trustees noted that, although the Fund’s total expenses exceeded the peer group for both share classes, overall the Fund’s total expenses were reasonable. The Trustees also noted that the Adviser has voluntarily agreed to limit the Fund’s expenses to assist the Fund in attempting to maintain a yield of at least 0.00%.
· For Janus Henderson Money Market Fund, the Trustees noted that, although the Fund’s total expenses exceeded the peer group for both share classes, overall the Fund’s total expenses were reasonable. The Trustees also noted that the Adviser has agreed to limit the Fund’s expenses to assist the Fund in attempting to maintain a yield of at least 0.00%.
Multi-Asset Funds
· For Janus Henderson Adaptive Global Allocation Fund, the Trustees noted that, that the Fund’s total expenses were below the peer group average for all share classes.
· For Janus Henderson Dividend & Income Builder Fund, the Trustees noted that, that the Fund’s total expenses were below the peer group average for all share classes.
Multi-Asset U.S. Equity Funds
· For Janus Henderson Balanced Fund, the Trustees noted that, although the Fund’s total expenses exceeded the peer group average for certain share classes, overall the Fund’s total expenses were reasonable. The Trustees also noted that the Adviser has contractually agreed to limit the Fund’s expenses, although this limit did not apply because the Fund’s total expenses were already below the applicable fee limit.
· For Janus Henderson Contrarian Fund, the Trustees noted that, although the Fund’s total expenses exceeded the peer group average for certain share classes, overall the Fund’s total expenses were reasonable. The Trustees also noted that the Adviser had contractually agreed to limit the Fund’s expenses.
· For Janus Henderson Enterprise Fund, the Trustees noted that, although the Fund’s total expenses exceeded the peer group for certain share classes, overall the Fund’s total expenses were reasonable. The Trustees also noted
Janus Henderson Small Cap Value Fund
Additional Information (unaudited)
that the Adviser has contractually agreed to limit the Fund’s expenses, although this limit did not apply because the Fund’s total expenses were already below the applicable fee limit.
· For Janus Henderson Forty Fund, the Trustees noted that, although the Fund’s total expenses exceeded the peer group for certain share classes, overall the Fund’s total expenses were reasonable. The Trustees also noted that the Adviser has contractually agreed to limit the Fund’s expenses, although this limit did not apply because the Fund’s total expenses were already below the applicable fee limit.
· For Janus Henderson Growth and Income Fund, the Trustees noted that, although the Fund’s total expenses exceeded the peer group for certain share classes, overall the Fund’s total expenses were reasonable. The Trustees also noted that the Adviser has contractually agreed to limit the Fund’s expenses, although this limit did not apply because the Fund’s total expenses were already below the applicable fee limit.
· For Janus Henderson Research Fund, the Trustees noted that, although the Fund’s total expenses exceeded the peer group for one share class, overall the Fund’s total expenses were reasonable. The Trustees also noted that the Adviser has contractually agreed to limit the Fund’s expenses, although this limit did not apply because the Fund’s total expenses were already below the applicable fee limit.
· For Janus Henderson Triton Fund, the Trustees noted that the Fund’s total expenses were below the peer group for all share classes.
· For Janus Henderson Venture Fund, the Trustees noted that the Fund’s total expenses were below the peer group for all share classes.
Quantitative Equity Funds
· For Janus Henderson Emerging Markets Managed Volatility Fund, the Trustees noted that, although the Fund’s total expenses exceeded the peer group for certain share classes, overall the Fund’s total expenses were reasonable. The Trustees also noted that the Adviser has contractually agreed to limit the Fund’s expenses.
· For Janus Henderson Global Income Managed Volatility Fund, the Trustees noted that the Fund’s total expenses were below the peer group for all share classes.
· For Janus Henderson International Managed Volatility Fund, the Trustees noted that, although the Fund’s total expenses exceeded the peer group for certain share classes, overall the Fund’s total expenses were reasonable. The Trustees also noted that the Adviser has contractually agreed to limit the Fund’s expenses.
· For Janus Henderson U.S. Managed Volatility Fund, the Trustees noted that, although the Fund’s total expenses exceeded the peer group for certain share classes, overall the Fund’s total expenses were reasonable. The Trustees also noted that the Adviser has contractually agreed to limit the Fund’s expenses, although this limit did not apply because the Fund’s total expenses were already below the applicable fee limit.
U.S. Equity Funds
· For Janus Henderson Mid Cap Value Fund, the Trustees noted that, although the Fund’s total expenses exceeded the peer group average for certain share classes, overall the Fund’s total expenses were reasonable. The Trustees also noted that the Adviser has contractually agreed to limit the Fund’s expenses, although this limit did not apply because the Fund’s total expenses were already below the applicable fee limit.
· For Janus Henderson Small Cap Value Fund, the Trustees noted that, although the Fund’s total expenses exceeded the peer group average for certain share classes, overall the Fund’s total expenses were reasonable. The Trustees also noted that the Adviser has contractually agreed to limit the Fund’s expenses, although this limit did not apply because the Fund’s total expenses were already below the applicable fee limit.
· For Janus Henderson Small-Mid Cap Value Fund, the Trustees noted that, although the Fund’s total expenses exceeded the peer group average for certain share classes, overall the Fund’s total expenses were reasonable. The Trustees also noted that the Adviser has contractually agreed to limit the Fund’s expenses.
The Trustees reviewed information on the overall profitability to the Adviser and its affiliates from their relationships with the Janus Henderson Funds, and considered profitability data of other publicly traded mutual fund advisers. The Trustees recognized that profitability comparisons among fund managers are difficult because of the variation in the type of comparative information that is publicly available, and the profitability of any fund manager is affected by
Janus Henderson Small Cap Value Fund
Additional Information (unaudited)
numerous factors, including the organizational structure of the particular fund manager, differences in complex size, difference in product mix, difference in types of business (mutual fund, institutional and other), differences in the types of funds and other accounts it manages, possible other lines of business, the methodology for allocating expenses and the fund manager’s capital structure and cost of capital.
Additionally, the Trustees considered the estimated profitability to the Adviser from the investment management services it provided to each Janus Henderson Fund. In their review, the Trustees considered whether the Adviser and subadviser receive adequate incentives and resources to manage the Janus Henderson Funds effectively. In reviewing profitability, the Trustees noted that the estimated profitability for an individual Janus Henderson Fund is necessarily a product of the allocation methodology utilized by the Adviser to allocate its expenses as part of the estimated profitability calculation. In this regard, the Trustees noted that the independent fee consultant found that (1) the expense allocation methodology and rationales utilized by the Adviser were reasonable and (2) no clear correlation exists between expense allocations and operating margins. The Trustees also considered that the estimated profitability for an individual Janus Henderson Fund was influenced by a number of factors, including not only the allocation methodology selected, but also the presence of fee waivers and expense caps, and whether the Janus Henderson Fund’s investment management agreement contained breakpoints or a performance fee component. The Trustees determined, after taking into account these factors, among others, that the Adviser’s estimated profitability with respect to each Janus Henderson Fund was not unreasonable in relation to the services provided, and that the variation in the range of such estimated profitability among the Janus Henderson Funds was not a material factor in the Board’s approval of the reasonableness of any Janus Henderson Fund’s investment management fees.
The Trustees concluded that the management fees payable by each Janus Henderson Fund to the Adviser and its affiliates, as well as the fees paid by the Adviser to the subadviser of subadvised Janus Henderson Funds, were reasonable in relation to the nature, extent, and quality of the services provided, taking into account the fees charged by other advisers for managing comparable mutual funds with similar strategies, the fees the Adviser and the subadviser charge to other clients, and, as applicable, the impact of fund performance on management fees payable by the Janus Henderson Funds. The Trustees also concluded that each Janus Henderson Fund’s total expenses were reasonable, taking into account the size of the Janus Henderson Fund, the quality of services provided by the Adviser and subadviser, the investment performance of the Janus Henderson Fund, and any expense limitations agreed to or provided by the Adviser.
Economies of Scale
The Trustees considered information about the potential for the Adviser to realize economies of scale as the assets of the Janus Henderson Funds increase. They noted that their independent fee consultant published a report to the Trustees in November 2019 which provided its research and analysis into economies of scale. They also noted that, although many Janus Henderson Funds pay advisory fees at a fixed base rate as a percentage of net assets, without any breakpoints or performance fees, their independent fee consultant concluded that 75% of these Janus Henderson Funds’ have contractual management fees (gross of waivers) below their Broadridge Expense Group averages. The Trustees also noted the following: (1) that for those Janus Henderson Funds whose expenses are being reduced by the contractual expense limitations of the Adviser, the Adviser is subsidizing certain of these Janus Henderson Funds because they have not reached adequate scale; (2) performance fee structures have been implemented for various Janus Henderson Funds that have caused the effective rate of advisory fees payable by such Janus Henderson Fund to vary depending on the investment performance of the Janus Henderson Fund relative to its benchmark index over the measurement period; and (3) a few Janus Henderson Funds have fee schedules with breakpoints and reduced fee rates above certain asset levels. The Trustees also noted that the Janus Henderson Funds share directly in economies of scale through the significant investments made by the Adviser and its affiliates related to services provided to the Funds and the lower charges of third-party service providers that are based in part on the combined scale of all of the Janus Henderson Funds.
The Trustees also considered the independent fee consultant’s conclusion that, given the limitations of various analytical approaches to economies of scale and their conflicting results, it is difficult to analytically confirm or deny the existence of economies of scale in the Janus Henderson complex. In this regard, the independent consultant concluded that (1) to the extent there were economies of scale at the Adviser, the Adviser’s general strategy of setting fixed management fees below peers appeared to share any such economies with investors even on smaller Janus Henderson Funds which have not yet achieved those economies and (2) by setting lower fixed fees from the start on these Janus Henderson Funds, the Adviser appeared to be investing to increase the likelihood that these Janus
Janus Henderson Small Cap Value Fund
Additional Information (unaudited)
Henderson Funds will grow to a level to achieve any economies of scale that may exist. Further, the independent fee consultant provided its belief that Janus Henderson Fund investors are well-served by the fee levels and performance fee structures in place on the Janus Henderson Funds in light of any economies of scale that may be present at the Adviser.
Based on all of the information reviewed, including the recent and past research and analysis conducted by the Trustees’ independent fee consultant, the Trustees concluded that the current fee structure of each Janus Henderson Fund was reasonable and that the current rates of fees do reflect a sharing between the Adviser and the Janus Henderson Fund of any economies of scale that may be present at the current asset level of the Janus Henderson Fund.
Other Benefits to the Adviser
The Trustees also considered benefits that accrue to the Adviser and its affiliates and subadviser to the Janus Henderson Funds from their relationships with the Janus Henderson Funds. They recognized that two affiliates of the Adviser separately serve the Janus Henderson Funds as transfer agent and distributor, respectively, and the transfer agent receives compensation directly from the non-money market funds for services provided, and that such compensation contributes to the overall profitability of the Adviser and its affiliates that results from their relationship with the Janus Henderson Funds. The Trustees also considered the Adviser’s past and proposed use of commissions paid by the Janus Henderson Funds on portfolio brokerage transactions to obtain proprietary and third-party research products and services benefiting the Janus Henderson Fund and/or other clients of the Adviser and/or the Adviser, and/or subadviser to a Janus Henderson Fund. The Trustees concluded that the Adviser’s and the subadviser’s use of these types of client commission arrangements to obtain proprietary and third-party research products and services was consistent with regulatory requirements and guidelines and was likely to benefit each Janus Henderson Fund. The Trustees also concluded that, other than the services provided by the Adviser and its affiliates and subadviser pursuant to the agreements and the fees to be paid by each Janus Henderson Fund therefor, the Janus Henderson Funds and the Adviser and the subadviser may potentially benefit from their relationship with each other in other ways. They concluded that the Adviser and its affiliates share directly in economies of scale through the lower charges of third-party service providers that are based in part on the combined scale of the Janus Henderson Funds and other clients serviced by the Adviser and its affiliates. They also concluded that the Adviser and the subadviser benefit from the receipt of research products and services acquired through commissions paid on portfolio transactions of the Janus Henderson Funds and that the Janus Henderson Funds benefit from the Adviser’s and/or the subadviser’s receipt of those products and services as well as research products and services acquired through commissions paid by other clients of the Adviser and/or other clients of the subadviser. They further concluded that the success of any Janus Henderson Fund could attract other business to the Adviser, the subadviser or other Janus Henderson funds, and that the success of the Adviser and the subadviser could enhance the Adviser’s and the subadviser’s ability to serve the Janus Henderson Funds.
Janus Henderson Small Cap Value Fund
Liquidity Risk Management Program (unaudited)
Liquidity Risk Management Program
Rule 22e-4 under the Investment Company Act of 1940, as amended (the “Liquidity Rule”), requires open-end funds (but not money market funds) to adopt and implement a written liquidity risk management program (the “LRMP”) that is reasonably designed to assess and manage liquidity risk, which is the risk that a fund could not meet redemption requests without significant dilution of remaining investors’ interest in the fund. The Fund has implemented a LRMP, which incorporates the following elements: (i) assessment, management, and periodic review of liquidity risk; (ii) classification of portfolio holdings; (iii) the establishment and monitoring of a highly liquid investment minimum, as applicable; (iv) a 15% limitation on a Fund’s illiquid investments; (v) redemptions in-kind; and (vi) board oversight.
The Trustees of the Fund (the “Trustees”) have designated Janus Henderson Investors US LLC, the Fund’s investment adviser (the “Adviser”), as the Program Administrator for the LRMP responsible for administering the LRMP and carrying out the specific responsibilities of the LRMP. A working group comprised of various teams within the Adviser’s business is responsible for administering the LRMP and carrying out the specific responsibilities of different aspects of the LRMP (the “Liquidity Risk Working Group”). In assessing each Fund’s liquidity risk, the Liquidity Risk Working Group periodically considers, as relevant, factors including (i) the liquidity of a Fund’s portfolio investments during normal and reasonably foreseeable stressed conditions; (ii) whether a Fund’s investment strategy is appropriate for an open-end fund; (iii) the extent to which a Fund’s strategy involves a relatively concentrated portfolio or large positions in any issuer; (iv) a Fund’s use of borrowing for investment purposes; and (v) a Fund’s use of derivatives.
The Liquidity Rule requires the Trustees to review at least annually a written report provided by the Program Administrator that addresses the operation of the LRMP and assesses its adequacy and the effectiveness of its implementation, including, if applicable, the operation of the highly liquid investment minimum, and any material changes to the LRMP (the “Program Administrator Report”). At a meeting held on March 16, 2022, the Adviser provided the Program Administrator Report to the Trustees which covered the operation of the LRMP from January 1, 2021 through December 31, 2021 (the “Reporting Period”).
The Program Administrator Report discussed the operation and effectiveness of the LRMP during the Reporting Period. It noted that the Fund was able to meet redemptions during the normal course of business during the Reporting Period. The Program Administrator Report also stated that the Fund did not exceed the 15% limit on illiquid assets during the Reporting Period, that the Fund held primarily highly liquid assets, and was considered to be a primarily highly liquid fund during the Reporting Period. In addition, the Adviser expressed its belief in the Program Administrator Report that the LRMP is reasonably designed and adequate to assess and manage the Fund’s liquidity risk, considering the Fund’s particular risks and circumstances, and includes policies and procedures reasonably designed to implement each required component of the Liquidity Rule.
There can be no assurance that the LRMP will achieve its objectives in the future. Please refer to your Fund’s prospectus for more information regarding the risks to which an investment in the Fund may be subject.
Janus Henderson Small Cap Value Fund
Useful Information About Your Fund Report (unaudited)
Management Commentary
The Management Commentary in this report includes valuable insight as well as statistical information to help you understand how your Fund’s performance and characteristics stack up against those of comparable indices.
If the Fund invests in foreign securities, this report may include information about country exposure. Country exposure is based primarily on the country of risk. A company may be allocated to a country based on other factors such as location of the company’s principal office, the location of the principal trading market for the company’s securities, or the country where a majority of the company’s revenues are derived.
Please keep in mind that the opinions expressed in the Management Commentary are just that: opinions. They are a reflection based on best judgment at the time this report was compiled, which was June 30, 2022. As the investing environment changes, so could opinions. These views are unique and are not necessarily shared by fellow employees or by Janus Henderson in general.
Performance Overviews
Performance overview graphs compare the performance of a hypothetical $10,000 investment in the Fund with one or more widely used market indices. When comparing the performance of the Fund with an index, keep in mind that market indices are not available for investment and do not reflect deduction of expenses.
Average annual total returns are quoted for a Fund with more than one year of performance history. Average annual total return is calculated by taking the growth or decline in value of an investment over a period of time, including reinvestment of dividends and distributions, then calculating the annual compounded percentage rate that would have produced the same result had the rate of growth been constant throughout the period. Average annual total return does not reflect the deduction of taxes that a shareholder would pay on Fund distributions or redemptions of Fund shares.
Cumulative total returns are quoted for a Fund with less than one year of performance history. Cumulative total return is the growth or decline in value of an investment over time, independent of the period of time involved. Cumulative total return does not reflect the deduction of taxes that a shareholder would pay on Fund distributions or redemptions of Fund shares.
Pursuant to federal securities rules, expense ratios shown in the performance chart reflect subsidized (if applicable) and unsubsidized ratios. The total annual fund operating expenses ratio is gross of any fee waivers, reflecting the Fund’s unsubsidized expense ratio. The net annual fund operating expenses ratio (if applicable) includes contractual waivers of the Adviser and reflects the Fund’s subsidized expense ratio. Ratios may be higher or lower than those shown in the “Financial Highlights” in this report.
Schedule of Investments
Following the performance overview section is the Fund’s Schedule of Investments. This schedule reports the types of securities held in the Fund on the last day of the reporting period. Securities are usually listed by type (common stock, corporate bonds, U.S. Government obligations, etc.) and by industry classification (banking, communications, insurance, etc.). Holdings are subject to change without notice.
The value of each security is quoted as of the last day of the reporting period. The value of securities denominated in foreign currencies is converted into U.S. dollars.
If the Fund invests in foreign securities, it will also provide a summary of investments by country. This summary reports the Fund exposure to different countries by providing the percentage of securities invested in each country. The country of each security represents the country of risk. The Fund’s Schedule of Investments relies upon the industry group and country classifications published by Bloomberg and/or MSCI Inc.
Tables listing details of individual forward currency contracts, futures, written options, swaptions, and swaps follow the Fund’s Schedule of Investments (if applicable).
Statement of Assets and Liabilities
This statement is often referred to as the “balance sheet.” It lists the assets and liabilities of the Fund on the last day of the reporting period.
Janus Henderson Small Cap Value Fund
Useful Information About Your Fund Report (unaudited)
The Fund’s assets are calculated by adding the value of the securities owned, the receivable for securities sold but not yet settled, the receivable for dividends declared but not yet received on securities owned, and the receivable for Fund shares sold to investors but not yet settled. The Fund’s liabilities include payables for securities purchased but not yet settled, Fund shares redeemed but not yet paid, and expenses owed but not yet paid. Additionally, there may be other assets and liabilities such as unrealized gain or loss on forward currency contracts.
The section entitled “Net Assets Consist of” breaks down the components of the Fund’s net assets. Because the Fund must distribute substantially all earnings, you will notice that a significant portion of net assets is shareholder capital.
The last section of this statement reports the net asset value (“NAV”) per share on the last day of the reporting period. The NAV is calculated by dividing the Fund’s net assets for each share class (assets minus liabilities) by the number of shares outstanding.
Statement of Operations
This statement details the Fund’s income, expenses, realized gains and losses on securities and currency transactions, and changes in unrealized appreciation or depreciation of Fund holdings.
The first section in this statement, entitled “Investment Income,” reports the dividends earned from securities and interest earned from interest-bearing securities in the Fund.
The next section reports the expenses incurred by the Fund, including the advisory fee paid to the investment adviser, transfer agent fees and expenses, and printing and postage for mailing statements, financial reports and prospectuses. Expense offsets and expense reimbursements, if any, are also shown.
The last section lists the amounts of realized gains or losses from investment and foreign currency transactions, and changes in unrealized appreciation or depreciation of investments and foreign currency-denominated assets and liabilities. The Fund will realize a gain (or loss) when it sells its position in a particular security. A change in unrealized gain (or loss) refers to the change in net appreciation or depreciation of the Fund during the reporting period. “Net Realized and Unrealized Gain/(Loss) on Investments” is affected both by changes in the market value of Fund holdings and by gains (or losses) realized during the reporting period.
Statements of Changes in Net Assets
These statements report the increase or decrease in the Fund’s net assets during the reporting period. Changes in the Fund’s net assets are attributable to investment operations, dividends and distributions to investors, and capital share transactions. This is important to investors because it shows exactly what caused the Fund’s net asset size to change during the period.
The first section summarizes the information from the Statement of Operations regarding changes in net assets due to the Fund’s investment operations. The Fund’s net assets may also change as a result of dividend and capital gains distributions to investors. If investors receive their dividends and/or distributions in cash, money is taken out of the Fund to pay the dividend and/or distribution. If investors reinvest their dividends and/or distributions, the Fund’s net assets will not be affected.
The reinvestment of dividends and distributions is included under “Capital Share Transactions.” “Capital Shares” refers to the money investors contribute to the Fund through purchases or withdrawals via redemptions. The Fund’s net assets will increase and decrease in value as investors purchase and redeem shares from the Fund.
Financial Highlights
This schedule provides a per-share breakdown of the components that affect the Fund’s NAV for current and past reporting periods as well as total return, asset size, ratios, and portfolio turnover rate.
The first line in the table reflects the NAV per share at the beginning of the reporting period. The next line reports the net investment income/(loss) per share. Following is the per share total of net gains/(losses), realized and unrealized. Per share dividends and distributions to investors are then subtracted to arrive at the NAV per share at the end of the period. The next line reflects the total return for the period. The total return may include adjustments in accordance with generally accepted accounting principles required at the period end for financial reporting purposes. As a result, the total return may differ from the total return reflected for individual shareholder transactions. Also included are ratios of expenses and net investment income to average net assets.
Janus Henderson Small Cap Value Fund
Useful Information About Your Fund Report (unaudited)
The Fund’s expenses may be reduced through expense offsets and expense reimbursements. The ratios shown reflect expenses before and after any such offsets and reimbursements.
The ratio of net investment income/(loss) summarizes the income earned less expenses, divided by the average net assets of the Fund during the reporting period. Do not confuse this ratio with the Fund’s yield. The net investment income ratio is not a true measure of the Fund’s yield because it does not take into account the dividends distributed to the Fund’s investors.
The next figure is the portfolio turnover rate, which measures the buying and selling activity in the Fund. Portfolio turnover is affected by market conditions, changes in the asset size of the Fund, fluctuating volume of shareholder purchase and redemption orders, the nature of the Fund’s investments, and the investment style and/or outlook of the portfolio manager(s) and/or investment personnel. A 100% rate implies that an amount equal to the value of the entire portfolio was replaced once during the fiscal year; a 50% rate means that an amount equal to the value of half the portfolio is traded in a year; and a 200% rate means that an amount equal to the value of the entire portfolio is traded every six months.
Janus Henderson Small Cap Value Fund
Designation Requirements (unaudited)
For federal income tax purposes, the Fund designated the following for the year ended June 30, 2022:
| | |
| | |
Capital Gain Distributions | $59,456,694 |
Dividends Received Deduction Percentage | 100% |
Qualified Dividend Income Percentage | 100% |
Janus Henderson Small Cap Value Fund
Trustees and Officers (unaudited)
The following are the Trustees and officers of the Trust, together with a brief description of their principal occupations during the last five years (principal occupations for certain Trustees may include periods over five years). The Fund’s Statement of Additional Information includes additional information about the Trustees and officers and is available, without charge, by calling 1-877-335-2687.
Each Trustee has served in that capacity since he or she was originally elected or appointed. The Trustees do not serve a specified term of office. Each Trustee will hold office until the termination of the Trust or his or her earlier death, resignation, retirement, incapacity, or removal. Under the Fund’s Governance Procedures and Guidelines, the policy is for Trustees to retire no later than the end of the calendar year in which the Trustee turns 75. The Trustees review the Fund’s Governance Procedures and Guidelines from time to time and may make changes they deem appropriate. The Fund’s Nominating and Governance Committee will consider nominees for the position of Trustee recommended by shareholders. Shareholders may submit the name of a candidate for consideration by the Committee by submitting their recommendations to the Trust’s Secretary. Each Trustee is currently a Trustee of one other registered investment company advised by the Adviser: Janus Aspen Series. Collectively, these two registered investment companies consist of 50 series or funds referred to herein as the Fund Complex.
The Trust’s officers are elected annually by the Trustees for a one-year term. Certain officers also serve as officers of Janus Aspen Series. Certain officers of the Fund may also be officers and/or directors of the Adviser. Except as otherwise disclosed, Fund officers receive no compensation from the Fund, except for the Fund’s Chief Compliance Officer, as authorized by the Trustees.
| | | | | | |
TRUSTEES |
Name, Address, and Age | Positions Held with the Trust | Length of Time Served | Principal Occupations During the Past Five Years | Number of Portfolios/Funds in Fund Complex Overseen by Trustee | Other Directorships Held by Trustee During the Past Five Years |
Independent Trustees | | | | |
Alan A. Brown
151 Detroit Street
Denver, CO 80206
DOB: 1962 | Chairman
Trustee | 5/22-Present
1/13-Present | Principal, Curam Holdings LLC (since 2018). Formerly, Executive Vice President, Institutional Markets, of Black Creek Group (private equity real estate investment management firm) (2012-2018), Executive Vice President and Co-Head, Global Private Client Group (2007-2010), Executive Vice President, Mutual Funds (2005-2007), and Chief Marketing Officer (2001-2005) of Nuveen Investments, Inc. (asset management). | 50 | Advisory Board Member of AEW Core Property Trust (open-end property fund) (since 2020), and Director of WTTW (PBS affiliate) (since 2003). Formerly, Director of MotiveQuest LLC (strategic social market research company) (2003-2016), Director of Nuveen Global Investors LLC (2007-2011), Director of Communities in Schools (2004-2010), and Director of Mutual Fund Education Alliance (until 2010). |
Janus Henderson Small Cap Value Fund
Trustees and Officers (unaudited)
| | | | | | |
TRUSTEES |
Name, Address, and Age | Positions Held with the Trust | Length of Time Served | Principal Occupations During the Past Five Years | Number of Portfolios/Funds in Fund Complex Overseen by Trustee | Other Directorships Held by Trustee During the Past Five Years |
Independent Trustees | | | | |
Cheryl D. Alston
151 Detroit Street
Denver, CO 80206
DOB: 1966 | Trustee | 8/22-Present | Executive Director and Chief Investment Officer, Employees’ Retirement Fund of the City of Dallas (since 2004). | 50 | Director of Blue Cross Blue Shield of Kansas City (a not-for-profit health insurance provider) (since 2016) and Director of Global Life Insurance (life and supplemental health insurance provider) (since 2017). Formerly, Director of Federal Home Loan Bank of Dallas (2017-2021). |
Janus Henderson Small Cap Value Fund
Trustees and Officers (unaudited)
| | | | | | |
TRUSTEES |
Name, Address, and Age | Positions Held with the Trust | Length of Time Served | Principal Occupations During the Past Five Years | Number of Portfolios/Funds in Fund Complex Overseen by Trustee | Other Directorships Held by Trustee During the Past Five Years |
Independent Trustees | | | | |
William D. Cvengros
151 Detroit Street
Denver, CO 80206
DOB: 1948 | Trustee | 1/11-Present | Chief Executive Officer of SJC Capital, LLC (a personal investment company and consulting firm) (since 2002). Formerly, Chief Executive Officer and President of PIMCO Advisors Holdings L.P. (a publicly traded investment management firm) (1994-2000), and Chief Investment Officer (1987-1994) and Vice Chairman and Director (1990-1994) of Pacific Life Insurance Company (a mutual life insurance and annuity company) (1987-1994). | 50 | Member, Limited Partner Advisory Committee, Karmel Capital Fund III (later stage growth fund) (since 2022), Member of the Investment Committee for the Orange County Community Foundation (a grantmaking foundation) (since 2020), Advisory Board Member, RevOZ Fund LP and related funds (real estate investments for opportunity zones) (since 2020), and Advisory Board Member, Innovate Partners Emerging Growth and Equity Fund I (early stage venture capital fund) (since 2014). Formerly, Managing Trustee of National Retirement Partners Liquidating Trust (2013-2016), Chairman, National Retirement Partners, Inc. (formerly a network of advisors to 401(k) plans) (2005-2013), Director of Prospect Acquisition Corp. (a special purpose acquisition corporation) (2007-2009), Director of RemedyTemp, Inc. (temporary help services company) (1996-2006), and Trustee of PIMCO Funds Multi-Manager Series (1990-2000) and Pacific Life Variable Life & Annuity Trusts (1987-1994). |
Janus Henderson Small Cap Value Fund
Trustees and Officers (unaudited)
| | | | | | |
TRUSTEES |
Name, Address, and Age | Positions Held with the Trust | Length of Time Served | Principal Occupations During the Past Five Years | Number of Portfolios/Funds in Fund Complex Overseen by Trustee | Other Directorships Held by Trustee During the Past Five Years |
Independent Trustees | | | | |
Raudline Etienne
151 Detroit Street
Denver, CO 80206
DOB: 1965 | Trustee | 6/16-Present | Founder, Daraja Capital (advisory and investment firm) (since 2016). Formerly, Senior Vice President and Senior Advisor, Albright Stonebridge Group LLC (global strategy firm) (2011-2021), and Deputy Comptroller and Chief Investment Officer, New York State Common Retirement Fund (public pension fund) (2008-2011). | 50 | Member of the Investment Committee for Cooper Union (private college) (since 2021), Board Member, Van Alen Institute (nonprofit architectural and design organization) (since 2019) and Director of Brightwood Capital Advisors, LLC (since 2014). |
Darrell B. Jackson
151 Detroit Street
Denver, CO 80206
DOB: 1958 | Trustee | 8/22-Present | President and Chief Executive Officer, The Efficace Group Inc. (since 2018). Formerly, President and Chief Executive Officer, Seaway Bank and Trust Company (community bank) (2014-2015), and Executive Vice President and Co-President, Wealth Management (2009-2014), and several senior positions, including Group Executive, Senior Vice President, and Vice President (1995-2009) of Northern Trust Company (financial services company) (1995-2014). | 50 | Director of Amalgamated Financial Corp (bank) (since August 2021), Director of YR Media (a not-for-profit production company) (since 2021), and Director of Gray-Bowen-Scott (transportation project consulting firm) (since April 2020). Formerly, Director of Delaware Place Bank (closely held commercial bank) (2016-2018) and Director of Seaway Bank and Trust Company (2014-2015). |
Janus Henderson Small Cap Value Fund
Trustees and Officers (unaudited)
| | | | | | |
TRUSTEES |
Name, Address, and Age | Positions Held with the Trust | Length of Time Served | Principal Occupations During the Past Five Years | Number of Portfolios/Funds in Fund Complex Overseen by Trustee | Other Directorships Held by Trustee During the Past Five Years |
Independent Trustees | | | | |
William F. McCalpin
151 Detroit Street
Denver, CO 80206
DOB: 1957 | Trustee | 6/02-Present | Chief Executive Officer, muun chi LLC (organic food business) (since 2022). Formerly, Chief Operating Officer, muun chi LLC (2020-2022), Managing Partner, Impact Investments, Athena Capital Advisors LLC (independent registered investment advisor) (2016-2019), Managing Director, Holos Consulting LLC (provides consulting services to foundations and other nonprofit organizations) (2009-2016), Chief Executive Officer, Imprint Capital Advisors (impact investment firm) (2013-2015), and Executive Vice President and Chief Operating Officer of The Rockefeller Brothers Fund (a private family foundation) (1998-2006). | 50 | Chairman of the Board and Trustee of The Investment Fund for Foundations Investment Program (TIP) (consisting of 1 fund) (since 2008) and Director of the F.B. Heron Foundation (a private grantmaking foundation) (since 2006). Formerly, Director of Mutual Fund Directors Forum (a non-profit organization serving independent directors of U.S. mutual funds) (2016-2021). |
Janus Henderson Small Cap Value Fund
Trustees and Officers (unaudited)
| | | | | | |
TRUSTEES |
Name, Address, and Age | Positions Held with the Trust | Length of Time Served | Principal Occupations During the Past Five Years | Number of Portfolios/Funds in Fund Complex Overseen by Trustee | Other Directorships Held by Trustee During the Past Five Years |
Independent Trustees | | | | |
Gary A. Poliner
151 Detroit Street
Denver, CO 80206
DOB: 1953 | Trustee | 6/16-Present | Retired. Formerly, President (2010-2013) of Northwestern Mutual Life Insurance Company. | 50 | Director of MGIC Investment Corporation (private mortgage insurance) (since 2013). Formerly, Director, West Bend Mutual Insurance Company (property/casualty insurance) (2013-2021), Trustee of Northwestern Mutual Life Insurance Company (2010-2013) and Director of Frank Russell Company (global asset management firm) (2008-2013). |
Diane L. Wallace
151 Detroit Street
Denver, CO 80206
DOB: 1958 | Trustee | 6/17-Present | Retired. Formerly, Chief Operating Officer, Senior Vice President-Operations, and Chief Financial Officer for Driehaus Capital Management, LLC (1988-2006) and Treasurer for Driehaus Mutual Funds (1996-2002). | 50 | Formerly, Director of Family Service of Lake County (2019-2021), Independent Trustee, Henderson Global Funds (13 portfolios) (2015-2017), Independent Trustee, State Farm Associates’ Funds Trust, State Farm Mutual Fund Trust, and State Farm Variable Product Trust (28 portfolios) (2013-2017).
|
Janus Henderson Small Cap Value Fund
Trustees and Officers (unaudited)
| | | | | | |
TRUSTEES |
Name, Address, and Age | Positions Held with the Trust | Length of Time Served | Principal Occupations During the Past Five Years | Number of Portfolios/Funds in Fund Complex Overseen by Trustee | Other Directorships Held by Trustee During the Past Five Years |
Independent Trustees | | | | |
Linda S. Wolf
151 Detroit Street
Denver, CO 80206
DOB: 1947 | Trustee | 11/05-Present | Retired. Formerly, Chairman and Chief Executive Officer of Leo Burnett (Worldwide) (advertising agency) (2001-2005). | 50 | Director of Chicago Community Trust (Regional Community Foundation), Lurie Children’s Hospital (Chicago, IL), and Shirley Ryan Ability Lab. Formerly, Director of Wrapports, LLC (until 2022), Director of Chicago Council on Global Affairs (until 2019), InnerWorkings (until 2019) and Director of Walmart (until 2017). |
Janus Henderson Small Cap Value Fund
Trustees and Officers (unaudited)
| | | | |
OFFICERS |
Name, Address, and Age | Positions Held with the Trust | Term of Office* and Length of Time Served | Principal Occupations During the Past Five Years |
Craig Kempler
151 Detroit Street
Denver, CO 80206
DOB: 1977 | Executive Vice President and Co-Portfolio Manager
Janus Henderson Small Cap Value Fund | 10/17-Present | Portfolio Manager for other Janus Henderson accounts. |
Justin Tugman
151 Detroit Street
Denver, CO 80206
DOB: 1973 | Executive Vice President and Co-Portfolio Manager
Janus Henderson Small Cap Value Fund | 3/09-Present | Portfolio Manager for other Janus Henderson accounts. |
Michelle Rosenberg
151 Detroit Street
Denver, CO 80206
DOB: 1973 | Interim President and Chief Executive Officer | 1/22-Present | General Counsel and Corporate Secretary of Janus Henderson Investors (since 2018). Formerly, Senior Vice President and Head of Legal, North America of Janus Henderson Investors (2017-2018) and Deputy General Counsel of Janus Henderson US (Holdings) Inc. (2015-2018). |
Kristin Mariani
151 Detroit Street
Denver, CO 80206
DOB: 1966 | Vice President, Chief Compliance Officer, and Anti-Money Laundering Officer | 7/20-Present | Head of Compliance, North America for Janus Henderson Investors (since September 2020) and Chief Compliance Officer for Janus Henderson Investors US LLC (since September 2017). Formerly, Global Head of Investment Management Compliance for Janus Henderson Investors (February 2019-August 2020), Vice President, Head of Global Distribution Compliance and Chief Compliance Officer of Janus Henderson Distributors US LLC (May 2017-September 2017), Vice President, Compliance at Janus Henderson US (Holdings) Inc., Janus Henderson Investors US LLC, and Janus Henderson Distributors US LLC (2009-2017). |
Jesper Nergaard
151 Detroit Street
Denver, CO 80206
DOB: 1962 | Chief Financial Officer
Vice President, Treasurer, and Principal Accounting Officer | 3/05-Present
2/05-Present | Head of U.S. Fund Administration, Janus Henderson Investors and Janus Henderson Services US LLC. |
Janus Henderson Small Cap Value Fund
Trustees and Officers (unaudited)
| | | | |
OFFICERS |
Name, Address, and Age | Positions Held with the Trust | Term of Office* and Length of Time Served | Principal Occupations During the Past Five Years |
Abigail J. Murray
151 Detroit Street
Denver, CO 80206
DOB: 1975 | Vice President, Chief Legal Officer, and Secretary | 12/20-Present | Managing Counsel (2020-present). Formerly, Senior Counsel for Invesco Ltd. (2017-2020), and Vice President and Senior Counsel, ALPS Fund Services, Inc. and Assistant General Counsel, ALPS Advisors, Inc. (2015-2017). |
* Officers are elected at least annually by the Trustees for a one-year term and may also be elected from time to time by the Trustees for an interim period. |
| | | | | | | | |
| | | | | |

| | | | |
This report is submitted for the general information of shareholders of the Fund. It is not an offer or solicitation for the Fund and is not authorized for distribution to prospective investors unless preceded or accompanied by an effective prospectus. |
Janus Henderson is a trademark of Janus Henderson Group plc or one of its subsidiaries. © Janus Henderson Group plc Janus Henderson Distributors US LLC |
| | | | 125-02-93034 08-22 |
| | | |
| | | |
| | | ANNUAL REPORT June 30, 2022 |
| | |
| | Janus Henderson Small-Mid Cap Value Fund |
| | |
| | Janus Investment Fund |
| |
| | | |
| | | HIGHLIGHTS · Portfolio management perspective · Investment strategy behind your fund · Fund performance, characteristics
and holdings |
Table of Contents
Janus Henderson Small-Mid Cap Value Fund
Janus Henderson Small-Mid Cap Value Fund (unaudited)
| | | | | | |
FUND SNAPSHOT As defensive value specialists, we look to invest in high-quality companies with strong management teams, stable balance sheets, and durable competitive advantages that are trading at attractive valuations. The Fund seeks capital appreciation. | | | | 
Justin Tugman co-portfolio manager | 
Kevin Preloger co-portfolio manager |
| | | |
PERFORMANCE
For the 12-month period ended June 30, 2022, the Janus Henderson Small-Mid Cap Value Fund Class I shares returned -13.56%, slightly underperforming its primary benchmark, the Russell 2500TM Value Index, which returned - 13.19%. The Fund also underperformed its secondary benchmark, the Russell 3000® Value Index, which returned -7.46%.
INVESTMENT ENVIRONMENT
The period commenced with strengthening economic conditions and improving consumer sentiment. Following record stimulus in response to the COVID pandemic, economic growth was strong, asset prices had recovered, and the unemployment rate was trending down steadily. Despite the emergence of new COVID variants during the first half of the period – that slowed the gains in spending and labor market participation – the recovery continued, largely due to ongoing accommodative monetary policy. While COVID persisted as a nagging factor, the focal story of the 12-month period turned out to be the rapid rise of inflation, the Federal Reserve’s (Fed) slow but increasingly aggressive response to taming it, and the prospect of multiple interest rate hikes. Toward the close of 2021, the anticipation of higher interest rates triggered a rotation out of high-beta (beta is a measure of a stock’s volatility relative to that of the market), high-valuation stocks, especially in the small-cap market. This spurred a move into value stocks, which outperformed growth for the period.
Soaring inflation continued into 2022, with the Fed initially communicating that inflation was “transitory” and would abate once supply chain disruptions were alleviated. Market volatility increased in late February after the war in Ukraine led to an upward spike in commodity prices. With each passing month, inflation continued to rise, the anticipated peak did not materialize, and it became increasingly difficult for the Fed’s transitory thesis to hold. Finally, starting in March, the Fed imposed several interest rate hikes, ultimately raising interest rates 150 basis points by period end. The Fed also signaled it may continue this aggressive pace of monetary tightening in the second half of 2022. By the close of the period, there were signs that higher gasoline prices and rising inflation were starting to slow the broader economy, especially the housing and consumer spending markets. Investors scaled back their expectations for economic growth and corporate earnings, as recession fears weighed on stock performance.
PERFORMANCE DISCUSSION
Despite a challenging market environment over the period, we were pleased to see our portfolio provide relative downside preservation for investors, aided by our disciplined stock selection. This was due in part to our avoidance of lower-quality, high-valuation or unprofitable companies that were especially impacted by the market sell-off in the second half of the period. Our holdings have stronger balance sheets relative to holdings in the benchmark, and we believe this attribute likely will be even more important going forward. We were pleased to see many of our disciplined value investments rewarded for their higher quality and strong fundamentals.
The Fund’s stock selection and positioning in the energy sector hindered relative performance. In the index, energy stocks far outperformed other sectors, and the Fund’s overall underweight in the sector, as well as its lower relative exposure to natural gas producers and oil services companies, hurt relative returns. Late in the period, the prices of oil and natural gas retreated somewhat due to a temporary outage at a large liquified natural gas (LNG) export facility, and energy stocks declined. However, fuel prices have remained well above 2021 levels, which in our view provides a supportive environment for the kind of higher-quality, well-capitalized and disciplined producers we favor. We reduced our sector underweight over the period, adding positions in a natural gas producer and a gas utility.
Janus Henderson Small-Mid Cap Value Fund (unaudited)
Consumer discretionary was one of the weakest-performing sectors in the index, due to concerns that higher interest rates, high inflation and negative real wage growth could dampen consumer spending. The Fund’s stock selection in the sector detracted from relative performance as several of our holdings succumbed to the broad-based decline in consumer discretionary stocks. Among them were HanesBrands, a maker of sportswear and casual apparel; Stoneridge, a manufacturer of vehicle components; and Qurate Retail, which sells assorted merchandise online and through QVC video programming and whose stock was further pressured by a warehouse fire that impacted product availability. Our concerns over the impact of inflation on consumer spending led us to reduce our weighting in consumer discretionary over the period.
Stock selection in financials aided relative performance. Our investment in Memphis-based regional bank First Horizon was additive, as the stock rose on the announcement in February that Toronto-Dominion Bank would be acquiring the company for a substantial premium. The Fund’s stock selection and overweight in materials contributed as higher commodities prices provided a tailwind for their earnings. In our view, this provides a favorable environment for competitively positioned, cost-advantaged producers such as Graphic Packaging, a commercial products packaging manufacturer. The company was a top contributor over the period.
Several of our commodity-related investments also benefited from the strong demand and pricing environment. These included energy company Magnolia Oil & Gas and leading U.S. rebar producer Commercial Metals.
Fund positioning relative to the benchmark changed significantly in late June following a rebalancing of the Russell 2500 Value Index. The portfolio ended the quarter overweight in industrials, healthcare, information technology, materials, energy and consumer staples. It was underweight in financials, real estate, consumer discretionary, utilities and communication services.
OUTLOOK
We caution that the market may see heightened volatility as investors await more clarity on the outlook for inflation, interest rates and economic growth. We have seen some glimmers of improvement on the inflation front with the recent pullback in commodities prices as well as some easing in supply chain pressures. However, the Fed likely will need to raise rates further to get inflation closer to their target. Past Fed efforts to contain inflation have often led to a recession rather than a soft landing. We don’t believe this possibility is reflected in either corporate earnings outlooks or price-to-earnings (P/E) multiples (a measure of share price compared to earnings per share for a stock or stocks in a portfolio), and additional downward revisions may further unsettle the markets. Despite these uncertainties, we believe the Fund is well positioned to perform defensively, due to our focus on reasonably valued companies with strong balance sheets and healthy cash flows. We also seek to use volatility to our advantage as we identify opportunities that fit with our defensive value approach. We remain committed to this approach, which aims to pursue long-term opportunity while managing downside risk.
Thank you for your continued investment in the Janus Henderson Small-Mid Cap Value Fund.
Janus Henderson Small-Mid Cap Value Fund (unaudited)
Fund At A Glance
June 30, 2022
| | | | | | | | | | |
| | | | | | | | | |
| | | | | | | | | |
| | | | | | | | | |
| 5 Top Contributors - Holdings | 5 Top Detractors - Holdings |
| | Average
Weight | | Relative
Contribution | | | Average
Weight | | Relative
Contribution |
| First Horizon National Corporation | 2.65% | | 0.99% | | Qurate Retail Inc | 1.02% | | -0.75% |
| Magnolia Oil & Gas Corp | 1.85% | | 0.64% | | Hanesbrands Inc | 1.54% | | -0.67% |
| Carlisle Cos Inc | 1.92% | | 0.57% | | Mercury Systems Inc | 0.85% | | -0.62% |
| Commercial Metals Co | 2.36% | | 0.55% | | Stoneridge Inc | 0.49% | | -0.61% |
| Graphic Packaging Holding Co | 2.12% | | 0.52% | | Nomad Foods Ltd | 3.34% | | -0.57% |
| | | | | | | |
| 5 Top Contributors - Sectors* | | | | | |
| | | Relative | | Fund | Russell 2500 Value Index |
| | | Contribution | | Average Weight | Average Weight |
| Health Care | | 2.06% | | 10.33% | 8.35% |
| Materials | | 1.20% | | 10.30% | 7.17% |
| Financials | | 0.97% | | 15.78% | 20.52% |
| Other** | | 0.60% | | 2.88% | 0.00% |
| Communication Services | | 0.48% | | 0.71% | 2.94% |
| | | | | | |
| | | | | | |
| 5 Top Detractors - Sectors* | | | | | |
| | | Relative | | Fund | Russell 2500 Value Index |
| | | Contribution | | Average Weight | Average Weight |
| Energy | | -1.79% | | 4.54% | 6.00% |
| Consumer Discretionary | | -1.14% | | 7.14% | 9.65% |
| Industrials | | -1.13% | | 21.05% | 17.08% |
| Consumer Staples | | -0.60% | | 5.98% | 3.29% |
| Utilities | | -0.50% | | 0.66% | 4.00% |
| | | | | | | |
| Relative contribution reflects how the portolio's holdings impacted return relative to the benchmark. Cash and securities not held in the portfolio are not shown. For equity portfolios, relative contribution compares the performance of a security in the portfolio to the benchmark's total return, factoring in the difference in weight of that security in the benchmark. Returns are calculated using daily returns and previous day ending weights rolled up by ticker, excluding fixed income securities, gross of advisory fees, may exclude certain derivatives and will differ from actual performance.
Performance attribution reflects returns gross of advisory fees and may differ from actual returns as they are based on end of day holdings. Attribution is calculated by geometrically linking daily returns for the portfolio and index. |
* | Based on sector classification according to the Global Industry Classification Standard (“GICS”) codes, which are the exclusive property and a service mark of MSCI Inc. and Standard & Poor’s. |
** | Not a GICS classified sector. |
Janus Henderson Small-Mid Cap Value Fund (unaudited)
Fund At A Glance
June 30, 2022
| | |
5 Largest Equity Holdings - (% of Net Assets) |
First Interstate BancSystem Inc - Class A | |
Banks | 3.6% |
Nomad Foods Ltd | |
Food Products | 3.4% |
Casey's General Stores Inc | |
Food & Staples Retailing | 2.8% |
Ameris Bancorp | |
Banks | 2.8% |
Globus Medical Inc | |
Health Care Equipment & Supplies | 2.7% |
| | 15.3% |
| | | | | | |
Asset Allocation - (% of Net Assets) | |
Common Stocks | | 97.3% | |
Repurchase Agreements | | 3.2% | |
Other | | (0.5)% |
| | | 100.0% |
| | |
Top Country Allocations - Long Positions - (% of Investment Securities) |
As of June 30, 2022 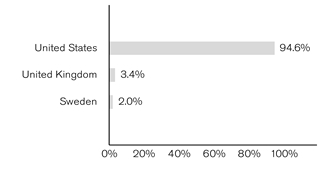
| As of June 30, 2021 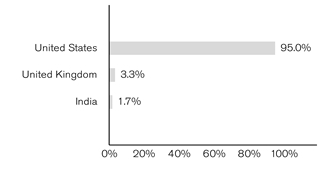
|
Janus Henderson Small-Mid Cap Value Fund (unaudited)
Performance
| |
See important disclosures on the next page. |

| | | | | | | | | | | |
| | | | | | | | | |
| | | | | | | | | |
Average Annual Total Return - for the periods ended June 30, 2022 | | | Prospectus Expense Ratios |
| | One
Year | Five
Year | Ten
Year | Since
Inception* | | | Total Annual Fund
Operating Expenses‡ | Net Annual Fund
Operating Expenses‡ |
Class A Shares at NAV | | -13.78% | 3.54% | 7.61% | 8.01% | | | 1.35% | 1.07% |
Class A Shares at MOP | | -18.72% | 2.32% | 6.98% | 7.41% | | | | |
Class C Shares at NAV | | -14.41% | 2.75% | 6.78% | 7.18% | | | 2.78% | 1.89% |
Class C Shares at CDSC | | -15.24% | 2.75% | 6.78% | 7.18% | | | | |
Class D Shares | | -13.54% | 3.76% | 7.84% | 8.24% | | | 1.06% | 0.90% |
Class I Shares | | -13.56% | 3.79% | 7.92% | 8.31% | | | 1.10% | 0.90% |
Class N Shares | | -13.48% | 3.88% | 7.89% | 8.25% | | | 0.88% | 0.76% |
Class S Shares | | -13.85% | 3.48% | 7.54% | 7.92% | | | 1.73% | 1.26% |
Class T Shares | | -13.67% | 3.64% | 7.74% | 8.13% | | | 1.18% | 1.01% |
Russell 2500 Value Index | | -13.19% | 5.54% | 9.54% | 10.27% | | | | |
Russell 3000 Value Index | | -7.46% | 7.01% | 10.39% | 11.12% | | | | |
Morningstar Quartile - Class I Shares | | 4th | 4th | 4th | 4th | | | | |
Morningstar Ranking - based on total returns for Mid-Cap Blend Funds | | 385/409 | 338/386 | 318/337 | 318/334 | | | | |
Returns quoted are past performance and do not guarantee future results; current performance may be lower or higher. Investment returns and principal value will vary; there may be a gain or loss when shares are sold. For the most recent month-end performance call 800.668.0434 (or 800.525.3713 if you hold shares directly with Janus Henderson) or visit janushenderson.com/performance (or janushenderson.com/allfunds if you hold shares directly with Janus Henderson).
Maximum Offering Price (MOP) returns include the maximum sales charge of 5.75%. Net Asset Value (NAV) returns exclude this charge, which would have reduced returns.
CDSC returns include a 1% contingent deferred sales charge (CDSC) on Shares redeemed within 12 months of purchase. Net Asset Value (NAV) returns exclude this charge, which would have reduced returns.
For certain periods, the Fund’s performance may reflect the effect of expense waivers.
This Fund has a performance-based management fee that may adjust up or down based on the Fund’s performance.
Janus Henderson Small-Mid Cap Value Fund (unaudited)
Performance
Performance may be affected by risks that include those associated with foreign and emerging markets, fixed income securities, high-yield and high-risk securities, undervalued, overlooked and smaller capitalization companies, real estate related securities including Real Estate Investment Trusts (REITs), Environmental, Social and Governance (ESG) factors, non-diversification, portfolio turnover, derivatives, short sales, initial public offerings (IPOs) and potential conflicts of interest. Each product has different risks. Please see the prospectus for more information about risks, holdings and other details.
Returns include reinvestment of all dividends and distributions and do not reflect the deduction of taxes that a shareholder would pay on Fund distributions or redemptions of Fund shares. The returns do not include adjustments in accordance with generally accepted accounting principles required at the period end for financial reporting purposes.
Class N Shares commenced operations on August 4, 2017. Performance shown for periods prior to August 4, 2017 reflects the historical performance of the Fund’s Class I Shares, calculated using the fees and expenses of Class N Shares, without the effect of any fee and expense limitations or waivers.
If Class N Shares of the Fund had been available during periods prior August 4, 2017, the performance shown may have been different. The performance shown for periods following the Fund’s commencement Class N Shares reflects the fees and expenses of Class N Shares, net of any applicable fee and expense limitations or waivers. Please refer to the Fund’s prospectuses for further details concerning historical performance.
Ranking is for the share class shown only; other classes may have different performance characteristics. When an expense waiver is in effect, it may have a material effect on the total return, and therefore the ranking for the period.
© 2022 Morningstar, Inc. All Rights Reserved.
There is no assurance that the investment process will consistently lead to successful investing.
See Notes to Schedule of Investments and Other Information for index definitions.
Index performance does not reflect the expenses of managing a portfolio as an index is unmanaged and not available for direct investment.
See “Useful Information About Your Fund Report.”
*The Fund’s inception date – December 15, 2011
‡ As stated in the prospectus. Net expense ratios reflect the expense waivers, if any, contractually agreed to for at least a one-year period commencing on October 28, 2021. See Financial Highlights for actual expense ratios during the reporting period.
Janus Henderson Small-Mid Cap Value Fund (unaudited)
Expense Examples
As a shareholder of the Fund, you incur two types of costs: (1) transaction costs, such as sales charges (loads) on purchase payments (applicable to Class A Shares only); and (2) ongoing costs, including management fees; 12b-1 distribution and shareholder servicing fees; transfer agent fees and expenses payable pursuant to the Transfer Agency Agreement; and other Fund expenses. This example is intended to help you understand your ongoing costs (in dollars) of investing in the Fund and to compare these costs with the ongoing costs of investing in other mutual funds. To do so, compare this 5% hypothetical example with the 5% hypothetical examples that appear in the shareholder reports of the other funds. The example is based upon an investment of $1,000 invested at the beginning of the period and held for the six-months indicated, unless noted otherwise in the table and footnotes below.
Actual Expenses
The information in the table under the heading “Actual” provides information about actual account values and actual expenses. You may use the information in these columns, together with the amount you invested, to estimate the expenses that you paid over the period. Simply divide your account value by $1,000 (for example, an $8,600 account value divided by $1,000 = 8.6), then multiply the result by the number in the appropriate column for your share class under the heading entitled “Expenses Paid During Period” to estimate the expenses you paid on your account during the period.
Hypothetical Example for Comparison Purposes
The information in the table under the heading “Hypothetical (5% return before expenses)” provides information about hypothetical account values and hypothetical expenses based upon the Fund’s actual expense ratio and an assumed rate of return of 5% per year before expenses, which is not the Fund’s actual return. The hypothetical account values and expenses may not be used to estimate the actual ending account balance or expenses you paid for the period. You may use this information to compare the ongoing costs of investing in the Fund and other funds. To do so, compare this 5% hypothetical example with the 5% hypothetical examples that appear in the shareholder reports of the other funds. Additionally, for an analysis of the fees associated with an investment in any share class or other similar funds, please visit www.finra.org/fundanalyzer.
Please note that the expenses shown in the table are meant to highlight your ongoing costs only and do not reflect any transaction costs. These fees are fully described in the Fund’s prospectuses. Therefore, the hypothetical examples are useful in comparing ongoing costs only, and will not help you determine the relative total costs of owning different funds. In addition, if these transaction costs were included, your costs would have been higher.
| | | | | | | | | | | |
| | | | | | | | |
| | | Actual | | Hypothetical
(5% return before expenses) | |
| Beginning
Account
Value
(1/1/22) | Ending
Account
Value
(6/30/22) | Expenses
Paid During
Period
(1/1/22 - 6/30/22)† | | Beginning
Account
Value
(1/1/22) | Ending
Account
Value
(6/30/22) | Expenses
Paid During
Period
(1/1/22 - 6/30/22)† | Net Annualized
Expense Ratio
(1/1/22 - 6/30/22) |
Class A Shares | $1,000.00 | $839.50 | $4.97 | | $1,000.00 | $1,019.39 | $5.46 | 1.09% |
Class C Shares | $1,000.00 | $836.70 | $8.15 | | $1,000.00 | $1,015.92 | $8.95 | 1.79% |
Class D Shares | $1,000.00 | $840.60 | $3.88 | | $1,000.00 | $1,020.58 | $4.26 | 0.85% |
Class I Shares | $1,000.00 | $840.70 | $3.70 | | $1,000.00 | $1,020.78 | $4.06 | 0.81% |
Class N Shares | $1,000.00 | $840.60 | $3.24 | | $1,000.00 | $1,021.27 | $3.56 | 0.71% |
Class S Shares | $1,000.00 | $839.40 | $5.34 | | $1,000.00 | $1,018.99 | $5.86 | 1.17% |
Class T Shares | $1,000.00 | $840.60 | $4.38 | | $1,000.00 | $1,020.03 | $4.81 | 0.96% |
† | Expenses Paid During Period are equal to the Net Annualized Expense Ratio multiplied by the average account value over the period, multiplied by 181/365 (to reflect the one-half year period). Expenses in the examples include the effect of applicable fee waivers and/or expense reimbursements, if any. Had such waivers and/or reimbursements not been in effect, your expenses would have been higher. Please refer to the Notes to Financial Statements or the Fund’s prospectuses for more information regarding waivers and/or reimbursements. |
Janus Henderson Small-Mid Cap Value Fund
Schedule of Investments
June 30, 2022
| | | | | | | | |
Shares or
Principal Amounts | | | Value | |
Common Stocks– 97.3% | | | |
Aerospace & Defense – 2.3% | | | |
| | BWX Technologies Inc | | 47,979 | | | $2,643,163 | |
Airlines – 1.5% | | | |
| | Southwest Airlines Co* | | 47,274 | | | 1,707,537 | |
Auto Components – 3.3% | | | |
| | Aptiv PLC* | | 15,964 | | | 1,421,913 | |
| | Autoliv Inc | | 33,684 | | | 2,410,764 | |
| | | 3,832,677 | |
Banks – 10.1% | | | |
| | Ameris Bancorp | | 80,411 | | | 3,230,914 | |
| | First Horizon National Corp | | 119,051 | | | 2,602,455 | |
| | First Interstate BancSystem Inc - Class A | | 110,926 | | | 4,227,390 | |
| | Synovus Financial Corp | | 49,272 | | | 1,776,256 | |
| | | 11,837,015 | |
Biotechnology – 1.4% | | | |
| | Exelixis Inc* | | 81,150 | | | 1,689,543 | |
Building Products – 1.6% | | | |
| | Fortune Brands Home & Security Inc | | 30,483 | | | 1,825,322 | |
Chemicals – 2.1% | | | |
| | Innospec Inc | | 25,230 | | | 2,416,782 | |
Communications Equipment – 1.6% | | | |
| | F5 Networks Inc* | | 12,292 | | | 1,881,168 | |
Construction Materials – 1.4% | | | |
| | Eagle Materials Inc | | 15,435 | | | 1,696,924 | |
Containers & Packaging – 2.4% | | | |
| | Graphic Packaging Holding Co | | 137,881 | | | 2,826,560 | |
Electrical Equipment – 3.4% | | | |
| | Acuity Brands Inc | | 14,442 | | | 2,224,646 | |
| | Encore Wire Corp | | 17,396 | | | 1,807,792 | |
| | | 4,032,438 | |
Electronic Equipment, Instruments & Components – 2.1% | | | |
| | Vontier Corp | | 105,850 | | | 2,433,491 | |
Energy Equipment & Services – 2.3% | | | |
| | ChampionX Corp | | 135,124 | | | 2,682,211 | |
Entertainment – 1.9% | | | |
| | Take-Two Interactive Software Inc* | | 18,629 | | | 2,282,611 | |
Equity Real Estate Investment Trusts (REITs) – 7.8% | | | |
| | Apple Hospitality Inc | | 128,130 | | | 1,879,667 | |
| | Equity LifeStyle Properties Inc | | 41,442 | | | 2,920,418 | |
| | Lamar Advertising Co | | 22,256 | | | 1,957,860 | |
| | PotlatchDeltic Corp | | 54,013 | | | 2,386,834 | |
| | | 9,144,779 | |
Food & Staples Retailing – 2.8% | | | |
| | Casey's General Stores Inc | | 17,750 | | | 3,283,395 | |
Food Products – 3.4% | | | |
| | Nomad Foods Ltd* | | 197,146 | | | 3,940,949 | |
Gas Utilities – 2.6% | | | |
| | ONE Gas Inc | | 37,416 | | | 3,037,805 | |
Health Care Equipment & Supplies – 6.7% | | | |
| | Embecta Corp* | | 84,557 | | | 2,140,983 | |
| | Envista Holdings Corp* | | 66,751 | | | 2,572,584 | |
| | Globus Medical Inc* | | 56,618 | | | 3,178,535 | |
| | | 7,892,102 | |
Health Care Providers & Services – 4.3% | | | |
| | Cardinal Health Inc | | 54,269 | | | 2,836,641 | |
| | Henry Schein Inc* | | 28,246 | | | 2,167,598 | |
| | | 5,004,239 | |
Industrial Conglomerates – 2.0% | | | |
| | Carlisle Cos Inc | | 9,877 | | | 2,356,751 | |
| | |
See Notes to Schedule of Investments and Other Information and Notes to Financial Statements. |
| |
8 | JUNE 30, 2022 |
Janus Henderson Small-Mid Cap Value Fund
Schedule of Investments
June 30, 2022
| | | | | | | | |
Shares or
Principal Amounts | | | Value | |
Common Stocks– (continued) | | | |
Insurance – 4.4% | | | |
| | Hartford Financial Services Group Inc | | 44,863 | | | $2,935,386 | |
| | Reinsurance Group of America Inc | | 19,428 | | | 2,278,710 | |
| | | 5,214,096 | |
Machinery – 5.6% | | | |
| | Hillenbrand Inc | | 60,634 | | | 2,483,569 | |
| | Lincoln Electric Holdings Inc | | 14,131 | | | 1,743,200 | |
| | Watts Water Technologies Inc - Class A | | 18,613 | | | 2,286,421 | |
| | | 6,513,190 | |
Metals & Mining – 1.7% | | | |
| | Commercial Metals Co | | 61,954 | | | 2,050,677 | |
Oil, Gas & Consumable Fuels – 5.3% | | | |
| | Denbury Inc* | | 24,520 | | | 1,470,955 | |
| | Gulfport Energy Corp* | | 20,734 | | | 1,648,560 | |
| | Magnolia Oil & Gas Corp | | 146,570 | | | 3,076,504 | |
| | | 6,196,019 | |
Semiconductor & Semiconductor Equipment – 2.4% | | | |
| | MKS Instruments Inc | | 8,687 | | | 891,547 | |
| | Teradyne Inc | | 21,352 | | | 1,912,072 | |
| | | 2,803,619 | |
Software – 1.8% | | | |
| | Black Knight Inc* | | 32,240 | | | 2,108,174 | |
Specialty Retail – 1.1% | | | |
| | Burlington Stores Inc* | | 9,709 | | | 1,322,657 | |
Textiles, Apparel & Luxury Goods – 1.7% | | | |
| | Hanesbrands Inc | | 189,167 | | | 1,946,528 | |
Thrifts & Mortgage Finance – 1.8% | | | |
| | WSFS Financial Corp | | 51,342 | | | 2,058,301 | |
Trading Companies & Distributors – 4.5% | | | |
| | GATX Corp | | 17,829 | | | 1,678,779 | |
| | H&E Equipment Services Inc | | 51,760 | | | 1,499,487 | |
| | MSC Industrial Direct Co Inc | | 28,492 | | | 2,140,034 | |
| | | 5,318,300 | |
Total Common Stocks (cost $120,883,719) | | 113,979,023 | |
Repurchase Agreements– 3.2% | | | |
| | ING Financial Markets LLC, Joint repurchase agreement, 1.4700%, dated 6/30/22, maturing 7/1/22 to be repurchased at $3,700,151 collateralized by $4,136,948 in U.S. Treasuries 0% - 3.2500%, 11/17/22 - 11/15/51 with a value of $3,774,154((cost $3,700,000) | | $3,700,000 | | | 3,700,000 | |
Total Investments (total cost $124,583,719) – 100.5% | | 117,679,023 | |
Liabilities, net of Cash, Receivables and Other Assets – (0.5)% | | (547,519) | |
Net Assets – 100% | | $117,131,504 | |
| | | | | | |
Summary of Investments by Country - (Long Positions) (unaudited) |
| |
| | | | | % of | |
| | | | | Investment | |
Country | | Value | | Securities | |
United States | | $111,327,310 | | 94.6 | % |
United Kingdom | | 3,940,949 | | 3.4 | |
Sweden | | 2,410,764 | | 2.0 | |
| | | | | | |
| | | | | | |
Total | | $117,679,023 | | 100.0 | % |
| | |
See Notes to Schedule of Investments and Other Information and Notes to Financial Statements. |
| |
Janus Investment Fund | 9 |
Janus Henderson Small-Mid Cap Value Fund
Schedule of Investments
June 30, 2022
| | | | | | | | | | |
Offsetting of Financial Assets and Derivative Assets |
| |
| | | Gross Amounts | | | | | | |
| | | of Recognized | | Offsetting Asset | | Collateral | | |
Counterparty | | Assets | | or Liability(a) | | Pledged(b) | | Net Amount |
| | | | | | | | | |
ING Financial Markets LLC | $ | 3,700,000 | $ | — | $ | (3,700,000) | $ | — |
| | | | | | | | | |
(a) | Represents the amount of assets or liabilities that could be offset with the same counterparty under master netting or similar agreements that management elects not to offset on the Statement of Assets and Liabilities. |
(b) | Collateral pledged is limited to the net outstanding amount due to/from an individual counterparty. The actual collateral amounts pledged may exceed these amounts and may fluctuate in value. |
| | |
See Notes to Schedule of Investments and Other Information and Notes to Financial Statements. |
| |
10 | JUNE 30, 2022 |
Janus Henderson Small-Mid Cap Value Fund
Notes to Schedule of Investments and Other Information
| | |
Russell 2500TM Value Index | Russell 2500TM Value Index reflects the performance of U.S. small to mid-cap equities with lower price-to-book ratios and lower forecasted growth values. |
Russell 3000® Value Index | Russell 3000® Value Index reflects the performance of U.S. equities with lower price-to-book ratios and lower forecasted growth values. |
| | |
LLC | Limited Liability Company |
PLC | Public Limited Company |
| | |
* | Non-income producing security. |
| | | | | | | | | | | | | |
The following is a summary of the inputs that were used to value the Fund’s investments in securities and other financial instruments as of June 30, 2022. See Notes to Financial Statements for more information. |
| |
Valuation Inputs Summary |
| | | | | | | |
| | | | | Level 2 - | | Level 3 - |
| | | Level 1 - | | Other Significant | | Significant |
| | | Quoted Prices | | Observable Inputs | | Unobservable Inputs |
| | | | | | | |
Assets | | | | | | |
Investments In Securities: | | | | | | |
Common Stocks | $ | 113,979,023 | $ | - | $ | - |
Repurchase Agreements | | - | | 3,700,000 | | - |
Total Assets | $ | 113,979,023 | $ | 3,700,000 | $ | - |
| | | | | | | |
Janus Henderson Small-Mid Cap Value Fund
Statement of Assets and Liabilities
June 30, 2022
| |
See footnotes at the end of the Statement. |
| | | | | | | |
| | | | | | |
Assets: | | | | |
| Investments, at value (cost $120,883,719) | | $ | 113,979,023 | |
| Repurchase agreements, at value (cost $3,700,000) | | | 3,700,000 | |
| Cash | | | 64,736 | |
| Trustees' deferred compensation | | | 3,424 | |
| Receivables: | | | | |
| | Investments sold | | | 297,496 | |
| | Dividends | | | 145,316 | |
| | Fund shares sold | | | 23,459 | |
| | Interest | | | 176 | |
| Other assets | | | 309 | |
Total Assets | | | 118,213,939 | |
Liabilities: | | | | |
| Payables: | | | — | |
| | Investments purchased | | | 830,065 | |
| | Fund shares repurchased | | | 80,219 | |
| | Professional fees | | | 54,475 | |
| | Advisory fees | | | 53,429 | |
| | Transfer agent fees and expenses | | | 9,851 | |
| | Trustees' deferred compensation fees | | | 3,424 | |
| | 12b-1 Distribution and shareholder servicing fees | | | 1,114 | |
| | Custodian fees | | | 1,046 | |
| | Trustees' fees and expenses | | | 536 | |
| | Affiliated fund administration fees payable | | | 253 | |
| | Accrued expenses and other payables | | | 48,023 | |
Total Liabilities | | | 1,082,435 | |
Net Assets | | $ | 117,131,504 | |
| | |
See Notes to Financial Statements. |
| |
12 | JUNE 30, 2022 |
Janus Henderson Small-Mid Cap Value Fund
Statement of Assets and Liabilities
June 30, 2022
| | | | | | | |
| | | | | | |
| | | | | | | |
Net Assets Consist of: | | | | |
| Capital (par value and paid-in surplus) | | $ | 126,425,362 | |
| Total distributable earnings (loss) | | | (9,293,858) | |
Total Net Assets | | $ | 117,131,504 | |
Net Assets - Class A Shares | | $ | 2,386,573 | |
| Shares Outstanding, $0.01 Par Value (unlimited shares authorized) | | | 203,619 | |
Net Asset Value Per Share(1) | | $ | 11.72 | |
Maximum Offering Price Per Share(2) | | $ | 12.44 | |
Net Assets - Class C Shares | | $ | 450,137 | |
| Shares Outstanding, $0.01 Par Value (unlimited shares authorized) | | | 40,110 | |
Net Asset Value Per Share(1) | | $ | 11.22 | |
Net Assets - Class D Shares | | $ | 40,877,839 | |
| Shares Outstanding, $0.01 Par Value (unlimited shares authorized) | | | 3,461,961 | |
Net Asset Value Per Share | | $ | 11.81 | |
Net Assets - Class I Shares | | $ | 8,308,975 | |
| Shares Outstanding, $0.01 Par Value (unlimited shares authorized) | | | 696,465 | |
Net Asset Value Per Share | | $ | 11.93 | |
Net Assets - Class N Shares | | $ | 56,752,283 | |
| Shares Outstanding, $0.01 Par Value (unlimited shares authorized) | | | 4,803,524 | |
Net Asset Value Per Share | | $ | 11.81 | |
Net Assets - Class S Shares | | $ | 939,379 | |
| Shares Outstanding, $0.01 Par Value (unlimited shares authorized) | | | 81,015 | |
Net Asset Value Per Share | | $ | 11.60 | |
Net Assets - Class T Shares | | $ | 7,416,318 | |
| Shares Outstanding, $0.01 Par Value (unlimited shares authorized) | | | 628,159 | |
Net Asset Value Per Share | | $ | 11.81 | |
| |
(1) Redemption price per share may be reduced for any applicable contingent deferred sales charge. (2) Maximum offering price is computed at 100/94.25 of net asset value. |
| | |
See Notes to Financial Statements. |
| |
Janus Investment Fund | 13 |
Janus Henderson Small-Mid Cap Value Fund
Statement of Operations
For the year ended June 30, 2022
| | | | | | |
| | | | | |
Investment Income: | | | |
| Dividends | $ | 2,085,547 | |
| Interest | | 9,275 | |
| Other income | | 499 | |
Total Investment Income | | 2,095,321 | |
Expenses: | | | |
| Advisory fees | | 852,287 | |
| 12b-1 Distribution and shareholder servicing fees: | | | |
| | Class A Shares | | 7,301 | |
| | Class C Shares | | 4,865 | |
| | Class S Shares | | 2,521 | |
| Transfer agent administrative fees and expenses: | | | |
| | Class D Shares | | 55,710 | |
| | Class S Shares | | 2,775 | |
| | Class T Shares | | 22,366 | |
| Transfer agent networking and omnibus fees: | | | |
| | Class A Shares | | 3,731 | |
| | Class C Shares | | 557 | |
| | Class I Shares | | 9,046 | |
| Other transfer agent fees and expenses: | | | |
| | Class A Shares | | 193 | |
| | Class C Shares | | 35 | |
| | Class D Shares | | 12,979 | |
| | Class I Shares | | 513 | |
| | Class N Shares | | 2,569 | |
| | Class S Shares | | 27 | |
| | Class T Shares | | 164 | |
| Registration fees | | 130,570 | |
| Non-affiliated fund administration fees | | 68,233 | |
| Professional fees | | 45,477 | |
| Shareholder reports expense | | 13,391 | |
| Custodian fees | | 3,594 | |
| Affiliated fund administration fees | | 3,476 | |
| Trustees’ fees and expenses | | 2,652 | |
| Other expenses | | 7,862 | |
Total Expenses | | 1,252,894 | |
Less: Excess Expense Reimbursement and Waivers | | (108,420) | |
Net Expenses | | 1,144,474 | |
Net Investment Income/(Loss) | | 950,847 | |
| | | | | |
| | |
See Notes to Financial Statements. |
| |
14 | JUNE 30, 2022 |
Janus Henderson Small-Mid Cap Value Fund
Statement of Operations
For the year ended June 30, 2022
| | | | | | |
| | | | | |
Net Realized Gain/(Loss) on Investments: | | | |
| Investments | $ | 1,636,295 | |
Total Net Realized Gain/(Loss) on Investments | | 1,636,295 | |
Change in Unrealized Net Appreciation/Depreciation: | | | |
| Investments and Trustees’ deferred compensation | | (21,819,692) | |
Total Change in Unrealized Net Appreciation/Depreciation | | (21,819,692) | |
Net Increase/(Decrease) in Net Assets Resulting from Operations | $ | (19,232,550) | |
| | | | | |
| | |
See Notes to Financial Statements. |
| |
Janus Investment Fund | 15 |
Janus Henderson Small-Mid Cap Value Fund
Statements of Changes in Net Assets
| | | | | | | | | |
| | | | | | | | |
| | | Year ended
June 30, 2022 | | Year ended
June 30, 2021 | |
| | | | | | | | | |
Operations: | | | | | | |
| Net investment income/(loss) | $ | 950,847 | | $ | 727,436 | |
| Net realized gain/(loss) on investments | | 1,636,295 | | | 3,173,769 | |
| Change in unrealized net appreciation/depreciation | | (21,819,692) | | | 17,435,662 | |
Net Increase/(Decrease) in Net Assets Resulting from Operations | | (19,232,550) | | | 21,336,867 | |
Dividends and Distributions to Shareholders: | | | | | | |
| | Class A Shares | | (79,135) | | | (16,879) | |
| | Class C Shares | | (12,497) | | | — | |
| | Class D Shares | | (1,467,870) | | | (180,499) | |
| | Class I Shares | | (310,688) | | | (119,572) | |
| | Class N Shares | | (2,081,053) | | | (158,071) | |
| | Class S Shares | | (30,861) | | | (4,556) | |
| | Class T Shares | | (239,738) | | | (36,885) | |
Net Decrease from Dividends and Distributions to Shareholders | | (4,221,842) | | | (516,462) | |
Capital Share Transactions: | | | | | | |
| | Class A Shares | | (428,805) | | | (630,167) | |
| | Class C Shares | | 22,667 | | | 29,223 | |
| | Class D Shares | | (17,630,182) | | | 38,275,331 | |
| | Class I Shares | | (4,610,382) | | | 270,036 | |
| | Class N Shares | | (2,767,610) | | | 63,111,878 | |
| | Class S Shares | | (5,229) | | | (207,299) | |
| | Class T Shares | | (9,681,030) | | | (22,390,494) | |
Net Increase/(Decrease) from Capital Share Transactions | | (35,100,571) | | | 78,458,508 | |
Net Increase/(Decrease) in Net Assets | | (58,554,963) | | | 99,278,913 | |
Net Assets: | | | | | | |
| Beginning of period | | 175,686,467 | | | 76,407,554 | |
| End of period | $ | 117,131,504 | | $ | 175,686,467 | |
| | | | | | | | |
| | |
See Notes to Financial Statements. |
| |
16 | JUNE 30, 2022 |
Janus Henderson Small-Mid Cap Value Fund
Financial Highlights
| | | | | | | | | | | | | | | | | | | |
Class A Shares | | | | | | | | | | | | | | | |
For a share outstanding during the year ended June 30 | | 2022 | | | 2021 | | | 2020 | | | 2019 | | | 2018 | |
| Net Asset Value, Beginning of Period | | $13.98 | | | $10.17 | | | $13.17 | | | $14.13 | | | $13.71 | |
| Income/(Loss) from Investment Operations: | | | | | | | | | | | | | | | |
| | Net investment income/(loss)(1) | | 0.06 | | | 0.10 | | | 0.10 | | | 0.10 | | | 0.04 | |
| | Net realized and unrealized gain/(loss) | | (1.93) | | | 3.78 | | | (1.71) | | | 0.65 | | | 1.12 | |
| Total from Investment Operations | | (1.87) | | | 3.88 | | | (1.61) | | | 0.75 | | | 1.16 | |
| Less Dividends and Distributions: | | | | | | | | | | | | | | | |
| | Dividends (from net investment income) | | (0.05) | | | (0.07) | | | (0.11) | | | (0.18) | | | —(2) | |
| | Distributions (from capital gains) | | (0.34) | | | — | | | (1.28) | | | (1.53) | | | (0.74) | |
| Total Dividends and Distributions | | (0.39) | | | (0.07) | | | (1.39) | | | (1.71) | | | (0.74) | |
| Net Asset Value, End of Period | | $11.72 | | | $13.98 | | | $10.17 | | | $13.17 | | | $14.13 | |
| Total Return* | | (13.78)% | | | 38.27% | | | (14.37)% | | | 7.46% | | | 8.49% | |
| Net Assets, End of Period (in thousands) | | $2,387 | | | $3,279 | | | $3,039 | | | $2,055 | | | $521 | |
| Average Net Assets for the Period (in thousands) | | $2,920 | | | $3,034 | | | $2,169 | | | $852 | | | $501 | |
| Ratios to Average Net Assets**: | | | | | | | | | | | | | | | |
| | Ratio of Gross Expenses | | 1.28% | | | 1.35% | | | 1.78% | | | 1.91% | | | 1.55% | |
| | Ratio of Net Expenses (After Waivers and Expense Offsets) | | 1.12% | | | 1.07% | | | 1.34% | | | 1.31% | | | 1.31% | |
| | Ratio of Net Investment Income/(Loss) | | 0.42% | | | 0.81% | | | 0.88% | | | 0.79% | | | 0.29% | |
| Portfolio Turnover Rate | | 80% | | | 99% | | | 152% | | | 40% | | | 58% | |
| | | | | | | | | | | | | | | | | | | |
| |
* Total return includes adjustments in accordance with generally accepted accounting principles required at the year or period end and are not annualized for periods of less than one full year. ** Annualized for periods of less than one full year. (1) Per share amounts are calculated based on average shares outstanding during the year or period. (2) Less than $0.005 on a per share basis. |
| | |
See Notes to Financial Statements. |
| |
Janus Investment Fund | 17 |
Janus Henderson Small-Mid Cap Value Fund
Financial Highlights
| | | | | | | | | | | | | | | | | | | |
Class C Shares | | | | | | | | | | | | | | | |
For a share outstanding during the year ended June 30 | | 2022 | | | 2021 | | | 2020 | | | 2019 | | | 2018 | |
| Net Asset Value, Beginning of Period | | $13.45 | | | $9.80 | | | $12.74 | | | $13.73 | | | $13.43 | |
| Income/(Loss) from Investment Operations: | | | | | | | | | | | | | | | |
| | Net investment income/(loss)(1) | | (0.04) | | | 0.02 | | | 0.01 | | | 0.02 | | | (0.06) | |
| | Net realized and unrealized gain/(loss) | | (1.85) | | | 3.63 | | | (1.66) | | | 0.60 | | | 1.10 | |
| Total from Investment Operations | | (1.89) | | | 3.65 | | | (1.65) | | | 0.62 | | | 1.04 | |
| Less Dividends and Distributions: | | | | | | | | | | | | | | | |
| | Dividends (from net investment income) | | — | | | — | | | (0.01) | | | (0.08) | | | — | |
| | Distributions (from capital gains) | | (0.34) | | | — | | | (1.28) | | | (1.53) | | | (0.74) | |
| Total Dividends and Distributions | | (0.34) | | | — | | | (1.29) | | | (1.61) | | | (0.74) | |
| Net Asset Value, End of Period | | $11.22 | | | $13.45 | | | $9.80 | | | $12.74 | | | $13.73 | |
| Total Return* | | (14.41)% | | | 37.24% | | | (15.04)% | | | 6.52% | | | 7.75% | |
| Net Assets, End of Period (in thousands) | | $450 | | | $515 | | | $353 | | | $398 | | | $262 | |
| Average Net Assets for the Period (in thousands) | | $493 | | | $427 | | | $380 | | | $318 | | | $319 | |
| Ratios to Average Net Assets**: | | | | | | | | | | | | | | | |
| | Ratio of Gross Expenses | | 2.51% | | | 2.70% | | | 3.23% | | | 3.30% | | | 2.38% | |
| | Ratio of Net Expenses (After Waivers and Expense Offsets) | | 1.84% | | | 1.81% | | | 2.14% | | | 2.09% | | | 2.05% | |
| | Ratio of Net Investment Income/(Loss) | | (0.33)% | | | 0.14% | | | 0.12% | | | 0.16% | | | (0.46)% | |
| Portfolio Turnover Rate | | 80% | | | 99% | | | 152% | | | 40% | | | 58% | |
| | | | | | | | | | | | | | | | | | | |
| |
* Total return includes adjustments in accordance with generally accepted accounting principles required at the year or period end and are not annualized for periods of less than one full year. ** Annualized for periods of less than one full year. (1) Per share amounts are calculated based on average shares outstanding during the year or period. |
| | |
See Notes to Financial Statements. |
| |
18 | JUNE 30, 2022 |
Janus Henderson Small-Mid Cap Value Fund
Financial Highlights
| | | | | | | | | | | | | | | | | | | |
Class D Shares | | | | | | | | | | | | | | | |
For a share outstanding during the year ended June 30 | | 2022 | | | 2021 | | | 2020 | | | 2019 | | | 2018 | |
| Net Asset Value, Beginning of Period | | $14.08 | | | $10.24 | | | $13.24 | | | $14.19 | | | $13.76 | |
| Income/(Loss) from Investment Operations: | | | | | | | | | | | | | | | |
| | Net investment income/(loss)(1) | | 0.08 | | | 0.10 | | | 0.13 | | | 0.16 | | | 0.08 | |
| | Net realized and unrealized gain/(loss) | | (1.93) | | | 3.83 | | | (1.72) | | | 0.61 | | | 1.13 | |
| Total from Investment Operations | | (1.85) | | | 3.93 | | | (1.59) | | | 0.77 | | | 1.21 | |
| Less Dividends and Distributions: | | | | | | | | | | | | | | | |
| | Dividends (from net investment income) | | (0.08) | | | (0.09) | | | (0.13) | | | (0.19) | | | (0.04) | |
| | Distributions (from capital gains) | | (0.34) | | | — | | | (1.28) | | | (1.53) | | | (0.74) | |
| Total Dividends and Distributions | | (0.42) | | | (0.09) | | | (1.41) | | | (1.72) | | | (0.78) | |
| Net Asset Value, End of Period | | $11.81 | | | $14.08 | | | $10.24 | | | $13.24 | | | $14.19 | |
| Total Return* | | (13.54)% | | | 38.52% | | | (14.20)% | | | 7.57% | | | 8.81% | |
| Net Assets, End of Period (in thousands) | | $40,878 | | | $66,854 | | | $21,708 | | | $23,948 | | | $22,006 | |
| Average Net Assets for the Period (in thousands) | | $49,604 | | | $34,811 | | | $22,879 | | | $22,739 | | | $23,560 | |
| Ratios to Average Net Assets**: | | | | | | | | | | | | | | | |
| | Ratio of Gross Expenses | | 0.95% | | | 1.06% | | | 1.51% | | | 1.45% | | | 1.19% | |
| | Ratio of Net Expenses (After Waivers and Expense Offsets) | | 0.87% | | | 0.89% | | | 1.17% | | | 1.10% | | | 1.07% | |
| | Ratio of Net Investment Income/(Loss) | | 0.62% | | | 0.78% | | | 1.06% | | | 1.22% | | | 0.53% | |
| Portfolio Turnover Rate | | 80% | | | 99% | | | 152% | | | 40% | | | 58% | |
| | | | | | | | | | | | | | | | | | | |
| |
* Total return includes adjustments in accordance with generally accepted accounting principles required at the year or period end and are not annualized for periods of less than one full year. ** Annualized for periods of less than one full year. (1) Per share amounts are calculated based on average shares outstanding during the year or period. |
| | |
See Notes to Financial Statements. |
| |
Janus Investment Fund | 19 |
Janus Henderson Small-Mid Cap Value Fund
Financial Highlights
| | | | | | | | | | | | | | | | | | | |
Class I Shares | | | | | | | | | | | | | | | |
For a share outstanding during the year ended June 30 | | 2022 | | | 2021 | | | 2020 | | | 2019 | | | 2018 | |
| Net Asset Value, Beginning of Period | | $14.22 | | | $10.34 | | | $13.36 | | | $14.21 | | | $13.78 | |
| Income/(Loss) from Investment Operations: | | | | | | | | | | | | | | | |
| | Net investment income/(loss)(1) | | 0.09 | | | 0.13 | | | 0.11 | | | 0.16 | | | 0.10 | |
| | Net realized and unrealized gain/(loss) | | (1.96) | | | 3.84 | | | (1.72) | | | 0.63 | | | 1.11 | |
| Total from Investment Operations | | (1.87) | | | 3.97 | | | (1.61) | | | 0.79 | | | 1.21 | |
| Less Dividends and Distributions: | | | | | | | | | | | | | | | |
| | Dividends (from net investment income) | | (0.08) | | | (0.09) | | | (0.13) | | | (0.11) | | | (0.04) | |
| | Distributions (from capital gains) | | (0.34) | | | — | | | (1.28) | | | (1.53) | | | (0.74) | |
| Total Dividends and Distributions | | (0.42) | | | (0.09) | | | (1.41) | | | (1.64) | | | (0.78) | |
| Net Asset Value, End of Period | | $11.93 | | | $14.22 | | | $10.34 | | | $13.36 | | | $14.21 | |
| Total Return* | | (13.56)% | | | 38.58% | | | (14.19)% | | | 7.66% | | | 8.84% | |
| Net Assets, End of Period (in thousands) | | $8,309 | | | $14,659 | | | $9,848 | | | $7,535 | | | $5,391 | |
| Average Net Assets for the Period (in thousands) | | $10,673 | | | $13,258 | | | $6,734 | | | $6,250 | | | $60,942 | |
| Ratios to Average Net Assets**: | | | | | | | | | | | | | | | |
| | Ratio of Gross Expenses | | 0.91% | | | 1.10% | | | 1.47% | | | 1.39% | | | 1.08% | |
| | Ratio of Net Expenses (After Waivers and Expense Offsets) | | 0.82% | | | 0.89% | | | 1.13% | | | 1.06% | | | 0.99% | |
| | Ratio of Net Investment Income/(Loss) | | 0.67% | | | 1.02% | | | 0.93% | | | 1.20% | | | 0.69% | |
| Portfolio Turnover Rate | | 80% | | | 99% | | | 152% | | | 40% | | | 58% | |
| | | | | | | | | | | | | | | | | | | |
| |
* Total return includes adjustments in accordance with generally accepted accounting principles required at the year or period end and are not annualized for periods of less than one full year. ** Annualized for periods of less than one full year. (1) Per share amounts are calculated based on average shares outstanding during the year or period. |
| | |
See Notes to Financial Statements. |
| |
20 | JUNE 30, 2022 |
Janus Henderson Small-Mid Cap Value Fund
Financial Highlights
| | | | | | | | | | | | | | | | | | | |
Class N Shares | | | | | | | | | | | | | | | |
For a share outstanding during the year or period ended June 30 | | 2022 | | | 2021 | | | 2020 | | | 2019 | | | 2018(1) | |
| Net Asset Value, Beginning of Period | | $14.09 | | | $10.24 | | | $13.24 | | | $14.20 | | | $14.06 | |
| Income/(Loss) from Investment Operations: | | | | | | | | | | | | | | | |
| | Net investment income/(loss)(2) | | 0.11 | | | 0.11 | | | 0.15 | | | 0.19 | | | 0.10 | |
| | Net realized and unrealized gain/(loss) | | (1.95) | | | 3.84 | | | (1.72) | | | 0.59 | | | 0.85 | |
| Total from Investment Operations | | (1.84) | | | 3.95 | | | (1.57) | | | 0.78 | | | 0.95 | |
| Less Dividends and Distributions: | | | | | | | | | | | | | | | |
| | Dividends (from net investment income) | | (0.10) | | | (0.10) | | | (0.15) | | | (0.21) | | | (0.07) | |
| | Distributions (from capital gains) | | (0.34) | | | — | | | (1.28) | | | (1.53) | | | (0.74) | |
| Total Dividends and Distributions | | (0.44) | | | (0.10) | | | (1.43) | | | (1.74) | | | (0.81) | |
| Net Asset Value, End of Period | | $11.81 | | | $14.09 | | | $10.24 | | | $13.24 | | | $14.20 | |
| Total Return* | | (13.48)% | | | 38.72% | | | (14.09)% | | | 7.73% | | | 6.77% | |
| Net Assets, End of Period (in thousands) | | $56,752 | | | $70,581 | | | $1,806 | | | $1,852 | | | $1,585 | |
| Average Net Assets for the Period (in thousands) | | $65,311 | | | $28,417 | | | $2,112 | | | $1,782 | | | $1,164 | |
| Ratios to Average Net Assets**: | | | | | | | | | | | | | | | |
| | Ratio of Gross Expenses | | 0.80% | | | 0.88% | | | 1.48% | | | 1.41% | | | 1.12% | |
| | Ratio of Net Expenses (After Waivers and Expense Offsets) | | 0.74% | | | 0.76% | | | 1.03% | | | 0.96% | | | 0.95% | |
| | Ratio of Net Investment Income/(Loss) | | 0.79% | | | 0.83% | | | 1.24% | | | 1.40% | | | 0.76% | |
| Portfolio Turnover Rate | | 80% | | | 99% | | | 152% | | | 40% | | | 58% | |
| | | | | | | | | | | | | | | | | | | |
| |
* Total return includes adjustments in accordance with generally accepted accounting principles required at the year or period end and are not annualized for periods of less than one full year. ** Annualized for periods of less than one full year. (1) Period from August 4, 2017 (inception date) through June 30, 2018. (2) Per share amounts are calculated based on average shares outstanding during the year or period. |
| | |
See Notes to Financial Statements. |
| |
Janus Investment Fund | 21 |
Janus Henderson Small-Mid Cap Value Fund
Financial Highlights
| | | | | | | | | | | | | | | | | | | |
Class S Shares | | | | | | | | | | | | | | | |
For a share outstanding during the year ended June 30 | | 2022 | | | 2021 | | | 2020 | | | 2019 | | | 2018 | |
| Net Asset Value, Beginning of Period | | $13.84 | | | $10.06 | | | $13.07 | | | $14.12 | | | $13.71 | |
| Income/(Loss) from Investment Operations: | | | | | | | | | | | | | | | |
| | Net investment income/(loss)(1) | | 0.04 | | | 0.08 | | | 0.08 | | | 0.09 | | | 0.04 | |
| | Net realized and unrealized gain/(loss) | | (1.91) | | | 3.75 | | | (1.69) | | | 0.65 | | | 1.12 | |
| Total from Investment Operations | | (1.87) | | | 3.83 | | | (1.61) | | | 0.74 | | | 1.16 | |
| Less Dividends and Distributions: | | | | | | | | | | | | | | | |
| | Dividends (from net investment income) | | (0.03) | | | (0.05) | | | (0.12) | | | (0.26) | | | (0.01) | |
| | Distributions (from capital gains) | | (0.34) | | | — | | | (1.28) | | | (1.53) | | | (0.74) | |
| Total Dividends and Distributions | | (0.37) | | | (0.05) | | | (1.40) | | | (1.79) | | | (0.75) | |
| Net Asset Value, End of Period | | $11.60 | | | $13.84 | | | $10.06 | | | $13.07 | | | $14.12 | |
| Total Return* | | (13.85)% | | | 38.16% | | | (14.51)% | | | 7.51% | | | 8.47% | |
| Net Assets, End of Period (in thousands) | | $939 | | | $1,136 | | | $1,004 | | | $390 | | | $100 | |
| Average Net Assets for the Period (in thousands) | | $1,110 | | | $1,084 | | | $890 | | | $115 | | | $114 | |
| Ratios to Average Net Assets**: | | | | | | | | | | | | | | | |
| | Ratio of Gross Expenses | | 1.54% | | | 1.71% | | | 2.16% | | | 4.23% | | | 2.17% | |
| | Ratio of Net Expenses (After Waivers and Expense Offsets) | | 1.20% | | | 1.23% | | | 1.51% | | | 1.29% | | | 1.34% | |
| | Ratio of Net Investment Income/(Loss) | | 0.31% | | | 0.68% | | | 0.71% | | | 0.70% | | | 0.27% | |
| Portfolio Turnover Rate | | 80% | | | 99% | | | 152% | | | 40% | | | 58% | |
| | | | | | | | | | | | | | | | | | | |
| |
* Total return includes adjustments in accordance with generally accepted accounting principles required at the year or period end and are not annualized for periods of less than one full year. ** Annualized for periods of less than one full year. (1) Per share amounts are calculated based on average shares outstanding during the year or period. |
| | |
See Notes to Financial Statements. |
| |
22 | JUNE 30, 2022 |
Janus Henderson Small-Mid Cap Value Fund
Financial Highlights
| | | | | | | | | | | | | | | | | | | |
Class T Shares | | | | | | | | | | | | | | | |
For a share outstanding during the year ended June 30 | | 2022 | | | 2021 | | | 2020 | | | 2019 | | | 2018 | |
| Net Asset Value, Beginning of Period | | $14.07 | | | $10.21 | | | $13.22 | | | $14.16 | | | $13.76 | |
| Income/(Loss) from Investment Operations: | | | | | | | | | | | | | | | |
| | Net investment income/(loss)(1) | | 0.06 | | | 0.06 | | | 0.14 | | | 0.15 | | | 0.06 | |
| | Net realized and unrealized gain/(loss) | | (1.93) | | | 3.86 | | | (1.76) | | | 0.61 | | | 1.13 | |
| Total from Investment Operations | | (1.87) | | | 3.92 | | | (1.62) | | | 0.76 | | | 1.19 | |
| Less Dividends and Distributions: | | | | | | | | | | | | | | | |
| | Dividends (from net investment income) | | (0.05) | | | (0.06) | | | (0.11) | | | (0.17) | | | (0.05) | |
| | Distributions (from capital gains) | | (0.34) | | | — | | | (1.28) | | | (1.53) | | | (0.74) | |
| Total Dividends and Distributions | | (0.39) | | | (0.06) | | | (1.39) | | | (1.70) | | | (0.79) | |
| Net Asset Value, End of Period | | $11.81 | | | $14.07 | | | $10.21 | | | $13.22 | | | $14.16 | |
| Total Return* | | (13.67)% | | | 38.50% | | | (14.40)% | | | 7.51% | | | 8.65% | |
| Net Assets, End of Period (in thousands) | | $7,416 | | | $18,663 | | | $38,649 | | | $23,144 | | | $30,287 | |
| Average Net Assets for the Period (in thousands) | | $8,946 | | | $11,012 | | | $17,402 | | | $27,284 | | | $22,955 | |
| Ratios to Average Net Assets**: | | | | | | | | | | | | | | | |
| | Ratio of Gross Expenses | | 1.07% | | | 1.18% | | | 1.55% | | | 1.51% | | | 1.29% | |
| | Ratio of Net Expenses (After Waivers and Expense Offsets) | | 0.99% | | | 1.02% | | | 1.27% | | | 1.20% | | | 1.19% | |
| | Ratio of Net Investment Income/(Loss) | | 0.46% | | | 0.49% | | | 1.08% | | | 1.14% | | | 0.43% | |
| Portfolio Turnover Rate | | 80% | | | 99% | | | 152% | | | 40% | | | 58% | |
| | | | | | | | | | | | | | | | | | | |
| |
* Total return includes adjustments in accordance with generally accepted accounting principles required at the year or period end and are not annualized for periods of less than one full year. ** Annualized for periods of less than one full year. (1) Per share amounts are calculated based on average shares outstanding during the year or period. |
| | |
See Notes to Financial Statements. |
| |
Janus Investment Fund | 23 |
Janus Henderson Small-Mid Cap Value Fund
Notes to Financial Statements
1. Organization and Significant Accounting Policies
Janus Henderson Small-Mid Cap Value Fund (the “Fund”) is a series of Janus Investment Fund (the “Trust”), which is organized as a Massachusetts business trust and is registered under the Investment Company Act of 1940, as amended (the “1940 Act”), as an open-end management investment company, and therefore has applied the specialized accounting and reporting guidance in Financial Accounting Standards Board (“FASB”) Accounting Standards Codification (“ASC”) Topic 946. The Trust offers 38 funds, each of which offers multiple share classes, with differing investment objectives and policies. The Fund seeks capital appreciation. The Fund is classified as diversified, as defined in the 1940 Act. Janus Henderson Investors US LLC (formerly Janus Capital Management LLC) is the investment adviser (the “Adviser”) to the Fund.
The Fund offers multiple classes of shares in order to meet the needs of various types of investors. Each class represents an interest in the same portfolio of investments. Certain financial intermediaries may not offer all classes of shares.
Class A Shares are offered through financial intermediary platforms including, but not limited to, traditional brokerage platforms, mutual fund wrap fee programs, bank trust platforms, and retirement platforms.
Class C Shares are offered through financial intermediary platforms including, but not limited to, traditional brokerage platforms, mutual fund wrap fee programs, and bank trust platforms.
Class C Shares are closed to investments by new employer-sponsored retirement plans and existing employer-sponsored retirement plans are no longer able to make additional purchases or exchanges into Class C Shares.
The Funds currently implement an automatic conversion feature pursuant to which Class C Shares that have been held for eight years are automatically converted to Class A Shares without the imposition of any sales charge, fee or other charge. The conversion will generally occur no later than ten business days in the month following the month of the eighth anniversary of the date of purchase. Class C Shares purchased through the reinvestment of dividends and other distributions on Class C Shares will convert to Class A Shares at the same time as the original Class C Shares with respect to which they were purchased. For Class C Shares held in omnibus accounts on intermediary platforms, the Fund will rely on these intermediaries to implement this conversion feature. Your financial intermediary may have separate policies and procedures as to when and how Class C Shares may be converted to Class A Shares. Please contact your financial intermediary for additional information.
Effective July 6, 2020, Class D Shares are available to new investors, subject to any closed fund policies for a Fund, as applicable. Previously, Class D Shares were only available to investors who already had a direct account with the Janus Henderson funds; immediate family members or members of the same household of an eligible individual investor; and existing beneficial owners of sole proprietorships or partnerships that hold accounts directly with the Janus Henderson funds.
Class I Shares are available through certain financial intermediary platforms including, but not limited to, mutual fund wrap fee programs, managed account programs, asset allocation programs, bank trust platforms, as well as certain retirement platforms. Class I Shares are also available to certain direct institutional investors including, but not limited to, corporations, certain retirement plans, public plans, and foundations/endowments, who established Class I Share accounts before August 4, 2017.
Class N Shares are generally available only to financial intermediaries purchasing on behalf of: 1) certain adviser-assisted, employer-sponsored retirement plans, including 401(k) plans, 457 plans, 403(b) plans, Taft-Hartley multi-employer plans, profit-sharing and money purchase pension plans, defined benefit plans and certain welfare benefit plans, such as health savings accounts, and nonqualified deferred compensation plans; and 2) retail investors purchasing in qualified or nonqualified accounts, whose accounts are held through an omnibus account at their financial intermediary, and where the financial intermediary requires no payment or reimbursement from the Fund, the Adviser, or its affiliates. Class N Shares are also available to Janus Henderson proprietary products and to certain direct institutional investors approved by Janus Henderson Distributors US LLC (formerly Janus Distributors LLC) (the “Distributor”) including, but not limited to, corporations, certain retirement plans, public plans, and foundations and endowments, subject to minimum investment requirements.
Class S Shares are offered through financial intermediary platforms including, but not limited to, retirement platforms and asset allocation, mutual fund wrap, or other discretionary or nondiscretionary fee-based investment advisory
Janus Henderson Small-Mid Cap Value Fund
Notes to Financial Statements
programs. In addition, Class S Shares may be available through certain financial intermediaries who have an agreement with the Adviser or its affiliates to offer Class S Shares on their supermarket platforms.
Class T Shares are available through certain financial intermediary platforms including, but not limited to, mutual fund wrap fee programs, managed account programs, asset allocation programs, bank trust platforms, as well as certain retirement platforms. In addition, Class T Shares may be available through certain financial intermediaries who have an agreement with the Adviser or its affiliates to offer Class T Shares on their supermarket platforms.
The following accounting policies have been followed by the Fund and are in conformity with US GAAP.
Investment Valuation
Securities held by the Fund are valued in accordance with policies and procedures established by and under the supervision of the Trustees (the “Valuation Procedures”). Equity securities traded on a domestic securities exchange are generally valued at the closing prices on the primary market or exchange on which they trade. If such price is lacking for the trading period immediately preceding the time of determination, such securities are generally valued at their current bid price. Equity securities that are traded on a foreign exchange are generally valued at the closing prices on such markets. In the event that there is no current trading volume on a particular security in such foreign exchange, the bid price from the primary exchange is generally used to value the security. Securities that are traded on the over-the-counter (“OTC”) markets are generally valued at their closing or latest bid prices as available. Foreign securities and currencies are converted to U.S. dollars using the applicable exchange rate in effect at the close of the New York Stock Exchange (“NYSE”). The Fund will determine the market value of individual securities held by it by using prices provided by one or more approved professional pricing services or, as needed, by obtaining market quotations from independent broker-dealers. Most debt securities are valued in accordance with the evaluated bid price supplied by the pricing service that is intended to reflect market value. The evaluated bid price supplied by the pricing service is an evaluation that may consider factors such as security prices, yields, maturities and ratings. Certain short-term securities maturing within 60 days or less may be evaluated and valued on an amortized cost basis provided that the amortized cost determined approximates market value. Securities for which market quotations or evaluated prices are not readily available or deemed unreliable are valued at fair value determined in good faith under the Valuation Procedures. Circumstances in which fair value pricing may be utilized include, but are not limited to: (i) a significant event that may affect the securities of a single issuer, such as a merger, bankruptcy, or significant issuer-specific development; (ii) an event that may affect an entire market, such as a natural disaster or significant governmental action; (iii) a nonsignificant event such as a market closing early or not opening, or a security trading halt; and (iv) pricing of a nonvalued security and a restricted or nonpublic security. Special valuation considerations may apply with respect to “odd-lot” fixed-income transactions which, due to their small size, may receive evaluated prices by pricing services which reflect a large block trade and not what actually could be obtained for the odd-lot position. The Fund uses systematic fair valuation models provided by independent third parties to value international equity securities in order to adjust for stale pricing, which may occur between the close of certain foreign exchanges and the close of the NYSE.
Valuation Inputs Summary
FASB ASC 820, Fair Value Measurements and Disclosures (“ASC 820”), defines fair value, establishes a framework for measuring fair value, and expands disclosure requirements regarding fair value measurements. This standard emphasizes that fair value is a market-based measurement that should be determined based on the assumptions that market participants would use in pricing an asset or liability and establishes a hierarchy that prioritizes inputs to valuation techniques used to measure fair value. These inputs are summarized into three broad levels:
Level 1 – Unadjusted quoted prices in active markets the Fund has the ability to access for identical assets or liabilities.
Level 2 – Observable inputs other than unadjusted quoted prices included in Level 1 that are observable for the asset or liability either directly or indirectly. These inputs may include quoted prices for the identical instrument on an inactive market, prices for similar instruments, interest rates, prepayment speeds, credit risk, yield curves, default rates and similar data.
Assets or liabilities categorized as Level 2 in the hierarchy generally include: debt securities fair valued in accordance with the evaluated bid or ask prices supplied by a pricing service; securities traded on OTC markets and listed securities for which no sales are reported that are fair valued at the latest bid price (or yield equivalent thereof) obtained from one or more dealers transacting in a market for such securities or by a pricing service approved by the Fund’s Trustees; certain short-term debt securities with maturities of 60 days or less that are fair
Janus Henderson Small-Mid Cap Value Fund
Notes to Financial Statements
valued at amortized cost; and equity securities of foreign issuers whose fair value is determined by using systematic fair valuation models provided by independent third parties in order to adjust for stale pricing which may occur between the close of certain foreign exchanges and the close of the NYSE. Other securities that may be categorized as Level 2 in the hierarchy include, but are not limited to, preferred stocks, bank loans, swaps, investments in unregistered investment companies, options, and forward contracts.
Level 3 – Unobservable inputs for the asset or liability to the extent that relevant observable inputs are not available, representing the Fund’s own assumptions about the assumptions that a market participant would use in valuing the asset or liability, and that would be based on the best information available.
There have been no significant changes in valuation techniques used in valuing any such positions held by the Fund since the beginning of the fiscal year.
The inputs or methodology used for fair valuing securities are not necessarily an indication of the risk associated with investing in those securities. The summary of inputs used as of June 30, 2022 to fair value the Fund’s investments in securities and other financial instruments is included in the “Valuation Inputs Summary” in the Notes to Schedule of Investments and Other Information.
Investment Transactions and Investment Income
Investment transactions are accounted for as of the date purchased or sold (trade date). Dividend income is recorded on the ex-dividend date. Certain dividends from foreign securities will be recorded as soon as the Fund is informed of the dividend, if such information is obtained subsequent to the ex-dividend date. Dividends from foreign securities may be subject to withholding taxes in foreign jurisdictions. Non-cash dividends, if any, are recorded on the ex-dividend date at fair value. Interest income is recorded daily on the accrual basis and includes amortization of premiums and accretion of discounts. The Fund classifies gains and losses on prepayments received as an adjustment to interest income. Debt securities may be placed in non-accrual status and related interest income may be reduced by stopping current accruals and writing off interest receivables when collection of all or a portion of interest has become doubtful. Gains and losses are determined on the identified cost basis, which is the same basis used for federal income tax purposes. Income, as well as gains and losses, both realized and unrealized, are allocated daily to each class of shares based upon the ratio of net assets represented by each class as a percentage of total net assets.
Expenses
The Fund bears expenses incurred specifically on its behalf. Each class of shares bears a portion of general expenses, which are allocated daily to each class of shares based upon the ratio of net assets represented by each class as a percentage of total net assets. Expenses directly attributable to a specific class of shares are charged against the operations of such class.
Estimates
The preparation of financial statements in conformity with US GAAP requires management to make estimates and assumptions that affect the reported amount of assets and liabilities and disclosure of contingent assets and liabilities at the date of the financial statements, and the reported amounts of income and expenses during the reporting period. Actual results could differ from those estimates.
Indemnifications
In the normal course of business, the Fund may enter into contracts that contain provisions for indemnification of other parties against certain potential liabilities. The Fund’s maximum exposure under these arrangements is unknown, and would involve future claims that may be made against the Fund that have not yet occurred. Currently, the risk of material loss from such claims is considered remote.
Dividends and Distributions
The Fund generally declares and distributes dividends of net investment income and realized capital gains (if any) annually. The Fund may treat a portion of the amount paid to redeem shares as a distribution of investment company taxable income and realized capital gains that are reflected in the net asset value. This practice, commonly referred to as “equalization,” has no effect on the redeeming shareholder or a Fund’s total return, but may reduce the amounts that would otherwise be required to be paid as taxable dividends to the remaining shareholders. It is possible that the Internal Revenue Service (IRS) could challenge the Fund's equalization methodology or calculations, and any such challenge could result in additional tax, interest, or penalties to be paid by the Fund.
Janus Henderson Small-Mid Cap Value Fund
Notes to Financial Statements
The Fund may make certain investments in real estate investment trusts (“REITs”) which pay dividends to their shareholders based upon funds available from operations. It is quite common for these dividends to exceed the REITs’ taxable earnings and profits, resulting in the excess portion of such dividends being designated as a return of capital. If the Fund distributes such amounts, such distributions could constitute a return of capital to shareholders for federal income tax purposes.
Federal Income Taxes
The Fund intends to continue to qualify as a regulated investment company and distribute all of its taxable income in accordance with the requirements of Subchapter M of the Internal Revenue Code. Management has analyzed the Fund’s tax positions taken for all open federal income tax years, generally a three-year period, and has concluded that no provision for federal income tax is required in the Fund’s financial statements. The Fund is not aware of any tax positions for which it is reasonably possible that the total amounts of unrecognized tax benefits will significantly change in the next twelve months.
2. Other Investments and Strategies
Additional Investment Risk
In response to the COVID-19 pandemic, the U.S. government and the Federal Reserve, as well as certain foreign governments and central banks, have taken extraordinary actions to support local and global economies and the financial markets, including reducing interest rates to record-low levels. Extremely low or negative interest rates may become more prevalent or may not work as intended. As there is little precedent for this situation, the impact on various markets that interest rate or other significant policy changes may have is unknown. The withdrawal of this support, a failure of measures put in place in response to such economic uncertainty, or investor perception that such efforts were not sufficient could each negatively affect financial markets generally, and the value and liquidity of specific securities. In addition, policy and legislative changes in the United States and in other countries continue to impact many aspects of financial regulation.
Widespread disease, including pandemics and epidemics, and natural or environmental disasters, including those which may be attributable to global climate change, such as earthquakes, fires, floods, hurricanes, tsunamis and weather-related phenomena generally, have been and can be highly disruptive to economies and markets, adversely impacting individual companies, sectors, industries, markets, currencies, interest and inflation rates, credit ratings, investor sentiment, and other factors affecting the value of a Fund’s investments. Economies and financial markets throughout the world have become increasingly interconnected, which increases the likelihood that events or conditions in one region or country will adversely affect markets or issuers in other regions or countries, including the United States. These disruptions could prevent a Fund from executing advantageous investment decisions in a timely manner and negatively impact a Fund’s ability to achieve its investment objective(s). Any such event(s) could have a significant adverse impact on the value of a Fund. In addition, these disruptions could also impair the information technology and other operational systems upon which the Fund’s service providers, including the Adviser or the subadviser (as applicable), rely, and could otherwise disrupt the ability of employees of the Fund’s service providers to perform essential tasks on behalf of the Fund. Adverse weather conditions may also have a particularly significant negative effect on issuers in the agricultural sector and on insurance and reinsurance companies that insure or reinsure against the impact of natural disasters.
A number of countries in the European Union (the “EU”) have experienced, and may continue to experience, severe economic and financial difficulties. In particular, many EU nations are susceptible to economic risks associated with high levels of debt. Many non-governmental issuers, and even certain governments, have defaulted on, or been forced to restructure, their debts. Many other issuers have faced difficulties obtaining credit or refinancing existing obligations. Financial institutions have in many cases required government or central bank support, have needed to raise capital, and/or have been impaired in their ability to extend credit. As a result, financial markets in the EU have experienced extreme volatility and declines in asset values and liquidity. These difficulties may continue, worsen, or spread further within the EU. Responses to these financial problems by European governments, central banks, and others, including austerity measures and reforms, may not work, may result in social unrest, and may limit future growth and economic recovery or have other unintended consequences. Among other things, these developments have adversely affected the value and exchange rate of the euro and pound sterling, and may continue to significantly affect the economies of all EU countries, which in turn may have a material adverse effect on the Fund’s investments in such countries, other countries that depend on EU countries for significant amounts of trade or investment, or issuers with exposure to debt issued by certain EU countries.
Janus Henderson Small-Mid Cap Value Fund
Notes to Financial Statements
Counterparties
Fund transactions involving a counterparty are subject to the risk that the counterparty or a third party will not fulfill its obligation to the Fund (“counterparty risk”). Counterparty risk may arise because of the counterparty’s financial condition (i.e., financial difficulties, bankruptcy, or insolvency), market activities and developments, or other reasons, whether foreseen or not. A counterparty’s inability to fulfill its obligation may result in significant financial loss to the Fund. The Fund may be unable to recover its investment from the counterparty or may obtain a limited recovery, and/or recovery may be delayed. The extent of the Fund’s exposure to counterparty risk with respect to financial assets and liabilities approximates its carrying value. See the "Offsetting Assets and Liabilities" section of this Note for further details.
The Fund may be exposed to counterparty risk through participation in various programs, including, but not limited to, lending its securities to third parties, cash sweep arrangements whereby the Fund’s cash balance is invested in one or more types of cash management vehicles, as well as investments in, but not limited to, repurchase agreements, debt securities, and derivatives, including various types of swaps, futures and options. The Fund intends to enter into financial transactions with counterparties that the Adviser believes to be creditworthy at the time of the transaction. There is always the risk that the Adviser’s analysis of a counterparty’s creditworthiness is incorrect or may change due to market conditions. To the extent that the Fund focuses its transactions with a limited number of counterparties, it will have greater exposure to the risks associated with one or more counterparties.
Offsetting Assets and Liabilities
The Fund presents gross and net information about transactions that are either offset in the financial statements or subject to an enforceable master netting arrangement or similar agreement with a designated counterparty, regardless of whether the transactions are actually offset in the Statement of Assets and Liabilities.
The Offsetting Assets and Liabilities table located in the Schedule of Investments presents gross amounts of recognized assets and/or liabilities and the net amounts after deducting collateral that has been pledged by counterparties or has been pledged to counterparties (if applicable). For corresponding information grouped by type of instrument, see the Fund's Schedule of Investments.
All repurchase agreements are transacted under legally enforceable master repurchase agreements that give the Fund, in the event of default by the counterparty, the right to liquidate securities held and to offset receivables and payables with the counterparty. For financial reporting purposes, the Fund does not offset financial instruments' payables and receivables and related collateral on the Statement of Assets and Liabilities. Repurchase agreements held by the Fund are fully collateralized, and such collateral is in the possession of the Fund’s custodian or, for tri-party agreements, the custodian designated by the agreement. The collateral is evaluated daily to ensure its market value exceeds the current market value of the repurchase agreements, including accrued interest.
Real Estate Investing
The Fund may invest in equity and debt securities of real estate-related companies. Such companies may include those in the real estate industry or real estate-related industries. These securities may include common stocks, corporate bonds, preferred stocks, and other equity securities, including, but not limited to, mortgage-backed securities, real estate-backed securities, securities of REITs and similar REIT-like entities. A REIT is a trust that invests in real estate-related projects, such as properties, mortgage loans, and construction loans. REITs are generally categorized as equity, mortgage, or hybrid REITs. A REIT may be listed on an exchange or traded OTC.
Repurchase Agreements
The Fund and other funds advised by the Adviser or its affiliates may transfer daily uninvested cash balances into one or more joint trading accounts. Assets in the joint trading accounts are invested in money market instruments and the proceeds are allocated to the participating funds on a pro rata basis.
Repurchase agreements held by the Fund are fully collateralized, and such collateral is in the possession of the Fund’s custodian or, for tri-party agreements, the custodian designated by the agreement. The collateral is evaluated daily to ensure its market value exceeds the current market value of the repurchase agreements, including accrued interest. In the event of default on the obligation to repurchase, the Fund has the right to liquidate the collateral and apply the proceeds in satisfaction of the obligation. In the event of default or bankruptcy by the other party to the agreement, realization and/or retention of the collateral or proceeds may be subject to legal proceedings.
Janus Henderson Small-Mid Cap Value Fund
Notes to Financial Statements
3. Investment Advisory Agreements and Other Transactions with Affiliates
The Fund pays the Adviser an investment advisory fee rate that may adjust up or down based on the Fund’s performance relative to its benchmark index.
The investment advisory fee rate paid to the Adviser by the Fund consists of two components: (1) a base fee calculated by applying the contractual fixed rate of the advisory fee to the Fund’s average daily net assets during the previous month (the “Base Fee Rate”), plus or minus (2) a performance-fee adjustment (the “Performance Adjustment”) calculated by applying a variable rate of up to 0.15% (positive or negative) to the Fund’s average daily net assets based on the Fund’s relative performance compared to the cumulative investment record of its benchmark index over a 36-month performance measurement period or shorter time period, as applicable. The investment advisory fee rate is calculated daily and paid monthly.
The investment performance of the Fund’s Class A Shares (waiving the upfront sales load) for the performance measurement period is used to calculate the Performance Adjustment. The Fund’s Base Fee Rate prior to any performance adjustment (expressed as an annual rate) is 0.70%. The Fund’s primary benchmark index is the Russell 2500® Value Index. The Russell 3000® Value Index was used to calculate the Fund’s performance fee adjustment prior to August 1, 2019. For a period of 36 months beginning on August 1, 2019, the Fund’s performance fee adjustment is calculated based on a combination of the Russell 2500® Value Index and the Russell 3000® Value Index.
No Performance Adjustment is applied unless the difference between the Fund’s investment performance and the cumulative investment record of the Fund’s benchmark index is 0.50% or greater (positive or negative) during the applicable performance measurement period. The Base Fee Rate is subject to an upward or downward Performance Adjustment for every full 0.50% increment by which the Fund outperforms or underperforms its benchmark index, up to the Fund’s full performance rate of ±5.00%. Because the Performance Adjustment is tied to a Fund’s relative performance compared to its benchmark index (and not its absolute performance), the Performance Adjustment could increase the Adviser’s fee even if the Fund’s Shares lose value during the performance measurement period and could decrease the Adviser’s fee even if the Fund’s Shares increase in value during the performance measurement period. For purposes of computing the Base Fee Rate and the Performance Adjustment, net assets are averaged over different periods (average daily net assets during the previous month for the Base Fee Rate, versus average daily net assets during the performance measurement period for the Performance Adjustment). Performance of the Fund is calculated net of expenses whereas the Fund’s benchmark index does not have any fees or expenses. Reinvestment of dividends and distributions is included in calculating both the performance of a Fund and the Fund’s benchmark index.
The Fund’s prospectuses and statement(s) of additional information contain additional information about performance-based fees. The amount shown as advisory fees on the Statement of Operations reflects the Base Fee Rate plus/minus any Performance Adjustment. For the year ended June 30, 2022, the performance adjusted investment advisory fee rate before any waivers and/or reimbursements of expenses is 0.61%.
The Adviser has contractually agreed to waive the investment advisory fee and/or reimburse operating expenses to the extent that the Fund’s total annual fund operating expenses, excluding any performance adjustments to management fees, the fees payable pursuant to a Rule 12b-1 plan, shareholder servicing fees, such as transfer agency fees (including out-of-pocket costs), administrative services fees and any networking/omnibus payable by any share class, brokerage commissions, interest, dividends, taxes, acquired fund fees and expenses, and extraordinary expenses, exceed the annual rate of 0.82% of the Fund’s average daily net assets. The Adviser has agreed to continue the waivers for at least a one-year period commencing October 28, 2021. If applicable, amounts waived and/or reimbursed to the Fund by the Adviser are disclosed as “Excess Expense Reimbursement and Waivers” on the Statement of Operations.
The Adviser serves as administrator to the Fund pursuant to an administration agreement between the Adviser and the Trust. Under the administration agreement, the Adviser is authorized to perform, or cause others to perform certain administration, compliance, and accounting services to the Fund, including providing office space for the Fund, and is reimbursed by the Fund for certain of its costs in providing these services (to the extent the Adviser seeks reimbursement and such costs are not otherwise waived). In addition, employees of the Adviser and/or its affiliates may serve as officers of the Trust. The Fund pays for some or all of the salaries, fees, and expenses of the Adviser employees and Fund officers, with respect to certain specified administration functions they perform on behalf of the Fund. The Fund pays these costs based on out-of-pocket expenses incurred by the Adviser, and these costs are separate and apart from advisory fees and other expenses paid in connection with the investment advisory services the
Janus Henderson Small-Mid Cap Value Fund
Notes to Financial Statements
Adviser (or any subadvisor, as applicable) provides to the Fund. These amounts are disclosed as “Affiliated fund administration fees” on the Statement of Operations. In addition, some expenses related to compensation payable to the Fund’s Chief Compliance Officer and certain compliance staff, all of whom are employees of the Adviser and/or its affiliates, are shared with the Fund. Total compensation of $474,228 was paid to the Chief Compliance Officer and certain compliance staff by the Trust during the year ended June 30, 2022. The Fund's portion is reported as part of “Other expenses” on the Statement of Operations.
Janus Henderson Services US LLC (formerly Janus Services LLC) (the “Transfer Agent”), a wholly-owned subsidiary of the Adviser, is the Fund’s transfer agent. The Transfer Agent provides or arranges for the provision of shareholder services including, but not limited to, recordkeeping, subaccounting, answering inquiries regarding accounts, order processing, transaction confirmations, the mailing of prospectuses and shareholder reports, and other shareholder services provided to or on behalf of shareholders. These amounts are disclosed as “Transfer agent administrative fees and expenses” on the Statement of Operations.
Class D Shares of the Fund pay the Transfer Agent an annual administrative services fee based on the average daily net assets of Class D Shares as detailed below.
| | |
Average Daily Net Assets of Class D Shares of the Janus Henderson funds | Administrative Services Fee |
Under $40 billion | 0.12% |
$40 billion – $49.9 billion | 0.10% |
Over $49.9 billion | 0.08% |
During the reporting period, the administrative services fee rate was 0.11%.
The Transfer Agent receives an administrative services fee at an annual rate of up to 0.25% of the average daily net assets of the Fund’s Class S Shares and Class T Shares for providing or procuring administrative services to investors in Class S Shares and Class T Shares of the Fund. The Transfer Agent expects to use all or a significant portion of this fee to compensate retirement plan service providers, broker-dealers, bank trust departments, financial advisors, and other financial intermediaries for providing these services. The Transfer Agent may keep certain amounts retained for reimbursement of out-of-pocket costs incurred for servicing clients of Class S Shares and Class T Shares.
Shareholder Services provided by these financial intermediaries may include, but are not limited to, recordkeeping, subaccounting, order processing, providing order confirmations, periodic statements, forwarding prospectuses, shareholder reports, and other materials to existing customers, answering inquiries regarding accounts, and other administrative services. Order processing includes the submission of transactions through the National Securities Clearing Corporation (“NSCC”) or similar systems, or those processed on a manual basis with the Adviser. For all share classes, the Transfer Agent also seeks reimbursement for costs it incurs as transfer agent and for providing servicing.
Certain, but not all, intermediaries may charge administrative fees to investors in Class A Shares, Class C Shares, and Class I Shares for administrative services provided on behalf of such investors. These administrative fees are paid by the Class A Shares, Class C Shares, and Class I Shares of the Fund to the Transfer Agent, which uses such fees to reimburse intermediaries. Consistent with the Transfer Agency Agreement between the Transfer Agent and the Fund, the Transfer Agent may negotiate the level, structure, and/or terms of the administrative fees with intermediaries requiring such fees on behalf of the Fund. The Adviser and its affiliates benefit from an increase in assets that may result from such relationships. The Adviser has agreed to limit these fees up to 0.20% for Class A Shares and Class C Shares, and up to 0.15% for Class I Shares on an annual basis based on the daily net assets of each share class. Such limits are subject to change by the Trustees in the future. These amounts are disclosed as “Transfer agent networking and omnibus fees” on the Statement of Operations.
The Transfer Agent is not compensated for its services related to the shares, except for out-of-pocket costs, although the Transfer Agent is compensated for its services related to Fund’s Class D Shares. These amounts are disclosed as “Other transfer agent fees and expenses” on the Statement of Operations.
Under distribution and shareholder servicing plans (the “Plans”) adopted in accordance with Rule 12b-1 under the 1940 Act, the Fund pays the Trust’s distributor, the Distributor, a wholly-owned subsidiary of the Adviser, a fee for the sale and distribution and/or shareholder servicing of the shares based on the average daily net assets for each share class at an annual rate of up to 0.25% for Class A Shares, up to 1.00% for Class C Shares, and up to 0.25% for Class S Shares. Under the terms of the Plans, the Trust is authorized to make payments to the Distributor for remittance to
Janus Henderson Small-Mid Cap Value Fund
Notes to Financial Statements
retirement plan service providers, broker-dealers, bank trust departments, financial advisors, and other financial intermediaries, as compensation for distribution and/or shareholder services performed by such entities for their customers who are investors in the Fund. These amounts are disclosed as “12b-1 Distribution and shareholder servicing fees” on the Statement of Operations.
Class A Shares include a 5.75% upfront sales charge of the offering price of the Fund. The sales charge is allocated between the Distributor and financial intermediaries. During the year ended June 30, 2022, the Distributor retained upfront sales charges of $718.
A contingent deferred sales charge (“CDSC”) of 1.00% will be deducted with respect to Class A Shares purchased without a sales load and redeemed within 12 months of purchase, unless waived. Any applicable CDSC will be 1.00% of the lesser of the original purchase price or the value of the redemption of the Class A Shares redeemed. There were no CDSCs paid by redeeming shareholders of Class A Shares to the Distributor during the year ended June 30, 2022.
A CDSC of 1.00% will be deducted with respect to Class C Shares redeemed within 12 months of purchase, unless waived. Any applicable CDSC will be 1.00% of the lesser of the original purchase price or the value of the redemption of the Class C Shares redeemed. During the year ended June 30, 2022, redeeming shareholders of Class C Shares paid CDSCs of $9.
The Board of Trustees has adopted a deferred compensation plan (the “Deferred Plan”) for independent Trustees to elect to defer receipt of all or a portion of the annual compensation they are entitled to receive from the Fund. All deferred fees are credited to an account established in the name of the Trustees. The amounts credited to the account then increase or decrease, as the case may be, in accordance with the performance of one or more of the Janus Henderson funds that are selected by the Trustees. The account balance continues to fluctuate in accordance with the performance of the selected fund or funds until final payment of all amounts are credited to the account. The fluctuation of the account balance is recorded by the Fund as unrealized appreciation/(depreciation) and is included as of June 30, 2022 on the Statement of Assets and Liabilities in the asset, “Trustees’ deferred compensation,” and liability, “Trustees’ deferred compensation fees.” Additionally, the recorded unrealized appreciation/(depreciation) is included in “Total distributable earnings (loss)” on the Statement of Assets and Liabilities. Deferred compensation expenses for the year ended June 30, 2022 are included in “Trustees’ fees and expenses” on the Statement of Operations. Trustees are allowed to change their designation of mutual funds from time to time. Amounts will be deferred until distributed in accordance with the Deferred Plan. Deferred fees of $431,326 were paid by the Trust to the Trustees under the Deferred Plan during the year ended June 30, 2022.
As of June 30, 2022, shares of the Fund were owned by affiliates of the Adviser, and/or other funds advised by the Adviser, as indicated in the table below:
| | | | | | | |
Class | % of Class Owned | | % of Fund Owned | | |
Class A Shares | - | % | - | % | |
Class C Shares | - | | - | | |
Class D Shares | - | | - | | |
Class I Shares | - | | - | | |
Class N Shares | 49 | | 24 | | |
Class S Shares | 8 | | -* | | |
Class T Shares | - | | - | | |
| | | | | | |
* | Less than 0.50% | | | | | |
In addition, other shareholders, including other funds, individuals, accounts, as well as the Fund’s portfolio manager(s) and/or investment personnel, may from time to time own (beneficially or of record) a significant percentage of the Fund’s Shares and can be considered to “control” the Fund when that ownership exceeds 25% of the Fund’s assets (and which may differ from control as determined in accordance with US GAAP).
The Fund is permitted to purchase or sell securities (“cross-trade”) between itself and other funds or accounts managed by the Adviser in accordance with Rule 17a-7 under the Investment Company Act of 1940 (“Rule 17a-7”), when the transaction is consistent with the investment objectives and policies of the Fund and in accordance with the Internal Cross Trade Procedures adopted by the Trust’s Board of Trustees. These procedures have been designed to ensure
Janus Henderson Small-Mid Cap Value Fund
Notes to Financial Statements
that any cross-trade of securities by the Fund from or to another fund or account that is or could be considered an affiliate of the Fund under certain limited circumstances by virtue of having a common investment adviser, common Officer, or common Trustee complies with Rule 17a-7. Under these procedures, each cross-trade is effected at the current market price to save costs where allowed. During the year ended June 30, 2022, the Fund engaged in cross trades amounting to $266,438 in sales, resulting in a net realized loss of $52,589. The net realized loss is included within the “Net Realized Gain/(Loss) on Investments” section of the Fund’s Statement of Operations.
4. Federal Income Tax
The tax components of capital shown in the table below represent: (1) distribution requirements the Fund must satisfy under the income tax regulations; (2) losses or deductions the Fund may be able to offset against income and gains realized in future years; and (3) unrealized appreciation or depreciation of investments for federal income tax purposes.
Other book to tax differences primarily consist of deferred compensation. The Fund has elected to treat gains and losses on forward foreign currency contracts as capital gains and losses, if applicable. Other foreign currency gains and losses on debt instruments are treated as ordinary income for federal income tax purposes pursuant to Section 988 of the Internal Revenue Code.
The Fund has elected to defer post-October losses as noted in the table below. These losses will be deferred for tax purposes and recognized during the next fiscal year.
| | | | | | | | |
| | | Loss Deferrals | Other Book | Net Tax | |
Undistributed
Ordinary Income | Undistributed
Long-Term Gains | Accumulated
Capital Losses | Late-Year
Ordinary Loss | Post-October
Capital Loss | to Tax
Differences | Appreciation/
(Depreciation) | |
$ 61,416 | $ - | $ - | $ - | $ (1,768,924) | $ (3,424) | $ (7,582,926) | |
The aggregate cost of investments and the composition of unrealized appreciation and depreciation of investment securities for federal income tax purposes as of June 30, 2022 are noted below. The primary difference between book and tax appreciation or depreciation of investments is wash sale loss deferrals.
| | | | |
Federal Tax Cost | Unrealized
Appreciation | Unrealized
(Depreciation) | Net Tax Appreciation/
(Depreciation) |
$ 125,261,949 | $ 5,800,518 | $(13,383,444) | $ (7,582,926) |
Income and capital gains distributions are determined in accordance with income tax regulations that may differ from US GAAP. These differences are due to differing treatments for items such as net short-term gains, deferral of wash sale losses, and capital loss carryovers. Certain permanent differences such as tax returns of capital and net investment losses noted below have been reclassified to capital.
| | | | | |
For the year ended June 30, 2022 | |
Distributions | | |
From Ordinary Income | From Long-Term Capital Gains | Tax Return of Capital | Net Investment Loss | |
$ 854,268 | $ 3,367,574 | $ - | $ - | |
| | | | | |
For the year ended June 30, 2021 | |
Distributions | | |
From Ordinary Income | From Long-Term Capital Gains | Tax Return of Capital | Net Investment Loss | |
$ 516,462 | $ - | $ - | $ - | |
Janus Henderson Small-Mid Cap Value Fund
Notes to Financial Statements
Permanent book to tax basis differences may result in reclassifications between the components of net assets. These differences have no impact on the results of operations or net assets. The following reclassifications have been made to the Fund:
| | | |
| | |
Increase/(Decrease) to Capital | Increase/(Decrease) to Undistributed
Net Investment Income/Loss | Increase/(Decrease) to Undistributed
Net Realized Gain/Loss |
$ - | $ (34,337) | $ 34,337 |
5. Capital Share Transactions
| | | | | | | |
| | | | | | |
| | Year ended June 30, 2022 | | Year ended June 30, 2021 |
| | Shares | Amount | | Shares | Amount |
| | | | | | | |
Class A Shares: | | | | | |
Shares sold | 15,045 | $ 202,833 | | 47,889 | $ 590,648 |
Reinvested dividends and distributions | 5,810 | 79,135 | | 1,394 | 16,879 |
Shares repurchased | (51,693) | (710,773) | | (113,732) | (1,237,694) |
Net Increase/(Decrease) | (30,838) | $ (428,805) | | (64,449) | $ (630,167) |
Class C Shares: | | | | | |
Shares sold | 5,225 | $ 66,326 | | 13,604 | $ 163,620 |
Reinvested dividends and distributions | 955 | 12,497 | | - | - |
Shares repurchased | (4,323) | (56,156) | | (11,428) | (134,397) |
Net Increase/(Decrease) | 1,857 | $ 22,667 | | 2,176 | $ 29,223 |
Class D Shares: | | | | | |
Shares sold | 788,962 | $ 10,804,986 | | 4,768,668 | $ 66,420,388 |
Reinvested dividends and distributions | 103,899 | 1,423,415 | | 14,302 | 174,203 |
Shares repurchased | (2,177,708) | (29,858,583) | | (2,156,726) | (28,319,260) |
Net Increase/(Decrease) | (1,284,847) | $(17,630,182) | | 2,626,244 | $ 38,275,331 |
Class I Shares: | | | | | |
Shares sold | 128,465 | $ 1,787,759 | | 891,748 | $ 11,414,067 |
Reinvested dividends and distributions | 22,449 | 310,688 | | 9,721 | 119,572 |
Shares repurchased | (485,566) | (6,708,829) | | (823,105) | (11,263,603) |
Net Increase/(Decrease) | (334,652) | $ (4,610,382) | | 78,364 | $ 270,036 |
Class N Shares: | | | | | |
Shares sold | 1,218,146 | $ 16,587,943 | | 5,742,225 | $ 75,606,237 |
Reinvested dividends and distributions | 151,902 | 2,081,053 | | 12,978 | 158,071 |
Shares repurchased | (1,574,792) | (21,436,606) | | (923,388) | (12,652,430) |
Net Increase/(Decrease) | (204,744) | $ (2,767,610) | | 4,831,815 | $ 63,111,878 |
Class S Shares: | | | | | |
Shares sold | 8,954 | $ 119,811 | | 5,919 | $ 69,778 |
Reinvested dividends and distributions | 2,289 | 30,861 | | 380 | 4,556 |
Shares repurchased | (12,293) | (155,901) | | (24,044) | (281,633) |
Net Increase/(Decrease) | (1,050) | $ (5,229) | | (17,745) | $ (207,299) |
Class T Shares: | | | | | |
Shares sold | 142,207 | $ 1,927,674 | | 1,141,393 | $ 14,821,986 |
Reinvested dividends and distributions | 17,486 | 239,738 | | 3,028 | 36,885 |
Shares repurchased | (857,665) | (11,848,442) | | (3,603,506) | (37,249,365) |
Net Increase/(Decrease) | (697,972) | $ (9,681,030) | | (2,459,085) | $(22,390,494) |
Janus Henderson Small-Mid Cap Value Fund
Notes to Financial Statements
6. Purchases and Sales of Investment Securities
For the year ended June 30, 2022, the aggregate cost of purchases and proceeds from sales of investment securities (excluding any short-term securities, short-term options contracts, TBAs, and in-kind transactions, as applicable) was as follows:
| | | | |
Purchases of
Securities | Proceeds from Sales
of Securities | Purchases of Long-
Term U.S. Government
Obligations | Proceeds from Sales
of Long-Term U.S.
Government Obligations |
$ 109,026,769 | $ 145,063,252 | $ - | $ - |
7. Subsequent Event
Management has evaluated whether any events or transactions occurred subsequent to June 30, 2022 and through the date of issuance of the Fund's financial statements and determined that there were no material events or transactions that would require recognition or disclosure in the Fund’s financial statements.
Janus Henderson Small-Mid Cap Value Fund
Report of Independent Registered Public Accounting Firm
To the Board of Trustees of Janus Investment Fund and Shareholders of Janus Henderson Small-Mid Cap Value Fund
Opinion on the Financial Statements
We have audited the accompanying statement of assets and liabilities, including the schedule of investments, of Janus Henderson Small-Mid Cap Value Fund (one of the funds constituting Janus Investment Fund, referred to hereafter as the “Fund”) as of June 30, 2022, the related statement of operations for the year ended June 30, 2022, the statements of changes in net assets for each of the two years in the period ended June 30, 2022, including the related notes, and the financial highlights for each of the periods indicated therein (collectively referred to as the “financial statements”). In our opinion, the financial statements present fairly, in all material respects, the financial position of the Fund as of June 30, 2022, the results of its operations for the year then ended, the changes in its net assets for each of the two years in the period ended June 30, 2022 and the financial highlights for each of the periods indicated therein in conformity with accounting principles generally accepted in the United States of America.
Basis for Opinion
These financial statements are the responsibility of the Fund’s management. Our responsibility is to express an opinion on the Fund’s financial statements based on our audits. We are a public accounting firm registered with the Public Company Accounting Oversight Board (United States) (PCAOB) and are required to be independent with respect to the Fund in accordance with the U.S. federal securities laws and the applicable rules and regulations of the Securities and Exchange Commission and the PCAOB.
We conducted our audits of these financial statements in accordance with the standards of the PCAOB. Those standards require that we plan and perform the audit to obtain reasonable assurance about whether the financial statements are free of material misstatement, whether due to error or fraud.
Our audits included performing procedures to assess the risks of material misstatement of the financial statements, whether due to error or fraud, and performing procedures that respond to those risks. Such procedures included examining, on a test basis, evidence regarding the amounts and disclosures in the financial statements. Our audits also included evaluating the accounting principles used and significant estimates made by management, as well as evaluating the overall presentation of the financial statements. Our procedures included confirmation of securities owned as of June 30, 2022 by correspondence with the custodian and brokers; when replies were not received from brokers, we performed other auditing procedures. We believe that our audits provide a reasonable basis for our opinion.

Denver, Colorado
August 19, 2022
We have served as the auditor of one or more investment companies in Janus Henderson Funds since 1990.
Janus Henderson Small-Mid Cap Value Fund
Additional Information (unaudited)
Proxy Voting Policies and Voting Record
A description of the policies and procedures that the Fund uses to determine how to vote proxies relating to its portfolio securities is available without charge: (i) upon request, by calling 1-800-525-1093; (ii) on the Fund’s website at janushenderson.com/proxyvoting; and (iii) on the SEC’s website at http://www.sec.gov. Additionally, information regarding the Fund’s proxy voting record for the most recent twelve-month period ended June 30 is also available, free of charge, through janushenderson.com/proxyvoting and from the SEC’s website at http://www.sec.gov.
Full Holdings
The Fund files its complete portfolio holdings (schedule of investments) with the SEC as an exhibit to Form N-PORT within 60 days of the end of the first and third fiscal quarters, and in the annual report and semiannual report to shareholders. The Fund’s Form N-PORT filings and annual and semiannual reports: (i) are available on the SEC’s website at http://www.sec.gov; (ii) may be reviewed and copied at the SEC’s Public Reference Room in Washington, D.C. (information on the Public Reference Room may be obtained by calling 1-800-SEC-0330); and (iii) are available without charge, upon request, by calling a Janus Henderson representative at 1-877-335-2687 (toll free) (or 1-800-525-3713 if you hold Class D shares). Portfolio holdings consisting of at least the names of the holdings are generally available on a monthly basis with a 30-day lag under Full Holdings for the Fund at janushenderson.com/info (or janushenderson.com/reports if you hold Class D Shares).
APPROVAL OF ADVISORY AGREEMENTS DURING THE PERIOD
The Trustees of Janus Aspen Series, each of whom serves as an “independent” Trustee (the “Trustees”), oversee the management of each portfolio of Janus Aspen Series (each, a “VIT Portfolio,” and collectively, the “VIT Portfolios”), as well as each fund of Janus Investment Fund (each, a “Fund,” and collectively, the “Funds” and together with the VIT Portfolios, the “Janus Henderson Funds,” and each, a “Janus Henderson Fund”). As required by law, the Trustees determine annually whether to continue the investment advisory agreement for each Janus Henderson Fund and the subadvisory agreement for each Janus Henderson Fund that utilizes a subadviser.
In connection with their most recent consideration of those agreements for each Janus Henderson Fund, the Trustees received and reviewed information provided by Janus Henderson Investors US LLC (formerly, Janus Capital Management LLC) (the “Adviser”) and the subadviser in response to requests of the Trustees and their independent legal counsel. They also received and reviewed information and analysis provided by, and in response to requests of, their independent fee consultant. Throughout their consideration of the agreements, the Trustees were advised by their independent legal counsel. The Trustees met with management to consider the agreements, and also met separately in executive session with their independent legal counsel and their independent fee consultant.
At meetings held on November 3-4, 2021 and December 7-8, 2021, the Trustees’ evaluated the information provided by the Adviser, the subadviser, and the independent fee consultant, as well as other information addressed during the year. Following such evaluation, the Trustees determined that the overall arrangements between each Janus Henderson Fund and the Adviser and each subadviser, as applicable, were fair and reasonable in light of the nature, extent and quality of the services provided by the Adviser, its affiliates and the subadviser, the fees charged for those services, and other matters that the Trustees considered relevant in the exercise of their business judgment and unanimously approved the continuation of the investment advisory agreement for each Janus Henderson Fund and the subadvisory agreement for each subadvised Janus Henderson Fund, for the period from February 1, 2022 through February 1, 2023, subject to earlier termination as provided for in each agreement.
In considering the continuation of those agreements, the Trustees reviewed and analyzed various factors that they determined were relevant, including the factors described below, none of which by itself was considered dispositive. However, the material factors and conclusions that formed the basis for the Trustees’ determination to approve the continuation of the agreements are discussed separately below. Also included is a summary of the independent fee consultant’s conclusions and opinions that arose during, and were included as part of, the Trustees’ consideration of the agreements. “Management fees,” as used herein, reflect actual annual advisory fees and, for the purpose of peer comparisons any administration fees (excluding out of pocket costs), net of any waivers, paid by a fund as a percentage of average net assets.
Nature, Extent and Quality of Services
The Trustees reviewed the nature, extent and quality of the services provided by the Adviser and the subadviser to the Janus Henderson Funds, taking into account the investment objective, strategies and policies of each Janus Henderson
Janus Henderson Small-Mid Cap Value Fund
Additional Information (unaudited)
Fund, and the knowledge the Trustees gained from their regular meetings with management on at least a quarterly basis and their ongoing review of information related to the Janus Henderson Funds. In addition, the Trustees reviewed the resources and key personnel of the Adviser and the subadviser, particularly noting those employees who provide investment and risk management services to the Janus Henderson Funds. The Trustees also considered other services provided to the Janus Henderson Funds by the Adviser or the subadviser, such as managing the execution of portfolio transactions and the selection of broker-dealers for those transactions. The Trustees considered the Adviser’s role as administrator to the Janus Henderson Funds, noting that the Adviser generally does not receive a fee for its services as administrator, but is reimbursed for its out-of-pocket costs. The Trustees considered the role of the Adviser in monitoring adherence to the Janus Henderson Funds’ investment restrictions, providing support services for the Trustees and Trustee committees, and overseeing communications with shareholders and the activities of other service providers, including monitoring compliance with various policies and procedures of the Janus Henderson Funds and with applicable securities laws and regulations.
In this regard, the independent fee consultant noted that the Adviser provides a number of different services for the Janus Henderson Funds and fund shareholders, ranging from investment management services to various other servicing functions, and that, in its view, the Adviser is a capable provider of those services. The independent fee consultant also provided its belief that the Adviser has developed a number of institutional competitive advantages that should enable it to provide superior investment and service performance over the long term.
The Trustees concluded that the nature, extent and quality of the services provided by the Adviser and the subadviser to each Janus Henderson Fund were appropriate and consistent with the terms of the respective advisory and subadvisory agreements, and that, taking into account steps taken to address those Janus Henderson Funds whose performance lagged that of their peers for certain periods, the Janus Henderson Funds were likely to benefit from the continued provision of those services. They also concluded that the Adviser and the subadviser had sufficient personnel, with the appropriate education and experience, to serve the Janus Henderson Funds effectively and each had demonstrated its ability to attract well-qualified personnel.
Performance of the Funds
The Trustees considered the performance results of each Janus Henderson Fund over various time periods. They noted that they considered Janus Henderson Fund performance data throughout the year, including periodic meetings with each Janus Henderson Fund’s portfolio manager(s), and also reviewed information comparing each Janus Henderson Fund’s performance with the performance of comparable funds and peer groups identified by Broadridge Financial Solutions, Inc. (“Broadridge”), an independent data provider, and with the Janus Henderson Fund’s benchmark index. In this regard, the independent fee consultant found that the overall Janus Henderson Funds’ performance has been reasonable: for the 36 months ended September 30, 2021, approximately 55% of the Janus Henderson Funds were in the top two quartiles of performance versus Broadridge peers, and for the 12 months ended September 30, 2021, approximately 45% of the Janus Henderson Funds were in the top two quartiles of performance versus Broadridge peers.
The Trustees considered the performance of each Fund, noting that performance may vary by share class, and noted the following:
Asset Allocation Funds
· For Janus Henderson Global Allocation Fund – Conservative, the Trustees noted that the Fund’s performance was in the second Broadridge quartile for the 36 months ended May 31, 2021 and the first Broadridge quartile for the 12 months ended May 31, 2021.
· For Janus Henderson Global Allocation Fund – Growth, the Trustees noted that the Fund’s performance was in the bottom Broadridge quartile for the 36 months ended May 31, 2021 and the first Broadridge quartile for the 12 months ended May 31, 2021. The Trustees noted the reasons for the Fund’s underperformance, the steps the Adviser had taken or was taking to improve performance, and that the performance trend was improving.
· For Janus Henderson Global Allocation Fund – Moderate, the Trustees noted that the Fund’s performance was in the third Broadridge quartile for the 36 months ended May 31, 2021 and the first Broadridge quartile for the 12 months ended May 31, 2021. The Trustees noted the reasons for the Fund’s underperformance, the steps the Adviser had taken or was taking to improve performance and that the performance trend was improving
Janus Henderson Small-Mid Cap Value Fund
Additional Information (unaudited)
Fixed-Income Funds
· For Janus Henderson Absolute Return Income Opportunities Fund, the Trustees noted that the Fund’s performance was in the bottom Broadridge quartile for the 36 months ended May 31, 2021 and the bottom Broadridge quartile for the 12 months ended May 31, 2021. The Trustees noted the reasons for the Fund’s underperformance and the steps the Adviser had taken or was taking to improve performance.
· For Janus Developed World Bond Fund, the Trustees noted the Fund’s performance was in the second Broadridge quartile for the 36 months ended May 31, 2021 and the bottom Broadridge quartile for the 12 months ended May 31, 2021.
· For Janus Henderson Flexible Bond Fund, the Trustees noted that the Fund’s performance was in the first Broadridge quartile for the 36 months ended May 31, 2021 and the third Broadridge quartile for the 12 months ended May 31, 2021.
· For Janus Henderson Global Bond Fund, the Trustees noted that the Fund’s performance was in the second Broadridge quartile for the 36 months ended May 31, 2021 and the third Broadridge quartile for the 12 months ended May 31, 2021.
· For Janus Henderson High-Yield Fund, the Trustees noted that the Fund’s performance was in the first Broadridge quartile for the 36 months ended May 31, 2021 and the second Broadridge quartile for the 12 months ended May 31, 2021.
· For Janus Henderson Multi-Sector Income Fund, the Trustees noted that the Fund’s performance was in the first Broadridge quartile for the 36 months ended May 31, 2021 and the first Broadridge quartile for the 12 months ended May 31, 2021.
· For Janus Henderson Short Duration Flexible Bond Fund, the Trustees noted that the Fund’s performance was in the second Broadridge quartile for the 36 months ended May 31, 2021 and the second Broadridge quartile for the 12 months ended May 31, 2021.
Global and International Equity Funds
· For Janus Henderson Asia Equity Fund, the Trustees noted that the Fund’s performance was in the second Broadridge quartile for the 36 months ended May 31, 2021 and the second Broadridge quartile for the 12 months ended May 31, 2021.
· For Janus Henderson Emerging Markets Fund, the Trustees noted that the Fund’s performance was in the second Broadridge quartile for the 36 months ended May 31, 2021 and the first Broadridge quartile for the 12 months ended May 31, 2021.
· For Janus Henderson European Focus Fund, the Trustees noted that the Fund’s performance was in the first Broadridge quartile for the 36 months ended May 31, 2021 and the first Broadridge quartile for the 12 months ended May 31, 2021.
· For Janus Henderson Global Equity Income Fund, the Trustees noted that the Fund’s performance was in the bottom Broadridge quartile for the 36 months ended May 31, 2021 and the third Broadridge quartile for the 12 months ended May 31, 2021. The Trustees noted the reasons for the Fund’s underperformance and the steps the Adviser had taken or was taking to improve performance.
· For Janus Henderson Global Life Sciences Fund, the Trustees noted that the Fund’s performance was in the first Broadridge quartile for the 36 months ended May 31, 2021 and the first Broadridge quartile for the 12 months ended May 31, 2021.
· For Janus Henderson Global Real Estate Fund, the Trustees noted that the Fund’s performance was in the first Broadridge quartile for the 36 months ended May 31, 2021 and the bottom Broadridge quartile for the 12 months ended May 31, 2021.
· For Janus Henderson Global Research Fund, the Trustees noted that the Fund’s performance was in the third Broadridge quartile for the 36 months ended May 31, 2021 and the third Broadridge quartile for the 12 months ended May 31, 2021. The Trustees noted the reasons for the Fund’s underperformance, while also noting that the
Janus Henderson Small-Mid Cap Value Fund
Additional Information (unaudited)
Fund has a performance fee structure that results in lower management fees during periods of underperformance, and the steps the Adviser had taken or was taking to improve performance.
· For Janus Henderson Global Select Fund, the Trustees noted that the Fund’s performance was in the first Broadridge quartile for the 36 months ended May 31, 2021 and the first Broadridge quartile for the 12 months ended May 31, 2021.
· For Janus Henderson Global Technology and Innovation Fund, the Trustees noted that the Fund’s performance was in the second Broadridge quartile for the 36 months ended May 31, 2021 and the bottom Broadridge quartile for the 12 months ended May 31, 2021.
· For Janus Henderson International Opportunities Fund, the Trustees noted that the Fund’s performance was in the bottom Broadridge quartile for the 36 months ended May 31, 2021 and the third Broadridge quartile for the 12 months ended May 31, 2021. The Trustees noted the reasons for the Fund’s underperformance and the steps the Adviser had taken or was taking to improve performance.
· For Janus Henderson Overseas Fund, the Trustees noted that the Fund’s performance was in the second Broadridge quartile for the 36 months ended May 31, 2021 and the first Broadridge quartile for the 12 months ended May 31, 2021.
Money Market Funds
· For Janus Henderson Government Money Market Fund, the Trustees noted that the Fund’s performance was in the third Broadridge quartile for the 36 months ended May 31, 2021 and the bottom Broadridge quartile for the 12 months ended May 31, 2021. The Trustees noted the reasons for the Fund’s underperformance and the steps the Adviser had taken or was taking to improve performance.
· For Janus Henderson Money Market Fund, the Trustees noted that the Fund’s performance was in the third Broadridge quartile for the 36 months ended May 31, 2021 and the bottom Broadridge quartile for the 12 months ended May 31, 2021. The Trustees noted the reasons for the Fund’s underperformance and the steps the Adviser had taken or was taking to improve performance.
Multi-Asset Funds
· For Janus Henderson Adaptive Global Allocation Fund, the Trustees noted that the Fund’s performance was in bottom Broadridge quartile for the 36 months ended May 31, 2021 and the bottom Broadridge quartile for the 12 months ended May 31, 2021. The Trustees noted the reasons for the Fund’s underperformance and the steps the Adviser had taken or was taking to improve performance.
· For Janus Henderson Dividend & Income Builder Fund, the Trustees noted that the Fund’s performance was in the third Broadridge quartile for the 36 months ended May 31, 2021 and the third Broadridge quartile for the 12 months ended May 31, 2021. The Trustees noted the reasons for the Fund’s underperformance and the steps the Adviser had taken or was taking to improve performance.
Multi-Asset U.S. Equity Funds
· For Janus Henderson Balanced Fund, the Trustees noted that the Fund’s performance was in the first Broadridge quartile for the 36 months ended May 31, 2021 and the third Broadridge quartile for the 12 months ended May 31, 2021.
· For Janus Henderson Contrarian Fund, the Trustees noted that the Fund’s performance was in the first Broadridge quartile for the 36 months ended May 31, 2021 and the first Broadridge quartile for the 12 months ended May 31, 2021.
· For Janus Henderson Enterprise Fund, the Trustees noted that the Fund’s performance was in the bottom Broadridge quartile for the 36 months ended May 31, 2021 and the third Broadridge quartile for the 12 months ended May 31, 2021. The Trustees noted the reasons for the Fund’s underperformance, and the steps the Adviser had taken or was taking to improve performance.
· For Janus Henderson Forty Fund, the Trustees noted that the Fund’s performance was in the first Broadridge quartile for the 36 months ended May 31, 2021 and the first Broadridge quartile for the 12 months ended May 31, 2021.
Janus Henderson Small-Mid Cap Value Fund
Additional Information (unaudited)
· For Janus Henderson Growth and Income Fund, the Trustees noted that the Fund’s performance was in the bottom Broadridge quartile for the 36 months ended May 31, 2021 and the third Broadridge quartile for the 12 months ended May 31, 2021. The Trustees noted the reasons for the Fund’s underperformance, and the steps the Adviser had taken or was taking to improve performance.
· For Janus Henderson Research Fund, the Trustees noted that the Fund’s performance was in the third Broadridge quartile for the 36 months ended May 31, 2021 and the third Broadridge quartile for the 12 months ended May 31, 2021. The Trustees noted the reasons for the Fund’s underperformance while also noting that the Fund has a performance fee structure that results in lower management fees during periods of underperformance, and the steps the Adviser had taken or was taking to improve performance.
· For Janus Henderson Triton Fund, the Trustees noted that the Fund’s performance was in the bottom Broadridge quartile for the 36 months ended May 31, 2021 and the bottom Broadridge quartile for the 12 months ended May 31, 2021. The Trustees noted the reasons for the Fund’s underperformance, and the steps the Adviser had taken or was taking to improve performance.
· For Janus Henderson Venture Fund, the Trustees noted that the Fund’s performance was in the third Broadridge quartile for the 36 months ended May 31, 2021 and the bottom Broadridge quartile for the 12 months ended May 31, 2021. The Trustees noted the reasons for the Fund’s underperformance, and the steps the Adviser had taken or was taking to improve performance.
Quantitative Equity Funds
· For Janus Henderson Emerging Markets Managed Volatility Fund, the Trustees noted that the Fund’s performance was in the bottom Broadridge quartile for the 36 months ended May 31, 2021 and the bottom Broadridge quartile for the 12 months ended May 31, 2021. The Trustees noted the reasons for the Fund’s underperformance and the steps the Adviser and subadviser had taken or were taking to improve performance.
· For Janus Henderson Global Income Managed Volatility Fund, the Trustees noted that the Fund’s performance was in the second Broadridge quartile for the 36 months ended May 31, 2021 and the bottom Broadridge quartile for the 12 months ended May 31, 2021.
· For Janus Henderson International Managed Volatility Fund, the Trustees noted that the Fund’s performance was in the bottom Broadridge quartile for the 36 months ended May 31, 2021 and the bottom Broadridge quartile for the 12 months ended May 31, 2021. The Trustees noted the reasons for the Fund’s underperformance, the steps the Adviser and subadviser had taken or were taking to improve performance.
· For Janus Henderson U.S. Managed Volatility Fund, the Trustees noted that the Fund’s performance was in the bottom Broadridge quartile for the 36 months ended May 31, 2021 and the bottom Broadridge quartile for the 12 months ended May 31, 2021. The Trustees noted the reasons for the Fund’s underperformance, the steps the Adviser and subadviser had taken or were taking to improve performance.
U.S. Equity Funds
· For Janus Henderson Mid Cap Value Fund, the Trustees noted that the Fund’s performance was in the bottom Broadridge quartile for the 36 months ended May 31, 2021 and the bottom Broadridge quartile for the 12 months ended May 31, 2021. The Trustees noted the reasons for the Fund’s underperformance, while also noting that the Fund has a performance fee structure that results in lower management fees during periods of underperformance, and the steps the Adviser had taken or was taking to improve performance.
· For Janus Henderson Small Cap Value Fund, the Trustees noted that the Fund’s performance was in the bottom Broadridge quartile for the 36 months ended May 31, 2021 and the bottom Broadridge quartile for the 12 months ended May 31, 2021. The Trustees noted the reasons for the Fund’s underperformance, while also noting that the Fund has a performance fee structure that results in lower management fees during periods of underperformance, and the steps the Adviser had taken or was taking to improve performance.
· For Janus Henderson Small-Mid Cap Value Fund, the Trustees noted that the Fund’s performance was in the third Broadridge quartile for the 36 months ended May 31, 2021 and the bottom Broadridge quartile for the 12 months ended May 31, 2021. The Trustees noted the reasons for the Fund’s underperformance, while also noting that the Fund has a performance fee structure that results in lower management fees during periods of underperformance, and the steps the Adviser had taken or was taking to improve performance.
Janus Henderson Small-Mid Cap Value Fund
Additional Information (unaudited)
In consideration of each Janus Henderson Fund’s performance, the Trustees concluded that, taking into account the factors relevant to performance, as well as other considerations, including steps taken to improve performance, the Janus Henderson Fund’s performance warranted continuation of such Janus Henderson Fund’s investment advisory and subadvisory agreement(s).
Costs of Services Provided
The Trustees examined information regarding the fees and expenses of each Janus Henderson Fund in comparison to similar information for other comparable funds as provided by Broadridge, an independent data provider. They also reviewed an analysis of that information provided by their independent fee consultant and noted that the rate of management fees (investment advisory fees and any administration fees but excluding out-of-pocket costs) for many of the Janus Henderson Funds, after applicable waivers, was below the average management fee rate of the respective peer group of funds selected by an independent data provider. The Trustees also examined information regarding the subadvisory fees charged for subadvisory services, as applicable, noting that all such fees were paid by the Adviser out of its management fees collected from such Janus Henderson Fund.
The independent fee consultant provided its belief that the management fees charged by the Adviser to each of the Janus Henderson Funds under the current investment advisory and administration agreements are reasonable in relation to the services provided by the Adviser. The independent fee consultant found: (1) the total expenses and management fees of the Janus Henderson Funds to be reasonable relative to other comparable mutual funds; (2) the total expenses, on average, were 8% under the average total expenses of the respective Broadridge Expense Group peers; and (3) and the management fees for the Janus Henderson Funds, on average, were 6% under the average management fees for the respective Broadridge Expense Group. The Trustees also considered the total expenses for each share class of each Janus Henderson Fund compared to the average total expenses for its Broadridge Expense Group and to average total expenses for its Broadridge Expense Universe.
For certain Janus Henderson Funds, the independent fee consultant also performed a systematic “focus list” analysis of expenses which assessed fund fees in the context of fund performance being delivered. Based on this analysis, the independent fee consultant found that the combination of service quality/performance and expenses on these individual Janus Henderson Funds was reasonable in light of performance trends, performance histories, and existence of performance fees, breakpoints, and/or expense waivers on such Janus Henderson Funds.
The Trustees considered the methodology used by the Adviser and subadviser in determining compensation payable to portfolio managers, the competitive environment for investment management talent, and the competitive market for mutual funds in different distribution channels.
The Trustees also reviewed management fees charged by the Adviser and subadviser to comparable separate account clients and to comparable non-affiliated funds subadvised by the Adviser or subadviser (for which the Adviser or the subadviser provides only or primarily portfolio management services). Although in most instances subadvisory and separate account fee rates for various investment strategies were lower than management fee rates for Janus Henderson Funds having a similar strategy, the Trustees considered that the Adviser noted that, under the terms of the management agreements with the Janus Henderson Funds, the Adviser performs significant additional services for the Janus Henderson Funds that it does not provide to those other clients, including administration services, oversight of the Janus Henderson Funds’ other service providers, trustee support, regulatory compliance and numerous other services, and that, in serving the Janus Henderson Funds, the Adviser assumes many legal risks and other costs that it does not assume in servicing its other clients. Moreover, the Trustees noted that the independent fee consultant found that: (1) the management fees the Adviser charges to the Janus Henderson Funds are reasonable in relation to the management fees the Adviser charges to funds subadvised by the Adviser and to the fees the Adviser charges to its institutional separate account clients; (2) these subadvised and institutional separate accounts have different service and infrastructure needs and operate in markets very distinct relative to retail funds; (3) Janus Henderson mutual fund investors enjoy reasonable fees relative to the fees charged to Janus Henderson subadvised fund and separate account investors; and (4) as part of its 2020 review, 9 of 10 Janus Henderson Funds have lower management fees than similar funds subadvised by the Adviser.
The Trustees considered the fees for each Janus Henderson Fund for its fiscal year ended in 2020, including the VIT Portfolios, and noted the following with regard to each VIT Portfolio’s total expenses, net of applicable fee waivers (the VIT Portfolio’s “total expenses”):
Janus Henderson Small-Mid Cap Value Fund
Additional Information (unaudited)
Asset Allocation Funds
· For Janus Henderson Global Allocation Fund – Conservative, the Trustees noted that, although the Fund’s total expenses exceeded the peer group average for certain share classes, overall the Fund’s total expenses were reasonable. The Trustees also noted that the Adviser has contractually agreed to limit the Fund’s expenses.
· For Janus Henderson Global Allocation Fund – Growth, the Trustees noted that, although the Fund’s total expenses exceeded the peer group average for certain share classes, overall the Fund’s total expenses were reasonable.
· For Janus Henderson Global Allocation Fund – Moderate, the Trustees noted that, although the Fund’s total expenses exceeded the peer group for certain share classes, overall the Fund’s total expenses were reasonable. The Trustees also noted that the Adviser has contractually agreed to limit the Fund’s expenses.
Fixed-Income Funds
· For Janus Henderson Absolute Return Income Opportunities Fund, the Trustees noted that, although the Fund’s total expenses exceeded the peer group for certain share classes, overall the Fund’s total expenses were reasonable. The Trustees also noted that the Adviser has contractually agreed to limit the Fund’s expenses.
· For Janus Henderson Developed World Bond Fund, the Trustees noted that, although the Fund’s total expenses exceeded the peer group for one share class, overall the Fund’s total expenses were reasonable. The Trustees also noted that the Adviser has contractually agreed to limit the Fund’s expenses.
· For Janus Henderson Flexible Bond Fund, the Trustees noted that, although the Fund’s total expenses exceeded the peer group for certain share classes, overall the Fund’s total expenses were reasonable. The Trustees also noted that the Adviser has contractually agreed to limit the Fund’s expenses, although this limit did not apply because the Fund’s total expenses were already below the applicable fee limit.
· For Janus Henderson Global Bond Fund, the Trustees noted that, although the Fund’s total expenses exceeded the peer group average for certain share classes, overall the Fund’s total expenses were reasonable. The Trustees also noted that the Adviser has contractually agreed to limit the Fund’s expenses.
· For Janus Henderson High-Yield Fund, the Trustees noted that, although the Fund’s total expenses exceeded the peer group for certain share classes, overall the Fund’s total expenses were reasonable. The Trustees also noted that the Adviser has contractually agreed to limit the Fund’s expenses.
· For Janus Henderson Multi-Sector Income Fund, the Trustees noted that, although the Fund’s total expenses exceeded the peer group for certain share classes, overall the Fund’s total expenses were reasonable. The Trustees also noted that the Adviser has contractually agreed to limit the Fund’s expenses.
· For Janus Henderson Short Duration Flexible Bond Fund, the Trustees noted that, although the Fund’s total expenses exceeded the peer group for certain share classes, overall the Fund’s total expenses were reasonable. The Trustees also noted that the Adviser has contractually agreed to limit the Fund’s expenses.
Global and International Equity Funds
· For Janus Henderson Asia Equity Fund, the Trustees noted that, although the Fund’s total expenses exceeded the peer group for certain share classes, overall the Fund’s total expenses were reasonable. The Trustees also noted that the Adviser has contractually agreed to limit the Fund’s expenses.
· For Janus Henderson Emerging Markets Fund, the Trustees noted that, although the Fund’s total expenses exceeded the peer group for certain share classes, overall the Fund’s total expenses were reasonable. The Trustees also noted that the Adviser has contractually agreed to limit the Fund’s expenses.
· For Janus Henderson European Focus Fund, the Trustees noted that, although the Fund’s total expenses exceeded the peer group average for certain share classes, overall the Fund’s total expenses were reasonable. The Trustees also noted that the Adviser has contractually agreed to limit the Fund’s expenses.
· For Janus Henderson Global Equity Income Fund, the Trustees noted that, although the Fund’s total expenses exceeded the peer group for one share class, overall the Fund’s total expenses were reasonable. The Trustees also noted that the Adviser has contractually agreed to limit the Fund’s expenses, although this limit did not apply because the Fund’s total expenses were already below the applicable fee limit.
Janus Henderson Small-Mid Cap Value Fund
Additional Information (unaudited)
· For Janus Henderson Global Life Sciences Fund, the Trustees noted that the Fund’s total expenses were below the peer group for all share classes.
· For Janus Henderson Global Real Estate Fund, the Trustees noted, although the Fund’s total expenses exceeded the peer group average for certain share classes, overall the Fund’s total expenses were reasonable. The Trustees also noted that the Adviser has contractually agreed to limit the Fund’s expenses, although this limit did not apply because the Fund’s total expenses were already below the applicable fee limit.
· For Janus Henderson Global Research Fund, the Trustees noted that the Fund’s total expenses were below the peer group for all share classes.
· For Janus Henderson Global Select Fund, the Trustees noted that, although the Fund’s total expenses exceeded the peer group average for one share class, overall the Fund’s total expenses were reasonable. The Trustees also noted that the Adviser has contractually agreed to limit the Fund’s expenses.
· For Janus Henderson Global Sustainable Equity Fund, the Trustees noted that the Fund’s total expenses were below the peer group for all share classes.
· For Janus Henderson Global Technology and Innovation Fund, the Trustees noted that the Fund’s total expenses were below the peer group for all share classes.
· For Janus Henderson International Opportunities Fund, the Trustees noted that, although the Fund’s total expenses exceeded the peer group average for certain share classes, overall the Fund’s total expenses were reasonable. The Trustees also noted that the Adviser has contractually agreed to limit the Fund’s expenses.
· For Janus Henderson Overseas Fund, the Trustees noted that although the Fund’s total expenses exceeded the peer group average for certain share classes, overall the Fund’s total expenses were reasonable. The Trustees also noted that the Adviser has contractually agreed to limit the Fund’s expenses, although this limit did not apply because the Fund’s total expenses were already below the applicable fee limit.
Money Market Funds
· For Janus Henderson Government Money Market Fund, the Trustees noted that, although the Fund’s total expenses exceeded the peer group for both share classes, overall the Fund’s total expenses were reasonable. The Trustees also noted that the Adviser has voluntarily agreed to limit the Fund’s expenses to assist the Fund in attempting to maintain a yield of at least 0.00%.
· For Janus Henderson Money Market Fund, the Trustees noted that, although the Fund’s total expenses exceeded the peer group for both share classes, overall the Fund’s total expenses were reasonable. The Trustees also noted that the Adviser has agreed to limit the Fund’s expenses to assist the Fund in attempting to maintain a yield of at least 0.00%.
Multi-Asset Funds
· For Janus Henderson Adaptive Global Allocation Fund, the Trustees noted that, that the Fund’s total expenses were below the peer group average for all share classes.
· For Janus Henderson Dividend & Income Builder Fund, the Trustees noted that, that the Fund’s total expenses were below the peer group average for all share classes.
Multi-Asset U.S. Equity Funds
· For Janus Henderson Balanced Fund, the Trustees noted that, although the Fund’s total expenses exceeded the peer group average for certain share classes, overall the Fund’s total expenses were reasonable. The Trustees also noted that the Adviser has contractually agreed to limit the Fund’s expenses, although this limit did not apply because the Fund’s total expenses were already below the applicable fee limit.
· For Janus Henderson Contrarian Fund, the Trustees noted that, although the Fund’s total expenses exceeded the peer group average for certain share classes, overall the Fund’s total expenses were reasonable. The Trustees also noted that the Adviser had contractually agreed to limit the Fund’s expenses.
· For Janus Henderson Enterprise Fund, the Trustees noted that, although the Fund’s total expenses exceeded the peer group for certain share classes, overall the Fund’s total expenses were reasonable. The Trustees also noted
Janus Henderson Small-Mid Cap Value Fund
Additional Information (unaudited)
that the Adviser has contractually agreed to limit the Fund’s expenses, although this limit did not apply because the Fund’s total expenses were already below the applicable fee limit.
· For Janus Henderson Forty Fund, the Trustees noted that, although the Fund’s total expenses exceeded the peer group for certain share classes, overall the Fund’s total expenses were reasonable. The Trustees also noted that the Adviser has contractually agreed to limit the Fund’s expenses, although this limit did not apply because the Fund’s total expenses were already below the applicable fee limit.
· For Janus Henderson Growth and Income Fund, the Trustees noted that, although the Fund’s total expenses exceeded the peer group for certain share classes, overall the Fund’s total expenses were reasonable. The Trustees also noted that the Adviser has contractually agreed to limit the Fund’s expenses, although this limit did not apply because the Fund’s total expenses were already below the applicable fee limit.
· For Janus Henderson Research Fund, the Trustees noted that, although the Fund’s total expenses exceeded the peer group for one share class, overall the Fund’s total expenses were reasonable. The Trustees also noted that the Adviser has contractually agreed to limit the Fund’s expenses, although this limit did not apply because the Fund’s total expenses were already below the applicable fee limit.
· For Janus Henderson Triton Fund, the Trustees noted that the Fund’s total expenses were below the peer group for all share classes.
· For Janus Henderson Venture Fund, the Trustees noted that the Fund’s total expenses were below the peer group for all share classes.
Quantitative Equity Funds
· For Janus Henderson Emerging Markets Managed Volatility Fund, the Trustees noted that, although the Fund’s total expenses exceeded the peer group for certain share classes, overall the Fund’s total expenses were reasonable. The Trustees also noted that the Adviser has contractually agreed to limit the Fund’s expenses.
· For Janus Henderson Global Income Managed Volatility Fund, the Trustees noted that the Fund’s total expenses were below the peer group for all share classes.
· For Janus Henderson International Managed Volatility Fund, the Trustees noted that, although the Fund’s total expenses exceeded the peer group for certain share classes, overall the Fund’s total expenses were reasonable. The Trustees also noted that the Adviser has contractually agreed to limit the Fund’s expenses.
· For Janus Henderson U.S. Managed Volatility Fund, the Trustees noted that, although the Fund’s total expenses exceeded the peer group for certain share classes, overall the Fund’s total expenses were reasonable. The Trustees also noted that the Adviser has contractually agreed to limit the Fund’s expenses, although this limit did not apply because the Fund’s total expenses were already below the applicable fee limit.
U.S. Equity Funds
· For Janus Henderson Mid Cap Value Fund, the Trustees noted that, although the Fund’s total expenses exceeded the peer group average for certain share classes, overall the Fund’s total expenses were reasonable. The Trustees also noted that the Adviser has contractually agreed to limit the Fund’s expenses, although this limit did not apply because the Fund’s total expenses were already below the applicable fee limit.
· For Janus Henderson Small Cap Value Fund, the Trustees noted that, although the Fund’s total expenses exceeded the peer group average for certain share classes, overall the Fund’s total expenses were reasonable. The Trustees also noted that the Adviser has contractually agreed to limit the Fund’s expenses, although this limit did not apply because the Fund’s total expenses were already below the applicable fee limit.
· For Janus Henderson Small-Mid Cap Value Fund, the Trustees noted that, although the Fund’s total expenses exceeded the peer group average for certain share classes, overall the Fund’s total expenses were reasonable. The Trustees also noted that the Adviser has contractually agreed to limit the Fund’s expenses.
The Trustees reviewed information on the overall profitability to the Adviser and its affiliates from their relationships with the Janus Henderson Funds, and considered profitability data of other publicly traded mutual fund advisers. The Trustees recognized that profitability comparisons among fund managers are difficult because of the variation in the type of comparative information that is publicly available, and the profitability of any fund manager is affected by
Janus Henderson Small-Mid Cap Value Fund
Additional Information (unaudited)
numerous factors, including the organizational structure of the particular fund manager, differences in complex size, difference in product mix, difference in types of business (mutual fund, institutional and other), differences in the types of funds and other accounts it manages, possible other lines of business, the methodology for allocating expenses and the fund manager’s capital structure and cost of capital.
Additionally, the Trustees considered the estimated profitability to the Adviser from the investment management services it provided to each Janus Henderson Fund. In their review, the Trustees considered whether the Adviser and subadviser receive adequate incentives and resources to manage the Janus Henderson Funds effectively. In reviewing profitability, the Trustees noted that the estimated profitability for an individual Janus Henderson Fund is necessarily a product of the allocation methodology utilized by the Adviser to allocate its expenses as part of the estimated profitability calculation. In this regard, the Trustees noted that the independent fee consultant found that (1) the expense allocation methodology and rationales utilized by the Adviser were reasonable and (2) no clear correlation exists between expense allocations and operating margins. The Trustees also considered that the estimated profitability for an individual Janus Henderson Fund was influenced by a number of factors, including not only the allocation methodology selected, but also the presence of fee waivers and expense caps, and whether the Janus Henderson Fund’s investment management agreement contained breakpoints or a performance fee component. The Trustees determined, after taking into account these factors, among others, that the Adviser’s estimated profitability with respect to each Janus Henderson Fund was not unreasonable in relation to the services provided, and that the variation in the range of such estimated profitability among the Janus Henderson Funds was not a material factor in the Board’s approval of the reasonableness of any Janus Henderson Fund’s investment management fees.
The Trustees concluded that the management fees payable by each Janus Henderson Fund to the Adviser and its affiliates, as well as the fees paid by the Adviser to the subadviser of subadvised Janus Henderson Funds, were reasonable in relation to the nature, extent, and quality of the services provided, taking into account the fees charged by other advisers for managing comparable mutual funds with similar strategies, the fees the Adviser and the subadviser charge to other clients, and, as applicable, the impact of fund performance on management fees payable by the Janus Henderson Funds. The Trustees also concluded that each Janus Henderson Fund’s total expenses were reasonable, taking into account the size of the Janus Henderson Fund, the quality of services provided by the Adviser and subadviser, the investment performance of the Janus Henderson Fund, and any expense limitations agreed to or provided by the Adviser.
Economies of Scale
The Trustees considered information about the potential for the Adviser to realize economies of scale as the assets of the Janus Henderson Funds increase. They noted that their independent fee consultant published a report to the Trustees in November 2019 which provided its research and analysis into economies of scale. They also noted that, although many Janus Henderson Funds pay advisory fees at a fixed base rate as a percentage of net assets, without any breakpoints or performance fees, their independent fee consultant concluded that 75% of these Janus Henderson Funds’ have contractual management fees (gross of waivers) below their Broadridge Expense Group averages. The Trustees also noted the following: (1) that for those Janus Henderson Funds whose expenses are being reduced by the contractual expense limitations of the Adviser, the Adviser is subsidizing certain of these Janus Henderson Funds because they have not reached adequate scale; (2) performance fee structures have been implemented for various Janus Henderson Funds that have caused the effective rate of advisory fees payable by such Janus Henderson Fund to vary depending on the investment performance of the Janus Henderson Fund relative to its benchmark index over the measurement period; and (3) a few Janus Henderson Funds have fee schedules with breakpoints and reduced fee rates above certain asset levels. The Trustees also noted that the Janus Henderson Funds share directly in economies of scale through the significant investments made by the Adviser and its affiliates related to services provided to the Funds and the lower charges of third-party service providers that are based in part on the combined scale of all of the Janus Henderson Funds.
The Trustees also considered the independent fee consultant’s conclusion that, given the limitations of various analytical approaches to economies of scale and their conflicting results, it is difficult to analytically confirm or deny the existence of economies of scale in the Janus Henderson complex. In this regard, the independent consultant concluded that (1) to the extent there were economies of scale at the Adviser, the Adviser’s general strategy of setting fixed management fees below peers appeared to share any such economies with investors even on smaller Janus Henderson Funds which have not yet achieved those economies and (2) by setting lower fixed fees from the start on these Janus Henderson Funds, the Adviser appeared to be investing to increase the likelihood that these Janus
Janus Henderson Small-Mid Cap Value Fund
Additional Information (unaudited)
Henderson Funds will grow to a level to achieve any economies of scale that may exist. Further, the independent fee consultant provided its belief that Janus Henderson Fund investors are well-served by the fee levels and performance fee structures in place on the Janus Henderson Funds in light of any economies of scale that may be present at the Adviser.
Based on all of the information reviewed, including the recent and past research and analysis conducted by the Trustees’ independent fee consultant, the Trustees concluded that the current fee structure of each Janus Henderson Fund was reasonable and that the current rates of fees do reflect a sharing between the Adviser and the Janus Henderson Fund of any economies of scale that may be present at the current asset level of the Janus Henderson Fund.
Other Benefits to the Adviser
The Trustees also considered benefits that accrue to the Adviser and its affiliates and subadviser to the Janus Henderson Funds from their relationships with the Janus Henderson Funds. They recognized that two affiliates of the Adviser separately serve the Janus Henderson Funds as transfer agent and distributor, respectively, and the transfer agent receives compensation directly from the non-money market funds for services provided, and that such compensation contributes to the overall profitability of the Adviser and its affiliates that results from their relationship with the Janus Henderson Funds. The Trustees also considered the Adviser’s past and proposed use of commissions paid by the Janus Henderson Funds on portfolio brokerage transactions to obtain proprietary and third-party research products and services benefiting the Janus Henderson Fund and/or other clients of the Adviser and/or the Adviser, and/or subadviser to a Janus Henderson Fund. The Trustees concluded that the Adviser’s and the subadviser’s use of these types of client commission arrangements to obtain proprietary and third-party research products and services was consistent with regulatory requirements and guidelines and was likely to benefit each Janus Henderson Fund. The Trustees also concluded that, other than the services provided by the Adviser and its affiliates and subadviser pursuant to the agreements and the fees to be paid by each Janus Henderson Fund therefor, the Janus Henderson Funds and the Adviser and the subadviser may potentially benefit from their relationship with each other in other ways. They concluded that the Adviser and its affiliates share directly in economies of scale through the lower charges of third-party service providers that are based in part on the combined scale of the Janus Henderson Funds and other clients serviced by the Adviser and its affiliates. They also concluded that the Adviser and the subadviser benefit from the receipt of research products and services acquired through commissions paid on portfolio transactions of the Janus Henderson Funds and that the Janus Henderson Funds benefit from the Adviser’s and/or the subadviser’s receipt of those products and services as well as research products and services acquired through commissions paid by other clients of the Adviser and/or other clients of the subadviser. They further concluded that the success of any Janus Henderson Fund could attract other business to the Adviser, the subadviser or other Janus Henderson funds, and that the success of the Adviser and the subadviser could enhance the Adviser’s and the subadviser’s ability to serve the Janus Henderson Funds.
Janus Henderson Small-Mid Cap Value Fund
Liquidity Risk Management Program (unaudited)
Liquidity Risk Management Program
Rule 22e-4 under the Investment Company Act of 1940, as amended (the “Liquidity Rule”), requires open-end funds (but not money market funds) to adopt and implement a written liquidity risk management program (the “LRMP”) that is reasonably designed to assess and manage liquidity risk, which is the risk that a fund could not meet redemption requests without significant dilution of remaining investors’ interest in the fund. The Fund has implemented a LRMP, which incorporates the following elements: (i) assessment, management, and periodic review of liquidity risk; (ii) classification of portfolio holdings; (iii) the establishment and monitoring of a highly liquid investment minimum, as applicable; (iv) a 15% limitation on a Fund’s illiquid investments; (v) redemptions in-kind; and (vi) board oversight.
The Trustees of the Fund (the “Trustees”) have designated Janus Henderson Investors US LLC, the Fund’s investment adviser (the “Adviser”), as the Program Administrator for the LRMP responsible for administering the LRMP and carrying out the specific responsibilities of the LRMP. A working group comprised of various teams within the Adviser’s business is responsible for administering the LRMP and carrying out the specific responsibilities of different aspects of the LRMP (the “Liquidity Risk Working Group”). In assessing each Fund’s liquidity risk, the Liquidity Risk Working Group periodically considers, as relevant, factors including (i) the liquidity of a Fund’s portfolio investments during normal and reasonably foreseeable stressed conditions; (ii) whether a Fund’s investment strategy is appropriate for an open-end fund; (iii) the extent to which a Fund’s strategy involves a relatively concentrated portfolio or large positions in any issuer; (iv) a Fund’s use of borrowing for investment purposes; and (v) a Fund’s use of derivatives.
The Liquidity Rule requires the Trustees to review at least annually a written report provided by the Program Administrator that addresses the operation of the LRMP and assesses its adequacy and the effectiveness of its implementation, including, if applicable, the operation of the highly liquid investment minimum, and any material changes to the LRMP (the “Program Administrator Report”). At a meeting held on March 16, 2022, the Adviser provided the Program Administrator Report to the Trustees which covered the operation of the LRMP from January 1, 2021 through December 31, 2021 (the “Reporting Period”).
The Program Administrator Report discussed the operation and effectiveness of the LRMP during the Reporting Period. It noted that the Fund was able to meet redemptions during the normal course of business during the Reporting Period. The Program Administrator Report also stated that the Fund did not exceed the 15% limit on illiquid assets during the Reporting Period, that the Fund held primarily highly liquid assets, and was considered to be a primarily highly liquid fund during the Reporting Period. In addition, the Adviser expressed its belief in the Program Administrator Report that the LRMP is reasonably designed and adequate to assess and manage the Fund’s liquidity risk, considering the Fund’s particular risks and circumstances, and includes policies and procedures reasonably designed to implement each required component of the Liquidity Rule.
There can be no assurance that the LRMP will achieve its objectives in the future. Please refer to your Fund’s prospectus for more information regarding the risks to which an investment in the Fund may be subject.
Janus Henderson Small-Mid Cap Value Fund
Useful Information About Your Fund Report (unaudited)
Management Commentary
The Management Commentary in this report includes valuable insight as well as statistical information to help you understand how your Fund’s performance and characteristics stack up against those of comparable indices.
If the Fund invests in foreign securities, this report may include information about country exposure. Country exposure is based primarily on the country of risk. A company may be allocated to a country based on other factors such as location of the company’s principal office, the location of the principal trading market for the company’s securities, or the country where a majority of the company’s revenues are derived.
Please keep in mind that the opinions expressed in the Management Commentary are just that: opinions. They are a reflection based on best judgment at the time this report was compiled, which was June 30, 2022. As the investing environment changes, so could opinions. These views are unique and are not necessarily shared by fellow employees or by Janus Henderson in general.
Performance Overviews
Performance overview graphs compare the performance of a hypothetical $10,000 investment in the Fund with one or more widely used market indices. When comparing the performance of the Fund with an index, keep in mind that market indices are not available for investment and do not reflect deduction of expenses.
Average annual total returns are quoted for a Fund with more than one year of performance history. Average annual total return is calculated by taking the growth or decline in value of an investment over a period of time, including reinvestment of dividends and distributions, then calculating the annual compounded percentage rate that would have produced the same result had the rate of growth been constant throughout the period. Average annual total return does not reflect the deduction of taxes that a shareholder would pay on Fund distributions or redemptions of Fund shares.
Cumulative total returns are quoted for a Fund with less than one year of performance history. Cumulative total return is the growth or decline in value of an investment over time, independent of the period of time involved. Cumulative total return does not reflect the deduction of taxes that a shareholder would pay on Fund distributions or redemptions of Fund shares.
Pursuant to federal securities rules, expense ratios shown in the performance chart reflect subsidized (if applicable) and unsubsidized ratios. The total annual fund operating expenses ratio is gross of any fee waivers, reflecting the Fund’s unsubsidized expense ratio. The net annual fund operating expenses ratio (if applicable) includes contractual waivers of the Adviser and reflects the Fund’s subsidized expense ratio. Ratios may be higher or lower than those shown in the “Financial Highlights” in this report.
Schedule of Investments
Following the performance overview section is the Fund’s Schedule of Investments. This schedule reports the types of securities held in the Fund on the last day of the reporting period. Securities are usually listed by type (common stock, corporate bonds, U.S. Government obligations, etc.) and by industry classification (banking, communications, insurance, etc.). Holdings are subject to change without notice.
The value of each security is quoted as of the last day of the reporting period. The value of securities denominated in foreign currencies is converted into U.S. dollars.
If the Fund invests in foreign securities, it will also provide a summary of investments by country. This summary reports the Fund exposure to different countries by providing the percentage of securities invested in each country. The country of each security represents the country of risk. The Fund’s Schedule of Investments relies upon the industry group and country classifications published by Bloomberg and/or MSCI Inc.
Tables listing details of individual forward currency contracts, futures, written options, swaptions, and swaps follow the Fund’s Schedule of Investments (if applicable).
Statement of Assets and Liabilities
This statement is often referred to as the “balance sheet.” It lists the assets and liabilities of the Fund on the last day of the reporting period.
Janus Henderson Small-Mid Cap Value Fund
Useful Information About Your Fund Report (unaudited)
The Fund’s assets are calculated by adding the value of the securities owned, the receivable for securities sold but not yet settled, the receivable for dividends declared but not yet received on securities owned, and the receivable for Fund shares sold to investors but not yet settled. The Fund’s liabilities include payables for securities purchased but not yet settled, Fund shares redeemed but not yet paid, and expenses owed but not yet paid. Additionally, there may be other assets and liabilities such as unrealized gain or loss on forward currency contracts.
The section entitled “Net Assets Consist of” breaks down the components of the Fund’s net assets. Because the Fund must distribute substantially all earnings, you will notice that a significant portion of net assets is shareholder capital.
The last section of this statement reports the net asset value (“NAV”) per share on the last day of the reporting period. The NAV is calculated by dividing the Fund’s net assets for each share class (assets minus liabilities) by the number of shares outstanding.
Statement of Operations
This statement details the Fund’s income, expenses, realized gains and losses on securities and currency transactions, and changes in unrealized appreciation or depreciation of Fund holdings.
The first section in this statement, entitled “Investment Income,” reports the dividends earned from securities and interest earned from interest-bearing securities in the Fund.
The next section reports the expenses incurred by the Fund, including the advisory fee paid to the investment adviser, transfer agent fees and expenses, and printing and postage for mailing statements, financial reports and prospectuses. Expense offsets and expense reimbursements, if any, are also shown.
The last section lists the amounts of realized gains or losses from investment and foreign currency transactions, and changes in unrealized appreciation or depreciation of investments and foreign currency-denominated assets and liabilities. The Fund will realize a gain (or loss) when it sells its position in a particular security. A change in unrealized gain (or loss) refers to the change in net appreciation or depreciation of the Fund during the reporting period. “Net Realized and Unrealized Gain/(Loss) on Investments” is affected both by changes in the market value of Fund holdings and by gains (or losses) realized during the reporting period.
Statements of Changes in Net Assets
These statements report the increase or decrease in the Fund’s net assets during the reporting period. Changes in the Fund’s net assets are attributable to investment operations, dividends and distributions to investors, and capital share transactions. This is important to investors because it shows exactly what caused the Fund’s net asset size to change during the period.
The first section summarizes the information from the Statement of Operations regarding changes in net assets due to the Fund’s investment operations. The Fund’s net assets may also change as a result of dividend and capital gains distributions to investors. If investors receive their dividends and/or distributions in cash, money is taken out of the Fund to pay the dividend and/or distribution. If investors reinvest their dividends and/or distributions, the Fund’s net assets will not be affected.
The reinvestment of dividends and distributions is included under “Capital Share Transactions.” “Capital Shares” refers to the money investors contribute to the Fund through purchases or withdrawals via redemptions. The Fund’s net assets will increase and decrease in value as investors purchase and redeem shares from the Fund.
Financial Highlights
This schedule provides a per-share breakdown of the components that affect the Fund’s NAV for current and past reporting periods as well as total return, asset size, ratios, and portfolio turnover rate.
The first line in the table reflects the NAV per share at the beginning of the reporting period. The next line reports the net investment income/(loss) per share. Following is the per share total of net gains/(losses), realized and unrealized. Per share dividends and distributions to investors are then subtracted to arrive at the NAV per share at the end of the period. The next line reflects the total return for the period. The total return may include adjustments in accordance with generally accepted accounting principles required at the period end for financial reporting purposes. As a result, the total return may differ from the total return reflected for individual shareholder transactions. Also included are ratios of expenses and net investment income to average net assets.
Janus Henderson Small-Mid Cap Value Fund
Useful Information About Your Fund Report (unaudited)
The Fund’s expenses may be reduced through expense offsets and expense reimbursements. The ratios shown reflect expenses before and after any such offsets and reimbursements.
The ratio of net investment income/(loss) summarizes the income earned less expenses, divided by the average net assets of the Fund during the reporting period. Do not confuse this ratio with the Fund’s yield. The net investment income ratio is not a true measure of the Fund’s yield because it does not take into account the dividends distributed to the Fund’s investors.
The next figure is the portfolio turnover rate, which measures the buying and selling activity in the Fund. Portfolio turnover is affected by market conditions, changes in the asset size of the Fund, fluctuating volume of shareholder purchase and redemption orders, the nature of the Fund’s investments, and the investment style and/or outlook of the portfolio manager(s) and/or investment personnel. A 100% rate implies that an amount equal to the value of the entire portfolio was replaced once during the fiscal year; a 50% rate means that an amount equal to the value of half the portfolio is traded in a year; and a 200% rate means that an amount equal to the value of the entire portfolio is traded every six months.
Janus Henderson Small-Mid Cap Value Fund
Designation Requirements (unaudited)
For federal income tax purposes, the Fund designated the following for the year ended June 30, 2022:
| | |
| | |
Capital Gain Distributions | $3,367,574 |
Dividends Received Deduction Percentage | 100% |
Qualified Dividend Income Percentage | 100% |
Janus Henderson Small-Mid Cap Value Fund
Trustees and Officers (unaudited)
The following are the Trustees and officers of the Trust, together with a brief description of their principal occupations during the last five years (principal occupations for certain Trustees may include periods over five years). The Fund’s Statement of Additional Information includes additional information about the Trustees and officers and is available, without charge, by calling 1-877-335-2687.
Each Trustee has served in that capacity since he or she was originally elected or appointed. The Trustees do not serve a specified term of office. Each Trustee will hold office until the termination of the Trust or his or her earlier death, resignation, retirement, incapacity, or removal. Under the Fund’s Governance Procedures and Guidelines, the policy is for Trustees to retire no later than the end of the calendar year in which the Trustee turns 75. The Trustees review the Fund’s Governance Procedures and Guidelines from time to time and may make changes they deem appropriate. The Fund’s Nominating and Governance Committee will consider nominees for the position of Trustee recommended by shareholders. Shareholders may submit the name of a candidate for consideration by the Committee by submitting their recommendations to the Trust’s Secretary. Each Trustee is currently a Trustee of one other registered investment company advised by the Adviser: Janus Aspen Series. Collectively, these two registered investment companies consist of 50 series or funds referred to herein as the Fund Complex.
The Trust’s officers are elected annually by the Trustees for a one-year term. Certain officers also serve as officers of Janus Aspen Series. Certain officers of the Fund may also be officers and/or directors of the Adviser. Except as otherwise disclosed, Fund officers receive no compensation from the Fund, except for the Fund’s Chief Compliance Officer, as authorized by the Trustees.
| | | | | | |
TRUSTEES |
Name, Address, and Age | Positions Held with the Trust | Length of Time Served | Principal Occupations During the Past Five Years | Number of Portfolios/Funds in Fund Complex Overseen by Trustee | Other Directorships Held by Trustee During the Past Five Years |
Independent Trustees | | | | |
Alan A. Brown
151 Detroit Street
Denver, CO 80206
DOB: 1962 | Chairman
Trustee | 5/22-Present
1/13-Present | Principal, Curam Holdings LLC (since 2018). Formerly, Executive Vice President, Institutional Markets, of Black Creek Group (private equity real estate investment management firm) (2012-2018), Executive Vice President and Co-Head, Global Private Client Group (2007-2010), Executive Vice President, Mutual Funds (2005-2007), and Chief Marketing Officer (2001-2005) of Nuveen Investments, Inc. (asset management). | 50 | Advisory Board Member of AEW Core Property Trust (open-end property fund) (since 2020), and Director of WTTW (PBS affiliate) (since 2003). Formerly, Director of MotiveQuest LLC (strategic social market research company) (2003-2016), Director of Nuveen Global Investors LLC (2007-2011), Director of Communities in Schools (2004-2010), and Director of Mutual Fund Education Alliance (until 2010). |
Janus Henderson Small-Mid Cap Value Fund
Trustees and Officers (unaudited)
| | | | | | |
TRUSTEES |
Name, Address, and Age | Positions Held with the Trust | Length of Time Served | Principal Occupations During the Past Five Years | Number of Portfolios/Funds in Fund Complex Overseen by Trustee | Other Directorships Held by Trustee During the Past Five Years |
Independent Trustees | | | | |
Cheryl D. Alston
151 Detroit Street
Denver, CO 80206
DOB: 1966 | Trustee | 8/22-Present | Executive Director and Chief Investment Officer, Employees’ Retirement Fund of the City of Dallas (since 2004). | 50 | Director of Blue Cross Blue Shield of Kansas City (a not-for-profit health insurance provider) (since 2016) and Director of Global Life Insurance (life and supplemental health insurance provider) (since 2017). Formerly, Director of Federal Home Loan Bank of Dallas (2017-2021). |
Janus Henderson Small-Mid Cap Value Fund
Trustees and Officers (unaudited)
| | | | | | |
TRUSTEES |
Name, Address, and Age | Positions Held with the Trust | Length of Time Served | Principal Occupations During the Past Five Years | Number of Portfolios/Funds in Fund Complex Overseen by Trustee | Other Directorships Held by Trustee During the Past Five Years |
Independent Trustees | | | | |
William D. Cvengros
151 Detroit Street
Denver, CO 80206
DOB: 1948 | Trustee | 1/11-Present | Chief Executive Officer of SJC Capital, LLC (a personal investment company and consulting firm) (since 2002). Formerly, Chief Executive Officer and President of PIMCO Advisors Holdings L.P. (a publicly traded investment management firm) (1994-2000), and Chief Investment Officer (1987-1994) and Vice Chairman and Director (1990-1994) of Pacific Life Insurance Company (a mutual life insurance and annuity company) (1987-1994). | 50 | Member, Limited Partner Advisory Committee, Karmel Capital Fund III (later stage growth fund) (since 2022), Member of the Investment Committee for the Orange County Community Foundation (a grantmaking foundation) (since 2020), Advisory Board Member, RevOZ Fund LP and related funds (real estate investments for opportunity zones) (since 2020), and Advisory Board Member, Innovate Partners Emerging Growth and Equity Fund I (early stage venture capital fund) (since 2014). Formerly, Managing Trustee of National Retirement Partners Liquidating Trust (2013-2016), Chairman, National Retirement Partners, Inc. (formerly a network of advisors to 401(k) plans) (2005-2013), Director of Prospect Acquisition Corp. (a special purpose acquisition corporation) (2007-2009), Director of RemedyTemp, Inc. (temporary help services company) (1996-2006), and Trustee of PIMCO Funds Multi-Manager Series (1990-2000) and Pacific Life Variable Life & Annuity Trusts (1987-1994). |
Janus Henderson Small-Mid Cap Value Fund
Trustees and Officers (unaudited)
| | | | | | |
TRUSTEES |
Name, Address, and Age | Positions Held with the Trust | Length of Time Served | Principal Occupations During the Past Five Years | Number of Portfolios/Funds in Fund Complex Overseen by Trustee | Other Directorships Held by Trustee During the Past Five Years |
Independent Trustees | | | | |
Raudline Etienne
151 Detroit Street
Denver, CO 80206
DOB: 1965 | Trustee | 6/16-Present | Founder, Daraja Capital (advisory and investment firm) (since 2016). Formerly, Senior Vice President and Senior Advisor, Albright Stonebridge Group LLC (global strategy firm) (2011-2021), and Deputy Comptroller and Chief Investment Officer, New York State Common Retirement Fund (public pension fund) (2008-2011). | 50 | Member of the Investment Committee for Cooper Union (private college) (since 2021), Board Member, Van Alen Institute (nonprofit architectural and design organization) (since 2019) and Director of Brightwood Capital Advisors, LLC (since 2014). |
Darrell B. Jackson
151 Detroit Street
Denver, CO 80206
DOB: 1958 | Trustee | 8/22-Present | President and Chief Executive Officer, The Efficace Group Inc. (since 2018). Formerly, President and Chief Executive Officer, Seaway Bank and Trust Company (community bank) (2014-2015), and Executive Vice President and Co-President, Wealth Management (2009-2014), and several senior positions, including Group Executive, Senior Vice President, and Vice President (1995-2009) of Northern Trust Company (financial services company) (1995-2014). | 50 | Director of Amalgamated Financial Corp (bank) (since August 2021), Director of YR Media (a not-for-profit production company) (since 2021), and Director of Gray-Bowen-Scott (transportation project consulting firm) (since April 2020). Formerly, Director of Delaware Place Bank (closely held commercial bank) (2016-2018) and Director of Seaway Bank and Trust Company (2014-2015). |
Janus Henderson Small-Mid Cap Value Fund
Trustees and Officers (unaudited)
| | | | | | |
TRUSTEES |
Name, Address, and Age | Positions Held with the Trust | Length of Time Served | Principal Occupations During the Past Five Years | Number of Portfolios/Funds in Fund Complex Overseen by Trustee | Other Directorships Held by Trustee During the Past Five Years |
Independent Trustees | | | | |
William F. McCalpin
151 Detroit Street
Denver, CO 80206
DOB: 1957 | Trustee | 6/02-Present | Chief Executive Officer, muun chi LLC (organic food business) (since 2022). Formerly, Chief Operating Officer, muun chi LLC (2020-2022), Managing Partner, Impact Investments, Athena Capital Advisors LLC (independent registered investment advisor) (2016-2019), Managing Director, Holos Consulting LLC (provides consulting services to foundations and other nonprofit organizations) (2009-2016), Chief Executive Officer, Imprint Capital Advisors (impact investment firm) (2013-2015), and Executive Vice President and Chief Operating Officer of The Rockefeller Brothers Fund (a private family foundation) (1998-2006). | 50 | Chairman of the Board and Trustee of The Investment Fund for Foundations Investment Program (TIP) (consisting of 1 fund) (since 2008) and Director of the F.B. Heron Foundation (a private grantmaking foundation) (since 2006). Formerly, Director of Mutual Fund Directors Forum (a non-profit organization serving independent directors of U.S. mutual funds) (2016-2021). |
Janus Henderson Small-Mid Cap Value Fund
Trustees and Officers (unaudited)
| | | | | | |
TRUSTEES |
Name, Address, and Age | Positions Held with the Trust | Length of Time Served | Principal Occupations During the Past Five Years | Number of Portfolios/Funds in Fund Complex Overseen by Trustee | Other Directorships Held by Trustee During the Past Five Years |
Independent Trustees | | | | |
Gary A. Poliner
151 Detroit Street
Denver, CO 80206
DOB: 1953 | Trustee | 6/16-Present | Retired. Formerly, President (2010-2013) of Northwestern Mutual Life Insurance Company. | 50 | Director of MGIC Investment Corporation (private mortgage insurance) (since 2013). Formerly, Director, West Bend Mutual Insurance Company (property/casualty insurance) (2013-2021), Trustee of Northwestern Mutual Life Insurance Company (2010-2013) and Director of Frank Russell Company (global asset management firm) (2008-2013). |
Diane L. Wallace
151 Detroit Street
Denver, CO 80206
DOB: 1958 | Trustee | 6/17-Present | Retired. Formerly, Chief Operating Officer, Senior Vice President-Operations, and Chief Financial Officer for Driehaus Capital Management, LLC (1988-2006) and Treasurer for Driehaus Mutual Funds (1996-2002). | 50 | Formerly, Director of Family Service of Lake County (2019-2021), Independent Trustee, Henderson Global Funds (13 portfolios) (2015-2017), Independent Trustee, State Farm Associates’ Funds Trust, State Farm Mutual Fund Trust, and State Farm Variable Product Trust (28 portfolios) (2013-2017).
|
Janus Henderson Small-Mid Cap Value Fund
Trustees and Officers (unaudited)
| | | | | | |
TRUSTEES |
Name, Address, and Age | Positions Held with the Trust | Length of Time Served | Principal Occupations During the Past Five Years | Number of Portfolios/Funds in Fund Complex Overseen by Trustee | Other Directorships Held by Trustee During the Past Five Years |
Independent Trustees | | | | |
Linda S. Wolf
151 Detroit Street
Denver, CO 80206
DOB: 1947 | Trustee | 11/05-Present | Retired. Formerly, Chairman and Chief Executive Officer of Leo Burnett (Worldwide) (advertising agency) (2001-2005). | 50 | Director of Chicago Community Trust (Regional Community Foundation), Lurie Children’s Hospital (Chicago, IL), and Shirley Ryan Ability Lab. Formerly, Director of Wrapports, LLC (until 2022), Director of Chicago Council on Global Affairs (until 2019), InnerWorkings (until 2019) and Director of Walmart (until 2017). |
Janus Henderson Small-Mid Cap Value Fund
Trustees and Officers (unaudited)
| | | | |
OFFICERS |
Name, Address, and Age | Positions Held with the Trust | Term of Office* and Length of Time Served | Principal Occupations During the Past Five Years |
Kevin Preloger
151 Detroit Street
Denver, CO 80206
DOB: 1975 | Executive Vice President and Co-Portfolio Manager
Janus Henderson Small-Mid Cap Value Fund | 8/19-Present | Portfolio Manager for other Janus Henderson accounts. |
Justin Tugman
151 Detroit Street
Denver, CO 80206
DOB: 1973 | Executive Vice President and Co-Portfolio Manager
Janus Henderson Small-Mid Cap Value Fund | 8/19-Present | Portfolio Manager for other Janus Henderson accounts. |
Michelle Rosenberg
151 Detroit Street
Denver, CO 80206
DOB: 1973 | Interim President and Chief Executive Officer | 1/22-Present | General Counsel and Corporate Secretary of Janus Henderson Investors (since 2018). Formerly, Senior Vice President and Head of Legal, North America of Janus Henderson Investors (2017-2018) and Deputy General Counsel of Janus Henderson US (Holdings) Inc. (2015-2018). |
Kristin Mariani
151 Detroit Street
Denver, CO 80206
DOB: 1966 | Vice President, Chief Compliance Officer, and Anti-Money Laundering Officer | 7/20-Present | Head of Compliance, North America for Janus Henderson Investors (since September 2020) and Chief Compliance Officer for Janus Henderson Investors US LLC (since September 2017). Formerly, Global Head of Investment Management Compliance for Janus Henderson Investors (February 2019-August 2020), Vice President, Head of Global Distribution Compliance and Chief Compliance Officer of Janus Henderson Distributors US LLC (May 2017-September 2017), Vice President, Compliance at Janus Henderson US (Holdings) Inc., Janus Henderson Investors US LLC, and Janus Henderson Distributors US LLC (2009-2017). |
Jesper Nergaard
151 Detroit Street
Denver, CO 80206
DOB: 1962 | Chief Financial Officer
Vice President, Treasurer, and Principal Accounting Officer | 3/05-Present
2/05-Present | Head of U.S. Fund Administration, Janus Henderson Investors and Janus Henderson Services US LLC. |
Janus Henderson Small-Mid Cap Value Fund
Trustees and Officers (unaudited)
| | | | |
OFFICERS |
Name, Address, and Age | Positions Held with the Trust | Term of Office* and Length of Time Served | Principal Occupations During the Past Five Years |
Abigail J. Murray
151 Detroit Street
Denver, CO 80206
DOB: 1975 | Vice President, Chief Legal Officer, and Secretary | 12/20-Present | Managing Counsel (2020-present). Formerly, Senior Counsel for Invesco Ltd. (2017-2020), and Vice President and Senior Counsel, ALPS Fund Services, Inc. and Assistant General Counsel, ALPS Advisors, Inc. (2015-2017). |
* Officers are elected at least annually by the Trustees for a one-year term and may also be elected from time to time by the Trustees for an interim period. |
Janus Henderson Small-Mid Cap Value Fund
Notes
NotesPage1
| | | | | | | | |
| | | | | |

| | | | |
This report is submitted for the general information of shareholders of the Fund. It is not an offer or solicitation for the Fund and is not authorized for distribution to prospective investors unless preceded or accompanied by an effective prospectus. |
Janus Henderson is a trademark of Janus Henderson Group plc or one of its subsidiaries. © Janus Henderson Group plc Janus Henderson Distributors US LLC |
| | | | 125-02-93033 08-22 |
Item 2 - Code of Ethics
As of the end of the period covered by this Form N-CSR, the Registrant has adopted a Code of Ethics (as defined in Item 2(b) of Form N-CSR), which is posted on the Registrant's website: janushenderson.com. Registrant intends to post any amendments to, or waivers from (as defined in Item 2 of Form N-CSR), such code on janushenderson.com within five business days following the date of such amendment or waiver.
Item 3 - Audit Committee Financial Expert
The Registrant's Board of Trustees has determined that the following members of the Board's Audit Committee are "audit committee financial experts," as defined in Item 3 to Form N-CSR: William D. Cvengros, Gary A. Poliner, and Diane Wallace who are each "independent" under the standards set forth in Item 3 to Form N-CSR.
Item 4 - Principal Accountant Fees and Services
Janus Investment Fund (the "Trust"), a Massachusetts business trust registered under the Investment Company Act of 1940, as amended, as an open-end investment company, offers 47 funds which include multiple series of shares with differing investment objectives and policies. The funds comprising the Trust have differing fiscal year ends (June 30 and September 30). This Form N-CSR relates to funds with June 30 fiscal year ends (the "Funds").
(a) Audit Fees
The aggregate fees billed for each of the last two fiscal years for professional services rendered by the principal accountant for the audit of the Funds' annual financial statements or services that are normally provided by the accountant in connection with statutory and regulatory filings or engagements for those fiscal years were $852,995 in fiscal 2022 and $922,201 in fiscal 2021.
(b) Audit-Related Fees
The aggregate fees billed in each of the last two fiscal years for assurance and related services by the principal accountant that are reasonably related to the performance of the audit of the Funds' financial statements and are not reported under paragraph (a) of this Item were $0 in fiscal 2022 and $0 in fiscal 2021.
The nature of the services comprising the fees disclosed under this category includes agreed upon procedures.
(c) Tax Fees
The aggregate fees billed in each of the last two fiscal years for professional services rendered by the principal accountant for tax compliance, tax advice, and tax planning were $207,033 in fiscal 2022 and $196,239 in fiscal 2021.
The nature of the services comprising the fees disclosed under this category includes tax compliance, tax planning, tax advice, and corporate actions review.
(d) All Other Fees
The aggregate fees billed in each of the last two fiscal years for products and services provided by the principal accountant, other than the services reported in paragraphs (a) through (c) of this Item were $0 in fiscal 2022 and $0 in fiscal 2021.
(e) (1) The registrant's Audit Committee Charter requires the registrant's Audit Committee to pre-approve any engagement of the principal accountant (i) to provide audit or non-audit services to the registrant or (ii) to provide non-audit services to the registrant's investment adviser or any entity controlling, controlled by, or under common control with the investment adviser that provides ongoing services to the registrant, if the engagement relates directly to the operations and financial reporting of the registrant, except for those non-audit services that were subject to the pre-approval exception under Rule 2-01 of Regulation S-X. The Chairman of the Audit Committee or, if the Chairman is unavailable, another member of the Audit Committee who is an independent Trustee, may grant the pre-approval. All such delegated pre-approvals must be presented to the Audit Committee no later than the next Audit Committee meeting.
(2) No services described in paragraphs (b) through (d) of this Item were approved by the Registrant’s audit committee pursuant to paragraph (c)(7)(i)(C) of Rule 2-01 of Regulation S-X.
(f) Not applicable as less than 50%
(g) The aggregate non-audit fees billed by the registrant's accountant for services rendered to the registrant, and rendered to the registrant's investment adviser (not including any sub-adviser whose role is primarily portfolio management and is subcontracted with or overseen by another investment adviser), and any entity controlling, controlled by, or under common control with the adviser that provides ongoing services to the registrant for each of the last two fiscal years of the registrant were $207,033 in fiscal 2022 and $196,239 in fiscal 2021.
(h) The registrant's audit committee of the board of trustees has considered whether the provision of non-audit services that were rendered to the registrant's investment adviser (not including any subadviser whose role is primarily portfolio management and is subcontracted with or overseen by another investment adviser), and any entity controlling, controlled by, or under common control with the investment adviser that provides ongoing services to the registrant that were not pre-approved pursuant to paragraph (c)(7)(ii) of Rule 2-01 of Regulation S-X is compatible with maintaining the principal accountant's independence.
Item 5 - Audit Committee of Listed Registrants
Not applicable.
Item 6 - Investments
(a) Schedule of Investments is contained in the Reports to Shareholders included under Item 1 of this Form N-CSR.
(b) Not applicable.
Item 7 - Disclosure of Proxy Voting Policies and Procedures for Closed-End Management Investment Companies
Not applicable to this Registrant.
Item 8 - Portfolio Managers of Closed-End Management Investment Companies
Not applicable to this Registrant.
Item 9 - Purchases of Equity Securities by Closed-End Management Investment Company and Affiliated Purchasers
Not applicable to this Registrant.
Item 10 - Submission of Matters to a Vote of Security Holders
There have been no material changes to the procedures by which shareholders may recommend nominees to the Registrant's Board of Trustees.
Item 11 - Controls and Procedures
(a) The Registrant's Principal Executive Officer and Principal Financial Officer have evaluated the Registrant's disclosure controls and procedures (as defined in Rule 30a-3(c) under the Investment Company Act of 1940, as amended) within 90 days of this filing and have concluded that the Registrant's disclosure controls and procedures were effective, as of that date.
(b) There have been no changes in the Registrant's internal control over financial reporting (as defined in Rule 30a-3(d) under the Investment Company Act of 1940, as amended) that occurred during the period covered by this report that have materially affected, or are reasonably likely to materially affect, the Registrant's internal control over financial reporting.
Item 12 - Disclosure of Securities Lending Activities for Closed-End Management Investment Companies
(a) Not applicable.
(b) Not applicable.
Item 13 - Exhibits
(a)(1) Not applicable because the Registrant has posted its Code of Ethics (as defined in Item 2(b) of Form N-CSR) on its website pursuant to paragraph (f)(2) of Item 2 of Form N-CSR.
(a)(2) Separate certifications for the Registrant's Principal Executive Officer and Principal Financial Officer, as required under Rule 30a-2(a) under the Investment Company Act of 1940, as amended, are attached as Ex-99CERT.
(b) A certification for the Registrant's Principal Executive Officer and Principal Financial Officer, as required by Rule 30a-2(b) under the Investment Company Act of 1940, as amended, is attached as Ex99.906CERT.
Signatures
Pursuant to the requirements of the Securities Exchange Act of 1934, as amended, and the Investment Company Act of 1940, as amended, the Registrant has duly caused this report to be signed on its behalf by the undersigned, thereunto duly authorized.
Janus Investment Fund
By: /s/ Michelle Rosenberg
Michelle Rosenberg, Interim President and Chief Executive Officer of Janus Investment Fund
(Principal Executive Officer)
Date: August 29, 2022
Pursuant to the requirements of the Securities Exchange Act of 1934, as amended, and the Investment Company Act of 1940, as amended, this report has been signed below by the following persons on behalf of the Registrant and in the capacities and on the dates indicated.
By: /s/ Michelle Rosenberg
Michelle Rosenberg, Interim President and Chief Executive Officer of Janus Investment Fund
(Principal Executive Officer)
Date: August 29, 2022
By: /s/ Jesper Nergaard
Jesper Nergaard, Vice President, Chief Financial Officer, Treasurer and Principal Accounting Officer of Janus Investment Fund
(Principal Accounting Officer and Principal Financial Officer)
Date: August 29, 2022