Exhibit 99.2

CSX Corporation Announces Record First-Quarter Earnings,
New Shareholder Distributions and Financial Targets
Highlights:
| • | Record first-quarter operating income, operating ratio, earnings and EPS |
| • | Quarterly dividend increases 7 percent to $0.15 per share |
| • | New share buyback program targets $1 billion over 24 months |
JACKSONVILLE, Fla. - April 16, 2013 - CSX Corporation (NYSE: CSX) today announced first-quarter net earnings of $459 million, or $0.45 per share, versus $449 million, or $0.43 per share, in the same period last year.
“CSX continues to create value by supporting its customers with high levels of service in an economy that is still gradually recovering,” said Michael J. Ward, chairman, president and chief executive officer. “At the same time, we are prepared for the economy to accelerate and have great confidence in the long-term outlook for the business.”
Revenue in the quarter was nearly $3.0 billion, essentially flat from the year before, as gains in merchandise, intermodal and other revenue offset declines in the company's coal business.
These revenues, combined with strength in operations, drove first-quarter operating income of $875 million, and an operating ratio of 70.4 percent. These results were achieved with industry-leading safety levels.
In addition to its quarterly results, CSX announced that its Board of Directors has approved a 7 percent increase in the quarterly dividend on the company's common stock, and a new $1.0 billion share buyback program.
“These actions reflect the strength of CSX's core earning power and its confidence in the future,” said Ward. “They build upon the $2.3 billion of investment CSX is making this year to meet the nation's future transportation needs and drive long-term shareholder value.”
Since 2005, CSX has invested $14.2 billion in its business, increased its quarterly cash dividend 11 times representing a 29 percent compounded annual growth rate (including the dividend increase announced today), and repurchased $8.0 billion worth of shares. These actions reflect the company's ongoing commitment to deploy cash in a balanced framework to drive near- and long-term value.
The new quarterly dividend of $0.15 is payable on June 14, 2013 to shareholders of record at the close of business on May 31, 2013. The new share buyback program is authorized to begin immediately, and it is expected to be completed over the next 24 months. Under the buyback program, the company may purchase shares from time to time on the open market, through block trading or otherwise. The company expects to fund the repurchase program primarily through excess cash and free cash flow as the company continues to target an improving credit profile.
| Table of Contents | The accompanying unaudited | CSX CORPORATION | CONTACTS: |
| financial information should be | 500 Water Street, C900 | ||
| read in conjunction with the | Jacksonville, FL 32202 | INVESTOR RELATIONS | |
| Company’s most recent | www.csx.com | David Baggs | |
| Annual Report on Form 10-K, | (904) 359-4812 | ||
| Quarterly Reports on Form | MEDIA | ||
| 10-Q, and any Current | Lauren Rueger | ||
| Reports on Form 8-K. | (877) 835-5279 | ||
1
Consistent with its current view of the economy, the changing coal market, and its proven ability to withstand a range of business conditions, CSX said that it now expects to achieve an operating ratio in the high 60s by 2015, while remaining focused on attaining a mid-60s operating ratio longer-term. At the same time, the company expects to produce average annual earnings-per-share growth of 10-15 percent through 2015 off of the 2013 base, which is expected to be flat to down from prior-year levels.
CSX executives will conduct a quarterly earnings conference call with the investment community on April 17, 2013, at 8:30 a.m. Eastern time. Investors, media and the public may listen to the conference call by dialing 1-888-327-6279 (888-EARN-CSX) and asking for the CSX earnings call. (Callers outside the U.S., dial 1-773-756-0199). Participants should dial in 10 minutes prior to the call. In conjunction with the call, a live webcast will be accessible and presentation materials will be posted on the company's website at http:// investors.csx.com. Following the earnings call, an internet replay of the presentation will be archived on the company website.
CSX, based in Jacksonville, Florida, is a premier transportation company. It provides rail, intermodal and rail-to-truck transload services and solutions to customers across a broad array of markets, including energy, industrial, construction, agricultural, and consumer products. For more than 185 years, CSX has played a critical role in the nation's economic expansion and industrial development. Its network connects every major metropolitan area in the eastern United States, where nearly two-thirds of the nation's population resides. It also links more than 240 short-line railroads and more than 70 ocean, river and lake ports with major population centers and small farming towns alike. More information about CSX Corporation and its subsidiaries is available at www.csx.com. Like us on Facebook (http://www.facebook.com/OfficialCSX) and follow us on Twitter (http://twitter.com/CSX).
Forward-looking Statements
This information and other statements by the company may contain forward-looking statements within the meaning of the Private Securities Litigation Reform Act with respect to, among other items: projections and estimates of earnings, revenues, margins, volumes, rates, cost-savings, expenses, taxes, liquidity, capital expenditures, dividends, share repurchases or other financial items, statements of management's plans, strategies and objectives for future operations, and management's expectations as to future performance and operations and the time by which objectives will be achieved, statements concerning proposed new services, and statements regarding future economic, industry or market conditions or performance. Forward-looking statements are typically identified by words or phrases such as “will,” “should,” “believe,” “expect,” “anticipate,” “project,” “estimate,” “preliminary” and similar expressions. Forward-looking statements speak only as of the date they are made, and the company undertakes no obligation to update or revise any forward-looking statement. If the company updates any forward-looking statement, no inference should be drawn that the company will make additional updates with respect to that statement or any other forward-looking statements.
Forward-looking statements are subject to a number of risks and uncertainties, and actual performance or results could differ materially from that anticipated by any forward-looking statements. Factors that may cause actual results to differ materially from those contemplated by any forward- looking statements include, among others; (i) the company's success in implementing its financial and operational initiatives; (ii) changes in domestic or international economic, political or business conditions, including those affecting the transportation industry (such as the impact of industry competition, conditions, performance and consolidation); (iii) legislative or regulatory changes; (iv) the inherent business risks associated with safety and security; (v) the outcome of claims and litigation involving or affecting the company; (vi) natural events such as severe weather conditions or pandemic health crises; and (vii) the inherent uncertainty associated with projecting economic and business conditions.
Other important assumptions and factors that could cause actual results to differ materially from those in the forward-looking statements are specified in the company's SEC reports, accessible on the SEC's website at www.sec.gov and the company's website at www.csx.com.
2
CSX Corporation
CONSOLIDATED INCOME STATEMENTS (Unaudited)
(Dollars in millions, except per share amounts)
| Quarters Ended | |||||||||||
| Mar. 29, 2013 | Mar. 30, 2012 | $ Change | % Change | ||||||||
| Revenue | $ | 2,958 | $ | 2,966 | $ | (8 | ) | — | % | ||
| Expense | |||||||||||
| Labor and Fringe | 767 | 770 | 3 | — | |||||||
| Materials, Supplies and Other | 507 | 542 | 35 | 6 | |||||||
| Fuel | 444 | 444 | — | — | |||||||
| Depreciation | 270 | 257 | (13 | ) | (5 | ) | |||||
| Equipment and Other Rents | 95 | 97 | 2 | 2 | |||||||
| Total Expense | 2,083 | 2,110 | 27 | 1 | |||||||
| Operating Income | 875 | 856 | 19 | 2 | |||||||
| Interest Expense | (147 | ) | (144 | ) | (3 | ) | (2 | ) | |||
| Other (Expense) Income - Net | (3 | ) | 4 | (7 | ) | (175 | ) | ||||
| Earnings Before Income Taxes | 725 | 716 | 9 | 1 | |||||||
| Income Tax Expense | (266 | ) | (267 | ) | 1 | — | |||||
| Net Earnings | $ | 459 | $ | 449 | $ | 10 | 2 | % | |||
| Operating Ratio | 70.4 | % | 71.1 | % | |||||||
| Per Common Share | |||||||||||
| Net Earnings Per Share, Assuming Dilution | $ | 0.45 | $ | 0.43 | $ | 0.02 | 5 | % | |||
Average Shares Outstanding, Assuming Dilution (millions) | 1,023 | 1,049 | |||||||||
| Cash Dividends Paid Per Common Share | $ | 0.14 | $ | 0.12 | |||||||
3
CSX Corporation
CONDENSED CONSOLIDATED BALANCE SHEETS
(Dollars in millions)
| (Unaudited) | ||||||
| Mar. 29, 2013 | Dec. 28, 2012 | |||||
| ASSETS | ||||||
| Cash, Cash Equivalents and Short-term Investments | $ | 1,072 | $ | 1,371 | ||
| Other Current Assets | 1,495 | 1,430 | ||||
| Properties - Net | 26,288 | 26,050 | ||||
| Investment in Affiliates and Other Companies | 1,215 | 1,206 | ||||
| Other Long-term Assets | 516 | 514 | ||||
| Total Assets | $ | 30,586 | $ | 30,571 | ||
| LIABILITIES AND SHAREHOLDERS' EQUITY | ||||||
| Current Maturities of Long-term Debt | $ | 572 | $ | 780 | ||
| Other Current Liabilities | 1,902 | 1,847 | ||||
| Long-term Debt | 8,846 | 9,052 | ||||
| Deferred Income Taxes | 8,202 | 8,096 | ||||
| Other Long-term Liabilities | 1,716 | 1,794 | ||||
| Total Liabilities | 21,238 | 21,569 | ||||
| Total Shareholders' Equity | 9,348 | 9,002 | ||||
| Total Liabilities and Shareholders' Equity | $ | 30,586 | $ | 30,571 | ||
4
CSX Corporation
CONDENSED CONSOLIDATED CASH FLOW STATEMENTS (Unaudited)
(Dollars in millions)
| Quarters Ended | ||||||
| Mar. 29, 2013 | Mar. 30, 2012 | |||||
| OPERATING ACTIVITIES | ||||||
| Net Earnings | $ | 459 | $ | 449 | ||
| Depreciation | 270 | 257 | ||||
| Deferred Income Taxes | 82 | 195 | ||||
| Contributions to Qualified Pension Plans | — | (275 | ) | |||
| Gain on Property Dispositions | (30 | ) | (19 | ) | ||
| Other Operating Activities - Net | (50 | ) | (163 | ) | ||
| Net Cash Provided by Operating Activities | 731 | 444 | ||||
| INVESTING ACTIVITIES | ||||||
| Property Additions | (491 | ) | (469 | ) | ||
| Purchase of Short-term Investments | (290 | ) | (53 | ) | ||
| Proceeds from Sales of Short-term Investments | 534 | 437 | ||||
| Other Investing Activities | (18 | ) | 8 | |||
| Net Cash Used in Investing Activities | (265 | ) | (77 | ) | ||
| FINANCING ACTIVITIES | ||||||
| Long-term Debt Issued | — | 300 | ||||
| Long-term Debt Repaid | (413 | ) | (413 | ) | ||
| Dividends Paid | (143 | ) | (125 | ) | ||
| Shares Repurchased | — | (300 | ) | |||
| Other Financing Activities - Net | 11 | 15 | ||||
| Net Cash Used in Financing Activities | (545 | ) | (523 | ) | ||
| Net Decrease in Cash and Cash Equivalents | (79 | ) | (156 | ) | ||
| CASH AND CASH EQUIVALENTS | ||||||
| Cash and Cash Equivalents at Beginning of Period | 784 | 783 | ||||
| Cash and Cash Equivalents at End of Period | $ | 705 | $ | 627 | ||
Certain prior year data has been reclassified to conform to the current presentation.
5
CSX Corporation
VOLUME AND REVENUE (Unaudited) | |||||||||||||||||||||||||||
| Volume (Thousands of units); Revenue (Dollars in millions); Revenue Per Unit (Dollars) | |||||||||||||||||||||||||||
| Quarters Ended March 29, 2013 and March 30, 2012 | |||||||||||||||||||||||||||
| Volume | Revenue | Revenue Per Unit | |||||||||||||||||||||||||
| 2013 | 2012 | % Change | 2013 | 2012 | % Change | 2013 | 2012 | % Change | |||||||||||||||||||
| Agricultural | |||||||||||||||||||||||||||
| Agricultural Products | 95 | 108 | (12 | )% | $ | 241 | $ | 275 | (12 | )% | $ | 2,537 | $ | 2,546 | — | % | |||||||||||
| Phosphates and Fertilizers | 84 | 80 | 5 | 144 | 131 | 10 | 1,714 | 1,638 | 6 | ||||||||||||||||||
| Food and Consumer | 24 | 25 | (3 | ) | 68 | 67 | 1 | 2,833 | 2,680 | 4 | |||||||||||||||||
| Industrial | |||||||||||||||||||||||||||
| Chemicals | 130 | 117 | 11 | 468 | 415 | 13 | 3,600 | 3,547 | 1 | ||||||||||||||||||
| Automotive | 105 | 105 | — | 293 | 281 | 4 | 2,790 | 2,676 | 4 | ||||||||||||||||||
| Metals | 66 | 72 | (8 | ) | 161 | 171 | (5 | ) | 2,439 | 2,375 | 3 | ||||||||||||||||
| Housing and Construction | |||||||||||||||||||||||||||
| Forest Products | 73 | 73 | 1 | 189 | 181 | 4 | 2,589 | 2,479 | 3 | ||||||||||||||||||
Minerals(a) | 57 | 57 | — | 96 | 94 | 2 | 1,684 | 1,649 | 2 | ||||||||||||||||||
Waste and Equipment(a) | 32 | 34 | (7 | ) | 57 | 60 | (5 | ) | 1,781 | 1,765 | 2 | ||||||||||||||||
| Total Merchandise | 666 | 671 | (1 | ) | 1,717 | 1,675 | 2 | 2,578 | 2,496 | 3 | |||||||||||||||||
| Coal | 297 | 331 | (10 | ) | 726 | 832 | (13 | ) | 2,444 | 2,514 | (3 | ) | |||||||||||||||
| Intermodal | 615 | 600 | 3 | 404 | 389 | 4 | 657 | 648 | 1 | ||||||||||||||||||
| Other | — | — | — | 111 | 70 | 60 | — | — | — | ||||||||||||||||||
| Total | 1,578 | 1,602 | (2 | )% | $ | 2,958 | $ | 2,966 | — | % | $ | 1,875 | $ | 1,851 | 1 | % | |||||||||||
(a) Prior periods have been reclassified to conform to current presentation.
6
CSX Corporation
VOLUME AND REVENUE
Volume declined 2% year-over-year as lower coal and agricultural products shipments were partially offset by growth in chemicals and intermodal volume. Pricing gains drove increases in revenue per unit in nearly all markets. As a result, total revenue was essentially flat year-over-year due to lower volume, offset by pricing gains, other revenue gains and higher fuel recoveries.
Merchandise
Agricultural
Agricultural Products - Volume decreased due to lower shipments of feed grain and ethanol. Shipments for animal feed declined due to low supplier inventories caused by last year's drought and increased competition from imports. Ethanol shipments were lower as a result of a continued reduction in gasoline demand in the U.S. and increased competition from imports.
Phosphates and Fertilizers - Volume increased as the reopening of a mine led to more short haul phosphate rock shipments to fertilizer production facilities. Fertilizer volume also grew as producers advanced shipments of fertilizer in anticipation of an expected increase in application by farms.
Food and Consumer - Volume declined due to a reduction in alcoholic beverage shipments. This reduction was primarily driven by consolidation within a customer's distribution network that resulted in lower shipments for CSX.
Industrial
Chemicals - Volume growth was driven by an increase in energy-related markets that include crude oil, liquefied petroleum gas (LPG) and frac sand. The rise in crude oil shipments was due to increased supply of low-cost crude from shale drilling activity, resulting in new shipments to east coast refineries.
Automotive - Although North American light vehicle production was flat, vehicle shipments increased due to the restart of a production facility. This increase was offset by competitive losses in the automotive parts business.
Metals - Volume decreased due to lower shipments of scrap metals and sheet steel. The decline in scrap metals was driven by lower global demand for domestic steel production and exported scrap metals, while sheet steel was negatively impacted by a source shift and competitive losses.
Housing and Construction
Forest Products - Volume was flat due to an increase in building products which was offset by the decline in paper shipments. The recovery of the residential housing market increased the demand for building products, while electronic substitution of print media continues to drive contraction in the paper market.
Minerals - Volume was flat year-over-year as growth in salt shipments and aggregates (which include crushed stone, sand and gravel) was offset by a reduction in cement shipments. Salt shipments grew as a more severe winter resulted in increased application of salt to roads, and aggregates increased from the continued recovery in construction activity. Cement volume declined due to source shifts and a plant closure.
Waste and Equipment - Volume decreased in equipment primarily due to the cycling of the prior year surge in moves of third-party coal cars into storage as a result of coal market declines. This decrease was partially offset by growth in waste shipments due to continued clean-up efforts from Superstorm Sandy.
Coal
Shipments of domestic coal declined due to utility stockpiles above target levels and low natural gas prices. Export declines were driven by decreased shipments of U.S. thermal coal primarily to Europe where demand for electrical generation declined due to the overall softening of the economy.
Intermodal
Domestic volume was driven by highway-to-rail conversions, expanded service offerings and growth with existing customers. International volume was flat as new services were offset by recent carrier port shifts.
Other
Other revenue increased primarily due to higher revenue of $32 million from customers who did not meet minimum contractual volumes.
7
CSX Corporation
EXPENSE
Expenses in the first quarter 2013 decreased $27 million from the prior year's first quarter. Significant variances are described below.
Labor and Fringe expense decreased $3 million due to the following:
| • | Efficiency and volume-related labor costs decreased $20 million due to the year-over-year improvement in crew starts and overtime, as well as training and other labor savings. |
| • | Wage expense increased $13 million as a result of inflation. |
| • | Various other costs increased $4 million during the quarter. |
Materials, Supplies and Other expense decreased $35 million due to the following:
| • | Deferred gains increased year-over-year by $30 million. During the quarter, a deferred gain of $20 million was recognized due to a closure arrangement reached during the quarter related to a prior conveyance of a formerly-owned company. Additionally, the recognition of the deferred gain from the 2011 sale of an operating rail corridor to the state of Florida increased $10 million year-over-year. |
| • | Efficiency and volume-related expenses decreased $22 million primarily related to lower material and repair costs due to the reduction of active locomotives and other savings. |
| • | Inflation-related expenses increased $11 million. |
| • | Various other costs increased $6 million. |
Fuel expense remained flat primarily as volume and efficiency offset the 3% increase in the average price per gallon for locomotive fuel. (See Fuel Statistics table below)
Depreciation expense increased $13 million due to larger asset base.
| FUEL STATISTICS | ||||||||||
| Quarters Ended | ||||||||||
| Mar. 29, 2013 | Mar. 30, 2012 | Change | ||||||||
Estimated Locomotive Fuel Consumption (Millions of gallons) | 125.3 | 130.0 | 4.7 | |||||||
Price per Gallon (Dollars) | $ | 3.26 | $ | 3.15 | $ | (0.11 | ) | |||
Total Locomotive Fuel Expense (Dollars in millions) | $ | 408 | $ | 409 | $ | 1 | ||||
Total Non-Locomotive Fuel Expense (Dollars in millions) | 36 | 35 | (1 | ) | ||||||
Total Fuel Expense (Dollars in millions) | $ | 444 | $ | 444 | $ | — | ||||
EMPLOYEE COUNTS (Estimated) | ||||||||
| 2013 | 2012 | Change | ||||||
| January | 31,043 | 32,318 | (1,275 | ) | ||||
| February | 31,058 | 32,423 | (1,365 | ) | ||||
| March | 30,928 | 32,437 | (1,509 | ) | ||||
Average(a) | 31,010 | 32,393 | (1,383 | ) | ||||
(a) Average headcount includes employees who are on a furlough retention board which means that they are guaranteed two days of service per week as well as full health and welfare benefits in exchange for remaining available to work when needed. The average employees with this status was 286 for the first quarter 2013 versus 130 employees for the first quarter last year. These boards are different than a traditional furlough where an employee does not receive guaranteed minimum weekly service and forfeits health and welfare benefits after a defined period of time without service.
8
CSX Corporation
OPERATING STATISTICS (Estimated)
| Quarters Ended | |||||||
| Mar. 29, 2013 | Mar. 30, 2012 | Improvement (Decline) % | |||||
Coal (Millions of Tons) | |||||||
| Domestic | |||||||
| Utility | 16.2 | 18.8 | (14 | )% | |||
| Coke, Iron Ore and Other | 4.7 | 5.7 | (18 | ) | |||
| Total Domestic | 20.9 | 24.5 | (15 | ) | |||
| Export | |||||||
| Metallurgical | 7.0 | 6.3 | 11 | ||||
| Thermal | 5.3 | 6.2 | (15 | ) | |||
| Total Export | 12.3 | 12.5 | (2 | ) | |||
| Total Coal | 33.2 | 37.0 | (10 | )% | |||
Revenue Ton-Miles (Billions) | |||||||
| Merchandise | 33.5 | 33.8 | (1 | )% | |||
| Coal | 16.3 | 17.4 | (6 | ) | |||
| Intermodal | 5.9 | 5.8 | 2 | ||||
| Total | 55.7 | 57.0 | (2 | )% | |||
Gross Ton-Miles (Billions) | |||||||
| Total Gross Ton-Miles | 103.0 | 104.3 | (1 | )% | |||
| (Excludes locomotive gross ton-miles) | |||||||
| Safety and Service Measurements | |||||||
| FRA Personal Injury Frequency Index | 0.66 | 0.80 | 18 | % | |||
| (Number of FRA-reportable injuries per 200,000 man-hours) | |||||||
| FRA Train Accident Rate | 1.54 | 2.24 | 31 | % | |||
| (Number of FRA-reportable train accidents per million train miles) | |||||||
| On-Time Train Originations | 91 | % | 89 | % | 2 | % | |
| On-Time Destination Arrivals | 85 | % | 77 | % | 10 | % | |
Dwell (Hours) | 22.2 | 24.0 | 8 | % | |||
| Cars-On-Line | 183,223 | 194,454 | 6 | % | |||
Train Velocity (Miles per hour) | 23.4 | 22.3 | 5 | % | |||
| Resources | Increase % | ||||||
| Route Miles | 20,752 | 20,823 | — | % | |||
Locomotives (Owned and long-term leased) | 4,192 | 4,128 | 2 | % | |||
Freight Cars (Owned and long-term leased) | 69,057 | 68,635 | 1 | % | |||
9
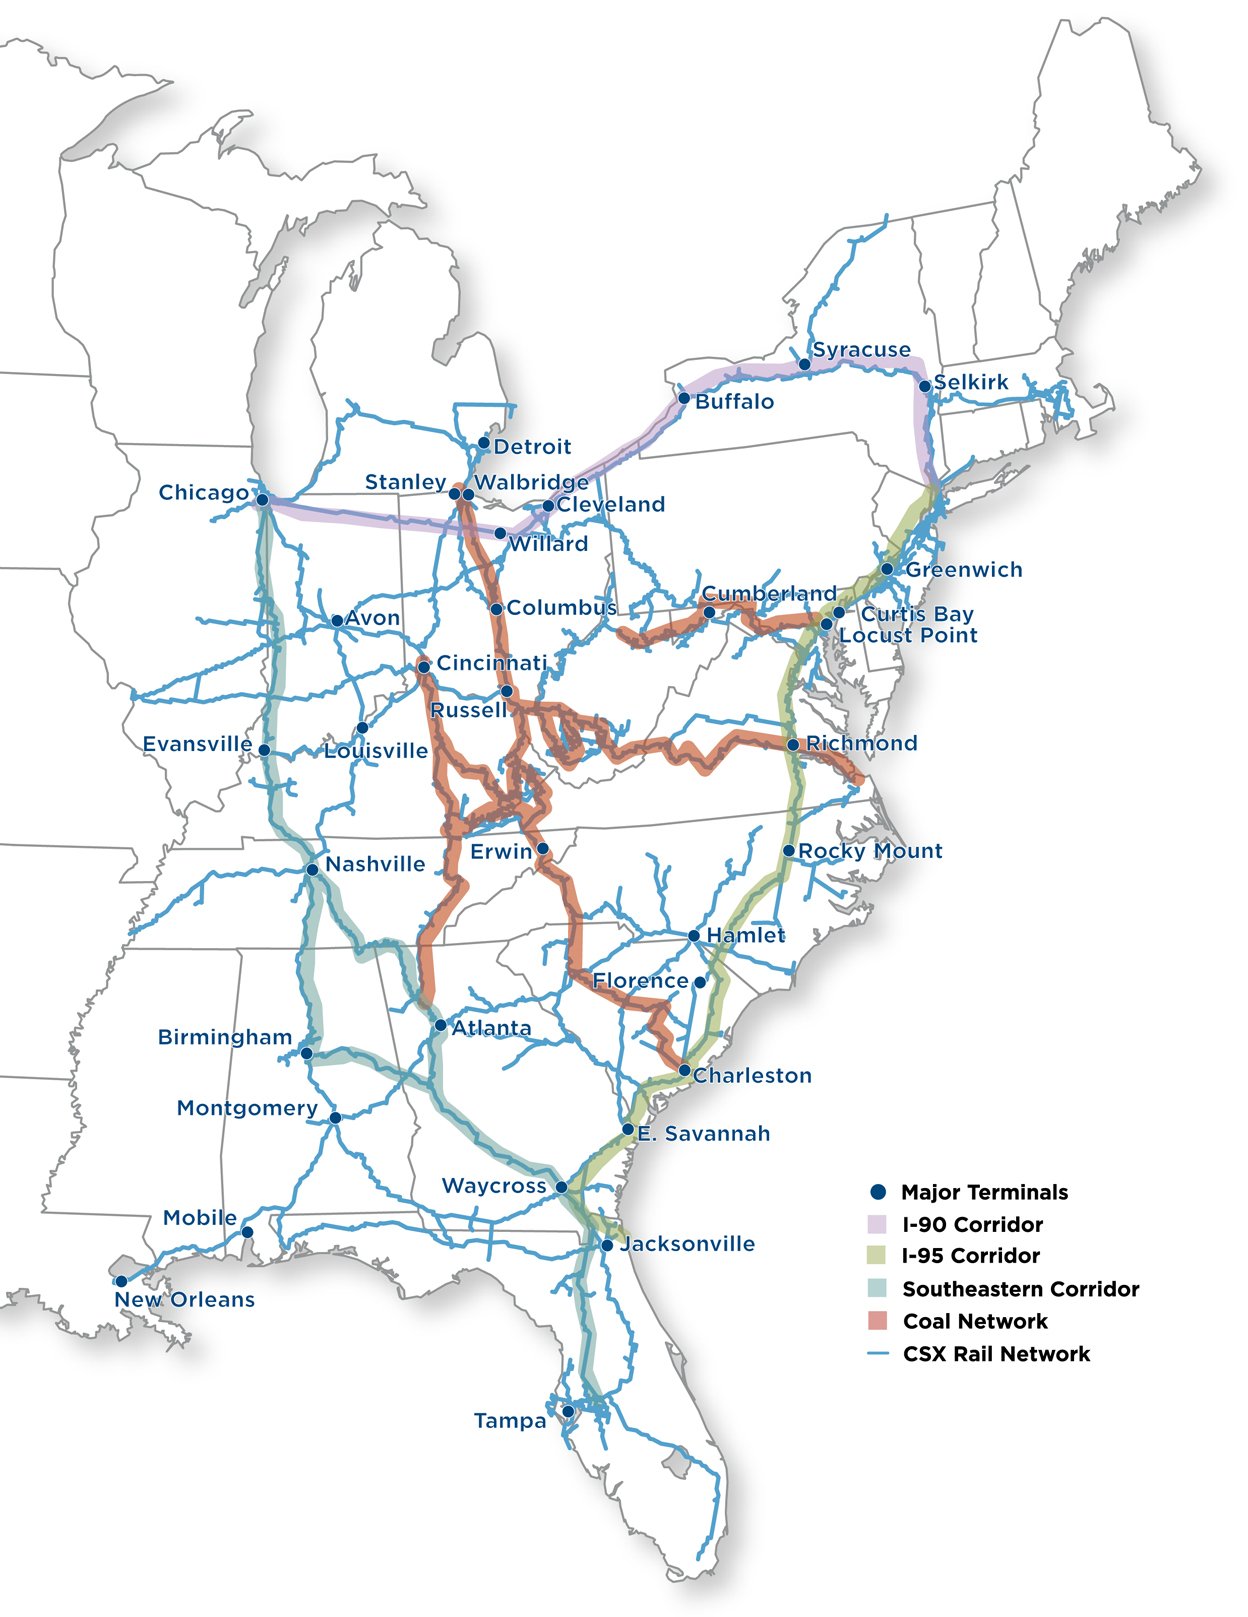
CSX Rail Network
10