Exhibit 99.2


CSX Corporation Announces First-Quarter Earnings, Dividend Increase and New Share Repurchase Program
Highlights:
| • | Double-digit growth in operating income, net earnings and earnings per share |
| • | Quarterly dividend increases 13 percent, effective in June |
| • | New $2 billion share repurchase program |
JACKSONVILLE, Fla. - April 14, 2015 - CSX Corporation (NYSE: CSX) today announced first-quarter 2015 net earnings of $442 million, an 11 percent increase from $398 million in the same period last year. The company also generated earnings per share of $0.45, a 13 percent increase from $0.40 per share in the first quarter of 2014.
Revenue in the quarter was $3.0 billion, driven by growth across many of CSX’s markets and an improved pricing environment, partially offset by the impact of low natural gas prices, lower fuel recoveries and the strong U.S. dollar. At the same time, the benefit of lower fuel prices and cost-saving initiatives more than offset higher inflation and volume-related costs in the quarter. As a result, operating income increased by 14 percent to $843 million and the operating ratio improved 330 basis points to 72.2 percent.
“In this dynamic economic and business environment, CSX’s core earnings remain strong and we are continuing our drive to provide excellent service for our customers and value for our shareholders,” said Michael J. Ward, chairman and chief executive officer. “Our commitment and confidence in CSX’s future is underscored by the positive shareholder actions we’re taking today.”
The CSX Board of Directors has approved an increase in the quarterly dividend and a new share repurchase program. The 13 percent increase in the dividend, to $0.18 per share, is payable on June 15, 2015 to shareholders of record at the close of business on May 29, 2015. This is the 13th increase in 10 years, representing a 26 percent compound annual growth rate during that time. The new, $2 billion share repurchase program is expected to be completed over the next 24 months. This follows the successful completion of CSX’s previous repurchase plan, during which the company bought back $1 billion worth of shares. Since 2006, CSX has repurchased nearly $9 billion in shares.
CSX executives will conduct a quarterly earnings conference call with the investment community on April 15, 2015, at 8:30 a.m. Eastern time. Investors, media and the public may listen to the conference call by dialing 1-888-EARN-CSX (888-327-6279) and asking for the CSX earnings call. Callers outside the U.S., dial 1-773-756-0199. Participants should dial in 10 minutes prior to the call. In conjunction with the call, a live webcast will be accessible and presentation materials will be posted on the company's website at http://investors.csx.com. Following the earnings call, an internet replay of the presentation will be archived on the company website.
This earnings announcement, as well as additional detailed financial information, is contained in the CSX Quarterly Financial Report available through the company’s website at http://investors.csx.com and on Form 8-K with the Securities and Exchange Commission.
| Table of Contents | The accompanying unaudited | CSX CORPORATION | CONTACTS: |
| financial information should be | 500 Water Street, C900 | ||
| read in conjunction with the | Jacksonville, FL 32202 | INVESTOR RELATIONS | |
| Company’s most recent | www.csx.com | David Baggs | |
| Annual Report on Form 10-K, | (904) 359-4812 | ||
| Quarterly Reports on Form | MEDIA | ||
| 10-Q, and any Current | Melanie Cost | ||
| Reports on Form 8-K. | (904) 359-1702 | ||
1
About CSX and its Disclosures
CSX, based in Jacksonville, Florida, is a premier transportation company. It provides rail, intermodal and rail-to-truck transload services and solutions to customers across a broad array of markets, including energy, industrial, construction, agricultural, and consumer products. For nearly 190 years, CSX has played a critical role in the nation's economic expansion and industrial development. Its network connects every major metropolitan area in the eastern United States, where nearly two-thirds of the nation's population resides. It also links more than 240 short-line railroads and more than 70 ocean, river and lake ports with major population centers and farming towns alike.
This announcement, as well as additional financial information, is available on the company's website at http://investors.csx.com. CSX also uses social media channels to communicate information about the company. Although social media channels are not intended to be the primary method of disclosure for material information, it is possible that certain information CSX posts on social media could be deemed to be material.
Therefore, we encourage investors, the media, and others interested in the company to review the information we post on Twitter (http://twitter.com/CSX) and on Slideshare (http://www.slideshare.net/HowTomorrowMoves). The social media channels used by CSX may be updated from time to time.
More information about CSX Corporation and its subsidiaries is available at www.csx.com and on Facebook (http://www.facebook.com/OfficialCSX).
Forward-looking Statements
This information and other statements by the company may contain forward-looking statements within the meaning of the Private Securities Litigation Reform Act with respect to, among other items: projections and estimates of earnings, revenues, margins, volumes, rates, cost-savings, expenses, taxes, liquidity, capital expenditures, dividends, share repurchases or other financial items, statements of management's plans, strategies and objectives for future operations, and management's expectations as to future performance and operations and the time by which objectives will be achieved, statements concerning proposed new services, and statements regarding future economic, industry or market conditions or performance. Forward-looking statements are typically identified by words or phrases such as “will,” “should,” “believe,” “expect,” “anticipate,” “project,” “estimate,” “preliminary” and similar expressions. Forward-looking statements speak only as of the date they are made, and the company undertakes no obligation to update or revise any forward-looking statement. If the company updates any forward-looking statement, no inference should be drawn that the company will make additional updates with respect to that statement or any other forward-looking statements.
Forward-looking statements are subject to a number of risks and uncertainties, and actual performance or results could differ materially from that anticipated by any forward-looking statements. Factors that may cause actual results to differ materially from those contemplated by any forward- looking statements include, among others; (i) the company's success in implementing its financial and operational initiatives; (ii) changes in domestic or international economic, political or business conditions, including those affecting the transportation industry (such as the impact of industry competition, conditions, performance and consolidation); (iii) legislative or regulatory changes; (iv) the inherent business risks associated with safety and security; (v) the outcome of claims and litigation involving or affecting the company; (vi) natural events such as severe weather conditions or pandemic health crises; and (vii) the inherent uncertainty associated with projecting economic and business conditions.
Other important assumptions and factors that could cause actual results to differ materially from those in the forward-looking statements are specified in the company's SEC reports, accessible on the SEC's website at www.sec.gov and the company's website at www.csx.com.
2
CSX Corporation
CONSOLIDATED INCOME STATEMENTS (Unaudited)
(Dollars in millions, except per share amounts)
| Quarters Ended | |||||||||||
| Mar. 27, 2015 | Mar. 28, 2014 | $ Change | % Change | ||||||||
| Revenue | $ | 3,027 | $ | 3,012 | $ | 15 | — | % | |||
| Expense | |||||||||||
| Labor and Fringe | 879 | 814 | (65 | ) | (8 | ) | |||||
| Materials, Supplies and Other | 627 | 629 | 2 | — | |||||||
| Fuel | 270 | 446 | 176 | 39 | |||||||
| Depreciation | 295 | 283 | (12 | ) | (4 | ) | |||||
| Equipment and Other Rents | 113 | 101 | (12 | ) | (12 | ) | |||||
| Total Expense | 2,184 | 2,273 | 89 | 4 | |||||||
| Operating Income | 843 | 739 | 104 | 14 | |||||||
| Interest Expense | (134 | ) | (140 | ) | 6 | 4 | |||||
| Other Income - Net | 2 | 7 | (5 | ) | — | ||||||
| Earnings Before Income Taxes | 711 | 606 | 105 | 17 | |||||||
| Income Tax Expense | (269 | ) | (208 | ) | (61 | ) | (29 | ) | |||
| Net Earnings | $ | 442 | $ | 398 | $ | 44 | 11 | % | |||
| Operating Ratio | 72.2 | % | 75.5 | % | |||||||
| Per Common Share | |||||||||||
| Net Earnings Per Share, Assuming Dilution | $ | 0.45 | $ | 0.40 | $ | 0.05 | 13 | % | |||
Average Shares Outstanding, Assuming Dilution (millions) | 992 | 1,008 | |||||||||
| Cash Dividends Paid Per Common Share | $ | 0.16 | $ | 0.15 | |||||||
3
CSX Corporation
CONDENSED CONSOLIDATED BALANCE SHEETS
(Dollars in millions)
| (Unaudited) | ||||||
| Mar. 27, 2015 | Dec. 26, 2014 | |||||
| ASSETS | ||||||
| Cash and Cash Equivalents | $ | 561 | $ | 669 | ||
| Short-term Investments | 257 | 292 | ||||
| Other Current Assets | 1,639 | 1,611 | ||||
| Properties - Net | 28,872 | 28,584 | ||||
| Investment in Affiliates and Other Companies | 1,353 | 1,356 | ||||
| Other Long-term Assets | 479 | 541 | ||||
| Total Assets | $ | 33,161 | $ | 33,053 | ||
| LIABILITIES AND SHAREHOLDERS' EQUITY | ||||||
| Current Maturities of Long-term Debt | $ | 228 | $ | 228 | ||
| Other Current Liabilities | 1,810 | 1,879 | ||||
| Long-term Debt | 9,513 | 9,514 | ||||
| Deferred Income Taxes | 8,886 | 8,858 | ||||
| Other Long-term Liabilities | 1,386 | 1,398 | ||||
| Total Liabilities | 21,823 | 21,877 | ||||
| Total Shareholders' Equity | 11,338 | 11,176 | ||||
| Total Liabilities and Shareholders' Equity | $ | 33,161 | $ | 33,053 | ||
4
CSX Corporation
CONDENSED CONSOLIDATED CASH FLOW STATEMENTS (Unaudited)
(Dollars in millions)
| Quarters Ended | ||||||
| Mar. 27, 2015 | Mar. 28, 2014 | |||||
| OPERATING ACTIVITIES | ||||||
| Net Earnings | $ | 442 | $ | 398 | ||
| Depreciation | 295 | 283 | ||||
| Deferred Income Taxes | 6 | (1 | ) | |||
| Other Operating Activities - Net | (53 | ) | (81 | ) | ||
| Net Cash Provided by Operating Activities | 690 | 599 | ||||
| INVESTING ACTIVITIES | ||||||
| Property Additions | (598 | ) | (475 | ) | ||
| Purchase of Short-term Investments | (105 | ) | (165 | ) | ||
| Proceeds from Sales of Short-term Investments | 140 | 409 | ||||
| Other Investing Activities | 63 | 4 | ||||
| Net Cash Used in Investing Activities | (500 | ) | (227 | ) | ||
| FINANCING ACTIVITIES | ||||||
| Long-term Debt Repaid | — | (209 | ) | |||
| Dividends Paid | (158 | ) | (151 | ) | ||
Shares Repurchased (a) | (127 | ) | (127 | ) | ||
| Other Financing Activities - Net | (13 | ) | (2 | ) | ||
| Net Cash Used in Financing Activities | (298 | ) | (489 | ) | ||
| Net Decrease in Cash and Cash Equivalents | (108 | ) | (117 | ) | ||
| CASH AND CASH EQUIVALENTS | ||||||
| Cash and Cash Equivalents at Beginning of Period | 669 | 592 | ||||
| Cash and Cash Equivalents at End of Period | $ | 561 | $ | 475 | ||
| a) | Shares Repurchased: There were 4 million shares repurchased for $127 million and 5 million shares repurchased for $127 million during the first quarters of 2015 and 2014, respectively. On April 14, 2015, the Company announced a new $2 billion share repurchase program, which is expected to be completed over the next 24 months. |
5
CSX Corporation
VOLUME AND REVENUE (Unaudited) | |||||||||||||||||||||||||||
| Volume (Thousands of units); Revenue (Dollars in millions); Revenue Per Unit (Dollars) | |||||||||||||||||||||||||||
| Quarters Ended March 27, 2015 and March 28, 2014 | |||||||||||||||||||||||||||
| Volume | Revenue | Revenue Per Unit | |||||||||||||||||||||||||
| 2015 | 2014 | % Change | 2015 | 2014 | % Change | 2015 | 2014 | % Change | |||||||||||||||||||
| Agricultural | |||||||||||||||||||||||||||
| Agricultural Products | 109 | 106 | 3 | % | $ | 291 | $ | 284 | 2 | % | $ | 2,670 | $ | 2,679 | — | % | |||||||||||
| Phosphates and Fertilizers | 78 | 83 | (6 | ) | 136 | 134 | 1 | 1,744 | 1,614 | 8 | |||||||||||||||||
| Food and Consumer | 23 | 23 | — | 64 | 65 | (2 | ) | 2,783 | 2,826 | (2 | ) | ||||||||||||||||
| Industrial | |||||||||||||||||||||||||||
| Chemicals | 155 | 146 | 6 | 534 | 516 | 3 | 3,445 | 3,534 | (3 | ) | |||||||||||||||||
| Automotive | 101 | 98 | 3 | 267 | 275 | (3 | ) | 2,644 | 2,806 | (6 | ) | ||||||||||||||||
| Metals | 61 | 65 | (6 | ) | 154 | 165 | (7 | ) | 2,525 | 2,538 | (1 | ) | |||||||||||||||
| Housing and Construction | |||||||||||||||||||||||||||
| Forest Products | 73 | 74 | (1 | ) | 198 | 194 | 2 | 2,712 | 2,622 | 3 | |||||||||||||||||
| Minerals | 60 | 54 | 11 | 103 | 95 | 8 | 1,717 | 1,759 | (2 | ) | |||||||||||||||||
| Waste and Equipment | 31 | 31 | — | 62 | 59 | 5 | 2,000 | 1,903 | 5 | ||||||||||||||||||
| Total Merchandise | 691 | 680 | 2 | 1,809 | 1,787 | 1 | 2,618 | 2,628 | — | ||||||||||||||||||
| Coal | 289 | 293 | (1 | ) | 638 | 662 | (4 | ) | 2,208 | 2,259 | (2 | ) | |||||||||||||||
| Intermodal | 655 | 647 | 1 | 415 | 421 | (1 | ) | 634 | 651 | (3 | ) | ||||||||||||||||
| Other | — | — | — | 165 | 142 | 16 | — | — | — | ||||||||||||||||||
| Total | 1,635 | 1,620 | 1 | % | $ | 3,027 | $ | 3,012 | — | % | $ | 1,851 | $ | 1,859 | — | % | |||||||||||
6
CSX Corporation
VOLUME AND REVENUE
Revenue was slightly up by $15 million to $3.0 billion from the prior year's first quarter as volume growth, price gains and higher other revenue were mostly offset by lower fuel surcharge recoveries.
Same Store Sales Pricing Year-Over-Year Change | ||
| % Change | ||
| All-In | 1.6 | |
| Merchandise and Intermodal | 3.4 | |
Same store sales is defined as shipments with the same customer, commodity and car type, and the same origin and destination.
Revenue per unit was flat as pricing gains and positive mix in the quarter were offset by lower fuel recoveries. Same store sales increased as strong gains in merchandise and intermodal were partially offset by a decline in coal. Declines in coal pricing are due to continued rate pressure in the export markets and the impact of fixed/variable contracts in the domestic utility market.
MERCHANDISE
Agricultural Sector
| Volume (Thousands of units); Revenue (Dollars in millions); Revenue Per Unit (Dollars) | ||||||||||||||||||||||||
| Volume | Revenue | Revenue Per Unit | ||||||||||||||||||||||
| 2015 | 2014 | % Change | 2015 | 2014 | % Change | 2015 | 2014 | % Change | ||||||||||||||||
| 210 | 212 | (1 | ) | $ | 491 | $ | 483 | 2 | $ | 2,338 | $ | 2,278 | 3 | |||||||||||
% of Carloads
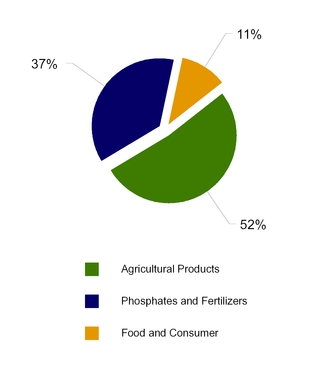
Agricultural Products - Volume growth was driven by increased feed grain shipments from a record harvest. Ethanol shipments also increased due to higher sourcing at CSX-served ethanol blending locations. Growth was partially offset by declines in the export market as a result of a strong harvest in South America and pressure from the strengthening U.S. dollar.
Phosphates and Fertilizers - Softer phosphate demand drove volume declines across both domestic and export markets. Key drivers of lower volumes include late winter weather which delayed domestic fertilizer application, along with high existing inventories and the strength of the U.S. dollar which pressured export markets.
Food and Consumer - Gains in frozen food shipments resulted from increased traffic which was rerouted to the east due to U.S. West Coast port disruptions. This increase was offset by a decline in the canned goods market due to a competitive shift.
7
CSX Corporation
Industrial Sector
Volume (Thousands of units); Revenue (Dollars in millions); Revenue Per Unit (Dollars) | |||||||||||||||||||||||||
| Volume | Revenue | Revenue Per Unit | |||||||||||||||||||||||
| 2015 | 2014 | % Change | 2015 | 2014 | % Change | 2015 | 2014 | % Change | |||||||||||||||||
| 317 | 309 | 3 | $ | 955 | $ | 956 | — | $ | 3,013 | $ | 3,094 | (3 | ) | ||||||||||||
% of Carloads
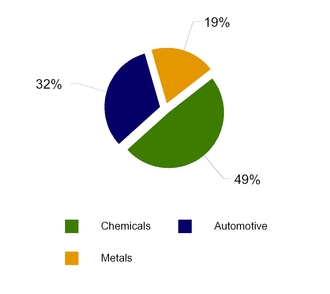
Chemicals - Volume growth was driven by the larger portfolio of energy-related shipments of crude oil, liquefied petroleum gases (LPG) and petroleum products versus first quarter last year. The growth was partially offset by a decline in frac sand, reflecting reduced drilling activity for natural gas this year.
Automotive - Finished vehicle volume grew as North American light vehicle production increased.
Metals - Volume declines reflect a challenged domestic scrap market due to the strong U.S. dollar, which has increased steel imports and decreased domestic steel production.
Housing and Construction Sector
| Volume (Thousands of units); Revenue (Dollars in millions); Revenue Per Unit (Dollars) | |||||||||||||||||||||||
| Volume | Revenue | Revenue Per Unit | |||||||||||||||||||||
| 2015 | 2014 | % Change | 2015 | 2014 | % Change | 2015 | 2014 | % Change | |||||||||||||||
| 164 | 159 | 3 | $ | 363 | $ | 348 | 4 | $ | 2,213 | $ | 2,189 | 1 | |||||||||||
% of Carloads

Forest Products - Volume decreased due to continued weakening demand for printing paper and newsprint in consumer behavior.
Minerals - Volume increased due to growth in aggregates (which includes crushed stone, sand and gravel) as a result of more infrastructure development projects in CSX's territory.
Waste and Equipment - Overall volume was flat as growth in municipal waste shipments in the northeast was offset by project delays in the equipment market.
8
CSX Corporation
COAL
| Volume (Thousands of units); Revenue (Dollars in millions); Revenue Per Unit (Dollars) | ||||||||||||||||||||||||||
| Volume | Revenue | Revenue Per Unit | ||||||||||||||||||||||||
| 2015 | 2014 | % Change | 2015 | 2014 | % Change | 2015 | 2014 | % Change | ||||||||||||||||||
| 289 | 293 | (1 | ) | $ | 638 | $ | 662 | (4 | ) | $ | 2,208 | $ | 2,259 | (2 | ) | |||||||||||
% of Tons
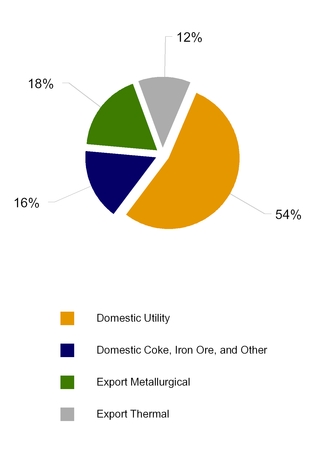
Domestic Utility Coal - Volume slightly decreased as a result of lower natural gas prices favoring increased natural gas power generation and higher overall coal stockpiles.
Domestic Coke, Iron Ore and Other - Volume increased as a result of iron ore shipments associated with a new customer facility and stronger river coal shipments this quarter.
Export Coal - Metallurgical and thermal coal volume was down as global market conditions continued to weaken due to global oversupply and the strength of the U.S. dollar.
| Quarters Ended | |||||||
| Mar. 27, 2015 | Mar. 28, 2014 | % Change | |||||
| (Millions of Tons) | |||||||
| Domestic | |||||||
| Utility | 17.6 | 17.7 | (1 | )% | |||
| Coke, Iron Ore and Other | 5.3 | 4.8 | 10 | ||||
| Total Domestic | 22.9 | 22.5 | 2 | ||||
| Export | |||||||
| Metallurgical | 5.8 | 6.2 | (6 | ) | |||
| Thermal | 4.0 | 4.3 | (7 | ) | |||
| Total Export | 9.8 | 10.5 | (7 | ) | |||
| Total Coal | 32.7 | 33.0 | (1 | )% | |||
9
CSX Corporation
INTERMODAL
| Volume (Thousands of units); Revenue (Dollars in millions); Revenue Per Unit (Dollars) | |||||||||||||||||||||||||
| Volume | Revenue | Revenue Per Unit | |||||||||||||||||||||||
| 2015 | 2014 | % Change | 2015 | 2014 | % Change | 2015 | 2014 | % Change | |||||||||||||||||
| 655 | 647 | 1 | $ | 415 | $ | 421 | (1 | ) | $ | 634 | $ | 651 | (3 | ) | |||||||||||
% of Units
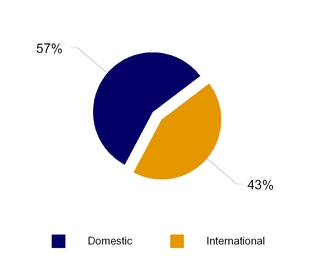
Domestic - Domestic volume increased nearly 9%, driven by continued success with CSX’s highway-to-rail (H2R) conversion program, growth with existing customers and new service offerings.
International - International volume declined 7% primarily as a result of U.S. West Coast port disruptions impacting global container shipments moving to inland destinations.
Intermodal Network
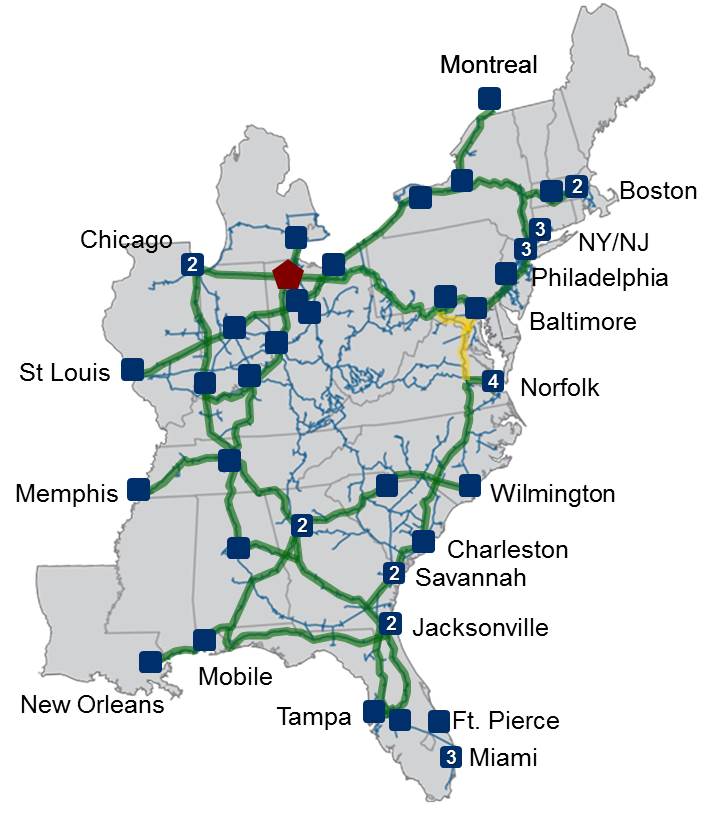

Note: Multiple terminals in a market are designated with a number
10
CSX Corporation
OTHER REVENUE
The increase in other revenue of $23 million is primarily related to revenue recognized from customers who did not meet minimum contractual volumes in the quarter of $105 million, compared to $55 million in the prior year. This increase was partially offset by adjustments to revenue reserves.
FUEL SURCHARGE
Fuel surcharge revenue is included in the individual markets detailed within the volume and revenue explanations above. Fuel lag is the difference between highway diesel prices in the quarter and the prices used for fuel surcharge, which are generally on a two month lag.
| Quarters Ended | |||||||||
| (Dollars in millions) | Mar. 27, 2015 | Mar. 28, 2014 | $ Change | ||||||
| Fuel Surcharge Revenue | $ | 191 | $ | 280 | $ | (89 | ) | ||
| Fuel Lag Benefit (Expense) | $ | 37 | $ | (9 | ) | $ | 46 | ||
11
CSX Corporation
EXPENSE
Expenses decreased 4% or $89 million from the prior year's first quarter. The decrease was primarily driven by lower fuel costs partially offset by higher labor and fringe expense. Variances are described below.
LABOR AND FRINGE

| • | Inflation resulted in $37 million of additional cost driven by union and management wages partially offset by reduced health and welfare costs. |
| • | Labor costs were $16 million higher due to an amended locomotive maintenance agreement in mid-2014 where CSX now provides oversight of the labor force. As a result, outside service costs shifted from materials, supplies and other to labor and fringe, but overall expense for this change is neutral for the quarter. |
| • | Volume-related costs were $12 million higher primarily to help serve customer demand. |
| • | Other costs were $12 million higher, which include such charges as the completion of the management workforce reduction program initiated during the fourth quarter 2014. |
| • | Efficiency savings of $12 million were due to less overtime across operating support functions and reduced management headcount. |
EMPLOYEE COUNTS (Estimated) | ||||||||
| 2015 | 2014 | Change | ||||||
| January | 32,048 | 31,410 | 638 | |||||
| February | 32,227 | 31,076 | 1,151 | |||||
| March | 32,315 | 31,040 | 1,275 | |||||
| Average | 32,197 | 31,175 | 1,022 | |||||
MATERIALS, SUPPLIES AND OTHER
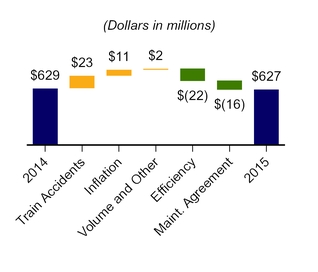
| • | Train accident costs increased $23 million during the quarter primarily driven by costs related to derailments, despite the improvement in the FRA train accident frequency rate. |
| • | Inflation resulted in $11 million of additional cost. |
| • | Volume-related and other costs rose $2 million primarily to help serve customer demand. |
| • | Efficiency savings of $22 million were driven by general and administrative cost savings initiatives as well as a reduction in weather-related costs and foreign locomotive usage versus the prior year. |
| • | The amended locomotive maintenance agreement shifted $16 million to labor and fringe as referenced above. |
12
CSX Corporation
FUEL
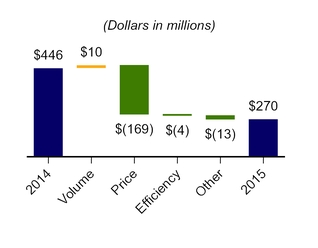
| • | Volume-related costs were $10 million higher. |
| • | Locomotive fuel price decreased 41% and reduced expense by $169 million. |
| • | Locomotive fuel reduction technology and improved processes helped drive $4 million of efficiency. |
| • | Other fuel savings of $13 million were primarily due to lower non-locomotive fuel costs. |
| Quarters Ended | ||||||||||
| (Dollars and Gallons In Millions, Except Price per Gallon) | Mar. 27, 2015 | Mar. 28, 2014 | Fav / (Unfav) | |||||||
Estimated Locomotive Fuel Consumption (Gallons) | 131.9 | 130.1 | (1.8 | ) | ||||||
Price per Gallon (Dollars) | $ | 1.86 | $ | 3.14 | $ | 1.28 | ||||
| Total Locomotive Fuel Expense | $ | 245 | $ | 408 | $ | 163 | ||||
| Other | 25 | 38 | 13 | |||||||
| Total Fuel Expense | $ | 270 | $ | 446 | $ | 176 | ||||
DEPRECIATION
Depreciation expense increased $12 million due to a larger asset base.
EQUIPMENT AND OTHER RENTS
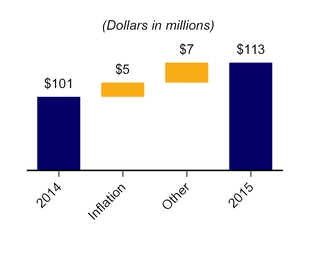
| • | Inflation resulted in $5 million additional cost related to rates on automotive and intermodal cars. |
| • | Other costs increased $7 million primarily due to higher locomotive leases. |
13
CSX Corporation
OPERATING STATISTICS (Estimated)
TON MILES
| Quarters Ended | |||||||
| Mar. 27, 2015 | Mar. 28, 2014 | Improvement / (Deterioration) | |||||
Revenue Ton-Miles (Billions) | |||||||
| Merchandise | 35.9 | 35.3 | 2 | % | |||
| Coal | 16.1 | 16.3 | (1 | ) | |||
| Intermodal | 6.7 | 6.4 | 5 | ||||
| Total | 58.7 | 58.0 | 1 | % | |||
Gross Ton-Miles (Billions) | |||||||
| Total Gross Ton-Miles | 107.1 | 104.8 | 2 | % | |||
| (Excludes locomotive gross ton-miles) | |||||||
SAFETY AND SERVICE
The FRA reportable personal injury frequency index improved 19 percent year over year to 0.79, and the reported FRA train accident frequency rate improved 34 percent to 1.77. These results highlight the company’s commitment to safety especially while working under challenging operating conditions.
CSX’s operations were stable in the quarter and the company expects service improvement through strategic infrastructure investments, as well as additional locomotives coming online. While on-time originations decreased year over year to 50 percent and on-time arrivals declined to 41 percent, both were relatively consistent with fourth quarter levels. Average train velocity was 20.2 miles per hour, and dwell was 27.7 hours, both unfavorable year-over-year, but stable sequentially.
| Quarters Ended | |||||||
| Mar. 27, 2015 | Mar. 28, 2014 | Improvement / (Deterioration) | |||||
| Safety and Service Measurements | |||||||
| FRA Personal Injury Frequency Index | 0.79 | 0.97 | 19 | % | |||
| (Number of FRA-reportable injuries per 200,000 man-hours) | |||||||
| FRA Train Accident Rate | 1.77 | 2.68 | 34 | % | |||
| (Number of FRA-reportable train accidents per million train miles) | |||||||
| On-Time Originations | 50 | % | 63 | % | (21 | )% | |
| On-Time Arrivals | 41 | % | 51 | % | (20 | )% | |
Train Velocity (Miles per hour) | 20.2 | 20.6 | (2 | )% | |||
Dwell (Hours) | 27.7 | 26.8 | (3 | )% | |||
| Cars-On-Line | 208,959 | 202,319 | (3 | )% | |||
14
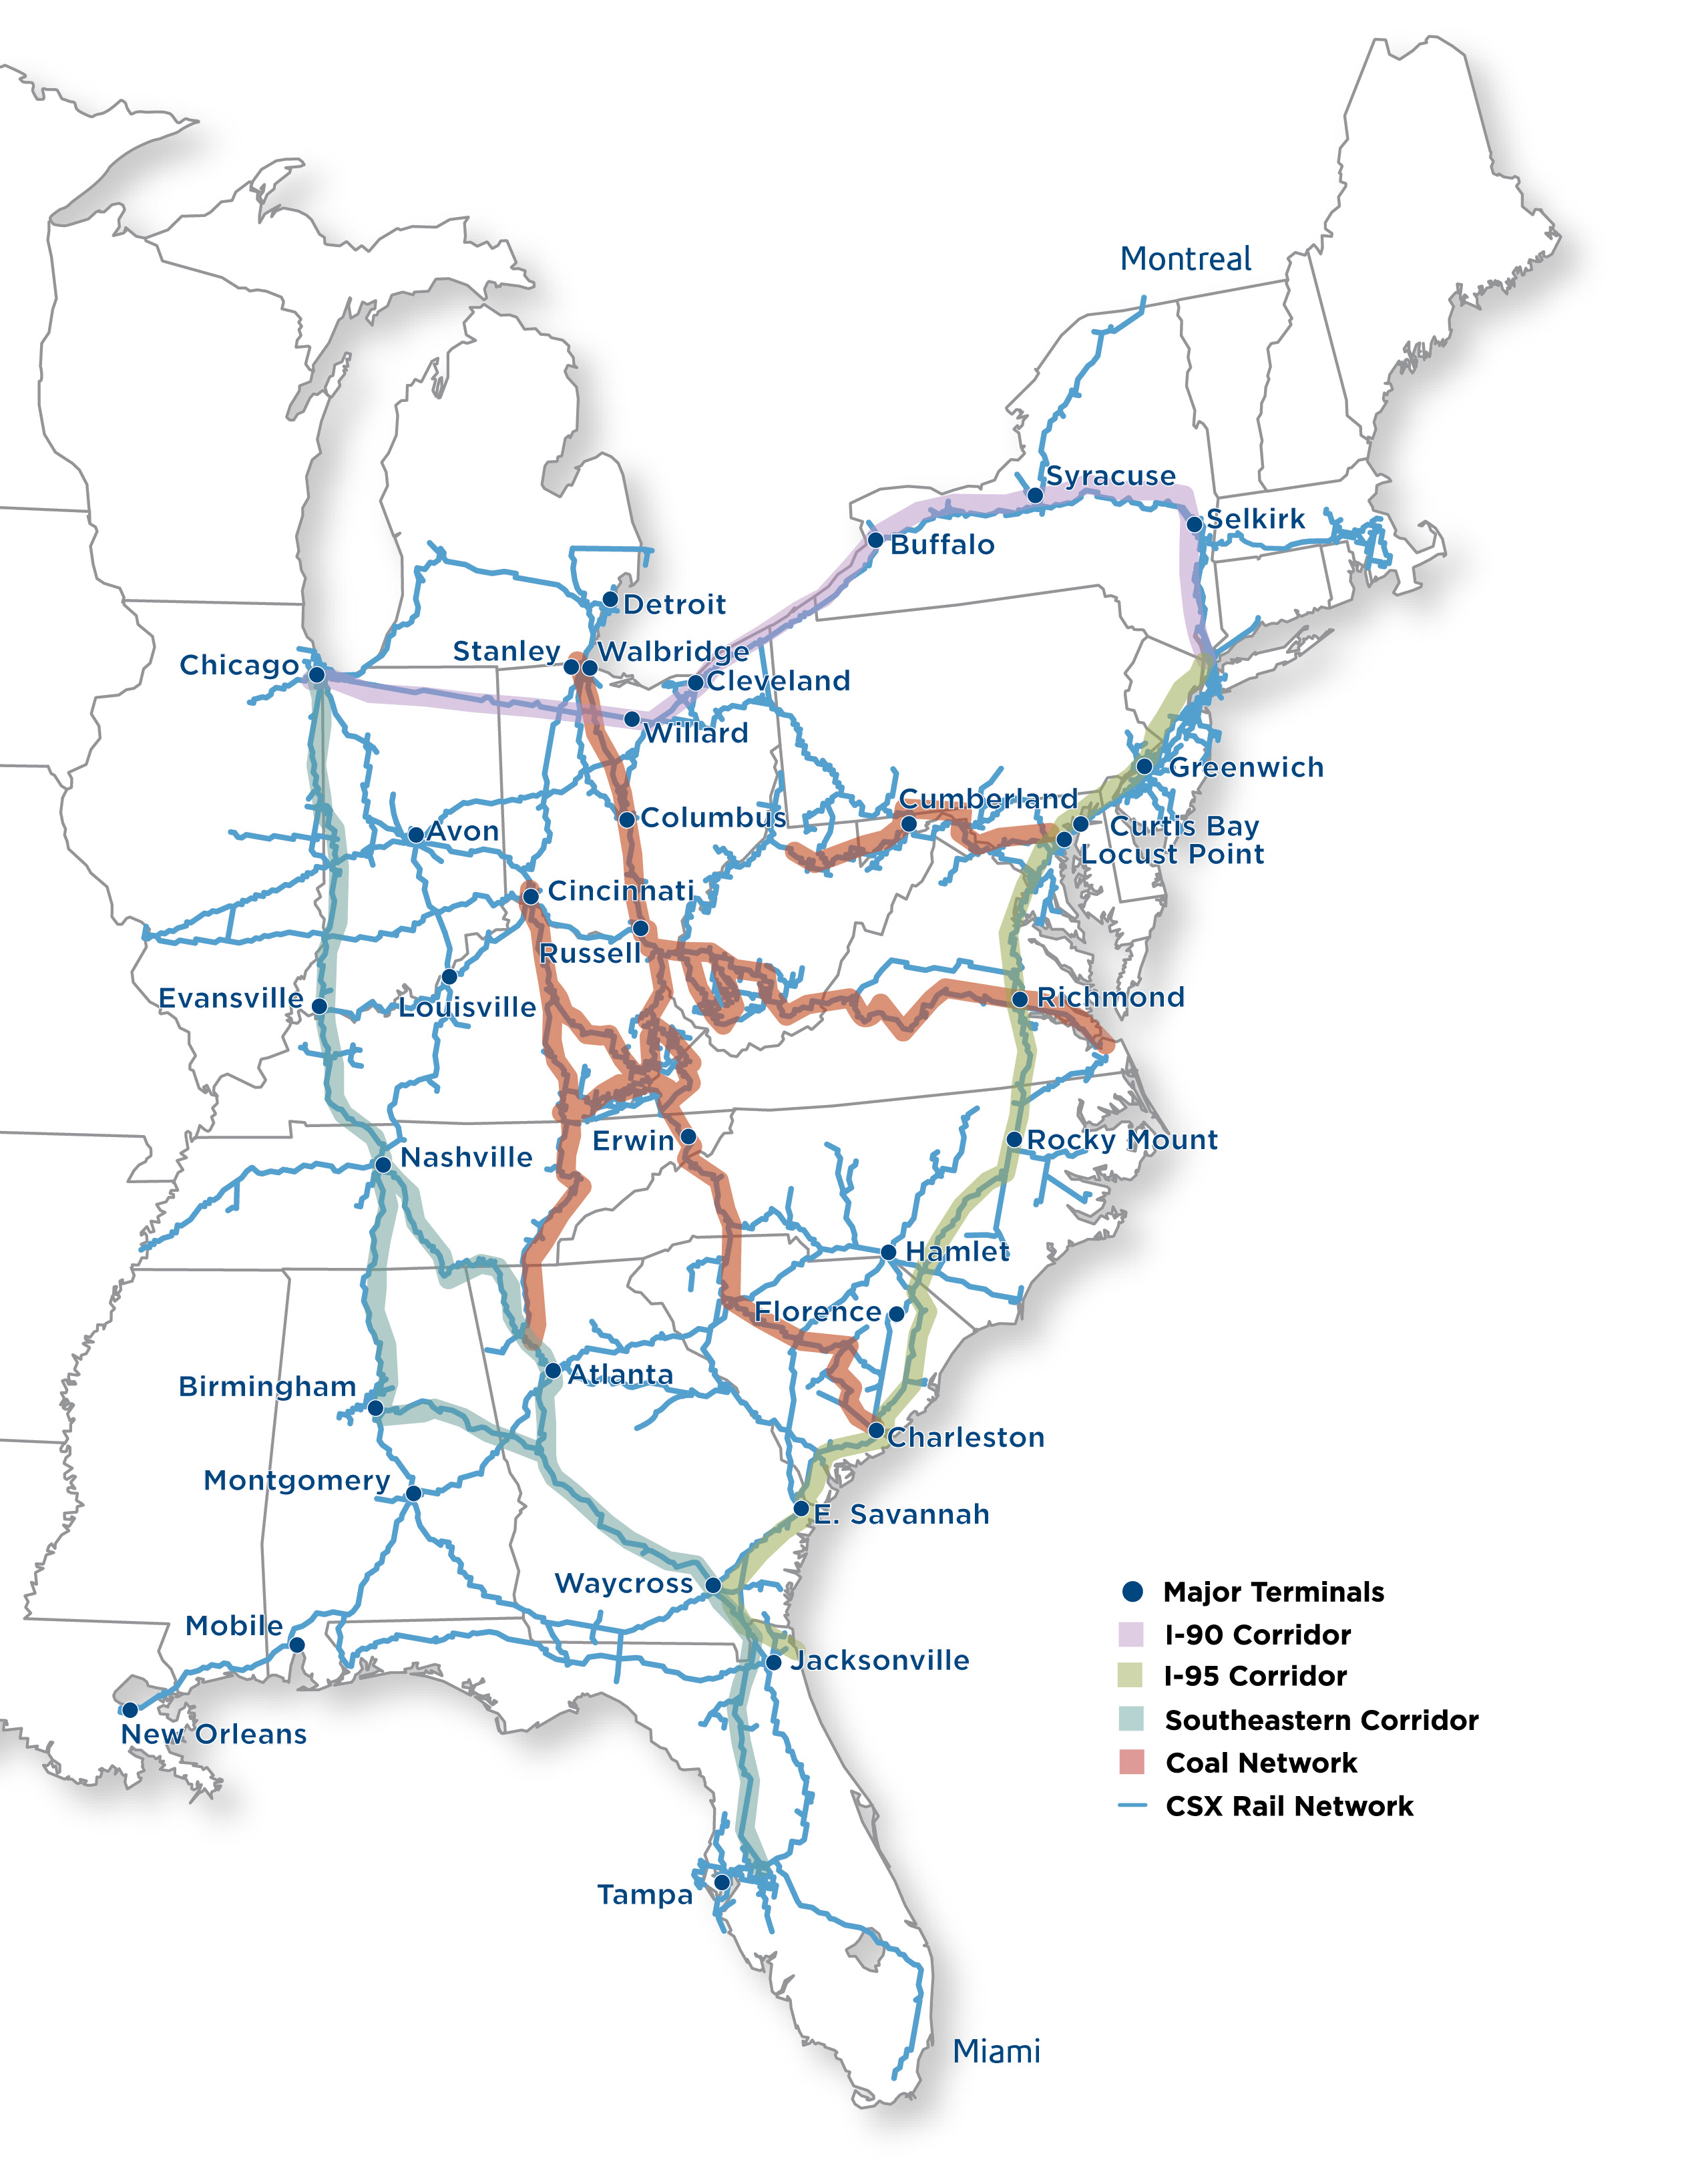
CSX Rail Network
15