Exhibit 99.2

CSX Corporation Announces First Quarter Earnings
JACKSONVILLE, Fla. - April 19, 2017 - CSX Corporation (Nasdaq: CSX) today announced first quarter 2017 net earnings of $362 million, or $0.39 per share, up from $356 million, or $0.37 per share, in the same period of last year. Excluding a $173 million restructuring charge in this year’s first quarter results, adjusted earnings per share was $0.51 as shown in the table below.
| Reconciliation of GAAP to Non-GAAP Measures | ||||||||
| For the Quarter ended March 31, 2017 | ||||||||
| (in millions, except operating ratio and EPS) | Operating Income | Operating Ratio | Net Earnings | Net Earnings Per Share, Assuming Dilution | ||||
| GAAP Operating Results | $ | 712 | 75.2% | $ | 362 | $ 0.39 | ||
Restructuring Charge (a) | 173 | (6.0)% | 108 | 0.12 | ||||
| Adjusted Operating Results (non-GAAP) | $ | 885 | 69.2% | $ | 470 | $ 0.51 | ||
| (a) The restructuring charge impact to net earnings and net earnings per share, assuming dilution was tax effected using the company’s tax rate of 37.8%. | ||||||||
Revenue for the quarter increased 10 percent, reflecting volume growth across most markets, overall core pricing gains, increased fuel recovery, and favorable mix. Although the $173 million restructuring charge drove a 13 percent year-over-year increase in expenses for the first quarter, the company delivered strong efficiency savings of $123 million. Looking forward, CSX is making adjustments throughout the company to improve asset utilization, achieve greater operations efficiency and reduce its cost structure.
“I am pleased to join the CSX team and working together we are going to make this company the best North American railroad, capable of consistently meeting and exceeding the expectations of our customers and our shareholders,” said E. Hunter Harrison, president and chief executive officer. “As the business environment continues to improve and we implement Precision Scheduled Railroading, CSX will realize these objectives while driving volume growth and achieving a new level of financial performance.”
| Table of Contents | The accompanying unaudited | CSX CORPORATION | CONTACTS: |
| financial information should be | 500 Water Street, C900 | ||
| read in conjunction with the | Jacksonville, FL 32202 | INVESTOR RELATIONS | |
| Company’s most recent | www.csx.com | David Baggs | |
| Annual Report on Form 10-K, | (904) 359-4812 | ||
| Quarterly Reports on Form | MEDIA | ||
| 10-Q, and any Current | Lauren Rueger | ||
| Reports on Form 8-K. | (904) 366-4211 | ||
1
CSX executives will conduct a quarterly earnings conference call with the investment community on April 20, 2017, from 8:30 a.m. to 9:30 a.m. Eastern time. Investors, media and the public may listen to the conference call by dialing 1-888-EARN-CSX (888-327-6279) and asking for the CSX earnings call. Callers outside the U.S., dial 1-773-756-0199. Participants should dial in 10 minutes prior to the call. In conjunction with the call, a live webcast will be accessible and presentation materials will be posted on the company's website at http://investors.csx.com. Following the earnings call, an internet replay of the presentation will be archived on the company website.
This earnings announcement, as well as additional detailed financial information, is contained in the CSX Quarterly Financial Report available through the company’s website at http://investors.csx.com and on Form 8-K with the Securities and Exchange Commission.
About CSX and its Disclosures
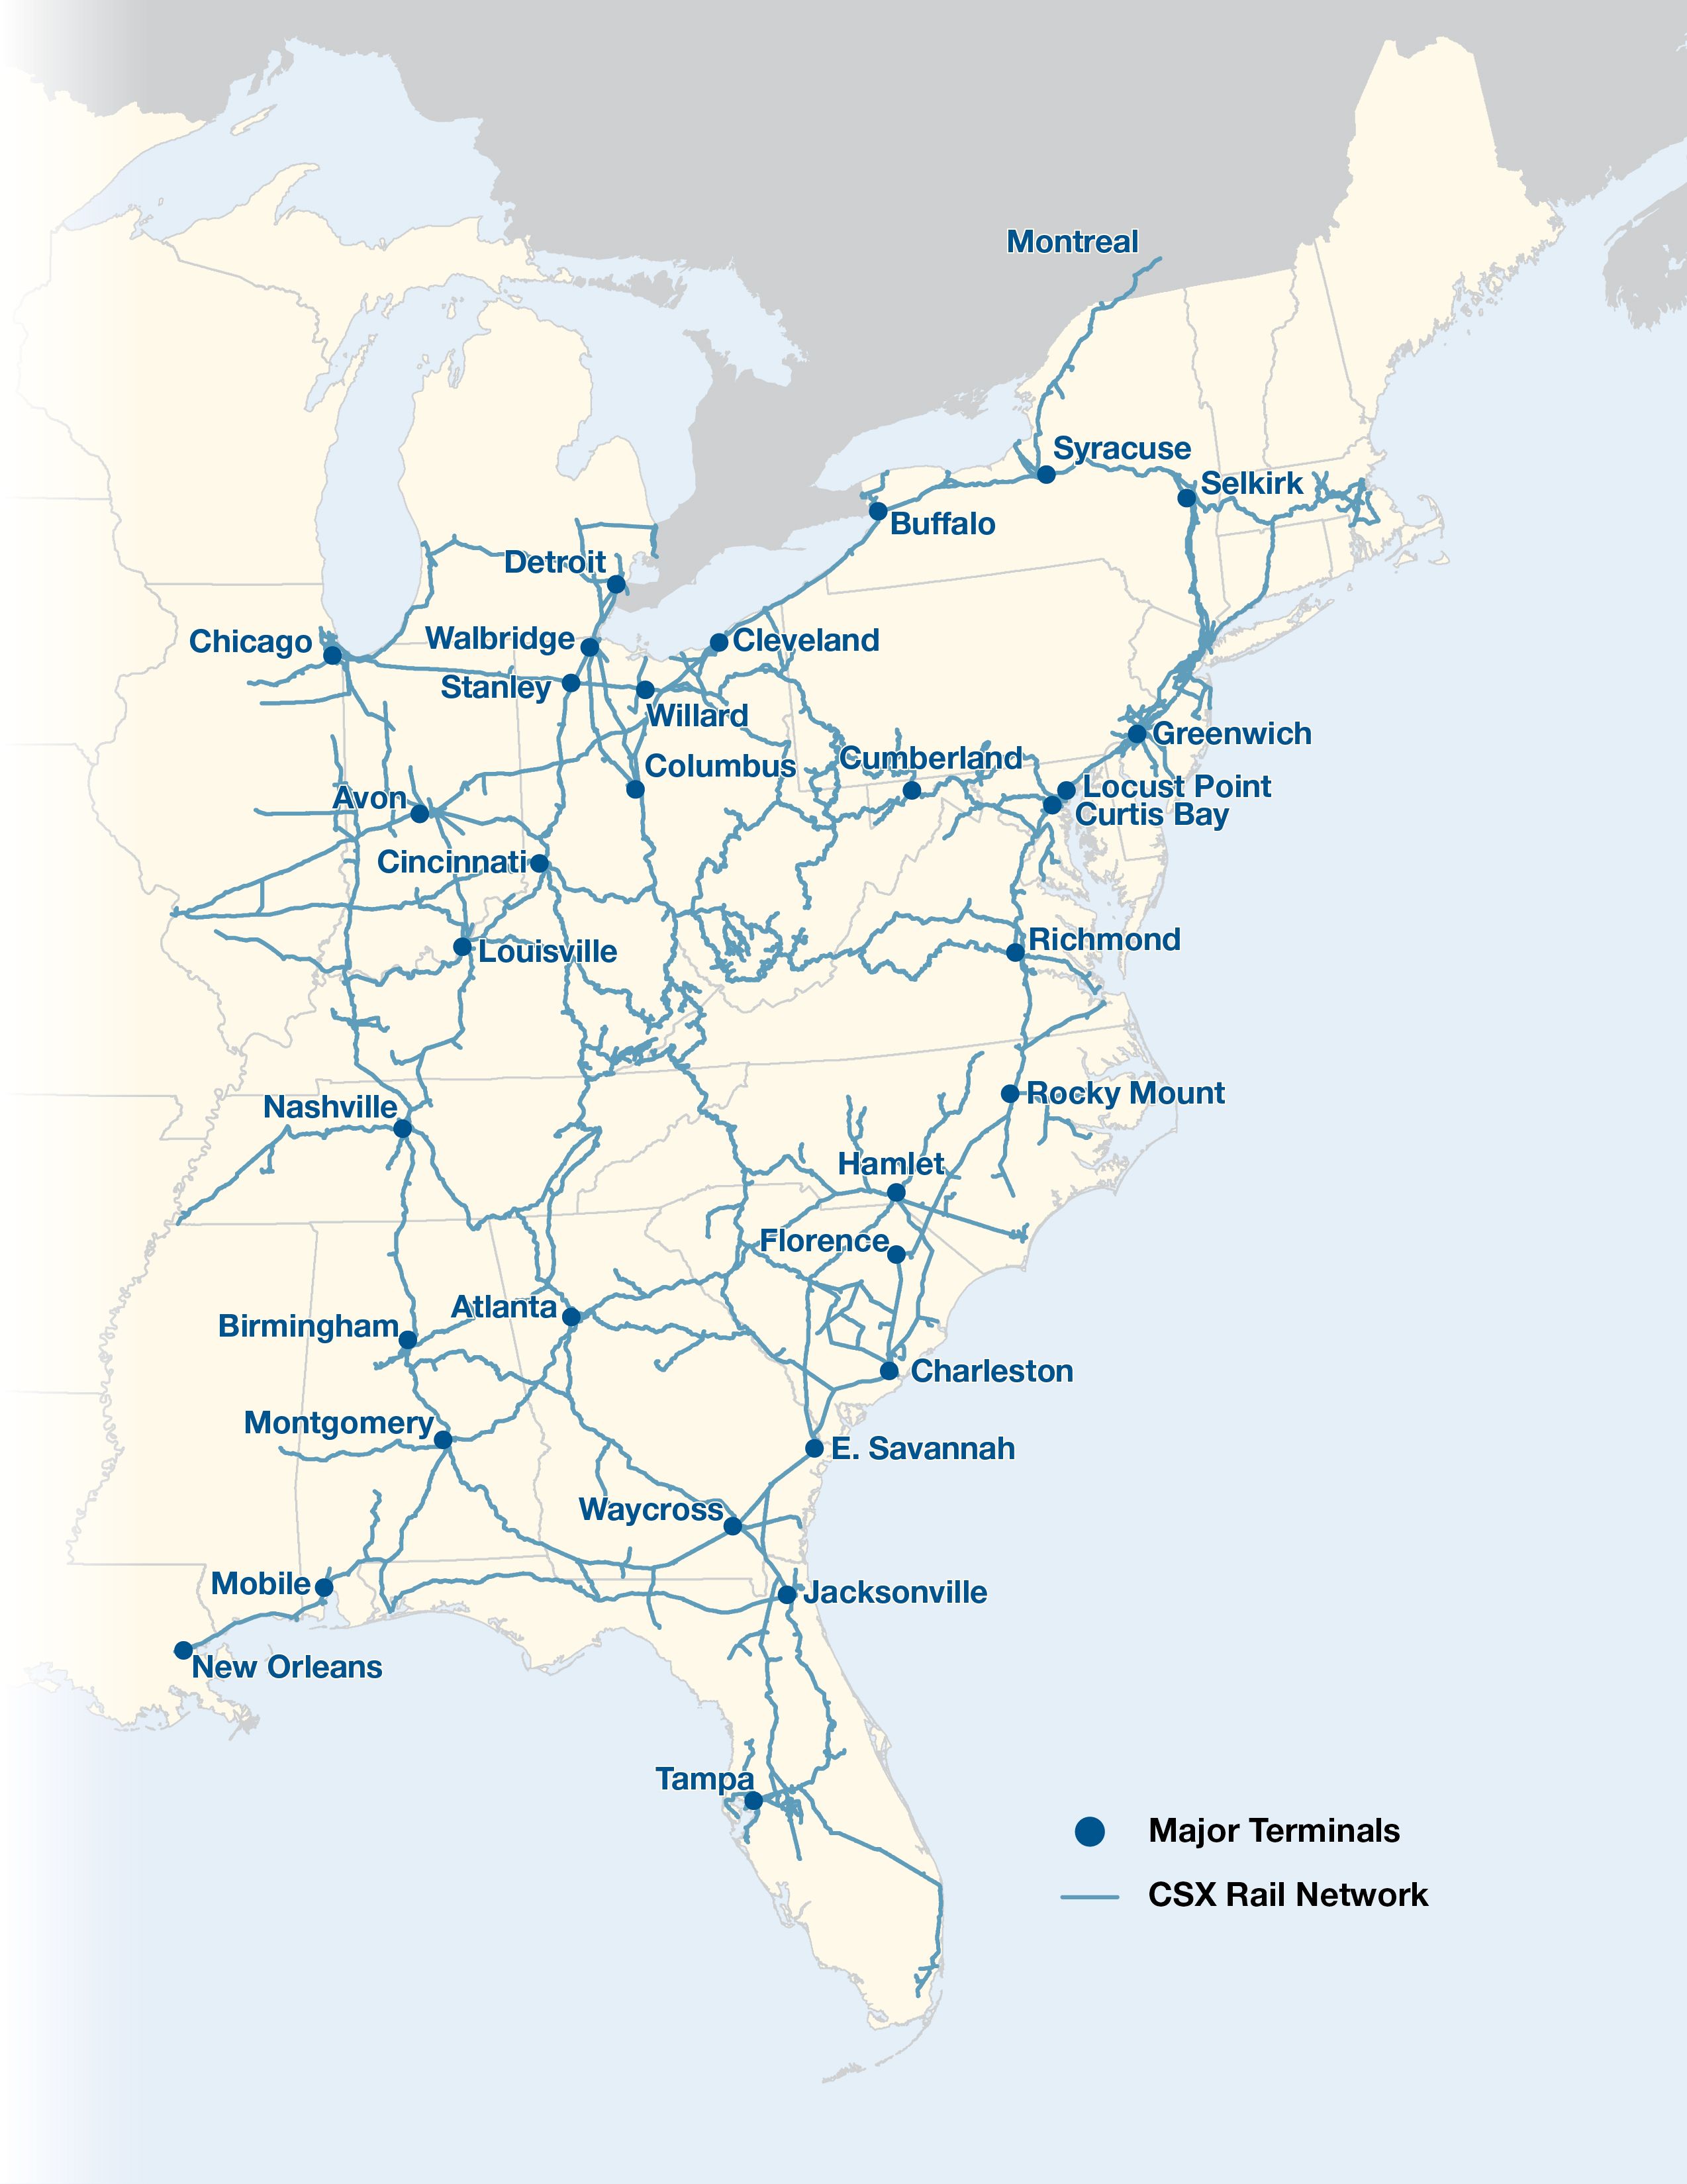
CSX, based in Jacksonville, Florida, is a premier transportation company. It provides rail, intermodal and rail-to-truck transload services and solutions to customers across a broad array of markets, including energy, industrial, construction, agricultural, and consumer products. For over 190 years, CSX has played a critical role in the nation's economic expansion and industrial development. Its network connects every major metropolitan area in the eastern United States, where nearly two-thirds of the nation's population resides. It also links more than 240 short-line railroads and more than 70 ocean, river and lake ports with major population centers and farming towns alike.
This announcement, as well as additional financial information, is available on the company's website at http://investors.csx.com. CSX also uses social media channels to communicate information about the company. Although social media channels are not intended to be the primary method of disclosure for material information, it is possible that certain information CSX posts on social media could be deemed to be material. Therefore, we encourage investors, the media, and others interested in the company to review the information we post on Twitter (http://twitter.com/CSX) and on Slideshare (http://www.slideshare.net/HowTomorrowMoves). The social media channels used by CSX may be updated from time to time.
More information about CSX Corporation and its subsidiaries is available at www.csx.com and on Facebook (http://www.facebook.com/OfficialCSX).
Non-GAAP Disclosure
CSX reports its financial results in accordance with accounting principles generally accepted in the United States of America (U.S. GAAP). CSX also uses certain non-GAAP measures that fall within the meaning of Securities and Exchange Commission Regulation G and Regulation S-K Item 10(e), which may provide users of the financial information with additional meaningful comparison to prior reported results. Non-GAAP measures do not have standardized definitions and are not defined by U.S. GAAP. Therefore, CSX’s non-GAAP measures are unlikely to be comparable to similar measures presented by other companies. The presentation of these non-GAAP measures should not be considered in isolation from, as a substitute for, or as superior to the financial information presented in accordance with GAAP. Reconciliations of non-GAAP measures to corresponding GAAP measures are above.
Forward-looking Statements
This information and other statements by the company may contain forward-looking statements within the meaning of the Private Securities Litigation Reform Act with respect to, among other items: projections and estimates of earnings, revenues, margins, volumes, rates, cost-savings, expenses, taxes, liquidity, capital expenditures, dividends, share repurchases or other financial items, statements of management's plans, strategies and objectives for future operations, and management's expectations as to future performance and operations and the time by which objectives will be achieved, statements concerning proposed new services, and statements regarding future economic, industry or market conditions or performance. Forward-looking statements are typically identified by words or phrases such as “will,” “should,” “believe,” “expect,” “anticipate,” “project,” “estimate,” “preliminary” and similar expressions. Forward-looking statements speak only as of the date they are made, and the company undertakes no obligation to update or revise any forward-looking statement. If the company updates any forward-looking statement, no inference should be drawn that the company will make additional updates with respect to that statement or any other forward-looking statements.
Forward-looking statements are subject to a number of risks and uncertainties, and actual performance or results could differ materially from that anticipated by any forward-looking statements. Factors that may cause actual results to differ materially from those contemplated by any forward- looking statements include, among others; (i) the company's success in implementing its financial and operational initiatives; (ii) changes in domestic or international economic, political or business conditions, including those affecting the transportation industry (such as the impact of industry competition, conditions, performance and consolidation); (iii) legislative or regulatory changes; (iv) the inherent business risks associated with safety and security; (v) the outcome of claims and litigation involving or affecting the company; (vi) natural events such as severe weather conditions or pandemic health crises; and (vii) the inherent uncertainty associated with projecting economic and business conditions.
Other important assumptions and factors that could cause actual results to differ materially from those in the forward-looking statements are specified in the company's SEC reports, accessible on the SEC's website at www.sec.gov and the company's website at www.csx.com.
2
CSX Corporation
CONSOLIDATED INCOME STATEMENTS (Unaudited)
(Dollars in millions, except per share amounts)
| Quarters Ended | |||||||||||
| Mar. 31, 2017 | Mar. 25, 2016 | $ Change | % Change | ||||||||
| Revenue | $ | 2,869 | $ | 2,618 | $ | 251 | 10 | % | |||
| Expense | |||||||||||
| Labor and Fringe | 789 | 796 | 7 | 1 | |||||||
| Materials, Supplies and Other | 567 | 550 | (17 | ) | (3 | ) | |||||
| Fuel | 218 | 150 | (68 | ) | (45 | ) | |||||
| Depreciation | 320 | 313 | (7 | ) | (2 | ) | |||||
| Equipment and Other Rents | 90 | 105 | 15 | 14 | |||||||
Restructuring Charge (a) | 173 | — | (173 | ) | — | ||||||
| Total Expense | 2,157 | 1,914 | (243 | ) | (13 | ) | |||||
| Operating Income | 712 | 704 | 8 | 1 | |||||||
| Interest Expense | (137 | ) | (143 | ) | 6 | 4 | |||||
| Other Income - Net | 7 | 7 | — | — | |||||||
| Earnings Before Income Taxes | 582 | 568 | 14 | 2 | |||||||
| Income Tax Expense | (220 | ) | (212 | ) | (8 | ) | (4 | ) | |||
| Net Earnings | $ | 362 | $ | 356 | $ | 6 | 2 | % | |||
| Operating Ratio | 75.2 | % | 73.1 | % | |||||||
| Per Common Share | |||||||||||
| Net Earnings Per Share, Assuming Dilution | $ | 0.39 | $ | 0.37 | $ | 0.02 | 5 | % | |||
Average Shares Outstanding, Assuming Dilution (millions) | 929 | 963 | |||||||||
| Cash Dividends Paid Per Common Share | $ | 0.18 | $ | 0.18 | |||||||
3
CSX Corporation
CONDENSED CONSOLIDATED BALANCE SHEETS
(Dollars in millions)
| (Unaudited) | ||||||
| Mar. 31, 2017 | Dec. 30, 2016 | |||||
| ASSETS | ||||||
| Cash and Cash Equivalents | $ | 930 | $ | 603 | ||
| Short-term Investments | 287 | 417 | ||||
| Other Current Assets | 1,443 | 1,467 | ||||
| Properties - Net | 31,259 | 31,150 | ||||
| Investment in Affiliates and Other Companies | 1,469 | 1,459 | ||||
| Other Long-term Assets | 324 | 318 | ||||
| Total Assets | $ | 35,712 | $ | 35,414 | ||
| LIABILITIES AND SHAREHOLDERS' EQUITY | ||||||
| Current Maturities of Long-term Debt | $ | 331 | $ | 331 | ||
| Other Current Liabilities | 1,946 | 1,709 | ||||
| Long-term Debt | 10,963 | 10,962 | ||||
| Deferred Income Taxes | 9,648 | 9,596 | ||||
| Other Long-term Liabilities | 1,155 | 1,122 | ||||
| Total Liabilities | 24,043 | 23,720 | ||||
| Total Shareholders' Equity | 11,669 | 11,694 | ||||
| Total Liabilities and Shareholders' Equity | $ | 35,712 | $ | 35,414 | ||
4
CSX Corporation
CONDENSED CONSOLIDATED CASH FLOW STATEMENTS (Unaudited)
(Dollars in millions)
| Quarters Ended | ||||||
| Mar. 31, 2017 | Mar. 25, 2016 | |||||
| OPERATING ACTIVITIES | ||||||
| Net Earnings | $ | 362 | $ | 356 | ||
| Depreciation | 320 | 313 | ||||
Restructuring Charge (b) | 161 | — | ||||
| Deferred Income Taxes | 59 | 80 | ||||
| Other Operating Activities - Net | 141 | 5 | ||||
| Net Cash Provided by Operating Activities | 1,043 | 754 | ||||
| INVESTING ACTIVITIES | ||||||
| Property Additions | (441 | ) | (425 | ) | ||
| Purchase of Short-term Investments | (75 | ) | (235 | ) | ||
| Proceeds from Sales of Short-term Investments | 205 | 670 | ||||
| Other Investing Activities | 25 | 31 | ||||
| Net Cash (Used in) Provided by Investing Activities | (286 | ) | 41 | |||
| FINANCING ACTIVITIES | ||||||
| Dividends Paid | (166 | ) | (173 | ) | ||
Shares Repurchased (c) | (258 | ) | (249 | ) | ||
Other Financing Activities - Net (d) | (6 | ) | (270 | ) | ||
| Net Cash Used in Financing Activities | (430 | ) | (692 | ) | ||
| Net Increase in Cash and Cash Equivalents | 327 | 103 | ||||
| CASH AND CASH EQUIVALENTS | ||||||
| Cash and Cash Equivalents at Beginning of Period | 603 | 628 | ||||
| Cash and Cash Equivalents at End of Period | $ | 930 | $ | 731 | ||
5
CSX Corporation
NOTES TO CONSOLIDATED FINANCIAL STATEMENTS (Unaudited)
Income Statement
| a) | Restructuring Charge: In March 2017, the Company reduced its management workforce by 765 employees through an involuntary separation program with enhanced benefits. The majority of separation benefits will be paid from general corporate funds while certain benefits will be paid through CSX’s qualified pension plans. Cash expenditures, most of which will take place in second quarter 2017, will total approximately $90 million primarily related to one-time severance costs. Additionally, the terms of unvested equity awards for the outgoing CEO and President were modified prior to their retirements on March 6, 2017 to permit prorated vesting through May 31, 2018. |
The restructuring charge of $173 million, which amounts to $108 million or $0.12 cents per share after-tax, includes costs related to the management workforce reduction, the proration of equity awards and other advisory costs related to the leadership transition. The majority of the costs for restructuring activities for these 765 employees were recognized in first quarter 2017 as shown in the table below. The Company expects to incur additional costs as reductions continue until this program is completed.
| Quarter Ended | |||
| (Dollars in millions) | Mar. 31, 2017 | ||
| Severance and Pension | $ | 131 | |
| Other Post-retirement Benefits Curtailment | 13 | ||
| Employee Equity Awards Proration and Other | 11 | ||
| Subtotal Management Workforce Reduction | 155 | ||
| Executive Equity Awards Proration | 8 | ||
| Advisory Fees Related to Shareholder Matters | 10 | ||
| Total Restructuring Charge | $ | 173 | |
Cash Flow Statement
| b) | Restructuring Charge: The restructuring charge of $173 million was reduced by cash paid of $12 million as of March 31, 2017. |
| c) | Shares repurchased: During the first quarter of 2017 and 2016, the Company repurchased the following number of shares: |
| Quarters Ended | ||||||
| Mar. 31, 2017 | Mar. 25, 2016 | |||||
Shares Repurchased (Millions) | 6 | 10 | ||||
Cost of Shares (Dollars in millions) | $ | 258 | $ | 249 | ||
| d) | Other Financing Activities - Net: Prior year includes payments of $272 million for locomotives which were purchased using seller financing in 2015. |
6
CSX Corporation
VOLUME AND REVENUE (Unaudited) | |||||||||||||||||||||||||||
| Volume (Thousands of units); Revenue (Dollars in millions); Revenue Per Unit (Dollars) | |||||||||||||||||||||||||||
| Quarters Ended March 31, 2017 and March 25, 2016 | |||||||||||||||||||||||||||
| Volume | Revenue | Revenue Per Unit | |||||||||||||||||||||||||
| 2017 | 2016 | % Change | 2017 | 2016 | % Change | 2017 | 2016 | % Change | |||||||||||||||||||
| Agricultural | |||||||||||||||||||||||||||
Agricultural and Food Products (a) | 121 | 121 | — | % | $ | 332 | $ | 323 | 3 | % | $ | 2,744 | $ | 2,669 | 3 | % | |||||||||||
Fertilizers (a) | 77 | 76 | 1 | 129 | 127 | 2 | 1,675 | 1,671 | — | ||||||||||||||||||
| Industrial | |||||||||||||||||||||||||||
Chemicals (a) | 175 | 175 | — | 566 | 546 | 4 | 3,234 | 3,120 | 4 | ||||||||||||||||||
| Automotive | 119 | 113 | 5 | 316 | 290 | 9 | 2,655 | 2,566 | 3 | ||||||||||||||||||
Metals and Equipment (a) | 70 | 62 | 13 | 190 | 165 | 15 | 2,714 | 2,661 | 2 | ||||||||||||||||||
| Housing and Construction | |||||||||||||||||||||||||||
Minerals (a) | 70 | 58 | 21 | 114 | 94 | 21 | 1,629 | 1,621 | — | ||||||||||||||||||
| Forest Products | 67 | 68 | (1 | ) | 192 | 189 | 2 | 2,866 | 2,779 | 3 | |||||||||||||||||
| Total Merchandise | 699 | 673 | 4 | 1,839 | 1,734 | 6 | 2,631 | 2,577 | 2 | ||||||||||||||||||
| Coal | 205 | 200 | 3 | 522 | 399 | 31 | 2,546 | 1,995 | 28 | ||||||||||||||||||
| Intermodal | 688 | 678 | 1 | 434 | 405 | 7 | 631 | 597 | 6 | ||||||||||||||||||
| Other | — | — | — | 74 | 80 | (8 | ) | — | — | — | |||||||||||||||||
| Total | 1,592 | 1,551 | 3 | % | $ | 2,869 | $ | 2,618 | 10 | % | $ | 1,802 | $ | 1,688 | 7 | % | |||||||||||
(a) At the beginning of the third quarter 2016, in order to better align markets with the Company's business strategy, changes were made to the categorization of certain lines of business. Prior periods have been reclassified to conform to the current presentation and are posted on the Company's website at csx.com under the investors section.
| • | Agricultural and Food Products includes the combination of the previous Agricultural Products and Food and Consumer markets. |
| • | Fertilizers was previously named Phosphates and Fertilizers. |
| • | Metals and Equipment includes the Equipment portion of the previous Waste and Equipment market. |
| • | Chemicals includes the Waste portion of the previous Waste and Equipment market. Chemicals also includes fly ash for remediation purposes (a form of waste) which was previously included within the Minerals market. |
7
CSX Corporation
VOLUME AND REVENUE
Revenue increased $251 million to $2.9 billion from the prior year’s first quarter due to volume growth, pricing gains and increased fuel surcharge.
Same Store Sales Pricing Year-Over-Year Change | |||
| % Change | |||
| All-In | 3.9 | % | |
| Merchandise and Intermodal | 2.5 | % | |
Same store sales is defined as customer shipments with the same commodity and car type, and the same origin and destination.
Revenue per unit was up 7 percent in the quarter as a result of pricing gains, positive mix and higher fuel recoveries.
Same store sales pricing increased across all major markets (Coal, Merchandise and Intermodal), led by temporal strength in export coal. Continued sequential softening in merchandise and intermodal pricing reflects the cumulative impact of traffic negotiated over the last several quarters in a slowly recovering market.
FUEL SURCHARGE
Fuel surcharge revenue is included in the individual markets. Fuel lag is the estimated difference between highway diesel prices in the quarter and the prices used for fuel surcharge, which are generally on a two month lag.
| Quarters Ended | |||||||||
| (Dollars in millions) | Mar. 31, 2017 | Mar. 25, 2016 | $ Change | ||||||
| Fuel Surcharge Revenue | $ | 85 | $ | 52 | $ | 33 | |||
| Fuel Lag (Expense) Benefit | $ | (5 | ) | $ | 19 | $ | (24 | ) | |
MERCHANDISE
Agricultural Sector
| Volume (Thousands of units); Revenue (Dollars in millions); Revenue Per Unit (Dollars) | |||||||||||||||||||||||
| Volume | Revenue | Revenue Per Unit | |||||||||||||||||||||
| 2017 | 2016 | % Change | 2017 | 2016 | % Change | 2017 | 2016 | % Change | |||||||||||||||
| 198 | 197 | 1 | $ | 461 | $ | 450 | 2 | $ | 2,328 | $ | 2,284 | 2 | |||||||||||
% of Carloads
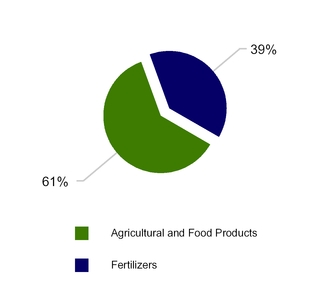
Agricultural and Food Products - Volume was flat as gains in ethanol driven by higher production levels were offset by declines in the export grain market as the strong South American harvest and low barge rates negatively impacted rail volumes.
Fertilizers - Volume increased modestly due to rail conversion of phosphate rock traffic that would otherwise move by truck. This growth was partially offset by reduced demand for nitrogen reflecting the anticipated shift of acres planted from corn to soybeans.
8
CSX Corporation
MERCHANDISE cont'd
Industrial Sector
| Volume (Thousands of units); Revenue (Dollars in millions); Revenue Per Unit (Dollars) | |||||||||||||||||||||||
| Volume | Revenue | Revenue Per Unit | |||||||||||||||||||||
| 2017 | 2016 | % Change | 2017 | 2016 | % Change | 2017 | 2016 | % Change | |||||||||||||||
| 364 | 350 | 4 | $ | 1,072 | $ | 1,001 | 7 | $ | 2,945 | $ | 2,860 | 3 | |||||||||||
% of Carloads
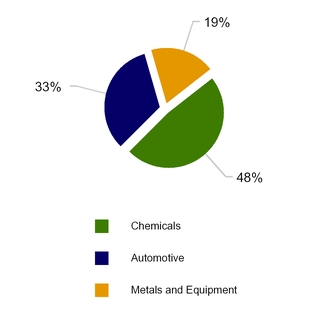
Chemicals - Volume was flat as fly ash shipments, which began moving a year ago, ramped up over several quarters to current levels. Growth was also driven by soil remediation projects and frac sand due to an increase in drilling activity. These gains were offset by lower crude oil shipments as crude by rail economics remained challenged.
Automotive - Volume increased, driven by SUV and truck shipments, as North American vehicle production increased versus the prior year at several CSX-served plants.
Metals and Equipment - Volume grew due to improved domestic steel production, which reflected moderating import steel pressure and increased construction-related activity.
Housing and Construction Sector
| Volume (Thousands of units); Revenue (Dollars in millions); Revenue Per Unit (Dollars) | ||||||||||||||||||||||||
| Volume | Revenue | Revenue Per Unit | ||||||||||||||||||||||
| 2017 | 2016 | % Change | 2017 | 2016 | % Change | 2017 | 2016 | % Change | ||||||||||||||||
| 137 | 126 | 9 | $ | 306 | $ | 283 | 8 | $ | 2,234 | $ | 2,246 | (1 | ) | |||||||||||
% of Carloads
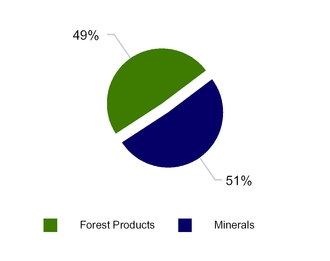
Minerals - Volume grew as shipments of aggregates increased, reflecting construction project activity and periods of mild winter weather, which allowed for additional production and movement. In addition, salt demand improved after a few significant snow storms depleted stockpiles in the northeast.
Forest Products - Volume was down modestly as truck competition from excess capacity continued to constrain growth despite positive momentum in the housing market and rail shipments of building products. In addition, headwinds from electronic substitution continued to negatively impact shipments of paper products.
9
CSX Corporation
COAL
| Volume (Thousands of units); Revenue (Dollars in millions); Revenue Per Unit (Dollars) | |||||||||||||||||||||||
| Volume | Revenue | Revenue Per Unit | |||||||||||||||||||||
| 2017 | 2016 | % Change | 2017 | 2016 | % Change | 2017 | 2016 | % Change | |||||||||||||||
| 205 | 200 | 3 | $ | 522 | $ | 399 | 31 | $ | 2,546 | $ | 1,995 | 28 | |||||||||||
% of Tons
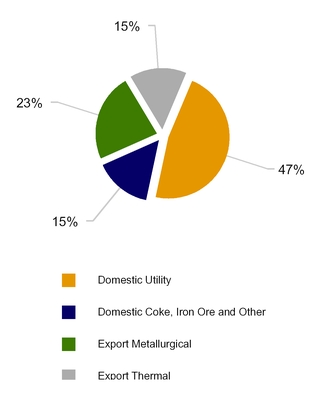
Domestic Utility Coal - Volume declined due to mild winter weather and a competitive loss of short-haul interchange traffic as previously conveyed.
Domestic Coke, Iron Ore and Other - Iron ore shipments were down as a large customer retooled its production, but overall demand was stable.
Export Coal - Volume increased as global supply levels and pricing conditions extended the strong demand environment for U.S. coal exports.
| Quarters Ended | ||||||
| Mar. 31, 2017 | Mar. 25, 2016(a) | % Change | ||||
| (Millions of Tons) | ||||||
| Domestic | ||||||
| Utility | 11.0 | 12.3 | (11 | )% | ||
| Coke, Iron Ore and Other | 3.5 | 4.6 | (24 | ) | ||
| Total Domestic | 14.5 | 16.9 | (14 | ) | ||
| Export | ||||||
| Metallurgical | 5.3 | 4.3 | 23 | |||
| Thermal | 3.4 | 1.5 | 127 | |||
| Total Export | 8.7 | 5.8 | 50 | |||
| Total Coal | 23.2 | 22.7 | 2 | % | ||
(a) Coal tonnage was corrected by an immaterial amount of 1%.
10
CSX Corporation
INTERMODAL
| Volume (Thousands of units); Revenue (Dollars in millions); Revenue Per Unit (Dollars) | |||||||||||||||||||||||
| Volume | Revenue | Revenue Per Unit | |||||||||||||||||||||
| 2017 | 2016 | % Change | 2017 | 2016 | % Change | 2017 | 2016 | % Change | |||||||||||||||
| 688 | 678 | 1 | $ | 434 | $ | 405 | 7 | $ | 631 | $ | 597 | 6 | |||||||||||
% of Units
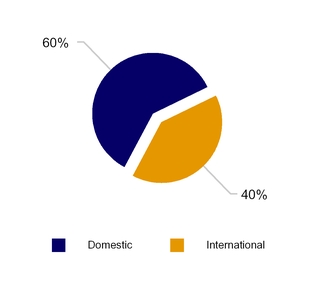
Domestic - Volume declined one percent as the impact of a short-haul competitive loss in the third quarter of last year was partially offset by continued growth in CSX’s highway-to-rail initiative.
International - Volume increased five percent, reflecting improving demand in international freight flows and strong performance in several large customer accounts.
11
CSX Corporation
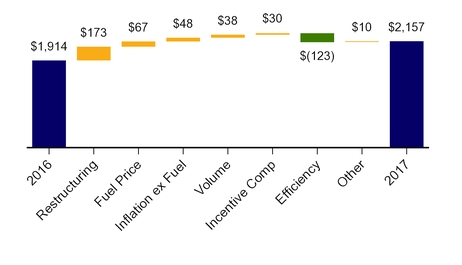
EXPENSE
Expenses of $2.2 billion increased $243 million, or 13 percent year over year, primarily driven by a restructuring charge of $173 million and a fuel price increase of $67 million, partially offset by efficiency savings of $123 million.
EXPENSE
(Dollars in millions)
LABOR AND FRINGE
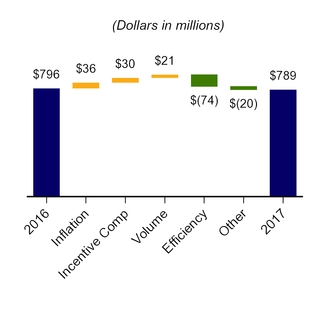
| • | Inflation of $36 million was driven primarily by increased health and welfare costs. |
| • | Incentive compensation was $30 million higher reflecting the expected award payouts on existing plans. |
| • | Volume-related costs were $21 million higher. |
| • | Efficiency savings of $74 million were driven by lower T&E and operating support costs. |
| • | Other costs decreased by $20 million primarily due to a $14 million decrease in pension expense. |
EMPLOYEE COUNTS (Estimated) | |||||
| 2017 | 2016 | Change | |||
| January | 26,387 | 28,134 | (1,747) | ||
| February | 26,429 | 27,771 | (1,342) | ||
| March | 25,820 | 27,841 | (2,021) | ||
| Average | 26,212 | 27,915 | (1,703) | ||
12
CSX Corporation
MATERIALS, SUPPLIES AND OTHER
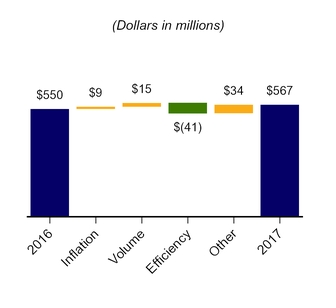
| • | Inflation resulted in $9 million of additional cost. |
| • | Volume-related costs were $15 million higher. |
| • | Efficiency savings of $41 million were primarily related to lower operating support costs. |
| • | Other costs increased $34 million due to $14 million in prior year favorable adjustments that did not repeat in the current quarter and several other items. |
FUEL
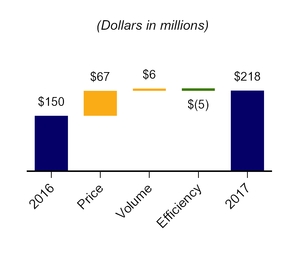
| • | A 45 percent price increase drove $67 million in additional fuel expense. |
| • | Volume-related costs were $6 million higher due to a five percent year-over-year increase in gross ton miles. |
| • | Efficiency savings of $5 million were related to process improvement and locomotive fuel reduction initiatives. |
| Quarters Ended | ||||||||||
| (Dollars and Gallons in Millions, Except Price per Gallon) | Mar. 31, 2017 | Mar. 25, 2016 | Fav / (Unfav) | |||||||
Estimated Locomotive Fuel Consumption (Gallons) | 114.7 | 113.1 | (1.6 | ) | ||||||
Price per Gallon (Dollars) | $ | 1.73 | $ | 1.19 | $ | (0.54 | ) | |||
| Total Locomotive Fuel Expense | $ | 198 | $ | 135 | $ | (63 | ) | |||
| Other | 20 | 15 | (5 | ) | ||||||
| Total Fuel Expense | $ | 218 | $ | 150 | $ | (68 | ) | |||
13
CSX Corporation
DEPRECIATION
Depreciation expense increased $7 million primarily due to a larger asset base.
EQUIPMENT AND OTHER RENTS
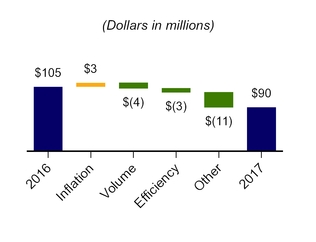
| • | Inflation resulted in $3 million of additional cost due to higher rates on automotive freight cars. |
| • | Volume-related costs decreased by $4 million, despite an overall year-over-year volume increase, due to lower rents on certain boxcars primarily attributable to demand decreases in paper products. |
| • | Efficiency savings of $3 million were due to improved miles per car. |
| • | Other costs decreased $11 million primarily due to rental income that was previously classified as other income in the prior years being reclassified to operating expense in the current year. |
14
CSX Corporation
NONOPERATING STATISTICS (Estimated)
TON MILES
| Quarters Ended | |||||||
| Mar. 31, 2017 | Mar. 25, 2016 (a) | Improvement / (Deterioration) | |||||
Revenue Ton-Miles (Billions) | |||||||
| Merchandise | 34.4 | 33.8 | 2 | % | |||
| Coal | 12.2 | 9.7 | 26 | ||||
| Intermodal | 6.9 | 6.6 | 5 | ||||
| Total | 53.5 | 50.1 | 7 | % | |||
Gross Ton-Miles (Billions) | |||||||
| Total Gross Ton-Miles | 100.3 | 95.9 | 5 | % | |||
| (Excludes locomotive gross ton-miles) | |||||||
(a) Prior year revenue ton-miles and gross ton-miles were corrected by immaterial amounts.
SAFETY AND SERVICE
CSX’s FRA reportable personal injury frequency index of 0.99 for the quarter was nine percent unfavorable, despite a slight reduction in the number of injuries, due to a significant decline in man-hours from fewer employees. The FRA train accident frequency rate of 2.37 for the quarter improved 25 percent from the prior year due to a substantial reduction in the number of accident occurrences in comparison to the prior year. The Company remains committed to ongoing improvement, with a focus on avoiding catastrophic events.
CSX’s operating performance remained stable in the first quarter. On-time originations were 81 percent, which were consistent with the previous year, and on-time arrivals decreased to 61 percent, a five percent decline year-over-year. Average train velocity experienced a four percent decline to 20.2 miles per hour and terminal dwell of 26.1 hours remained relatively constant when compared to the prior year.
| Quarters Ended | |||||||
| Mar. 31, 2017 | Mar. 25, 2016 | Improvement / (Deterioration) | |||||
| Safety and Service Measurements | |||||||
| FRA Personal Injury Frequency Index | 0.99 | 0.91 | (9 | )% | |||
| (Number of FRA-reportable injuries per 200,000 man-hours) | |||||||
| FRA Train Accident Rate | 2.37 | 3.14 | 25 | % | |||
| (Number of FRA-reportable train accidents per million train miles) | |||||||
| On-Time Originations | 81 | % | 81 | % | — | % | |
| On-Time Arrivals | 61 | % | 64 | % | (5 | )% | |
Train Velocity (Miles per hour) | 20.2 | 21.1 | (4 | )% | |||
Dwell (Hours) | 26.1 | 26.0 | — | % | |||
| Cars-On-Line | 210,589 | 207,357 | (2 | )% | |||
Certain operating statistics are estimated and can continue to be updated as actuals settle.
15
CSX Corporation
Non-GAAP Measures - Unaudited
CSX reports its financial results in accordance with accounting principles generally accepted in the United States of America (U.S. GAAP). CSX also uses certain non-GAAP measures that fall within the meaning of Securities and Exchange Commission Regulation G and Regulation S-K Item 10(e), which may provide users of the financial information with additional meaningful comparison to prior reported results. Non-GAAP measures do not have standardized definitions and are not defined by U.S. GAAP. Therefore, CSX’s non-GAAP measures are unlikely to be comparable to similar measures presented by other companies. The presentation of these non-GAAP measures should not be considered in isolation from, as a substitute for, or as superior to the financial information presented in accordance with GAAP. Reconciliations of non-GAAP measures to corresponding GAAP measures are below.
Adjusted Operating Results
Management believes that adjusted operating income, adjusted operating ratio, adjusted net earnings and adjusted net earnings per share, assuming dilution are important in evaluating the Company’s operating performance and for planning and forecasting future business operations and future profitability. These non-GAAP measures provide meaningful supplemental information regarding operating results because they exclude certain significant items that are not considered indicative of future financial trends. The $173 million restructuring charge impact to net earnings and net earnings per share, assuming dilution was tax effected using the Company's tax rate of 37.8%.
| For the Quarter ended March 31, 2017 | |||||||||||||||
| (in millions, except operating ratio and net earnings per share, assuming dilution) | Operating Income | Operating Ratio | Net Earnings | Net Earnings Per Share, Assuming Dilution | |||||||||||
| GAAP Operating Results | $ | 712 | 75.2 | % | $ | 362 | $ | 0.39 | |||||||
| Restructuring Charge | 173 | (6.0 | )% | 108 | 0.12 | ||||||||||
| Adjusted Operating Results (non-GAAP) | $ | 885 | 69.2 | % | $ | 470 | $ | 0.51 | |||||||
Free Cash Flow
Management believes that free cash flow is useful to investors as it is important in evaluating the Company’s financial performance. More specifically, free cash flow measures cash generated by the business after reinvestment. This measure represents cash available for both equity and bond investors to be used for dividends, share repurchases or principal reduction on outstanding debt. Free cash flow should be considered in addition to, rather than a substitute for, cash provided by operating activities. Free cash flow is calculated by using net cash from operations and adjusting for property additions and certain other investing activities.
The following table reconciles cash provided by operating activities (GAAP measure) to adjusted free cash flow after restructuring, before dividends (non-GAAP measure). The restructuring charge impact to free cash flow was tax effected using the Company's tax rate of 37.8%.
| Quarter Ended | ||||||
| (Dollars in Millions) | March 31, 2017 | March 25, 2016 | ||||
| Net cash provided by operating activities | $ | 1,043 | $ | 754 | ||
| Property additions | (441 | ) | (425 | ) | ||
| Other investing activities | 25 | 31 | ||||
| Free Cash Flow (before payment of dividends) | 627 | 360 | ||||
| Add back: Cash paid related to Restructuring Charge (after-tax) | 7 | — | ||||
| Adjusted Free Cash Flow Before Dividends (non-GAAP) | $ | 634 | $ | 360 | ||
16
CSX Rail Network
17