Fourth Quarter 2007
Earnings Conference Call
Exhibit 2
1

Proxy Statement Disclosure
IMPORTANT INFORMATION
CSX Corporation plans to file with the SEC and furnish to its shareholders a Proxy Statement in connection with its
2008 Annual Meeting, and advises its security holders to read the Proxy Statement relating to the 2008 Annual Meeting
when it becomes available, because it will contain important information. Security holders may obtain a free copy of the
Proxy Statement and other documents (when available) that CSX files with the SEC at the SEC’s website at
www.sec.gov. The Proxy Statement and these other documents may also be obtained for free from CSX by directing a
request to CSX Corporation, Attn: Investor Relations, David Baggs, 500 Water Street C110, Jacksonville, FL 32202.
CERTAIN INFORMATION CONCERNING PARTICIPANTS
CSX, its directors and named executive officers may be deemed to be participants in the solicitation of CSX’s security
holders in connection with its 2008 Annual Meeting. Security holders may obtain information regarding the names,
affiliations and interests of such individuals in CSX’s Annual Report on Form 10-K for the year ended December 29,
2006 and its proxy statement dated March 30, 2007, each of which is on file with the SEC. To the extent holdings of
CSX securities have changed since the amounts printed in the proxy statement, dated March 30, 2007, such changes
have been or will be reflected on Statements of Change in Ownership on Form 4 or Form 5 filed with the SEC.
2
Forward-Looking Disclosure
This presentation and other statements by the company contain forward-looking statements within the meaning of the
Private Securities Litigation Reform Act with respect to, among other items: projections and estimates of earnings,
revenues, cost-savings, expenses, or other financial items; statements of management’s plans, strategies and
objectives for future operation, and management’s expectations as to future performance and operations and the time
by which objectives will be achieved; statements concerning proposed new products and services; and statements
regarding future economic, industry or market conditions or performance. Forward-looking statements are typically
identified by words or phrases such as “believe,” “expect,” “anticipate,” “project,” “estimate,” and similar expressions.
Forward-looking statements speak only as of the date they are made, and the company undertakes no obligation to
update or revise any forward-looking statement. If the company does update any forward-looking statement, no
inference should be drawn that the company will make additional updates with respect to that statement or any other
forward-looking statements.
Forward-looking statements are subject to a number of risks and uncertainties, and actual performance or results could
differ materially from that anticipated by these forward-looking statements. Factors that may cause actual results to
differ materially from those contemplated by these forward-looking statements include, among others: (i) the company’s
success in implementing its financial and operational initiatives; (ii) changes in domestic or international economic or
business conditions, including those affecting the rail industry (such as the impact of industry competition, conditions,
performance and consolidation); (iii) legislative or regulatory changes; (iv) the inherent business risks associated with
safety and security; and (v) the outcome of claims and litigation involving or affecting the company. Other important
assumptions and factors that could cause actual results to differ materially from those in the forward-looking statements
are specified in the company’s SEC reports, accessible on the SEC’s website at www.sec.gov and the company’s
website at www.csx.com.
3

Executive Summary
Michael Ward
Chairman, President and
Chief Executive Officer

Fourth quarter overview . . .
Strong earnings growth,
despite fuel headwind
Safety and service at all-time
best levels and improving
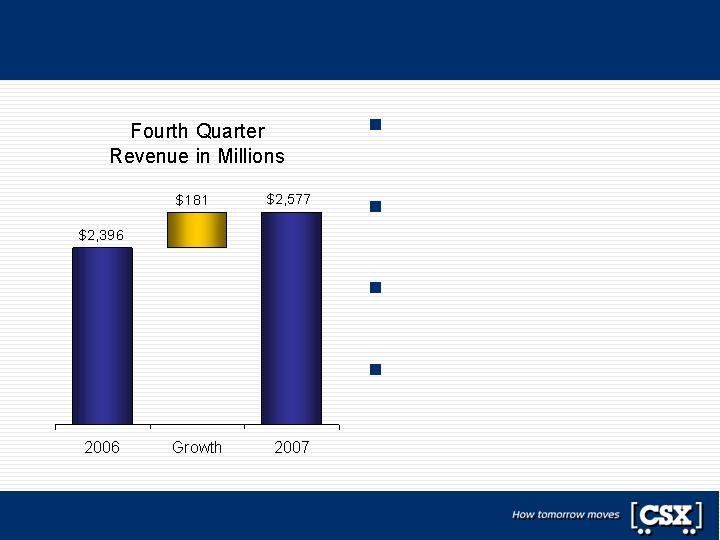
Revenues increase on
strong service levels
Operating ratio improves on
continued price/productivity
Note: Comparable EPS exclude gains on insurance recoveries and Conrail property, and income tax benefits
Fourth Quarter
Earnings Per Share
5
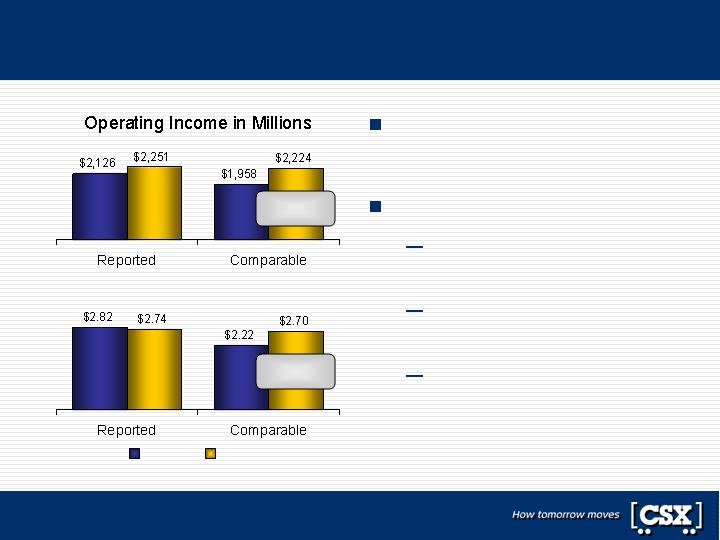
Full year highlights . . .
Strong double-digit growth
drives record results
Surface Transportation:
Revenues exceed $10
billion for first time ever
Record operating income
of over $2.2 billion
Operating ratio below 78%
for first time in a decade
EPS from Continuing Operations
2006
2007
Note: Comparable EPS exclude gains on insurance recoveries and Conrail property, and income tax benefits
22%
Increase
14%
Increase
6

Operations Review
Tony Ingram
Executive Vice President
Chief Operating Officer
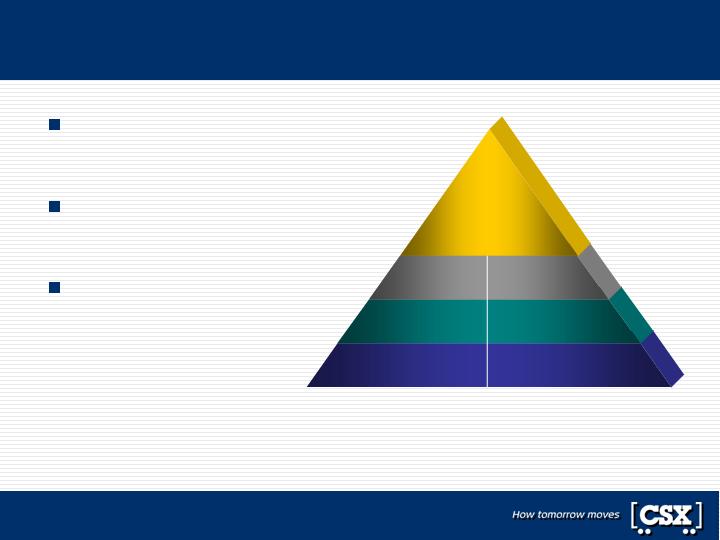
Leadership, discipline and execution
Safety results at historical best
and improving
Productivity gains driving the
operating ratio lower
Network performance and
service at all-time highs
Safety
Productivity
Service
Leadership
Discipline
Execution
Performance
Excellence
8
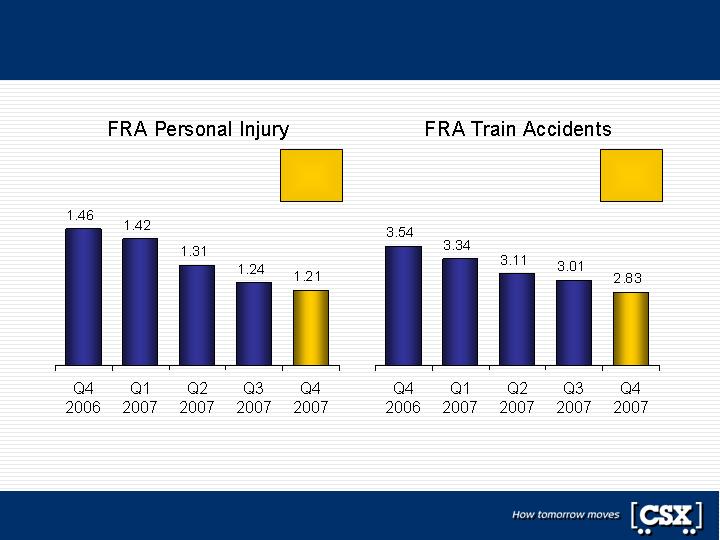
Helping lead one of the nation’s safest industries
Rolling 12-Month Averages
13 Week
Average
1.26
13 Week
Average
2.85
9
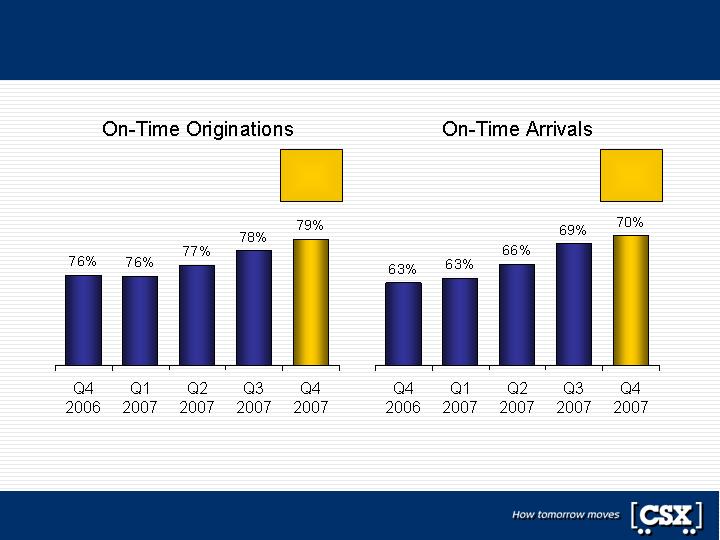
On-time performance at all-time highs
Rolling 12-Month Averages
13 Week
Average
81%
13 Week
Average
73%
10

Network efficiency provides strong service product
Rolling 12-Month Averages
13 Week
Average
21.2 mph
13 Week
Average
22.2 hrs
11
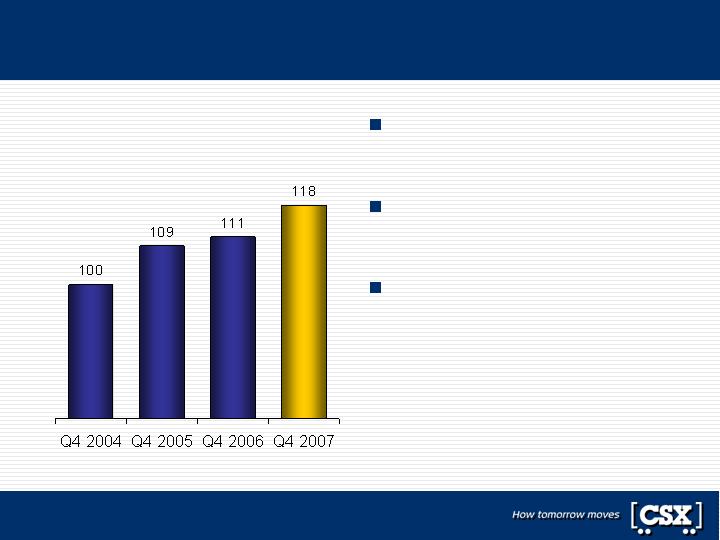
Customer satisfaction levels remain at high levels
Best results since inception of
third-party survey
Correlates to internal
operating measure gains
Strong service supports
pricing initiatives
Customer Satisfaction
Indexed: 2004 = 100
12
Operations wrap-up . . .
Taking safety performance to the next level
Service reliability delivering value for customers
Driving productivity to lower the operating ratio
13

Sales and Marketing Review
Clarence Gooden
Executive Vice President
Sales and Marketing
Revenues increased 8% to nearly $2.6 billion
Record quarterly Surface
Transportation revenues
Improved service enabling
revenue growth
Yield management continues
to offset softer volumes
Uninterrupted revenue growth
for nearly 6 years
15
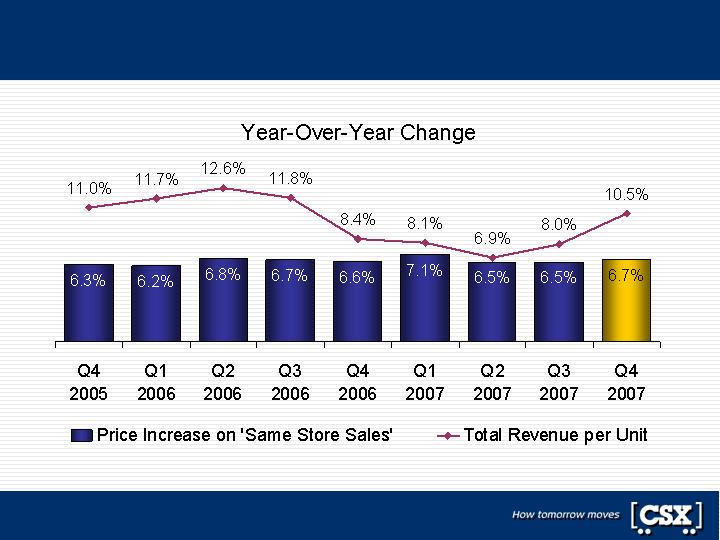
Price continues to drive RPU growth
Note: ‘Same Store Sales’ price increases exclude impacts from fuel and mix
16
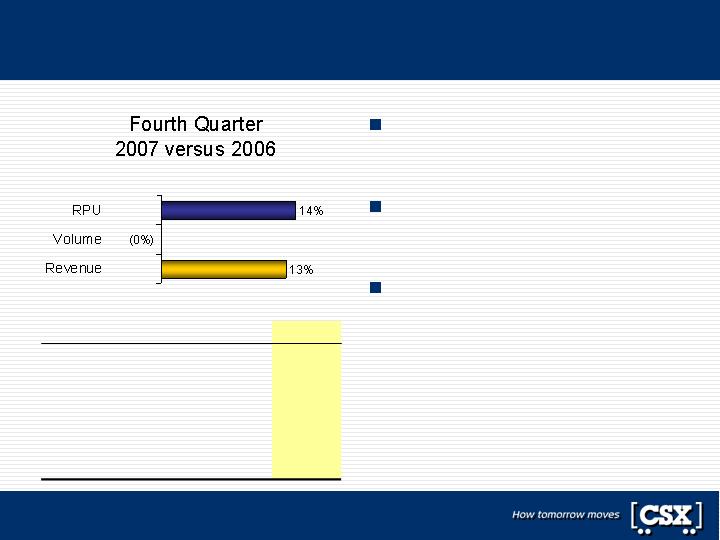
Merchandise revenue increases 7%
Yield management continues
to offset softer volumes
Continued softness in
housing/auto related markets
Strength in agriculture,
phosphates, and chemicals
2006
Change
2007
RPU
$ 1,736
$ 195
$ 1,931
Volume
(thousands)
675
(25)
650
Revenue
(millions)
$ 1,172
$ 83
$ 1,255
17
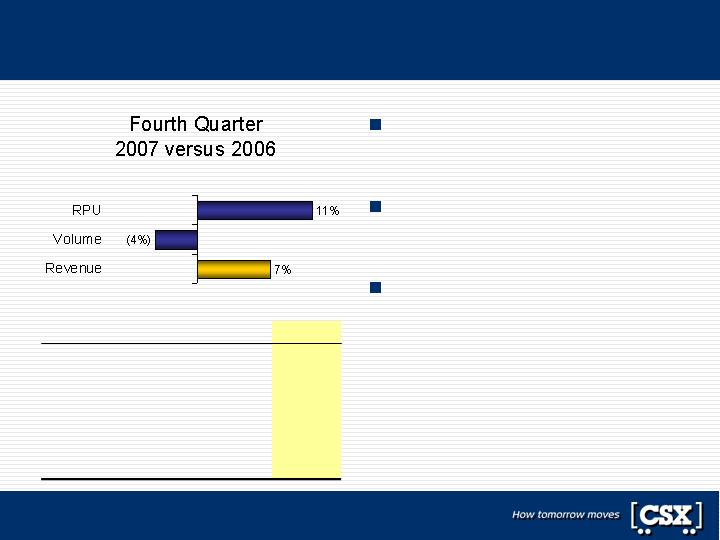
Coal revenue increases 13%
Export strength offsets
decline in utility market
Tons shipped up nearly 1%
on flat carload volume
Overall pricing environment
remains favorable
2006
Change
2007
RPU
$ 1,282
$ 174
$ 1,456
Volume
(thousands)
471
(2)
469
Revenue
(millions)
$ 604
$ 79
$ 683
18
Automotive revenue increases over 2%
Softer economy and tight
credit impacting auto sales
Big-3 production decline
drove CSX volumes
2006
Change
2007
RPU
$ 1,875
$ 97
$ 1,972
Volume
(thousands)
112
(3)
109
Revenue
(millions)
$ 210
$ 5
$ 215
19
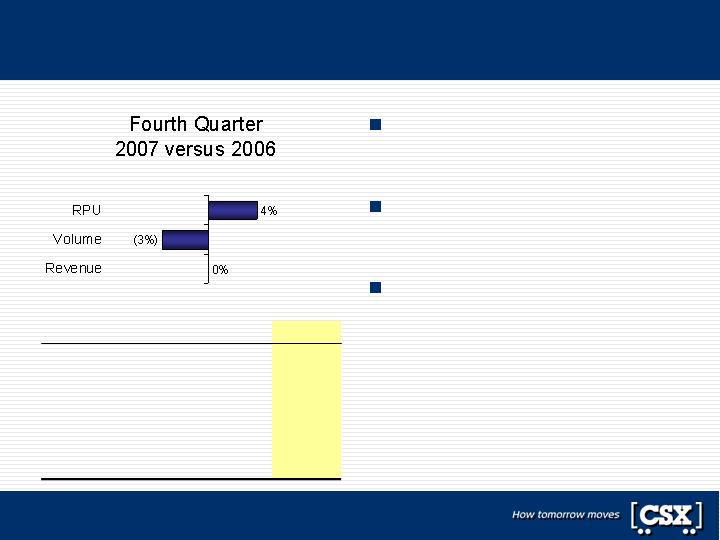
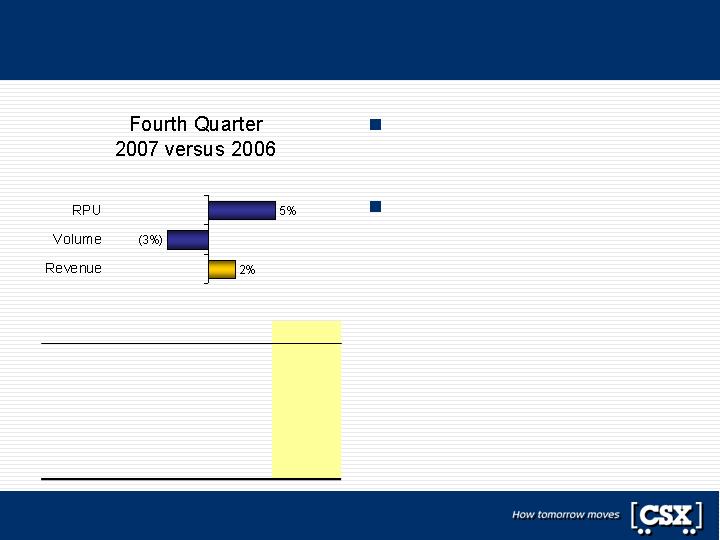
Intermodal revenue is flat on lower volumes
Revenue was flat as yields
and mix offset volume losses
International down on slowing
imports/customer losses
Domestic traffic improved on
new services/new terminal
2006
Change
2007
RPU
$ 649
$ 23
$ 672
Volume
(thousands)
552
(19)
533
Revenue
(millions)
$ 358
$ 0
$ 358
20
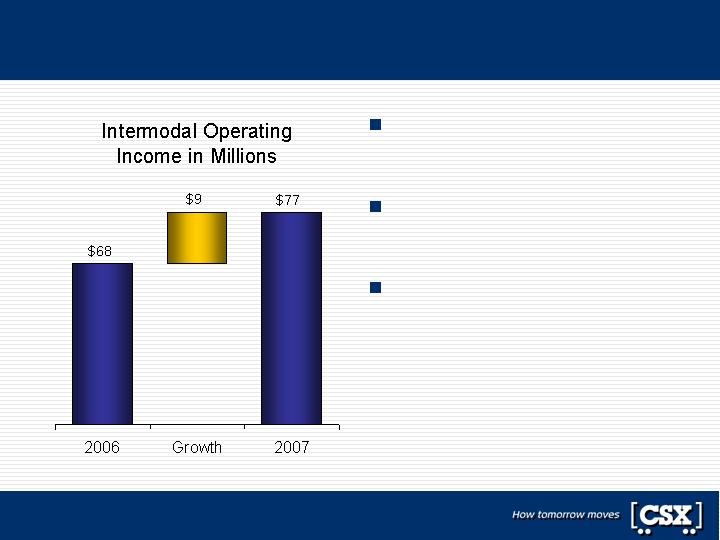
Intermodal reports record fourth quarter profit
Bottom line focus drove
record fourth quarter results
Cost control driven by greater
efficiency and productivity
Operating ratio improved 2.5
points to 78.5%
21
First quarter revenue outlook is positive
Favorable
Neutral
Unfavorable
Agricultural Products
Chemicals
Coal, Coke & Iron Ore
Metals
Phosphate & Fertilizer
Automotive
Emerging Markets
Intermodal
Food & Consumer
Forest Products
22

Financial Results
Oscar Munoz
Executive Vice President
Chief Financial Officer
Strong fourth quarter results . . .
$ 0.11
$ 0.75
$ 0.86
Earnings Per Share
$ 18
$ 347
$ 365
Net Income
)
)
102
14
(16
(82
507
62
99
123
609
76
115
205
Consolidated Operating Income
Other Income (net)
Interest Expense
Income Taxes
)
104
(2
505
2
609
-
Surface Transportation Operating Income
Other Operating Income
)
$ 181
(77
$ 2,396
1,891
$ 2,577
1,968
Revenue
Expense
Variance
2006
2007
Dollars in Millions, Except EPS
Fourth Quarter Results
24
Comparable operating income increases 26%
$ 123
$ 478
$ 601
Comparable Operating Income
$ 104
19
)
$ 505
(27
)
$ 609
(8
Surface Transportation Operating Income
Less Gain on Insurance Recoveries
$ 0.28
$ 0.57
$ 0.85
Comparable Earnings Per Share
$ 0.11
0.03
0.06
0.08
)
)
)
$ 0.75
(0.04
(0.06
(0.08
)
$ 0.86
(0.01
-
-
Earnings Per Share
Less Gain on Insurance Recoveries
Less Gain on Conrail Property After-tax
Less Income Tax Benefits
Variance
2006
2007
Dollars in Millions, Except EPS
Fourth Quarter Results
25
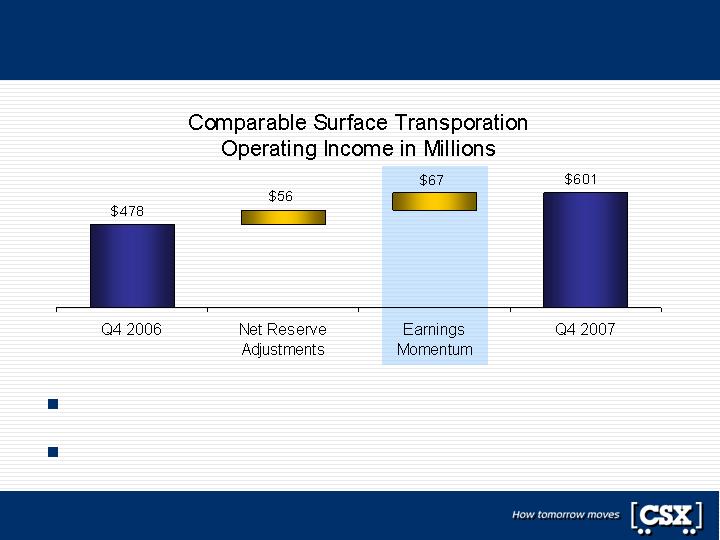
Key fourth quarter operating income drivers . . .
Improving safety performance lowers reserve requirements
Revenue strength and cost control overcome impact of fuel headwind
Note: Exclude gains from insurance recoveries in 2006 and 2007
26
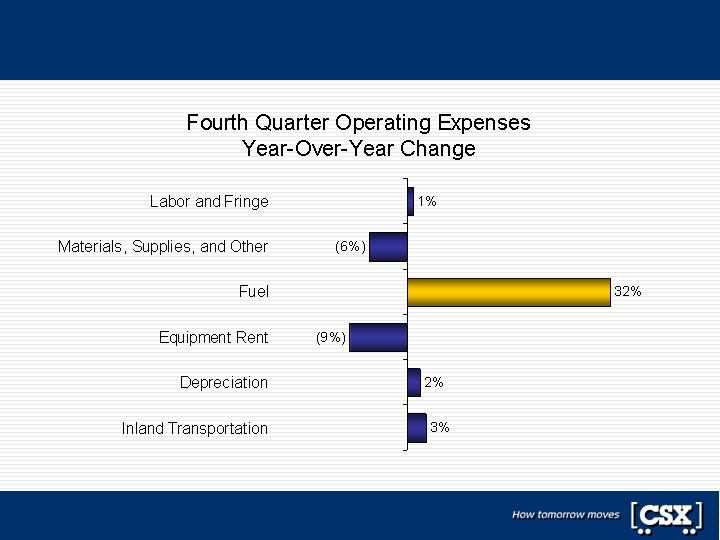
Expenses up 3% overall; down 2% excluding fuel
Note: Results exclude gains from insurance recoveries
27
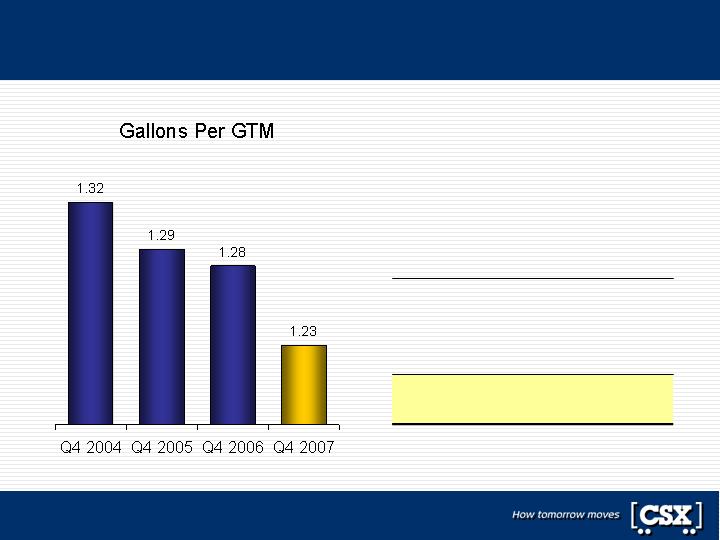
Fuel price more than offsets efficiency and volume
$ 357
2007 Fuel Expense
)
)
104
(9
(9
Increase in Price
Change in Volume/Mix
Fuel Efficiency
$ 271
2006 Fuel Expense
Fourth Quarter
Fuel Analysis in Millions
28
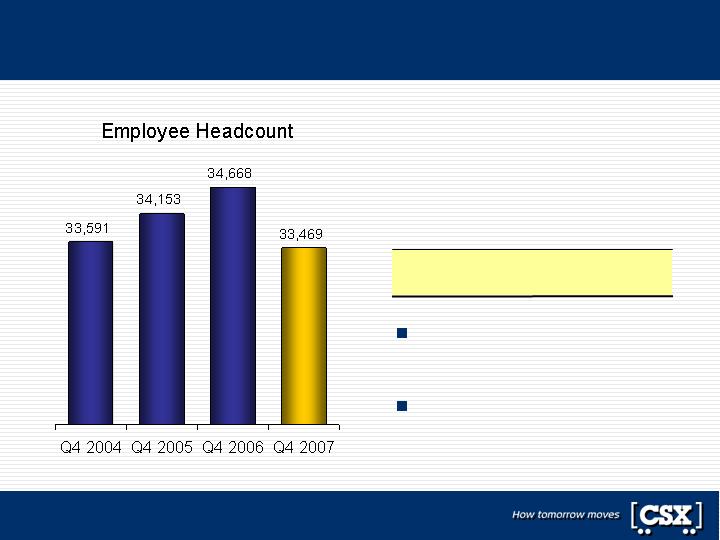
Labor and Fringe increased 1%
Fourth Quarter
Labor and Fringe in Millions
2006 Labor and Fringe $ 753
Year-over-year change 6
2007 Labor and Fringe $ 759
Wage and benefit inflation
totaled $22 million
Rightsizing resources drove
3% lower headcount
Note: Headcount reflects the company’s Surface Transportation businesses
29
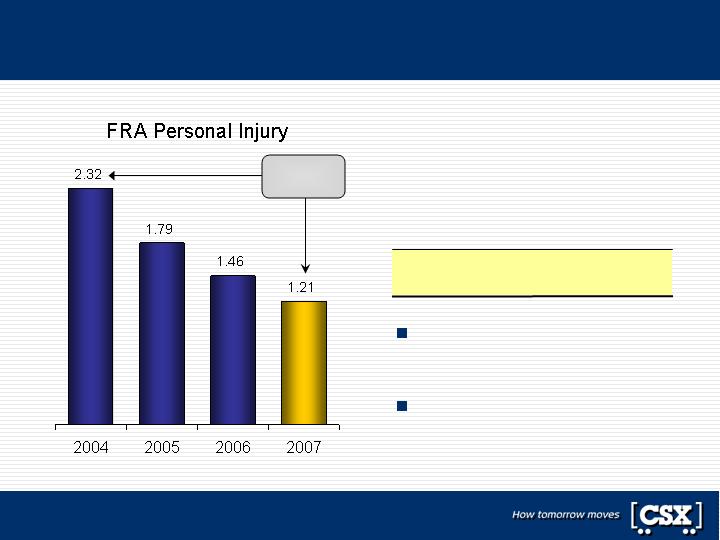
MS&O declines on lower personal injuries
Fourth Quarter
MS&O in Millions
2006 MS&O $ 496
Year-over-year change (29)
2007 MS&O $ 467
Sustained improvements in
safety lower net reserves
Partially offset by inflation
and derailment costs
48%
Improvement
30
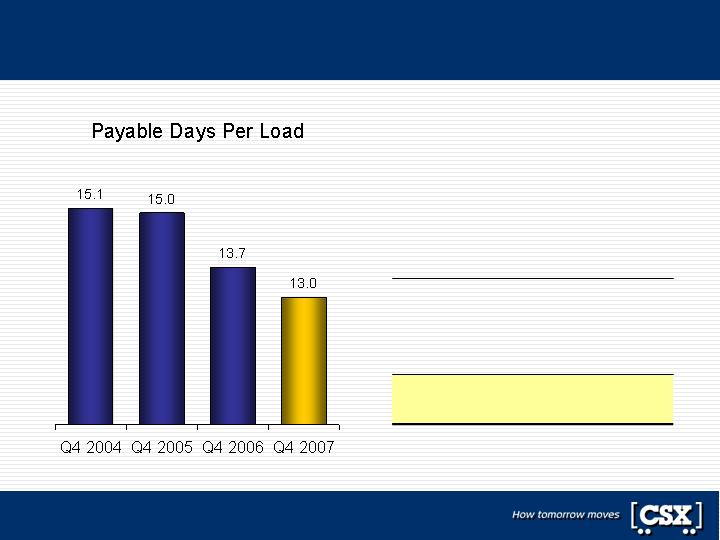
Rents decline on volume and productivity
$ 110
2007 Rent Expense
)
)
3
(10
(4
Inflation
Volume/Mix/Other
Equipment Utilization
$ 121
2006 Rent Expense
Fourth Quarter
Rents Analysis in Millions
Note: Reflects equipment utilization in the carload network on freight cars where CSX incurs rent
31
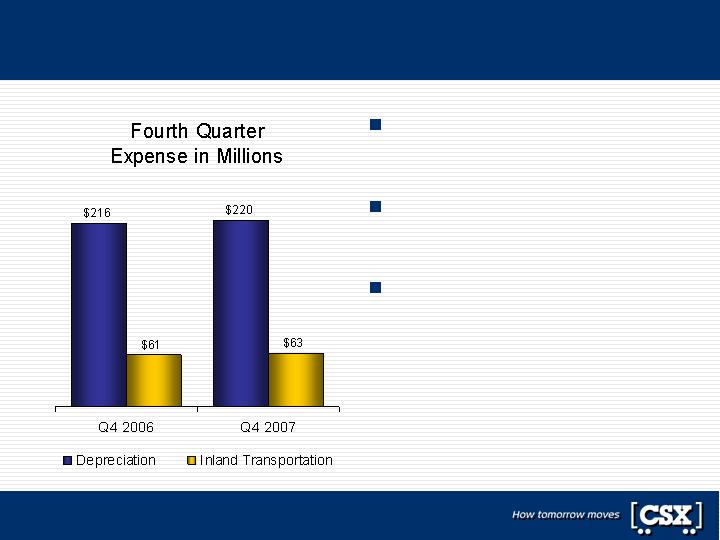
Other expenses increase 2%
Higher capital base increased
depreciation expense
Partially offset by lower rates
from asset life studies
Increased trucking expenses
driving inland transportation
32
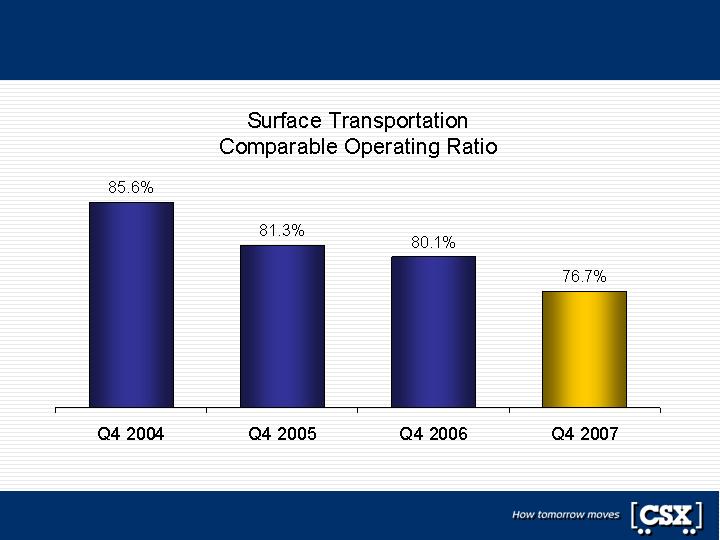
Price and productivity driving operating ratio lower
Note: Exclude gains from insurance recoveries in 2006 and 2007
33
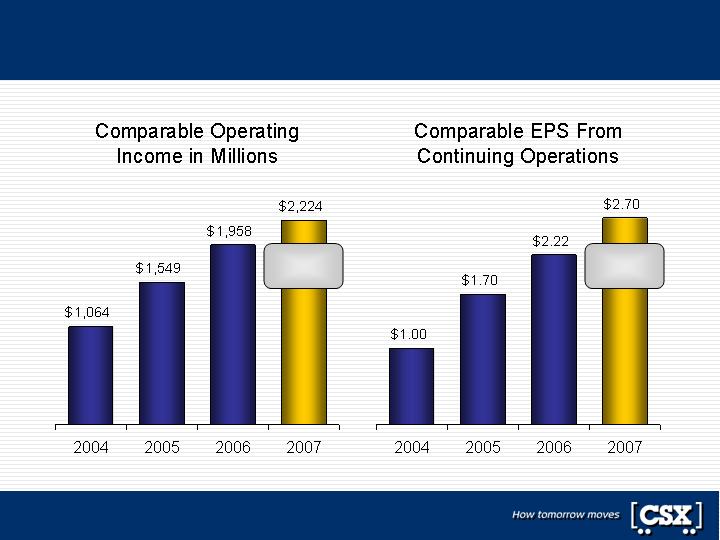
Full-year results reflect strong double-digit growth
14%
Increase
22%
Increase
Note: Exclude management restructuring, gains on insurance recoveries and Conrail property, and income tax benefits
34
Full-year Free Cash Flow . . .
Generated $145 million in 2007
Consistent with $100+ million target outlined at
September Investor Conference
Stronger earnings and cash flows supported:
Locomotive capital investment
Pension contribution
Dividend increases
35
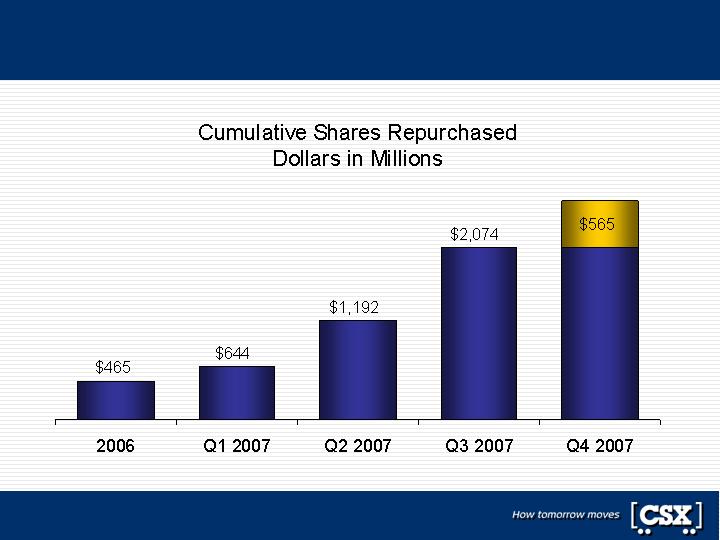
Cash flows and capital structure support buyback
Note: Approximately $2.1 billion of the $2.6 billion has been repurchased under the current $3.0 billion program
$2,639
36
Double-digit growth targeted off record 2007 base
$800M – $1B
in 2010
Free Cash Flow
Before Dividends
Mid-low 70’s
by 2010
Operating Ratio
15% – 17%
CAGR
Earnings Per Share
10% – 12%
CAGR
Operating Income
2008 – 2010
Guidance
37
Concluding Remarks
Michael Ward
Chairman, President and
Chief Executive Officer
Looking forward . . .
Delivering superior long-term value for shareholders
Leveraging the growing secular strength of the industry
Driving greater cost efficiency through productivity
Capitalizing on growth potential with key investments
Building on momentum to produce record 2008 results
Relentless Pursuit of Excellence
39

Fourth Quarter 2007
Earnings Conference Call
40