First Quarter 2008
Earnings Conference Call
Exhibit 99.1

Proxy Statement Disclosure
On February 22, 2008, CSX Corporation ("CSX") filed with the SEC a revised preliminary proxy statement in connection
with its 2008 Annual Meeting. CSX plans to file with the SEC and furnish to its shareholders a definitive Proxy
Statement in connection with its 2008 Annual Meeting, and advises its security holders to read the definitive Proxy
Statement when it becomes available, because it will contain important information. Security holders may obtain a free
copy of the definitive Proxy Statement and other documents (when available) that CSX files with the SEC at the SEC’s
website at www.sec.gov. The definitive Proxy Statement and these other documents may also be obtained for free from
CSX by directing a request to CSX Corporation, Attn: Investor Relations, David Baggs, 500 Water Street C110,
Jacksonville, FL 32202.
CSX, its directors, director nominee and certain named executive officers and employees may be deemed to be
participants in the solicitation of CSX’s security holders in connection with its 2008 Annual Meeting. Security holders
may obtain information regarding the names, affiliations and interests of such individuals in CSX’s revised preliminary
proxy statement filed on February 22, 2008 with the SEC.
2

Executive Summary
Michael Ward
Chairman, President and
Chief Executive Officer

Forward-Looking Disclosure
This information and other statements by the company contain forward-looking statements within the meaning of the
Private Securities Litigation Reform Act with respect to, among other items: projections and estimates of earnings,
revenues, cost-savings, expenses, or other financial items; statements of management’s plans, strategies and
objectives for future operation, and management’s expectations as to future performance and operations and the time
by which objectives will be achieved; statements concerning proposed new products and services; and statements
regarding future economic, industry or market conditions or performance. Forward-looking statements are typically
identified by words or phrases such as “believe,” “expect,” “anticipate,” “project,” “estimate” and similar expressions.
Forward-looking statements speak only as of the date they are made, and the company undertakes no obligation to
update or revise any forward-looking statement. If the company does update any forward-looking statement, no
inference should be drawn that the company will make additional updates with respect to that statement or any other
forward-looking statements.
Forward-looking statements are subject to a number of risks and uncertainties, and actual performance or results could
differ materially from that anticipated by these forward-looking statements. Factors that may cause actual results to
differ materially from those contemplated by these forward-looking statements include, among others: (i) the company’s
success in implementing its financial and operational initiatives, (ii) changes in domestic or international economic or
business conditions, including those affecting the rail industry (such as the impact of industry competition, conditions,
performance and consolidation); (iii) legislative or regulatory changes; (iv) the inherent business risks associated with
safety and security; and (v) the outcome of claims and litigation involving or affecting the company.
Other important assumptions and factors that could cause actual results to differ materially from those in the forward-
looking statements are specified in the company’s SEC reports, accessible on the SEC’s website at www.sec.gov and
the company’s website at: http://investors.csx.com/
4
First quarter overview . . .
Delivered record Q1 revenues,
operating income and EPS
Raised safety and customer
service to record levels
Produced best-ever Q1
operating ratio of 77%
Increased dividend, buyback
and financial targets
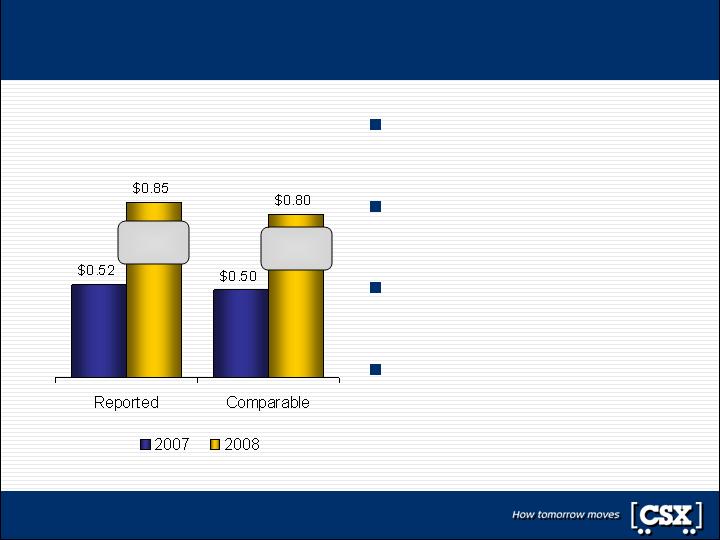
First Quarter
Earnings Per Share
60%
Increase
Note: Comparable results exclude gains from insurance recoveries and a non-cash equity earnings adjustment
63%
Increase
5

Operations Review
Tony Ingram
Executive Vice President
Chief Operating Officer
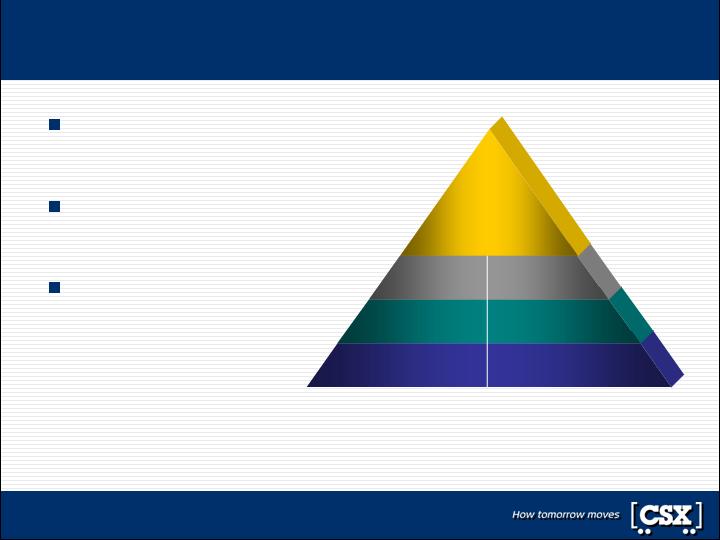
Leadership, discipline and execution
Safety performance improves
to record levels
Productivity helping drive the
operating ratio lower
Customer service improves
to record levels
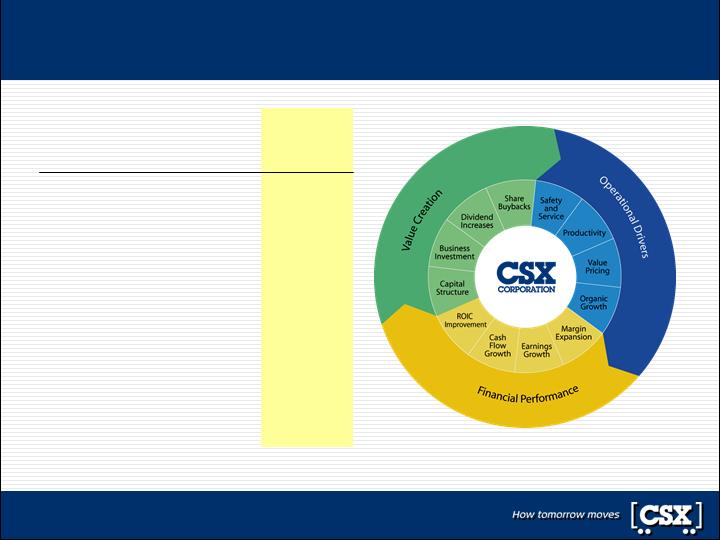
Safety
Productivity
Service
Leadership
Discipline
Execution
Performance
Excellence
7
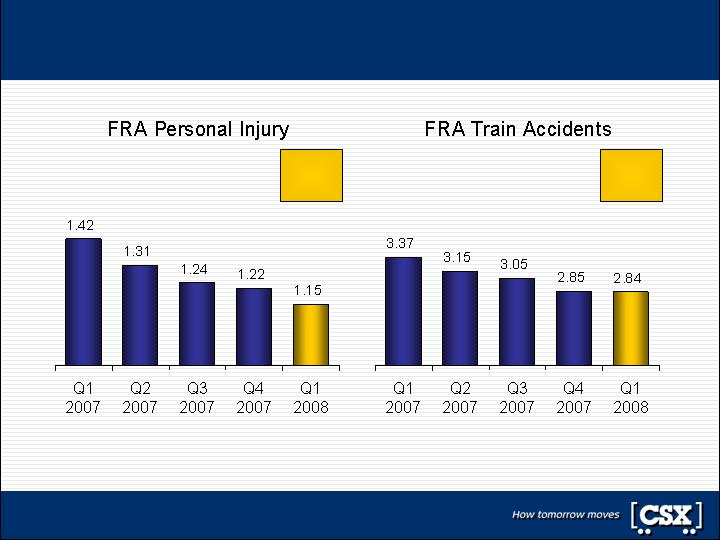
Helping lead one of the nation’s safest industries
Rolling 12-Month Averages
13 Week
Average
1.10
13 Week
Average
3.04
8
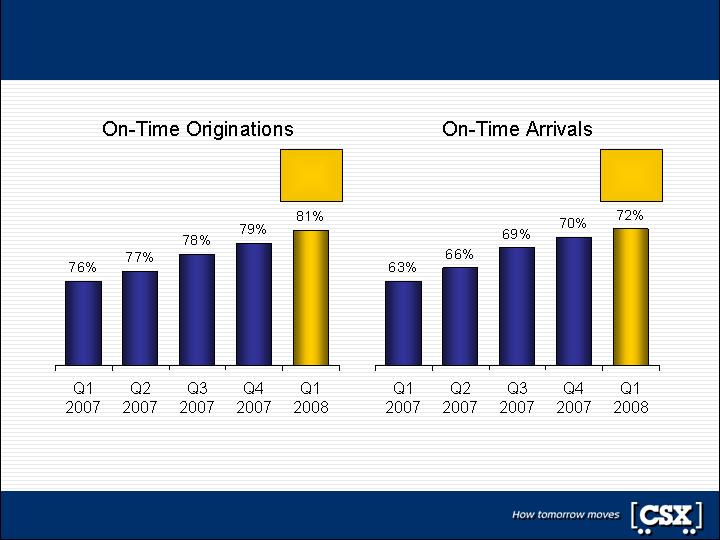
On-time performance at all-time highs
Rolling 12-Month Averages
13 Week
Average
79%
13 Week
Average
69%
9
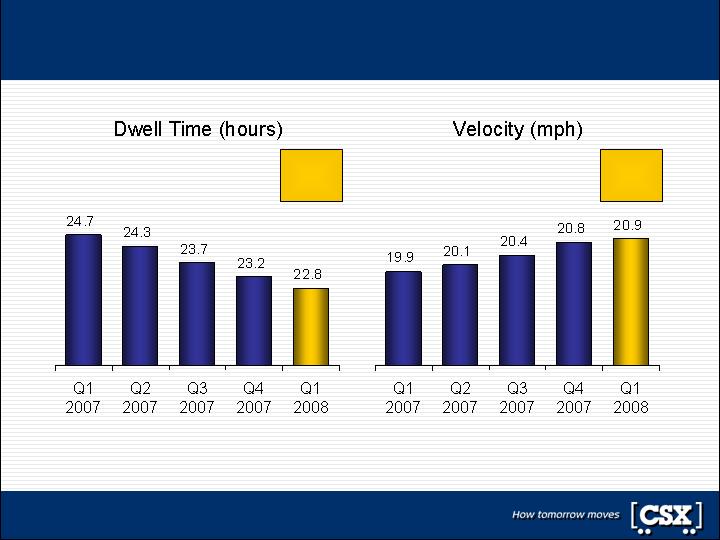
Network efficiency provides strong service product
Rolling 12-Month Averages
13 Week
Average
20.8 mph
13 Week
Average
22.7 hrs
10
Operations wrap-up . . .
Driving safety momentum to record levels
Rightsizing resources to current business levels
On-track with Total Service Integration roll-out
Taking service and productivity to the next level
11

Sales and Marketing Review
Clarence Gooden
Executive Vice President
Sales and Marketing
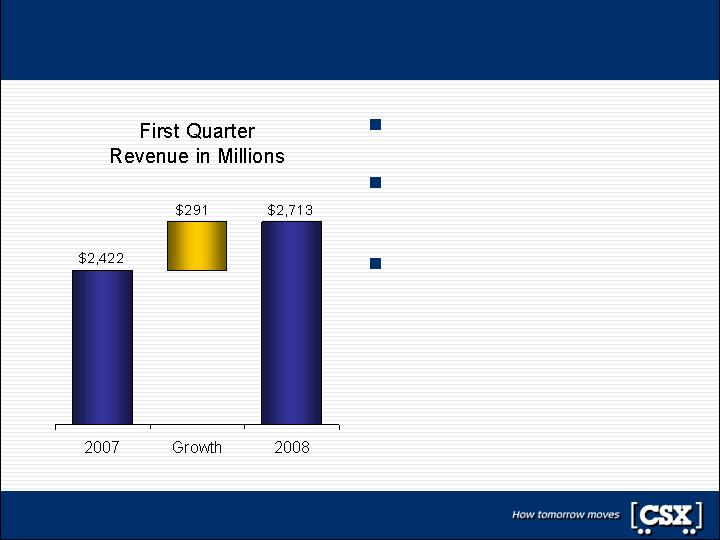
Revenues increased 12% to over $2.7 billion
Record first quarter revenues
Strong service continues to
drive revenue growth
Yield management and fuel
recovery offset softer volume
13
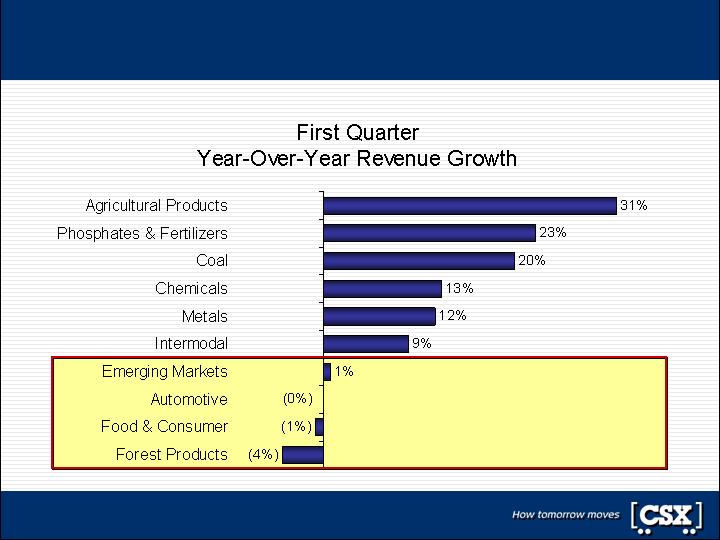
Revenue growth is strong across most markets
Revenues impacted by
the continued softness in
the housing and automotive
sectors of the economy
14
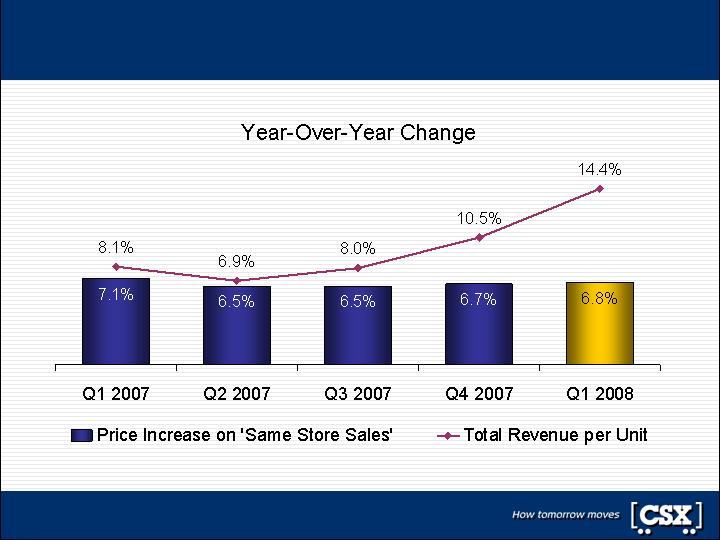
Price continues to drive RPU growth
Note: ‘Same Store Sales’ price increases exclude impacts from fuel and mix
15
Merchandise revenue increases 11%
Yield management continues
to offset softer volumes
Continued softness in
housing and auto sectors
All-time record revenue in
agriculture products
Further strength in fertilizer,
chemicals and metals
2007
Change
2008
RPU
$ 1,791
$ 274
$ 2,065
Volume
(thousands)
675
(25)
650
Revenue
(millions)
$ 1,209
$ 133
$ 1,342
16
Coal revenue increases 20%
Strength in exports offset
decline in utility market
Tons shipped increase 1% on
flat carload volume
Price, fuel recovery and mix
drove strong revenue growth
Overall pricing environment
remains favorable
2007
Change
2008
RPU
$ 1,370
$ 276
$ 1,646
Volume
(thousands)
462
1
463
Revenue
(millions)
$ 633
$ 129
$ 762
17
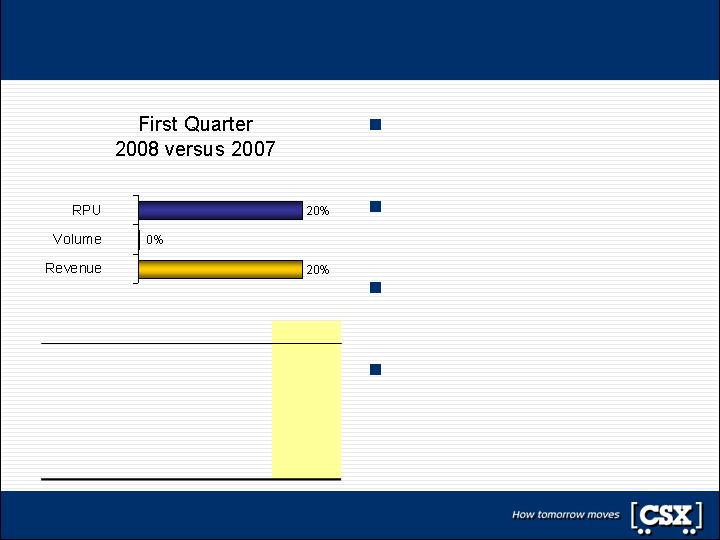
Automotive revenue flat
Softer demand and tight
credit impacting auto sales
Lower production at CSX
plants impacted volumes
Revenues flat on higher
prices and fuel recovery
2007
Change
2008
RPU
$ 1,862
$ 242
$ 2,104
Volume
(thousands)
109
(13)
96
Revenue
(millions)
$ 203
($ 1)
$ 202
18
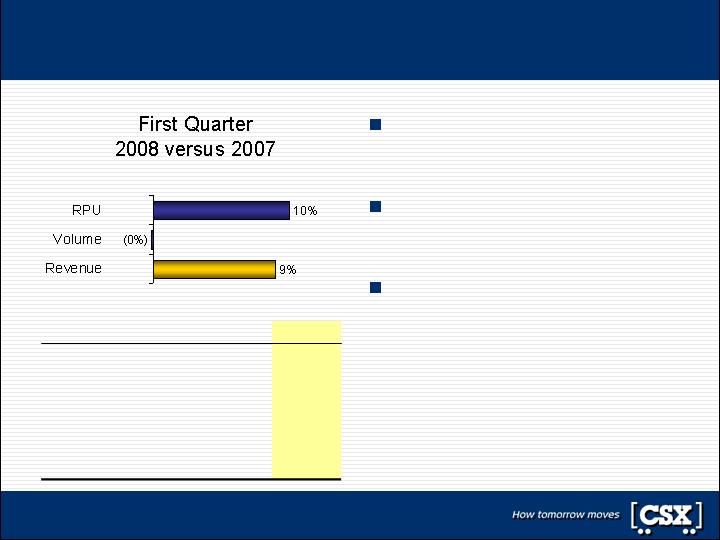
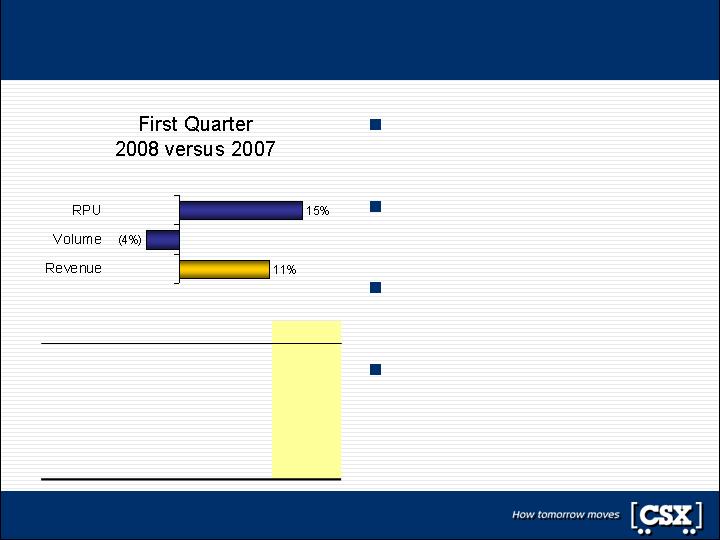
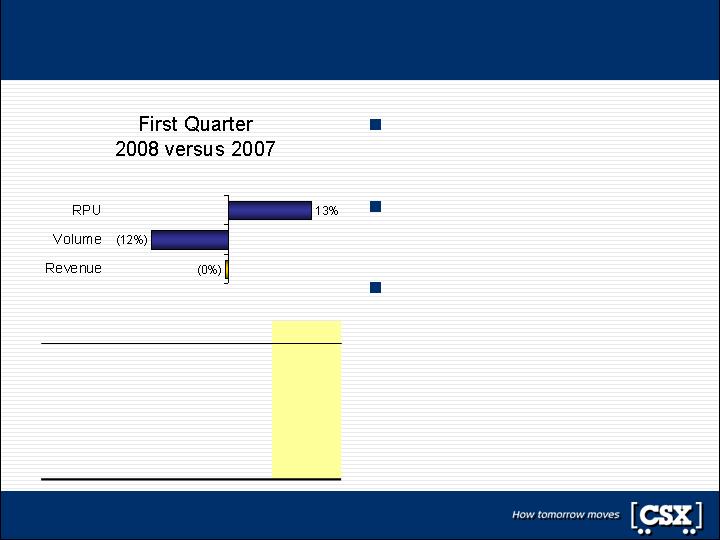
Intermodal revenue increases 9%
RPU increase driven by fuel
recovery and mix
Domestic traffic gains offset
International weakness
Domestic revenue increased
on Transcontinental growth
2007
Change
2008
RPU
$ 625
$ 60
$ 685
Volume
(thousands)
509
(1)
508
Revenue
(millions)
$ 318
$ 30
$ 348
19
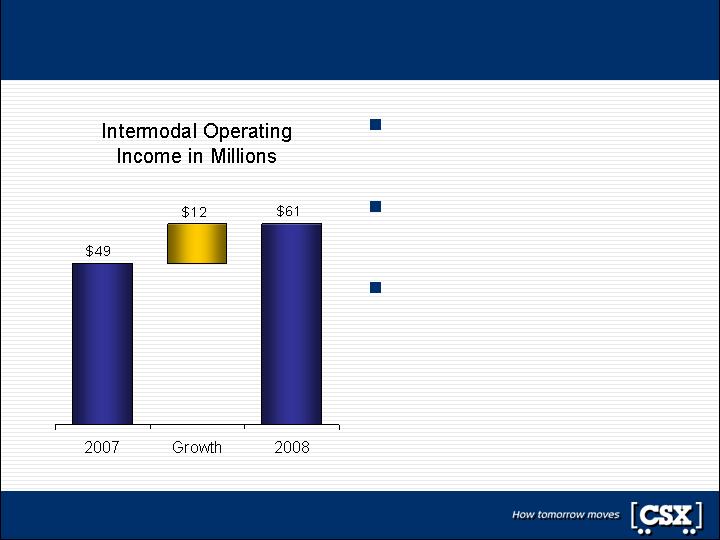
Intermodal reports strong first quarter profit
Bottom-line focus increases
operating income nearly 25%
Operating initiatives continue
to offset rising fuel costs
Operating ratio improves
210 bps to 82.5%
20
Second quarter revenue outlook is positive
Favorable
Neutral
Unfavorable
Agricultural Products
Chemicals
Coal, Coke & Iron Ore
Metals
Phosphate & Fertilizer
Emerging Markets
Food & Consumer
Intermodal
Automotive
Forest Products
21

Financial Results
Oscar Munoz
Executive Vice President
Chief Financial Officer
Double-digit growth in operating income and EPS
Variance
2007
2008
Dollars in millions, except EPS
$ 141
$ 485
$ 626
Operating Income
48.0
$ 0.33
463.2
$ 0.52
415.2
$ 0.85
Fully Diluted Shares in Millions
Earnings Per Share
$ 111
$ 240
$ 351
Net Income
)
)
63
(20
(73
)
)
)
(8
(99
(138
)
)
55
(119
(211
Other Income (net)
Interest Expense
Income Taxes
)
$ 291
(150
$ 2,422
1,937
$ 2,713
2,087
Revenue
Expense
First Quarter Results
23

Comparable earnings per share increase 60%
Variance
2007
2008
Dollars in millions, except EPS
$ 0.30
$ 0.50
$ 0.80
Comparable Earnings Per Share
$ 157
$ 467
$ 624
Comparable Operating Income
$ 141
16
)
$ 485
(18
)
$ 626
(2
Operating Income
Less Gain on Insurance Recoveries
)
$ 0.33
0.02
(0.05
)
$ 0.52
(0.02
-
)
$ 0.85
-
(0.05
Earnings Per Share
Less Gain on Insurance Recoveries
Less Equity Earnings Adjustment
First Quarter Results
24
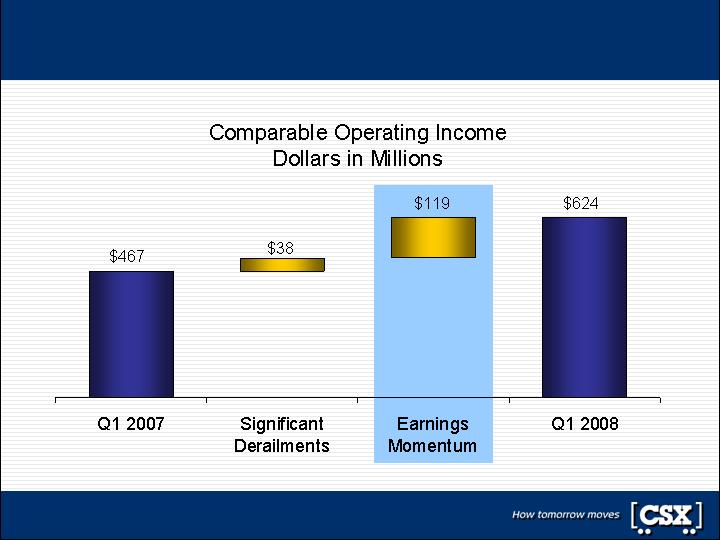
Core earning power increases 25%
Note: Comparable operating income excludes gains from insurance recoveries
25

Operating ratio improves 370 basis points
Margin expansion driven by:
Yield management
Operating efficiencies
Diversity of portfolio helps
overcome softer economy
370 bps
Improvement
Note: Comparable operating ratio excludes gains from insurance recoveries
26
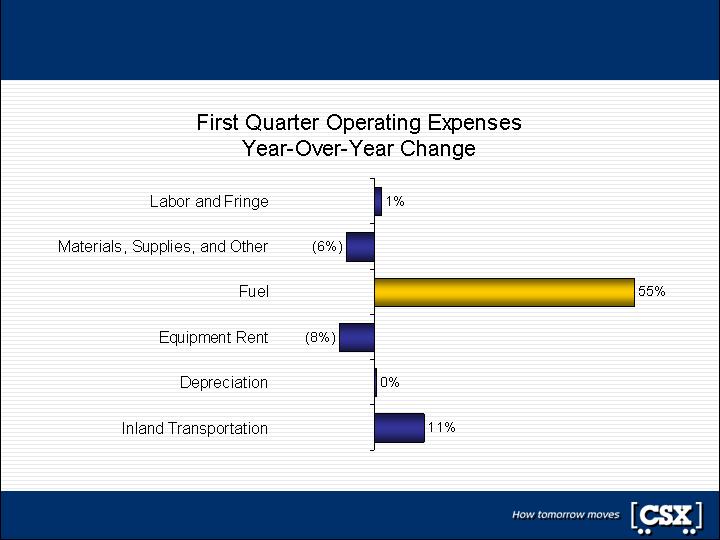
Expenses up 7% overall; down 1% excluding fuel
Note: Results exclude gains from insurance recoveries
27
Fuel price more than offsets efficiency and volume
$ 441
2008 Fuel Expense
)
)
157
(1
(10
11
Increase in Price
Change in Volume/Mix
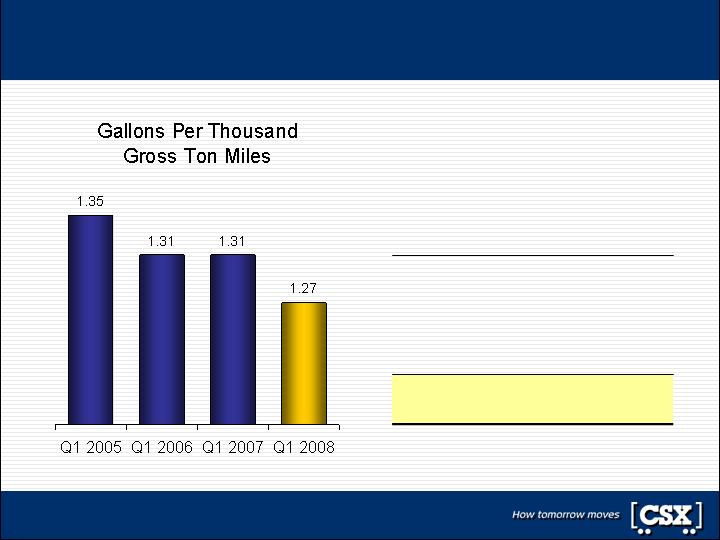
Fuel Efficiency
Net Non-locomotive Fuel
$ 284
2007 Fuel Expense
First Quarter
Fuel Analysis in Millions
28
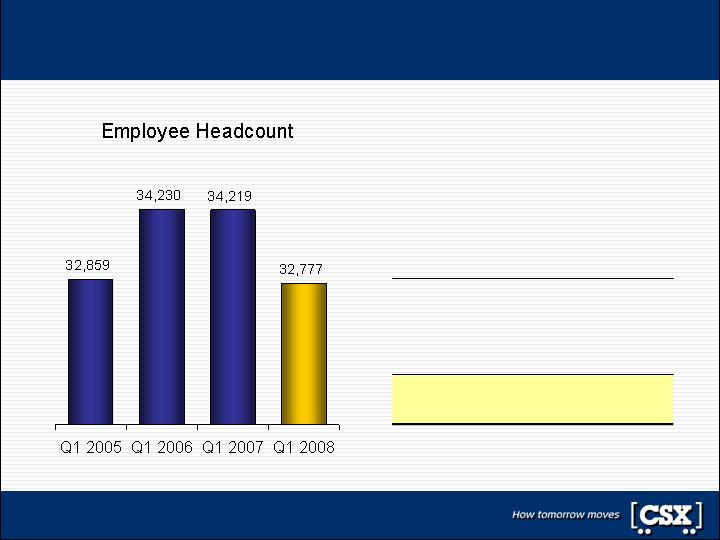
Labor and Fringe held to 1% increase
Note: Headcount reflects the company’s transportation businesses only
$ 745
2008 Labor Expense
)
22
12
(23
Wage & Benefit Inflation
Incentive Compensation
Labor Productivity, Other
$ 734
2007 Labor Expense
First Quarter
Labor Analysis in Millions
29
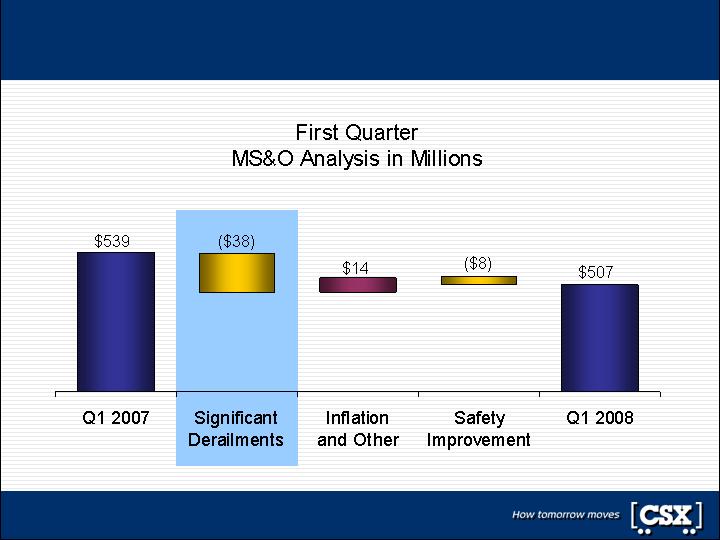
MS&O declines 6% on lower derailment costs
30
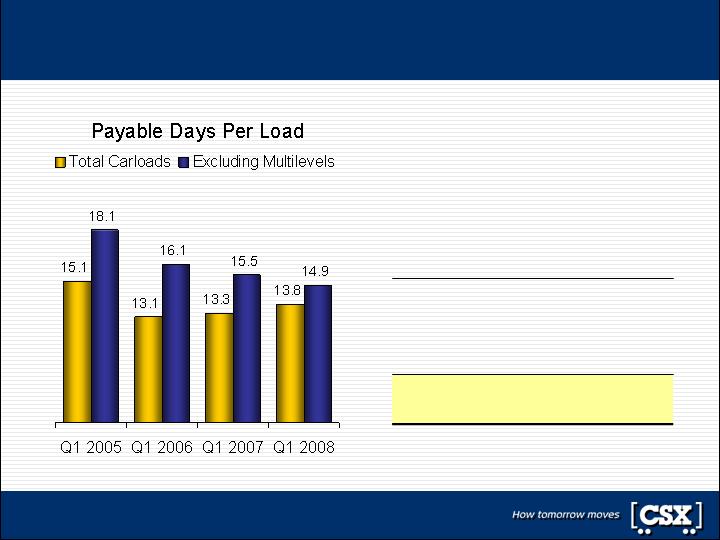
Rent expenses decline 8%
Note: Reflects equipment utilization in the carload network on freight cars where CSX incurs rent
$ 111
2008 Rent Expense
)
1
(12
2
Inflation
Volume/Other
Equipment Utilization
$ 120
2007 Rent Expense
First Quarter
Rents Analysis in Millions
31
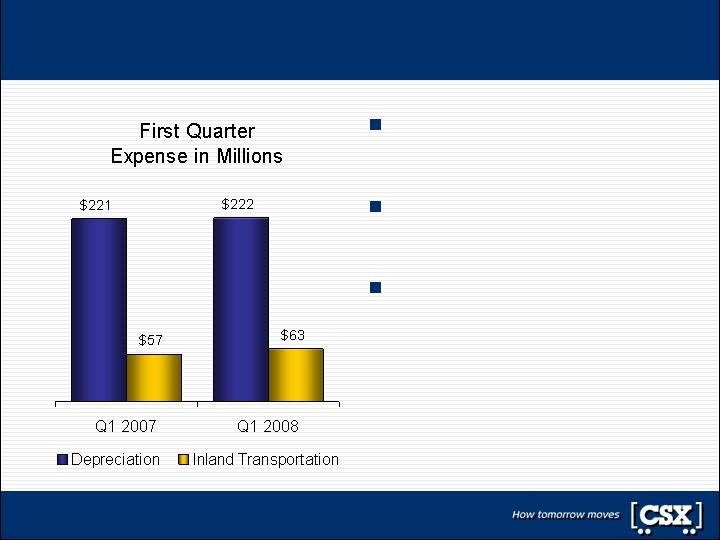
Other expenses increase 3%
Higher capital base increased
depreciation expense
Mostly offset by lower rates
from asset life studies
Inland Transportation driven
by transcontinental volumes
32
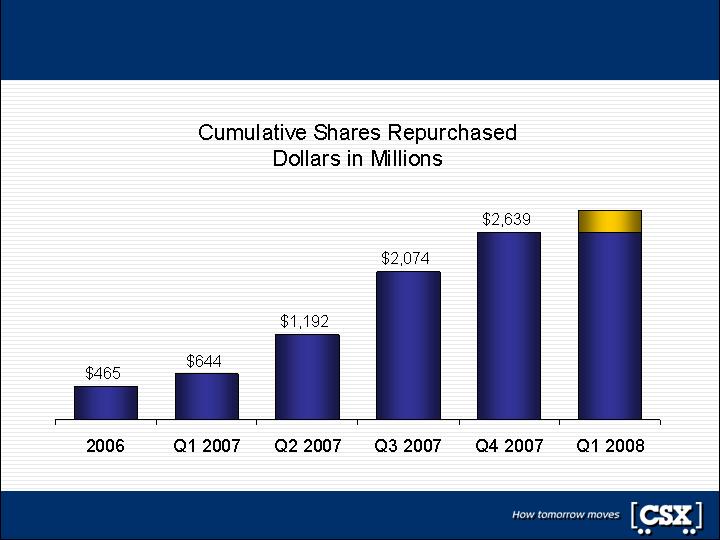
Nearly $3 billion of stock repurchased since 2006
$2,939
Note: Includes $2.4B purchased under the $3.0 billion program authorized in 2007 and $0.5B under prior programs
33
Recent actions reflect long-term confidence
$3.0 Billion
Share Buyback Program
Targeting completion by
fiscal year-end 2009
Builds on nearly $3 billion
repurchased since 2006
Consistent with BBB-/Baa3
capital structure objectives
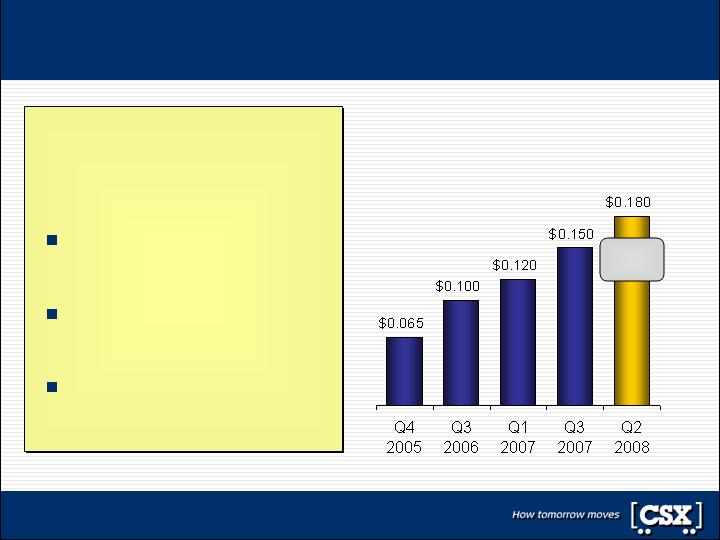
20%
Increase
Quarterly Dividend
Nearly Tripled Since 2005
34
Full-year earnings per share guidance driven by:
Same store sales price growth of 6%+
Continued productivity gains
Diverse portfolio of business
Targeting high-end of $3.40 – $3.60 EPS range
on a comparable basis
Update on full-year 2008 earnings guidance . . .
35
Long-term financial targets through 2010 . . .
Exceed $1B
in 2010
$800M– $1B
in 2010
Free Cash Flow
Before Dividends
Low 70’s
By 2010
Mid-Low
70’s by 2010
Operating Ratio
18%–21%
CAGR
15%–17%
CAGR
Earnings Per Share
13%–15%
CAGR
10%–12%
CAGR
Operating Income
Current
2008–2010
Targets
Previous
2008–2010
Targets
Note: Compound annual growth rates are off comparable 2007 results; EPS targets are stated before share buybacks
36

Concluding Remarks
Michael Ward
Chairman, President and
Chief Executive Officer
Relentless pursuit of excellence . . .
38

Appendix

GAAP Reconciliation Disclosure
CSX reports its financial results in accordance with generally accepted accounting principles (“GAAP”). However,
management believes that certain non-GAAP financial measures used to manage the company’s business that fall
within the meaning of Regulation G (Disclosure of Non-GAAP Financial Measures) by the SEC may provide users of
the financial information with additional meaningful comparisons to prior reported results.
In press releases and presentation slides for stock analysts, CSX has provided operating income, operating ratio and
earnings per share adjusted for certain items, which are non-GAAP financial measures. The company’s management
evaluates its business and makes certain operating decisions (e.g. budgeting, forecasting, employee compensation,
asset management, and resource allocation) using these adjusted numbers.
Likewise, this information facilitates comparisons to financial results that are directly associated with ongoing
business operations as well as provides comparable historical information. Lastly, earnings forecasts prepared by
stock analysts and other third parties generally exclude the effects of items that are difficult to predict or measure in
advance and are not directly related to CSX’s ongoing operations. A reconciliation between GAAP and non-GAAP
measures is provided on the following slide. These non-GAAP measures should not be considered a substitute for
the company’s GAAP measures.
40
GAAP reconciliation to comparable results
)
$ 291
(150
$ 2,422
1,937
$ 2,713
2,087
Revenue
Expense
$ 0.30
$ 0.50
$ 0.80
Comparable Earnings Per Share
)
$ 0.33
0.02
(0.05
)
$ 0.52
(0.02
-
)
$ 0.85
-
(0.05
Earnings Per Share
Less Gain on Insurance Recoveries
Less Equity Earnings Adjustment
$ 157
3.7%
$ 467
80.7%
$ 624
77.0%
Comparable Operating Income
Comparable Operating Ratio
$ 141
16
)
$ 485
(18
)
$ 626
(2
Operating Income
Less Gain on Insurance Recoveries
Variance
2007
2008
41
First Quarter 2008
Earnings Conference Call