EXHIBIT 99.1
2002 Financial Supplement
The Financial Supplement provides additional explanatory information for CSX Corporation and its business components and additional data for analysis that may not be available in the Company’s annual report. This information is derived from the Company’s audited financial statements and other books and records of the Company, but should not be considered audited. The data provided is not considered to be better than that available in the Company’s publicly available reports filed with the Securities and Exchange Commission (“SEC”), but rather is supplemental information that may be of use to investors, creditors, analysts and other users of CSX’s financial reports.
 |  |
Contents
2 | Financial Highlights | |
3 | Surface Transportation | |
11 | Marine Services | |
15 | CSX Consolidating Statements | |
18 | Supplemental Financial Information | |
CSX 2002 FINANCIAL SUPPLEMENT
CSX Corporation
The organizational structure of CSX Corporation (“CSX”) has changed significantly over the past several years. In 1998, a majority interest in American Commercial Lines, CSX’s wholly-owned barge subsidiary, was conveyed to a joint venture. In December 1999, CSX sold the international liner portion of Sea-Land Service Inc., its wholly-owned world wide container-shipping business, to A.P. Moller-Maersk Line (“Maersk”), retaining two marine service businesses, domestic container-shipping and terminal services. CSX Lines LLC and CSX World Terminals LLC were formed to operate these two retained businesses. In September 2000, CSX sold CTI Logistix, CSX’s wholly-owned logistics subsidiary, to TNT Post Group N.V. In December 2002, CSX reached an agreement to convey most of its interest in its domestic container-shipping company, CSX Lines, to a new venture formed with The Carlyle Group for $300 million ($240 million in cash and $60 million in securities issued by the new venture). This transaction closed on February 27, 2003 and the company now operates under the name Horizon Lines LLC (“Horizon”). Beginning in fiscal year 2003, CSX will no longer report the domestic container-shipping company as a reporting segment, but will instead reflect its share of earnings in the new venture.
At December 27, 2002, CSX consists primarily of two main business segments, the Surface Transportation group and the Marine Services group. The Surface Transportation group consists of the operations of CSX Transportation Inc., CSX Intermodal Inc. and CSX’s share of the operations of Conrail Inc. (“Conrail”). CSX Technology, which supports the operations of these businesses, as well as other CSX businesses, is combined with Surface Transportation for presentation purposes. The Marine Services group consists of CSX Lines LLC and CSX World Terminals LLC. Descriptions of each business follows along with a description of the non-transportation businesses owned by CSX.
Surface Transportation
CSX Transportation Inc.
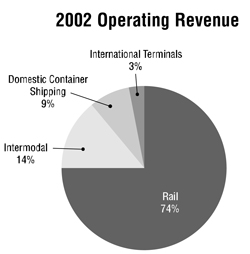
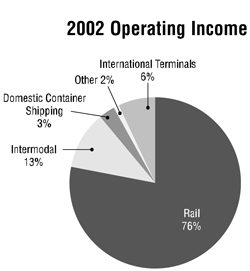
CSX Transportation Inc. (“CSXT”) is the largest rail network in the eastern United States, providing rail freight transportation over a network of more than 23,000 route miles in 23 states, the District of Columbia and two Canadian provinces. Headquartered in Jacksonville, Florida, CSXT accounted for 74% of CSX’s operating revenue and 76% of operating income in 2002.
CSX Intermodal Inc.
CSX Intermodal Inc. (“CSXI”) is the nation’s only transcontinental intermodal transportation service provider, operating a network of dedicated intermodal facilities across North America. The CSXI network uses approximately 450 purchased dedicated trains between its 45 terminals weekly. CSXI accounted for 14% of CSX’s operating revenue and 13% of operating income in 2002. Its headquarters are located in Jacksonville, Florida.
CSX Technology
CSX Technology provides computer and software services to CSX’s affiliates and to outside parties. Since its major customers are CSXT and CSXI, its results from operations are combined with Surface Transportation in this document.
Marine Services
CSX Lines LLC
CSX Lines LLC (“CSX Lines”) operates a domestic container-shipping business consisting of a fleet of 17 vessels and approximately 21,500 containers serving the trade between the continental United States and Alaska, Hawaii/Guam and Puerto Rico. As previously noted, in December 2002, CSX reached an agreement to convey most of its interest in CSX Lines to a new venture formed with The Carlyle Group for $300 million. CSX Lines accounted for 9% of CSX’s operating revenues and 3% of operating income in 2002.
CSX World Terminals LLC
CSX World Terminals LLC (“CSX World Terminals”) operates container-freight terminal facilities in Asia, Europe, Australia, Latin America and the United States. CSX World Terminals accounted for 3% of CSX’s operating revenues and 6% of operating income in 2002. CSX World Terminals is headquartered in Charlotte, North Carolina.
Non-Transportation
CSX owns the historic Greenbrier resort in White Sulphur Springs, West Virginia. The Greenbrier was awarded the coveted AAA Five-Diamond award for the 27th consecutive year in 2002.
CSX Real Property Inc. (“RPI”) creates shareholder value through the efficient provision of real estate management and real estate services to all CSX companies. Activities include development, sales, leasing and management of assets ranging from stand-alone properties to surplus railroad corridors. RPI is headquartered in Jacksonville, Florida.
BridgePoint provides logistics information technology tools to help customers monitor, measure and manage their operations through high-level data quality and connectivity. BridgePoint’s headquarters are located in the Research Triangle, North Carolina.
| CSX 2002 FINANCIAL SUPPLEMENT | 1 |
Financial Highlights
(Millions of Dollars, Except Per Share Amounts)
| 2002 | 2001 | 2000 | 1999 | 1998 | ||||||||||||||||
Earnings from Continuing Operations | ||||||||||||||||||||
Operating Revenue | $ | 8,152 | $ | 8,110 | $ | 8,191 | $ | 10,375 | $ | 9,490 | ||||||||||
Operating Expense | 7,025 | 7,153 | 7,386 | 9,802 | 8,359 | |||||||||||||||
Operating Income | $ | 1,127 | $ | 957 | $ | 805 | $ | 573 | $ | 1,131 | ||||||||||
Net Earnings from Continuing Operations | $ | 424 | $ | 293 | $ | 186 | $ | 32 | $ | 520 | ||||||||||
Earnings Per Share from Continuing Operations | $ | 2.00 | $ | 1.39 | $ | .88 | $ | .15 | $ | 2.47 | ||||||||||
Earnings Per Share from Continuing Operations, Assuming Dilution | $ | 1.99 | $ | 1.38 | $ | .88 | $ | .15 | $ | 2.43 | ||||||||||
Financial Position | ||||||||||||||||||||
Cash, Cash Equivalents and Short-term Investments | $ | 264 | $ | 618 | $ | 686 | $ | 974 | $ | 533 | ||||||||||
Working Capital Deficit | $ | (665 | ) | $ | (1,023 | ) | $ | (1,231 | ) | $ | (910 | ) | $ | (616 | ) | |||||
Total Assets | $ | 20,951 | $ | 20,801 | $ | 20,548 | $ | 20,828 | $ | 20,535 | ||||||||||
Long-term Debt | $ | 6,519 | $ | 5,839 | $ | 5,896 | $ | 6,304 | $ | 6,540 | ||||||||||
Shareholders’ Equity | $ | 6,241 | $ | 6,120 | $ | 6,017 | $ | 5,756 | $ | 5,880 | ||||||||||
Other Data Per Common Share | ||||||||||||||||||||
Cash Dividends | $ | .40 | $ | .80 | $ | 1.20 | $ | 1.20 | $ | 1.20 | ||||||||||
Book Value | $ | 29.07 | $ | 28.64 | $ | 28.28 | $ | 26.35 | $ | 27.08 | ||||||||||
Market Price | ||||||||||||||||||||
High | $ | 41.40 | $ | 41.30 | $ | 33.44 | $ | 53.94 | $ | 60.75 | ||||||||||
Low | $ | 25.09 | $ | 24.81 | $ | 19.50 | $ | 28.81 | $ | 36.50 | ||||||||||
Employees—Annual Averages | ||||||||||||||||||||
Rail | 33,464 | 35,014 | 35,496 | 31,952 | 28,358 | |||||||||||||||
Other | 6,464 | 6,446 | 9,955 | 16,998 | 17,789 | |||||||||||||||
Total | 39,928 | 41,460 | 45,451 | 48,950 | 46,147 | |||||||||||||||
See accompanying Consolidated Financial Statements (All periods reflect contract logistics as a discontinued operation).
Significant events include the following:
2002 | – | A charge to write-down indefinite lived intangible assets as a cumulative effect of accounting change, which reduced earnings $83 million before tax, $43 million after tax and consideration of minority interest, 20 cents per share (See Note 1 of the Annual Report, Significant Accounting Policies). | ||
2001 | – | A charge in the fourth quarter of 2001 to account for the settlement of the 1987 New Orleans tank car fire litigation. This charge reduced earnings by $60 million before tax, $37 million after tax, 17 cents per share. | ||
1999 | – | A loss on the sale of international container-shipping assets net of a related benefit from discontinuing depreciation of those assets from the date they were classified as “held for disposition.” The net effect of the loss and the depreciation benefit reduced earnings by $360 million before tax, $271 million after tax, $1.27 per share. | ||
| – | A charge to recognize the cost of a workforce reduction program at the Company’s rail and intermodal units that reduced earnings by $55 million before tax, $34 million after tax, 16 cents per share. | |||
| – | A gain on the sale of the Company’s Grand Teton Lodge resort subsidiary that increased earnings by $27 million before tax, $17 million after tax, 8 cents per share. | |||
1998 | – | A net investment gain, primarily from the conveyance of American Commercial Lines LLC, the Company’s wholly-owned barge subsidiary, to a joint venture. The gain increased earnings by $154 million before tax, $90 million after tax, 42 cents per share. | ||
| – | A restructuring credit to reverse certain separation and labor protection reserves established by the Company’s rail unit as part of a 1995 restructuring charge. The restructuring credit increased earnings by $30 million before tax, $19 million after tax, 9 cents per share. | |||
| 2 | CSX 2002 FINANCIAL SUPPLEMENT |
Surface Transportation
The Surface Transportation group at CSX reflects the operations of CSX Transportation and CSX Intermodal. Also, CSX Technology’s operations are combined in this group for presentation purposes. Surface Transportation operating revenue includes revenue from traffic previously moving on Conrail. Operating expenses include costs incurred to handle that traffic and operate the former Conrail lines. Conrail continues to operate the shared service areas for the benefit of both CSX and Norfolk Southern. The 2002 consolidating statements of income, financial position, cash flows and lease commitments that follow are intended to show this group’s entire contribution to CSX Corporation’s net income. They include CSX’s revenue and expenses relating to operations in the former Conrail territories, plus rental fees and certain adjustments relating to CSX’s accounting for the purchase of Conrail. CSX’s 42% interest in Conrail is reported in CSX’s financial statements using the equity method of accounting. Conrail’s financial statements are included in this Supplement. In addition, various operating statistics that may be used to analyze the Surface Transportation segment’s operations are included.
CSX Transportation Inc.
CSXT contributed $785 million and $743 million to Surface Transportation operating income in 2002 and 2001, respectively. Revenue for 2002 and 2001 totaled $6.0 billion and $6.1 billion, respectively, and operating expenses totaled $5.2 billion and $5.3 billion, respectively.
CSX Intermodal Inc.
CSXI contributed $141 million and $104 million to Surface Transportation operating income in 2002 and 2001, respectively. Revenue for 2002 and 2001 totaled $1.2 billion and $1.1 billion, respectively. Operating expenses totaled $1.0 billion in both years.
Consolidating Statement of Income
(Millions of Dollars)
| Fiscal Years Ended | |||||||||||||||||||
| Dec. 27, 2002 | Dec. 28, 2001 | ||||||||||||||||||
| Rail | Intermodal | Technology | Total Surface Transportation | Total Surface Transportation | |||||||||||||||
Operating Revenue | $ | 6,003 | $ | 1,180 | $ | — | $ | 7,183 | $ | 7,194 | |||||||||
Operating Expense | |||||||||||||||||||
Labor and Fringe | 2,473 | 67 | 68 | 2,608 | 2,650 | ||||||||||||||
Materials, Supplies and Other | 1,385 | 179 | (184 | ) | 1,380 | 1,385 | |||||||||||||
Conrail Operating Fees, Rents and Services (Note 3) | 322 | — | — | 322 | 336 | ||||||||||||||
Building and Equipment Rent | 409 | 131 | 16 | 556 | 565 | ||||||||||||||
Inland Transportation | (365 | ) | 633 | — | 268 | 245 | |||||||||||||
Depreciation | 545 | 29 | 31 | 605 | 581 | ||||||||||||||
Fuel | 449 | — | — | 449 | 525 | ||||||||||||||
New Orleans Litigation Provision | — | — | — | — | 60 | ||||||||||||||
Total Operating Expense | 5,218 | 1,039 | (69 | ) | 6,188 | 6,347 | |||||||||||||
Rail Operating Income Before Fees and Special Items | 785 | 141 | 69 | 995 | 847 | ||||||||||||||
Management Services Fees | (155 | ) | — | — | (155 | ) | (168 | ) | |||||||||||
Conrail-related Items Recorded at Parent—Net | (53 | ) | — | — | (53 | ) | (51 | ) | |||||||||||
Operating Income | 577 | 141 | 69 | 787 | 628 | ||||||||||||||
Other Income (Expense) | 15 | 4 | — | 19 | (2 | ) | |||||||||||||
Interest Expense | 113 | 11 | 3 | 127 | 147 | ||||||||||||||
Earnings Before Income Tax | 479 | 134 | 66 | 679 | 479 | ||||||||||||||
Income Tax Expense | 183 | 55 | 25 | 263 | 181 | ||||||||||||||
Net Earnings | $ | 296 | $ | 79 | $ | 41 | $ | 416 | $ | 298 | |||||||||
| CSX 2002 FINANCIAL SUPPLEMENT | 3 |
Surface Transportation
Consolidating Statement of Cash Flows
(Millions of Dollars)
| Fiscal Years Ended | ||||||||||||||||||||
| Dec. 27, 2002 | Dec. 28, 2001 | |||||||||||||||||||
| Rail | Intermodal | Technology | Total Surface Transportation | Total Surface Transportation | ||||||||||||||||
Operating Activities | ||||||||||||||||||||
Net Earnings | $ | 296 | $ | 79 | $ | 41 | $ | 416 | $ | 298 | ||||||||||
Adjustments to Reconcile Net Earnings to Net Cash Provided: | ||||||||||||||||||||
Depreciation | 543 | 29 | 31 | 603 | 580 | |||||||||||||||
Deferred Taxes | 205 | 3 | (4 | ) | 204 | 135 | ||||||||||||||
Other Operating Activities | (67 | ) | 1 | 3 | (63 | ) | (1 | ) | ||||||||||||
Redemption of Accounts Receivable | (52 | ) | — | — | (52 | ) | (28 | ) | ||||||||||||
Changes in Operating Assets and Liabilities | 7 | 3 | 18 | 28 | 8 | |||||||||||||||
Net Cash Provided by Operating Activities | 932 | 115 | 89 | 1,136 | 992 | |||||||||||||||
Investing Activities | ||||||||||||||||||||
Property Additions | (981 | ) | (29 | ) | (26 | ) | (1,036 | ) | (879 | ) | ||||||||||
Short-term Investments—Net(b) | 220 | — | — | 220 | (220 | ) | ||||||||||||||
Other Investing Activities | (3 | ) | — | — | (3 | ) | (2 | ) | ||||||||||||
Net Cash Used by Investing Activities | (764 | ) | (29 | ) | (26 | ) | (819 | ) | (1,101 | ) | ||||||||||
Financing Activities | ||||||||||||||||||||
Long-term Debt Repaid | (196 | ) | — | — | (196 | ) | (185 | ) | ||||||||||||
Dividends Paid to Affiliate | (200 | ) | — | (42 | ) | (242 | ) | (257 | ) | |||||||||||
Other Financing Activities | 201 | (86 | ) | (21 | ) | 94 | 550 | |||||||||||||
Net Cash (Used) Provided by Financing Activities | (195 | ) | (86 | ) | (63 | ) | (344 | ) | 108 | |||||||||||
Net Decrease in Cash and Cash Equivalents | (27 | ) | — | — | (27 | ) | (1 | ) | ||||||||||||
Cash, Cash Equivalents and Short-term Investments | ||||||||||||||||||||
Cash and Cash Equivalents at Beginning of Year | 27 | — | — | 27 | 28 | |||||||||||||||
Cash and Cash Equivalents at End of Year(a) | — | — | — | — | 27 | |||||||||||||||
Short-term Investments at End of Year(b) | — | — | — | — | 220 | |||||||||||||||
Cash, Cash Equivalents and Short-term | ||||||||||||||||||||
Investments at End of Year | $ | — | $ | — | $ | — | $ | — | $ | 247 | ||||||||||
| (a) | Surface Transportation units participate in the CSX cash management plan, under which excess cash is advanced to CSX for investment. CSX then makes cash available to the units as needed. |
| (b) | The 2001 short-term investment of $220 million represents deposits relating to the New Orleans tank car fire litigation. |
| 4 | CSX 2002 FINANCIAL SUPPLEMENT |
Surface Transportation
Consolidating Statement of Financial Position
(Millions of Dollars)
| Fiscal Years Ended | ||||||||||||||||||||||||
| Dec. 27, 2002 | Dec. 28, 2001 | |||||||||||||||||||||||
| Rail | Intermodal | Technology | Other/ Eliminations | Total Surface Transportation | Total Surface Transportation | |||||||||||||||||||
Assets | ||||||||||||||||||||||||
Current Assets | ||||||||||||||||||||||||
Cash, Cash Equivalents and Short-term Investments | $ | — | $ | — | $ | — | $ | — | $ | — | $ | 247 | ||||||||||||
Accounts and Notes Receivable (Note 4) | 235 | 57 | — | — | 292 | 381 | ||||||||||||||||||
Receivable from Affiliates | — | 201 | 56 | (249 | ) | 8 | 7 | |||||||||||||||||
Materials and Supplies | 171 | — | — | — | 171 | 181 | ||||||||||||||||||
Deferred Income Taxes | 110 | — | — | — | 110 | 142 | ||||||||||||||||||
Other Current Assets | 18 | 2 | — | — | 20 | 115 | ||||||||||||||||||
Total Current Assets | 534 | 260 | 56 | (249 | ) | 601 | 1,073 | |||||||||||||||||
Properties | 17,354 | 442 | 271 | — | 18,067 | 17,288 | ||||||||||||||||||
Accumulated Depreciation | (4,730 | ) | (173 | ) | (148 | ) | — | (5,051 | ) | (4,690 | ) | |||||||||||||
Properties—Net | 12,624 | 269 | 123 | — | 13,016 | 12,598 | ||||||||||||||||||
Affiliates and Other Companies | 217 | 4 | — | (5 | ) | 216 | 197 | |||||||||||||||||
Other Long-term Assets | 627 | 14 | — | — | 641 | 580 | ||||||||||||||||||
Total Assets | $ | 14,002 | $ | 547 | $ | 179 | $ | (254 | ) | $ | 14,474 | $ | 14,448 | |||||||||||
| �� | ||||||||||||||||||||||||
Liabilities | ||||||||||||||||||||||||
Current Liabilities | ||||||||||||||||||||||||
Accounts Payable | $ | 618 | $ | 75 | $ | 17 | $ | — | $ | 710 | $ | 800 | ||||||||||||
Labor and Fringe Benefits Payable | 319 | 4 | 47 | — | 370 | 361 | ||||||||||||||||||
Payable to Affiliates | 1,497 | 36 | 118 | (249 | ) | 1,402 | 1,284 | |||||||||||||||||
Casualty, Environmental and Other Reserves | 173 | 3 | — | — | 176 | 181 | ||||||||||||||||||
Current Maturities of Long-term Debt | 213 | 1 | — | — | 214 | 170 | ||||||||||||||||||
Income and Other Taxes Payable | 98 | 14 | 9 | — | 121 | 207 | ||||||||||||||||||
Other Current Liabilities | 132 | — | — | — | 132 | 197 | ||||||||||||||||||
Total Current Liabilities | 3,050 | 133 | 191 | (249 | ) | 3,125 | 3,200 | |||||||||||||||||
Casualty, Environmental and Other Reserves | 467 | — | — | — | 467 | 532 | ||||||||||||||||||
Long-term Debt | 873 | 17 | — | — | 890 | 1,036 | ||||||||||||||||||
Deferred Income Taxes | 3,424 | 16 | 33 | — | 3,473 | 3,299 | ||||||||||||||||||
Long-term Payable to Affiliates | 4 | 101 | — | (5 | ) | 100 | 143 | |||||||||||||||||
Other Long-term Liabilities | 575 | 5 | 26 | — | 606 | 599 | ||||||||||||||||||
Total Liabilities | 8,393 | 272 | 250 | (254 | ) | 8,661 | 8,809 | |||||||||||||||||
Shareholder’s Equity | 5,609 | 275 | (71 | ) | — | 5,813 | 5,639 | |||||||||||||||||
Total Liabilities and Shareholder’s Equity | $ | 14,002 | $ | 547 | $ | 179 | $ | (254 | ) | $ | 14,474 | $ | 14,448 | |||||||||||
| CSX 2002 FINANCIAL SUPPLEMENT | 5 |
Surface Transportation
Notes to Surface Transportation
Note 1. Lease Commitments
Net lease obligations at December 27, 2002 are as follows:
(Millions of Dollars) | Rail | Intermodal | Technology | Total Surface Transportation | ||||||||
2003 | $ | 133 | $ | 3 | $ | 18 | $ | 154 | ||||
2004 | 129 | 2 | 14 | 145 | ||||||||
2005 | 126 | 1 | — | 127 | ||||||||
2006 | 102 | 1 | — | 103 | ||||||||
2007 | 102 | 1 | — | 103 | ||||||||
Thereafter | 451 | 4 | — | 455 | ||||||||
Total | $ | 1,043 | $ | 12 | $ | 32 | $ | 1,087 | ||||
Note 2. Related Party Transactions
CSXI purchases rail transportation services from CSXT. CSXT and CSXI purchase computer and software services from CSX Technology. The majority of the Payable to Affiliate balance relates to CSXT’s, CSXI’s and CSX Technology’s participation in the CSX cash management plan. Under this plan, excess cash is advanced to CSX for investment and CSX makes cash funds available to its subsidiaries as needed for use in their operations. CSX and its subsidiaries are committed to repay all amounts due each other on demand should circumstances require.
Note 3. Conrail Operating Fees, Rents and Services
CSX’s rail and intermodal operating revenue includes revenue from traffic previously moving on Conrail. Operating expenses include costs incurred to handle that traffic and operate the former Conrail lines. Rail operating expense includes an expense category, “Conrail Operating Fees, Rents and Services,” which reflects:
| 1. | Right of way usage fees and equipment rental payments to Conrail |
| 2. | Transportation, switching, and terminal service charges provided by Conrail in the Shared Asset Areas that Conrail operates for the joint benefit of CSX and Norfolk Southern |
| 3. | Amortization of the fair value write-up arising from the acquisition of Conrail |
| 4. | CSX’s 42% share of Conrail’s net income recognized under the equity method of accounting. |
The detail of Conrail Operating Fees, Rents, and Services is as follows:
| Fiscal Years Ended | ||||||||
(Millions of Dollars) | 2002 | 2001 | ||||||
Rents and Services (See page 9) | $ | 346 | $ | 353 | ||||
Purchase Price Amortization and Other | 52 | 56 | ||||||
Equity Income (See page 9) | (76 | ) | (73 | ) | ||||
Total | $ | 322 | $ | 336 | ||||
Note 4. Accounts Receivable
Rail accounts receivable reported on the Statement of Financial Position exclude receivables sold of $380 million and $500 million in 2002 and 2001, respectively, to a bankruptcy-protected subsidiary of CSX.
| 6 | CSX 2002 FINANCIAL SUPPLEMENT |
Surface Transportation
Operating Statistics(a)
Traffic and Revenue
| Carloads (Thousands) | Revenue (Millions of Dollars) | ||||||||||||||
| 2002 | 2001 | 2000 | 2002 | 2001 | 2000 | ||||||||||
Rail | |||||||||||||||
Merchandise | |||||||||||||||
Phosphates and Fertilizer | 463 | 441 | 486 | $ | 324 | $ | 306 | $ | 316 | ||||||
Metals | 319 | 319 | 344 | 401 | 395 | 407 | |||||||||
Food and Consumer | 162 | 163 | 157 | 217 | 218 | 206 | |||||||||
Paper and Forest | 477 | 478 | 523 | 637 | 633 | 657 | |||||||||
Agricultural | 358 | 372 | 361 | 489 | 501 | 483 | |||||||||
Chemicals | 500 | 499 | 523 | 907 | 883 | 922 | |||||||||
Minerals | 88 | 92 | 101 | 135 | 140 | 154 | |||||||||
Emerging Markets | 424 | 435 | 430 | 397 | 384 | 368 | |||||||||
Total Merchandise | 2,791 | 2,799 | 2,925 | 3,507 | 3,460 | 3,513 | |||||||||
Automotive | 538 | 516 | 586 | 845 | 794 | 869 | |||||||||
Coal, Coke and Iron Ore | |||||||||||||||
Coal | 1,573 | 1,722 | 1,660 | 1,528 | 1,671 | 1,546 | |||||||||
Coke | 34 | 39 | 46 | 49 | 46 | 47 | |||||||||
Iron Ore | 36 | 38 | 49 | 20 | 22 | 30 | |||||||||
Total Coal, Coke and Iron Ore | 1,643 | 1,799 | 1,755 | 1,597 | 1,739 | 1,623 | |||||||||
Other Revenue | — | — | — | 54 | 89 | 70 | |||||||||
Total Rail | 4,972 | 5,114 | 5,266 | 6,003 | 6,082 | 6,075 | |||||||||
Intermodal | |||||||||||||||
Domestic | 982 | 901 | 931 | 696 | 625 | 645 | |||||||||
International | 1,137 | 1,103 | 1,121 | 476 | 470 | 492 | |||||||||
Other | — | — | — | 8 | 17 | 31 | |||||||||
Total Intermodal | 2,119 | 2,004 | 2,052 | 1,180 | 1,112 | 1,168 | |||||||||
Total Surface Transportation | 7,091 | 7,118 | 7,318 | $ | 7,183 | $ | 7,194 | $ | 7,243 | ||||||
Revenue Ton Miles
| Revenue Ton Miles (Billions) | ||||||
| 2002 | 2001 | 2000 | ||||
Merchandise | 125.5 | 125.6 | 130.1 | |||
Automotive | 9.3 | 8.7 | 9.6 | |||
Coal, Coke and Iron Ore | 72.4 | 79.8 | 77.5 | |||
Intermodal(b) | 21.0 | 20.4 | 21.5 | |||
Total Surface Transportation | 228.2 | 234.5 | 238.7 | |||
Gross Ton Miles(b)(c)
| (Billions) | ||||||
| 2002 | 2001 | 2000 | ||||
Gross Ton Miles | 438.1 | 447.9 | 457.6 | |||
| (a) | Certain prior year amounts have been reclassified to conform to the 2002 presentation. |
| (b) | Intermodal Revenue Ton Miles and Gross Ton Miles excludes ton miles for moves outside of CSXT’s territory. |
| (c) | Gross Ton Miles excludes locomotive ton miles. |
| CSX 2002 FINANCIAL SUPPLEMENT | 7 |
Surface Transportation
Capital Expenditures (Millions of Dollars)
| 2002 | 2001 | 2000 | |||||||
Track | $ | 613 | $ | 572 | $ | 579 | |||
Locomotives | 238 | 86 | 84 | ||||||
Facilities and Other | 141 | 98 | 33 | ||||||
Technology | 26 | 19 | 19 | ||||||
Freight Cars | 18 | 104 | 144 | ||||||
Total Capital Expenditures | $ | 1,036 | $ | 879 | $ | 859 | |||
Locomotives and Rolling Stock Owned or Leased at Year End
| 2002 | 2001 | 2000 | ||||
Locomotives | 3,573 | 3,552 | 3,533 | |||
Freight Cars | ||||||
Gondolas | 31,370 | 32,574 | 36,599 | |||
Open Top Hoppers | 22,215 | 25,166 | 26,392 | |||
Box Cars | 18,017 | 18,830 | 19,975 | |||
Covered Hoppers | 17,729 | 18,123 | 20,116 | |||
Multi-level Racks | 13,777 | 13,904 | 13,941 | |||
Other | 6,707 | 6,852 | 6,524 | |||
Total Freight Cars | 109,815 | 115,449 | 123,547 | |||
Track Information
| 2002 | 2001 | 2000 | ||||
Track Miles | ||||||
Main Line (Route Miles) | 23,160 | 23,297 | 23,320 | |||
Branch Line | 5,506 | 5,518 | 5,513 | |||
Yards, Sidings and Other Main Line | 11,633 | 11,705 | 11,725 | |||
Total Track Miles | 40,299 | 40,520 | 40,558 | |||
Employees(Annual Averages)
| 2002 | 2001 | 2000 | ||||
Rail | 33,464 | 35,014 | 35,496 | |||
Intermodal | 1,093 | 1,116 | 1,230 | |||
Other (Technology & Corp.) | 823 | 807 | 899 | |||
Total Surface Transportation | 35,380 | 36,937 | 37,625 | |||
Fuel
| 2002 | 2001 | 2000 | |||||||
Estimated Fuel Consumption | 572.2 | 580.4 | 607.6 | ||||||
Average Price Per Gallon | $ | 0.78 | $ | 0.90 | $ | 0.95 | |||
Gross Ton Miles Per Gallon | 766 | 772 | 753 | ||||||
Productivity
| 2002 | 2001 | 2000 | |||||||
Revenue Per Route Mile | $ | 310,147 | $ | 308,795 | $ | 310,592 | |||
Revenue Per Employee | $ | 203,024 | $ | 194,764 | $ | 192,505 | |||
GTM Per Route Mile (Millions) | 18.9 | 19.2 | 19.6 | ||||||
GTM Per Employee (Millions) | 12.4 | 12.1 | 12.1 | ||||||
GTM Per Carload (Thousand) | 61.8 | 62.9 | 62.5 | ||||||
Operating Expense Per Carload(a) | $ | 873 | $ | 883 | $ | 892 | |||
Operating Expense Per GTM (cents)(a) | 1.41 | 1.40 | 1.43 | ||||||
Labor Expense Per Employee | $ | 73,714 | $ | 71,744 | $ | 70,007 | |||
Service Performance Measurements
| 2002 | 2001 | 2000 | |||||||
Cars on Line (Average) | 229,609 | 240,054 | 246,739 | ||||||
Average System Dwell Time (Hours) | 23.2 | 24.5 | 30.8 | ||||||
Velocity—All Trains | 22.5 | 21.7 | 19.1 | ||||||
On-Time (+2) Originations | 91 | % | 88 | % | 69 | % | |||
On-Time (+2) Destination Arrivals | 77 | % | 76 | % | 51 | % | |||
Safety
| 2002 | 2001 | 2000 | ||||
FRA Train Accidents Frequency | 3.00 | 3.50 | 4.90 | |||
(Per Million Train Miles) | ||||||
Personal Injury Frequency Index | 1.94 | 2.64 | 2.87 | |||
(Per 100 Employees) |
| (a) | Excludes effect of New Orleans tank car fire litigation in 2001. |
| 8 | CSX 2002 FINANCIAL SUPPLEMENT |
Surface Transportation
Conrail
CSX and Norfolk Southern Corporation (“Norfolk Southern”) completed the acquisition of Conrail Inc. (“Conrail”) in May 1997. CSX and Norfolk Southern, through a jointly owned acquisition entity, hold economic interests in Conrail of 42% and 58%, respectively, and voting interests of 50% each.
In June 1999, CSX and Norfolk Southern each began operations over a portion of the Conrail rail system under the terms of an operating agreement. Under the operating agreement, CSXT has the right to operate over 4,400 route miles of track in the Northeastern and Midwestern United States and Canada. CSXT now operates a network of more than 23,000 route miles in 23 states, the District of Columbia, and two Canadian provinces.
Consolidated Statements of Income
(Millions of Dollars) | Year ended | |||||||
| Dec. 31, 2002 | Dec. 31, 2001 | |||||||
Revenues—NSC/CSX(a) | $ | 813 | $ | 823 | ||||
Revenues—Third Parties | 80 | 80 | ||||||
Total Operating Revenues | 893 | 903 | ||||||
Operating Expense | ||||||||
Compensation and Benefits | 151 | 158 | ||||||
Fuel | 6 | 7 | ||||||
Material, Services and Rents | 125 | 143 | ||||||
Depreciation and Amortization | 322 | 325 | ||||||
Casualties and Insurance | 2 | (13 | ) | |||||
Other | 17 | 19 | ||||||
Total Operating Expense | 623 | 639 | ||||||
Operating Income | 270 | 264 | ||||||
Other Income—Net | 94 | 103 | ||||||
Interest Expense | (104 | ) | (109 | ) | ||||
Earnings Before Income Taxes | 260 | 258 | ||||||
Income Tax Expense | 80 | 84 | ||||||
Net Income(b) | $ | 180 | $ | 174 | ||||
| (a) | CSX’s Rents and Services was $346 million in 2002 and $353 million in 2001. |
| (b) | CSX’s 42% Equity in Net Income of Conrail was $76 million in 2002 and $73 million in 2001. |
Conrail revenues consist primarily of operating fees and equipment rents from CSX (attributable to operation over the portion of Conrail’s network known as the New York Central) and Norfolk Southern (attributable to operations over the portion of Conrail’s network known as Pennsylvania Railroad Systems). Expenses consist of salaries and wages, rents, depreciation and other costs of operations. Conrail also earns usage fees relating to the portions of the network that they continue to operate for the benefit of both companies (“Shared Asset Areas”). Purchase accounting amortization recorded by CSX and Norfolk Southern remains on the financial statements of those entities and is not reflected in Conrail’s financial statements.
Consolidated Statement of Cash Flows
(Millions of Dollars) | Year ended | |||||||
| Dec. 31, 2002 | Dec. 31, 2001 | |||||||
Operating Activities | ||||||||
Net Income | ||||||||
Adjustments to Reconcile Net Income to | $ | 180 | $ | 174 | ||||
Net Cash Provided by Operating Activities: | ||||||||
Depreciation and Amortization | 322 | 325 | ||||||
Deferred Income Tax | (9 | ) | (18 | ) | ||||
Gains from Sales of Property | (3 | ) | (2 | ) | ||||
Pension Credit | (17 | ) | (19 | ) | ||||
Changes in Operating Assets and Liabilities: | ||||||||
Accounts Receivable | (3 | ) | 1 | |||||
Accounts and Wages Payable | (14 | ) | (32 | ) | ||||
Due from NSC/CSX | 14 | 60 | ||||||
Due to NSC/CSX | (3 | ) | (19 | ) | ||||
Other | (44 | ) | 32 | |||||
Net Cash Provided by Operating Activities | 423 | 502 | ||||||
Investing Activities | ||||||||
Property and Equipment Acquisitions | (23 | ) | (47 | ) | ||||
Notes Receivable from NSC/CSX | (377 | ) | (424 | ) | ||||
Proceeds from Disposals of Properties | 14 | 14 | ||||||
Other | 11 | — | ||||||
Net Cash Used in Investing Activities | (375 | ) | (457 | ) | ||||
Financing Activities | ||||||||
Payment of Long-term Debt | (59 | ) | (61 | ) | ||||
Net Cash Used in Financing Activities | (59 | ) | (61 | ) | ||||
Decrease in Cash and Cash Equivalents | (11 | ) | (16 | ) | ||||
Cash and Cash Equivalents | ||||||||
Beginning of Year | 34 | 50 | ||||||
End of Year | $ | 23 | $ | 34 | ||||
| CSX 2002 FINANCIAL SUPPLEMENT | 9 |
Surface Transportation
Conrail,—(Continued)
Consolidated Balance Sheet
(Millions of Dollars)
| Dec. 31, 2002 | Dec. 31, 2001 | |||||||
Assets | ||||||||
Current Assets | ||||||||
Cash and Cash Equivalents | $ | 23 | $ | 34 | ||||
Accounts Receivable—Net | 35 | 32 | ||||||
Due from NSC/CSX | 158 | 172 | ||||||
Notes Receivable from NSC/CSX | — | 515 | ||||||
Material and Supplies | 8 | 9 | ||||||
Deferred Income Taxes | 65 | 76 | ||||||
Other Current Assets | 11 | 8 | ||||||
Total Current Assets | 300 | 846 | ||||||
Property and Equipment—Net | 6,382 | 6,688 | ||||||
Notes Receivable from NSC/CSX | 892 | — | ||||||
Other Assets | 583 | 548 | ||||||
Total Assets | $ | 8,157 | $ | 8,082 | ||||
Liabilities | ||||||||
Current Liabilities | ||||||||
Current Maturities of Long-term Debt | $ | 57 | $ | 60 | ||||
Accounts Payable | 33 | 41 | ||||||
Due to NSC/CSX | 9 | 12 | ||||||
Wages and Employee Benefits | 31 | 37 | ||||||
Casualty Reserves | 69 | 101 | ||||||
Accrued and Other Current Liabilities | 130 | 157 | ||||||
Total Current Liabilities | 329 | 408 | ||||||
Long-term Debt | 1,123 | 1,156 | ||||||
Casualty Reserves | 119 | 134 | ||||||
Deferred Income Taxes | 1,822 | 1,833 | ||||||
Other Liabilities | 538 | 446 | ||||||
Total Liabilities | 3,931 | 3,977 | ||||||
Shareholders’ Equity | ||||||||
Common Stock ($1 par value; 100 shares authorized, issued and outstanding) | — | — | ||||||
Additional Paid-In-Capital | 2,221 | 2,221 | ||||||
Retained Earnings | 2,134 | 1,954 | ||||||
Accumulated Other Comprehensive Loss | (129 | ) | (70 | ) | ||||
Total Shareholders’ Equity | 4,226 | 4,105 | ||||||
Total Liabilities and Shareholders’ Equity | $ | 8,157 | $ | 8,082 | ||||
Notes to Conrail Statements
Note 1. Lease Commitments
(Millions of Dollars)
| Dec. 31, 2002 | |||||||||
| Capital Leases | Operating Leases | Total Conrail | |||||||
2003 | $ | 51 | $ | 56 | $ | 107 | |||
2004 | 53 | 56 | 109 | ||||||
2005 | 38 | 55 | 93 | ||||||
2006 | 24 | 54 | 78 | ||||||
2007 | 28 | 53 | 81 | ||||||
Thereafter | 52 | 289 | 341 | ||||||
Total | $ | 246 | $ | 563 | $ | 809 | |||
Note 2. Properties
Improvements and additions are leasehold improvements that are recorded on CSX and Norfolk Southern’s financial statements.
Note 3. Related Party Transactions
As noted throughout this document, Conrail has numerous transactions with both CSX and Norfolk Southern representing lease payments, usage fees and borrowings between the companies.
| 10 | CSX 2002 FINANCIAL SUPPLEMENT |
Marine Services
CSX Lines LLC
CSX Lines LLC (“CSX Lines”) operates a domestic container-shipping business consisting of a fleet of 17 vessels and approximately 21,500 containers serving the trade between the continental United States and Alaska, Hawaii/Guam, and Puerto Rico. CSX Lines also operates port terminals in Anchorage, Kodiak, and Dutch Harbor, Alaska; Honolulu, Hawaii; San Juan, Puerto Rico; and Apra, Guam. In December 2002, CSX Corporation reached an agreement to convey most of its interest in CSX Lines to a new venture formed with The Carlyle Group for $300 million ($240 million in cash and $60 million in securities issued by the new venture). This transaction closed on February 27, 2003 and the company now operates under the name Horizon Lines LLC (“Horizon”). The company is headquartered in Charlotte, North Carolina, with 20 offices throughout the continental United States, Alaska, Hawaii, Guam and Puerto Rico. Beginning in fiscal year 2003, CSX will no longer report the domestic container-shipping company as a reporting segment, but will instead have a preferred interest in the new venture.
CSX Lines reported operating income of $38 million in 2002 compared to $32 million in the prior year. Improvements came primarily from continued expense reductions as well as improvement in revenues in the Hawaii/Guam service and Puerto Rico service.
CSX World Terminals LLC
Headquartered in Charlotte, North Carolina, CSX World Terminals LLC (“CSX World Terminals”) operates container-freight terminal facilities in Asia, Europe, Australia, Latin America and the United States.
CSX World Terminals’ operating revenues were flat at $236 million in 2002 and 2001. Operating expenses were up $2 million in 2002 over 2001 due to lower earnings from equity investees. Miscellaneous operating expenses in 2002 and 2001 include $6 million and $3 million gains, respectively, from transactions relating to equity investments. Operating income was $69 million for 2002, a $2 million decrease from $71 million in 2001.
Consolidating Statement of Income
(Millions of Dollars)
| Fiscal Years Ended | ||||||||||||||||||
| Dec. 27, 2002 | Dec. 28, 2001 | |||||||||||||||||
| CSX Lines | CSX World Terminals | Total | CSX Lines | CSX World Terminals | Total | |||||||||||||
Operating Revenue | $ | 758 | $ | 236 | $ | 994 | $ | 681 | $ | 236 | $ | 917 | ||||||
Operating Expense | ||||||||||||||||||
Labor and Fringe | 229 | 57 | 286 | 213 | 62 | 275 | ||||||||||||
Materials, Supplies and Other | 244 | 77 | 321 | 203 | 70 | 273 | ||||||||||||
Building and Equipment Rent | 45 | 9 | 54 | 51 | 9 | 60 | ||||||||||||
Inland Transportation | 119 | 7 | 126 | 98 | 7 | 105 | ||||||||||||
Depreciation | 17 | 9 | 26 | 24 | 8 | 32 | ||||||||||||
Fuel | 66 | — | 66 | 60 | — | 60 | ||||||||||||
Miscellaneous(a) | — | 8 | 8 | — | 9 | 9 | ||||||||||||
Total Operating Expense | 720 | 167 | 887 | 649 | 165 | 814 | ||||||||||||
Operating Income | 38 | 69 | 107 | 32 | 71 | 103 | ||||||||||||
Other Income | 5 | 31 | 36 | 10 | 31 | 41 | ||||||||||||
Interest Expense | 7 | — | 7 | 14 | — | 14 | ||||||||||||
Earnings Before Income Tax | 36 | 100 | 136 | 28 | 102 | 130 | ||||||||||||
Income Tax Expense | 14 | 25 | 39 | 11 | 27 | 38 | ||||||||||||
Net Earnings | $ | 22 | $ | 75 | $ | 97 | $ | 17 | $ | 75 | $ | 92 | ||||||
| (a) | Miscellaneous expense includes minority interest expense of $39 million and $36 million in 2002 and 2001, respectively, offset by equity earnings in unconsolidated subsidiaries of $31 million and $27 million, respectively. |
| CSX 2002 FINANCIAL SUPPLEMENT | 11 |
Marine Services
Consolidating Statement of Cash Flows
(Millions of Dollars)
| Fiscal Years Ended | ||||||||||||||||||||||||
| Dec. 27, 2002 | Dec. 28, 2001 | |||||||||||||||||||||||
| CSX Lines | CSX World Terminals | Total | CSX Lines | CSX World Terminals | Total | |||||||||||||||||||
Operating Activities | ||||||||||||||||||||||||
Net Earnings | $ | 22 | $ | 75 | $ | 97 | $ | 17 | $ | 75 | $ | 92 | ||||||||||||
Adjustments to Reconcile Net Earnings to Net Cash Provided: | ||||||||||||||||||||||||
Depreciation | 18 | 9 | 27 | 24 | 8 | 32 | ||||||||||||||||||
Deferred Taxes | (18 | ) | 6 | (12 | ) | (1 | ) | 11 | 10 | |||||||||||||||
Other Operating Activities | — | (13 | ) | (13 | ) | — | (21 | ) | (21 | ) | ||||||||||||||
Changes in Operating Assets and Liabilities | (7 | ) | 18 | 11 | 92 | (15 | ) | 77 | ||||||||||||||||
Net Cash Provided by Operating Activities | 15 | 95 | 110 | 132 | 58 | 190 | ||||||||||||||||||
Investing Activities | ||||||||||||||||||||||||
Property Additions | (19 | ) | (11 | ) | (30 | ) | (11 | ) | (19 | ) | (30 | ) | ||||||||||||
Short-term Investments—Net | (26 | ) | — | (26 | ) | — | — | — | ||||||||||||||||
Other Investing Activities | 15 | (35 | ) | (20 | ) | 1 | (14 | ) | (13 | ) | ||||||||||||||
Net Cash Used by Investing Activities | (30 | ) | (46 | ) | (76 | ) | (10 | ) | (33 | ) | (43 | ) | ||||||||||||
Financing Activities | ||||||||||||||||||||||||
Long-term Debt Repaid | — | — | — | (21 | ) | — | (21 | ) | ||||||||||||||||
Other Financing Activities | — | (50 | ) | (50 | ) | (49 | ) | (16 | ) | (65 | ) | |||||||||||||
Net Cash Used by Financing Activities | — | (50 | ) | (50 | ) | (70 | ) | (16 | ) | (86 | ) | |||||||||||||
Net (Decrease) Increase in Cash and Cash Equivalents | (15 | ) | (1 | ) | (16 | ) | 52 | 9 | 61 | |||||||||||||||
Cash and Cash Equivalents at Beginning of Year | 52 | 88 | 140 | — | 79 | 79 | ||||||||||||||||||
Cash and Cash Equivalents at End of Year | 37 | 87 | 124 | 52 | 88 | 140 | ||||||||||||||||||
Short-term Investments at End of Year | — | — | — | 3 | — | 3 | ||||||||||||||||||
Cash, Cash Equivalents and Short-term Investments at End of Year | $ | 37 | $ | 87 | $ | 124 | $ | 55 | $ | 88 | $ | 143 | ||||||||||||
| 12 | CSX 2002 FINANCIAL SUPPLEMENT |
Marine Services
Consolidating Statement of Financial Position
(Millions of Dollars)
| Fiscal Years Ended | ||||||||||||||||||||||||
| Dec. 27, 2002 | Dec. 28, 2001 | |||||||||||||||||||||||
| CSX Lines | CSX World Terminals | Total | CSX Lines | CSX World Terminals | Total | |||||||||||||||||||
Assets | ||||||||||||||||||||||||
Current Assets | ||||||||||||||||||||||||
Cash, Cash Equivalents and Short-term Investments | $ | 37 | $ | 87 | $ | 124 | $ | 55 | $ | 88 | $ | 143 | ||||||||||||
Accounts Receivable—Net | — | 49 | 49 | — | 49 | 49 | ||||||||||||||||||
Receivables from Affiliates | — | — | — | — | 10 | 10 | ||||||||||||||||||
Materials and Supplies | — | 2 | 2 | — | 2 | 2 | ||||||||||||||||||
Assets Held for Disposition | 263 | — | 263 | 244 | — | 244 | ||||||||||||||||||
Other Current Assets | — | 2 | 2 | 24 | 2 | 26 | ||||||||||||||||||
Total Current Assets | 300 | 140 | 440 | 323 | 151 | 474 | ||||||||||||||||||
Properties | 11 | 183 | 194 | 62 | 185 | 247 | ||||||||||||||||||
Accumulated Depreciation | (2 | ) | (83 | ) | (85 | ) | (20 | ) | (83 | ) | (103 | ) | ||||||||||||
Properties—Net | 9 | 100 | 109 | 42 | 102 | 144 | ||||||||||||||||||
Affiliates and Other Companies | — | 630 | 630 | — | 560 | 560 | ||||||||||||||||||
Other Long-term Assets | — | 89 | 89 | 139 | 52 | 191 | ||||||||||||||||||
Total Assets | $ | 309 | $ | 959 | $ | 1,268 | $ | 504 | $ | 865 | $ | 1,369 | ||||||||||||
Liabilities | ||||||||||||||||||||||||
Current Liabilities | ||||||||||||||||||||||||
Accounts Payable | $ | 19 | $ | 7 | $ | 26 | $ | 20 | $ | 11 | $ | 31 | ||||||||||||
Labor and Fringe Benefits Payable | 11 | 8 | 19 | 4 | 8 | 12 | ||||||||||||||||||
Payable to Affiliates | 1 | 1 | 2 | 2 | 1 | 3 | ||||||||||||||||||
Casualty, Environmental and Other Reserves | — | — | — | 1 | — | 1 | ||||||||||||||||||
Current Maturities of Long-term Debt | — | — | — | 21 | — | 21 | ||||||||||||||||||
Income and Other Taxes Payable | 9 | 9 | 18 | 24 | 3 | 27 | ||||||||||||||||||
Liabilities Held for Disposition | 104 | — | 104 | 92 | — | 92 | ||||||||||||||||||
Other Current Liabilities | 3 | 10 | 13 | 5 | 4 | 9 | ||||||||||||||||||
Total Current Liabilities | 147 | 35 | 182 | 169 | 27 | 196 | ||||||||||||||||||
Casualty, Environmental and Other Reserves | 1 | — | 1 | 1 | — | 1 | ||||||||||||||||||
Long-term Debt | — | — | — | 132 | — | 132 | ||||||||||||||||||
Deferred Income Taxes | 3 | 35 | 38 | 25 | 27 | 52 | ||||||||||||||||||
Long-term Payable to Affiliates | — | 33 | 33 | — | 31 | 31 | ||||||||||||||||||
Other Long-term Liabilities | 50 | 137 | 187 | 49 | 117 | 166 | ||||||||||||||||||
Total Liabilities | 201 | 240 | 441 | 376 | 202 | 578 | ||||||||||||||||||
Shareholder’s Equity | 108 | 719 | 827 | 128 | 663 | 791 | ||||||||||||||||||
Total Liabilities and Shareholder’s Equity | $ | 309 | $ | 959 | $ | 1,268 | $ | 504 | $ | 865 | $ | 1,369 | ||||||||||||
| CSX 2002 FINANCIAL SUPPLEMENT | 13 |
Marine Services
Notes to Marine Services Statements
Note 1. Lease Commitments
Net lease obligations at December 27, 2002 are as follows:
(Millions of Dollars) | Fiscal Year Ended Dec. 27, 2002 | ||||||||
| CSX Lines | CSX World Terminals | Total Marine Services | |||||||
2003 | $ | 65 | $ | 7 | $ | 72 | |||
2004 | 72 | 5 | 77 | ||||||
2005 | 30 | 4 | 34 | ||||||
2006 | 35 | 4 | 39 | ||||||
2007 | 54 | 4 | 58 | ||||||
Thereafter | 189 | 136 | 325 | ||||||
Total | $ | 445 | $ | 160 | $ | 605 | |||
Note 2. Related Party Transactions
CSX Lines purchases transportation services from CSX Intermodal, CSX Lines and CSX World Terminals purchase computer and software services from CSX Technology.
| 14 | CSX 2002 FINANCIAL SUPPLEMENT |
CSX Consolidating Statements
The following schedules combine the Surface Transportation group and the Marine Services group with all of the Company’s additional subsidiaries and the parent company, which are included in the Eliminations/Other column.
Consolidating Statement of Income
(Millions of Dollars)
| Fiscal Years Ended | |||||||||||||||||||
| Dec. 27, 2002 | Dec. 28, 2001 | ||||||||||||||||||
| Surface Transportation | Marine Services | Eliminations/ Other | Total | Total | |||||||||||||||
Operating Revenue | $ | 7,183 | $ | 994 | $ | (25 | ) | $ | 8,152 | $ | 8,110 | ||||||||
Operating Expense | |||||||||||||||||||
Labor and Fringe | 2,608 | 286 | 3 | 2,897 | 2,934 | ||||||||||||||
Materials, Supplies and Other | 1,380 | 321 | 12 | 1,713 | 1,689 | ||||||||||||||
Conrail Operating Fees, Rents and Services | 322 | — | — | 322 | 336 | ||||||||||||||
Building and Equipment Rent | 556 | 54 | (9 | ) | 601 | 626 | |||||||||||||
Inland Transportation | 268 | 126 | (24 | ) | 370 | 337 | |||||||||||||
Depreciation | 605 | 26 | 7 | 638 | 613 | ||||||||||||||
Fuel | 449 | 66 | — | 515 | 585 | ||||||||||||||
Miscellaneous | — | 8 | (39 | ) | (31 | ) | (27 | ) | |||||||||||
New Orleans Litigation Provision | — | — | — | — | 60 | ||||||||||||||
Total Operating Expense | 6,188 | 887 | (50 | ) | 7,025 | 7,153 | |||||||||||||
Operating Income Before Fees and Special Items | 995 | 107 | 25 | 1,127 | 957 | ||||||||||||||
Management Service Fees | (155 | ) | — | 155 | — | — | |||||||||||||
Conrail-Related Items Recorded at Parent—Net | (53 | ) | — | 53 | — | — | |||||||||||||
Operating Income | 787 | 107 | 233 | 1,127 | 957 | ||||||||||||||
Other Income (Expense) | 19 | 36 | (14 | ) | 41 | 9 | |||||||||||||
Interest Expense | 127 | 7 | 311 | 445 | 518 | ||||||||||||||
Earnings (Loss) Before Income Taxes | 679 | 136 | (92 | ) | 723 | 448 | |||||||||||||
Income Tax Expense (Benefit) | 263 | 39 | (46 | ) | 256 | 155 | |||||||||||||
Earnings (Loss) Before Cumulative Effect of Accounting Change | 416 | 97 | (46 | ) | 467 | 293 | |||||||||||||
Cumulative Effect of Accounting Change—Net of Tax | — | — | (43 | ) | (43 | ) | — | ||||||||||||
Net Earnings (Loss) | $ | 416 | $ | 97 | $ | (89 | ) | $ | 424 | $ | 293 | ||||||||
| CSX 2002 FINANCIAL SUPPLEMENT | 15 |
CSX Consolidating Statements
Consolidating Statement of Cash Flows
(Millions of Dollars)
| Fiscal Years Ended | ||||||||||||||||||||
| Dec. 27, 2002 | Dec. 28, 2001 | |||||||||||||||||||
| Surface Transportation | Marine Services | Eliminations/ Other | Total | Total | ||||||||||||||||
Operating Activities | ||||||||||||||||||||
Net Earnings | $ | 416 | $ | 97 | $ | (89 | ) | $ | 424 | $ | 293 | |||||||||
Adjustments to Reconcile Net Earnings to Net Cash Provided: | ||||||||||||||||||||
Depreciation | 603 | 27 | 19 | 649 | 622 | |||||||||||||||
Deferred Income Taxes | 204 | (12 | ) | (20 | ) | 172 | 197 | |||||||||||||
Cumulative Effect of Accounting Change | — | — | 43 | 43 | — | |||||||||||||||
Other Operating Activities | (63 | ) | (13 | ) | (32 | ) | (108 | ) | (13 | ) | ||||||||||
Changes in Operating Assets and Liabilities | 28 | 11 | 28 | 67 | (225 | ) | ||||||||||||||
Sale (Redemption) of Accounts Receivable | (52 | ) | — | (68 | ) | (120 | ) | (47 | ) | |||||||||||
Net Cash Provided (Used) by Operating Activities | 1,136 | 110 | (119 | ) | 1,127 | 827 | ||||||||||||||
Investing Activities | ||||||||||||||||||||
Property Additions | (1,036 | ) | (30 | ) | (14 | ) | (1,080 | ) | (930 | ) | ||||||||||
Short-term Investments—Net | 220 | (26 | ) | 156 | 350 | (51 | ) | |||||||||||||
Other Investing Activities | (3 | ) | (20 | ) | (22 | ) | (45 | ) | 16 | |||||||||||
Net Cash (Used) Provided by Investing Activities | (819 | ) | (76 | ) | 120 | (775 | ) | (965 | ) | |||||||||||
Financing Activities | ||||||||||||||||||||
Short-term Debt—Net | — | — | 140 | 140 | (524 | ) | ||||||||||||||
Long-term Debt Issued | — | — | 748 | 748 | 962 | |||||||||||||||
Long-term Debt Repaid | (196 | ) | — | (963 | ) | (1,159 | ) | (266 | ) | |||||||||||
Dividends Paid | (242 | ) | — | 156 | (86 | ) | (171 | ) | ||||||||||||
Other Financing Activities | 94 | (50 | ) | (49 | ) | (5 | ) | 14 | ||||||||||||
Net Cash (Used) Provided by Financing Activities | (344 | ) | (50 | ) | 32 | (362 | ) | 15 | ||||||||||||
Net (Decrease) Increase in Cash and Cash Equivalents | (27 | ) | (16 | ) | 33 | (10 | ) | (123 | ) | |||||||||||
Cash, Cash Equivalents, and Short-term Investments | ||||||||||||||||||||
Cash and Cash Equivalents at Beginning of Year | 27 | 140 | (30 | ) | 137 | 260 | ||||||||||||||
Cash and Cash Equivalents at End of Year | — | 124 | 3 | 127 | 137 | |||||||||||||||
Short-term Investments at End of Year | — | — | 137 | 137 | 481 | |||||||||||||||
Cash, Cash Equivalents, and Short-term Investments at End of Year | $ | — | $ | 124 | $ | 140 | $ | 264 | $ | 618 | ||||||||||
| 16 | CSX 2002 FINANCIAL SUPPLEMENT |
CSX Consolidating Statements
Consolidating Statement of Financial Position
(Millions of Dollars)
| Fiscal Years Ended | ||||||||||||||||||||
| Dec. 27, 2002 | Dec. 28, 2001 | |||||||||||||||||||
| Surface Transportation | Marine Services | Eliminations/ Other | Total | Total | ||||||||||||||||
Assets | ||||||||||||||||||||
Current Assets | ||||||||||||||||||||
Cash, Cash Equivalents and Short-term Investments | $ | — | $ | 124 | $ | 140 | $ | 264 | $ | 618 | ||||||||||
Accounts Receivable—Net | 292 | 49 | 458 | 799 | 871 | |||||||||||||||
Receivables from Affiliates | 8 | — | (8 | ) | — | — | ||||||||||||||
Materials and Supplies | 171 | 2 | 7 | 180 | 191 | |||||||||||||||
Deferred Income Taxes | 110 | — | 18 | 128 | 162 | |||||||||||||||
Assets Held for Disposition(a) | — | 263 | — | 263 | 244 | |||||||||||||||
Other Current Assets | 20 | 2 | 133 | 155 | 198 | |||||||||||||||
Total Current Assets | 601 | 440 | 748 | 1,789 | 2,284 | |||||||||||||||
Properties | 18,067 | 194 | 299 | 18,560 | 17,760 | |||||||||||||||
Accumulated Depreciation | (5,051 | ) | (85 | ) | (138 | ) | (5,274 | ) | (4,913 | ) | ||||||||||
Properties—Net | 13,016 | 109 | 161 | 13,286 | 12,847 | |||||||||||||||
Investment in Conrail | — | — | 4,653 | 4,653 | 4,655 | |||||||||||||||
Affiliates and Other Companies | 216 | 630 | (465 | ) | 381 | 297 | ||||||||||||||
Other Long-term Assets | 641 | 89 | 112 | 842 | 718 | |||||||||||||||
Total Assets | $ | 14,474 | $ | 1,268 | $ | 5,209 | $ | 20,951 | $ | 20,801 | ||||||||||
Liabilities | ||||||||||||||||||||
Current Liabilities | ||||||||||||||||||||
Accounts Payable | $ | 710 | $ | 26 | $ | 66 | $ | 802 | $ | 905 | ||||||||||
Labor and Fringe Benefits Payable | 370 | 19 | 68 | 457 | 409 | |||||||||||||||
Payable to Affiliates | 1,402 | 2 | (1,404 | ) | — | — | ||||||||||||||
Casualty, Environmental and Other Reserves | 176 | — | 70 | 246 | 248 | |||||||||||||||
Current Maturities of Long-term Debt | 214 | — | 177 | 391 | 1,044 | |||||||||||||||
Short-term Debt | — | — | 143 | 143 | 225 | |||||||||||||||
Income and Other Taxes Payable | 121 | 18 | 5 | 144 | 100 | |||||||||||||||
Liabilities Held for Disposition(a) | — | 104 | — | 104 | 92 | |||||||||||||||
Other Current Liabilities | 132 | 13 | 22 | 167 | 284 | |||||||||||||||
Total Current Liabilities | 3,125 | 182 | (853 | ) | 2,454 | 3,307 | ||||||||||||||
Casualty, Environmental and Other Reserves | 467 | 1 | 136 | 604 | 687 | |||||||||||||||
Long-term Debt | 890 | — | 5,629 | 6,519 | 5,839 | |||||||||||||||
Deferred Income Taxes | 3,473 | 38 | 56 | 3,567 | 3,621 | |||||||||||||||
Long-term Payable to Affiliates | 100 | 33 | (133 | ) | — | — | ||||||||||||||
Other Long-term Liabilities | 606 | 187 | 773 | 1,566 | 1,227 | |||||||||||||||
Total Liabilities | 8,661 | 441 | 5,608 | 14,710 | 14,681 | |||||||||||||||
Shareholders’ Equity | 5,813 | 827 | (399 | ) | 6,241 | 6,120 | ||||||||||||||
Total Liabilities and Shareholders’ Equity | $ | 14,474 | $ | 1,268 | $ | 5,209 | $ | 20,951 | $ | 20,801 | ||||||||||
| (a) | Assets and Liabilities Held for Disposition represent amounts associated with the conveyance of CSX Lines to Horizon Lines. This agreement was entered into in December 2002, and the transaction completed in February 2003. |
| CSX 2002 FINANCIAL SUPPLEMENT | 17 |
Supplemental Financial Information
The information on pages 18 and 19 is included for analytical purposes only. This is not considered to be better information than is available in the Company’s publicly available reports filed with the Securities and Exchange Commission and does not conform with generally accepted accounting principles. This computation of Earnings Before Interest, Taxes, Depreciation and Amortization (EBITDA) is presented because management believes it is a widely accepted financial indicator used by investors and analysts to evaluate companies on the basis of operating performance. CSX owns a 42 percent undivided interest in Conrail Inc., and operates over a portion of the Conrail territory under the terms of an operating agreement. Conrail loans its excess cash to its owners under loan agreements at market interest rates. The calculations of EBITDA and other financial ratios combine CSX and Conrail financial data for analytical purposes only and are not intended to suggest that CSX has control over Conrail’s operations.
Analysis of Economic Earnings CSX + 42% of Conrail
(Millions of Dollars)
| Fiscal Year ended | ||||||||||||||||||||||||
| Dec. 27, 2002 | Dec. 28, 2001 | |||||||||||||||||||||||
| CSX Consolidated | 42% of Conrail | Purchase Price Amortization | Eliminations | Combined Total | Combined Total | |||||||||||||||||||
Operating Revenue | $ | 8,152 | $ | 375 | $ | — | $ | (345 | ) | $ | 8,182 | $ | 8,136 | |||||||||||
Operating Expense | ||||||||||||||||||||||||
Labor and Fringe | 2,897 | 63 | — | — | 2,960 | 3,000 | ||||||||||||||||||
Materials, Supplies and Other | 1,713 | 60 | — | (4 | ) | 1,769 | 1,752 | |||||||||||||||||
Conrail Operating Fee, Rent and Services | 322 | — | — | (322 | ) | — | — | |||||||||||||||||
Building and Equipment Rent | 601 | — | — | — | 601 | 626 | ||||||||||||||||||
Inland Transportation | 370 | — | — | — | 370 | 337 | ||||||||||||||||||
Depreciation and Amortization | 638 | 135 | 80 | 11 | 864 | 838 | ||||||||||||||||||
Fuel | 515 | 3 | — | — | 518 | 588 | ||||||||||||||||||
Miscellaneous | (31 | ) | — | — | — | (31 | ) | (27 | ) | |||||||||||||||
New Orleans Litigation Provision | — | — | — | — | — | 60 | ||||||||||||||||||
Total Operating Expense | 7,025 | 261 | 80 | (315 | ) | 7,051 | 7,174 | |||||||||||||||||
Operating Income | 1,127 | 114 | (80 | ) | (30 | ) | 1,131 | 962 | ||||||||||||||||
New Orleans Litigation Provision | — | — | — | — | — | 60 | ||||||||||||||||||
Adjusted Operating Income | 1,127 | 114 | (80 | ) | (30 | ) | 1,131 | 1,022 | ||||||||||||||||
Other Income (Expense) | ||||||||||||||||||||||||
Interest Income | 27 | 10 | — | (8 | ) | 29 | 51 | |||||||||||||||||
Discounts on Sales of Accounts Receivable | (26 | ) | — | — | — | (26 | ) | (42 | ) | |||||||||||||||
Other—Net | 40 | 30 | — | 11 | 81 | 47 | ||||||||||||||||||
Interest Expense | 445 | 44 | — | (8 | ) | 481 | 559 | |||||||||||||||||
Earnings Before Income Taxes | 723 | 110 | (80 | ) | (19 | ) | 734 | 459 | ||||||||||||||||
Income Tax Expense | 256 | 34 | (23 | ) | — | 267 | 166 | |||||||||||||||||
Net Earnings (Loss) | $ | 467 | $ | 76 | $ | (57 | ) | $ | (19 | ) | $ | 467 | $ | 293 | ||||||||||
EBITDA Calculations(a) | ||||||||||||||||||||||||
Net Earnings (Loss) | $ | 467 | $ | 76 | $ | (57 | ) | $ | (19 | ) | $ | 467 | $ | 293 | ||||||||||
Depreciation and Amortization | 638 | 135 | 80 | 11 | 864 | 838 | ||||||||||||||||||
Interest Income | (27 | ) | (10 | ) | — | 8 | (29 | ) | (51 | ) | ||||||||||||||
Discounts on Sales of Accounts Receivable | 26 | — | — | — | 26 | 42 | ||||||||||||||||||
Interest Expense | 445 | 44 | — | (8 | ) | 481 | 559 | |||||||||||||||||
Income Tax Expense | 256 | 34 | (23 | ) | — | 267 | 166 | |||||||||||||||||
New Orleans Litigation Provision | — | — | — | — | — | 60 | ||||||||||||||||||
EBITDA | $ | 1,805 | $ | 279 | $ | — | $ | (8 | ) | $ | 2,076 | $ | 1,907 | |||||||||||
| (a) | 2001 excludes New Orleans tank car fire litigation provision of $60 million before tax, $37 million after tax. |
| 18 | CSX 2002 FINANCIAL SUPPLEMENT |
Supplemental Financial Information
Analysis of Economic Earnings CSX + 42% of Conrail
The information on this page is presented for analytical purposes only. See the top of page 18.
(Millions of Dollars)
| Fiscal Years Ended | ||||||||||||||||||||
| Dec. 27, 2002 | Dec. 28, 2001 | |||||||||||||||||||
| CSX | 42% Conrail | Eliminations | Combined Total | Combined Total | ||||||||||||||||
Debt Ratios | ||||||||||||||||||||
Short-term Debt | $ | 143 | $ | — | $ | — | $ | 143 | $ | — | ||||||||||
Long-term Debt | 6,910 | 496 | (371 | ) | 7,035 | 7,394 | ||||||||||||||
Less: Cash, Cash Equiv. and Short-term Investments | 264 | 10 | — | 274 | 632 | |||||||||||||||
Less: Offsetting Deposits | 226 | — | — | 226 | 52 | |||||||||||||||
Net Debt | 6,563 | 486 | (371 | ) | 6,678 | 6,710 | ||||||||||||||
Shareholders’ Equity | 6,241 | 1,775 | (1,775 | ) | 6,241 | 6,120 | ||||||||||||||
Basic Capitalization | 12,804 | 2,261 | (2,146 | ) | 12,919 | 12,830 | ||||||||||||||
Accounts Receivable Sold | 380 | — | — | 380 | 500 | |||||||||||||||
Present Value of Operating Leases | 1,097 | 141 | — | 1,238 | 1,268 | |||||||||||||||
Other Debt | 1,477 | 141 | — | 1,618 | 1,768 | |||||||||||||||
“All-in” Debt | $ | 8,040 | $ | 627 | $ | (371 | ) | $ | 8,296 | $ | 8,478 | |||||||||
“All-in” Capitalization | $ | 14,281 | $ | 2,402 | $ | (2,146 | ) | $ | 14,537 | $ | 14,598 | |||||||||
Net Debt | 6,563 | 486 | (371 | ) | 6,678 | 6,710 | ||||||||||||||
Divided by Basic Capitalization | 12,804 | 2,261 | (2,146 | ) | 12,919 | 12,830 | ||||||||||||||
Debt Ratio | 51 | % | 52 | % | 52 | % | ||||||||||||||
“All-in” Debt | 8,040 | 627 | (371 | ) | 8,296 | 8,478 | ||||||||||||||
“All-in” Capitalization | 14,281 | 2,402 | (2,146 | ) | 14,537 | 14,598 | ||||||||||||||
“All-in” Debt Ratio | 56 | % | 57 | % | 58 | % | ||||||||||||||
EBITDA(from page 18) | $ | 1,805 | $ | 279 | $ | (8 | ) | 2,076 | $ | 1,907 | ||||||||||
Interest Expense—As Reported | 445 | 44 | (8 | ) | 481 | 559 | ||||||||||||||
Less: Interest Income | (27 | ) | (10 | ) | 8 | (29 | ) | (51 | ) | |||||||||||
Plus: Accounts Receivable Sales Expense | 26 | — | — | 26 | 42 | |||||||||||||||
Interest Expense for EBITDA Coverage | $ | 444 | $ | 34 | $ | — | $ | 478 | $ | 550 | ||||||||||
EBITDA Coverage | 4.1 | 4.3 | 3.5 | |||||||||||||||||
EBITDA (from page 18) | $ | 1,805 | $ | 279 | $ | (8 | ) | $ | 2,076 | $ | 1,907 | |||||||||
Lease Payments | 205 | 26 | — | 231 | 274 | |||||||||||||||
EBITDA Including Lease Payments | 2,010 | 305 | (8 | ) | 2,307 | 2,181 | ||||||||||||||
Interest Expense for EBITDA Coverage | 444 | 34 | — | 478 | 550 | |||||||||||||||
Lease Interest | 88 | 11 | — | 99 | 101 | |||||||||||||||
Interest Expense Including Lease Interest | $ | 532 | $ | 45 | $ | — | $ | 577 | $ | 651 | ||||||||||
EBITDA Coverage (including leases) | 3.8 | 4.0 | 3.4 | |||||||||||||||||
| CSX 2002 FINANCIAL SUPPLEMENT | 19 |
CSX Corporation | ||
500 Water Street, 15th floor | ||
Jacksonville, FL 32202 | ||
904/359-3200 | ||
www.csx.com | ||
CSX Transportation Inc. | ||
500 Water Street | ||
Jacksonville, FL 32202 | ||
904/359-3100 | ||
www.csxt.com | ||
CSX Intermodal Inc. | ||
301 West Bay Street | ||
Jacksonville, FL 32202 | ||
904/633-1000 | ||
www.csxi.com | ||
CSX Lines LLC | ||
2101 Rexford Road | ||
Suite 350 West | ||
Charlotte, NC 28211 | ||
704/973-7000 | ||
www.csxlines.com | ||
CSX World Terminals LLC | ||
2101 Rexford Road | ||
Suite 250 West | ||
Charlotte, NC 28211 | ||
704/973-7200 | ||
www.csxworldterminals.com | ||
The Greenbrier | ||
300 West Main Street | ||
White Sulphur Springs, WV 24986 | ||
304/536-1110 | ||
www.greenbrier.com | ||