UNITED STATES
SECURITIES AND EXCHANGE COMMISSION
Washington, D.C. 20549
FORM N-CSR
CERTIFIED SHAREHOLDER REPORT OF REGISTERED
MANAGEMENT INVESTMENT COMPANIES
Investment Company Act file number 811-02890
Fidelity Phillips Street Trust
(Exact name of registrant as specified in charter)
245 Summer St., Boston, MA 02210
(Address of principal executive offices) (Zip code)
Margaret Carey, Secretary
245 Summer St.
Boston, Massachusetts 02210
(Name and address of agent for service)
Registrant's telephone number, including area code:
617-563-7000
| |
Date of fiscal year end: | November 30 |
|
|
Date of reporting period: | May 31, 2024 |
Item 1.
Reports to Stockholders
| |
| | SEMI-ANNUAL SHAREHOLDER REPORT | AS OF MAY 31, 2024 | |
| | Fidelity® Government Cash Reserves Fidelity® Government Cash Reserves : FDRXX |
| | | |
This semi-annual shareholder report contains information about Fidelity® Government Cash Reserves for the period December 1, 2023 to May 31, 2024. You can find additional information about the Fund at fundresearch.fidelity.com/prospectus/sec. You can also request this information by contacting us at 1-800-544-8544 or by sending an e-mail to fidfunddocuments@fidelity.com.
What were your Fund costs for the last six months?(based on hypothetical $10,000 investment)
| | Costs of a $10,000 investment | Costs paid as a percentage of a $10,000 investment | |
| Fidelity® Government Cash Reserves | $ 20 | 0.40% | |
Key Fund Statistics (as of May 31, 2024)
KEY FACTS | | |
| Fund Size | $218,855,553,492 | |
| Number of Holdings | 464 | |
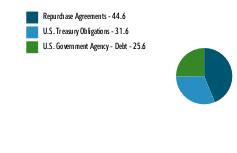
What did the Fund invest in?
(as of May 31, 2024)
EFFECTIVE MATURITY DIVERSIFICATION (% of Fund's net assets) |
| Days |
| 1-7 | 63.1 | |
| 8-30 | 7.5 | |
| 31-60 | 13.2 | |
| 61-90 | 6.3 | |
| 91-180 | 8.1 | |
| >180 | 3.6 | |
| |
| Repurchase Agreements | 44.6 |
| U.S. Treasury Obligations | 31.6 |
| U.S. Government Agency - Debt | 25.6 |
ASSET ALLOCATION (% of Fund's net assets) |
|
| Net Other Assets (Liabilities) - (1.8)% |
|
| Fidelity, the Fidelity Investments Logo and all other Fidelity trademarks or service marks used herein are trademarks or service marks of FMR LLC. Any third-party marks that are used herein are trademarks or service marks of their respective owners. © 2024 FMR LLC. All rights reserved. |
1.9915844.100 55-TSRS-0724 | | For additional information about the Fund; including its prospectus, financial information, holdings and proxy information, scan the QR code or visit fundresearch.fidelity.com/prospectus/sec |
Item 2.
Code of Ethics
Not applicable.
Item 3.
Audit Committee Financial Expert
Not applicable.
Item 4.
Principal Accountant Fees and Services
Not applicable.
Item 5.
Audit Committee of Listed Registrants
Not applicable.
Item 6.
Investments
(a)
Not applicable.
(b)
Not applicable
Item 7.
Financial Statements and Financial Highlights for Open-End Management Investment Companies
Fidelity® Government Cash Reserves
Semi-Annual Report
May 31, 2024
Contents
To view a fund's proxy voting guidelines and proxy voting record for the 12-month period ended June 30, visit http://www.fidelity.com/proxyvotingresults or visit the Securities and Exchange Commission's (SEC) web site at http://www.sec.gov.
You may also call 1-800-544-8544 to request a free copy of the proxy voting guidelines.
Standard & Poor's, S&P and S&P 500 are registered service marks of The McGraw-Hill Companies, Inc. and have been licensed for use by Fidelity Distributors Corporation.
Other third-party marks appearing herein are the property of their respective owners.
All other marks appearing herein are registered or unregistered trademarks or service marks of FMR LLC or an affiliated company. © 2024 FMR LLC. All rights reserved.
This report and the financial statements contained herein are submitted for the general information of the shareholders of the Fund. This report is not authorized for distribution to prospective investors in the Fund unless preceded or accompanied by an effective prospectus.
A fund files its complete schedule of portfolio holdings with the SEC for the first and third quarters of each fiscal year on Form N-PORT. Forms N-PORT are available on the SEC's web site at http://www.sec.gov. A fund's Forms N-PORT may be reviewed and copied at the SEC's Public Reference Room in Washington, DC. Information regarding the operation of the SEC's Public Reference Room may be obtained by calling 1-800-SEC-0330.
For a complete list of a fund's portfolio holdings, view the most recent holdings listing, semiannual report, or annual report on Fidelity's web site at http://www.fidelity.com, http://www.institutional.fidelity.com, or http://www.401k.com, as applicable.
NOT FDIC INSURED •MAY LOSE VALUE •NO BANK GUARANTEE
Neither the Fund nor Fidelity Distributors Corporation is a bank.
Item 7: Financial Statements and Financial Highlights for Open-End Management Investment Companies (Semi-Annual Report)
Fidelity® Government Cash Reserves
Schedule of Investments May 31, 2024 (Unaudited)
Showing Percentage of Net Assets
| U.S. Treasury Debt - 31.6% |
| | | Yield (%)(a) | Principal Amount (b) (000s) | Value ($) (000s) |
| U.S. Treasury Obligations - 31.6% | | | | |
| U.S. Treasury Bills | | | | |
| 6/4/24 to 11/29/24 | | 5.11 to 5.41 | 65,872,644 | 65,258,780 |
| U.S. Treasury Notes | | | | |
| 7/31/24 to 5/15/25 (c) | | 4.88 to 5.47 | 4,008,500 | 3,955,707 |
| | | | | |
| TOTAL U.S. TREASURY DEBT (Cost $69,214,487) | | | | 69,214,487 |
| | | | | |
| U.S. Government Agency Debt - 25.6% |
| | | Yield (%)(a) | Principal Amount (b) (000s) | Value ($) (000s) |
| Federal Agencies - 25.6% | | | | |
| Federal Farm Credit Bank | | | | |
| 3/4/26 (c)(d) | | 0.00 | 77,000 | 76,994 |
| 3/4/26 (c)(d) | | 0.00 | 25,000 | 24,998 |
| 6/3/24 to 5/20/26 (c) | | 5.02 to 5.53 | 9,007,105 | 9,007,231 |
| 6/5/26 (c)(d) | | 0.00 | 44,000 | 43,996 |
| 6/6/25 (c)(d) | | 0.00 | 26,000 | 26,000 |
| Federal Home Loan Bank | | | | |
| 10/3/24 (c)(d) | | 0.00 | 352,000 | 352,000 |
| 10/4/24 (c)(d) | | 0.00 | 99,000 | 99,000 |
| 12/10/24 (c)(d) | | 0.00 | 250,000 | 250,000 |
| 12/10/24 (c)(d) | | 0.00 | 102,000 | 102,000 |
| 12/10/24 (c)(d) | | 0.00 | 141,000 | 141,000 |
| 12/6/24 (c)(d)(e) | | 0.00 | 143,000 | 143,000 |
| 12/6/24 (c)(d)(e) | | 0.00 | 139,000 | 139,000 |
| 12/9/24 (c)(d) | | 0.00 | 28,000 | 28,000 |
| 6/3/24 to 2/27/26 (c) | | 4.79 to 5.52 | 45,732,341 | 45,692,927 |
| | | | | |
| TOTAL U.S. GOVERNMENT AGENCY DEBT (Cost $56,126,146) | | | | 56,126,146 |
| | | | | |
| U.S. Government Agency Repurchase Agreement - 18.6% |
| | | Maturity Amount ($) (000s) | Value ($) (000s) |
| In a joint trading account at: | | | |
| 5.33% dated 5/31/24 due 6/3/24 (Collateralized by U.S. Government Obligations)# | | 17,779,071 | 17,771,172 |
| 5.33% dated 5/31/24 due 6/3/24 (Collateralized by U.S. Government Obligations)# | | 25,844 | 25,833 |
| With: | | | |
| ABN AMRO Bank NV at 5.34%, dated 5/31/24 due 6/3/24 (Collateralized by U.S. Government Obligations valued at $336,765,983, 0.38% - 6.00%, 12/1/26 - 5/1/54) | | 330,147 | 330,000 |
| Bank of America NA at 5.39%, dated 5/6/24 due 9/3/24 (Collateralized by U.S. Government Obligations valued at $152,617,134, 3.00% - 3.50%, 8/1/42 - 4/1/47) | | 151,677 | 149,000 |
| BMO Capital Markets Corp. at 5.32%, dated 5/28/24 due 6/4/24 (Collateralized by U.S. Government Obligations valued at $56,551,828, 0.00% - 5.50%, 7/26/24 - 4/20/54) | | 55,057 | 55,000 |
| BMO Harris Bank NA at: | | | |
5.32%, dated 5/28/24 due 6/4/24 | | | |
| (Collateralized by U.S. Government Obligations valued at $113,400,460, 6.42% - 6.52%, 12/20/53 - 2/20/54) | | 110,114 | 110,000 |
| (Collateralized by U.S. Government Obligations valued at $112,299,485, 6.50%, 11/20/53 - 2/20/54) | | 110,114 | 110,000 |
5.33%, dated: | | | |
| 5/13/24 due 6/7/24 (Collateralized by U.S. Government Obligations valued at $113,572,021, 6.50%, 2/20/54) | | 111,509 | 111,000 |
| 5/20/24 due 6/7/24 (Collateralized by U.S. Government Obligations valued at $226,909,360, 2.50% - 8.00%, 7/20/47 - 5/20/54) | | 223,019 | 222,000 |
5.34%, dated 4/1/24 due 6/3/24 (Collateralized by U.S. Government Obligations valued at $175,020,423, 5.50% - 7.50%, 12/20/53 - 5/20/54) | | 171,589 | 170,000 |
| BNP Paribas, SA at 5.36%, dated: | | | |
3/11/24 due 6/7/24 (Collateralized by U.S. Government Obligations valued at $579,138,459, 0.00% - 7.00%, 7/18/24 - 4/20/64) (c)(d)(f) | | 568,838 | 560,000 |
3/13/24 due 6/7/24 (Collateralized by U.S. Treasury Obligations valued at $232,166,710, 0.00% - 7.00%, 7/31/24 - 5/15/54) (c)(d)(f) | | 226,486 | 223,000 |
| BNY Mellon Capital Markets Corp. at 5.35%, dated 5/2/24 due 6/13/24 (Collateralized by U.S. Treasury Obligations valued at $409,958,510, 0.00% - 8.00%, 6/6/24 - 6/1/54) | | 402,497 | 400,000 |
| BofA Securities, Inc. at: | | | |
5.35%, dated 4/2/24 due 7/2/24 (Collateralized by U.S. Government Obligations valued at $1,102,485,436, 1.50% - 7.50%, 10/1/25 - 5/20/63) | | 1,085,484 | 1,071,000 |
5.38%, dated: | | | |
| 4/18/24 due 7/18/24 (Collateralized by U.S. Government Obligations valued at $459,064,329, 1.50% - 7.05%, 4/1/25 - 4/1/54) (c)(d)(f) | | 453,079 | 447,000 |
| 4/25/24 due 7/25/24 (Collateralized by U.S. Government Obligations valued at $151,837,245, 1.50% - 7.00%, 3/1/27 - 5/1/54) (c)(d)(f) | | 150,013 | 148,000 |
| 4/26/24 due 7/26/24 (Collateralized by U.S. Government Obligations valued at $151,814,769, 1.50% - 7.00%, 10/1/33 - 5/1/54) (c)(d)(f) | | 150,013 | 148,000 |
| 4/30/24 due 7/30/24 (Collateralized by U.S. Government Obligations valued at $607,924,456, 1.50% - 7.50%, 9/1/26 - 5/1/54) (c)(d)(f) | | 601,064 | 593,000 |
| 5/2/24 due 8/2/24 (Collateralized by U.S. Government Obligations valued at $363,826,312, 1.50% - 8.50%, 9/1/26 - 6/1/54) (c)(d)(f) | | 359,881 | 355,000 |
5.39%, dated 3/6/24 due 6/6/24 (Collateralized by U.S. Government Obligations valued at $309,043,943, 1.50% - 6.50%, 4/1/26 - 5/1/54) | | 303,119 | 299,000 |
| CIBC Bank U.S.A. at: | | | |
5.33%, dated: | | | |
| 4/11/24 due 6/7/24 (Collateralized by U.S. Government Obligations valued at $358,773,355, 2.00% - 7.00%, 6/1/43 - 9/1/61) | | 352,255 | 349,000 |
| 5/2/24 due 6/7/24 (Collateralized by U.S. Government Obligations valued at $92,235,689, 2.50% - 7.00%, 12/1/34 - 5/1/54) | | 90,560 | 90,000 |
| 5/20/24 due 6/7/24 (Collateralized by U.S. Government Obligations valued at $175,804,057, 0.00% - 7.00%, 7/14/36 - 5/1/54) | | 172,789 | 172,000 |
5.38%, dated 5/20/24 due 6/20/24 (Collateralized by U.S. Government Obligations valued at $14,310,465, 1.50% - 7.00%, 1/31/28 - 6/1/54) | | 14,065 | 14,000 |
| Citibank NA at 5.34%, dated 5/30/24 due 6/6/24 (Collateralized by U.S. Government Obligations valued at $335,790,075, 0.00% - 7.42%, 1/15/25 - 10/20/67) | | 329,342 | 329,000 |
| Citigroup Global Capital Markets, Inc. at: | | | |
5.34%, dated: | | | |
| 5/6/24 due 6/5/24 (Collateralized by U.S. Government Obligations valued at $345,167,714, 4.00% - 7.50%, 9/30/24 - 10/20/53) | | 338,500 | 337,000 |
| 5/30/24 due 6/6/24 (Collateralized by U.S. Treasury Obligations valued at $503,158,438, 0.75% - 4.25%, 12/31/25 - 5/31/26) | | 493,512 | 493,000 |
5.37%, dated: | | | |
| 5/8/24 due 7/8/24 (Collateralized by U.S. Government Obligations valued at $757,727,423, 2.50% - 7.50%, 2/15/33 - 2/1/54) | | 746,733 | 740,000 |
| 5/14/24 due 7/15/24 (Collateralized by U.S. Government Obligations valued at $599,503,238, 4.25% - 7.50%, 9/30/24 - 1/1/54) | | 591,420 | 586,000 |
5.38%, dated 5/24/24 due 7/24/24 (Collateralized by U.S. Government Obligations valued at $517,912,882, 4.25% - 7.00%, 9/30/24 - 2/1/54) | | 511,622 | 507,000 |
| Ficc Mississippi Gc Repo (GOV) at 5.33%, dated 5/31/24 due 6/3/24 (Collateralized by U.S. Government Obligations valued at $451,040,249, 1.50% - 7.00%, 4/1/26 - 5/1/54) | | 442,196 | 442,000 |
| FICC State Street GC (Gov. Repo) at 5.34%, dated 5/31/24 due 6/3/24 (Collateralized by U.S. Government Obligations valued at $676,560,483, 1.50% - 7.00%, 9/1/32 - 5/1/54) | | 662,295 | 662,000 |
| Goldman Sachs & Co. at: | | | |
5.33%, dated: | | | |
| 5/28/24 due 6/4/24 (Collateralized by U.S. Government Obligations valued at $447,156,872, 2.00% - 7.00%, 9/1/28 - 5/1/54) | | 438,454 | 438,000 |
| 5/29/24 due: | | | |
| 6/3/24 (Collateralized by U.S. Government Obligations valued at $1,120,789,082, 1.50% - 6.50%, 3/1/26 - 5/20/54) | | 1,098,813 | 1,098,000 |
| 6/5/24 (Collateralized by U.S. Government Obligations valued at $1,120,789,081, 1.50% - 7.00%, 6/1/25 - 5/1/54) | | 1,099,138 | 1,098,000 |
5.34%, dated: | | | |
| 5/30/24 due 6/6/24 (Collateralized by U.S. Government Obligations valued at $1,678,895,554, 1.50% - 7.50%, 7/1/29 - 6/1/54) | | 1,646,708 | 1,645,000 |
| 5/31/24 due 6/7/24 (Collateralized by U.S. Government Obligations valued at $1,344,958,240, 2.00% - 7.50%, 8/1/30 - 4/20/54) | | 1,319,369 | 1,318,000 |
| ING Financial Markets LLC at: | | | |
5.35%, dated 5/15/24 due 6/17/24 (Collateralized by U.S. Government Obligations valued at $150,363,372, 2.00% - 6.00%, 3/1/42 - 8/1/53) | | 147,721 | 147,000 |
5.36%, dated: | | | |
| 5/2/24 due 6/13/24 (Collateralized by U.S. Government Obligations valued at $533,984,690, 2.00% - 7.00%, 7/15/26 - 6/1/54) | | 524,258 | 521,000 |
| 5/3/24 due 6/14/24 (Collateralized by U.S. Government Obligations valued at $228,509,854, 4.50% - 7.00%, 7/1/52 - 1/1/54) | | 224,394 | 223,000 |
| Mitsubishi UFJ Securities (U.S.A.), Inc. at 5.36%, dated 5/2/24 due 7/17/24 (Collateralized by U.S. Government Obligations valued at $1,051,506,979, 0.00% - 7.50%, 7/1/24 - 6/1/54) | | 1,037,610 | 1,026,000 |
| Morgan Stanley & Co., LLC at 5.42%, dated 4/1/24 due 6/3/24 (Collateralized by U.S. Government Obligations valued at $153,550,304, 0.00% - 7.50%, 5/1/26 - 6/25/54) (c)(d)(f) | | 150,413 | 149,000 |
| MUFG Securities (Canada), Ltd. at 5.36%, dated 5/2/24 due 7/17/24 (Collateralized by U.S. Government Obligations valued at $213,171,726, 0.13% - 6.50%, 5/15/25 - 4/1/54) | | 210,354 | 208,000 |
| RBC Dominion Securities at 5.33%, dated 5/29/24 due 6/5/24 (Collateralized by U.S. Government Obligations valued at $224,571,845, 0.13% - 6.50%, 10/15/24 - 4/20/54) | | 220,228 | 220,000 |
| RBC Financial Group at: | | | |
5.33%, dated 4/26/24 due 6/7/24 (Collateralized by U.S. Government Obligations valued at $1,168,113,691, 0.00% - 8.00%, 6/30/24 - 6/1/54) | | 1,143,066 | 1,135,000 |
5.34%, dated 5/31/24 due 6/7/24 (Collateralized by U.S. Government Obligations valued at $1,120,075,950, 0.38% - 7.50%, 7/15/24 - 6/1/54) | | 1,106,926 | 1,097,000 |
| SMBC Nikko Securities America, Inc. at 5.34%, dated 5/31/24 due 6/3/24 (Collateralized by U.S. Government Obligations valued at $112,249,993, 1.25% - 7.00%, 8/15/25 - 5/1/54) | | 110,049 | 110,000 |
| TD Securities (U.S.A.) at 5.34%, dated 5/31/24 due 6/3/24 (Collateralized by U.S. Government Obligations valued at $447,979,263, 1.50% - 8.00%, 8/1/24 - 5/1/54) | | 439,195 | 439,000 |
| Wells Fargo Securities, LLC at: | | | |
5.37%, dated: | | | |
| 3/21/24 due 6/21/24 (Collateralized by U.S. Government Obligations valued at $605,349,092, 1.50% - 6.50%, 1/1/25 - 5/1/54) | | 595,056 | 587,000 |
| 3/26/24 due 6/21/24 (Collateralized by U.S. Government Obligations valued at $90,683,855, 2.00% - 6.50%, 10/1/35 - 5/1/54) | | 89,142 | 88,000 |
5.38%, dated 5/21/24 due 8/19/24 (Collateralized by U.S. Government Obligations valued at $594,793,311, 1.50% - 7.00%, 11/1/24 - 6/1/54) | | 589,828 | 582,000 |
5.39%, dated: | | | |
| 3/15/24 due 6/13/24 (Collateralized by U.S. Government Obligations valued at $301,407,461, 2.00% - 6.50%, 5/1/25 - 5/1/54) | | 295,935 | 292,000 |
| 5/28/24 due 8/26/24 (Collateralized by U.S. Government Obligations valued at $295,044,811, 2.50% - 6.50%, 3/1/27 - 1/1/57) | | 292,894 | 289,000 |
| TOTAL U.S. GOVERNMENT AGENCY REPURCHASE AGREEMENT (Cost $40,729,005) | | | 40,729,005 |
| | | | |
| U.S. Treasury Repurchase Agreement - 26.0% |
| | | Maturity Amount ($) (000s) | Value ($) (000s) |
| With: | | | |
| ABN AMRO Bank NV at 5.33%, dated 5/31/24 due 6/3/24 (Collateralized by U.S. Treasury Obligations valued at $303,349,818, 0.00% - 2.88%, 10/24/24 - 8/15/49) | | 297,376 | 297,244 |
| Barclays Bank PLC at 5.33%, dated: | | | |
5/2/24 due 6/7/24 (Collateralized by U.S. Treasury Obligations valued at $730,710,665, 0.75% - 3.63%, 4/30/26 - 11/15/48) | | 717,434 | 713,000 |
5/31/24 due 6/3/24 (Collateralized by U.S. Treasury Obligations valued at $1,014,330,345, 0.25% - 4.75%, 9/15/25 - 11/15/43) | | 994,442 | 994,000 |
| BMO Capital Markets Corp. at 5.32%, dated 5/29/24 due 6/5/24 (Collateralized by U.S. Treasury Obligations valued at $101,057,486, 0.00% - 5.00%, 9/5/24 - 11/15/51) | | 99,102 | 99,000 |
| BMO Harris Bank NA at 5.32%, dated 5/13/24 due 6/7/24 (Collateralized by U.S. Treasury Obligations valued at $100,270,222, 0.63% - 3.50%, 12/31/27 - 2/15/33) | | 98,449 | 98,000 |
| BNP Paribas, SA at: | | | |
5.36%, dated: | | | |
| 2/29/24 due 6/7/24 (Collateralized by U.S. Treasury Obligations valued at $1,061,341,062, 0.38% - 5.57%, 10/31/24 - 2/15/54) (c)(d)(f) | | 1,041,177 | 1,025,000 |
| 3/1/24 due 6/7/24 (Collateralized by U.S. Treasury Obligations valued at $848,097,321, 0.25% - 6.50%, 1/15/25 - 11/15/53) (c)(d)(f) | | 833,674 | 820,000 |
| 3/8/24 due 6/7/24 (Collateralized by U.S. Treasury Obligations valued at $314,170,589, 0.00% - 5.57%, 7/9/24 - 2/15/54) (c)(d)(f) | | 308,888 | 304,000 |
| 3/11/24 due 6/7/24 (Collateralized by U.S. Treasury Obligations valued at $1,455,926,189, 0.50% - 5.57%, 7/31/24 - 5/15/54) (c)(d)(f) | | 1,431,237 | 1,409,000 |
5.37%, dated: | | | |
| 2/14/24 due 6/7/24 (Collateralized by U.S. Treasury Obligations valued at $1,769,120,453, 0.63% - 5.57%, 7/31/24 - 2/15/54) (c)(d)(f) | | 1,734,756 | 1,704,000 |
| 2/16/24 due 6/7/24 (Collateralized by U.S. Treasury Obligations valued at $439,886,397, 0.00% - 5.57%, 7/16/24 - 8/15/53) (c)(d)(f) | | 431,716 | 424,000 |
| 2/20/24 due 6/7/24 (Collateralized by U.S. Treasury Obligations valued at $439,842,532, 0.00% - 5.57%, 7/31/24 - 11/15/53) (c)(d)(f) | | 431,906 | 424,000 |
5.38%, dated 5/3/24 due 9/3/24 (Collateralized by U.S. Treasury Obligations valued at $152,141,365, 0.00% - 5.57%, 6/13/24 - 2/15/54) (c)(d)(f) | | 150,720 | 148,000 |
| BofA Securities, Inc. at: | | | |
5.32%, dated 4/1/24 due 7/1/24 (Collateralized by U.S. Treasury Obligations valued at $80,300,783, 1.38% - 4.00%, 2/29/28 - 2/15/43) | | 79,049 | 78,000 |
5.33%, dated 4/2/24 due 7/2/24 (Collateralized by U.S. Treasury Obligations valued at $168,815,569, 1.88% - 4.00%, 2/29/28 - 2/15/41) | | 166,210 | 164,000 |
5.36%, dated 4/25/24 due 7/25/24 (Collateralized by U.S. Treasury Obligations valued at $259,554,075, 1.13% - 4.00%, 2/29/28 - 5/15/43) (c)(d)(f) | | 256,428 | 253,000 |
| CIBC Bank U.S.A. at 5.32%, dated: | | | |
4/29/24 due 6/7/24 (Collateralized by U.S. Treasury Obligations valued at $135,336,484, 0.38% - 4.88%, 7/31/24 - 2/15/52) | | 133,170 | 132,000 |
5/2/24 due 6/7/24 (Collateralized by U.S. Treasury Obligations valued at $72,763,247, 0.38% - 4.88%, 6/30/24 - 8/15/53) | | 71,441 | 71,000 |
5/15/24 due 6/6/24 (Collateralized by U.S. Treasury Obligations valued at $133,204,310, 0.38% - 4.38%, 6/30/24 - 8/15/53) | | 130,423 | 130,000 |
5/21/24 due 6/3/24 (Collateralized by U.S. Treasury Obligations valued at $202,357,484, 0.38% - 4.63%, 7/31/24 - 8/15/53) | | 198,380 | 198,000 |
5/23/24 due 6/7/24 (Collateralized by U.S. Treasury Obligations valued at $60,283,458, 0.38% - 4.88%, 11/30/24 - 8/15/53) | | 59,183 | 59,000 |
6/3/24 due 6/7/24 (g) | | 198,878 | 198,000 |
| Credit AG at 5.32%, dated 5/15/24 due 6/7/24 (Collateralized by U.S. Treasury Obligations valued at $184,115,588, 4.75%, 7/31/25) | | 180,798 | 180,000 |
| Federal Reserve Bank of New York at 5.3%, dated 5/31/24 due 6/3/24 (Collateralized by U.S. Treasury Obligations valued at $18,871,331,179, 0.38% - 4.75%, 8/15/24 - 5/15/42) | | 18,871,331 | 18,863,000 |
| FICC ACAFB Repo Program at 5.34%, dated 5/31/24 due 6/3/24 (Collateralized by U.S. Treasury Obligations valued at $614,793,900, 3.63% - 4.13%, 3/31/31 - 2/15/53) | | 596,265 | 596,000 |
| Ficc Citi Gc Repo (GOV) at 5.33%, dated 5/31/24 due 6/3/24 (Collateralized by U.S. Treasury Obligations valued at $203,070,214, 0.63% - 6.25%, 5/15/25 - 11/15/53) | | 199,088 | 199,000 |
| Ficc Nomura Gc Repo (GOV) at 5.33%, dated 5/31/24 due 6/3/24 (Collateralized by U.S. Treasury Obligations valued at $1,927,635,833, 0.00% - 5.53%, 6/18/24 - 4/30/29) | | 1,889,839 | 1,889,000 |
| Fixed Income Clearing Corp. - BNP at 5.33%, dated 5/31/24 due 6/3/24 (Collateralized by U.S. Treasury Obligations valued at $1,927,635,814, 0.00% - 5.57%, 6/13/24 - 11/15/53) | | 1,889,839 | 1,889,000 |
| Fixed Income Clearing Corp. - BNYM at 5.33%, dated 5/31/24 due 6/3/24 (Collateralized by U.S. Treasury Obligations valued at $7,508,220,029, 0.75% - 4.50%, 5/15/26 - 5/15/32) | | 7,364,270 | 7,361,000 |
| Fixed Income Clearing Corp. - SSB at: | | | |
5.32%, dated 5/31/24 due 6/3/24 (Collateralized by U.S. Treasury Obligations valued at $3,449,070,600, 0.50% - 3.25%, 5/31/27 - 8/31/27) | | 3,382,499 | 3,381,000 |
5.33%, dated 5/31/24 due 6/3/24 (Collateralized by U.S. Treasury Obligations valued at $2,024,771,867, 1.63% - 4.00%, 7/31/29 - 3/31/30) | | 1,985,882 | 1,985,000 |
| Goldman Sachs & Co. at 5.33%, dated 5/31/24 due 6/3/24 | | | |
(Collateralized by U.S. Treasury Obligations valued at $346,954,121, 3.13% - 4.38%, 11/15/28 - 5/15/34) | | 340,151 | 340,000 |
(Collateralized by U.S. Treasury Obligations valued at $507,165,199, 3.75%, 12/31/30) | | 497,221 | 497,000 |
| HSBC Securities, Inc. at 5.33%, dated 5/29/24 due 6/5/24 (Collateralized by U.S. Treasury Obligations valued at $396,053,030, 3.88%, 11/30/29) | | 388,402 | 388,000 |
| ING Financial Markets LLC at: | | | |
5.33%, dated 5/28/24 due 6/4/24 (Collateralized by U.S. Treasury Obligations valued at $80,670,209, 0.00% - 4.13%, 8/13/24 - 2/15/53) | | 79,082 | 79,000 |
5.34%, dated: | | | |
| 5/30/24 due 6/6/24 (Collateralized by U.S. Treasury Obligations valued at $19,391,572, 0.25% - 4.13%, 6/15/24 - 8/15/28) | | 19,020 | 19,000 |
| 5/31/24 due 6/7/24 (Collateralized by U.S. Treasury Obligations valued at $39,798,672, 0.75% - 4.63%, 9/30/25 - 5/15/49) | | 39,040 | 39,000 |
| J.P. Morgan Securities, LLC at 5.35%, dated 5/22/24 due 6/7/24 (Collateralized by U.S. Treasury Obligations valued at $1,985,386,691, 0.38% - 4.38%, 7/15/25 - 9/30/27) (c)(d)(f) | | 1,951,663 | 1,943,000 |
| Lloyds Bank Corp. Markets PLC at 5.33%, dated 5/28/24 due 6/4/24 (Collateralized by U.S. Treasury Obligations valued at $409,469,593, 3.50% - 4.63%, 11/15/25 - 1/31/30) | | 401,416 | 401,000 |
| Lloyds Bank PLC at 5.39%, dated: | | | |
3/20/24 due 6/20/24 (Collateralized by U.S. Treasury Obligations valued at $171,196,900, 2.25% - 3.88%, 2/15/27 - 12/31/27) | | 168,287 | 166,000 |
5/20/24 due 8/20/24 (Collateralized by U.S. Treasury Obligations valued at $94,054,181, 2.25% - 4.13%, 2/15/27 - 7/31/28) | | 93,267 | 92,000 |
| Mitsubishi UFJ Securities (U.S.A.), Inc. at 5.34%, dated 5/2/24 due 7/17/24 (Collateralized by U.S. Treasury Obligations valued at $266,458,831, 0.00% - 4.63%, 7/25/24 - 8/31/30) | | 262,931 | 260,000 |
| Mizuho Bank, Ltd. at 5.33%, dated 5/31/24 due 6/3/24 (Collateralized by U.S. Treasury Obligations valued at $508,450,898, 1.25%, 8/15/31) | | 497,221 | 497,000 |
| MUFG Securities (Canada), Ltd. at: | | | |
5.33%, dated 5/2/24 due 6/7/24 (Collateralized by U.S. Treasury Obligations valued at $104,874,415, 0.25% - 4.75%, 8/31/24 - 11/15/52) | | 102,634 | 102,000 |
5.34%, dated 5/2/24 due 7/17/24 (Collateralized by U.S. Treasury Obligations valued at $200,053,196, 0.25% - 4.75%, 8/31/24 - 11/15/52) | | 197,198 | 195,000 |
| MUFG Securities EMEA PLC at: | | | |
5.32%, dated: | | | |
| 5/22/24 due 6/7/24 (Collateralized by U.S. Treasury Obligations valued at $203,390,196, 0.38% - 0.88%, 1/31/26 - 1/31/28) | | 199,647 | 199,000 |
| 5/29/24 due 6/7/24 (Collateralized by U.S. Treasury Obligations valued at $809,373,217, 0.38% - 4.13%, 5/15/25 - 10/31/27) | | 794,758 | 793,000 |
5.33%, dated 5/31/24 due: | | | |
| 6/3/24 (Collateralized by U.S. Treasury Obligations valued at $121,550,161, 0.00% - 4.50%, 6/15/24 - 2/15/47) | | 119,053 | 119,000 |
| 6/7/24 (Collateralized by U.S. Treasury Obligations valued at $203,269,868, 1.13% - 2.13%, 5/15/25 - 12/31/26) | | 199,383 | 199,000 |
| Natixis SA at 5.33%, dated: | | | |
4/29/24 due 6/7/24 (Collateralized by U.S. Treasury Obligations valued at $416,295,998, 0.00% - 5.25%, 9/15/24 - 8/15/52) | | 408,525 | 406,000 |
5/31/24 due 6/3/24 (Collateralized by U.S. Treasury Obligations valued at $203,777,946, 0.25% - 4.75%, 6/15/24 - 11/15/53) | | 199,088 | 199,000 |
| NatWest Markets Securities, Inc. at: | | | |
5.32%, dated 5/29/24 due 6/5/24 (Collateralized by U.S. Treasury Obligations valued at $497,107,071, 0.38% - 4.25%, 1/31/25 - 11/30/29) | | 487,504 | 487,000 |
5.33%, dated 5/31/24 due 6/3/24 (Collateralized by U.S. Treasury Obligations valued at $100,004,481, 3.88%, 8/15/33) | | 98,044 | 98,000 |
| Norinchukin Bank at: | | | |
5.33%, dated 5/31/24 due 6/3/24 (Collateralized by U.S. Treasury Obligations valued at $65,289,739, 0.00% - 1.88%, 4/30/28 - 2/15/32) | | 64,028 | 64,000 |
5.35%, dated 5/28/24 due 6/4/24 (Collateralized by U.S. Treasury Obligations valued at $192,866,017, 0.00% - 3.38%, 8/15/31 - 5/15/33) | | 189,197 | 189,000 |
| RBC Dominion Securities at 5.34%, dated 5/31/24 due 6/7/24 (Collateralized by U.S. Treasury Obligations valued at $707,461,938, 0.25% - 4.75%, 6/30/24 - 2/15/54) | | 694,336 | 693,000 |
| SMBC Nikko Securities America, Inc. at 5.33%, dated 5/31/24 due 6/3/24 (Collateralized by U.S. Treasury Obligations valued at $1,202,347,660, 0.00% - 7.63%, 6/27/24 - 5/15/54) | | 1,178,523 | 1,178,000 |
| Societe Generale at: | | | |
5.32%, dated 5/28/24 due 6/3/24 (Collateralized by U.S. Treasury Obligations valued at $99,998,628, 2.38%, 11/15/49) | | 97,086 | 97,000 |
5.35%, dated 5/30/24 due 6/6/24 (Collateralized by U.S. Treasury Obligations valued at $507,470,241, 1.13% - 4.50%, 4/30/27 - 8/15/52) | | 495,515 | 495,000 |
| Sumitomo Mitsui Trust Bank Ltd. at 5.38%, dated: | | | |
5/22/24 due 6/5/24 (Collateralized by U.S. Treasury Obligations valued at $44,990,313, 1.63% - 4.38%, 8/31/28 - 8/15/29) | | 44,092 | 44,000 |
6/5/24 due 6/7/24 (g) | | 44,099 | 44,000 |
| TD Securities (U.S.A.) at 5.33%, dated 5/31/24 due 6/3/24 (Collateralized by U.S. Treasury Obligations valued at $396,956,311, 1.75% - 4.50%, 12/31/26 - 5/31/29) | | 389,173 | 389,000 |
| TOTAL U.S. TREASURY REPURCHASE AGREEMENT (Cost $56,796,244) | | | 56,796,244 |
| | | | |
| TOTAL INVESTMENT IN SECURITIES - 101.8% (Cost $222,865,882) | 222,865,882 |
NET OTHER ASSETS (LIABILITIES) - (1.8)% | (4,010,329) |
| NET ASSETS - 100.0% | 218,855,553 |
| | |
The date shown for securities represents the date when principal payments must be paid, taking into account any call options exercised by the issuer and any permissible maturity shortening features other than interest rate resets.
Any values shown as $0 in the Schedule of Investments may reflect amounts less than $500.
Legend
| (a) | Yield represents either the annualized yield at the date of purchase, or the stated coupon rate, or, for floating and adjustable rate securities, the rate at period end. |
| (b) | Amount is stated in United States dollars unless otherwise noted. |
| (c) | Coupon rates for floating and adjustable rate securities reflect the rates in effect at period end. |
| (d) | Coupon is indexed to a floating interest rate which may be multiplied by a specified factor and/or subject to caps or floors. |
| (e) | Security or a portion of the security purchased on a delayed delivery or when-issued basis. |
| (f) | The maturity amount is based on the rate at period end. |
| (g) | Represents a forward settling transaction and therefore no collateral securities had been allocated as of period end. The agreement contemplated the delivery of U.S. Treasury Obligations as collateral on settlement date. |
Investment Valuation
All investments are categorized as Level 2 under the Fair Value Hierarchy. The inputs or methodology used for valuing securities may not be an indication of the risk associated with investing in these securities. For more information on valuation inputs, refer to the Investment Valuation section in the accompanying Notes to Financial Statements.
| Other Information |
| # Additional information on each counterparty to the repurchase agreement is as follows: |
| Repurchase Agreement / Counterparty | Value ($) (000's) | |
| $17,771,172,000 due 6/03/24 at 5.33% | | |
| BNY Mellon Capital Markets LLC | 275,098 | |
| Bank of America, N.A. | 793,402 | |
| Bank of Nova Scotia | 233,843 | |
| BofA Securities, Inc. | 344,486 | |
| Citigroup Global Markets, Inc. | 1,333,420 | |
| Credit Agricole CIB New York Branch | 1,251,081 | |
| HSBC Securities (USA), Inc. | 488,913 | |
| ING Financial Markets LLC | 211,661 | |
| JP Morgan Securities LLC | 3,536,583 | |
| Mitsubishi UFJ Securities Holdings Ltd | 617,090 | |
| Mizuho Securities USA, Inc. | 800,918 | |
| Nomura Securities International | 168,803 | |
| RBC Dominion Securities, Inc. | 2,050,105 | |
| Royal Bank of Canada | 172,775 | |
| Societe Generale | 307,885 | |
| Sumitomo Mitsui Banking Corp. | 3,791,088 | |
| Sumitomo Mitsui Banking Corp. NY | 714,931 | |
| Wells Fargo Bank NA | 198,592 | |
| Wells Fargo Securities LLC | 480,498 | |
| | 17,771,172 | |
| $25,833,000 due 6/03/24 at 5.33% | | |
| Credit Agricole CIB New York Branch | 416 | |
| JP Morgan Securities LLC | 25,417 | |
| | 25,833 | |
Financial Statements (Unaudited)
| Statement of Assets and Liabilities |
| Amounts in thousands (except per-share amount) | | | | May 31, 2024 (Unaudited) |
| | | | | |
| Assets | | | | |
Investment in securities, at value (including repurchase agreements of $97,525,249) - See accompanying schedule Unaffiliated issuers (cost $222,865,882): | | | $ | 222,865,882 |
| Cash | | | | 1,243,000 |
| Receivable for fund shares sold | | | | 1,777,029 |
| Interest receivable | | | | 614,849 |
| Prepaid expenses | | | | 33 |
| Other receivables | | | | 3,259 |
Total assets | | | | 226,504,052 |
| Liabilities | | | | |
| Payable for investments purchased | | | | |
Regular delivery | $ | 5,273,382 | | |
Delayed delivery | | 282,000 | | |
| Payable for fund shares redeemed | | 1,832,053 | | |
| Distributions payable | | 185,548 | | |
| Accrued management fee | | 71,428 | | |
| Other payables and accrued expenses | | 4,088 | | |
| Total liabilities | | | | 7,648,499 |
| Net Assets | | | $ | 218,855,553 |
| Net Assets consist of: | | | | |
| Paid in capital | | | $ | 218,857,067 |
| Total accumulated earnings (loss) | | | | (1,514) |
| Net Assets | | | $ | 218,855,553 |
Net Asset Value, offering price and redemption price per share ($218,855,553 ÷ 218,817,105 shares) | | | $ | 1.00 |
| Statement of Operations |
| Amounts in thousands | | | | Six months ended May 31, 2024 (Unaudited) |
| Investment Income | | | | |
| Interest | | | $ | 6,126,894 |
| Expenses | | | | |
| Management fee | $ | 338,868 | | |
| Transfer agent fees | | 110,612 | | |
| Accounting fees and expenses | | 1,327 | | |
| Custodian fees and expenses | | 648 | | |
| Independent trustees' fees and expenses | | 324 | | |
| Registration fees | | 4,300 | | |
| Audit | | 37 | | |
| Legal | | 106 | | |
| Miscellaneous | | 544 | | |
| Total expenses before reductions | | 456,766 | | |
| Expense reductions | | (5,425) | | |
| Total expenses after reductions | | | | 451,341 |
| Net Investment income (loss) | | | | 5,675,553 |
| Realized and Unrealized Gain (Loss) | | | | |
| Net realized gain (loss) on: | | | | |
| Investment Securities: | | | | |
| Unaffiliated issuers | | 56 | | |
| Total net realized gain (loss) | | | | 56 |
| Net increase in net assets resulting from operations | | | $ | 5,675,609 |
| Statement of Changes in Net Assets |
| |
| Amount in thousands | | Six months ended May 31, 2024 (Unaudited) | | Year ended November 30, 2023 |
| Increase (Decrease) in Net Assets | | | | |
| Operations | | | | |
| Net investment income (loss) | $ | 5,675,553 | $ | 9,940,026 |
| Net realized gain (loss) | | 56 | | (1,925) |
Net increase in net assets resulting from operations | | 5,675,609 | | 9,938,101 |
| Distributions to shareholders | | (5,675,752) | | (9,939,697) |
| | | | | |
| Share transactions | | | | |
| Proceeds from sales of shares | | 566,395,012 | | 979,486,736 |
| Reinvestment of distributions | | 4,503,179 | | 7,901,601 |
| Cost of shares redeemed | | (580,696,814) | | (973,085,068) |
| | | | | |
Net increase (decrease) in net assets and shares resulting from share transactions | | (9,798,623) | | 14,303,269 |
| Total increase (decrease) in net assets | | (9,798,766) | | 14,301,673 |
| | | | | |
| Net Assets | | | | |
| Beginning of period | | 228,654,319 | | 214,352,646 |
| End of period | $ | 218,855,553 | $ | 228,654,319 |
| | | | | |
| Other Information | | | | |
| Shares | | | | |
| Sold | | 566,395,012 | | 979,486,736 |
| Issued in reinvestment of distributions | | 4,503,179 | | 7,901,601 |
| Redeemed | | (580,696,814) | | (973,085,068) |
| Net increase (decrease) | | (9,798,623) | | 14,303,269 |
| | | | | |
Financial Highlights
Fidelity® Government Cash Reserves |
| |
| | Six months ended (Unaudited) May 31, 2024 | | Years ended November 30, 2023 | | 2022 | | 2021 | | 2020 | | 2019 |
Selected Per-Share Data | | | | | | | | | | | | |
| Net asset value, beginning of period | $ | 1.00 | $ | 1.00 | $ | 1.00 | $ | 1.00 | $ | 1.00 | $ | 1.00 |
| Income from Investment Operations | | | | | | | | | | | | |
Net investment income (loss) A | | .029 | | .046 | | .010 | | - B | | .004 | | .019 |
Net realized and unrealized gain (loss) B | | - | | - | | - | | - | | - | | - |
| Total from investment operations | | .029 | | .046 | | .010 | | - B | | .004 | | .019 |
| Distributions from net investment income | | (.029) | | (.046) | | (.010) | | - B | | (.004) | | (.019) |
| Total distributions | | (.029) | | (.046) | | (.010) | | - B | | (.004) | | (.019) |
| Net asset value, end of period | $ | 1.00 | $ | 1.00 | $ | 1.00 | $ | 1.00 | $ | 1.00 | $ | 1.00 |
Total Return C,D | | | | 4.67% | | 1.03% | | .01% | | .39% | | 1.95% |
Ratios to Average Net Assets A,E,F | | | | | | | | | | | | |
| Expenses before reductions | | .40% G | | .41% | | .34% | | .33% | | .34% | | .38% |
| Expenses net of fee waivers, if any | | | | .40% | | .27% | | .08% | | .26% | | .37% |
| Expenses net of all reductions | | .40% G | | .40% | | .27% | | .08% | | .26% | | .37% |
| Net investment income (loss) | | 5.01% G | | 4.58% | | 1.00% | | .01% | | .33% | | 1.93% |
| Supplemental Data | | | | | | | | | | | | |
| Net assets, end of period (in millions) | $ | 218,856 | $ | 228,654 | $ | 214,353 | $ | 214,123 | $ | 210,565 | $ | 155,714 |
ANet investment income (loss) is affected by the timing of the declaration of dividends by any underlying mutual funds or exchange-traded funds (ETFs). Net investment income (loss) of any mutual funds or ETFs is not included in the Fund's net investment income (loss) ratio.
BAmount represents less than $.0005 per share.
CTotal returns for periods of less than one year are not annualized.
DTotal returns would have been lower if certain expenses had not been reduced during the applicable periods shown.
EFees and expenses of any underlying mutual funds or exchange-traded funds (ETFs) are not included in the Fund's expense ratio. The Fund indirectly bears its proportionate share of these expenses.
FExpense ratios reflect operating expenses of the class. Expenses before reductions do not reflect amounts reimbursed, waived, or reduced through arrangements with the investment adviser, brokerage services, or other offset arrangements, if applicable, and do not represent the amount paid by the class during periods when reimbursements, waivers or reductions occur.
GAnnualized.
Notes to Financial Statements
(Unaudited)For the period ended May 31, 2024
(Amounts in thousands except percentages)
1. Organization.
Fidelity Government Cash Reserves (the Fund) is a fund of Fidelity Phillips Street Trust (the Trust) and is authorized to issue an unlimited number of shares. Share transactions on the Statement of Changes in Net Assets may contain exchanges between affiliated funds. The Trust is registered under the Investment Company Act of 1940, as amended (the 1940 Act), as an open-end management investment company organized as a Delaware statutory trust.
2. Significant Accounting Policies.
The Fund is an investment company and applies the accounting and reporting guidance of the Financial Accounting Standards Board (FASB) Accounting Standards Codification Topic 946 Financial Services - Investment Companies. The financial statements have been prepared in conformity with accounting principles generally accepted in the United States of America (GAAP), which require management to make certain estimates and assumptions at the date of the financial statements. Actual results could differ from those estimates. Subsequent events, if any, through the date that the financial statements were issued have been evaluated in the preparation of the financial statements. The Fund's Schedule of Investments lists any underlying mutual funds or exchange-traded funds (ETFs) but does not include the underlying holdings of these funds. The following summarizes the significant accounting policies of the Fund:
Investment Valuation. The Fund categorizes the inputs to valuation techniques used to value its investments into a disclosure hierarchy consisting of three levels as shown below:
Level 1 - unadjusted quoted prices in active markets for identical investments
Level 2 - other significant observable inputs (including quoted prices for similar investments, interest rates, prepayment speeds, etc.)
Level 3 - unobservable inputs (including the Fund's own assumptions based on the best information available)
As permitted by compliance with certain conditions under Rule 2a-7 of the 1940 Act, securities are valued at amortized cost, which approximates fair value. The amortized cost of an instrument is determined by valuing it at its original cost and thereafter amortizing any discount or premium from its face value at a constant rate until maturity. Securities held by a money market fund are generally high quality and liquid; however, they are reflected as Level 2 because the inputs used to determine fair value are not quoted prices in an active market.
Investment Transactions and Income. The net asset value per share for processing shareholder transactions is calculated as of the close of business of the New York Stock Exchange (NYSE), normally 4:00 p.m. Eastern time. Security transactions are accounted for as of trade date. Gains and losses on securities sold are determined on the basis of identified cost and include proceeds received from litigation. Interest income is accrued as earned and includes coupon interest and amortization of premium and accretion of discount on debt securities as applicable.
Expenses. Expenses directly attributable to a fund are charged to that fund. Expenses attributable to more than one fund are allocated among the respective funds on the basis of relative net assets or other appropriate methods. Expenses included in the accompanying financial statements reflect the expenses of that fund and do not include any expenses associated with any underlying mutual funds or exchange-traded funds. Although not included in a fund's expenses, a fund indirectly bears its proportionate share of these expenses through the net asset value of each underlying mutual fund or exchange-traded fund. Expense estimates are accrued in the period to which they relate and adjustments are made when actual amounts are known.
Deferred Trustee Compensation. Under a Deferred Compensation Plan (the Plan) for certain Funds, certain independent Trustees have elected to defer receipt of a portion of their annual compensation. Deferred amounts are invested in affiliated mutual funds, are marked-to-market and remain in a fund until distributed in accordance with the Plan. The investment of deferred amounts and the offsetting payable to the Trustees presented below are included in the accompanying Statement of Assets and Liabilities in other receivables and other payables and accrued expenses, as applicable.
| Fidelity Government Cash Reserves | $3,258 |
Income Tax Information and Distributions to Shareholders. Each year, the Fund intends to qualify as a regulated investment company under Subchapter M of the Internal Revenue Code, including distributing substantially all of its taxable income and realized gains. As a result, no provision for U.S. Federal income taxes is required. The Fund files a U.S. federal tax return, in addition to state and local tax returns as required. The Fund's federal income tax returns are subject to examination by the Internal Revenue Service (IRS) for a period of three fiscal years after they are filed. State and local tax returns may be subject to examination for an additional fiscal year depending on the jurisdiction.
Distributions are declared and recorded daily and paid monthly from net investment income. Distributions from realized gains, if any, are declared and recorded on the ex-dividend date. Income and capital gain distributions are determined in accordance with income tax regulations, which may differ from GAAP.
Capital accounts within the financial statements are adjusted for permanent book-tax differences. These adjustments have no impact on net assets or the results of operations. Capital accounts are not adjusted for temporary book-tax differences which will reverse in a subsequent period.
Book-tax differences are primarily due to capital loss carryforwards.
As of period end, the cost and unrealized appreciation (depreciation) in securities for federal income tax purposes were as follows:
| Gross unrealized appreciation | $- |
| Gross unrealized depreciation | - |
| Net unrealized appreciation (depreciation) | $- |
| Tax cost | $222,865,882 |
Capital loss carryforwards are only available to offset future capital gains of the Fund to the extent provided by regulations and may be limited. The capital loss carryforward information presented below, including any applicable limitation, is estimated as of prior fiscal period end and is subject to adjustment.
| Long-term | $(1,926) |
| Total capital loss carryforward | $(1,926) |
Repurchase Agreements. Pursuant to an Exemptive Order issued by the Securities and Exchange Commission, funds and other registered investment companies having management contracts with Fidelity Management and Research Company LLC, or its affiliates are permitted to transfer uninvested cash balances into joint trading accounts which are then invested in repurchase agreements. Funds may also invest directly with institutions in repurchase agreements. Repurchase agreements may be collateralized by cash or government securities. Upon settlement date, collateral is held in segregated accounts with custodian banks and may be obtained in the event of a default of the counterparty. The collateral balance is monitored on a daily basis to ensure it is at least equal to the principal amount of the repurchase agreement (including accrued interest). In the event of a default by the counterparty, realization of the collateral proceeds could be delayed, during which time the value of the collateral may decline.
Delayed Delivery Transactions and When-Issued Securities. During the period, certain Funds transacted in securities on a delayed delivery or when-issued basis. Payment and delivery may take place after the customary settlement period for that security. The price of the underlying securities and the date when the securities will be delivered and paid for are fixed at the time the transaction is negotiated. Securities purchased on a delayed delivery or when-issued basis are identified as such in the Schedule of Investments. Compensation for interest forgone in the purchase of a delayed delivery or when-issued debt security may be received. With respect to purchase commitments, each applicable Fund identifies securities as segregated in its records with a value at least equal to the amount of the commitment. Payables and receivables associated with the purchases and sales of delayed delivery securities having the same coupon, settlement date and broker are offset. Delayed delivery or when-issued securities that have been purchased from and sold to different brokers are reflected as both payables and receivables in the Statement of Assets and Liabilities under the caption "Delayed delivery", as applicable. Losses may arise due to changes in the value of the underlying securities or if the counterparty does not perform under the contract's terms, or if the issuer does not issue the securities due to political, economic, or other factors.
New Rule Issuance. In July 2023, the Securities and Exchange Commission issued a Final Rule relative to Money Market Reform. Among other things, the Final Rule includes amendments for: (1) Removal of redemption gates except for liquidations; (2) Required liquidity fees for institutional prime and institutional tax-exempt money market funds; (3) Discretionary liquidity fees for non-government money market funds; (4) Higher liquidity requirements; and (5) Changes to reporting requirements for Form N-MFP and Form N-CR. The Final Rule imposes different implementation dates for the amendments through October 2, 2024. Management has evaluated the amendments and does not expect them to have a material impact to the Fund's financial statements and related disclosures.
3. Fees and Other Transactions with Affiliates.
Management Fee. Fidelity Management & Research Company LLC (the investment adviser) and its affiliates provide the Fund with investment management related services for which the Fund pays a monthly management fee.
Effective March 1, 2024, the Fund's management contract was amended to incorporate administrative services previously covered under separate services agreements (Transfer Agent and Accounting agreements). Any reference to "class" in this note shall mean "the Fund" as the Fund currently offers only one class of shares. The amended contract incorporates a management fee rate that may vary by class. The investment adviser or an affiliate pays certain expenses of managing and operating the Fund out of each class's management fee. Each class of the Fund pays a management fee to the investment adviser. The management fee is calculated and paid to the investment adviser every month. The management fee is determined by calculating a basic fee and then adding an income-related fee. When determining a class's management fee, a mandate rate is calculated based on the monthly average net assets of a group of funds advised by FMR within a designated asset class. A discount rate is subtracted from the mandate rate once the Fund's monthly average net assets reach a certain level. The mandate rate and discount rate may vary by class. The annual management fee rate for a class of shares of the Fund is the lesser of (1) the class's mandate rate reduced by the class's discount rate (if applicable) or (2) the amount set forth in the following table.
| | Maximum Management Fee Rate % |
| Fidelity Government Cash Reserves | .27 |
One-twelfth of the management fee rate for a class is applied to the average net assets of the class for the month, giving a dollar amount which is the management fee for the class for that month. The income-related fee varies depending on the level of the Fund's monthly gross income from an annualized rate of .05% (at a fund annualized gross yield of 0%) to .27% (at a fund annualized gross yield of 15%) of the Fund's average net assets throughout the month. The income-related fee is proportionately added to a class's basic fee. A different management fee rate may be applicable to each class of the Fund. The difference between classes is the result of separate arrangements for class-level services and/or waivers of certain expenses. It is not the result of any difference in advisory or custodial fees or other expenses related to the management of the Fund's assets, which do not vary by class. For the portion of the reporting period on or after March 1, 2024, the total annualized income-related fee and management fee rates were as follows:
| | Income-Related Fee $ | Income-Related Fee Rate % | Total Management Fee Rate % |
| Fidelity Government Cash Reserves | 65,920 | .12 | .39 |
Prior to March 1, 2024, the management fee was calculated on the basis of a group fee rate plus a total income-based component. The annualized group fee rate averaged .10% during the period. The group fee rate was based upon the monthly average net assets of a group of registered investment companies with which the investment adviser has management contracts. The group fee rate decreased as assets under management increased and increased as assets under management decreased. The total income-based component was comprised of an income-based fee and an asset-based fee and was calculated according to a graduated schedule providing for different rates based on the Fund's gross annualized yield. The rate increased as the Fund's gross yield increased. Prior to March 1, 2024, the income-based portion of this fee was $67,953 or an annualized rate of .12% of the Fund's average net assets. For the portion of the reporting period prior to March 1, 2024, the total annualized management fee rate was .21%.
Effective March 1, 2024, the Fund's sub-advisory agreements with FMR Investment Management (UK) Limited, Fidelity Management & Research (Hong Kong) Limited, and Fidelity Management & Research (Japan) Limited were amended to provide that the investment adviser pays each sub-adviser monthly fees equal to 110% of the sub-adviser's costs for providing sub-advisory services.
Transfer Agent Fees. Fidelity Investments Institutional Operations Company LLC (FIIOC), an affiliate of the investment adviser, is the Fund's transfer, dividend disbursing and shareholder servicing agent. Effective March 1, 2024, each Fund's management contract was amended to incorporate transfer agent services and associated fees previously covered under a separate services agreement. FIIOC pays for typesetting, printing and mailing of shareholder reports, except proxy statements.
During November 2023, the Board approved a change in the transfer agent fees effective December 1, 2023 to a fixed annual rate of average net assets of .1919%.
Prior to December 1, 2023, FIIOC received account fees and asset-based fees that varied according to account size and type of account.
For the portion of the reporting period prior to March 1, 2024, the fees were equivalent to the annualized rate of .19% of average net assets.
Accounting Fees. Fidelity Service Company, Inc. (FSC), an affiliate of the investment adviser, maintains the Fund's accounting records. Effective March 1, 2024, the Fund's management contract was amended to incorporate accounting services and associated fees previously covered under a separate services agreement.
During November 2023, the Board approved a change in the accounting fees effective December 1, 2023 to a fixed annual rate of average net assets as follows:
| | % of Average Net Assets |
| Fidelity Government Cash Reserves | .0023 |
Prior to December 1, 2023, the accounting fee was based on the level of average net assets for each month. For the portion of the reporting period prior to March 1, 2024, the fees were equivalent to the following annualized rates:
| | % of Average Net Assets |
| Fidelity Government Cash Reserves | -A |
A Amount represents less than .005%
Interfund Trades. Funds may purchase from or sell securities to other Fidelity Funds under procedures adopted by the Board. The procedures have been designed to ensure these interfund trades are executed in accordance with Rule 17a-7 of the 1940 Act. During the period, there were no interfund trades.
4. Expense Reductions.
During the period the investment adviser or an affiliate reimbursed and/or waived a portion of operating expenses in the amount of $5,425.
5. Other.
A fund's organizational documents provide former and current trustees and officers with a limited indemnification against liabilities arising in connection with the performance of their duties to the fund. In the normal course of business, a fund may also enter into contracts that provide general indemnifications. A fund's maximum exposure under these arrangements is unknown as this would be dependent on future claims that may be made against a fund. The risk of material loss from such claims is considered remote.
6. Risk and Uncertainties.
Many factors affect a fund's performance. Developments that disrupt global economies and financial markets, such as pandemics, epidemics, outbreaks of infectious diseases, war, terrorism, and environmental disasters, may significantly affect a fund's investment performance. The effects of these developments to a fund will be impacted by the types of securities in which a fund invests, the financial condition, industry, economic sector, and geographic location of an issuer, and a fund's level of investment in the securities of that issuer. Significant concentrations in security types, issuers, industries, sectors, and geographic locations may magnify the factors that affect a fund's performance.
Item 8: Changes in and Disagreements with Accountants for Open-End Management Investment Companies
Note: This is not applicable for any fund included in this document.
Item 9: Proxy Disclosures for Open-End Management Investment Companies
Note: This is not applicable for any fund included in this document.
Item 10: Renumeration Paid to Directors, Officers, and others of Open-End Management Investment Companies
Note: This information is disclosed as part of the financial statements for each Fund as part of Item 7: Financial Statements and Financial Highlights for Open-End Management Investment companies.
Item 11: Statement Regarding Basis for Approval of Investment Advisory Contract
Board Approval of Investment Advisory Contracts
Fidelity Government Cash Reserves
At its January 2024 meeting, the Board of Trustees, including the Independent Trustees (together, the Board), approved an amended and restated management contract with Fidelity Management & Research Company LLC (FMR) (the Management Contract), and amended and restated sub-advisory agreements (the Sub-Advisory Contracts, and together with the Management Contract, the Advisory Contracts) for the fund, including the fund's sub-advisory agreements with FMR Investment Management (UK) Limited (FMR UK), Fidelity Management & Research (Hong Kong) Limited (FMR H.K.), and Fidelity Management & Research (Japan) Limited (FMR Japan). The Advisory Contracts will be effective March 1, 2024. The Board will consider the annual renewal of the fund's Advisory Contracts in September 2024, following its review of additional materials provided by FMR.
Management Contract. The Board approved the Management Contract, which implements a new fee structure combining the management fee, transfer agent fee (TA Fee), and pricing and bookkeeping fee (P&B Fee) of the fund into a single fee based on tiered schedules and subject to a maximum rate (the Unified Fee). In exchange for the Unified Fee, the fund will receive investment advisory, management, administrative, transfer agent, pricing and bookkeeping services under a single agreement - the Management Contract.
In its consideration of the Management Contract over several meetings, the Board received, reviewed and discussed a comprehensive set of analyses regarding the Unified Fee including (i) the legal framework, (ii) design goals for the Unified Fee, (iii) calculation methodology for the Unified Fee and illustrative examples, (iv) annual and cumulative projected impacts under various scenarios, both in the aggregate and at the fund/class level, (v) explanations of schedules, rate levers and maximum rates and (vi) shareholder benefits and projected savings.
The Board considered that the maximum Unified Fee for the fund would be no higher than the sum of (i) the lowest contractual management fee under the fund's existing management contract, which is the individual fund fee, if any, plus the lowest contractual marginal group fee rate and (ii) the TA and P&B Fee rates, which are fixed fee rates since December 1, 2023 (together, the "Unified Fee Cap"). The Board noted that, as a result of this Unified Fee Cap, the Unified Fee would be no greater than the fees previously authorized to be charged for the same services. The Board noted that certain expenses such as income-based fees, third-party expenses, and certain other miscellaneous expenses would be outside the scope of the Unified Fee and the calculation of such fees would not change as a result of the Unified Fee.
The Board considered that implementation of the Unified Fee, which includes the Unified Fee Cap, would cause all funds subject to a Unified Fee, including the fund, to experience an immediate reduction on contractual fee rates for services provided under the current management contracts. The Board considered that some funds would not experience lower fees as a result of existing fee caps. The Board further considered that, in addition to the contractual fee savings, the Unified Fee offers funds and their shareholders greater protection from future rate increases for services previously offered under separate agreements that are now covered by the Management Contract because such rate increases would require shareholder, as well as Board, approval.
Sub-Advisory Contracts. In connection with the Unified Fee changes, the Board considered the Sub-Advisory Contracts, which changed the arrangements for fees paid by FMR to the sub-advisers under the agreements. The Board noted that the agreements with FMR UK, FMR H.K., and FMR Japan were amended to provide that FMR will compensate each sub-adviser at a fee equal to 110% of the sub-adviser's costs incurred in providing services under the agreement. The Board considered that, under the Sub-Advisory Contracts, FMR, and not the fund, will continue to pay the sub-advisory fees to each applicable sub-adviser.
The Board considered that the approval of the fund's Advisory Contracts will not result in any changes in the investment process or strategies employed in the management of the fund's assets or the day-to-day management of the fund or the persons primarily responsible for such management. Further, the Board considered that the Management Contract would not change the obligations and services of FMR and its affiliates on behalf of the fund, and, in particular, there would be no change in the nature and level of advisory, management, administration, transfer agent, and pricing and bookkeeping services provided to the fund by FMR and its affiliates.
In connection with its consideration of future renewals of the fund's Advisory Contracts, the Board will consider: (i) the nature, extent and quality of services provided to the funds, including shareholder and administrative services and investment performance; (ii) the competitiveness of the management fee and total expenses for the fund; (iii) the costs of the services and profitability, including the revenues earned and the expenses incurred in conducting the business of developing, marketing, distributing, managing, administering, and servicing the fund and its shareholders, to the extent applicable; and (iv) whether there have been economies of scale in respect of the Fidelity funds, whether the Fidelity funds (including the fund) have appropriately benefited from any such economies of scale, and whether there is the potential for realization of any further economies.
Based on its evaluation of all of the conclusions noted above, and after considering all factors it believed relevant, the Board concluded that the fund's management fee structure is fair and reasonable, and that the fund's Advisory Contracts should be approved.
1.704549.126
CAS-SANN-0724
Item 8.
Changes in and Disagreements with Accountants for Open-End Management Investment Companies
See Item 7.
Item 9.
Proxy Disclosures for Open-End Management Investment Companies
See Item 7.
Item 10.
Remuneration Paid to Directors, Officers, and Others of Open-End Management Investment Companies
See Item 7.
Item 11.
Statement Regarding Basis for Approval of Investment Advisory Contract
See Item 7.
Item 12.
Disclosure of Proxy Voting Policies and Procedures for Closed-End Management Investment Companies
Not applicable.
Item 13.
Portfolio Managers of Closed-End Management Investment Companies
Not applicable.
Item 14.
Purchases of Equity Securities by Closed-End Management Investment Company and Affiliated Purchasers
Not applicable.
Item 15.
Submission of Matters to a Vote of Security Holders
There were no material changes to the procedures by which shareholders may recommend nominees to the Fidelity Phillips Street Trust’s Board of Trustees.
Item 16.
Controls and Procedures
(a)(i) The President and Treasurer and the Chief Financial Officer have concluded that the Fidelity Phillips Street Trust’s (the “Trust”) disclosure controls and procedures (as defined in Rule 30a-3(c) under the Investment Company Act) provide reasonable assurances that material information relating to the Trust is made known to them by the appropriate persons, based on their evaluation of these controls and procedures as of a date within 90 days of the filing date of this report.
(a)(ii) There was no change in the Trust’s internal control over financial reporting (as defined in Rule 30a-3(d) under the Investment Company Act) that occurred during the period covered by this report that has materially affected, or is reasonably likely to materially affect, the Trust’s internal control over financial reporting.
Item 17.
Disclosure of Securities Lending Activities for Closed-End Management Investment Companies
Not applicable.
Item 18.
Recovery of Erroneously Awarded Compensation
(a)
Not applicable.
(b)
Not applicable.
Item 19.
Exhibits
SIGNATURES
Pursuant to the requirements of the Securities Exchange Act of 1934 and the Investment Company Act of 1940, the registrant has duly caused this report to be signed on its behalf by the undersigned, thereunto duly authorized.
Fidelity Phillips Street Trust
|
By: | /s/Laura M. Del Prato |
| Laura M. Del Prato |
| President and Treasurer (Principal Executive Officer) |
|
|
Date: | July 23, 2024 |
Pursuant to the requirements of the Securities Exchange Act of 1934 and the Investment Company Act of 1940, this report has been signed below by the following persons on behalf of the registrant and in the capacities and on the dates indicated.
|
By: | /s/Laura M. Del Prato |
| Laura M. Del Prato |
| President and Treasurer (Principal Executive Officer) |
|
|
Date: | July 23, 2024 |
|
By: | /s/John J. Burke III |
| John J. Burke III |
| Chief Financial Officer (Principal Financial Officer) |
|
|
Date: | July 23, 2024 |