Item 1. Reports to Stockholders
US equity mutual fund
Delaware Mid Cap Value Fund
October 31, 2018
Carefully consider the Fund’s investment objectives, risk factors, charges, and expenses before investing. This and other information can be found in the Fund’s prospectus and its summary prospectus, which may be obtained by visiting delawarefunds.com/literature or calling 800 523-1918. Investors should read the prospectus and the summary prospectus carefully before investing.
You can obtain shareholder reports and prospectuses online instead of in the mail.
Visit delawarefunds.com/edelivery.

Experience Delaware Funds® by Macquarie
Macquarie Investment Management (MIM) is a global asset manager with offices throughout the United States, Europe, Asia, and Australia. We are active managers who prioritize autonomy and accountability at the investment team level in pursuit of opportunities that matter for our clients. Delaware Funds is one of the longest-standing mutual fund families, with more than 75 years in existence.
If you are interested in learning more about creating an investment plan, contact your financial advisor.
You can learn more about Delaware Funds or obtain a prospectus for Delaware Mid Cap Value Fund at delawarefunds.com/literature.
Manage your account online
| • | | Check your account balance and transactions |
| • | | View statements and tax forms |
| • | | Make purchases and redemptions |
Visit delawarefunds.com/account-access.
Macquarie Asset Management (MAM) offers a diverse range of products including securities investment management, infrastructure and real asset management, and fund and equity-based structured products. MIM is the marketing name for certain companies comprising the asset management division of Macquarie Group. This includes the following registered investment advisers: Macquarie Investment Management Business Trust (MIMBT), Macquarie Funds Management Hong Kong Limited, Macquarie Investment Management Austria Kapitalanlage AG, Macquarie Investment Management Global Limited, Macquarie Investment Management Europe Limited, and Macquarie Capital Investment Management LLC.
The Fund is distributed by Delaware Distributors, L.P. (DDLP), an affiliate of MIMBT and Macquarie Group Limited.
Other than Macquarie Bank Limited (MBL), none of the entities noted are authorized deposit-taking institutions for the purposes of the Banking Act 1959 (Commonwealth of Australia). The obligations of these entities do not represent deposits or other liabilities of MBL. MBL does not guarantee or otherwise provide assurance in respect of the obligations of these entities, unless noted otherwise. The Fund is governed by US laws and regulations.
Unless otherwise noted, views expressed herein are current as of Oct. 31, 2018, and subject to change for events occurring after such date.
The Fund is not FDIC insured and is not guaranteed. It is possible to lose the principal amount invested.
Advisory services provided by Delaware Management Company, a series of MIMBT, a US registered investment advisor.
All third-party marks cited are the property of their respective owners.
© 2018 Macquarie Management Holdings, Inc.
| | | | |
| Portfolio management review | | | | |
| Delaware Mid Cap Value Fund | | | November 13, 2018 | |
| | | | | | | | |
Performance preview (for the year ended October 31, 2018) | |
Delaware Mid Cap Value Fund (Institutional Class shares) | | | 1-year return | | | | -3.37 | % |
Delaware Mid Cap Value Fund (Class A shares) | | | 1-year return | | | | -3.45 | % |
Russell Midcap ® Value Index (benchmark) | | | 1-year return | | | | +0.16 | % |
Past performance does not guarantee future results.
For complete, annualized performance for Delaware Mid Cap Value Fund, please see the table on page 4. Institutional Class shares are not subject to a sales charge and are offered for sale exclusively to certain eligible investors. In addition, Institutional Class shares pay no distribution and service fee.
The performance of Class A shares excludes the applicable sales charge. Both Institutional Class shares and Class A shares reflect the reinvestment of all distributions.
Please see page 6 for a description of the index. Index performance returns do not reflect any management fees, transaction costs, or expenses. Indices are unmanaged and one cannot invest directly in an index.
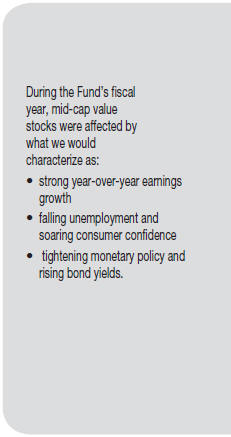
Mid-cap value stocks repeatedly traced an up-and-down pattern during the Fund’s fiscal year ended Oct. 31, 2018 before finishing the period close to unchanged. While the economic and fiscal backdrop remained strongly supportive, investors appeared to grow concerned that rising interest rates, uncertainty over trade policy, and the looming end of easy earnings comparisons would warrant a more cautious approach. The consumer cyclical and basic industry sectors were particularly affected, with at least some of the weakness likely attributable to the decreased demand and higher input costs that resulted from contentious trade negotiations with China.
Elsewhere during the fiscal period, energy stocks rallied on the back of rising oil prices (although prices slumped in October), consumer services companies benefited from the highest consumer confidence readings in 18 years, and utilities stocks gained from a late-period flight to safety (source: The Conference Board). The steep decline in stock prices that began in early October followed the release of employment data suggesting that the Federal Reserve’s policy of incremental rate hikes was likely to continue. Significantly, though, there were only vague hints that inflationary pressures were reviving despite the lowest unemployment rate in nearly 50 years and a modest acceleration in wage growth.
1
| | | | |
| Portfolio management review | | | | |
| Delaware Mid Cap Value Fund | | | | |
Though value stocks were among the major beneficiaries of the December 2017 tax-reform legislation, the group nonetheless underperformed its growth counterpart over the fiscal period, a probable reflection of continued investor preference for faster-growing companies, even some with little or no earnings. The prior outperformance of growth stocks was likely a logical reaction to the long stretch of slow economic growth in the aftermath of the global financial crisis. However, 2018 could be the first year in more than a decade during which the US economy has the potential to grow by at least 3%, suggesting to us that value stocks – with what we view as generally having more-compelling valuations – could potentially begin to attract increased interest from investors seeking to dampen volatility in a less-certain economic and geopolitical environment.
Within the Fund
For the fiscal year ended Oct. 31, 2018, Delaware Mid Cap Value Fund Institutional Class shares returned -3.37%. The Fund’s Class A shares returned -3.45% at net asset value (NAV) and -9.00% at maximum offer price. These figures reflect reinvestment of all distributions. During the same period, the Fund’s benchmark, the Russell Midcap Value Index, returned +0.16%. For complete annualized performance of Delaware Mid Cap Value Fund, please see the table on page 4.
Sector allocations had a modestly negative impact on performance results for the Fund as stock selection was the main detractor from relative performance over the fiscal year. An underweight allocation to the consumer services sector detracted from performance, although positive stock selection within the sector offset the underperformance. The Fund’s large underweight allocation to utilities detracted despite a contribution from stock selection within the sector.
Stock selection in the technology sector was the main detractor from relative returns during the
fiscal year. Electronic manufacturing services (EMS) company, Flex Ltd. detracted from relative returns. The company had been engaged in a much-publicized relationship with Nike with a goal of reducing shoe manufacturing costs by using advanced robotic automation. Late in the Fund’s fiscal year, Flex released quarterly results that contained several pieces of negative news. The company announced the cancellation of the Nike relationship after concluding that it was unlikely to be profitable, while at the same time announcing the retirement of its CEO, who had led the Nike project. These factors, combined with weak earnings results and lower expectations caused a sharp pullback in the company’s shares. The Fund continues to own the shares of Flex based on our assessment of its valuation and its record of strong free-cash flow generation.
Stock selection in the basic industry sector detracted from the Fund’s performance. Plastics packaging manufacturer Berry Global Group Inc. was a notable detractor. Higher raw material and freight costs were a headwind to the company’s operating earnings growth. The Fund continued to hold Berry Global based on our view of its valuation and the company’s ability to generate free-cash flow.
Newfield Exploration Co., an energy exploration and development company with extensive holdings in the shale-rich Anadarko Basin of west-central Oklahoma and the Texas Panhandle, detracted from relative performance. Despite what we view as an attractive valuation, the company underperformed after twice issuing revenue-and-earnings guidance that fell short of market expectations. The Fund continued to hold shares of Newfield Exploration at the end of the Fund’s fiscal year end, while on Nov. 1, Encana Corp. agreed to acquire Newfield Exploration in a stock deal valued at $5.5 billion.
The Fund benefited from a surge in merger and acquisition activity, which reached an all-time high during the first six months of 2018. Andeavor, a
2
Texas-based refiner and Fortune 100 company, contributed to relative performance after Marathon Petroleum Corp. acquired it at a substantial premium to the Fund’s cost basis. Similarly, Dr. Pepper Snapple Group Inc. outperformed as the company was acquired early in the fiscal period by the beverage brewing company Keurig Green Mountain Inc. at a healthy premium. Validus Holdings Ltd., the Bermuda-based reinsurer and provider of specialty insurance products, also contributed to relative performance. American International Group Inc. (AIG) acquired Validus Holdings in a cash deal worth $5.4 billion that closed in July 2018. As of the end of the fiscal period, the Fund did not hold shares in any of the aforementioned companies.
At fiscal year end, we have positioned the Fund to potentially benefit, particularly if less vigorous but still solid economic growth occurs. For example, we remained an underweight to the defensive sectors, including real estate investment trusts (REITs) and utilities. The Fund ended the fiscal year with relative overweights to some of the more cyclical sectors, as we believe valuations and free-cash-flow generation are more attractive in these sectors. We also believe these sectors are well positioned to continue to benefit from the reduced US corporate tax rate. The Fund’s largest
relative sector overweights at the end of the fiscal year were capital spending, financial services, energy, and consumer cyclicals.
Nonetheless, we do not believe that this year’s double-digit earnings growth rate is sustainable, given that 2019 profits will be compared to the tax-enhanced results from 2018. Regarding fears of tighter monetary policy, however, we think it is important to keep in mind that benchmark interest rates – while rising and likely to continue doing so – are still at historically low levels.
Despite a nearly decade-long bull market, we are finding no shortage of companies that trade at what we view as attractive valuations, generate strong free-cash flow, and implement shareholder-friendly policies through share buybacks, dividend increases, and debt reduction. In fact, recent months have seen record levels of dividend increases and share buybacks as companies remain cautious about expanding capital budgets this late in an economic expansion (source: Bloomberg). We believe that such caution plays well into our value-oriented investment process. As always, we appreciate your confidence and look forward to serving your investment needs in the new year.
3
| | | | |
| Performance summary | | | | |
| Delaware Mid Cap Value Fund | | | October 31, 2018 | |
The performance quoted represents past performance and does not guarantee future results. Investment return and principal value of an investment will fluctuate so that shares, when redeemed, may be worth more or less than their original cost. Current performance may be lower or higher than the performance quoted. Performance data current to the most recent month end may be obtained by calling 800 523-1918 or visiting delawarefunds.com/performance.
| | | | | | | | |
Fund and benchmark performance1,2 | | Average annual total returns through October 31, 2018 |
| | | 1 year | | 5 years | | 10 years | | Lifetime |
Class A (Est. Feb. 1, 2008) | | | | | | | | |
Excluding sales charge | | -3.45% | | +7.52% | | +11.63% | | +7.11% |
Including sales charge | | -9.00% | | +6.25% | | +10.97% | | +6.52% |
Class C (Est. July 31, 2008) | | | | | | | | |
Excluding sales charge | | -4.26% | | +6.71% | | +10.77% | | +6.98% |
Including sales charge | | -5.21% | | +6.71% | | +10.77% | | +6.98% |
Class R (Est. July 31, 2008) | | | | | | | | |
Excluding sales charge | | -3.66% | | +7.26% | | +11.37% | | +7.56% |
Including sales charge | | -3.66% | | +7.26% | | +11.37% | | +7.56% |
Institutional Class (Est. Feb. 1, 2008) | | | | | | | | |
Excluding sales charge | | -3.37%* | | +7.78% | | +11.90% | | +7.35% |
Including sales charge | | -3.37%* | | +7.78% | | +11.90% | | +7.35% |
Russell Midcap Value Index | | +0.16% | | +8.11% | | +13.35% | | +8.47%** |
*Total returns for the report period presented in the table differ from the returns in the “Financial highlights.” The total returns presented in the above table are calculated based on the net asset value (NAV) at which shareholder transactions were processed. The total returns presented in “Financial highlights” are calculated in the same manner, but also take into account certain adjustments that are necessary under US generally accepted accounting principles (US GAAP) required in the annual report.
**The benchmark lifetime return is for Institutional Class share comparison only and is calculated using the last business day in the month of the Fund’s Institutional Class inception date.
1Returns reflect the reinvestment of all distributions and are presented both with and without the applicable sales charges described below. Returns do not reflect the deduction of taxes the shareholder would pay on Fund distributions or redemptions of Fund shares.
Expense limitations were in effect for certain classes during some or all of the periods shown in the “Fund and benchmark performance” table. Expenses for each class are listed on the “Fund expense ratios” table on page 5. Performance would have been lower had expense limitations not been in effect.
Institutional Class shares are not subject to a sales charge and are offered for sale exclusively to certain eligible investors. In addition, Institutional Class shares pay no distribution and service fee.
Class A shares are sold with a maximum front-end sales charge of 5.75%, and have an annual distribution and service fee of 0.25% of average daily net assets. Performance for Class A shares, excluding sales charges, assumes that no front-end sales charge applied.
Class C shares are sold with a contingent deferred sales charge of 1.00% if redeemed during the first 12 months. They are also subject to an annual distribution and service fee of 1.00% of average
4
daily net assets. Performance for Class C shares, excluding sales charges, assumes either that contingent deferred sales charges did not apply or that the investment was not redeemed.
Class R shares are available only for certain retirement plan products. They are sold without a sales charge and have an annual distribution and service fee of 0.50% of average daily net assets.
Investments in small and/or medium-sized companies typically exhibit greater risk and higher volatility than larger, more established companies.
Narrowly focused investments may exhibit higher volatility than investments in multiple industry sectors.
REIT investments are subject to many of the risks associated with direct real estate ownership, including changes in economic conditions, credit risk, and interest rate fluctuations.
2The Fund’s expense ratios, as described in the most recent prospectus, are disclosed in the following “Fund expense ratios” table. Delaware Management Company has agreed to reimburse certain expenses and/or waive certain fees in order to prevent total annual fund operating expenses (excluding any 12b-1 fees, acquired fund fees and expenses, taxes, interest, short sale and dividend and interest expenses, brokerage fees, certain insurance costs, and nonroutine expenses or costs, including, but not limited to, those relating to reorganizations, litigation, conducting shareholder meetings, and liquidations (collectively, nonroutine expenses)) from exceeding 1.00% of the Fund’s average daily net assets during the period from Nov. 1, 2017 to Oct. 31, 2018.* Please see the most recent prospectus and any applicable supplement(s) for additional information on these fee waivers and/or reimbursements. Please see the “Financial highlights” section in this report for the most recent expense ratios.
| | | | | | | | |
| Fund expense ratios | | Class A | | Class C | | Class R | | Institutional
Class |
Total annual operating expenses | | 2.86% | | 3.61% | | 3.11% | | 2.61% |
(without fee waivers) | | | | | | | | |
Net expenses | | 1.25% | | 2.00% | | 1.50% | | 1.00% |
(including fee waivers, if any) | | | | | | | | |
Type of waiver | | Contractual | | Contractual | | Contractual | | Contractual |
*The aggregate contractual waiver period covering this report is from Feb. 28, 2017 through Feb. 28, 2019.
5
| | | | |
| Performance summary | | | | |
| Delaware Mid Cap Value Fund | | | | |
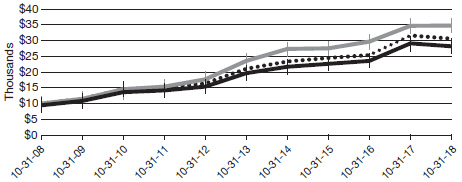
Performance of a $10,000 investment1
Average annual total returns from Oct. 31, 2008 through Oct. 31, 2018
| | | | | | | | | | |
For the period beginning Oct. 31, 2008 through Oct. 31, 2018 | | | Starting value | | | | Ending value | |

| | Russell Midcap Value Index | | | $10,000 | | | | $35,011 | |

| | Delaware Mid Cap Value Fund — Institutional Class shares | | | $10,000 | | | | $30,781 | |

| | Delaware Mid Cap Value Fund — Class A shares | | | $9,425 | | | | $28,319 | |
1The “Performance of a $10,000 investment” graph assumes $10,000 invested in Institutional Class and Class A shares of the Fund on Oct. 31, 2008, and includes the effect of a 5.75% front-end sales charge (for Class A shares) and the reinvestment of all distributions. The graph does not reflect the deduction of taxes the shareholders would pay on Fund distributions or redemptions of Fund shares. Expense limitations were in effect for some or all of the periods shown. Performance would have been lower had expense limitations not been in effect. Expenses are listed in the “Fund expense ratios” table on page 5. Please note additional details on pages 4 through 7.
The graph also assumes $10,000 invested in the Russell Midcap Value Index as of Oct. 31, 2008.
The Russell Midcap Value Index measures the performance of the mid-cap value segment of the US equity universe. It includes those Russell Midcap Index companies with lower price-to-book ratios and lower forecasted growth values.
Frank Russell Company (“Russell”) is the source and owner of the trademarks, service marks, and copyrights related to the Russell Indexes. Russell® is a trademark of the Frank Russell Company.
Index performance returns do not reflect any management fees, transaction costs, or expenses. Indices are unmanaged and one cannot invest directly in an index. Past performance is not a guarantee of future results.
Performance of other Fund classes will vary due to different charges and expenses.
6
| | | | | | |
| | | Nasdaq symbols | | CUSIPs | | |
Class A | | DLMAX | | 246093868 | | |
Class C | | DLMCX | | 246093850 | | |
Class R | | DLMRX | | 246093843 | | |
Institutional Class | | DLMIX | | 246093835 | | |
7
| | | | |
| Disclosure of Fund expenses | | | | |
| For the six-month period from May 1, 2018 to October 31, 2018 (Unaudited) | | | | |
As a shareholder of the Fund, you incur two types of costs: (1) transaction costs, including sales charges (loads) on purchase payments, reinvested dividends, or other distributions; redemption fees; and exchange fees; and (2) ongoing costs, including management fees; distribution and/or service (12b-1) fees; and other Fund expenses. This example is intended to help you understand your ongoing costs (in dollars) of investing in the Fund and to compare these costs with the ongoing costs of investing in other mutual funds.
The example is based on an investment of $1,000 invested at the beginning of the period and held for the entire six-month period from May 1, 2018 to Oct. 31, 2018.
Actual expenses
The first section of the table shown, “Actual Fund return,” provides information about actual account values and actual expenses. You may use the information in this section of the table, together with the amount you invested, to estimate the expenses that you paid over the period. Simply divide your account value by $1,000 (for example, an $8,600 account value divided by $1,000 = 8.6), then multiply the result by the number in the first section under the heading entitled “Expenses Paid During Period” to estimate the expenses you paid on your account during this period.
Hypothetical example for comparison purposes
The second section of the table shown, “Hypothetical 5% return,” provides information about hypothetical account values and hypothetical expenses based on the Fund’s actual expense ratio and an assumed rate of return of 5% per year before expenses, which is not the Fund’s actual return. The hypothetical account values and expenses may not be used to estimate the actual ending account balance or expenses you paid for the period. You may use this information to compare the ongoing costs of investing in the Fund and other funds. To do so, compare this 5% hypothetical example with the 5% hypothetical examples that appear in the shareholder reports of the other funds.
Please note that the expenses shown in the table are meant to highlight your ongoing costs only and do not reflect any transactional costs, such as sales charges (loads), redemption fees, or exchange fees. Therefore, the second section of the table is useful in comparing ongoing costs only, and will not help you determine the relative total costs of owning different funds. In addition, if these transactional costs were included, your costs would have been higher. The Fund’s expenses shown in the table reflect fee waivers in effect. The Fund’s expenses shown in the table assume reinvestment of all dividends and distributions.
8
| | | | |
| Delaware Mid Cap Value Fund | | | | |
| Expense analysis of an investment of $1,000 | | | | |
| | | | | | | | | | | | | | | | | | | | |
| | Beginning
Account Value
5/1/18 | | Ending
Account Value
10/31/18 | | Annualized
Expense Ratio | | Expenses
Paid During Period
5/1/18 to 10/31/18* |
Actual Fund return† | | | | | | | | | | | | | | | | | | | | |
Class A | | | $ | 1,000.00 | | | | $ | 942.90 | | | | | 1.25 | % | | | $ | 6.12 | |
Class C | | | | 1,000.00 | | | | | 938.70 | | | | | 2.00 | % | | | | 9.77 | |
Class R | | | | 1,000.00 | | | | | 941.30 | | | | | 1.50 | % | | | | 7.34 | |
Institutional Class | | | | 1,000.00 | | | | | 942.90 | | | | | 1.00 | % | | | | 4.90 | |
Hypothetical 5% return (5% return before expenses) | | | | | | | | | | | |
Class A | | | $ | 1,000.00 | | | | $ | 1,018.90 | | | | | 1.25 | % | | | $ | 6.36 | |
Class C | | | | 1,000.00 | | | | | 1,015.12 | | | | | 2.00 | % | | | | 10.16 | |
Class R | | | | 1,000.00 | | | | | 1,017.64 | | | | | 1.50 | % | | | | 7.63 | |
Institutional Class | | | | 1,000.00 | | | | | 1,020.16 | | | | | 1.00 | % | | | | 5.09 | |
| * | “Expenses Paid During Period” are equal to the Fund’s annualized expense ratio, multiplied by the average account value over the period, multiplied by 184/365 (to reflect the one-half year period). |
| † | Because actual returns reflect only the most recent six-month period, the returns shown may differ significantly from fiscal year returns. |
9
| | |
| Security type / sector allocation and top 10 equity holdings |
| Delaware Mid Cap Value Fund | | As of October 31, 2018 (Unaudited) |
Sector designations may be different than the sector designations presented in other fund materials. The sector designations may represent the investment manager’s internal sector classifications.
| | | | | |
| Security type / sector | | Percentage of net assets |
Common Stock | | | | 98.08 | % |
Basic Industry | | | | 6.91 | % |
Business Services | | | | 1.67 | % |
Capital Spending | | | | 10.51 | % |
Consumer Cyclical | | | | 3.80 | % |
Consumer Services | | | | 7.13 | % |
Consumer Staples | | | | 2.70 | % |
Energy | | | | 7.97 | % |
Financial Services | | | | 22.65 | % |
Healthcare | | | | 4.41 | % |
Real Estate Investment Trusts | | | | 10.03 | % |
Technology | | | | 10.41 | % |
Transportation | | | | 2.56 | % |
Utilities | | | | 7.33 | % |
Short-Term Investments | | | | 2.08 | % |
Total Value of Securities | | | | 100.16 | % |
Liabilities Net of Receivables and Other Assets | | | | (0.16 | %) |
Total Net Assets | | | | 100.00 | % |
Holdings are for informational purposes only and are subject to change at any time. They are not a recommendation to buy, sell, or hold any security.
| | | | | |
| Top 10 equity holdings | | Percentage of net assets |
Raymond James Financial | | | | 2.64 | % |
Synopsys | | | | 2.41 | % |
American Financial Group | | | | 2.38 | % |
East West Bancorp | | | | 2.36 | % |
Comerica | | | | 2.27 | % |
Marathon Oil | | | | 2.27 | % |
Reinsurance Group of America | | | | 2.19 | % |
Public Service Enterprise Group | | | | 2.12 | % |
Torchmark | | | | 2.06 | % |
ITT | | | | 1.89 | % |
10
| | | | |
| Schedule of investments | | | | |
| Delaware Mid Cap Value Fund | | | October 31, 2018 | |
| | | | | | | | |
| | Number of shares | | | Value (US $) | |
Common Stock – 98.08% | | | | | | | | |
Basic Industry – 6.91% | | | | | | | | |
Axalta Coating Systems † | | | 6,200 | | | $ | 153,016 | |
Berry Global Group † | | | 6,151 | | | | 268,307 | |
Celanese | | | 4,200 | | | | 407,148 | |
Graphic Packaging Holding | | | 21,300 | | | | 234,513 | |
Huntsman | | | 10,900 | | | | 238,492 | |
WR Grace & Co. | | | 3,450 | | | | 223,525 | |
| | | | | | | | |
| | | | | | | 1,525,001 | |
| | | | | | | | |
Business Services – 1.67% | | | | | | | | |
Brink’s | | | 3,650 | | | | 242,068 | |
ManpowerGroup | | | 1,650 | | | | 125,879 | |
| | | | | | | | |
| | | | | | | 367,947 | |
| | | | | | | | |
Capital Spending – 10.51% | | | | | | | | |
AECOM † | | | 8,550 | | | | 249,147 | |
Allison Transmission Holdings | | | 4,850 | | | | 213,788 | |
Gates Industrial † | | | 12,600 | | | | 189,630 | |
HD Supply Holdings † | | | 5,700 | | | | 214,149 | |
ITT | | | 8,250 | | | | 416,625 | |
KBR | | | 15,750 | | | | 311,535 | |
Quanta Services † | | | 7,850 | | | | 244,920 | |
Spirit AeroSystems Holdings Class A | | | 3,700 | | | | 310,837 | |
United Rentals † | | | 1,400 | | | | 168,098 | |
| | | | | | | | |
| | | | | | | 2,318,729 | |
| | | | | | | | |
Consumer Cyclical – 3.80% | | | | | | | | |
BorgWarner | | | 3,600 | | | | 141,876 | |
DR Horton | | | 5,450 | | | | 195,982 | |
Johnson Controls International | | | 3,018 | | | | 96,485 | |
Mohawk Industries † | | | 900 | | | | 112,257 | |
Stanley Black & Decker | | | 2,500 | | | | 291,300 | |
| | | | | | | | |
| | | | | | | 837,900 | |
| | | | | | | | |
Consumer Services – 7.13% | | | | | | | | |
Cable One | | | 250 | | | | 223,935 | |
CBS Class B | | | 3,650 | | | | 209,327 | |
Cinemark Holdings | | | 4,400 | | | | 182,908 | |
Darden Restaurants | | | 1,550 | | | | 165,153 | |
Dollar Tree † | | | 2,250 | | | | 189,675 | |
Hasbro | | | 1,650 | | | | 151,321 | |
Marriott International Class A | | | 1,170 | | | | 136,761 | |
PVH | | | 1,500 | | | | 181,185 | |
VF | | | 1,600 | | | | 132,608 | |
| | | | | | | | |
| | | | | | | 1,572,873 | |
| | | | | | | | |
Consumer Staples – 2.70% | | | | | | | | |
Conagra Brands | | | 6,950 | | | | 247,420 | |
11
| | | | |
| Schedule of investments | | | | |
| Delaware Mid Cap Value Fund | | | | |
| | | | | | | | |
| | | Number of shares | | | Value (US $) | |
Common Stock (continued) | | | | | | | | |
Consumer Staples (continued) | | | | | | | | |
Tyson Foods Class A | | | 2,750 | | | $ | 164,780 | |
US Foods Holding † | | | 6,300 | | | | 183,771 | |
| | | | | | | | |
| | | | | | | 595,971 | |
| | | | | | | | |
Energy – 7.97% | | | | | | | | |
Hess | | | 6,300 | | | | 361,620 | |
Marathon Oil | | | 26,350 | | | | 500,387 | |
Newfield Exploration † | | | 15,400 | | | | 311,080 | |
Patterson-UTI Energy | | | 15,050 | | | | 250,432 | |
SM Energy | | | 9,450 | | | | 230,013 | |
Whiting Petroleum † | | | 2,825 | | | | 105,373 | |
| | | | | | | | |
| | | | | | | 1,758,905 | |
| | | | | | | | |
Financial Services – 22.65% | | | | | | | | |
Affiliated Managers Group | | | 1,550 | | | | 176,173 | |
Allstate | | | 2,800 | | | | 268,016 | |
American Financial Group | | | 5,250 | | | | 525,157 | |
Assurant | | | 2,250 | | | | 218,723 | |
Bank of Hawaii | | | 1,250 | | | | 98,050 | |
Comerica | | | 6,150 | | | | 501,594 | |
East West Bancorp | | | 9,950 | | | | 521,778 | |
First Hawaiian | | | 6,000 | | | | 148,680 | |
Hancock Whitney | | | 7,450 | | | | 312,602 | |
KeyCorp | | | 19,800 | | | | 359,568 | |
Raymond James Financial | | | 7,600 | | | | 582,844 | |
Reinsurance Group of America | | | 3,400 | | | | 484,058 | |
Synchrony Financial | | | 12,000 | | | | 346,560 | |
Torchmark | | | 5,375 | | | | 455,047 | |
| | | | | | | | |
| | | | | | | 4,998,850 | |
| | | | | | | | |
Healthcare – 4.41% | | | | | | | | |
Becton Dickinson and Co. | | | 550 | | | | 126,775 | |
Cigna | | | 550 | | | | 117,595 | |
Quest Diagnostics | | | 2,250 | | | | 211,747 | |
Service Corp. International | | | 5,500 | | | | 228,085 | |
Zimmer Biomet Holdings | | | 2,550 | | | | 289,655 | |
| | | | | | | | |
| | | | | | | 973,857 | |
| | | | | | | | |
Real Estate Investment Trusts – 10.03% | | | | | | | | |
Apartment Investment & Management Class A | | | 5,950 | | | | 256,088 | |
Brandywine Realty Trust | | | 15,300 | | | | 215,118 | |
Equity Residential | | | 3,950 | | | | 256,592 | |
Highwoods Properties | | | 5,300 | | | | 225,992 | |
Host Hotels & Resorts | | | 15,700 | | | | 300,027 | |
Kimco Realty | | | 13,450 | | | | 216,411 | |
Life Storage | | | 2,950 | | | | 277,772 | |
12
| | | | | | | | |
| | | Number of shares | | | Value (US $) | |
Common Stock (continued) | | | | | | | | |
Real Estate Investment Trusts (continued) | | | | | | | | |
VEREIT | | | 38,200 | | | $ | 280,006 | |
Welltower | | | 2,800 | | | | 184,996 | |
| | | | | | | | |
| | | | | | | 2,213,002 | |
| | | | | | | | |
Technology – 10.41% | | | | | | | | |
Agilent Technologies | | | 3,500 | | | | 226,765 | |
Avnet | | | 6,950 | | | | 278,487 | |
Citrix Systems | | | 650 | | | | 66,605 | |
DXC Technology | | | 2,150 | | | | 156,585 | |
Fiserv † | | | 2,050 | | | | 162,565 | |
Flex † | | | 18,400 | | | | 144,624 | |
Keysight Technologies † | | | 3,675 | | | | 209,769 | |
Qorvo † | | | 2,500 | | | | 183,775 | |
Synopsys † | | | 5,950 | | | | 532,703 | |
Teradyne | | | 7,950 | | | | 273,877 | |
Western Digital | | | 1,400 | | | | 60,298 | |
| | | | | | | | |
| | | | | | | 2,296,053 | |
| | | | | | | | |
Transportation – 2.56% | | | | | | | | |
CSX | | | 2,000 | | | | 137,720 | |
JB Hunt Transport Services | | | 2,050 | | | | 226,751 | |
Southwest Airlines | | | 4,100 | | | | 201,310 | |
| | | | | | | | |
| | | | | | | 565,781 | |
| | | | | | | | |
Utilities – 7.33% | | | | | | | | |
CMS Energy | | | 6,750 | | | | 334,260 | |
Edison International | | | 4,150 | | | | 287,969 | |
IDACORP | | | 1,700 | | | | 158,542 | |
Public Service Enterprise Group | | | 8,750 | | | | 467,513 | |
WEC Energy Group | | | 5,400 | | | | 369,360 | |
| | | | | | | | |
| | | | | | | 1,617,644 | |
| | | | | | | | |
Total Common Stock (cost $20,241,846) | | | | | | | 21,642,513 | |
| | | | | | | | |
| | |
| | Principal amount° | | | | |
Short-Term Investments – 2.08% | | | | | | | | |
Discount Note – 0.31%≠ | | | | | | | | |
Federal Home Loan Bank 1.999% 11/1/18 | | | 69,689 | | | | 69,689 | |
| | | | | | | | |
| | | | | | | 69,689 | |
| | | | | | | | |
Repurchase Agreements – 1.77% | | | | | | | | |
Bank of America Merrill Lynch
2.12%, dated 10/31/18, to be repurchased on 11/1/18, repurchase price $53,610 (collateralized by US government obligations 0.00% 5/15/19–8/15/31; market value $54,679) | | | 53,607 | | | | 53,607 | |
13
| | | | |
| Schedule of investments | | | | |
| Delaware Mid Cap Value Fund | | | | |
| | | | | | | | |
| | | Principal amount° | | | Value (US $) | |
Short-Term Investments (continued) | | | | | | | | |
Repurchase Agreements (continued) | | | | | | | | |
Bank of Montreal
2.10%, dated 10/31/18, to be repurchased on 11/1/18, repurchase price $147,427 (collateralized by US government obligations 0.00%–3.75% 11/1/18–2/15/47; market value $150,367) | | | 147,418 | | | $ | 147,418 | |
BNP Paribas
2.17%, dated 10/31/18, to be repurchased on 11/1/18, repurchase price $189,302 (collateralized by US government obligations 0.00%–8.00% 2/28/19–8/15/46; market value $193,076) | | | 189,290 | | | | 189,290 | |
| | | | | | | | |
| | | | | | | 390,315 | |
| | | | | | | | |
Total Short-Term Investments (cost $460,004) | | | | | | | 460,004 | |
| | | | | | | | |
| | |
Total Value of Securities – 100.16%
(cost $20,701,850) | | | | | | $ | 22,102,517 | |
| | | | | | | | |
| ≠ | The rate shown is the effective yield at the time of purchase. |
| ° | Principal amount shown is stated in USD. |
| † | Non-income producing security. |
USD – US Dollar
See accompanying notes, which are an integral part of the financial statements.
14
This page intentionally left blank.
| | | | |
| Statement of assets and liabilities | | | | |
| Delaware Mid Cap Value Fund | | | October 31, 2018 | |
| | | | |
Assets: | | | | |
Investments, at value1 | | $ | 22,102,517 | |
Cash | | | 3,511 | |
Dividends and interest receivable | | | 9,428 | |
Receivable for fund shares sold | | | 694 | |
| | | | |
Total assets | | | 22,116,150 | |
| | | | |
Liabilities: | | | | |
Investment management fees payable | | | 17,656 | |
Reports and statements to shareholders expenses payable to non-affiliates | | | 13,475 | |
Accounting and administration expenses payable to non-affiliates | | | 7,447 | |
Other accrued expenses | | | 6,123 | |
Distribution fees payable to affiliates | | | 4,011 | |
Accounting and administration expenses payable to affiliates | | | 412 | |
Dividend disbursing and transfer agent fees and expenses payable to affiliates | | | 189 | |
Trustees’ fees and expenses payable to affiliates | | | 54 | |
Legal fees payable to affiliates | | | 34 | |
Reports and statements to shareholders expenses payable to affiliates | | | 17 | |
| | | | |
Total liabilities | | | 49,418 | |
| | | | |
Total Net Assets | | $ | 22,066,732 | |
| | | | |
| |
Net Assets Consist of: | | | | |
Paid-in capital | | $ | 19,944,043 | |
Total distributable earnings (loss) | | | 2,122,689 | |
| | | | |
Total Net Assets | | $ | 22,066,732 | |
| | | | |
16
| | | | |
Net Asset Value | | | | |
Class A: | | | | |
Net assets | | $ | 10,376,808 | |
Shares of beneficial interest outstanding, unlimited authorization, no par | | | 1,746,756 | |
Net asset value per share | | $ | 5.94 | |
Sales charge | | | 5.75 | % |
Offering price per share, equal to net asset value per share / (1 – sales charge) | | $ | 6.30 | |
| |
Class C: | | | | |
Net assets | | $ | 1,836,608 | |
Shares of beneficial interest outstanding, unlimited authorization, no par | | | 333,297 | |
Net asset value per share | | $ | 5.51 | |
| |
Class R: | | | | |
Net assets | | $ | 49,086 | |
Shares of beneficial interest outstanding, unlimited authorization, no par | | | 8,283 | |
Net asset value per share | | $ | 5.93 | |
| |
Institutional Class: | | | | |
Net assets | | $ | 9,804,230 | |
Shares of beneficial interest outstanding, unlimited authorization, no par | | | 1,647,400 | |
Net asset value per share | | $ | 5.95 | |
| |
| | | | |
1 Investments, at cost | | $ | 20,701,850 | |
See accompanying notes, which are an integral part of the financial statements.
17
| | | | |
| Statement of operations | | | | |
| Delaware Mid Cap Value Fund | | | Year ended October 31, 2018 | |
| | | | |
Investment Income: | | | | |
Dividends | | $ | 254,554 | |
Interest | | | 7,235 | |
| | | | |
| | | 261,789 | |
| | | | |
Expenses: | | | | |
Management fees | | | 119,232 | |
Distribution expenses – Class A | | | 23,326 | |
Distribution expenses – Class C | | | 17,573 | |
Distribution expenses – Class R | | | 331 | |
Registration fees | | | 57,205 | |
Audit and tax fees | | | 35,312 | |
Accounting and administration expenses | | | 34,563 | |
Reports and statements to shareholders expenses | | | 26,425 | |
Legal fees | | | 25,706 | |
Dividend disbursing and transfer agent fees and expenses | | | 19,133 | |
Custodian fees | | | 1,559 | |
Trustees’ fees and expenses | | | 700 | |
Other | | | 12,411 | |
| | | | |
| | | 373,476 | |
Less expenses waived | | | (173,451 | ) |
Less expenses paid indirectly | | | (108 | ) |
| | | | |
Total operating expenses | | | 199,917 | |
| | | | |
Net Investment Income | | | 61,872 | |
| | | | |
| |
Net Realized and Unrealized Gain (Loss): | | | | |
Net realized gain on investments | | | 785,208 | |
Net change in unrealized appreciation (depreciation) of investments | | | (2,290,869 | ) |
| | | | |
Net Realized and Unrealized Loss | | | (1,505,661 | ) |
| | | | |
Net Decrease in Net Assets Resulting from Operations | | $ | (1,443,789 | ) |
| | | | |
See accompanying notes, which are an integral part of the financial statements.
18
This page intentionally left blank.
| | | | |
| Statements of changes in net assets | | | | |
| Delaware Mid Cap Value Fund | | | | |
| | | | | | | | |
| | | Year ended | |
| | | 10/31/18 | | | 10/31/17 | |
Increase (Decrease) in Net Assets from Operations: | | | | | | | | |
Net investment income | | $ | 61,872 | | | $ | 42,861 | |
Net realized gain | | | 785,208 | | | | 121,630 | |
Net change in unrealized appreciation (depreciation) | | | (2,290,869 | ) | | | 2,026,775 | |
| | | | | | | | |
Net increase (decrease) in net assets resulting from operations | | | (1,443,789 | ) | | | 2,191,266 | |
| | | | | | | | |
| | |
Dividends and Distributions to Shareholders from: | | | | | | | | |
Distributable earnings* | | | | | | | | |
Class A | | | (101,564 | ) | | | (99,973 | ) |
Class C | | | (16,073 | ) | | | (15,920 | ) |
Class R | | | (799 | ) | | | (769 | ) |
Institutional Class | | | (43,609 | ) | | | (26,657 | ) |
| | | | | | | | |
| | | (162,045 | ) | | | (143,319 | ) |
| | | | | | | | |
| | |
Capital Share Transactions: | | | | | | | | |
Proceeds from shares sold: | | | | | | | | |
Class A | | | 5,266,481 | | | | 4,004,378 | |
Class C | | | 856,578 | | | | 894,263 | |
Class R | | | 70,304 | | | | 23,343 | |
Institutional Class | | | 7,993,689 | | | | 1,963,545 | |
| | |
Net asset value of shares issued upon reinvestment of dividends and distributions: | | | | | | | | |
Class A | | | 100,480 | | | | 98,770 | |
Class C | | | 16,002 | | | | 15,889 | |
Class R | | | 799 | | | | 769 | |
Institutional Class | | | 34,050 | | | | 17,652 | |
| | | | | | | | |
| | | 14,338,383 | | | | 7,018,609 | |
| | | | | | | | |
| | |
Capital Share Transactions: | | | | | | | | |
Cost of shares redeemed: | | | | | | | | |
Class A | | | (2,157,578 | ) | | | (2,316,556 | ) |
Class C | | | (537,857 | ) | | | (790,549 | ) |
Class R | | | (50,491 | ) | | | (57,877 | ) |
Institutional Class | | | (615,545 | ) | | | (571,474 | ) |
| | | | | | | | |
| | | (3,361,471 | ) | | | (3,736,456 | ) |
| | | | | | | | |
Increase in net assets derived from capital share transactions | | | 10,976,912 | | | | 3,282,153 | |
| | | | | | | | |
Net Increase in Net Assets | | | 9,371,078 | | | | 5,330,100 | |
20
| | | | | | | | |
| | | Year ended | |
| | | 10/31/18 | | | 10/31/17 | |
Net Assets: | | | | | | | | |
Beginning of year | | $ | 12,695,654 | | | $ | 7,365,554 | |
| | | | | | | | |
End of year1 | | $ | 22,066,732 | | | $ | 12,695,654 | |
| | | | | | | | |
| 1 | Net Assets – End of year includes undistributed net investment income of $23,583 in 2017. The Securities and Exchange Commission eliminated the requirement to disclose undistributed (distributions in excess of) net investment income in 2018. |
| * | For the year ended Oct. 31, 2018, the Fund has adopted amendments to Regulation S-X (see Note 12 in “Notes to financial statements”). For the year ended Oct. 31, 2017, the dividends and distributions to shareholders were as follows: |
| | | | | | | | | | | | | | | | | | | | |
| | | | | | | | | Institutional |
| | | Class A | | Class C | | Class R | | Class |
| | | | |
Dividends from net investment income | | $(34,559) | | $— | | $(178) | | $(11,627) |
Distributions from net realized gains | | (65,414) | | (15,920) | | (591) | | (15,030) |
See accompanying notes, which are an integral part of the financial statements.
21
| | | | |
| Financial highlights | | | | |
| Delaware Mid Cap Value Fund Class A | | | | |
Selected data for each share of the Fund outstanding throughout each period were as follows:
|
Net asset value, beginning of period |
|
Income (loss) from investment operations: |
Net investment income1 |
Net realized and unrealized gain (loss) |
|
Total from investment operations |
|
|
Less dividends and distributions from: |
Net investment income |
Net realized gain |
|
Total dividends and distributions |
|
|
Net asset value, end of period |
|
|
Total return2 |
|
Ratios and supplemental data: |
Net assets, end of period (000 omitted) |
Ratio of expenses to average net assets |
Ratio of expenses to average net assets prior to fees waived |
Ratio of net investment income to average net assets |
Ratio of net investment loss to average net assets prior to fees waived |
Portfolio turnover |
| 1 | The average shares outstanding method has been applied for per share information. |
| 2 | Total investment return is based on the change in net asset value of a share during the period and assumes reinvestment of dividends and distributions at net asset value and does not reflect the impact of a sales charge. Total investment return during all of the periods shown reflects waivers by the manager and/or distributor. Performance would have been lower had the waivers not been in effect. |
| 3 | As a result of proxy fees, ratio of expenses to average net assets for the year ended Oct. 31, 2015, exceeded the contractual waiver by 15 basis points. |
See accompanying notes, which are an integral part of the financial statements.
22
| | | | | | | | | | | | | | | | | | | | |
| | | Year ended | |
| | | 10/31/18 | | | 10/31/17 | | | 10/31/16 | | | 10/31/15 | | | 10/31/14 | |
| | $ | 6.23 | | | $ | 5.09 | | | $ | 5.22 | | | $ | 6.22 | | | $ | 11.79 | |
| | | | | |
| | | | | | | | | | | | | | | | | | | | |
| | | 0.03 | | | | 0.02 | | | | 0.04 | | | | 0.02 | | | | 0.02 | |
| | | (0.24 | ) | | | 1.20 | | | | 0.13 | | | | 0.21 | | | | 0.78 | |
| | | | | | | | | | | | | | | | | | | | |
| | | (0.21 | ) | | | 1.22 | | | | 0.17 | | | | 0.23 | | | | 0.80 | |
| | | | | | | | | | | | | | | | | | | | |
| | | | | |
| | | | | | | | | | | | | | | | | | | | |
| | | (0.02 | ) | | | (0.03 | ) | | | (0.01 | ) | | | (0.02 | ) | | | (0.12 | ) |
| | | (0.06 | ) | | | (0.05 | ) | | | (0.29 | ) | | | (1.21 | ) | | | (6.25 | ) |
| | | | | | | | | | | | | | | | | | | | |
| | | (0.08 | ) | | | (0.08 | ) | | | (0.30 | ) | | | (1.23 | ) | | | (6.37 | ) |
| | | | | | | | | | | | | | | | | | | | |
| | | | | |
| | $ | 5.94 | | | $ | 6.23 | | | $ | 5.09 | | | $ | 5.22 | | | $ | 6.22 | |
| | | | | | | | | | | | | | | | | | | | |
| | | | | |
| | | (3.45% | ) | | | 24.17% | | | | 3.78% | | | | 4.27% | | | | 10.75% | |
| | | | | |
| | | | | | | | | | | | | | | | | | | | |
| | $ | 10,377 | | | $ | 7,887 | | | $ | 4,795 | | | $ | 3,825 | | | $ | 3,685 | |
| | | 1.25% | | | | 1.25% | | | | 1.25% | | | | 1.40% | 3 | | | 1.25% | |
| | | 2.34% | | | | 2.86% | | | | 4.10% | | | | 4.09% | | | | 4.34% | |
| | | 0.40% | | | | 0.42% | | | | 0.71% | | | | 0.31% | | | | 0.28% | |
| | | (0.69% | ) | | | (1.19% | ) | | | (2.14% | ) | | | (2.38% | ) | | | (2.81% | ) |
| | | | 20% | | | | 24% | | | | 49% | | | | 25% | | | | 28% | |
23
| | | | |
| Financial highlights | | | | |
| Delaware Mid Cap Value Fund Class C | | | | |
Selected data for each share of the Fund outstanding throughout each period were as follows:
|
Net asset value, beginning of period |
|
Income (loss) from investment operations: |
Net investment loss1 |
Net realized and unrealized gain (loss) |
|
Total from investment operations |
|
|
Less dividends and distributions from: |
Net investment income |
Net realized gain |
|
Total dividends and distributions |
|
|
Net asset value, end of period |
|
|
Total return3 |
|
Ratios and supplemental data: |
Net assets, end of period (000 omitted) |
Ratio of expenses to average net assets |
Ratio of expenses to average net assets prior to fees waived |
Ratio of net investment loss to average net assets |
Ratio of net investment loss to average net assets prior to fees waived |
Portfolio turnover |
| 1 | The average shares outstanding method has been applied for per share information. |
| 2 | Amount is less than $0.005 per share. |
| 3 | Total investment return is based on the change in net asset value of a share during the period and assumes reinvestment of dividends and distributions at net asset value and does not reflect the impact of a sales charge. Total investment return during all of the periods shown reflects a waiver by the manager. Performance would have been lower had the waiver not been in effect. |
| 4 | As a result of proxy fees, ratio of expenses to average net assets for the year ended Oct. 31, 2015, exceeded the contractual waiver by 15 basis points. |
See accompanying notes, which are an integral part of the financial statements.
24
| | | | | | | | | | | | | | | | | | | | |
| | | Year ended | |
| | | 10/31/18 | | | 10/31/17 | | | 10/31/16 | | | 10/31/15 | | | 10/31/14 | |
| | $ | 5.81 | | | $ | 4.76 | | | $ | 4.93 | | | $ | 5.96 | | | $ | 11.52 | |
| | | | | |
| | | | | | | | | | | | | | | | | | | | |
| | | (0.02 | ) | | | (0.02 | ) | | | — | 2 | | | (0.02 | ) | | | (0.03 | ) |
| | | (0.22 | ) | | | 1.12 | | | | 0.12 | | | | 0.20 | | | | 0.75 | |
| | | | | | | | | | | | | | | | | | | | |
| | | (0.24 | ) | | | 1.10 | | | | 0.12 | | | | 0.18 | | | | 0.72 | |
| | | | | | | | | | | | | | | | | | | | |
| | | | | |
| | | | | | | | | | | | | | | | | | | | |
| | | — | | | | — | | | | — | | | | — | | | | (0.03 | ) |
| | | (0.06 | ) | | | (0.05 | ) | | | (0.29 | ) | | | (1.21 | ) | | | (6.25 | ) |
| | | | | | | | | | | | | | | | | | | | |
| | | (0.06 | ) | | | (0.05 | ) | | | (0.29 | ) | | | (1.21 | ) | | | (6.28 | ) |
| | | | | | | | | | | | | | | | | | | | |
| | | | | |
| | $ | 5.51 | | | $ | 5.81 | | | $ | 4.76 | | | $ | 4.93 | | | $ | 5.96 | |
| | | | | | | | | | | | | | | | | | | | |
| | | | | |
| | | (4.26% | ) | | | 23.30% | | | | 2.95% | | | | 3.53% | | | | 9.99% | |
| | | | | |
| | | | | | | | | | | | | | | | | | | | |
| | $ | 1,837 | | | $ | 1,619 | | | $ | 1,206 | | | $ | 1,084 | | | $ | 775 | |
| | | 2.00% | | | | 2.00% | | | | 2.00% | | | | 2.15% | 4 | | | 2.00% | |
| | | 3.09% | | | | 3.61% | | | | 4.85% | | | | 4.84% | | | | 5.09% | |
| | | (0.35% | ) | | | (0.33% | ) | | | (0.04% | ) | | | (0.44% | ) | | | (0.47% | ) |
| | | (1.44% | ) | | | (1.94% | ) | | | (2.89% | ) | | | (3.13% | ) | | | (3.56% | ) |
| | | | 20% | | | | 24% | | | | 49% | | | | 25% | | | | 28% | |
25
| | | | |
| Financial highlights | | | | |
| Delaware Mid Cap Value Fund Class R | | | | |
Selected data for each share of the Fund outstanding throughout each period were as follows:
|
Net asset value, beginning of period |
|
Income (loss) from investment operations: |
Net investment income1 |
Net realized and unrealized gain (loss) |
|
Total from investment operations |
|
|
Less dividends and distributions from: |
Net investment income |
Net realized gain |
|
Total dividends and distributions |
|
|
Net asset value, end of period |
|
|
Total return4 |
|
Ratios and supplemental data: |
Net assets, end of period (000 omitted) |
Ratio of expenses to average net assets |
Ratio of expenses to average net assets prior to fees waived |
Ratio of net investment income to average net assets |
Ratio of net investment loss to average net assets prior to fees waived |
Portfolio turnover |
| 1 | The average shares outstanding method has been applied for per share information. |
| 2 | Amount is less than $0.005 per share. |
| 3 | For the year ended Oct. 31, 2015, net investment income distributions of $7 were made by the Fund’s Class R shares, which calculated to a de minimis amount of $(0.001) per share. |
| 4 | Total investment return is based on the change in net asset value of a share during the period and assumes reinvestment of dividends and distributions at net asset value. Total investment return during all of the periods shown reflects waivers by the manager and/or the distributor. Performance would have been lower had the waivers not been in effect. |
| 5 | As a result of proxy fees, ratio of expenses to average net assets for the year ended Oct. 31, 2015, exceeded the contractual waiver by 15 basis points. |
See accompanying notes, which are an integral part of the financial statements.
26
| | | | | | | | | | | | | | | | | | | | |
| | | Year ended | |
| | | 10/31/18 | | | 10/31/17 | | | 10/31/16 | | | 10/31/15 | | | 10/31/14 | |
| | $ | 6.22 | | | $ | 5.08 | | | $ | 5.22 | | | $ | 6.21 | | | $ | 11.77 | |
| | | | | |
| | | | | | | | | | | | | | | | | | | | |
| | | 0.01 | | | | 0.01 | | | | 0.02 | | | | — | 2 | | | — | 2 |
| | | (0.23 | ) | | | 1.20 | | | | 0.13 | | | | 0.22 | | | | 0.78 | |
| | | | | | | | | | | | | | | | | | | | |
| | | (0.22 | ) | | | 1.21 | | | | 0.15 | | | | 0.22 | | | | 0.78 | |
| | | | | | | | | | | | | | | | | | | | |
| | | | | |
| | | | | | | | | | | | | | | | | | | | |
| | | (0.01 | ) | | | (0.02 | ) | | | — | | | | — | 3 | | | (0.09 | ) |
| | | (0.06 | ) | | | (0.05 | ) | | | (0.29 | ) | | | (1.21 | ) | | | (6.25 | ) |
| | | | | | | | | | | | | | | | | | | | |
| | | (0.07 | ) | | | (0.07 | ) | | | (0.29 | ) | | | (1.21 | ) | | | (6.34 | ) |
| | | | | | | | | | | | | | | | | | | | |
| | | | | |
| | $ | 5.93 | | | $ | 6.22 | | | $ | 5.08 | | | $ | 5.22 | | | $ | 6.21 | |
| | | | | | | | | | | | | | | | | | | | |
| | | | | |
| | | (3.66% | ) | | | 23.96% | | | | 3.39% | | | | 4.14% | | | | 10.41% | |
| | | | | |
| | | | | | | | | | | | | | | | | | | | |
| | $ | 49 | | | $ | 31 | | | $ | 55 | | | $ | 34 | | | $ | 42 | |
| | | 1.50% | | | | 1.50% | | | | 1.50% | | | | 1.65% | 5 | | | 1.50% | |
| | | 2.59% | | | | 3.11% | | | | 4.35% | | | | 4.34% | | | | 4.59% | |
| | | 0.15% | | | | 0.17% | | | | 0.46% | | | | 0.06% | | | | 0.03% | |
| | | (0.94% | ) | | | (1.44% | ) | | | (2.39% | ) | | | (2.63% | ) | | | (3.06% | ) |
| | | | 20% | | | | 24% | | | | 49% | | | | 25% | | | | 28% | |
27
| | | | |
| Financial highlights | | | | |
| Delaware Mid Cap Value Fund Institutional Class | | | | |
Selected data for each share of the Fund outstanding throughout each period were as follows:
|
Net asset value, beginning of period |
|
Income (loss) from investment operations: |
Net investment income1 |
Net realized and unrealized gain (loss) |
|
Total from investment operations |
|
|
Less dividends and distributions from: |
Net investment income |
Net realized gain |
|
Total dividends and distributions |
|
|
Net asset value, end of period |
|
|
Total return2 |
|
Ratios and supplemental data: |
Net assets, end of period (000 omitted) |
Ratio of expenses to average net assets |
Ratio of expenses to average net assets prior to fees waived |
Ratio of net investment income to average net assets |
Ratio of net investment loss to average net assets prior to fees waived |
Portfolio turnover |
| 1 | The average shares outstanding method has been applied for per share information. |
| 2 | Total investment return is based on the change in net asset value of a share during the period and assumes reinvestment of dividends and distributions at net asset value. Total investment return during all of the periods shown reflects a waiver by the manager. Performance would have been lower had the waiver not been in effect. |
| 3 | As a result of proxy fees, ratio of expenses to average net assets for the year ended Oct. 31, 2015, exceeded the contractual waiver by 15 basis points. |
See accompanying notes, which are an integral part of the financial statements.
28
| | | | | | | | | | | | | | | | | | | | |
| | | Year ended | |
| | | 10/31/18 | | | 10/31/17 | | | 10/31/16 | | | 10/31/15 | | | 10/31/14 | |
| | | | | | | | | | | | | | | | | | | | | |
| | | | | |
| | $ | 6.24 | | | $ | 5.10 | | | $ | 5.23 | | | $ | 6.23 | | | $ | 11.81 | |
| | | 0.04 | | | | 0.04 | | | | 0.05 | | | | 0.03 | | | | 0.04 | |
| | | (0.23 | ) | | | 1.19 | | | | 0.13 | | | | 0.21 | | | | 0.77 | |
| | | | | | | | | | | | | | | | | | | | |
| | | (0.19 | ) | | | 1.23 | | | | 0.18 | | | | 0.24 | | | | 0.81 | |
| | | | | | | | | | | | | | | | | | | | |
| | | | | |
| | | | | | | | | | | | | | | | | | | | |
| | | (0.04 | ) | | | (0.04 | ) | | | (0.02 | ) | | | (0.03 | ) | | | (0.14 | ) |
| | | (0.06 | ) | | | (0.05 | ) | | | (0.29 | ) | | | (1.21 | ) | | | (6.25 | ) |
| | | | | | | | | | | | | | | | | | | | |
| | | (0.10 | ) | | | (0.09 | ) | | | (0.31 | ) | | | (1.24 | ) | | | (6.39 | ) |
| | | | | | | | | | | | | | | | | | | | |
| | | | | |
| | $ | 5.95 | | | $ | 6.24 | | | $ | 5.10 | | | $ | 5.23 | | | $ | 6.23 | |
| | | | | | | | | | | | | | | | | | | | |
| | | | | |
| | | (3.21% | ) | | | 24.42% | | | | 4.05% | | | | 4.55% | | | | 11.00% | |
| | | | | |
| | | | | | | | | | | | | | | | | | | | |
| | $ | 9,804 | | | $ | 3,159 | | | $ | 1,310 | | | $ | 1,059 | | | $ | 916 | |
| | | 1.00% | | | | 1.00% | | | | 1.00% | | | | 1.15% | 3 | | | 1.00% | |
| | | 2.09% | | | | 2.61% | | | | 3.85% | | | | 3.84% | | | | 4.09% | |
| | | 0.65% | | | | 0.67% | | | | 0.96% | | | | 0.56% | | | | 0.53% | |
| | | (0.44% | ) | | | (0.94% | ) | | | (1.89% | ) | | | (2.13% | ) | | | (2.56% | ) |
| | | | 20% | | | | 24% | | | | 49% | | | | 25% | | | | 28% | |
29
| | | | |
| Notes to financial statements | | | | |
| Delaware Mid Cap Value Fund | | | October 31, 2018 | |
Delaware Group® Equity Funds I (Trust) is organized as a Delaware statutory trust and offers one series: Delaware Mid Cap Value Fund (Fund). The Trust is an open-end investment company. The Fund is considered diversified under the Investment Company Act of 1940, as amended (1940 Act), and offers Class A, Class C, Class R, and Institutional Class shares. Class A shares are sold with a maximum front-end sales charge of 5.75%. Class A share purchases of $1,000,000 or more will incur a contingent deferred sales charge (CDSC) instead of a front-end sales charge of 1.00%, if redeemed during the first year, and 0.50% during the second year, provided that Delaware Distributors, L.P. (DDLP) paid a financial advisor a commission on the purchase of those shares. Class C shares are sold with a CDSC of 1.00%, which will be incurred if redeemed during the first 12 months. Class R and Institutional Class shares are not subject to a sales charge and are offered for sale exclusively to certain eligible investors.
The investment objective of the Fund is to seek capital appreciation.
1. Significant Accounting Policies
The Fund is an investment company and follows accounting and reporting guidance under Financial Accounting Standards Board (FASB) Accounting Standards Codification Topic 946, Financial Services – Investment Companies. The following accounting policies are in accordance with US generally accepted accounting principles (US GAAP) and are consistently followed by the Funds.
Security Valuation – Equity securities, except those traded on the Nasdaq Stock Market LLC (Nasdaq), are valued at the last quoted sales price as of the time of the regular close of the New York Stock Exchange on the valuation date. Equity securities traded on the Nasdaq are valued in accordance with the Nasdaq Official Closing Price, which may not be the last sales price. If, on a particular day, an equity security does not trade, the mean between the bid and ask prices will be used, which approximates fair value. Equity securities listed on a foreign exchange are normally valued at the last quoted sales price on the valuation date. US government and agency securities are valued at the mean between the bid and ask prices, which approximates fair value. Generally, other securities and assets for which market quotations are not readily available are valued at fair value as determined in good faith under the direction of the Trust’s Board of Trustees (Board). In determining whether market quotations are readily available or fair valuation will be used, various factors will be taken into consideration, such as market closures or suspension of trading in a security. Restricted securities are valued at fair value using methods approved by the Board.
Federal and Foreign Income Taxes – No provision for federal income taxes has been made as the Fund intends to continue to qualify for federal income tax purposes as a regulated investment company under Subchapter M of the Internal Revenue Code of 1986, as amended, and make the requisite distributions to shareholders. The Fund evaluates tax positions taken or expected to be taken in the course of preparing the Fund’s tax returns to determine whether the tax positions are “more-likely-than-not” of being sustained by the applicable tax authority. Tax positions not deemed to meet the “more-likely-than-not” threshold are recorded as a tax benefit or expense in the current year. Management has analyzed the Fund’s tax positions taken or expected to be taken on the Fund’s federal income tax returns through the year ended Oct. 31, 2018 and for all open tax years (years ended Oct. 31, 2015–Oct. 31, 2017), and has concluded that no provision for federal income tax is required in the Fund’s financial statements. If applicable, the Fund recognizes interest accrued on unrecognized tax benefits in interest expense and penalties in other expenses on the “Statement of operations.” During the
30
year ended Oct. 31, 2018, the Fund did not incur any interest or tax penalties. In regard to foreign taxes only, the Fund has open tax years in certain foreign countries in which it invests that may date back to the inception of the Fund.
Class Accounting – Investment income, common expenses, and realized and unrealized gain (loss) on investments are allocated to the various classes of the Fund on the basis of daily net assets of each class. Distribution expenses relating to a specific class are charged directly to that class.
Repurchase Agreements – The Fund may purchase certain US government securities subject to the counterparty’s agreement to repurchase them at an agreed upon date and price. The counterparty will be required on a daily basis to maintain the value of the collateral subject to the agreement at not less than the repurchase price (including accrued interest). The agreements are conditioned upon the collateral being deposited under the Federal Reserve book-entry system with the Fund’s custodian or a third-party sub-custodian. In the event of default or bankruptcy by the other party to the agreement, retention of the collateral may be subject to legal proceedings. All open repurchase agreements as of the date of this report were entered into on Oct. 31, 2018, and matured on the next business day.
Use of Estimates – The preparation of financial statements in conformity with US GAAP requires management to make estimates and assumptions that affect the fair value of investments, the reported amounts of assets and liabilities and disclosure of contingent assets and liabilities at the date of the financial statements, and the reported amounts of revenues and expenses during the reporting period. Actual results could differ from those estimates and the differences could be material.
Other – Expenses directly attributable to the Fund are charged directly to the Fund. Other expenses common to various funds within the Delaware Funds® by Macquarie (Delaware Funds) are generally allocated among such funds on the basis of average net assets. Management fees and certain other expenses are paid monthly. Security transactions are recorded on the date the securities are purchased or sold (trade date) for financial reporting purposes. Costs used in calculating realized gains and losses on the sale of investment securities are those of the specific securities sold. Dividend income is recorded on the ex-dividend date and interest income is recorded on the accrual basis. Discounts and premiums on debt securities are accreted or amortized to interest income, respectively, over the lives of the respective securities using the effective interest method. Realized gain (loss) on paydowns of asset- and mortgage-backed securities are classified as interest income. Distributions received from investments in real estate investment trusts (REITs) are recorded as dividend income on the ex-dividend date, subject to reclassification upon notice of the character of such distributions by the issuer. Foreign dividends are also recorded on the ex-dividend date or as soon after the ex-dividend date that the Fund is aware of such dividends, net of all tax withholdings, a portion of which may be reclaimable. Withholding taxes and reclaims on foreign dividends have been recorded in accordance with the Fund’s understanding of the applicable country’s tax rules and rates. The Fund will accrue such taxes as applicable based upon current interpretations of the tax rules and regulations that exist in the markets in which it invests. The Fund declares and pays dividends from net investment income and distributions from net realized gain on investments, if any, annually. The Fund may distribute more frequently, if necessary for tax purposes. Dividends and distributions, if any, are recorded on the ex-dividend date.
The Fund receives earnings credits from its custodian when positive cash balances are maintained, which may be used to offset custody fees. The expense paid under this arrangement is included on the
31
| | | | |
| Notes to financial statements | | | | |
| Delaware Mid Cap Value Fund | | | | |
1. Significant Accounting Policies (continued)
“Statement of operations” under “Custodian fees” with the corresponding expense offset included under “Less expenses paid indirectly.” For the year ended Oct. 31, 2018, the Fund earned $36 under this arrangement.
The Fund receives earnings credits from its transfer agent when positive cash balances are maintained, which may be used to offset transfer agent fees. If the amount earned is greater than $1, the expense paid under this arrangement is included on the “Statement of operations” under “Dividend disbursing and transfer agent fees and expenses” with the corresponding expense offset included under “Less expenses paid indirectly.” For the year ended Oct. 31, 2018, the Fund earned $72 under this arrangement.
2. Investment Management, Administration Agreements, and Other Transactions with Affiliates
In accordance with the terms of its investment management agreement, the Fund pays Delaware Management Company (DMC), a series of Macquarie Investment Management Business Trust and the investment manager, an annual fee which is calculated daily and paid monthly at the rate of 0.75% on the first $500 million of the average daily net assets of the Fund, 0.70% on the next $500 million, 0.65% on the next $1.5 billion, and 0.60% on the average daily net assets in excess of $2.5 billion.
DMC has contractually agreed to waive that portion, if any, of its management fee and/or pay/reimburse the Fund to the extent necessary to ensure that total annual operating expenses (excluding any distribution and service (12b-1) fees, acquired fund fees and expenses, taxes, interest, short sale and dividend interest expenses, brokerage fees, certain insurance costs, and nonroutine expenses or costs, including, but not limited to, those relating to reorganizations, litigation, conducting shareholder meetings, and liquidations) do not exceed 1.00% of the Fund’s average daily net assets from Nov. 1, 2017 through Oct. 31, 2018.* These waivers and reimbursements may be terminated only by agreement of DMC and the Fund. The waivers and reimbursements are accrued daily and received monthly.
Delaware Investments Fund Services Company (DIFSC), an affiliate of DMC, provides fund accounting and financial administration oversight services to the Fund. For these services, DIFSC’s fees are calculated daily and paid monthly based on the aggregate daily net assets of all funds within the Delaware Funds at the following annual rate: 0.00475% of the first $35 billion; 0.0040% of the next $10 billion; and 0.0025% of aggregate average daily net assets in excess of $45 billion (Total Fee). Each fund in the Delaware Funds pays a minimum of $4,000, which, in aggregate, is subtracted from the Total Fee. Each fund in the Delaware Funds then pays its portion of the remainder of the Total Fee on a relative NAV basis. This amount is included on the “Statement of operations” under “Accounting and administration expenses.” For the year ended Oct. 31, 2018, the Fund was charged $4,599 for these services.
DIFSC is also the transfer agent and dividend disbursing agent of the Fund. For these services, DIFSC’s fees were calculated daily and paid monthly based on the aggregate daily net assets of the retail funds within the Delaware Funds from Nov. 1, 2017 through June 30, 2018 at the following annual rate: 0.025% of the first $20 billion; 0.020% of the next $5 billion; 0.015% of the next $5 billion; and 0.013% of average daily net assets in excess of $30 billion. Effective July 1, 2018, the Fund as well as the other
32
Delaware Funds entered into an amendment to the DIFSC agreement. Under the amendment to the DIFSC agreement, DIFSC’s fees are calculated daily and paid monthly based on the aggregate daily net assets of the retail funds within the Delaware Funds at the following annual rate: 0.014% of the first $20 billion; 0.011% of the next $5 billion; 0.007% of the next $5 billion; 0.005% of the next $20 billion; and 0.0025% of average daily net assets in excess of $50 billion. The fees payable to DIFSC under the service agreement described above are allocated among all retail funds in the Delaware Funds on a relative NAV basis. This amount is included on the “Statement of operations” under “Dividend disbursing and transfer agent fees and expenses.” For the year ended Oct. 31, 2018, the Fund was charged $2,426 for these services. Pursuant to a sub-transfer agency agreement between DIFSC and BNY Mellon Investment Servicing (US) Inc. (BNYMIS), BNYMIS provides certain sub-transfer agency services to the Fund. Sub-transfer agency fees are paid by the Fund and are also included on the “Statement of operations” under “Dividend disbursing and transfer agent fees and expenses.”
Pursuant to a distribution agreement and distribution plan, the Fund pays DDLP, the distributor and an affiliate of DMC, an annual 12b-1 fee of 0.25% of the average daily net assets of the Class A shares, 1.00% of the average daily net assets of the Class C shares, and 0.50% of the average daily net assets of the Class R shares. The fees are calculated daily and paid monthly. Institutional Class shares pay no 12b-1 fees.
As provided in the investment management agreement, the Fund bears a portion of the cost of certain resources shared with DMC, including the cost of internal personnel of DMC and/or its affiliates that provide legal, tax, and regulatory reporting services to the Fund. For the year ended Oct. 31, 2018, the Fund was charged $432 for internal legal, tax, and regulatory reporting services provided by DMC and/or its affiliates’ employees. This amount is included on the “Statement of operations” under “Legal fees.”
For the year ended Oct. 31, 2018, DDLP earned $6,013 for commissions on sales of the Fund’s Class A shares. For the year ended Oct. 31, 2018, DDLP received gross CDSC commissions of $9 and $806 on redemptions of the Fund’s Class A and Class C shares, respectively, and these commissions were entirely used to offset upfront commissions previously paid by DDLP to broker/dealers on sales of those shares.
Trustees’ fees include expenses accrued by the Fund for each Trustee’s retainer and meeting fees. Certain officers of DMC, DIFSC, and DDLP are officers and/or Trustees of the Trust. These officers and Trustees are paid no compensation by the Fund.
*The aggregate contractual waiver period covering this report is from Feb. 28, 2017 through Feb. 28, 2019.
33
| | | | |
| Notes to financial statements | | | | |
| Delaware Mid Cap Value Fund | | | | |
3. Investments
For the year ended Oct. 31, 2018, the Fund made purchases and sales of investment securities other than short-term investments as follows:
| | | | |
Purchases | | $ | 13,568,252 | |
Sales | | | 3,085,920 | |
The tax cost of investments includes adjustments to net unrealized appreciation (depreciation) which may not necessarily be final tax cost basis adjustments, but approximate the tax basis unrealized gains and losses that may be realized and distributed to shareholders. At Oct. 31, 2018, the cost and unrealized appreciation (depreciation) of investments for federal income tax purposes for the Fund were as follows:
| | | | |
Cost of investments | | $ | 20,784,783 | |
| | | | |
Aggregate unrealized appreciation of investments | | $ | 2,520,373 | |
Aggregate unrealized depreciation of investments | | | (1,202,639 | ) |
| | | | |
Net unrealized appreciation of investments | | $ | 1,317,734 | |
| | | | |
US GAAP defines fair value as the price that the Fund would receive to sell an asset or pay to transfer a liability in an orderly transaction between market participants at the measurement date under current market conditions. A three-level hierarchy for fair value measurements has been established based upon the transparency of inputs to the valuation of an asset or liability. Inputs may be observable or unobservable and refer broadly to the assumptions that market participants would use in pricing the asset or liability. Observable inputs reflect the assumptions market participants would use in pricing the asset or liability based on market data obtained from sources independent of the reporting entity. Unobservable inputs reflect the reporting entity’s own assumptions about the assumptions that market participants would use in pricing the asset or liability based on the best information available under the circumstances. The Fund’s investment in its entirety is assigned a level based upon the observability of the inputs which are significant to the overall valuation. The three-level hierarchy of inputs is summarized below.
| | |
Level 1 – | | Inputs are quoted prices in active markets for identical investments. (Examples: equity securities, open-end investment companies, futures contracts, exchange-traded options contracts) |
| |
Level 2 – | | Other observable inputs, including, but not limited to: quoted prices for similar assets or liabilities in markets that are active, quoted prices for identical or similar assets or liabilities in markets that are not active, inputs other than quoted prices that are observable for the assets or liabilities (such as interest rates, yield curves, volatilities, prepayment speeds, loss severities, credit risks, and default rates) or other market-corroborated inputs. (Examples: debt securities, government securities, swap contracts, foreign currency exchange contracts, foreign securities utilizing international fair value pricing, broker-quoted securities, fair valued securities) |
| |
Level 3 – | | Significant unobservable inputs, including the Fund’s own assumptions used to determine the fair value of investments. (Examples: broker-quoted securities, fair valued securities) |
34
Level 3 investments are valued using significant unobservable inputs. The Fund may also use an income-based valuation approach in which the anticipated future cash flows of the investment are discounted to calculate fair value. Discounts may also be applied due to the nature or duration of any restrictions on the disposition of the investments. Valuations may also be based upon current market prices of securities that are comparable in coupon, rating, maturity, and industry. The derived value of a Level 3 investment may not represent the value which is received upon disposition and this could impact the results of operations.
The following table summarizes the valuation of the Fund’s investments by fair value hierarchy levels as of Oct. 31, 2018:
| | | | | | | | | | | | |
| | | Level 1 | | | Level 2 | | | Total | |
Securities | | | | | | | | | | | | |
| | | |
Assets: | | | | | | | | | | | | |
| | | |
Common Stock | | $ | 21,642,513 | | | $ | — | | | $ | 21,642,513 | |
Short-Term Investments | | | — | | | | 460,004 | | | | 460,004 | |
| | | | | | | | | | | | |
Total Value of Securities | | $ | 21,642,513 | | | $ | 460,004 | | | $ | 22,102,517 | |
| | | | | | | | | | | | |
During the year ended Oct. 31, 2018, there were no transfers between Level 1 investments, Level 2 investments, or Level 3 investments that had a significant impact to the Fund. The Fund’s policy is to recognize transfers between levels based on fair value at the beginning of the reporting period.
A reconciliation of Level 3 investments is presented when the Fund has a significant amount of Level 3 investments at the beginning, interim, or end of the period in relation to net assets. During the year ended Oct. 31, 2018, there were no Level 3 investments.
4. Dividend and Distribution Information
Income and long-term capital gain distributions are determined in accordance with federal income tax regulations, which may differ from US GAAP. Additionally, distributions from net short-term gains on sales of investment securities are treated as ordinary income for federal income tax purposes. The tax character of dividends and distributions paid during the years ended Oct. 31, 2018 and 2017 was as follows:
| | | | | | | | | | | | |
| | | Year ended | |
| | | 10/31/18 | | | | | | 10/31/17 | |
Ordinary income | | $ | 47,929 | | | | | | | $ | 46,364 | |
Long-term capital gains | | | 114,116 | | | | | | | | 96,955 | |
| | | | | | | | | | | | |
Total | | $ | 162,045 | | | | | | | $ | 143,319 | |
| | | | | | | | | | | | |
35
| | | | |
| Notes to financial statements | | | | |
| Delaware Mid Cap Value Fund | | | | |
5. Components of Net Assets on a Tax Basis
As of Oct. 31, 2018, the components of net assets on a tax basis were as follows:
| | | | |
Shares of beneficial interest | | $ | 19,944,043 | |
Undistributed ordinary income | | | 105,684 | |
Undistributed long-term capital gain | | | 699,271 | |
Unrealized appreciation of investments | | | 1,317,734 | |
| | | | |
Net assets | | $ | 22,066,732 | |
| | | | |
The differences between book basis and tax basis components of net assets are primarily attributable to tax deferral of losses on wash sales.
6. Capital Shares
Transactions in capital shares were as follows:
| | | | | | | | | | | | |
| | | Year ended | |
| | | 10/31/18 | | | | | | 10/31/17 | |
Shares sold: | | | | | | | | | | | | |
Class A | | | 808,349 | | | | | | | | 708,972 | |
Class C | | | 141,826 | | | | | | | | 169,465 | |
Class R | | | 10,945 | | | | | | | | 4,068 | |
Institutional Class | | | 1,232,522 | | | | | | | | 342,878 | |
| | | |
Shares issued upon reinvestment of dividends and distributions: | | | | | | | | | | | | |
Class A | | | 15,749 | | | | | | | | 17,701 | |
Class C | | | 2,685 | | | | | | | | 3,038 | |
Class R | | | 125 | | | | | | | | 138 | |
Institutional Class | | | 5,337 | | | | | | | | 3,169 | |
| | | | | | | | | | | | |
| | | 2,217,538 | | | | | | | | 1,249,429 | |
| | | | | | | | | | | | |
Shares redeemed: | | | | | | | | | | | | |
Class A | | | (342,553 | ) | | | | | | | (402,771 | ) |
Class C | | | (89,915 | ) | | | | | | | (147,007 | ) |
Class R | | | (7,766 | ) | | | | | | | (10,007 | ) |
Institutional Class | | | (96,230 | ) | | | | | | | (97,093 | ) |
| | | | | | | | | | | | |
| | | (536,464 | ) | | | | | | | (656,878 | ) |
| | | | | | | | | | | | |
Net increase | | | 1,681,074 | | | | | | | | 592,551 | |
| | | | | | | | | | | | |
36
Certain shareholders may exchange shares of one class for shares of another class in the same Fund. These exchange transactions are included as subscriptions and redemptions in the table on the previous page and the “Statements of changes in net assets.” For the year ended Oct. 31, 2018, the Fund had the following exchange transactions:
| | | | | | | | | | | | | | | | | | | | | | | | | | | | | | | | | | | | |
| | | Exchange Redemptions | | | | | | Exchange Subscriptions | | | | | | | |
| | | | | | | | | |
| | | | | | | | | | | | | | | | | | | | | Institutional | | | | | | | |
| | | Class A | | | | | | Class C | | | | | | Class A | | | | | | Class | | | | | | | |
| | | Shares | | | | | | Shares | | | | | | Shares | | | | | | Shares | | | | | | Value | |
Year ended 10/31/18 | | | — | | | | | | | | 18,283 | | | | | | | | 17,013 | | | | | | | | — | | | | | | | $ | 110,245 | |
Year ended 10/31/17 | | | 79,131 | | | | | | | | 9,981 | | | | | | | | — | | | | | | | | 88,471 | | | | | | | | 510,418 | |
7. Line of Credit
The Fund, along with certain other funds in the Delaware Funds (Participants), was a participant in a $155,000,000 revolving line of credit intended to be used for temporary or emergency purposes as an additional source of liquidity to fund redemptions of investor shares. Under the agreement, the Participants were charged an annual commitment fee of 0.15%, which was allocated across the Participants based on a weighted average of the respective net assets of each Participant. The Participants were permitted to borrow up to a maximum of one-third of their net assets under the agreement. Each Participant was individually, and not jointly, liable for its particular advances, if any, under the line of credit. The line of credit available under the agreement expired on Nov. 6, 2017.
On Nov. 6, 2017, the Fund, along with the other Participants, entered into an amendment to the agreement for a $155,000,000 revolving line of credit. The revolving line of credit available was reduced from $155,000,000 to $130,000,0000 on Sept. 6, 2018. The revolving line of credit was to be used as described above and operated in substantially the same manner as the original agreement. The line of credit available under the agreement expired on Nov. 5, 2018.
The Fund had no amounts outstanding as of Oct. 31, 2018, or at any time during the year then ended.
8. Offsetting
Master Repurchase Agreements
Repurchase agreements are entered into by the Fund under Master Repurchase Agreements (each, an MRA). Each MRA permits the Fund, under certain circumstances including an event of default (such as bankruptcy or insolvency), to offset payables and/or receivables with collateral held by and/or posted to the counterparty. As a result, one single net payment is created. Bankruptcy or insolvency laws of a particular jurisdiction may impose restrictions on or prohibitions against such a right of offset in the event of the MRA counterparty’s bankruptcy or insolvency. Based on the terms of each MRA, the Fund receives securities as collateral with a market value in excess of the repurchase price at maturity. Upon a bankruptcy or insolvency of the MRA counterparty, the Fund would recognize a liability with respect to such excess collateral. The liability reflects the Fund’s obligation under bankruptcy law to return the
37
| | | | |
| Notes to financial statements | | | | |
| Delaware Mid Cap Value Fund | | | | |
8. Offsetting (continued)
excess to the counterparty. As of Oct. 31, 2018, the following table is a summary of the Fund’s repurchase agreements by counterparty which are subject to offset under an MRA:
| | | | | | | | | | | | | | | | | | | | | | | | | |
Counterparty | | Repurchase
Agreements | | Fair Value of
Non-Cash
Collateral Received(a) | | Cash Collateral
Received | | Net Collateral
Received | | Net Exposure(b) |
Bank of America Merrill Lynch | | | $ | 53,607 | | | | $ | (53,607 | ) | | | $ | — | | | | $ | (53,607 | ) | | | $ | — | |
Bank of Montreal | | | | 147,418 | | | | | (147,418 | ) | | | | — | | | | | (147,418 | ) | | | | — | |
BNP Paribas | | | | 189,290 | | | | | (189,290 | ) | | | | — | | | | | (189,290 | ) | | | | — | |
| | | | | | | | | | | | | | | | | | | | | | | | | |
Total | | | $ | 390,315 | | | | $ | (390,315 | ) | | | $ | — | | | | $ | (390,315 | ) | | | $ | — | |
| | | | | | | | | | | | | | | | | | | | | | | | | |
(a)The value of the related collateral received exceeded the value of the repurchase agreements as of Oct. 31, 2018.
(b)Net exposure represents the receivable (payable) that would be due from (to) the counterparty in the event of default.
9. Securities Lending
The Fund, along with other funds in the Delaware Funds, may lend its securities pursuant to a security lending agreement (Lending Agreement) with The Bank of New York Mellon (BNY Mellon). At the time a security is loaned, the borrower must post collateral equal to the required percentage of the market value of the loaned security, including any accrued interest. The required percentage is: (1) 102% with respect to US securities and foreign securities that are denominated and payable in US dollars; and (2) 105% with respect to foreign securities. With respect to each loan, if on any business day the aggregate market value of securities collateral plus cash collateral held is less than the aggregate market value of the securities which are the subject of such loan, the borrower will be notified to provide additional collateral by the end of the following business day, which, together with the collateral already held, will be not less than the applicable initial collateral requirements for such security loan. If the aggregate market value of securities collateral and cash collateral held with respect to a security loan exceeds the applicable initial collateral requirement, upon the request of the borrower, BNY Mellon must return enough collateral to the borrower by the end of the following business day to reduce the value of the remaining collateral to the applicable initial collateral requirement for such security loan. As a result of the foregoing, the value of the collateral held with respect to a loaned security on any particular day may be more or less than the value of the security on loan. The collateral percentage with respect to the market value of the loaned security is determined by the security lending agent.
Cash collateral received by each fund of the Trust is generally invested in a series of individual separate accounts, each corresponding to a fund. The investment guidelines permit each separate account to hold certain securities that would be considered eligible securities for a money market fund. Cash collateral received is generally invested in government securities; certain obligations issued by government sponsored enterprises; repurchase agreements collateralized by US Treasury securities; obligations issued by the central government of any Organization for Economic Cooperation and Development (OECD) country or its agencies, instrumentalities, or establishments; obligations of supranational organizations; commercial paper, notes, bonds, and other debt obligations; certificates of deposit, time deposits, and other bank obligations; and asset-backed securities. A fund can also accept US government securities and letters of credit (non-cash collateral) in connection with securities loans.
38
In the event of default or bankruptcy by the lending agent, realization and/or retention of the collateral may be subject to legal proceedings. In the event the borrower fails to return loaned securities and the collateral received is insufficient to cover the value of the loaned securities and provided such collateral shortfall is not the result of investment losses, the lending agent has agreed to pay the amount of the shortfall to the Fund or, at the discretion of the lending agent, replace the loaned securities. The Fund continues to record dividends or interest, as applicable, on the securities loaned and is subject to changes in value of the securities loaned that may occur during the term of the loan. The Fund has the right under the Lending Agreement to recover the securities from the borrower on demand. With respect to security loans collateralized by non-cash collateral, the Fund receives loan premiums paid by the borrower. With respect to security loans collateralized by cash collateral, the earnings from the collateral investments are shared among the Fund, the security lending agent, and the borrower. The Fund records security lending income net of allocations to the security lending agent and the borrower.
The Fund may incur investment losses as a result of investing securities lending collateral. This could occur if an investment in the collateral investment account defaulted or became impaired. Under those circumstances, the value of a Fund’s cash collateral account may be less than the amount the Fund would be required to return to the borrowers of the securities and the Fund would be required to make up for this shortfall.
During the year ended Oct. 31, 2018, the Fund had no securities out on loan.
10. Credit and Market Risk
The Fund invests a significant portion of its assets in small- and mid-sized companies and may be subject to certain risks associated with ownership of securities of such companies. Investments in small- or mid-sized companies may be more volatile than investments in larger companies for a number of reasons, which include more limited financial resources or a dependence on narrow product lines.
The Fund invests in REITs and is subject to the risks associated with that industry. If the Fund holds real estate directly as a result of defaults or receives rental income directly from real estate holdings, its tax status as a regulated investment company may be jeopardized. There were no direct real estate holdings during the year ended Oct. 31, 2018. The Fund’s REIT holdings are also affected by interest rate changes, particularly if the REITs it holds use floating rate debt to finance their ongoing operations.
The Fund may invest up to 10% of its net assets in illiquid securities, which may include securities with contractual restrictions on resale, securities exempt from registration under Rule 144A promulgated under the Securities Act of 1933, as amended, and other securities which may not be readily marketable. The relative illiquidity of these securities may impair the Fund from disposing of them in a timely manner and at a fair price when it is necessary or desirable to do so. While maintaining oversight, the Fund’s Board has delegated to DMC, the day-to-day functions of determining whether individual securities are liquid for purposes of the Fund’s limitation on investments in illiquid securities. Securities eligible for resale pursuant to Rule 144A, which are determined to be liquid, are not subject to the Fund’s 10% limit on investments in illiquid securities. As of Oct. 31, 2018, there were no Rule 144A securities held by the Fund. Restricted securities are valued pursuant to the security valuation procedures described in Note 1.
39
| | | | |
| Notes to financial statements | | | | |
| Delaware Mid Cap Value Fund | | | | |
11. Contractual Obligations
The Fund enters into contracts in the normal course of business that contain a variety of indemnifications. The Fund’s maximum exposure under these arrangements is unknown. However, the Fund has not had prior claims or losses pursuant to these contracts. Management has reviewed the Fund’s existing contracts and expects the risk of loss to be remote.
12. Recent Accounting Pronouncements
In August 2018, the FASB issued an Accounting Standards Update, ASU 2018-13, which changes certain fair value measurement disclosure requirements. The ASU 2018-13, in addition to other modifications and additions, removes the requirement to disclose the amount and reasons for transfers between Level 1 and Level 2 of the fair value hierarchy, the policy for the timing of transfers between levels and the valuation process for Level 3 fair value measurements. The ASU 2018-13 is effective for fiscal years, and interim periods within those fiscal years, beginning after Dec. 15, 2019. At this time, management is evaluating the implications of these changes on the financial statements.
In August 2018, the Securities and Exchange Commission (SEC) adopted amendments to Regulation S-X to update and simplify the disclosure requirements for registered investment companies by eliminating requirements that are redundant or duplicative of US GAAP requirements or other SEC disclosure requirements. The new amendments require the presentation of the total, rather than the components, of distributable earnings on the “Statement of assets and liabilities” and the total, rather than the components, of dividends from net investment income and distributions from net realized gains on the “Statements of changes in net assets.” The amendments also removed the requirement for the parenthetical disclosure of undistributed net investment income on the “Statements of changes in net assets” and certain tax adjustments that were reflected in the “Notes to financial statements.” All of these have been reflected in the Fund’s financial statements.
13. Subsequent Events
On Nov. 5, 2018, the Fund, along with the other Participants, entered into an amendment to the agreement for a $190,000,000 revolving line of credit to be used as described in Note 7 and to be operated in substantially the same manner as the agreement described in Note 7. The revolving line of credit available was increased from $190,000,000 to $220,000,000 on Nov. 29, 2018. Under the amendment to the agreement, the Participants are charged an annual commitment fee of 0.15%, which is allocated across the Participants based on a weighted average of the respective net assets of each Participant. The line of credit available under the agreement expires on Nov. 4, 2019.
Management has determined that no other material events or transactions occurred subsequent to Oct. 31, 2018, that would require recognition or disclosure in the Fund’s financial statements.
40
| | | | |
Report of independent registered public accounting firm | | | | |
To the Board of Trustees of Delaware Group® Equity Funds I
and Shareholders of Delaware Mid Cap Value Fund
Opinion on the Financial Statements
We have audited the accompanying statement of assets and liabilities, including the schedule of investments, of Delaware Mid Cap Value Fund (constituting Delaware Group® Equity Funds I, referred to hereafter as the “Fund”) as of October 31, 2018, the related statement of operations for the year ended October 31, 2018, the statements of changes in net assets for each of the two years in the period ended October 31, 2018, including the related notes, and the financial highlights for each of the five years in the period ended October 31, 2018 (collectively referred to as the “financial statements”). In our opinion, the financial statements present fairly, in all material respects, the financial position of the Fund as of October 31, 2018, the results of its operations for the year then ended, the changes in its net assets for each of the two years in the period ended October 31, 2018 and the financial highlights for each of the five years in the period ended October 31, 2018 in conformity with accounting principles generally accepted in the United States of America.
Basis for Opinion
These financial statements are the responsibility of the Fund’s management. Our responsibility is to express an opinion on the Fund’s financial statements based on our audits. We are a public accounting firm registered with the Public Company Accounting Oversight Board (United States) (“PCAOB”) and are required to be independent with respect to the Fund in accordance with the U.S. federal securities laws and the applicable rules and regulations of the Securities and Exchange Commission and the PCAOB.
We conducted our audits of these financial statements in accordance with the standards of the PCAOB. Those standards require that we plan and perform the audit to obtain reasonable assurance about whether the financial statements are free of material misstatement, whether due to error or fraud.
Our audits included performing procedures to assess the risks of material misstatement of the financial statements, whether due to error or fraud, and performing procedures that respond to those risks. Such procedures included examining, on a test basis, evidence regarding the amounts and disclosures in the financial statements. Our audits also included evaluating the accounting principles used and significant estimates made by management, as well as evaluating the overall presentation of the financial statements. Our procedures included confirmation of securities owned as of October 31, 2018 by correspondence with the custodian and brokers. We believe that our audits provide a reasonable basis for our opinion.
/s/PricewaterhouseCoopers LLP
Philadelphia, Pennsylvania
December 20, 2018
We have served as the auditor of one or more investment companies in Delaware Funds® by Macquarie since 2010.
41
| | | | |
| Other Fund information (Unaudited) | | | | |
| Delaware Mid Cap Value Fund | | | | |
Tax Information
The information set forth below is for the Fund’s fiscal year as required by federal income tax laws. Shareholders, however, must report distributions on a calendar year basis for income tax purposes, which may include distributions for portions of two fiscal years of the Fund. Accordingly, the information needed by shareholders for income tax purposes will be sent to them in January of each year. Please consult your tax advisor for proper treatment of this information.
All disclosures are based on financial information available as of the date of this annual report and, accordingly are subject to change. For any and all items requiring reporting, it is the intention of the Fund to report the maximum amount permitted under the Internal Revenue Code and the regulations thereunder.
For the fiscal year ended Oct. 31, 2018, the Fund reports distributions paid during the year as follows:
| | | | |
(A) Ordinary Income Distributions (Tax Basis)* | | | 29.58 | % |
(B) Long-Term Capital Gain Distributions (Tax Basis) | | | 70.42 | % |
Total Distributions (Tax Basis) | | | 100.00 | % |
(C) Qualifying Dividends1 | | | 100.00 | % |
(A) and (B) are based on a percentage of the Fund’s total distributions.
(C) is based on a percentage of the Fund’s ordinary income distributions.
1Qualifying dividends represent dividends which qualify for the corporate dividends received deduction.
*For the fiscal year ended Oct. 31, 2018, certain dividends paid by the Fund may be subject to a maximum tax rate of 20%. The percentage of dividends paid by the Fund from ordinary income reported as qualified income was 100.00%. Complete information will be computed and reported in conjunction with your 2018 Form 1099-DIV.
Board consideration of sub-advisory agreements for Delaware Mid Cap Value Fund at a meeting held May 16-17, 2018
At a meeting held on May 16-17, 2018, the Board of Trustees of Delaware Group® Equity Funds I, including a majority of non-interested or independent Trustees (the “Independent Trustees”), approved a new Sub-Advisory Agreement between Delaware Management Company (“DMC” or “Management”) and each of Macquarie Investment Management Global Limited (“MIMGL”) and Macquarie Funds Management Hong Kong Limited (“MFMHK”) for Delaware Mid Cap Value Fund (the “Fund”). MIMGL and MFMHK may also be referenced as “sub-advisor(s)” below.
In reaching the decision to approve the Sub-Advisory Agreements, the Board considered and reviewed information about each of MIMGL and MFMHK, including its personnel, operations, and financial condition, which had been provided by MIMGL and MFMHK, respectively. The Board also reviewed material furnished by DMC, including: a memorandum from DMC reviewing the Sub-Advisory Agreements and the various services proposed to be rendered by MIMGL and MFMHK; information concerning MIMGL’s and MFMHK’s organizational structure and the experience of their key investment management personnel; copies of MIMGL’s and MFMHK’s Form ADV, financial statements, compliance policies and procedures, and Codes of Ethics; relevant performance information provided with respect to MIMGL and MFMHK; and a copy of the Sub-Advisory Agreements.
42
In considering such information and materials, the Independent Trustees received assistance and advice from and met separately with independent counsel. The materials prepared by Management in connection with the approval of the Sub-Advisory Agreements were sent to the Independent Trustees in advance of the meeting. While attention was given to all information furnished, the following discusses some primary factors relevant to the Board’s decision. This discussion of the information and factors considered by the Board (as well as the discussion above) is not intended to be exhaustive, but rather summarizes certain factors considered by the Board. In view of the wide variety of factors considered, the Board did not, unless otherwise noted, find it practicable to quantify or otherwise assign relative weights to the following factors. In addition, individual Trustees may have assigned different weights to various factors.
Nature, extent, and quality of services. The Board considered the nature, extent, and quality of services that MIMGL and MFMHK each would provide as a sub-advisor to the Fund. The Trustees considered the investment process to be employed by MIMGL and MFMHK in connection with DMC’s collaboration with MIMGL and MFMHK in managing the Fund, and the qualifications and experience of MIMGL and MFMHK’s equity teams with regard to implementing the Fund’s investment mandates. The Board considered MIMGL and MFMHK’s organization, personnel, and operations. The Trustees also considered Management’s review and recommendation process with respect to MIMGL and MFMHK, and Management’s favorable assessment as to the nature, extent, and quality of the sub-advisory services expected to be provided by MIMGL and MFMHK to the Fund. Based on their consideration and review of the foregoing factors, the Board concluded that the nature, extent, and quality of the sub-advisory services to be provided by MIMGL and MFMHK, as well as MIMGL and MFMHK’s ability to render such services based on its experience, organization and resources, were appropriate for the Fund, in light of the Fund’s investment objective, strategies, and policies. In discussing the nature of the services proposed to be provided by the sub-advisors, several Board members observed that, unlike traditional sub-advisors, who make the investment-related decisions with respect to the sub-advised portfolio, the relationship contemplated in this case is limited to access to the additional quantitative investment resources and related technology support of MIMGL and MFMHK.
Sub-advisory fees. The Board considered that DMC would not pay MIMGL and MFMHK fees in conjunction with the services that would be rendered to the sub-advised Fund. The Board concluded that, in light of the quality and extent of the services to be provided and the business relationships between the advisor and sub-advisors, the proposed fee arrangement was understandable and reasonable.
Investment performance. In evaluating performance, the Board considered that MIMGL and MFMHK would provide trade execution support, but that DMC’s portfolio managers for the Fund would retain portfolio management discretion over the Fund.
Economies of scale and fall-out benefits. The Board considered whether the proposed fee arrangement would reflect economies of scale for the benefit of Fund investors as assets in the Fund increased, as applicable. The Board also considered that DMC and its affiliates may benefit by leveraging the global resources of its affiliates.
43
| | | | |
| Other Fund information (Unaudited) | | | | |
| Delaware Mid Cap Value Fund | | | | |
Board consideration of advisory agreement for Delaware Mid Cap Value Fund at a meeting held August 15-16, 2018
At a meeting held on Aug. 15-16, 2018 (the “Annual Meeting”), the Board of Trustees (the “Board”), including a majority of disinterested or independent Trustees, approved the renewal of the Investment Advisory Agreement for Delaware Mid Cap Value Fund (the “Fund”). In making its decision, the Board considered information furnished at regular quarterly Board meetings, including reports detailing Fund performance, investment strategies, and expenses, as well as information prepared specifically in connection with the renewal of the investment advisory contract. Information furnished specifically in connection with the renewal of the Investment Management Agreement with Delaware Management Company (“DMC”), a series of Macquarie Investment Management Business Trust (“MIMBT”), included materials provided by DMC and its affiliates (collectively, “Macquarie Investment Management”) concerning, among other things, the nature, extent, and quality of services provided to the Fund; the costs of such services to the Fund; economies of scale; and the investment manager’s financial condition and profitability. In addition, in connection with the Annual Meeting, materials were provided to the Trustees in May 2018, including reports provided by Broadridge Financial Solutions (“Broadridge”). The Broadridge reports compared the Fund’s investment performance and expenses with those of other comparable mutual funds. The Independent Trustees reviewed and discussed the Broadridge reports with independent legal counsel to the Independent Trustees. In addition to the information noted above, the Board also requested and received information regarding DMC’s policy with respect to advisory fee levels and its breakpoint philosophy; the structure of portfolio manager compensation; comparative client fee information; and any constraints or limitations on the availability of securities for certain investment styles, which had in the past year inhibited, or which were likely in the future to inhibit, the investment manager’s ability to invest fully in accordance with Fund policies.
In considering information relating to the approval of the Fund’s advisory agreement, the Independent Trustees received assistance and advice from and met separately with independent legal counsel to the Independent Trustees and also from an experienced and knowledgeable independent fund consultant, JDL Consultants, LLC (“JDL”). Although the Board gave attention to all information furnished, the following discussion identifies, under separate headings, the primary factors taken into account by the Board during its contract renewal considerations.
Nature, extent, and quality of services. The Board considered the services provided by DMC to the Fund and its shareholders. In reviewing the nature, extent, and quality of services, the Board considered reports furnished to it throughout the year, which covered matters such as the relative performance of the Fund; compliance of portfolio managers with the investment policies, strategies, and restrictions for the Fund; compliance by DMC and Delaware Distributors, L.P. (together, “Management”) personnel with the Code of Ethics adopted throughout the Delaware Funds® by Macquarie (“Delaware Funds”); and adherence to fair value pricing procedures as established by the Board. The Board was pleased with the current staffing of DMC and the emphasis placed on research in the investment process. The Board recognized DMC’s receipt of certain favorable industry distinctions during the past several years. The Board gave favorable consideration to DMC’s efforts to control expenses while maintaining service levels committed to Fund matters. The Board also noted the benefits provided to Fund shareholders (a) through each shareholder’s ability to: (i) exchange an investment in one Delaware Fund for the same class of shares in another Delaware Fund without a sales charge, or (ii) to reinvest Fund dividends into
44
additional shares of the Fund or into additional shares of other Delaware Funds, and (b) the privilege to combine holdings in other Delaware Funds to obtain a reduced sales charge. The Board was satisfied with the nature, extent, and quality of the overall services provided by DMC.
Investment performance. The Board placed significant emphasis on the investment performance of the Fund in view of the importance of investment performance to shareholders. Although the Board considered performance reports and discussions with portfolio managers at Investment Committee meetings throughout the year, the Board gave particular weight to the Broadridge reports furnished for the Annual Meeting. The Broadridge reports prepared for the Fund showed the investment performance of its Class A shares in comparison to a group of similar funds as selected by Broadridge (the “Performance Universe”). A fund with the best performance ranked first, and a fund with the poorest performance ranked last. The highest/best performing 25% of funds in the Performance Universe make up the first quartile; the next 25%, the second quartile; the next 25%, the third quartile; and the poorest/worst performing 25% of funds in the Performance Universe make up the fourth quartile. Comparative annualized performance for the Fund was shown for the past 1-, 3-, 5-, and 10-year periods, to the extent applicable, ended Jan. 31, 2018. The Board’s objective is that the Fund’s performance for the 1-, 3-, and 5-year periods be at or above the median of its Performance Universe.
Broadridge currently classifies the Fund as a mid-cap core fund. However, Management believes that it would be more appropriate to include the Fund in the mid-cap value funds category because the Fund invests in companies whose stock price appears low relative to their underlying value or future potential. Funds in the Broadridge Core category typically use a core investment philosophy and process to select investment holdings. Accordingly, the Broadridge report prepared for the Fund compares the Fund’s performance to two separate Performance Universes – one consisting of the Fund and all retail and institutional mid-cap core funds and the other consisting of the Fund and all retail and institutional mid-cap value funds. When compared to mid-cap core funds, the Broadridge report comparison showed that the Fund’s total return for the 1- and 5-year periods was in the second quartile of its Performance Universe. The report further showed that the Fund’s total return for the 3-year and since inception periods was in the first and third quartile, respectively. When compared to mid-cap value funds, the Broadridge report comparison showed that the Fund’s total return for the 1- and 3-year periods was in the first quartile of its Performance Universe. The report further showed that the Fund’s total return for the 5-year and since inception periods was in the second and third quartile, respectively. The Board was satisfied with performance.
Comparative expenses. The Board considered expense data for the Delaware Funds. Management provided the Board with information on pricing levels and fee structures for the Fund as of its most recently completed fiscal year. The Board also focused on the comparative analysis of effective management fees and total expense ratios of the Fund versus effective management fees and total expense ratios of a group of similar funds as selected by Broadridge (the “Expense Group”). In reviewing comparative costs, the Fund’s contractual management fee and the actual management fee incurred by the Fund were compared with the contractual management fees (assuming all funds in the Expense Group were similar in size to the Fund) and actual management fees (as reported by each fund) within the Expense Group, taking into account any applicable breakpoints and fee waivers. The Fund’s total expenses were also compared with those of its Expense Group. The Broadridge total expenses, for comparative consistency, were shown by Broadridge for Class A shares and comparative total expenses
45
| | | | |
| Other Fund information (Unaudited) | | | | |
| Delaware Mid Cap Value Fund | | | | |
Board consideration of advisory agreement for Delaware Mid Cap Value Fund at a meeting held August 15-16, 2018 (continued)
including 12b-1 and non-12b-1 service fees. The Board’s objective is for each Fund’s total expense ratio to be competitive with those of the peer funds within its Expense Group.
When compared to other mid-cap core funds and mid-cap value funds, the expense comparisons for the Fund showed that its actual management fee was in the quartile with the lowest expenses of its Expense Group and its total expenses were in the quartile with the second lowest expenses of its Expense Group. The Board was satisfied with the management fee and total expenses of the Fund in comparison to those of its Expense Group as shown in the Broadridge report.
Management profitability. The Board considered the level of profits realized by DMC in connection with the operation of the Fund. In this respect, the Board reviewed the Investment Management Profitability Analysis that addressed the overall profitability of DMC’s business in providing management and other services to each of the individual funds and the Delaware Funds as a whole. Specific attention was given to the methodology used by DMC in allocating costs for the purpose of determining profitability. Management stated that the level of profits of DMC, to a certain extent, reflects recent operational cost savings and efficiencies initiated by DMC. The Board considered DMC’s efforts to improve services provided to Fund shareholders and to meet additional regulatory and compliance requirements resulting from recent industry-wide Securities and Exchange Commission initiatives. The Board also considered the extent to which DMC might derive ancillary benefits from fund operations, including the potential for procuring additional business as a result of the prestige and visibility associated with its role as service provider to the Delaware Funds and the benefits from allocation of fund brokerage to improve trading efficiencies. As part of its work, the Board also reviewed a report prepared by JDL regarding MIMBT profitability as compared to certain peer fund complexes and the Independent Trustees met with JDL personnel to discuss DMC’s profitability in such context. The Board found that the management fees were reasonable in light of the services rendered and the level of profitability of DMC.
Economies of scale. The Trustees considered whether economies of scale are realized by DMC as the Fund’s assets increase and the extent to which any economies of scale are reflected in the level of management fees charged. The Trustees reviewed the Fund’s advisory fee pricing and structure, approved by the Board and shareholders, which includes breakpoints, and which applies to most funds in the Delaware Funds complex. Breakpoints in the advisory fee occur when the advisory fee rate is reduced on assets in excess of specified levels. Breakpoints result in a lower advisory fee than would otherwise be the case in the absence of breakpoints, when the asset levels specified in the breakpoints are exceeded. Although, as of March 31, 2018, the Fund had not reached a size at which it could take advantage of any breakpoints in the applicable fee schedule, the Board recognized that the fee was structured so that, if the increases sufficiently in size, then economies of scale may be shared.
46
This page intentionally left blank.
| | | | |
| Board of trustees / directors and officers addendum | | | | |
| Delaware Funds® by Macquarie | | | | |
A mutual fund is governed by a Board of Trustees/Directors (“Trustees”), which has oversight responsibility for the management of a fund’s business affairs. Trustees establish procedures and oversee and review the performance of the investment manager, the distributor, and others who perform services for the fund. The independent fund trustees, in particular, are advocates
| | | | |
Name, Address, and Birth Date | | Position(s) Held with Fund(s) | | Length of Time Served |
Interested Trustee | | | | |
| Shawn K. Lytle1, 2 | | President, | | Trustee since |
| 2005 Market Street | | Chief Executive Officer, | | September 2015 |
| Philadelphia, PA 19103 | | and Trustee | | |
| February 1970 | | | | President and |
| | | | Chief Executive Officer |
| | | | since August 2015 |
Independent Trustees | | | | |
| Thomas L. Bennett | | Chair and Trustee | | Trustee since |
| 2005 Market Street | | | | March 2005 |
| Philadelphia, PA 19103 | | | | |
| October 1947 | | | | Chair since |
| | | | | March 2015 |
| Ann D. Borowiec | | Trustee | | Since March 2015 |
| 2005 Market Street | | | | |
| Philadelphia, PA 19103 | | | | |
November 1958 | | | | |
| Joseph W. Chow | | Trustee | | Since January 2013 |
| 2005 Market Street | | | | |
| Philadelphia, PA 19103 | | | | |
| January 1953 | | | | |
| | | | | |
| 1 | Shawn K. Lytle is considered to be an “Interested Trustee” because he is an executive officer of the Fund’s(s’) investment advisor. |
| 2 | Shawn K. Lytle, David F. Connor, Daniel V. Geatens, and Richard Salus serve in similar capacities for the six portfolios of the Optimum Fund Trust, which have the same investment advisor, principal underwriter, and transfer agent as the registrant. Mr. Geatens also serves as the Chief Financial Officer and Treasurer for Macquarie Global Infrastructure Total Return Fund Inc., which has an affiliated investment manager. |
48
for shareholder interests. Each trustee has served in that capacity since he or she was elected to or appointed to the Board of Trustees, and will continue to serve until his or her retirement or the election of a new trustee in his or her place. The following is a list of the Trustees and Officers with certain background and related information.
| | | | |
| | | Number of Portfolios in | | |
| Principal Occupation(s) | | Fund Complex Overseen | | Other Directorships |
| During the Past Five Years | | by Trustee or Officer | | Held by Trustee or Officer |
| | | | |
| | |
| President — Macquarie | | 59 | | Trustee — UBS |
| Investment Management3 | | | | Relationship Funds, |
| (June 2015–Present) | | | | SMA Relationship |
| | | | Trust, and UBS Funds |
| Regional Head of | | | | (May 2010–April 2015) |
| Americas — UBS Global | | | | |
| Asset Management | | | | |
(April 2010–May 2015) | | | | |
| | | | |
| | |
| Private Investor | | 59 | | None |
(March 2004–Present) | | | | |
| Chief Executive Officer, | | 59 | | Director — |
| Private Wealth Management | | | | Banco Santander International |
| (2011–2013) and | | | | (October 2016–Present) |
| Market Manager, | | | | |
| New Jersey Private | | | | Director — |
| Bank (2005–2011) — | | | | Santander Bank, N.A. |
J.P. Morgan Chase & Co. | | | | (December 2016–Present) |
| Private Investor | | 59 | | Director and Audit Committee |
| (April 2011–Present) | | | | Member — Hercules |
| | | | Technology Growth |
| | | | Capital, Inc. |
| | | | | (July 2004–July 2014) |
| 3 | Macquarie Investment Management is the marketing name for Macquarie Management Holdings, Inc. and its subsidiaries, including the Fund’s(s’) investment advisor, principal underwriter, and its transfer agent. |
49
| | | | |
| Board of trustees / directors and officers addendum | | | | |
| Delaware Funds® by Macquarie | | | | |
| | | | |
| Name, Address, | | Position(s) | | Length of |
| and Birth Date | | Held with Fund(s) | | Time Served |
Independent Trustees (continued) | | |
| John A. Fry | | Trustee | | Since January 2001 |
| 2005 Market Street | | | | |
| Philadelphia, PA 19103 | | | | |
May 1960 | | | | |
| Lucinda S. Landreth | | Trustee | | Since March 2005 |
| 2005 Market Street | | | | |
| Philadelphia, PA 19103 | | | | |
| June 1947 | | | | |
| | |
| Frances A. Sevilla-Sacasa | | Trustee | | Since September 2011 |
| 2005 Market Street | | | | |
| Philadelphia, PA 19103 | | | | |
| January 1956 | | | | |
| | |
| | | | | |
50
| | | | |
| | | Number of Portfolios in | | |
| Principal Occupation(s) | | Fund Complex Overseen | | Other Directorships |
| During the Past Five Years | | by Trustee or Officer | | Held by Trustee or Officer |
| | | | |
| | |
| President — | | 59 | | Director; Compensation |
| Drexel University | | | | Committee and |
| (August 2010–Present) | | | | Governance Committee |
| | | | Member — Community |
| President — | | | | Health Systems |
| Franklin & Marshall College | | | | |
| (July 2002–July 2010) | | | | Director — Drexel |
| | | | Morgan & Co. |
| | |
| | | | Director; Audit Committee |
| | | | Member — vTv |
| | | | Therapeutics LLC |
| | |
| | | | Director; Audit Committee |
| | | | Member — FS Credit Real |
| | | | | Estate Income Trust, Inc. |
| Private Investor | | 59 | | None |
(2004–Present) | | | | |
| Private Investor | | 59 | | Trust Manager and |
| (January 2017–Present) | | | | Audit Committee |
| | | | Chair — Camden |
| Chief Executive Officer — | | | | Property Trust |
| Banco Itaú | | | | (August 2011–Present) |
| International | | | | |
| (April 2012–December 2016) | | | | Director — |
| | | | Carrizo Oil & Gas, Inc. |
| Executive Advisor to Dean | | | | (March 2018–Present) |
| (August 2011–March 2012) | | | | |
| and Interim Dean | | | | |
| (January 2011–July 2011) — | | | | |
| University of Miami School of | | | | |
| Business Administration | | | | |
| | |
| President — U.S. Trust, | | | | |
| Bank of America Private | | | | |
| Wealth Management | | | | |
| (Private Banking) | | | | |
(July 2007–December 2008) | | | | |
51
| | | | |
| Board of trustees / directors and officers addendum | | | | |
| Delaware Funds® by Macquarie | | | | |
| | | | |
| Name, Address, | | Position(s) | | Length of |
| and Birth Date | | Held with Fund(s) | | Time Served |
Independent Trustees (continued) | | |
| Thomas K. Whitford | | Trustee | | Since January 2013 |
| 2005 Market Street | | | | |
| Philadelphia, PA 19103 | | | | |
March 1956 | | | | |
| Janet L. Yeomans | | Trustee | | Since April 1999 |
| 2005 Market Street | | | | |
| Philadelphia, PA 19103 | | | | |
July 1948 | | | | |
Officers | | |
| David F. Connor | | Senior Vice President, | | Senior Vice President |
| 2005 Market Street | | General Counsel, | | since May 2013; |
| Philadelphia, PA 19103 | | and Secretary | | General Counsel |
| December 1963 | | | | since May 2015; |
| | | | Secretary since |
| | | | | October 2005 |
| Daniel V. Geatens | | Vice President | | Vice President and |
| 2005 Market Street | | and Treasurer | | Treasurer since October 2007 |
| Philadelphia, PA 19103 | | | | |
October 1972 | | | | |
| Richard Salus | | Senior Vice President | | Senior Vice President and |
| 2005 Market Street | | and Chief Financial Officer | | Chief Financial Officer |
| Philadelphia, PA 19103 | | | | since November 2006 |
October 1963 | | | | |
The Statement of Additional Information for the Fund(s) includes additional information about the Trustees and Officers and is available, without charge, upon request by calling 800 523-1918.
52
| | | | |
| | | Number of Portfolios in | | |
| Principal Occupation(s) | | Fund Complex Overseen | | Other Directorships |
| During the Past Five Years | | by Trustee or Officer | | Held by Trustee or Officer |
| | | | |
| | |
| Vice Chairman | | 59 | | Director — HSBC Finance |
| (2010–April 2013) — | | | | Corporation and HSBC |
| PNC Financial | | | | North America Holdings Inc. |
| Services Group | | | | (December 2013–Present) |
| | |
| | | | Director — |
| | | | HSBC Bank USA, Inc. |
| | | | | (July 2014–March 2017) |
| Vice President and Treasurer | | 59 | | Director (2009–2017); |
| (January 2006–July 2012), | | | | Personnel and Compensation |
| Vice President — | | | | Committee Chair; Member of |
| Mergers & Acquisitions | | | | Nominating, Investments, and |
| (January 2003–January 2006), | | | | Audit Committees for various |
| and Vice President | | | | periods throughout |
| and Treasurer | | | | directorship — |
| (July 1995–January 2003) — | | | | Okabena Company |
3M Company | | | | |
| | | | |
| | |
| David F. Connor has served | | 59 | | None2 |
| in various capacities at | | | | |
| different times at | | | | |
| Macquarie Investment | | | | |
Management. | | | | |
| Daniel V. Geatens has served | | 59 | | None2 |
| in various capacities at | | | | |
| different times at | | | | |
| Macquarie Investment | | | | |
Management. | | | | |
| Richard Salus has served | | 59 | | None2 |
| in various executive capacities | | | | |
| at different times at | | | | |
| Macquarie Investment | | | | |
Management. | | | | |
53
| | | | | | |
Board of trustees | | | | | | |
| Shawn K. Lytle | | Ann D. Borowiec | | John A. Fry | | Frances A. |
| President and | | Former Chief Executive | | President | | Sevilla-Sacasa |
| Chief Executive Officer | | Officer | | Drexel University | | Former Chief Executive |
| Delaware Funds® | | Private Wealth Management | | Philadelphia, PA | | Officer |
| by Macquarie | | J.P. Morgan Chase & Co. | | | | Banco Itaú International |
| Philadelphia, PA | | New York, NY | | Lucinda S. Landreth | | Miami, FL |
| | | | Former Chief Investment | | |
| Thomas L. Bennett | | Joseph W. Chow | | Officer | | Thomas K. Whitford |
| Chairman of the Board | | Former Executive Vice | | Assurant, Inc. | | Former Vice Chairman |
| Delaware Funds | | President | | New York, NY | | PNC Financial Services Group |
| by Macquarie | | State Street Corporation | | | | Pittsburgh, PA |
| Private Investor | | Boston, MA | | | | |
| Rosemont, PA | | | | | | Janet L. Yeomans |
| | | | | | Former Vice President and |
| | | | | | Treasurer |
| | | | | | 3M Company |
| | | | | | St. Paul, MN |
| | | |
Affiliated officers | | | | | | |
| | | |
| David F. Connor | | Daniel V. Geatens | | Richard Salus | | |
| Senior Vice President, | | Vice President and | | Senior Vice President and | | |
| General Counsel, | | Treasurer | | Chief Financial Officer | | |
| and Secretary | | Delaware Funds | | Delaware Funds | | |
| Delaware Funds | | by Macquarie | | by Macquarie | | |
| by Macquarie | | Philadelphia, PA | | Philadelphia, PA | | |
| Philadelphia, PA | | | | | | |
This annual report is for the information of Delaware Mid Cap Value Fund shareholders, but it may be used with prospective investors when preceded or accompanied by the Delaware Fund fact sheet for the most recently completed calendar quarter. These documents are available at delawarefunds.com/literature.
The Fund files its complete schedule of portfolio holdings with the Securities and Exchange Commission (SEC) for the first and third quarters of each fiscal year on Form N-Q. The Fund’s Forms N-Q, as well as a description of the policies and procedures that the Fund uses to determine how to vote proxies (if any) relating to portfolio securities are available without charge (i) upon request, by calling 800 523-1918; and (ii) on the SEC’s website at sec.gov. In addition, a description of the policies and procedures that the Fund uses to determine how to vote proxies (if any) relating to portfolio securities and the Schedule of Investments included in the Fund’s most recent Form N-Q are available without charge on the Fund’s website at delawarefunds.com/literature. The Fund’s Forms N-Q may be reviewed and copied at the SEC’s Public Reference Room in Washington, D.C.; information on the operation of the Public Reference Room may be obtained by calling 800 SEC-0330.
Information (if any) regarding how the Fund voted proxies relating to portfolio securities during the most recently disclosed 12-month period ended June 30 is available without charge (i) through the Fund’s website at delawarefunds.com/proxy; and (ii) on the SEC’s website at sec.gov.
54
Item 2. Code of Ethics
Item 3. Audit Committee Financial Expert
The registrant’s Board of Trustees has determined that certain members of the registrant’s Audit Committee are audit committee financial experts, as defined below. For purposes of this item, an “audit committee financial expert” is a person who has the following attributes:
a. An understanding of generally accepted accounting principles and financial statements;
b. The ability to assess the general application of such principles in connection with the accounting for estimates, accruals, and reserves;
c. Experience preparing, auditing, analyzing, or evaluating financial statements that present a breadth and level of complexity of accounting issues that are generally comparable to the breadth and complexity of issues that can reasonably be expected to be raised by the registrant’s financial statements, or experience actively supervising one or more persons engaged in such activities;
d. An understanding of internal controls and procedures for financial reporting; and
e. An understanding of audit committee functions.
An “audit committee financial expert” shall have acquired such attributes through:
a. Education and experience as a principal financial officer, principal accounting officer, controller, public accountant, or auditor or experience in one or more positions that involve the performance of similar functions;
b. Experience actively supervising a principal financial officer, principal accounting officer, controller, public accountant, auditor, or person performing similar functions;
c. Experience overseeing or assessing the performance of companies or public accountants with respect to the preparation, auditing, or evaluation of financial statements; or
d. Other relevant experience.
The registrant’s Board of Trustees has also determined that each member of the registrant’s Audit Committee is independent. In order to be “independent” for purposes of this item, the Audit Committee member may not: (i) other than in his or her capacity as a member of the Board of Trustees or any committee thereof, accept directly or indirectly any consulting, advisory or other compensatory fee from the issuer; or (ii) be an “interested person” of the registrant as defined in Section 2(a)(19) of the Investment Company Act of 1940.
The names of the audit committee financial experts on the registrant’s Audit Committee are set forth below:
Joseph W. Chow
John A. Fry
Lucinda S. Landreth
Thomas K. Whitford
Janet L. Yeomans
Item 4. Principal Accountant Fees and Services
The aggregate fees billed for services provided to the registrant by its independent auditors for the audit of the registrant’s annual financial statements and for services normally provided by the independent auditors in connection with statutory and regulatory filings or engagements were $30,480 for the fiscal year ended October 31, 2018.
The aggregate fees billed for services provided to the registrant by its independent auditors for the audit of the registrant’s annual financial statements and for services normally provided by the independent auditors in connection with statutory and regulatory filings or engagements were $29,630 for the fiscal year ended October 31, 2017.
The aggregate fees billed by the registrant’s independent auditors for services relating to the performance of the audit of the registrant’s financial statements and not reported under paragraph (a) of this Item were $0 for the fiscal year ended October 31, 2018.
The aggregate fees billed by the registrant’s independent auditors for services relating to the performance of the audit of the registrant’s financial statements and not reported under paragraph (a) of this Item were $0 for the fiscal year ended October 31, 2017.
The aggregate fees billed by the registrant’s independent auditors for tax-related services provided to the registrant’s investment adviser and other service providers under common control with the adviser and that relate directly to the operations or financial reporting of the registrant were $0 for the registrant’s fiscal year ended October 31, 2018.
The aggregate fees billed by the registrant’s independent auditors for tax-related services provided to the registrant’s investment adviser and other service providers under common control with the adviser and that relate directly to the operations or financial reporting of the registrant were $0 for the registrant’s fiscal year ended October 31, 2017.
The aggregate fees billed for all services provided by the independent auditors to the registrant other than those set forth in paragraphs (a), (b) and (c) of this Item were $0 for the fiscal year ended October 31, 2018.
The aggregate fees billed for all services provided by the independent auditors to the registrant other than those set forth in paragraphs (a), (b) and (c) of this Item were $0 for the fiscal year ended October 31, 2017.
Under the Pre-Approval Policy, the Audit Committee has also pre-approved the services set forth in the table below with respect to the registrant’s investment adviser and other entities controlling, controlled by or under common control with the investment adviser that provide ongoing services to the registrant (the “Control Affiliates”) up to the specified fee limit. This fee limit is based on aggregate fees to the investment adviser and its Control Affiliates.
The Pre-Approval Policy requires the registrant’s independent auditors to report to the Audit Committee at each of its regular meetings regarding all services initiated since the last such report was rendered, including those services authorized by the Pre-Approval Policy.
(f) Not applicable.
(g) The aggregate non-audit fees billed by the registrant’s independent auditors for services rendered to the registrant and to its investment adviser and other service providers under common control with the adviser were $11,748,000 and $11,180,000 for the registrant’s fiscal years ended October 31, 2018 and October 31, 2017, respectively.
(h) In connection with its selection of the independent auditors, the registrant’s Audit Committee has considered the independent auditors’ provision of non-audit services to the registrant’s investment adviser and other service providers under common control with the adviser that were not required to be pre-approved pursuant to Rule 2-01(c)(7)(ii) of Regulation S-X. The Audit Committee has determined that the independent auditors’ provision of these services is compatible with maintaining the auditors’ independence.
Item 5. Audit Committee of Listed Registrants
Not applicable.
Item 6. Investments
(a) Included as part of report to shareholders filed under Item 1 of this Form N-CSR.
(b) Divestment of securities in accordance with Section 13(c) of the Investment Company Act of 1940.
Not applicable.
Item 7. Disclosure of Proxy Voting Policies and Procedures for Closed-End Management Investment Companies
Not applicable.
Item 8. Portfolio Managers of Closed-End Management Investment Companies
Not applicable.
Item 9. Purchases of Equity Securities by Closed-End Management Investment Company and Affiliated Purchasers
Not applicable.
Item 10. Submission of Matters to a Vote of Security Holders
Not applicable.
Item 11. Controls and Procedures
The registrant’s principal executive officer and principal financial officer have evaluated the registrant’s disclosure controls and procedures within 90 days of the filing of this report and have concluded that they are effective in providing reasonable assurance that the information required to be disclosed by the registrant in its reports or statements filed under the Securities Exchange Act of 1934 is recorded, processed, summarized and reported within the time periods specified in the rules and forms of the Securities and Exchange Commission.
There were no significant changes in the registrant’s internal control over financial reporting that occurred during the second fiscal quarter of the period covered by the report to stockholders included herein (i.e., the registrant’s fourth fiscal quarter) that have materially affected, or are reasonably likely to materially affect, the registrant’s internal control over financial reporting.
Item 12. Disclosure of Securities Lending Activities for Closed-End Management Investment Companies
Not applicable.
Item 13. Exhibits
Pursuant to the requirements of the Securities Exchange Act of 1934 and the Investment Company Act of 1940, the registrant has duly caused this report to be signed on its behalf, by the undersigned, thereunto duly authorized.
Pursuant to the requirements of the Securities Exchange Act of 1934 and the Investment Company Act of 1940, this report has been signed below by the following persons on behalf of the registrant and in the capacities and on the dates indicated.