Item 1. Reports to Stockholders
Annual report
US equity mutual fund
Delaware Mid Cap Value Fund
October 31, 2019
Beginning on or about June 1, 2021, as permitted by regulations adopted by the Securities and Exchange Commission, paper copies of your Fund’s shareholder reports will no longer be sent to you by mail, unless you specifically request them from the Fund or from your financial intermediary, such as a broker/dealer, bank, or insurance company. Instead, you will be notified by mail each time a report is posted on the website and provided with a link to access the report.
If you already elected to receive shareholder reports electronically, you will not be affected by this change and you do not need to take any action. You may elect to receive shareholder reports and other communications from the Fund electronically by signing up at delawarefunds.com/edelivery. If you own these shares through a financial intermediary, you may contact your financial intermediary.
You may elect to receive paper copies of all future shareholder reports free of charge. You can inform the Fund that you wish to continue receiving paper copies of your shareholder reports by contacting us at 800523-1918. If you own these shares through a financial intermediary, you may contact your financial intermediary to elect to continue to receive paper copies of your shareholder reports. Your election to receive reports in paper will apply to all funds held with the Delaware Funds® by Macquarie or your financial intermediary.
Carefully consider the Fund’s investment objectives, risk factors, charges, and expenses before investing. This and other information can be found in the Fund’s prospectus and its summary prospectus, which may be obtained by visiting delawarefunds.com/literature or calling 800523-1918. Investors should read the prospectus and the summary prospectus carefully before investing.
You can obtain shareholder reports and prospectuses online instead of in the mail.
Visit delawarefunds.com/edelivery.
Experience Delaware Funds®by Macquarie
Macquarie Investment Management (MIM) is a global asset manager with offices throughout the United States, Europe, Asia, and Australia. As active managers we prioritize autonomy and accountability at the investment team level in pursuit of opportunities that matter for clients. Delaware Funds is one of the longest-standing mutual fund families, with more than 80 years in existence.
If you are interested in learning more about creating an investment plan, contact your financial advisor.
You can learn more about Delaware Funds or obtain a prospectus for Delaware Mid Cap Value Fund at delawarefunds.com/literature.
Manage your account online
| · | | Check your account balance and transactions |
| · | | View statements and tax forms |
| · | | Make purchases and redemptions |
Visit delawarefunds.com/account-access.
Macquarie Asset Management (MAM) offers a diverse range of products including securities investment management, infrastructure and real asset management, and fund and equity-based structured products. MIM is the marketing name for certain companies comprising the asset management division of Macquarie Group. This includes the following investment advisers: Macquarie Investment Management Business Trust (MIMBT), Macquarie Funds Management Hong Kong Limited, Macquarie Investment Management Austria Kapitalanlage AG, Macquarie Investment Management Global Limited, Macquarie Investment Management Europe Limited, Macquarie Capital Investment Management LLC, and Macquarie Investment Management Europe S.A.
The Fund is distributed byDelaware Distributors, L.P.(DDLP), an affiliate of MIMBT and Macquarie Group Limited.
Other than Macquarie Bank Limited (MBL), none of the entities noted are authorized deposit-taking institutions for the purposes of the Banking Act 1959 (Commonwealth of Australia). The obligations of these entities do not represent deposits or other liabilities of MBL. MBL does not guarantee or otherwise provide assurance in respect of the obligations of these entities, unless noted otherwise. The Fund is governed by US laws and regulations.
Unless otherwise noted, views expressed herein are current as of Oct. 31, 2019, and subject to change for events occurring after such date.
The Fund is not FDIC insured and is not guaranteed. It is possible to lose the principal amount invested.
Advisory services provided by Delaware Management Company, a series of MIMBT, a US registered investment advisor.
All third-party marks cited are the property of their respective owners.
© 2019 Macquarie Management Holdings, Inc.
| | |
| Portfolio management review | | |
| Delaware Mid Cap Value Fund | | November 12, 2019 (Unaudited) |
| | | | | | |
| Performance preview (for the year ended October 31, 2019) | | | | |
Delaware Mid Cap Value Fund (Institutional Class shares) | | 1-year return | | | +10.29 | % |
Delaware Mid Cap Value Fund (Class A shares) | | 1-year return | | | +9.99 | % |
Russell Midcap® Value Index (benchmark) | | 1-year return | | | +10.08 | % |
Past performance does not guarantee future results.
For complete, annualized performance for Delaware Mid Cap Value Fund, please see the table on page 4.
Institutional Class shares are not subject to a sales charge and are offered for sale exclusively to certain eligible investors. In addition, Institutional Class shares pay no distribution and service fee.
The performance of Class A shares excludes the applicable sales charge. Both Institutional Class shares and Class A shares reflect the reinvestment of all distributions.
Please see page 6 for a description of the index. Index performance returns do not reflect any management fees, transaction costs, or expenses. Indices are unmanaged and one cannot invest directly in an index.
Market review
Mid-cap value stocks experienced substantial volatility during the Fund’s fiscal year ended Oct. 31, 2019, although they did finish the period with a positive return. During the fiscal year, growth companies outperformed value companies across the US market cap spectrum as investors continued to favor momentum over quality. The performance disparity between value companies and growth companies was significant inmid-cap equities as the Russell Midcap Value Index gained 10.08% and the Russell Midcap® Growth Index rose 18.93% during the fiscal year.
All sectors within the Russell Midcap Value Index posted positive returns with the exception of energy and consumer services. In the consumer services sector, US apparel companies faced headwinds from tariffs on imports from goods manufactured in China. In the energy sector, the price per barrel for West Texas Intermediate (WTI) crude oil declined from $65 to $54 during the fiscal year, as global supply increased more quickly than demand. Elsewhere during the fiscal period, investors’ preference for the more defensive and higher yielding sectors of the benchmark, as well as declining interest rates, led to strong performance in the real estate investment trust (REIT) and utilities sectors. An accommodative US Federal Reserve, which
reduced the federal funds rate in the second half of the Fund’s fiscal year, reinforced this. We think a style rotation in the market may have started in late August, showing signs of a possible value cycle. Generally, companies with higher momentum and growth factors reversed their outperformance trend and companies in the consumer cyclical and capital spending sectors, as well as companies with more attractive valuations, outperformed. It remains to be seen, however, whether this is a more sustainable move into value equities or just a temporary shift within the market.
The gross domestic product (GDP) growth rate maintained a moderate pace during the fiscal year, although the rate of growth did slow during the first three quarters of 2019. The unemployment rate remained at historically low levels with an October reading of 3.6%. while wage growth remained positive. The Conference Board Consumer Confidence Index® (1985=100, SA) was at historically high levels over the summer, peaking in August, and declining month over month to settle at 125.9 for October, which was well above long-term averages.
Source: Bloomberg.
1
Portfolio management review
Delaware Mid Cap Value Fund
Within the Fund
For the fiscal year ended Oct. 31, 2019, Delaware Mid Cap Value Fund Institutional Class shares gained 10.29%. The Fund’s Class A shares advanced 9.99% at net asset value (NAV) and 3.71% at maximum offer price. These figures reflect reinvestment of all distributions. During the same period, the Fund’s benchmark, the Russell Midcap Value Index, gained 10.08%. For complete annualized performance of Delaware Mid Cap Value Fund, please see the table on page 4.
Stock selection in the technology, consumer cyclical, and healthcare sectors contributed to the Fund’s performance during the fiscal year. Stock selection and relative underweight allocations to companies in consumer services and consumer staples also contributed. Stock selection in the financial services and energy sectors detracted from performance.
Synopsys Inc.provides design tools used in the design and development of advanced integrated circuits and electronic systems. Synopsys contributed to the Fund’s performance during the fiscal year as the company reported multiple quarters of strong financial results. The demand for new, high-performance, integrated circuits to address new applications continues to grow, which is driving companies to increase their spending on research and development (R&D). This benefits Synopsys’ platform. We maintain a positive outlook on Synopsys as we believe the company’s products are well positioned in the market and management continues to repurchase its common stock. Synopsys generates notably strong free-cash flow and its valuation remains reasonable within the technology sector, in our view.
Teradyne Inc., a supplier of automation equipment for test and industrial applications, also contributed to performance. Teradyne designs systems used to test semiconductors, wireless products, and electronic systems, in addition to producing collaborativeindustrial-use robots.
Teradyne’s stock price rose throughout the fiscal year and experienced a significant price increase after reporting its fiscal second quarter earnings in July. Teradyne’s largest business segment – Semiconductor Test – reported stronger-than-expected sales, driven by 5G infrastructure, networking, and memory test. We believe Teradyne is well positioned to continue benefiting from increasing demand for its products.
In the capital spending sector, government solutions companyKBR Inc.contributed to the Fund’s performance. Since 2016, KBR has sought to transform its revenue mix towards more government service-oriented work and away from higher-risk construction work. During the fiscal year, KBR was awarded significant projects in both energy and government services segments. KBR also successfully petitioned MSCI to change its GICS® industry classification (effective April 30) from engineering and construction to information technology (IT) consulting and other services. This change is positive for its current investors from a valuation comparison perspective. KBR has contracts with the US Army, US Department of State, NASA, and various companies in the energy industry. During the fiscal year, KBR increased revenues, earnings, and free-cash flow in addition to repaying debt to reduce leverage.
SM Energy Co.detracted from the Fund’s relative performance during the fiscal year. SM Energy, an independent oil and gas energy and production (E&P) company, maintains some of the more prolific wells in its areas of operation and has made significant progress in a transition to focus on its holdings in the Permian Basin and Eagle Ford Shale regions of the United States. The stock underperformed during the year, as was the case for many companies in the E&P industry. SM Energy is growing production while trying to maintain capital discipline in a volatile energy environment. Prior to the end of the Fund’s fiscal year, we exited the Fund’s position in SM Energy and invested the proceeds in a new energy
2
company that had what we viewed as stronger financials.
Stock selection in the financial services sector also detracted from performance during the fiscal year as a number of the Fund’s regional bank holdings underperformed.East West Bancorp Inc.is a regional bank that focuses on the financial services needs of individuals and businesses operating in both the US and Greater China, including Chinese-Americans and small-business owners. East West Bancorp is more sensitive to changes in interest rates than its peers because of the composition of the bank’s balance sheet. The flattening of the US Treasury yield curve and the reductions in the federal funds rate slowed East West Bancorp’s net interest income growth. East West Bancorp has what we view as a niche business model that enables the company to earn more than its peers and generate higher average loan growth. We maintained our position in East West Bancorp as the valuation remains attractive to us.
Chemours Co., a global chemical company operating in three main business segments: Titanium Technologies, Fluoroproducts, and Chemical Solutions, detracted from performance. Chemours experienced a decline in volume sales for titanium dioxide (TiO2) as a result of weaker economic demand and a shift in sales strategy that lowered sales and earnings before interest, tax, depreciation, and amortization (EBITDA) during its fiscal second quarter. Global uncertainty also pressured Chemours’ stock price as the company operates in numerous end markets. Management is focused on execution and managing what it can control which we think should likely improve its financials. We initiated
our purchase of Chemours during the Fund’s fiscal year and are attracted to the valuation as the company continues to repurchase shares and remains committed to returning the majority of free-cash flow to shareholders; we believe these are positive indicators.
The Fund ended the fiscal year overweight the capital spending, financial services, and technology sectors. The Fund remained underweight defensive sectors, including REITs, utilities, and consumer staples. Relative sector weightings were roughly neutral in the transportation, consumer cyclical, business services, and energy sectors.
Although market volatility may remain elevated, we believe the moderate-growth, low inflation, low interest rate environment that we have experienced for several years should continue to support equity prices. Several indicators suggest to us that value-oriented companies have the potential to perform well in the current market environment. We have positioned the Fund to potentially benefit from this.
Our team’s disciplined philosophy remains unchanged. We continue to focus onbottom-up stock selection and specifically on identifying companies that, in our view, trade at attractive valuations, generate strong free-cash flow, and implement shareholder-friendly policies through share buybacks, dividend increases, and debt reduction. In that regard, we are encouraged by the number of companies that continue to meet these criteria.
We appreciate your confidence and look forward to serving your investment needs in the next fiscal year.
3
| | |
| Performance summary | | |
| Delaware Mid Cap Value Fund | | October 31, 2019 (Unaudited) |
The performance quoted represents past performance and does not guarantee future results. Investment return and principal value of an investment will fluctuate so that shares, when redeemed, may be worth more or less than their original cost. Current performance may be lower or higher than the performance quoted. Performance data current to the most recent month end may be obtained by calling 800523-1918 or visiting delawarefunds.com/performance.
| | | | | | | | | | | | | | | | |
| Fund and benchmark performance1,2 | | Average annual total returns through October 31, 2019 | |
| | | | |
| | | 1 year | | | 5 year | | | 10 year | | | Lifetime | |
Class A (Est. Feb. 1, 2008) | | | | | | | | | | | | | | | | |
Excluding sales charge | | | +9.99% | | | | +7.37% | | | | +11.13% | | | | +7.35% | |
Including sales charge | | | +3.71% | | | | +6.11% | | | | +10.48% | | | | +6.81% | |
Class C (Est. July 31, 2008) | | | | | | | | | | | | | | | | |
Excluding sales charge | | | +9.25% | | | | +6.57% | | | | +10.29% | | | | +7.18% | |
Including sales charge | | | +8.25% | | | | +6.57% | | | | +10.29% | | | | +7.18% | |
Class R (Est. July 31, 2008) | | | | | | | | | | | | | | | | |
Excluding sales charge | | | +9.69% | | | | +7.12% | | | | +10.88% | | | | +7.75% | |
Including sales charge | | | +9.69% | | | | +7.12% | | | | +10.88% | | | | +7.75% | |
Institutional Class (Est. Feb. 1, 2008) | | | | | | | | | | | | | | | | |
Excluding sales charge | | | +10.29% | | | | +7.64% | | | | +11.40% | | | | +7.60% | |
Including sales charge | | | +10.29% | | | | +7.64% | | | | +11.40% | | | | +7.60% | |
Russell Midcap Value Index | | | +10.08% | | | | +6.95% | | | | +12.90% | | | | +8.60%* | |
*The benchmark lifetime return is for Institutional Class share comparison only and is calculated using the last business day in the month of the Fund’s Institutional Class inception date.
1Returns reflect the reinvestment of all distributions and are presented both with and without the applicable sales charges described below. Returns do not reflect the deduction of taxes the shareholder would pay on Fund distributions or redemptions of Fund shares.
Expense limitations were in effect for certain classes during some or all of the periods shown in the “Fund and benchmark performance” table. Expenses for each class are listed on the “Fund expense ratios” table on page 5. Performance would have been lower had expense limitations not been in effect.
Institutional Class shares are not subject to a sales charge and are offered for sale exclusively to certain eligible investors. In addition, Institutional Class shares pay no distribution and service(12b-1) fee.
Class A shares are sold with a maximumfront-end sales charge of 5.75%, and have an annual12b-1 fee of 0.25% of average daily net assets. Performance for Class A shares, excluding sales charges, assumes that nofront-end sales charge applied.
Class C shares are sold with a contingent deferred sales charge of 1.00% if redeemed during the first 12 months. They are also subject to an annual12b-1 fee of 1.00% of average daily net assets. Performance for Class C shares, excluding sales charges, assumes either that contingent deferred sales charges did not apply or that the investment was not redeemed.
Class R shares are available only for certain retirement plan products. They are sold without a sales charge and have an annual12b-1 fee of 0.50% of average daily net assets.
4
Investments in small and/ormedium-sized companies typically exhibit greater risk and higher volatility than larger, more established companies.
Narrowly focused investments may exhibit higher volatility than investments in multiple industry sectors.
REIT investments are subject to many of the risks associated with direct real estate ownership, including changes in economic conditions, credit risk, and interest rate fluctuations.
2The Fund’s expense ratios, as described in the most recent prospectus, are disclosed in the following “Fund expense ratios” table. Delaware Management Company has agreed to reimburse certain expenses and/or waive certain fees in order to prevent total annual fund operating expenses (excluding any12b-1 fees, acquired fund fees and expenses, taxes, interest, short sale dividend and interest expenses, brokerage fees, certain insurance costs, and nonroutine expenses or costs, including, but not limited to, those relating to reorganizations, litigation, conducting shareholder meetings, and liquidations) do not exceed 0.89% of the Fund’s average daily net assets through Oct. 31, 2019.* Prior to Feb. 28, 2019, DMC has contractually agreed to waive all or a portion, if any, of its management fee and/or pay/reimburse the Fund to the extent necessary to ensure total annual operating expenses do not exceed 1.00% of the Fund’s average daily net assets from Nov. 1, 2018 through Feb. 27, 2019. Please see the most recent prospectus and any applicable supplement(s) for additional information on these fee waivers and/or reimbursements. Please see the “Financial highlights” section in this report for the most recent expense ratios.
| | | | | | | | | | | | | | | | |
| Fund expense ratios | | Class A | | | Class C | | | Class R | | | Institutional
Class | |
Total annual operating expenses | | | 2.34% | | | | 3.09% | | | | 2.59% | | | | 2.09% | |
(without fee waivers) | | | | | | | | | | | | | | | | |
Net expenses | | | 1.14% | | | | 1.89% | | | | 1.39% | | | | 0.89% | |
(including fee waivers, if any) | | | | | | | | | | | | | | | | |
Type of waiver | | | Contractual | | | | Contractual | | | | Contractual | | | | Contractual | |
*The aggregate contractual waiver period covering this report is from Feb. 28, 2019 through Feb. 28, 2020.
5
Performance summary
Delaware Mid Cap Value Fund
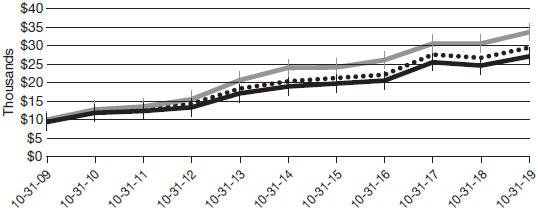
Performance of a $10,000 investment1
Average annual total returns from Oct. 31, 2009 through Oct. 31, 2019
| | | | | | | | |
| For the period beginning Oct. 31, 2009 through Oct. 31, 2019 | | Starting value | | | Ending value | |
 Russell Midcap Value Index Russell Midcap Value Index
| | | $10,000 | | | | $33,652 | |
| | |
 Delaware Mid Cap Value Fund — Institutional Class shares Delaware Mid Cap Value Fund — Institutional Class shares
| | | $10,000 | | | | $29,433 | |
| | |
 Delaware Mid Cap Value Fund — Class A shares Delaware Mid Cap Value Fund — Class A shares
| | | $9,425 | | | | $27,089 | |
1The “Performance of a $10,000 investment” graph assumes $10,000 invested in Institutional Class and Class A shares of the Fund on Oct. 31, 2009, and includes the effect of a 5.75%front-end sales charge (for Class A shares) and the reinvestment of all distributions. The graph does not reflect the deduction of taxes the shareholders would pay on Fund distributions or redemptions of Fund shares. Expense limitations were in effect for some or all of the periods shown. Performance would have been lower had expense limitations not been in effect. Expenses are listed in the “Fund expense ratios” table on page 5. Please note additional details on pages 4 through 7.
The graph also assumes $10,000 invested in the Russell Midcap Value Index as of Oct. 31, 2009. The Russell Midcap Value Index measures the performance of themid-cap value segment of the
US equity universe. It includes those Russell Midcap Index companies with lowerprice-to-book ratios and lower forecasted growth values.
The Russell Midcap Growth Index, mentioned on page 1, measures the performance of themid-cap growth segment of the US equity universe. It includes those Russell Midcap Index companies with higherprice-to-book ratios and higher forecasted growth values.
The Conference Board Consumer Confidence Index, mentioned on page 1, is a barometer of the health of the US economy from the perspective of the consumer. The index is based on consumers’ perceptions of current business and employment conditions, as well as their expectations for six months hence regarding business conditions, employment, and income. The resulting relative value is then used as an “index value” and compared against each respective monthly value
6
for 1985. In that year, the result of the index was arbitrarily set at 100, representing it as index benchmark.
Frank Russell Company is the source and owner of the trademarks, service marks and copyrights related to the Russell Indexes. Russell® is a trademark of the Frank Russell Company.
Index performance returns do not reflect any management fees, transaction costs, or expenses. Indices are unmanaged and one cannot invest directly in an index.Past performance is not a guarantee of future results.
Performance of other Fund classes will vary due to different charges and expenses.
| | | | |
| | | Nasdaq symbols | | CUSIPs |
Class A | | DLMAX | | 246093868 |
Class C | | DLMCX | | 246093850 |
Class R | | DLMRX | | 246093843 |
Institutional Class | | DLMIX | | 246093835 |
7
Disclosure of Fund expenses
For thesix-month period from May 1, 2019 to October 31, 2019 (Unaudited)
As a shareholder of the Fund, you incur two types of costs: (1) transaction costs, including sales charges (loads) on purchase payments, reinvested dividends, or other distributions; redemption fees; and exchange fees; and (2) ongoing costs, including management fees; distribution and service(12b-1) fees; and other Fund expenses. This example is intended to help you understand your ongoing costs (in dollars) of investing in the Fund and to compare these costs with the ongoing costs of investing in other mutual funds.
The example is based on an investment of $1,000 invested at the beginning of the period and held for the entiresix-month period from May 1, 2019 to Oct. 31, 2019.
Actual expenses
The first section of the table shown, “Actual Fund return,” provides information about actual account values and actual expenses. You may use the information in this section of the table, together with the amount you invested, to estimate the expenses that you paid over the period. Simply divide your account value by $1,000 (for example, an $8,600 account value divided by $1,000 = 8.6), then multiply the result by the number in the first section under the heading entitled “Expenses Paid During Period” to estimate the expenses you paid on your account during this period.
Hypothetical example for comparison purposes
The second section of the table shown, “Hypothetical 5% return,” provides information about hypothetical account values and hypothetical expenses based on the Fund’s actual expense ratio and an assumed rate of return of 5% per year before expenses, which is not the Fund’s actual return. The hypothetical account values and expenses may not be used to estimate the actual ending account balance or expenses you paid for the period. You may use this information to compare the ongoing costs of investing in the Fund and other funds. To do so, compare this 5% hypothetical example with the 5% hypothetical examples that appear in the shareholder reports of the other funds.
Please note that the expenses shown in the table are meant to highlight your ongoing costs only and do not reflect any transactional costs, such as sales charges (loads), redemption fees, or exchange fees. Therefore, the second section of the table is useful in comparing ongoing costs only, and will not help you determine the relative total costs of owning different funds. In addition, if these transactional costs were included, your costs would have been higher. The Fund’s expenses shown in the table reflect fee waivers in effect and assume reinvestment of all dividends and distributions.
8
Delaware Mid Cap Value Fund
Expense analysis of an investment of $1,000
| | | | | | | | | | | | | | | | |
| | | Beginning Account Value 5/1/19 | | Ending Account Value 10/31/19 | | Annualized Expense Ratio | | Expenses Paid During Period 5/1/19 to 10/31/19* |
Actual Fund return† | | | | | | | | | | | | | | | | |
Class A | | | $1,000.00 | | | | $1,000.00 | | | | 1.13 | % | | | $5.70 | |
Class C | | | 1,000.00 | | | | 996.50 | | | | 1.88 | % | | | 9.46 | |
Class R | | | 1,000.00 | | | | 998.40 | | | | 1.38 | % | | | 6.95 | |
Institutional Class | | | 1,000.00 | | | | 1,001.60 | | | | 0.88 | % | | | 4.44 | |
Hypothetical 5% return(5% return before expenses) | | | | | | | | | |
Class A | | | $1,000.00 | | | | $1,019.51 | | | | 1.13 | % | | | $5.75 | |
Class C | | | 1,000.00 | | | | 1,015.73 | | | | 1.88 | % | | | 9.55 | |
Class R | | | 1,000.00 | | | | 1,018.25 | | | | 1.38 | % | | | 7.02 | |
Institutional Class | | | 1,000.00 | | | | 1,020.77 | | | | 0.88 | % | | | 4.48 | |
*“Expenses Paid During Period” are equal to the Fund’s annualized expense ratio, multiplied by the average account value over the period, multiplied by 184/365 (to reflect theone-half year period).
†Because actual returns reflect only the most recentsix-month period, the returns shown may differ significantly from fiscal year returns.
In addition to the Fund’s expenses reflected above, the Fund also indirectly bears its portion of the fees and expenses of the investment companies (Underlying Funds) in which it invests. The table above does not reflect the expenses of the Underlying Funds.
9
| | |
| Security type / sector allocation and top 10 equity holdings |
| Delaware Mid Cap Value Fund | | As of October 31, 2019 (Unaudited) |
Sector designations may be different than the sector designations presented in other fund materials. The sector designations may represent the investment manager’s internal sector classifications.
| | | | |
| Security type / sector | | Percentage of net assets |
| |
Common Stock | | | 96.60 | % |
Basic Industry | | | 7.10 | % |
Business Services | | | 1.96 | % |
Capital Spending | | | 10.70 | % |
Consumer Cyclical | | | 4.33 | % |
Consumer Services | | | 6.67 | % |
Consumer Staples | | | 2.48 | % |
Energy | | | 5.27 | % |
Financial Services | | | 21.11 | % |
Healthcare | | | 4.57 | % |
Real Estate Investment Trusts | | | 10.72 | % |
Technology | | | 11.81 | % |
Transportation | | | 2.45 | % |
Utilities | | | 7.43 | % |
Short-Term Investments | | | 3.04 | % |
Total Value of Securities | | | 99.64 | % |
Receivables and Other Assets Net of Liabilities | | | 0.36 | % |
Total Net Assets | | | 100.00 | % |
| | |
|
Holdings are for informational purposes only and are subject to change at any time. They are not a recommendation to buy, sell, or hold any security. |
| | | | |
| |
| Top 10 equity holdings | | Percentage of net assets |
Synopsys | | | 2.82 | % |
Raymond James Financial | | | 2.55 | % |
Public Service Enterprise Group | | | 2.21 | % |
KBR | | | 2.09 | % |
East West Bancorp | | | 1.89 | % |
ITT | | | 1.86 | % |
Hess | | | 1.81 | % |
CMS Energy | | | 1.79 | % |
WEC Energy Group | | | 1.78 | % |
Reinsurance Group of America | | | 1.76 | % |
10
| | |
| Schedule of investments | | |
| Delaware Mid Cap Value Fund | | October 31, 2019 |
| | | | | | | | |
| | | Number of shares | | | Value (US $) | |
Common Stock – 96.60% | | | | | | | | |
Basic Industry – 7.10% | | | | | | | | |
Axalta Coating Systems † | | | 6,450 | | | $ | 190,211 | |
Berry Global Group † | | | 7,151 | | | | 296,838 | |
Celanese | | | 2,600 | | | | 314,990 | |
Chemours | | | 9,750 | | | | 159,997 | |
Graphic Packaging Holding | | | 28,450 | | | | 445,527 | |
Huntsman | | | 14,700 | | | | 325,311 | |
WR Grace & Co. | | | 4,000 | | | | 265,800 | |
| | | | | | | | |
| | | | | | | 1,998,674 | |
| | | | | | | | |
Business Services – 1.96% | | | | | | | | |
Brink’s | | | 4,250 | | | | 361,080 | |
ManpowerGroup | | | 2,100 | | | | 190,932 | |
| | | | | | | | |
| | | | | | | 552,012 | |
| | | | | | | | |
Capital Spending – 10.70% | | | | | | | | |
AECOM † | | | 8,100 | | | | 324,081 | |
Allison Transmission Holdings | | | 4,550 | | | | 198,425 | |
Gates Industrial † | | | 14,650 | | | | 146,500 | |
HD Supply Holdings † | | | 7,050 | | | | 278,757 | |
ITT | | | 8,800 | | | | 523,160 | |
KBR | | | 20,900 | | | | 588,544 | |
Quanta Services | | | 9,500 | | | | 399,475 | |
Spirit AeroSystems Holdings Class A | | | 3,350 | | | | 274,097 | |
United Rentals † | | | 2,100 | | | | 280,497 | |
| | | | | | | | |
| | | | | | | 3,013,536 | |
| | | | | | | | |
Consumer Cyclical – 4.33% | | | | | | | | |
BorgWarner | | | 4,200 | | | | 175,056 | |
DR Horton | | | 5,650 | | | | 295,891 | |
Johnson Controls International | | | 3,518 | | | | 152,435 | |
Mohawk Industries † | | | 1,250 | | | | 179,225 | |
Stanley Black & Decker | | | 2,750 | | | | 416,157 | |
| | | | | | | | |
| | | | | | | 1,218,764 | |
| | | | | | | | |
Consumer Services – 6.67% | | | | | | | | |
Cable One | | | 200 | | | | 265,074 | |
CBS Class B | | | 4,250 | | | | 153,170 | |
Cinemark Holdings | | | 6,200 | | | | 226,920 | |
Darden Restaurants | | | 2,050 | | | | 230,153 | |
Dollar Tree † | | | 2,600 | | | | 287,040 | |
Hasbro | | | 1,500 | | | | 145,965 | |
Marriott International Class A | | | 1,970 | | | | 249,303 | |
PVH | | | 1,750 | | | | 152,530 | |
VF | | | 2,050 | | | | 168,695 | |
| | | | | | | | |
| | | | | | | 1,878,850 | |
| | | | | | | | |
11
Schedule of investments
Delaware Mid Cap Value Fund
| | | | | | | | |
| | | Number of shares | | | Value (US $) | |
Common Stock(continued) | | | | | | | | |
Consumer Staples – 2.48% | | | | | | | | |
Conagra Brands | | | 6,350 | | | $ | 171,767 | |
Tyson Foods Class A | | | 2,850 | | | | 235,952 | |
US Foods Holding † | | | 7,350 | | | | 291,575 | |
| | | | | | | | |
| | | | | | | 699,294 | |
| | | | | | | | |
Energy – 5.27% | | | | | | | | |
Continental Resources | | | 8,750 | | | | 257,863 | |
Encana | | | 48,140 | | | | 189,190 | |
Hess | | | 7,750 | | | | 509,563 | |
Marathon Oil | | | 33,250 | | | | 383,373 | |
Patterson-UTI Energy | | | 17,550 | | | | 146,016 | |
| | | | | | | | |
| | | | | | | 1,486,005 | |
| | | | | | | | |
Financial Services – 21.11% | | | | | | | | |
Affiliated Managers Group | | | 1,800 | | | | 143,784 | |
Allstate | | | 3,350 | | | | 356,507 | |
American Financial Group | | | 4,650 | | | | 483,786 | |
Assurant | | | 2,600 | | | | 327,782 | |
Comerica | | | 7,150 | | | | 467,753 | |
East West Bancorp | | | 12,400 | | | | 532,208 | |
First Hawaiian | | | 11,590 | | | | 316,755 | |
Globe Life | | | 4,675 | | | | 455,018 | |
Hancock Whitney | | | 8,700 | | | | 339,300 | |
Hartford Financial Services Group | | | 6,050 | | | | 345,334 | |
KeyCorp | | | 26,250 | | | | 471,713 | |
Raymond James Financial | | | 8,600 | | | | 718,014 | |
Reinsurance Group of America | | | 3,050 | | | | 495,533 | |
Synchrony Financial | | | 13,950 | | | | 493,411 | |
| | | | | | | | |
| | | | | | | 5,946,898 | |
| | | | | | | | |
Healthcare – 4.57% | | | | | | | | |
AmerisourceBergen | | | 2,150 | | | | 183,567 | |
Becton Dickinson and Co. | | | 550 | | | | 140,800 | |
Quest Diagnostics | | | 2,850 | | | | 288,563 | |
Service Corp. International | | | 5,250 | | | | 238,770 | |
Zimmer Biomet Holdings | | | 3,150 | | | | 435,425 | |
| | | | | | | | |
| | | | | | | 1,287,125 | |
| | | | | | | | |
Real Estate Investment Trusts – 10.72% | | | | | | | | |
Apartment Investment & Management Class A | | | 7,052 | | | | 387,014 | |
Brandywine Realty Trust | | | 18,800 | | | | 287,264 | |
Equity Residential | | | 3,250 | | | | 288,145 | |
Highwoods Properties | | | 6,200 | | | | 290,160 | |
Host Hotels & Resorts | | | 19,500 | | | | 319,605 | |
Kimco Realty | | | 16,100 | | | | 347,116 | |
Life Storage | | | 3,550 | | | | 386,666 | |
12
| | | | | | | | |
| | | Number of shares | | | Value (US $) | |
Common Stock(continued) | | | | | | | | |
Real Estate Investment Trusts(continued) | | | | | | | | |
VEREIT | | | 43,850 | | | $ | 431,484 | |
Welltower | | | 3,100 | | | | 281,139 | |
| | | | | | | | |
| | | | | | | 3,018,593 | |
| | | | | | | | |
Technology – 11.81% | | | | | | | | |
Agilent Technologies | | | 4,050 | | | | 306,787 | |
Avnet | | | 7,300 | | | | 288,788 | |
Citrix Systems | | | 750 | | | | 81,645 | |
DXC Technology | | | 2,500 | | | | 69,175 | |
Fiserv † | | | 2,350 | | | | 249,429 | |
Flex † | | | 24,750 | | | | 290,813 | |
Keysight Technologies † | | | 3,925 | | | | 396,072 | |
ON Semiconductor † | | | 7,050 | | | | 143,820 | |
Qorvo † | | | 2,100 | | | | 169,806 | |
Synopsys † | | | 5,850 | | | | 794,136 | |
Teradyne | | | 7,500 | | | | 459,150 | |
Western Digital | | | 1,500 | | | | 77,475 | |
| | | | | | | | |
| | | | | | | 3,327,096 | |
| | | | | | | | |
Transportation – 2.45% | | | | | | | | |
CSX | | | 2,050 | | | | 144,053 | |
JB Hunt Transport Services | | | 2,350 | | | | 276,266 | |
Southwest Airlines | | | 4,800 | | | | 269,424 | |
| | | | | | | | |
| | | | | | | 689,743 | |
| | | | | | | | |
Utilities – 7.43% | | | | | | | | |
CMS Energy | | | 7,900 | | | | 504,968 | |
Edison International | | | 4,000 | | | | 251,600 | |
MDU Resources Group | | | 7,400 | | | | 213,786 | |
Public Service Enterprise Group | | | 9,850 | | | | 623,603 | |
WEC Energy Group | | | 5,300 | | | | 500,320 | |
| | | | | | | | |
| | | | | | | 2,094,277 | |
| | | | | | | | |
Total Common Stock(cost $23,009,799) | | | | | | | 27,210,867 | |
| | | | | | | | |
| | | | | | | | | |
Short-Term Investments – 3.04% | | | | | | | | |
Money Market Mutual Funds – 3.04% | | | | | | | | |
BlackRock FedFund – Institutional Shares(seven-day effective yield 1.72%) | | | 171,236 | | | | 171,243 | |
Fidelity Investments Money Market Government Portfolio – Class I(seven-day effective
yield 1.72%) | | | 171,236 | | | | 171,243 | |
GS Financial Square Government Fund – Institutional Shares(seven-day effective
yield 1.71%) | | | 171,236 | | | | 171,242 | |
Morgan Stanley Government Portfolio – Institutional Share Class(seven-day effective
yield 1.72%) | | | 171,236 | | | | 171,242 | |
13
Schedule of investments
Delaware Mid Cap Value Fund
| | | | | | | | |
| | | Number of shares | | | Value (US $) | |
Short-Term Investments(continued) | | | | | | | | |
Money Market Mutual Funds(continued) | | | | | | | | |
State Street Institutional US Government Money Market Fund – Investor Class
(seven-day effective yield 1.67%) | | | 171,236 | | | $ | 171,240 | |
| | | | | | | | |
Total Short-Term Investments(cost $856,210) | | | | | | | 856,210 | |
| | | | | | | | |
| | |
Total Value of Securities – 99.64%
(cost $23,866,009) | | | | | | $ | 28,067,077 | |
| | | | | | | | |
† Non-income producing security.
GS – Goldman Sachs
See accompanying notes, which are an integral part of the financial statements.
14
This page intentionally left blank.
| | |
| Statement of assets and liabilities | | |
| Delaware Mid Cap Value Fund | | October 31, 2019 |
| | | | |
Assets: | | | | |
Investments, at value1 | | $ | 28,067,077 | |
Receivable for fund shares sold | | | 141,798 | |
Receivable from investment manager | | | 20,239 | |
Dividends and interest receivable | | | 13,920 | |
| | | | |
Total assets | | | 28,243,034 | |
| | | | |
Liabilities: | | | | |
Payable for fund shares redeemed | | | 36,267 | |
Reports and statements to shareholders expenses payable | | | 14,201 | |
Accounting and administration expenses payable | | | 11,454 | |
Audit and tax fees payable | | | 4,750 | |
Other accrued expenses | | | 4,412 | |
Distribution fees payable to affiliates | | | 3,717 | |
Accounting and administration expenses payable to affiliates | | | 418 | |
Dividend disbursing and transfer agent fees and expenses payable to affiliates | | | 209 | |
Trustees’ fees and expenses payable to affiliates | | | 86 | |
Legal fees payable to affiliates | | | 41 | |
Reports and statements to shareholders expenses payable to affiliates | | | 28 | |
| | | | |
Total liabilities | | | 75,583 | |
| | | | |
Total Net Assets | | $ | 28,167,451 | |
| | | | |
| |
Net Assets Consist of: | | | | |
Paid-in capital | | $ | 24,354,347 | |
Total distributable earnings (loss) | | | 3,813,104 | |
| | | | |
Total Net Assets | | $ | 28,167,451 | |
| | | | |
16
| | | | |
Net Asset Value | | | | |
Class A: | | | | |
Net assets | | $ | 9,757,652 | |
Shares of beneficial interest outstanding, unlimited authorization, no par | | | 1,555,010 | |
Net asset value per share | | $ | 6.27 | |
Sales charge | | | 5.75 | % |
Offering price per share, equal to net asset value per share / (1 – sales charge) | | $ | 6.65 | |
| |
Class C: | | | | |
Net assets | | $ | 1,994,048 | |
Shares of beneficial interest outstanding, unlimited authorization, no par | | | 345,008 | |
Net asset value per share | | $ | 5.78 | |
| |
Class R: | | | | |
Net assets | | $ | 225,386 | |
Shares of beneficial interest outstanding, unlimited authorization, no par | | | 36,059 | |
Net asset value per share | | $ | 6.25 | |
| |
Institutional Class: | | | | |
Net assets | | $ | 16,190,365 | |
Shares of beneficial interest outstanding, unlimited authorization, no par | | | 2,576,747 | |
Net asset value per share | | $ | 6.28 | |
| | | | |
1Investments, at cost | | $ | 23,866,009 | |
See accompanying notes, which are an integral part of the financial statements.
17
| | |
| Statement of operations |
| Delaware Mid Cap Value Fund | | Year ended October 31, 2019 |
| | | | |
Investment Income: | | | | |
Dividends | | $ | 393,702 | |
Interest | | | 6,277 | |
Foreign tax withheld | | | (395 | ) |
| | | | |
| | | 399,584 | |
| | | | |
| |
Expenses: | | | | |
Management fees | | | 192,160 | |
Distribution expenses – Class A | | | 25,216 | |
Distribution expenses – Class C | | | 18,036 | |
Distribution expenses – Class R | | | 803 | |
Registration fees | | | 82,773 | |
Accounting and administration expenses | | | 44,955 | |
Audit and tax fees | | | 35,909 | |
Reports and statements to shareholders expenses | | | 31,350 | |
Dividend disbursing and transfer agent fees and expenses | | | 30,789 | |
Legal fees | | | 27,726 | |
Custodian fees | | | 4,049 | |
Trustees’ fees and expenses | | | 1,517 | |
Other | | | 12,070 | |
| | | | |
| | | 507,353 | |
Less expenses waived | | | (227,007 | ) |
Less expenses paid indirectly | | | (119 | ) |
| | | | |
Total operating expenses | | | 280,227 | |
| | | | |
Net Investment Income | | | 119,357 | |
| | | | |
| |
Net Realized and Unrealized Gain (Loss): | | | | |
Net realized loss on investments | | | (362,892 | ) |
Net change in unrealized appreciation (depreciation) of investments | | | 2,800,401 | |
| | | | |
Net Realized and Unrealized Gain | | | 2,437,509 | |
| | | | |
Net Increase in Net Assets Resulting from Operations | | $ | 2,556,866 | |
| | | | |
See accompanying notes, which are an integral part of the financial statements.
18
This page intentionally left blank.
Statements of changes in net assets
Delaware Mid Cap Value Fund
| | | | | | | | |
| | | Year ended | |
| | | 10/31/19 | | | 10/31/18 | |
Increase (Decrease) in Net Assets from Operations: | | | | | | | | |
Net investment income | | $ | 119,357 | | | $ | 61,872 | |
Net realized gain (loss) | | | (362,892 | ) | | | 785,208 | |
Net change in unrealized appreciation (depreciation) | | | 2,800,401 | | | | (2,290,869 | ) |
| | | | | | | | |
Net increase (decrease) in net assets resulting from operations | | | 2,556,866 | | | | (1,443,789 | ) |
| | | | | | | | |
| | |
Dividends and Distributions to Shareholders from: | | | | | | | | |
Distributable earnings: | | | | | | | | |
Class A | | | (359,413 | ) | | | (101,564 | ) |
Class C | | | (62,367 | ) | | | (16,073 | ) |
Class R | | | (3,529 | ) | | | (799 | ) |
Institutional Class | | | (441,142 | ) | | | (43,609 | ) |
| | | | | | | | |
| | | (866,451 | ) | | | (162,045 | ) |
| | | | | | | | |
| | |
Capital Share Transactions: | | | | | | | | |
Proceeds from shares sold: | | | | | | | | |
Class A | | | 2,315,806 | | | | 5,266,481 | |
Class C | | | 979,105 | | | | 856,578 | |
Class R | | | 210,211 | | | | 70,304 | |
Institutional Class | | | 8,766,238 | | | | 7,993,689 | |
| | |
Net asset value of shares issued upon reinvestment of dividends and distributions: | | | | | | | | |
Class A | | | 356,575 | | | | 100,480 | |
Class C | | | 62,156 | | | | 16,002 | |
Class R | | | 3,529 | | | | 799 | |
Institutional Class | | | 331,383 | | | | 34,050 | |
| | | | | | | | |
| | | 13,025,003 | | | | 14,338,383 | |
| | | | | | | | |
20
| | | | | | | | |
| | | Year ended | |
| | | 10/31/19 | | | 10/31/18 | |
Capital Share Transactions (continued): | | | | | | | | |
Cost of shares redeemed: | | | | | | | | |
Class A | | $ | (3,916,884 | ) | | $ | (2,157,578 | ) |
Class C | | | (988,329 | ) | | | (537,857 | ) |
Class R | | | (42,901 | ) | | | (50,491 | ) |
Institutional Class | | | (3,666,585 | ) | | | (615,545 | ) |
| | | | | | | | |
| | | (8,614,699 | ) | | | (3,361,471 | ) |
| | | | | | | | |
Increase in net assets derived from capital share transactions | | | 4,410,304 | | | | 10,976,912 | |
| | | | | | | | |
Net Increase in Net Assets | | | 6,100,719 | | | | 9,371,078 | |
| | |
Net Assets: | | | | | | | | |
Beginning of year | | $ | 22,066,732 | | | $ | 12,695,654 | |
| | | | | | | | |
End of year | | $ | 28,167,451 | | | $ | 22,066,732 | |
| | | | | | | | |
See accompanying notes, which are an integral part of the financial statements.
21
Financial highlights
Delaware Mid Cap Value Fund Class A
Selected data for each share of the Fund outstanding throughout each period were as follows:
|
Net asset value, beginning of period |
|
Income (loss) from investment operations: |
Net investment income1 |
Net realized and unrealized gain (loss) |
Total from investment operations |
|
Less dividends and distributions from: |
Net investment income |
Net realized gain |
Total dividends and distributions |
|
Net asset value, end of period |
|
Total return2 |
|
Ratios and supplemental data: |
Net assets, end of period (000 omitted) |
Ratio of expenses to average net assets |
Ratio of expenses to average net assets prior to fees waived |
Ratio of net investment income to average net assets |
Ratio of net investment loss to average net assets prior to fees waived |
Portfolio turnover |
| 1 | The average shares outstanding method has been applied for per share information. |
| 2 | Total return is based on the change in net asset value of a share during the period and assumes reinvestment of dividends and distributions at net asset value and does not reflect the impact of a sales charge. Total return during all of the periods shown reflects waivers by the manager and/or distributor. Performance would have been lower had the waivers not been in effect. |
| 3 | As a result of proxy fees, ratio of expenses to average net assets for the year ended Oct. 31, 2015, exceeded the contractual waiver by 15 basis points. |
See accompanying notes, which are an integral part of the financial statements.
22
| | | | | | | | | | | | | | | | | | | | | | | | | | | | | | | | | | | | |
| | | Year ended | |
| | | 10/31/19 | | | | | | 10/31/18 | | | | | | 10/31/17 | | | | | | 10/31/16 | | | | | | 10/31/15 | |
| |
| | | | | | | | | |
| | $ | 5.94 | | | | | | | $ | 6.23 | | | | | | | $ | 5.09 | | | | | | | $ | 5.22 | | | | | | | $ | 6.22 | |
| | | | | | | | | |
| | | 0.02 | | | | | | | | 0.03 | | | | | | | | 0.02 | | | | | | | | 0.04 | | | | | | | | 0.02 | |
| | | 0.52 | | | | | | | | (0.24 | ) | | | | | | | 1.20 | | | | | | | | 0.13 | | | | | | | | 0.21 | |
| | | | | | | | | | | | | | | | | | | | | | | | | | | | | | | | | | | | |
| | | 0.54 | | | | | | | | (0.21 | ) | | | | | | | 1.22 | | | | | | | | 0.17 | | | | | | | | 0.23 | |
| | | | | | | | | | | | | | | | | | | | | | | | | | | | | | | | | | | | |
| | | | | | | | | |
| | | (0.02 | ) | | | | | | | (0.02 | ) | | | | | | | (0.03 | ) | | | | | | | (0.01 | ) | | | | | | | (0.02 | ) |
| | | (0.19 | ) | | | | | | | (0.06 | ) | | | | | | | (0.05 | ) | | | | | | | (0.29 | ) | | | | | | | (1.21 | ) |
| | | | | | | | | | | | | | | | | | | | | | | | | | | | | | | | | | | | |
| | | (0.21 | ) | | | | | | | (0.08 | ) | | | | | | | (0.08 | ) | | | | | | | (0.30 | ) | | | | | | | (1.23 | ) |
| | | | | | | | | | | | | | | | | | | | | | | | | | | | | | | | | | | | |
| | | | | | | | | |
| | $ | 6.27 | | | | | | | $ | 5.94 | | | | | | | $ | 6.23 | | | | | | | $ | 5.09 | | | | | | | $ | 5.22 | |
| | | | | | | | | | | | | | | | | | | | | | | | | | | | | | | | | | | | |
| | | | | | | | | |
| | | 9.99% | | | | | | | | (3.45% | ) | | | | | | | 24.17% | | | | | | | | 3.78% | | | | | | | | 4.27% | |
| | | | | | | | | |
| | $ | 9,758 | | | | | | | $ | 10,377 | | | | | | | $ | 7,887 | | | | | | | $ | 4,795 | | | | | | | $ | 3,825 | |
| | | 1.17% | | | | | | | | 1.25% | | | | | | | | 1.25% | | | | | | | | 1.25% | | | | | | | | 1.40% | 3 |
| | | | | | | | | |
| | | 2.06% | | | | | | | | 2.34% | | | | | | | | 2.86% | | | | | | | | 4.10% | | | | | | | | 4.09% | |
| | | 0.39% | | | | | | | | 0.40% | | | | | | | | 0.42% | | | | | | | | 0.71% | | | | | | | | 0.31% | |
| | | | | | | | | |
| | | (0.50% | ) | | | | | | | (0.69% | ) | | | | | | | (1.19% | ) | | | | | | | (2.14% | ) | | | | | | | (2.38% | ) |
| | | 12% | | | | | | | | 20% | | | | | | | | 24% | | | | | | | | 49% | | | | | | | | 25% | |
| |
23
Financial highlights
Delaware Mid Cap Value Fund Class C
Selected data for each share of the Fund outstanding throughout each period were as follows:
|
Net asset value, beginning of period |
|
Income (loss) from investment operations: |
Net investment income (loss)1 |
Net realized and unrealized gain (loss) |
Total from investment operations |
|
Less dividends and distributions from: |
Net realized gain |
Total dividends and distributions |
|
Net asset value, end of period |
|
Total return3 |
|
Ratios and supplemental data: |
Net assets, end of period (000 omitted) |
Ratio of expenses to average net assets |
Ratio of expenses to average net assets prior to fees waived |
Ratio of net investment loss to average net assets |
Ratio of net investment loss to average net assets prior to fees waived |
Portfolio turnover |
| 1 | The average shares outstanding method has been applied for per share information. |
| 2 | Amount is less than $0.005 per share. |
| 3 | Total return is based on the change in net asset value of a share during the period and assumes reinvestment of dividends and distributions at net asset value and does not reflect the impact of a sales charge. Total return during all of the periods shown reflects a waiver by the manager. Performance would have been lower had the waiver not been in effect. |
| 4 | As a result of proxy fees, ratio of expenses to average net assets for the year ended Oct. 31, 2015, exceeded the contractual waiver by 15 basis points. |
See accompanying notes, which are an integral part of the financial statements.
24
| | | | | | | | | | | | | | | | | | | | | | | | | | | | | | | | | | | | |
| | | Year ended | |
| | | 10/31/19 | | | | | | 10/31/18 | | | | | | 10/31/17 | | | | | | 10/31/16 | | | | | | 10/31/15 | |
| |
| | $ | 5.51 | | | | | | | $ | 5.81 | | | | | | | $ | 4.76 | | | | | | | $ | 4.93 | | | | | | | $ | 5.96 | |
| | | | | | | | | |
| | | (0.02 | )2 | | | | | | | (0.02 | ) | | | | | | | (0.02 | ) | | | | | | | — | 2 | | | | | | | (0.02 | ) |
| | | 0.48 | | | | | | | | (0.22 | ) | | | | | | | 1.12 | | | | | | | | 0.12 | | | | | | | | 0.20 | |
| | | | | | | | | | | | | | | | | | | | | | | | | | | | | | | | | | | | |
| | | 0.46 | | | | | | | | (0.24 | ) | | | | | | | 1.10 | | | | | | | | 0.12 | | | | | | | | 0.18 | |
| | | | | | | | | | | | | | | | | | | | | | | | | | | | | | | | | | | | |
| | | | | | | | | |
| | | (0.19 | ) | | | | | | | (0.06 | ) | | | | | | | (0.05 | ) | | | | | | | (0.29 | ) | | | | | | | (1.21 | ) |
| | | | | | | | | | | | | | | | | | | | | | | | | | | | | | | | | | | | |
| | | (0.19 | ) | | | | | | | (0.06 | ) | | | | | | | (0.05 | ) | | | | | | | (0.29 | ) | | | | | | | (1.21 | ) |
| | | | | | | | | | | | | | | | | | | | | | | | | | | | | | | | | | | | |
| | | | | | | | | |
| | $ | 5.78 | | | | | | | $ | 5.51 | | | | | | | $ | 5.81 | | | | | | | $ | 4.76 | | | | | | | $ | 4.93 | |
| | | | | | | | | | | | | | | | | | | | | | | | | | | | | | | | | | | | |
| | | | | | | | | |
| | | 9.25% | | | | | | | | (4.26% | ) | | | | | | | 23.30% | | | | | | | | 2.95% | | | | | | | | 3.53% | |
| | | | | | | | | |
| | $ | 1,994 | | | | | | | $ | 1,837 | | | | | | | $ | 1,619 | | | | | | | $ | 1,206 | | | | | | | $ | 1,084 | |
| | | 1.92% | | | | | | | | 2.00% | | | | | | | | 2.00% | | | | | | | | 2.00% | | | | | | | | 2.15% | 4 |
| | | | | | | | | |
| | | 2.81% | | | | | | | | 3.09% | | | | | | | | 3.61% | | | | | | | | 4.85% | | | | | | | | 4.84% | |
| | | (0.36% | ) | | | | | | | (0.35% | ) | | | | | | | (0.33% | ) | | | | | | | (0.04% | ) | | | | | | | (0.44% | ) |
| | | | | | | | | |
| | | (1.25% | ) | | | | | | | (1.44% | ) | | | | | | | (1.94% | ) | | | | | | | (2.89% | ) | | | | | | | (3.13% | ) |
| | | 12% | | | | | | | | 20% | | | | | | | | 24% | | | | | | | | 49% | | | | | | | | 25% | |
| |
25
Financial highlights
Delaware Mid Cap Value Fund Class R
Selected data for each share of the Fund outstanding throughout each period were as follows:
|
Net asset value, beginning of period |
|
Income (loss) from investment operations: |
Net investment income1 |
Net realized and unrealized gain (loss) |
Total from investment operations |
|
Less dividends and distributions from: |
Net investment income |
Net realized gain |
Total dividends and distributions |
|
Net asset value, end of period |
|
Total return4 |
|
Ratios and supplemental data: |
Net assets, end of period (000 omitted) |
Ratio of expenses to average net assets |
Ratio of expenses to average net assets prior to fees waived |
Ratio of net investment income to average net assets |
Ratio of net investment loss to average net assets prior to fees waived |
|
Portfolio turnover |
| 1 | The average shares outstanding method has been applied for per share information. |
| 2 | Amount is less than $0.005 per share. |
| 3 | For the year ended Oct. 31, 2015, net investment income distributions of $7 were made by the Fund’s Class R shares, which calculated to an amount of $(0.001) per share. |
| 4 | Total return is based on the change in net asset value of a share during the period and assumes reinvestment of dividends and distributions at net asset value. Total return during all of the periods shown reflects waivers by the manager and/or the distributor. Performance would have been lower had the waivers not been in effect. |
| 5 | As a result of proxy fees, ratio of expenses to average net assets for the year ended Oct. 31, 2015, exceeded the contractual waiver by 15 basis points. |
See accompanying notes, which are an integral part of the financial statements.
26
| | | | | | | | | | | | | | | | | | | | | | | | | | | | | | | | | | | | |
| | | Year ended | |
| | | 10/31/19 | | | | | | 10/31/18 | | | | | | 10/31/17 | | | | | | 10/31/16 | | | | | | 10/31/15 | |
| |
| | $ | 5.93 | | | | | | | $ | 6.22 | | | | | | | $ | 5.08 | | | | | | | $ | 5.22 | | | | | | | $ | 6.21 | |
| | | | | | | | | |
| | | 0.01 | | | | | | | | 0.01 | | | | | | | | 0.01 | | | | | | | | 0.02 | | | | | | | | — | 2 |
| | | 0.51 | | | | | | | | (0.23 | ) | | | | | | | 1.20 | | | | | | | | 0.13 | | | | | | | | 0.22 | |
| | | | | | | | | | | | | | | | | | | | | | | | | | | | | | | | | | | | |
| | | 0.52 | | | | | | | | (0.22 | ) | | | | | | | 1.21 | | | | | | | | 0.15 | | | | | | | | 0.22 | |
| | | | | | | | | | | | | | | | | | | | | | | | | | | | | | | | | | | | |
| | | | | | | | | |
| | | (0.01 | ) | | | | | | | (0.01 | ) | | | | | | | (0.02 | ) | | | | | | | — | | | | | | | | — | 3 |
| | | (0.19 | ) | | | | | | | (0.06 | ) | | | | | | | (0.05 | ) | | | | | | | (0.29 | ) | | | | | | | (1.21 | ) |
| | | | | | | | | | | | | | | | | | | | | | | | | | | | | | | | | | | | |
| | | (0.20 | ) | | | | | | | (0.07 | ) | | | | | | | (0.07 | ) | | | | | | | (0.29 | ) | | | | | | | (1.21 | ) |
| | | | | | | | | | | | | | | | | | | | | | | | | | | | | | | | | | | | |
| | | | | | | | | |
| | $ | 6.25 | | | | | | | $ | 5.93 | | | | | | | $ | 6.22 | | | | | | | $ | 5.08 | | | | | | | $ | 5.22 | |
| | | | | | | | | | | | | | | | | | | | | | | | | | | | | | | | | | | | |
| | | | | | | | | |
| | | 9.69% | | | | | | | | (3.66% | ) | | | | | | | 23.96% | | | | | | | | 3.39% | | | | | | | | 4.14% | |
| | | | | | | | | |
| | $ | 225 | | | | | | | $ | 49 | | | | | | | $ | 31 | | | | | | | $ | 55 | | | | | | | $ | 34 | |
| | | 1.42% | | | | | | | | 1.50% | | | | | | | | 1.50% | | | | | | | | 1.50% | | | | | | | | 1.65% | 5 |
| | | | | | | | | |
| | | 2.31% | | | | | | | | 2.59% | | | | | | | | 3.11% | | | | | | | | 4.35% | | | | | | | | 4.34% | |
| | | 0.14% | | | | | | | | 0.15% | | | | | | | | 0.17% | | | | | | | | 0.46% | | | | | | | | 0.06% | |
| | | | | | | | | |
| | | (0.75% | ) | | | | | | | (0.94% | ) | | | | | | | (1.44% | ) | | | | | | | (2.39% | ) | | | | | | | (2.63% | ) |
| | | 12% | | | | | | | | 20% | | | | | | | | 24% | | | | | | | | 49% | | | | | | | | 25% | |
| |
27
Financial highlights
Delaware Mid Cap Value Fund Institutional Class
Selected data for each share of the Fund outstanding throughout each period were as follows:
|
Net asset value, beginning of period |
|
Income (loss) from investment operations: |
Net investment income1 |
Net realized and unrealized gain (loss) |
Total from investment operations |
|
Less dividends and distributions from: |
Net investment income |
Net realized gain |
Total dividends and distributions |
|
Net asset value, end of period |
|
Total return2 |
|
Ratios and supplemental data: |
Net assets, end of period (000 omitted) |
Ratio of expenses to average net assets |
Ratio of expenses to average net assets prior to fees waived |
Ratio of net investment income to average net assets |
Ratio of net investment loss to average net assets prior to fees waived |
Portfolio turnover |
| 1 | The average shares outstanding method has been applied for per share information. |
| 2 | Total return is based on the change in net asset value of a share during the period and assumes reinvestment of dividends and distributions at net asset value. Total return during all of the periods shown reflects a waiver by the manager. Performance would have been lower had the waiver not been in effect. |
| 3 | As a result of proxy fees, ratio of expenses to average net assets for the year ended Oct. 31, 2015, exceeded the contractual waiver by 15 basis points. |
See accompanying notes, which are an integral part of the financial statements.
28
| | | | | | | | | | | | | | | | | | | | | | | | | | | | | | | | | | | | |
| | | Year ended | |
| | | 10/31/19 | | | | | | 10/31/18 | | | | | | 10/31/17 | | | | | | 10/31/16 | | | | | | 10/31/15 | |
| |
| | $ | 5.95 | | | | | | | $ | 6.24 | | | | | | | $ | 5.10 | | | | | | | $ | 5.23 | | | | | | | $ | 6.23 | |
| | | | | | | | | |
| | | 0.04 | | | | | | | | 0.04 | | | | | | | | 0.04 | | | | | | | | 0.05 | | | | | | | | 0.03 | |
| | | 0.51 | | | | | | | | (0.23 | ) | | | | | | | 1.19 | | | | | | | | 0.13 | | | | | | | | 0.21 | |
| | | | | | | | | | | | | | | | | | | | | | | | | | | | | | | | | | | | |
| | | 0.55 | | | | | | | | (0.19 | ) | | | | | | | 1.23 | | | | | | | | 0.18 | | | | | | | | 0.24 | |
| | | | | | | | | | | | | | | | | | | | | | | | | | | | | | | | | | | | |
| | | | | | | | | |
| | | (0.03 | ) | | | | | | | (0.04 | ) | | | | | | | (0.04 | ) | | | | | | | (0.02 | ) | | | | | | | (0.03 | ) |
| | | (0.19 | ) | | | | | | | (0.06 | ) | | | | | | | (0.05 | ) | | | | | | | (0.29 | ) | | | | | | | (1.21 | ) |
| | | | | | | | | | | | | | | | | | | | | | | | | | | | | | | | | | | | |
| | | (0.22 | ) | | | | | | | (0.10 | ) | | | | | | | (0.09 | ) | | | | | | | (0.31 | ) | | | | | | | (1.24 | ) |
| | | | | | | | | | | | | | | | | | | | | | | | | | | | | | | | | | | | |
| | | | | | | | | |
| | $ | 6.28 | | | | | | | $ | 5.95 | | | | | | | $ | 6.24 | | | | | | | $ | 5.10 | | | | | | | $ | 5.23 | |
| | | | | | | | | | | | | | | | | | | | | | | | | | | | | | | | | | | | |
| | | | | | | | | |
| | | 10.29% | | | | | | | | (3.21% | ) | | | | | | | 24.42% | | | | | | | | 4.05% | | | | | | | | 4.55% | |
| | | | | | | | | |
| | $ | 16,190 | | | | | | | $ | 9,804 | | | | | | | $ | 3,159 | | | | | | | $ | 1,310 | | | | | | | $ | 1,059 | |
| | | 0.92% | | | | | | | | 1.00% | | | | | | | | 1.00% | | | | | | | | 1.00% | | | | | | | | 1.15% | 3 |
| | | | | | | | | |
| | | 1.81% | | | | | | | | 2.09% | | | | | | | | 2.61% | | | | | | | | 3.85% | | | | | | | | 3.84% | |
| | | 0.64% | | | | | | | | 0.65% | | | | | | | | 0.67% | | | | | | | | 0.96% | | | | | | | | 0.56% | |
| | | | | | | | | |
| | | (0.25% | ) | | | | | | | (0.44% | ) | | | | | | | (0.94% | ) | | | | | | | (1.89% | ) | | | | | | | (2.13% | ) |
| | | 12% | | | | | | | | 20% | | | | | | | | 24% | | | | | | | | 49% | | | | | | | | 25% | |
| |
29
| | |
| Notes to financial statements | | |
| Delaware Mid Cap Value Fund | | October 31, 2019 |
Delaware Group® Equity Funds I (Trust) is organized as a Delaware statutory trust and offers one series: Delaware Mid Cap Value Fund (Fund). The Fund is anopen-end investment company. The Fund is considered diversified under the Investment Company Act of 1940, as amended, and offers Class A, Class C, Class R, and Institutional Class shares. Class A shares are sold with a maximumfront-end sales charge of 5.75%. Class A share purchases of $1,000,000 or more will incur a contingent deferred sales charge (CDSC) instead of afront-end sales charge of 1.00%, if redeemed during the first year and 0.50% during the second year, provided that Delaware Distributors, L.P. (DDLP) paid a financial advisor a commission on the purchase of those shares. Class C shares are sold with a CDSC of 1.00%, which will be incurred if redeemed during the first 12 months. Class R and Institutional Class shares are not subject to a sales charge and are offered for sale exclusively to certain eligible investors.
The investment objective of the Fund is to seek capital appreciation.
1. Significant Accounting Policies
The Fund follows accounting and reporting guidance under Financial Accounting Standards Board (FASB) Accounting Standards Codification Topic 946, Financial Services – Investment Companies. The following accounting policies are in accordance with US generally accepted accounting principles (US GAAP) and are consistently followed by the Fund.
Security Valuation– Equity securities, except those traded on the Nasdaq Stock Market LLC (Nasdaq), are valued at the last quoted sales price as of the time of the regular close of the New York Stock Exchange on the valuation date. Equity securities traded on the Nasdaq are valued in accordance with the Nasdaq Official Closing Price, which may not be the last sales price. If, on a particular day, an equity security does not trade, the mean between the bid and ask prices will be used, which approximates fair value. Equity securities listed on a foreign exchange are normally valued at the last quoted sales price on the valuation date. US government and agency securities are valued at the mean between the bid and ask prices, which approximates fair value.Open-end investment companies are valued at their published net asset value (NAV). Generally, other securities and assets for which market quotations are not readily available are valued at fair value as determined in good faith under the direction of the Trust’s Board of Trustees (Board). In determining whether market quotations are readily available or fair valuation will be used, various factors will be taken into consideration, such as market closures or suspension of trading in a security. Restricted securities are valued at fair value using methods approved by the Board.
Federal and Foreign Income Taxes– No provision for federal income taxes has been made as the Fund intends to continue to qualify for federal income tax purposes as a regulated investment company under Subchapter M of the Internal Revenue Code of 1986, as amended, and make the requisite distributions to shareholders. The Fund evaluates tax positions taken or expected to be taken in the course of preparing the Fund’s tax returns to determine whether the tax positions are“more-likely-than-not” of being sustained by the applicable tax authority. Tax positions not deemed to meet the“more-likely-than-not” threshold are recorded as a tax benefit or expense in the current year. Management has analyzed the Fund’s tax positions taken or expected to be taken on the Fund’s federal income tax returns through the year ended Oct. 31, 2019 and for all open tax years (years ended Oct. 31, 2016–Oct. 31, 2018), and has concluded that no provision for federal income tax is required in the Fund’s financial statements. If applicable, the Fund recognizes interest accrued on unrecognized tax
30
benefits in interest expense and penalties in “Other expenses” on the “Statement of operations.” During the year ended Oct. 31, 2019, the Fund did not incur any interest or tax penalties. In regard to foreign taxes only, the Fund has open tax years in certain foreign countries in which it invests that may date back to the inception of the Fund.
Class Accounting– Investment income, common expenses, and realized and unrealized gain (loss) on investments are allocated to the various classes of the Fund on the basis of daily net assets of each class. Distribution expenses relating to a specific class are charged directly to that class.
Repurchase Agreements– The Fund may purchase certain US government securities subject to the counterparty’s agreement to repurchase them at an agreed upon date and price. The counterparty will be required on a daily basis to maintain the value of the collateral subject to the agreement at not less than the repurchase price (including accrued interest). The agreements are conditioned upon the collateral being deposited under the Federal Reserve book-entry system with the Fund’s custodian or a third-partysub-custodian. In the event of default or bankruptcy by the other party to the agreement, retention of the collateral may be subject to legal proceedings. All open repurchase agreements as of the date of this report were entered into on April 30, 2019, and matured on the next business day. At Oct. 31, 2019, the Fund held no investments in repurchase agreements.
Use of Estimates– The preparation of financial statements in conformity with US GAAP requires management to make estimates and assumptions that affect the fair value of investments, the reported amounts of assets and liabilities and disclosure of contingent assets and liabilities at the date of the financial statements, and the reported amounts of revenues and expenses during the reporting period. Actual results could differ from those estimates and the differences could be material.
Other– Expenses directly attributable to the Fund are charged directly to the Fund. Other expenses common to various funds within the Delaware Funds® by Macquarie (Delaware Funds) are generally allocated among such funds on the basis of average net assets. Management fees and certain other expenses are paid monthly. Security transactions are recorded on the date the securities are purchased or sold (trade date) for financial reporting purposes. Costs used in calculating realized gains and losses on the sale of investment securities are those of the specific securities sold. Dividend income is recorded on theex-dividend date and interest income is recorded on the accrual basis. Discounts and premiums on debt securities are accreted or amortized to interest income, respectively, over the lives of the respective securities using the effective interest method. Realized gain (losses) on paydowns of asset- and mortgage-backed securities are classified as interest income. Distributions received from investments in real estate investment trusts (REITs) are recorded as dividend income on theex-dividend date, subject to reclassification upon notice of the character of such distributions by the issuer. The financial statements reflect an estimate of the reclassification of the distribution character. Foreign dividends are also recorded on theex-dividend date or as soon after theex-dividend date that the Fund is aware of such dividends, net of all tax withholdings, a portion of which may be reclaimable. Withholding taxes and reclaims on foreign dividends have been recorded in accordance with the Fund’s understanding of the applicable country’s tax rules and rates. The Fund will accrue such taxes as applicable based upon current interpretations of the tax rules and regulations that exist in the markets in which it invests. The Fund declares and pays dividends from net investment income and distributions
31
Notes to financial statements
Delaware Mid Cap Value Fund
1. Significant Accounting Policies (continued)
from net realized gain on investments, if any, annually. The Fund may distribute more frequently, if necessary for tax purposes. Dividends and distributions, if any, are recorded on theex-dividend date.
The Fund receives earnings credits from its custodian when positive cash balances are maintained, which may be used to offset custody fees. The expenses paid under this arrangement are included on the “Statement of operations” under “Custodian fees” with the corresponding expenses offset included under “Less expenses paid indirectly.” For the year ended Oct. 31, 2019, the Fund earned $41 under this arrangement.
The Fund receives earnings credits from its transfer agent when positive cash balances are maintained, which may be used to offset transfer agent fees. If the amount earned is greater than $1, the expenses paid under this arrangement are included on the “Statement of operations” under “Dividend disbursing and transfer agent fees and expenses” with the corresponding expenses offset included under “Less expenses paid indirectly.” For the year ended Oct. 31, 2019, the Fund earned $78 under this arrangement.
2. Investment Management, Administration Agreements, and Other Transactions with Affiliates
In accordance with the terms of its investment management agreement, the Fund pays Delaware Management Company (DMC), a series of Macquarie Investment Management Business Trust and the investment manager, an annual fee which is calculated daily and paid monthly at the rates of 0.75% on the first $500 million of average daily net assets of the Fund, 0.70% on the next $500 million, 0.65% on the next $1.5 billion, and 0.60% on average daily net assets in excess of $2.5 billion.
Effective Feb. 28, 2019, DMC has contractually agreed to waive all or a portion, if any, of its management fee and/or pay/reimburse the Fund to the extent necessary to ensure total annual operating expenses (excluding any distribution and service(12b-1) fees, acquired fund fees and expenses, taxes, interest, short sale dividend and interest expenses, brokerage fees, certain insurance costs, and nonroutine expenses or costs, including, but not limited to, those relating to reorganizations, litigation, conducting shareholder meetings, and liquidations) do not exceed 0.89% of the Fund’s average daily net assets through Oct. 31, 2019.* Prior to Feb. 28, 2019, DMC has contractually agreed to waive all or a portion, if any, of its management fee and/or pay/reimburse the Fund to the extent necessary to ensure total annual operating expenses do not exceed 1.00% of the Fund’s average daily net assets from Nov. 1, 2018 through Feb. 27, 2019. For purposes of those waivers and reimbursements, nonroutine expenses may also include such additional costs and expenses, as may be agreed upon from time to time by the Fund’s Board and DMC. These waivers and reimbursements apply only to expenses paid directly by the Fund and may only be terminated by agreement of DMC and the Fund. The waivers and reimbursements are accrued daily and received monthly.
Effective May 30, 2019, DMC may permit its affiliates, Macquarie Investment Management Global Limited (MIMGL) and Macquarie Funds Management Hong Kong Limited (together, the “AffiliatedSub- Advisors”), to execute Fund equity security trades on behalf of the Manager. The Manager may also seek quantitative support from MIMGL. Although the AffiliatedSub-Advisors serve assub-advisors, DMC has ultimate responsibility for all investment advisory services. For these services, DMC, not the Fund, may pay each AffiliatedSub-Advisor a portion of its investment management fee.
32
Delaware Investments Fund Services Company (DIFSC), an affiliate of DMC, provides fund accounting and financial administrative oversight services to the Fund. For these services, DIFSC’s fees are calculated daily and paid monthly based on the aggregate daily net assets of all funds within the Delaware Funds at the following annual rates: 0.00475% of the first $35 billion; 0.0040% of the next $10 billion; and 0.0025% of aggregate average daily net assets in excess of $45 billion (Total Fee). Each fund in the Delaware Funds pays a minimum of $4,000, which, in aggregate, is subtracted from the Total Fee. Each fund then pays its portion of the remainder of the Total Fee on a relative NAV basis. This amount is included on the “Statement of operations” under “Accounting and administration expenses.” For the year ended Oct. 31, 2019, the Fund was charged $4,960 for these services.
DIFSC is also the transfer agent and dividend disbursing agent of the Fund. For these services, DIFSC’s fees were calculated daily and paid monthly based on the aggregate daily net assets of the retail funds within the Delaware Funds at the following annual rate: 0.014% of the first $20 billion; 0.011% of the next $5 billion; 0.007% of the next $5 billion; 0.005% of the next $20 billion; and 0.0025% of average daily net assets in excess of $50 billion. The fees payable to DIFSC under the shareholder service agreement described above are allocated among all retail funds in the Delaware Funds on a relative NAV basis. This amount is included on the “Statement of operations” under “Dividend disbursing and transfer agent fees and expenses.” For the year ended Oct. 31, 2019, the Fund was charged $2,514 for these services. Pursuant to asub-transfer agency agreement between DIFSC and BNY Mellon Investment Servicing (US) Inc. (BNYMIS), BNYMIS provides certainsub-transfer agency services to the Fund.Sub-transfer agency fees are paid by the Fund and are also included on the “Statement of operations” under “Dividend disbursing and transfer agent fees and expenses.” The fees that are calculated daily and paid as invoices are received on a monthly or quarterly basis.
Pursuant to a distribution agreement and distribution plan, the Fund pays DDLP, the distributor and an affiliate of DMC, an annual12b-1 fee of 0.25%, 1.00%, and 0.50% of the average daily net assets of the Class A, Class C, and Class R shares, respectively. The fees are calculated daily and paid monthly. Institutional class shares do not pay12b-1 fees.
As provided in the investment management agreement, the Fund bears a portion of the cost of certain resources shared with DMC, including the cost of internal personnel of DMC and/or its affiliates that provide legal, tax, and regulatory reporting services to the Fund. For the year ended Oct. 31, 2019, the Fund was charged $700 for internal legal, tax, and regulatory reporting services provided by DMC and/or its affiliates’ employees. This amount is included on the “Statement of operations” under “Legal fees.”
For the year ended Oct. 31, 2019, DDLP earned $3,171 for commissions on sales of the Fund’s Class A shares. For the year ended Oct. 31, 2019, DDLP received gross CDSC commissions of $150 and $156 on redemptions of the Fund’s Class A and Class C shares, respectively, and these commissions were entirely used to offset upfront commissions previously paid by DDLP to broker/dealers on sales of those shares.
Trustees’ fees include expenses accrued by the Fund for each Trustee’s retainer and meeting fees. Certain officers of DMC, DIFSC, and DDLP are officers and/or Trustees of the Trust. These officers and Trustees are paid no compensation by the Fund.
33
Notes to financial statements
Delaware Mid Cap Value Fund
2. Investment Management, Administration Agreements, and Other Transactions with Affiliates (continued)
In addition to the management fees and other expenses of the Fund, the Fund indirectly bears the investment management fees and other expenses of the investment companies (Underlying Funds) in which it invests. The amount of these fees and expenses incurred indirectly by the Fund will vary based upon the expense and fee levels of the Underlying Funds and the number of shares that are owned of the Underlying Funds at different times.
*The aggregate contractual waiver period covering this report is from Feb. 28, 2019 through Feb. 28, 2020.
3. Investments
For the year ended Oct. 31, 2019, the Fund made purchases and sales of investment securities other than short-term investments as follows:
| | | | |
Purchases | | $ | 6,287,005 | |
Sales | | | 3,026,946 | |
The tax cost of investments includes adjustments to net unrealized appreciation (depreciation) which may not necessarily be final tax cost basis adjustments, but approximate the tax basis unrealized gains and losses that may be realized and distributed to shareholders. At Oct. 31, 2019, the cost and unrealized appreciation (depreciation) of investments for federal income tax purposes for the Fund were as follows:
| | | | |
Cost of investments | | $ | 24,001,899 | |
| | | | |
Aggregate unrealized appreciation of investments | | $ | 5,636,384 | |
Aggregate unrealized depreciation of investments | | | (1,571,206 | ) |
| | | | |
Net unrealized appreciation of investments | | $ | 4,065,178 | |
| | | | |
US GAAP defines fair value as the price that the Fund would receive to sell an asset or pay to transfer a liability in an orderly transaction between market participants at the measurement date under current market conditions. A three-level hierarchy for fair value measurements has been established based upon the transparency of inputs to the valuation of an asset or liability. Inputs may be observable or unobservable and refer broadly to the assumptions that market participants would use in pricing the asset or liability. Observable inputs reflect the assumptions market participants would use in pricing the asset or liability based on market data obtained from sources independent of the reporting entity. Unobservable inputs reflect the reporting entity’s own assumptions about the assumptions that market participants would use in pricing the asset or liability based on the best information available under the circumstances. The Fund’s investment in its entirety is assigned a level based upon the observability of the inputs which are significant to the overall valuation. The three-level hierarchy of inputs is summarized on the next page.
34
| | | | |
| Level 1 | | – | | Inputs are quoted prices in active markets for identical investments. (Examples: equity securities,open-end investment companies, futures contracts, and exchange-traded options contracts) |
| | |
| Level 2 | | – | | Other observable inputs, including, but not limited to: quoted prices for similar assets or liabilities in markets that are active, quoted prices for identical or similar assets or liabilities in markets that are not active, inputs other than quoted prices that are observable for the assets or liabilities (such as interest rates, yield curves, volatilities, prepayment speeds, loss severities, credit risks, and default rates) or other market-corroborated inputs. (Examples: debt securities, government securities, swap contracts, foreign currency exchange contracts, foreign securities utilizing international fair value pricing, broker-quoted securities, and fair valued securities) |
| | |
| Level 3 | | – | | Significant unobservable inputs, including the Fund’s own assumptions used to determine the fair value of investments. (Examples: broker-quoted securities and fair valued securities) |
Level 3 investments are valued using significant unobservable inputs. The Fund may also use an income-based valuation approach in which the anticipated future cash flows of the investment are discounted to calculate fair value. Discounts may also be applied due to the nature or duration of any restrictions on the disposition of the investments. Valuations may also be based upon current market prices of securities that are comparable in coupon, rating, maturity, and industry. The derived value of a Level 3 investment may not represent the value which is received upon disposition and this could impact the results of operations.
The following table summarizes the valuation of the Fund’s investments by fair value hierarchy levels as of Oct. 31, 2019:
| | | | |
| | | Level 1 | |
Securities | | | | |
Assets: | | | | |
Common Stock | | | $27,210,867 | |
Short-Term Investments | | | 856,210 | |
| | | | |
Total Value of Securities | | | $28,067,077 | |
| | | | |
During the year ended Oct. 31, 2019, there were no transfers between Level 1 investments, Level 2 investments, or Level 3 investments that had a significant impact to the Fund. The Fund’s policy is to recognize transfers between levels based on fair value at the beginning of the reporting period.
A reconciliation of Level 3 investments is presented when the Fund has a significant amount of Level 3 investments at the beginning, interim, or end of the period in relation to the Fund’s net assets. During the year ended Oct. 31, 2019, there were no Level 3 investments.
35
Notes to financial statements
Delaware Mid Cap Value Fund
4. Dividend and Distribution Information
Income and long-term capital gain distributions are determined in accordance with federal income tax regulations, which may differ from US GAAP. Additionally, distributions from net short-term gains on sales of investment securities are treated as ordinary income for federal income tax purposes. The tax character of dividends and distributions paid during the years ended Oct. 31, 2019 and 2018 was as follows:
| | | | | | | | |
| | | Year ended | |
| | | 10/31/19 | | | 10/31/18 | |
Ordinary income | | | $167,180 | | | | $ 47,929 | |
Long-term capital gains | | | 699,271 | | | | 114,116 | |
| | | | | | | | |
Total | | | $866,451 | | | | $162,045 | |
| | | | | | | | |
5. Components of Net Assets on a Tax Basis
As of Oct. 31, 2019, the components of net assets on a tax basis were as follows:
| | | | |
Shares of beneficial interest | | | $24,354,347 | |
Undistributed ordinary income | | | 57,861 | |
Capital loss carryforwards | | | (309,935 | ) |
Unrealized appreciation of investments | | | 4,065,178 | |
| | | | |
Net assets | | | $28,167,451 | |
| | | | |
The differences between book basis and tax basis components of net assets are primarily attributable to tax deferral of losses on wash sales.
At Oct. 31, 2019, capital loss carryforwards available to offset future realized capital gains were as follows:
| | | | | | | | | | |
| | | | | Loss carryforward character | | | |
| | | Short-term | | Long-term | | Total | |
| | $198,493 | | | $111,442 | | | | $309,935 | |
36
6. Capital Shares
Transactions in capital shares were as follows:
| | | | | | | | |
| | | Year ended | |
| | | 10/31/19 | | | 10/31/18 | |
Shares sold: | | | | | | | | |
Class A | | | 408,350 | | | | 808,349 | |
Class C | | | 178,619 | | | | 141,826 | |
Class R | | | 34,368 | | | | 10,945 | |
Institutional Class | | | 1,468,722 | | | | 1,232,522 | |
| | |
Shares issued upon reinvestment of dividends and distributions: | | | | | | | | |
Class A | | | 71,031 | | | | 15,749 | |
Class C | | | 13,367 | | | | 2,685 | |
Class R | | | 705 | | | | 125 | |
Institutional Class | | | 66,144 | | | | 5,337 | |
| | | | | | | | |
| | | 2,241,306 | | | | 2,217,538 | |
| | | | | | | | |
| | |
Shares redeemed: | | | | | | | | |
Class A | | | (671,127 | ) | | | (342,553 | ) |
Class C | | | (180,275 | ) | | | (89,915 | ) |
Class R | | | (7,297 | ) | | | (7,766 | ) |
Institutional Class | | | (605,519 | ) | | | (96,230 | ) |
| | | | | | | | |
| | | (1,464,218 | ) | | | (536,464 | ) |
| | | | | | | | |
Net increase | | | 777,088 | | | | 1,681,074 | |
| | | | | | | | |
Certain shareholders may exchange shares of one class for shares of another class in the same Fund. These exchange transactions are included as subscriptions and redemptions in the table above and on the “Statements of changes in net assets.”
For the year ended Oct. 31, 2019 and 2018, the Fund had the following exchange transactions:
| | | | | | | | | | | | |
| | | Exchange Redemptions | | Exchange Subscriptions | | |
| Year ended | | Class C Shares | | Class A Shares | | Value |
10/31/19 | | | 3,665 | | | | 3,387 | | | $ | 21,013 | |
10/31/18 | | | 18,283 | | | | 17,013 | | | | 110,245 | |
7. Line of Credit
The Fund, along with certain other funds in the Delaware Funds (Participants), was a participant in a revolving line of credit intended to be used for temporary or emergency purposes as an additional source of liquidity to fund redemptions of investor shares. The revolving line of credit available was reduced from $155,000,000 to $130,000,000 on Sept. 6, 2018. Under the agreement, the Participants were charged an annual commitment fee of 0.15%, which was allocated across the Participants based on a weighted average of the respective net assets of each Participant. The Participants were permitted to borrow up to a maximum ofone-third of their net assets under the agreement. Each Participant was
37
Notes to financial statements
Delaware Mid Cap Value Fund
7. Line of Credit (continued)
individually, and not jointly, liable for its particular advances, if any, under the line of credit. The line of credit available under the agreement expired on Nov. 5, 2018.
On Nov. 5, 2018, the Participants entered into an amendment to the agreement for a $190,000,000 revolving line of credit. The revolving line of credit available was increased to $220,000,000 on Nov. 29, 2018. The revolving line of credit is to be used as described above and operates in substantially the same manner as the original agreement. The line of credit available under the agreement expires on Nov. 4, 2019.
The Fund had no amounts outstanding as of Oct. 31, 2019, or at any time during the year then ended.
8. Securities Lending
The Fund, along with other funds in the Delaware Funds, may lend its securities pursuant to a security lending agreement (Lending Agreement) with The Bank of New York Mellon (BNY Mellon). At the time a security is loaned, the borrower must post collateral equal to the required percentage of the market value of the loaned security, including any accrued interest. The required percentage is: (1) 102% with respect to US securities and foreign securities that are denominated and payable in US dollars; and (2) 105% with respect to foreign securities. With respect to each loan, if on any business day, the aggregate market value of securities collateral plus cash collateral held is less than the aggregate market value of the securities which are the subject of such loan, the borrower will be notified to provide additional collateral by the end of the following business day, which, together with the collateral already held, will be not less than the applicable initial collateral requirements for such security loan. If the aggregate market value of securities collateral and cash collateral held with respect to a security loan exceeds the applicable initial collateral requirement, upon request of the borrower, BNY Mellon must return enough collateral to the borrower by the end of the following business day to reduce the value of the remaining collateral to the applicable initial collateral requirement for such security loan. As a result of the foregoing, the value of the collateral held with respect to a loaned security on any particular day, may be more or less than the value of the security on loan. The collateral percentage with respect to the market value of the loaned security is determined by the security lending agent.
Cash collateral received by each fund of the Trust is generally invested in a series of individual separate accounts, each corresponding to a fund. The investment guidelines permit each separate account to hold certain securities that would be considered eligible securities for a money market fund. Cash collateral received is generally invested in government securities; certain obligations issued by government sponsored enterprises; repurchase agreements collateralized by US Treasury securities; obligations issued by the central government of any Organization for Economic Cooperation and Development (OECD) country or its agencies, instrumentalities or establishments; obligations of supranational organizations; commercial paper, notes, bonds, and other debt obligations; certificates of deposit, time deposits, and other bank obligations; and asset-backed securities. The Fund can also accept US government securities and letters of credit(non-cash collateral) in connection with securities loans.
In the event of default or bankruptcy by the lending agent, realization and/or retention of the collateral may be subject to legal proceedings. In the event the borrower fails to return loaned securities and the
38
collateral received is insufficient to cover the value of the loaned securities and provided such collateral shortfall is not the result of investment losses, the lending agent has agreed to pay the amount of the shortfall to the Fund or, at the discretion of the lending agent, replace the loaned securities. The Fund continues to record dividends or interest, as applicable, on the securities loaned and is subject to changes in value of the securities loaned that may occur during the term of the loan. The Fund has the right under the Lending Agreement to recover the securities from the borrower on demand. With respect to security loans collateralized bynon-cash collateral, the Fund receives loan premiums paid by the borrower. With respect to security loans collateralized by cash collateral, the earnings from the collateral investments are shared among the Fund, the security lending agent, and the borrower. The Fund records security lending income net of allocations to the security lending agent and the borrower.
The Fund may incur investment losses as a result of investing securities lending collateral. This could occur if an investment in the collateral investment account defaulted or became impaired. Under those circumstances, the value of the Fund’s cash collateral account may be less than the amount the Fund would be required to return to the borrowers of the securities and the Fund would be required to make up for this shortfall.
During the year ended Oct. 31, 2019, the Fund had no securities out on loan.
9. Credit and Market Risk
The Fund invests a significant portion of its assets in small- andmid-sized companies and may be subject to certain risks associated with ownership of securities of such companies. Investments in small- ormid-sized companies may be more volatile than investments in larger companies for a number of reasons, which include more limited financial resources or a dependence on narrow product lines.
The Fund invests in REITs and is subject to the risks associated with that industry. If the Fund holds real estate directly as a result of defaults or receives rental income directly from real estate holdings, its tax status as a regulated investment company may be jeopardized. There were no direct real estate holdings during the year ended Oct. 31, 2019. The Fund’s REIT holdings are also affected by interest rate changes, particularly if the REITs it holds use floating rate debt to finance their ongoing operations.
The Fund may invest up to 15% of its net assets in illiquid securities, which may include securities with contractual restrictions on resale, securities exempt from registration under Rule 144A promulgated under the Securities Act of 1933, as amended, and other securities which may not be readily marketable. The relative illiquidity of these securities may impair the Fund from disposing of them in a timely manner and at a fair price when it is necessary or desirable to do so. While maintaining oversight, the Board has delegated to DMC, theday-to-day functions of determining whether individual securities are liquid for purposes of the Fund’s limitation on investments in illiquid securities. Securities eligible for resale pursuant to Rule 144A, which are determined to be liquid, are not subject to the Fund’s 15% limit on investments in illiquid securities. As of Oct. 31, 2019, there were no Rule 144A securities held by the Fund. Restricted securities are valued pursuant to the security valuation procedures described in Note 1.
10. Contractual Obligations
The Fund enters into contracts in the normal course of business that contain a variety of indemnifications. The Fund’s maximum exposure under these arrangements is unknown. However, the
39
Notes to financial statements
Delaware Mid Cap Value Fund
Fund has not had prior claims or losses pursuant to these contracts. Management has reviewed the Fund’s existing contracts and expects the risk of loss to be remote.
11. Recent Accounting Pronouncements
In August 2018, the FASB issued an Accounting Standards Update (ASU), ASU2018-13, which changes certain fair value measurement disclosure requirements. The ASU2018-13, in addition to other modifications and additions, removes the requirement to disclose the amount and reasons for transfers between Level 1 and Level 2 of the fair value hierarchy, the policy for the timing of transfers between levels and the valuation process for Level 3 fair value measurements. The ASU2018-13 is effective for fiscal years, and interim periods within those fiscal years, beginning after Dec. 15, 2019. At this time, management is evaluating the implications of these changes on the financial statements.
12. Subsequent Events
On Nov. 4, 2019, the Fund, along with the other Participants, entered into an amendment to the agreement for a $250,000,000 revolving line of credit to be used as described in Note 7 and to be operated in substantially the same manner as the agreement described in Note 7. Under the amendment to the agreement, the Participants are charged an annual commitment fee of 0.15%, which is allocated across the Participants based on a weighted average of the respective net assets of each Participant. The line of credit available under the agreement expires on Nov. 2, 2020.
Management has determined that no other material events or transactions occurred subsequent to Oct. 31, 2019, that would require recognition or disclosure in the Fund’s financial statements.
40
This page intentionally left blank.
Report of independent
registered public accounting firm
To the Board of Trustees of Delaware Group® Equity Funds I
and Shareholders of Delaware Mid Cap Value Fund
Opinion on the Financial Statements
We have audited the accompanying statement of assets and liabilities, including the schedule of investments, of Delaware Mid Cap Value Fund (constituting Delaware Group® Equity Funds I, referred to hereafter as the “Fund”) as of October 31, 2019, the related statement of operations for the year ended October 31, 2019, the statements of changes in net assets for each of the two years in the period ended October 31, 2019, including the related notes, and the financial highlights for each of the five years in the period ended October 31, 2019 (collectively referred to as the “financial statements”). In our opinion, the financial statements present fairly, in all material respects, the financial position of the Fund as of October 31, 2019, the results of its operations for the year then ended, the changes in its net assets for each of the two years in the period ended October 31, 2019 and the financial highlights for each of the five years in the period ended October 31, 2019 in conformity with accounting principles generally accepted in the United States of America.
Basis for Opinion
These financial statements are the responsibility of the Fund’s management. Our responsibility is to express an opinion on the Fund’s financial statements based on our audits. We are a public accounting firm registered with the Public Company Accounting Oversight Board (United States) (PCAOB) and are required to be independent with respect to the Fund in accordance with the U.S. federal securities laws and the applicable rules and regulations of the Securities and Exchange Commission and the PCAOB.
We conducted our audits of these financial statements in accordance with the standards of the PCAOB. Those standards require that we plan and perform the audit to obtain reasonable assurance about whether the financial statements are free of material misstatement, whether due to error or fraud.
Our audits included performing procedures to assess the risks of material misstatement of the financial statements, whether due to error or fraud, and performing procedures that respond to those risks. Such procedures included examining, on a test basis, evidence regarding the amounts and disclosures in the financial statements. Our audits also included evaluating the accounting principles used and significant estimates made by management, as well as evaluating the overall presentation of the financial statements. Our procedures included confirmation of securities owned as of October 31, 2019 by correspondence with the custodian, transfer agents and brokers. We believe that our audits provide a reasonable basis for our opinion.
/s/ PricewaterhouseCoopers LLP
Philadelphia, Pennsylvania
December 20, 2019
We have served as the auditor of one or more investment companies in Delaware Funds® by Macquarie since 2010.
42
Other Fund information (Unaudited)
Delaware Mid Cap Value Fund
Tax Information
The information set forth below is for the Fund’s fiscal year as required by federal income tax laws. Shareholders, however, must report distributions on a calendar year basis for income tax purposes, which may include distributions for portions of two fiscal years of the Fund. Accordingly, the information needed by shareholders for income tax purposes will be sent to them in January of each year. Please consult your tax advisor for proper treatment of this information.
All disclosures are based on financial information available as of the date of this annual report and, accordingly are subject to change. For any and all items requiring reporting, it is the intention of the Fund to report the maximum amount permitted under the Internal Revenue Code and the regulations thereunder.
For the fiscal year ended Oct. 31, 2019, the Fund reports distributions paid during the year as follows:
| | | | |
(A) Ordinary Income Distributions (Tax Basis)* | | | 19.29 | % |
(B) Long-Term Capital Gain Distributions (Tax Basis) | | | 80.71 | % |
Total Distributions (Tax Basis) | | | 100.00 | % |
(C) Qualifying Dividends1 | | | 100.00 | % |
(A) and (B) are based on a percentage of the Fund’s total distributions.
(C) is based on a percentage of the Fund’s ordinary income distributions.
1Qualifying dividends represent dividends which qualify for the corporate dividends received deduction.
*For the fiscal year ended Oct. 31, 2019, certain dividends paid by the Fund may be subject to a maximum tax rate of 20%. The percentage of dividends paid by the Fund from ordinary income reported as qualified income was 100.00%. Complete information will be computed and reported in conjunction with your 2019 Form1099-DIV.
Board consideration of Investment Advisory andSub-Advisory Agreements for Delaware Mid Cap Value Fund
At a meeting held on Aug.21-22, 2019 (the “Annual Meeting”), the Board of Trustees (the “Board”), including a majority of disinterested or independent Trustees, approved the renewal of the Investment Advisory andSub-Advisory Agreements for Delaware Mid Cap Value Fund (the “Fund”). In making its decision, the Board considered information furnished at regular quarterly Board meetings, including reports detailing Fund performance, investment strategies, and expenses, as well as information prepared specifically in connection with the renewal of the investment advisory andsub-advisory contracts. Information furnished specifically in connection with the renewal of the Investment Management Agreement with Delaware Management Company (“DMC”), a series of Macquarie Investment Management Business Trust (“MIMBT”) and theSub-Advisory Agreements with Macquarie Funds Management Hong Kong Limited (“MFMHK”) and Macquarie Investment Management Global Limited (“MIMGL”), included materials provided by DMC and its affiliates (collectively, “Macquarie Investment Management”), MFMHK, and MIMGL, concerning, among other things, the nature, extent, and quality of services provided to the Fund; the costs of such services to the Fund; economies of scale; and the investment manager’s financial condition and profitability. In addition, in connection with the Annual Meeting, materials were provided to the Trustees in May 2019, including reports provided by Broadridge Financial Solutions (“Broadridge”). The Broadridge reports compared the Fund’s investment performance and expenses with those of other comparable mutual funds. The Independent Trustees
43
Other Fund information (Unaudited)
Delaware Mid Cap Value Fund
Board consideration of Investment Advisory and Sub-Advisory Agreements for Delaware Mid Cap Value Fund (continued)
reviewed and discussed the Broadridge reports with independent legal counsel to the Independent Trustees. In addition to the information noted above, the Board also requested and received information regarding DMC’s policy with respect to advisory fee levels and its breakpoint philosophy; the structure of portfolio manager compensation; comparative client fee information; and any constraints or limitations on the availability of securities for certain investment styles, which had in the past year inhibited, or which were likely in the future to inhibit, the investment manager’s ability to invest fully in accordance with Fund policies.
In considering information relating to the approval of the Fund’s investment advisory andsub-advisory agreements, the Independent Trustees received assistance and advice from and met separately with independent legal counsel to the Independent Trustees and also received assistance and advice from an experienced and knowledgeable independent fund consultant, JDL Consultants, LLC (“JDL”). Although the Board gave attention to all information furnished, the following discussion identifies, under separate headings, the primary factors taken into account by the Board during its contract renewal considerations.
Nature, extent, and quality of services.The Board considered the services provided by DMC to the Fund and its shareholders. In reviewing the nature, extent, and quality of services, the Board considered reports furnished to it throughout the year, which covered matters such as the relative performance of the Fund; compliance of portfolio managers with the investment policies, strategies, and restrictions for the Fund; compliance by DMC and Delaware Distributors, L.P. (together, “Management”) personnel with the Code of Ethics adopted throughout the Delaware Funds® by Macquarie (“Delaware Funds”); and adherence to fair value pricing procedures as established by the Board. The Board was pleased with the current staffing of DMC and the emphasis placed on research in the investment process. The Board recognized DMC’s receipt of certain favorable industry distinctions during the past several years. The Board gave favorable consideration to DMC’s efforts to control expenses while maintaining service levels committed to Fund matters. The Board also noted the benefits provided to Fund shareholders through (a) each shareholder’s ability to: (i) exchange an investment in one Delaware Fund for the same class of shares in another Delaware Fund without a sales charge, or (ii) reinvest Fund dividends into additional shares of the Fund or into additional shares of other Delaware Funds, and (b) the privilege to combine holdings in other Delaware Funds to obtain a reduced sales charge. The Board was satisfied with the nature, extent, and quality of the overall services provided by DMC.
Nature, extent, and quality of services. The Board considered the services provided by MIMGL to the Fund and its shareholders. In reviewing the nature, extent, and quality of services, the Board considered reports furnished to it throughout the year at regular Board Meetings covering matters such as relative performance of the Fund; compliance of portfolio managers with the investment policies, strategies, and restrictions for the Fund; the compliance of MIMGL personnel with its Code of Ethics; and adherence to fair value pricing procedures as established by the Board. The Board was pleased with the current staffing of MIMGL and the emphasis placed on research in the investment process. The Board was satisfied with the nature, extent, and quality of the overall services provided by MIMGL.
44
Nature, extent, and quality of services.The Board considered the services provided by MFMHK to the Fund and its shareholders. In reviewing the nature, extent, and quality of services, the Board considered reports furnished to it throughout the year at regular Board Meetings covering matters such as relative performance of the Fund; compliance of portfolio managers with the investment policies, strategies, and restrictions for the Fund; the compliance of MFMHK personnel with its Code of Ethics; and adherence to fair value pricing procedures as established by the Board. The Board was pleased with the current staffing of MFMHK and the emphasis placed on research in the investment process. The Board was satisfied with the nature, extent, and quality of the overall services provided by MFMHK.
Investment performance.The Board placed significant emphasis on the investment performance of the Fund in view of the importance of investment performance to shareholders. Although the Board considered performance reports and discussions with portfolio managers at Investment Committee meetings throughout the year, the Board gave particular weight to the Broadridge reports furnished for the Annual Meeting. The Broadridge reports prepared for the Fund showed the investment performance of its Class A shares in comparison to a group of similar funds as selected by Broadridge (the “Performance Universe”). A fund with the best performance ranked first, and a fund with the poorest performance ranked last. The highest/best performing 25% of funds in the Performance Universe make up the first quartile; the next 25%, the second quartile; the next 25%, the third quartile; and the poorest/worst performing 25% of funds in the Performance Universe make up the fourth quartile. Comparative annualized performance for the Fund was shown for the past1-,3-,5-, and10-year periods, to the extent applicable, ended Jan. 31, 2019. The Board’s objective is that the Fund’s performance for the1-,3-, and5-year periods be at or above the median of its Performance Universe.
Broadridge currently classifies the Fund as amid-cap core fund. However, Management believes that it would be more appropriate to include the Fund in themid-cap value funds category because the Fund invests in companies whose stock price appears low relative to their underlying value or future potential. Funds in the Broadridge Core category typically use a core investment philosophy and process to select investment holdings. Accordingly, the Broadridge report prepared for the Fund compares the Fund’s performance to two separate Performance Universes – one consisting of the Fund and all retail and institutionalmid-cap core funds and the other consisting of the Fund and all retail and institutionalmid-cap value funds. When compared tomid-cap core funds, the Broadridge report comparison showed that the Fund’s total return for the1-year period was in the fourth quartile of its Performance Universe. The report further showed that the Fund’s total return for the3- and5-year periods was in the second quartile of its Performance Universe and the Fund’s total return for the10-year period was in the third quartile. When compared tomid-cap value funds, the Broadridge report comparison showed that the Fund’s total return for the1- and10-year periods was in the third quartile of its Performance Universe. The report further showed that the Fund’s total return for the3- and5-year periods was in the first quartile of its Performance Universe. The Board observed that the Fund’s performance results were mixed. In evaluating the Fund’s performance, the Board considered the numerous investment and performance reports delivered by Management personnel to the Board’s Investments Committee. The Board was satisfied that Management was taking action to improve Fund performance and to meet the Board’s performance objective.
45
Other Fund information (Unaudited)
Delaware Mid Cap Value Fund
Board consideration of Investment Advisory andSub-Advisory Agreements for Delaware Mid Cap Value Fund (continued)
Comparative expenses.The Board considered expense data for the Delaware Funds. Management provided the Board with information on pricing levels and fee structures for the Fund as of its most recently completed fiscal year. The Board also focused on the comparative analysis of effective management fees and total expense ratios of the Fund versus effective management fees and total expense ratios of a group of similar funds as selected by Broadridge (the “Expense Group”). In reviewing comparative costs, the Fund’s contractual management fee and the actual management fee incurred by the Fund were compared with the contractual management fees (assuming all funds in the Expense Group were similar in size to the Fund) and actual management fees (as reported by each fund) within the Expense Group, taking into account any applicable breakpoints and fee waivers. The Fund’s total expenses were also compared with those of its Expense Group. The Broadridge total expenses, for comparative consistency, were shown by Broadridge for Class A shares and comparative total expenses including12b-1 andnon-12b-1 service fees. The Board’s objective is for the Fund’s total expense ratio to be competitive with those of the peer funds within its Expense Group.
When compared to othermid-cap core funds andmid-cap value funds, the expense comparisons for the Fund showed that its actual management fee was in the quartile with the lowest expenses of its Expense Group and its total expenses were in the quartile with the second highest expenses of its Expense Group. The Board gave favorable consideration to the Fund’s management fee but noted that the Fund’s total expenses were not in line with the Board’s objective. In evaluating total expenses, the Board considered fee waivers in place through February 2020 and various initiatives implemented by Management, such as the negotiation of lower fees for fund accounting, fund accounting oversight, and custody services, which had created an opportunity for a further reduction in expenses. The Board was satisfied with Management’s efforts to improve the Fund’s total expense ratio and to bring it in line with the Board’s objective.
Management profitability.The Board considered the level of profits realized by DMC in connection with the operation of the Fund. In this respect, the Board reviewed the Investment Management Profitability Analysis that addressed the overall profitability of DMC’s business in providing management and other services to each of the individual funds and the Delaware Funds as a whole. Specific attention was given to the methodology used by DMC in allocating costs for the purpose of determining profitability. Management stated that the level of profits of DMC, to a certain extent, reflects recent operational cost savings and efficiencies initiated by DMC. The Board considered DMC’s efforts to improve services provided to Fund shareholders and to meet additional regulatory and compliance requirements resulting from recent industry-wide Securities and Exchange Commission initiatives. The Board also considered the extent to which DMC might derive ancillary benefits from fund operations, including the potential for procuring additional business as a result of the prestige and visibility associated with its role as service provider to the Delaware Funds and the benefits from allocation of fund brokerage to improve trading efficiencies. As part of its work, the Board also reviewed a report prepared by JDL regarding MIMBT profitability as compared to certain peer fund complexes and the Independent Trustees discussed with JDL personnel regarding DMC’s profitability in such context. The Board found that the management fees were reasonable in light of the services rendered and the level of profitability of DMC.
46
Management profitability.Trustees were also given available information on profits being realized by MIMGL in relation to the services being provided to the Fund and in relation to MIMGL’s overall investment advisory business, but believed such information to be of limited relevance because thesub-advisory fees are paid by DMC out of its management fee, and changes in the level ofsub-advisory fees have no impact on Fund expenses. The Board was also provided information on potentialfall-out benefits derived or to be derived by MIMGL in connection with its relationship to the Fund, such as reputational enhancement, soft dollar arrangements, or commissions paid to affiliated broker/dealers, as applicable.
Management profitability. Trustees were also given available information on profits being realized by MFMHK in relation to the services being provided to the Fund and in relation to MFMHK’s overall investment advisory business, but believed such information to be of limited relevance because thesub-advisory fees are paid by DMC out of its management fee, and changes in the level ofsub-advisory fees have no impact on Fund expenses. The Board was also provided information on potentialfall-out benefits derived or to be derived by MFMHK in connection with its relationship to the Fund, such as reputational enhancement, soft dollar arrangements, or commissions paid to affiliated broker/dealers, as applicable.
Economies of scale. The Trustees considered whether economies of scale are realized by DMC as the Fund’s assets increase and the extent to which any economies of scale are reflected in the level of management fees charged. The Trustees reviewed the Fund’s advisory fee pricing and structure, approved by the Board and shareholders, which includes breakpoints, and which applies to most funds in the Delaware Funds complex. Breakpoints in the advisory fee occur when the advisory fee rate is reduced on assets in excess of specified levels. Breakpoints result in a lower advisory fee than would otherwise be the case in the absence of breakpoints, when the asset levels specified in the breakpoints are exceeded. Although, as of March 31, 2019, the Fund had not reached a size at which it could take advantage of any breakpoints in the applicable fee schedule, the Board recognized that the fee was structured so that, if the Fund increases sufficiently in size, then economies of scale may be shared.
47
Board of trustees / directors and officers addendum
Delaware Funds®by Macquarie
A mutual fund is governed by a Board of Trustees/Directors (“Trustees”), which has oversight responsibility for the management of a fund’s business affairs. Trustees establish procedures and oversee and review the performance of the investment manager, the distributor, and others who perform services for the fund. The independent fund trustees, in particular, are advocates
| | | | |
Name, Address, and Birth Date | | Position(s) Held with Fund(s) | | Length of Time Served |
| Interested Trustee | | | | |
Shawn K. Lytle1 | | President, | | President and |
| 2005 Market Street | | Chief Executive Officer, | | Chief Executive Officer |
| Philadelphia, PA 19103 | | and Trustee | | since August 2015 |
| February 1970 | | | | |
| | | | Trustee since |
| | | | September 2015 |
| | |
| | | | |
| Independent Trustees | | | | |
Thomas L. Bennett | | Chair and Trustee | | Trustee since |
| 2005 Market Street | | | | March 2005 |
| Philadelphia, PA 19103 | | | | |
| October 1947 | | | | Chair since |
| | | | March 2015 |
| Jerome D. Abernathy | | Trustee | | Since January 2019 |
| 2005 Market Street | | | | |
| Philadelphia, PA 19103 | | | | |
| July 1959 | | | | |
| Ann D. Borowiec | | Trustee | | Since March 2015 |
| 2005 Market Street | | | | |
| Philadelphia, PA 19103 | | | | |
| November 1958 | | | | |
| | |
| | | | | |
1 Shawn K. Lytle is considered to be an “Interested Trustee” because he is an executive officer of the Fund’s(s’) investment advisor.
48
for shareholder interests. Each trustee has served in that capacity since he or she was elected to or appointed to the Board of Trustees, and will continue to serve until his or her retirement or the election of a new trustee in his or her place. The following is a list of the Trustees and Officers with certain background and related information.
| | | | |
Principal Occupation(s) During the Past Five Years | | Number of Portfolios in Fund Complex Overseen by Trustee or Officer | | Other Directorships Held by Trustee or Officer |
| | | | | |
President — Macquarie | | 95 | | Trustee — UBS |
| Investment Management2 | | | | Relationship Funds, |
| (June 2015–Present) | | | | SMA Relationship |
| | | | Trust, and UBS Funds |
| Regional Head of | | | | (May 2010–April 2015) |
| Americas —UBS Global | | | | |
| Asset Management | | | | |
(April 2010–May 2015) | | | | |
| | | | | |
| Private Investor | | 95 | | None |
| (March 2004–Present) | | | | |
| Managing Member, | | 95 | | None |
| Stonebrook Capital | | | | |
| Management, LLC (financial | | | | |
| technology: macro factors | | | | |
| and databases) | | | | |
(January 1993–Present) | | | | |
| Chief Executive Officer, | | 95 | | Director — |
| Private Wealth Management | | | | Banco Santander International |
| (2011–2013) and | | | | (October 2016–Present) |
| Market Manager, | | | | |
| New Jersey Private | | | | Director — |
| Bank (2005–2011) — | | | | Santander Bank, N.A. |
J.P. Morgan Chase & Co. | | | | (December 2016–Present) |
| 2 | Macquarie Investment Management is the marketing name for Macquarie Management Holdings, Inc. and its subsidiaries, including the Fund’s(s’) investment advisor, principal underwriter, and its transfer agent. |
49
Board of trustees / directors and officers addendum
Delaware Funds®by Macquarie
| | | | |
Name, Address, and Birth Date | | Position(s) Held with Fund(s) | | Length of Time Served |
| Independent Trustees (continued) | | | | |
| Joseph W. Chow | | Trustee | | Since January 2013 |
| 2005 Market Street | | | | |
| Philadelphia, PA 19103 | | | | |
| January 1953 | | | | |
| | | | | |
| | |
| John A. Fry | | | | |
| 2005 Market Street | | Trustee | | Since January 2001 |
| Philadelphia, PA 19103 | | | | |
| May 1960 | | | | |
| | |
| | | | | |
| Lucinda S. Landreth | | Trustee | | Since March 2005 |
| 2005 Market Street | | | | |
| Philadelphia, PA 19103 | | | | |
| June 1947 | | | | |
50
| | | | |
Principal Occupation(s) During the Past Five Years | | Number of Portfolios in Fund Complex Overseen by Trustee or Officer | | Other Directorships Held by Trustee or Officer |
| | | | | |
| Private Investor | | 95 | | Director and Audit Committee |
| (April 2011–Present) | | | | Member — Hercules |
| | | | Technology Growth |
| | | | Capital, Inc. |
| | | | (July 2004–July 2014) |
| President — | | 95 | | Director; Compensation |
| Drexel University | | | | Committee and |
| (August 2010–Present) | | | | Governance Committee |
| | | | Member — Community |
| President — | | | | Health Systems |
| Franklin & Marshall College | | | | (May 2004–present) |
| (July 2002–June 2010) | | | | |
| | | | Director — Drexel |
| | | | Morgan & Co. |
| | | | (2015–present) |
| | |
| | | | Director and Audit Committee |
| | | | Member — vTv |
| | | | Therapeutics Inc. |
| | | | (2017–present) |
| | |
| | | | Director and Audit Committee |
| | | | Member — FS Credit Real |
| | | | Estate Income Trust, Inc. |
| | | | (2018–present) |
| Private Investor | | 95 | | None |
| (2004–Present) | | | | |
| | |
| | | | | |
51
Board of trustees / directors and officers addendum
Delaware Funds®by Macquarie
| | | | |
Name, Address, and Birth Date | | Position(s) Held with Fund(s) | | Length of Time Served |
| Independent Trustees (continued) | | | | |
| Frances A. Sevilla-Sacasa | | Trustee | | Since September 2011 |
| 2005 Market Street | | | | |
| Philadelphia, PA 19103 | | | | |
| January 1956 | | | | |
| Thomas K. Whitford | | Trustee | | Since January 2013 |
| 2005 Market Street | | | | |
| Philadelphia, PA 19103 | | | | |
| March 1956 | | | | |
| | |
| | | | | |
52
| | | | |
| | | Number of Portfolios in | | |
| Principal Occupation(s) | | Fund Complex Overseen | | Other Directorships |
| During the Past Five Years | | by Trustee or Officer | | Held by Trustee or Officer |
| | | | | |
| Private Investor | | 95 | | Trust Manager and |
| (January 2017–Present) | | | | Audit Committee |
| | | | Chair — Camden |
| Chief Executive Officer — | | | | Property Trust |
| Banco Itaú | | | | (August 2011–Present) |
| International | | | | |
| (April 2012–December 2016) | | | | Director; Audit |
| | | | Committee Member — |
| Executive Advisor to Dean | | | | Carrizo Oil & Gas, Inc. |
| (August 2011–March 2012) | | | | (March 2018–Present) |
| and Interim Dean | | | | |
| (January 2011–July 2011) — | | | | |
| University of Miami School of | | | | |
| Business Administration | | | | |
| | |
| President — U.S. Trust, | | | | |
| Bank of America Private | | | | |
| Wealth Management | | | | |
| (Private Banking) | | | | |
| (July 2007–December 2008) | | | | |
| Vice Chairman | | 95 | | Director — HSBC North |
| (2010–April 2013) — | | | | America Holdings Inc. |
| PNC Financial | | | | (December 2013–Present) |
| Services Group | | | | |
| | | | Director — HSBC USA Inc. |
| | | | (July 2014–Present) |
| | |
| | | | Director — |
| | | | HSBC Bank USA, |
| | | | National Association |
| | | | (July 2014–March 2017) |
| | |
| | | | Director — HSBC |
| | | | Finance Corporation |
| | | | | (December 2013–April 2018) |
53
Board of trustees / directors and officers addendum
Delaware Funds®by Macquarie
| | | | |
| Name, Address, | | Position(s) | | Length of |
| and Birth Date | | Held with Fund(s) | | Time Served |
| Independent Trustees (continued) | | | | |
| Christianna Wood | | Trustee | | Since January 2019 |
| 2005 Market Street | | | | |
| Philadelphia, PA 19103 | | | | |
| August 1959 | | | | |
| | |
| | | | | |
54
| | | | |
| | | Number of Portfolios in | | |
| Principal Occupation(s) | | Fund Complex Overseen | | Other Directorships |
| During the Past Five Years | | by Trustee or Officer | | Held by Trustee or Officer |
| | | | | |
| | |
| Chief Executive Officer | | 95 | | Director; Finance Committee |
| and President — | | | | and Audit Committee |
| Gore Creek | | | | Member — H&R |
| Capital, Ltd. | | | | Block Corporation |
| (August 2009–Present) | | | | (July 2008–Present) |
| | |
| | | | Director; Chair of Investments |
| | | | Committee and Audit |
| | | | Committee Member — |
| | | | Grange Insurance |
| | | | (2013–Present) |
| | |
| | | | Trustee; Chair of |
| | | | Nominating and Governance |
| | | | Committee and Audit |
| | | | Committee Member — |
| | | | The Merger Fund |
| | | | (2013–Present), |
| | | | The Merger Fund VL |
| | | | (2013-Present), |
| | | | WCM Alternatives: |
| | | | Event-Driven Fund |
| | | | (2013–Present), |
| | | | and WCM Alternatives: |
| | | | Credit Event Fund |
| | | | (December 2017–Present) |
| | |
| | | | Director; Chair of |
| | | | Governance Committee |
| | | | and Audit Committee |
| | | | Member — International |
| | | | Securities Exchange |
| | | | | (2010–2016) |
55
Board of trustees / directors and officers addendum
Delaware Funds®by Macquarie
| | | | |
| Name, Address, | | Position(s) | | Length of |
| and Birth Date | | Held with Fund(s) | | Time Served |
| Independent Trustees (continued) | | | | |
| Janet L. Yeomans | | Trustee | | Since April 1999 |
| 2005 Market Street | | | | |
| Philadelphia, PA 19103 | | | | |
| July 1948 | | | | |
| | |
| | | | | |
| Officers | | | | |
| David F. Connor | | Senior Vice President, | | Senior Vice President since |
| 2005 Market Street | | General Counsel, | | May 2013; General |
| Philadelphia, PA 19103 | | and Secretary | | Counsel since May 2015; |
| December 1963 | | | | Secretary since |
| | | | | October 2005 |
| Daniel V. Geatens | | Vice President | | Vice President and |
| 2005 Market Street | | and Treasurer | | Treasurer since October 2007 |
| Philadelphia, PA 19103 | | | | |
| October 1972 | | | | |
| | |
| | | | | |
| Richard Salus | | Senior Vice President | | Senior Vice President and |
| 2005 Market Street | | and Chief Financial Officer | | Chief Financial Officer |
| Philadelphia, PA 19103 | | | | since November 2006 |
| October 1963 | | | | |
| | | | | |
The Statement of Additional Information for the Fund(s) includes additional information about the Trustees and Officers and is available, without charge, upon request by calling 800523-1918.
56
| | | | |
| | | Number of Portfolios in | | |
| Principal Occupation(s) | | Fund Complex Overseen | | Other Directorships |
| During the Past Five Years | | by Trustee or Officer | | Held by Trustee or Officer |
| | | | | |
| Vice President and Treasurer | | 95 | | Director; Personnel and |
| (January 2006–July 2012), | | | | Compensation Committee |
| Vice President — | | | | Chair; Member of Nominating, |
| Mergers & Acquisitions | | | | Investments, and Audit |
| (January 2003–January 2006), | | | | Committees for various |
| and Vice President | | | | periods throughout |
| and Treasurer | | | | directorship — |
| (July 1995–January 2003) — | | | | Okabena Company |
| 3M Company | | | | (2009–2017) |
| | | | | |
| David F. Connor has served | | 95 | | None3 |
| in various capacities at | | | | |
| different times at | | | | |
| Macquarie Investment | | | | |
| Management. | | | | |
| Daniel V. Geatens has served | | 95 | | None3 |
| in various capacities at | | | | |
| different times at | | | | |
| Macquarie Investment | | | | |
| Management. | | | | |
| Richard Salus has served | | 95 | | None3 |
| in various capacities | | | | |
| at different times at | | | | |
| Macquarie Investment | | | | |
| Management. | | | | |
| 3 | David F. Connor, Daniel V. Geatens, and Richard Salus serve in similar capacities for the six portfolios of the Optimum Fund Trust, which have the same investment advisor, principal underwriter, and transfer agent as the registrant. Mr. Geatens also serves as the Chief Financial Officer and Treasurer for Macquarie Global Infrastructure Total Return Fund Inc., which has an affiliated investment manager. |
57
About the organization
| | | | | | |
| Board of trustees | | | | | | |
| | | |
Shawn K. Lytle President and Chief Executive Officer Delaware Funds® by Macquarie Philadelphia, PA Thomas L. Bennett Chairman of the Board Delaware Funds by Macquarie Private Investor Rosemont, PA Jerome D. Abernathy Managing Member Stonebrook Capital Management, LLC Jersey City, NJ | | Ann D. Borowiec Former Chief Executive Officer Private Wealth Management J.P. Morgan Chase & Co. New York, NY Joseph W. Chow Former Executive Vice President State Street Corporation Boston, MA John A. Fry President Drexel University Philadelphia, PA | | Lucinda S. Landreth Former Chief Investment Officer Assurant, Inc. New York, NY Frances A. Sevilla-Sacasa Former Chief Executive Officer Banco Itaú International Miami, FL | | Thomas K. Whitford Former Vice Chairman PNC Financial Services Group Pittsburgh, PA Christianna Wood Chief Executive Officer and President Gore Creek Capital, Ltd. Golden, CO Janet L. Yeomans Former Vice President and Treasurer 3M Company St. Paul, MN |
Affiliated officers | | |
| | | |
| David F. Connor | | Daniel V. Geatens | | Richard Salus | | |
| Senior Vice President, | | Vice President and | | Senior Vice President and | | |
| General Counsel, | | Treasurer | | Chief Financial Officer | | |
| and Secretary | | Delaware Funds | | Delaware Funds | | |
| Delaware Funds | | by Macquarie | | by Macquarie | | |
| by Macquarie | | Philadelphia, PA | | Philadelphia, PA | | |
| Philadelphia, PA | | | | | | |
This annual report is for the information of Delaware Mid Cap Value Fund shareholders, but it may be used with prospective investors when preceded or accompanied by the Delaware Fund fact sheet for the most recently completed calendar quarter. These documents are available at delawarefunds.com/literature.
The Fund files its complete schedule of portfolio holdings with the Securities and Exchange Commission (SEC) for the first and third quarters of each fiscal year on FormN-Q or FormN-PORT (available for filings after March 31, 2019). The Fund’s FormsN-Q or FormsN-PORT, as well as a description of the policies and procedures that the Fund uses to determine how to vote proxies (if any) relating to portfolio securities, are available without charge (i) upon request, by calling 800523-1918; and (ii) on the SEC’s website at sec.gov. In addition, a description of the policies and procedures that the Fund uses to determine how to vote proxies (if any) relating to portfolio securities and the Schedule of Investments included in the Fund’s most recent FormN-Q or FormN-PORT are available without charge on the Fund’s website at delawarefunds.com/literature. The Fund’s FormsN-Q and FormsN-PORT may be reviewed and copied at the SEC’s Public Reference Room in Washington, D.C.; information on the operation of the Public Reference Room may be obtained by calling 800SEC-0330.
Information (if any) regarding how the Fund voted proxies relating to portfolio securities during the most recently disclosed12-month period ended June 30 is available without charge (i) through the Fund’s website at delawarefunds.com/proxy; and (ii) on the SEC’s website at sec.gov.
58
Item 2. Code of Ethics
Item 3. Audit Committee Financial Expert
The registrant’s Board of Trustees has determined that certain members of the registrant’s Audit Committee are audit committee financial experts, as defined below. For purposes of this item, an “audit committee financial expert” is a person who has the following attributes:
a. An understanding of generally accepted accounting principles and financial statements;
b. The ability to assess the general application of such principles in connection with the accounting for estimates, accruals, and reserves;
c. Experience preparing, auditing, analyzing, or evaluating financial statements that present a breadth and level of complexity of accounting issues that are generally comparable to the breadth and complexity of issues that can reasonably be expected to be raised by the registrant’s financial statements, or experience actively supervising one or more persons engaged in such activities;
d. An understanding of internal controls and procedures for financial reporting; and
e. An understanding of audit committee functions.
An “audit committee financial expert” shall have acquired such attributes through:
a. Education and experience as a principal financial officer, principal accounting officer, controller, public accountant, or auditor or experience in one or more positions that involve the performance of similar functions;
b. Experience actively supervising a principal financial officer, principal accounting officer, controller, public accountant, auditor, or person performing similar functions;
c. Experience overseeing or assessing the performance of companies or public accountants with respect to the preparation, auditing, or evaluation of financial statements; or
d. Other relevant experience.
The registrant’s Board of Trustees has also determined that each member of the registrant’s Audit Committee is independent. In order to be “independent” for purposes of this item, the Audit Committee member may not: (i) other than in his or her capacity as a member of the Board of Trustees or any committee thereof, accept directly or indirectly any consulting, advisory or other compensatory fee from the issuer; or (ii) be an “interested person” of the registrant as defined in Section 2(a)(19) of the Investment Company Act of 1940.
The names of the audit committee financial experts on the registrant’s Audit Committee are set forth below:
John A. Fry
Lucinda S. Landreth
Thomas K. Whitford
Christianna Wood
Item 4. Principal Accountant Fees and Services
The aggregate fees billed for services provided to the registrant by its independent auditors for the audit of the registrant’s annual financial statements and for services normally provided by the independent auditors in connection with statutory and regulatory filings or engagements were $31,090 for the fiscal year ended October 31, 2019.
The aggregate fees billed for services provided to the registrant by its independent auditors for the audit of the registrant’s annual financial statements and for services normally provided by the independent auditors in connection with statutory and regulatory filings or engagements were $30,480 for the fiscal year ended October 31, 2018.
The aggregate fees billed by the registrant’s independent auditors for services relating to the performance of the audit of the registrant’s financial statements and not reported under paragraph (a) of this Item were $0 for the fiscal year ended October 31, 2019.
The aggregate fees billed by the registrant’s independent auditors for services relating to the performance of the audit of the registrant’s financial statements and not reported under paragraph (a) of this Item were $0 for the fiscal year ended October 31, 2018.
The aggregate fees billed by the registrant’s independent auditors for tax-related services provided to the registrant’s investment adviser and other service providers under common control with the adviser and that relate directly to the operations or financial reporting of the registrant were $0 for the registrant’s fiscal year ended October 31, 2019.
The aggregate fees billed by the registrant’s independent auditors for tax-related services provided to the registrant’s investment adviser and other service providers under common control with the adviser and that relate directly to the operations or financial reporting of the registrant were $0 for the registrant’s fiscal year ended October 31, 2018.
The aggregate fees billed for all services provided by the independent auditors to the registrant other than those set forth in paragraphs (a), (b) and (c) of this Item were $0 for the fiscal year ended October 31, 2019.
The aggregate fees billed for all services provided by the independent auditors to the registrant other than those set forth in paragraphs (a), (b) and (c) of this Item were $0 for the fiscal year ended October 31, 2018.
Under the Pre-Approval Policy, the Audit Committee has also pre-approved the services set forth in the table below with respect to the registrant’s investment adviser and other entities controlling, controlled by or under common control with the investment adviser that provide ongoing services to the registrant (the “Control Affiliates”) up to the specified fee limit. This fee limit is based on aggregate fees to the investment adviser and its Control Affiliates.
The Pre-Approval Policy requires the registrant’s independent auditors to report to the Audit Committee at each of its regular meetings regarding all services initiated since the last such report was rendered, including those services authorized by the Pre-Approval Policy.
(f) Not applicable.
(g) The aggregate non-audit fees billed by the registrant’s independent auditors for services rendered to the registrant and to its investment adviser and other service providers under common control with the adviser were $9,955,000 and $11,748,000 for the registrant’s fiscal years ended October 31, 2019 and October 31, 2018, respectively.
(h) In connection with its selection of the independent auditors, the registrant’s Audit Committee has considered the independent auditors’ provision of non-audit services to the registrant’s investment adviser and other service providers under common control with the adviser that were not required to be pre-approved pursuant to Rule 2-01(c)(7)(ii) of Regulation S-X. The Audit Committee has determined that the independent auditors’ provision of these services is compatible with maintaining the auditors’ independence.
Item 5. Audit Committee of Listed Registrants
Not applicable.
Item 6. Investments
(a) Included as part of report to shareholders filed under Item 1 of this Form N-CSR.
(b) Divestment of securities in accordance with Section 13(c) of the Investment Company Act of 1940.
Not applicable.
Item 7. Disclosure of Proxy Voting Policies and Procedures for Closed-End Management Investment Companies
Not applicable.
Item 8. Portfolio Managers of Closed-End Management Investment Companies
Not applicable.
Item 9. Purchases of Equity Securities by Closed-End Management Investment Companies and Affiliated Purchasers
Not applicable.
Item 10. Submission of Matters to a Vote of Security Holders
Not applicable.
Item 11. Controls and Procedures
The registrant’s principal executive officer and principal financial officer have evaluated the registrant’s disclosure controls and procedures within 90 days of the filing of this report and have concluded that they are effective in providing reasonable assurance that the information required to be disclosed by the registrant in its reports or statements filed under the Securities Exchange Act of 1934 is recorded, processed, summarized and reported within the time periods specified in the rules and forms of the Securities and Exchange Commission.
There were no significant changes in the registrant’s internal control over financial reporting that occurred during the period covered by the report to stockholders included herein that have materially affected, or are reasonably likely to materially affect, the registrant’s internal control over financial reporting.
Item 12. Disclosure of Securities Lending Activities for Closed-End Management Investment Companies
Not applicable.
Item 13. Exhibits
Pursuant to the requirements of the Securities Exchange Act of 1934 and the Investment Company Act of 1940, the registrant has duly caused this report to be signed on its behalf, by the undersigned, thereunto duly authorized.
Pursuant to the requirements of the Securities Exchange Act of 1934 and the Investment Company Act of 1940, this report has been signed below by the following persons on behalf of the registrant and in the capacities and on the dates indicated.