UNITED STATES
SECURITIES AND EXCHANGE COMMISSION
Washington, D.C. 20549
FORM N-CSR
CERTIFIED SHAREHOLDER REPORT OF REGISTERED
MANAGEMENT INVESTMENT COMPANIES
Investment Company Act file number: 811- 2896
Dryden High Yield Fund, Inc.
(Exact name of registrant as specified in charter)
Gateway Center 3,
100 Mulberry Street,
Newark, New Jersey 07102
(Address of principal executive offices)
Marguerite E. H. Morrison
Gateway Center 3,
100 Mulberry Street,
Newark, New Jersey 07102
(Name and address of agent for service)
Registrant’s telephone number, including area code: 973-367-7525
Date of fiscal year end: 12/31/03
Date of reporting period: 12/31/03
Item 1 – Reports to Stockholders – [ INSERT REPORT ]
Dryden High Yield Fund, Inc.
| | |
|
| DECEMBER 31, 2003 | | ANNUAL REPORT |

FUND TYPE
Junk bond
OBJECTIVES
Current income, and capital appreciation as a secondary objective
This report is not authorized for distribution to prospective investors unless preceded or accompanied by a current prospectus.
The views expressed in this report and information about the Fund’s portfolio holdings are for the period covered by this report and are subject to change thereafter.
JennisonDryden is a service mark of The Prudential Insurance Company of America.

Dear Shareholder,
February 23, 2004
As you may know, the mutual fund industry recently has been the subject of much media attention. As president of your Fund, I’d like to provide you with an update on the issues as they pertain to JennisonDryden mutual funds.
Regulators and government authorities have requested information regarding trading practices from many mutual fund companies across the nation. Our fund family has been cooperating with inquiries it has received, and at the same time, Prudential Financial, Inc. has been conducting its own internal review. This review encompasses the policies, systems, and procedures of our fund family, Prudential Financial’s investment units and its proprietary distribution channels. The review also includes mutual fund trading activity by investment professionals who manage our funds.
Market timing
The frequent trading of shares in response to short-term fluctuations in the market is known as “market timing”. When market timing occurs in violation of a fund’s prospectus, in certain circumstances, a fund may have to sell portfolio securities to have the cash necessary to redeem the market timer’s shares. The redemption may happen when it is not advantageous to sell securities and result in harming the fund’s performance and/or subject the fund to additional transaction costs.
Prudential Investments LLC, the Fund’s investment manager, has actively discouraged market timing and for years our mutual fund prospectuses have identified and addressed this issue. Prudential Investments has established operating policies and procedures that are designed to detect and deter frequent trading activities that would be disruptive to the management of our mutual fund portfolios, and has rejected numerous orders placed by market timers in the past.
Late trading
The Securities and Exchange Commission requires that orders to purchase or redeem mutual fund shares be received either by the fund or by an intermediary (such as a broker, financial adviser, or 401(k) record keeper) before the time at which the fund calculates its net asset value (normally 4:00 p.m., Eastern time) if they are to receive that day’s price. The policies of our mutual funds do not make and have not made allowances for the practice known as “late trading”.
For more than 40 years we have offered investors quality investment products, financial guidance, and responsive customer service. Today we remain committed to this heritage and to the highest ethical principles in our investment practices.
Sincerely,

Judy A. Rice, President
Dryden High Yield Fund, Inc.
| | |
| Dryden High Yield Fund, Inc. | | 1 |
Your Fund’s Performance
Fund Objectives
The primary investment objective of the Dryden High Yield Fund, Inc. (the Fund) is to maximize current income. As a secondary objective, the Fund seeks capital appreciation, but only when consistent with the Fund’s primary investment objective of current income. There can be no assurance that the Fund will achieve its investment objectives.
| | | | | | | | | | | | |
| | | | |
| Cumulative Total Returns1 as of 12/31/03 | | | | | | | | | | | | |
| | | One Year | | | Five Years | | | Ten Years | | | Since Inception2 | |
Class A | | 25.66 | % | | 18.80 | % | | 73.90 | % | | 188.63 | % |
| |
Class B | | 25.08 | | | 15.90 | | | 64.71 | | | 633.50 | |
| |
Class C | | 25.08 | | | 15.90 | | | N/A | | | 68.33 | |
| |
Class Z | | 25.94 | | | 20.57 | | | N/A | | | 48.15 | |
| |
Lehman Brothers U.S. Corporate High Yield Index3 | | 28.97 | | | 29.04 | | | 94.67 | | | *** | |
| |
Lipper High Current Yield Funds Avg.4 | | 24.30 | | | 20.24 | | | 64.42 | | | **** | |
| |
| | | | | | | | | | | | | |
| | | | |
| Average Annual Total Returns1 as of 12/31/03 | | | | | | | | | | | | |
| | | One Year | | | Five Years | | | Ten Years | | | Since Inception2 | |
Class A | | 20.64 | % | | 2.66 | % | | 5.26 | % | | 7.58 | % |
| |
Class B | | 20.08 | | | 2.86 | | | 5.12 | | | 8.38 | |
| |
Class C | | 22.84 | | | 2.79 | | | N/A | | | 5.57 | |
| |
Class Z | | 25.94 | | | 3.81 | | | N/A | | | 5.14 | |
| |
Lehman Brothers U.S. Corporate High Yield Index3 | | 28.97 | | | 5.23 | | | 6.89 | | | *** | |
| |
Lipper High Current Yield Funds Avg.4 | | 24.30 | | | 3.56 | | | 4.97 | | | **** | |
| |
| | | | | | |
| | |
| Distributions and Yields1 as of 12/31/03 | | | | | |
| | | Total Distributions
Paid for 12 Months | | 30-Day SEC Yield | |
Class A | | $ | 0.44 | | 6.87 | % |
| |
Class B | | $ | 0.41 | | 6.65 | % |
| |
Class C | | $ | 0.41 | | 6.59 | % |
| |
Class Z | | $ | 0.45 | | 7.41 | % |
| |
Past performance is not indicative of future results. Principal value and investment return will fluctuate so that an investor’s shares, when redeemed, may be worth more or less than their original cost. 1Source: Prudential Investments LLC and Lipper Inc. The cumulative total returns do not take into account applicable sales charges. If reflected, the applicable sales charges would reduce the cumulative total return performance quoted. The average annual total returns do take into account applicable sales charges. Without the distribution and service (12b-1) fee waiver of 0.05% and 0.25% for Class A and Class C shares respectively, the returns for these classes would have been lower. The Fund charges a maximum front-end sales charge of 4% for Class A shares, and a 12b-1 fee of up to 0.30% annually. Class A shares may not be subject to a front-end sales charge, but may be subject to a 1% contingent deferred sales charge (CDSC) for the first year. Class B shares are subject to
| | |
| 2 | | Visit our website at www.jennisondryden.com |
a declining CDSC of 5%, 4%, 3%, 2%, 1%, and 1% for the first six years respectively after purchase, and a 12b-1 fee of 0.75% annually. Approximately seven years after purchase, Class B shares will automatically convert to Class A shares on a quarterly basis. Class C shares are subject to a CDSC of 1% for shares redeemed within 12 months of purchase, and a 12b-1 fee of up to 1% annually. Class Z shares are not subject to a sales charge or 12b-1 fee. The returns in the tables do not reflect the deduction of taxes that a shareholder would pay on Fund distributions or following the redemption of Fund shares. 2Inception dates: Class A, 1/22/90; Class B, 3/29/79; Class C, 8/1/94; and Class Z, 3/1/96. 3The Lehman Brothers U.S. Corporate High Yield Index is an unmanaged index of fixed-rate, noninvestment-grade debt securities with at least one year remaining to maturity. It gives a broad look at how high yield (“junk”) bonds have performed. 4The Lipper High Current Yield Funds Average (Lipper Average) represents returns based on an average return of all funds in the Lipper High Current Yield Funds category for the periods noted. Funds in the Lipper High Current Yield Funds Average aim at high (relative) current yield from fixed income securities, have no quality or maturity restrictions, and tend to invest in lower-grade debt issues. Investors cannot invest directly in an index. The returns for the Lehman Brothers U.S. Corporate High Yield Index and the Lipper Average would be lower if they included the effects of sales charges, operating expenses of a mutual fund, or taxes. Returns for the Lipper Average reflect the deduction of operating expenses, but not sales charges or taxes. ***Lehman Brothers U.S. Corporate High Yield Index Closest Month-End to Inception cumulative total returns are 256.45% for Class A, 592.26% for Class B, 97.51% for Class C, and 62.07% for Class Z. Lehman Brothers U.S. Corporate High Yield Index Closest Month-End to Inception average annual total returns are 9.56% for Class A, 9.90% for Class B, 7.50% for Class C, and 6.36% for Class Z. The Lehman Brothers High Yield Bond Index began on 6/30/83, therefore the return for Class B shares represents an inception return from that time until present (12/31/03). ****Lipper Average Closest Month-End to Inception cumulative total returns are 200.45% for Class A, 760.99% for Class B, 67.90% for Class C, and 45.25% for Class Z. Lipper Average Closest Month-End to Inception average annual total returns are 8.10% for Class A, 8.98% for Class B, 5.52% for Class C, and 4.73% for Class Z.
| | | |
| |
| Five Largest Issuers expressed as a percentage of total investments† as of 12/31/03 | | | |
Charter Communications Holdings LLC | | 1.9 | % |
| |
Allied Waste of North America, Inc. | | 1.4 | |
| |
Echostar DBS Corp. | | 1.4 | |
| |
Nextel Communications, Inc. | | 1.4 | |
| |
AES Corp. | | 1.2 | |
| |
†Excludes cash received as a result of securities on loan. Issuers are subject to change.
| | | |
| |
| Credit Quality* expressed as a percentage of net assets as of 12/31/03 | | | |
High Grade | | 1.3 | % |
| |
Ba | | 29.4 | |
| |
B | | 49.1 | |
| |
Caa or lower | | 16.3 | |
| |
NR | | 2.4 | |
| |
Cash & Equivalents | | 1.5 | |
| |
*Source: Moody’s rating, defaulting to S&P when not rated by Moody’s. Credit Quality is subject to change.
| | |
| Dryden High Yield Fund, Inc. | | 3 |
Investment Adviser’s Report
Prudential Investment Management, Inc.
Strong year for high yield bonds
High yield corporate bonds, commonly called junk bonds because they are rated below investment grade, turned in a strong performance in 2003. The sector returned 28.97% for the year, based on the Fund’s benchmark, the Lehman Brothers U.S. Corporate High Yield Index (the Index). This was the sector’s best performance since 1991.
In the first half of 2003, long-term interest rates declined as the Federal Reserve (the Fed) was expected to reduce short-term interest rates in an effort to stimulate sustainable economic growth in the United States. The Fed cut the interbank overnight lending rate by a quarter of a percentage point to 1%, its lowest level in 45 years. High yield bonds initially gained in value as companies took advantage of low interest rates by issuing new bonds and using the proceeds to pay off bank loans, replace higher-rate bonds, or simply extend their maturity profiles. As a result, companies cut their interest costs, and in some cases, avoided potential bankruptcies. The junk bond default rate also declined during the year. In the second half of 2003, high yield bonds continued to rally as tax cuts, a weak U.S. dollar, and low interest rates fueled an economic recovery in the United States. Improving economic conditions helped boost the earnings of companies that issue junk bonds. On the whole, strong investor demand for high yield bonds persisted throughout 2003 as they provided more attractive yields than U.S. Treasury securities and other high-quality bonds.
Fund’s relatively conservative risk profile versus the Index
In 2003, riskier high yield bonds, such as those rated Caa and below, performed better than bonds rated Ba and single-B, which are Moody’s two higher rating categories in the high yield market. We limited the Fund’s holdings of certain Caa-rated bonds because we believed their yields did not provide sufficient compensation for the credit risk associated with investing in them. Therefore the Fund had a more conservative risk profile than the Index. The Fund’s smaller exposure to top-performing Caa-rated bonds, compared with the Index, detracted from its performance relative to the Index in 2003.
Focus on cable television and airline bonds
From the perspective of industry sectors, the Fund benefited from what we believed to be timely investments in bonds of cable television companies and airlines, including Cablevision, European cable firm UPC, Continental Airlines, and Delta Airlines. We view cable television as a core industry whose steady cash flows are less vulnerable to changing economic conditions. Cable television bonds were helped in 2003 by the fact that the sector did not have to contend with the corporate governance scandals that pressured it in 2002. Meanwhile, airline bonds gained in value as improving economic conditions in the United States benefited the industry.
| | |
| 4 | | Visit our website at www.jennisondryden.com |
Telecommunications and electric utility bonds downplayed
We continued to limit the Fund’s exposure to bonds of industries that we consider vulnerable, such as telecommunications and utilities. Both continue to suffer from competitive pressures and overcapacity. In the late 1990s, there was an abundance of capital available to finance the construction of what proved to be an oversupply of fiber optic networks in the telecom industry. Among utilities, independent power producers remained under pressure as the companies struggled with oversupply in the electricity market, high debt levels, and increasing scrutiny from regulators. Nevertheless, bonds in both sectors appreciated in 2003. The Fund owned bonds of Qwest, Nextel, Calpine, Reliant Resources, and AES that gained in value. However, it had an underweight exposure to telecommunications and electric utility bonds relative to the Index that detracted from its performance versus the Index in 2003.
Finding value among bonds of cyclical industries
An increase in business investment in the United States benefited companies in cyclical businesses, which tend to do well when economic growth accelerates. The Fund took advantage of this development through its exposure to the capital goods sector and travel-related sectors. Similarly, strong demand for raw materials boosted their prices and benefited firms in certain commodity-related businesses. The Fund took advantage of this development through its exposure to the chemical, energy, and metals sectors.
Another strong year for emerging market bonds in 2003
Turning to bonds of issuers outside the United States, the Fund had a small exposure to emerging market bonds in 2003. The sector gained sharply in value during the year, helped by improving global economic conditions, the search for bonds
with attractive yields, and rising commodity prices. Among the Fund’s emerging-market holdings that performed well were bonds of Russia and Brazil. In contrast, the Fund held bonds of El Salvador that lagged the market due to their relatively higher credit quality.
| | |
| Dryden High Yield Fund, Inc. | | 5 |
This Page Intentionally Left Blank
Portfolio Of Investments
as of December 31, 2003
| | | | | | | | | | | | | |
| | | | | |
| Description | | Moody’s
Rating
(Unaudited) | | Interest
Rate | | Maturity
Date | | Principal
Amount (000) | | | Value (Note 1) |
| | | | | | | | | | | | | | |
LONG-TERM INVESTMENTS 95.8% | | | | | | | | | | | |
| | | |
ASSET BACKED SECURITIES 0.7% | | | | | | | | | |
|
CSAM Funding Corp. I,
Sub. Notes, Cl. D-2 | | Ba2 | | 7.511%(j) | | 3/29/16 | | $ | 7,000 | | | $ | 5,040,000 |
Inner Harbor, Sub. Notes, Cl. B-2 (cost $4,646,501; purchased 4/19/01) | | Ba2 | | 11.19 | | 6/15/13 | | | 5,000 | (b) | | | 3,805,469 |
Liberty Square Ltd.,
Ser. 2001-2A, Cl. D
(cost $3,730,968; purchased 5/23/01) | | Ba3 | | 7.73(j) | | 6/15/13 | | | 3,462 | (b) | | | 969,288 |
Octagon Investment Partners III, Sr. Sec’d. Notes (cost $5,000,000; purchased 12/7/99) | | Ba3 | | 7.39(j) | | 12/14/11 | | | 5,000 | (b) | | | 2,913,350 |
Stanfield/RMF Transatlantic Ltd., Sr. Notes, Ser. D-1 (cost $5,000,000; purchased 4/19/00) | | Caa3 | | 7.25(j) | | 4/15/15 | | | 5,000 | (b) | | | 1,500,000 |
| | | | | | | | | | | | |
|
|
Total asset backed securities
(cost $25,055,279) | | | | | | | | | | | | | 14,228,107 |
| | | | | | | | | | | | |
|
|
| | | |
CORPORATE BONDS 89.8% | | | | | | | | | |
| | | | |
Aerospace/Defense 1.1% | | | | | | | | | | | |
|
K&F Industries, Inc., | | | | | | | | | | | | | |
Sr. Sub. Notes | | B3 | | 9.625 | | 12/15/10 | | | 6,000 | | | | 6,727,500 |
Sr. Sub. Notes, Ser. B | | B3 | | 9.25 | | 10/15/07 | | | 3,570 | | | | 3,681,562 |
L-3 Communications Corp. | | | | | | | | | | | | | |
Sr. Sub. Notes | | Ba3 | | 7.625 | | 6/15/12 | | | 7,500 | | | | 8,128,125 |
Sr. Sub. Notes | | Ba3 | | 6.125 | | 1/15/14 | | | 775 | | | | 776,938 |
Sequa Corp.,
Sr. Notes, Ser. B | | B1 | | 8.875 | | 4/1/08 | | | 3,500 | | | | 3,797,500 |
| | | | | | | | | | | | |
|
|
| | | | | | | | | | | | | | 23,111,625 |
| | | |
Banks/Financial Services/Insurance 0.3% | | | | | | | | | |
|
Sovereign Bancorp, Inc.,
Sr. Notes | | Ba1 | | 10.50 | | 11/15/06 | | | 1,245 | | | | 1,472,332 |
See Notes to Financial Statements.
| | |
| Dryden High Yield Fund, Inc. | | 7 |
Portfolio Of Investments
as of December 31, 2003 Cont’d.
| | | | | | | | | | | | | |
| | | | | |
| Description | | Moody’s
Rating
(Unaudited) | | Interest
Rate | | Maturity
Date | | Principal
Amount (000) | | | Value (Note 1) |
| | | | | | | | | | | | | | |
Western Financial Savings Bank, Sub. Cap. Deb. | | B1 | | 8.875% | | 8/1/07 | | $ | 4,400 | | | $ | 4,554,000 |
| | | | | | | | | | | | |
|
|
| | | | | | | | | | | | | | 6,026,332 |
Building & Construction 1.7% | | | | | | | | | | | |
|
American Standard, Inc.,
Gtd. Notes | | Ba2 | | 7.375 | | 4/15/05 | | | 5,000 | | | | 5,275,000 |
D.R. Horton, Inc., | | | | | | | | | | | | | |
Sr. Gtd. Notes | | Ba1 | | 8.00 | | 2/1/09 | | | 4,565 | (g) | | | 5,158,450 |
Sr. Notes | | Ba1 | | 7.50 | | 12/1/07 | | | 2,000 | | | | 2,190,000 |
Sr. Notes | | Ba1 | | 8.50 | | 4/15/12 | | | 4,375 | | | | 4,943,750 |
KB Home, Sr. Sub. Notes | | Ba2 | | 8.625 | | 12/15/08 | | | 6,325 | (g) | | | 7,084,000 |
New Millenium Homes LLC | | NR | | Zero | | 12/31/04 | | | 1,854 | (f) | | | 927,000 |
Nortek Holdings, Inc.,
Sr. Notes | | Caa1 | | Zero | | 5/15/11 | | | 5,000 | | | | 3,612,500 |
Nortek, Inc., | | | | | | | | | | | | | |
Sr. Notes | | B1 | | 9.25 | | 3/15/07 | | | 1,440 | | | | 1,479,600 |
Sr. Sub. Notes, Ser. B | | B3 | | 9.875 | | 6/15/11 | | | 5,825 | | | | 6,422,062 |
| | | | | | | | | | | | |
|
|
| | | | | | | | | | | | | | 37,092,362 |
| | | | | |
Cable 5.5% | | | | | | | | | | | | | |
|
Avalon Cable Holdings LLC,
Sr. Disc. Notes | | Caa1 | | 11.875 | | 12/1/08 | | | 4,670 | | | | 4,926,698 |
Callahan Nordrhein Westfalen (Germany), | | | | | | | | | | | | | |
Sr. Disc. Notes, Zero Coupon (until 07/15/05) | | NR | | 16.00 | | 7/15/10 | | | 15,000 | (e)(i) | | | 600,000 |
Sr. Notes | | NR | | 14.00 | | 7/15/10 | | | 6,900 | (e)(i) | | | 422,625 |
Charter Communications Holdings II, Sr. Notes | | Caa1 | | 10.25 | | 9/15/10 | | | 1,800 | (g) | | | 1,890,000 |
Charter Communications Holdings LLC, | | | | | | | | | | | | | |
Sr. Disc. Notes, Zero Coupon (until 5/15/06) | | Ca | | 11.75 | | 5/15/11 | | | 3,000 | | | | 2,010,000 |
Sr. Notes | | Ca | | 8.625 | | 4/1/09 | | | 14,100 | (g) | | | 12,302,250 |
Sr. Notes | | Ca | | 10.00 | | 4/1/09 | | | 1,500 | | | | 1,335,000 |
Sr. Notes | | Ca | | 10.75 | | 10/1/09 | | | 2,700 | | | | 2,477,250 |
Sr. Notes | | Ca | | 9.625 | | 11/15/09 | | | 7,250 | (g) | | | 6,380,000 |
Sr. Notes | | Ca | | 10.25 | | 1/15/10 | | | 8,200 | (g) | | | 7,339,000 |
Sr. Notes | | Ca | | 11.125 | | 1/15/11 | | | 9,000 | (g) | | | 8,257,500 |
Sr. Notes | | Ca | | 10.00 | | 5/15/11 | | | 8,100 | (g) | | | 7,047,000 |
See Notes to Financial Statements.
| | |
| 8 | | Visit our website at www.jennisondryden.com |
| | | | | | | | | | | | | |
| | | | | |
| Description | | Moody’s
Rating
(Unaudited) | | Interest
Rate | | Maturity
Date | | Principal
Amount (000) | | | Value (Note 1) |
| | | | | | | | | | | | | | |
Comcast UK Cable Partners Ltd. (Bermuda),
Sr. Disc. Deb. | | Caa2 | | 11.20% | | 11/15/07 | | $ | 10,900 | (i) | | $ | 11,009,000 |
CSC Holdings, Inc. | | | | | | | | | | | | | |
Deb. | | B1 | | 7.625 | | 7/15/18 | | | 2,610 | | | | 2,740,500 |
Sr. Sub. Deb. | | B2 | | 9.875 | | 2/15/13 | | | 3,000 | (g) | | | 3,135,000 |
DirecTV Holdings, Sr. Notes | | B1 | | 8.375 | | 3/15/13 | | | 6,940 | (g) | | | 8,050,400 |
Echostar DBS Corp., | | | | | | | | | | | | | |
Sr. Notes | | Ba3 | | 10.375 | | 10/1/07 | | | 26,175 | | | | 28,694,344 |
Sr. Notes | | Ba3 | | 9.125 | | 1/15/09 | | | 7,808 | | | | 8,735,200 |
| | | | | | | | | | | | |
|
|
| | | | | | | | | | | | | | 117,351,767 |
| | | | | |
Chemicals 3.6% | | | | | | | | | | | | | |
|
Equistar Chemicals LP, | | | | | | | | | | | | | |
Gtd. Notes | | B2 | | 10.125 | | 9/1/08 | | | 140 | | | | 153,300 |
Notes | | BB-(a) | | 6.50 | | 2/15/06 | | | 1,400 | | | | 1,414,000 |
Sr. Notes | | B2 | | 10.625 | | 5/1/11 | | | 3,195 | | | | 3,530,475 |
Sr. Notes | | B2 | | 10.625 | | 5/1/11 | | | 5,000 | (g) | | | 5,525,000 |
Huntsman Advanced Materials LLC,
Sec’d. Notes | | B2 | | 11.00 | | 7/15/10 | | | 300 | (g) | | | 331,500 |
Huntsman International LLC, Sr. Sub. Notes | | Caa1 | | 10.125 | | 7/1/09 | | | 9,996 | | | | 10,295,880 |
Huntsman LLC, Sec’d. Notes | | B2 | | 11.625 | | 10/15/10 | | | 4,925 | | | | 5,023,500 |
IMC Global, Inc., | | | | | | | | | | | | | |
Gtd. Notes | | B1 | | 11.25 | | 6/1/11 | | | 1,600 | | | | 1,760,000 |
Sr. Notes | | B1 | | 10.875 | | 8/1/13 | | | 2,700 | (g) | | | 2,956,500 |
Sr. Notes, Ser. B | | B1 | | 10.875 | | 6/1/08 | | | 325 | | | | 357,500 |
Sr. Notes, Ser. B | | B1 | | 11.25 | | 6/1/11 | | | 4,475 | (g) | | | 4,922,500 |
ISP Chemco, Inc., Sr. Sub. Notes, Ser. B | | B2 | | 10.25 | | 7/1/11 | | | 3,370 | | | | 3,791,250 |
Lyondell Chemical Co., Gtd. Notes | | B1 | | 10.50 | | 6/1/13 | | | 1,985 | (g) | | | 2,163,650 |
Nalco Co. | | | | | | | | | | | | | |
Sr. Notes | | B2 | | 7.75 | | 11/15/11 | | | 1,950 | (g) | | | 2,086,500 |
Sr. Sub. Notes | | Caa1 | | 8.875 | | 11/15/13 | | | 1,700 | (g) | | | 1,802,000 |
OM Group, Inc.,
Sr. Sub. Notes | | Caa1 | | 9.25 | | 12/15/11 | | | 19,110 | | | | 19,874,400 |
Rhodia SA, Sr. Sub. Notes | | B3 | | 8.875 | | 6/1/11 | | | 2,600 | (g) | | | 2,392,000 |
Rockwood Specialties, Inc., Sr. Sub. Notes | | B3 | | 10.625 | | 5/15/11 | | | 3,375 | | | | 3,763,125 |
See Notes to Financial Statements.
| | |
| Dryden High Yield Fund, Inc. | | 9 |
Portfolio Of Investments
as of December 31, 2003 Cont’d.
| | | | | | | | | | | | | |
| | | | | |
| Description | | Moody’s
Rating
(Unaudited) | | Interest
Rate | | Maturity
Date | | Principal
Amount (000) | | | Value (Note 1) |
| | | | | | | | | | | | | | |
Westlake Chemical Corp., Gtd. Notes | | Ba3 | | 8.75% | | 7/15/11 | | $ | 3,550 | | | $ | 3,887,250 |
| | | | | | | | | | | | |
|
|
| | | | | | | | | | | | | | 76,030,330 |
Consumer Products & Services 1.0% | | | | | | | | | |
|
Coinmach Corp., Sr. Notes | | B2 | | 9.00 | | 2/1/10 | | | 7,945 | (g) | | | 8,620,325 |
Dimon, Inc., Sr. Notes | | Ba3 | | 9.625 | | 10/15/11 | | | 3,150 | | | | 3,512,250 |
Kindercare Learning Centers, Inc.,
Sr. Sub. Notes | | B3 | | 9.50 | | 2/15/09 | | | 8,200 | | | | 8,323,000 |
The Goodyear Tire & Rubber Co., Notes | | B2 | | 7.857 | | 8/15/11 | | | 1,775 | (g) | | | 1,548,688 |
| | | | | | | | | | | | |
|
|
| | | | | | | | | | | | | | 22,004,263 |
| | | | | |
Containers 3.3% | | | | | | | | | | | | | |
|
Anchor Glass Container Corp., Sec’d. Notes | | B2 | | 11.00 | | 2/15/13 | | | 3,725 | | | | 4,321,000 |
Berry Plastics Corp. | | | | | | | | | | | | | |
Gtd. Notes | | B3 | | 10.75 | | 7/15/12 | | | 3,500 | | | | 4,029,375 |
Sr. Sub. Notes | | B3 | | 10.75 | | 7/15/12 | | | 3,125 | | | | 3,597,656 |
BWAY Corp., Sr. Sub. Notes | | B3 | | 10.00 | | 10/15/10 | | | 1,430 | | | | 1,558,700 |
Crown European Holdings SA, Sec’d. Notes | | B1 | | 9.50 | | 3/1/11 | | | 6,250 | (g) | | | 7,078,125 |
Graham Packaging Holdings Co., | | | | | | | | | | | | | |
Sr. Disc. Notes | | Caa2 | | 10.75 | | 1/15/09 | | | 10,675 | | | | 11,021,938 |
Sr. Sub. Notes, Ser. B | | Caa1 | | 8.75 | | 1/15/08 | | | 6,850 | | | | 7,004,125 |
Graphic Packaging International Corp. | | | | | | | | | | | | | |
Sr. Notes | | B2 | | 8.50 | | 8/15/11 | | | 1,750 | | | | 1,916,250 |
Sr. Sub. Notes | | B3 | | 9.50 | | 8/15/13 | | | 1,340 | | | | 1,480,700 |
Greif Brothers Corp.,
Sr. Sub. Notes | | B2 | | 8.875 | | 8/1/12 | | | 6,595 | | | | 7,254,500 |
Norampac, Inc., Sr. Notes | | Ba2 | | 6.75 | | 6/1/13 | | | 4,500 | | | | 4,691,250 |
Owens-Brockway Glass Container, | | | | | | | | | | | | | |
Gtd. Notes | | B1 | | 7.75 | | 5/15/11 | | | 11,250 | (g) | | | 12,079,687 |
Sec’d. Notes | | B1 | | 8.75 | | 11/15/12 | | | 2,265 | (g) | | | 2,522,644 |
Silgan Holdings, Inc., Sr. Sub. Notes | | B1 | | 6.75 | | 11/15/13 | | | 2,500 | (g) | | | 2,506,250 |
| | | | | | | | | | | | |
|
|
| | | | | | | | | | | | | | 71,062,200 |
See Notes to Financial Statements.
| | |
| 10 | | Visit our website at www.jennisondryden.com |
| | | | | | | | | | | | | |
| | | | | |
| Description | | Moody’s
Rating
(Unaudited) | | Interest
Rate | | Maturity
Date | | Principal
Amount (000) | | | Value (Note 1) |
| | | | | | | | | | | | | | |
Energy 9.5% | | | | | | | | | |
|
AmeriGas Partners & Eagle, Sr. Notes, Ser. B | | B2 | | 8.875% | | 5/20/11 | | $ | 4,600 | | | $ | 5,060,000 |
Chesapeake Energy Corp., Sr. Notes | | Ba3 | | 6.875 | | 1/15/16 | | | 4,925 | (g) | | | 5,072,750 |
Cogentrix, Inc., Sr. Notes | | B1 | | 8.10 | | 3/15/04 | | | 1,850 | | | | 1,845,375 |
Edison Mission Energy, | | | | | | | | | | | | | |
Sr. Notes | | B2 | | 7.73 | | 6/15/09 | | | 8,715 | | | | 8,301,038 |
Sr. Notes | | B2 | | 9.875 | | 4/15/11 | | | 1,250 | | | | 1,300,000 |
El Paso Corp., Sr. Notes | | Caa1 | | 7.00 | | 5/15/11 | | | 10,400 | (g) | | | 9,594,000 |
El Paso Energy Partners LP, Sr. Sub. Notes | | B1 | | 8.50 | | 6/1/11 | | | 519 | | | | 583,875 |
El Paso Production Holdings, Sr. Notes | | B2 | | 7.75 | | 6/1/13 | | | 15,825 | | | | 15,587,625 |
Empresa Nacional de Electricidad SA (Chile), | | | | | | | | | | | | | |
Notes | | Ba2 | | 7.75 | | 7/15/08 | | | 3,000 | (i) | | | 3,274,614 |
Notes | | Ba2 | | 8.35 | | 8/1/13 | | | 8,765 | (g)(i) | | | 9,853,113 |
Notes | | Ba2 | | 8.625 | | 8/1/15 | | | 5,650 | (i) | | | 6,437,051 |
Eott Energy Partners LP, | | | | | | | | | | | | | |
Sr. Notes, PIK | | NR | | 9.00 | | 3/1/10 | | | 439 | (i) | | | 432,647 |
Ferrellgas Partner LP,
Sr. Notes | | B2 | | 8.75 | | 6/15/12 | | | 2,590 | | | | 2,849,000 |
Forest Oil Corp., | | | | | | | | | | | | | |
Sr. Notes | | Ba3 | | 8.00 | | 6/15/08 | | | 3,500 | (g) | | | 3,815,000 |
Sr. Notes | | Ba3 | | 8.00 | | 12/15/11 | | | 7,199 | | | | 7,864,908 |
Gazprom, Notes | | BB-(a) | | 9.625 | | 3/1/13 | | | 7,700 | (g) | | | 8,489,250 |
Gemstone Investors Ltd., Gtd. Notes | | Caa1 | | 7.71 | | 10/31/04 | | | 1,055 | | | | 1,065,550 |
GulfTerra Energy Partners, L.P., Sr. Notes | | Ba3 | | 6.25 | | 6/1/10 | | | 2,600 | | | | 2,704,000 |
Hanover Compressor Co., Sr. Notes | | B3 | | 8.625 | | 12/15/10 | | | 2,075 | (g) | | | 2,158,000 |
Hanover Equipment Trust, Sec’d. Notes, Ser. B | | B2 | | 8.75 | | 9/1/11 | | | 7,325 | (g) | | | 7,764,500 |
Homer City Funding LLC, Gtd. Notes | | Ba2 | | 8.137 | | 10/1/19 | | | 4,000 | | | | 4,300,000 |
Houston Exploration Co.,
Sr. Sub. Notes | | B2 | | 7.00 | | 6/15/13 | | | 2,350 | | | | 2,426,375 |
See Notes to Financial Statements.
| | |
| Dryden High Yield Fund, Inc. | | 11 |
Portfolio Of Investments
as of December 31, 2003 Cont’d.
| | | | | | | | | | | | | |
| | | | | |
| Description | | Moody’s
Rating
(Unaudited) | | Interest
Rate | | Maturity
Date | | Principal
Amount (000) | | | Value (Note 1) |
| | | | | | | | | | | | | | |
Leviathan Gas Pipeline Corp., Sr. Sub. Notes | | B1 | | 10.375% | | 6/1/09 | | $ | 4,750 | | | $ | 5,153,750 |
Magnum Hunter Resources, Inc., Sr. Notes | | B2 | | 9.60 | | 3/15/12 | | | 4,250 | | | | 4,823,750 |
Paramount Resources Ltd., Sr. Notes | | B2 | | 7.875 | | 11/1/10 | | | 5,125 | | | | 5,099,375 |
Parker & Parsley Petroleum Co., Sr. Notes | | Ba1 | | 8.875 | | 4/15/05 | | | 2,000 | | | | 2,140,498 |
Plains All American Pipeline LP, Gtd. Notes | | Ba1 | | 7.75 | | 10/15/12 | | | 1,120 | | | | 1,292,200 |
Premcor Refining Group, Inc., | | | | | | | | | | | | | |
Sr. Notes | | Ba3 | | 9.50 | | 2/1/13 | | | 6,550 | | | | 7,467,000 |
Sr. Sub. Notes | | B2 | | 7.75 | | 2/1/12 | | | 2,875 | (g) | | | 2,961,250 |
Stone Energy Corp.,
Sr. Sub. Notes | | B2 | | 8.25 | | 12/15/11 | | | 2,000 | | | | 2,180,000 |
Tennessee Gas Pipeline Co., | | | | | | | | | | | | | |
Deb. | | B1 | | 7.00 | | 3/15/27 | | | 4,355 | (g) | | | 4,518,312 |
Deb. | | B1 | | 7.00 | | 10/15/28 | | | 3,200 | | | | 3,040,000 |
Deb. | | B1 | | 7.625 | | 4/1/37 | | | 8,615 | | | | 8,485,775 |
TransMontaigne, Inc.,
Sr. Sub. Notes | | B3 | | 9.125 | | 6/1/10 | | | 3,900 | | | | 4,182,750 |
Vintage Petroleum, Inc., | | | | | | | | | | | | | |
Sr. Notes | | Ba3 | | 8.25 | | 5/1/12 | | | 3,010 | | | | 3,273,375 |
Sr. Sub. Notes | | B1 | | 9.75 | | 6/30/09 | | | 1,530 | | | | 1,610,325 |
Sr. Sub. Notes | | B1 | | 7.875 | | 5/15/11 | | | 1,750 | (g) | | | 1,846,250 |
Westar Energy, Inc.,
1st Mtge. | | Ba1 | | 7.875 | | 5/1/07 | | | 3,230 | | | | 3,609,525 |
Williams Cos., Inc., | | | | | | | | | | | | | |
Notes | | B3 | | 9.25 | | 3/15/04 | | | 1,865 | | | | 1,888,313 |
Notes | | B3 | | 7.125 | | 9/1/11 | | | 10,275 | (g) | | | 10,865,812 |
Notes | | B3 | | 8.125 | | 3/15/12 | | | 6,110 | (g) | | | 6,782,100 |
Sr. Notes | | B3 | | 8.625 | | 6/1/10 | | | 9,525 | (g) | | | 10,691,812 |
| | | | | | | | | | | | |
|
|
| | | | | | | | | | | | | | 202,690,843 |
| | | |
Food/Beverages/Bottling 3.0% | | | | | | | | | |
|
Agrilink Foods, Inc.,
Sr. Sub. Notes | | B3 | | 11.875 | | 11/1/08 | | | 1,558 | | | | 1,655,375 |
Ahold Finance USA, Inc. (Netherlands), Notes | | B1 | | 8.25 | | 7/15/10 | | | 1,840 | (g)(i) | | | 2,005,600 |
Carrols Corp.,
Sr. Sub. Notes | | B3 | | 9.50 | | 12/1/08 | | | 9,000 | | | | 9,135,000 |
See Notes to Financial Statements.
| | |
| 12 | | Visit our website at www.jennisondryden.com |
| | | | | | | | | | | | | |
| | | | | |
| Description | | Moody’s
Rating
(Unaudited) | | Interest
Rate | | Maturity
Date | | Principal
Amount (000) | | | Value (Note 1) |
| | | | | | | | | | | | | | |
Del Monte Corp.,
Sr. Sub. Notes | | B2 | | 8.625% | | 12/15/12 | | $ | 4,400 | | | $ | 4,818,000 |
Delhaize America, Inc.,
Gtd. Notes | | Ba1 | | 8.125 | | 4/15/11 | | | 11,695 | (g) | | | 13,449,250 |
Dole Food Co., Inc. | | | | | | | | | | | | | |
Gtd. Notes | | B2 | | 7.25 | | 6/15/10 | | | 2,150 | | | | 2,214,500 |
Sr. Notes | | B2 | | 8.625 | | 5/1/09 | | | 7,100 | | | | 7,792,250 |
Dominos, Inc.,
Sr. Sub. Notes | | B3 | | 8.25 | | 7/1/11 | | | 2,950 | | | | 3,160,187 |
Iowa Select Farms LP, Sec’d. Notes, PIK | | NR | | 10.75 | | 12/1/06 | | | 665 | | | | 332,353 |
Merisant Co., Gtd. Notes | | B3 | | 9.50 | | 7/15/13 | | | 1,875 | | | | 1,996,875 |
National Restaurant Enterprises Holding, Inc., | | | | | | | | | | | | | |
Sr. Notes | | NR | | 10.75 | | 11/15/07 | | | 1,090 | (d)(e) | | | 11 |
Sr. Notes, PIK | | NR | | 13.00 | | 5/15/08 | | | 1,320 | (d)(e) | | | 13 |
Smithfield Foods, Inc., | | | | | | | | | | | | | |
Sr. Notes | | Ba2 | | 8.00 | | 10/15/09 | | | 1,450 | (g) | | | 1,529,750 |
Sr. Notes | | Ba2 | | 7.75 | | 5/15/13 | | | 3,750 | | | | 3,900,000 |
Specialty Foods Acquisition Corp., Sr. Sec’d.
Disc. Deb. | | NR | | 13.00 | | 6/15/09 | | | 460 | (f) | | | 5 |
Tricon Global
Restaurants, Inc., | | | | | | | | | | | | | |
Sr. Notes | | Ba1 | | 8.50 | | 4/15/06 | | | 3,000 | | | | 3,337,500 |
Sr. Notes | | Ba1 | | 8.875 | | 4/15/11 | | | 8,000 | | | | 9,700,000 |
| | | | | | | | | | | | |
|
|
| | | | | | | | | | | | | | 65,026,669 |
| | | | | |
Gaming 4.9% | | | | | | | | | | | | | |
|
Argosy Gaming Co.,
Sr. Sub. Notes | | B2 | | 9.00 | | 9/1/11 | | | 2,355 | (g) | | | 2,608,163 |
Aztar Corp., Sr. Sub. Notes | | Ba3 | | 9.00 | | 8/15/11 | | | 400 | | | | 439,000 |
Boyd Gaming Corp.,
Sr. Sub. Notes | | B1 | | 8.75 | | 4/15/12 | | | 2,800 | | | | 3,073,000 |
Circus Circus Enterprises, Inc., Notes | | Ba2 | | 6.45 | | 2/1/06 | | | 2,925 | | | | 3,049,312 |
Coast Hotels & Casinos, Inc., Sr. Sub. Notes | | B2 | | 9.50 | | 4/1/09 | | | 8,000 | (g) | | | 8,460,000 |
Isle of Capri Casinos, Inc., Sr. Sub. Notes | | B2 | | 9.00 | | 3/15/12 | | | 910 | (g) | | | 1,012,375 |
See Notes to Financial Statements.
| | |
| Dryden High Yield Fund, Inc. | | 13 |
Portfolio Of Investments
as of December 31, 2003 Cont’d.
| | | | | | | | | | | | | |
| | | | | |
| Description | | Moody’s
Rating
(Unaudited) | | Interest
Rate | | Maturity
Date | | Principal
Amount (000) | | | Value (Note 1) |
| | | | | | | | | | | | | | |
Kerzner International Ltd. (Bahamas), Gtd. Notes | | B2 | | 8.875% | | 8/15/11 | | $ | 9,670 | (i) | | $ | 10,564,475 |
Mandalay Resort Group,,
Sr. Notes | | Ba2 | | 9.50 | | 8/1/08 | | | 3,500 | (g) | | | 4,086,250 |
MGM Mirage, Inc., | | | | | | | | | | | | | |
Gtd. Notes | | Ba2 | | 9.75 | | 6/1/07 | | | 10,300 | | | | 11,742,000 |
Gtd. Notes | | Ba1 | | 6.00 | | 10/1/09 | | | 10,350 | | | | 10,634,625 |
Mohegan Tribal Gaming Authority, | | | | | | | | | | | | | |
Sr. Sub. Notes | | Ba3 | | 6.375 | | 7/15/09 | | | 3,765 | | | | 3,887,362 |
Sr. Sub. Notes | | Ba3 | | 8.00 | | 4/1/12 | | | 2,810 | | | | 3,041,825 |
Park Place Entertainment Corp., | | | | | | | | | | | | | |
Sr. Notes | | Ba1 | | 8.50 | | 11/15/06 | | | 1,275 | | | | 1,412,063 |
Sr. Sub. Notes | | Ba2 | | 7.875 | | 12/15/05 | | | 3,500 | (g) | | | 3,749,375 |
Sr. Sub. Notes | | Ba2 | | 9.375 | | 2/15/07 | | | 2,100 | | | | 2,378,250 |
Sr. Sub. Notes | | Ba2 | | 8.875 | | 9/15/08 | | | 2,240 | | | | 2,536,800 |
Sr. Sub. Notes | | Ba2 | | 7.875 | | 3/15/10 | | | 1,855 | (g) | | | 2,054,412 |
Sr. Sub. Notes | | Ba2 | | 8.125 | | 5/15/11 | | | 2,000 | (g) | | | 2,242,500 |
Station Casinos, Inc.,
Sr. Sub. Notes | | B2 | | 9.875 | | 7/1/10 | | | 11,832 | (g) | | | 13,015,200 |
Venetian Casino Resort LLC, Gtd. Notes | | B3 | | 11.00 | | 6/15/10 | | | 13,345 | | | | 15,480,200 |
| | | | | | | | | | | | |
|
|
| | | | | | | | | | | | | | 105,467,187 |
| | | | | |
Healthcare 6.2% | | | | | | | | | | | | | |
|
Alliance Imaging, Inc.,
Sr. Sub. Notes | | B3 | | 10.375 | | 4/15/11 | | | 8,775 | (g) | | | 9,301,500 |
Concentra Operating Corp., Sr. Sub. Notes, Ser. 981B | | B3 | | 13.00 | | 8/15/09 | | | 6,525 | | | | 7,275,375 |
Fresenius Med. Care Capital Trust, Gtd. Notes | | Ba2 | | 7.875 | | 6/15/11 | | | 110 | | | | 118,800 |
HCA, Inc. | | | | | | | | | | | | | |
Deb. | | Ba1 | | 7.50 | | 11/15/95 | | | 4,985 | | | | 4,774,359 |
Notes | | Ba1 | | 8.85 | | 1/1/07 | | | 4,632 | | | | 5,237,245 |
Notes | | Ba1 | | 8.70 | | 2/10/10 | | | 4,150 | | | | 4,911,981 |
Notes | | Ba1 | | 9.00 | | 12/15/14 | | | 6,500 | | | | 7,866,352 |
Notes | | Ba1 | | 7.69 | | 6/15/25 | | | 3,440 | | | | 3,630,263 |
HEALTHSOUTH Corp., | | | | | | | | | | | | | |
Sr. Notes | | NR | | 6.875 | | 6/15/05 | | | 810 | (e)(g) | | | 775,575 |
Sr. Notes | | NR | | 8.50 | | 2/1/08 | | | 5,925 | (e)(g) | | | 5,688,000 |
See Notes to Financial Statements.
| | |
| 14 | | Visit our website at www.jennisondryden.com |
| | | | | | | | | | | | | |
| | | | | |
| Description | | Moody’s
Rating
(Unaudited) | | Interest
Rate | | Maturity
Date | | Principal
Amount (000) | | | Value (Note 1) |
| | | | | | | | | | | | | | |
Magellan Health Services, Inc., Sr. Notes | | D(a) | | 9.375% | | 11/15/07 | | $ | 4,755 | (e) | | $ | 4,992,750 |
Mariner Health Care, Inc., Sr. Sub. Notes | | B3 | | 8.25 | | 12/15/13 | | | 5,100 | | | | 5,151,000 |
Medco Health Solutions, Inc., Sr. Notes | | Ba1 | | 7.25 | | 8/15/13 | | | 4,000 | (g) | | | 4,363,800 |
Medquest, Inc., Gtd.
Notes, Ser. B | | B3 | | 11.875 | | 8/15/12 | | | 8,050 | | | | 8,794,625 |
NeighborCare, Inc.,
Sr. Sub. Notes | | Ba3 | | 6.875 | | 11/15/13 | | | 2,500 | | | | 2,543,750 |
Quintiles Transnational Corp., Sr. Sub. Notes | | B3 | | 10.00 | | 10/1/13 | | | 6,825 | | | | 7,371,000 |
Res-Care, Inc., Sr. Notes | | B2 | | 10.625 | | 11/15/08 | | | 6,000 | | | | 6,210,000 |
Select Medical Corp., | | | | | | | | | | | | | |
Sr. Sub. Notes | | B2 | | 9.50 | | 6/15/09 | | | 3,690 | (g) | | | 4,049,775 |
Sr. Sub. Notes | | B2 | | 7.50 | | 8/1/13 | | | 2,725 | | | | 2,888,500 |
Service Corp. Int’l., | | | | | | | | | | | | | |
Notes | | B1 | | 6.50 | | 3/15/08 | | | 6,195 | (g) | | | 6,365,363 |
Sr. Notes | | B1 | | 6.00 | | 12/15/05 | | | 870 | | | | 887,400 |
Tenet Healthcare Corp., | | | | | | | | | | | | | |
Sr. Notes | | B1 | | 5.375 | | 11/15/06 | | | 3,025 | | | | 2,979,625 |
Sr. Notes | | B1 | | 6.375 | | 12/1/11 | | | 1,850 | (g) | | | 1,776,000 |
Sr. Notes | | B1 | | 6.50 | | 6/1/12 | | | 9,950 | | | | 9,539,562 |
Triad Hospitals, Inc., | | | | | | | | | | | | | |
Gtd. Notes, Ser. B | | B1 | | 8.75 | | 5/1/09 | | | 2,840 | | | | 3,077,850 |
Sr. Sub. Notes | | B3 | | 7.00 | | 11/15/13 | | | 3,650 | | | | 3,677,375 |
US Healthworks, Inc.,
Sr. Disc. Notes | | NR | | 17.00 | | 11/15/04 | | | 2,044 | | | | 2,187,584 |
Valeant Pharmaceuticals International, Sr. Notes | | B1 | | 7.00 | | 12/15/11 | | | 4,725 | | | | 4,866,750 |
| | | | | | | | | | | | |
|
|
| | | | | | | | | | | | | | 131,302,159 |
See Notes to Financial Statements.
| | |
| Dryden High Yield Fund, Inc. | | 15 |
Portfolio Of Investments
as of December 31, 2003 Cont’d.
| | | | | | | | | | | | | |
| | | | | |
| Description | | Moody’s
Rating
(Unaudited) | | Interest
Rate | | Maturity
Date | | Principal
Amount (000) | | | Value (Note 1) |
| | | | | | | | | | | | | | |
Industrials/Services 5.5% | | | | | | | | | | | |
|
Alliant Techsystems, Inc., Sr. Sub. Notes | | B2 | | 8.50% | | 5/15/11 | | $ | 2,955 | | | $ | 3,250,500 |
Allied Waste of North America, Inc., | | | | | | | | | | | | | |
Gtd. Notes, Ser. B | | Ba3 | | 8.50 | | 12/1/08 | | | 4,785 | (g) | | | 5,323,313 |
Sr. Notes | | Ba3 | | 7.875 | | 1/1/09 | | | 17,400 | (g) | | | 18,139,500 |
Sr. Sub. Notes | | B2 | | 10.00 | | 8/1/09 | | | 10,690 | (g) | | | 11,545,200 |
AMSTED Industries, Inc.,
Sr. Notes | | B3 | | 10.25 | | 10/15/11 | | | 4,200 | | | | 4,641,000 |
Browning-Ferris Industrials, Inc., Sr. Deb. | | Ba3 | | 7.40 | | 9/15/35 | | | 5,000 | | | | 4,737,500 |
Case New Holland, Inc.,
Sr. Notes | | Ba3 | | 9.25 | | 8/1/11 | | | 5,650 | (g) | | | 6,328,000 |
International Wire Group, Inc., | | | | | | | | | | | | | |
Gtd. Notes | | Ca | | 11.75 | | 6/1/05 | | | 1,310 | | | | 805,650 |
Sr. Sub. Notes | | Ca | | 11.75 | | 6/1/05 | | | 134 | | | | 82,410 |
Iron Mountain, Inc.,
Sr. Sub. Notes | | B2 | | 8.625 | | 4/1/13 | | | 4,550 | | | | 4,914,000 |
Johnsondiversey Holdings, Inc., Disc. Notes | | B3 | | Zero | | 5/15/13 | | | 4,535 | | | | 3,469,275 |
Manitowoc Co., Inc.,
Gtd. Notes | | B2 | | 10.50 | | 8/1/12 | | | 5,775 | (g) | | | 6,576,281 |
Moore North America Finance, Sr. Notes | | B1 | | 7.875 | | 1/15/11 | | | 3,900 | | | | 4,416,750 |
Motors & Gears, Inc.,
Sr. Notes | | Caa1 | | 10.75 | | 11/15/06 | | | 7,550 | | | | 6,417,500 |
SPX Corp., Sr. Notes | | Ba3 | | 6.25 | | 6/15/11 | | | 2,275 | | | | 2,337,563 |
Terex Corp., | | | | | | | | | | | | | |
Sr. Sub. Notes | | B3 | | 10.375 | | 4/1/11 | | | 10,830 | (g) | | | 12,129,600 |
Sr. Sub. Notes | | B3 | | 9.25 | | 7/15/11 | | | 1,845 | | | | 2,029,500 |
Thermadyne Holdings Corp., Sr. Disc. Notes | | C | | 12.50 | | 6/1/08 | | | 2,500 | (e) | | | 25 |
Tyco Int’l. Group SA, | | | | | | | | | | | | | |
Gtd. Notes | | Ba2 | | 6.125 | | 11/1/08 | | | 1,175 | | | | 1,257,250 |
Gtd. Notes | | Ba2 | | 6.75 | | 2/15/11 | | | 2,560 | | | | 2,796,800 |
Gtd. Notes | | Ba2 | | 6.375 | | 10/15/11 | | | 4,450 | (g) | | | 4,755,938 |
Notes | | Ba2 | | 2.75 | | 1/15/18 | | | 4,950 | | | | 6,317,437 |
Notes | | Ba2 | | 3.125 | | 1/15/23 | | | 2,750 | | | | 3,760,625 |
Sr. Notes | | Ba2 | | 6.375 | | 2/15/06 | | | 1,200 | (g) | | | 1,278,000 |
| | | | | | | | | | | | |
|
|
| | | | | | | | | | | | | | 117,309,617 |
See Notes to Financial Statements.
| | |
| 16 | | Visit our website at www.jennisondryden.com |
| | | | | | | | | | | | | |
| | | | | |
| Description | | Moody’s
Rating
(Unaudited) | | Interest
Rate | | Maturity
Date | | Principal
Amount (000) | | | Value (Note 1) |
| | | | | | | | | | | | | | |
Lodging & Leisure 6.5% | | | | | | | | | | | | | |
|
Extended Stay America, Inc., Sr. Sub. Notes | | B2 | | 9.15% | | 3/15/08 | | $ | 6,050 | (g) | | $ | 6,299,563 |
Felcor Lodging LP | | | | | | | | | | | | | |
Gtd. Notes | | B1 | | 9.00 | | 6/1/11 | | | 4,825 | (g) | | | 5,235,125 |
Sr. Notes | | B1 | | 10.00 | | 9/15/08 | | | 8,445 | | | | 9,120,600 |
Felcor Suites LP | | | | | | | | | | | | | |
Gtd. Notes | | B1 | | 7.625 | | 10/1/07 | | | 3,425 | (g) | | | 3,527,750 |
Gtd. Sr. Notes | | B1 | | 7.375 | | 10/1/04 | | | 820 | (g) | | | 839,475 |
Gaylord Entertainment Co., Sr. Notes | | B3 | | 8.00 | | 11/15/13 | | | 3,865 | (g) | | | 4,077,575 |
Hilton Hotels Corp.,
Sr. Notes | | Ba1 | | 7.50 | | 12/15/17 | | | 6,695 | | | | 7,113,437 |
HMH Properties, Inc., | | | | | | | | | | | | | |
Gtd. Notes, Ser. B | | Ba3 | | 7.875 | | 8/1/08 | | | 6,690 | (g) | | | 6,957,600 |
Sr. Notes, Ser. C | | Ba3 | | 8.45 | | 12/1/08 | | | 1,801 | | | | 1,877,542 |
Host Marriott Corp., | | | | | | | | | | | | | |
Gtd. Notes, Ser. E | | Ba3 | | 8.375 | | 2/15/06 | | | 1,775 | (g) | | | 1,892,594 |
Gtd. Notes, Ser. I | | Ba3 | | 9.50 | | 1/15/07 | | | 11,115 | (g) | | | 12,365,437 |
Sr. Notes | | Ba3 | | 7.125 | | 11/1/13 | | | 10,000 | (g) | | | 10,200,000 |
Intrawest Corp. (Canada), Sr. Notes | | B1 | | 10.50 | | 2/1/10 | | | 9,570 | (i) | | | 10,574,850 |
ITT Corp., | | | | | | | | | | | | | |
Deb. | | Ba1 | | 7.375 | | 11/15/15 | | | 7,000 | | | | 7,490,000 |
Notes | | Ba1 | | 6.75 | | 11/15/05 | | | 7,365 | (g) | | | 7,733,250 |
La Quinta Inns, Inc.,
Sr. Notes | | Ba3 | | 7.40 | | 9/15/05 | | | 1,200 | | | | 1,251,000 |
Meditrust Corp., Notes | | Ba3 | | 7.00 | | 8/15/07 | | | 1,150 | | | | 1,194,563 |
Royal Caribbean Cruises Ltd., | | | | | | | | | | | | | |
Sr. Notes | | Ba2 | | 8.125 | | 7/28/04 | | | 2,665 | (g) | | | 2,751,613 |
Sr. Notes | | Ba2 | | 8.75 | | 2/2/11 | | | 850 | (g) | | | 960,500 |
Sr. Notes | | Ba2 | | 6.875 | | 12/1/13 | | | 4,625 | | | | 4,659,687 |
Six Flags, Inc., | | | | | | | | | | | | | |
Sr. Notes | | B2 | | 9.75 | | 6/15/07 | | | 7,101 | (g) | | | 7,447,174 |
Sr. Notes | | B2 | | 9.50 | �� | 2/1/09 | | | 1,750 | (g) | | | 1,833,125 |
Sr. Notes | | B2 | | 9.625 | | 6/1/14 | | | 3,750 | | | | 3,918,750 |
Starwood Hotels & Resorts Worldwide, Inc., | | | | | | | | | | | | | |
Gtd. Notes | | Ba1 | | 7.375 | | 5/1/07 | | | 10,500 | | | | 11,340,000 |
Gtd. Notes | | Ba1 | | 7.875 | | 5/1/12 | | | 2,390 | (g) | | | 2,688,750 |
See Notes to Financial Statements.
| | |
| Dryden High Yield Fund, Inc. | | 17 |
Portfolio Of Investments
as of December 31, 2003 Cont’d.
| | | | | | | | | | | | | |
| | | | | |
| Description | | Moody’s
Rating
(Unaudited) | | Interest
Rate | | Maturity
Date | | Principal
Amount (000) | | | Value (Note 1) |
| | | | | | | | | | | | | | |
Vail Resorts, Inc.,
Sr. Sub. Notes | | B2 | | 8.75% | | 5/15/09 | | $ | 4,250 | | | $ | 4,483,750 |
| | | | | | | | | | | | |
|
|
| | | | | | | | | | | | | | 137,833,710 |
| | | | | |
Media 5.0% | | | | | | | | | | | | | |
|
Alliance Atlantis Communications, Inc. (Canada), Sr. Sub. Notes | | B1 | | 13.00 | | 12/15/09 | | | 8,125 | (i) | | | 9,262,500 |
American Media Operations, Inc., Notes, Ser. B | | B2 | | 10.25 | | 5/1/09 | | | 1,325 | | | | 1,412,781 |
CanWest Media, Inc. (Canada), | | | | | | | | | | | | | |
Gtd. Notes | | B1 | | 7.625 | | 4/15/13 | | | 1,775 | (i) | | | 1,943,625 |
Sr. Sub. Notes | | B2 | | 10.625 | | 5/15/11 | | | 5,600 | (i) | | | 6,398,000 |
Dex Media East LLC,
Gtd. Notes | | B3 | | 12.125 | | 11/15/12 | | | 5,750 | (g) | | | 7,072,500 |
Dex Media West LLC,
Sr. Sub. Notes | | B3 | | 9.875 | | 8/15/13 | | | 16,025 | (g) | | | 18,629,062 |
Dex Media, Inc., Notes | | Caa1 | | 8.00 | | 11/15/13 | | | 2,645 | (g) | | | 2,777,250 |
Granite Broadcasting Corp., Sec’d. Notes | | B3 | | 9.75 | | 12/1/10 | | | 5,800 | (g) | | | 5,785,500 |
Gray Television, Inc.,
Sr. Sub. Notes | | B2 | | 9.25 | | 12/15/11 | | | 5,980 | | | | 6,667,700 |
Morris Publishing Group LLC, Sr. Sub. Notes | | Ba3 | | 7.00 | | 8/1/13 | | | 625 | | | | 634,375 |
Phoenix Color Corp.,
Sr. Sub. Notes | | Caa2 | | 10.375 | | 2/1/09 | | | 1,000 | | | | 891,250 |
Quebecor Media, Inc. (Canada), Sr. Disc.
Notes, Zero Coupon
(until 7/15/06) | | B2 | | 13.75 | | 7/15/11 | | | 10,000 | (g)(i) | | | 8,812,500 |
Regal Cinemas, Inc.,
Sr. Sub. Notes | | B2 | | 9.375 | | 2/1/12 | | | 3,005 | (g) | | | 3,395,650 |
RH Donnelley Finance Corp. Sr. Sub. Notes | | B2 | | 10.875 | | 12/15/12 | | | 5,675 | (g) | | | 6,731,969 |
Sinclair Broadcast
Group, Inc., | | | | | | | | | | | | | |
Sr. Sub. Notes | | B2 | | 8.75 | | 12/15/11 | | | 4,100 | (g) | | | 4,551,000 |
Sr. Sub. Notes | | B2 | | 8.00 | | 3/15/12 | | | 7,575 | | | | 8,181,000 |
See Notes to Financial Statements.
| | |
| 18 | | Visit our website at www.jennisondryden.com |
| | | | | | | | | | | | | |
| | | | | |
| Description | | Moody’s
Rating
(Unaudited) | | Interest
Rate | | Maturity
Date | | Principal
Amount (000) | | | Value (Note 1) |
| | | | | | | | | | | | | | |
Vertis, Inc., | | | | | | | | | | | | | |
Gtd. Notes, Ser. B | | B3 | | 10.875% | | 6/15/09 | | $ | 4,600 | | | $ | 4,887,500 |
Sec’d. Notes | | B2 | | 9.75 | | 4/1/09 | | | 7,750 | | | | 8,418,438 |
| | | | | | | | | | | | |
|
|
| | | | | | | | | | | | | | 106,452,600 |
| | | | | |
Metals & Mining 1.7% | | | | | | | | | | | | | |
|
AK Steel Corp., | | | | | | | | | | | | | |
Gtd. Notes | | B3 | | 7.875 | | 2/15/09 | | | 4,010 | | | | 3,518,775 |
Gtd. Notes | | B3 | | 7.75 | | 6/15/12 | | | 10,915 | (g) | | | 9,332,325 |
Arch Western Finance LLC, Sr. Notes | | Ba2 | | 6.75 | | 7/1/13 | | | 2,420 | | | | 2,486,550 |
Century Aluminum Co.,
Sr. Sec’d. 1st Mtge. | | B1 | | 11.75 | | 4/15/08 | | | 5,120 | | | | 5,708,800 |
CSN Islands VII Corp.,
Gtd. Notes | | B1 | | 10.75 | | 9/12/08 | | | 5,290 | | | | 5,832,225 |
LTV Corp., Sr. Notes | | NR | | 11.75 | | 11/15/09 | | | 7,305 | (e) | | | 109,575 |
Lukens, Inc., Sr. Notes | | NR | | 6.50 | | 2/1/06 | | | 5,000 | (e) | | | 50,000 |
Sheffield Steel Corp.,
Sec’d. Notes | | NR | | 10.00 | | 4/30/07 | | | 2,736 | | | | 1,641,641 |
Steel Dynamics, Inc. | | B1 | | 9.50 | | 3/15/09 | | | 4,425 | | | | 4,911,750 |
UCAR Finance, Inc.,
Sr. Notes | | B3 | | 10.25 | | 2/15/12 | | | 2,375 | | | | 2,731,250 |
| | | | | | | | | | | | |
|
|
| | | | | | | | | | | | | | 36,322,891 |
| | | | |
Paper & Forest Products 2.8% | | | | | | | | | | | |
|
Boise Cascade Corp.,
Sr. Notes | | Ba2 | | 6.50 | | 11/1/10 | | | 3,600 | | | | 3,755,372 |
Cascades, Inc., Sr. Notes | | Ba1 | | 7.25 | | 2/15/13 | | | 9,450 | | | | 9,969,750 |
Fort James Corp., Sr. Notes | | Ba2 | | 6.625 | | 9/15/04 | | | 5,000 | (g) | | | 5,100,000 |
Georgia-Pacific Corp., | | | | | | | | | | | | | |
Deb. | | Ba3 | | 7.70 | | 6/15/15 | | | 4,000 | | | | 4,160,000 |
Deb. | | Ba3 | | 8.625 | | 4/30/25 | | | 970 | (g) | | | 1,003,950 |
Gtd. Notes | | Ba2 | | 9.375 | | 2/1/13 | | | 8,770 | (g) | | | 10,085,500 |
Notes | | Ba3 | | 8.875 | | 5/15/31 | | | 3,400 | | | | 3,740,000 |
Millar Western Forest Products Ltd., Sr. Notes | | B3 | | 7.75 | | 11/15/13 | | | 4,775 | | | | 4,954,063 |
Smurfit-Stone Container Corp., Sr. Notes | | B2 | | 8.25 | | 10/1/12 | | | 3,900 | | | | 4,231,500 |
Stone Container Corp. (Canada), | | | | | | | | | | | | | |
Sr. Notes | | B2 | | 11.50 | | 8/15/06 | | | 5,670 | (i) | | | 5,953,500 |
See Notes to Financial Statements.
| | |
| Dryden High Yield Fund, Inc. | | 19 |
Portfolio Of Investments
as of December 31, 2003 Cont’d.
| | | | | | | | | | | | | |
| | | | | |
| Description | | Moody’s
Rating
(Unaudited) | | Interest
Rate | | Maturity
Date | | Principal
Amount (000) | | | Value (Note 1) |
| | | | | | | | | | | | | | |
Sr. Notes | | B2 | | 9.75% | | 2/1/11 | | $ | 2,000 | (i) | | $ | 2,210,000 |
Sr. Notes | | B2 | | 8.375 | | 7/1/12 | | | 1,100 | (i) | | | 1,193,500 |
Tembec Industries, Inc., Gtd. Notes | | Ba3 | | 7.75 | | 3/15/12 | | | 3,905 | | | | 3,885,475 |
| | | | | | | | | | | | |
|
|
| | | | | | | | | | | | | | 60,242,610 |
| | | |
Real Estate Investment Trust 1.2% | | | | | | | | | |
|
La Quinta Properties, Inc. | | Ba3 | | 8.875 | | 3/15/11 | | | 5,950 | | | | 6,582,187 |
Senior Housing Trust,
Sr. Notes | | Ba2 | | 8.625 | | 1/15/12 | | | 6,000 | | | | 6,540,000 |
Ventas Realty LP, | | | | | | | | | | | | | |
Sr. Notes | | Ba3 | | 8.75 | | 5/1/09 | | | 4,000 | (g) | | | 4,390,000 |
Sr. Notes | | Ba3 | | 9.00 | | 5/1/12 | | | 6,525 | | | | 7,242,750 |
| | | | | | | | | | | | |
|
|
| | | | | | | | | | | | | | 24,754,937 |
| | | | |
Retail & Supermarkets 3.7% | | | | | | | | | | | |
|
Asbury Automotive Group, Inc., Sr. Sub. Notes | | B3 | | 8.00 | | 3/15/14 | | | 2,800 | | | | 2,814,000 |
AutoNation, Inc., Sr. Notes | | Ba2 | | 9.00 | | 8/1/08 | | | 2,000 | | | | 2,295,000 |
Dillards, Inc., Notes | | B2 | | 6.43 | | 8/1/04 | | | 995 | | | | 1,007,438 |
JC Penney Co., Inc., | | | | | | | | | | | | | |
Deb. | | Ba3 | | 8.25 | | 8/15/22 | | | 1,831 | (g) | | | 1,892,796 |
Deb. | | Ba3 | | 7.40 | | 4/1/37 | | | 6,390 | | | | 6,941,138 |
Notes | | Ba3 | | 8.00 | | 3/1/10 | | | 3,650 | (g) | | | 4,183,812 |
Montgomery Ward & Co. | | NR | | Zero | | 1/1/49 | | | 2,450 | | | | 245 |
Pantry, Inc., Sr. Sub. Notes | | B3 | | 10.25 | | 10/15/07 | | | 11,370 | | | | 11,767,950 |
Pathmark Stores, Inc., | | | | | | | | | | | | | |
Gtd. Notes | | B2 | | 8.75(g) | | 2/1/12 | | | 4,600 | | | | 4,807,000 |
Sr. Sub. Notes | | B(a) | | 8.75 | | 2/1/12 | | | 3,950 | | | | 4,127,750 |
Rite Aid Corp., | | | | | | | | | | | | | |
Deb. | | Caa2 | | 6.875 | | 8/15/13 | | | 1,045 | (g) | | | 1,003,200 |
Deb. | | Caa2 | | 7.70 | | 2/15/27 | | | 1,615 | (g) | | | 1,477,725 |
Deb. | | Caa2 | | 6.875 | | 12/15/28 | | | 4,000 | (g) | | | 3,370,000 |
Sec’d. Notes | | B2 | | 8.125 | | 5/1/10 | | | 8,150 | | | | 8,761,250 |
Saks, Inc., | | | | | | | | | | | | | |
Gtd. Notes | | B1 | | 7.00 | | 12/1/13 | | | 2,905 | | | | 2,963,100 |
Notes | | B1 | | 7.375 | | 2/15/19 | | | 5,290 | | | | 5,382,575 |
Sonic Automotive, Inc., | | | | | | | | | | | | | |
Sr. Sub. Notes | | B2 | | 8.625 | | 8/15/13 | | | 3,500 | | | | 3,692,500 |
Sr. Sub. Notes | | B2 | | 8.625 | | 8/15/13 | | | 2,000 | (g) | | | 2,110,000 |
See Notes to Financial Statements.
| | |
| 20 | | Visit our website at www.jennisondryden.com |
| | | | | | | | | | | | | |
| | | | | |
| Description | | Moody’s
Rating
(Unaudited) | | Interest
Rate | | Maturity
Date | | Principal
Amount (000) | | | Value (Note 1) |
| | | | | | | | | | | | | | |
Trac-X North America High Yield, Sec’d. Notes | | Ba3 | | 6.05 | | 3/25/09 | | $ | 5,500 | (g) | | $ | 5,630,625 |
Winn-Dixie Stores, Inc.,
Gtd. Notes | | Ba2 | | 8.875% | | 4/1/08 | | | 4,125 | (g) | | | 4,186,875 |
| | | | | | | | | | | | |
|
|
| | | | | | | | | | | | | | 78,414,979 |
| | | | | |
Technology 3.6% | | | | | | | | | | | | | |
|
Amkor Technology, Inc., Deb. | | B1 | | 9.25 | | 2/15/08 | | | 410 | (g) | | | 465,350 |
Ampex Corp., Sec’d. Notes, (cost $150,000; purchased 7/15/98), PIK | | NR | | 12.00 | | 8/15/08 | | | 1,327 | (b)(e) | | | 66,340 |
Avaya, Inc., Sr. Sec’d. Notes | | B2 | | 11.125 | | 4/1/09 | | | 2,250 | | | | 2,632,500 |
Flextronics Int’l. Ltd. (Singapore),
Sr. Sub. Notes | | Ba2 | | 6.50 | | 5/15/13 | | | 5,245 | (g)(i) | | | 5,428,575 |
Lucent Technologies, Inc., | | | | | | | | | | | | | |
Deb. | | Caa1 | | 6.50 | | 1/15/28 | | | 1,875 | | | | 1,467,188 |
Deb. | | Caa1 | | 6.45 | | 3/15/29 | | | 3,725 | (g) | | | 2,928,781 |
Notes | | Caa1 | | 5.50 | | 11/15/08 | | | 10,100 | (g) | | | 9,393,000 |
Nortel Networks Corp. | | B3 | | 4.25 | | 9/1/08 | | | 10,525 | | | | 9,959,281 |
ON Semiconductor Corp.,
Gtd. Notes | | Caa1 | | 13.00 | | 5/15/08 | | | 3,185 | (g) | | | 3,702,562 |
Sanmina-SCI Corp.,
Gtd. Notes | | Ba2 | | 10.375 | | 1/15/10 | | | 1,765 | | | | 2,065,050 |
Solectron Corp., Sr. Notes | | B1 | | Zero | | 11/20/20 | | | 11,460 | | | | 6,503,550 |
Unisys Corp., | | | | | | | | | | | | | |
Sr. Notes | | Ba1 | | 7.25 | | 1/15/05 | | | 4,900 | (g) | | | 5,077,625 |
Sr. Notes | | Ba1 | | 8.125 | | 6/1/06 | | | 680 | | | | 734,400 |
Xerox Capital Europe PLC (United Kingdom),
Gtd. Notes | | B1 | | 5.875 | | 5/15/04 | | | 7,140 | (g)(i) | | | 7,211,400 |
Xerox Corp. | | | | | | | | | | | | | |
Gtd. Notes | | B1 | | 9.75 | | 1/15/09 | | | 2,275 | (g) | | | 2,661,750 |
Sr. Notes | | B1 | | 7.125 | | 6/15/10 | | | 7,580 | (g) | | | 8,110,600 |
Sr. Notes | | B1 | | 7.625 | | 6/15/13 | | | 8,530 | (g) | | | 9,212,400 |
| | | | | | | | | | | | |
|
|
| | | | | | | | | | | | | | 77,620,352 |
See Notes to Financial Statements.
| | |
| Dryden High Yield Fund, Inc. | | 21 |
Portfolio Of Investments
as of December 31, 2003 Cont’d.
| | | | | | | | | | | | | |
| | | | | |
| Description | | Moody’s
Rating
(Unaudited) | | Interest
Rate | | Maturity
Date | | Principal
Amount (000) | | | Value (Note 1) |
| | | | | | | | | | | | | | |
Telecommunications 6.7% | | | | | | | | | | | | | |
|
ACC Escrow Corp., Sr. Notes | | B2 | | 10.00% | | 8/1/11 | | $ | 7,780 | (g) | | $ | 8,674,700 |
Bestel SA (Mexico),
Sr. Disc. Notes | | NR | | 12.75 | | 5/15/05 | | | 4,850 | (e)(i) | | | 485,000 |
Cellnet Data Systems, Inc.,
Sr. Disc. Notes | | NR | | 14.00 | | 10/1/07 | | | 13,069 | (e)(f) | | | 131 |
Cincinnati Bell, Inc.,
Sr. Sub. Notes | | B3 | | 8.375 | | 1/15/14 | | | 4,650 | (g) | | | 4,998,750 |
Crown Castle International Corp. | | | | | | | | | | | | | |
Sr. Notes | | B3 | | 10.75 | | 8/1/11 | | | 5,520 | (g) | | | 6,210,000 |
Sr. Notes | | B3 | | 7.50 | | 12/1/13 | | | 7,325 | | | | 7,361,625 |
Dobson Communications Corp., Sr. Notes | | B3 | | 10.875 | | 7/1/10 | | | 6,355 | (g) | | | 6,926,950 |
Empresa Brasileira (Brazil), Gtd. Notes | | B2 | | 11.00 | | 12/15/08 | | | 915 | (g)(i) | | | 940,162 |
Nextel Communications, Inc., | | | | | | | | | | | | | |
Sr. Notes | | B2 | | 9.375 | | 11/15/09 | | | 10,865 | (g) | | | 11,842,850 |
Sr. Notes | | B2 | | 9.50 | | 2/1/11 | | | 7,840 | | | | 8,859,200 |
Sr. Notes | | B2 | | 7.375 | | 8/1/15 | | | 13,450 | (g) | | | 14,458,750 |
Qwest Capital Funding, Inc., | | | | | | | | | | | | | |
Gtd. Notes | | Caa2 | | 5.875 | | 8/3/04 | | | 10,850 | | | | 10,877,125 |
Gtd. Notes | | Caa2 | | 7.00 | | 8/3/09 | | | 5,650 | | | | 5,607,625 |
Gtd. Notes | | Caa2 | | 7.25 | | 2/15/11 | | | 10,225 | | | | 10,071,625 |
Qwest Corp., Notes | | Ba3 | | 7.20 | | 11/1/04 | | | 2,340 | | | | 2,392,650 |
Qwest Services Corp., Notes | | CCC+(a) | | 13.50 | | 12/15/10 | | | 19,506 | | | | 23,699,790 |
Rogers Wireless Communications, Inc.
(Canada), Sr. Sec’d. Notes | | Ba3 | | 9.625 | | 5/1/11 | | | 5,165 | (g)(i) | | | 6,172,175 |
Tellus Corp. (Canada), Notes | | Ba1 | | 8.00 | | 6/1/11 | | | 5,235 | (g)(i) | | | 6,121,217 |
Tritel PCS, Inc.,
Sr. Sub. Notes | | Baa2 | | 10.375 | | 1/15/11 | | | 2,755 | | | | 3,296,220 |
Triton PCS, Inc., Gtd. Notes | | B2 | | 8.50 | | 6/1/13 | | | 4,695 | | | | 5,047,125 |
Voicestream Wireless Corp., Sr. Notes | | Ba3 | | 10.375 | | 11/15/09 | | | 0 | (k) | | | 164 |
| | | | | | | | | | | | |
|
|
| | | | | | | | | | | | | | 144,043,834 |
See Notes to Financial Statements.
| | |
| 22 | | Visit our website at www.jennisondryden.com |
| | | | | | | | | | | | | |
| | | | | |
| Description | | Moody’s
Rating
(Unaudited) | | Interest
Rate | | Maturity
Date | | Principal
Amount (000) | | | Value (Note 1) |
| | | | | | | | | | | | | | |
Transportation 3.6% | | | | | | | | | | | | | |
|
American Airlines, Inc., Certs., Ser. 91-A2 | | B3 | | 10.18% | | 1/2/13 | | $ | 2,000 | | | $ | 1,564,880 |
American Axle & Manufacturing, Inc.,
Sr. Sub. Notes | | Ba1 | | 9.75 | | 3/1/09 | | | 3,560 | | | | 3,764,700 |
AMR Corp., | | | | | | | | | | | | | |
Deb. | | Caa2 | | 10.00 | | 4/15/21 | | | 3,783 | | | | 2,875,080 |
Notes | | NR | | 10.40 | | 3/10/11 | | | 4,450 | | | | 3,560,000 |
ArvinMeritor, Inc., Notes | | Baa3 | | 8.75 | | 3/1/12 | | | 9,365 | | | | 10,722,925 |
Calair Capital LLC, Gtd.
Sr. Notes | | Caa2 | | 8.125 | | 4/1/08 | | | 2,980 | | | | 2,592,600 |
Continental Airlines, Inc., | | | | | | | | | | | | | |
Certs., Ser. 01-1 | | Ba1 | | 7.373 | | 12/15/15 | | | 1,511 | | | | 1,312,959 |
Certs., Ser. 981B | | Ba2 | | 6.748 | | 3/15/17 | | | 3,904 | | | | 3,221,381 |
Sr. Notes | | Caa2 | | 8.00 | | 12/15/05 | | | 45 | (g) | | | 43,763 |
Delta Air Lines, Inc., | | | | | | | | | | | | | |
Notes | | B3 | | 10.375 | | 12/15/22 | | | 4,775 | | | | 3,443,969 |
Notes | | B3 | | 8.30 | | 12/15/29 | | | 7,555 | | | | 4,995,743 |
Ser. 93-A2 | | B1 | | 10.50 | | 4/30/16 | | | 2,100 | | | | 1,661,352 |
Holt Group, Inc., Sr. Notes | | C | | 9.75 | | 1/15/06 | | | 8,120 | (e) | | | 233,450 |
Lear Corp., Gtd. Notes,
Ser. B | | Ba1 | | 7.96 | | 5/15/05 | | | 2,925 | | | | 3,129,750 |
Navistar International Corp., Sr. Notes, Ser. B | | Ba3 | | 9.375 | | 6/1/06 | | | 2,875 | (g) | | | 3,173,281 |
North America United Rentals, Inc.,
Gtd. Notes, Ser. B | | B1 | | 10.75 | | 4/15/08 | | | 8,900 | (g) | | | 10,012,500 |
Northwest Airlines, Inc., | | | | | | | | | | | | | |
Gtd. Notes | | Caa1 | | 9.875 | | 3/15/07 | | | 200 | | | | 182,000 |
Notes | | Caa1 | | 7.625 | | 3/15/05 | | | 795 | | | | 775,125 |
Sr. Notes | | Caa1 | | 8.875 | | 6/1/06 | | | 2,625 | | | | 2,382,188 |
Standyne Automotive Corp., Sr. Sub. Notes, Ser. B | | Caa1 | | 10.25 | | 12/15/07 | | | 2,965 | | | | 2,905,700 |
Stena AB (Sweden), | | | | | | | | | | | | | |
Sr. Notes | | Ba3 | | 9.625 | | 12/1/12 | | | 2,200 | (i) | | | 2,480,500 |
Sr. Notes | | Ba3 | | 7.50 | | 11/1/13 | | | 4,900 | (i) | | | 5,047,000 |
TRISM, Inc., Sr. Sub. Notes | | NR | | 12.00 | | 2/15/05 | | | 435 | (e) | | | 2,174 |
TRW Automotive, Sr. Notes | | B1 | | 9.375 | | 2/15/13 | | | 4,575 | | | | 5,226,938 |
See Notes to Financial Statements.
| | |
| Dryden High Yield Fund, Inc. | | 23 |
Portfolio Of Investments
as of December 31, 2003 Cont’d.
| | | | | | | | | | | | | |
| | | | | |
| Description | | Moody’s
Rating
(Unaudited) | | Interest
Rate | | Maturity
Date | | Principal
Amount (000) | | | Value (Note 1) |
| | | | | | | | | | | | | | |
United Air Lines, Inc., Notes, Ser. A | | Ca | | 10.11% | | 1/5/06 | | $ | 1,907 | (e) | | $ | 495,722 |
| | | | | | | | | | | | |
|
|
| | | | | | | | | | | | | | 75,805,680 |
| | | | | |
Utilities 9.4% | | | | | | | | | | | | | |
|
AES Corp., | | | | | | | | | | | | | |
Sec’d. Notes | | B2 | | 8.75 | | 5/15/13 | | | 13,000 | (g) | | | 14,527,500 |
Sr. Notes | | B3 | | 9.50 | | 6/1/09 | | | 6,635 | (g) | | | 7,356,556 |
Sr. Notes | | B3 | | 9.375 | | 9/15/10 | | | 9,475 | (g) | | | 10,505,406 |
AES Drax Holdings Ltd.
(United Kingdom),
Sr. Sec’d. Bond | | Caa2 | | 10.41 | | 12/31/20 | | | 25,990 | (i) | | | 22,351,400 |
AES Eastern Energy LP, Certs., Ser. A | | Ba1 | | 9.00 | | 1/2/17 | | | 6,296 | | | | 6,963,967 |
Allegheny Energy Supply Co. LLC | | B3 | | 8.75 | | 4/15/12 | | | 7,949 | (g) | | | 7,491,933 |
Aquila, Inc., | | | | | | | | | | | | | |
Sr. Notes | | Caa1 | | 6.875 | | 10/1/04 | | | 3,735 | | | | 3,735,000 |
Sr. Notes | | Caa1 | | 7.625 | | 11/15/09 | | | 1,600 | | | | 1,572,000 |
Sr. Notes | | Caa1 | | 9.95 | | 2/1/11 | | | 6,730 | (g) | | | 7,184,275 |
Beaver Valley II Funding Corp., Deb. | | Baa3 | | 9.00 | | 6/1/17 | | | 6,900 | | | | 7,930,998 |
Calpine Corp. | | | | | | | | | | | | | |
Notes | | Caa1 | | 8.50 | | 2/15/11 | | | 24,290 | (g) | | | 19,219,463 |
Sec’d. Notes | | B(a) | | 8.75 | | 7/15/13 | | | 5,025 | (g) | | | 4,899,375 |
Calpine Energy Finance (Canada), Gtd. Sr. Notes | | Caa1 | | 8.50 | | 5/1/08 | | | 1,300 | (i) | | | 1,036,750 |
CMS Energy Corp. | | | | | | | | | | | | | |
Sr. Notes | | B3 | | 9.875 | | 10/15/07 | | | 1,250 | | | | 1,393,750 |
Sr. Notes | | B3 | | 7.50 | | 1/15/09 | | | 2,360 | (g) | | | 2,430,800 |
Sr. Notes | | B3 | | 8.50 | | 4/15/11 | | | 5,090 | (g) | | | 5,497,200 |
Cogentrix Energy, Inc.,
Sr. Gtd. Notes, Ser. B | | B1 | | 8.75 | | 10/15/08 | | | 1,080 | | | | 1,088,100 |
Dynegy Holdings, Inc., | | | | | | | | | | | | | |
Sec’d. Notes | | B3 | | 10.125 | | 7/15/13 | | | 12,885 | (g) | | | 14,817,750 |
Sr. Notes | | Caa2 | | 6.875 | | 4/1/11 | | | 1,895 | (g) | | | 1,745,769 |
Midland Funding II Corp., | | | | | | | | | | | | | |
Deb. | | Ba3 | | 11.75 | | 7/23/05 | | | 4,258 | | | | 4,598,412 |
Deb. | | Ba3 | | 13.25 | | 7/23/06 | | | 13,135 | | | | 15,367,950 |
Midwest Generation LLC, Certs., Ser. A | | B2 | | 8.30 | | 7/2/09 | | | 2,750 | | | | 2,866,977 |
See Notes to Financial Statements.
| | |
| 24 | | Visit our website at www.jennisondryden.com |
| | | | | | | | | | | | | |
| | | | | |
| Description | | Moody’s
Rating
(Unaudited) | | Interest
Rate | | Maturity
Date | | Principal
Amount (000) | | | Value (Note 1) |
| | | | | | | | | | | | | | |
Mirant Americas Generation LLC, Sr. Notes | | D(a) | | 7.20% | | 10/1/08 | | $ | 2,385 | (e)(g) | | $ | 2,015,325 |
Mirant Corp., Sr. Notes | | Ca | | 7.40 | | 7/15/04 | | | 2,600 | (e)(g) | | | 1,677,000 |
Mission Energy Holding Co., Sec’d. Notes | | Caa2 | | 13.50 | | 7/15/08 | | | 1,800 | | | | 1,764,000 |
NRG Energy, Inc.,
Sec’d. Notes | | B2 | | 8.00 | | 12/15/13 | | | 7,100 | (g) | | | 7,463,875 |
Orion Power Holdings, Inc., Sr. Notes | | B2 | | 12.00 | | 5/1/10 | | | 6,235 | | | | 7,575,525 |
Reliant Energy Mid-Atlantic, Inc., Certs., Ser. C | | B1 | | 9.681 | | 7/2/26 | | | 3,600 | | | | 3,675,226 |
Reliant Resources, Inc., Sec’d. Notes | | B1 | | 9.50 | | 7/15/13 | | | 5,795 | | | | 6,200,650 |
York Power Funding (Cayman Islands),
Sr. Sec’d. Notes,
(cost $10,755,000; purchased 7/31/98) | | D(a) | | 12.00 | | 10/30/07 | | | 9,157 | (b)(e)(f)(i) | | | 6,410,162 |
| | | | | | | | | | | | |
|
|
| | | | | | | | | | | | | | 201,363,094 |
| | | | | | | | | | | | |
|
|
Total corporate bonds
(cost $1,821,872,774) | | | | | | | | | | | | | 1,917,330,041 |
| | | | | | | | | | | | |
|
|
| | | | | |
SOVEREIGN BONDS 1.9% | | | | | | | | | | | | | |
|
Republic of Brazil, | | | | | | | | | | | | | |
Notes | | B2 | | 9.25 | | 10/22/10 | | | 5,330 | (g)(i) | | | 5,729,750 |
Notes | | B2 | | 8.00 | | 4/15/14 | | | 2,217 | (i) | | | 2,180,630 |
Unsub. Notes | | B2 | | 10.00 | | 8/7/11 | | | 2,930 | (i) | | | 3,237,650 |
Unsub. Notes | | B2 | | 11.00 | | 8/17/40 | | | 5,905 | (i) | | | 6,480,738 |
Republic of Colombia, | | | | | | | | | | | | | |
Notes | | Ba2 | | 9.75 | | 4/23/09 | | | 6,780 | (i) | | | 7,441,050 |
Notes | | Ba2 | | 10.50 | | 7/9/10 | | | 500 | (i) | | | 560,500 |
Notes | | Ba2 | | 10.00 | | 1/23/12 | | | 2,781 | (i) | | | 3,045,195 |
Republic of El Salvador, Notes | | Baa3 | | 8.50 | | 7/25/11 | | | 4,000 | (g)(i) | | | 4,440,000 |
Republic of Venezuela | | | | | | | | | | | | | |
Notes | | Caa1 | | 10.75 | | 9/19/13 | | | 5,300 | (i) | | | 5,657,750 |
Notes | | Caa1 | | 10.75 | | 9/19/13 | | | 1,700 | (i) | | | 1,814,750 |
| | | | | | | | | | | | |
|
|
Total sovereign bonds
(cost $37,469,236) | | | | | | | | | | | | | 40,588,013 |
| | | | | | | | | | | | |
|
|
See Notes to Financial Statements.
| | |
| Dryden High Yield Fund, Inc. | | 25 |
Portfolio Of Investments
as of December 31, 2003 Cont’d.
| | | | | | |
| Description | | Shares | | | Value (Note 1) |
| | | | | | | |
COMMON STOCKS 1.1% | | | | | | |
AmeriKing, Inc. | | 50 | (c)(f) | | $ | 0 |
Birch Telecom | | 31,304 | (c) | | | 313 |
Classic Communications, Inc. | | 3,000 | (c)(f) | | | 30 |
Color Spot Nurseries, Inc. | | 57,197 | (c)(f) | | | 228,788 |
Firearms Training Systems, Inc. | | 122,000 | (c) | | | 57,340 |
GenTek, Inc., | | 30,418 | (c) | | | 1,076,797 |
IMPSAT Fiber Networks, Inc. | | 110,756 | (c) | | | 847,283 |
International Wireless Communications | | 386,756 | (c)(f) | | | 38,676 |
Kaiser Group Holdings, Inc. | | 21,359 | (c) | | | 477,908 |
Link Energy LLC | | 50,460 | (c) | | | 340,605 |
Nextel Communications, Inc., Cl. A | | 50,000 | (c) | | | 1,403,000 |
NTL, Inc. | | 16,869 | (c) | | | 1,176,613 |
Peachtree Cable Assoc. Ltd. | | 31,559 | (c)(f) | | | 53,919 |
Premier Cruise Ltd. | | 962,763 | (c)(f) | | | 963 |
PSF Holdings Group, Inc. | | 9,517 | (c)(f) | | | 14,275,755 |
Samuels Jewelers, Inc. | | 23,425 | (c) | | | 527 |
Sheffield Steel Corp. | | 403,749 | (c) | | | 1,614,996 |
Specialty Foods Acquisition Corp. | | 25 | (c)(f) | | | 0 |
Star Gas Partners LP | | 440 | | | | 10,758 |
Stellex Technologies, Inc. | | 214 | (c)(f) | | | 0 |
Sterling Chemicals, Inc. | | 159 | (c) | | | 3,975 |
TRISM, Inc. | | 27,543 | (c) | | | 14 |
UnitedGlobalCom, Inc., Cl. A | | 354,217 | (c) | | | 3,003,760 |
Walter Industries, Inc. | | 4,274 | | | | 57,058 |
WKI Holding Co., Inc. | | 20,225 | (c)(f) | | | 20 |
York Research Corp. | | 15,105 | (c)(f) | | | 1 |
| | | | | |
|
|
Total common stocks
(cost $81,606,874) | | | | | | 24,669,099 |
| | | | | |
|
|
| | |
PREFERRED STOCKS 2.2% | | | | | | |
|
Building & Construction | | | | | | |
|
New Millenium Homes LLC, Ser. A | | 2,000(f) | | | | 20 |
| | |
Cable 0.4% | | | | | | |
|
Adelphia Communications Corp.,
13.00% | | 20,000 | | | | 300,000 |
CSC Holdings, Inc., Ser. M,
11.125% | | 60,316 | | | | 6,333,180 |
NTL Europe, Inc., Ser. A,
10.00% | | 10 | | | | 75 |
See Notes to Financial Statements.
| | |
| 26 | | Visit our website at www.jennisondryden.com |
| | | | | | |
| Description | | Shares | | | Value (Note 1) |
| | | | | | | |
TVN Entertainment, Ser. A,
14.00% | | 733,788 | (f) | | $ | 1,614,334 |
| | | | | |
|
|
| | | | | | | 8,247,589 |
| | |
Food/Beverage/Bottling | | | | | | |
|
AmeriKing, Inc.,
13.00% | | 1,619 | | | | 16 |
| | |
Industrials/Services 0.6% | | | | | | |
|
Eagle-Picher Holdings, Inc.,
11.75% | | 1,530 | | | | 11,169,000 |
Kaiser Group Holdings, Inc.,
8.78% | | 17,729 | (f) | | | 177 |
Kaiser Group Holdings, Inc.,
7.00%, PIK | | 11,294 | | | | 581,641 |
| | | | | |
|
|
| | | | | | | 11,750,818 |
| | |
Media 1.0% | | | | | | |
|
Paxon Communications Corp.,
13.25% | | 1,566 | | | | 14,407,200 |
Primedia, Inc., Ser. D.
10.00% | | 77,640 | | | | 7,608,720 |
| | | | | |
|
|
| | | | | | | 22,015,920 |
| | |
Technology 0.2% | | | | | | |
|
Xerox Corp.,
6.25% | | 28,520 | | | | 3,700,470 |
| | |
Telecommunications | | | | | | |
|
Global Crossing Holdings Ltd. (Bermuda),
10.50% | | 42,889 | | | | 429 |
McLeodUSA, Inc., Ser. A,
2.50% | | 78,235 | | | | 596,151 |
World Access, Inc.,
13.25% | | 4,663 | (f) | | | 4 |
| | | | | |
|
|
| | | | | | | 596,584 |
| | | | | |
|
|
Total preferred stocks
(cost $69,684,282) | | | | | | 46,311,417 |
| | | | | |
|
|
See Notes to Financial Statements.
| | |
| Dryden High Yield Fund, Inc. | | 27 |
Portfolio Of Investments
as of December 31, 2003 Cont’d.
| | | | | | | | |
| | | |
| Description | | Expiration
Date | | Units | | | Value (Note 1) |
WARRANTS (c) 0.1% | | | | | | | | |
|
Aladdin Gaming | | 3/1/10 | | 30,000 | | | $ | 3 |
Allegiance Telecom, Inc. | | 2/3/08 | | 14,200 | | | | 1,775 |
Asia Pulp & Paper Ltd. (Indonesia) | | 3/15/05 | | 3,705 | | | | 0 |
Bell Technology Group Ltd. | | 5/1/05 | | 8,500 | | | | 85 |
Bestel SA (Mexico) | | 5/15/05 | | 12,000 | | | | 1 |
GenTek, Inc. | | 10/31/06 | | 57,852 | | | | 579 |
GenTek, Inc., | | 10/31/08 | | 30,528 | | | | 305 |
GenTek, Inc.,, | | 10/31/10 | | 14,910 | | | | 149 |
GT Group Telecom, Inc. (Canada) | | 2/1/10 | | 8,610 | | | | 2,153 |
HF Holdings, Inc. | | 9/27/09 | | 4,375 | (f) | | | 4 |
ICG Communications, Inc. | | 10/15/05 | | 127,809 | | | | 1,278 |
McLeodUSA, Inc. | | 4/16/07 | | 173,364 | | | | 88,416 |
National Restaurant Enterprises Holding, Inc. | | 5/15/08 | | 1,014 | (d) | | | 1 |
Price Communications Corp. | | 8/1/07 | | 17,200 | | | | 620,026 |
Primus Telecommunications Group | | 8/1/04 | | 12,250 | | | | 15,312 |
Star Choice Communications (Canada) | | 12/15/05 | | 124,485 | | | | 497,940 |
Sterling Chemicals, Inc. | | 8/15/08 | | 5,450 | | | | 1 |
Tellus Corp. (Canada) | | 9/15/05 | | 108,785 | (f) | | | 131 |
USN Communications, Inc. | | 8/15/04 | | 92,500 | | | | 9 |
Verado Holdings, Inc. | | 4/15/08 | | 4,075 | | | | 1,610 |
Versatel Telecom Int’l. NV (Netherlands) | | 5/15/08 | | 10,000 | | | | 100 |
Viasystems Group, Inc. | | 1/31/10 | | 166,335 | (f) | | | 2 |
Wam!Net, Inc. | | 3/1/05 | | 22,500 | | | | 225 |
XM Satellite Radio, Inc. | | 3/15/10 | | 345 | | | | 3 |
| | | | | | | |
|
|
Total warrants
(cost $4,934,470) | | | | | | | | 1,230,108 |
| | | | | | | |
|
|
Total long-term investments
(cost $2,040,622,915) | | | | | | | | 2,044,356,785 |
| | | | | | | |
|
|
See Notes to Financial Statements.
| | |
| 28 | | Visit our website at www.jennisondryden.com |
| | | | | | | | | | |
| | | | |
| | | Interest
Rate | | Maturity
Date | | Principal
Amount (000) | | Value (Note 1) |
SHORT-TERM INVESTMENTS 25.7% | | | | | | | | | | |
| | | | |
CORPORATE BONDS(h) 11.6% | | | | | | | | | | |
|
| | | | |
Bayer Corp. | | 1.16% | | 1/15/04 | | $ | 18,900 | | $ | 18,890,944 |
| | | | |
Elsevier Finance | | 1.20 | | 1/30/04 | | | 25,000 | | | 24,975,000 |
| | | | |
Elsevier Finance | | 1.22 | | 2/11/04 | | | 5,000 | | | 4,992,883 |
| | | | |
Hartford Financial Services Group, Inc. | | 1.20 | | 2/6/04 | | | 21,640 | | | 21,613,311 |
| | | | |
Hartford Financial Services Group, Inc. | | 1.25 | | 1/13/04 | | | 18,400 | | | 18,391,694 |
| | | | |
ING America Ins. HL | | 1.09 | | 2/20/04 | | | 50,000 | | | 49,922,792 |
| | | | |
Kraft Foods, Inc. | | 1.283 | | 2/11/04 | | | 25,000 | | | 24,962,667 |
| | | | |
Reed Elsevier, Inc. | | 1.22 | | 1/13/04 | | | 8,000 | | | 7,996,476 |
| | | | |
Sara Lee Corp. | | 1.15 | | 2/9/04 | | | 10,000 | | | 9,987,222 |
| | | | |
Sara Lee Corp. | | 1.15 | | 2/12/04 | | | 30,000 | | | 29,958,792 |
| | | | |
Swiss Re Financial Products Corp. | | 1.01 | | 1/8/04 | | | 35,000 | | | 34,991,162 |
| | | | | | | | | |
|
|
| | | | |
| | | | | | | | | | | 246,682,943 |
| | | | | | | | | |
|
|
| | | | |
Total corporate bonds
(cost $246,682,943) | | | | | | | | | | 246,682,943 |
| | | | | | | | | |
|
|
| | | | | | | | |
| | | | |
MONEY MARKET FUND 11.4% | | | | Shares | | | | |
|
Dryden Core Investment Fund - Taxable Money Market Series, (Note 3)(h)
(cost $243,855,536) | | | | 243,855,536 | | | | 243,855,536 |
See Notes to Financial Statements
| | |
| Dryden High Yield Fund, Inc. | | 29 |
| | | | | | | | | | | | |
| | | | |
| | | Interest
Rate | | | Maturity
Date | | Principal
Amount (000) | | Value (Note 1) | |
Description | | | | | | | | | | | | |
REPURCHASE AGREEMENT 2.7% | | | | | | | | | | | | |
Joint Repurchase Agreement Account,
dated 12/31/03, due 1/2/04 in the amount of $56,913,106; value of collateral including accrued interest was $58,049,416 (Note 6)
(cost $56,905,000) | | 1.00 | % | | 1/2/04 | | $ | 56,905 | | $ | 56,905,000 | |
| | | | | | | | | | |
|
|
|
Total short-term investments
(cost $547,443,479) | | | | | | | | | | | 547,443,479 | |
| | | | | | | | | | |
|
|
|
Total Investments 121.5%
(cost $2,588,066,394; Note 5) | | | | | | | | | | | 2,591,800,264 | |
Liabilities in excess of other assets (21.5%) | | | | | | | | | | | (458,020,040 | ) |
| | | | | | | | | | |
|
|
|
Net Assets 100.0% | | | | | | | | | | $ | 2,133,780,224 | |
| | | | | | | | | | |
|
|
|
| (a) | Standard & Poor’s rating. |
| (b) | Indicates a restricted security; the aggregate cost of such securities is $29,282,469. The aggregate value of $15,664,609 is approximately 0.7% of net assets. |
| (c) | Non-income producing security. |
| (d) | Consists of more than one class of securities traded together as a unit; generally bonds with attached stock or warrants. |
| (e) | Represents issuer in default on interest payments; non-income producing security. |
| (g) | All or a portion of security on loan, see Note 4. |
| (h) | Represents security purchased, or portion thereof, purchased with cash collateral received for securities on loan. |
| (i) | US$ denominated foreign bonds. |
| (j) | Floating rate bond. The coupon is indexed to a floating interest rate. The rate shown is the rate at December 31, 2003. |
| (k) | Less than $500 principal amount held. |
LLC—Limited Liability Company.
LP—Limited Partnership.
PIK—Payment-in-kind
NR—Not Rated by Moody’s or Standard & Poor’s.
The Fund’s current Prospectus contains a description of Moody’s and Standard & Poor’s ratings.
See Notes to Financial Statements.
| | |
| 30 | | Visit our website at www.jennisondryden.com |
Statement of Assets and Liabilities
| | |
|
| DECEMBER 31, 2003 | | ANNUAL REPORT |
Dryden High Yield Fund, Inc.
Statement of Assets and Liabilities
as of December 31, 2003
| | | | |
Assets | | | | |
| |
Investments, at value—including $469,331,835 of securities loaned
(Note 4) (cost $2,588,066,394) | | $ | 2,591,800,264 | |
Foreign currency, at value (cost $203) | | | 302 | |
Cash | | | 3,564,064 | |
Dividends and interest receivable | | | 41,009,802 | |
Receivable for Fund shares sold | | | 1,217,749 | |
Receivable for Investments sold | | | 435,569 | |
Prepaid expenses | | | 73,166 | |
| | |
|
|
|
Total assets | | | 2,638,100,916 | |
| | |
|
|
|
| |
Liabilities | | | | |
| |
Payable to broker for collateral for securities on loan | | | 490,338,751 | |
Payable for Fund shares reacquired | | | 6,619,078 | |
Payable for Investments purchased | | | 5,125,944 | |
Management fee payable | | | 819,503 | |
Distribution fee payable | | | 746,945 | |
Accrued expenses | | | 514,438 | |
Dividends payable | | | 117,649 | |
Deferred directors’ fees | | | 38,384 | |
| | |
|
|
|
Total liabilities | | | 504,320,692 | |
| | |
|
|
|
| |
Net Assets | | $ | 2,133,780,224 | |
| | |
|
|
|
| | | | | |
| |
Net assets were comprised of: | | | | |
Common stock, at par | | $ | 3,680,690 | |
Paid-in capital in excess of par | | | 3,401,315,039 | |
| | |
|
|
|
| | | | 3,404,995,729 | |
Distributions in excess of net investment income | | | (1,283,650 | ) |
Accumulated net realized loss on investments and foreign currency transactions | | | (1,273,665,822 | ) |
Net unrealized appreciation on investments and foreign currencies | | | 3,733,967 | |
| | |
|
|
|
Net assets December 31, 2003 | | $ | 2,133,780,224 | |
| | |
|
|
|
See Notes to Financial Statements.
| | |
| 32 | | Visit our website at www.jennisondryden.com |
| | | |
Class A | | | |
|
Net asset value and redemption price per share
($1,364,999,146 ÷ 235,343,049 shares of common stock issued and outstanding) | | $ | 5.80 |
Maximum sales charge (4% of offering price) | | | 0.24 |
| | |
|
|
Maximum offering price to public | | $ | 6.04 |
| | |
|
|
| |
Class B | | | |
|
Net asset value, offering price and redemption price per share
($618,538,872 ÷ 106,812,703 shares of common stock issued and outstanding) | | $ | 5.79 |
| | |
|
|
| |
Class C | | | |
|
Net asset value and redemption price per share
($97,291,114 ÷ 16,801,328 shares of common stock issued and outstanding) | | $ | 5.79 |
Sales charge (1% of offering price) | | | 0.06 |
| | |
|
|
Offering price to public | | $ | 5.85 |
| | |
|
|
| |
Class Z | | | |
|
Net asset value, offering price and redemption price per share
($52,951,092 ÷ 9,111,951 shares of common stock issued and outstanding) | | $ | 5.81 |
| | |
|
|
See Notes to Financial Statements.
| | |
| Dryden High Yield Fund, Inc. | | 33 |
Statement of Operations
Year Ended December 31, 2003
| | | | |
Net Investment Income | | | | |
| |
Income | | | | |
Interest | | $ | 174,611,328 | |
Dividends | | | 6,574,278 | |
Income from securities loaned, net | | | 947,749 | |
| | |
|
|
|
Total income | | | 182,133,355 | |
| | |
|
|
|
| |
Expenses | | | | |
Management fee | | | 9,376,285 | |
Distribution fee—Class A | | | 3,216,923 | |
Distribution fee—Class B | | | 4,723,869 | |
Distribution fee—Class C | | | 676,178 | |
Transfer agent’s fees and expenses | | | 2,667,000 | |
Reports to shareholders | | | 647,000 | |
Custodian’s fees and expenses | | | 397,000 | |
Registration fees | | | 79,000 | |
Legal fees and expenses | | | 56,000 | |
Audit fee | | | 38,000 | |
Directors’ fees | | | 35,000 | |
Miscellaneous | | | 62,255 | |
| | |
|
|
|
Total expenses | | | 21,974,510 | |
| | |
|
|
|
Net investment income | | | 160,158,845 | |
| | |
|
|
|
| |
Realized And Unrealized Gain (Loss) On Investments And Foreign Currency Transactions | | | | |
| |
Net realized gain (loss) on: | | | | |
Investment transactions | | | 19,981,203 | |
Foreign currency transactions | | | (12,518 | ) |
| | |
|
|
|
| | | | 19,968,685 | |
| | |
|
|
|
Net change in unrealized appreciation on: | | | | |
Investments | | | 292,665,948 | |
Foreign currencies | | | 52 | |
| | |
|
|
|
| | | | 292,666,000 | |
| | |
|
|
|
Net gain on investments and foreign currency transactions | | | 312,634,685 | |
| | |
|
|
|
Net Increase In Net Assets Resulting From Operations | | $ | 472,793,530 | |
| | |
|
|
|
See Notes to Financial Statements
| | |
| 34 | | Visit our website at www.jennisondryden.com |
Statement of Changes in Net Assets
| | | | | | | | |
| |
| | | Year Ended December 31,
| |
| | | 2003 | | | 2002 | |
Increase (Decrease) In Net Assets | | | | | | | | |
| |
Operations | | | | | | | | |
Net investment income | | $ | 160,158,845 | | | $ | 182,444,423 | |
Net realized gain (loss) on investment and foreign currency transactions | | | 19,968,685 | | | | (302,043,607 | ) |
Net change in unrealized appreciation of investments and foreign currencies | | | 292,666,000 | | | | 71,675,008 | |
| | |
|
|
| |
|
|
|
Net increase (decrease) in net assets resulting from operations | | | 472,793,530 | | | | (47,924,176 | ) |
| | |
|
|
| |
|
|
|
| | |
Dividends from net investment income (Note 1) | | | | | | | | |
Class A | | | (103,405,926 | ) | | | (111,074,417 | ) |
Class B | | | (47,569,007 | ) | | | (62,481,407 | ) |
Class C | | | (6,786,652 | ) | | | (6,328,367 | ) |
Class Z | | | (4,642,072 | ) | | | (4,125,177 | ) |
| | |
|
|
| |
|
|
|
| | | | (162,403,657 | ) | | | (184,009,368 | ) |
| | |
|
|
| |
|
|
|
Fund share transactions (Net of share conversions) (Note 7) | | | | | | | | |
Net proceeds from shares sold(a) | | | 504,018,908 | | | | 438,342,272 | |
Net asset value of shares issued in reinvestment of dividends | | | 85,279,392 | | | | 93,534,967 | |
Cost of shares reacquired | | | (654,733,464 | ) | | | (646,294,302 | ) |
| | |
|
|
| |
|
|
|
Net decrease in net assets from Fund share transactions | | | (65,435,164 | ) | | | (114,417,063 | ) |
| | |
|
|
| |
|
|
|
Total increase (decrease) | | | 244,954,709 | | | | (346,350,607 | ) |
| | |
Net Assets | | | | | | | | |
| |
Beginning of year | | | 1,888,825,515 | | | | 2,235,176,122 | |
| | |
|
|
| |
|
|
|
End of year | | $ | 2,133,780,224 | | | $ | 1,888,825,515 | |
| | |
|
|
| |
|
|
|
| (a) | For the year ended December 31, 2002, includes $69,733,943 for shares issued in connection with the acquisition of Prudential High Yield Total Return Fund. |
See Notes to Financial Statements
| | |
| Dryden High Yield Fund, Inc. | | 35 |
Notes to Financial Statements
Dryden High Yield Fund, Inc. (the “Fund”), formerly known as Prudential High Yield Fund, Inc., is registered under the Investment Company Act of 1940 as a diversified, open-end management investment company. The primary investment objective of the Fund is to maximize current income through investment in a diversified portfolio of high yield fixed-income securities which, in the opinion of the Fund’s investment adviser, do not subject the Fund to unreasonable risks. As a secondary investment objective, the Fund seeks capital appreciation but only when consistent with its primary objective. Lower rated or unrated (i.e., high yield) securities are more likely to react to developments affecting market risk (general market liquidity) and credit risk (an issuer’s inability to meet principal and interest payments on its obligations) than are more highly rated securities, which react primarily to movements in the general level of interest rates. The ability of issuers of debt securities held by the Fund to meet their obligations may be affected by economic developments in a specific industry or region.
Note 1. Accounting Policies
The following is a summary of significant accounting policies followed by the Fund in the preparation of its financial statements.
Security Valuation: Securities listed on a securities exchange are valued at the last sale price on such exchange on the day of valuation or, if there was no sale on such day, at the mean between the last reported bid and asked prices, or at the last bid price on such day in the absence of an asked price. Securities traded via NASDAQ are valued at the official closing price provided by NASDAQ. Securities that are actively traded in the over-the-counter market, including listed securities for which the primary market is believed by Prudential Investments LLC (“PI” or “Manager”) in consultation with the subadvisor, to be over-the-counter, are valued at market value by an independent pricing agent or principal market maker. Futures contracts and options thereon traded on a commodities exchange or board of trade are valued at the last sale price at the close of trading on such exchange or board of trade or, if there was no sale on the applicable commodities exchange or board of trade on such day, at the mean between the most recently quoted prices on such exchange or board of trade or at the last bid price in the absence of an asked price. Prices may be obtained from independent pricing services which use information provided by market makers or estimates of market values obtained from yield data relating to investments or securities with similar characteristics. Securities for which reliable
| | |
| 36 | | Visit our website at www.jennisondryden.com |
market quotations are not readily available, or whose values have been affected by events occurring after the close of the security’s foreign market and before the Fund’s normal pricing time, are valued at fair value in accordance with Board of Directors’ approved fair valuation procedures.
Investments in mutual funds are valued at their net asset value as of the close of the New York Stock Exchange on the date of valuation.
Short-term securities which mature in sixty days or less are valued at amortized cost, which approximates market value. The amortized cost method involves valuing a security at its cost on the date of purchase and thereafter assuming a constant amortization to maturity of the difference between the principal amount due at maturity and cost. Short-term securities which mature in more than 60 days are valued at current market quotations.
Repurchase Agreements: In connection with transactions in repurchase agreements with United States financial institutions, it is the Fund’s policy that its custodian or designated subcustodians under triparty repurchase agreements, as the case may be, take possession of the underlying collateral securities, the value of which exceeds the principal amount of the repurchase transactions, including accrued interest. To the extent that any repurchase transaction exceeds one business day, the value of the collateral is marked to market on a daily basis to ensure the adequacy of the collateral. If the seller defaults and the value of the collateral declines or if bankruptcy proceedings are commenced with respect to the seller of the security, realization of the collateral by the Fund may be delayed or limited.
Restricted Securities: The Fund may hold up to 15% of its net assets in illiquid securities, including those which are restricted as to disposition under securities law (“restricted securities”). Certain issues of restricted securities held by the Fund at December 31, 2003 include registration rights under which the Fund may demand registration by the issuer, of which the Fund may bear the cost of such registration. Restricted securities, sometimes referred to as private placements, are valued pursuant to the valuation procedures noted above.
Loan Participations: The Fund may invest in loan participations, another type of restricted security. When the Fund purchases a loan participation, the Fund typically enters into a contractual relationship with the lender or third party selling such participations (“Selling Participant”), but not the borrower. As a result, the Fund assumes the credit risk of the borrower, the selling participant and any other persons interpositioned between the Fund and the borrower (“intermediate participants”). The
| | |
| Dryden High Yield Fund, Inc. | | 37 |
Notes to Financial Statements
Cont’d
Fund may not directly benefit from the collateral supporting the senior loan in which it has purchased the loan participation.
Foreign Currency Translation: The books and records of the Fund are maintained in U.S. dollars. Foreign currency amounts are translated into U.S. dollars on the following basis:
(i) market value of investment securities, other assets and liabilities at the closing daily rates of exchange;
(ii) purchases and sales of investment securities, income and expenses at the rates of exchange prevailing on the respective dates of such transactions.
Although the net assets of the Fund are presented at the foreign exchange rates and market values at the close of the fiscal period, the Fund does not isolate that portion of the results of operations arising as a result of changes in the foreign exchange rates from the fluctuations arising from changes in the market prices of long-term securities held at the end of the fiscal period. Similarly, the Fund does not isolate the effect of changes in foreign exchange rates from the fluctuations arising from changes in the market prices of long-term portfolio securities sold during the fiscal period. Accordingly, realized foreign currency gains (losses) are included in the reported net realized gains (losses) on investment transactions.
Net realized gains (losses) on foreign currency transactions represent net foreign exchange gains (losses) from the holding of foreign currencies, currency gains (losses) realized between the trade and settlement dates on security transactions, and the difference between the amounts of dividends, interest and foreign withholding taxes recorded on the Fund’s books and the U.S. dollar equivalent amounts actually received or paid. Net realized currency gains (losses) from valuing foreign currency denominated assets and liabilities (other than investments) at period-ended exchange rates are reflected as a component of net unrealized appreciation (depreciation) on foreign currencies.
Foreign security and currency transactions may involve certain considerations and risks not typically associated with those of domestic origin as a result of, among other factors, the possibility of political and economic instability or the level of governmental supervision and regulation of foreign securities markets.
| | |
| 38 | | Visit our website at www.jennisondryden.com |
Forward Currency Contracts: A forward currency contract is a commitment to purchase or sell a foreign currency at a future date at a negotiated forward rate. The Fund enters into forward currency contracts in order to hedge its exposure to changes in foreign currency exchange rates on its foreign portfolio holdings or on specific receivables and payables denominated in a foreign currency. The contracts are valued daily at current forward exchange rates and any unrealized gain or loss is included in net unrealized appreciation (depreciation) on investments and foreign currencies. Gain (loss) is realized on the settlement date of the contract equal to the difference between the settlement value of the original and renegotiated forward contracts. This gain (loss), if any, is included in net realized gain (loss) on foreign currency transactions. Risks may arise upon entering into these contracts from the potential inability of the counterparties to meet the terms of their contracts.
Forward currency contracts involve elements of both market and credit risk in excess of the amounts reported on the Statement of Assets and Liabilities.
Securities Lending: The Fund may lend its portfolio securities to broker-dealers. The loans are secured by collateral at least equal at all times to the market value of the securities loaned. Loans are subject to termination at the option of the borrower or the Fund. Upon termination of the loan, the borrower will return to the lender securities identical to the loaned securities. Should the borrower of the securities fail financially, the Fund has the right to repurchase the securities using the collateral in the open market. The Fund recognizes income, net of any rebate and securities lending agent fees, for lending its securities in the form of fees or interest on the investment of any cash received as collateral. The Fund also continues to receive interest and dividends or amounts equivalent thereto, on the securities loaned and recognizes any unrealized gain or loss in the market price of the securities loaned that may occur during the term of the loan.
Securities Transactions and Net Investment Income: Securities transactions are recorded on the trade date. Realized gains (losses) on sales of investments are calculated on the identified cost basis. Dividend income is recorded on the ex-dividend date and interest income, including amortization of premium and accretion of discount on debt securities, as required, is recorded on the accrual basis. Expenses are recorded on the accrual basis which may require the use of certain estimates by management.
Net investment income/(loss) (other than distribution fees which are charged directly to the respective class) and unrealized and realized gains (losses) are allocated daily to each class of shares based upon the relative proportion of net assets of each class at the beginning of the day.
| | |
| Dryden High Yield Fund, Inc. | | 39 |
Notes to Financial Statements
Cont’d
Taxes: For federal income tax purposes, it is the Fund’s policy to continue to meet the requirements of the Internal Revenue Code applicable to regulated investment companies and to distribute all of its taxable net income and capital gains, if any, to its shareholders. Therefore, no federal income tax provision is required.
Dividends and Distributions: The Fund declares daily and pays dividends of net investment income monthly and makes distributions of net realized capital and currency gains, if any, annually. Dividends and distributions to shareholders, which are determined in accordance with federal income tax regulations and which may differ from generally accepted accounting principles, are recorded on the ex-dividend date. Permanent book/tax differences relating to income and gains are reclassified amongst undistributed net investment income, accumulated net realized gain or loss and paid-in capital in excess of par, as appropriate.
Estimates: The preparation of the financial statements requires management to make estimates and assumptions that affect the reported amounts and disclosures in the financial statements. Actual results could differ from those estimates.
Note 2. Agreements
The Fund has a management agreement with PI. Pursuant to this agreement, PI has responsibility for all investment advisory services and supervises the subadvisor’s performance of such services. PI has entered into a subadvisory agreement with Prudential Investment Management, Inc. (“PIM”). The subadvisory agreement provides that PIM will furnish investment advisory services in connection with the management of the Fund. In connection therewith, PIM is obligated to keep certain books and records of the Fund. PI pays for the services of PIM, the cost of compensation of officers of the Fund, occupancy and certain clerical and bookkeeping costs of the Fund. The Fund bears all other costs and expenses.
The management fee paid to PI is accrued daily and payable monthly, at an annual rate of .50% of the Fund’s average daily net assets up to $250 million, .475% of the next $500 million, .45% of the next $750 million, .425% of the next $500 million, ..40% of the next $500 million, .375% of the next $500 million and .35% of the Fund’s average daily net assets in excess of $3 billion.
| | |
| 40 | | Visit our website at www.jennisondryden.com |
The Fund has a distribution agreement with Prudential Investment Management Services LLC (“PIMS”), which acts as the distributor of the Class A, Class B, Class C and Class Z shares of the Fund. The Fund compensates PIMS for distributing and servicing the Fund’s Class A, B and C shares, pursuant to plans of distribution (the “Class A, B and C Plans”), regardless of expenses actually incurred by it. The distribution fees are accrued daily and payable monthly. No distribution or service fees are paid to PIMS as distributor of the Class Z shares of the Fund.
Pursuant to the Class A, B and C Plans, the Fund compensates PIMS for distribution-related activities at an annual rate of up to .30 of 1%, .75 of 1% and 1%, of the average daily net assets of the Class A, B and C shares, respectively. For the year ended December 31, 2003, PIMS contractually agreed to limit such fees to .25% of 1% and .75% of 1% of the average daily net assets of the Class A and Class C shares, respectively.
PIMS has advised the Fund that it has received approximately $696,500 and $161,400 in front-end sales charges resulting from sales of Class A and Class C shares, respectively, during the year ended December 31, 2003. From these fees, PIMS paid such sales charges to affiliated broker-dealers, which in turn paid commissions to salespersons and incurred other distribution costs.
PIMS has advised the Fund that for the year ended December 31, 2003, it received approximately $890,200 and $47,900 in contingent deferred sales charges imposed upon certain redemptions by Class B and Class C shareholders, respectively.
PI, PIMS and PIM are indirect, wholly-owned subsidiaries of Prudential Financial, Inc. (“Prudential”).
The Fund, along with other affiliated registered investment companies (the “Funds”), is a party to a syndicated credit agreement (“SCA”) with a group of banks. The SCA provides for a commitment of $800 million and allows the Funds to increase the commitment to $1 billion, if necessary. Interest on any borrowings will be at market rates. The Funds pay a commitment fee of .08 of 1% of the unused portion of the SCA. The commitment fee is accrued and paid quarterly and is allocated to the Funds pro rata based on net assets. The purpose of the SCA is to serve as an alternative source of funding for capital share redemptions. The expiration date of the SCA was May 2, 2003. On May 2, 2003, the SCA was renewed under the same terms and conditions (“May 2003 renewal”). The expiration date of the May 2003 renewal is April 30, 2004. The Fund did not borrow any amounts pursuant to the SCA during the year ended December 31, 2003.
| | |
| Dryden High Yield Fund, Inc. | | 41 |
Notes to Financial Statements
Cont’d
Note 3. Other Transactions with Affiliates
Prudential Mutual Fund Services LLC, (“PMFS”), an affiliate of PI and an indirect, wholly-owned subsidiary of Prudential, serves as the Fund’s transfer agent. During the year ended December 31, 2003, the Fund incurred fees of approximately $2,180,700 for the services of PMFS. As of December 31, 2003, approximately $172,700 of such fees were due to PMFS. Transfer agent fees and expenses in the Statement of Operations include certain out-of-pocket expenses paid to non-affiliates, where applicable.
The Fund pays networking fees to affiliated and unaffiliated broker/dealers. These networking fees are payments made to broker/dealers that clear mutual fund transactions through a national mutual fund clearing system. The Fund incurred approximately $157,000 in total networking fees, of which the amount relating to the services of Wachovia Securities, LLC (“Wachovia”) and Prudential Securities, Inc. (“PSI”), affiliates of PI, was approximately $150,900 for the year ended December 31, 2003. Effective July 1, 2003 Prudential and Wachovia Corp. formed a joint venture (“Wachovia Securities, LLC”) whereby Prudential and Wachovia Corp. combined their brokerage businesses with Prudential holding a minority interest. Prior to July 1, 2003, PSI was an indirect, wholly-owned subsidiary of Prudential. These amounts are included in transfer agent’s fees and expenses in the Statement of Operations.
PSI was the securities lending agent for the Fund through June 30, 2003. Effective July 1, 2003, PIM is the Fund’s securities lending agent. For the year ended December 31, 2003, PSI and PIM have been compensated approximately $93,143 and $171,765, for these services, respectively.
The Fund invests in the Taxable Money Market Series (the “Series”), a portfolio of Dryden Core Investment Fund, formerly Prudential Core Investment Fund, pursuant to an exemptive order received from the Securities and Exchange Commission. The Series is a money market mutual fund registered under the Investment Company Act of 1940, as amended, and managed by PI. During the year ended December 31, 2003, the Fund earned income of $794,721 from the Series by investing collateral received from securities lending.
| | |
| 42 | | Visit our website at www.jennisondryden.com |
Note 4. Portfolio Securities
Purchases and sales of investment securities, other than short-term investments, for the year ended December 31, 2003 were $1,383,070,291 and $1,319,944,111, respectively.
As of December 31, 2003, the Fund has securities on loan with an aggregate market value of $469,331,835. The Fund received $490,338,751 in cash, as collateral for securities on loan with which it purchased highly liquid short-term investments in accordance with the Fund’s securities lending procedures.
Note 5. Distribution and Tax Information
Distributions to shareholders, which are determined in accordance with federal income tax regulations and which may differ from generally accepted accounting principles, are recorded on the ex-dividend date. In order to present undistributed net investment income (loss), accumulated net realized gains (losses) and paid-in capital in excess of par on the Statement of Assets and Liabilities that more closely represent their tax character, certain adjustments have been made to paid-in-capital in excess of par, undistributed net investment income (loss) and accumulated net realized gain (loss) on investments. For the year ended December 31, 2003, the adjustments were to increase net investment income by $2,408,577, decrease accumulated net realized loss by $155,751,884 and decrease paid-in-capital by 158,160,461, due to foreign currency reclassification, expiration of capital loss carryforward and certain other permanent differences. Net investment income, net realized gains and net assets were not affected by this change.
For federal income tax purposes, the Fund had a capital loss carryforward at December 31, 2003, of approximately $1,266,889,000, of which $169,718,000 expires in 2007, $312,066,000 expires in 2008, $369,236,000 expires 2009 and $386,017,000 expires in 2010. The remaining amount resulted from when the Fund acquired a capital loss carryforward from the merger with Prudential High Yield Total Return Fund, Inc. in the amount of $29,852,000, of which $1,698,000 expires in 2006, $6,981,000 expires in 2007, $8,555,000 in 2008 and $12,618,000 expires in 2009, respectively. The future utilization of the acquired built-in losses from Prudential High Yield Total Return Fund, Inc. in the amount of $18,309,338, will be limited under Section 382 of the Internal Revenue Code of 1986, as amended. The annual limitation to be applied to all Section 382 losses will be $3,494,000. Accordingly, no capital gains distribution is expected to be paid to shareholders until net gains have been realized in excess of such allowable amounts. It is uncertain whether the Fund will be able to realize the full benefit prior to the expiration date.
| | |
| Dryden High Yield Fund, Inc. | | 43 |
Notes to Financial Statements
Cont’d
For the years ended December 31, 2003 and December 31, 2002, the tax character of dividends paid, as reflected in the Statement of Changes in Net Assets were $162,403,657 and $184,009,368, respectively of ordinary income. As of December 31, 2003, there were no accumulated undistributed earnings on a tax basis.
The United States federal income tax basis of the Fund’s investments and the net unrealized depreciation as of December 31, 2003 were as follows:
| | | | | | |
Tax Basis
| | Appreciation
| | Depreciation
| | Total Net Unrealized
Depreciation
|
| $2,594,843,255 | | $177,032,565 | | $180,075,556 | | $3,042,991 |
The difference between book basis and tax basis is primarily attributable to the difference in the treatment of market discount, amortization of premiums and wash sales for book and tax purposes.
Note 6. Joint Repurchase Agreement Account
The Fund, along with other affiliated registered investment companies, transfers uninvested cash balances into a single joint account, the daily aggregate balance of which is invested in one or more repurchase agreements collateralized by U.S. Treasury or federal agency obligations. As of December 31, 2003, the Fund had a 23.65% undivided interest in the joint account. The undivided interest for the Fund represents $56,905,000 in principal amount. As of such date, each repurchase agreement in the joint account and the collateral therefore were as follows:
Bank of America Securities LLC, 0.98%, in the principal amount of $25,634,000, repurchase price $25,635,396, dated 12/31/03, due 1/2/04. The value of the collateral including accrued interest was $26,146,680.
Greenwich Capital Market, 1.01%, in the principal amount of $75,000,000, repurchase price $75,004,208, dated 12/31/03, due 1/2/04. The value of the collateral including accrued interest was $76,501,470.
JP Morgan Chase Securities, Inc., 1.00%, in the principal amount of $65,000,000, repurchase price $65,003,611, dated 12/31/03, due 1/2/04. The value of the collateral including accrued interest was $66,300,359.
| | |
| 44 | | Visit our website at www.jennisondryden.com |
UBS Securities, 1.00%, in the principal amount of $75,000,000, repurchase price $75,004,167, dated 12/31/03, due 1/2/04. The value of the collateral including accrued interest was $76,503,568.
Note 7. Capital
The Fund offers Class A, Class B, Class C and Class Z shares. Class A shares are sold with a front-end sales charge of up to 4%. Class B shares are sold with a contingent deferred sales charge which declines from 5% to zero depending on the period of time the shares are held. Class C shares are sold with a front-end sales charge of 1% and a contingent deferred sales charge of 1% during the first 18 months. Class B shares automatically convert to Class A shares on a quarterly basis approximately seven years after purchase. A special exchange privilege is also available for shareholders who qualify to purchase Class A shares at net asset value. Class Z shares are not subject to any sales or redemption charge and are offered exclusively for sale to a limited group of investors.
The Fund has 3 billion shares of $.01 par value common stock authorized; equally divided into four classes, designated Class A, Class B, Class C and Class Z shares.
Transactions in shares of common stock were as follows:
| | | | | | | |
Class A
| | Shares
| | | Amount
| |
Year ended December 31, 2003: | | | | | | | |
Shares sold | | 62,033,819 | | | $ | 333,313,582 | |
Shares issued in reinvestment of dividends | | 10,269,474 | | | | 56,062,123 | |
Shares reacquired | | (86,556,055 | ) | | | (471,250,698 | ) |
| | |
|
| |
|
|
|
Net increase (decrease) in shares outstanding before conversion | | (14,252,762 | ) | | | (81,874,993 | ) |
Shares issued upon conversion from Class B | | 16,884,663 | | | | 92,565,640 | |
| | |
|
| |
|
|
|
Net increase (decrease) in shares outstanding | | 2,631,901 | | | $ | 10,690,647 | |
| | |
|
| |
|
|
|
Year ended December 31, 2002: | | | | | | | |
Shares sold | | 39,828,820 | | | $ | 204,352,128 | |
Shares issued in connection with reorganization (Note 8) | | 2,382,263 | | | | 13,284,198 | |
Shares issued in reinvestment of distributions | | 11,385,140 | | | | 59,010,116 | |
Shares reacquired | | (76,153,597 | ) | | | (397,420,267 | ) |
| | |
|
| |
|
|
|
Net increase (decrease) in shares outstanding before conversion | | (22,557,374 | ) | | | (120,773,825 | ) |
Shares issued upon conversion from Class B | | 17,763,327 | | | | 92,315,277 | |
| | |
|
| |
|
|
|
Net increase (decrease) in shares outstanding | | (4,794,047 | ) | | $ | (28,458,548 | ) |
| | |
|
| |
|
|
|
| | |
| Dryden High Yield Fund, Inc. | | 45 |
Notes to Financial Statements
Cont’d
| | | | | | | |
Class B
| | Shares
| | | Amount
| |
Year ended December 31, 2003: | | | | | | | |
Shares sold | | 16,575,416 | | | $ | 89,410,928 | |
Shares issued in reinvestment of dividends | | 3,960,647 | | | | 21,544,968 | |
Shares reacquired | | (19,470,116 | ) | | | (105,570,262 | ) |
| | |
|
| |
|
|
|
Net increase (decrease) in shares outstanding before conversion | | 1,065,947 | | | | 5,385,634 | |
Shares reacquired upon conversion into Class A | | (16,915,574 | ) | | | (92,565,640 | ) |
| | |
|
| |
|
|
|
Net increase (decrease) in shares outstanding | | (15,849,627 | ) | | $ | (87,180,006 | ) |
| | |
|
| |
|
|
|
Year ended December 31, 2002: | | | | | | | |
Shares sold | | 18,148,290 | | | $ | 95,003,748 | |
Shares issued in connection with reorganization (Note 8) | | 8,320,848 | | | | 46,313,859 | |
Shares reacquired in reinvestment of distributions | | 5,342,085 | | | | 27,701,984 | |
Shares reacquired | | (35,430,755 | ) | | | (183,090,227 | ) |
| | |
|
| |
|
|
|
Net increase (decrease) in shares outstanding before conversion | | (3,619,532 | ) | | | (14,070,636 | ) |
Shares issued upon conversion into Class A | | (17,788,474 | ) | | | (92,315,277 | ) |
| | |
|
| |
|
|
|
Net increase (decrease) in shares outstanding | | (21,408,006 | ) | | $ | (106,385,913 | ) |
| | |
|
| |
|
|
|
Class C
| | | | | | |
Year ended December 31, 2003: | | | | | | | |
Shares sold | | 6,096,355 | | | $ | 32,545,826 | |
Shares issued in reinvestment of distributions | | 671,779 | | | | 3,665,752 | |
Shares reaquired | | (4,472,803 | ) | | | (24,364,553 | ) |
| | |
|
| |
|
|
|
Net increase (decrease) in shares outstanding | | 2,295,331 | | | $ | 11,847,025 | |
| | |
|
| |
|
|
|
Year ended December 31, 2002: | | | | | | | |
Shares sold | | 4,438,546 | | | $ | 23,074,896 | |
Shares issued in connection with reorganization (Note 8) | | 1,640,289 | | | | 9,129,836 | |
Shares issued in reinvestment of distributions | | 619,893 | | | | 3,198,179 | |
Shares reaquired | | (4,486,748 | ) | | | (23,132,599 | ) |
| | |
|
| |
|
|
|
Net increase (decrease) in shares outstanding | | 2,211,980 | | | $ | 12,270,312 | |
| | |
|
| |
|
|
|
Class Z
| | | | | | |
Year ended December 31, 2003: | | | | | | | |
Shares sold | | 9,023,968 | | | $ | 48,748,572 | |
Shares issued in reinvestment of distributions | | 732,596 | | | | 4,006,549 | |
Shares reaquired | | (9,772,426 | ) | | | (53,547,951 | ) |
| | |
|
| |
|
|
|
Net increase (decrease) in shares outstanding | | (15,862 | ) | | $ | (792,830 | ) |
| | |
|
| |
|
|
|
Year ended December 31, 2002: | | | | | | | |
Shares sold | | 8,811,692 | | | $ | 46,177,557 | |
Shares issued in connection with reorganization (Note 8) | | 179,828 | | | | 1,006,050 | |
Shares issued in reinvestment of distributions | | 698,006 | | | | 3,624,688 | |
Shares reaquired | | (8,130,945 | ) | | | (42,651,209 | ) |
| | |
|
| |
|
|
|
Net increase (decrease) in shares outstanding | | 1,558,581 | | | $ | 8,157,086 | |
| | |
|
| |
|
|
|
| | |
| 46 | | Visit our website at www.jennisondryden.com |
Note 8. Acquisition of Prudential High Yield Total Return Fund
On March 20, 2002, the Fund acquired all of the net assets of Prudential High Yield Total Return Fund pursuant to a plan of reorganization approved by the Fund’s shareholders on March 7, 2002. The acquisition was accomplished by a tax-free exchange of Class A, Class B, Class C, and Class Z shares:
| | | | | | |
| | | Prudential High Yield Total Return Fund Shares Redeemed
| | Prudential
High Yield Fund
Shares Issued
| | Value
|
Class A | | 2,150,976 | | 2,382,263 | | $13,284,198 |
Class B | | 7,463,305 | | 8,320,848 | | 46,313,859 |
Class C | | 1,471,242 | | 1,640,289 | | 9,129,836 |
Class Z | | 162,924 | | 179,828 | | 1,006,050 |
Prudential High Yield Total Return Fund’s net assets at that date of $69,733,943, including $18,309,338 of unrealized depreciation, were combined with those of the Fund. The aggregate net assets of the Fund and Prudential High Yield Total Return Fund immediately before the acquisition were $2,203,447,051 and $69,733,943, respectively.
| | |
| Dryden High Yield Fund, Inc. | | 47 |
Financial Highlights
| | | | |
| |
| | | Class A
| |
| | | Year Ended
December 31, 2003 | |
| |
Per Share Operating Performance: | | | | |
Net Asset Value, Beginning Of Year | | $ | 4.99 | |
| | |
|
|
|
Income/loss from investment operations: | | | | |
Net investment income | | | .43 | |
Net realized and unrealized gain (loss) on investment transactions | | | .82 | |
| | |
|
|
|
Total from investment operations | | | 1.25 | |
| | |
|
|
|
Less distributions | | | | |
Dividends from net investment income | | | (.44 | ) |
Distributions in excess of net investment income | | | — | |
Tax return of capital distributions | | | — | |
| | |
|
|
|
Total distributions | | | (.44 | ) |
| | |
|
|
|
Net asset value, end of year | | $ | 5.80 | |
| | |
|
|
|
Total Return(a): | | | 25.66 | % |
Ratios/Supplemental Data: | | | | |
Net assets, end of year (000) | | $ | 1,364,999 | |
Average net assets (000) | | $ | 1,286,769 | |
Ratios to average net assets: | | | | |
Expenses, including distribution and service (12b-1) fees(d) | | | .90 | % |
Expenses, excluding distribution and service (12b-1) fees | | | .65 | % |
Net investment income | | | 7.93 | % |
For Class A, B, C and Z shares: | | | | |
Portfolio turnover rate | | | 68 | % |
| (a) | Total return does not consider the effects of sales load. Total return is calculated assuming a purchase of shares on the first day and a sale on the last day of each year reported and includes reinvestment of dividends and distributions. |
| (b) | Calculated based upon weighted average shares outstanding during the year. |
| (c) | Less than $.005 per share. |
| (d) | The distributor of the Fund contractually agreed to limit its distribution and service (12b-1) fees to .25% of 1% of the average daily net assets of the Class A shares. |
See Notes to Financial Statements
| | |
| 48 | | Visit our website at www.jennisondryden.com |
| | | | | | | | | | | | | | |
|
| Class A | |
|
| Year Ended December 31, | |
|
| 2002 | | | 2001 | | | 2000 | | | 1999 | |
| |
| | | | | | | | | | | | | | | |
| $ | 5.57 | | | $ | 6.20 | | | $ | 7.38 | | | $ | 7.88 | |
|
|
| |
|
|
| |
|
|
| |
|
|
|
| | | | | | | | | | | | | | | |
| | .47 | | | | .61 | (b) | | | .69 | (b) | | | .71 | |
| | (.57 | ) | | | (.61 | ) | | | (1.17 | ) | | | (.45 | ) |
|
|
| |
|
|
| |
|
|
| |
|
|
|
| | (.10 | ) | | | — | | | | (.48 | ) | | | .26 | |
|
|
| |
|
|
| |
|
|
| |
|
|
|
| | | | | | | | | | | | | | | |
| | (.48 | ) | | | (.61 | ) | | | (.69 | ) | | | (.71 | ) |
| | — | | | | — | | | | — | (c) | | | (.01 | ) |
| | — | | | | (.02 | ) | | | (.01 | ) | | | (.04 | ) |
|
|
| |
|
|
| |
|
|
| |
|
|
|
| | (.48 | ) | | | (.63 | ) | | | (.70 | ) | | | (.76 | ) |
|
|
| |
|
|
| |
|
|
| |
|
|
|
| $ | 4.99 | | | $ | 5.57 | | | $ | 6.20 | | | $ | 7.38 | |
|
|
| |
|
|
| |
|
|
| |
|
|
|
| | (1.56 | )% | | | (.25 | )% | | | (6.88 | )% | | | 3.38 | % |
| | | | | | | | | | | | | | | |
| $ | 1,160,389 | | | $ | 1,323,184 | | | $ | 1,482,144 | | | $ | 1,750,618 | |
| $ | 1,206,048 | | | $ | 1,433,298 | | | $ | 1,591,228 | | | $ | 1,746,123 | |
| | | | | | | | | | | | | | | |
| | .90 | % | | | .88 | % | | | .85 | % | | | .80 | % |
| | .65 | % | | | .63 | % | | | .60 | % | | | .55 | % |
| | 9.13 | % | | | 10.14 | % | | | 9.95 | % | | | 9.30 | % |
| | | | | | | | | | | | | | | |
| | 50 | % | | | 77 | % | | | 71 | % | | | 70 | % |
See Notes to Financial Statements
| | |
| Dryden High Yield Fund, Inc. | | 49 |
Financial Highlights
Cont’d
| | | | |
| |
| | | Class B
| |
| | | Year Ended
December 31, 2003 | |
| |
Per Share Operating Performance: | | | | |
Net Asset Value, Beginning Of Year | | $ | 4.98 | |
| | |
|
|
|
Income/loss from investment operations: | | | | |
Net investment income | | | .40 | |
Net realized and unrealized gain (loss) on investment transactions | | | .82 | |
| | |
|
|
|
Total from investment operations | | | 1.22 | |
| | |
|
|
|
Less distributions | | | | |
Dividends from net investment income | | | (.41 | ) |
Distributions in excess of net investment income | | | — | |
Tax return of capital distributions | | | — | |
| | |
|
|
|
Total distributions | | | (.41 | ) |
| | |
|
|
|
Net asset value, end of year | | $ | 5.79 | |
| | |
|
|
|
Total Return(a): | | | 25.08 | % |
Ratios/Supplemental Data: | | | | |
Net assets, end of year (000) | | $ | 618,539 | |
Average net assets (000) | | $ | 629,849 | |
Ratios to average net assets: | | | | |
Expenses, including distribution and service (12b-1) fees | | | 1.40 | % |
Expenses, excluding distribution and service (12b-1) fees | | | .65 | % |
Net investment income | | | 7.44 | % |
| (a) | Total return does not consider the effects of sales load. Total return is calculated assuming a purchase of shares on the first day and a sale on the last day of each year reported and includes reinvestment of dividends and distributions. |
| (b) | Calculated based upon weighted average shares outstanding during the year. |
| (c) | Less than $.005 per share. |
See Notes to Financial Statements
| | |
| 50 | | Visit our website at www.jennisondryden.com |
| | | | | | | | | | | | | | |
|
| Class B | |
|
| Year Ended December 31, | |
|
| 2002 | | | 2001 | | | 2000 | | | 1999 | |
| |
| | | | | | | | | | | | | | | |
| $ | 5.56 | | | $ | 6.19 | | | $ | 7.36 | | | $ | 7.86 | |
|
|
| |
|
|
| |
|
|
| |
|
|
|
| | | | | | | | | | | | | | | |
| | .44 | | | | .58 | (b) | | | .65 | (b) | | | .67 | |
| | (.57 | ) | | | (.61 | ) | | | (1.16 | ) | | | (.45 | ) |
|
|
| |
|
|
| |
|
|
| |
|
|
|
| | (.13 | ) | | | (.03 | ) | | | (.51 | ) | | | .22 | |
|
|
| |
|
|
| |
|
|
| |
|
|
|
| | | | | | | | | | | | | | | |
| | (.45 | ) | | | (.58 | ) | | | (.65 | ) | | | (.66 | ) |
| | — | | | | — | | | | — | (c) | | | (.02 | ) |
| | — | | | | (.02 | ) | | | (.01 | ) | | | (.04 | ) |
|
|
| |
|
|
| |
|
|
| |
|
|
|
| | (.45 | ) | | | (.60 | ) | | | (.66 | ) | | | (.72 | ) |
|
|
| |
|
|
| |
|
|
| |
|
|
|
| $ | 4.98 | | | $ | 5.56 | | | $ | 6.19 | | | $ | 7.36 | |
|
|
| |
|
|
| |
|
|
| |
|
|
|
| | (2.07 | )% | | | (.78 | )% | | | (7.28 | )% | | | 2.86 | % |
| | | | | | | | | | | | | | | |
| $ | 610,615 | | | $ | 801,358 | | | $ | 1,051,971 | | | $ | 1,867,620 | |
| $ | 720,123 | | | $ | 965,014 | | | $ | 1,453,221 | | | $ | 2,180,904 | |
| | | | | | | | | | | | | | | |
| | 1.40 | % | | | 1.38 | % | | | 1.35 | % | | | 1.30 | % |
| | .65 | % | | | .63 | % | | | .60 | % | | | .55 | % |
| | 8.60 | % | | | 9.66 | % | | | 9.41 | % | | | 8.78 | % |
See Notes to Financial Statements
| | |
| Dryden High Yield Fund, Inc. | | 51 |
Financial Highlights
Cont’d
| | | | |
| |
| | | Class C
| |
| | | Year Ended
December 31, 2003 | |
| |
Per Share Operating Performance: | | | | |
Net Asset Value, Beginning Of Year | | $ | 4.98 | |
| | |
|
|
|
Income/loss from investment operations: | | | | |
Net investment income | | | .40 | |
Net realized and unrealized gain (loss) on investment transactions | | | .82 | |
| | |
|
|
|
Total from investment operations | | | 1.22 | |
| | |
|
|
|
Less distributions | | | | |
Dividends from net investment income | | | (.41 | ) |
Distributions in excess of net investment income | | | — | |
Tax return of capital distributions | | | — | |
| | |
|
|
|
Total distributions | | | (.41 | ) |
| | |
|
|
|
Net asset value, end of year | | $ | 5.79 | |
| | |
|
|
|
Total Return(a): | | | 25.08 | % |
Ratios/Supplemental Data: | | | | |
Net assets, end of year (000) | | $ | 97,291 | |
Average net assets (000) | | $ | 90,157 | |
Ratios to average net assets: | | | | |
Expenses, including distribution and service (12b-1) fees(d) | | | 1.40 | % |
Expenses, excluding distribution and service (12b-1) fees | | | .65 | % |
Net investment income | | | 7.42 | % |
| (a) | Total return does not consider the effects of sales load. Total return is calculated assuming a purchase of shares on the first day and a sale on the last day of each year reported and includes reinvestment of dividends and distributions. |
| (b) | Calculated based upon weighted average shares outstanding during the year. |
| (c) | Less than $.005 per share. |
| (d) | The distributor of the Fund has contractually agreed to limit its distribution and service (12b-1) fees to .75% of 1% of the average daily net assets of the Class C shares. |
See Notes to Financial Statements
| | |
| 52 | | Visit our website at www.jennisondryden.com |
| | | | | | | | | | | | | | |
|
| Class C | |
|
| Year Ended December 31, | |
|
| 2002 | | | 2001 | | | 2000 | | | 1999 | |
| |
| | | | | | | | | | | | | | | |
| $ | 5.56 | | | $ | 6.19 | | | $ | 7.36 | | | $ | 7.86 | |
|
|
| |
|
|
| |
|
|
| |
|
|
|
| | | | | | | | | | | | | | | |
| | .44 | | | | .58 | (b) | | | .65 | (b) | | | .67 | |
| | (.57 | ) | | | (.61 | ) | | | (1.16 | ) | | | (.45 | ) |
|
|
| |
|
|
| |
|
|
| |
|
|
|
| | (.13 | ) | | | (.03 | ) | | | (.51 | ) | | | .22 | |
|
|
| |
|
|
| |
|
|
| |
|
|
|
| | | | | | | | | | | | | | | |
| | (.45 | ) | | | (.58 | ) | | | (.65 | ) | | | (.67 | ) |
| | — | | | | — | | | | — | (c) | | | (.01 | ) |
| | — | | | | (.02 | ) | | | (.01 | ) | | | (.04 | ) |
|
|
| |
|
|
| |
|
|
| |
|
|
|
| | (.45 | ) | | | (.60 | ) | | | (.66 | ) | | | (.72 | ) |
|
|
| |
|
|
| |
|
|
| |
|
|
|
| $ | 4.98 | | | $ | 5.56 | | | $ | 6.19 | | | $ | 7.36 | |
|
|
| |
|
|
| |
|
|
| |
|
|
|
| | (2.07 | )% | | | (.78 | )% | | | (7.28 | )% | | | 2.86 | % |
| | | | | | | | | | | | | | | |
| $ | 72,213 | | | $ | 68,382 | | | $ | 67,890 | | | $ | 98,347 | |
| $ | 72,506 | | | $ | 70,073 | | | $ | 82,438 | | | $ | 95,443 | |
| | | | | | | | | | | | | | | |
| | 1.40 | % | | | 1.38 | % | | | 1.35 | % | | | 1.30 | % |
| | .65 | % | | | .63 | % | | | .60 | % | | | .55 | % |
| | 8.65 | % | | | 9.66 | % | | | 9.44 | % | | | 8.81 | % |
See Notes to Financial Statements
| | |
| Dryden High Yield Fund, Inc. | | 53 |
Financial Highlights
Cont’d
| | | | |
| |
| | | Class Z
| |
| | | Year Ended
December 31, 2003 | |
| |
Per Share Operating Performance: | | | | |
Net Asset Value, Beginning Of Year | | $ | 5.00 | |
| | |
|
|
|
Income/loss from investment operations: | | | | |
Net investment income | | | .44 | |
Net realized and unrealized gain (loss) on investment transactions | | | .82 | |
| | |
|
|
|
Total from investment operations | | | 1.26 | |
| | |
|
|
|
Less distributions | | | | |
Dividends from net investment income | | | (.45 | ) |
Distributions in excess of net investment income | | | — | |
Tax return of capital distributions | | | — | |
| | |
|
|
|
Total distributions | | | (.45 | ) |
| | |
|
|
|
Net asset value, end of year | | $ | 5.81 | |
| | |
|
|
|
Total Return(a): | | | 25.94 | % |
Ratios/Supplemental Data: | | | | |
Net assets, end of year (000) | | $ | 52,951 | |
Average net assets (000) | | $ | 56,046 | |
Ratios to average net assets: | | | | |
Expenses, including distribution and service (12b-1) fees | | | .65 | % |
Expenses, excluding distribution and service (12b-1) fees | | | .65 | % |
Net investment income | | | 8.17 | % |
| (a) | Total return is calculated assuming a purchase of shares on the first day and a sale on the last day of each year reported and includes reinvestment of dividends and distributions. |
| (b) | Calculated based upon weighted average shares outstanding during the year. |
See Notes to Financial Statements
| | |
| 54 | | Visit our website at www.jennisondryden.com |
| | | | | | | | | | | | | | |
|
| Class Z | |
|
| Year Ended December 31, | |
|
| 2002 | | | 2001 | | | 2000 | | | 1999 | |
| |
| | | | | | | | | | | | | | | |
| $ | 5.58 | | | $ | 6.20 | | | $ | 7.39 | | | $ | 7.88 | |
|
|
| |
|
|
| |
|
|
| |
|
|
|
| | | | | | | | | | | | | | | |
| | .48 | | | | .63 | (b) | | | .70 | (b) | | | .73 | |
| | (.57 | ) | | | (.60 | ) | | | (1.17 | ) | | | (.44 | ) |
|
|
| |
|
|
| |
|
|
| |
|
|
|
| | (.09 | ) | | | .03 | | | | (.47 | ) | | | .29 | |
|
|
| |
|
|
| |
|
|
| |
|
|
|
| | | | | | | | | | | | | | | |
| | (.49 | ) | | | (.63 | ) | | | (.70 | ) | | | (.73 | ) |
| | — | | | | — | | | | (.01 | ) | | | (.01 | ) |
| | — | | | | (.02 | ) | | | (.01 | ) | | | (.04 | ) |
|
|
| |
|
|
| |
|
|
| |
|
|
|
| | (.49 | ) | | | (.65 | ) | | | (.72 | ) | | | (.78 | ) |
|
|
| |
|
|
| |
|
|
| |
|
|
|
| $ | 5.00 | | | $ | 5.58 | | | $ | 6.20 | | | $ | 7.39 | |
|
|
| |
|
|
| |
|
|
| |
|
|
|
| | (1.30 | )% | | | .19 | % | | | (6.58 | )% | | | 3.79 | % |
| | | | | | | | | | | | | | | |
| $ | 45,609 | | | $ | 42,252 | | | $ | 37,288 | | | $ | 50,330 | |
| $ | 43,494 | | | $ | 42,557 | | | $ | 43,997 | | | $ | 60,652 | |
| | | | | | | | | | | | | | | |
| | .65 | % | | | .63 | % | | | .60 | % | | | .55 | % |
| | .65 | % | | | .63 | % | | | .60 | % | | | .55 | % |
| | 9.41 | % | | | 10.41 | % | | | 10.17 | % | | | 9.53 | % |
See Notes to Financial Statements
| | |
| Dryden High Yield Fund, Inc. | | 55 |
Report of Independent Auditors
To the Board of Directors and Shareholders of
Dryden High Yield Fund, Inc.
In our opinion, the accompanying statement of assets and liabilities, including the portfolio of investments, and the related statements of operations and of changes in net assets and the financial highlights present fairly, in all material respects, the financial position of Dryden High Yield Fund, Inc., formerly Prudential High Yield Fund, Inc. (the “Fund”), at December 31, 2003, the results of its operations for the year then ended, the changes in its net assets for each of the two years in the period then ended and the financial highlights for each of the five years in the period then ended, in conformity with accounting principles generally accepted in the United States of America. These financial statements and financial highlights (hereafter referred to as “financial statements”) are the responsibility of the Fund’s management; our responsibility is to express an opinion on these financial statements based on our audits. We conducted our audits of these financial statements in accordance with auditing standards generally accepted in the United States of America, which require that we plan and perform the audit to obtain reasonable assurance about whether the financial statements are free of material misstatement. An audit includes examining, on a test basis, evidence supporting the amounts and disclosures in the financial statements, assessing the accounting principles used and significant estimates made by management, and evaluating the overall financial statement presentation. We believe that our audits, which included confirmation of securities at December 31, 2003 by correspondence with the custodian and brokers, provide a reasonable basis for our opinion.
PricewaterhouseCoopers LLP
New York, New York
February 20, 2004
| | |
| 56 | | Visit our website at www.jennisondryden.com |
Federal Income Tax Information
(unaudited)
We are required by the Internal Revenue Code to advise you within 60 days of the Fund’s fiscal year end (December 31, 2003) as to the federal income tax status of dividends paid by the Fund during such fiscal period. Accordingly, we are advising you that during its fiscal period ended December 31, 2003, the Fund paid dividends for Class A, Class B, Class C and Class Z shares totaling $.44, $.41, $.41 and $.45 per share, of ordinary income, which is taxable as such, respectively. Further, we wish to advise you that 4.04% of the ordinary income dividends paid in the fiscal year ended December 31, 2003 qualified for the corporate dividend received deduction available to corporate taxpayers.
| | |
| Dryden High Yield Fund, Inc. | | 57 |
Supplemental Proxy Information
(Unaudited)
A Special Meeting of Shareholders was held on July 17, 2003, and adjourned to August 21, 2003 and further adjourned to September 12, 2003, October 10, 2003, November 5, 2003, November 21, 2003 and December 5, 2003. At such meetings the shareholders approved the following proposals:
| 1)* | To approve the election of ten (10) directors to the Board of Directors, as follows: |
The result of the proxy solicitation on the preceding matter was:
| | | | | | | | |
Matter
| | Votes For
| | Votes Against
| | Votes Withheld
| | Abstentions
|
David E.A. Carson | | 211,310,724 | | — | | 7,346,289 | | — |
Robert E. La Blanc | | 211,451,344 | | — | | 7,205,669 | | — |
Robert F. Gunia | | 211,308,255 | | — | | 7,348,758 | | — |
Douglas H.
McCorkindale | | 211,352,708 | | — | | 7,304,305 | | — |
Stephen P. Munn* | | 211,426,948 | | — | | 7,230,065 | | — |
Richard A. Redeker | | 211,475,731 | | — | | 7,181,282 | | — |
Judy A. Rice | | 211,241,873 | | — | | 7,415,140 | | — |
Robin B. Smith | | 211,231,383 | | — | | 7,425,630 | | — |
Stephen Stoneburn | | 211,437,848 | | — | | 7,219,165 | | — |
Clay T. Whitehead | | 211,425,316 | | — | | 7,231,697 | | — |
| †Mr. | Munn ceased being a director effective November 30, 2003. |
| | |
| 58 | | Visit our website at www.jennisondryden.com |
| 2)** | To Permit the Manager to Enter into, or make material changes to, Subadvisory Agreements without shareholder approval. |
| | | | |
For
| | Against
| | Abstain
|
| 171,855,546 | | 18,576,281 | | 7,863,389 |
| 3)* | To Permit an amendment to the Management Contract Between PI and the Company. |
| | | | |
For
| | Against
| | Abstain
|
| 198,175,935 | | 12,265,049 | | 8,216,029 |
| 4a)** | To approve changes to fundamental investment restrictions or policies, relating to: fund diversification. |
| | | | |
For
| | Against
| | Abstain
|
| 180,147,964 | | 10,578,064 | | 7,569,189 |
| 4b)** | To approve changes to fundamental investment restrictions or policies, relating to: issuing senior securities, borrowing money or pledging assets. |
| | | | |
For
| | Against
| | Abstain
|
| 176,017,388 | | 13,890,474 | | 8,387,354 |
| 4c)** | To approve changes to fundamental investment restrictions or policies, relating to: buying and selling real estate. |
| | | | |
For
| | Against
| | Abstain
|
| 177,693,990 | | 12,373,173 | | 8,228,054 |
| 4d)** | To approve changes to fundamental investment restrictions or policies, relating to: buying and selling commodities and commodity contracts. |
| | | | |
For
| | Against
| | Abstain
|
| 176,808,128 | | 13,415,097 | | 8,071,992 |
| 4e)** | To approve changes to fundamental investment restrictions or policies, relating to: fund concentration. |
| | | | |
For
| | Against
| | Abstain
|
| 179,597,563 | | 10,624,470 | | 8,073,184 |
| 4f)** | To approve changes to fundamental investment restrictions or policies, relating to: making loans. |
| | | | |
For
| | Against
| | Abstain
|
| 176,405,353 | | 13,475,265 | | 8,414,599 |
| | |
| Dryden High Yield Fund, Inc. | | 59 |
| 4g)** | To approve changes to fundamental investment restrictions or policies, relating to: other investment restrictions, including investing in securities of other investment companies. |
| | | | |
For
| | Against
| | Abstain
|
| 178,152,107 | | 11,790,831 | | 8,352,279 |
| 5)*** | To approve amendments to the Company’s Articles of Incorporation. |
| | | | |
For
| | Against
| | Abstain
|
| 202,275,413 | | 10,517,177 | | 9,342,171 |
| * | Approved at the July 17, 2003 meeting. |
| ** | Approved at the August 21, 2003 meeting. |
| *** | Approved at the September 12, 2003 meeting. |
| | |
| 60 | | Visit our website at www.jennisondryden.com |
Management of the Fund
(Unaudited)
Information pertaining to the Directors of the Fund is set forth below. Directors who are not deemed to be “interested persons” of the Fund, as defined in the 1940 Act are referred to as “Independent Directors.” Directors who are deemed to be “interested persons” of the Fund are referred to as “Interested Directors.” “Fund Complex”† consists of the Fund and any other investment companies managed by Prudential Investments LLC (the manager or PI).
Independent Directors2
David E.A. Carson (69), Director since 20033
Oversees 90 portfolios in Fund complex
Principal occupations (last 5 years): Director (January 2000 to May 2000), Chairman (January 1999 to December 1999), Chairman and Chief Executive Officer (January 1998 to December 1998) and President, Chairman and Chief Executive Officer (1983-1997) of People’s Bank.
Other Directorships held:4 Director of United Illuminating and UIL Holdings (utility company), since 1993.
Robert E. La Blanc (69), Director since 20033
Oversees 98 portfolios in Fund complex
Principal occupations (last 5 years): President (since 1981) of Robert E. La Blanc Associates, Inc. (telecommunications); formerly General Partner at Salomon Brothers and Vice-Chairman of Continental Telecom; Trustee of Manhattan College.
Other Directorships held:4 Director of Storage Technology Corporation (since 1979) (technology), Chartered Semiconductor Manufacturing, Ltd. (since 1998); Titan Corporation (electronics) (since 1995), Computer Associates International, Inc. (since 2002) (software company); FiberNet Telecom Group, Inc. (since 2003) (telecom company); Director (since April 1999) of the High Yield Plus Fund, Inc.
Douglas H. McCorkindale (64), Director since 20033
Oversees 91 portfolios in Fund complex
Principal occupations (last 5 years): Chairman (since February 2001), Chief Executive Officer (since June 2000) and President (since September 1997) of Gannett Co. Inc. (publishing and media); formerly Vice Chairman (March 1984-May 2000) of Gannett Co., Inc.
Other Directorships held:4 Director of Gannett Co. Inc., Director of Continental Airlines, Inc. (since May 1993); Director of Lockheed Martin Corp. (aerospace and defense) (since May 2001); Director of The High Yield Plus Fund, Inc. (since 1996).
Richard A. Redeker (60), Director since 19953
Oversees 92 portfolios in Fund complex
Principal occupations (last 5 years): Management Consultant; Director of Invesmart, Inc. (since 2001) and Director of Penn Tank Lines, Inc. (since 1999).
Other Directorships held:4 None.
| | |
| Dryden High Yield Fund, Inc. | | 61 |
Robin B. Smith (64), Director since 20033
Oversees 97 portfolios in Fund complex
Principal occupations (last 5 years): Chairman of the Board (since January 2003) of Publishers Clearing House (direct marketing), formerly Chairman and Chief Executive Officer (August 1996-January 2003) of Publishers Clearing House.
Other Directorships held:4 Director of BellSouth Corporation (since 1992).
Stephen D. Stoneburn (60), Director since 20033
Oversees 95 portfolios in Fund complex
Principal occupations (last 5 years): President and Chief Executive Officer (since June 1996) of Quadrant Media Corp. (a publishing company); formerly President (June 1995-June 1996) of Argus Integrated Media, Inc.; Senior Vice President and Managing Director (January 1993-1995) of Cowles Business Media and Senior Vice President of Fairchild Publications, Inc. (1975-1989).
Other Directorships held:4 None
Clay T. Whitehead (64), Director since 20033
Oversees 96 portfolios in Fund complex
Principal occupations (last 5 years): President (since 1983) of National Exchange Inc. (new business development firm).
Other Directorships held:4 Director (since 2000) of the High Yield Plus Fund, Inc.
Interested Directors1
Judy A. Rice (56), President since 2003 and Director since 20003
Oversees 95 portfolios in Fund complex
Principal occupations (last 5 years): President, Chief Executive Officer, Chief Operating Officer and Officer-in-Charge (since 2003) of PI; Director, Officer-in-Charge, President, Chief Executive Officer and Chief Operating Officer (since May 2003) of American Skandia Advisory Services, Inc. and American Skandia Investment Services, Inc.; Director, Officer-in-Charge, President, Chief Executive Officer (since May 2003) of American Skandia Fund Services, Inc.; Vice President (since February 1999) of Prudential Investment Management Services LLC; President, Chief Executive Officer and Officer-in-Charge (since April 2003) of Prudential Mutual Fund Services LLC; formerly various positions to Senior Vice President (1992-1999) of Prudential Securities; and various positions to Managing Director (1975-1992) of Salomon Smith Barney; Member of Board of Governors of the Money Management Institute.
Other Directorships held:4 None
Robert F. Gunia (57), Vice President and Director since 19963
Oversees 179 portfolios in Fund complex
Principal occupations (last 5 years): Chief Administrative Officer (since June 1999) of PI; Executive Vice President and Treasurer (since January 1996) of PI; President (since April 1999) of Prudential Investment Management Services LLC (PIMS); Corporate Vice President (since September 1997) of The Prudential Insurance Company of America (Prudential); Director, Executive Vice President and Chief Administrative Officer (since May 2003) of American Skandia Investment Services, Inc., American Skandia Advisory Services, Inc. and American Skandia Fund Services, Inc.; Executive Vice President (since March 1999) and Treasurer (since May 2000) of Prudential Mutual Fund Services LLC; formerly Senior Vice President (March 1987-May 1999) of Prudential Securities Incorporated (Prudential Securities).
Other Directorships held:4 Vice President and Director (since May 1989) and Treasurer (since 1999) of The Asia Pacific Fund, Inc.
| | |
| 62 | | Visit our website at www.jennisondryden.com |
Information pertaining to the Officers of the Fund is set forth below.
Officers2
Marguerite E.H. Morrison (47), Chief Legal Officer since 2003 and Assistant Secretary since 20023
Principal occupations (last 5 years): Vice President and Chief Legal Officer—Mutual Funds and Unit Investment Trust (since August 2000) of Prudential; Senior Vice President and Secretary (since April 2003) of PI; Senior Vice President and Secretary (since May 2003) of American Skandia Investment Services, Inc., American Skandia Advisory Services, Inc. and American Skandia Fund Services, Inc.; Vice President and Assistant Secretary of PIMS (since October 2001), previously Senior Vice President and Assistant Secretary (February 2001-April 2003) of PI, Vice President and Associate General Counsel (December 1996-February 2001) of PI.
Deborah A. Docs (46), Secretary since 1996;3
Principal occupations (last 5 years): Vice President and Corporate Counsel (since January 2001) of Prudential; Vice President and Assistant Secretary (since December 1996) of PI, Vice President and Assistant Secretary (since May 2003) of American Skandia Investment Services, Inc.
Maryanne Ryan (39), Anti-Money Laundering Compliance Officer since 20023
Principal occupations (last 5 years): Vice President, Prudential (since November 1998), First Vice President, Prudential Securities (March 1997-May 1998); Anti-Money Laundering Compliance Officer (since 2003) of American Skandia Investment Services, Inc., American Skandia Advisory Services, Inc. and American Skandia Marketing, Inc.
Grace C. Torres (44), Treasurer and Principal Financial and Accounting Officer since 19953
Principal occupations (last 5 years): Senior Vice President (since January 2000) of PI, Senior Vice President and Assistant Treasurer (since May 2003) of American Skandia Investment Services, Inc. and American Skandia Advisory Services, Inc.; formerly First Vice President (December 1996-January 2000) of PI and First Vice President (March 1993-1999) of Prudential Securities.
| 1 | “Interested” Directors, as defined in the 1940 Act, by reason of employment with the Manager, (Prudential Investments LLC or PI), the Subadviser Prudential Investment Management Inc. or PIM) or the Distributor (Prudential Investment Management Services LLC or PIMS). |
| 2 | Unless otherwise noted, the address of the Directors and Officers is c/o: Prudential Investments LLC, Gateway Center Three, 100 Mulberry Street, Newark, NJ 07102. |
| 3 | There is no set term of office for Directors and Officers. The Independent Directors have adopted a retirement policy, which calls for the retirement of Directors on December 31 of the year in which they reach the age of 75. The table shows the individuals length of service as Director and/or Officer. |
| 4 | This includes only directorships of companies requested to register, or file reports with the SEC under the Securities and Exchange Act of 1934 (that is, “public companies”) or other investment companies registered under the 1940 Act. |
| † | The Fund Complex consists of all investment companies managed by PI. The Funds for which PI serves as manager include JennisonDryden Mutual Funds, Strategic Partners Funds, American Skandia Advisor Funds, Inc., The Prudential Variable Contract Accounts 2, 10, 11, The Target Portfolio Trust, The Prudential Series Fund, Inc., American Skandia Trust, and Prudential’s Gibraltar Fund. |
Additional information about the Fund’s Directors is included in the Fund’s Statement of Additional Information which is available without charge, upon request, by calling (800) 521-7466 or (732) 482-7555 (Calling from outside the U.S.)
| | |
| Dryden High Yield Fund, Inc. | | 63 |
Growth of a $10,000 Investment
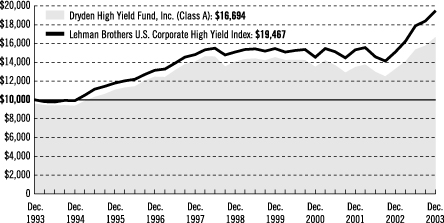
| | | | | | | | | | | | |
| |
| Average Annual Total Returns (With Sales Charges) as of 12/31/03 | | | | |
| | | One Year | | | Five Years | | | Ten Years | | | Since Inception | |
Class A | | 20.64 | % | | 2.66 | % | | 5.26 | % | | 7.58 | % |
| |
Class B | | 20.08 | | | 2.86 | | | 5.12 | | | 8.38 | |
| |
Class C | | 22.84 | | | 2.79 | | | N/A | | | 5.57 | |
| |
Class Z | | 25.94 | | | 3.81 | | | N/A | | | 5.14 | |
| |
| | | | | | | | | | | | | |
| |
| Average Annual Total Returns (Without Sales Charges) as of 12/31/03 | | | | |
| | | One Year | | | Five Years | | | Ten Years | | | Since Inception | |
Class A | | 25.66 | % | | 3.50 | % | | 5.69 | % | | 7.90 | % |
| |
Class B | | 25.08 | | | 2.99 | | | 5.12 | | | 8.38 | |
| |
Class C | | 25.08 | | | 3.00 | | | N/A | | | 5.69 | |
| |
Class Z | | 25.94 | | | 3.81 | | | N/A | | | 5.14 | |
| |
Past performance is not indicative of future results. Principal value and investment return will fluctuate so that an investor’s shares, when redeemed, may be worth more or less than their original cost. Source: Prudential Investments LLC and Lipper Inc. Inception dates: Class A, 1/22/90; Class B, 3/29/79; Class C, 8/1/94; and Class Z, 3/1/96.
The graph compares a $10,000 investment in the Dryden High Yield Fund, Inc. (Class A shares) with a similar investment in the Lehman Brothers U.S. Corporate High Yield Index by portraying the initial account values at the beginning of the 10-year period for Class A shares (December 31, 1993) and the account values at the end of the current fiscal year (December 31, 2003) as measured on a quarterly basis. For purposes of the graph, and unless otherwise indicated, it has been assumed that (a) the maximum applicable front-end sales charge was deducted from the initial $10,000 investment in Class A shares; (b) all recurring fees (including management fees) were deducted; and (c) all dividends and distributions were reinvested. The line graph provides information for Class A shares only. As indicated in the tables provided earlier, performance for Class B, C, and Z shares will
| | |
| | | Visit our website at www.jennisondryden.com |
vary due to the differing charges and expenses applicable to each share class (as indicated in the following paragraphs). Without a distribution and service (12b-1) fee waiver of 0.05% for Class A shares through December 31, 2003, the returns shown in the graph and for Class A shares in the tables would have been lower.
The Lehman Brothers U.S. Corporate High Yield Index is an unmanaged index of fixed-rate, noninvestment-grade debt securities with at least one year remaining to maturity. It gives a broad look at how high yield (junk) bonds have performed. The Index’s total returns include the reinvestment of all dividends, but do not include the effects of sales charges, operating expenses of a mutual fund, or taxes. The returns for the Index would be lower if they included the effects of sales charges, operating expenses, or taxes. The securities that comprise the Index may differ substantially from the securities in the Fund. This is not the only index that may be used to characterize performance of junk bond funds. Other indexes may portray different comparative performance. Investors cannot invest directly in an index.
The Fund charges a maximum front-end sales charge of 4% for Class A shares, and a 12b-1 fee of up to 0.30% annually. Class A shares may not be subject to a front-end sales charge, but may be subject to a 1% contingent deferred sales charge (CDSC) for the first year. Class B shares are subject to a declining CDSC of 5%, 4%, 3%, 2%, 1%, and 1% for the first six years respectively after purchase, and a 12b-1 fee of 0.75% annually. Approximately seven years after purchase, Class B shares will automatically convert to Class A shares on a quarterly basis. Effective February 1, 2004, Class C shares do not have a front-end sales charge of 1%, but are subject to a CDSC of 1% for shares redeemed within 12 months of purchase, and a 12b-1 fee of up to 1% annually. Class Z shares are not subject to a sales charge or 12b-1 fee. The returns on investment in the graph and the returns in the tables do not reflect the deduction of taxes that a shareholder would pay on Fund distributions or following the redemption of Fund shares.
| | |
| Dryden High Yield Fund, Inc. | | |
| | | | |
| | |
| n MAIL | | n TELEPHONE | | n WEBSITE |
Gateway Center Three 100 Mulberry Street Newark, NJ 07102 | | (800) 225-1852 | | www.jennisondryden.com |
|
| DIRECTORS |
David E.A. Carson•Robert F. Gunia•Robert E. La Blanc•Douglas H. McCorkindale• Richard A. Redeker•
Judy A. Rice•Robin B. Smith•Stephen D. Stoneburn•Clay T. Whitehead |
|
| OFFICERS |
| Judy A. Rice, President•Robert F. Gunia, Vice President•Grace C. Torres, Treasurer and Principal Financial and Accounting Officer•Marguerite E.H. Morrison, Chief Legal Officer and Assistant Secretary•Deborah A. Docs, Secretary•Maryanne Ryan, Anti-Money Laundering Compliance Officer |
| | | | |
| MANAGER | | Prudential Investments LLC | | Gateway Center Three
100 Mulberry Street
Newark, NJ 07102 |
|
| INVESTMENT ADVISER | | Prudential Investment
Management, Inc. | | Gateway Center Two
100 Mulberry Street
Newark, NJ 07102 |
|
| DISTRIBUTOR | | Prudential Investment
Management Services LLC | | Gateway Center Three
14th Floor
100 Mulberry Street
Newark, NJ 07102 |
|
| CUSTODIAN | | State Street Bank
and Trust Company | | One Heritage Drive
North Quincy, MA 02171 |
|
| TRANSFER AGENT | | Prudential Mutual Fund
Services LLC | | PO Box 8098
Philadelphia, PA 19101 |
|
| INDEPENDENT AUDITORS | | PricewaterhouseCoopers LLP | | 1177 Avenue of the
Americas
New York, NY 10036 |
|
| FUND COUNSEL | | Shearman & Sterling LLP | | 599 Lexington Avenue
New York, NY 10022 |
| | | | | | | | | | | | |
| | | | |
| | | Dryden High Yield Fund, Inc. | | | | | | |
| | | Share Class | | A | | B | | C | | Z | | |
| | | | | | |
| | | Nasdaq | | PBHAX | | PBHYX | | PRHCX | | PHYZX | | |
| | | CUSIP | | 262438104 | | 262438203 | | 262438302 | | 262438401 | | |
| | | | | | | | | | | | | |
Mutual Funds:
| | | | |
| ARE NOT INSURED BY THE FDIC OR ANY FEDERAL GOVERNMENT AGENCY | | MAY LOSE VALUE | | ARE NOT A DEPOSIT OF OR GUARANTEED BY ANY BANK OR ANY BANK AFFILIATE |
| | | | | | | | | | | | |
| | | | |
| | | Dryden High Yield Fund, Inc. | | | | | | |
| | | Share Class | | A | | B | | C | | Z | | |
| | | | | | |
| | | Nasdaq | | PBHAX | | PBHYX | | PRHCX | | PHYZX | | |
| | | CUSIP | | 262438104 | | 262438203 | | 262438302 | | 262438401 | | |
| | | | | | | | | | | | | |
MF110E IFS-A087700
Item 2—Code of Ethics—See Exhibit (a)
As of the end of the period covered by this report, the registrant has adopted a code of ethics (the “Section 406 Standards for Investment Companies – Ethical Standards for Principal Executive and Financial Officers”) that applies to the registrant’s Principal Executive Officer and Principal Financial Officer; the registrant’s Principal Financial Officer also serves as the Principal Accounting Officer.
The registrant hereby undertakes to provide any person, without charge, upon request, a copy of the code of ethics. To request a copy of the code of ethics, contact the registrant 973-367-7525, and ask for a copy of the Section 406 Standards for Investment Companies—Ethical Standards for Principal Executive and Financial Officers.
Item 3—Audit Committee Financial Expert—
The registrant’s Board has determined that Mr. David Carson, member of the Board’s Audit Committee is an “audit committee financial expert,” and that he is “independent,” for purposes of this Item.
Item 4—Principal Accountant Fees and Services—
For each of the fiscal years ended December 31, 2003 and December 31, 2002 PricewaterhouseCoopers LLP (“PwC”), the Registrant’s principal accountant, billed the Registrant $38,000 for professional services rendered for the audit of the Registrant’s annual financial statements or services that are normally provided in connection with statutory and regulatory filings.
None.
None.
None.
| (e) (1) | Audit Committee Pre-Approval Policies and Procedures |
THE PRUDENTIAL MUTUAL FUNDS
AUDIT COMMITTEE POLICY
on
Pre-Approval of Services Provided by the Independent Accountants
The Audit Committee of each Prudential Mutual Fund is charged with the responsibility to monitor the independence of the Fund’s independent accountants. As part of this responsibility, the Audit Committee must pre-approve any independent accounting firm’s engagement to render audit and/or permissible non-audit services, as required by law. In evaluating a proposed engagement of the independent accountants, the Audit Committee will assess the effect that the engagement might reasonably be expected to have on the accountant’s independence. The Committee’s evaluation will be based on:
| | • | a review of the nature of the professional services expected to be provided, |
| | • | a review of the safeguards put into place by the accounting firm to safeguard independence, and |
| | • | periodic meetings with the accounting firm. |
Policy for Audit and Non-Audit Services Provided to the Funds
On an annual basis, the scope of audits for each Fund, audit fees and expenses, and audit-related and non-audit services (and fees proposed in respect thereof) proposed to be performed by the Fund’s independent accountants will be presented by the Treasurer and the independent accountants to the Audit Committee for review and, as appropriate, approval prior to the initiation of such services. Such presentation shall be accompanied by confirmation by both the Treasurer and the independent accountants that the proposed services will not adversely affect the independence of the independent accountants. Proposed services shall be described in sufficient detail to enable the Audit Committee to assess the appropriateness of such services and fees, and the compatibility of the provision of such services with the auditor’s independence. The Committee shall receive periodic reports on the progress of the audit and other services which are approved by the Committee or by the Committee Chair pursuant to authority delegated in this Policy.
The categories of services enumerated under “Audit Services”, “Audit-related Services”, and “Tax Services” are intended to provide guidance to the Treasurer and the independent accountants as to those categories of services which the Committee believes are generally consistent with the independence of the independent accountants and which the Committee (or the Committee Chair) would expect upon the presentation of specific proposals to pre-approve. The enumerated categories are not intended as an exclusive list of audit, audit-related or tax services which the Committee (or the Committee Chair) would consider for pre-approval.
Audit Services
The following categories of audit services are considered to be consistent with the role of the Fund’s independent accountants
| | Ø | Annual Fund financial statement audits |
| | Ø | Seed audits (related to new product filings, as required) |
| | Ø | SEC and regulatory filings and consents |
Audit-related Services
The following categories of audit-related services are considered to be consistent with the role of the Fund’s independent accountants:
| | Ø | Accounting consultations |
| | Ø | Fund merger support services |
| | Ø | Agreed Upon Procedure Reports |
| | Ø | Other Internal Control Reports |
Individual audit-related services that fall within one of these categories and are not presented to the Audit Committee as part of the annual pre-approval process will be subject to pre-approval by the Committee Chair (or any other Committee member on whom this responsibility has been delegated) so long as the estimated fee for those services does not exceed $50,000.
Tax Services
The following categories of tax services are considered to be consistent with the role of the Fund’s independent accountants:
| | Ø | Tax compliance services related to the filing or amendment of the following: |
| | n | Federal, state and local income tax compliance; and, |
| | n | Sales and use tax compliance |
| | Ø | Timely RIC qualification reviews |
| | Ø | Tax distribution analysis and planning |
| | Ø | Tax authority examination services |
| | Ø | Tax appeals support services |
| | Ø | Accounting methods studies |
| | Ø | Fund merger support services |
| | Ø | Tax consulting services and related projects |
Individual tax services that fall within one of these categories and are not presented to the Audit Committee as part of the annual pre-approval process will be subject to pre-approval by the Committee Chair (or any other Committee member on whom this responsibility has been delegated) so long as the estimated fee for those services does not exceed $50,000.
Other Non-audit Services
Certain non-audit services that the independent accountants are legally permitted to render will be subject to pre-approval by the Committee or by one or more Committee members to whom the Committee has delegated this authority and who will report to the full Committee any pre-approval decisions made pursuant to this Policy. Non-audit services presented for pre-approval pursuant to this paragraph will be accompanied by a confirmation from both the Treasurer and the independent accountants that the proposed services will not adversely affect the independence of the independent accountants.
Proscribed Services
The Fund’s independent accountants will not render services in the following categories of non-audit services:
| | Ø | Bookkeeping or other services related to the accounting records or financial statements of the Fund |
| | Ø | Financial information systems design and implementation |
| | Ø | Appraisal or valuation services, fairness opinions, or contribution-in-kind reports |
| | Ø | Internal audit outsourcing services |
| | Ø | Management functions or human resources |
| | Ø | Broker or dealer, investment adviser, or investment banking services |
| | Ø | Legal services and expert services unrelated to the audit |
| | Ø | Any other service that the Public Company Accounting Oversight Board determines, by regulation, is impermissible. |
Pre-approval of Non-Audit Services Provided to Other Entities Within the Prudential Fund Complex
Certain non-audit services provided to Prudential Investments LLC or any of its affiliates that also provide ongoing services to the Prudential Mutual Funds will be subject to pre-approval by the Audit Committee. The only non-audit services provided to these entities that will require pre-approval are those related directly to the operations and financial reporting of the Funds. Individual projects that are not presented to the Audit Committee as part of the annual pre-approval process, will be subject to pre-approval by the Committee Chair (or any other Committee member on whom this responsibility has been delegated) so long as the estimated fee for those services does not exceed $50,000. Services presented for pre-approval pursuant to this paragraph will be accompanied by a confirmation from both the Treasurer and the independent accountants that the proposed services will not adversely affect the independence of the independent accountants.
Although the Audit Committee will not pre-approve all services provided to Prudential Investments LLC and its affiliates, the Committee will receive an annual report from the Fund’s independent accounting firm showing the aggregate fees for all services provided to Prudential Investments and its affiliates.
(e)-(2) Percentage of services referred to in 4(b)- (4)(d) that were approved by the audit committee –Not applicable.
| (f) | Percentage of hours expended attributable to work performed by other than full time employees of principal accountant if greater than 50%. |
Not applicable.
N/A to Registrant. The aggregate non-audit fees billed by PwC for services rendered to the registrant’s investment adviser and any entity controlling, controlled by, or under common control with the investment adviser that provides ongoing services to the registrant for each of the last two fiscal years 2003 and 2002 were $1,715,979 and $1,601,295 respectively.
(h) Principal Accountants Independence
The Registrant’s Audit Committee has considered whether the provision of non-audit services that were rendered to the registrant’s investment adviser and any entity controlling, controlled by, or under common control with the investment adviser that provides ongoing services to the registrant that were not pre-approved pursuant to Rule 2-01(c)(7)(ii) of Regulation S-X is compatible with maintaining PwC’s independence.
| Item 7 – | Disclosure of Proxy Voting Policies and Procedures for Closed-End Management Investment Companies—Not required in this filing |
| Item 9 – | Controls and Procedures |
| | (a) | It is the conclusion of the registrant’s principal executive officer and principal financial officer that the effectiveness of the registrant’s current disclosure controls and procedures (such disclosure controls and procedures having been evaluated within 90 days of the date of this filing) provide reasonable assurance that the information required to be disclosed by the registrant has been recorded, processed, summarized and reported within the time period specified in the Commission’s rules and forms and that the information required to be disclosed by the registrant has been accumulated and communicated to the registrant’s principal executive officer and principal financial officer in order to allow timely decisions regarding required disclosure. |
| | (b) | There have been no significant changes in the registrant’s internal controls or in other factors that could significantly affect these controls subsequent to the date of their evaluation, including any corrective actions with regard to significant deficiencies and material weaknesses. |
| | (a) | Code of Ethics – attached hereto |
| | (b) | Certifications pursuant to Section 302 and 906 of the Sarbanes-Oxley Act – Attached hereto |
SIGNATURES
Pursuant to the requirements of the Securities Exchange Act of 1934 and the Investment Company Act of 1940, the registrant has duly caused this report to be signed on its behalf by the undersigned, thereunto duly authorized.
| | |
| (Registrant) | | Dryden High Yield Fund, Inc. |
| | |
|
| |
| By (Signature and Title)* | | /s/ Marguerite E. H. Morrison |
| | |
|
| | | Marguerite E. H. Morrison Assistant Secretary |
Date February 9, 2004
Pursuant to the requirements of the Securities Exchange Act of 1934 and the Investment Company Act of 1940, this report has been signed below by the following persons on behalf of the registrant and in the capacities and on the dates indicated.
| | |
| |
| By (Signature and Title)* | | /s/ Judy A. Rice |
| | |
|
| | | Judy A. Rice President and Principal Executive Officer |
Date February 9, 2004
| | |
| |
| By (Signature and Title)* | | /s/ Grace C. Torres |
| | |
|
| | | Grace C. Torres Treasurer and Principal Financial Officer |
Date February 9, 2004
* Print the name and title of each signing officer under his or her signature.