UNITED STATES
SECURITIES AND EXCHANGE COMMISSION
Washington, D.C. 20549
FORM N-CSR
CERTIFIED SHAREHOLDER REPORT OF REGISTERED
MANAGEMENT INVESTMENT COMPANIES
| | |
| Investment Company Act file number: | | 811-02896 |
| |
| Exact name of registrant as specified in charter: | | Dryden High Yield Fund, Inc. |
| |
| Address of principal executive offices: | | Gateway Center 3, |
| | 100 Mulberry Street, |
| | Newark, New Jersey 07102 |
| |
| Name and address of agent for service: | | Deborah A. Docs |
| | Gateway Center 3, |
| | 100 Mulberry Street, |
| | Newark, New Jersey 07102 |
| |
| Registrant’s telephone number, including area code: | | 973-367-7521 |
| |
| Date of fiscal year end: | | 12/31/2005 |
| |
| Date of reporting period: | | 12/31/2005 |
| | |
| |
| Item 1 – | | Reports to Stockholders – [ INSERT REPORT ] |

Dryden High Yield Fund, Inc.
| | |
| DECEMBER 31, 2005 | | ANNUAL REPORT |

FUND TYPE
Junk bond
OBJECTIVES
Current income, and capital appreciation as a secondary objective
This report is not authorized for distribution to prospective investors unless preceded or accompanied by a current prospectus.
The views expressed in this report and information about the Fund’s portfolio holdings are for the period covered by this report and are subject to change thereafter.
JennisonDryden is a registered trademark of The Prudential Insurance Company of America.

February 15, 2006
Dear Shareholder:
We hope you find the annual report for the Dryden High Yield Fund informative and useful. As a JennisonDryden mutual fund shareholder, you may be thinking about where you can find additional growth opportunities. You could invest in last year’s top-performing asset class and hope history repeats itself or you could stay in cash while waiting for the “right moment” to invest.
Instead, we believe it is better to take advantage of developing domestic and global investment opportunities through a diversified portfolio of stock and bond mutual funds. A diversified asset allocation offers two potential advantages. It helps you manage downside risk by not being overly exposed to any particular asset class, plus it gives you a better opportunity to have at least some of your assets in the right place at the right time. Your financial professional can help you create a diversified investment plan that may include mutual funds covering all the basic asset classes and that reflects your personal investor profile and tolerance for risk.
JennisonDryden Mutual Funds gives you a wide range of choices that can help you make progress toward your financial goals. Our funds offer the experience, resources, and professional discipline of three leading asset managers. They are recognized and respected in the institutional market and by discerning investors for excellence in their respective strategies. JennisonDryden equity funds are advised by Jennison Associates LLC or Quantitative Management Associates LLC (QMA). Prudential Investment Management, Inc. (PIM) advises the JennisonDryden fixed income and money market funds. Jennison Associates, QMA, and PIM are registered investment advisors and Prudential Financial companies.
Thank you for choosing JennisonDryden Mutual Funds.
Sincerely,

Judy A. Rice, President
Dryden High Yield Fund, Inc.
| | |
| Dryden High Yield Fund, Inc. | | 1 |
Your Fund’s Performance
Fund objectives
The primary investment objective of the Dryden High Yield Fund, Inc. (the Fund) is to maximize current income. As a secondary objective, the Fund seeks capital appreciation, but only when consistent with the Fund’s primary investment objective of current income. There can be no assurance that the Fund will achieve its investment objectives.
Performance data quoted represent past performance. Past performance does not guarantee future results. The investment return and principal value of an investment will fluctuate, so that an investor’s shares, when redeemed, may be worth more or less than their original cost. Current performance may be lower or higher than the past performance data quoted. An investor may obtain performance data as of the most recent month-end by visiting our website at www.jennisondryden.com or by calling (800) 225-1852. The maximum initial sales charge is 4.50% (Class A shares).
| | | | | | | | |
| Cumulative Total Returns1 as of 12/31/05 | | | | | | |
| | | One Year | | Five Years | | Ten Years | | Since Inception2 |
Class A | | 3.07% | | 39.81% | | 70.75% | | 227.01% |
Class B | | 2.54 | | 36.32 | | 61.99 | | 722.79 |
Class C | | 2.54 | | 36.32 | | 61.99 | | 88.82 |
Class R | | N/A | | N/A | | N/A | | 2.98 |
Class Z | | 3.32 | | 41.81 | | N/A | | 68.69 |
Lehman Brothers U.S. Corporate
High Yield Index3 | | 2.74 | | 52.84 | | 88.44 | | *** |
Lehman Brothers U.S. Corporate
High Yield 2% Issuer Capped Index4 | | 2.76 | | 54.73 | | 91.25 | | **** |
Lipper High Current Yield Funds Avg.5 | | 2.44 | | 42.40 | | 71.70 | | ***** |
| | | | | | | | | |
| Average Annual Total Returns1 as of 12/31/05 | | | | | | | | |
| | | One Year | | Five Years | | Ten Years | | Since Inception2 |
Class A | | –1.57% | | 5.95% | | 5.01% | | 7.40% |
Class B | | –2.24 | | 6.25 | | 4.94 | | 8.19 |
Class C | | 1.58 | | 6.39 | | 4.94 | | 5.72 |
Class R | | N/A | | N/A | | N/A | | N/A |
Class Z | | 3.32 | | 7.24 | | N/A | | 5.46 |
Lehman Brothers U.S. Corporate
High Yield Index3 | | 2.74 | | 8.85 | | 6.54 | | *** |
Lehman Brothers U.S. Corporate
High Yield 2% Issuer Capped Index4 | | 2.76 | | 9.12 | | 6.70 | | **** |
Lipper High Current Yield Funds Avg.5 | | 2.44 | | 7.23 | | 5.41 | | ***** |
| | |
| 2 | | Visit our website at www.jennisondryden.com |
| | | | | | | | | | | | |
| Distributions and Yields1 as of 12/31/05 | | | | | | | | | | | |
| | | | | | | | | Total Distributions
Paid for 12 Months | | 30-Day SEC Yield | |
Class A | | | | | | | | $ | 0.43 | | 6.12 | % |
Class B | | | | | | | | $ | 0.40 | | 5.92 | |
Class C | | | | | | | | $ | 0.40 | | 5.93 | |
Class R | | | | | | | | $ | 0.25 | | 5.93 | |
Class Z | | | | | | | | $ | 0.45 | | 6.65 | |
The cumulative total returns do not reflect the deduction of applicable sales charges. If reflected, the applicable sales charges would reduce the cumulative total returns performance quoted. Class A shares are subject to a maximum front-end sales charge of 4.50%. Under certain circumstances, Class A shares may be subject to a contingent deferred sales charge (CDSC) of 1%. Class B and Class C shares are subject to a maximum CDSC of 5% and 1% respectively. Class Z shares are not subject to a sales charge.
1Source: Prudential Investments LLC and Lipper Inc. The average annual total returns take into account applicable sales charges. During certain periods shown, fee waivers and/or expense reimbursements were in effect. Without such fee waivers and expense reimbursements, the returns for the share classes would have been lower. Class A, Class B, Class C and Class R shares are subject to an annual distribution and service (12b-1) fee of up to 0.30%, 0.75%, 1.00% and 0.75% respectively. Approximately seven years after purchase, Class B shares will automatically convert to Class A shares on a quarterly basis. Class Z shares are not subject to a 12b-1 fee. Except where noted, returns in the tables do not reflect the deduction of taxes that a shareholder would pay on Fund distributions or following the redemption of Fund shares.
2Inception dates: Class A, 1/22/90; Class B, 3/29/79; Class C, 8/1/94; Class R, 6/6/05; and Class Z, 3/1/96.
3The Lehman Brothers U.S. Corporate High Yield Index (the Prior Index) is an unmanaged index of fixed-rate, noninvestment-grade debt securities with at least one year remaining to maturity. It gives a broad look at how high yield (“junk”) bonds have performed. Beginning in September 2005, the Fund no longer utilizes this index.
4Effective September 2005, the Fund utilizes the Lehman Brothers U.S. Corporate High Yield 2% Issuer Capped Index (Lehman High Yield 2% Issuer Capped Index). The Lehman High Yield 2% Issuer Capped Index covers the universe of U.S. dollar denominated, non-convertible, fixed-rate, non-investment-grade debt. Issuers are capped at 2% of the Index. Index holdings must have at least one year to final maturity, at least $150 million par amount outstanding, and be publicly issued with a rating of Ba1 or lower.
5The Lipper High Current Yield Funds Average (Lipper Average) represents returns based on an average return of all funds in the Lipper High Current Yield Funds category for the periods noted. Funds in the Lipper Average aim at high (relative) current yield from fixed income securities, have no quality or maturity restrictions, and tend to invest in lower-grade debt issues.
The returns for the Prior Index, the Lehman High Yield 2% Issuer Capped Index, and the Lipper Average would be lower if they included the effects of sales charges, operating expenses of a mutual fund, or taxes. Returns for the Lipper Average reflect the deduction of operating expenses, but not sales charges or taxes.
***The Prior Index Closest Month-End to Inception cumulative total returns are 306.96% for Class A, 690.35% for Class B, 125.50% for Class C, 3.60% for Class R, and 85.03% for Class Z. The Prior Index Closest Month-End to Inception average annual total returns are 9.22% for Class A, 9.62% for Class B, 7.38% for Class C, N/A
| | |
| Dryden High Yield Fund, Inc. | | 3 |
Your Fund’s Performance (continued)
for Class R, and 6.46% for Class Z. The Prior Index began on 6/30/83, therefore the return for Class B shares represents an inception return from that time until the present (12/31/05).
****Lehman High Yield 2% Issuer Capped Index returns do not include the effect of any sales charges, mutual fund operating expenses, or taxes. These returns would be lower if they included the effect of sales charges, operating expenses, and taxes. Lehman High Yield 2% Issuer Capped Index Closest Month-End to Inception cumulative total returns are 164.02% for Class A and Class B, 128.68% for Class C, 3.62% for Class R, and 87.67% for Class Z. Lehman High Yield 2% Issuer Capped Index Closest Month-End to Inception average annual total returns are 7.75% for Class A and Class B, 7.51% for Class C, N/A for Class R, and 6.61% for Class Z. The Lehman High Yield 2% Issuer Capped Index began on January 1, 1993, therefore the returns for Class A and Class B shares represent an inception return from that time until the present (12/31/05).
*****Lipper Average Closest Month-End to Inception cumulative total returns are 245.07% for Class A, 877.67% for Class B, 93.48% for Class C, 3.78% for Class R, and 66.87% for Class Z. Lipper Average Closest Month-End to Inception average annual total returns are 7.97% for Class A, 8.78% for Class B, 5.84% for Class C, N/A for Class R, and 5.20% for Class Z.
| | | |
| Five Largest Long-Term Issues expressed as a percentage of net assets as of 12/31/05 | | | |
General Motors Acceptance Corp., 6.75%, 01/15/06 | | 1.17 | % |
Ford Motor Credit Co., Notes, 7.875%, 06/15/10 | | 1.07 | |
Sungard Data Systems, Inc., Notes, 144A, 10.25%, 08/15/15 | | 1.03 | |
Quebecor Media, Inc., (Canada), Sr. Disc. Notes, 13.75%, Zero Coupon (until 07/15/06) | | 0.91 | |
Dex Media West LLC, Sr. Sub. Notes, 9.00%, 11/15/12 | | 0.77 | |
Issues are subject to change.
| | | |
| Credit Quality* expressed as a percentage of net assets as of 12/31/05 | | | |
High Grade | | 4.4 | % |
Ba | | 33.1 | |
B | | 42.9 | |
Caa or Lower | | 13.7 | |
Not Rated | | 25.4 | |
Total Investments | | 119.5 | |
Liabilities in excess of other assets | | –19.5 | |
Net Assets | | 100.0 | |
| | |
|
|
*Source: Moody’s rating, defaulting to S&P when not rated by Moody’s.
Credit Quality is subject to change.
| | |
| 4 | | Visit our website at www.jennisondryden.com |
Investment Subadvisor’s Report
Prudential Investment Management, Inc.
U.S. high yield market ends challenging year in positive territory
It was another memorable year for the U.S. high yield corporate bond market. In 2005, the market faced a shakeup in the U.S. automotive industry, the bankruptcy of certain high-profile firms, and repeated increases in short-term interest rates by the Federal Reserve (the Fed) determined to prevent the U.S. economy from overheating. Despite these challenges, the speculative-grade bond market managed to return 2.76% in 2005 as measured by the Lehman Brothers U.S. Corporate High Yield 2% Issuer Capped Index (the benchmark Index). It returned 2.74% as measured by the Lehman Brothers U.S. Corporate High Yield Index (the former benchmark Index.) For the year, the cumulative total returns of the Fund’s Class A and Z shares exceeded the benchmark Index, but Class B and C shares lagged the benchmark Index.
Several factors continued to support high yield bonds. Their yields remained attractive compared to those of most other debt securities, and a buoyant U.S. economy helped many companies that issue high yield bonds generate solid earnings growth. Furthermore, the high yield bond default rate remained well below its historical average in 2005.
Limited auto sector exposure aided Fund’s relative performance
The Fund’s highly diversified portfolio was spread across many sectors of the market such as healthcare, gaming, energy, lodging, and the automotive sector. The situation in the U.S. auto industry deteriorated in mid-March 2005 when General Motors Corporation (GM) slashed its earnings forecast reflecting its declining share of the U.S. auto market. Both GM and Ford Motor Company (Ford) reported losses for the year. Stiff competition from foreign auto manufacturers and high labor costs hurt GM and Ford to the extent that their bonds were lowered from investment to speculative grade by major rating agencies. Although the Fund held auto bonds that declined in value, its underweight exposure to the auto sector compared with the benchmark Index benefited its relative performance. Among its holdings were short- and intermediate-term bonds of GM and Ford financial subsidiaries General Motors Acceptance Corporation and Ford Motor Credit Company that performed better than bonds of their parent companies.
Production cutbacks at GM and Ford and rising prices of industrial metals made for a tough operating environment for auto parts suppliers. We sold bonds of Collins & Aikman Company in early 2005 at a slight loss before it filed for bankruptcy. We purchased a small position in bonds of Delphi Corporation after they declined in value and sold them at a loss after the company filed for bankruptcy.
| | |
| Dryden High Yield Fund, Inc. | | 5 |
Investment Subadvisor’s Report (continued)
Favorable security selection in the media sector
The Fund also had an underweight exposure to the media sector compared to the benchmark Index. In this case, however, favorable security selection in the sector rather than sector weighing was the crucial factor that benefited the Fund’s performance. The Fund held preferred stock of Paxson Communications Corporation that gained solidly on news that the television broadcast group’s owner was stepping down, potentially paving the way for a sale of the company or a strategic alliance with another firm.
Fund held too few telecommunications bonds
Telecom was among the best performing sectors of the high yield market in 2005, particularly wireless telecom firms. These companies have attracted large amounts of new subscribers. In addition, the telecom sector as a whole benefited from positive merger-and-acquisition activity in 2005. For example, SBC Communications acquired AT&T Corporation in a deal valued at roughly $14 billion, leading to an upgrade of AT&T’s credit rating. The Fund held bonds of AT&T, Telus Corporation, Dobson Communications Corporation, and other telecom firms that gained in value, but its underweight exposure to the sector versus the benchmark Index detracted from its relative performance.
Emphasis on shorter-term bonds a prudent strategy
Fed policymakers were concerned that the U.S. economy might grow too quickly and boost inflationary pressures. Therefore they gradually raised short-term interest rates to slow the economic expansion. From June 2004 through December 2005, the target for the federal funds rate on overnight loans between banks was increased 13 times in quarter-point increments, from 1.00% to 4.25%. Eight of the increases occurred in 2005. Because short-term rates rose sharply while longer-term rates fluctuated in a range, the yield curve flattened to where yields on speculative-grade bonds with shorter maturity dates were nearly as high as yields on longer-term speculative-grade bonds. We generally favored shorter-term bonds in the belief that the additional yield provided by some longer-term bonds was not worth the increased risk. Similarly, we selectively increased the Fund’s holdings of higher-quality speculative grade bonds, which were yielding nearly as much as medium-quality high yield bonds.
One bond that helped the Fund and a preferred stock that hurt
The sharp rise in commodity prices spelled trouble for two companies whose securities are held by the Fund. Calpine Corporation, which had to deal with the rising cost of natural gas, a heavy debt burden, ongoing legal challenges, and overcapacity in its market, filed for bankruptcy in December 2005. The Fund held the more senior Calpine bonds that actually rose in value while the Fund’s underweight
| | |
| 6 | | Visit our website at www.jennisondryden.com |
exposure to Calpine’s subordinated debt benefited its relative performance. However, the Fund’s preferred stock holdings of EaglePicher Holdings Inc. detracted from its returns. The diversified manufacturer’s struggles with the high costs of metals and energy as well as deteriorating business conditions at its automotive subsidiary, led it to file for bankruptcy in 2005.
Emerging-market bonds another positive for the Fund
Emerging-market bonds turned in an impressive performance in 2005. A strong global economy boosted investor confidence in the bonds of developing nations. Balance-of-payment positions remained strong in many emerging-market countries, helped by rising commodity and oil prices. In addition, a search for attractive yields in the global low-interest-rate environment encouraged investment in emerging-market debt securities.
Since the market for bonds of developing nations can be very volatile, we limited the Fund’s exposure to a few debt securities such as the restructured sovereign bonds of the Republic of Argentina. They gained in value after the Argentine government successfully completed the process in which investors exchanged defaulted bonds for the new restructured bonds. The Fund also held government bonds of the Republic of the Philippines that gained in value as the government broadened its value-added tax to apply to sales of oil and certain other products and services. We believe additional tax revenues could help narrow the nation’s budget gap and may benefit its credit rating down the road.
| | |
| Dryden High Yield Fund, Inc. | | 7 |
Fees and Expenses (Unaudited)
As a shareholder of the Fund, you incur two types of costs: (1) transaction costs, including sales charges (loads) on purchase payments and redemptions, as applicable, and (2) ongoing costs, including management fees, distribution and/or service (12b-1) fees, and other Fund expenses, as applicable. This example is intended to help you understand your ongoing costs (in dollars) of investing in the Fund and to compare these costs with the ongoing costs of investing in other mutual funds.
The example is based on an investment of $1,000 invested on July 1, 2005, at the beginning of the period, and held through the six-month period ended December 31, 2005.
The Fund’s transfer agent may charge additional fees to holders of certain accounts that are not included in the expenses shown in the table on the following page. These fees apply to Individual Retirement Accounts (IRAs) and Section 403(b) accounts. As of the close of the six-month period covered by the table, IRA fees included an annual maintenance fee of $15 per account (subject to a maximum annual maintenance fee of $25 for all accounts held by the same shareholder). Section 403(b) accounts are charged an annual $25 fiduciary maintenance fee. Some of the fees may vary in amount, or may be waived, based on your total account balance or the number of JennisonDryden or Strategic Partners Funds, including the Fund, that you own. You should consider the additional fees that were charged to your Fund account over the six-month period when you estimate the total ongoing expenses paid over the period and the impact of these fees on your ending account value, as these additional expenses are not reflected in the information provided in the expense table. Additional fees have the effect of reducing investment returns.
Actual Expenses
The first line for each share class in the table on the following page provides information about actual account values and actual expenses. You may use the information on this line, together with the amount you invested, to estimate the expenses that you paid over the period. Simply divide your account value by $1,000 (for example, an $8,600 account value ÷ $1,000 = 8.6), then multiply the result by the number on the first line under the heading “Expenses Paid During the Six-Month Period” to estimate the expenses you paid on your account during this period.
Hypothetical Example for Comparison Purposes
The second line for each share class in the table on the following page provides information about hypothetical account values and hypothetical expenses based on the Fund’s actual expense ratio and an assumed rate of return of 5% per year before
| | |
| 8 | | Visit our website at www.jennisondryden.com |
expenses, which is not the Fund’s actual return. The hypothetical account values and expenses may not be used to estimate the actual ending account balance or expenses you paid for the period. You may use this information to compare the ongoing costs of investing in the Fund and other funds. To do so, compare this 5% hypothetical example with the 5% hypothetical examples that appear in the shareholder reports of the other funds.
Please note that the expenses shown in the table are meant to highlight your ongoing costs only, and do not reflect any transactional costs such as sales charges (loads). Therefore the second line for each share class in the table is useful in comparing ongoing costs only, and will not help you determine the relative total costs of owning different funds. In addition, if these transactional costs were included, your costs would have been higher.
| | | | | | | | | | | | | | |
Dryden High Yield
Fund, Inc. | | Beginning Account
Value
July 1, 2005 | | Ending Account
Value December 31,
2005 | | Annualized
Expense Ratio
Based on the
Six-Month Period | | | Expenses Paid
During the
Six-Month Period* |
| | | | | | | | | | | | | | | |
| Class A | | Actual | | $ | 1,000.00 | | $ | 1,028.10 | | 0.92 | % | | $ | 4.70 |
| | | Hypothetical | | $ | 1,000.00 | | $ | 1,020.57 | | 0.92 | % | | $ | 4.69 |
| | | | | | | | | | | | | | | |
| Class B | | Actual | | $ | 1,000.00 | | $ | 1,023.50 | | 1.42 | % | | $ | 7.24 |
| | | Hypothetical | | $ | 1,000.00 | | $ | 1,018.05 | | 1.42 | % | | $ | 7.22 |
| | | | | | | | | | | | | | | |
| Class C | | Actual | | $ | 1,000.00 | | $ | 1,023.50 | | 1.42 | % | | $ | 7.24 |
| | | Hypothetical | | $ | 1,000.00 | | $ | 1,018.05 | | 1.42 | % | | $ | 7.22 |
| | | | | | | | | | | | | | | |
| Class R | | Actual | | $ | 1,000.00 | | $ | 1,025.50 | | 1.17 | % | | $ | 5.97 |
| | | Hypothetical | | $ | 1,000.00 | | $ | 1,019.31 | | 1.17 | % | | $ | 5.96 |
| | | | | | | | | | | | | | | |
| Class Z | | Actual | | $ | 1,000.00 | | $ | 1,027.60 | | 0.67 | % | | $ | 3.42 |
| | | Hypothetical | | $ | 1,000.00 | | $ | 1,021.83 | | 0.67 | % | | $ | 3.41 |
| | | | | | | | | | | | | | | |
* Fund expenses (net of fee waivers or subsidies, if any) for each share class are equal to the annualized expense ratio for each share class (provided in the table), multiplied by the average account value over the period, multiplied by the 184 days in the six-month period ended December 31, 2005, and divided by the 365 days in the Fund’s fiscal year ended December 31, 2005 (to reflect the six-month period).
| | |
| Dryden High Yield Fund, Inc. | | 9 |
This Page Intentionally Left Blank
Portfolio of Investments
as of December 31, 2005
| | | | | | | | | | | | | |
| Description | | Moody’s
Rating
(Unaudited) | | Interest
Rate | | Maturity
Date | | Principal
Amount (000) | | | Value (Note 1) |
| | | | | | | | | | | | | | |
LONG-TERM INVESTMENTS 96.2% | | | | | | | | | | | |
| | | | |
ASSET BACKED SECURITIES 1.1% | | | | | | | | | | | |
Centurion CDO Vll Ltd., Ser. 2004 -7A, Cl. D1 144A (cost $5,000,000; purchased 4/14/04) | | Ba2 | | 12.09% | | 1/30/16 | | $ | 5,000 | (k)(l) | | $ | 5,165,000 |
CSAM Funding Corp. l, Sub. Notes, Cl. D-2 144A (cost $7,000,000; purchased 3/15/01) | | Ba2 | | 10.59(k) | | 3/29/16 | | | 7,000 | (l) | | | 6,965,000 |
Landmark lV CDO Ltd., 144A (cost $3,500,000; purchased 9/23/04) | | Ba2 | | 10.64(k) | | 12/15/16 | | | 3,500 | (l) | | | 3,640,000 |
Liberty Square Ltd., Ser. 2001-2A, Cl. D 144A (cost $3,408,779; purchased 5/23/01) | | Ba3 | | 11.17(k) | | 6/15/13 | | | 3,462 | (l) | | | 1,557,784 |
| | | | | | | | | | | | |
|
|
Total asset backed securities | | | | | | | | | | | | | 17,327,784 |
| | | | | | | | | | | | |
|
|
CORPORATE BONDS 91.3% | | | | | | | | | | | |
| | | | |
Aerospace/Defense 2.1% | | | | | | | | | | | |
Alliant Techsystems, Inc., Sr. Sub. Notes | | B2 | | 8.50 | | 5/15/11 | | | 2,955 | | | | 3,102,750 |
Argo-Tech Corp., Sr. Notes | | B3 | | 9.25 | | 6/1/11 | | | 1,230 | | | | 1,260,750 |
BE Aerospace, Inc., | | | | | | | | | | | | | |
Sr. Sub. Notes, Ser. B | | Caa2 | | 8.00 | | 3/1/08 | | | 1,550 | | | | 1,550,000 |
Sr. Sub. Notes, Ser. B | | Caa2 | | 8.875 | | 5/1/11 | | | 4,780 | | | | 5,019,000 |
Esterline Technologies Corp.,
Sr. Sub. Notes | | B1 | | 7.75 | | 6/15/13 | | | 2,000 | | | | 2,090,000 |
K&F Acquisition, Inc.,
Sr. Sub. Notes, 144A | | Caa1 | | 7.75 | | 11/15/14 | | | 3,325 | | | | 3,358,250 |
L-3 Communications Corp.,
Sr. Sub. Notes | | Ba3 | | 7.625 | | 6/15/12 | | | 7,825 | | | | 8,235,812 |
Moog, Inc. | | Ba3 | | 6.25 | | 1/15/15 | | | 2,000 | | | | 1,970,000 |
Sequa Corp. | | B1 | | 9.00 | | 8/1/09 | | | 375 | | | | 398,438 |
Sequa Corp., Sr. Notes, Ser. B | | B1 | | 8.875 | | 4/1/08 | | | 3,775 | | | | 3,935,438 |
Standard Aero Holdings, Inc., 144A | | Caa1 | | 8.25 | | 9/1/14 | | | 2,740 | | | | 2,246,800 |
| | | | | | | | | | | | |
|
|
| | | | | | | | | | | | | | 33,167,238 |
See Notes to Financial Statements.
| | |
| Dryden High Yield Fund, Inc. | | 11 |
Portfolio of Investments
as of December 31, 2005 Cont’d.
| | | | | | | | | | | | | |
| Description | | Moody’s
Rating
(Unaudited) | | Interest
Rate | | Maturity
Date | | Principal
Amount (000) | | | Value (Note 1) |
| | | | | | | | | | | | | | |
Airlines 0.9% | | | | | | | | | | | | | |
American Airlines, Inc., Certs., Ser. 91-A2 | | B3 | | 10.18 | | 1/2/13 | | $ | 2,000 | | | $ | 1,617,660 |
AMR Corp., | | | | | | | | | | | | | |
Deb. | | Caa2 | | 10.00 | | 4/15/21 | | | 3,783 | | | | 2,827,793 |
Notes | | Caa2 | | 10.40 | | 3/10/11 | | | 4,450 | | | | 3,682,374 |
Calair Capital LLC, Gtd. Sr. Notes | | Caa2 | | 8.125 | | 4/1/08 | | | 2,980 | | | | 2,588,875 |
Continental Airlines, Inc., Certs., Ser. 981B | | Ba2 | | 6.748 | | 3/15/17 | | | 3,804 | (g) | | | 3,333,271 |
| | | | | | | | | | | | |
|
|
| | | | | | | | | | | | | | 14,049,973 |
| | | | | |
Automotive 6.3% | | | | | | | | | | | | | |
ArvinMeritor, Inc., Notes | | Ba2 | | 8.75 | | 3/1/12 | | | 9,610 | (g) | | | 9,201,575 |
Dana Corp. | | B1 | | 6.50 | | 3/1/09 | | | 1,300 | (g) | | | 1,040,000 |
Ford Motor Credit Co., Notes | | Baa3 | | 7.875 | | 6/15/10 | | | 19,235 | (g) | | | 17,309,422 |
General Motors Acceptance Corp., | | | | | | | | | | | | | |
Notes | | Ba1 | | 6.75 | | 1/15/06 | | | 18,900 | (g) | | | 18,877,500 |
Notes | | Ba1 | | 6.875 | | 9/15/11 | | | 10,800 | (g) | | | 9,849,006 |
Notes | | Ba1 | | 6.875 | | 8/28/12 | | | 11,450 | | | | 10,320,274 |
Notes | | Ba1 | | 6.75 | | 12/1/14 | | | 7,070 | (g) | | | 6,360,320 |
Goodyear Tire & Rubber Co. (The), Sr. Notes, 144A | | B3 | | 9.00 | | 7/1/15 | | | 3,300 | | | | 3,250,500 |
Lear Corp., Gtd. Notes, Ser. B | | Ba2 | | 8.11 | | 5/15/09 | | | 3,125 | (g) | | | 2,908,456 |
Navistar International Corp., Sr. Notes, Ser. B | | Ba3 | | 9.375 | | 6/1/06 | | | 2,875 | | | | 2,918,125 |
Tenneco Automotive, Inc., Gtd. Notes, 144A | | B3 | | 8.625 | | 11/15/14 | | | 3,850 | (g) | | | 3,638,250 |
TRW Automotive, | | | | | | | | | | | | | |
Sr. Notes | | Ba3 | | 9.375 | | 2/15/13 | | | 5,737 | (g) | | | 6,210,303 |
Sr. Sub. Notes | | B1 | | 11.00 | | 2/15/13 | | | 425 | (g) | | | 477,063 |
Visteon Corp., | | | | | | | | | | | | | |
Notes | | B3 | | 7.00 | | 3/10/14 | | | 6,405 | (g) | | | 4,947,863 |
Sr. Notes | | B3 | | 8.25 | | 8/1/10 | | | 5,220 | (g) | | | 4,437,000 |
| | | | | | | | | | | | |
|
|
| | | | | | | | | | | | | | 101,745,657 |
| | | | | |
Banking 0.5% | | | | | | | | | | | | | |
Halyk Savings Bank of Kazakhstan, Notes, 144A (Kazakhstan) | | Baa2 | | 8.125 | | 10/7/09 | | | 1,620 | (j) | | | 1,733,400 |
See Notes to Financial Statements.
| | |
| 12 | | Visit our website at www.jennisondryden.com |
| | | | | | | | | | | | | |
| Description | | Moody’s
Rating
(Unaudited) | | Interest
Rate | | Maturity
Date | | Principal
Amount (000) | | | Value (Note 1) |
| | | | | | | | | | | | | | |
Kazkommerts Int’l. BV, (Netherlands) | | | | | | | | | | | | | |
Gtd. Notes, 144A | | Baa2 | | 7.00 | | 11/3/09 | | $ | 2,210 | (j) | | $ | 2,267,460 |
Gtd. Notes, 144A | | Baa2 | | 8.50 | | 4/16/13 | | | 4,435 | (j) | | | 4,831,489 |
| | | | | | | | | | | | |
|
|
| | | | | | | | | | | | | | 8,832,349 |
| | | |
Building Materials & Construction 1.7% | | | | | | | | | |
D.R. Horton, Inc., | | | | | | | | | | | | | |
Sr. Gtd. Notes | | Baa3 | | 8.00 | | 2/1/09 | | | 4,565 | | | | 4,865,121 |
Sr. Notes | | Baa3 | | 7.50 | | 12/1/07 | | | 2,000 | (g) | | | 2,076,410 |
Sr. Notes | | Baa3 | | 8.50 | | 4/15/12 | | | 1,375 | | | | 1,469,061 |
Sr. Sub. Notes | | Ba1 | | 9.38 | | 3/15/11 | | | 1,360 | | | | 1,430,936 |
Goodman Global Holdings, Inc., Sr. Notes, 144A | | B3 | | 7.67(k) | | 6/15/12 | | | 4,130 | (g) | | | 4,088,700 |
K Hovnanian Enterprises, Inc., Gtd. Sr. Notes, 144A | | Ba1 | | 6.25 | | 1/15/15 | | | 3,000 | | | | 2,823,321 |
KB Home, Sr. Sub. Notes | | Ba2 | | 8.625 | | 12/15/08 | | | 6,325 | | | | 6,718,245 |
New Millenium Homes LLC, (cost $1,953,409; purchased 5/27/98) | | NR | | Zero | | 12/31/07 | | | 1,854 | (b)(d)(f)(l) | | | 1,483,200 |
Nortek, Inc., Sr. Sub. Notes 144A | | Caa1 | | 8.50 | | 9/1/14 | | | 3,490 | | | | 3,367,850 |
| | | | | | | | | | | | |
|
|
| | | | | | | | | | | | | | 28,322,844 |
| | | | | |
Cable 3.1% | | | | | | | | | | | | | |
Cablevision Systems Corp., Sr. Notes, Ser. B | | B3 | | 8.00 | | 4/15/12 | | | 850 | (g) | | | 794,750 |
Callahan Nordrhein Westfalen (Germany), | | | | | | | | | | | | | |
Sr. Disc. Notes, Zero Coupon (until 7/15/05) (cost $9,882,293; purchased 6/29/00) | | NR | | 16.00(m) | | 7/15/10 | | | 15,000 | (e)(j)(l) | | | 1,500 |
Sr. Notes (cost $5,429,117; purchased 6/29/00) | | NR | | 14.00 | | 7/15/10 | | | 6,900 | (e)(j)(l) | | | 690 |
Charter Communications Bank Loan A | | B2 | | 7.25 | | 4/27/10 | | | 6,991 | | | | 6,982,024 |
Charter Communications Holdings II, Sr. Notes | | Caa1 | | 10.25 | | 9/15/10 | | | 3,000 | | | | 2,985,000 |
See Notes to Financial Statements.
| | |
| Dryden High Yield Fund, Inc. | | 13 |
Portfolio of Investments
as of December 31, 2005 Cont’d.
| | | | | | | | | | | | | |
| Description | | Moody’s
Rating
(Unaudited) | | Interest
Rate | | Maturity
Date | | Principal
Amount (000) | | | Value (Note 1) |
| | | | | | | | | | | | | | |
Charter Communications Holdings LLC, | | | | | | | | | | | | | |
Sr. Notes | | Ca | | 10.75 | | 10/1/09 | | $ | 2,700 | (g) | | $ | 2,011,500 |
Sr. Notes, 144A | | Ca | | 11.125 | | 1/15/14 | | | 4,434 | (g) | | | 2,582,805 |
Sr. Notes, 144A | | Ca | | 10.00 | | 5/15/14 | | | 983 | (g) | | | 557,853 |
Sr. Notes 144A | | Caa3 | | 11.00 | | 10/1/15 | | | 11,692 | (g) | | | 9,821,279 |
Sr. Notes, Zero Coupon (until 1/15/06) 144A | | Ca | | 13.50(m) | | 1/15/14 | | | 2,000 | (g) | | | 1,345,000 |
Sr. Notes, Zero Coupon (until 5/1/06) 144A | | Ca | | 11.75(m) | | 5/15/14 | | | 3,000 | (g) | | | 1,665,000 |
Charter Communications Operating LLC., Sr. Notes, 144A (cost $3,379,892; purchased 4/22/04) | | B2 | | 8.375 | | 4/30/14 | | | 3,250 | (g)(l) | | | 3,233,750 |
CSC Holdings Inc., | | | | | | | | | | | | | |
Deb. | | B2 | | 7.625 | | 7/15/18 | | | 3,360 | | | | 3,192,000 |
Sr. Notes | | B2 | | 7.875 | | 12/15/07 | | | 4,500 | | | | 4,578,750 |
Sr. Notes, Ser. B | | B2 | | 8.125 | | 7/15/09 | | | 5,100 | | | | 5,151,000 |
Rogers Cable, Inc., Sr. Sec’d. Notes, 144A | | Ba3 | | 6.75 | | 3/15/15 | | | 2,525 | (g) | | | 2,562,875 |
Videotron Ltee, Gtd., Sr. Notes, 144A | | Ba3 | | 6.38 | | 12/15/15 | | | 3,525 | | | | 3,502,969 |
| | | | | | | | | | | | |
|
|
| | | | | | | | | | | | | | 50,968,745 |
| | | | | |
Capital Goods 5.2% | | | | | | | | | | | | | |
Allied Waste North America, Inc., | | | | | | | | | | | | | |
Gtd. Notes, Ser B. | | B2 | | 8.50 | | 12/1/08 | | | 4,785 | (g) | | | 5,024,250 |
Sr. Notes, Ser. B | | B2 | | 5.75 | | 2/15/11 | | | 4,320 | (g) | | | 4,093,200 |
Sr. Notes, Ser. B | | B2 | | 9.25 | | 9/1/12 | | | 5,127 | | | | 5,549,978 |
Sr. Notes, 144A | | B2 | | 7.25 | | 3/15/15 | | | 1,395 | | | | 1,408,950 |
Blount, Inc., Sr. Sub. Notes | | B3 | | 8.875 | | 8/1/12 | | | 6,200 | | | | 6,541,000 |
Case New Holland, Inc., Sr Notes, 144A | | Ba3 | | 9.25 | | 8/1/11 | | | 3,995 | | | | 4,274,650 |
Hertz Corp., | | | | | | | | | | | | | |
Sr. Notes 144A | | B1 | | 8.875 | | 1/1/14 | | | 9,225 | | | | 9,397,969 |
Sr. Sub. 144A | | B3 | | 10.50 | | 1/1/16 | | | 5,825 | (g) | | | 5,999,750 |
Holt Group, Inc., Sr. Notes (cost $8,158,700; purchased 1/15/98) | | NR | | 9.75(m) | | 1/15/06 | | | 8,120 | (e)(l) | | | 20,300 |
Invensys PLC (United Kingdom), Sr. Notes, 144A | | B3 | | 9.875 | | 3/15/11 | | | 2,620 | (j) | | | 2,593,800 |
See Notes to Financial Statements.
| | |
| 14 | | Visit our website at www.jennisondryden.com |
| | | | | | | | | | | | | |
| Description | | Moody’s
Rating
(Unaudited) | | Interest
Rate | | Maturity
Date | | Principal
Amount (000) | | | Value (Note 1) |
| | | | | | | | | | | | | | |
Johnsondiversey Holding, Inc., | | | | | | | | | | | | | |
Sr. Disc. Notes (cost $3,617,826; purchased 9/8/03) | | Caa1 | | Zero | | 5/15/13 | | $ | 4,110 | (l) | | $ | 3,267,450 |
Sr. Sub. Notes, Ser. B | | Caa1 | | 9.625 | | 5/15/12 | | | 900 | (g) | | | 904,500 |
Manitowoc Co., Inc., Gtd. Notes | | B2 | | 10.50 | | 8/1/12 | | | 6,216 | | | | 6,899,759 |
Mueller Group, Inc., Sr. Sub. Notes | | Caa1 | | 10.00 | | 5/1/12 | | | 1,830 | | | | 1,944,375 |
Stena AB, (Sweden), | | | | | | | | | | | | | |
Sr. Notes | | Ba3 | | 9.625 | | 12/1/12 | | | 2,800 | (j) | | | 3,041,500 |
Sr. Notes | | Ba3 | | 7.50 | | 11/1/13 | | | 4,900 | (g)(j) | | | 4,704,000 |
Terex Corp., | | | | | | | | | | | | | |
Sr. Sub. Notes | | Caa1 | | 10.375 | | 4/1/11 | | | 8,565 | | | | 9,078,899 |
Sr. Sub. Notes | | Caa1 | | 9.25 | | 7/15/11 | | | 1,845 | | | | 1,969,538 |
TRISM, Inc., Sr. Sub. Notes (cost $493,912; purchased 3/7/00) | | NR | | 12.00 | | 2/15/05 | | | 435 | (b)(d)(e)(l) | | | 1,087 |
Tyco Int’l. Group SA (Luxembourg), Sr. Notes | | Baa3 | | 6.375 | | 2/15/06 | | | 1,200 | | | | 1,201,992 |
United Rentals North America, Inc., Sr. Notes | | B3 | | 6.50 | | 2/15/12 | | | 6,750 | (g) | | | 6,572,813 |
| | | | | | | | | | | | |
|
|
| | | | | | | | | | | | | | 84,489,760 |
| | | | | |
Chemicals 6.6% | | | | | | | | | | | | | |
BCI US Finance Corp., Sec’d. Notes, 144A | | B3 | | 9.65(k) | | 7/15/10 | | | 4,670 | | | | 4,728,375 |
Equistar Chemicals LP, | | | | | | | | | | | | | |
Gtd. Notes | | B2 | | 10.125 | | 9/1/08 | | | 3,565 | | | | 3,868,025 |
Notes (cost $1,389,798; purchased 5/5/03) | | B2 | | 6.50 | | 2/15/06 | | | 1,400 | (l) | | | 1,400,000 |
Sr. Notes | | B2 | | 10.625 | | 5/1/11 | | | 3,030 | | | | 3,333,000 |
Huntsman Co. LLC, Gtd. Notes | | Ba3 | | 11.625 | | 10/15/10 | | | 3,000 | | | | 3,416,250 |
Huntsman International LLC, | | | | | | | | | | | | | |
Gtd. Notes | | B2 | | 9.875 | | 3/1/09 | | | 6,700 | | | | 7,068,500 |
Sr. Sub. Notes | | B3 | | 10.125 | | 7/1/09 | | | 1,238 | | | | 1,278,235 |
Huntsman LLC, Gtd. Notes, 144A | | B2 | | 11.50 | | 7/15/12 | | | 660 | (g) | | | 747,450 |
See Notes to Financial Statements.
| | |
| Dryden High Yield Fund, Inc. | | 15 |
Portfolio of Investments
as of December 31, 2005 Cont’d.
| | | | | | | | | | | | | |
| Description | | Moody’s
Rating
(Unaudited) | | Interest
Rate | | Maturity
Date | | Principal
Amount (000) | | | Value (Note 1) |
| | | | | | | | | | | | | | |
IMC Global, Inc., | | | | | | | | | | | | | |
Gtd. Notes | | Ba3 | | 11.25 | | 6/1/11 | | $ | 1,600 | | | $ | 1,720,000 |
Gtd. Notes, Ser. B | | Ba3 | | 11.25 | | 6/1/11 | | | 6,300 | | | | 6,772,500 |
Sr. Notes | | Ba3 | | 10.875 | | 8/1/13 | | | 2,700 | | | | 3,101,625 |
Sr. Notes, Ser. B | | Ba3 | | 10.875 | | 6/1/08 | | | 3,618 | | | | 4,006,935 |
ISP Chemco, Inc.,
Sr. Sub Notes, Ser. B | | B1 | | 10.25 | | 7/1/11 | | | 6,370 | | | | 6,784,050 |
Koppers, Inc., Gtd. Notes | | B2 | | 9.875 | | 10/15/13 | | | 8,710 | | | | 9,450,349 |
Lyondell Chemical Co., | | | | | | | | | | | | | |
Gtd. Notes | | B1 | | 10.50 | | 6/1/13 | | | 5,360 | (g) | | | 6,090,300 |
Sec’d. Notes, Ser. A | | B1 | | 9.625 | | 5/1/07 | | | 8,000 | | | | 8,350,000 |
Sr. Sec’d Notes | | B1 | | 9.50 | | 12/15/08 | | | 1,607 | | | | 1,683,333 |
Sr. Sec’d. Notes | | B1 | | 9.50 | | 12/15/08 | | | 1,752 | | | | 1,837,410 |
Nalco Co., | | | | | | | | | | | | | |
Sr. Notes | | B2 | | 7.75 | | 11/15/11 | | | 4,695 | | | | 4,824,113 |
Sr. Sub. Notes | | Caa1 | | 8.875 | | 11/15/13 | | | 4,560 | (g) | | | 4,776,600 |
Nell AF SARL (Luxembourg), Sr. Notes, 144A | | B2 | | 8.375 | | 8/15/15 | | | 3,335 | (g)(j) | | | 3,301,650 |
OM Group, Inc., Sr. Sub. Notes | | Caa1 | | 9.25 | | 12/15/11 | | | 2,320 | | | | 2,267,800 |
PQ Corp., Gtd. Notes, 144A | | B3 | | 7.50 | | 2/15/13 | | | 1,390 | (g) | | | 1,292,700 |
Rhodia SA (France), | | | | | | | | | | | | | |
Sr. Notes | | B3 | | 10.25 | | 6/1/10 | | | 2,925 | (g)(j) | | | 3,202,875 |
Sr. Sub. Notes | | Caa1 | | 8.875 | | 6/1/11 | | | 3,740 | (g)(j) | | | 3,833,500 |
Rockwood Specialties, Inc., Sr. Sub. Notes (cost $5,090,469; purchased 7/9/03-6/10/05) | | B3 | | 10.625 | | 5/15/11 | | | 3,254 | (l) | | | 3,567,198 |
Westlake Chemical Corp., Sr. Notes | | Ba2 | | 8.75 | | 7/15/11 | | | 3,701 | | | | 3,960,070 |
| | | | | | | | | | | | |
|
|
| | | | | | | | | | | | | | 106,662,843 |
| | | | | |
Consumer 1.2% | | | | | | | | | | | | | |
Coinmach Corp., Sr. Notes | | B3 | | 9.00 | | 2/1/10 | | | 2,055 | | | | 2,152,613 |
Levi Strauss & Co., Sr. Notes | | Caa2 | | 12.25 | | 12/15/12 | | | 2,230 | | | | 2,486,450 |
Playtex Products Inc. | | Caa1 | | 9.375 | | 6/1/11 | | | 3,950 | (g) | | | 4,137,625 |
Propex Fabrics, Inc., Gtd. Notes | | Caa1 | | 10.00 | | 12/1/12 | | | 915 | | | | 816,638 |
Service Corp. Int’l., | | | | | | | | | | | | | |
Notes | | Ba3 | | 6.50 | | 3/15/08 | | | 4,385 | | | | 4,428,849 |
Sr. Notes, 144A | | Ba3 | | 7.00 | | 6/15/17 | | | 2,000 | | | | 1,985,000 |
Simmons Bedding Co., Sr. Sub. Notes | | Caa1 | | 7.875 | | 1/15/14 | | | 2,850 | (g) | | | 2,636,250 |
| | | | | | | | | | | | |
|
|
| | | | | | | | | | | | | | 18,643,425 |
See Notes to Financial Statements.
| | |
| 16 | | Visit our website at www.jennisondryden.com |
| | | | | | | | | | | | | |
| Description | | Moody’s
Rating
(Unaudited) | | Interest
Rate | | Maturity
Date | | Principal
Amount (000) | | | Value (Note 1) |
| | | | | | | | | | | | | | |
Electric 8.6% | | | | | | | | | | | | | |
AES Corp., | | | | | | | | | | | | | |
Sec’d. Notes, 144A | | Ba3 | | 8.75 | | 5/15/13 | | $ | 935 | | | $ | 1,017,981 |
Sr. Notes | | B1 | | 9.50 | | 6/1/09 | | | 6,635 | (g) | | | 7,165,800 |
Sr. Notes | | B1 | | 9.375 | | 9/15/10 | | | 9,475 | (g) | | | 10,351,437 |
AES Eastern Energy LP, Certs., Ser. A | | Ba1 | | 9.00 | | 1/2/17 | | | 5,870 | | | | 6,633,470 |
Aquila, Inc., Sr. Notes | | B2 | | 9.95 | | 2/1/11 | | | 3,418 | (g) | | | 3,768,345 |
Beaver Valley II Funding Corp., Deb. | | Baa3 | | 9.00 | | 6/1/17 | | | 6,900 | | | | 7,914,783 |
CMS Energy Corp., | | | | | | | | | | | | | |
Sr. Notes | | B1 | | 9.875 | | 10/15/07 | | | 1,250 | | | | 1,337,500 |
Sr. Notes | | B1 | | 7.50 | | 1/15/09 | | | 5,625 | (g) | | | 5,793,750 |
Sr. Notes | | B1 | | 8.50 | | 4/15/11 | | | 4,060 | (g) | | | 4,420,325 |
Dynegy Holdings, Inc., | | | | | | | | | | | | | |
Sec’d. Notes, 144A | | B1 | | 9.875 | | 7/15/10 | | | 1,395 | | | | 1,529,269 |
Sec’d. Notes, 144A | | B1 | | 10.125 | | 7/15/13 | | | 8,025 | | | | 9,068,249 |
Sr. Notes | | B2 | | 6.875 | | 4/1/11 | | | 1,895 | (g) | | | 1,866,575 |
Edison Mission Energy, | | | | | | | | | | | | | |
Sr. Notes | | B1 | | 7.73 | | 6/15/09 | | | 8,285 | | | | 8,554,262 |
Sr. Notes | | B1 | | 9.875 | | 4/15/11 | | | 1,250 | | | | 1,457,813 |
Empresa Nacional de Electricidad SA (Chile), Notes | | Ba1 | | 8.625 | | 8/1/15 | | | 5,650 | (g)(j) | | | 6,616,020 |
Homer City Funding LLC, Gtd. Notes | | Ba2 | | 8.137 | | 10/1/19 | | | 1,880 | | | | 2,068,000 |
Midland Funding II Corp., Deb. (cost $12,856,913; purchased 9/7/00) | | B3 | | 13.25 | | 7/23/06 | | | 4,352 | (l) | | | 4,507,725 |
Midwest Generation LLC, | | | | | | | | | | | | | |
Certs., Ser. A (cost $4,996,813; purchased 11/20/03) | | B1 | | 8.30 | | 7/2/09 | | | 4,855 | (l) | | | 5,061,338 |
Certs., Ser. B | | B1 | | 8.56 | | 1/2/16 | | | 790 | | | | 859,163 |
Sec’d. Notes | | B1 | | 8.75 | | 5/1/34 | | | 3,025 | | | | 3,331,281 |
Mirant Corp., Sr. Notes, 144A | | NR | | 7.40 | | 7/15/04 | | | 2,600 | (e) | | | 3,224,000 |
Mirant North America LLC, Sr. Notes, 144A | | B1 | | 7.375 | | 12/31/13 | | | 1,500 | (g) | | | 1,516,875 |
Mission Energy Holding Co., Sec’d. Notes | | B2 | | 13.50 | | 7/15/08 | | | 2,890 | | | | 3,352,400 |
Nevada Power Co., Gen. & Ref. Mtg. Bkd., Ser. A | | Ba1 | | 8.25 | | 6/1/11 | | | 2,465 | | | | 2,729,988 |
See Notes to Financial Statements.
| | |
| Dryden High Yield Fund, Inc. | | 17 |
Portfolio of Investments
as of December 31, 2005 Cont’d.
| | | | | | | | | | | | | |
| Description | | Moody’s
Rating
(Unaudited) | | Interest
Rate | | Maturity
Date | | Principal
Amount (000) | | | Value (Note 1) |
| | | | | | | | | | | | | | |
NRG Energy, Inc., Sec’d Notes, 144A | | B1 | | 8.00 | | 12/15/13 | | $ | 7,671 | | | $ | 8,553,164 |
Orion Power Holdings, Inc., Sr. Notes | | B2 | | 12.00 | | 5/1/10 | | | 6,235 | | | | 7,045,550 |
Reliant Energy Mid-Atlantic, Inc., Certs., Ser. C | | B1 | | 9.681 | | 7/2/26 | | | 3,600 | | | | 3,805,617 |
Reliant Resources, Inc., Sec’d. Notes | | B1 | | 9.50 | | 7/15/13 | | | 5,275 | (g) | | | 5,288,188 |
Sierra Pacific Power Co., Ser. A | | Ba1 | | 8.00 | | 6/1/08 | | | 2,040 | | | | 2,131,800 |
Sierra Pacific Resources, Sr. Notes | | B1 | | 8.625 | | 3/15/14 | | | 2,165 | | | | 2,342,506 |
Teco Energy, Inc., Sr. Notes | | Ba2 | | 7.50 | | 6/15/10 | | | 1,000 | (g) | | | 1,065,000 |
Texas Genco Holdings Bank Loan (cost $1,961,651; purchased 12/8/04) | | Ba2 | | 4.60 | | 12/14/11 | | | 1,946 | (l) | | | 1,949,676 |
Texas Genco Holdings Bank Loan (cost $ 810,247; purchased 12/8/04) | | Ba2 | | 6.501 | | 12/14/11 | | | 804 | (l) | | | 805,301 |
UtiliCorp Finance Corp., Sr. Notes (Canada) | | B2 | | 7.75 | | 6/15/11 | | | 2,375 | (j)(g) | | | 2,428,438 |
York Power Funding (Cayman Islands), Sr. Sec’d. Notes, 144A (cost $1,963,363; purchased 7/31/98) | | D(a) | | Zero | | 10/30/07 | | | 1,963 | (b)(e)(f)(j)(l) | | | 169,831 |
| | | | | | | | | | | | |
|
|
| | | | | | | | | | | | | | 139,731,420 |
| | | | | |
Energy—Other 3.7% | | | | | | | | | | | | | |
Chesapeake Energy Corp., | | | | | | | | | | | | | |
Sr. Notes | | Ba2 | | 7.00 | | 8/15/14 | | | 2,650 | | | | 2,742,750 |
Sr. Notes | | Ba2 | | 6.875 | | 1/15/16 | | | 4,925 | | | | 5,048,125 |
Sr. Notes | | Ba2 | | 6.25 | | 1/15/18 | | | 684 | | | | 670,320 |
Sr. Notes, 144A | | Ba2 | | 6.375 | | 6/15/15 | | | 3,900 | | | | 3,900,000 |
Compton Petroleum Corp. | | B2 | | 7.625 | | 12/1/13 | | | 2,100 | | | | 2,147,250 |
Encore Acquisition Co., Sr. Sub. Notes (cost $2,100,000; purchased 3/30/04) | | B2 | | 6.25 | | 4/15/14 | | | 2,085 | (l) | | | 1,980,750 |
Forest Oil Corp., Sr. Notes | | Ba3 | | 8.00 | | 6/15/08 | | | 1,260 | | | | 1,313,550 |
See Notes to Financial Statements.
| | |
| 18 | | Visit our website at www.jennisondryden.com |
| | | | | | | | | | | | | |
| Description | | Moody’s
Rating
(Unaudited) | | Interest
Rate | | Maturity
Date | | Principal
Amount (000) | | | Value (Note 1) |
| | | | | | | | | | | | | | |
Hanover Equipment Trust, Sec’d. Notes, Ser. B | | B2 | | 8.75 | | 9/1/11 | | $ | 6,990 | (g) | | $ | 7,391,925 |
Houston Exploration Co.,
Sr. Sub. Notes | | B2 | | 7.00 | | 6/15/13 | | | 2,350 | | | | 2,256,000 |
Kerr-McGgee Corp. | | Ba3 | | 6.95 | | 7/1/24 | | | 1,400 | | | | 1,484,955 |
Magnum Hunter Resources, Inc., Sr. Notes | | Ba3 | | 9.60 | | 3/15/12 | | | 460 | | | | 499,100 |
Newfield Exploration Co.,
Sr. Sub. Notes, 144A | | Ba3 | | 6.625 | | 9/1/14 | | | 4,560 | | | | 4,639,800 |
Parker Drilling Co., Sr. Notes, 144A | | B2 | | 9.625 | | 10/1/13 | | | 3,900 | (g) | | | 4,353,375 |
Pogo Producing Co., Sr. Notes, 144A | | Ba3 | | 6.875 | | 10/1/17 | | | 2,675 | | | | 2,608,125 |
Premcor Refining Group, Inc., | | | | | | | | | | | | | |
Sr. Notes | | Baa3 | | 6.75 | | 2/1/11 | | | 3,000 | (g) | | | 3,177,714 |
Sr. Notes | | Baa3 | | 9.50 | | 2/1/13 | | | 6,550 | | | | 7,300,944 |
Sr. Notes | | Baa3 | | 6.75 | | 5/1/14 | | | 390 | | | | 409,656 |
Pride International, Inc., Sr. Notes | | Ba2 | | 7.375 | | 7/15/14 | | | 2,000 | | | | 2,145,000 |
Vintage Petroleum, Inc., | | | | | | | | | | | | | |
Sr. Notes | | Ba3 | | 8.25 | | 5/1/12 | | | 2,960 | | | | 3,174,600 |
Sr. Sub. Notes | | B1 | | 7.875 | | 5/15/11 | | | 2,625 | | | | 2,743,125 |
| | | | | | | | | | | | |
|
|
| | | | | | | | | | | | | | 59,987,064 |
| | | | | |
Foods 2.2% | | | | | | | | | | | | | |
Agrilink Foods, Inc., Sr. Sub Notes (cost $1,450,379; purchased 10/13/99) | | B3 | | 11.875 | | 11/1/08 | | | 1,558 | (b)(l) | | | 1,589,160 |
Ahold Finance USA, Inc. (Netherlands), Notes | | Ba2 | | 8.25 | | 7/15/10 | | | 1,840 | (j) | | | 1,989,500 |
Del Monte Corp., Sr. Sub. Notes | | B2 | | 8.625 | | 12/15/12 | | | 4,400 | | | | 4,675,000 |
Delhaize America, Inc., Gtd. Notes | | Ba1 | | 8.125 | | 4/15/11 | | | 4,325 | (g) | | | 4,714,540 |
Dole Food Co., Inc., | | | | | | | | | | | | | |
Gtd. Notes | | B2 | | 7.25 | | 6/15/10 | | | 555 | | | | 538,350 |
Sr. Notes | | B2 | | 8.625 | | 5/1/09 | | | 5,423 | | | | 5,558,575 |
Dominos, Inc., Sr. Sub. Notes | | B2 | | 8.25 | | 7/1/11 | | | 2,127 | | | | 2,222,715 |
Iowa Select Farms LP, Sec’d. Notes, PIK, 144A (cost $457,887; purchased 9/9/04) | | NR | | 6.50 | | 12/1/12 | | | 668 | (l) | | | 333,990 |
National Beef Packing Co., Sr. Notes | | B3 | | 10.50 | | 8/1/11 | | | 2,375 | | | | 2,458,125 |
See Notes to Financial Statements.
| | |
| Dryden High Yield Fund, Inc. | | 19 |
Portfolio of Investments
as of December 31, 2005 Cont’d.
| | | | | | | | | | | | | |
| Description | | Moody’s
Rating
(Unaudited) | | Interest
Rate | | Maturity
Date | | Principal
Amount (000) | | | Value (Note 1) |
| | | | | | | | | | | | | | |
Pathmark Stores, Inc., Gtd. Notes | | Caa2 | | 8.75 | | 2/1/12 | | $ | 3,295 | | | $ | 3,076,706 |
Smithfield Foods, Inc., | | | | | | | | | | | | | |
Sr. Notes | | Ba2 | | 8.00 | | 10/15/09 | | | 405 | | | | 427,275 |
Sr. Notes, 144A | | Ba2 | | 7.00 | | 8/1/11 | | | 2,900 | | | | 2,958,000 |
Sr. Notes | | Ba2 | | 7.75 | | 5/15/13 | | | 3,750 | (g) | | | 3,965,625 |
Specialty Foods Acquisition Corp., Sr. Sec’d. Disc.
Deb. 144A (cost $190,765; purchased 1/14/00) | | NR | | 13.00 | | 6/15/09 | | | 460 | (d)(e)(f)(l) | | | 5 |
Stater Brothers Holdings, Inc., Sr. Notes | | B1 | | 8.125 | | 6/15/12 | | | 1,620 | | | | 1,603,800 |
| | | | | | | | | | | | |
|
|
| | | | | | | | | | | | | | 36,111,366 |
| | | | | |
Gaming 5.1% | | | | | | | | | | | | | |
Aztar Corp., Sr. Sub. Notes | | Ba3 | | 7.875 | | 6/15/14 | | | 4,320 | (g) | | | 4,525,200 |
Boyd Gaming Corp.,
Sr. Sub. Notes | | B1 | | 8.75 | | 4/15/12 | | | 2,800 | (g) | | | 3,003,000 |
Circus Circus Entertainment | | | | | | | | | | | | | |
Sr. Notes | | Ba2 | | 6.45 | | 2/1/06 | | | 2,925 | (g) | | | 2,925,000 |
Sr. Notes | | Ba2 | | 9.50 | | 8/1/08 | | | 3,050 | | | | 3,305,438 |
Greektown Holdings LLC, Sr. Notes, 144A | | B3 | | 10.75 | | 12/1/13 | | | 3,400 | | | | 3,374,500 |
Isle of Capri Casinos, Inc., Sr. Sub. Notes | | B2 | | 9.00 | | 3/15/12 | | | 2,010 | | | | 2,125,575 |
MGM Grand, Inc., Gtd. Notes | | Ba3 | | 9.75 | | 6/1/07 | | | 10,300 | | | | 10,853,625 |
MGM Mirage, Inc., | | | | | | | | | | | | | |
Gtd. Notes | | Ba2 | | 6.00 | | 10/1/09 | | | 12,020 | | | | 11,944,874 |
Gtd. Notes | | Ba2 | | 6.625 | | 7/15/15 | | | 500 | | | | 498,750 |
Gtd. Notes, 144A | | Ba2 | | 6.625 | | 7/15/15 | | | 3,100 | | | | 3,092,250 |
Sr. Notes | | Ba2 | | 5.875 | | 2/27/14 | | | 1,250 | | | | 1,193,750 |
Mohegan Tribal Gaming Authority, Sr. Sub. Notes | | Ba3 | | 8.00 | | 4/1/12 | | | 4,510 | (g) | | | 4,746,775 |
Park Place Entertainment Inc., | | | | | | | | | | | | | |
Sr. Sub. Notes | | Ba1 | | 9.375 | | 2/15/07 | | | 2,100 | | | | 2,186,625 |
CCM Merger, Inc., Notes, 144A | | B3 | | 8.00 | | 8/1/13 | | | 2,885 | (g) | | | 2,769,600 |
Penn National Gaming, Inc., Sr. Sub. Notes, 144A | | B3 | | 6.75 | | 3/1/15 | | | 1,555 | | | | 1,527,788 |
Station Casinos Inc., | | | | | | | | | | | | | |
Sr. Notes | | Ba2 | | 6.00 | | 4/1/12 | | | 4,500 | (g) | | | 4,488,750 |
Sr. Sub. Notes, 144A | | Ba3 | | 6.875 | | 3/1/16 | | | 1,125 | | | | 1,150,313 |
See Notes to Financial Statements.
| | |
| 20 | | Visit our website at www.jennisondryden.com |
| | | | | | | | | | | | | |
| Description | | Moody’s
Rating
(Unaudited) | | Interest
Rate | | Maturity
Date | | Principal
Amount (000) | | | Value (Note 1) |
| | | | | | | | | | | | | | |
Trump Entertainment Resorts, Inc., Sec’d. Notes | | Caa1 | | 8.50 | | 6/1/15 | | $ | 7,820 | (g) | | $ | 7,624,500 |
Wynn Las Vegas LLC,144A | | B2 | | 6.625 | | 12/1/14 | | | 10,900 | | | | 10,600,250 |
| | | | | | | | | | | | |
|
|
| | | | | | | | | | | | | | 81,936,563 |
| | | | |
Health Care & Pharmaceutical 7.9% | | | | | | | | | | | |
Accellent Inc, Sr. Notes, 144A | | Caa1 | | 10.50 | | 12/1/13 | | | 9,800 | | | | 10,044,999 |
Alliance Imaging, Inc.,
Sr. Sub. Notes, 144A | | B3 | | 7.25 | | 12/15/12 | | | 1,900 | (g) | | | 1,581,750 |
Concentra Operating Corp., Gtd. Notes | | B3 | | 9.50 | | 8/15/10 | | | 4,175 | | | | 4,321,125 |
Coventry Health Care, Inc., Sr. Notes | | Ba1 | | 8.125 | | 2/15/12 | | | 3,225 | | | | 3,426,563 |
Elan Financial PLC (Ireland), Sr. Notes, 144A | | B3 | | 7.75 | | 11/15/11 | | | 7,450 | (j) | | | 6,965,750 |
Fresenius Med. Care Capital Trust, Gtd. Notes | | B1 | | 7.875 | | 6/15/11 | | | 110 | | | | 117,150 |
HCA Inc., | | | | | | | | | | | | | |
Deb. | | Ba2 | | 7.50 | | 11/15/95 | | | 1,500 | | | | 1,433,702 |
Notes | | Ba2 | | 8.85 | | 1/1/07 | | | 4,632 | | | | 4,776,667 |
Notes | | Ba2 | | 5.50 | | 12/1/09 | | | 4,800 | | | | 4,740,653 |
Notes | | Ba2 | | 8.70 | | 2/10/10 | | | 2,650 | | | | 2,886,526 |
Notes | | Ba2 | | 8.75 | | 9/1/10 | | | 3,300 | | | | 3,649,790 |
Notes | | Ba2 | | 9.00 | | 12/15/14 | | | 5,500 | | | | 6,435,110 |
Notes | | Ba2 | | 6.375 | | 1/15/15 | | | 4,000 | (g) | | | 4,043,336 |
Notes | | Ba2 | | 7.69 | | 6/15/25 | | | 3,290 | (g) | | | 3,416,372 |
HEALTHSOUTH Corp., | | | | | | | | | | | | | |
Notes | | NR | | 7.625 | | 6/1/12 | | | 90 | | | | 91,350 |
Sr. Notes | | NR | | 8.50 | | 2/1/08 | | | 4,600 | (g) | | | 4,634,500 |
Iasis Healthcare Capital Corp. LLC, Sr. Sub. Notes | | B3 | | 8.75 | | 6/15/14 | | | 2,550 | | | | 2,677,500 |
Inverness Medical Innovations, Inc., Sr. Sub. Notes | | Caa3 | | 8.75 | | 2/15/12 | | | 3,475 | | | | 3,527,125 |
Medco Health Solutions, Inc., Sr. Notes | | Ba1 | | 7.25 | | 8/15/13 | | | 3,370 | | | | 3,701,999 |
MedQuest, Inc., Gtd. Notes | | Caa1 | | 11.875 | | 8/15/12 | | | 4,385 | | | | 4,231,525 |
Omega Healthcare Investors, Inc., Notes | | B1 | | 6.95 | | 8/1/07 | | | 3,325 | | | | 3,420,594 |
Omnicare Inc., | | | | | | | | | | | | | |
Notes | | Ba3 | | 6.875 | | 12/15/15 | | | 5,500 | | | | 5,582,500 |
Sr. Sub. Notes | | Ba3 | | 6.125 | | 6/1/13 | | | 650 | | | | 638,625 |
See Notes to Financial Statements.
| | |
| Dryden High Yield Fund, Inc. | | 21 |
Portfolio of Investments
as of December 31, 2005 Cont’d.
| | | | | | | | | | | | | |
| Description | | Moody’s
Rating
(Unaudited) | | Interest
Rate | | Maturity
Date | | Principal
Amount (000) | | | Value (Note 1) |
| | | | | | | | | | | | | | |
Select Medical Corp.,
Sr. Sub. Notes, 144A | | B3 | | 7.625 | | 2/1/15 | | $ | 1,425 | | | $ | 1,371,563 |
Senior Housing Trust, Sr. Notes | | Ba2 | | 8.625 | | 1/15/12 | | | 3,675 | | | | 4,024,125 |
Skilled Healthcare Group Inc., Sr. Notes, 144A | | Caa1 | | 11.00 | | 1/15/14 | | | 4,750 | | | | 4,797,500 |
Tenet Healthcare Corp., Sr. Notes, 144A | | B3 | | 9.25 | | 2/1/15 | | | 3,320 | (g) | | | 3,295,100 |
Vanguard Health Holdings Co. II LLC, Sr. Sub. Notes, 144A | | Caa1 | | 9.00 | | 10/1/14 | | | 6,400 | | | | 6,800,000 |
Ventas Realty LP, | | | | | | | | | | | | | |
Sr. Notes | | Ba2 | | 8.75 | | 5/1/09 | | | 4,000 | | | | 4,320,000 |
Sr. Notes | | Ba2 | | 9.00 | | 5/1/12 | | | 5,950 | | | | 6,783,000 |
Warner Chilcott Corp.,
Sr. Sub. Notes, 144A | | Caa1 | | 8.75 | | 2/1/15 | | | 11,185 | | | | 10,290,199 |
| | | | | | | | | | | | |
|
|
| | | | | | | | | | | | | | 128,026,698 |
| | | | |
Lodging & Leisure 4.1% | | | | | | | | | | | |
Felcor Lodging LP, | | | | | | | | | | | | | |
Gtd. Notes | | B1 | | 9.00 | | 6/1/11 | | | 4,825 | (g) | | | 5,283,375 |
Sr. Notes | | B1 | | 8.83(k) | | 6/1/11 | | | 1,765 | (g) | | | 1,835,600 |
Felcor Suites LP, Gtd. Notes | | B1 | | 7.625 | | 10/1/07 | | | 3,425 | | | | 3,502,063 |
Gaylord Entertainment Co., Sr. Notes | | B3 | | 8.00 | | 11/15/13 | | | 2,175 | | | | 2,278,313 |
HMH Properties, Inc., Gtd. Notes, Ser. B | | Ba2 | | 7.875 | | 8/1/08 | | | 869 | | | | 878,776 |
Host Marriott LP, | | | | | | | | | | | | | |
Ser. M, | | Ba2 | | 7.00 | | 8/15/12 | | | 6,500 | (g) | | | 6,662,500 |
Gtd. Notes, Ser. 1 | | Ba2 | | 9.50 | | 1/15/07 | | | 7,775 | (g) | | | 8,047,124 |
Sr. Notes | | Ba2 | | 7.125 | | 11/1/13 | | | 5,510 | (g) | | | 5,730,400 |
La Quinta Properties, Inc., | | | | | | | | | | | | | |
Sr. Notes | | Ba2 | | 8.875 | | 3/15/11 | | | 5,950 | | | | 6,463,188 |
Sr. Notes | | Ba2 | | 7.00 | | 8/15/12 | | | 225 | | | | 243,563 |
La Quinta Corp., Notes | | Ba2 | | 7.00 | | 8/15/07 | | | 1,150 | | | | 1,185,938 |
Royal Caribbean Cruises Ltd. (Liberia), | | | | | | | | | | | | | |
Deb. | | Ba1 | | 7.50 | | 10/15/27 | | | 875 | (j) | | | 937,344 |
Sr. Notes | | Ba1 | | 6.875 | | 12/1/13 | | | 7,590 | (j) | | | 8,038,872 |
Sr. Notes | | Ba1 | | 8.75 | | 02/2/11 | | | 850 | (j) | | | 960,500 |
Starwood Hotels & Resorts Worldwide, Inc., | | | | | | | | | | | | | |
Deb. | | Ba1 | | 7.375 | | 11/15/15 | | | 3,615 | | | | 3,922,275 |
See Notes to Financial Statements.
| | |
| 22 | | Visit our website at www.jennisondryden.com |
| | | | | | | | | | | | | |
| Description | | Moody’s
Rating
(Unaudited) | | Interest
Rate | | Maturity
Date | | Principal
Amount (000) | | | Value (Note 1) |
| | | | | | | | | | | | | | |
Gtd. Notes | | Ba1 | | 7.375 | | 5/1/07 | | $ | 10,500 | | | $ | 10,709,999 |
Gtd. Notes | | Ba1 | | 7.875 | | 5/1/12 | | | 390 | | | | 429,975 |
| | | | | | | | | | | | |
|
|
| | | | | | | | | | | | | | 67,109,805 |
| | | | |
Media & Entertainment �� 6.6% | | | | | | | | | | | |
AMC Entertainment, Inc., Sr. Sub. Notes | | B3 | | 8.00 | | 3/1/14 | | | 4,075 | (g) | | | 3,687,875 |
Cinemark Inc., Sr. Sub. Notes | | B3 | | 9.00 | | 2/1/13 | | | 1,150 | (g) | | | 1,216,125 |
Dex Media East LLC, Gtd. Notes | | B1 | | 12.125 | | 11/15/12 | | | 10,690 | | | | 12,507,299 |
Dex Media, Inc., Notes | | B3 | | 8.00 | | 11/15/13 | | | 2,645 | | | | 2,697,900 |
Dex Media West LLC,
Sr. Sub. Notes | | B2 | | 9.875 | | 8/15/13 | | | 7,375 | | | | 8,186,250 |
DirecTv Holdings LLC | | Ba2 | | 6.375 | | 6/15/15 | | | 3,084 | | | | 3,014,610 |
Echostar DBS Corp., | | | | | | | | | | | | | |
Sr. Notes | | Ba3 | | 9.125 | | 1/15/09 | | | 1,697 | | | | 1,775,486 |
Sr. Notes, 144A | | Ba3 | | 6.625 | | 10/1/14 | | | 1,600 | | | | 1,534,000 |
Gray Television, Inc.,
Sr. Sub. Notes | | Ba3 | | 9.25 | | 12/15/11 | | | 6,395 | (g) | | | 6,826,663 |
Intelsat Bermuda Ltd. (Bermuda), Sr. Notes, 144A | | B2 | | 8.25 | | 1/15/13 | | | 8,675 | (j) | | | 8,761,750 |
Intrawest Corp. (Canada), Sr. Notes, 144A | | B1 | | 7.50 | | 10/15/13 | | | 4,475 | (j) | | | 4,530,938 |
Loews Cineplex Entertainment Corp. | | B3 | | 9.00 | | 08/1/14 | | | 2,150 | | | | 2,171,500 |
Medianews Group, Inc., | | | | | | | | | | | | | |
Sr. Sub. Notes | | B2 | | 6.875 | | 10/1/13 | | | 3,825 | | | | 3,657,656 |
Sr. Sub. Notes, 144A | | B2 | | 6.375 | | 4/1/14 | | | 3,175 | | | | 2,928,938 |
Morris Publishing Group LLC, Sr. Sub. Notes | | B1 | | 7.00 | | 8/1/13 | | | 1,460 | | | | 1,377,875 |
New Skies Satellites NV (Netherlands), Bank Loan (cost $584,196; purchased 11/01/04) | | B1 | | 7.582 | | 4/26/11 | | | 584 | (l)(j) | | | 586,873 |
New Skies Satellites NV (Netherlands), | | | | | | | | | | | | | |
Sr. Notes 144A | | B3 | | 9.57(k) | | 11/1/11 | | | 1,725 | (j) | | | 1,794,000 |
Sr. Sub. Notes, 144A | | Caa1 | | 9.125 | | 11/1/12 | | | 1,900 | (g)(j) | | | 2,030,625 |
Quebecor Media, Inc. (Canada), | | | | | | | | | | | | | |
Sr. Disc. Notes, Zero Coupon (until 07/15/06) | | B2 | | 13.75(m) | | 7/15/11 | | | 14,180 | (j) | | | 14,658,574 |
Sr. Notes | | B2 | | 11.125 | | 7/15/11 | | | 1,000 | (j) | | | 1,082,500 |
See Notes to Financial Statements.
| | |
| Dryden High Yield Fund, Inc. | | 23 |
Portfolio of Investments
as of December 31, 2005 Cont’d.
| | | | | | | | | | | | | |
| Description | | Moody’s
Rating
(Unaudited) | | Interest
Rate | | Maturity
Date | | Principal
Amount (000) | | | Value (Note 1) |
| | | | | | | | | | | | | | |
Rainbow National Services LLC, Sr. Notes, 144A | | B3 | | 10.375 | | 9/1/14 | | $ | 325 | | | $ | 364,000 |
RH Donnelley Finance Corp. I, Sr. Sub. Notes | | B2 | | 10.875 | | 12/15/12 | | | 5,675 | | | | 6,398,563 |
Sinclair Broadcast Group, Inc., Sr. Sub. Notes | | B2 | | 8.75 | | 12/15/11 | | | 3,490 | | | | 3,673,225 |
Six Flags, Inc., Sr. Notes | | Caa1 | | 9.625 | | 6/1/14 | | | 2,020 | | | | 1,964,450 |
Vail Resorts, Inc., Sr. Sub. Notes | | B2 | | 6.75 | | 2/15/14 | | | 3,150 | | | | 3,150,000 |
Vertis, Inc., | | | | | | | | | | | | | |
Gtd. Notes, Ser. B | | Caa1 | | 10.875 | | 6/15/09 | | | 1,090 | (g) | | | 1,073,650 |
Sec’d. Notes | | B3 | | 9.75 | | 4/1/09 | | | 5,035 | | | | 5,217,519 |
| | | | | | | | | | | | |
|
|
| | | | | | | | | | | | | | 106,868,844 |
| | | | | |
Metals 3.1% | | | | | | | | | | | | | |
AK Steel Corp., | | | | | | | | | | | | | |
Gtd. Notes | | B1 | | 7.875 | | 2/15/09 | | | 535 | (g) | | | 508,250 |
Gtd. Notes | | B1 | | 7.75 | | 6/15/12 | | | 2,600 | | | | 2,346,500 |
Arch Western Finance LLC, Sr. Notes | | Ba3 | | 6.75 | | 7/1/13 | | | 4,145 | | | | 4,222,719 |
Century Aluminum Co., Sr. Notes | | B1 | | 7.50 | | 8/15/14 | | | 5,030 | (g) | | | 4,954,550 |
Chaparral Steel Co., Sr. Unsec’d. Notes, 144A | | B1 | | 10.00 | | 7/15/13 | | | 2,950 | (g) | | | 3,178,625 |
CSN Islands VII Corp. (Cayman Islands), Gtd. Notes, 144A (cost $1,983,413; purchased 9/5/03) | | BB(a) | | 10.75 | | 9/12/08 | | | 1,990 | (j)(l) | | | 2,201,438 |
Gerdau AmeriSteel Corp. (Canada), Sr. Notes | | Ba3 | | 10.375 | | 7/15/11 | | | 2,500 | (g)(j) | | | 2,756,250 |
Ispat Inland ULC (Canada), Sec’d. Notes | | Ba1 | | 9.75 | | 4/1/14 | | | 3,555 | (j) | | | 4,026,038 |
Metals USA Inc., Sr. Notes, 144A | | B3 | | 11.125 | | 12/1/15 | | | 3,400 | | | | 3,485,000 |
Novelis, Inc., Sr. Notes, 144A | | B1 | | 7.50 | | 2/15/15 | | | 6,970 | | | | 6,499,524 |
Oregon Steel Mills, Inc., Gtd. Notes | | Ba3 | | 10.00 | | 7/15/09 | | | 7,575 | (g) | | | 8,105,249 |
Peabody Energy Corp., Sr. Notes | | Ba3 | | 5.875 | | 4/15/16 | | | 1,600 | (g) | | | 1,558,000 |
Russel Metals, Inc. (Canada), Sr. Notes | | Ba3 | | 6.375 | | 3/1/14 | | | 1,000 | (j) | | | 970,000 |
Ryerson Tull, Inc., Sr. Notes | | B2 | | 8.25 | | 12/15/11 | | | 2,495 | (g) | | | 2,426,388 |
United States Steel LLC Sr. Notes, Ser. B | | Ba2 | | 10.75 | | 8/1/08 | | | 1,700 | | | | 1,878,500 |
Wise Metals Group LLC, Sec’d. Notes | | Caa1 | | 10.25 | | 5/15/12 | | | 1,000 | | | | 760,000 |
| | | | | | | | | | | | |
|
|
| | | | | | | | | | | | | | 49,877,031 |
See Notes to Financial Statements.
| | |
| 24 | | Visit our website at www.jennisondryden.com |
| | | | | | | | | | | | | |
| Description | | Moody’s
Rating
(Unaudited) | | Interest
Rate | | Maturity
Date | | Principal
Amount (000) | | | Value (Note 1) |
| | | | | | | | | | | | | | |
Non Captive Finance 0.7% | | | | | | | | | | | | | |
Galaxy Entertainment Financial Co., Ltd. | | B1 | | 9.875 | | 12/15/12 | | $ | 3,000 | (g) | | $ | 3,045,000 |
Residential Capital Corp. | | Baa3 | | 6.375 | | 6/30/10 | | | 4,550 | | | | 4,623,323 |
Stripes Acquisition LLC/ Susser Finance Corp. Sr. Notes, 144A | | B2 | | 10.625 | | 12/15/13 | | | 3,775 | | | | 3,831,625 |
| | | | | | | | | | | | |
|
|
| | | | | | | | | | | | | | 11,499,948 |
| | | | | |
Packaging 3.0% | | | | | | | | | | | | | |
Berry Plastics Corp., Gtd. Notes | | B3 | | 10.75 | | 7/15/12 | | | 6,395 | | | | 6,874,625 |
Crown Americas LLC, Sr. Notes, 144A | | B1 | | 7.625 | | 11/15/13 | | | 5,550 | | | | 5,758,125 |
Graham Packaging Co., Inc. | | | | | | | | | | | | | |
Sr. Notes, 144A | | Caa1 | | 8.50 | | 10/15/12 | | | 2,875 | (g) | | | 2,831,875 |
Sr. Sub. Notes, 144A | | Caa2 | | 9.875 | | 10/15/14 | | | 4,575 | (g) | | | 4,460,625 |
Greif Brothers Corp.,
Sr. Sub. Notes | | B1 | | 8.875 | | 8/1/12 | | | 10,000 | | | | 10,650,000 |
Owens-Brockway Glass Container, | | | | | | | | | | | | | |
Gtd. Notes | | B1 | | 7.75 | | 5/15/11 | | | 4,160 | (g) | | | 4,342,000 |
Sec’d. Notes | | B1 | | 8.75 | | 11/15/12 | | | 9,355 | | | | 10,056,625 |
Silgan Holdings, Inc.,
Sr. Sub. Notes | | B1 | | 6.75 | | 11/15/13 | | | 3,300 | | | | 3,283,500 |
| | | | | | | | | | | | |
|
|
| | | | | | | | | | | | | | 48,257,375 |
| | | | | |
Paper 2.8% | | | | | | | | | | | | | |
Abitibi-Consolidated, Inc. (Canada), | | | | | | | | | | | | | |
Debs. | | B1 | | 8.85 | | 8/1/30 | | | 2,200 | (g)(j) | | | 1,881,000 |
Notes | | B1 | | 5.25 | | 6/20/08 | | | 2,300 | (g)(j) | | | 2,185,000 |
Notes | | B1 | | 6.00 | | 6/20/13 | | | 1,435 | (g)(j) | | | 1,216,163 |
Sr. Notes | | B1 | | 8.375 | | 4/1/15 | | | 3,550 | (g)(j) | | | 3,399,125 |
Ainsworth Lumber Co., Ltd. (Canada), | | | | | | | | | | | | | |
Sr. Notes, 144A | | B2 | | 6.75 | | 3/15/14 | | | 3,675 | (j) | | | 3,151,313 |
Sr. Notes | | B2 | | 8.28(k) | | 10/1/10 | | | 1,500 | (j) | | | 1,462,500 |
Sr. Notes, 144A | | B2 | | 7.25 | | 10/1/12 | | | 820 | (j) | | | 738,000 |
Caraustar Industries, Inc., Sr. Sub. Notes | | Caa1 | | 9.875 | | 4/1/11 | | | 2,825 | (g) | | | 2,881,500 |
Cascades, Inc. (Canada), Sr. Notes | | Ba3 | | 7.25 | | 2/15/13 | | | 5,200 | (j) | | | 4,732,000 |
See Notes to Financial Statements.
| | |
| Dryden High Yield Fund, Inc. | | 25 |
Portfolio of Investments
as of December 31, 2005 Cont’d.
| | | | | | | | | | | | | |
| Description | | Moody’s
Rating
(Unaudited) | | Interest
Rate | | Maturity
Date | | Principal
Amount (000) | | | Value (Note 1) |
| | | | | | | | | | | | | | |
Cellu Tissue Holdings, Inc., Sec’d. Notes | | B2 | | 9.75 | | 3/15/10 | | $ | 5,000 | | | $ | 4,949,999 |
Domtar Inc, Sr. Notes | | B1 | | 7.875 | | 10/15/11 | | | 740 | | | | 680,800 |
Georgia-Pacific Corp., | | | | | | | | | | | | | |
Deb. | | Ba2 | | 7.375 | | 12/1/25 | | | 1,500 | | | | 1,350,000 |
Notes (cost $1,674,000; purchased 5/13/04) | | Ba2 | | 7.50 | | 5/15/06 | | | 1,600 | (l) | | | 1,610,000 |
Jefferson Smurfit Corp., Gtd. Notes | | B2 | | 7.50 | | 6/1/13 | | | 4,375 | (g) | | | 4,025,000 |
Millar Western Forest Products Ltd. (Canada), Sr. Notes | | B2 | | 7.75 | | 11/15/13 | | | 3,675 | (j) | | | 2,737,875 |
Norampac, Inc. (Canada), Sr. Notes | | Ba2 | | 6.75 | | 6/1/13 | | | 1,500 | (j) | | | 1,447,500 |
Norske Skog Canada (Canada), Sr. Notes | | B1 | | 8.625 | | 6/15/11 | | | 1,000 | (j) | | | 955,000 |
Smurfit-Stone Container Corp., Sr. Notes | | B2 | | 8.375 | | 7/1/12 | | | 3,330 | (g) | | | 3,221,775 |
Tembec Industries, Inc. (Canada), Gtd. Notes | | B3 | | 7.75 | | 3/15/12 | | | 4,755 | (j) | | | 2,543,925 |
| | | | | | | | | | | | |
|
|
| | | | | | | | | | | | | | 45,168,475 |
| | | | | |
Pipelines & Others 3.7% | | | | | | | | | | | | | |
El Paso Corp., Sr. Notes | | Caa1 | | 7.00 | | 5/15/11 | | | 13,210 | | | | 13,110,925 |
El Paso Production Holding Co., Sr. Notes | | B3 | | 7.75 | | 6/1/13 | | | 6,875 | (g) | | | 7,132,813 |
Ferrellgas Partners LP, Sr. Notes | | Ba3 | | 6.75 | | 5/1/14 | | | 750 | | | | 708,750 |
Pacific Energy Partners LP, Sr. Notes | | Ba2 | | 7.125 | | 6/15/14 | | | 2,700 | | | | 2,781,000 |
Tennessee Gas Pipeline Co., | | | | | | | | | | | | | |
Deb. | | B1 | | 7.00 | | 10/15/28 | | | 3,200 | | | | 3,154,416 |
Deb. | | B1 | | 7.625 | | 4/1/37 | | | 8,615 | (g) | | | 9,070,716 |
Deb. (cost $3,852,487; Purchased 12/2/02) | | B1 | | 7.00 | | 3/15/27 | | | 4,355 | (g)(l) | | | 4,430,755 |
TransMontaigne, Inc., Sr. Sub. Notes | | B3 | | 9.125 | | 6/1/10 | | | 1,890 | | | | 1,856,925 |
Williams Cos., Inc., | | | | | | | | | | | | | |
Notes | | B1 | | 7.125 | | 9/1/11 | | | 10,275 | (g) | | | 10,673,156 |
Notes | | B1 | | 8.125 | | 3/15/12 | | | 6,110 | (g) | | | 6,659,900 |
| | | | | | | | | | | | |
|
|
| | | | | | | | | | | | | | 59,579,356 |
See Notes to Financial Statements.
| | |
| 26 | | Visit our website at www.jennisondryden.com |
| | | | | | | | | | | | | |
| Description | | Moody’s
Rating
(Unaudited) | | Interest
Rate | | Maturity
Date | | Principal
Amount (000) | | | Value (Note 1) |
| | | | | | | | | | | | | | |
Retailers 1.8% | | | | | | | | | | | | | |
Asbury Automotive Group, Inc., Sr. Sub. Notes, 144A | | B3 | | 8.00 | | 3/15/14 | | $ | 2,800 | (g) | | $ | 2,674,000 |
GSC Holdings, | | | | | | | | | | | | | |
Gtd. Notes, 144A | | Ba3 | | 7.875 | | 10/1/11 | | | 1,150 | (g) | | | 1,138,500 |
Gtd. Notes, 144A | | Ba3 | | 8.00 | | 10/1/12 | | | 2,440 | (g) | | | 2,293,600 |
JC Penney Co., Inc., | | | | | | | | | | | | | |
Deb. | | Ba1 | | 6.875 | | 10/15/15 | | | 250 | | | | 270,667 |
Deb. | | Ba1 | | 7.40 | | 4/1/37 | | | 585 | | | | 653,570 |
Notes | | Ba1 | | 8.00 | | 3/1/10 | | | 3,650 | | | | 3,997,652 |
Notes | | Ba1 | | 9.00 | | 8/1/12 | | | 425 | | | | 500,040 |
Neiman Marcus Group, Sr. Sub Notes, 144A | | B3 | | 10.375 | | 10/1/15 | | | 3,000 | (g) | | | 3,048,750 |
Pantry, Inc., Sr. Sub. Notes | | B3 | | 7.75 | | 2/15/14 | | | 3,985 | (g) | | | 3,985,000 |
Rite Aid Corp., | | | | | | | | | | | | | |
Sec’d. Notes | | B2 | | 8.125 | | 5/1/10 | | | 5,420 | | | | 5,514,849 |
Sec’d. Notes | | B2 | | 7.50 | | 1/15/15 | | | 2,675 | (g) | | | 2,527,875 |
Sonic Automotive, Inc., Sr. Sub. Notes | | B2 | | 8.625 | | 8/15/13 | | | 1,935 | | | | 1,872,113 |
| | | | | | | | | | | | |
|
|
| | | | | | | | | | | | | | 28,476,616 |
| | | | | |
Technology 5.2% | | | | | | | | | | | | | |
Amkor Technology, Inc., Sr. Notes | | Caa1 | | 7.125 | | 3/15/11 | | | 1,475 | (g) | | | 1,298,000 |
Ampex Corp., Sec’d. Notes, PIK (cost $39,304; purchased 7/15/98) | | NR | | 12.00 | | 8/15/08 | | | 127 | (b)(e)(l) | | | 31,848 |
Avago Technologies Finance Pte (Singapore), | | | | | | | | | | | | | |
Sr. Sub. Notes, 144A | | Caa2 | | 11.875 | | 12/1/15 | | | 4,800 | (g)(j) | | | 4,836,000 |
Sr. Notes, 144A | | B3 | | 10.125 | | 12/1/13 | | | 5,000 | (g)(j) | | | 5,137,500 |
Flextronics Int’l, Ltd. (Singapore), | | | | | | | | | | | | | |
Sr. Sub. Notes, 144A | | Ba2 | | 6.25 | | 11/15/14 | | | 4,300 | (j) | | | 4,240,875 |
Sr. Sub. Notes | | Ba2 | | 6.50 | | 5/15/13 | | | 5,070 | (g)(j) | | | 5,152,388 |
Freescale Semiconductor, Inc., Sr. Notes | | Ba1 | | 7.125 | | 7/15/14 | | | 5,560 | (g) | | | 5,921,400 |
Iron Mountain, Inc., | | | | | | | | | | | | | |
Sr. Sub. Notes | | Caa1 | | 8.625 | | 4/1/13 | | | 6,075 | | | | 6,333,188 |
Nortel Networks Corp. (Canada) | | B3 | | 4.25 | | 9/1/08 | | | 3,070 | (g)(j) | | | 2,878,125 |
Nortel Networks, Ltd. (Canada), Notes | | B3 | | 6.125 | | 2/15/06 | | | 2,720 | (g)(j) | | | 2,720,000 |
See Notes to Financial Statements.
| | |
| Dryden High Yield Fund, Inc. | | 27 |
Portfolio of Investments
as of December 31, 2005 Cont’d.
| | | | | | | | | | | | | |
| Description | | Moody’s
Rating
(Unaudited) | | Interest
Rate | | Maturity
Date | | Principal
Amount (000) | | | Value (Note 1) |
| | | | | | | | | | | | | | |
Sanmina-SCI Corp., | | | | | | | | | | | | | |
Gtd. Notes | | Ba2 | | 10.375 | | 1/15/10 | | $ | 7,290 | | | $ | 8,055,450 |
Sr. Sub. Notes, 144A | | B1 | | 6.75 | | 3/1/13 | | | 1,210 | (g) | | | 1,151,013 |
Seagate Technology Int’l., Gtd. Notes, | | Ba2 | | 8.00 | | 5/15/09 | | | 8,650 | | | | 9,082,500 |
STATS ChipPAC Ltd., Sr. Notes, 144A | | Ba2 | | 6.75 | | 11/15/11 | | | 1,670 | | | | 1,611,550 |
Sungard Data Systems, Inc., | | | | | | | | | | | | | |
Notes, 144A | | B3 | | 8.52(k) | | 8/15/13 | | | 1,750 | | | | 1,811,250 |
Notes, 144A | | Caa1 | | 10.25 | | 8/15/15 | | | 16,690 | (g) | | | 16,689,999 |
Sr. Unsec. Notes, 144A | | B3 | | 9.125 | | 8/15/13 | | | 2,000 | | | | 2,070,000 |
UGS Corp., Sr. Sub. Notes, 144A | | B3 | | 10.00 | | 6/1/12 | | | 2,000 | | | | 2,180,000 |
Unisys Corp., Sr. Notes | | Ba3 | | 8.00 | | 10/15/12 | | | 3,090 | (g) | | | 2,858,250 |
Xerox Corp., Sr. Notes | | Ba2 | | 6.875 | | 8/15/11 | | | 200 | (d)(g) | | | 207,000 |
| | | | | | | | | | | | |
|
|
| | | | | | | | | | | | | | 84,266,336 |
| | | | | |
Telecommunications 5.1% | | | | | | | | | | | | | |
Alamosa Inc., | | | | | | | | | | | | | |
Sr. Notes | | Caa1 | | 11.00 | | 7/31/10 | | | 3,663 | | | | 4,130,033 |
Sr. Notes | | Caa1 | | 8.50 | | 1/31/12 | | | 2,125 | | | | 2,297,656 |
AT&T Corp., | | | | | | | | | | | | | |
Sr. Notes | | A2 | | 9.05 | | 11/15/11 | | | 2,909 | | | | 3,219,754 |
Sr. Notes | | A2 | | 9.75 | | 11/15/31 | | | 2,100 | (g) | | | 2,637,860 |
Bestel SA de CV (Mexico), Sr. Disc. Notes (cost $4,594,620; purchased 5/13/98-7/9/98) | | NR | | 12.75 | | 5/15/05 | | | 4,850 | (b)(e)(j)(l) | | | 824,500 |
Centennial Communications Corp., Sr. Notes | | B3 | | 8.125 | | 2/1/14 | | | 1,775 | | | | 1,801,625 |
Cincinnati Bell, Inc., | | | | | | | | | | | | | |
Gtd. Notes | | B1 | | 7.25 | | 7/15/13 | | | 1,025 | (g) | | | 1,066,000 |
Sr. Sub Notes | | B3 | | 8.375 | | 1/15/14 | | | 1,430 | (g) | | | 1,406,763 |
Citizens Communications Co., | | | | | | | | | | | | | |
Notes | | Ba3 | | 9.25 | | 5/15/11 | | | 3,685 | | | | 4,062,713 |
Sr. Notes | | Ba3 | | 6.25 | | 1/15/13 | | | 5,085 | (g) | | | 4,919,738 |
Dobson Cellular Systems, Inc., | | | | | | | | | | | | | |
Sec’d. Notes, 144A | | B2 | | 8.375 | | 11/1/11 | | | 1,925 | | | | 2,042,906 |
Sec’d. Notes, 144A | | B2 | | 9.00(k) | | 11/1/11 | | | 2,175 | | | | 2,262,000 |
See Notes to Financial Statements.
| | |
| 28 | | Visit our website at www.jennisondryden.com |
| | | | | | | | | | | | | |
| Description | | Moody’s
Rating
(Unaudited) | | Interest
Rate | | Maturity
Date | | Principal
Amount (000) | | | Value (Note 1) |
| | | | | | | | | | | | | | |
Dobson Communications Co., Sr. Notes, 144A | | Caa2 | | 8.40 | | 10/15/12 | | $ | 945 | (g) | | $ | 940,275 |
Eircom Funding (Ireland), Gtd. Notes | | B1 | | 8.25 | | 8/15/13 | | | 2,380 | (j) | | | 2,546,600 |
Hawaiian Telcom Communications, Inc., | | | | | | | | | | | | | |
Sr. Notes, 144A | | B3 | | 9.95(k) | | 5/1/13 | | | 1,650 | | | | 1,592,250 |
Sr. Notes, 144A | | B3 | | 9.75 | | 5/1/13 | | | 1,700 | (g) | | | 1,661,750 |
Sr. Sub. Notes, 144A | | Caa1 | | 12.50 | | 5/1/15 | | | 1,200 | | | | 1,122,000 |
MCI, Inc., | | | | | | | | | | | | | |
Sr. Notes, 144A | | Ba3 | | 7.688 | | 5/1/09 | | | 4,299 | | | | 4,438,718 |
Sr. Notes | | Ba3 | | 8.735 | | 5/1/14 | | | 925 | | | | 1,023,281 |
Qwest Communications Int’l., Inc., Sr. Notes, 144A | | B2 | | 7.50 | | 2/15/14 | | | 6,700 | (g) | | | 6,884,249 |
Qwest Corp., | | | | | | | | | | | | | |
Sr. Notes, 144A | | Ba3 | | 7.875 | | 9/1/11 | | | 3,650 | (g) | | | 3,932,875 |
Sr. Notes, 144A | | Ba3 | | 7.625 | | 6/15/15 | | | 6,525 | (g) | | | 6,981,749 |
Rogers Wireless Communications, Inc. (Canada), | | | | | | | | | | | | | |
Sr. Sec’d. Notes | | Ba3 | | 9.625 | | 5/1/11 | | | 5,100 | (j) | | | 5,865,000 |
Sr. Sec’d. Notes | | Ba3 | | 6.375 | | 3/1/14 | | | 1,200 | (j) | | | 1,203,000 |
Sr. Sub. Notes, 144A | | B2 | | 8.00 | | 12/15/12 | | | 225 | (g)(j) | | | 238,219 |
Rural Cellular Corp.,
Sr. Sub. Notes, 144A | | Caa2 | | 10.04 | | 11/1/12 | | | 2,500 | (g) | | | 2,518,750 |
SBA Communications Corp., Sr. Notes | | Caa1 | | 8.50 | | 12/1/12 | | | 814 | | | | 903,540 |
Suncom Wireless Holdings Inc., Sr. Notes | | Caa1 | | 8.50 | | 6/1/13 | | | 2,140 | | | | 1,990,200 |
Ubiquitel Operating Co., Sr. Notes | | Caa1 | | 9.875 | | 3/1/11 | | | 5,525 | | | | 6,118,938 |
US Unwired, Inc., Sr. Sec’d. Notes, Ser. B | | B2 | | 8.74(k) | | 6/15/10 | | | 1,850 | | | | 1,900,875 |
| | | | | | | | | | | | |
|
|
| | | | | | | | | | | | | | 82,533,817 |
| | | | | |
Tobacco 0.1% | | | | | | | | | | | | | |
RJ Reynolds Tobacco Holdings, Inc., | | | | | | | | | | | | | |
Notes, 144A | | Ba2 | | 6.50 | | 7/15/10 | | | 250 | | | | 248,750 |
Notes, 144A | | Ba2 | | 7.30 | | 7/15/15 | | | 2,000 | (g) | | | 2,040,000 |
| | | | | | | | | | | | |
|
|
| | | | | | | | | | | | | | 2,288,750 |
| | | | | | | | | | | | |
|
|
Total corporate bonds | | | | | | | | | | | | | 1,478,602,298 |
| | | | | | | | | | | | |
|
|
See Notes to Financial Statements.
| | |
| Dryden High Yield Fund, Inc. | | 29 |
Portfolio of Investments
as of December 31, 2005 Cont’d.
| | | | | | | | | | | | | |
| Description | | Moody’s
Rating
(Unaudited) | | Interest
Rate | | Maturity
Date | | Principal
Amount (000) | | | Value (Note 1) |
| | | | | | | | | | | | | | |
SOVEREIGN BONDS 1.5% | | | | | | | | | | | |
Gazprom Oao (Russia), Sr. Notes, 144A | | NR | | 10.50 | | 10/21/09 | | $ | 2,080 | (j) | | $ | 2,408,224 |
Republic of Argentina, Bonds | | B3 | | 3.00 | | 4/30/13 | | | 6,815 | (j) | | | 5,488,801 |
Republic of Brazil, Notes | | Ba3 | | 8.75 | | 2/4/25 | | | 3,650 | (j) | | | 4,033,250 |
Republic of Colombia, Notes | | Ba2 | | 10.00 | | 1/23/12 | | | 4,531 | (g)(j) | | | 5,391,890 |
Republic of Philippines, Notes | | B1 | | 9.375 | | 1/18/17 | | | 6,260 | (j) | | | 7,167,700 |
| | | | | | | | | | | | |
|
|
Total sovereign bonds | | | | | | | | | | | | | 24,489,865 |
| | | | | | | | | | | | |
|
|
| | | | | |
| | | Shares
| | | |
| | | | | | |
COMMON STOCKS 1.4% | | | |
Classic Communications, Inc., 144A
(cost $0; purchased 5/3/99) | | 3,000 | (c)(f)(l) | | 30 |
Color Spot Nurseries, Inc.,
(cost $5,070,366; purchased 12/30/03) | | 57,197 | (c)(f)(l) | | 228,788 |
Firearms Training Systems, Inc. | | 122,000 | (c) | | 119,560 |
IMPSAT Fiber Networks, Inc. | | 118,952 | (c) | | 821,958 |
Kaiser Group Holdings, Inc. | | 10,148 | (c)(d) | | 395,772 |
Liberty Global, Inc., Cl. A | | 76,333 | (c) | | 1,618,276 |
Liberty Global, Inc., Cl. C | | 76,334 | (c) | | 1,717,493 |
Link Energy LLC,
(cost $227,080; purchased 3/1/03) | | 20,001 | (c)(l) | | 400 |
NTL, Inc. | | 12,881 | (c)(g) | | 876,938 |
Peachtree Cable Assoc. Ltd.,
(cost $314,921; purchased 12/10/86) | | 31,559 | (b)(c)(f)(l) | | 59,708 |
Premium Standard Farms, Inc. | | 745,838 | (c) | | 11,157,737 |
Specialty Foods Acquisiton Corp., 144A
(cost $0; purchased 1/7/00) | | 25 | (c)(d)(f)(l) | | 0 |
Sprint Nextel Corp. | | 63,375 | (c) | | 1,480,442 |
Sterling Chemicals, Inc. | | 159 | (c)(d) | | 1,829 |
Telus Corp. | | 108,785 | (c) | | 4,379,684 |
TRISM Inc.,
(cost $0; purchased 3/7/00) | | 27,543 | (b)(c)(d)(l) | | 28 |
Walter Industries, Inc. | | 4,274 | | | 212,503 |
York Research Corp.,
(cost $0; purchased 12/30/02) | | 15,105 | (c)(l) | | 15 |
| | | | | |
|
Total common stocks | | | | | 23,071,161 |
| | | | | |
|
See Notes to Financial Statements.
| | |
| 30 | | Visit our website at www.jennisondryden.com |
| | | | | | |
| Description | | Shares | | | Value (Note 1) |
PREFERRED STOCKS 0.9% | | | | | | |
| | |
Building Materials & Construction | | | | | | |
New Millenium Homes LLC, Ser. A
(cost $0; purchased 5/27/98) | | 2,000 | (b)(d)(e)(f)(l) | | $ | 20 |
| | |
Cable | | | | | | |
Adelphia Communications Corp.,
(cost $1,860,000; purchased 8/8/01) | | 20,000 | (e)(l) | | | 5,000 |
PTV, Inc., Ser. A.
10.00% | | 9 | (e) | | | 19 |
| | | | | |
|
|
| | | | | | | 5,019 |
| | |
Capital Goods | | | | | | |
Eagle-Picher Holdings, Inc.,
11.75% (cost $8,699,886; purchased 2/19/98) | | 1,530 | (b)(e)(l) | | | 153,000 |
| | |
Foods | | | | | | |
AmeriKing, Inc.,
13.00% (cost $13,414; purchased 9/2/99) | | 1,619 | (e)(l) | | | 2 |
| | |
Media & Entertainment 0.7% | | | | | | |
Paxson Communications Corp.,
14.25% | | 1,179 | | | | 10,248,599 |
| | |
Technology 0.2% | | | | | | |
Xerox Corp.,
6.25% | | 28,520 | (d) | | | 3,490,848 |
| | |
Telecommunications | | | | | | |
McLeodUSA, Inc., Ser. A,
2.50% | | 78,235 | (d)(e) | | | 4,694 |
World Access, Inc.,
13.25% (cost $6,500,000; purchased 4/7/98) | | 4,662 | (b)(e)(f)(l) | | | 12 |
| | | | | |
|
|
| | | | | | | 4,706 |
| | | | | |
|
|
Total preferred stocks | | | | | | 13,902,194 |
| | | | | |
|
|
| | |
| Dryden High Yield Fund, Inc. | | 31 |
Portfolio of Investments
as of December 31, 2005 Cont’d.
| | | | | | | | |
| Description | | Expiration
Date | | Warrants | | | Value (Note 1) |
| | | | | | | | | |
WARRANTS(c) | | | | | | | | |
Aladdin Gaming,
(cost $0; purchased 2/18/98) | | 3/1/10 | | 30,000 | (b)(l) | | $ | 30 |
Allegiance Telecom, Inc.,
(cost $0; purchased 1/29/98) | | 2/3/08 | | 14,200 | (b)(l) | | | 14 |
GT Group Telecom, Inc. (Canada), 144A
(cost $0; purchased 1/27/00) | | 2/1/10 | | 8,610 | (b)(d)(j)(l) | | | 9 |
IHF Holdings, Inc.,
(cost $4,375; purchased 9/30/99) | | 9/27/09 | | 4,375 | (l) | | | 44 |
McLeodUSA, Inc.,
(cost $0; purchased 7/15/97) | | 4/16/07 | | 173,364 | (d)(l) | | | 1,023 |
Price Communications Corp.,
(cost $0; purchased 7/31/97) | | 8/1/07 | | 17,200 | (b)(l) | | | 703,652 |
Republic of Argentina Bond
(cost $494; purchased 12/2/05) | | 12/15/35 | | 10,000 | (d)(l) | | | 574 |
Sterling Chemical, Inc.,
(cost $0; purchased 8/16/96) | | 8/15/08 | | 5,450 | (d)(l) | | | 5 |
TVN Entertainment,
(cost $5,615,000; purchased 10/21/04) | | 1/1/49 | | 46,241 | (b)(l) | | | 26,820 |
Verado Holdings Inc.,
(cost $0; purchased 4/6/98) | | 4/15/08 | | 4,075 | (l) | | | 2,738 |
Versatel Telecom Int’l. NV (Netherlands),
(cost $0; purchased 5/21/98) | | 5/15/08 | | 10,000 | (j)(l) | | | 10 |
Viasystems Group, Inc.,
(cost $3,297,246; purchased 11/17/97) | | 1/10/31 | | 166,335 | (f)(l) | | | 17 |
XM Satellite Radio, Inc., 144A
(cost $3; purchased 3/10/00) | | 3/15/10 | | 345 | (l) | | | 0 |
| | | | | | | |
|
|
Total warrants | | | | | | | | 734,936 |
| | | | | | | |
|
|
Total long-term investments
(cost $1,598,932,947) | | | | | | | | 1,558,128,238 |
| | | | | | | |
|
|
| | | |
| | | | | Shares
| | | |
SHORT-TERM INVESTMENTS 23.3% | | | | | | | | |
MUTUAL FUNDS | | | | | | | | |
Dryden Core Investment Fund- Dryden Short-Term Core Bond Series(i) | | | | 2,016,702 | | | | 20,165,409 |
See Notes to Financial Statements.
| | |
| 32 | | Visit our website at www.jennisondryden.com |
| | | | | | | | | | | | |
| Description | | | | | | | | Shares | | Value (Note 1) | |
Dryden Core Investment Fund - Taxable Money Market Series (includes $339,354,723 of cash collateral received for securities on loan)(h)(i) | | | | | | | | 357,279,751 | | $ | 357,279,751 | |
| | | | | | | | | | |
|
|
|
Total short-term investments
(cost $377,446,773) | | | | | | | | | | | 377,445,160 | |
| | | | | | | | | | |
|
|
|
Total Investments 119.5%
(cost $1,976,379,720; Note 5) | | | | | | | | | | | 1,935,573,398 | |
Liabilities in excess of other assets(n) (19.5)% | | | | | | | | | | | (316,081,948 | ) |
| | | | | | | | | | |
|
|
|
Net Assets 100.0% | | | | | | | | | | $ | 1,619,491,450 | |
| | | | | | | | | | |
|
|
|
144A—Security was purchased pursuant to Rule 144A under the securities Act of 1933 and may not be resold subject to that rule except to qualified institutional buyers. Unless otherwise noted, 144A securities are deemed to be liquid.
LLC—Limited Liability Company.
LP—Limited Partnership.
PIK—Payment-in-kind.
NR—Not Rated by Moody’s or Standard & Poor’s.
| (a) | Standard & Poor’s rating. |
| (b) | Indicates a restricted security. |
| (c) | Non-income producing security. |
| (d) | Consists of more than one class of securities traded together as a unit; generally bonds with attached stock or warrants. |
| (e) | Represents issuer in default on interest payments; non-income producing security. |
| (g) | All or portion of security is on loan. The aggregate market value of such securities is $330,470,356; cash collateral of $339,354,723 (included in liabilities) was received with which the Portfolio purchased highly liquid short-term investments. |
| (h) | Represents security, or portion thereof, purchased with cash collateral received for securities on loan. |
| (i) | Pudential Investments LLC, the manager of the Fund, also serves as manager of the Dryden Core Investment Fund - Taxable Money Market Series and the Dryden Core Investment Fund - Dryden Short-Term Core Bond Series. |
| (j) | US$ denominated foreign bonds. |
| (k) | Floating rate bond. The coupon is indexed to a floating interest rate. The rate shown is the rate at December 31, 2005. |
| (l) | Indicates a security that has been deemed illiquid. The aggregate cost of the illiquid securities is $129,423,018. The aggregate value of $57,568,088 represents 3.55% of net assets. |
| (m) | The rate shown reflects the coupon rate after the step date. |
| (n) | Liabilities in excess of other assets include net unrealized appreciation (depreciation) on foreign currency contracts and credit default swap agreements: |
Forward foreign currency contract outstanding at December 31, 2005:
| | | | | | | | | |
Foreign Currency Purchase Contracts
| | Value at Settlement
Date Payable
| | Current
Value
| | Unrealized
Appreciation
|
Euro Currency,
Expiring 1/24/2006 | | $ | 839,752 | | $ | 841,208 | | $ | 1,456 |
| | |
|
| |
|
| |
|
|
| | |
| Dryden High Yield Fund, Inc. | | 33 |
Portfolio of Investments
as of December 31, 2005 Cont’d.
Credit default swap agreements outstanding at December 31, 2005:
| | | | | | | | | | | | | | |
Counterparty
| | Termination
Date
| | Notional
Amount
| | Fixed
Rate
| | | Underlying
Bond
| | Unrealized
Depreciation
| |
Morgan Stanley Capital Services, Inc. (1) | | 9/20/10 | | $ | 2,500 | | 4.20 | % | | Lear Corporation
8.11%. 5/15/09 | | $ | (215,970 | ) |
| | | | | | | | | | | | |
|
|
|
| (1) | The Portfolio receives the fixed rate and pays the counterparty par in the event that the underlying bond defaults. |
The Fund’s current Prospectus contains a description of Moody’s and Standard & Poor’s ratings.
The industry classification of portfolio holdings and liabilities in excess of assets shown as a percentage of net assets as of December 31, 2005 was as follows:
| | | |
Mutual Funds (including 21.0% of collateral received for securities on loan) | | 23.3 | % |
Electric | | 8.6 | |
Health Care & Pharmaceutical | | 7.9 | |
Media & Entertainment | | 7.3 | |
Chemicals | | 6.6 | |
Automotive | | 6.3 | |
Capital Goods | | 5.2 | |
Technology | | 5.4 | |
Telecommunications | | 5.1 | |
Gaming | | 5.1 | |
Lodging & Leisure | | 4.1 | |
Energy-Other | | 3.7 | |
Pipelines & Other | | 3.7 | |
Cable | | 3.1 | |
Metals | | 3.1 | |
Packaging | | 3.0 | |
Paper | | 2.8 | |
Foods | | 2.2 | |
Aerospace/Defense | | 2.1 | |
Retailers | | 1.8 | |
Building Materials & Construction | | 1.7 | |
Sovereign Bonds | | 1.5 | |
Common Stocks | | 1.4 | |
Consumer | | 1.2 | |
Asset Backed Securities | | 1.1 | |
Airlines | | 0.9 | |
Non Captive Finance | | 0.7 | |
Banking | | 0.5 | |
Tobacco | | 0.1 | |
| | |
|
|
| | | 119.5 | |
Liabilities in excess of other assets | | (19.5 | ) |
| | |
|
|
| | | 100.0 | % |
| | |
|
|
See Notes to Financial Statements.
| | |
| 34 | | Visit our website at www.jennisondryden.com |
Financial Statements
| | |
| DECEMBER 31, 2005 | | ANNUAL REPORT |
Dryden High Yield Fund, Inc.
Statement of Assets and Liabilities
as of December 31, 2005
| | | | |
Assets | | | | |
Investments, at value, including securities on loan of $330,470,356: | | | | |
Unaffiliated investments (cost $1,598,932,947) | | $ | 1,558,128,238 | |
Affiliated investments (cost $377,446,773) | | | 377,445,160 | |
Foreign currency, at value (cost $811,681) | | | 801,814 | |
Dividends and interest receivable | | | 31,178,829 | |
Receivable for Fund shares sold | | | 154,957 | |
Prepaid expenses | | | 66,255 | |
Unrealized appreciation on forward currency contract | | | 1,456 | |
| | |
|
|
|
Total assets | | | 1,967,776,709 | |
| | |
|
|
|
| |
Liabilities | | | | |
Payable to broker for collateral for securities on loan | | | 339,354,723 | |
Payable for Fund shares reacquired | | | 3,954,048 | |
Dividends payable | | | 1,334,585 | |
Accrued expenses | | | 674,148 | |
Payable to custodian | | | 699,579 | |
Management fee payable | | | 640,954 | |
Distribution fee payable | | | 491,762 | |
Payable for investments purchased | | | 419,175 | |
Transfer agent fee payable | | | 461,143 | |
Unrealized depreciation on swap agreements | | | 215,970 | |
Deferred directors’ fees | | | 39,172 | |
| | |
|
|
|
Total liabilities | | | 348,285,259 | |
| | |
|
|
|
| |
Net Assets | | $ | 1,619,491,450 | |
| | |
|
|
|
| | | | | |
Net assets were comprised of: | | | | |
Common stock, at par | | $ | 2,859,505 | |
Paid-in capital in excess of par | | | 2,928,616,240 | |
| | |
|
|
|
| | | | 2,931,475,745 | |
Undistributed net investment income | | | 112,801 | |
Accumulated net realized loss on investments and foreign currency transactions | | | (1,271,066,392 | ) |
Net unrealized depreciation on investments and foreign currencies | | | (41,030,704 | ) |
| | |
|
|
|
Net assets, December 31, 2005 | | $ | 1,619,491,450 | |
| | |
|
|
|
See Notes to Financial Statements.
| | |
| 36 | | Visit our website at www.jennisondryden.com |
| | | |
Class A | | | |
Net asset value and redemption price per share | | | |
($1,251,927,438 ÷ 220,979,186 shares of common stock issued and outstanding) | | $ | 5.67 |
Maximum sales charge (4.50% of offering price) | | | .27 |
| | |
|
|
Maximum offering price to public | | $ | 5.94 |
| | |
|
|
| |
Class B | | | |
Net asset value, offering price and redemption price per share | | | |
($281,304,442 ÷ 49,738,441 shares of common stock issued and outstanding) | | $ | 5.66 |
| | |
|
|
| |
Class C | | | |
Net asset value, offering price and redemption price per share | | | |
($62,126,712 ÷ 10,982,969 shares of common stock issued and outstanding) | | $ | 5.66 |
| | |
|
|
| |
Class R | | | |
Net asset value, offering price and redemption price per share | | | |
($2,466 ÷ 435 shares of common stock issued and outstanding) | | $ | 5.67 |
| | |
|
|
| |
Class Z | | | |
Net asset value, offering price and redemption price per share | | | |
($24,130,392 ÷ 4,249,485 shares of common stock issued and outstanding) | | $ | 5.68 |
| | |
|
|
See Notes to Financial Statements.
| | |
| Dryden High Yield Fund, Inc. | | 37 |
Statement of Operations
Year Ended December 31, 2005
| | | | |
Net Investment Income | | | | |
Income | | | | |
Unaffiliated interest | | $ | 135,740,066 | |
Unaffiliated dividends (net of foreign withholding taxes of $2,796) | | | 2,930,509 | |
Affiliated dividend income | | | 1,757,903 | |
Affiliated income from securities loaned, net | | | 728,557 | |
| | |
|
|
|
Total income | | | 141,157,035 | |
| | |
|
|
|
| |
Expenses | | | | |
Management fee | | | 8,139,315 | |
Distribution fee—Class A | | | 3,218,524 | |
Distribution fee—Class B | | | 2,853,376 | |
Distribution fee—Class C | | | 531,857 | |
Distribution fee—Class R | | | 7 | |
Transfer agent’s fee and expenses (including affiliated expense of $1,952,000) | | | 2,440,000 | |
Custodian’s fees and expenses | | | 400,000 | |
Reports to shareholders | | | 275,000 | |
Registration fees | | | 65,000 | |
Insurance | | | 61,000 | |
Directors’ fees | | | 58,000 | |
Legal fees and expenses | | | 27,000 | |
Audit fee | | | 23,000 | |
Miscellaneous | | | 26,597 | |
| | |
|
|
|
Total expenses | | | 18,118,676 | |
| | |
|
|
|
Net investment income | | | 123,038,359 | |
| | |
|
|
|
|
Realized And Unrealized Gain (Loss) On Investments, Foreign Currency Transactions And Swaps | |
Net realized gain (loss) on: | | | | |
Investment transactions | | | (11,750,912 | ) |
Foreign currency transactions | | | 196,471 | |
Swaps | | | 26,542 | |
| | |
|
|
|
| | | | (11,527,899 | ) |
| | |
|
|
|
Net change in unrealized appreciation (depreciation) on: | | | | |
Investments | | | (64,900,209 | ) |
Foreign currencies | | | 9,345 | |
Swaps | | | (215,970 | ) |
| | |
|
|
|
| | | | (65,106,834 | ) |
| | |
|
|
|
Net loss on investments, foreign currency transactions and swaps | | | (76,634,733 | ) |
| | |
|
|
|
Net Increase In Net Assets Resulting From Operations | | $ | 46,403,626 | |
| | |
|
|
|
See Notes to Financial Statements.
| | |
| 38 | | Visit our website at www.jennisondryden.com |
Statement of Changes in Net Assets
| | | | | | | | |
| | | Year Ended December 31,
| |
| | | 2005 | | | 2004 | |
Increase (Decrease) In Net Assets | | | | | | | | |
Operations | | | | | | | | |
Net investment income | | $ | 123,038,359 | | | $ | 137,631,619 | |
Net realized gain (loss) on investments and foreign currency transactions | | | (11,527,899 | ) | | | 25,184,460 | |
Net change in unrealized appreciation (depreciation) of investments and foreign currencies | | | (65,106,834 | ) | | | 20,342,163 | |
| | |
|
|
| |
|
|
|
Net increase in net assets resulting from operations | | | 46,403,626 | | | | 183,158,242 | |
| | |
|
|
| |
|
|
|
| | |
Dividends from net investment income (Note 1) | | | | | | | | |
Class A | | | (95,762,363 | ) | | | (96,111,579 | ) |
Class B | | | (26,303,722 | ) | | | (37,049,411 | ) |
Class C | | | (4,909,702 | ) | | | (6,004,591 | ) |
Class R | | | (105 | ) | | | — | |
Class Z | | | (2,247,078 | ) | | | (2,469,824 | ) |
| | |
|
|
| |
|
|
|
| | | | (129,222,970 | ) | | | (141,635,405 | ) |
| | |
|
|
| |
|
|
|
| | |
Fund share transactions (net of share conversions) (Note 6) | | | | | | | | |
Net proceeds from shares sold | | | 179,013,491 | | | | 133,355,723 | |
Net asset value of shares issued in reinvestment of dividends | | | 71,944,019 | | | | 75,381,490 | |
Cost of shares reacquired | | | (479,150,992 | ) | | | (453,535,998 | ) |
| | |
|
|
| |
|
|
|
Net decrease in net assets from Fund share transactions | | | (228,193,482 | ) | | | (244,798,785 | ) |
| | |
|
|
| |
|
|
|
Total decrease | | | (311,012,826 | ) | | | (203,275,948 | ) |
| | |
Net Assets | | | | | | | | |
Beginning of year | | | 1,930,504,276 | | | | 2,133,780,224 | |
| | |
|
|
| |
|
|
|
End of year(a) | | $ | 1,619,491,450 | | | $ | 1,930,504,276 | |
| | |
|
|
| |
|
|
|
(a) Includes undistributed net investment income of: | | $ | 112,801 | | | $ | — | |
| | |
|
|
| |
|
|
|
See Notes to Financial Statements.
| | |
| Dryden High Yield Fund, Inc. | | 39 |
Notes to Financial Statements
Dryden High Yield Fund, Inc. (the “Fund”) is registered under the Investment Company Act of 1940 as a diversified, open-end management investment company. The primary investment objective of the Fund is to maximize current income through investment in a diversified portfolio of high yield fixed-income securities which, in the opinion of the Fund’s investment adviser, do not subject the Fund to unreasonable risks. As a secondary investment objective, the Fund seeks capital appreciation but only when consistent with its primary objective. Lower rated or unrated (i.e., high yield) securities are more likely to react to developments affecting market risk (general market liquidity) and credit risk (an issuer’s inability to meet principal and interest payments on its obligations) than are more highly rated securities, which react primarily to movements in the general level of interest rates. The ability of issuers of debt securities held by the Fund to meet their obligations may be affected by economic developments in a specific industry or region.
Note 1. Accounting Policies
The following is a summary of significant accounting policies followed by the Fund in the preparation of its financial statements.
Security Valuation: Securities listed on a securities exchange are valued at the last price on such exchange on the day of valuation or, if there was no sale on such day, at the mean between the last reported bid and asked prices, or at the last bid price on such day in the absence of an asked price. Securities traded via NASDAQ are valued at the official closing price provided by NASDAQ. Securities that are actively traded in the over-the-counter market, including listed securities for which the primary market is believed by Prudential Investments LLC (“PI” or “Manager”) in consultation with the subadvisor, to be over-the-counter, are valued at market value using prices provided by an independent pricing agent or principal market maker. Futures contracts and options thereon traded on a commodities exchange or board of trade are valued at the last sale price at the close of trading on such exchange or board of trade or, if there was no sale on the applicable commodities exchange or board of trade on such day, at the mean between the most recently quoted bid and asked prices on such exchange or board of trade or at the last bid price in the absence of an asked price. Prices may be obtained from independent pricing services which use information provided by market makers or estimates of market values obtained from yield data relating to investments or securities with similar characteristics. Securities for which reliable market quotations are not readily available, or whose values have been affected by events occurring after the close of the security’s foreign market and before the Fund’s normal pricing time, are valued at fair value in accordance with the
| | |
| 40 | | Visit our website at www.jennisondryden.com |
Board of Directors’ approved fair valuation procedures. When determining the fair valuation of securities, some of the factors influencing the valuation include, the nature of any restrictions on disposition of the securities; assessment of the general liquidity of the securities; the issuer’s financial condition and the markets in which it does business; the cost of the investment; the size of the holding and the capitalization of issuer; the prices of any recent transactions or bids/offers for such securities or any comparable securities; any available analyst media or other reports or information deemed reliable by the investment adviser regarding the issuer or the markets or industry in which it operates. Using fair value to price securities may result in a value that is different from the security’s most recent closing price and from the price used by other mutual funds to calculate their net asset values.
Investments in mutual funds are valued at their net asset value as of the close of the New York Stock Exchange on the date of valuation.
Short-term securities which mature in 60 days or less are valued at amortized cost, which approximates market value. The amortized cost method involves valuing a security at its cost on the date of purchase and thereafter assuming a constant amortization to maturity of the difference between the principal amount due at maturity and cost. Short-term securities which mature in more than 60 days are valued at current market quotations.
Restricted Securities: The Fund may hold up to 15% of its net assets in illiquid securities, including those which are restricted as to disposition under securities law (“restricted securities”). Certain issues of restricted securities held by the Fund at the end of the fiscal period may include registration rights under which the Fund may demand registration by the issuer, of which the Fund may bear the cost of such registration. Restricted securities, sometimes referred to as private placements, are valued pursuant to the valuation procedures noted above.
Swap Agreements: The Fund may enter into interest rate swap agreements, forward swap spread lock agreements, and credit default swap agreements. A swap agreement is an agreement to exchange the return generated by one instrument for the return generated by another instrument. Interest rate swap agreements involve the exchange by the Fund with another party of their respective commitments to pay or receive interest. Forward spread lock swap agreements involve commitments to pay or receive a settlement amount calculated as the difference between the swap spread and a fixed spread, multiplied by the notional amount times the duration of the swap.; The swap spread is the difference between the benchmark swap rate (market rate) and the specific Treasury rate. In a credit default swap agreement, one party (the protection buyer) makes a stream of payments to another party (the protection seller)
| | |
| Dryden High Yield Fund, Inc. | | 41 |
Notes to Financial Statements
Cont’d
in exchange for the right to receive a specified payment in the event of a default by a third party, typically corporate issues or sovereign issues of an emerging country, on its obligation. The maximum amount of the payment may equal the notional, at par, of the underlying index or security as a result of a default (or “credit event”). In addition to bearing the risk that the credit event will occur, the Fund could be exposed to market risk due to unfavorable changes in interest rates or in the price of the underlying security or index, the possibility that the fund may be unable to close out its position at the same time or at the same price as if it had purchased comparable publicly traded securities, or that the counterparty may default on it’s obligation to perform. The swaps are valued daily at current market value and any change in value is included in net unrealized appreciation or depreciation on investments. Payments received or paid by the Fund are recorded as realized gains or losses. Risk of loss may exceed amounts recognized on the statements of assets and liabilities. Swap agreements outstanding at period end, if any, are listed on the Schedule of Investments.
Forward currency contracts, written options, short sales, swaps and financial futures contracts involve elements of both market and credit risk in excess of the amounts reflected on the Statement of Assets and Liabilities.
Loan Participations: The Fund may invest in loan participations, another type of restricted security. When the Fund purchases a loan participation, the Fund typically enters into a contractual relationship with the lender or third party selling such participations (“Selling Participant”), but not the borrower. As a result, the Fund assumes the credit risk of the borrower, the selling participant and any other persons interpositioned between the Fund and the borrower (“intermediate participants”). The Fund may not directly benefit from the collateral supporting the senior loan in which it has purchased the loan participation.
Foreign Currency Translation: The books and records of the Fund are maintained in U.S. dollars. Foreign currency amounts are translated into U.S. dollars on the following basis:
(i) market value of investment securities, other assets and liabilities at the closing daily rates of exchange;
(ii) purchases and sales of investment securities, income and expenses at the rates of exchange prevailing on the respective dates of such transactions.
| | |
| 42 | | Visit our website at www.jennisondryden.com |
Although the net assets of the Fund are presented at the foreign exchange rates and market values at the close of the fiscal period, the Fund does not isolate that portion of the results of operations arising as a result of changes in the foreign exchange rates from the fluctuations arising from changes in the market prices of long-term securities held at the end of the fiscal period. Similarly, the Fund does not isolate the effect of changes in foreign exchange rates from the fluctuations arising from changes in the market prices of long-term portfolio securities sold during the fiscal period. Accordingly, realized foreign currency gains (losses) are included in the reported net realized gains (losses) on investment transactions.
Net realized gains or losses on foreign currency transactions represent net foreign exchange gains or losses from the holding of foreign currencies, currency gains (losses) realized between the trade and settlement dates on security transactions, and the difference between the amounts of dividends, interest and foreign withholding taxes recorded on the Fund’s books and the U.S. dollar equivalent amounts actually received or paid. Net unrealized currency gains (losses) from valuing foreign currency denominated assets and liabilities (other than investments) at period-ended exchange rates are reflected as a component of net unrealized appreciation (depreciation) on investments and foreign currencies.
Foreign security and currency transactions may involve certain considerations and risks not typically associated with those of domestic origin as a result of, among other factors, the possibility of political and economic instability or the level of governmental supervision and regulation of foreign securities markets.
Forward Currency Contracts: A forward currency contract is a commitment to purchase or sell a foreign currency at a future date at a negotiated forward rate. The Fund enters into forward currency contracts in order to hedge its exposure to changes in foreign currency exchange rates on its foreign portfolio holdings or on specific receivables and payables denominated in a foreign currency. The contracts are valued daily at current forward exchange rates and any unrealized gain or loss is included in net unrealized appreciation (depreciation) on investments and foreign currencies. Gain or loss is realized on the settlement date of the contract equal to the difference between the settlement value of the original and renegotiated forward contracts. This gain or loss, if any, is included in net realized gain or loss on foreign currency transactions. Risks may arise upon entering into these contracts from the potential inability of the counterparties to meet the terms of their contracts.
Forward currency contracts involve elements of both market and credit risk in excess of the amounts reported on the Statement of Assets and Liabilities.
| | |
| Dryden High Yield Fund, Inc. | | 43 |
Notes to Financial Statements
Cont’d
Securities Lending: The Fund may lend its portfolio securities to broker-dealers. The loans are secured by collateral at least equal at all times to the market value of the securities loaned. Loans are subject to termination at the option of the borrower or the Fund. Upon termination of the loan, the borrower will return to the lender securities identical to the loaned securities. Should the borrower of the securities fail financially, the Fund has the right to repurchase the securities using the collateral in the open market. The Fund recognizes income, net of any rebate and securities lending agent fees, for lending its securities in the form of fees or interest on the investment of any cash received as collateral. The Fund also continues to receive interest and dividends or amounts equivalent thereto, on the securities loaned and recognizes any unrealized gain or loss in the market price of the securities loaned that may occur during the term of the loan.
Securities Transactions and Net Investment Income: Securities transactions are recorded on the trade date. Realized gains and losses on sales of investments are calculated on the identified cost basis. Dividend income is recorded on the ex-dividend date and interest income, including amortization of premium and accretion of discount on debt securities, as required, is recorded on the accrual basis. Expenses are recorded on the accrual basis which may require the use of certain estimates by management.
Net investment income (loss) (other than distribution fees which are charged directly to the respective class) and unrealized and realized gains and losses are allocated daily to each class of shares based upon the relative proportion of net assets of each class at the beginning of the day.
Taxes: For federal income taxes purposes, it is Fund’s policy to continue to meet the requirements of the Internal Revenue Code applicable to regulated investment companies and to distribute all of its taxable net income and capital gains, if any, to its shareholders. Therefore, no federal income tax provision is required.
Dividends and Distributions: The Fund declares daily and pays dividends of net investment income monthly and makes distributions of net realized capital and currency gains, if any, annually. Dividends and distributions to shareholders, which are determined in accordance with federal income tax regulations and which may differ from generally accepted accounting principles, are recorded on the ex-dividend date. Permanent book/tax differences relating to income and gains are reclassified amongst undistributed net investment income, accumulated net realized gain or loss and paid-in capital in excess of par, as appropriate.
| | |
| 44 | | Visit our website at www.jennisondryden.com |
Estimates: The preparation of the financial statements requires management to make estimates and assumptions that affect the reported amounts and disclosures in the financial statements. Actual results could differ from those estimates.
Note 2. Agreements
The Fund has a management agreement with PI. Pursuant to this agreement, PI has responsibility for all investment advisory services and supervises the subadvisor’s performance of such services. PI has entered into a subadvisory agreement with Prudential Investment Management, Inc. (“PIM”). The subadvisory agreement provides that PIM will furnish investment advisory services in connection with the management of the Fund. In connection therewith, PIM is obligated to keep certain books and records of the Fund. PI pays for the services of PIM, the cost of compensation of officers of the Fund, occupancy and certain clerical and bookkeeping costs of the Fund. The Fund bears all other costs and expenses.
The management fee paid to PI is accrued daily and payable monthly, at an annual rate of .50% of 1% of the Fund’s average daily net assets up to $250 million, .475% of 1% of the next $500 million, .45% of 1% of the next $750 million, .425% of 1% of the next $500 million, .40% of 1% of the next $500 million, .375% of 1% of the next $500 million and .35% of 1% of the Fund’s average daily net assets in excess of $3 billion. The effective management fee rate was .46 of 1% for the year ended December 31, 2005.
The Fund has a distribution agreement with Prudential Investment Management Services LLC (“PIMS”), which acts as the distributor of the Class A, Class B, Class C, Class R and Class Z shares of the Fund. The Fund compensates PIMS for distributing and servicing the Fund’s Class A, Class B, Class C and Class R shares, pursuant to plans of distribution (the “Class A, B, C and R Plans”), regardless of expenses actually incurred by PIMS. The distribution fees are accrued daily and payable monthly. No distribution or service fees are paid to PIMS as distributor of the Class Z shares of the Fund.
Pursuant to the Class A, B, C and R Plans, the Fund compensates PIMS for distribution related activities at an annual rate of up to .30 of 1%, .75 of 1%, 1% and .75 of 1% of the average daily net assets of the Class A, B, C and R shares, respectively. For the year ended December 31, 2005, PIMS contractually agreed to limit such fees to .25 of 1%, .75 of 1% and .50 of 1% of the average daily net assets of the Class A, Class C and Class R shares, respectively.
PIMS has advised the Fund that it has received approximately $515,900 in front-end sales charges resulting from sales of Class A shares during the year ended
| | |
| Dryden High Yield Fund, Inc. | | 45 |
Notes to Financial Statements
Cont’d
December 31, 2005. From these fees, PIMS paid such sales charges to affiliated broker-dealers, which in turn paid commissions to salespersons and incurred other distribution costs.
PIMS has advised the Fund that for the year ended December 31, 2005, it received approximately $2,800, $550,000 and $10,000 in contingent deferred sales charges imposed upon redemptions by certain Class A, Class B and Class C shareholders, respectively.
PI, PIMS and PIM are indirect, wholly-owned subsidiaries of Prudential Financial, Inc. (“Prudential”).
The Fund, along with other affiliated registered investment companies (the “Funds”), is a party to a syndicated credit agreement (“SCA”) with two banks. The SCA provides for a commitment of $500 million. Interest on any borrowings under the SCA would be incurred at market rates. For the period from October 29, 2004 through October 28, 2005, the Fund paid a commitment fee of .075 of 1% of the unused portion of the agreement. Effective October 29, 2005, the Funds renewed the SCA with the banks. The commitment under the renewed SCA continues to be $500 million. The Fund pays a commitment fee of .0725 of 1% of the unused portion of the renewed SCA. The commitment fee is accrued daily and paid quarterly and is allocated to the Funds pro-rata based on net assets. The purpose of the SCA is to serve as an alternative source of funding for capital share redemptions. The expiration date of the renewed SCA is October 27, 2006. The Fund did not borrow any amounts pursuant to the SCA during the year ended December 31, 2005.
Note 3. Other Transactions with Affiliates
Prudential Mutual Fund Services LLC (“PMFS”), an affiliate of PI and an indirect, wholly-owned subsidiary of Prudential, serves as the Fund’s transfer agent. Transfer agent’s fees and expenses in the Statement of Operations include certain out-of-pocket expenses paid to non-affiliates, where applicable.
The Fund invests in the Taxable Money Market Series and the Dryden Short-Term Core Bond Series, separate portfolios of Dryden Core Investment Fund, pursuant to an exemptive order received from the Securities and Exchange Commission. Taxable Money Market Series and the Dryden Short-Term Core Bond Series are mutual funds registered under the Investment Company Act of 1940, as amended, and managed by PI.
| | |
| 46 | | Visit our website at www.jennisondryden.com |
Note 4. Portfolio Securities
Purchases and sales of investment securities, other than short-term investments, for the year ended December 31, 2005 were $863,890,539 and $1,031,244,475, respectively.
As of December 31, 2005, the Fund has securities on loan with an aggregate market value of $330,470,356. The Fund received $339,354,723 in cash as collateral for securities on loan which was used to purchase highly liquid short-term investments in accordance with the Fund’s securities lending procedures.
Note 5. Distributions and Tax Information
Distributions to shareholders, which are determined in accordance with federal income tax regulations and which may differ from generally accepted accounting principles, are recorded on the ex-dividend date. In order to present undistributed net investment income (loss), accumulated net realized gains (losses) and paid-in capital in excess of par on the Statement of Assets and Liabilities that more closely represent their tax character, certain adjustments have been made to paid-in-capital in excess of par, undistributed net investment income (loss) and accumulated net realized gain (loss) on investment. For the year ended December 31, 2005, the adjustments were to increase undistributed net investment income and increase accumulated net realized loss on investments and foreign currency transactions by $6,811,744 due to foreign currency reclassification, the difference in the treatment of accreting market discount and premium amortization, swap income and paydowns between financial and tax reporting. Net investment income, net realized gains and net assets were not affected by this change.
For the year ended December 31, 2005 and December 31, 2004, the tax character of dividends paid, as reflected in the Statement of Changes in Net Assets was $129,222,970 and $141,635,405 of ordinary income, respectively.
As of December 31, 2005, distributable earnings on a tax basis of $593,227 of ordinary income.
The United States federal income tax basis of the Fund’s investments and the net unrealized appreciation as of December 31, 2005 were as follows:
| | | | | | | | | | |
Tax Basis
| | Appreciation
| | Depreciation
| | Total
Net Unrealized
Depreciation
| | Other Cost
Basis
Adjustments
| | Adjusted
Net Unrealized
Depreciation
of Investments
|
| $1,984,753,519 | | $61,864,659 | | $111,044,780 | | $49,180,121 | | $(229,337) | | $49,409,458 |
| | |
| Dryden High Yield Fund, Inc. | | 47 |
Notes to Financial Statements
Cont’d
The difference between book basis and tax basis is primarily attributable to the difference in the treatment of market discount, amortization of premiums and wash sales for book and tax purposes.
For federal income tax purposes, the Fund had a capital loss carryforward at December 31, 2005 of approximately $1,259,906,000, of which $137,467,000 expires in 2007, $312,066,000 expires in 2008, $369,236,000 expires in 2009, $386,017,000 expires in 2010 and $25,268,000 expires in 2013. The remaining amount resulted from when the Fund acquired a capital loss carryforward from the merger with Prudential High Yield Total Return Fund, Inc. in the amount of $29,852,000, of which $1,698,000 expires in 2006, $6,981,000 expires in 2007, $8,555,000 expires in 2008 and $12,618,000 expires in 2009, respectively. The future utilization of the acquired built-in losses from Prudential High Yield Total Return Fund, Inc. in the amount of $18,309,338, will be limited under Section 382 of the Internal Revenue Code of 1986, as amended. The annual limitation to be applied to all Section 382 losses will be $3,494,000. Accordingly, no capital gains distribution is expected to be paid to shareholders until net gains have been realized in excess of such allowable amounts. It is uncertain whether the Fund will be able to realize the full benefit prior to the expiration date. In addition, as of December 31, 2005, the Fund elected to treat post- October capital losses of approximately $3,223,000 incurred in the two month period ended December 31, 2005, as having been incurred in the following fiscal year.
Note 6. Capital
The Fund offers Class A, Class B, Class C, Class R and Class Z Shares. Class A shares are subject to a maximum front-end sales charge (FESC) of 4.5% and all investors who purchase Class A shares in the amount of $1 million or more and sell these shares within 12 months of purchase are subject to a contingent deferred sales charge (CDSC) of 1%, including investors who purchase their shares through broker-dealers affiliated with Prudential. Class B shares are sold with a CDSC which declines from 5% to zero depending on the period of time the shares are held. Class B shares automatically convert to Class A shares on a quarterly basis approximately seven years after purchase. Class C shares are subject to a CDSC of 1% if sold within 12 months of purchase. A special exchange privilege is also available for shareholders who qualified to purchase Class A shares at net asset value. Class R and Class Z shares are not subject to any sales or redemption charge and are offered exclusively to a limited group of investors.
| | |
| 48 | | Visit our website at www.jennisondryden.com |
The Fund is authorized to issue 3 billion shares of common stock, $.01 par value per share, divided into five classes, designated Class A, Class B, Class C, Class R and Class Z common stock. Of the authorized shares of common stock of the Fund, 750 million shares are designated Class A common stock, 750 million shares are designated Class B common stock, 750 million shares are designated Class C common stock, 375 million shares are designated Class R common stock and 375 million shares are designated Class Z common stock. As of December 31, 2005, Class R shares were not available to the public and the outstanding shares were seeded and owned by Prudential.
Transactions in shares of common stock were as follows:
| | | | | | | |
Class A
| | Shares
| | | Amount
| |
Year ended December 31, 2005: | | | | | | | |
Shares sold | | 25,831,549 | | | $ | 147,620,981 | |
Shares issued in reinvestment of dividends | | 9,513,870 | | | | 54,534,631 | |
Shares reacquired | | (60,031,009 | ) | | | (344,380,128 | ) |
| | |
|
| |
|
|
|
Net increase (decrease) in shares outstanding before conversion | | (24,685,590 | ) | | | (142,224,516 | ) |
Shares issued upon conversion from Class B | | 20,252,757 | | | | 116,489,971 | |
| | |
|
| |
|
|
|
Net increase (decrease) in shares outstanding | | (4,432,833 | ) | | $ | (25,734,545 | ) |
| | |
|
| |
|
|
|
Year ended December 31, 2004: | | | | | | | |
Shares sold | | 12,360,634 | | | $ | 71,390,483 | |
Shares issued in reinvestment of dividends | | 9,161,500 | | | | 53,029,281 | |
Shares reacquired | | (46,786,778 | ) | | | (270,679,919 | ) |
| | |
|
| |
|
|
|
Net increase (decrease) in shares outstanding before conversion | | (25,264,644 | ) | | | (146,260,155 | ) |
Shares issued upon conversion from Class B | | 15,333,614 | | | | 88,858,239 | |
| | |
|
| |
|
|
|
Net increase (decrease) in shares outstanding | | (9,931,030 | ) | | $ | (57,401,916 | ) |
| | |
|
| |
|
|
|
| | |
| Dryden High Yield Fund, Inc. | | 49 |
Notes to Financial Statements
Cont’d
| | | | | | | |
Class B
| | Shares
| | | Amount
| |
Year ended December 31, 2005: | | | | | | | |
Shares sold | | 2,906,835 | | | $ | 16,977,800 | |
Shares issued in reinvestment of dividends | | 2,183,749 | | | | 12,509,546 | |
Shares reacquired | | (15,788,812 | ) | | | (90,665,190 | ) |
| | |
|
| |
|
|
|
Net increase (decrease) in shares outstanding before conversion | | (10,698,228 | ) | | | (61,177,844 | ) |
Shares reacquired upon conversion into Class A | | (20,267,875 | ) | | | (116,489,971 | ) |
| | |
|
| |
|
|
|
Net increase (decrease) in shares outstanding | | (30,966,103 | ) | | $ | (177,667,815 | ) |
| | |
|
| |
|
|
|
Year ended December 31, 2004: | | | | | | | |
Shares sold | | 6,521,977 | | | $ | 37,767,874 | |
Shares issued in reinvestment of dividends | | 2,968,726 | | | | 17,149,203 | |
Shares reacquired | | (20,238,734 | ) | | | (116,679,071 | ) |
| | |
|
| |
|
|
|
Net increase (decrease) in shares outstanding before conversion | | (10,748,031 | ) | | | (61,761,994 | ) |
Shares reacquired upon conversion into Class A | | (15,360,128 | ) | | | (88,858,239 | ) |
| | |
|
| |
|
|
|
Net increase (decrease) in shares outstanding | | (26,108,159 | ) | | $ | (150,620,233 | ) |
| | |
|
| |
|
|
|
Class C
| | | | | | |
Year ended December 31, 2005: | | | | | | | |
Shares sold | | 746,585 | | | $ | 4,311,636 | |
Shares issued in reinvestment of dividends | | 474,202 | | | | 2,715,167 | |
Shares reacquired | | (4,325,568 | ) | | | (24,820,669 | ) |
| | |
|
| |
|
|
|
Net increase (decrease) in shares outstanding | | (3,104,781 | ) | | $ | (17,793,866 | ) |
| | |
|
| |
|
|
|
Year ended December 31, 2004: | | | | | | | |
Shares sold | | 1,201,251 | | | $ | 6,943,109 | |
Shares issued in reinvestment of dividends | | 557,285 | | | | 3,220,067 | |
Shares reacquired | | (4,472,114 | ) | | | (25,713,475 | ) |
| | |
|
| |
|
|
|
Net increase (decrease) in shares outstanding | | (2,713,578 | ) | | $ | (15,550,299 | ) |
| | |
|
| |
|
|
|
Class R
| | | | | | |
Period ended December 31, 2005:* | | | | | | | |
Shares sold | | 435 | | | $ | 2,500 | |
Shares issued in reinvestment of dividends | | — | | | | — | |
Shares reacquired | | — | | | | — | |
| | |
|
| |
|
|
|
Net increase (decrease) in shares outstanding | | 435 | | | $ | 2,500 | |
| | |
|
| |
|
|
|
| | |
| 50 | | Visit our website at www.jennisondryden.com |
| | | | | | | |
Class Z
| | Shares
| | | Amount
| |
Year ended December 31, 2005: | | | | | | | |
Shares sold | | 1,755,003 | | | $ | 10,100,574 | |
Shares issued in reinvestment of dividends | | 380,085 | | | | 2,184,675 | |
Shares reacquired | | (3,362,015 | ) | | | (19,285,005 | ) |
| | |
|
| |
|
|
|
Net increase (decrease) in shares outstanding | | (1,226,927 | ) | | $ | (6,999,756 | ) |
| | |
|
| |
|
|
|
Year ended December 31, 2004: | | | | | | | |
Shares sold | | 2,981,778 | | | $ | 17,254,257 | |
Shares issued in reinvestment of dividends | | 341,370 | | | | 1,982,939 | |
Shares reacquired | | (6,958,687 | ) | | | (40,463,533 | ) |
| | |
|
| |
|
|
|
Net increase (decrease) in shares outstanding | | (3,635,539 | ) | | $ | (21,226,337 | ) |
| | |
|
| |
|
|
|
* Commenced operations on June 6, 2005. | | | | | | | |
| | |
| Dryden High Yield Fund, Inc. | | 51 |
This Page Intentionally Left Blank
Financial Highlights
| | |
| DECEMBER 31, 2005 | | ANNUAL REPORT |
Dryden High Yield Fund, Inc.
Financial Highlights
| | | | |
| | | Class A
| |
| | | Year Ended
December 31, 2005 | |
Per Share Operating Performance: | | | | |
Net Asset Value, Beginning Of Year | | $ | 5.93 | |
| | |
|
|
|
Income (loss) from investment operations: | | | | |
Net investment income | | | .41 | |
Net realized and unrealized gain (loss) on investment transactions | | | (.24 | ) |
| | |
|
|
|
Total from investment operations | | | .17 | |
| | |
|
|
|
Less Dividends and Distributions | | | | |
Dividends from net investment income | | | (.43 | ) |
Tax return of capital distributions | | | — | |
| | |
|
|
|
Total dividends and distributions | | | (.43 | ) |
| | |
|
|
|
Net asset value, end of year | | $ | 5.67 | |
| | |
|
|
|
Total Return(b): | | | 3.07 | % |
Ratios/Supplemental Data: | | | | |
Net assets, end of year (000) | | $ | 1,251,927 | |
Average net assets (000) | | $ | 1,287,410 | |
Ratios to average net assets: | | | | |
Expenses, including distribution and service (12b-1) fees(c) | | | .90 | % |
Expenses, excluding distribution and service (12b-1) fees | | | .65 | % |
Net investment income | | | 7.09 | % |
For Classes A, B, C and Z shares: | | | | |
Portfolio turnover rate | | | 51 | % |
| (a) | Calculated based upon average shares outstanding during the year. |
| (b) | Total return does not consider the effects of sales loads. Total return is calculated assuming a purchase of shares on the first day and a sale on the last day of each year reported, and includes reinvestment of dividends and distributions. |
| (c) | The distributor of the Fund contractually agreed to limit its distribution and service (12b-1) fees to .25 of 1% of the average daily net assets of the Class A shares. |
See Notes to Financial Statements.
| | |
| 54 | | Visit our website at www.jennisondryden.com |
| | | | | | | | | | | | | | |
| Class A | |
| Year Ended December 31, | |
| 2004 | | | 2003 | | | 2002 | | | 2001(a) | |
| | | | | | | | | | | | | | | |
| $ | 5.80 | | | $ | 4.99 | | | $ | 5.57 | | | $ | 6.20 | |
|
|
| |
|
|
| |
|
|
| |
|
|
|
| | | | | | | | | | | | | | | |
| | .41 | | | | .43 | | | | .47 | | | | .61 | |
| | .14 | | | | .82 | | | | (.57 | ) | | | (.61 | ) |
|
|
| |
|
|
| |
|
|
| |
|
|
|
| | .55 | | | | 1.25 | | | | (.10 | ) | | | — | |
|
|
| |
|
|
| |
|
|
| |
|
|
|
| | | | | | | | | | | | | | | |
| | (.42 | ) | | | (.44 | ) | | | (.48 | ) | | | (.61 | ) |
| | — | | | | — | | | | — | | | | (.02 | ) |
|
|
| |
|
|
| |
|
|
| |
|
|
|
| | (.42 | ) | | | (.44 | ) | | | (.48 | ) | | | (.63 | ) |
|
|
| |
|
|
| |
|
|
| |
|
|
|
| $ | 5.93 | | | $ | 5.80 | | | $ | 4.99 | | | $ | 5.57 | |
|
|
| |
|
|
| |
|
|
| |
|
|
|
| | 9.93 | % | | | 25.66 | % | | | (1.56 | )% | | | (.25 | )% |
| | | | | | | | | | | | | | | |
| $ | 1,336,703 | | | $ | 1,364,999 | | | $ | 1,160,389 | | | $ | 1,323,184 | |
| $ | 1,318,334 | | | $ | 1,268,769 | | | $ | 1,206,048 | | | $ | 1,433,298 | |
| | | | | | | | | | | | | | | |
| | .89 | % | | | .90 | % | | | .90 | % | | | .88 | % |
| | .64 | % | | | .65 | % | | | .65 | % | | | .63 | % |
| | 7.08 | % | | | 7.93 | % | | | 9.13 | % | | | 10.14 | % |
| | | | | | | | | | | | | | | |
| | 55 | % | | | 68 | % | | | 50 | % | | | 77 | % |
See Notes to Financial Statements.
| | |
| Dryden High Yield Fund, Inc. | | 55 |
Financial Highlights
Cont’d
| | | | |
| | | Class B
| |
| | | Year Ended
December 31, 2005 | |
Per Share Operating Performance: | | | | |
Net Asset Value, Beginning Of Year | | $ | 5.92 | |
| | |
|
|
|
Income (loss) from investment operations: | | | | |
Net investment income | | | .38 | |
Net realized and unrealized gain (loss) on investment transactions | | | (.24 | ) |
| | |
|
|
|
Total from investment operations | | | .14 | |
| | |
|
|
|
Less Dividends and Distributions | | | | |
Dividends from net investment income | | | (.40 | ) |
Tax return of capital distributions | | | — | |
| | |
|
|
|
Total dividends and distributions | | | (.40 | ) |
| | |
|
|
|
Net asset value, end of year | | $ | 5.66 | |
| | |
|
|
|
Total Return(b): | | | 2.54 | % |
Ratios/Supplemental Data: | | | | |
Net assets, end of year (000) | | $ | 281,304 | |
Average net assets (000) | | $ | 380,450 | |
Ratios to average net assets: | | | | |
Expenses, including distribution and service (12b-1) fees | | | 1.40 | % |
Expenses, excluding distribution and service (12b-1) fees | | | .65 | % |
Net investment income | | | 6.57 | % |
| (a) | Calculated based upon average shares outstanding during the year. |
| (b) | Total return does not consider the effects of sales loads. Total return is calculated assuming a purchase of shares on the first day and a sale on the last day of each year reported, and includes reinvestment of dividends and distributions. |
See Notes to Financial Statements.
| | |
| 56 | | Visit our website at www.jennisondryden.com |
| | | | | | | | | | | | | | |
| Class B | |
| Year Ended December 31, | |
| 2004 | | | 2003 | | | 2002 | | | 2001(a) | |
| | | | | | | | | | | | | | | |
| $ | 5.79 | | | $ | 4.98 | | | $ | 5.56 | | | $ | 6.19 | |
|
|
| |
|
|
| |
|
|
| |
|
|
|
| | | | | | | | | | | | | | | |
| | .38 | | | | .40 | | | | .44 | | | | .58 | |
| | .14 | | | | .82 | | | | (.57 | ) | | | (.61 | ) |
|
|
| |
|
|
| |
|
|
| |
|
|
|
| | .52 | | | | 1.22 | | | | (.13 | ) | | | (.03 | ) |
|
|
| |
|
|
| |
|
|
| |
|
|
|
| | | | | | | | | | | | | | | |
| | (.39 | ) | | | (.41 | ) | | | (.45 | ) | | | (.58 | ) |
| | — | | | | — | | | | — | | | | (.02 | ) |
|
|
| |
|
|
| |
|
|
| |
|
|
|
| | (.39 | ) | | | (.41 | ) | | | (.45 | ) | | | (.60 | ) |
|
|
| |
|
|
| |
|
|
| |
|
|
|
| $ | 5.92 | | | $ | 5.79 | | | $ | 4.98 | | | $ | 5.56 | |
|
|
| |
|
|
| |
|
|
| |
|
|
|
| | 9.39 | % | | | 25.08 | % | | | (2.07 | )% | | | (.78 | )% |
| | | | | | | | | | | | | | | |
| $ | 477,841 | | | $ | 618,539 | | | $ | 610,615 | | | $ | 801,358 | |
| $ | 545,044 | | | $ | 629,849 | | | $ | 720,123 | | | $ | 965,014 | |
| | | | | | | | | | | | | | | |
| | 1.39 | % | | | 1.40 | % | | | 1.40 | % | | | 1.38 | % |
| | .64 | % | | | .65 | % | | | .65 | % | | | .63 | % |
| | 6.62 | % | | | 7.44 | % | | | 8.60 | % | | | 9.66 | % |
See Notes to Financial Statements.
| | |
| Dryden High Yield Fund, Inc. | | 57 |
Financial Highlights
Cont’d
| | | | |
| | | Class C
| |
| | | Year Ended
December 31, 2005 | |
Per Share Operating Performance: | | | | |
Net Asset Value, Beginning Of Year | | $ | 5.92 | |
| | |
|
|
|
Income (loss) from investment operations: | | | | |
Net investment income | | | .38 | |
Net realized and unrealized gain (loss) on investment transactions | | | (.24 | ) |
| | |
|
|
|
Total from investment operations | | | .14 | |
| | |
|
|
|
Less Dividends and Distributions | | | | |
Dividends from net investment income | | | (.40 | ) |
Tax return of capital distributions | | | — | |
| | |
|
|
|
Total dividends and distributions | | | (.40 | ) |
| | |
|
|
|
Net asset value, end of year | | $ | 5.66 | |
| | |
|
|
|
Total Return(b): | | | 2.54 | % |
Ratios/Supplemental Data: | | | | |
Net assets, end of year (000) | | $ | 62,127 | |
Average net assets (000) | | $ | 70,914 | |
Ratios to average net assets: | | | | |
Expenses, including distribution and service (12b-1) fees(c) | | | 1.40 | % |
Expenses, excluding distribution and service (12b-1) fees | | | .65 | % |
Net investment income | | | 6.57 | % |
| (a) | Calculated based upon average shares outstanding during the year. |
| (b) | Total return does not consider the effects of sales loads. Total return is calculated assuming a purchase of shares on the first day and a sale on the last day of each year reported, and includes reinvestment of dividends and distributions. |
| (c) | The distributor of the Fund contractually agreed to limit its distribution and service (12b-1) fees to .75 of 1% of the average daily net assets of the Class C shares. |
See Notes to Financial Statements.
| | |
| 58 | | Visit our website at www.jennisondryden.com |
| | | | | | | | | | | | | | |
| Class C | |
| Year Ended December 31, | |
| 2004 | | | 2003 | | | 2002 | | | 2001(a) | |
| | | | | | | | | | | | | | | |
| $ | 5.79 | | | $ | 4.98 | | | $ | 5.56 | | | $ | 6.19 | |
|
|
| |
|
|
| |
|
|
| |
|
|
|
| | | | | | | | | | | | | | | |
| | .38 | | | | .40 | | | | .44 | | | | .58 | |
| | .14 | | | | .82 | | | | (.57 | ) | | | (.61 | ) |
|
|
| |
|
|
| |
|
|
| |
|
|
|
| | .52 | | | | 1.22 | | | | (.13 | ) | | | (.03 | ) |
|
|
| |
|
|
| |
|
|
| |
|
|
|
| | | | | | | | | | | | | | | |
| | (.39 | ) | | | (.41 | ) | | | (.45 | ) | | | (.58 | ) |
| | — | | | | — | | | | — | | | | (.02 | ) |
|
|
| |
|
|
| |
|
|
| |
|
|
|
| | (.39 | ) | | | (.41 | ) | | | (.45 | ) | | | (.60 | ) |
|
|
| |
|
|
| |
|
|
| |
|
|
|
| $ | 5.92 | | | $ | 5.79 | | | $ | 4.98 | | | $ | 5.56 | |
|
|
| |
|
|
| |
|
|
| |
|
|
|
| | 9.39 | % | | | 25.08 | % | | | (2.07 | )% | | | (.78 | )% |
| | | | | | | | | | | | | | | |
| $ | 83,412 | | | $ | 97,291 | | | $ | 72,213 | | | $ | 68,382 | |
| $ | 88,295 | | | $ | 90,157 | | | $ | 72,506 | | | $ | 70,073 | |
| | | | | | | | | | | | | | | |
| | 1.39 | % | | | 1.40 | % | | | 1.40 | % | | | 1.38 | % |
| | .64 | % | | | .65 | % | | | .65 | % | | | .63 | % |
| | 6.61 | % | | | 7.42 | % | | | 8.65 | % | | | 9.66 | % |
See Notes to Financial Statements.
| | |
| Dryden High Yield Fund, Inc. | | 59 |
Financial Highlights
Cont’d
| | | | |
| | | Class R
| |
| | | June 6, 2005(a)
through
December 31, 2005 | |
Per Share Operating Performance: | | | | |
Net Asset Value, Beginning Of Period | | $ | 5.75 | |
| | |
|
|
|
Income from investment operations: | | | | |
Net investment income | | | .23 | |
Net realized and unrealized loss on investment transactions | | | (.06 | ) |
| | |
|
|
|
Total from investment operations | | | .17 | |
| | |
|
|
|
Less Dividends and Distributions | | | | |
Dividends from net investment income | | | (.25 | ) |
| | |
|
|
|
Total dividends and distributions | | | (.25 | ) |
| | |
|
|
|
Net asset value, end of period | | $ | 5.67 | |
| | |
|
|
|
Total Return(b): | | | 2.98 | % |
Ratios/Supplemental Data: | | | | |
Net assets, end of period (000) | | $ | 2 | |
Average net assets (000) | | $ | 2 | |
Ratios to average net assets: | | | | |
Expenses, including distribution and service (12b-1) fees(c) | | | 1.15 | %(d) |
Expenses, excluding distribution and service (12b-1) fees | | | .65 | %(d) |
Net investment income | | | 6.75 | %(d) |
| (a) | Commencement of operations. |
| (b) | Total return does not consider the effects of sales loads. Total return is calculated assuming a purchase of shares on the first day and a sale on the last day of each period reported, and includes reinvestment of dividends and distributions. Total returns for periods less than one full year are not annualized. |
| (c) | During the period, the distributor of the Fund contractually agreed to limit its distribution and service (12b-1) fees to .50 of 1% of the average daily net assets of the Class R shares. |
See Notes to Financial Statements.
| | |
| 60 | | Visit our website at www.jennisondryden.com |
This Page Intentionally Left Blank
Financial Highlights
Cont’d
| | | | |
| | | Class Z
| |
| | | Year Ended
December 31, 2005 | |
Per Share Operating Performance: | | | | |
Net Asset Value, Beginning Of Year | | $ | 5.94 | |
| | |
|
|
|
Income (loss) from investment operations: | | | | |
Net investment income | | | .43 | |
Net realized and unrealized gain (loss) on investment transactions | | | (.24 | ) |
| | |
|
|
|
Total from investment operations | | | .19 | |
| | |
|
|
|
Less Dividends and Distributions | | | | |
Dividends from net investment income | | | (.45 | ) |
Tax return of capital distributions | | | — | |
| | |
|
|
|
Total dividends and distributions | | | (.45 | ) |
| | |
|
|
|
Net asset value, end of year | | $ | 5.68 | |
| | |
|
|
|
Total Return(b): | | | 3.32 | % |
Ratios/Supplemental Data: | | | | |
Net assets, end of year (000) | | $ | 24,130 | |
Average net assets (000) | | $ | 29,298 | |
Ratios to average net assets: | | | | |
Expenses, including distribution and service (12b-1) fees | | | .65 | % |
Expenses, excluding distribution and service (12b-1) fees | | | .65 | % |
Net investment income | | | 7.32 | % |
| (a) | Calculated based upon average shares outstanding during the year. |
| (b) | Total return is calculated assuming a purchase of shares on the first day and a sale on the last day of each year reported, and includes reinvestment of dividends and distributions. |
See Notes to Financial Statements.
| | |
| 62 | | Visit our website at www.jennisondryden.com |
| | | | | | | | | | | | | | |
| Class Z | |
| Year Ended December 31, | |
| 2004 | | | 2003 | | | 2002 | | | 2001(a) | |
| | | | | | | | | | | | | | | |
| $ | 5.81 | | | $ | 5.00 | | | $ | 5.58 | | | $ | 6.20 | |
|
|
| |
|
|
| |
|
|
| |
|
|
|
| | | | | | | | | | | | | | | |
| | .42 | | | | .44 | | | | .48 | | | | .63 | |
| | .15 | | | | .82 | | | | (.57 | ) | | | (.60 | ) |
|
|
| |
|
|
| |
|
|
| |
|
|
|
| | .57 | | | | 1.26 | | | | (.09 | ) | | | .03 | |
|
|
| |
|
|
| |
|
|
| |
|
|
|
| | | | | | | | | | | | | | | |
| | (.44 | ) | | | (.45 | ) | | | (.49 | ) | | | (.63 | ) |
| | — | | | | — | | | | — | | | | (.02 | ) |
|
|
| |
|
|
| |
|
|
| |
|
|
|
| | (.44 | ) | | | (.45 | ) | | | (.49 | ) | | | (.65 | ) |
|
|
| |
|
|
| |
|
|
| |
|
|
|
| $ | 5.94 | | | $ | 5.81 | | | $ | 5.00 | | | $ | 5.58 | |
|
|
| |
|
|
| |
|
|
| |
|
|
|
| | 10.20 | % | | | 25.94 | % | | | (1.30 | )% | | | .19 | % |
| | | | | | | | | | | | | | | |
| $ | 32,548 | | | $ | 52,951 | | | $ | 45,609 | | | $ | 42,252 | |
| $ | 32,828 | | | $ | 56,046 | | | $ | 43,494 | | | $ | 42,557 | |
| | | | | | | | | | | | | | | |
| | .64 | % | | | .65 | % | | | .65 | % | | | .63 | % |
| | .64 | % | | | .65 | % | | | .65 | % | | | .63 | % |
| | 7.32 | % | | | 8.17 | % | | | 9.41 | % | | | 10.41 | % |
See Notes to Financial Statements.
| | |
| Dryden High Yield Fund, Inc. | | 63 |
Report of Independent Registered Public Accounting Firm
The Board of Directors and Shareholders of
Dryden High Yield Fund, Inc.
We have audited the accompanying statement of assets and liabilities of Dryden High Yield Fund, Inc. (hereafter referred to as the “Fund”), including the portfolio of investments, as of December 31, 2005, and the related statement of operations for the year then ended, and the statements of changes in net assets and the financial highlights for each of the years in the two-year period then ended. These financial statements and financial highlights are the responsibility of the Fund’s management. Our responsibility is to express an opinion on these financial statements and financial highlights based on our audits. The financial highlights for the years presented prior to the year ended December 31, 2004, were audited by another independent registered public accounting firm, whose report dated February 20, 2004, expressed an unqualified opinion thereon.
We conducted our audits in accordance with the standards of the Public Company Accounting Oversight Board (United States). Those standards require that we plan and perform the audit to obtain reasonable assurance about whether the financial statements and financial highlights are free of material misstatement. An audit includes examining, on a test basis, evidence supporting the amounts and disclosures in the financial statements. Our procedures included confirmation of securities owned as of December 31, 2005, by correspondence with the custodian and brokers or by other appropriate auditing procedures where replies from brokers were not received. An audit also includes assessing the accounting principles used and significant estimates made by management, as well as evaluating the overall financial statement presentation. We believe that our audits provide a reasonable basis for our opinion.
In our opinion, the financial statements and financial highlights referred to above present fairly, in all material respects, the financial position of the Fund as of December 31, 2005, and the results of its operations for the year ended, and the changes in its net assets and the financial highlights for each of the years in the two-year period then ended, in conformity with U.S. generally accepted accounting principles.
New York, New York
February 28, 2006
| | |
| 64 | | Visit our website at www.jennisondryden.com |
Federal Income Tax Information
(unaudited)
We are required by the Internal Revenue Code to advise you within 60 days of the Fund’s fiscal year end (December 31, 2005) as to the federal income tax status of dividends paid by the Fund during such fiscal period. Accordingly, we are advising you that during its fiscal period ended December 31, 2005, the Fund paid dividends for Class A, Class B, Class C, Class R and Class Z shares totaling $.43, $.40, $.40, $.25 and $.45 per share, of ordinary income, which is taxable as such, respectively.
Further, we wish to advise you that 2.23% of the ordinary income dividends paid in the fiscal year ended December 31, 2005 qualified for the corporate dividend received deduction available to corporate taxpayers.
The Fund intends to designate 2.27% of the ordinary income dividends as qualified for the reduced rate tax under The Jobs and Growth Tax Relief Reconciliation Act of 2003.
The Fund intends to designate 99.98% of the ordinary dividends as qualified interest income under The American Jobs Creation Act of 2004.
| | |
| Dryden High Yield Fund, Inc. | | 65 |
Management of the Fund
(Unaudited)
Information pertaining to the Directors of the Fund is set forth below. Directors who are not deemed to be “interested persons” of the Fund, as defined in the Investment Company Act of 1940 (the 1940 Act), are referred to as “Independent Directors.” Directors who are deemed to be “interested persons” of the Fund are referred to as “Interested Directors.” “Fund Complex”† consists of the Fund and any other investment companies managed by PI.
Independent Directors(2)
Linda W. Bynoe (53), Director since 2005 Oversees 88 portfolios in Fund complex
Principal occupations (last 5 years): President and Chief Executive Officer (since March 1995) of Telemat, Ltd. (management consulting); formerly Vice President at Morgan Stanley & Co.
Other Directorships held: Director of Dynegy Inc. (energy services) (since September 2002) and Simon Property Group, Inc. (real estate investment trust) (since May 2003); Anixter International (communication products distributor) (since January 2006); Director (since August 2005) of The High Yield Plus Fund, Inc.
David E.A. Carson (71), Director since 2003(3) Oversees 73 portfolios in Fund complex
Principal occupations (last 5 years): Formerly Director (January 2000 to May 2000), Chairman (January 1999 to December 1999), Chairman and Chief Executive Officer (January 1998 to December 1998) and President, Chairman and Chief Executive Officer (1983-1997) of People’s Bank.
Other Directorships held.(4) Director (since 2004) of The High Yield Plus Fund, Inc.
Robert E. La Blanc (71), Director since 2003(3) Oversees 85 portfolios in Fund complex
Principal occupations (last 5 years): President (since 1981) of Robert E. La Blanc Associates, Inc. (telecommunications).
Other Directorships held:(4) Director of Chartered Semiconductor Manufacturing, Ltd. (since 1998); Computer Associates International, Inc. (software company) (since 2002); FiberNet Telecom Group, Inc. (telecom company) (since 2003); Director (since April 1999) of The High Yield Plus Fund, Inc.
Douglas H. McCorkindale (66), Director since 2003(3) Oversees 85 portfolios in Fund complex
Principal occupations (last 5 years): Chairman (since February 2001), Formerly Chief Executive Officer (June 2000-July 2005) and President (since September 1997-July 2005) of Gannett Co. Inc. (publishing and media); formerly Vice Chairman (March 1984-May 2000) of Gannett Co., Inc.
Other Directorships held:(4) Director of Gannett Co. Inc., Director of Continental Airlines, Inc. (since May 1993); Director of Lockheed Martin Corp. (aerospace and defense) (since May 2001); Director of The High Yield Plus Fund, Inc. (since 1996).
Richard A. Redeker (62), Director since 1995(3) Oversees 85 portfolios in Fund complex and Chairman of the Board (since 2006)
Principal occupations (last 5 years): Management Consultant; Director (since 2001) of Invesmart, Inc. and Director of Penn Tank Lines, Inc. (since 1999).
Other Directorships held:(4) Director (since January 2005) of The High Yield Plus Fund, Inc.
| | |
| 66 | | Visit our website at www.jennisondryden.com |
Robin B. Smith (66), Director since 2003(3) Oversees 85 portfolios in Fund complex
Principal occupations (last 5 years): Chairman of the Board (since January 2003) of Publishers Clearing House (direct marketing); formerly Chairman and Chief Executive Officer (August 1996-January 2003) of Publishers Clearing House.
Other Directorships held:(4) Director of BellSouth Corporation (since 1992). Director (since January 2005) of The High Yield Plus Fund, Inc.
Stephen G. Stoneburn (62), Director since 2003(3) Oversees 85 portfolios in Fund complex
Principal occupations (last 5 years): President and Chief Executive Officer (since June 1996) of Quadrant Media Corp. (a publishing company); formerly President (June 1995-June 1996) of Argus Integrated Media, Inc.; Senior Vice President and Managing Director (January 1993-1995) of Cowles Business Media and Senior Vice President of Fairchild Publications, Inc. (1975-1989).
Other Directorships held:(4) Director (since January 2005) of The High Yield Plus Fund, Inc.
Clay T. Whitehead (67), Director since 2003(3) Oversees 85 portfolios in Fund complex
Principal occupations (last 5 years): President (since 1983) of National Exchange Inc. (new business development firm).
Other Directorships held:(4) Director (since 2000) of The High Yield Plus Fund, Inc.
Interested Directors(1)
Judy A. Rice (58), President since 2003 and Director since 2000(3) Oversees 81 portfolios in Fund complex
Principal occupations (last 5 years): President, Chief Executive Officer, Chief Operating Officer and Officer-in-Charge (since February 2003) of Prudential Investments LLC; Vice President (since February 1999) of Prudential Investment Management Services LLC; President, Chief Executive Officer and Officer-In-Charge (since April 2003) of Prudential Mutual Fund Services LLC; Director (since May 2003) and Executive Vice President (since June 2005) of American Skandia Investment Services, Inc.; formerly Executive Vice President (September 1999-February 2003) of Prudential Investments LLC; Member of Board of Governors of the Money Management Institute.
Other Directorships held:(4) Director (since August 2005) of The High Yield Plus Fund, Inc.
Robert F. Gunia (59), Vice President and Director since 1996(3) Oversees 158 portfolios in Fund complex
Principal occupations (last 5 years): Chief Administrative Officer (since September 1999) and Executive Vice President (since December 1996) of Prudential Investments LLC; President (since April 1999) of Prudential Investment Management Services LLC; Executive Vice President (since March 1999) and Treasurer (since May 2000) of Prudential Mutual Fund Services LLC.
Other Directorships held:(4) Vice President and Director (since May 1989) and Treasurer (since 1999) of The Asia Pacific Fund, Inc., Vice President (since 2004) and Director (since August 2005) of The High Yield Plus Fund, Inc.
Information pertaining to the Officers of the Fund who are not also Directors is set forth below.
Officers(2)
Kathryn L. Quirk (53), Chief Legal Officer since 2005(3)
Principal occupations (last 5 years): Vice President and Corporate Counsel (since September 2004) of Prudential; Executive Vice President, Chief Legal Officer and Secretary (since July 2005) of Prudential Investments LLC and Prudential Mutual Fund Services LLC; formerly Managing Director, General Counsel, Chief Compliance Officer, Chief Risk Officer and Corporate Secretary (1997-2002) of Zurich Scudder Investments, Inc.
| | |
| Dryden High Yield Fund, Inc. | | 67 |
Executive Vice President and Chief Legal Officer (since May 2003) of American Skandia Investment Services, Inc., American Skandia Fund Services, Inc. and American Skandia Advisory Services, Inc.; Director (June 1999-June 2002 and June 2003-present) of ICI Mutual Insurance Company; prior to August 1998, Associate General Counsel of the Dreyfus Corporation (Dreyfus), a subsidiary of Mellon Bank, N.A. (Mellon Bank), and an officer and/or director of various affiliates of Mellon Bank and Dreyfus.
Deborah A. Docs (48), Secretary since 2005(3)
Principal occupations (last 5 years): Vice President and Corporate Counsel (since January 2001) of Prudential; Chief Legal Officer of the High Yield Income Fund, Inc. and The High Yield Plus Fund, Inc.; Vice President (since December 1996) and Assistant Secretary (since March 1999) of PI; formerly Vice President and Assistant Secretary (May 2003-June 2005) of American Skandia Investment Services, Inc.
Jonathan D. Shain (47), Assistant Secretary since 2004(3)
Principal occupations (last 5 years): Vice President and Corporate Counsel (since August 1998) of Prudential; Vice President and Assistant Secretary (since May 2001) of PI; Vice President and Assistant Secretary (since February 2001) of PMFS; formerly Vice President and Assistant Secretary (May 2003-June 2005) of American Skandia Investment Services, Inc.
Claudia DiGiacomo (31), Assistant Secretary since 2005
Principal occupations (last 5 years): Vice President and Corporate Counsel (since January 2005) of Prudential; Vice President and Assistant Secretary of PI (since December 2005); Associate at Sidley Austin Brown Wood LLP (1999-2004).
Helene Gurian (52), Acting Anti-Money Laundering Compliance Officer since 2004(3)
Principal occupations (last 5 years): Vice President, Prudential (since July 1997): Vice President, Compliance (July 1997-January 2001); Vice President, Compliance and Risk Officer, Retail Distribution (January 2001-May 2002); Vice President, Corporate Investigations (May 2002-present) responsible for supervision of Prudential’s fraud investigations, anti-money laundering program and high technology investigation unit.
Lee D. Augsburger (46), Chief Compliance Officer since 2004(3)
Principal occupations (last 5 years): Senior Vice President and Chief Compliance Officer (since April 2003) of PI; Vice President (since November 2000) and Chief Compliance Officer (since October 2000) of Prudential Investment Management, Inc.; Chief Compliance Officer and Senior Vice President (since May 2003) of American Skandia Investment Services, Inc.
Grace C. Torres (46), Treasurer and Principal Financial and Accounting Officer since 1995(3)
Principal occupations (last 5 years): Assistant Treasurer (since March 1999) and Senior Vice President (since September 1999) of PI; Assistant Treasurer (since May 2003) and Vice President (since June 2005) of American Skandia Investment Services, Inc.; Senior Vice President and Assistant Treasurer (since May 2003) of American Skandia Advisory Services, Inc.; formerly Senior Vice President (May 2003-June 2005) of American Skandia Investment Services, Inc.
| | |
| 68 | | Visit our website at www.jennisondryden.com |
| † | The Fund Complex consists of all investment companies managed by PI. The Funds for which PI serves as manager include Jennison Dryden Mutual Funds, Strategic Partners Funds, The Prudential Variable Contract Accounts 2, 10, 11. The Target Portfolio Trust, The Prudential Series Fund, American Skandia Trust, The High Yield Income Fund, Inc., The High Yield Plus Fund, Inc. and Prudential’s Gibraltar Fund, Inc. |
| (1) | “Interested” Director, as defined in the 1940 Act, by reason of employment with the Manager (Prudential Investments LLC or PI), the Subadvisor or the Distributor (Prudential Investment Management Services LLC or PIMS). |
| (2) | Unless otherwise noted, the address of the Directors and Officers is c/o: Prudential Investments LLC, Gateway Center Three, 100 Mulberry Street, Newark, NJ 07102. |
| (3) | There is no set term of office for Directors and Officers. The Independent Directors have adopted a retirement policy, which calls for the retirement of Directors on December 31 of the year in which they reach the age of 75. The table shows the individuals length of service as Director and/or Officer. |
| (4) | This includes only directorships of companies required to register, or file reports with the SEC under the Securities and Exchange Act of 1934 (that is, “public companies”) or other investment companies registered under the 1940 Act. |
Additional Information about the Fund’s Directors is included in the Fund’s Statement of Additional Information which is available without charge, upon request, by calling (800) 521-7466 or (732) 482-7555 (Calling from outside the U.S.)
| | |
| Dryden High Yield Fund, Inc. | | 69 |
Growth of a $10,000 Investment
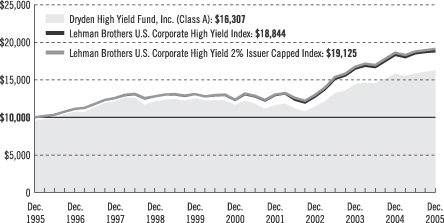
| | | | | | | | | | | | |
| Average Annual Total Returns (With Sales Charges) as of 12/31/05 | | | | |
| | | One Year | | | Five Years | | | Ten Years | | | Since Inception | |
Class A | | –1.57 | % | | 5.95 | % | | 5.01 | % | | 7.40 | % |
Class B | | –2.24 | | | 6.25 | | | 4.94 | | | 8.19 | |
Class C | | 1.58 | | | 6.39 | | | 4.94 | | | 5.72 | |
Class R | | N/A | | | N/A | | | N/A | | | N/A | |
Class Z | | 3.32 | | | 7.24 | | | N/A | | | 5.46 | |
| | | | | | | | | | | | | |
| Average Annual Total Returns (Without Sales Charges) as of 12/31/05 | | | | |
| | | One Year | | | Five Years | | | Ten Years | | | Since Inception | |
Class A | | 3.07 | % | | 6.93 | % | | 5.50 | % | | 7.72 | % |
Class B | | 2.54 | | | 6.39 | | | 4.94 | | | 8.19 | |
Class C | | 2.54 | | | 6.39 | | | 4.94 | | | 5.72 | |
Class R | | N/A | | | N/A | | | N/A | | | N/A | |
Class Z | | 3.32 | | | 7.24 | | | N/A | | | 5.46 | |
Performance data quoted represent past performance. Past performance does not guarantee future results. The investment return and principal value of an investment will fluctuate, so that an investor’s shares, when redeemed, may be worth more or less than their original cost. Current performance may be lower or higher than the past performance data quoted. An investor may obtain performance data as of the most recent month-end by visiting our website at www.jennisondryden.com or by calling (800) 225-1852. The maximum initial sales charge is 4.50%.
The returns in the graph and the tables do not reflect the deduction of taxes that a shareholder would pay on Fund distributions or following the redemption of Fund shares.
| | |
| | | Visit our website at www.jennisondryden.com |
Source: Prudential Investments LLC and Lipper Inc.
Inception dates: Class A, 1/22/90; Class B, 3/29/79; Class C, 8/1/94; and Class Z, 3/1/96.
The graph compares a $10,000 investment in the Dryden High Yield Fund, Inc. (Class A shares) with a similar investment in the Lehman Brothers U.S. Corporate High Yield Index (the Prior Index) and the Lehman Brothers U.S. Corporate High Yield 2% Issuer Capped Index by portraying the initial account values at the beginning of the 10-year period for Class A shares (December 31, 1995) and the account values at the end of the current fiscal year (December 31, 2005) as measured on a quarterly basis. For purposes of the graph, and unless otherwise indicated, it has been assumed that (a) the maximum applicable front-end sales charge was deducted from the initial $10,000 investment in Class A shares; (b) all recurring fees (including management fees) were deducted; and (c) all dividends and distributions were reinvested. The line graph provides information for Class A shares only. As indicated in the tables provided earlier, performance for Class B, C, and Z shares will vary due to the differing charges and expenses applicable to each share class (as indicated in the following paragraphs). Without a distribution and service (12b-1) fee waiver of 0.05% for Class A shares through December 31, 2005, the returns shown in the graph and for Class A shares in the tables would have been lower.
The Prior Index and the Lehman Brothers U.S. Corporate High Yield 2% Issuer Capped Index are an unmanaged index of fixed-rate, noninvestment-grade debt securities with at least one year remaining to maturity. It gives a broad look at how high yield (junk) bonds have performed. The Indices total returns include the reinvestment of all dividends, but do not include the effects of sales charges, operating expenses of a mutual fund, or taxes. The returns for the Index would be lower if they included the effects of sales charges, operating expenses, or taxes. The securities that comprise each Index may differ substantially from the securities in the Fund. These are not the only index that may be used to characterize performance of junk bond funds. Other indexes may portray different comparative performance. Investors cannot invest directly in an index.
Class A shares are subject to a maximum front-end sales charge of 4.50% and a 12b-1 fee of up to 0.30% annually, and all investors who purchase Class A shares in an amount of $1 million or more and sell these shares within 12 months of purchase are subject to a contingent deferred sales charge (CDSC) of 1%. Class B shares are subject to a declining CDSC of 5%, 4%, 3%, 2%, 1%, and 1% respectively for the first six years after purchase and a 12b-1 fee of 1% annually. Approximately seven years after purchase, Class B shares will automatically convert to Class A shares on a quarterly basis. Class C shares purchased are not subject to a front-end sales charge, but charge a CDSC of 1% for Class C shares sold within 12 months from the date of purchase and an annual 12b-1 fee of 1%. Class Z shares are not subject to a sales charge or 12b-1 fees. The returns in the graph and tables reflect the share class expense structure in effect at the close of the fiscal period.
| | |
| Dryden High Yield Fund, Inc. | | |
| | | | |
| n MAIL | | n TELEPHONE | | n WEBSITE |
Gateway Center Three 100 Mulberry Street Newark, NJ 07102 | | (800) 225-1852 | | www.jennisondryden.com |
PROXY VOTING
The Board of Directors of the Fund has delegated to the Fund’s investment subadvisor the responsibility for voting any proxies and maintaining proxy recordkeeping with respect to the Fund. A description of these proxy voting policies and procedures is available without charge, upon request, by calling (800) 225-1852 or by visiting the Securities and Exchange Commission’s website at www.sec.gov. Information regarding how the Fund voted proxies relating to portfolio securities during the most recent 12-month period ended June 30 is available on the Fund’s website at www.jennisondryden.com and on the Commission’s website at www.sec.gov.
DIRECTORS
Linda W. Bynoe • David E.A. Carson • Robert F. Gunia • Robert E. La Blanc • Douglas H. McCorkindale • Richard A. Redeker • Judy A. Rice • Robin B. Smith • Stephen G. Stoneburn • Clay T. Whitehead
OFFICERS
Judy A. Rice, President • Robert F. Gunia, Vice President • Grace C. Torres, Treasurer and Principal Financial and Accounting Officer • Kathryn L. Quirk, Chief Legal Officer • Deborah A. Docs, Secretary • Jonathan D. Shain, Assistant Secretary • Claudia DiGiacomo, Assistant Secretary • Helene Gurian, Acting Anti-Money Laundering Compliance Officer • Lee D. Augsburger, Chief Compliance Officer
| | | | |
| MANAGER | | Prudential Investments LLC | | Gateway Center Three
100 Mulberry Street
Newark, NJ 07102 |
|
| INVESTMENT SUBADVISOR | | Prudential Investment
Management, Inc. | | Gateway Center Two
100 Mulberry Street
Newark, NJ 07102 |
|
| DISTRIBUTOR | | Prudential Investment
Management Services LLC | | Gateway Center Three
100 Mulberry Street
Newark, NJ 07102 |
|
| CUSTODIAN | | The Bank of New York | | One Wall Street
New York, NY 10286 |
|
| TRANSFER AGENT | | Prudential Mutual Fund
Services LLC | | PO Box 8098
Philadelphia, PA 19176 |
|
| INDEPENDENT REGISTERED PUBLIC ACCOUNTING FIRM | | KPMG LLP | | 345 Park Avenue
New York, NY 10154 |
|
| FUND COUNSEL | | Willkie, Farr & Gallagher LLP | | 787 Seventh Avenue
New York, NY 10019 |
An investor should consider the investment objectives, risks, charges, and expenses of the Fund carefully before investing. The prospectus for the Fund contains this and other information about the Fund. An investor may obtain a prospectus by visiting our website at www.jennisondryden.com or by calling (800) 225-1852. The prospectus should be read carefully before investing.
E-DELIVERY
To receive your mutual fund documents on-line, go to www.icsdelivery.com/prudential/funds and enroll. Instead of receiving printed documents by mail, you will receive notification via e-mail when new materials are available. You can cancel your enrollment or change your e-mail address at any time by clicking on the change/cancel enrollment option at the icsdelivery website address.
SHAREHOLDER COMMUNICATIONS WITH DIRECTORS
Shareholders can communicate directly with the Board of Directors by writing to the Chair of the Board, Dryden High Yield Fund, Inc., PO Box 13964, Philadelphia, PA 19176. Shareholders can communicate directly with an individual Director by writing to the same address. Communications are not screened before being delivered to the addressee.
AVAILABILITY OF PORTFOLIO SCHEDULE
The Fund files its complete schedule of portfolio holdings with the Securities and Exchange Commission for the first and third quarters of each fiscal year on Form N-Q. The Fund’s Forms N-Q are available on the Commission’s website at www.sec.gov. The Fund’s Forms N-Q may also be reviewed and copied at the Commission’s Public Reference Room in Washington, D.C. Information on the operation and location of the Public Reference Room may be obtained by calling (800) SEC-0330 (732-0330). The Fund will provide a full list of its portfolio holdings on its website as of the end of each month within approximately 30 days after the end of the month.
|
| The Fund’s Statement of Additional Information contains additional information about the Fund’s Directors and is available without charge, upon request, by calling (800) 225-1852. |
Mutual Funds:
| | | | |
| ARE NOT INSURED BY THE FDIC OR ANY FEDERAL GOVERNMENT AGENCY | | MAY LOSE VALUE | | ARE NOT A DEPOSIT OF OR GUARANTEED BY ANY BANK OR ANY BANK AFFILIATE |

| | | | | | | | | | | | | | |
| | | Dryden High Yield Fund, Inc. | | | | | | | | |
| | | Share Class | | A | | B | | C | | R | | Z | | |
| | | NASDAQ | | PBHAX | | PBHYX | | PRHCX | | N/A | | PHYZX | | |
| | | CUSIP | | 262438104 | | 262438203 | | 262438302 | | 262438500 | | 262438401 | | |
| | | | | | | | | | | | | | | |
MF110E IFS-A114987 Ed. 02/2006
Item 2 – Code of Ethics – – See Exhibit (a)
As of the end of the period covered by this report, the registrant has adopted a code of ethics (the “Section 406 Standards for Investment Companies – Ethical Standards for Principal Executive and Financial Officers”) that applies to the registrant’s Principal Executive Officer and Principal Financial Officer; the registrant’s Principal Financial Officer also serves as the Principal Accounting Officer.
The registrant hereby undertakes to provide any person, without charge, upon request, a copy of the code of ethics. To request a copy of the code of ethics, contact the registrant 973-367-7521, and ask for a copy of the Section 406 Standards for Investment Companies - Ethical Standards for Principal Executive and Financial Officers.
Item 3 – Audit Committee Financial Expert –
The registrant’s Board has determined that Mr. David Carson, member of the Board’s Audit Committee is an “audit committee financial expert,” and that he is “independent,” for purposes of this Item.
Item 4 – Principal Accountant Fees and Services –
(a) Audit Fees
For the fiscal years ended December 31, 2005 and December 31, 2004, KPMG LLP (“KPMG”), the Registrant’s principal accountant, billed the Registrant $22,100 and $22,100, respectively, for professional services rendered for the audit of the Registrant’s annual financial statements or services that are normally provided in connection with statutory and regulatory filings.
(b) Audit-Related Fees
For the fiscal year ended December 31, 2005, KPMG, the Registrant’s principal accountant, billed the Registrant $913 for assurance and related services that are reasonably related to the performance of the audit of the registrant’s financial statements. Professional services rendered included those in connection with additional audit procedures related to the conversion of shareholder accounts. For the fiscal year ended December 31, 2004, KPMG, the Registrant’s principal accountant, did not bill the Registrant for assurance and related services that are reasonably related to the performance of the audit of the registrant’s financial statements.
(c) Tax Fees
None.
(d) All Other Fees
None.
(e) (1) Audit Committee Pre-Approval Policies and Procedures
THE PRUDENTIAL MUTUAL FUNDS
AUDIT COMMITTEE POLICY
on
Pre-Approval of Services Provided by the Independent Accountants
The Audit Committee of each Prudential Mutual Fund is charged with the responsibility to monitor the independence of the Fund’s independent accountants. As part of this responsibility, the Audit Committee must pre-approve any independent accounting firm’s engagement to render audit and/or permissible non-audit services, as required by law. In evaluating a proposed engagement of the independent accountants, the Audit Committee will assess the effect that the engagement might reasonably be expected to have on the accountant’s independence. The Committee’s evaluation will be based on:
| | • | | a review of the nature of the professional services expected to be provided, |
| | • | | a review of the safeguards put into place by the accounting firm to safeguard independence, and |
| | • | | periodic meetings with the accounting firm. |
Policy for Audit and Non-Audit Services Provided to the Funds
On an annual basis, the scope of audits for each Fund, audit fees and expenses, and audit-related and non-audit services (and fees proposed in respect thereof) proposed to be performed by the Fund’s independent accountants will be presented by the Treasurer and the independent accountants to the Audit Committee for review and, as appropriate, approval prior to the initiation of such services. Such presentation shall be accompanied by confirmation by both the Treasurer and the independent accountants that the proposed services will not adversely affect the independence of the independent accountants. Proposed services shall be described in sufficient detail to enable the Audit Committee to assess the appropriateness of such services and fees, and the compatibility of the provision of such services with the auditor’s independence. The Committee shall receive periodic reports on the progress of the audit and other services which are approved by the Committee or by the Committee Chair pursuant to authority delegated in this Policy.
The categories of services enumerated under “Audit Services”, “Audit-related Services”, and “Tax Services” are intended to provide guidance to the Treasurer and the independent accountants as to those categories of services which the Committee believes are generally consistent with the independence of the independent accountants and which the Committee (or the Committee Chair) would expect upon the presentation of specific proposals to pre-approve. The enumerated categories are not intended as an exclusive list of audit, audit-related or tax services which the Committee (or the Committee Chair) would consider for pre-approval.
Audit Services
The following categories of audit services are considered to be consistent with the role of the Fund’s independent accountants:
| | • | | Annual Fund financial statement audits |
| | • | | Seed audits (related to new product filings, as required) |
| | • | | SEC and regulatory filings and consents |
Audit-related Services
The following categories of audit-related services are considered to be consistent with the role of the Fund’s independent accountants:
| | • | | Accounting consultations |
| | • | | Fund merger support services |
| | • | | Agreed Upon Procedure Reports |
| | • | | Other Internal Control Reports |
Individual audit-related services that fall within one of these categories and are not presented to the Audit Committee as part of the annual pre-approval process will be subject to pre-approval by the Committee Chair (or any other Committee member on whom this responsibility has been delegated) so long as the estimated fee for those services does not exceed $50,000.
Tax Services
The following categories of tax services are considered to be consistent with the role of the Fund’s independent accountants:
| | • | | Tax compliance services related to the filing or amendment of the following: |
| | • | | Federal, state and local income tax compliance; and, |
| | • | | Sales and use tax compliance |
| | • | | Timely RIC qualification reviews |
| | • | | Tax distribution analysis and planning |
| | • | | Tax authority examination services |
| | • | | Tax appeals support services |
| | • | | Accounting methods studies |
| | • | | Fund merger support services |
| | • | | Tax consulting services and related projects |
Individual tax services that fall within one of these categories and are not presented to the Audit Committee as part of the annual pre-approval process will be subject to pre-approval by the Committee Chair (or any other Committee member on whom this responsibility has been delegated) so long as the estimated fee for those services does not exceed $50,000.
Other Non-audit Services
Certain non-audit services that the independent accountants are legally permitted to render will be subject to pre-approval by the Committee or by one or more Committee members to whom the Committee has delegated this authority and who will report to the full Committee any pre-approval decisions made pursuant to this Policy. Non-audit services presented for pre-approval pursuant to this paragraph will be accompanied by a confirmation from both the Treasurer and the independent accountants that the proposed services will not adversely affect the independence of the independent accountants.
Proscribed Services
The Fund’s independent accountants will not render services in the following categories of non-audit services:
| | • | | Bookkeeping or other services related to the accounting records or financial statements of the Fund |
| | • | | Financial information systems design and implementation |
| | • | | Appraisal or valuation services, fairness opinions, or contribution-in-kind reports |
| | • | | Internal audit outsourcing services |
| | • | | Management functions or human resources |
| | • | | Broker or dealer, investment adviser, or investment banking services |
| | • | | Legal services and expert services unrelated to the audit |
| | • | | Any other service that the Public Company Accounting Oversight Board determines, by regulation, is impermissible. |
Pre-approval of Non-Audit Services Provided to Other Entities Within the Prudential Fund Complex
Certain non-audit services provided to Prudential Investments LLC or any of its affiliates that also provide ongoing services to the Prudential Mutual Funds will be subject to pre-approval by the Audit Committee. The only non-audit services provided to these entities that will require pre-approval are those related directly to the operations and financial reporting of the Funds. Individual projects that are not presented to the Audit Committee as part of the annual pre-approval process, will be subject to pre-approval by the Committee Chair (or any other Committee member on whom this responsibility has been delegated) so long as the estimated fee for those services does not exceed $50,000. Services presented for pre-approval pursuant to this paragraph will be accompanied by a confirmation from both the Treasurer and the independent accountants that the proposed services will not adversely affect the independence of the independent accountants.
Although the Audit Committee will not pre-approve all services provided to Prudential Investments LLC and its affiliates, the Committee will receive an annual report from the Fund’s independent accounting firm showing the aggregate fees for all services provided to Prudential Investments and its affiliates.
(e) (2) Percentage of services referred to in 4(b)- (4)(d) that were approved by the audit committee –
One hundred percent of the services described in Item 4(b) were approved by the audit committee.
(f) Percentage of hours expended attributable to work performed by other than full time employees of principal accountant if greater than 50%.
Not applicable.
(g) Non-Audit Fees
Not applicable to Registrant for the fiscal years 2005 and 2004. The aggregate non-audit fees billed by KPMG for services rendered to the registrant’s investment adviser and any entity controlling, controlled by, or under common control with the investment adviser that provides ongoing services to the registrant for the fiscal years 2005 and 2004 was $50,087 and $33,500, respectively.
(h) Principal Accountants Independence
Not applicable as KPMG has not provided non-audit services to the registrant’s investment adviser and any entity controlling, controlled by, or under common control with the investment adviser that provides ongoing services to the registrant that were not pre-approved pursuant to Rule 2-01(c)(7)(ii) of Regulation S-X.
Item 5 – Audit Committee of Listed Registrants – Not applicable.
Item 6 – Schedule of Investments – The schedule is included as part of the report to shareholders filed under Item 1 of this Form.
Item 7 – Disclosure of Proxy Voting Policies and Procedures for Closed-End Management Investment Companies – Not applicable.
Item 8 – Portfolio Managers of Closed-End Management Investment Companies – Not applicable.
Item 9 – Purchases of Equity Securities by Closed-End Management Investment Company and Affiliated Purchasers – Not applicable.
Item 10 – Submission of Matters to a Vote of Security Holders – Not applicable.
Item 11 – Controls and Procedures
| | (a) | It is the conclusion of the registrant’s principal executive officer and principal financial officer that the effectiveness of the registrant’s current disclosure controls and procedures (such disclosure controls and procedures having been evaluated within 90 days of the date of this filing) provide reasonable assurance that the information required to be disclosed by the registrant has been recorded, processed, summarized and reported within the time period specified in the Commission’s rules and forms and that the information required to be disclosed by the registrant has been accumulated and communicated to the registrant’s principal executive officer and principal financial officer in order to allow timely decisions regarding required disclosure. |
| | (b) | There has been no significant change in the registrant’s internal control over financial reporting that occurred during the registrant’s most recent fiscal quarter of the period covered by this report that has materially affected, or is likely to materially affect, the registrant’s internal control over financial reporting. |
Item 12 – Exhibits
| | |
(a) (1) | | Code of Ethics – Attached hereto as Exhibit EX-99.CODE-ETH |
| |
(2) | | Certifications pursuant to Section 302 of the Sarbanes-Oxley Act – Attached hereto as Exhibit EX-99.CERT. |
| |
(3) | | Any written solicitation to purchase securities under Rule 23c-1. – Not applicable. |
| | (b) | Certifications pursuant to Section 906 of the Sarbanes-Oxley Act – Attached hereto as Exhibit EX-99.906CERT. |
SIGNATURES
Pursuant to the requirements of the Securities Exchange Act of 1934 and the Investment Company Act of 1940, the registrant has duly caused this report to be signed on its behalf by the undersigned, thereunto duly authorized.
| | |
| (Registrant) Dryden High Yield Fund, Inc. |
| |
| By (Signature and Title)* | | /s/ Deborah A. Docs |
| | Deborah A. Docs |
| | Secretary |
|
| Date February 24, 2006 |
Pursuant to the requirements of the Securities Exchange Act of 1934 and the Investment Company Act of 1940, this report has been signed below by the following persons on behalf of the registrant and in the capacities and on the dates indicated.
| | |
| By (Signature and Title)* | | /s/ Judy A. Rice |
| | Judy A. Rice |
| | President and Principal Executive Officer |
| |
| Date February 24, 2006 | | |
| |
| By (Signature and Title)* | | /s/ Grace C. Torres |
| | Grace C. Torres |
| | Treasurer and Principal Financial Officer |
| |
| Date February 24, 2006 | | |
| * | Print the name and title of each signing officer under his or her signature. |