UNITED STATES
SECURITIES AND EXCHANGE COMMISSION
Washington, D.C. 20549
FORM N-CSR
CERTIFIED SHAREHOLDER REPORT OF REGISTERED
MANAGEMENT INVESTMENT COMPANIES
| | |
Investment Company Act file number: | | 811-02896 |
Dryden High Yield Fund, Inc.
|
| Exact name of registrant as specified in charter |
|
Gateway Center 3, 100 Mulberry Street, Newark, New Jersey 07102 |
| Address of principal executive offices |
Deborah A. Docs
Gateway Center 3,
100 Mulberry Street,
Newark, New Jersey 07102
|
| Name and address of agent for service |
Registrant’s telephone number, including area code: 800-225-1852
Date of fiscal year end: 8/31/2008
Date of reporting period: 8/31/2008
Item 1 – Reports to Stockholders


| | |
| AUGUST 31, 2008 | | ANNUAL REPORT |
Dryden High Yield Fund, Inc.
FUND TYPE
Junk bond
OBJECTIVES
Current income, and capital appreciation as a secondary objective
This report is not authorized for distribution to prospective investors unless preceded or accompanied by a current prospectus.
The views expressed in this report and information about the Fund’s portfolio holdings are for the period covered by this report and are subject to change thereafter.
JennisonDryden, Dryden, Prudential Financial and the Rock Prudential logo are registered service marks of The Prudential Insurance Company of America, Newark, NJ, and its affiliates.

October 15, 2008
Dear Shareholder:
We hope you find the annual report for the Dryden High Yield Fund informative and useful. As a JennisonDryden mutual fund shareholder, you may be thinking about where you can find additional growth opportunities. You could invest in last year’s top-performing asset class and hope that history repeats itself or you could stay in cash while waiting for the “right moment” to invest.
Instead, we believe it is better to take advantage of developing domestic and global investment opportunities through a diversified portfolio of stock and bond mutual funds. A diversified asset allocation offers two potential advantages. It helps you manage downside risk by not being overly exposed to any particular asset class, plus it gives you a better opportunity to have at least some of your assets in the right place at the right time. Your financial professional can help you create a diversified investment plan that may include mutual funds covering all the basic asset classes and that reflects your personal investor profile and tolerance for risk. Keep in mind that diversification and asset allocation do not assure against loss in declining markets.
JennisonDryden Mutual Funds gives you a wide range of choices that can help you make progress toward your financial goals. Our funds offer the experience, resources, and professional discipline of four leading asset managers. They are recognized and respected in the institutional market and by discerning investors for excellence in their respective strategies. JennisonDryden equity funds are advised by Jennison Associates LLC, Quantitative Management Associates LLC (QMA), or PREI® (Prudential Real Estate Investors). Prudential Investment Management, Inc. (PIM) advises the JennisonDryden fixed income and money market funds. Jennison Associates, QMA, and PIM are registered investment advisers and Prudential Financial companies. PREI is a registered investment adviser and a unit of PIM.
Thank you for choosing JennisonDryden Mutual Funds.
Sincerely,

Judy A. Rice, President
Dryden High Yield Fund, Inc.
| | |
| Dryden High Yield Fund, Inc. | | 1 |
Your Fund’s Performance
Fund objectives
The primary investment objective of the Dryden High Yield Fund, Inc. is to maximize current income. As a secondary objective, the Fund seeks capital appreciation, but only when consistent with the Fund’s primary investment objective of current income. There can be no assurance that the Fund will achieve its investment objectives.
Performance data quoted represent past performance. Past performance does not guarantee future results. The investment return and principal value of an investment will fluctuate, so that an investor’s shares, when redeemed, may be worth more or less than their original cost. Current performance may be lower or higher than the past performance data quoted. An investor may obtain performance data as of the most recent month-end by visiting our website at www.jennisondryden.com or by calling (800) 225-1852. Class A and Class L shares have a maximum initial sales charge of 4.50% and 4.25%, respectively. Gross operating expenses: Class A, 0.93%; Class B, 1.38%; Class C, 1.63%; Class L, 1.13%; Class M, 1.63%; Class R, 1.38%; Class X, 1.63%; Class Z, 0.63%. Net operating expenses apply to: Class A, 0.88%; Class B, 1.38%; Class C, 1.38%; Class L, 1.13%; Class M, 1.63%; Class R, 1.13%; Class X, 1.63%; Class Z, 0.63%, after contractual reduction through 12/31/2009.
| | | | | | | | | | | |
| Cumulative Total Returns as of 8/31/08 | | | | | | |
| | | One Year | | | Five Years | | | Ten Years | | | Since Inception1 |
Class A | | 0.86 | % | | 37.64 | % | | 56.30 | % | | — |
Class B | | 0.55 | | | 34.51 | | | 48.95 | | | — |
Class C | | 0.35 | | | 34.23 | | | 48.65 | | | — |
Class L | | 0.61 | | | N/A | | | N/A | | | –1.06% (3/26/07) |
Class M | | 0.28 | | | N/A | | | N/A | | | –1.44 (3/26/07) |
Class R | | 0.64 | | | N/A | | | N/A | | | 15.42 (6/6/05) |
Class X | | 0.30 | | | N/A | | | N/A | | | –1.43 (3/26/07) |
Class Z | | 1.13 | | | 39.38 | | | 60.39 | | | — |
Lehman Brothers U.S. Corporate High Yield 1% Issuer Capped Index2 | | –0.44 | | | 37.68 | | | 71.21 | | | ** |
Prior Index3 | | –0.66 | | | 37.82 | | | 69.92 | | | *** |
Lipper High Current Yield Funds Avg.4 | | –2.17 | | | 32.52 | | | 57.12 | | | **** |
| | |
| 2 | | Visit our website at www.jennisondryden.com |
| | | | | | | | | | | |
| Average Annual Total Returns5 as of 9/30/08 | | | | | | |
| | | One Year | | | Five Years | | | Ten Years | | | Since Inception1 |
Class A | | –11.31 | % | | 3.89 | % | | 3.48 | % | | — |
Class B | | –12.05 | | | 4.18 | | | 3.44 | | | — |
Class C | | –8.63 | | | 4.32 | | | 3.44 | | | — |
Class L | | –11.45 | | | N/A | | | N/A | | | –7.30% (3/26/07) |
Class M | | –12.81 | | | N/A | | | N/A | | | –7.70 (3/26/07) |
Class R | | –7.49 | | | N/A | | | N/A | | | 2.51 (6/6/05) |
Class X | | –12.98 | | | N/A | | | N/A | | | –7.82 (3/26/07) |
Class Z | | –7.02 | | | 5.12 | | | 4.23 | | | — |
Lehman Brothers U.S. Corporate High Yield 1% Issuer Capped Index2 | | –9.77 | | | 4.45 | | | 4.69 | | | ** |
Prior Index3 | | –10.51 | | | 4.37 | | | 4.56 | | | *** |
Lipper High Current Yield Funds Avg.4 | | –10.99 | | | 3.59 | | | 3.59 | | | **** |
| | | | | | |
| Distributions and Yields as of 8/31/08 | | | | | |
| | | Total Distributions
Paid for 12 Months | | 30-Day SEC Yield | |
Class A | | $ | 0.44 | | 8.84 | % |
Class B | | $ | 0.41 | | 8.75 | |
Class C | | $ | 0.41 | | 8.77 | |
Class L | | $ | 0.43 | | 9.01 | |
Class M | | $ | 0.40 | | 8.50 | |
Class R | | $ | 0.43 | | 9.01 | |
Class X | | $ | 0.40 | | 8.50 | |
Class Z | | $ | 0.46 | | 9.50 | |
The cumulative total returns do not reflect the deduction of applicable sales charges. If reflected, the applicable sales charges would reduce the cumulative total returns performance quoted. Class A and Class L shares are subject to a maximum front-end sales charge of 4.50% and 4.25%, respectively. Under certain circumstances, Class A shares may be subject to a contingent deferred sales charge (CDSC) of 1%. Class B, Class C, Class L, Class M, and Class X shares are subject to a maximum CDSC of 5%, 1%, 1%, 6%, 6%, respectively. Class R and Class Z shares are not subject to a sales charge.
Source: Prudential Investments LLC, Lehman Brothers, and Lipper Inc. Performance figures may reflect fee waivers and/or expense reimbursements. In the absence of such fee waivers and/or expense reimbursements, total returns would be lower.
1Inception date returns are provided for any share class with less than 10 calendar years of returns.
2The Lehman Brothers U.S. Corporate High Yield 1% Issuer Capped Index (1% Issuer Capped Index) covers the universe of U.S. dollar denominated, non-convertible, fixed rate, non-investment grade debt. Issuers are capped
| | |
| Dryden High Yield Fund, Inc. | | 3 |
Your Fund’s Performance (continued)
at 1% of the Index. Index holdings must have at least one year to final maturity, at least $150 million par amount outstanding, and be publicly issued with a rating of Ba1 or lower.
3Lehman Brothers U.S. Corporate High Yield 2% Issuer Capped Index (Prior Index) covers the universe of U.S. dollar denominated, non-convertible, fixed-rate, non-investment grade debt. Issuers are capped at 2% of the Index. Index holdings must have at least one year to final maturity, at least $150 million par amount outstanding, and be publicly issued with a rating of Ba1 or lower. The Board recently approved replacing the Prior Index with the Lehman High Yield 1% Issuer Capped Index.
4The Lipper High Current Yield Funds Average (Lipper Average) represents returns based on an average return of all funds in the Lipper High Current Yield Funds category for the periods noted. Funds in the Lipper Average aim at high (relative) current yield from fixed income securities, have no quality or maturity restrictions, and tend to invest in lower-grade debt issues.
5The average annual total returns take into account applicable sales charges. Class A, Class B, Class C, Class L, Class M, Class R, and Class X shares are subject to an annual distribution and service (12b-1) fee of up to 0.30%, 0.75%, 1.00%, 0.50%, 1.00%, 0.75%, and 1.00%, respectively. Approximately seven years after purchase, Class B shares will automatically convert to Class A shares on a quarterly basis. Class Z shares are not subject to a 12b-1 fee. Returns in the tables do not reflect the deduction of taxes that a shareholder would pay on Fund distributions or following the redemption of Fund shares.
**Lehman High Yield 1% Issuer Capped Index Closest Month-End to Inception cumulative total returns as of 8/31/08 are –2.23% for Class L, Class M, and Class X; and 15.07% for Class R. Lehman High Yield 1% Issuer Capped Index Closest Month-End to Inception average annual total returns as of 9/30/08 are –6.30% for Class L, Class M, and Class X; and 1.98% for Class R.
***Prior Index Closest Month-End to Inception cumulative total returns as of 8/31/08 are –2.53% for Class L, Class M, and Class X; and 14.99% for Class R. Prior Index Closest Month-End to Inception average annual total returns as of 9/30/08 are –6.79% for Class L, Class M, and Class X; and 1.81% for Class R.
****Lipper Average Closest Month-End to Inception cumulative total returns as of 8/31/08 are –4.00% for Class L, Class M, and Class X; and 12.61% for Class R. Lipper Average Closest Month-End to Inception average annual total returns as of 9/30/08 are –7.34% for Class L, Class M, Class X; and 1.23% for Class R.
Investors cannot invest directly in an index. The returns for the Lehman High Yield 1% Issuer Capped Index, the Prior Index, and the Lipper Average would be lower if they included the effects of sales charges, operating expenses of a mutual fund, or taxes. Returns for the Lipper Average reflect the deduction of operating expenses, but not sales charges or taxes.
| | | |
| Five Largest Long-Term Issues expressed as a percentage of net assets as of 8/31/08 | | | |
Texas Competitive Electric Holdings Co. LLC, Bank Loan, 6.269%, 10/10/14 | | 1.6 | % |
Affiliated Computer Services, Inc., 4.70%, 6/1/10 | | 1.4 | |
Freeport-McMoRan Copper & Gold, Inc., Sr. Unsec’d. Notes, 8.375%, 4/1/17 | | 1.0 | |
Hertz Corp., Sr. Notes, 8.875%, 1/1/14 | | 1.0 | |
Ispat Inland ULC (Canada), Sec’d. Notes, 9.75%, 4/1/14 | | 1.0 | |
Issues reflect only long-term investments and are subject to change.
| | |
| 4 | | Visit our website at www.jennisondryden.com |
| | | |
| Credit Quality* expressed as a percentage of net assets as of 8/31/08 | | | |
High Grade | | 4.5 | % |
Ba | | 35.5 | |
B | | 38.4 | |
Caa or Lower | | 15.4 | |
Not Rated** | | 17.6 | |
Total Investments | | 111.4 | |
Liabilities in excess of other assets | | –11.4 | |
Net Assets | | 100.0 | % |
| | | |
*Source: Moody’s rating, defaulting to S&P when not rated by Moody’s.
**Approximately 17.4% of Not Rated is reflected in Short Term Money Markets.
Credit Quality is subject to change.
| | |
| Dryden High Yield Fund, Inc. | | 5 |
Strategy and Performance Overview
How did the Fund perform?
The Dryden High Yield Fund’s Class A shares returned 0.86% for the 12 months ended August 31, 2008, outperforming the 0.44% decline of the Lehman Brothers U.S. Corporate High Yield 1% Issuer Capped Index (the Index) and the 2.17% decline of the Lipper High Current Yield Funds Average (Lipper Average). The performance of the Fund, the Index, and the Lipper Average reflected the negative impact of a credit crisis that began in the United States and spread to financial markets around the world.
How is the Fund managed?
The Fund, which is managed by Prudential Fixed Income Management, invests primarily in debt securities of corporations that are commonly called “junk” bonds because they are rated below investment grade. Most of the Fund’s holdings are in the Ba and single-B rating categories, the two highest in the junk bond market based on Moody’s Investors Service. Research plays a key role in the Fund’s investment process. Senior investment professionals develop a quarterly market outlook that provides an overall view on the economy, interest rates, risk levels in the major bond markets, and the yield curve, a single-line graph that depicts yields on bonds of the same credit quality from the shortest to the longest maturities. This outlook helps set broad investment strategies for the Fund. Portfolio managers also work closely with a team of 14 credit research analysts when selecting bonds to buy and sell.
What were conditions like in the U.S. high yield market?
Early in the reporting period, the Federal Reserve (the Fed) tried to prevent a rising tide of delinquencies and foreclosures on subprime mortgages from engulfing the broader U.S. economy. The Fed reduced its target for the federal funds rate charged on overnight loans between banks to 4.75% from 5.25% in September 2007. It hoped that lower borrowing costs would encourage companies to continue expanding their businesses and consumers to spend freely for goods and services. Initially, the rate cut helped buoy financial markets, and high yield bond prices gained in September and October 2007, only to turn sharply lower as the reporting period continued.
It became increasingly clear that more aggressive, inventive measures were needed to support the economy and ease stresses in the credit markets. Wall Street investment banks and commercial banks were forced to write down billions of dollars of debt securities linked to the risky mortgages. Commercial banks grew reluctant to lend money to each other, businesses, and consumers. The U.S. economy shed thousands of jobs, housing prices continued to fall, and the inventory of houses for sale climbed.
A concerned Fed acted decisively. It repeatedly eased monetary policy, pushing down its target for the federal funds rate to 2.00%. In addition, the Fed allowed
| | |
| 6 | | Visit our website at www.jennisondryden.com |
Wall Street investment banks to borrow money from its discount window on much the same terms as commercial banks. It also helped facilitate JP Morgan Chase & Co.’s hurried acquisition of Bear Stearns Cos. at a deep discount before the latter slid into bankruptcy. The Fed’s decision to help initially cheered financial markets, helping high yield bond prices soar in April 2008. But the downturn in the high yield market soon resumed.
As the credit crisis worsened, investors grew more risk averse. Many continued to seek safe haven in U.S. Treasury securities, which are rated AAA because the federal government backs their interest and principal. Meanwhile, prices of riskier assets, including high yield bonds, repeatedly came under pressure, causing their yields to climb, as yields rise when bond prices fall. Consequently, the difference between yields on high yield bonds and 10-year U.S. Treasury notes ballooned, indicating that investors required significantly more compensation to invest in bonds rated below investment grade. Defaults on high yield bonds also edged higher as more companies failed to pay interest and/or principal on their debt securities.
Within the high yield market, the performance was mixed for the 12-month reporting period. The positive total return posted by bonds in the Ba rating category was wiped out by the sharp declines posted by bonds in the lower rating categories. Some market sectors such as healthcare, pharmaceuticals, telecommunications, and aerospace/defense finished in positive territory. In contrast, the airlines and automotive sectors, hard hit by soaring energy prices, as well as the building materials and financial institutions sectors, which were deeply affected by the credit crisis, ended the period with double-digit losses.
How was the Fund positioned during the reporting period?
Under the difficult market conditions, the Fund continued to favor shorter-term investments, whether high yield bonds or leveraged bank loans. The latter are loans made to below-investment-grade companies that have borrowed heavily to finance their businesses. Of the two, leveraged bank loans are the more conservative because, in most cases, they get paid off before high yield bonds when a company declares bankruptcy.
Commercial banks sell leveraged loans to mutual funds and other institutional investors to remove them from their balance sheets, thereby reducing the risk associated with lending. Wall Street firms also set up legal entities that purchase groups of loans and package them as collateralized loan obligations (CLOs) that are sold to institutional investors. Because there was a large amount of bank loans available and few newly issued CLOs, the Fund was able to increase its holdings of leveraged bank loans on very attractive terms.
| | |
| Dryden High Yield Fund, Inc. | | 7 |
Strategy and Performance Overview (continued)
The Fund also benefited from Prudential Fixed Income Management’s sector allocation strategy that favored so-called defensive industries, that is those that tend to hold up well even when the broader economy weakens in the United States. Most notably, the Fund had a substantially larger exposure than the Index to the healthcare sector, which performed well. At the same time, the Fund had significantly smaller positions than the Index in the troubled automotive, building materials, and financial institutions sectors. Thus, the sector allocation strategy helped the Fund outperform the Index for the reporting period.
What were some of the key holdings that aided the Fund’s return?
Two of the Fund’s positions in the healthcare sector—Accellent Inc. and HCA Inc.—made the largest positive contribution to its return. Accellent provides design, engineering, and manufacturing services to companies that produce medical devices. HCA, a provider of healthcare services in the United States and England, owns more than 160 hospitals and more than 100 outpatient centers.
In the difficult investment environment, avoiding companies that defaulted on their bonds was just as important as selecting bonds of companies that performed well. For example, the Fund did not own bonds of SemGroup LP, an oil company included in the Index. SemGroup filed to reorganize under Chapter 11 of the U.S. Bankruptcy Code and defaulted on its bonds. Avoiding these debt securities helped the Fund outperform the Index.
What were some of the key holdings that detracted from the Fund’s return?
The Fund had a limited exposure to bonds that were pressured most by the malaise in the housing market. Yet it continued to have a larger exposure than the Index to debt securities of Realogy Corp., a real estate management and services firm based in New Jersey. Realogy bonds were one of the largest detractors from the Fund’s return, but the Fund continues to hold them because Prudential Fixed Income Management still believes Realogy will gain market share as weaker competitors go out of business.
The Fund also owned bonds of Hawaiian Telecom Communications that tumbled in value, detracting from its return. The company suffered lingering systems problems that have weakened its competitive potential in the longer term.
What is Prudential Fixed Income Management’s outlook for the market?
Prudential Fixed Income Management maintains its cautious outlook for the U.S. high yield bond and leveraged bank loan markets, given that weak economic conditions are having a negative impact on companies that borrow heavily to finance their businesses. As previously mentioned, defaults on high yield bonds have already begun to edge higher. Prudential Fixed Income Management expects the default rate to rise by the end of 2008 to nearly 4.00%, its long-term average.
| | |
| 8 | | Visit our website at www.jennisondryden.com |
The high yield market is also expected to remain volatile well into 2009. That said, Prudential Fixed Income Management believes the downturn in the high yield market is creating attractive investment opportunities. Even relatively minor disappointments in earnings have caused sharp sell-offs in the high yield bonds and bank loans of some generally solid companies. The Fund’s portfolio managers and credit research analysts are working diligently to identify high yield bonds and bank loans that have become oversold and therefore represent good value.
| | |
| Dryden High Yield Fund, Inc. | | 9 |
Fees and Expenses (Unaudited)
As a shareholder of the Fund, you incur two types of costs: (1) transaction costs, including sales charges (loads) on purchase payments and redemptions, as applicable, and (2) ongoing costs, including management fees, distribution and/or service (12b-1) fees, and other Fund expenses, as applicable. This example is intended to help you understand your ongoing costs (in dollars) of investing in the Fund and to compare these costs with the ongoing costs of investing in other mutual funds.
The example is based on an investment of $1,000 invested on March 1, 2008, at the beginning of the period, and held through the six-month period ended August 31, 2008. The example is for illustrative purposes only; you should consult the Prospectus for information on initial and subsequent minimum investment requirements.
The Fund’s transfer agent may charge additional fees to holders of certain accounts that are not included in the expenses shown in the table on the following page. These fees apply to individual retirement accounts (IRAs) and Section 403(b) accounts. As of the close of the six-month period covered by the table, IRA fees included an annual maintenance fee of $15 per account (subject to a maximum annual maintenance fee of $25 for all accounts held by the same shareholder). Section 403(b) accounts are charged an annual $25 fiduciary maintenance fee. Some of the fees may vary in amount, or may be waived, based on your total account balance or the number of JennisonDryden funds, including the Fund, that you own. You should consider the additional fees that were charged to your Fund account over the six-month period when you estimate the total ongoing expenses paid over the period and the impact of these fees on your ending account value, as these additional expenses are not reflected in the information provided in the expense table. Additional fees have the effect of reducing investment returns.
Actual Expenses
The first line for each share class in the table on the following page provides information about actual account values and actual expenses. You may use the information on this line, together with the amount you invested, to estimate the expenses that you paid over the period. Simply divide your account value by $1,000 (for example, an $8,600 account value ÷ $1,000 = 8.6), then multiply the result by the number on the first line under the heading “Expenses Paid During the Six-Month Period” to estimate the expenses you paid on your account during this period.
Hypothetical Example for Comparison Purposes
The second line for each share class in the table on the following page provides information about hypothetical account values and hypothetical expenses based on the Fund’s actual expense ratio and an assumed rate of return of 5% per year before expenses, which is not the Fund’s actual return. The hypothetical account values and expenses may not be used to estimate the actual ending account balance or expenses you paid for the period. You may use this information to compare the ongoing costs
| | |
| 10 | | Visit our website at www.jennisondryden.com |
of investing in the Fund and other funds. To do so, compare this 5% hypothetical example with the 5% hypothetical examples that appear in the shareholder reports of the other funds.
Please note that the expenses shown in the table are meant to highlight your ongoing costs only and do not reflect any transactional costs such as sales charges (loads). Therefore, the second line for each share class in the table is useful in comparing ongoing costs only and will not help you determine the relative total costs of owning different funds. In addition, if these transactional costs were included, your costs would have been higher.
| | | | | | | | | | | | | | |
Dryden High Yield
Fund, Inc. | | Beginning Account
Value
March 1, 2008 | | Ending Account
Value
August 31, 2008 | | Annualized
Expense Ratio
Based on the
Six-Month Period | | | Expenses Paid
During the
Six-Month Period* |
| | | | | | | | | | | | | | |
| Class A | | Actual | | $ | 1,000.00 | | $ | 1,020.00 | | 0.87 | % | | $ | 4.42 |
| | | Hypothetical | | $ | 1,000.00 | | $ | 1,020.76 | | 0.87 | % | | $ | 4.42 |
| | | | | | | | | | | | | | |
| Class B | | Actual | | $ | 1,000.00 | | $ | 1,017.50 | | 1.37 | % | | $ | 6.95 |
| | | Hypothetical | | $ | 1,000.00 | | $ | 1,018.25 | | 1.37 | % | | $ | 6.95 |
| | | | | | | | | | | | | | |
| Class C | | Actual | | $ | 1,000.00 | | $ | 1,017.50 | | 1.37 | % | | $ | 6.95 |
| | | Hypothetical | | $ | 1,000.00 | | $ | 1,018.25 | | 1.37 | % | | $ | 6.95 |
| | | | | | | | | | | | | | |
| Class L | | Actual | | $ | 1,000.00 | | $ | 1,016.90 | | 1.12 | % | | $ | 5.68 |
| | | Hypothetical | | $ | 1,000.00 | | $ | 1,019.51 | | 1.12 | % | | $ | 5.69 |
| | | | | | | | | | | | | | |
| Class M | | Actual | | $ | 1,000.00 | | $ | 1,016.20 | | 1.62 | % | | $ | 8.21 |
| | | Hypothetical | | $ | 1,000.00 | | $ | 1,016.99 | | 1.62 | % | | $ | 8.21 |
| | | | | | | | | | | | | | |
| Class R | | Actual | | $ | 1,000.00 | | $ | 1,018.90 | | 1.12 | % | | $ | 5.68 |
| | | Hypothetical | | $ | 1,000.00 | | $ | 1,019.51 | | 1.12 | % | | $ | 5.69 |
| | | | | | | | | | | | | | |
| Class X | | Actual | | $ | 1,000.00 | | $ | 1,016.30 | | 1.62 | % | | $ | 8.21 |
| | | Hypothetical | | $ | 1,000.00 | | $ | 1,016.99 | | 1.62 | % | | $ | 8.21 |
| | | | | | | | | | | | | | |
| Class Z | | Actual | | $ | 1,000.00 | | $ | 1,021.40 | | 0.62 | % | | $ | 3.15 |
| | | Hypothetical | | $ | 1,000.00 | | $ | 1,022.02 | | 0.62 | % | | $ | 3.15 |
* Fund expenses (net of fee waivers or subsidies, if any) for each share class are equal to the annualized expense ratio for each share class (provided in the table), multiplied by the average account value over the period, multiplied by the 184 days in the six-month period ended August 31, 2008, and divided by the 366 days in the Fund’s fiscal year ended August 31, 2008 (to reflect the six-month period). Expenses presented in the table include the expenses of any underlying portfolios in which the Fund may invest.
| | |
| Dryden High Yield Fund, Inc. | | 11 |
Portfolio of Investments
as of August 31, 2008
| | | | | | | | | | | | |
| | | Moody’s
Rating*
(Unaudited) | | Interest
Rate | | Maturity
Date | | Principal
Amount (000) | | Value (Note 1) |
| | | | | | | | | | | | |
LONG-TERM INVESTMENTS 94.0% | | | | | | | | | | |
| | | | |
ASSET BACKED SECURITIES 1.0% | | | | | | | | | | |
Centurion CDO Vll Ltd. (Cayman Islands), Ser. 2004-7A,
Cl. D1(i) | | Ba2 | | 12.09% | | 1/30/16 | | $ | 5,000 | | $ | 3,564,100 |
CSAM Funding Corp. (Cayman Islands), Sub. Notes,
Cl. D-2, 144A(i)(j) | | Ba2 | | 9.143 | | 3/29/16 | | | 7,000 | | | 4,889,500 |
Landmark lV CDO Ltd. (Cayman Islands)(i)(j)(k) | | Ba2 | | 8.926 | | 12/15/16 | | | 3,500 | | | 2,347,734 |
Liberty Square Ltd. (Cayman Islands), Ser. 2001-2A,
Cl. D, 144A(i)(j)(k) | | Caa3 | | 9.633 | | 6/15/13 | | | 2,780 | | | 1,334,379 |
| | | | | | | | | | | | |
Total asset backed securities | | | | | | | | | | | | 12,135,713 |
| | | | | | | | | | | | |
| | | | | |
CORPORATE BONDS 92.7% | | | | | | | | | | | | |
| | | | | |
Aerospace/Defense 1.9% | | | | | | | | | | | | |
DRS Technologies, Inc.,
Gtd. Notes | | B3 | | 6.875 | | 11/1/13 | | | 1,000 | | | 1,012,500 |
Gtd. Notes(f) | | B3 | | 7.625 | | 2/1/18 | | | 5,130 | | | 5,399,325 |
Esterline Technologies Corp.,
Sr. Sub. Notes | | B1 | | 7.75 | | 6/15/13 | | | 3,150 | | | 3,150,000 |
L-3 Communications Corp.,
Sr. Notes | | Ba3 | | 6.375 | | 10/15/15 | | | 1,125 | | | 1,077,188 |
Sr. Sub. Notes | | Ba3 | | 7.625 | | 6/15/12 | | | 5,575 | | | 5,672,562 |
Sr. Unsec’d. Notes | | Ba3 | | 6.125 | | 1/15/14 | | | 1,000 | | | 965,000 |
Moog, Inc.,
Sr. Sub. Notes | | Ba3 | | 6.25 | | 1/15/15 | | | 2,000 | | | 1,890,000 |
Sr. Sub. Notes, 144A | | Ba3 | | 7.25 | | 6/15/18 | | | 2,725 | | | 2,670,500 |
| | | | | | | | | | | | |
| | | | | | | | | | | | 21,837,075 |
| | | | | |
Airlines 0.4% | | | | | | | | | | | | |
American Airlines, Inc., Certs., Ser. 91-A2 | | Caa1 | | 10.18 | | 1/2/13 | | | 1,882 | | | 1,166,948 |
AMR Corp., Notes | | CCC+(a) | | 10.40 | | 3/10/11 | | | 4,450 | | | 3,204,000 |
Continental Airlines, Inc., Certs., Ser. 981B | | Ba2 | | 6.748 | | 3/15/17 | | | 857 | | | 693,955 |
| | | | | | | | | | | | |
| | | | | | | | | | | | 5,064,903 |
See Notes to Financial Statements.
| | |
| Dryden High Yield Fund, Inc. | | 13 |
Portfolio of Investments
as of August 31, 2008 continued
| | | | | | | | | | | | |
| | | Moody’s
Rating*
(Unaudited) | | Interest
Rate | | Maturity
Date | | Principal
Amount (000) | | Value (Note 1) |
| | | | | | | | | | | | |
Automotive 2.2% | | | | | | | | | | | | |
Ford Motor Co.,
Bank Loans(k) | | Ba3 | | 8.47% | | 12/15/13 | | $ | 5,910 | | $ | 4,578,140 |
Notes(f) | | Caa1 | | 7.45 | | 7/16/31 | | | 325 | | | 167,375 |
Ford Motor Credit Co. LLC,
Bonds | | B1 | | 7.375 | | 2/1/11 | | | 820 | | | 660,005 |
Notes | | B1 | | 7.00 | | 10/1/13 | | | 200 | | | 144,902 |
Notes | | B1 | | 7.875 | | 6/15/10 | | | 5,085 | | | 4,383,417 |
Sr. Notes(f) | | B1 | | 7.25 | | 10/25/11 | | | 5,825 | | | 4,462,189 |
General Motors Corp.,
Debs. | | Caa2 | | 8.25 | | 7/15/23 | | | 700 | | | 341,250 |
Notes(f) | | Caa2 | | 7.20 | | 1/15/11 | | | 4,785 | | | 3,074,363 |
Sr. Notes(f) | | Caa2 | | 7.125 | | 7/15/13 | | | 950 | | | 513,000 |
Lear Corp., Sr. Notes | | B3 | | 8.75 | | 12/1/16 | | | 1,800 | | | 1,354,500 |
TRW Automotive, Inc., Sr. Notes, 144A(f) | | Ba3 | | 7.25 | | 3/15/17 | | | 5,575 | | | 4,794,500 |
Visteon Corp., Notes(f) | | Caa2 | | 7.00 | | 3/10/14 | | | 2,190 | | | 1,084,050 |
| | | | | | | | | | | | |
| | | | | | | | | | | | 25,557,691 |
| | | | | |
Banking 0.6% | | | | | | | | | | | | |
Halyk Savings Bank of Kazahstan (Kazahstan),
Notes, 144A(i) | | Baa3 | | 8.125 | | 10/7/09 | | | 1,620 | | | 1,636,200 |
HSBK Europe (Netherlands), Gtd. Notes, 144A(i) | | Baa3 | | 7.25 | | 5/3/17 | | | 4,500 | | | 3,723,750 |
Kazkommerts International BV (Netherlands), Gtd.
Notes, 144A(i) | | Ba1 | | 7.00 | | 11/3/09 | | | 2,210 | | | 2,099,500 |
| | | | | | | | | | | | |
| | | | | | | | | | | | 7,459,450 |
| | | |
Building Materials & Construction 0.3% | | | | | | | | |
D.R. Horton, Inc., Sr. Gtd. Notes | | Ba2 | | 8.00 | | 2/1/09 | | | 2,000 | | | 2,000,000 |
Nortek, Inc., Sr. Sub. Notes(f) | | Caa1 | | 8.50 | | 9/1/14 | | | 3,185 | | | 1,942,850 |
| | | | | | | | | | | | |
| | | | | | | | | | | | 3,942,850 |
| | | | | |
Cable 5.4% | | | | | | | | | | | | |
CCO Holdings LLC/CCO Holdings Capital Corp., Sr. Notes | | Caa1 | | 8.75 | | 11/15/13 | | | 800 | | | 754,000 |
See Notes to Financial Statements.
| | |
| 14 | | Visit our website at www.jennisondryden.com |
| | | | | | | | | | | | |
| | | Moody’s
Rating*
(Unaudited) | | Interest
Rate | | Maturity
Date | | Principal
Amount (000) | | Value (Note 1) |
| | | | | | | | | | | | |
Cable (cont’d) | | | | | | | | | | | | |
Charter Communications Holding LLC,
Bank Loan(k) | | B1 | | 4.80% | | 9/6/14 | | $ | 7,463 | | $ | 6,518,285 |
Gtd. Notes(f) | | NR | | 11.00 | | 10/1/15 | | | 125 | | | 95,313 |
Sr. Notes(f) | | Caa3 | | 10.00 | | 5/15/14 | | | 983 | | | 486,585 |
Sr. Notes(f) | | Caa3 | | 11.00 | | 10/1/15 | | | 917 | | | 703,798 |
Sr. Notes(f) | | Caa3 | | 11.125 | | 1/15/14 | | | 4,434 | | | 2,217,000 |
Sr. Notes(f) | | Caa3 | | 11.75 | | 5/15/14 | | | 3,000 | | | 1,605,000 |
Sr. Notes(f) | | Caa3 | | 13.50 | | 1/15/14 | | | 1,350 | | | 891,000 |
CSC Holdings, Inc.
Bank Loan(k) | | Ba1 | | 3.464 | | 2/24/12 | | | 2,921 | | | 2,777,921 |
Debs. | | B1 | | 7.625 | | 7/15/18 | | | 3,110 | | | 2,892,300 |
Debs. | | B1 | | 7.875 | | 2/15/18 | | | 725 | | | 681,500 |
Sr. Notes, 144A | | B1 | | 8.50 | | 6/15/15 | | | 2,000 | | | 2,010,000 |
Sr. Notes, Ser. B(f) | | B1 | | 7.625 | | 4/1/11 | | | 7,125 | | | 7,160,624 |
Sr. Notes, Ser. B(f) | | B1 | | 8.125 | | 7/15/09 | | | 7,175 | | | 7,273,655 |
Sr. Unsec’d. Notes | | B1 | | 6.75 | | 4/15/12 | | | 425 | | | 414,375 |
Sr. Unsec’d. Notes | | B1 | | 8.125 | | 8/15/09 | | | 2,500 | | | 2,537,500 |
Mediacom Broadband LLC, Sr. Unsec’d. Notes(f) | | B3 | | 8.50 | | 10/15/15 | | | 1,750 | | | 1,596,875 |
Mediacom LLC, Sr. Unsec’d. Notes(f) | | B3 | | 9.50 | | 1/15/13 | | | 1,600 | | | 1,548,000 |
Newsday LLC, Bank Loan(k) | | B1 | | 9.75 | | 8/1/13 | | | 6,000 | | | 5,988,750 |
Shaw Communications, Inc. (Canada), Sr. Unsec’d. Notes(i) | | Ba1 | | 7.20 | | 12/15/11 | | | 2,800 | | | 2,831,500 |
UPC Broadband Holdings, Bank Loan(k) | | Ba3 | | 4.214 | | 12/31/14 | | | 5,363 | | | 5,022,008 |
Videotron Ltee (Canada), Gtd. Notes | | Ba2 | | 6.875 | | 1/15/14 | | | 2,370 | | | 2,301,863 |
Videotron Ltee, Sr. Notes | | Ba2 | | 6.375 | | 12/15/15 | | | 3,525 | | | 3,291,469 |
Virgin Media Finance PLC (United Kingdom), Gtd. Notes(i) | | B2 | | 9.125 | | 8/15/16 | | | 1,125 | | | 1,071,563 |
| | | | | | | | | | | | |
| | | | | | | | | | | | 62,670,884 |
| | | | | |
Capital Goods 9.3% | | | | | | | | | | | | |
Actuant Corp., Gtd. Notes | | Ba2 | | 6.875 | | 6/15/17 | | | 2,975 | | | 2,915,500 |
ALH Finance LLC, Sr. Sub. Notes(f) | | B3 | | 8.50 | | 1/15/13 | | | 5,100 | | | 4,755,750 |
See Notes to Financial Statements.
| | |
| Dryden High Yield Fund, Inc. | | 15 |
Portfolio of Investments
as of August 31, 2008 continued
| | | | | | | | | | | | |
| | | Moody’s
Rating*
(Unaudited) | | Interest
Rate | | Maturity
Date | | Principal
Amount (000) | | Value (Note 1) |
| | | | | | | | | | | | |
Capital Goods (cont’d) | | | | | | | | | | | | |
Allied Waste North America, Inc., Gtd. Notes, Ser. B | | B1 | | 7.125% | | 5/15/16 | | $ | 800 | | $ | 808,000 |
Sr. Notes(f) | | B1 | | 7.25 | | 3/15/15 | | | 1,705 | | | 1,726,313 |
Sr. Notes, Ser. B(f) | | B1 | | 5.75 | | 2/15/11 | | | 4,320 | | | 4,287,600 |
Ashtead Capital, Inc., Notes, 144A(f) | | B1 | | 9.00 | | 8/15/16 | | | 3,835 | | | 3,451,500 |
Ashtead Holdings PLC (United Kingdom), Sec’d.
Notes, 144A(i) | | B1 | | 8.625 | | 8/1/15 | | | 6,475 | | | 5,762,750 |
Baldor Electric Co., Gtd. Notes(f) | | B3 | | 8.625 | | 2/15/17 | | | 5,775 | | | 5,847,188 |
Blount, Inc., Sr. Sub. Notes(f) | | B2 | | 8.875 | | 8/1/12 | | | 7,700 | | | 7,854,000 |
Capital Safety Group Ltd.,(k)
Bank Loan | | B1 | | 4.719 | | 7/20/15 | | | 2,728 | | | 2,605,550 |
Bank Loan | | B1 | | 5.219 | | 7/20/16 | | | 7,272 | | | 6,944,450 |
Columbus McKinnon Corp.,
Sr. Sub. Notes | | B1 | | 8.875 | | 11/1/13 | | | 4,245 | | | 4,372,350 |
UCAR Finance, Inc., Gtd. Notes | | Ba3 | | 10.25 | | 2/15/12 | | | 697 | | | 717,910 |
Hertz Corp., Sr. Notes(f) | | B1 | | 8.875 | | 1/1/14 | | | 12,790 | | | 11,974,637 |
Johnson Diversey Holding, Inc.,
Sr. Disc. Notes | | Caa1 | | 10.67 | | 5/15/13 | | | 6,120 | | | 6,150,600 |
Sr. Sub. Notes, Ser. B(f) | | B2 | | 9.625 | | 5/15/12 | | | 1,450 | | | 1,475,375 |
Lender Processing Services, Inc., 144A | | Ba2 | | 8.125 | | 7/1/16 | | | 4,400 | | | 4,471,500 |
Mobile Mini, Inc., Gtd. Notes | | B2 | | 6.875 | | 5/1/15 | | | 2,500 | | | 2,131,250 |
RBS Global, Inc. and Rexnord Corp., Gtd. Notes(f) | | B3 | | 9.50 | | 8/1/14 | | | 6,535 | | | 6,371,625 |
Rental Service Corp., Gtd. Notes(f) | | Caa1 | | 9.50 | | 12/1/14 | | | 6,830 | | | 5,464,000 |
SPX Corp., Sr. Notes, 144A | | Ba2 | | 7.625 | | 12/15/14 | | | 3,000 | | | 3,082,500 |
Stena AB (Sweden), Sr. Notes(i) | | Ba2 | | 7.50 | | 11/1/13 | | | 4,900 | | | 4,777,500 |
Terex Corp., | | | | | | | | | | | | |
Gtd. Notes | | Ba2 | | 7.375 | | 1/15/14 | | | 1,000 | | | 985,000 |
Sr. Sub. Notes | | Ba3 | | 8.00 | | 11/15/17 | | | 4,750 | | | 4,690,625 |
United Rentals North America, Inc., Sr. Notes(f) | | B1 | | 6.50 | | 2/15/12 | | | 5,080 | | | 4,533,900 |
| | | | | | | | | | | | |
| | | | | | | | | | | | 108,157,373 |
| | | | | |
Chemicals 3.2% | | | | | | | | | | | | |
Hercules, Inc., Gtd. Notes | | Ba1 | | 6.75 | | 10/15/29 | | | 4,260 | | | 4,281,300 |
Huntsman Co. LLC, Gtd. Notes(f) | | Ba1 | | 11.625 | | 10/15/10 | | | 9,200 | | | 9,522,000 |
See Notes to Financial Statements.
| | |
| 16 | | Visit our website at www.jennisondryden.com |
| | | | | | | | | | | | |
| | | Moody’s
Rating*
(Unaudited) | | Interest
Rate | | Maturity
Date | | Principal
Amount (000) | | Value (Note 1) |
| | | | | | | | | | | | |
Chemicals (cont’d) | | | | | | | | | | | | |
Huntsman International LLC,
Gtd. Notes | | B2 | | 7.375% | | 1/1/15 | | $ | 1,000 | | $ | 915,000 |
Gtd. Notes | | Ba3 | | 11.50 | | 7/15/12 | | | 660 | | | 689,700 |
Koppers, Inc., Gtd. Notes | | Ba3 | | 9.875 | | 10/15/13 | | | 5,979 | | | 6,277,950 |
Momentive Performance Materials, Inc.,(f)
Sr. Notes | | B3 | | 9.75 | | 12/1/14 | | | 4,765 | | | 4,300,413 |
Sr. Sub. Notes | | Caa2 | | 11.50 | | 12/1/16 | | | 2,000 | | | 1,560,000 |
Mosaic Co., 144A
Sr. Notes | | Baa3 | | 7.375 | | 12/1/14 | | | 2,155 | | | 2,228,554 |
Sr. Notes | | Baa3 | | 7.625 | | 12/1/16 | | | 650 | | | 683,560 |
Nalco Co.,
Sr. Notes | | B1 | | 7.75 | | 11/15/11 | | | 5,815 | | | 5,887,688 |
Sr. Sub. Notes | | B3 | | 8.875 | | 11/15/13 | | | 480 | | | 499,200 |
| | | | | | | | | | | | |
| | | | | | | | | | | | 36,845,365 |
| | | | | |
Consumer 2.4% | | | | | | | | | | | | |
Levi Straus & Co.,
Sec’d. Notes | | B2 | | 8.875 | | 4/1/16 | | | 875 | | | 752,500 |
Sr. Unsub. Notes | | B2 | | 9.75 | | 1/15/15 | | | 1,230 | | | 1,108,538 |
Mac-Gray Corp., Sr. Unsec’d. Notes | | B3 | | 7.625 | | 8/15/15 | | | 1,925 | | | 1,833,563 |
Realogy Corp., Gtd. Notes, PIK | | Caa2 | | 11.00 | | 4/15/14 | | | 15,000 | | | 7,049,999 |
Service Corp., International,
Sr. Notes | | B1 | | 6.75 | | 4/1/16 | | | 6,000 | | | 5,520,000 |
Sr. Notes | | B1 | | 7.00 | | 6/15/17 | | | 3,400 | | | 3,170,500 |
Sr. Unsec’d. Notes | | B1 | | 6.75 | | 4/1/15 | | | 1,350 | | | 1,258,875 |
Sr. Unsec’d. Notes | | B1 | | 7.375 | | 10/1/14 | | | 1,050 | | | 1,023,750 |
Stewart Enterprises, Inc., Gtd. Notes | | Ba3 | | 6.25 | | 2/15/13 | | | 3,750 | | | 3,618,750 |
Ticketmaster, Sr. Notes, 144A | | Ba3 | | 10.75 | | 8/1/16 | | | 2,800 | | | 2,870,000 |
| | | | | | | | | | | | |
| | | | | | | | | | | | 28,206,475 |
| | | | | |
Electric 7.3% | | | | | | | | | | | | |
AES Corp., | | | | | | | | | | | | |
Sec’d. Notes, 144A | | Ba3 | | 8.75 | | 5/15/13 | | | 2,549 | | | 2,638,215 |
Sr. Unsec’d. Notes | | B1 | | 7.75 | | 10/15/15 | | | 3,425 | | | 3,390,750 |
Sr. Unsec’d. Notes | | B1 | | 8.00 | | 10/15/17 | | | 2,675 | | | 2,634,875 |
AES Eastern Energy LP, Certs.,
Ser. A | | Ba1 | | 9.00 | | 1/2/17 | | | 5,182 | | | 5,531,836 |
See Notes to Financial Statements.
| | |
| Dryden High Yield Fund, Inc. | | 17 |
Portfolio of Investments
as of August 31, 2008 continued
| | | | | | | | | | | | |
| | | Moody’s
Rating*
(Unaudited) | | Interest
Rate | | Maturity
Date | | Principal
Amount (000) | | Value (Note 1) |
| | | | | | | | | | | | |
Electric (cont’d) | | | | | | | | | | | | |
CMS Energy Corp., Sr. Notes(f) | | Ba1 | | 8.50% | | 4/15/11 | | $ | 2,760 | | $ | 2,902,446 |
Dynegy Holdings, Inc., Sr. Unsec’d. Notes | | B2 | | 7.75 | | 6/1/19 | | | 1,900 | | | 1,752,750 |
Dynegy Roseton/Danskammer Pass-Through Trust, Ser. B | | Ba3 | | 7.67 | | 11/8/16 | | | 5,175 | | | 5,065,031 |
Edison Mission Energy, Sr. Unsec’d. Notes | | B1 | | 7.75 | | 6/15/16 | | | 250 | | | 250,000 |
Energy Future Holdings Corp., Gtd. Notes, 144A, PIK | | B3 | | 11.25 | | 11/1/17 | | | 4,400 | | | 4,345,000 |
Midwest Generation LLC, Certs., Ser. A | | Baa3 | | 8.30 | | 7/2/09 | | | 1,737 | | | 1,758,888 |
Mirant America’s Generation LLC, Sr. Notes | | B3 | | 8.50 | | 10/1/21 | | | 750 | | | 641,250 |
Mirant Corp., Sr. Notes, 144A(e)(k) | | NR | | 7.40 | | 7/15/49 | | | 2,600 | | | 2,600 |
Mirant Mid-Atlantic LLC | | Ba1 | | 9.125 | | 6/30/17 | | | 1,811 | | | 1,960,861 |
Mirant North America LLC, Series WI | | B1 | | 7.375 | | 12/31/13 | | | 6,050 | | | 6,004,624 |
Nevada Power Co., Gen. & Ref. Mtg. Bkd., Ser. A | | Baa3 | | 8.25 | | 6/1/11 | | | 2,465 | | | 2,643,303 |
NRG Energy, Inc.,
Gtd. Notes | | B1 | | 7.25 | | 2/1/14 | | | 2,950 | | | 2,909,438 |
Sr. Notes | | B1 | | 7.375 | | 2/1/16 | | | 525 | | | 518,438 |
Orion Power Holdings, Inc., Sr. Notes | | Ba3 | | 12.00 | | 5/1/10 | | | 5,235 | | | 5,653,800 |
Reliant Energy Mid-Atlantic, Inc., Certs., Ser. C | | Ba1 | | 9.681 | | 7/2/26 | | | 3,600 | | | 3,960,000 |
Sierra Pacific Resources., Sr. Unsec’d. Notes | | Ba3 | | 6.75 | | 8/15/17 | | | 675 | | | 656,735 |
Tenaska Alabama Partners LP,
Sec’d. Notes, 144A | | Ba2 | | 7.00 | | 6/30/21 | | | 2,501 | | | 2,352,300 |
Texas Competitive Electric Holdings Co. LLC,
Bank Loan(k) | | Ba3 | | 6.213 | | 10/10/14 | | | 3,386 | | | 3,155,989 |
Bank Loan(k) | | Ba3 | | 6.22 | | 10/10/14 | | | 6,035 | | | 5,616,672 |
Bank Loan(k) | | Ba3 | | 6.269 | | 10/10/14 | | | 19,850 | | | 18,460,499 |
Sr. Unsec’d. Notes, 144A | | B3 | | 10.25 | | 11/1/15 | | | 100 | | | 99,750 |
| | | | | | | | | | | | |
| | | | | | | | | | | | 84,906,050 |
See Notes to Financial Statements.
| | |
| 18 | | Visit our website at www.jennisondryden.com |
| | | | | | | | | | | | |
| | | Moody’s
Rating*
(Unaudited) | | Interest
Rate | | Maturity
Date | | Principal
Amount (000) | | Value (Note 1) |
| | | | | | | | | | | | |
Energy - Integrated 0.2% | | | | | | | | | | | | |
TNK-BP Finance (Luxembourg), 144A(i) | | Baa2 | | 7.50% | | 7/18/16 | | $ | 2,200 | | $ | 1,969,000 |
| | | | | |
Energy - Other 7.1% | | | | | | | | | | | | |
Compagnie Generale de Geophysique-Veritas
(France), Gtd. Notes(i) | | Ba3 | | 7.50 | | 5/15/15 | | | 645 | | | 641,775 |
Forest Oil Corp.,
Gtd. Notes | | B1 | | 7.25 | | 6/15/19 | | | 1,150 | | | 1,058,000 |
Sr. Notes | | B1 | | 8.00 | | 12/15/11 | | | 1,550 | | | 1,584,875 |
McMoRan Exploration Co., Gtd. Notes | | Caa1 | | 11.875 | | 11/15/14 | | | 6,200 | | | 6,385,999 |
Newfield Exploration Co.,
Sr. Sub. Notes | | Ba3 | | 6.625 | | 9/1/14 | | | 4,258 | | | 4,007,843 |
Sr. Sub. Notes | | Ba3 | | 6.625 | | 4/15/16 | | | 5,150 | | | 4,795,938 |
Newfield Exploration Co.,
Sr. Sub. Notes | | Ba3 | | 7.125 | | 5/15/18 | | | 1,525 | | | 1,437,313 |
Opti Canada, Inc., Sr. Sec’d. Notes | | B1 | | 7.875 | | 12/15/14 | | | 6,225 | | | 6,154,969 |
Parker Drilling Co., Sr. Notes | | B2 | | 9.625 | | 10/1/13 | | | 3,900 | | | 4,075,500 |
Petrohawk Energy Corp.,
Notes | | B3 | | 9.125 | | 7/15/13 | | | 5,350 | | | 5,323,250 |
Sr. Notes, 144A(f) | | B3 | | 7.875 | | 6/1/15 | | | 5,250 | | | 4,895,625 |
Petroplus Finance Ltd. (Bermuda), 144A(f)(i)
Gtd. Notes | | B1 | | 6.75 | | 5/1/14 | | | 9,250 | | | 8,371,249 |
Gtd. Notes | | B1 | | 7.00 | | 5/1/17 | | | 3,300 | | | 2,928,750 |
Pioneer Natural Resource Co.,
Sr. Notes | | Ba1 | | 5.875 | | 7/15/16 | | | 1,050 | | | 920,703 |
Sr. Notes | | Ba1 | | 6.875 | | 5/1/18 | | | 3,000 | | | 2,725,968 |
Sr. Unsec’d. Notes | | Ba1 | | 6.65 | | 3/15/17 | | | 6,425 | | | 5,853,683 |
Plains Exploration & Production Co.,
Gtd. Notes | | B1 | | 7.00 | | 3/15/17 | | | 1,100 | | | 990,000 |
Gtd. Notes(f) | | B1 | | 7.625 | | 6/1/18 | | | 1,600 | | | 1,508,000 |
Gtd. Notes | | B1 | | 7.75 | | 6/15/15 | | | 6,450 | | | 6,143,625 |
SandRidge Energy, Inc., Sr. Notes, 144A | | B3 | | 8.00 | | 6/1/18 | | | 6,825 | | | 6,398,437 |
Tesoro Corp.,
Gtd. Notes | | Ba1 | | 6.50 | | 6/1/17 | | | 3,975 | | | 3,329,063 |
See Notes to Financial Statements.
| | |
| Dryden High Yield Fund, Inc. | | 19 |
Portfolio of Investments
as of August 31, 2008 continued
| | | | | | | | | | | | |
| | | Moody’s
Rating*
(Unaudited) | | Interest
Rate | | Maturity
Date | | Principal
Amount (000) | | Value (Note 1) |
| | | | | | | | | | | | |
Energy - Other (cont’d) | | | | | | | | | | | | |
Sr. Notes | | Ba1 | | 6.25% | | 11/1/12 | | $ | 2,290 | | $ | 2,061,000 |
Sr. Notes | | Ba1 | | 6.625 | | 11/1/15 | | | 650 | | | 563,875 |
| | | | | | | | | | | | |
| | | | | | | | | | | | 82,155,440 |
| | | | | |
Foods 2.2% | | | | | | | | | | | | |
Ahold Finance USA, Inc.,
Gtd. Notes(f) | | Baa3 | | 6.875 | | 5/1/29 | | | 650 | | | 650,417 |
Notes | | Baa3 | | 8.25 | | 7/15/10 | | | 1,840 | | | 1,923,576 |
Albertson’s, Inc., Debs. | | B1 | | 8.70 | | 5/1/30 | | | 1,230 | | | 1,291,867 |
Aramark Corp.,(f)
Gtd. Notes(j) | | B3 | | 6.301 | | 2/1/15 | | | 2,450 | | | 2,278,500 |
Gtd. Notes | | B3 | | 8.50 | | 2/1/15 | | | 1,500 | | | 1,511,250 |
Carrols Corp.,
Gtd. Notes | | B3 | | 9.00 | | 1/15/13 | | | 425 | | | 359,125 |
Del Monte Corp., Sr. Sub. Notes | | B2 | | 8.625 | | 12/15/12 | | | 2,300 | | | 2,323,000 |
Dole Food, Inc.,
Gtd. Notes | | Caa1 | | 7.25 | | 6/15/10 | | | 2,275 | | | 2,104,375 |
Sr. Notes | | Caa1 | | 8.625 | | 5/1/09 | | | 1,000 | | | 987,500 |
Independencia International Ltd., Gtd. Notes, 144A(f) | | B2 | | 9.875 | | 5/15/15 | | | 2,000 | | | 1,967,600 |
National Beef Packing Co.,
Sr. Notes | | Caa1 | | 10.50 | | 8/1/11 | | | 3,625 | | | 3,624,999 |
Smithfield Foods, Inc.,
Sr. Notes(f) | | Ba3 | | 7.75 | | 5/15/13 | | | 2,500 | | | 2,325,000 |
Sr. Notes | | Ba3 | | 8.00 | | 10/15/09 | | | 405 | | | 406,013 |
Stater Brothers Holdings, Inc.,
Gtd. Notes | | B2 | | 7.75 | | 4/15/15 | | | 1,600 | | | 1,544,000 |
Sr. Notes(f) | | B2 | | 8.125 | | 6/15/12 | | | 1,745 | | | 1,736,275 |
| | | | | | | | | | | | |
| | | | | | | | | | | | 25,033,497 |
| | | | | |
Gaming 5.0% | | | | | | | | | | | | |
Park Place Ent., Sr. Notes(f) | | Caa2 | | 8.125 | | 5/15/11 | | | 775 | | | 542,500 |
CCM Merger, Inc., Notes, 144A | | Caa1 | | 8.00 | | 8/1/13 | | | 11,235 | | | 9,044,174 |
Choctaw Resort Development Enterprise, Sr. Notes, 144A | | Ba3 | | 7.25 | | 11/15/19 | | | 235 | | | 186,238 |
Chukchansi Economic Development Authority,
Sr. Notes, 144A | | B2 | | 8.00 | | 11/15/13 | | | 180 | | | 148,050 |
See Notes to Financial Statements.
| | |
| 20 | | Visit our website at www.jennisondryden.com |
| | | | | | | | | | | | |
| | | Moody’s
Rating*
(Unaudited) | | Interest
Rate | | Maturity
Date | | Principal
Amount (000) | | Value (Note 1) |
| | | | | | | | | | | | |
Gaming (cont’d) | | | | | | | | | | | | |
Downstream Development Authority of the Quapaw Tribe of Oklahoma, Sec’d. Notes, 144A | | B3 | | 12.00% | | 10/15/15 | | $ | 2,500 | | $ | 2,043,750 |
Fontainebleau Las Vegas Holdings LLC, Mortgaged Backed, 144A | | Caa1 | | 10.25 | | 6/15/15 | | | 5,025 | | | 2,374,313 |
Harrahs Operating Co., Inc.,
Gtd. Notes | | Caa2 | | 5.50 | | 7/1/10 | | | 4,505 | | | 3,784,200 |
Gtd. Notes | | Caa2 | | 5.625 | | 6/1/15 | | | 2,530 | | | 993,025 |
Gtd. Notes | | Caa2 | | 6.50 | | 6/1/16 | | | 775 | | | 310,000 |
Gtd. Notes, 144A(f) | | Caa1 | | 10.75 | | 2/1/16 | | | 13,100 | | | 8,809,750 |
Isle of Capri Casinos, Inc.,
Sr. Sub. Notes(f) | | B3 | | 7.00 | | 3/1/14 | | | 750 | | | 536,250 |
Mandalay Resort Group, Sr. Sub. Notes | | B1 | | 9.375 | | 2/15/10 | | | 450 | | | 441,000 |
MGM Mirage, Inc.,
Gtd. Notes | | Ba2 | | 6.00 | | 10/1/09 | | | 9,840 | | | 9,643,199 |
Gtd. Notes | | Ba2 | | 6.875 | | 4/1/16 | | | 2,000 | | | 1,585,000 |
Gtd. Notes(f) | | Ba2 | | 7.50 | | 6/1/16 | | | 2,650 | | | 2,159,750 |
Gtd. Notes(f) | | B1 | | 8.375 | | 2/1/11 | | | 1,750 | | | 1,588,125 |
Gtd. Notes | | Ba2 | | 8.50 | | 9/15/10 | | | 125 | | | 120,938 |
Mohegan Tribal Gaming Authority,
Sr. Sub. Notes | | Ba3 | | 6.375 | | 7/15/09 | | | 1,915 | | | 1,852,763 |
Sr. Sub. Notes | | Ba3 | | 8.00 | | 4/1/12 | | | 4,700 | | | 3,995,000 |
Sr. Sub. Notes | | Ba3 | | 8.375 | | 7/1/11 | | | 295 | | | 289,100 |
Sr. Unsec’d. Notes | | Ba1 | | 6.125 | | 2/15/13 | | | 500 | | | 420,000 |
River Rock Entertainment Authority (The), Sec’d. Notes | | B2 | | 9.75 | | 11/1/11 | | | 1,500 | | | 1,395,000 |
Shingle Springs Tribal Gaming Authority,
Sr. Notes, 144A(f) | | B3 | | 9.375 | | 6/15/15 | | | 3,500 | | | 2,843,750 |
Station Casinos, Inc.,
Sr. Notes(f) | | B3 | | 6.00 | | 4/1/12 | | | 750 | | | 523,125 |
Sr. Sub. Notes(f) | | Caa2 | | 6.50 | | 2/1/14 | | | 2,655 | | | 1,194,750 |
Sr. Sub Notes | | Caa2 | | 6.625 | | 3/15/18 | | | 1,735 | | | 720,025 |
Sr. Sub. Notes(f) | | Caa2 | | 6.875 | | 3/1/16 | | | 1,065 | | | 463,275 |
| | | | | | | | | | | | |
| | | | | | | | | | | | 58,007,050 |
See Notes to Financial Statements.
| | |
| Dryden High Yield Fund, Inc. | | 21 |
Portfolio of Investments
as of August 31, 2008 continued
| | | | | | | | | | | | |
| | | Moody’s
Rating*
(Unaudited) | | Interest
Rate | | Maturity
Date | | Principal
Amount (000) | | Value (Note 1) |
| | | | | | | | | | | | |
Healthcare & Pharmaceutical 12.4% | | | | | | | | | | |
Accellent, Inc., Sr. Notes | | Caa3 | | 10.50% | | 12/1/13 | | $ | 9,600 | | $ | 9,023,999 |
Alliance Imaging, Inc., Sr. Sub. Notes | | B3 | | 7.25 | | 12/15/12 | | | 1,585 | | | 1,493,863 |
Biomet, Inc.,(f)
Gtd. Notes, PIK | | B3 | | 10.375 | | 10/15/17 | | | 5,775 | | | 6,063,750 |
Gtd. Notes | | Caa1 | | 11.625 | | 10/15/17 | | | 5,740 | | | 6,034,175 |
BIO-RAD Laboratories, Inc. | | Ba3 | | 7.50 | | 8/15/13 | | | 2,000 | | | 2,000,000 |
Boston Scientific Corp.,
Sr. Unsec’d. Notes | | Ba2 | | 5.45 | | 6/15/14 | | | 1,825 | | | 1,706,375 |
Sr. Unsec’d. Notes | | Ba2 | | 6.25 | | 11/15/15 | | | 4,975 | | | 4,701,375 |
Catalent Pharma Solutions, Inc., Gtd. Notes(f) | | Caa1 | | 9.50 | | 4/15/15 | | | 5,450 | | | 4,550,750 |
Community Health Systems, Inc., | | | | | | | | | | | | |
Bank Loan(k) | | Ba3 | | 1.00 | | 7/25/14 | | | 404 | | | 381,858 |
Bank Loan(k) | | Ba3 | | 4.719 | | 7/25/14 | | | 7,900 | | | 7,466,437 |
Gtd. Notes(f) | | B3 | | 8.875 | | 7/15/15 | | | 2,625 | | | 2,651,250 |
Elan Finance PLC (Ireland),(i)
Sr. Notes | | B3 | | 7.75 | | 11/15/11 | | | 2,045 | | | 1,891,625 |
Sr. Unsec’d. Notes | | B3 | | 8.875 | | 12/1/13 | | | 600 | | | 532,500 |
FMC Finance III SA, Gtd. Notes | | Ba2 | | 6.875 | | 7/15/17 | | | 1,250 | | | 1,200,000 |
Fresenius Med. Care Capital Trust, Gtd. Notes | | Ba3 | | 7.875 | | 6/15/11 | | | 410 | | | 420,250 |
HCA, Inc.,
Bank Loan(k) | | Ba3 | | 5.306 | | 11/17/12 | | | 11,010 | | | 10,288,063 |
Notes | | Caa1 | | 6.75 | | 7/15/13 | | | 3,150 | | | 2,740,500 |
Notes | | Caa1 | | 7.69 | | 6/15/25 | | | 840 | | | 657,109 |
Notes(f) | | Caa1 | | 7.50 | | 11/15/95 | | | 1,500 | | | 1,059,227 |
Notes, M.T.N. | | Caa1 | | 8.70 | | 2/10/10 | | | 550 | | | 555,528 |
Notes, M.T.N. | | Caa1 | | 9.00 | | 12/15/14 | | | 4,000 | | | 3,736,408 |
Sec’d. Notes(f) | | B2 | | 9.125 | | 11/15/14 | | | 6,595 | | | 6,776,363 |
Omega Healthcare Investors, Inc.,
Gtd. Notes | | Ba3 | | 7.00 | | 4/1/14 | | | 4,000 | | | 3,830,000 |
Gtd. Notes | | Ba3 | | 7.00 | | 1/15/16 | | | 4,100 | | | 3,823,250 |
PTS Acquisitions Corp., Bank Loan(k) | | Ba3 | | 5.051 | | 4/10/14 | | | 6,930 | | | 6,046,425 |
Res-Care, Inc., Sr. Notes | | B1 | | 7.75 | | 10/15/13 | | | 6,515 | | | 6,172,963 |
Royalty Pharma Finance Trust, Bank Loan(k) | | Baa3 | | 7.75 | | 5/15/15 | | | 8,350 | | | 8,297,812 |
See Notes to Financial Statements.
| | |
| 22 | | Visit our website at www.jennisondryden.com |
| | | | | | | | | | | | |
| | | Moody’s
Rating*
(Unaudited) | | Interest
Rate | | Maturity
Date | | Principal
Amount (000) | | Value (Note 1) |
| | | | | | | | | | | | |
Healthcare & Pharmaceutical (cont’d) | | | | | | | | | | |
Select Medical Corp., Sr. Sub. Notes(f) | | B3 | | 7.625% | | 2/1/15 | | $ | 1,605 | | $ | 1,380,300 |
Senior Housing Properties Trust,
Sr. Notes | | Ba1 | | 7.875 | | 4/15/15 | | | 875 | | | 870,625 |
Sr. Notes | | Ba1 | | 8.625 | | 1/15/12 | | | 7,250 | | | 7,395,000 |
Skilled Healthcare Group, Inc., Gtd. Notes | | Caa1 | | 11.00 | | 1/15/14 | | | 6,631 | | | 6,995,705 |
Sun Healthcare Group, Inc., Gtd. Notes | | B3 | | 9.125 | | 4/15/15 | | | 5,450 | | | 5,450,000 |
Surgical Care Affiliates, Inc.,
Sr. Sub. Notes, 144A (original cost $3,244,286; purchased 6/21/07 - 12/19/07)(b) | | Caa1 | | 10.00 | | 7/15/17 | | | 3,350 | | | 2,512,500 |
Vanguard Health Holdings Co. II LLC, Sr. Sub. Notes | | Caa1 | | 9.00 | | 10/1/14 | | | 2,885 | | | 2,834,513 |
Ventas Realty LP, Sr. Notes | | Ba1 | | 9.00 | | 5/1/12 | | | 2,380 | | | 2,510,900 |
Viant Holdings, Inc., Gtd. Notes, 144A(k) | | Caa1 | | 10.125 | | 7/15/17 | | | 12,506 | | | 10,567,569 |
| | | | | | | | | | | | |
| | | | | | | | | | | | 144,618,967 |
| | | | | |
Lodging & Leisure 1.1% | | | | | | | | | | | | |
Felcor Lodging LP, Gtd. Notes(f) | | Ba3 | | 8.50 | | 6/1/11 | | | 3,825 | | | 3,691,125 |
Host Marriott LP,
Sr. Notes | | Ba1 | | 7.125 | | 11/1/13 | | | 4,835 | | | 4,556,988 |
Sr. Notes, Ser. M(f) | | Ba1 | | 7.00 | | 8/15/12 | | | 5,250 | | | 4,908,750 |
| | | | | | | | | | | | |
| | | | | | | | | | | | 13,156,863 |
| | | | | |
Media & Entertainment 4.9% | | | | | | | | | | | | |
AMC Entertainment, Inc.,
Sr. Notes | | B2 | | 11.00 | | 2/1/16 | | | 400 | | | 406,000 |
Sr. Sub. Notes | | B2 | | 8.00 | | 3/1/14 | | | 4,075 | | | 3,677,688 |
Cinemark, Inc., Sr. Notes | | B3 | | 9.229(l) | | 3/15/14 | | | 1,455 | | | 1,404,075 |
Clear Channel Communications Inc.,
Debs. | | Caa1 | | 6.875 | | 6/15/18 | | | 525 | | | 246,750 |
Sr. Notes | | Caa1 | | 5.50 | | 9/15/14 | | | 1,370 | | | 667,875 |
Sr. Notes | | Caa1 | | 5.75 | | 1/15/13 | | | 4,025 | | | 2,294,250 |
CMP Susquehanna Corp., Gtd. Notes | | Caa1 | | 9.875 | | 5/15/14 | | | 2,100 | | | 1,312,500 |
Dex Media West LLC, Sr. Sub. Notes | | B1 | | 9.875 | | 8/15/13 | | | 9,775 | | | 7,526,749 |
See Notes to Financial Statements.
| | |
| Dryden High Yield Fund, Inc. | | 23 |
Portfolio of Investments
as of August 31, 2008 continued
| | | | | | | | | | | | |
| | | Moody’s
Rating*
(Unaudited) | | Interest
Rate | | Maturity
Date | | Principal
Amount (000) | | Value (Note 1) |
| | | | | | | | | | | | |
Media & Entertainment (cont’d) | | | | | | | | | | | | |
Dex Media, Inc., Notes | | B2 | | 8.00% | | 11/15/13 | | $ | 2,645 | | $ | 1,560,550 |
DirecTV Holdings LLC,
Gtd. Notes, Ser. B | | Ba3 | | 6.375 | | 6/15/15 | | | 1,084 | | | 1,021,670 |
Sr. Notes, 144A | | Ba3 | | 7.625 | | 5/15/16 | | | 1,500 | | | 1,496,250 |
Sr. Notes | | Ba3 | | 8.375 | | 3/15/13 | | | 2,300 | | | 2,380,500 |
Echostar DBS Corp.,
Gtd. Notes | | Ba3 | | 7.00 | | 10/1/13 | | | 775 | | | 736,250 |
Sr. Notes(f) | | Ba3 | | 6.375 | | 10/1/11 | | | 4,025 | | | 3,934,438 |
Sr. Notes | | Ba3 | | 6.625 | | 10/1/14 | | | 1,600 | | | 1,472,000 |
Sr. Notes | | Ba3 | | 7.125 | | 2/1/16 | | | 2,585 | | | 2,378,200 |
Sr. Unsec’d. Notes | | Ba3 | | 7.75 | | 5/31/15 | | | 3,700 | | | 3,533,500 |
Idearc, Inc., Gtd. Notes | | B3 | | 8.00 | | 11/15/16 | | | 4,385 | | | 1,984,213 |
Lin Television Corp., Gtd. Notes(f) | | B1 | | 6.50 | | 5/15/13 | | | 4,250 | | | 3,485,000 |
MediaNews Group, Inc., Sr. Sub. Notes | | Caa2 | | 6.875 | | 10/1/13 | | | 2,325 | | | 805,031 |
Morris Publishing Group LLC,
Sr. Sub. Notes | | Caa1 | | 7.00 | | 8/1/13 | | | 1,460 | | | 700,800 |
Quebecor Media, Inc. (Canada), Sr. Notes(f)(i) | | B2 | | 7.75 | | 3/15/16 | | | 4,820 | | | 4,530,800 |
Radio One, Inc., Gtd. Notes(f) | | B3 | | 8.875 | | 7/1/11 | | | 2,993 | | | 2,551,533 |
Rainbow National Services LLC, Sr. Notes, 144A | | B2 | | 10.375 | | 9/1/14 | | | 215 | | | 228,706 |
RH Donnelley,
Sr. Disc. Notes | | B3 | | 6.875 | | 1/15/13 | | | 3,000 | | | 1,635,000 |
Sr. Notes | | B3 | | 8.875 | | 1/15/16 | | | 1,190 | | | 624,750 |
Univision Communications, Inc., Sr. Notes, 144A, PIK(f) | | Caa1 | | 9.75 | | 3/15/15 | | | 5,490 | | | 3,925,350 |
| | | | | | | | | | | | |
| | | | | | | | | | | | 56,520,428 |
| | | | | |
Metals 4.9% | | | | | | | | | | | | |
AK Steel Corp., Gtd. Notes | | B1 | | 7.75 | | 6/15/12 | | | 2,735 | | | 2,796,538 |
Aleris International, Inc., Gtd. Notes, PIK | | B3 | | 9.00 | | 12/15/14 | | | 900 | | | 702,000 |
Century Aluminum Co., Sr. Notes | | B1 | | 7.50 | | 8/15/14 | | | 2,430 | | | 2,357,100 |
FMG Finance Pty Ltd. (Australia), Sec’d. Notes, 144A(i) | | B1 | | 10.625 | | 9/1/16 | | | 9,200 | | | 10,304,000 |
Freeport-McMoRan Copper & Gold, Inc., Sr. Unsec’d. Notes | | Ba2 | | 8.375 | | 4/1/17 | | | 11,400 | | | 12,084,000 |
See Notes to Financial Statements.
| | |
| 24 | | Visit our website at www.jennisondryden.com |
| | | | | | | | | | | | |
| | | Moody’s
Rating*
(Unaudited) | | Interest
Rate | | Maturity
Date | | Principal
Amount (000) | | Value (Note 1) |
| | | | | | | | | | | | |
Metals (cont’d) | | | | | | | | | | | | |
Gerdau AmeriSteel Corp. (Canada), Sr. Notes(i) | | Ba1 | | 10.375% | | 7/15/11 | | $ | 6,000 | | $ | 6,225,000 |
Ispat Inland ULC (Canada), Sec’d. Notes(i) | | Baa2 | | 9.75 | | 4/1/14 | | | 10,493 | | | 11,214,782 |
Metals USA, Inc., Sec’d. Notes | | B3 | | 11.125 | | 12/1/15 | | | 4,400 | | | 4,598,000 |
Novelis, Inc. (Canada), Sec’d. Notes(i) | | B3 | | 7.25 | | 2/15/15 | | | 1,506 | | | 1,396,861 |
Ryerson, Inc., Sec’d. Notes, 144A (original cost $2,420,000; purchased 10/3/07)(b) | | B2 | | 12.00 | | 11/1/15 | | | 2,420 | | | 2,371,600 |
Southern Copper Corp., Sr. Notes | | Baa2 | | 7.50 | | 7/27/35 | | | 3,450 | | | 3,319,631 |
| | | | | | | | | | | | |
| | | | | | | | | | | | 57,369,512 |
| | | | | |
Non Captive Finance 0.7% | | | | | | | | | | | | |
General Motors Acceptance Corp.,
Notes | | B3 | | 6.875 | | 9/15/11 | | | 350 | | | 217,189 |
Notes | | B3 | | 6.875 | | 8/28/12 | | | 7,440 | | | 4,364,639 |
GMAC LLC,
Notes | | B3 | | 7.00 | | 2/1/12 | | | 650 | | | 389,459 |
Unsub. Notes | | B3 | | 6.625 | | 5/15/12 | | | 3,000 | | | 1,751,979 |
Residential Capital LLC, 144A(f) | | Caa3 | | 9.625 | | 5/15/15 | | | 4,964 | | | 1,638,120 |
| | | | | | | | | | | | |
| | | | | | | | | | | | 8,361,386 |
| | | | | |
Packaging 2.9% | | | | | | | | | | | | |
Ball Corp.,
Gtd. Notes | | Ba1 | | 6.625 | | 3/15/18 | | | 1,950 | | | 1,911,000 |
Gtd. Notes | | Ba1 | | 6.875 | | 12/15/12 | | | 3,000 | | | 3,015,000 |
Berry Plastics Hldg. Corp.,(f)
Sec’d. Notes(j) | | Caa1 | | 6.651 | | 9/15/14 | | | 1,750 | | | 1,312,500 |
Sec’d. Notes | | Caa1 | | 8.875 | | 9/15/14 | | | 5,475 | | | 4,544,250 |
Crown Americas LLC,
Gtd. Notes | | B1 | | 7.625 | | 11/15/13 | | | 5,550 | | | 5,647,124 |
Gtd. Notes | | B1 | | 7.75 | | 11/15/15 | | | 600 | | | 615,000 |
Exopack Holding, Inc.,
Gtd. Notes | | B3 | | 11.25 | | 2/1/14 | | | 4,800 | | | 4,212,000 |
Graham Packaging Co., Inc.,(f)
Sr. Notes | | Caa1 | | 8.50 | | 10/15/12 | | | 915 | | | 862,388 |
Sr. Sub. Notes | | Caa1 | | 9.875 | | 10/15/14 | | | 2,305 | | | 2,022,638 |
Greif, Inc., Sr. Sub. Notes | | Ba2 | | 6.75 | | 2/1/17 | | | 5,500 | | | 5,335,000 |
See Notes to Financial Statements.
| | |
| Dryden High Yield Fund, Inc. | | 25 |
Portfolio of Investments
as of August 31, 2008 continued
| | | | | | | | | | | | |
| | | Moody’s
Rating*
(Unaudited) | | Interest
Rate | | Maturity
Date | | Principal
Amount (000) | | Value (Note 1) |
| | | | | | | | | | | | |
Packaging (cont’d) | | | | | | | | | | | | |
Owens Brockway Glass Container, Inc., | | | | | | | | | | | | |
Gtd. Notes | | Ba3 | | 8.25% | | 5/15/13 | | $ | 1,575 | | $ | 1,622,250 |
Gtd. Notes | | Ba3 | | 6.75 | | 12/1/14 | | | 250 | | | 248,125 |
Silgan Holdings, Inc., Sr. Sub. Notes | | B1 | | 6.75 | | 11/15/13 | | | 2,717 | | | 2,553,980 |
| | | | | | | | | | | | |
| | | | | | | | | | | | 33,901,255 |
| | | | | |
Paper 1.7% | | | | | | | | | | | | |
Cascades, Inc. (Canada), Sr. Notes(i) | | Ba3 | | 7.25 | | 2/15/13 | | | 2,505 | | | 2,116,725 |
Cellu Tissue Holdings, Inc., Sec’d. Notes | | B2 | | 9.75 | | 3/15/10 | | | 1,425 | | | 1,321,688 |
Domtar Corp., | | | | | | | | | | | | |
Gtd. Notes | | Ba3 | | 5.375 | | 12/1/13 | | | 1,500 | | | 1,320,000 |
Gtd. Notes | | Ba3 | | 7.875 | | 10/15/11 | | | 1,465 | | | 1,505,288 |
Georgia Pacific Corp., Gtd. Notes, 144A (original cost $2,880,626; purchased 12/13/06 - 7/18/08)(b) | | Ba3 | | 7.125 | | 1/15/17 | | | 2,950 | | | 2,736,125 |
P.H. Glatfelter, Gtd. Notes | | Ba2 | | 7.125 | | 5/1/16 | | | 255 | | | 250,538 |
Graphic Package Int’l, Inc., Sr. Notes(f) | | B3 | | 8.50 | | 8/15/11 | | | 4,560 | | | 4,491,599 |
Millar Western Forest Products Ltd. (Canada), Sr. Notes(i) | | B2 | | 7.75 | | 11/15/13 | | | 275 | | | 167,750 |
Norampac, Inc. (Canada), Sr. Notes(i) | | Ba3 | | 6.75 | | 6/1/13 | | | 875 | | | 719,688 |
Smurfit Capital Funding PLC, Notes | | Ba2 | | 7.50 | | 11/20/25 | | | 100 | | | 87,000 |
Verso Paper Holdings LLC and Verson Paper, Inc., | | | | | | | | | | | | |
Gtd. Notes | | B3 | | 11.375 | | 8/1/16 | | | 6,285 | | | 5,342,249 |
| | | | | | | | | | | | |
| | | | | | | | | | | | 20,058,650 |
| | | | | |
Pipelines & Other 2.8% | | | | | | | | | | | | |
Amerigas Partners LP,
Sr. Unsec’d. Notes | | Ba3 | | 7.25 | | 5/20/15 | | | 2,350 | | | 2,226,625 |
Amerigas Partners LP/Amerigas Eagle Finance Corp.,
Sr. Notes | | Ba3 | | 7.125 | | 5/20/16 | | | 840 | | | 781,200 |
See Notes to Financial Statements.
| | |
| 26 | | Visit our website at www.jennisondryden.com |
| | | | | | | | | | | | |
| | | Moody’s
Rating*
(Unaudited) | | Interest
Rate | | Maturity
Date | | Principal
Amount (000) | | Value (Note 1) |
| | | | | | | | | | | | |
Pipelines & Other (cont’d) | | | | | | | | | | | | |
Copano Energy LLC/Copano Energy Finance Corp.,
Sr. Notes, 144A | | B1 | | 7.75% | | 6/1/18 | | $ | 4,375 | | $ | 4,068,750 |
El Paso Corp., Sr. Unsec’d. Notes, M.T.N. | | Ba3 | | 7.80 | | 8/1/31 | | | 750 | | | 740,625 |
Ferrellgas Partners LP, Sr. Notes | | Ba3 | | 6.75 | | 5/1/14 | | | 1,500 | | | 1,305,000 |
Inergy LP/Inergy Finance Corp., Sr. Notes(f) | | B1 | | 8.25 | | 3/1/16 | | | 3,750 | | | 3,525,000 |
MarkWest Energy Partners LP/ MarkWest Energy Finance Corp., Sr. Notes, 144A | | B2 | | 8.75 | | 4/15/18 | | | 3,340 | | | 3,323,300 |
Pacific Energy Partners LP,
Sr. Notes | | Baa3 | | 7.125 | | 6/15/14 | | | 1,900 | | | 1,904,630 |
Sonat, Inc., Notes(f) | | Ba3 | | 7.625 | | 7/15/11 | | | 350 | | | 356,794 |
Southern Natural Gas Co., Notes | | Baa3 | | 8.00 | | 3/1/32 | | | 29 | | | 30,864 |
Targa Resources Partners LP, Sr. Notes, 144A | | B2 | | 8.25 | | 7/1/16 | | | 3,000 | | | 2,730,000 |
Targa Resources, Inc., Gtd. Notes | | B3 | | 8.50 | | 11/1/13 | | | 4,700 | | | 4,465,000 |
Williams Cos., Inc.,
Notes | | Baa3 | | 7.125 | | 9/1/11 | | | 1,300 | | | 1,345,500 |
Notes | | Baa3 | | 8.125 | | 3/15/12 | | | 4,610 | | | 4,898,124 |
Williams Partners LP, Gtd. Notes | | Ba2 | | 7.25 | | 2/1/17 | | | 225 | | | 225,563 |
| | | | | | | | | | | | |
| | | | | | | | | | | | 31,926,975 |
| | | | | |
Real Estate Investment Trust | | | | | | | | | | | | |
Forest City Enterprises, Inc., Sr. Unsec’d. Notes | | Ba3 | | 6.50 | | 2/1/17 | | | 150 | | | 126,000 |
| | | | | |
Retailers 1.2% | | | | | | | | | | | | |
GSC Holdings, Gtd. Notes | | Ba1 | | 8.00 | | 10/1/12 | | | 2,140 | | | 2,241,650 |
Neiman Marcus Group, Inc., Gtd. Notes, PIK | | B2 | | 9.00 | | 10/15/15 | | | 3,230 | | | 3,141,175 |
Pantry, Inc., Sr. Sub. Notes | | Caa1 | | 7.75 | | 2/15/14 | | | 1,325 | | | 1,106,375 |
Susser Holdings, Sr. Notes | | B3 | | 10.625 | | 12/15/13 | | | 7,114 | | | 7,149,570 |
| | | | | | | | | | | | |
| | | | | | | | | | | | 13,638,770 |
| | | | | |
Technology 8.1% | | | | | | | | | | | | |
Affiliated Computer Services, Inc., Sr. Unsec’d. Notes | | Ba2 | | 4.70 | | 6/1/10 | | | 17,500 | | | 16,537,501 |
See Notes to Financial Statements.
| | |
| Dryden High Yield Fund, Inc. | | 27 |
Portfolio of Investments
as of August 31, 2008 continued
| | | | | | | | | | | | |
| | | Moody’s
Rating*
(Unaudited) | | Interest
Rate | | Maturity
Date | | Principal
Amount (000) | | Value (Note 1) |
| | | | | | | | | | | | |
Technology (cont’d) | | | | | | | | | | | | |
Avago Technologies Finance Pte (Singapore),(i) | | | | | | | | | | | | |
Sr. Notes | | B1 | | 10.125% | | 12/1/13 | | $ | 1,400 | | $ | 1,506,750 |
Sr. Sub. Notes | | B3 | | 11.875 | | 12/1/15 | | | 2,200 | | | 2,387,000 |
First Data Corp.,
Bank Loan(k) | | Ba3 | | 5.252 | | 9/24/14 | | | 4,963 | | | 4,547,580 |
Bank Loan(k) | | Ba3 | | 5.552 | | 9/24/14 | | | 3,970 | | | 3,636,802 |
Gtd. Notes, 144A | | B3 | | 9.875 | | 9/24/15 | | | 2,000 | | | 1,725,000 |
Flextronics International Ltd. (Singapore),(i)(k) | | | | | | | | | | | | |
Bank Loan | | Ba1 | | 5.041 | | 10/1/12 | | | 11,940 | | | 10,928,700 |
Bank Loan | | Ba1 | | 5.040 | | 10/1/14 | | | 5,397 | | | 4,895,838 |
Bank Loan | | Ba1 | | 5.041 | | 10/1/14 | | | 1,551 | | | 1,406,850 |
Freescale Semiconductor, Inc., Sr. Unsec’d. Notes, PIK(f) | | B2 | | 9.125 | | 12/15/14 | | | 11,250 | | | 8,775,000 |
Iron Mountain, Inc.,
Gtd. Notes | | B2 | | 8.00 | | 6/15/20 | | | 3,500 | | | 3,403,750 |
Sr. Sub. Notes | | B2 | | 8.625 | | 4/1/13 | | | 4,075 | | | 4,095,375 |
Nortel Networks Ltd. (Canada), Gtd. Notes(f)(i) | | B3 | | 10.125 | | 7/15/13 | | | 1,675 | | | 1,557,750 |
NXP BV/NXP Funding LLC,(f) | | | | | | | | | | | | |
Gtd. Notes | | Caa2 | | 9.50 | | 10/15/15 | | | 500 | | | 338,750 |
Sec’d. Notes | | B3 | | 7.875 | | 10/15/14 | | | 3,470 | | | 2,845,400 |
Open Solutions, Inc., Sr. Sub. Notes, 144A | | Caa1 | | 9.75 | | 2/1/15 | | | 1,075 | | | 763,250 |
Seagate Technology HDD Holdings, Gtd. Notes | | Ba1 | | 6.375 | | 10/1/11 | | | 3,600 | | | 3,550,500 |
Sensata Technologies, Inc. (Netherlands), Sr. Notes(f)(i) | | Caa1 | | 8.00 | | 5/1/14 | | | 7,915 | | | 6,727,750 |
Serena Software, Inc., Gtd. Notes | | Caa1 | | 10.375 | | 3/15/16 | | | 6,690 | | | 6,171,525 |
STATS ChipPAC Ltd. (Singapore) Sr. Notes(i) | | Ba1 | | 6.75 | | 11/15/11 | | | 3,170 | | | 3,201,700 |
SunGard Data Systems, Inc.,
Bonds | | B3 | | 4.875 | | 1/15/14 | | | 600 | | | 527,250 |
Gtd. Notes(f) | | Caa1 | | 9.125 | | 8/15/13 | | | 3,498 | | | 3,550,470 |
Unisys Corp., Sr. Notes | | B2 | | 8.00 | | 10/15/12 | | | 1,290 | | | 1,096,500 |
Xerox Corp., Sr. Notes | | Baa2 | | 6.875 | | 8/15/11 | | | 200 | | | 206,164 |
| | | | | | | | | | | | |
| | | | | | | | | | | | 94,383,155 |
See Notes to Financial Statements.
| | |
| 28 | | Visit our website at www.jennisondryden.com |
| | | | | | | | | | | | |
| | | Moody’s
Rating*
(Unaudited) | | Interest
Rate | | Maturity
Date | | Principal
Amount (000) | | Value (Note 1) |
| | | | | | | | | | | | |
Telecommunications 4.5% | | | | | | | | | | | | |
Centennial Cellular Corp., Gtd. Notes, Ser. B | | B2 | | 10.125% | | 6/15/13 | | $ | 4,685 | | $ | 4,884,113 |
Citizens Communications Co.,
Notes | | Ba2 | | 9.25 | | 5/15/11 | | | 2,045 | | | 2,116,575 |
Sr. Notes(f) | | Ba2 | | 6.25 | | 1/15/13 | | | 1,280 | | | 1,222,400 |
Sr. Notes | | Ba2 | | 9.00 | | 8/15/31 | | | 1,035 | | | 897,863 |
Cricket Communications, Inc.,
Gtd. Notes, 144A | | B3 | | 10.00 | | 7/15/15 | | | 500 | | | 502,500 |
Fairpoint Communications, Inc., Sr. Unsec’d. Notes, 144A | | B3 | | 13.125 | | 4/1/18 | | | 6,000 | | | 5,939,999 |
Hawaiian Telcom Communication, Inc.,
Sr. Notes(j) | | Caa2 | | 8.486 | | 5/1/13 | | | 1,650 | | | 387,750 |
Sr. Notes | | Caa3 | | 12.50 | | 5/1/15 | | | 3,515 | | | 615,125 |
Level 3 Financing, Inc., Sr. Notes | | Caa1 | | 12.25 | | 3/15/13 | | | 6,875 | | | 7,012,499 |
Nextel Communications, Inc., Ser. D, Gtd. Notes | | Baa3 | | 7.375 | | 8/1/15 | | | 425 | | | 345,313 |
Nordic Teleco Holding, Inc. (Denmark), Sr. Notes, 144A(f)(i) | | B2 | | 8.875 | | 5/1/16 | | | 1,810 | | | 1,742,125 |
Qwest Communications Int’l., Inc., Gtd. Notes | | Ba3 | | 7.50 | | 2/15/14 | | | 2,655 | | | 2,416,050 |
Qwest Corp., | | | | | | | | | | | | |
Debs. | | Ba1 | | 7.20 | | 11/10/26 | | | 1,000 | | | 795,000 |
Notes | | Ba1 | | 8.875 | | 3/15/12 | | | 1,500 | | | 1,511,250 |
Sr. Notes | | Ba1 | | 7.625 | | 6/15/15 | | | 2,380 | | | 2,207,450 |
Sr. Unsec’d. Notes | | Ba1 | | 7.50 | | 10/1/14 | | | 5,950 | | | 5,518,624 |
Sprint Capital Corp., | | | | | | | | | | | | |
Gtd. Notes | | Baa3 | | 8.375 | | 3/15/12 | | | 625 | | | 629,688 |
Gtd. Notes | | Baa3 | | 8.75 | | 3/15/32 | | | 1,575 | | | 1,531,688 |
Time Warner Telecom Holdings, Inc., Gtd. Notes | | B3 | | 9.25 | | 2/15/14 | | | 3,850 | | | 3,902,938 |
Windstream Corp., | | | | | | | | | | | | |
Gtd. Notes | | Ba3 | | 8.125 | | 8/1/13 | | | 3,000 | | | 2,970,000 |
Sr. Notes | | Ba3 | | 8.625 | | 8/1/16 | | | 5,135 | | | 5,083,650 |
| | | | | | | | | | | | |
| | | | | | | | | | | | 52,232,600 |
| | | | | | | | | | | | |
Total corporate bonds | | | | | | | | | | | | 1,078,107,664 |
| | | | | | | | | | | | |
See Notes to Financial Statements.
| | |
| Dryden High Yield Fund, Inc. | | 29 |
Portfolio of Investments
as of August 31, 2008 continued
| | | | | | | | | | | | |
| | | | | | | | | Shares | | Value (Note 1) | |
| | | | | | | | | | | | |
COMMON STOCKS 0.3% | | | | | | | | | | | | |
Adelphia Recovery Trust(c)(k) | | | | | | | | 2,000,000 | | $ | 2,000 | |
Embarq Corp. | | | | | | | | 2,933 | | | 138,320 | |
Mirant Corp.(c) | | | | | | | | 3,191 | | | 94,390 | |
Neenah Enterprises, Inc.(c)(k) | | | | | | | | 3,902 | | | 8,623 | |
Peachtree Cable Assoc. Ltd.(c)(k) | | | | | | | | 31,559 | | | 316 | |
Sprint Nextel Corp. | | | | | | | | 28,675 | | | 250,046 | |
Xerox Corp.(f) | | | | | | | | 169,797 | | | 2,365,272 | |
Zemex Minerals Group(c)(k) | | | | | | | | 171 | | | 38,005 | |
| | | | | | | | | | | | |
Total common stocks | | | | | | | | | | | 2,896,972 | |
| | | | | | | | | | | | |
| | | | | |
PREFERRED STOCKS | | | | | | | | | | | | |
Building Materials & Construction | | | | | | | | | | | | |
New Millenium Homes LLC, Ser. A(c)(d)(k) | | | | | | | | 2,000 | | | 242,000 | |
| | | | | | | | | | | | |
Cable | | | | | | | | | | | | |
Escrow Pfd Adelphia(c)(e)(k) | | | | | | | | 20,000 | | | 20 | |
PTV, Inc., Ser. A, 10.00% | | | | | | | | 9 | | | 5 | |
| | | | | | | | | | | | |
| | | | | | | | | | | 25 | |
| | | | | | | | | | | | |
Total preferred stocks | | | | | | | | | | | 242,025 | |
| | | | | | | | | | | | |
| | | | | |
| | | | | | | Expiration
Date | | | | | |
WARRANTS(c) | | | | | | | | | | | | |
Cable | | | | | | | | | | | | |
TVN Entertainment(k) | | | | | | 1/1/49 | | 46,241 | | | 26,819 | |
| | | | | | | | | | | | |
Consumer | | | | | | | | | | | | |
Icon Fitness Corp.(k) | | | | | | 2/28/49 | | 4,375 | | | 44 | |
| | | | | | | | | | | | |
Gaming | | | | | | | | | | | | |
Aladdin Gaming(k) | | | | | | 3/1/10 | | 30,000 | | | 30 | |
| | | | | | | | | | | | |
Paper | | | | | | | | | | | | |
Smurfit Kappa Funding PLC (Ireland), 144A(i)(k) | | | | | | 10/1/13 | | 275 | | | 825 | |
| | | | | | | | | | | | |
Technology | | | | | | | | | | | | |
Viasystems Group, Inc.(k) | | | | | | 1/10/31 | | 166,335 | | | 17 | |
| | | | | | | | | | | | |
Telecommunications | | | | | | | | | | | | |
GT Group Telecom, Inc. (Canada), 144A(d)(i)(k) | | | | | | 2/1/10 | | 8,610 | | | 9 | |
Sirius XM Radio, Inc., 144A | | | | | | 3/15/10 | | 345 | | | | † |
| | | | | | | | | | | | |
| | | | | | | | | | | 9 | |
| | | | | | | | | | | | |
Total warrants | | | | | | | | | | | 27,744 | |
| | | | | | | | | | | | |
Total long-term investments
(cost $1,194,604,489) | | | | | | | | | | | 1,093,410,118 | |
| | | | | | | | | | | | |
See Notes to Financial Statements.
| | |
| 30 | | Visit our website at www.jennisondryden.com |
| | | | | | | | | | | | |
| | | | | | | | | Shares | | Value (Note 1) | |
| | | | | | | | | | | | |
SHORT-TERM INVESTMENTS 17.4% | | | | | | | | | | | | |
Affiliated Mutual Funds | | | | | | | | | | | | |
Dryden Core Investment Fund—Dryden Short-Term Core Bond Series(h) | | | | | | | | 42,553 | | $ | 371,066 | |
Dryden Core Investment Fund—Taxable Money Market Series (includes $160,809,026 of cash collateral received for securities on loan)(g)(h) | | | | | | | | 201,487,963 | | | 201,487,963 | |
| | | | | | | | | | | | |
Total short-term investments
(cost $201,906,059) | | | | | | | | | | | 201,859,029 | |
| | | | | | | | | | | | |
Total Investments 111.4%
(cost $1,396,510,548; Note 5)(m) | | | | | | | | | | | 1,295,269,147 | |
Liabilities in excess of other assets(n) (11.4%) | | | | | | | | | | | (132,842,326 | ) |
| | | | | | | | | | | | |
Net Assets 100.0% | | | | | | | | | | $ | 1,162,426,821 | |
| | | | | | | | | | | | |
| * | The ratings reflected are as of August 31, 2008. Ratings of certain bonds may have changed subsequent to that date. The Fund’s current prospectus contains a description of Moody’s and Standard & Poor’s ratings. |
The following abbreviations are used in portfolio descriptions:
144A—Security was purchased pursuant to Rule 144A under the Securities Act of 1933 and may not be resold subject to that rule except to qualified institutional buyers. Unless otherwise noted, 144A securities are deemed to be liquid.
LLC—Limited Liability Company.
LP—Limited Partnership.
PIK— Payment-in-kind.
NR— Not Rated by Moody’s or Standard & Poor’s.
M.T.N.—Medium Term Notes
| (a) | Standard & Poor’s rating. |
| (b) | Indicates a restricted security; the aggregate original cost of such securities is $8,544,912. The aggregate value of $7,620,225 is approximately 0.7% of net assets. |
| (c) | Non-income producing security. |
| (d) | Consists of more than one class of securities traded together as a unit; generally bonds with attached stock or warrants. |
| (e) | Represents issuer in default on interest payments; non-income producing security. |
| (f) | All or portion of security is on loan. The aggregate market value of such securities is $156,519,177; cash collateral of $160,809,026 (included in liabilities) was received with which the Portfolio purchased highly liquid short-term investments. |
| (g) | Represents security, or portion thereof, purchased with cash collateral received for securities on loan. |
| (h) | Prudential Investments LLC, the manager of the Fund, also serves as manager of the Dryden Core Investment Fund—Dryden Short-Term Core Bond Series and the Dryden Core Investment Fund—Taxable Money Market Series. |
| (i) | US$ denominated foreign securities. |
| (j) | Floating rate bond. The coupon is indexed to a floating interest rate. The rate shown is the rate at August 31, 2008. |
| (k) | Indicates a security that has been deemed illiquid. |
| (l) | Represent a zero coupon bond or step bond. Rate shown reflects the effective yield at the time of purchase. |
| (m) | As of August 31, 2008, 11 securities representing $1,647,025 and 0.1% of the total market value were fair valued in accordance with the policies adopted by the Board of Directors. |
| (n) | Liabilities in excess of other assets includes net unrealized appreciation (depreciation) on credit default swaps as follows: |
See Notes to Financial Statements.
| | |
| Dryden High Yield Fund, Inc. | | 31 |
Portfolio of Investments
as of August 31, 2008 continued
Credit default swap agreements outstanding at August 31, 2008:
| | | | | | | | | | | | | | |
Counterparty | | Termination
Date | | Notional
Amount
(000) | | Fixed
Rate | | | Reference
Entity/Obligation | | Unrealized
Appreciation
(Depreciation) | |
Barclays Bank PLC(1) | | 12/20/2008 | | $ | 18,500 | | 2.38 | % | | Harrah’s Operating Company,
Inc., 5.625%, 6/1/15 | | $ | (446,987 | ) |
Barclays Bank PLC(1) | | 6/20/2013 | | | 17,500 | | 5.00 | | | CDX North America
High Yield, Ser. 10-V1 | | | (30,541 | ) |
Credit Suisse International(1) | | 12/20/2012 | | | 4,950 | | 3.75 | | | CDX North America
High Yield, Ser. 9-V1 | | | 97,262 | |
Citibank, NA(1) | | 12/20/2008 | | | 8,500 | | 2.50 | | | Altell Corporation,
7.00%, 7/1/12 | | | 104,272 | |
Deutsche Bank AG(1) | | 12/20/2012 | | | 4,950 | | 3.75 | | | CDX North America
High Yield, Ser. 9-V1 | | | 250,918 | |
Citibank, NA(1) | | 12/20/2012 | | | 3,500 | | 2.85 | | | American Axle &
Manufacturing, Inc.,
5.25%, 2/11/14 | | | 1,136,476 | |
Merrill Lynch Capital
Services, Inc.(1) | | 9/20/2009 | | | 2,000 | | 4.65 | | | General Motors Corp.,
7.125%, 7/15/13 | | | (358,918 | ) |
Morgan Stanley Capital
Services, Inc.(1) | | 9/20/2010 | | | 2,500 | | 4.20 | | | Lear Corp.,
8.11%, 5/15/09 | | | (213,448 | ) |
Barclays Bank PLC(1) | | 6/20/2013 | | | 1,455 | | 5.00 | | | Station Casino’s, Inc.,
6.00%, 4/1/12 | | | (302,866 | ) |
Lehman Brothers Special Financing(1) | | 6/20/2009 | | | 5,000 | | 5.00 | | | Idearc, Inc.,
8.00%, 11/15/16 | | | (292,541 | ) |
Lehman Brothers Special Financing(1) | | 6/20/2009 | | | 4,700 | | 5.00 | | | Idearc, Inc.,
8.00%, 11/15/16 | | | (231,933 | ) |
Morgan Stanley Capital
Services(1) | | 6/20/2009 | | | 5,000 | | 1.90 | | | Texas Competitive Electic
Holdings Co., | | | 31,549 | |
Lehman Brothers Special Financing(2) | | 6/20/2013 | | | 5,000 | | 2.70 | | | Ryland Group, Inc.
(The),
5.375%, 1/15/15 | | | 383,696 | |
Credit Suisse International(1) | | 12/20/2012 | | | 4,950 | | 3.75 | | | CDX North America
High Yield, Ser. 9-V1, | | | 247,824 | |
Merrill Lynch Capital Services, Inc.(1) | | 6/20/2013 | | | 5,000 | | 5.00 | | | CDX North America
High Yield, Ser. 10-V1, | | | 188,480 | |
Lehman Brothers Special Financing(1) | | 3/20/2009 | | | 2,000 | | 5.00 | | | RH Donnelley Corp.,
8.875%, 1/15/16 | | | 39,223 | |
Goldman Sachs International(1) | | 3/20/2016 | | | 1,850 | | 4.10 | | | NRG Energy, Inc.,
7.25%, 2/1/14 | | | 18,362 | |
| | | | | | | | | | | | | | |
| | | | | | | | | | | | $ | 620,828 | |
| | | | | | | | | | | | | | |
See Notes to Financial Statements.
| | |
| 32 | | Visit our website at www.jennisondryden.com |
| (1) | The Fund receives the fixed rate and pays the counterparty par in the event the underlying bond defaults. |
| (2) | The Fund pays the fixed rate and receives from the counterparty par in the event that the underlying bond defaults. |
The industry classification of long-term portfolio holdings, short-term investments and liabilities in excess of other assets shown as a percentage of net assets as of August 31, 2008 was as follows:
| | | |
Affiliated Mutual Funds (including 13.8% of collateral received for securities on loan) | | 17.4 | % |
Healthcare & Pharmaceutical | | 12.4 | |
Capital Goods | | 9.3 | |
Technology | | 8.1 | |
Electric | | 7.3 | |
Energy—Other | | 7.1 | |
Cable | | 5.4 | |
Gaming | | 5.0 | |
Media & Entertainment | | 4.9 | |
Metals | | 4.9 | |
Telecommunications | | 4.5 | |
Chemicals | | 3.2 | |
Packaging | | 2.9 | |
Pipelines & Other | | 2.8 | |
Consumer | | 2.4 | |
Automotive | | 2.2 | |
Foods | | 2.2 | |
Aerospace/Defense | | 1.9 | |
Paper | | 1.7 | |
Retailers | | 1.2 | |
Lodging & Leisure | | 1.1 | |
Asset Backed Securities | | 1.0 | |
Non Captive Finance | | 0.7 | |
Banking | | 0.6 | |
Airlines | | 0.4 | |
Building Materials & Construction | | 0.3 | |
Common Stocks | | 0.3 | |
Energy—Integrated | | 0.2 | |
| | | |
| | 111.4 | |
Liabilities in excess of other assets | | (11.4 | ) |
| | | |
Net Assets | | 100.0 | % |
| | | |
See Notes to Financial Statements.
| | |
| Dryden High Yield Fund, Inc. | | 33 |
Statement of Assets and Liabilities
as of August 31, 2008
| | | | |
Assets | | | | |
Investments, at value, including securities on loan of $156,519,177: | | | | |
Unaffiliated Investments (cost $1,194,604,489) | | $ | 1,093,410,118 | |
Affiliated Investments (cost $201,906,059) | | | 201,859,029 | |
Cash | | | 885,712 | |
Dividends and interest receivable | | | 23,983,026 | |
Receivable for investments sold | | | 9,282,958 | |
Unrealized appreciation on swap agreements | | | 2,498,062 | |
Premium for swaps purchased | | | 921,840 | |
Receivable for Fund shares sold | | | 377,683 | |
| | | | |
Total assets | | | 1,333,218,428 | |
| | | | |
| |
Liabilities | | | | |
Payable to broker for collateral for securities on loan | | | 160,809,026 | |
Income distribution payable | | | 2,585,020 | |
Unrealized depreciation on swap agreements | | | 1,877,234 | |
Discount for swaps purchased | | | 1,503,652 | |
Payable for investments purchased | | | 1,427,596 | |
Payable for Fund shares reacquired | | | 1,228,265 | |
Management fee payable | | | 465,357 | |
Accrued expenses | | | 386,862 | |
Distribution fee payable | | | 322,324 | |
Transfer agent fee payable | | | 149,532 | |
Deferred directors’ fees | | | 36,739 | |
| | | | |
Total liabilities | | | 170,791,607 | |
| | | | |
| |
Net Assets | | $ | 1,162,426,821 | |
| | | | |
| | | | | |
Net assets were comprised of: | | | | |
Common stock, at par | | $ | 2,239,621 | |
Paid-in capital in excess of par | | | 2,127,445,259 | |
| | | | |
| | | 2,129,684,880 | |
Undistributed net investment income | | | 1,856,218 | |
Accumulated net realized loss on investments and foreign currency transactions | | | (868,494,143 | ) |
Net unrealized depreciation on investments and foreign currencies | | | (100,620,134 | ) |
| | | | |
Net assets, August 31, 2008 | | $ | 1,162,426,821 | |
| | | | |
See Notes to Financial Statements.
| | |
| 34 | | Visit our website at www.jennisondryden.com |
| | | |
Class A | | | |
Net asset value and redemption price per share | | | |
($955,164,591 ÷ 184,008,096 shares of common stock issued and outstanding) | | $ | 5.19 |
Maximum sales charge (4.50% of offering price) | | | .24 |
| | | |
Maximum offering price to public | | $ | 5.43 |
| | | |
| |
Class B | | | |
Net asset value, offering price and redemption price per share | | | |
($109,151,907 ÷ 21,050,584 shares of common stock issued and outstanding) | | $ | 5.19 |
| | | |
| |
Class C | | | |
Net asset value, offering price and redemption price per share | | | |
($49,659,602 ÷ 9,579,750 shares of common stock issued and outstanding) | | $ | 5.18 |
| | | |
| |
Class L | | | |
Net asset value, offering price and redemption price per share | | | |
($5,113,977 ÷ 984,512 shares of common stock issued and outstanding) | | $ | 5.19 |
| | | |
| |
Class M | | | |
Net asset value, offering price and redemption price per share | | | |
($14,831,347 ÷ 2,857,946 shares of common stock issued and outstanding) | | $ | 5.19 |
| | | |
| |
Class R | | | |
Net asset value, offering price and redemption price per share | | | |
($1,295,291 ÷ 249,555 shares of common stock issued and outstanding) | | $ | 5.19 |
| | | |
| |
Class X | | | |
Net asset value, offering price and redemption price per share | | | |
($3,482,549 ÷ 671,591 shares of common stock issued and outstanding) | | $ | 5.19 |
| | | |
| |
Class Z | | | |
Net asset value, offering price and redemption price per share | | | |
($23,727,557 ÷ 4,560,056 shares of common stock issued and outstanding) | | $ | 5.20 |
| | | |
See Notes to Financial Statements.
| | |
| Dryden High Yield Fund, Inc. | | 35 |
Statement of Operations
Year Ended August 31, 2008
| | | | |
Net Investment Income | | | | |
Income | | | | |
Interest | | $ | 109,465,988 | |
Affiliated dividend income | | | 1,696,812 | |
Affiliated income from securities loaned, net | | | 1,132,593 | |
Unaffiliated dividends | | | 30,515 | |
| | | | |
Total income | | | 112,325,908 | |
| | | | |
| |
Expenses | | | | |
Management fee | | | 5,946,541 | |
Distribution fee—Class A | | | 2,562,229 | |
Distribution fee—Class B | | | 994,900 | |
Distribution fee—Class C | | | 396,031 | |
Distribution fee—Class L | | | 29,900 | |
Distribution fee—Class M | | | 220,368 | |
Distribution fee—Class R | | | 6,104 | |
Distribution fee—Class X | | | 42,302 | |
Transfer agent’s fee and expenses (including affiliated expense of $718,000) | | | 1,510,000 | |
Custodian’s fees and expenses | | | 190,000 | |
Registration fees | | | 123,000 | |
Reports to shareholders | | | 90,000 | |
Directors’ fees | | | 40,000 | |
Legal fees and expenses | | | 30,000 | |
Insurance | | | 28,000 | |
Audit fee | | | 28,000 | |
Interest expense (Note 8) | | | 16,452 | |
Loan interest expense (Note 8) | | | 15,933 | |
Miscellaneous | | | 18,140 | |
| | | | |
Total expenses | | | 12,287,900 | |
| | | | |
Net investment income | | | 100,038,008 | |
| | | | |
| |
Realized And Unrealized Gain (Loss) On Investments, Foreign Currency Transactions And Swaps | | | | |
Net realized gain (loss) on: | | | | |
Investment transactions (including affiliated $(378,944)) | | | (23,909,723 | ) |
Foreign currency transactions | | | (41,902 | ) |
Swaps | | | 1,552,503 | |
| | | | |
| | | (22,399,122 | ) |
| | | | |
Net change in unrealized appreciation (depreciation) on: | | | | |
Investments | | | (67,182,268 | ) |
Foreign currencies | | | 81,793 | |
Swaps | | | 606,368 | |
| | | | |
| | | (66,494,107 | ) |
| | | | |
Net loss on investments and foreign currency transactions | | | (88,893,229 | ) |
| | | | |
Net Increase In Net Assets Resulting From Operations | | $ | 11,144,779 | |
| | | | |
See Notes to Financial Statements.
| | |
| 36 | | Visit our website at www.jennisondryden.com |
Statement of Changes in Net Assets
| | | | | | | | | | | | |
| | | Year
Ended
August 31, 2008 | | | Eight Month
Period Ended
August 31, 2007 | | | Year
Ended
December 31, 2006 | |
Increase (Decrease) In Net Assets | | | | | | | | | | | | |
Operations | | | | | | | | | | | | |
Net investment income | | $ | 100,038,008 | | | $ | 69,553,919 | | | $ | 110,002,922 | |
Net realized loss on investments and foreign currency transactions | | | (22,399,122 | ) | | | (977,143 | ) | | | (17,207,876 | ) |
Net change in unrealized appreciation (depreciation) of investments and foreign currencies | | | (66,494,107 | ) | | | (51,232,710 | ) | | | 55,409,195 | |
| | | | | | | | | | | | |
Net increase in net assets resulting from operations | | | 11,144,779 | | | | 17,344,066 | | | | 148,204,241 | |
| | | | | | | | | | | | |
Dividends from net investment income (Note 1) | | | | | | | | | | | | |
Class A | | | (83,450,936 | ) | | | (57,397,846 | ) | | | (91,121,822 | ) |
Class B | | | (10,129,671 | ) | | | (8,176,629 | ) | | | (16,383,182 | ) |
Class C | | | (4,036,965 | ) | | | (2,677,708 | ) | | | (3,945,884 | ) |
Class L | | | (471,750 | ) | | | (237,346 | ) | | | — | |
Class M | | | (1,623,468 | ) | | | (1,058,763 | ) | | | — | |
Class R | | | (97,085 | ) | | | (19,635 | ) | | | (214 | ) |
Class X | | | (312,687 | ) | | | (154,994 | ) | | | — | |
Class Z | | | (1,854,417 | ) | | | (1,469,110 | ) | | | (2,079,925 | ) |
| | | | | | | | | | | | |
| | | (101,976,979 | ) | | | (71,192,031 | ) | | | (113,531,027 | ) |
| | | | | | | | | | | | |
| | | |
Fund share transactions (Net of share conversions) (Note 6) | | | | | | | | | | | | |
Net proceeds from shares sold | | | 78,931,280 | | | | 62,038,200 | | | | 87,023,047 | |
Net asset value of shares issued in connection with merger (Note 7) | | | — | | | | 80,086,722 | | | | — | |
Net asset value of shares issued in reinvestment of dividends | | | 61,313,668 | | | | 39,776,795 | | | | 63,955,471 | |
Cost of shares reacquired | | | (265,677,957 | ) | | | (227,074,856 | ) | | | (327,430,048 | ) |
| | | | | | | | | | | | |
Net decrease in net assets from Fund share transactions | | | (125,433,009 | ) | | | (45,173,139 | ) | | | (176,451,530 | ) |
| | | | | | | | | | | | |
Total decrease | | | (216,265,209 | ) | | | (99,021,104 | ) | | | (141,778,316 | ) |
| | | |
Net Assets | | | | | | | | | | | | |
Beginning of period | | | 1,378,692,030 | | | | 1,477,713,134 | | | | 1,619,491,450 | |
| | | | | | | | | | | | |
End of period(a) | | $ | 1,162,426,821 | | | $ | 1,378,692,030 | | | $ | 1,477,713,134 | |
| | | | | | | | | | | | |
(a) Includes undistributed net investment income of: | | $ | 1,856,218 | | | $ | 486,125 | | | $ | 420,083 | |
| | | | | | | | | | | | |
See Notes to Financial Statements.
| | |
| Dryden High Yield Fund, Inc. | | 37 |
Notes to Financial Statements
Dryden High Yield Fund, Inc. (the “Fund”) is registered under the Investment Company Act of 1940, as amended, as a diversified, open-end management investment company. The primary investment objective of the Fund is to maximize current income through investment in a diversified portfolio of high yield fixed-income securities which, in the opinion of the Fund’s investment adviser, do not subject the Fund to unreasonable risks. As a secondary investment objective, the Fund seeks capital appreciation but only when consistent with its primary objective. Lower rated or unrated (i.e., high yield) securities are more likely to react to developments affecting market risk (general market liquidity) and credit risk (an issuer’s inability to meet principal and interest payments on its obligations) than are more highly rated securities, which react primarily to movements in the general level of interest rates. The ability of issuers of debt securities held by the Fund to meet their obligations may be affected by economic developments in a specific industry or region.
Note 1. Accounting Policies
The following is a summary of significant accounting policies followed by the Fund in the preparation of its financial statements.
Security Valuation: Securities listed on a securities exchange are valued at the last price on such exchange on the day of valuation or, if there was no sale on such day, at the mean between the last reported bid and asked prices, or at the last bid price on such day in the absence of an asked price. Securities traded via NASDAQ are valued at the official closing price provided by NASDAQ. Securities that are actively traded in the over-the-counter market, including listed securities for which the primary market is believed by Prudential Investments LLC (“PI” or “Manager”) in consultation with the subadvisor, to be over-the-counter, are valued at market value using prices provided by an independent pricing agent or principal market maker. Futures contracts and options thereon traded on a commodities exchange or board of trade are valued at the last sale price at the close of trading on such exchange or board of trade or, if there was no sale on the applicable commodities exchange or board of trade on such day, at the mean between the most recently quoted bid and asked prices on such exchange or board of trade or at the last bid price in the absence of an asked price. Certain fixed income securities for which daily market quotations are not readily available may be valued with reference to fixed income securities whose prices are more readily available, pursuant to guidelines established by the Board of Directors. Prices may be obtained from independent pricing services which use
| | |
| 38 | | Visit our website at www.jennisondryden.com |
information provided by market makers or estimates of market values obtained from yield data relating to investments or securities with similar characteristics. Securities for which reliable market quotations are not readily available, or whose values have been affected by events occurring after the close of the security’s foreign market and before the Fund’s normal pricing time, are valued at fair value in accordance with the Board of Directors’ approved fair valuation procedures. When determining the fair valuation of securities, some of the factors influencing the valuation include, the nature of any restrictions on disposition of the securities; assessment of the general liquidity of the securities; the issuer’s financial condition and the markets in which it does business; the cost of the investment; the size of the holding and the capitalization of issuer; the prices of any recent transactions or bids/offers for such securities or any comparable securities; any available analyst media or other reports or information deemed reliable by the investment adviser regarding the issuer or the markets or industry in which it operates. Using fair value to price securities may result in a value that is different from the security’s most recent closing price and from the price used by other mutual funds to calculate their net asset values.
Investments in mutual funds are valued at their net asset value as of the close of the New York Stock Exchange on the date of valuation.
Short-term debt securities which mature in 60 days or less are valued at amortized cost, which approximates market value. The amortized cost method involves valuing a security at its cost on the date of purchase and thereafter assuming a constant amortization to maturity of the difference between the principal amount due at maturity and cost. Short-term debt securities which mature in more than 60 days are valued at current market quotations.
Restricted Securities: The Fund may hold up to 15% of its net assets in illiquid securities, including those which are restricted as to disposition under securities law (“restricted securities”). Restricted securities held by the Fund at the end of the fiscal period may include registration rights under which the Fund may demand registration by the issuer, of which the Fund may bear the cost of such registration. Restricted securities are valued pursuant to the valuation procedures noted above.
Swap Agreements: The Fund may enter into interest rate swap agreements, forward spread lock swap agreements, and credit default swap agreements. A swap agreement is an agreement to exchange the return generated by one instrument for the return generated by another instrument. Interest rate swap agreements involve the exchange by the Fund with another party of their respective commitments to pay or receive interest. Forward spread lock swap agreements involve commitments to pay or receive a settlement amount calculated as the difference between the swap spread and a fixed spread, multiplied by the notional amount times the duration of the swap.
| | |
| Dryden High Yield Fund, Inc. | | 39 |
Notes to Financial Statements
continued
The swap spread is the difference between the benchmark swap rate (market rate) and the specific Treasury rate. In a credit default swap agreement, one party (the protection buyer) makes a stream of payments to another party (the protection seller) in exchange for the right to receive a specified payment in the event of a default by a third party, typically corporate issues or sovereign issues of an emerging country, on its obligation. The maximum amount of the payment may equal the notional, at par, of the underlying index or security as a result of a default (or “credit event”). In addition to bearing the risk that the credit event will occur, the Fund could be exposed to market risk due to unfavorable changes in interest rates or in the price of the underlying security or index, the possibility that the fund may be unable to close out its position at the same time or at the same price as if it had purchased comparable publicly traded securities, or that the counterparty may default on it’s obligation to perform. The swaps are valued daily at current market value and any unrealized appreciation or depreciation is included in the Statement of Assets and Liabilities. Payments received or paid by the Fund are recorded as realized gains or losses. Risk of loss may exceed amounts recognized on the statements of assets and liabilities. Swap agreements outstanding at period end, if any, are listed on the Schedule of Investments.
Forward currency contracts, written options, short sales, swaps and financial futures contracts involve elements of both market and credit risk in excess of the amounts reflected on the Statement of Assets and Liabilities.
Loan Participations: The Fund may invest in loan participations, another type of restricted security. When the Fund purchases a loan participation, the Fund typically enters into a contractual relationship with the lender or third party selling such participations (“Selling Participant”), but not the borrower. As a result, the Fund assumes the credit risk of the borrower, the selling participant and any other persons interpositioned between the Fund and the borrower (“intermediate participants”). The Fund may not directly benefit from the collateral supporting the senior loan in which it has purchased the loan participation.
Foreign Currency Translation: The books and records of the Fund are maintained in U.S. dollars. Foreign currency amounts are translated into U.S. dollars on the following basis:
(i) market value of investment securities, other assets and liabilities at the closing daily rates of exchange;
| | |
| 40 | | Visit our website at www.jennisondryden.com |
(ii) purchases and sales of investment securities, income and expenses at the rates of exchange prevailing on the respective dates of such transactions.
The Fund does not isolate that portion of the results of operations arising as a result of changes in the foreign exchange rates from the fluctuations arising from changes in the market prices of long-term securities held at the end of the fiscal period. Similarly, the Fund does not isolate the effect of changes in foreign exchange rates from the fluctuations arising from changes in the market prices of long-term portfolio securities sold during the fiscal period. Accordingly, realized foreign currency gains (losses) are included in the reported net realized gains (losses) on investment transactions.
Net realized gains or losses on foreign currency transactions represent net foreign exchange gains or losses from the holding of foreign currencies, currency gains (losses) realized between the trade and settlement dates on security transactions, and the difference between the amounts of dividends, interest and foreign withholding taxes recorded on the Fund’s books and the U.S. dollar equivalent amounts actually received or paid. Net unrealized currency gains (losses) from valuing foreign currency denominated assets and liabilities (other than investments) at period-ended exchange rates are reflected as a component of net unrealized appreciation (depreciation) on investments and foreign currencies.
Foreign security and currency transactions may involve certain considerations and risks not typically associated with those of domestic origin as a result of, among other factors, the possibility of political and economic instability or the level of governmental supervision and regulation of foreign securities markets.
Forward Currency Contracts: A forward currency contract is a commitment to purchase or sell a foreign currency at a future date at a negotiated forward rate. The Fund enters into forward currency contracts in order to hedge its exposure to changes in foreign currency exchange rates on its foreign portfolio holdings or on specific receivables and payables denominated in a foreign currency. The contracts are valued daily at current forward exchange rates and any unrealized gain or loss is included in net unrealized appreciation (depreciation) on investments and foreign currencies. Gain or loss is realized on the settlement date of the contract equal to the difference between the settlement value of the original and renegotiated forward contracts. This gain or loss, if any, is included in net realized gain or loss on foreign currency transactions. Risks may arise upon entering into these contracts from the potential inability of the counterparties to meet the terms of their contracts.
Forward currency contracts involve elements of both market and credit risk in excess of the amounts reported on the Statement of Assets and Liabilities.
| | |
| Dryden High Yield Fund, Inc. | | 41 |
Notes to Financial Statements
continued
Short Sales: The Fund may make short sales of a security. This means that the Fund may sell a security that it does not own, which it may do, for example, when the Fund thinks the value of the security will decline. The Fund generally borrows the security to deliver to the buyers in a short sale. The Fund must then replace the borrowed security by purchasing it at the market price at the time of replacement. Short sales involve costs and risk. The Fund must pay the lender any dividends or interest that accrues on the security it borrows, and the Fund will lose money if the price of the security increases between the time of the short sale and the date when the Fund replaces the borrowed security. The Fund may make short sales “against the box.” In a short sale against the box, at the time of sale, the Fund owns or has the right to acquire the identical security at no additional cost. When selling short against the box, the Fund gives up the opportunity for capital appreciation in the security. A gain, limited to the price at which the company sold the security short, or a loss, unlimited in size, will be recognized upon the termination of a short sale.
Securities Lending: The Fund may lend its portfolio securities to broker-dealers. The loans are secured by collateral at least equal at all times to the market value of the securities loaned. Loans are subject to termination at the option of the borrower or the Fund. Upon termination of the loan, the borrower will return to the Fund securities identical to the loaned securities. Should the borrower of the securities fail financially, the Fund has the right to repurchase the securities using the collateral in the open market. The Fund recognizes income, net of any rebate and securities lending agent fees, for lending its securities in the form of fees or interest on the investment of any cash received as collateral. The Fund also continues to receive interest and dividends or amounts equivalent thereto, on the securities loaned and recognizes any unrealized gain or loss in the market price of the securities loaned that may occur during the term of the loan.
Securities Transactions and Net Investment Income: Securities transactions are recorded on the trade date. Realized gains and losses on sales of investments are calculated on the identified cost basis. Dividend income is recorded on the ex-dividend date and interest income, including amortization of premium and accretion of discount on debt securities, as required, is recorded on the accrual basis. Expenses are recorded on the accrual basis which may require the use of certain estimates by management. The Fund amortizes premiums and accretes discounts on purchases of debt securities as adjustments to interest income.
| | |
| 42 | | Visit our website at www.jennisondryden.com |
Net investment income (loss) (other than distribution fees which are charged directly to the respective class) and unrealized and realized gains and losses are allocated daily to each class of shares based upon the relative proportion of net assets of each class at the beginning of the day.
Taxes: For federal income taxes purposes, it is the Fund’s policy to continue to meet the requirements of the Internal Revenue Code applicable to regulated investment companies and to distribute all of its taxable net income and capital gains, if any, to its shareholders. Therefore, no federal income tax provision is required.
Dividends and Distributions: The Fund declares daily and pays dividends of net investment income monthly and makes distributions of net realized capital and currency gains, if any, annually. Dividends and distributions to shareholders, which are determined in accordance with federal income tax regulations and which may differ from generally accepted accounting principles, are recorded on the ex-dividend date. Permanent book/tax differences relating to income and gains are reclassified amongst undistributed net investment income, accumulated net realized gain or loss and paid-in capital in excess of par, as appropriate.
Estimates: The preparation of the financial statements requires management to make estimates and assumptions that affect the reported amounts and disclosures in the financial statements. Actual results could differ from those estimates.
Note 2. Agreements
The Fund has a management agreement with PI. Pursuant to this agreement, PI has responsibility for all investment advisory services and supervises the subadvisor’s performance of such services. PI has entered into a subadvisory agreement with Prudential Investment Management, Inc. (“PIM”). The subadvisory agreement provides that PIM will furnish investment advisory services in connection with the management of the Fund. In connection therewith, PIM is obligated to keep certain books and records of the Fund. PI pays for the services of PIM, the cost of compensation of officers of the Fund, occupancy and certain clerical and bookkeeping costs of the Fund. The Fund bears all other costs and expenses.
The management fee paid to PI is accrued daily and payable monthly, at an annual rate of .50 of 1% of the Fund’s average daily net assets up to $250 million, .475 of 1% of the next $500 million, .45 of 1% of the next $750 million, .425 of 1% of the next $500 million, .40 of 1% of the next $500 million, .375 of 1% of the next $500 million and .35 of 1% of the Fund’s average daily net assets in excess of $3 billion. The effective management fee rate was .47 of 1% for the year ended August 31, 2008.
| | |
| Dryden High Yield Fund, Inc. | | 43 |
Notes to Financial Statements
continued
Effective, March 23, 2007, PI had contractually agreed to waive up to .01% of the Fund’s management fee on an annualized basis until March 31, 2008, to the extent the Fund’s net operating expenses, exclusive of taxes, interest, distribution (12b-1) fees and certain extraordinary expenses, exceeded .64%.
The Fund has a distribution agreement with Prudential Investment Management Services LLC (“PIMS”), which acts as the distributor of the Class A, Class B, Class C, Class L, Class M, Class R, Class X and Class Z shares of the Fund. The Fund compensates PIMS for distributing and servicing the Fund’s Class A, Class B, Class C, Class L, Class M, Class R and Class X shares, pursuant to plans of distribution (the “Class A, B, C, L, M, R and X Plans”), regardless of expenses actually incurred by PIMS. The distribution fees are accrued daily and payable monthly. No distribution or service fees are paid to PIMS as distributor of the Class Z shares of the Fund.
Pursuant to the Class A, B, C, L, M, R and X Plans, the Fund compensates PIMS for distribution related activities at an annual rate of up to .30 of 1%, .75 of 1%, 1%, .50 of 1%, 1%, .75 of 1% and 1% of the average daily net assets of the Class A, B, C, L, M, R and X shares, respectively.
For the year ended August 31, 2008, PIMS contractually agreed to limit such fees to .25 of 1%, .75 of 1% and .50 of 1% of the average daily net assets of the Class A, Class C and Class R shares, respectively.
PIMS has advised the Fund that it has received approximately $146,300 in front-end sales charges resulting from sales of Class A shares, during the year ended August 31, 2008. From these fees, PIMS paid such sales charges to affiliated broker-dealers, which in turn paid commissions to salespersons and incurred other distribution costs.
PIMS has advised the Fund that for the year ended August 31, 2008, it received approximately $2,000, $179,500, $5,900, $60,700 and $2,800 in contingent deferred sales charges imposed upon redemptions by certain Class A, Class B, Class C, Class M and Class X shareholders, respectively.
PI, PIMS and PIM are indirect, wholly-owned subsidiaries of Prudential Financial, Inc. (“Prudential”).
| | |
| 44 | | Visit our website at www.jennisondryden.com |
Note 3. Other Transactions with Affiliates
Prudential Mutual Fund Services LLC (“PMFS”), an affiliate of PI and an indirect, wholly-owned subsidiary of Prudential, serves as the Fund’s transfer agent. Transfer agent’s fees and expenses on the Statement of Operations include certain out-of-pocket expenses paid to non-affiliates, where applicable.
The Fund pays networking fees to affiliated and unaffiliated broker/dealers including fees relating to the services of Wachovia Securities, LLC (“Wachovia”) and First Clearing LLC (“First Clearing”) affiliates of PI. These networking fees are payments made to broker/dealers that clear mutual fund transactions through a national clearing system. For the year ended August 31, 2008, the Fund incurred approximately $272,100 in total networking fees of which approximately $154,100 was paid to First Clearing. The Fund did not pay any amounts to Wachovia during the year ended August 31, 2008. These amounts are included in transfer agent’s fees and expenses in the Statement of Operations.
Prudential Investment Management, Inc., (“PIM”), an indirect, wholly-owned subsidiary of Prudential, is the Fund’s security lending agent. For the year ended August 31, 2008, PIM has been compensated approximately $487,600 for these services.
The Fund invests in the Taxable Money Market Series and the Dryden Short-Term Core Bond Series, separate portfolios of Dryden Core Investment Fund, pursuant to an exemptive order received from the Securities and Exchange Commission. Taxable Money Market Series and the Dryden Short-Term Core Bond Series are mutual funds registered under the Investment Company Act of 1940, as amended, and managed by PI.
On October 17, 2007, PIM made a payment of $225,538 to the Fund as part of the ultimate realization of a workout related to Price Communications warrants.
Note 4. Portfolio Securities
Purchases and sales of investment securities, other than short-term investments, for the year ended August 31, 2008 aggregated $760,730,164 and $887,224,214, respectively.
Note 5. Distributions and Tax Information
Distributions to shareholders, which are determined in accordance with federal income tax regulations and which may differ from generally accepted accounting
| | |
| Dryden High Yield Fund, Inc. | | 45 |
Notes to Financial Statements
continued
principles, are recorded on the ex-dividend date. In order to present undistributed net investment income, accumulated net realized loss on investments and foreign currency transactions and paid-in capital in excess of par on the Statement of Assets and Liabilities that more closely represent their tax character, certain adjustments have been made to undistributed net investment income, accumulated net realized loss on investments and foreign currency transactions and paid-in capital in excess of par.
For the year ended August 31, 2008, the adjustments were to increase undistributed net investment income by $3,309,064, decrease accumulated net realized loss on investments and foreign currency transactions by $311,075,531 and to decrease paid-in capital in excess of par by $314,384,595 primarily due to reclassification of foreign currencies, the difference in the treatment of accreting market discount and premium amortization between financial and tax reporting purposes, paydown gain (losses), swaps, expiration of capital loss carryforward from prior years and other book to tax differences. Net investment income, net realized loss on investments and foreign currency transactions and net assets were not affected by this change.
For the year ended August 31, 2008 and the eight-month period ended August 31, 2007, the tax character of dividends paid as reflected in the Statement of Changes in Net Assets were $101,976,979 and $71,192,031 of ordinary income, respectively.
As of August 31, 2008, the components of distributable earnings on a tax basis was $5,098,805 of ordinary income.
The United States federal income tax basis of the Fund’s investments and the net unrealized depreciation as of August 31, 2008 were as follows:
| | | | | | | | | | |
Tax Basis | | Appreciation | | Depreciation | | Net
Unrealized
Depreciation | | Other Cost
Basis
Adjustments | | Total Net
Unrealized
Depreciation |
| $1,399,771,934 | | $8,854,194 | | $(113,356,981) | | $(104,502,787) | | $620,828 | | $(103,881,959) |
The difference between book basis and tax basis is primarily attributable to the deferred losses on wash sales and the difference in the treatment of accreting market discount and premium amortization. Other cost basis adjustments are attributable to appreciation on swaps.
For federal income tax purposes, the Fund had a capital loss carryforward at August 31, 2008 of approximately $835,289,000, of which $386,822,000 expires in
| | |
| 46 | | Visit our website at www.jennisondryden.com |
2009, $392,572,000 expires in 2010, $25,269,000 expires in 2013, $24,857,000 expires in 2014 and $5,769,000 expires in 2015. The Fund utilized approximately of $3,578,000 of its capital loss carryforward to offset net taxable gains realized in the fiscal year ended August 31, 2008. Additionally, approximately $314,385,000 of the Fund’s capital loss carryforward expired in the year ended August 31, 2008. Accordingly, no capital gains distribution is expected to be paid to shareholders until net gains have been realized in excess of such amounts. It is uncertain whether the Fund will be able to realize the full benefit prior to the expiration dates.
The Fund elected to treat post-October capital losses of approximately $29,943,000 as having been incurred in the following fiscal year (August 31, 2009).
Management has analyzed the Fund’s tax positions taken on federal income tax returns for all open tax years and has concluded that as of August 31, 2008, no provision for income tax would be required in the Fund’s financial statements. The Fund’s federal and state income and federal excise tax returns for tax years for which the applicable statutes of limitations have not expired are subject to examination by the Internal Revenue Service and state departments of revenue.
Note 6. Capital
The Fund offers Class A, Class B, Class C, Class L, Class M, Class R, Class X and Class Z shares. Class A and Class L shares are sold with a front-end sales charge of up to 4.50% and 4.25%, respectively. Investors who purchase $1 million or more of Class A or Class L shares and redeem those shares within 12 months of purchase are subject to a contingent deferred sales charge (CDSC) of 1%, but are not subject to an initial sales charge. A special exchange privilege is also available for shareholders who qualified to purchase Class A shares at net asset value. Class B shares are sold with a CDSC which declines from 5% to zero depending on the period of time the shares are held. Class B shares will automatically convert to Class A shares on a quarterly basis approximately seven years after purchase. Class C shares are sold with a CDSC of 1% during the first 12 months. Class M and Class X shares are sold with a CDSC that declines from 6% to zero depending on the period of time the shares are held. Class M shares will automatically convert to Class A shares approximately eight years after purchase. Class X shares will automatically convert to Class A shares approximately 10 years after purchase. Class L, Class M and Class X shares are not offered to new purchasers and are only available through exchange from the same class of shares offered by certain JennisonDryden funds. Class R and Class Z shares are not subject to any sales or redemption charges and are available only to a limited group of investors.
| | |
| Dryden High Yield Fund, Inc. | | 47 |
Notes to Financial Statements
continued
The Fund is authorized to issue 3 billion shares of common stock, $.01 par value per share, divided into nine classes, designated Class A, Class B, Class C, Class L, Class M, Class R, Class X, Class New X and Class Z common stock. Of the authorized shares of common stock of the Fund, 500 million shares are designated Class A common stock, 400 million shares are designated for each of Class B common stock, Class C common stock, Class L common stock, Class M common stock and 225 million shares are designated for each of Class R common stock, Class X common stock, Class New X common stock and Class Z common stock.
Transactions in shares of common stock were as follows:
| | | | | | | |
Class A | | Shares | | | Amount | |
Year ended August 31, 2008: | | | | | | | |
Shares sold | | 7,505,102 | | | $ | 40,771,729 | |
Shares issued in reinvestment of dividends | | 9,170,962 | | | | 49,550,056 | |
Shares reacquired | | (37,254,650 | ) | | | (202,737,937 | ) |
| | | | | | | |
Net increase (decrease) in shares outstanding before conversion | | (20,578,586 | ) | | | (112,416,152 | ) |
Shares issued upon conversion from Class B, Class M and Class X | | 7,680,195 | | | | 41,643,153 | |
| | | | | | | |
Net increase (decrease) in shares outstanding | | (12,898,391 | ) | | $ | (70,772,999 | ) |
| | | | | | | |
Eight month period ended August 31, 2007: | | | | | | | |
Shares sold | | 6,258,592 | | | $ | 35,717,651 | |
Shares issued in connection with the merger | | 2,261,473 | | | | 13,229,616 | |
Shares issued in reinvestment of dividends | | 5,485,954 | | | | 31,752,296 | |
Shares reacquired | | (27,957,615 | ) | | | (161,743,635 | ) |
| | | | | | | |
Net increase (decrease) in shares outstanding before conversion | | (13,951,596 | ) | | | (81,044,072 | ) |
Shares issued upon conversion from Class B, Class M and Class X | | 3,651,640 | | | | 21,308,012 | |
| | | | | | | |
Net increase (decrease) in shares outstanding | | (10,299,956 | ) | | $ | (59,736,060 | ) |
| | | | | | | |
Year ended December 31, 2006: | | | | | | | |
Shares sold | | 9,756,100 | | | $ | 55,192,932 | |
Shares issued in reinvestment of dividends | | 9,057,150 | | | | 51,553,831 | |
Shares reacquired | | (44,055,687 | ) | | | (250,498,837 | ) |
| | | | | | | |
Net increase (decrease) in shares outstanding before conversion | | (25,242,437 | ) | | | (143,752,074 | ) |
Shares issued upon conversion from Class B | | 11,469,694 | | | | 65,213,888 | |
| | | | | | | |
Net increase (decrease) in shares outstanding | | (13,772,743 | ) | | $ | (78,538,186 | ) |
| | | | | | | |
| | |
| 48 | | Visit our website at www.jennisondryden.com |
| | | | | | | |
Class B | | Shares | | | Amount | |
Year ended August 31, 2008: | | | | | | | |
Shares sold | | 2,371,675 | | | $ | 12,927,028 | |
Shares issued in reinvestment of dividends | | 1,035,628 | | | | 5,601,384 | |
Shares reacquired | | (4,770,464 | ) | | | (25,771,912 | ) |
| | | | | | | |
Net increase (decrease) in shares outstanding before conversion | | (1,363,161 | ) | | | (7,243,500 | ) |
Shares issued upon conversion from Class A | | (6,330,449 | ) | | | (34,315,525 | ) |
| | | | | | | |
Net increase (decrease) in shares outstanding | | (7,693,610 | ) | | $ | (41,559,025 | ) |
| | | | | | | |
Eight month period ended August 31, 2007: | | | | | | | |
Shares sold | | 2,064,694 | | | $ | 11,980,169 | |
Shares issued in connection with the merger | | 314,291 | | | | 1,835,459 | |
Shares issued in reinvestment of dividends | | 720,891 | | | | 4,168,177 | |
Shares reacquired | | (4,573,162 | ) | | | (26,297,635 | ) |
| | | | | | | |
Net increase (decrease) in shares outstanding before conversion | | (1,473,286 | ) | | | (8,313,830 | ) |
Shares issued upon conversion from Class A | | (2,913,385 | ) | | | (17,027,065 | ) |
| | | | | | | |
Net increase (decrease) in shares outstanding | | (4,386,671 | ) | | $ | (25,340,895 | ) |
| | | | | | | |
Year ended December 31, 2006: | | | | | | | |
Shares sold | | 2,245,997 | | | $ | 12,756,096 | |
Shares issued in reinvestment of dividends | | 1,436,594 | | | | 8,160,974 | |
Shares reacquired | | (8,800,263 | ) | | | (49,954,732 | ) |
| | | | | | | |
Net increase (decrease) in shares outstanding before conversion | | (5,117,672 | ) | | | (29,037,662 | ) |
Shares reacquired upon conversion into Class A | | (11,489,904 | ) | | | (65,213,888 | ) |
| | | | | | | |
Net increase (decrease) in shares outstanding | | (16,607,576 | ) | | $ | (94,251,550 | ) |
| | | | | | | |
Class C | | | | | | |
Year ended August 31, 2008: | | | | | | | |
Shares sold | | 1,419,180 | | | $ | 7,647,960 | |
Shares issued in reinvestment of dividends | | 470,588 | | | | 2,539,908 | |
Shares reacquired | | (2,409,163 | ) | | | (13,031,893 | ) |
| | | | | | | |
Net increase (decrease) in shares outstanding | | (519,395 | ) | | $ | (2,844,025 | ) |
| | | | | | | |
Eight month period ended August 31, 2007: | | | | | | | |
Shares sold | | 1,048,973 | | | $ | 6,054,417 | |
Shares issued in connection with the merger | | 1,741,136 | | | | 10,185,647 | |
Shares issued in reinvestment of dividends | | 263,387 | | | | 1,520,904 | |
Shares reacquired | | (2,288,345 | ) | | | (13,139,416 | ) |
| | | | | | | |
Net increase (decrease) in shares outstanding | | 765,151 | | | $ | 4,621,552 | |
| | | | | | | |
Year ended December 31, 2006: | | | | | | | |
Shares sold | | 975,882 | | | $ | 5,559,668 | |
Shares issued in reinvestment of dividends | | 382,715 | | | | 2,174,798 | |
Shares reacquired | | (3,007,572 | ) | | | (17,083,181 | ) |
| | | | | | | |
Net increase (decrease) in shares outstanding | | (1,648,975 | ) | | $ | (9,348,715 | ) |
| | | | | | | |
| | |
| Dryden High Yield Fund, Inc. | | 49 |
Notes to Financial Statements
continued
| | | | | | | |
Class L | | Shares | | | Amount | |
Year ended August 31, 2008: | | | | | | | |
Shares sold | | 84,208 | | | $ | 462,790 | |
Shares issued in reinvestment of dividends | | 70,011 | | | | 379,066 | |
Shares reacquired | | (366,778 | ) | | | (1,985,384 | ) |
| | | | | | | |
Net increase (decrease) in shares outstanding | | (212,559 | ) | | $ | (1,143,528 | ) |
| | | | | | | |
Period ended August 31, 2007:* | | | | | | | |
Shares sold | | 46,002 | | | $ | 265,034 | |
Shares issued in connection with the merger | | 1,422,148 | | | | 8,333,789 | |
Shares issued in reinvestment of dividends | | 30,588 | | | | 176,084 | |
Shares reacquired | | (301,667 | ) | | | (1,740,675 | ) |
| | | | | | | |
Net increase (decrease) in shares outstanding | | 1,197,071 | | | $ | 7,034,232 | |
| | | | | | | |
Class M | | | | | | |
Year ended August 31, 2008: | | | | | | | |
Shares sold | | 493,516 | | | $ | 2,706,195 | |
Shares issued in reinvestment of dividends | | 190,859 | | | | 1,034,694 | |
Shares reacquired | | (1,731,554 | ) | | | (9,319,869 | ) |
| | | | | | | |
Net increase (decrease) in shares outstanding before conversion | | (1,047,179 | ) | | | (5,578,980 | ) |
Shares reacquired upon conversion into Class A | | (1,336,404 | ) | | | (7,275,258 | ) |
| | | | | | | |
Net increase (decrease) in shares outstanding | | (2,383,583 | ) | | $ | (12,854,238 | ) |
| | | | | | | |
Period ended August 31, 2007:* | | | | | | | |
Shares sold | | 260,201 | | | $ | 1,524,108 | |
Shares issued in connection with the merger | | 6,982,569 | | | | 40,778,200 | |
Shares issued in reinvestment of dividends | | 105,848 | | | | 608,688 | |
Shares reacquired | | (1,385,776 | ) | | | (7,913,710 | ) |
| | | | | | | |
Net increase (decrease) in shares outstanding before conversion | | 5,962,842 | | | | 34,997,286 | |
Shares reacquired upon conversion into Class A | | (721,313 | ) | | | (4,167,270 | ) |
| | | | | | | |
Net increase (decrease) in shares outstanding | | 5,241,529 | | | $ | 30,830,016 | |
| | | | | | | |
| | |
| 50 | | Visit our website at www.jennisondryden.com |
| | | | | | | |
Class R | | Shares | | | Amount | |
Year ended August 31, 2008: | | | | | | | |
Shares sold | | 219,789 | | | $ | 1,194,909 | |
Shares issued in reinvestment of dividends | | 17,773 | | | | 95,768 | |
Shares reacquired | | (140,321 | ) | | | (750,426 | ) |
| | | | | | | |
Net increase (decrease) in shares outstanding | | 97,241 | | | $ | 540,251 | |
| | | | | | | |
Eight month period ended August 31, 2007: | | | | | | | |
Shares sold | | 158,002 | | | $ | 919,724 | |
Shares issued in reinvestment of dividends | | 3,099 | | | | 17,729 | |
Shares reacquired | | (10,977 | ) | | | (63,072 | ) |
| | | | | | | |
Net increase (decrease) in shares outstanding | | 150,124 | | | $ | 874,381 | |
| | | | | | | |
Year ended December 31, 2006: | | | | | | | |
Shares sold | | 1,751 | | | $ | 10,159 | |
Shares issued in reinvestment of dividends | | 4 | | | | 23 | |
| | | | | | | |
Net increase (decrease) in shares outstanding | | 1,755 | | | $ | 10,182 | |
| | | | | | | |
Class X | | | | | | |
Year ended August 31, 2008: | | | | | | | |
Shares sold | | 117,917 | | | $ | 645,784 | |
Shares issued in reinvestment of dividends | | 53,019 | | | | 286,511 | |
Shares reacquired | | (301,433 | ) | | | (1,613,890 | ) |
| | | | | | | |
Net increase (decrease) in shares outstanding before conversion | | (130,497 | ) | | | (681,595 | ) |
Shares reacquired upon conversion into Class A | | (9,975 | ) | | | (52,370 | ) |
| | | | | | | |
Net increase (decrease) in shares outstanding | | (140,472 | ) | | $ | (733,965 | ) |
| | | | | | | |
Period ended August 31, 2007:* | | | | | | | |
Shares sold | | 54,609 | | | $ | 318,373 | |
Shares issued in connection with the merger | | 980,139 | | | | 5,724,011 | |
Shares issued in reinvestment of dividends | | 21,642 | | | | 124,318 | |
Shares reacquired | | (224,864 | ) | | | (1,293,649 | ) |
| | | | | | | |
Net increase (decrease) in shares outstanding before conversion | | 831,526 | | | | 4,873,053 | |
Shares reacquired upon conversion into Class A | | (19,463 | ) | | | (113,677 | ) |
| | | | | | | |
Net increase (decrease) in shares outstanding | | 812,063 | | | $ | 4,759,376 | |
| | | | | | | |
| | |
| Dryden High Yield Fund, Inc. | | 51 |
Notes to Financial Statements
continued
| | | | | | | |
Class Z | | Shares | | | Amount | |
Year ended August 31, 2008: | | | | | | | |
Shares sold | | 2,323,371 | | | $ | 12,574,885 | |
Shares issued in reinvestment of dividends | | 337,365 | | | | 1,826,281 | |
Shares reacquired | | (1,917,854 | ) | | | (10,466,646 | ) |
| | | | | | | |
Net increase (decrease) in shares outstanding | | 742,882 | | | $ | 3,934,520 | |
| | | | | | | |
Eight month period ended August 31, 2007: | | | | | | | |
Shares sold | | 900,020 | | | $ | 5,258,724 | |
Shares issued in reinvestment of dividends | | 242,217 | | | | 1,408,599 | |
Shares reacquired | | (2,570,553 | ) | | | (14,883,064 | ) |
| | | | | | | |
Net increase (decrease) in shares outstanding | | (1,428,316 | ) | | $ | (8,215,741 | ) |
| | | | | | | |
Year ended December 31, 2006: | | | | | | | |
Shares sold | | 2,376,052 | | | $ | 13,504,192 | |
Shares issued in reinvestment of dividends | | 361,808 | | | | 2,065,845 | |
Shares reacquired | | (1,741,855 | ) | | | (9,893,298 | ) |
| | | | | | | |
Net increase (decrease) in shares outstanding | | 996,005 | | | $ | 5,676,739 | |
| | | | | | | |
| * | Commenced operations on March 26, 2007. |
Note 7. Reorganization
On March 23, 2007, the Fund acquired all of the net assets of Strategic Partners High Yield Fund (the merged fund) pursuant to a plan of reorganization approved by the Strategic Partners High Yield Fund shareholders on December 21, 2006. The acquisition was accomplished by a tax-free issue of Class A, Class B, Class C, Class L, Class M and Class X shares for the corresponding classes of shares of Strategic Partners High Yield Bond Fund. The following table shows the number of shares of the merged fund and how many shares they became in the Dryden High Yield Fund and total value.
| | | | | | | | | |
Strategic Partners
High Yield Fund | | Dryden High Yield Fund |
| Class | | Shares | | Class | | Shares | | Value |
| A | | 1,792,422 | | A | | 2,261,473 | | $ | 13,229,616 |
| B | | 248,503 | | B | | 314,291 | | | 1,835,459 |
| C | | 1,380,697 | | C | | 1,741,136 | | | 10,185,647 |
| L | | 1,128,814 | | L | | 1,422,148 | | | 8,333,789 |
| M | | 5,528,608 | | M | | 6,982,569 | | | 40,778,200 |
| X | | 775,952 | | X | | 980,139 | | | 5,724,011 |
| | |
| 52 | | Visit our website at www.jennisondryden.com |
The aggregate net assets and net unrealized appreciation (depreciation) of the Merged fund immediately before the acquisition were:
| | | | | | |
| | | Total Net
Assets | | Net
Unrealized
Appreciation |
Strategic Partners High Yield Bond Fund | | $ | 80,086,722 | | $ | 2,728,192 |
The aggregate net assets of Dryden High Yield Fund immediately before the acquisition was $1,458,375,754.
Note 8. Borrowings and Overdrafts
The Fund, along with other affiliated registered investment companies (the “Funds”), is a party to a Syndicated Credit Agreement (“SCA”) with two banks. The SCA provides for a commitment of $500 million. Interest on any borrowings under the SCA is incurred at contracted market rates and a commitment fee for the unused amount is accrued daily and paid quarterly. Effective October 24, 2008, the Funds renewed the SCA with the banks. The commitment under the renewed SCA continues to be $500 million. The Funds pay a commitment fee of ..13 of 1% of the unused portion of the renewed SCA. The expiration date of the renewed SCA will be October 23, 2009. For the period from October 26, 2007 through October 23, 2008, the Funds paid a commitment fee of .06 of 1% of the unused portion of the agreement. The purpose of the SCA is to provide an alternative source of temporary funding for capital share redemptions.
The Fund utilized the line of credit during the year ended August 31, 2008. The average daily balance for the 13 days the Fund had an outstanding balance was $8,946,615 at a weighted average interest rate of 4.932%.
During the year ended August 31, 2008, the Fund paid interest to the custodian for temporary overdrawn balances. The average outstanding balance was $1,026,919 for 184 days at a weighted average interest rate of 5.24%.
Note 9. New Accounting Pronouncements
On September 20, 2006, the Financial Accounting Standards Board (“FASB”) released Statement of Financial Accounting Standards No. 157 “Fair Value Measurements” (“FAS 157”). FAS 157 establishes an authoritative definition of fair value, sets out a framework for measuring fair value, and requires additional disclosures about fair-value measurements. The application of FAS 157 is required for fiscal years beginning after November 15, 2007 and interim periods within those fiscal years. At this time,
| | |
| Dryden High Yield Fund, Inc. | | 53 |
Notes to Financial Statements
continued
management is evaluating the implications of FAS 157 and its impact, if any, on the financial statements has not yet been determined.
In addition, in March 2008, the Financial Accounting Standards Board (“FASB”) released Statement of Financial Accounting Standards No. 161, “Disclosures about Derivative Instruments and Hedging Activities” (“FAS 161”). FAS 161 requires qualitative disclosures about objectives and strategies for using derivatives, quantitative disclosures about fair value amounts of and gains and losses on derivative instruments, and disclosures about credit-risk-related contingent features in derivative agreements. The application of FAS 161 is required for any reporting period beginning after November 15, 2008. At this time, management is evaluating the implications of FAS 161 and its impact on the financial statements has not yet been determined.
Note 10. Subsequent Events
As noted in the Portfolio of Investments, the Fund held securities issued by Lehman Brothers Holdings, Inc. (Lehman). Subsequent to the year end, Lehman filed for Chapter 11 bankruptcy. The values of the positions held by the Fund have been adversely impacted since the date of these financial statements; however, the impact on the net assets of the Fund is not material.
As a result of the bankruptcy filing by Lehman Brothers Holdings Inc., which was the parent company to the Fund’s Securities Lending Counter Party, Lehman Brothers Inc. (Lehman), the Fund’s Securities Lending Agent utilized collateral held on behalf of the Fund for securities out on loan to compensate the Fund for the failure of Lehman to return the securities.
| | |
| 54 | | Visit our website at www.jennisondryden.com |
Financial Highlights
| | |
| AUGUST 31, 2008 | | ANNUAL REPORT |
Dryden High Yield Fund, Inc.
Financial Highlights
| | | | | | | | |
| | | Class A | |
| | | Year Ended
August 31, 2008 | | | Eight Month
Period Ended
August 31, 2007(e) | |
Per Share Operating Performance: | | | | | | | | |
Net Asset Value, Beginning Of Period | | $ | 5.58 | | | $ | 5.80 | |
| | | | | | | | |
Income (loss) from investment operations: | | | | | | | | |
Net investment income | | | .43 | | | | .28 | |
Net realized and unrealized gain (loss) on investment transactions | | | (.38 | ) | | | (.22 | ) |
| | | | | | | | |
Total from investment operations | | | .05 | | | | .06 | |
| | | | | | | | |
Less Dividends: | | | | | | | | |
Dividends from net investment income | | | (.44 | ) | | | (.28 | ) |
| | | | | | | | |
Net asset value, end of period | | $ | 5.19 | | | $ | 5.58 | |
| | | | | | | | |
Total Return(a): | | | .86 | % | | | .82 | % |
Ratios/Supplemental Data: | | | | | | | | |
Net assets, end of period (000) | | $ | 955,165 | | | $ | 1,099,469 | |
Average net assets (000) | | $ | 1,024,892 | | | $ | 1,170,148 | |
Ratios to average net assets(f): | | | | | | | | |
Expenses, including distribution and service (12b-1) fees(b) | | | .88 | % | | | .92 | %(c) |
Expenses, excluding distribution and service (12b-1) fees | | | .63 | % | | | .67 | %(c) |
Net investment income | | | 7.99 | % | | | 7.20 | %(c) |
Portfolio turnover rate | | | 63 | % | | | 34 | %(d) |
| (a) | Total return does not consider the effects of sales loads. Total return is calculated assuming a purchase of shares on the first day and a sale on the last day of each period reported, and includes reinvestment of dividends and distributions. Total investment returns may reflect adjustments to conform to generally accepted accounting principles. Total returns for periods less than one full year are not annualized. |
| (b) | The distributor of the Fund contractually agreed to limit its distribution and service (12b-1) fees to .25 of 1% of the average daily net assets of the Class A shares. |
| (e) | For the period ended August 31, 2007. The Fund changed its fiscal year end from December 31 to August 31. |
| (f) | Does not include expenses of the underlying portfolios in which the Portfolio invests. |
See Notes to Financial Statements.
| | |
| 56 | | Visit our website at www.jennisondryden.com |
| | | | | | | | | | | | | | |
|
| Class A | |
| Year Ended December 31, | |
| 2006 | | | 2005 | | | 2004 | | | 2003 | |
| | | | | | | | | | | | | | |
| $ | 5.67 | | | $ | 5.93 | | | $ | 5.80 | | | $ | 4.99 | |
| | | | | | | | | | | | | | | |
| | | | | | | | | | | | | | |
| | .41 | | | | .41 | | | | .41 | | | | .43 | |
| | | |
| | .15 | | | | (.24 | ) | | | .14 | | | | .82 | |
| | | | | | | | | | | | | | | |
| | .56 | | | | .17 | | | | .55 | | | | 1.25 | |
| | | | | | | | | | | | | | | |
| | | | | | | | | | | | | | |
| | (.43 | ) | | | (.43 | ) | | | (.42 | ) | | | (.44 | ) |
| | | | | | | | | | | | | | | |
| $ | 5.80 | | | $ | 5.67 | | | $ | 5.93 | | | $ | 5.80 | |
| | | | | | | | | | | | | | | |
| | 10.24 | % | | | 3.07 | % | | | 9.93 | % | | | 25.66 | % |
| | | | | | | | | | | | | | |
| $ | 1,201,400 | | | $ | 1,251,927 | | | $ | 1,336,703 | | | $ | 1,364,999 | |
| $ | 1,205,856 | | | $ | 1,287,410 | | | $ | 1,318,334 | | | $ | 1,268,769 | |
| | | | | | | | | | | | | | |
| | | |
| | .86 | % | | | .90 | % | | | .89 | % | | | .90 | % |
| | | |
| | .61 | % | | | .65 | % | | | .64 | % | | | .65 | % |
| | 7.32 | % | | | 7.09 | % | | | 7.08 | % | | | 7.93 | % |
| | 40 | % | | | 51 | % | | | 55 | % | | | 68 | % |
See Notes to Financial Statements.
| | |
| Dryden High Yield Fund, Inc. | | 57 |
Financial Highlights
continued
| | | | | | | | |
| | | Class B | |
| | | Year Ended
August 31, 2008 | | | Eight Month
Period Ended
August 31, 2007(c) | |
Per Share Operating Performance: | | | | | | | | |
Net Asset Value, Beginning Of Period | | $ | 5.58 | | | $ | 5.79 | |
| | | | | | | | |
Income (loss) from investment operations: | | | | | | | | |
Net investment income | | | .40 | | | | .26 | |
Net realized and unrealized gain (loss) on investment transactions | | | (.38 | ) | | | (.21 | ) |
| | | | | | | | |
Total from investment operations | | | .02 | | | | .05 | |
| | | | | | | | |
Less Dividends: | | | | | | | | |
Dividends from net investment income | | | (.41 | ) | | | (.26 | ) |
| | | | | | | | |
Net asset value, end of period | | $ | 5.19 | | | $ | 5.58 | |
| | | | | | | | |
Total Return(a): | | | .37 | % | | | .50 | % |
Ratios/Supplemental Data: | | | | | | | | |
Net assets, end of period (000) | | $ | 109,152 | | | $ | 160,265 | |
Average net assets (000) | | $ | 132,653 | | | $ | 178,973 | |
Ratios to average net assets(d): | | | | | | | | |
Expenses, including distribution and service (12b-1) fees | | | 1.38 | % | | | 1.42 | %(b) |
Expenses, excluding distribution and service (12b-1) fees | | | .63 | % | | | .67 | %(b) |
Net investment income | | | 7.48 | % | | | 6.69 | %(b) |
| (a) | Total return does not consider the effects of sales loads. Total return is calculated assuming a purchase of shares on the first day and a sale on the last day of each period reported, and includes reinvestment of dividends and distributions. Total investment returns may reflect adjustments to conform to generally accepted accounting principles. Total returns for periods less than one full year are not annualized. |
| (c) | For the period ended August 31, 2007. The Fund changed its fiscal year end from December 31 to August 31. |
| (d) | Does not include expenses of the underlying portfolios in which the Portfolio invests. |
See Notes to Financial Statements.
| | |
| 58 | | Visit our website at www.jennisondryden.com |
| | | | | | | | | | | | | | |
|
| Class B | |
| Year Ended December 31, | |
| 2006 | | | 2005 | | | 2004 | | | 2003 | |
| | | | | | | | | | | | | | |
| $ | 5.66 | | | $ | 5.92 | | | $ | 5.79 | | | $ | 4.98 | |
| | | | | | | | | | | | | | | |
| | | | | | | | | | | | | | |
| | .38 | | | | .38 | | | | .38 | | | | .40 | |
| | | |
| | .15 | | | | (.24 | ) | | | .14 | | | | .82 | |
| | | | | | | | | | | | | | | |
| | .53 | | | | .14 | | | | .52 | | | | 1.22 | |
| | | | | | | | | | | | | | | |
| | | | | | | | | | | | | | |
| | (.40 | ) | | | (.40 | ) | | | (.39 | ) | | | (.41 | ) |
| | | | | | | | | | | | | | | |
| $ | 5.79 | | | $ | 5.66 | | | $ | 5.92 | | | $ | 5.79 | |
| | | | | | | | | | | | | | | |
| | 9.70 | % | | | 2.54 | % | | | 9.39 | % | | | 25.08 | % |
| | | | | | | | | | | | | | |
| $ | 191,778 | | | $ | 281,304 | | | $ | 477,841 | | | $ | 618,539 | |
| $ | 232,435 | | | $ | 380,450 | | | $ | 545,044 | | | $ | 629,849 | |
| | | | | | | | | | | | | | |
| | | |
| | 1.36 | % | | | 1.40 | % | | | 1.39 | % | | | 1.40 | % |
| | | |
| | .61 | % | | | .65 | % | | | .64 | % | | | .65 | % |
| | 6.82 | % | | | 6.57 | % | | | 6.62 | % | | | 7.44 | % |
See Notes to Financial Statements.
| | |
| Dryden High Yield Fund, Inc. | | 59 |
Financial Highlights
continued
| | | | | | | | |
| | | Class C | |
| | | Year Ended
August 31, 2008 | | | Eight Month
Period Ended
August 31, 2007(d) | |
Per Share Operating Performance: | | | | | | | | |
Net Asset Value, Beginning Of Period | | $ | 5.58 | | | $ | 5.79 | |
| | | | | | | | |
Income (loss) from investment operations: | | | | | | | | |
Net investment income | | | .40 | | | | .26 | |
Net realized and unrealized gain (loss) on investment transactions | | | (.39 | ) | | | (.21 | ) |
| | | | | | | | |
Total from investment operations | | | .01 | | | | .05 | |
| | | | | | | | |
Less Dividends: | | | | | | | | |
Dividends from net investment income | | | (.41 | ) | | | (.26 | ) |
| | | | | | | | |
Net asset value, end of period | | $ | 5.18 | | | $ | 5.58 | |
| | | | | | | | |
Total Return(a): | | | .18 | % | | | .49 | % |
Ratios/Supplemental Data: | | | | | | | | |
Net assets, end of period (000) | | $ | 49,660 | | | $ | 56,307 | |
Average net assets (000) | | $ | 52,804 | | | $ | 58,540 | |
Ratios to average net assets(e): | | | | | | | | |
Expenses, including distribution and service (12b-1) fees(b) | | | 1.38 | % | | | 1.42 | %(c) |
Expenses, excluding distribution and service (12b-1) fees | | | .63 | % | | | .67 | %(c) |
Net investment income | | | 7.49 | % | | | 6.70 | %(c) |
| (a) | Total return does not consider the effects of sales loads. Total return is calculated assuming a purchase of shares on the first day and a sale on the last day of each period reported, and includes reinvestment of dividends and distributions. Total investment returns may reflect adjustments to conform to generally accepted accounting principles. Total returns for periods less than one full year are not annualized. |
| (b) | The distributor of the Fund contractually agreed to limit its distribution and service (12b-1) fees to .75 of 1% of the average daily net assets of the Class C shares. |
| (d) | For the period ended August 31, 2007. The Fund changed its fiscal year end from December 31 to August 31. |
| (e) | Does not include expenses of the underlying portfolios in which the Portfolio invests. |
See Notes to Financial Statements.
| | |
| 60 | | Visit our website at www.jennisondryden.com |
| | | | | | | | | | | | | | |
|
| Class C | |
| Year Ended December 31, | |
| 2006 | | | 2005 | | | 2004 | | | 2003 | |
| | | | | | | | | | | | | | |
| $ | 5.66 | | | $ | 5.92 | | | $ | 5.79 | | | $ | 4.98 | |
| | | | | | | | | | | | | | | |
| | | | | | | | | | | | | | |
| | .38 | | | | .38 | | | | .38 | | | | .40 | |
| | | |
| | .15 | | | | (.24 | ) | | | .14 | | | | .82 | |
| | | | | | | | | | | | | | | |
| | .53 | | | | .14 | | | | .52 | | | | 1.22 | |
| | | | | | | | | | | | | | | |
| | | | | | | | | | | | | | |
| | (.40 | ) | | | (.40 | ) | | | (.39 | ) | | | (.41 | ) |
| | | | | | | | | | | | | | | |
| $ | 5.79 | | | $ | 5.66 | | | $ | 5.92 | | | $ | 5.79 | |
| | | | | | | | | | | | | | | |
| | 9.69 | % | | | 2.54 | % | | | 9.39 | % | | | 25.08 | % |
| | | | | | | | | | | | | | |
| $ | 54,036 | | | $ | 62,127 | | | $ | 83,412 | | | $ | 97,291 | |
| $ | 55,946 | | | $ | 70,914 | | | $ | 88,295 | | | $ | 90,157 | |
| | | | | | | | | | | | | | |
| | | |
| | 1.36 | % | | | 1.40 | % | | | 1.39 | % | | | 1.40 | % |
| | | |
| | .61 | % | | | .65 | % | | | .64 | % | | | .65 | % |
| | 6.82 | % | | | 6.57 | % | | | 6.61 | % | | | 7.42 | % |
See Notes to Financial Statements.
| | |
| Dryden High Yield Fund, Inc. | | 61 |
Financial Highlights
continued
| | | | | | | | |
| | | Class L | |
| | | Year Ended
August 31, 2008 | | | March 26, 2007(a)
through
August 31, 2007(b) | |
Per Share Operating Performance: | | | | | | | | |
Net Asset Value, Beginning Of Period | | $ | 5.59 | | | $ | 5.86 | |
| | | | | | | | |
Income (loss) from investment operations: | | | | | | | | |
Net investment income | | | .42 | | | | .18 | |
Net realized and unrealized gain (loss) on investment transactions | | | (.39 | ) | | | (.27 | ) |
| | | | | | | | |
Total from investment operations | | | .03 | | | | (.09 | ) |
| | | | | | | | |
Less Dividends: | | | | | | | | |
Dividends from net investment income | | | (.43 | ) | | | (.18 | ) |
| | | | | | | | |
Net asset value, end of period | | $ | 5.19 | | | $ | 5.59 | |
| | | | | | | | |
Total Return(c): | | | .44 | % | | | (1.93 | )% |
Ratios/Supplemental Data: | | | | | | | | |
Net assets, end of period (000) | | $ | 5,114 | | | $ | 6,688 | |
Average net assets (000) | | $ | 5,980 | | | $ | 7,546 | |
Ratios to average net assets(e): | | | | | | | | |
Expenses, including distribution and service (12b-1) fees | | | 1.13 | % | | | 1.17 | %(d) |
Expenses, excluding distribution and service (12b-1) fees | | | .63 | % | | | .67 | %(d) |
Net investment income | | | 7.73 | % | | | 6.97 | %(d) |
| (a) | Inception date of Class L shares. |
| (b) | The Fund changed its fiscal year end from December 31 to August 31. |
| (c) | Total return does not consider the effects of sales loads. Total return is calculated assuming a purchase of shares on the first day and a sale on the last day of each period reported, and includes reinvestment of dividends and distributions. Total investment returns may reflect adjustments to conform to generally accepted accounting principles. Total returns for periods less than one full year are not annualized. |
| (e) | Does not include expenses of the underlying portfolios in which the Portfolio invests. |
See Notes to Financial Statements.
| | |
| 62 | | Visit our website at www.jennisondryden.com |
| | | | | | | | |
| | | Class M | |
| | | Year Ended
August 31, 2008 | | | March 26, 2007(a)
through
August 31, 2007(b) | |
Per Share Operating Performance: | | | | | | | | |
Net Asset Value, Beginning Of Period | | $ | 5.57 | | | $ | 5.84 | |
| | | | | | | | |
Income (loss) from investment operations: | | | | | | | | |
Net investment income | | | .39 | | | | .17 | |
Net realized and unrealized loss on investment
transactions | | | (.37 | ) | | | (.27 | ) |
| | | | | | | | |
Total from investment operations | | | .02 | | | | (.10 | ) |
| | | | | | | | |
Less Dividends: | | | | | | | | |
Dividends from net investment income | | | (.40 | ) | | | (.17 | ) |
| | | | | | | | |
Net asset value, end of period | | $ | 5.19 | | | $ | 5.57 | |
| | | | | | | | |
Total Return(c): | | | .28 | % | | | (1.96 | )% |
Ratios/Supplemental Data: | | | | | | | | |
Net assets, end of period (000) | | $ | 14,831 | | | $ | 29,221 | |
Average net assets (000) | | $ | 22,037 | | | $ | 36,125 | |
Ratios to average net assets(e): | | | | | | | | |
Expenses, including distribution and service (12b-1) fees | | | 1.63 | % | | | 1.67 | %(d) |
Expenses, excluding distribution and service (12b-1) fees | | | .63 | % | | | .67 | %(d) |
Net investment income | | | 7.21 | % | | | 6.63 | %(d) |
| (a) | Inception date of Class M shares. |
| (b) | The Fund changed its fiscal year end from December 31 to August 31. |
| (c) | Total return does not consider the effects of sales loads. Total return is calculated assuming a purchase of shares on the first day and a sale on the last day of each period reported, and includes reinvestment of dividends and distributions. Total investment returns may reflect adjustments to conform to generally accepted accounting principles. Total returns for periods less than one full year are not annualized. |
| (e) | Does not include expenses of the underlying portfolios in which the Portfolio invests. |
See Notes to Financial Statements.
| | |
| Dryden High Yield Fund, Inc. | | 63 |
Financial Highlights
continued
| | | | |
| | | Class R | |
| |
| | | Year Ended
August 31, 2008 | |
Per Share Operating Performance: | | | | |
Net Asset Value, Beginning Of Period | | $ | 5.59 | |
| | | | |
Income (loss) from investment operations: | | | | |
Net investment income | | | .42 | |
Net realized and unrealized gain (loss) on investment transactions | | | (.39 | ) |
| | | | |
Total from investment operations | | | .03 | |
| | | | |
Less Dividends: | | | | |
Dividends from net investment income | | | (.43 | ) |
| | | | |
Net asset value, end of period | | $ | 5.19 | |
| | | | |
Total Return(b): | | | .47 | % |
Ratios/Supplemental Data: | | | | |
Net assets, end of period (000) | | $ | 1,295 | |
Average net assets (000) | | $ | 1,221 | |
Ratios to average net assets(f): | | | | |
Expenses, including distribution and service (12b-1) fees(c) | | | 1.13 | % |
Expenses, excluding distribution and service (12b-1) fees | | | .63 | % |
Net investment income | | | 7.78 | % |
| (a) | Inception date of Class R shares. |
| (b) | Total return does not consider the effects of sales loads. Total return is calculated assuming a purchase of shares on the first day and a sale on the last day of each period reported, and includes reinvestment of dividends and distributions. Total investment returns may reflect adjustments to conform to generally accepted accounting principles. Total returns for periods less than one full year are not annualized. |
| (c) | During the period, the distributor of the Fund contractually agreed to limit its distribution and service (12b-1) fees to .50 of 1% of the average daily net assets of the Class R shares. |
| (e) | For the period ended August 31, 2007. The Fund changed its fiscal year end from December 31 to August 31. |
| (f) | Does not include expenses of the underlying portfolios in which the Portfolio invests. |
See Notes to Financial Statements.
| | |
| 64 | | Visit our website at www.jennisondryden.com |
| | | | | | | | | | |
| Class R | |
Eight Month
Period Ended
August 31, 2007(e) | | | Year Ended
December 31, 2006 | | | June 6, 2005(a)
through
December 31, 2005 | |
| | | | | | | | | | |
| $ | 5.81 | | | $ | 5.67 | | | $ | 5.75 | |
| | | | | | | | | | | |
| | | | | | | | | | |
| | .27 | | | | .42 | | | | .23 | |
| | (.21 | ) | | | .15 | | | | (.06 | ) |
| | | | | | | | | | | |
| | .06 | | | | .57 | | | | .17 | |
| | | | | | | | | | | |
| | | | | | | | | | |
| | (.28 | ) | | | (.43 | ) | | | (.25 | ) |
| | | | | | | | | | | |
| $ | 5.59 | | | $ | 5.81 | | | $ | 5.67 | |
| | | | | | | | | | | |
| | .56 | % | | | 10.45 | % | | | 2.98 | % |
| | | | | | | | | | |
| $ | 851 | | | $ | 13 | | | $ | 2 | |
| $ | 401 | | | $ | 3 | | | $ | 2 | |
| | | | | | | | | | |
| | 1.17 | %(d) | | | 1.11 | % | | | 1.15 | %(d) |
| | .67 | %(d) | | | .61 | % | | | .65 | %(d) |
| | 7.19 | %(d) | | | 7.45 | % | | | 6.75 | %(d) |
See Notes to Financial Statements.
| | |
| Dryden High Yield Fund, Inc. | | 65 |
Financial Highlights
continued
| | | | | | | | |
| | | Class X | |
| | | Year Ended
August 31, 2008 | | | March 26, 2007(a)
through
August 31, 2007(b) | |
Per Share Operating Performance: | | | | | | | | |
Net Asset Value, Beginning Of Period | | $ | 5.57 | | | $ | 5.84 | |
| | | | | | | | |
Income (loss) from investment operations: | | | | | | | | |
Net investment income | | | .38 | | | | .13 | |
Net realized and unrealized loss on investment transactions | | | (.36 | ) | | | (.23 | ) |
| | | | | | | | |
Total from investment operations | | | .02 | | | | (.10 | ) |
| | | | | | | | |
Less Dividends: | | | | | | | | |
Dividends from net investment income | | | (.40 | ) | | | (.17 | ) |
| | | | | | | | |
Net asset value, end of period | | $ | 5.19 | | | $ | 5.57 | |
| | | | | | | | |
Total Return(c): | | | .30 | % | | | (1.97 | )% |
Ratios/Supplemental Data: | | | | | | | | |
Net assets, end of period (000) | | $ | 3,482 | | | $ | 4,527 | |
Average net assets (000) | | $ | 4,230 | | | $ | 5,300 | |
Ratios to average net assets(e): | | | | | | | | |
Expenses, including distribution and service (12b-1) fees | | | 1.63 | % | | | 1.67 | %(d) |
Expenses, excluding distribution and service (12b-1) fees | | | .63 | % | | | .67 | %(d) |
Net investment income | | | 7.24 | % | | | 5.43 | %(d) |
| (a) | Inception date of Class X shares. |
| (b) | The Fund changed its fiscal year end from December 31 to August 31. |
| (c) | Total return does not consider the effects of sales loads. Total return is calculated assuming a purchase of shares on the first day and a sale on the last day of each period reported, and includes reinvestment of dividends and distributions. Total investment returns may reflect adjustments to conform to generally accepted accounting principles. Total returns for periods less than one full year are not annualized. |
| (e) | Does not include expenses of the underlying portfolios in which the Portfolio invests. |
See Notes to Financial Statements.
| | |
| 66 | | Visit our website at www.jennisondryden.com |
This Page Intentionally Left Blank
Financial Highlights
continued
| | | | | | | | |
| | | Class Z | |
| | | Year Ended
August 31, 2008 | | | Eight Month
Period Ended
August 31, 2007(c) | |
Per Share Operating Performance: | | | | | | | | |
Net Asset Value, Beginning Of Period | | $ | 5.60 | | | $ | 5.81 | |
| | | | | | | | |
Income (loss) from investment operations: | | | | | | | | |
Net investment income | | | .45 | | | | .29 | |
Net realized and unrealized gain (loss) on investment transactions | | | (.39 | ) | | | (.21 | ) |
| | | | | | | | |
Total from investment operations | | | .06 | | | | .08 | |
| | | | | | | | |
Less Dividends: | | | | | | | | |
Dividends from net investment income | | | (.46 | ) | | | (.29 | ) |
| | | | | | | | |
Net asset value, end of period | | $ | 5.20 | | | $ | 5.60 | |
| | | | | | | | |
Total Return(a): | | | .96 | % | | | .98 | % |
Ratios/Supplemental Data: | | | | | | | | |
Net assets, end of period (000) | | $ | 23,728 | | | $ | 21,364 | |
Average net assets (000) | | $ | 22,081 | | | $ | 29,101 | |
Ratios to average net assets(d): | | | | | | | | |
Expenses, including distribution and service (12b-1) fees | | | .63 | % | | | .67 | %(b) |
Expenses, excluding distribution and service (12b-1) fees | | | .63 | % | | | .67 | %(b) |
Net investment income | | | 8.24 | % | | | 7.41 | %(b) |
| (a) | Total return does not consider the effects of sales loads. Total return is calculated assuming a purchase of shares on the first day and a sale on the last day of each period reported, and includes reinvestment of dividends and distributions. Total investment returns may reflect adjustments to conform to generally accepted accounting principles. Total returns for periods less than one full year are not annualized. |
| (c) | For the period ended August 31, 2007. The Fund changed its fiscal year end from December 31 to August 31. |
| (d) | Does not include expenses of the underlying portfolios in which the Portfolio invests. |
See Notes to Financial Statements.
| | |
| 68 | | Visit our website at www.jennisondryden.com |
| | | | | | | | | | | | | | |
|
| Class Z | |
| Year Ended December 31, | |
| 2006 | | | 2005 | | | 2004 | | | 2003 | |
| | | | | | | | | | | | | | |
| $ | 5.68 | | | $ | 5.94 | | | $ | 5.81 | | | $ | 5.00 | |
| | | | | | | | | | | | | | | |
| | | | | | | | | | | | | | |
| | .43 | | | | .43 | | | | .42 | | | | .44 | |
| | | |
| | .14 | | | | (.24 | ) | | | .15 | | | | .82 | |
| | | | | | | | | | | | | | | |
| | .57 | | | | .19 | | | | .57 | | | | 1.26 | |
| | | | | | | | | | | | | | | |
| | | | | | | | | | | | | | |
| | (.44 | ) | | | (.45 | ) | | | (.44 | ) | | | (.45 | ) |
| | | | | | | | | | | | | | | |
| $ | 5.81 | | | $ | 5.68 | | | $ | 5.94 | | | $ | 5.81 | |
| | | | | | | | | | | | | | | |
| | 10.51 | % | | | 3.32 | % | | | 10.20 | % | | | 25.94 | % |
| | | | | | | | | | | | | | |
| $ | 30,486 | | | $ | 24,130 | | | $ | 32,548 | | | $ | 52,951 | |
| $ | 26,634 | | | $ | 29,298 | | | $ | 32,828 | | | $ | 56,046 | |
| | | | | | | | | | | | | | |
| | | |
| | .61 | % | | | .65 | % | | | .64 | % | | | .65 | % |
| | | |
| | .61 | % | | | .65 | % | | | .64 | % | | | .65 | % |
| | 7.58 | % | | | 7.32 | % | | | 7.32 | % | | | 8.17 | % |
See Notes to Financial Statements.
| | |
| Dryden High Yield Fund, Inc. | | 69 |
Report of Independent Registered Public Accounting Firm
The Board of Directors and Shareholders of
Dryden High Yield Fund, Inc.
We have audited the accompanying statement of assets and liabilities of Dryden High Yield Fund, Inc. (hereafter referred to as the “Fund”), including the portfolio of investments, as of August 31, 2008, and the related statement of operations for the year then ended, the statement of changes in net assets for the year then ended, the eight month period ended August 31, 2007 and the year ended December 31, 2006, and the financial highlights for the year then ended, the eight month period ended August 31, 2007 and for each of the years in the three year period ended December 31, 2006. These financial statements and financial highlights are the responsibility of the Fund’s management. Our responsibility is to express an opinion on these financial statements and financial highlights based on our audits. The financial highlights for the year ended December 31, 2003, were audited by another independent registered public accounting firm, whose report dated February 20, 2004, expressed an unqualified opinion thereon.
We conducted our audits in accordance with the standards of the Public Company Accounting Oversight Board (United States). Those standards require that we plan and perform the audit to obtain reasonable assurance about whether the financial statements and financial highlights are free of material misstatement. An audit includes examining, on a test basis, evidence supporting the amounts and disclosures in the financial statements. Our procedures included confirmation of securities owned as of August 31, 2008, by correspondence with the custodian and brokers or by other appropriate auditing procedures where replies from brokers were not received. An audit also includes assessing the accounting principles used and significant estimates made by management, as well as evaluating the overall financial statement presentation. We believe that our audits provide a reasonable basis for our opinion.
In our opinion, the financial statements and financial highlights referred to above present fairly, in all material respects, the financial position of the Dryden High Yield Fund, Inc. as of August 31, 2008, and the results of its operations for the year ended, the changes in its net assets for the year then ended, the eight month period ended August 31, 2007 and the year ended December 31, 2006, and the financial highlights for the year then ended, the eight month period ended August 31, 2007 and for each of the years in the three year period ended December 31, 2006, in conformity with U.S. generally accepted accounting principles.
New York, New York
October 27, 2008
| | |
| 70 | | Visit our website at www.jennisondryden.com |
Federal Income Tax Information
(Unaudited)
We are required by the Internal Revenue Code to advise you within 60 days of the Fund’s year end (August 31, 2008) as to the federal income tax status of dividends paid by the Fund during such fiscal period. We are advising you that during its fiscal period ended August 31, 2008, the Fund paid dividends for Class A, Class B, Class C, Class L, Class M, Class R, Class X and Class Z shares totaling $.44, $.41, $.41, $.43, $.40, $.43, $.40 and $.46 per share, of ordinary income, which is taxable as such, respectively.
The Fund intends to designate 93.08% of the ordinary income dividends as interest related dividends under The American Jobs Creation Act of 2004.
In January 2009, you will be advised on IRS Form 1099-DIV or substitute 1099-DIV as to the federal tax status of the distributions received by you in calendar year 2008.
For more detailed information regarding your state and local taxes, you should contact your tax advisor or the state/local taxing authorities.
| | |
| Dryden High Yield Fund, Inc. | | 71 |
MANAGEMENT OF THE FUND
(Unaudited)
Information about Fund Directors/Trustees (referred to herein as “Board Members”) and Fund Officers is set forth below. Board Members who are not deemed to be “interested persons,” as defined in the 1940 Act, are referred to as “Independent Board Members.” Board Members who are deemed to be “interested persons” are referred to as “Interested Board Members.” The Board Members are responsible for the overall supervision of the operations of the Fund and perform the various duties imposed on the directors or trustees of investment companies by the 1940 Act.
| | | | |
| Independent Board Members |
| | | |
Name, Address, Age Position(s) Portfolios Overseen (1) | | Principal Occupation(s) During Past Five Years | | Other Directorships Held |
Kevin J. Bannon (56)
Board Member
Portfolios Overseen: 63 | | Managing Director (since April 2008) of Highmount Capital LLC (registered investment adviser); formerly Executive Vice President and Chief Investment Officer (January 2003-August 2007) of Bank of New York Company; President (May 2003-May 2007) of BNY Hamilton Family of Mutual Funds. | | None. |
Linda W. Bynoe (56)
Board Member
Portfolios Overseen: 63 | | President and Chief Executive Officer (since March 1995) of Telemat Ltd. (management consulting); formerly Vice President at Morgan Stanley & Co. (broker-dealer). | | Director of Simon Property Group, Inc. (real estate investment trust) (since May 2003); Anixter International (communication products distributor) (since January 2006); Director of Northern Trust Corporation (banking) (since April 2006). |
David E.A. Carson (74)
Board Member
Portfolios Overseen: 63 | | Director (since May 2008) of Liberty Bank; Director (since October 2007) of ICI Mutual Insurance Company; formerly President, Chairman and Chief Executive Officer of People’s Bank (1987 – 2000). | | None. |
Michael S. Hyland, CFA (63)
Board Member
Portfolios Overseen: 63 | | Independent Consultant (since February 2005); formerly Senior Managing Director (July 2001-February 2005) of Bear Stearns & Co., Inc. | | None. |
Robert E. La Blanc (74)
Board Member
Portfolios Overseen: 63 | | President (since 1981) of Robert E. La Blanc Associates, Inc. (telecommunications). | | Director of CA, Inc. (since 2002) (software company); FiberNet Telecom Group, Inc. (since 2003) (telecom company). |
Visit our website at www.jennisondryden.com
| | | | |
Douglas H. McCorkindale (69)
Board Member
Portfolios Overseen: 63 | | Formerly Chairman (February 2001-June 2006), Chief Executive Officer (June 2000-July 2005), President (September 1997-July 2005) and Vice Chairman (March 1984-May 2000) of Gannett Co. Inc. (publishing and media). | | Director of Continental Airlines, Inc. (since May 1993); Director of Lockheed Martin Corp. (aerospace and defense) (since May 2001). |
Stephen P. Munn (66)
Board Member
Portfolios Overseen: 63 | | Lead Director (since 2007) and formerly Chairman (1993-2007) of Carlisle Companies Incorporated (manufacturer of industrial products). | | None. |
Richard A. Redeker (65)
Board Member
Portfolios Overseen: 63 | | Retired Mutual Fund Executive (36 years); Management Consultant; Director of Penn Tank Lines, Inc. (since 1999). | | None. |
Robin B. Smith (69)
Board Member & Independent Chair
Portfolios Overseen: 63 | | Chairman of the Board (since January 2003) of Publishers Clearing House (direct marketing); formerly Chairman and Chief Executive Officer (August 1996-January 2003) of Publishers Clearing House. | | Formerly Director of BellSouth Corporation (telecommunications) (1992-2006). |
Stephen G. Stoneburn (65)
Board Member
Portfolios Overseen: 63 | | President and Chief Executive Officer (since June 1996) of Quadrant Media Corp. (publishing company); formerly President (June 1995-June 1996) of Argus Integrated Media, Inc.; Senior Vice President and Managing Director (January 1993-1995) of Cowles Business Media; Senior Vice President of Fairchild Publications, Inc (1975-1989). | | None. |
| | | | |
| Interested Board Members |
Judy A. Rice (60)
Board Member & President Portfolios Overseen: 63 | | President, Chief Executive Officer, Chief Operating Officer and Officer-In-Charge (since February 2003) of Prudential Investments LLC; President, Chief Executive Officer and Officer-In-Charge (since April 2003) of Prudential Mutual Fund Services LLC; formerly Vice President (February 1999-April 2006) of Prudential Investment Management Services LLC; formerly President, Chief Executive Officer, Chief Operating Officer and Officer-In-Charge (May 2003-June 2005) and Director (May 2003-March 2006) and Executive Vice President (June 2005-March 2006) of AST Investment Services, Inc.; Member of Board of Governors of the Investment Company Institute. | | None. |
Dryden High Yield Fund, Inc.
| | | | |
Robert F. Gunia (61)
Board Member & Vice President
Portfolios Overseen: 147 | | Chief Administrative Officer (since September 1999) and Executive Vice President (since December 1996) of Prudential Investments LLC; President (since April 1999) of Prudential Investment Management Services LLC; Executive Vice President (since March 1999) and Treasurer (since May 2000) of Prudential Mutual Fund Services LLC; Chief Administrative Officer, Executive Vice President and Director (since May 2003) of AST Investment Services, Inc. | | Director (since May 1989) of The Asia Pacific Fund, Inc. and Vice President (since January 2007) of The Greater China Fund, Inc. |
1 | The year that each individual joined the Fund’s Board is as follows: |
Linda W. Bynoe, 2005; David E.A. Carson, 2003; Robert E. La Blanc, 2003; Douglas H. McCorkindale, 2003; Richard A. Redeker, 1995; Robin B. Smith, 2003; Stephen G. Stoneburn, 2003; Kevin J. Bannon, 2008; Michael S. Hyland, 2008; Stephen P. Munn, 2008; Judy A. Rice, Board Member since 2000 and President since 2003; Robert F. Gunia, Board Member since 1996 and Vice President since 1999.
Visit our website at www.jennisondryden.com
| | |
| Fund Officers (a)(1) |
| | |
Name, Address and Age
Position with Fund | | Principal Occupation(s) During Past Five Years |
Kathryn L. Quirk (55)
Chief Legal Officer | | Vice President and Corporate Counsel (since September 2004) of Prudential; Executive Vice President, Chief Legal Officer and Secretary (since July 2005) of PI and Prudential Mutual Fund Services LLC; Vice President and Corporate Counsel (since June 2005) and Secretary (since February 2006) of AST Investment Services, Inc.; formerly Senior Vice President and Assistant Secretary (November 2004-August 2005) of PI; formerly Assistant Secretary (June 2005-February 2006) of AST Investment Services, Inc.; formerly Managing Director, General Counsel, Chief Compliance Officer, Chief Risk Officer and Corporate Secretary (1997-2002) of Zurich Scudder Investments, Inc. |
Deborah A. Docs (50)
Secretary | | Vice President and Corporate Counsel (since January 2001) of Prudential; Vice President (since December 1996) and Assistant Secretary (since March 1999) of PI; formerly Vice President and Assistant Secretary (May 2003-June 2005) of AST Investment Services, Inc. |
Jonathan D. Shain (50)
Assistant Secretary | | Vice President and Corporate Counsel (since August 1998) of Prudential; Vice President and Assistant Secretary (since May 2001) of PI; Vice President and Assistant Secretary (since February 2001) of PMFS; formerly Vice President and Assistant Secretary (May 2003-June 2005) of AST Investment Services, Inc. |
Claudia DiGiacomo (34)
Assistant Secretary | | Vice President and Corporate Counsel (since January 2005) of Prudential; Vice President and Assistant Secretary of PI (since December 2005); Associate at Sidley Austin LLP (1999-2004). |
John P. Schwartz (37)
Assistant Secretary | | Vice President and Corporate Counsel (since April 2005) of Prudential; Vice President and Assistant Secretary of PI (since December 2005); Associate at Sidley Austin LLP (1997-2005). |
Andrew R. French (45)
Assistant Secretary | | Director and Corporate Counsel (since May 2006) of Prudential; Vice President and Assistant Secretary (since January 2007) of PI; Vice President and Assistant Secretary (since January 2007) of PMFS; formerly Senior Legal Analyst of Prudential Mutual Fund Law Department (1997-2006). |
Timothy J. Knierim (49)
Chief Compliance Officer | | Chief Compliance Officer of Prudential Investment Management, Inc. (PIM) (since July 2007); formerly Chief Risk Officer of PIM and PI (2002-2007) and formerly Chief Ethics Officer of PIM and PI (2006-2007). |
Valerie M. Simpson (50)
Deputy Chief Compliance Officer | | Chief Compliance Officer (since April 2007) of PI and AST Investment Services, Inc.; formerly Vice President-Financial Reporting (June 1999-March 2006) for Prudential Life and Annuities Finance. |
Theresa C. Thompson (46)
Deputy Chief Compliance Officer | | Vice President, Mutual Fund Compliance, PI (since April 2004); and Director, Compliance, PI (2001 - 2004). |
Dryden High Yield Fund, Inc.
| | |
Noreen M. Fierro (44)
Anti-Money Laundering
Compliance Officer | | Vice President, Corporate Compliance (since May 2006) of Prudential; formerly Corporate Vice President, Associate General Counsel (April 2002-May 2005) of UBS Financial Services, Inc., in their Money Laundering Prevention Group; Senior Manager (May 2005-May 2006) of Deloitte Financial Advisory Services, LLP, in their Forensic and Dispute Services, Anti-Money Laundering Group. |
Grace C. Torres (49)
Treasurer and Principal Financial and Accounting Officer | | Assistant Treasurer (since March 1999) and Senior Vice President (since September 1999) of PI; Assistant Treasurer (since May 2003) and Vice President (since June 2005) of AST Investment Services, Inc.; Senior Vice President and Assistant Treasurer (since May 2003) of Prudential Annuities Advisory Services, Inc.; formerly Senior Vice President (May 2003-June 2005) of AST Investment Services, Inc. |
M. Sadiq Peshimam (44)
Assistant Treasurer | | Vice President (since 2005) and Director (2000-2005) within Prudential Mutual Fund Administration. |
Peter Parrella (50)
Assistant Treasurer | | Vice President (since 2007) and Director (2004-2007) within Prudential Mutual Fund Administration; formerly Tax Manager at SSB Citi Fund Management LLC (1997-2004). |
1 | The year that each individual became an Officer of the Fund is as follows: |
Kathryn L. Quirk, 2005; Deborah A. Docs, 1996; Jonathan D. Shain, 2004; Claudia DiGiacomo, 2005; John P. Schwartz, 2006; Andrew R. French, 2006; Timothy J. Knierim, 2007; Valerie M. Simpson, 2007; Theresa C. Thompson, 2008; Noreen M. Fierro, 2006; Grace C. Torres, 1995; M. Sadiq Peshimam, 2006; Peter Parrella, 2007.
| (a) | Excludes interested Board Members who also serve as President or Vice President. |
Explanatory Notes
| • | | Board Members are deemed to be “Interested,” as defined in the 1940 Act, by reason of their affiliation with Prudential Investments LLC and/or an affiliate of Prudential Investments LLC. |
| • | | Unless otherwise noted, the address of all Board Members and Officers is c/o Prudential Investments LLC, Gateway Center Three, 100 Mulberry Street, Newark, New Jersey 07102. |
| • | | There is no set term of office for Board Members or Officers. The Board Members have adopted a retirement policy, which calls for the retirement of Board Members on December 31st of the year in which they reach the age of 75. |
| • | | “Other Directorships Held” includes only directorships of companies required to register or file reports with the SEC under the Securities Exchange Act of 1934 (that is, “public companies”) or other investment companies registered under the 1940 Act. |
| • | | “Portfolios Overseen” includes all investment companies managed by Prudential Investments LLC. The investment companies for which PI serves as manager include the JennisonDryden Funds, Strategic Partners Funds, The Prudential Variable Contract Accounts, The Target Portfolio Trust, The Prudential Series Fund, The High Yield Income Fund, Inc., The High Yield Plus Fund, Inc., Nicholas-Applegate Fund, Inc., Prudential’s Gibraltar Fund, Inc. and the Advanced Series Trust. |
Visit our website at www.jennisondryden.com
Approval of Advisory Agreements
The Board of Directors (the “Board”) of Dryden High Yield Fund, Inc. oversees the management of the Fund, and, as required by law, determines annually whether to renew the Fund’s management agreement with Prudential Investments LLC (“PI”) and the Fund’s subadvisory agreement with Prudential Investment Management, Inc. (“PIM”). In considering the renewal of the agreements, the Board, including all of the Independent Directors, met on June 3-5, 2008 and approved the renewal of the agreements through July 31, 2009, after concluding that renewal of the agreements was in the best interests of the Fund and its shareholders.
In advance of the meetings, the Board received materials relating to the agreements, and had the opportunity to ask questions and request further information in connection with their consideration. Among other things, the Board considered comparisons with other mutual funds in relevant Peer Universes and Peer Groups. The mutual funds included in each Peer Universe or Peer Group were objectively determined solely by Lipper Inc., an independent provider of mutual fund data. The comparisons placed the Fund in various quartiles over the one-, three-, five-, and ten-year periods ending December 31, 2007, with the first quartile being the best 25% of the mutual funds (for performance, the best performing mutual funds and, for expenses, the lowest cost mutual funds).
In approving the agreements, the Board, including the Independent Directors advised by independent legal counsel, considered the factors they deemed relevant, including the nature, quality and extent of services provided, the performance of the Fund, the profitability of PI and its affiliates, expenses and fees, and the potential for economies of scale that may be shared with the Fund and its shareholders. In their deliberations, the Directors did not identify any single factor which alone was responsible for the Board’s decision to approve the agreements with respect to the Fund. In connection with their deliberations, the Board considered information provided by PI throughout the year at regular Board meetings, presentations from portfolio managers and other information, as well as information furnished at or in advance of the meetings on June 3-5, 2008.
The Directors determined that the overall arrangements between the Fund and PI, which serves as the Fund’s investment manager pursuant to a management agreement, and between PI and PIM, which serves as the Fund’s subadviser pursuant to the terms of a subadvisory agreement with PI, are fair and reasonable in light of the services performed, fees charged and such other matters as the Directors considered relevant in the exercise of their business judgment.
The material factors and conclusions that formed the basis for the Directors’ reaching their determinations to approve the continuance of the agreements are separately discussed below.
| | |
| Dryden High Yield Fund, Inc. | | |
Approval of Advisory Agreements (continued)
Nature, Quality and Extent of Services
The Board received and considered information regarding the nature and extent of services provided to the Fund by PI and PIM. The Board considered the services provided by PI, including but not limited to the oversight of the subadvisers for the Fund, as well as the provision of fund recordkeeping, compliance, and other services to the Fund. With respect to PI’s oversight of the subadviser, the Board noted that PI’s Strategic Investment Research Group (“SIRG”), which is a business unit of PI, is responsible for monitoring and reporting to PI’s senior management on the performance and operations of the subadviser. The Board also considered that PI pays the salaries of all of the officers and non-independent Directors of the Fund. The Board also considered the investment subadvisory services provided by PIM, as well as adherence to the Fund’s investment restrictions and compliance with applicable Fund policies and procedures.
The Board reviewed the qualifications, backgrounds and responsibilities of PI’s senior management responsible for the oversight of the Fund and PIM, and also reviewed the qualifications, backgrounds and responsibilities of PIM’s portfolio managers who are responsible for the day-to-day management of the Fund’s portfolio. The Board was provided with information pertaining to PI’s and PIM’s organizational structure, senior management, investment operations, and other relevant information pertaining to both PI and PIM. The Board also noted that it received favorable compliance reports from the Fund’s Chief Compliance Officer (CCO) as to both PI and PIM. The Board noted that PIM is affiliated with PI. The Board considered PI’s evaluation of the subadviser, as well as PI’s recommendation, based on its review of the subadviser, to renew the subadvisory agreement.
The Board concluded that it was satisfied with the nature, extent and quality of the investment management services provided by PI and the subadvisory services provided to the Fund by PIM, and that there was a reasonable basis on which to conclude that the Fund benefits from the services provided by PI and PIM under the management and subadvisory agreements.
Performance of Dryden High Yield Fund
The Board received and considered information about the Fund’s historical performance, noting that the Fund’s gross performance in relation to its Peer Universe (the Lipper High Current Yield Funds Performance Universe) was in the second quartile for the one-, three- and five-year periods, and in the third quartile over the ten-year period. The Board also noted that the Fund outperformed its benchmark index over the one-, three- and five-year periods, though it underperformed its benchmark index over the ten-year period. The Board concluded that, in light of the
| | |
| | Visit our website at www.jennisondryden.com |
Fund’s competitive performance, it would be in the interest of the Fund and its shareholders for the Fund to renew the agreements.
Fees and Expenses
The Board considered that the Fund’s actual management fee (which reflects any subsidies, expense caps or waivers) and total expenses both ranked in the Expense Group’s first quartile. In light of the Fund’s total expense ranking and the fact that the Fund’s expenses were below 0.64% (exclusive of 12b-1 fees and certain other fees), the Board concurred with PI’s recommendation to remove the existing management fee waiver which provided for a waiver of up to 1 basis point of the management fee to the extent that Fund expenses exceed 0.64% (exclusive of 12b-1 fees and certain other fees), with the removal of the waiver effective as of July 1, 2008. The Board concluded that the management and subadvisory fees are reasonable in light of the services provided.
Costs of Services and Profits Realized by PI
The Board was provided with information on the profitability of PI and its affiliates in serving as the Fund’s investment manager. The Board discussed with PI the methodology utilized in assembling the information regarding profitability and considered its reasonableness. The Board recognized that it is difficult to make comparisons of profitability from fund management contracts because comparative information is not generally publicly available and is affected by numerous factors, including the structure of the particular adviser, the types of funds it manages, its business mix, numerous assumptions regarding allocations and the adviser’s capital structure and cost of capital. The Board did not separately consider the profitability of the subadviser, an affiliate of PI, as its profitability was reflected in the profitability report for PI. Taking these factors into account, the Board concluded that the profitability of PI and its affiliates in relation to the services rendered was not unreasonable.
Economies of Scale
The Board noted that the management fee schedule for the Fund includes breakpoints, which have the effect of decreasing the fee rate as assets increase, and that at its current level of assets the Fund’s effective fee rate reflected some of those rate reductions. The Board received and discussed information concerning whether PI realizes economies of scale as the Fund’s assets grow beyond current levels. The Board took note that the Fund’s fee structure currently results in benefits to Fund shareholders whether or not PI realizes any economies of scale.
| | |
| Dryden High Yield Fund, Inc. | | |
Approval of Advisory Agreements (continued)
Other Benefits to PI and PIM
The Board considered potential ancillary benefits that might be received by PI and PIM and their affiliates as a result of their relationship with the Fund. The Board concluded that potential benefits to be derived by PI included transfer agency fees received by the Fund’s transfer agent (which is affiliated with PI), as well as benefits to the reputation or other intangible benefits resulting from PI’s association with the Fund. The Board concluded that the potential benefits to be derived by PIM included the ability to use soft dollar credits, as well as the potential benefits consistent with those generally resulting from an increase in assets under management, specifically, potential access to additional research resources and benefits to the reputation. The Board concluded that the benefits derived by PI and PIM were consistent with the types of benefits generally derived by investment managers and subadvisers to mutual funds.
After full consideration of these factors, the Board concluded that the approval of the agreements was in the best interest of the Fund and its shareholders.
| | |
| | Visit our website at www.jennisondryden.com |
Growth of a $10,000 Investment
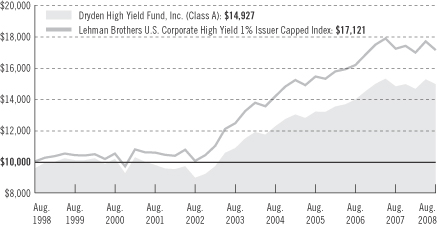
| | | | | | | | | | | |
| Average Annual Total Returns (With Sales Charges) as of 8/31/08 | | | |
| | | One Year | | | Five Years | | | Ten Years | | | Since Inception |
Class A | | –3.68 | % | | 5.62 | % | | 4.09 | % | | — |
Class B | | –4.11 | | | 5.96 | | | 4.07 | | | — |
Class C | | –0.58 | | | 6.06 | | | 4.04 | | | — |
Class L | | –3.66 | | | N/A | | | N/A | | | –3.70% (3/26/07) |
Class M | | –5.31 | | | N/A | | | N/A | | | –4.13 (3/26/07) |
Class R | | 0.64 | | | N/A | | | N/A | | | 4.53 (6/6/05) |
Class X | | –5.29 | | | N/A | | | N/A | | | –4.12 (3/26/07) |
Class Z | | 1.13 | | | 6.87 | | | 4.84 | | | — |
| | | | | | | | | | | |
| Average Annual Total Returns (Without Sales Charges) as of 8/31/08 | | | |
| | | One Year | | | Five Years | | | Ten Years | | | Since Inception |
Class A | | 0.86 | % | | 6.60 | % | | 4.57 | % | | — |
Class B | | 0.55 | | | 6.11 | | | 4.07 | | | — |
Class C | | 0.35 | | | 6.06 | | | 4.04 | | | — |
Class L | | 0.61 | | | N/A | | | N/A | | | –0.74% (3/26/07) |
Class M | | 0.28 | | | N/A | | | N/A | | | –1.01 (3/26/07) |
Class R | | 0.64 | | | N/A | | | N/A | | | 4.53 (6/6/05) |
Class X | | 0.30 | | | N/A | | | N/A | | | –1.00 (3/26/07) |
Class Z | | 1.13 | | | 6.87 | | | 4.84 | | | — |
Performance data quoted represent past performance. Past performance does not guarantee future results. The investment return and principal value of an investment
| | |
| | Visit our website at www.jennisondryden.com |
will fluctuate, so that an investor’s shares, when redeemed, may be worth more or less than their original cost. Current performance may be lower or higher than the past performance data quoted. An investor may obtain performance data as of the most recent month-end by visiting our website at www.jennisondryden.com or by calling (800) 225-1852. Class A and Class L shares have a maximum initial sales charge of 4.50% and 4.25%, respectively. Gross operating expenses: Class A, 0.93%; Class B, 1.38%; Class C, 1.63%; Class L, 1.13%; Class M, 1.63%; Class R, 1.38%; Class X, 1.63%; Class Z, 0.63%. Net operating expenses apply to: Class A, 0.88%; Class B, 1.38%; Class C, 1.38%; Class L, 1.13%; Class M, 1.63%; Class R, 1.13%; Class X, 1.63%; Class Z, 0.63%, after contractual reduction through 12/31/2009.
The returns in the graph and the tables do not reflect the deduction of taxes that a shareholder would pay on Fund distributions or following the redemption of Fund shares.
Source: Prudential Investments LLC, Lehman Brothers, and Lipper Inc.
Inception date returns are provided for any share class with less than 10 calendar years of returns.
The graph compares a $10,000 investment in the Dryden High Yield Fund, Inc. (Class A shares) with a similar investment in the Lehman Brothers U.S. Corporate High Yield 1% Issuer Capped Index by portraying the initial account values at the beginning of the 10-year period for Class A shares (August 31, 1998) and the account values at the end of the current fiscal year (August 31, 2008) as measured on a quarterly basis. For purposes of the graph, and unless otherwise indicated, it has been assumed that (a) the maximum applicable front-end sales charge was deducted from the initial $10,000 investment in Class A shares; (b) all recurring fees (including management fees) were deducted; and (c) all dividends and distributions were reinvested. The line graph provides information for Class A shares only. As indicated in the tables provided earlier, performance for Class B, Class C, Class L, Class M, Class R, Class X and Class Z shares will vary due to the differing charges and expenses applicable to each share class (as indicated in the following paragraphs). Without a distribution and service (12b-1) fee waiver of 0.05% for Class A shares through August 31, 2008, the returns shown in the graph and for Class A shares in the tables would have been lower.
The Lehman Brothers U.S. Corporate High Yield 1% Issuer Capped Index covers the universe of U.S. dollar denominated, non-convertible, fixed rate, non-investment grade debt. Issuers are capped at 1% of the Index. Index holdings must have at least one year to final maturity, at least $150 million par amount outstanding, and be publicly issued with a rating of Ba1 or lower. The index total returns include the reinvestment of all dividends, but do not include the effects of sales charges, operating expenses of a mutual fund, or taxes. The returns for the Index would be lower if they included the effects of sales charges, operating expenses, or taxes. The securities that comprise the Index may differ substantially from the securities in the Fund. This is not the only index that may be used to characterize performance of junk bond funds. Other indexes may portray different comparative performance. Investors cannot invest directly in an index.
Class A and Class L shares are subject to a maximum front-end sales charge of 4.50% and 4.25%, respectively, and a 12b-1 fee of up to 0.30% and 0.50%, respectively, annually, and all investors who purchase Class A and Class L shares in an amount of $1 million or more and sell these shares within 12 months of purchase are subject to a contingent deferred sales charge (CDSC) of 1%. Class B shares are subject to a declining CDSC of 5%, 4%, 3%, 2%, 1%, and 1%, respectively, for the first six years after purchase and a 12b-1 fee of 1% annually. Approximately seven years after purchase, Class B shares will automatically convert to Class A shares
| | |
| Dryden High Yield Fund, Inc. | | |
Growth of a $10,000 Investment (continued)
on a quarterly basis. Class C shares purchased are not subject to a front-end sales charge, but are subject to a CDSC of 1% for shares sold within 12 months from the date of purchase and an annual 12b-1 fee of 1%. Class M shares are subject to a CDSC of 6%, which decreases by 1% annually to 2% in the fifth and sixth years and 1% in the seventh year, a 12b-1 fee of 1% annually. Class M shares automatically convert to Class A shares approximately eight years after purchase. Class X shares are subject to a CDSC of 6%, which decreases by 1% annually to 4% in the third and fourth years, by 1% annually to 2% in the sixth and seventh years, and 1% in the eighth year, a 12b-1 fee of 1% annually. Class X shares automatically convert to Class A shares on a quarterly basis approximately ten years (eight years in the case of shares purchased prior to August 17, 1998) after purchase. Class R and Z shares are not subject to a sales charge. Class Z shares are not subject to a 12b-1 fee. The returns in the graph and tables reflect the share class expense structure in effect at the close of the fiscal period. The returns in the graph and the tables do not reflect the deduction of taxes that a shareholder would pay on Fund distributions or following the redemption of Fund shares.
| | |
| | Visit our website at www.jennisondryden.com |
| | | | |
| n MAIL | | n TELEPHONE | | n WEBSITE |
Gateway Center Three 100 Mulberry Street Newark, NJ 07102 | | (800) 225-1852
| | www.jennisondryden.com |
|
| PROXY VOTING |
| The Board of Directors of the Fund has delegated to the Fund’s investment subadviser the responsibility for voting any proxies and maintaining proxy recordkeeping with respect to the Fund. A description of these proxy voting policies and procedures is available without charge, upon request, by calling (800) 225-1852 or by visiting the Securities and Exchange Commission’s website at www.sec.gov. Information regarding how the Fund voted proxies relating to portfolio securities during the most recent 12-month period ended June 30 is available on the Fund’s website and on the Commission’s website. |
|
| DIRECTORS |
| Kevin J. Bannon • Linda W. Bynoe • David E.A. Carson • Robert F. Gunia • Michael S. Hyland • Robert E. La Blanc • Douglas H. McCorkindale • Stephen P. Munn • Richard A. Redeker • Judy A. Rice • Robin B. Smith • Stephen G. Stoneburn |
|
| OFFICERS |
| Judy A. Rice, President • Robert F. Gunia, Vice President • Grace C. Torres, Treasurer and Principal Financial and Accounting Officer • Kathryn L. Quirk, Chief Legal Officer • Deborah A. Docs, Secretary • Timothy J. Knierim, Chief Compliance Officer • Valerie M. Simpson, Deputy Chief Compliance Officer • Theresa C. Thompson, Deputy Chief Compliance Officer • Noreen M. Fierro, Anti-Money Laundering Compliance Officer • Jonathan D. Shain, Assistant Secretary • Claudia DiGiacomo, Assistant Secretary • John P. Schwartz, Assistant Secretary • Andrew R. French, Assistant Secretary • M. Sadiq Peshimam, Assistant Treasurer • Peter Parrella, Assistant Treasurer |
| | | | |
| MANAGER | | Prudential Investments LLC | | Gateway Center Three
100 Mulberry Street Newark, NJ 07102 |
|
| INVESTMENT SUBADVISER | | Prudential Investment
Management, Inc. | | Gateway Center Two
100 Mulberry Street
Newark, NJ 07102 |
|
| DISTRIBUTOR | | Prudential Investment
Management Services LLC | | Gateway Center Three
100 Mulberry Street Newark, NJ 07102 |
|
| CUSTODIAN | | The Bank of New York Mellon | | One Wall Street
New York, NY 10286 |
|
| TRANSFER AGENT | | Prudential Mutual Fund
Services LLC | | PO Box 9658
Providence, RI 02940 |
|
| INDEPENDENT REGISTERED PUBLIC ACCOUNTING FIRM | | KPMG LLP | | 345 Park Avenue
New York, NY 10154 |
|
| FUND COUNSEL | | Willkie Farr & Gallagher LLP | | 787 Seventh Avenue
New York, NY 10019 |
|
| An investor should consider the investment objectives, risks, charges, and expenses of the Fund carefully before investing. The prospectus for the Fund contains this and other information about the Fund. An investor may obtain a prospectus by visiting our website at www.jennisondryden.com or by calling (800) 225-1852. The prospectus should be read carefully before investing. |
|
| E-DELIVERY |
| To receive your mutual fund documents on-line, go to www.icsdelivery.com/prudential/funds and enroll. Instead of receiving printed documents by mail, you will receive notification via e-mail when new materials are available. You can cancel your enrollment or change your e-mail address at any time by clicking on the change/cancel enrollment option at the icsdelivery website address. |
|
| SHAREHOLDER COMMUNICATIONS WITH DIRECTORS |
| Shareholders can communicate directly with the Board of Directors by writing to the Chair of the Board, Dryden High Yield Fund, Inc., Prudential Investments, Attn: Board of Directors, 100 Mulberry Street, Gateway Center Three, Newark, NJ 07102. Shareholders can communicate directly with an individual Director by writing to the same address. Communications are not screened before being delivered to the addressee. |
|
| AVAILABILITY OF PORTFOLIO SCHEDULE |
| The Fund files its complete schedule of portfolio holdings with the Securities and Exchange Commission for the first and third quarters of each fiscal year on Form N-Q. The Fund’s Forms N-Q are available on the Commission’s website at www.sec.gov. The Fund’s Forms N-Q may also be reviewed and copied at the Commission’s Public Reference Room in Washington, D.C. Information on the operation and location of the Public Reference Room may be obtained by calling (800) SEC-0330 (732-0330). The Fund’s schedule of portfolio holdings is also available on the Fund’s website as of the end of each fiscal quarter. |
|
| The Fund’s Statement of Additional Information contains additional information about the Fund’s Directors and is available without charge, upon request, by calling (800) 225-1852. |
Mutual Funds:
| | | | |
| ARE NOT INSURED BY THE FDIC OR ANY FEDERAL GOVERNMENT AGENCY | | MAY LOSE VALUE | | ARE NOT A DEPOSIT OF OR GUARANTEED BY ANY BANK OR ANY BANK AFFILIATE |

| | | | | | | | | | | | | | | | | | | | |
| | | Dryden High Yield Fund, Inc. | | | | | | | | | | | | | | |
| | | Share Class | | A | | B | | C | | L | | M | | R | | X | | Z | | |
| | NASDAQ | | PBHAX | | PBHYX | | PRHCX | | N/A | | DHYMX | | JDYRX | | N/A | | PHYZX | | |
| | CUSIP | | 262438104 | | 262438203 | | 262438302 | | 262438609 | | 262438708 | | 262438500 | | 262438807 | | 262438401 | | |
| | | | | | | | | | | | | | | | | | | | |
MF110E IFS-A156662 Ed. 10/2008

Item 2 – Code of Ethics — See Exhibit (a)
As of the end of the period covered by this report, the registrant has adopted a code of ethics (the “Section 406 Standards for Investment Companies – Ethical Standards for Principal Executive and Financial Officers”) that applies to the registrant’s Principal Executive Officer and Principal Financial Officer; the registrant’s Principal Financial Officer also serves as the Principal Accounting Officer.
The registrant hereby undertakes to provide any person, without charge, upon request, a copy of the code of ethics. To request a copy of the code of ethics, contact the registrant 800-225-1852, and ask for a copy of the Section 406 Standards for Investment Companies—Ethical Standards for Principal Executive and Financial Officers.
Item 3 – Audit Committee Financial Expert –
The registrant’s Board has determined that Mr. David E. A. Carson, member of the Board’s Audit Committee is an “audit committee financial expert,” and that he is “independent,” for purposes of this Item.
Item 4 – Principal Accountant Fees and Services –
(a) Audit Fees
For the fiscal year ended August 31, 2008 and fiscal period January 1, 2007 through August 31, 2007, KPMG LLP (“KPMG”), the Registrant’s principal accountant, billed the Registrant $27,617 and $26,281, respectively, for professional services rendered for the audit of the Registrant’s annual financial statements or services that are normally provided in connection with statutory and regulatory filings.
(b) Audit-Related Fees
None.
(c) Tax Fees
None.
(d) All Other Fees
None.
(e) (1) Audit Committee Pre-Approval Policies and Procedures
THE PRUDENTIAL MUTUAL FUNDS
AUDIT COMMITTEE POLICY
on
Pre-Approval of Services Provided by the Independent Accountants
The Audit Committee of each Prudential Mutual Fund is charged with the responsibility to monitor the independence of the Fund’s independent accountants. As part of this responsibility, the Audit Committee must pre-approve any independent accounting firm’s engagement to render audit and/or permissible non-audit services, as required by law. In evaluating a proposed engagement of the independent accountants, the Audit Committee will assess the effect that the engagement might reasonably be expected to have on the accountant’s independence. The Committee’s evaluation will be based on:
| | • | | a review of the nature of the professional services expected to be provided, |
| | • | | a review of the safeguards put into place by the accounting firm to safeguard independence, and |
| | • | | periodic meetings with the accounting firm. |
Policy for Audit and Non-Audit Services Provided to the Funds
On an annual basis, the scope of audits for each Fund, audit fees and expenses, and audit-related and non-audit services (and fees proposed in respect thereof) proposed to be performed by the Fund’s independent accountants will be presented by the Treasurer and the independent accountants to the Audit Committee for review and, as appropriate, approval prior to the initiation of such services. Such presentation shall be accompanied by confirmation by both the Treasurer and the independent accountants that the proposed services will not adversely affect the independence of the independent accountants. Proposed services shall be described in sufficient detail to enable the Audit Committee to assess the appropriateness of such services and fees, and the compatibility of the provision of such services with the auditor’s independence. The Committee shall receive periodic reports on the progress of the audit and other services which are approved by the Committee or by the Committee Chair pursuant to authority delegated in this Policy.
The categories of services enumerated under “Audit Services”, “Audit-related Services”, and “Tax Services” are intended to provide guidance to the Treasurer and the independent accountants as to those categories of services which the Committee believes are generally consistent with the independence of the independent accountants and which the Committee (or the Committee Chair) would expect upon the presentation of specific proposals to pre-approve. The enumerated categories are not intended as an exclusive list of audit, audit-related or tax services, which the Committee (or the Committee Chair) would consider for pre-approval.
Audit Services
The following categories of audit services are considered to be consistent with the role of the Fund’s independent accountants:
| | • | | Annual Fund financial statement audits |
| | • | | Seed audits (related to new product filings, as required) |
| | • | | SEC and regulatory filings and consents |
Audit-related Services
The following categories of audit-related services are considered to be consistent with the role of the Fund’s independent accountants:
| | • | | Accounting consultations |
| | • | | Fund merger support services |
| | • | | Agreed Upon Procedure Reports |
| | • | | Other Internal Control Reports |
Individual audit-related services that fall within one of these categories and are not presented to the Audit Committee as part of the annual pre-approval process will be subject to pre-approval by the Committee Chair (or any other Committee member on whom this responsibility has been delegated) so long as the estimated fee for those services does not exceed $50,000.
Tax Services
The following categories of tax services are considered to be consistent with the role of the Fund’s independent accountants:
| | • | | Tax compliance services related to the filing or amendment of the following: |
| | • | | Federal, state and local income tax compliance; and, |
| | • | | Sales and use tax compliance |
| | • | | Timely RIC qualification reviews |
| | • | | Tax distribution analysis and planning |
| | • | | Tax authority examination services |
| | • | | Tax appeals support services |
| | • | | Accounting methods studies |
| | • | | Fund merger support services |
| | • | | Tax consulting services and related projects |
Individual tax services that fall within one of these categories and are not presented to the Audit Committee as part of the annual pre-approval process will be subject to pre-approval by the Committee Chair (or any other Committee member on whom this responsibility has been delegated) so long as the estimated fee for those services does not exceed $50,000.
Other Non-audit Services
Certain non-audit services that the independent accountants are legally permitted to render will be subject to pre-approval by the Committee or by one or more Committee members to whom the Committee has delegated this authority and who will report to the full Committee any pre-approval decisions made pursuant to this Policy. Non-audit services presented for pre-approval pursuant to this paragraph will be accompanied by a confirmation from both the Treasurer and the independent accountants that the proposed services will not adversely affect the independence of the independent accountants.
Proscribed Services
The Fund’s independent accountants will not render services in the following categories of non-audit services:
| | • | | Bookkeeping or other services related to the accounting records or financial statements of the Fund |
| | • | | Financial information systems design and implementation |
| | • | | Appraisal or valuation services, fairness opinions, or contribution-in-kind reports |
| | • | | Internal audit outsourcing services |
| | • | | Management functions or human resources |
| | • | | Broker or dealer, investment adviser, or investment banking services |
| | • | | Legal services and expert services unrelated to the audit |
| | • | | Any other service that the Public Company Accounting Oversight Board determines, by regulation, is impermissible. |
Pre-approval of Non-Audit Services Provided to Other Entities Within the Prudential Fund Complex
Certain non-audit services provided to Prudential Investments LLC or any of its affiliates that also provide ongoing services to the Prudential Mutual Funds will be subject to pre-approval by the Audit Committee. The only non-audit services provided to these entities that will require pre-approval are those related directly to the operations and financial reporting of the Funds. Individual projects that are not presented to the Audit Committee as part of the annual pre-approval process will be subject to pre-approval by the Committee Chair (or any other Committee member on whom this responsibility has been delegated) so long as the estimated fee for those services does not exceed $50,000. Services presented for pre-approval pursuant to this paragraph will be accompanied by a confirmation from both the Treasurer and the independent accountants that the proposed services will not adversely affect the independence of the independent accountants.
Although the Audit Committee will not pre-approve all services provided to Prudential Investments LLC and its affiliates, the Committee will receive an annual report from the Fund’s independent accounting firm showing the aggregate fees for all services provided to Prudential Investments and its affiliates.
(e) (2) Percentage of services referred to in 4(b) – 4(d) that were approved by the audit committee –
Not applicable.
(f) Percentage of hours expended attributable to work performed by other than full time employees of principal accountant if greater than 50%.
The percentage of hours expended on the principal accountant’s engagement to audit the registrant’s financial statements for the most recent fiscal year that were attributed to work performed by persons other than the principal accountant’s full-time, permanent employees was 0%.
(g) Non-Audit Fees
Not applicable to Registrant for the fiscal year 2008 and fiscal period January 1, 2007 through August 31, 2007. The aggregate non-audit fees billed by KPMG for services rendered to the registrant’s investment adviser and any entity controlling, controlled by, or under common control with the investment adviser that provides ongoing services to the registrant for the fiscal year 2008 and fiscal period January 1, 2007 through August 31, 2007 was $0 and $44,700, respectively.
(h) Principal Accountant’s Independence
Not applicable as KPMG has not provided non-audit services to the registrant’s investment adviser and any entity controlling, controlled by, or under common control with the investment adviser that provides ongoing services to the registrant that were not pre-approved pursuant to Rule 2-01(c)(7)(ii) of Regulation S-X.
Item 5 – Audit Committee of Listed Registrants – Not applicable.
Item 6 – Schedule of Investments – The schedule is included as part of the report to shareholders filed under Item 1 of this Form.
Item 7 – Disclosure of Proxy Voting Policies and Procedures for Closed-End Management Investment Companies – Not applicable.
Item 8 – Portfolio Managers of Closed-End Management Investment Companies – Not applicable.
Item 9 – Purchases of Equity Securities by Closed-End Management Investment Company and Affiliated Purchasers – Not applicable.
Item 10 – Submission of Matters to a Vote of Security Holders – Not applicable.
Item 11 – Controls and Procedures
| | (a) | It is the conclusion of the registrant’s principal executive officer and principal financial officer that the effectiveness of the registrant’s current disclosure controls and procedures (such disclosure controls and procedures having been evaluated within 90 days of the date of this filing) provide reasonable assurance that the information required to be disclosed by the registrant has been recorded, processed, summarized and reported within the time period specified in the Commission’s rules and forms and that the information required to be disclosed by the registrant has been accumulated and communicated to the registrant’s principal executive officer and principal financial officer in order to allow timely decisions regarding required disclosure. |
| | (b) | There has been no significant change in the registrant’s internal control over financial reporting that occurred during the registrant’s most recent fiscal quarter of the period covered by this report that has materially affected, or is likely to materially affect, the registrant’s internal control over financial reporting. |
Item 12 – Exhibits
| | | | |
| (a) | | (1) | | Code of Ethics – Attached hereto as Exhibit EX-99.CODE-ETH |
| | |
| | (2) | | Certifications pursuant to Section 302 of the Sarbanes-Oxley Act – Attached hereto as Exhibit EX-99.CERT. |
| | |
| | (3) | | Any written solicitation to purchase securities under Rule 23c-1. – Not applicable. |
| |
(b) | | Certifications pursuant to Section 906 of the Sarbanes-Oxley Act – Attached hereto as Exhibit EX-99.906CERT. |
SIGNATURES
Pursuant to the requirements of the Securities Exchange Act of 1934 and the Investment Company Act of 1940, the registrant has duly caused this report to be signed on its behalf by the undersigned, thereunto duly authorized.
| | | | |
| (Registrant) | | Dryden High Yield Fund, Inc. | | |
| | |
| By (Signature and Title)* | | /s/ Deborah A. Docs | | |
| | Deborah A. Docs | | |
| | Secretary | | |
| |
| Date October 24, 2008 | | |
Pursuant to the requirements of the Securities Exchange Act of 1934 and the Investment Company Act of 1940, this report has been signed below by the following persons on behalf of the registrant and in the capacities and on the dates indicated.
| | | | |
| By (Signature and Title)* | | /s/ Judy A. Rice | | |
| | Judy A. Rice | | |
| | President and Principal Executive Officer | | |
| |
| Date October 24, 2008 | | |
| | |
| By (Signature and Title)* | | /s/ Grace C. Torres | | |
| | Grace C. Torres | | |
| | Treasurer and Principal Financial Officer | | |
| |
| Date October 24, 2008 | | |
| * | Print the name and title of each signing officer under his or her signature. |